


Bahasa
Halaman
Hukum


International Journal of Engineering Science Invention Research & Development; Vol. I Issue VIII February 2015
www.ijesird.com e-ISSN: 2349-6185
Neelam Indora, Dinesh Kaushik ijesird, Vol. I (VIII) February 2015/ 280
Design, development and evaluation of ethosomal
gel of fluconazole for topical fungal infection Neelam Indora, Dinesh Kaushik*
Hindu College of Pharmacy, PGIMS University, Rohtak, India. Corresponding author: [email protected]
ABSTRACT:In the present investigation efficiency of ethosomes
as novel lipid carriers for topical delivery of fluconazole has been
evaluated. Ethosomes were optimized by varying concentration
of phospholipid and ethanol. Ethosomal formulation (F8) with
soya phosphatidylcholine (3%) and ethanol 20% was optimized.
On characterizationspherical, unilamellar vesicles with smooth
surfacewere observed under transmission electron microscopy
(TEM) in the range of 5 to 200 nm.Zeta potential of F8
formulation was found to be - 4.16 mv. Drug entrapment
efficiency of F8 formulation was found to be 90 %. The
optimized formulation exhibited pH (8) and viscosity (73,200
cps). Physical evaluation of ethosomal gel was done.In vitro
release of F8 formulation was carried out which showed 92 ± 0.79
% release over a period oF8 hours.Skin irritation study revealed
no irritation from ethosomal gel.From the data obtained after
plotting various models it was observed that the higuchi model
was found to be best suited with R2 value of 0.9678.Stability
studies performed at 40°C ± 1°C and 25ºC ± 1ºC for 3 months
showed good storage stability. No phase separation was observed
in the optimized ethosomal gel.Results suggested that ethosomes
as efficient carriers for fluconazole topical delivery.
Keywords: Vesicle, fluconazole, in vitrorelease,transmission
electron microscopy, topical delivery
Introduction
Over the past years, topical delivery of drug
has caused more and more attention; this has the
advantage that high concentration of drugs can be
localized at the site of action, reducing the systemic
side effects compared to parenteral or oral drug
administration.Topical delivery can be defined as
the application of a drug containing formulation to
the skin to treat cutaneous disorders (e.g. psoriasis,
acne) with the intent of containing the
pharmacological or another effect of the drug to the
surface of the skin or with in the skin. Intensive
research over the past two decades led to the
development of novel carriers, the ethanolic
liposomes that have been termed ethosomes
(Touitou et al., 2000).
Ethosomes are novel lipid carriers
composed of ethanol, phospholipids and water.
These are soft, malleable vesicles tailored for
enhanced delivery of active agents. They are
reported to improve the skin delivery of various
drugs. The high concentration of ethanol makes the
ethosomes unique, as ethanol is known for its
disturbance of skin lipid bilayer organization.
Ethosomes can entrap drug molecule with various
physicochemical characteristics i.e. of hydrophilic,
lipophilic, or amphiphilic. The size range of
ethosomes may vary from tens of nanometers to
microns.
The present investigation was to design the
ethosomal gel containing fluconazole using
different concentration of ethanol and
phospholipid.Fluconazole is a polar bis-triazole
antifungal drug. Studies have shown that
fluconazole exhibits specificity as an inhibitor of
the fungal as opposed to mammalian cytochrome P-
450 mediated reactions, including those involved in
steroid biosynthesis and drug
metabolism.Fluconazole is used in treatment of
candidiasis seen in the oral cavity, pharyngeal,
vaginal andurinary tract infection.
It is a BCS class III drug (high solubility
and low permeability). On oral administration, its
bioavailability is low due to poor aqueous
solubility. Fluconazole was selected for formulation
of topical ethosomal gel because patients with
diseases candidiasis andurinary tract infection etc.,
the dose is given at a higher level due to its low
permeability. The ethosomal approach was selected
to enhance the permeability of fluconazole that
increase bioavailability, reduce the side effects,
reduce large doses and increase the therapeutic
efficacy.
In the present study, ethosomes bearing
fluconazole was prepared by cold method and
International Journal of Engineering Science Invention Research & Development; Vol. I Issue VIII February 2015
www.ijesird.com e-ISSN: 2349-6185
Neelam Indora, Dinesh Kaushik ijesird, Vol. I (VIII) February 2015/ 281
optimized. They were evaluated for permeation
enhancement over marketed formulation and the
optimized formulation (F8) for vesicle skin
interaction studies and stability studies.
Material and method
Fluconazole (FLZ) was obtained as a gift
sample from Belco Pvt. Ltd., India. Soya lecithin
was obtained as a gift sample from Hi Media
laboratories Pvt. Ltd. Mumbai, India. Ethanol was
purchased from Loba Chemie Pvt. Ltd., Mumbai,
India.
Preformulation studies of drug sample
Preformulation study is the first step in the
rational development of dosage forms of a drug
substance. It can be defined as an investigation of
physical and chemical properties of a drug
substance alone and when combined with
excipients. The overall objective of preformulation
testing is to generate information useful to the
formulator in developing stable and bioavailable
dosage forms. Following preformulation studies
were performed.
Organoleptic properties
The organoleptic studies like general
appearance like nature, color, odor, etc. were
performed by visual observations and compared
with standard of drug given in pharmacopoeia for
identification of drug.
Color: Small quantity of drug was taken on butter
paper and viewed in well illuminated place.
Odor: Very less quantity of drug was smelled to get
the odor.
Solubility studies
Semi quantitative determination of the
solubility was made by adding solvent to glass tube
containing accurately weighed amount of solute.
The system is vigorously shaken and examined
visually for any undissolved solute particles. The
solubility is expressed in terms of ratio of solute
and solvent. The solubility study of Fluconazole
was performed in methanol, ethanol, acetone,
hexane, ether, chloroform, propylene glycol,
distilled water, 0.1 N HCL, phosphate buffer
solution pH 5.5, 6.8, 7.4, separately by keeping the
drug containing test tube on vortex mixture.
Determination of melting point
For determination of melting point USP
method was followed. Small quantity of drug was
placed into a sealed capillary tube. The tube was
placed in the melting point apparatus. The
temperature in the apparatus was gradually
increased and the observation of temperature was
noted at which drug started to melt and the
temperature when the entire drug gets melted was
noted.
Determination of partition co-efficient (85)
The known quantity of fluconazole was
added into 20 ml of octanol and it was mixed with
20 ml of phosphate buffer pH 7.4 in a separating
funnel. Then two phases were allowed to equilibrate
at 37 0
C for 2 hours with intermittent shaking. The
concentration of drug in the aqueous phase and
organic phase was determined by UV spectroscopic
method at λmax 260 nm after necessary dilution.
The apparent partition coefficient was calculated as
the ratio of drug concentration in each phase by the
following equation -
K p = C organic
C aqueous
C organic is concentration of drug in organic phase
C aqueous is concentration of drug in aqueous
phase
Determination of drug pH
The pH of Fluconazole was determined
using digital pH meter for freshly prepared 1%
solution of Fluconazole in methanol.
Infrared spectroscopic analysis
The Fourier infra red spectrums of moisture
free samples of fluconazole, soya lecithin, carbopol,
methyl paraben, propyl paraben and mixture of
fluconazole, carbopol, methyl paraben, propyl
paraben were recorded on IR spectrophotometer.
Infrared spectroscopy of different compounds was
performed for identification of that particular
compound. FTIR Spectroscopy was done using KBr
pellets. Various peaks in FTIR spectrum were
International Journal of Engineering Science Invention Research & Development; Vol. I Issue VIII February 2015
www.ijesird.com e-ISSN: 2349-6185
Neelam Indora, Dinesh Kaushik ijesird, Vol. I (VIII) February 2015/ 282
interpreted for identification of different group in
the structure of fluconazole. FTIR Spectroscopy can
also be used to investigate and predict any
physicochemical interactions between different
components. The scanning range varies from 4000
– 400 cm-1
and the resolution was 1 cm-1
.
Analysis by UV-Visible spectrophotometry
Preparation of standard curve in methanol
Standard stock solution of fluconazole
Accurately weighed 100 mg of fluconazole
and was dissolved in 100 ml of methanol, from this
stock solution 10 ml was withdrawn
andtransferredinto 100 ml volumetric flask. Volume
was made withmethanol in order to get standard
stock solution containing 100 μg/ml.
Standard graph of fluconazole
Form this standard stock solution, a series of
dilution(10, 20, 30, 40, 50 μg/ml) were prepared
using methanol. The absorbance of these solutions
was measured spectrophotometrically against blank
of methanol at 260 nm for fluconazole.
Determination of wavelength maxima of
fluconazole
The solution was scanned in the range of
200 to 400 nm to fix the maximum wavelength and
UV spectrum was obtained.
Method of preparation of ethosomes of
fluconazole Ethosomal formulations were prepared by
using the cold method. The ethanolic vascular
system was composed of phospholipid (2.0% to 4%
W/V), ethanol (20% to 40% V/V), propylene glycol
(20 % V/V), drug (fluconazole, 0.5% W/V) and
distilled water to 100% (V/V). Phospholipid was
dissolved along with the drug in ethanol. This
mixture was heated to 400
C ± 10
C and a fine
stream of distilled water was added slowly, with
constant mixing at 700 rpm with a mechanical
stirrer in a closed container. Mixing was continued
for an additional 5 minutes, while maintaining the
system at 400
C ± 10
C. The preparation was left to
cool at room temperature for 30 min and then it was
sonicated at 40
C for five cycles of 3 minutes each
with a minute rest between cycles using a probe
sonicator.
Nine formulations were prepared using
different concentration of phospholipid and ethanol
among them optimized formulation was selected for
characterization and evaluation studies.

International Journal of Engineering Science Invention Research & Development; Vol. I Issue VIII February 2015
www.ijesird.com e-ISSN: 2349-6185
Neelam Indora, Dinesh Kaushik ijesird, Vol. I (VIII) February 2015/ 283
Table: Compositions of different ethosomal formulation of fluconazole
Formulation code Conc. of
Phospholipid
(W/V)
Conc. of
Ethanol
(V/V)
Conc. of
Propylene
glycol (V/V)
Conc. of drug
(W/V)
Conc. of distilled
water
(V/V)
F 1 2 % 20 % 20 % 0.5 % Upto 100%
F 2 3 % 30 % 20 % 0.5 % Upto 100%
F 3 4 % 40 % 20 % 0.5 % Upto 100%
F 4 2 % 30 % 20 % 0.5 % Upto 100%
F 5 3 % 40 % 20 % 0.5 % Upto 100%
F 6 4 % 20 % 20 % 0.5 % Upto 100%
F 7 2 % 40 % 20 % 0.5 % Upto 100%
F8 3 % 20 % 20 % 0.5 % Upto 100%
F 9 4 % 30 % 20 % 0.5 % Upto 100%
Preparation of the carbopol gel(87)
Carbopol934 forms very good consistency
transparent gel at low concentration. 1% carbopol
gel base was prepared by dispersing 1 g
carbopol934 in 90 ml hot distilled water in which
10 ml glycerol was previously added. Accurately
weighed quantity of methyl paraben and propyl
paraben was also added into it. The mixture was
stirred until thickening occurred and then
neutralized by the drop wise addition of 50% (w/w)
triethanolamine to achieve a transparent gel.
Table: Composition of the gel base
Ingredients Concentration
Carbopol 934 1%
Glycerol 5%
Methyl paraben 0.02%
Propyl paraben 0.01%
Distilled water Upto 100%
Incorporation of ethosomes in the gel base
The ethosomal formulation was slowly
added in carbopol 934 gel base with gentle stirring.
Finally, the ethosomal gel was mixed using a
mechanical stirrer for 5 min.
Evaluation of ethosomes
Drug entrapment efficiency
The total volume of the ethosomal
suspension was measured. 5ml of this formulation
was diluted with distilled water up to 8 ml and
centrifuged at 15,000 rpm for 45 min at 40Cusing a
cooling centrifuge. After centrifugation, the
supernatant and sediment were recovered, their
volume was measured.Then sediment was lysed
using n- propanol and filtered through a 0.45 µm
nylon disk filter.The concentration of fluconazole in
the supernatant and sediment was analyzed by UV-
spectroscopic methodat 260 nm.The percent drug
entrapment was calculated using the following
equation:
International Journal of Engineering Science Invention Research & Development; Vol. I Issue VIII February 2015
www.ijesird.com e-ISSN: 2349-6185
Neelam Indora, Dinesh Kaushik ijesird, Vol. I (VIII) February 2015/ 284
Vesicular shape and surface morphology
Ethosome vesicles were visualized using
transmission electron microscopy (TEM Philips
Technai electron microscope, Netherlands). A drop
of ethosomal solution was dried on a microscopic
carbon coated grid, to get adsorbed and the surplus
was removed by filter paper. A drop of 1% aqueous
solution of phosphotungstic acid (PTA) was then
added and left in contact with the sample for 5
minutes. The excess solution was removed and the
sample was dried at room condition before the
vesicles were viewed under TEM operating at an
acceleration voltage of 200 KV.
Vesicle size measurement
The vesicles size was determined by
dynamic light scattering method (DLS), using a
computerized inspection system( MalvernZetasizer
Nano-ZS, Malvern, U.K.) with DTS®
(Nano)
software. For vesicles size measurement, vesicular
suspension was diluted with distilled water and put
into the cuvetts of zetasizer. Then the measurements
were conducted at 250C.The DLS measurements
were performed over alternating increasing and
decreasing temperature cycles at each temperature
the sample was equilibrated for at least 3 minutes
before performing the measurement. The average
hydrodynamic diameter of the ethosomes under
consideration corresponds to the Z-average value
measured by DLS. Hence, the data was collected
for vesicles size and size distribution.
Zeta potential measurement Zeta potential is the measure of the
magnitude of the electrostatic or charge repulsion or
attraction between particles and, known to affect
stability. Its measurement brings detailed insight
into the causes of dispersion, aggregation or
flocculation, and can be applied to improve the
formulation of ethosomes. Almost all particulate or
macroscopic materials in contact with a liquid
acquire an electronic charge on their surfaces. In
general, particles could be dispersed stable whenthe
absolute value of zeta potential is above 30 mV.
Moreover, the zeta potential below 20mV is of
limited stability and that below 5mV show rapid
aggregation. However, several studies have
reported that the zeta potentials of ethosome
formulations ranged between -10 to -20 mV. Zeta
potential of ethosomal formulation was determined
using Zeta Sizer (Nano-ZS, Malvern, U.K.) at 250C.
Physical evaluation of ethosomal gel
The ethosomal gel formulation of
fluconazole was evaluated for organoleptic
characteristics, occlusiveness and washability.
Measurement of pH of theethosomal gel 1 g fluconazole ethosomal gel was mixed in
100 ml distilled water with homogenizer. Then the
electrode was immersed in the prepared gel solution
and readingswere recorded from digital pH meter in
triplicate and average value was calculated.
Viscosity study
Viscosity measurements were done on
Brookfield viscometer by selecting suitable spindle
number and rpm. 50 g of preparation was kept in 50
ml beaker which was set till spindle groove was
dipped and rpm was set and dial reading was
measured after three minutes. From the reading
obtained, viscosity was calculated by using factor.
The procedure was repeated three times and
observations are recorded as mean.
Spreadability
It is the term expressed to denote the extent
of area to which gel readily spreads on application
to skin or affected part. The therapeutic efficacy of
a formulation also depends upon its spreading
value. Spreadability is expressed in terms of time in
seconds taken by two slides to slip off from geland
placed in between the slides under the direction of
certain load. Lesser the time taken for separation of
two slides, better the spreadability.
It is calculated by using the formula:
S = M. L / T
WhereM = wt. tied to upper slide
L = length of glass slides
T = time taken to separate the slides
0.1 g of ethosomal gel was pressed between
two slides (divided into squares of 5 mm sides) and
left for about 5 minutes where no more spreading
International Journal of Engineering Science Invention Research & Development; Vol. I Issue VIII February 2015
www.ijesird.com e-ISSN: 2349-6185
Neelam Indora, Dinesh Kaushik ijesird, Vol. I (VIII) February 2015/ 285
was expected. Diameters of spreaded circles were
measured in cm and were taken as comparative
values for spreadability. The standardized weight
tied on the upper slide was 125gm. The results
obtained are average of three determinations.
Extrudability study The extrudability of ethosomal gel was
determined by filling ethosomal gel in the
collapsible tubes. The extrudability of the
ethosomal gel was determined in terms of weight in
grams required to extrude a 0.5 cm ribbon of gel in
10 second.
Percentage yield
The empty container was weighed in which
the ethosomal gel formulation was stored then again
the container was weighed with ethosomal gel
formulation. Then subtracted the empty container
weighed with the container with gel formulation
then it gives the practical yield. Then the percentage
yield was calculated by the formula.
Homogeneity and grittiness
A small quantity of ethosomal gel was
pressed between the thumb and the index finger.
The consistency of theethosomal gel was noticed
(whether homogeneous or not), if there was any
coarse particles appeared on fingers. Also, the
homogeneity could be detected when a small
quantity of theethosomal gel was rubbed on the skin
of the back of the hand. The grittiness of prepared
ethosomal gel was also observed in the same
manner.
Skin irritation study
Skin irritationstudy was carried out on
healthy rats (150-200 g) of either sex. The animals
are maintained on standard animal feed and had free
access to water. Before one day of starting the study
hair was shaved from back of rats and area of 5 cm2
was marked on both the sides, one side served as
control while the other side was test.
Prepared ethosomal gel was applied for 7 days and
the site was observed for any sensitivity and the
reaction if any, was graded as 0, 1, 2, 3 for no
reaction, slight patchy erythema, slight but cofluent
or moderate but patchy erythema and severe
erythema with or without edema, respectively.
In vitro release studies
Skin permeation studies
Franz diffusion cell was used forpermeation
studies. Study was conducted using prepared rat
skin. 28 ml of PBS 7.4 was taken in receptor
compartment and was continuously stirred with a
magnetic stirrer and equilibrated at 37°±1°C with a
recirculating water bath. The prepared skin was
mounted with stratum corneum facing upward into
the donor compartment. 1 g ofethosomal gel
formulation was taken in donor compartment and
covered with parafilm to avoid any evaporation
process. 5 ml sample was withdrawn through the
sampling port at predetermined intervals over 8
hours and each sample was replaced with equal
volume of fresh dissolution medium. Then the
samples were analyzed for drug content by using
phosphate buffer as blank with UV-Visible double
beam spectrophotometer at 260 nm. Similar study
was performed with marketed fluconazole gel.
Franz diffusion cell
In vitro absorption studies are generally
carried out in vertical franz diffusion cell.
According to Food and Drug Administration (FDA)
regulations, it is an ideal tool for quality control of
topical preparations. It has a receptor and a donor
chamber, which is filled with phosphate buffer
medium. The schematic diagram of a vertical FDC
is shown in figure.
It consists of a water jacket through which
temperature controlled water is re-circulated in
order to perform the experiments at a desired
temperature. The dialysis membrane is sandwiched
between the two chambers and clamped in place
tightly.
The donor chamber is filled with a known
volume of and the permeation of solute through the
membrane is monitored by periodic sampling of the
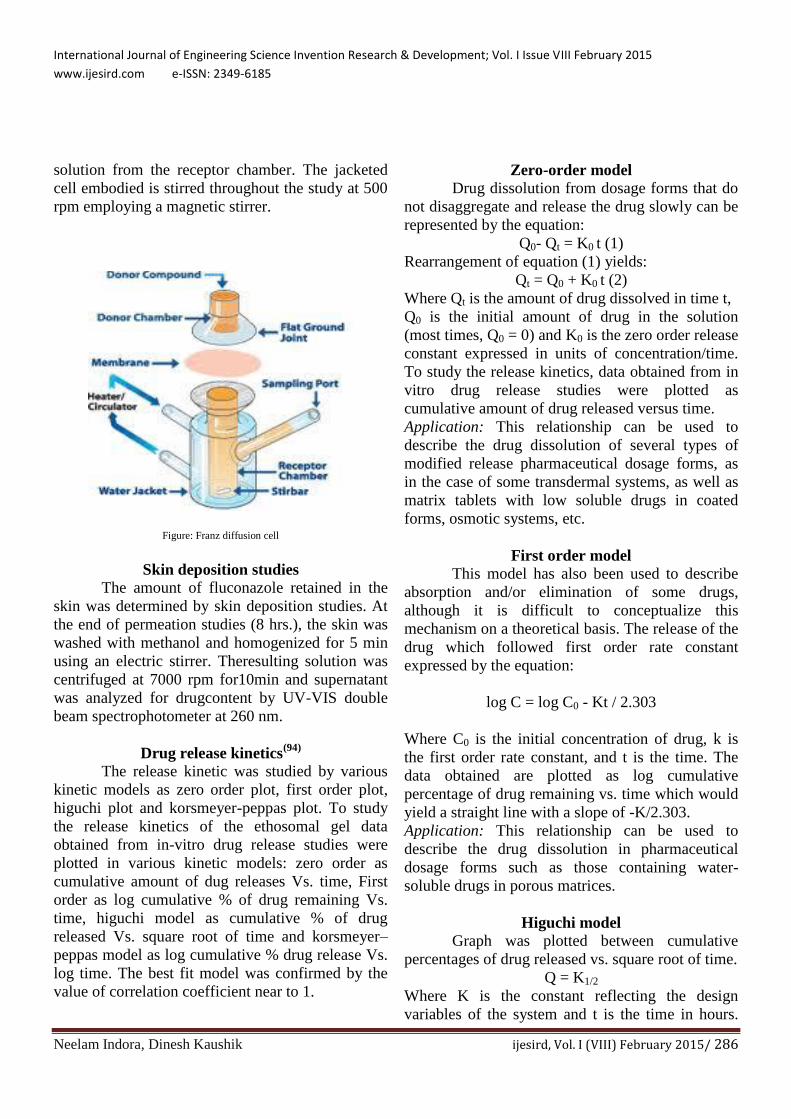
International Journal of Engineering Science Invention Research & Development; Vol. I Issue VIII February 2015
www.ijesird.com e-ISSN: 2349-6185
Neelam Indora, Dinesh Kaushik ijesird, Vol. I (VIII) February 2015/ 286
solution from the receptor chamber. The jacketed
cell embodied is stirred throughout the study at 500
rpm employing a magnetic stirrer.
Figure: Franz diffusion cell
Skin deposition studies
The amount of fluconazole retained in the
skin was determined by skin deposition studies. At
the end of permeation studies (8 hrs.), the skin was
washed with methanol and homogenized for 5 min
using an electric stirrer. Theresulting solution was
centrifuged at 7000 rpm for10min and supernatant
was analyzed for drugcontent by UV-VIS double
beam spectrophotometer at 260 nm.
Drug release kinetics(94)
The release kinetic was studied by various
kinetic models as zero order plot, first order plot,
higuchi plot and korsmeyer-peppas plot. To study
the release kinetics of the ethosomal gel data
obtained from in-vitro drug release studies were
plotted in various kinetic models: zero order as
cumulative amount of dug releases Vs. time, First
order as log cumulative % of drug remaining Vs.
time, higuchi model as cumulative % of drug
released Vs. square root of time and korsmeyer–
peppas model as log cumulative % drug release Vs.
log time. The best fit model was confirmed by the
value of correlation coefficient near to 1.
Zero-order model
Drug dissolution from dosage forms that do
not disaggregate and release the drug slowly can be
represented by the equation:
Q0- Qt = K0 t (1)
Rearrangement of equation (1) yields:
Qt = Q0 + K0 t (2)
Where Qt is the amount of drug dissolved in time t,
Q0 is the initial amount of drug in the solution
(most times, Q0 = 0) and K0 is the zero order release
constant expressed in units of concentration/time.
To study the release kinetics, data obtained from in
vitro drug release studies were plotted as
cumulative amount of drug released versus time.
Application: This relationship can be used to
describe the drug dissolution of several types of
modified release pharmaceutical dosage forms, as
in the case of some transdermal systems, as well as
matrix tablets with low soluble drugs in coated
forms, osmotic systems, etc.
First order model
This model has also been used to describe
absorption and/or elimination of some drugs,
although it is difficult to conceptualize this
mechanism on a theoretical basis. The release of the
drug which followed first order rate constant
expressed by the equation:
log C = log C0 - Kt / 2.303
Where C0 is the initial concentration of drug, k is
the first order rate constant, and t is the time. The
data obtained are plotted as log cumulative
percentage of drug remaining vs. time which would
yield a straight line with a slope of -K/2.303.
Application: This relationship can be used to
describe the drug dissolution in pharmaceutical
dosage forms such as those containing water-
soluble drugs in porous matrices.
Higuchi model
Graph was plotted between cumulative
percentages of drug released vs. square root of time.
Q = K1/2
Where K is the constant reflecting the design
variables of the system and t is the time in hours.
International Journal of Engineering Science Invention Research & Development; Vol. I Issue VIII February 2015
www.ijesird.com e-ISSN: 2349-6185
Neelam Indora, Dinesh Kaushik ijesird, Vol. I (VIII) February 2015/ 287
Hence, drug release rate is proportional to the
reciprocal of the square root of time.
Application: this relationship can be used to
describe the drug dissolution from several types of
modified release pharmaceutical dosage forms, as
in the case of some transdermal systems and matrix
tablets with water soluble drugs.
Korsmeyer-Peppas model(95)
Korsmeyer et al. (1983) derived a simple
relationship which described drug release from a
polymeric system. To find out the mechanism of
drug release, first 60% drug release data were fitted
in Korsmeyer-Peppas model
Mt / M∞ = Ktn
Where Mt / M∞ are a fraction of drug released at
time t, k is the release rate constant and n is the
release exponent. The n value is used to
characterize different release for cylindrical shaped
matrices. For the case of cylindrical tablets, 0.45 ≤
n corresponds to a Fickian diffusion mechanism,
0.45 < n <0.89 to non-Fickian transport, n = 0.89 to
Case II (relaxation) transport, and n > 0.89 to super
case II transport. To find out the exponent of n the
portion of the release curve, where Mt / M∞ < 0.6
should only be used. To study the release kinetics,
data obtained from in vitro drug release studies
were plotted as log cumulative percentage drug
release versus log time.
Stability(96)
The stability studywas carried out for
ethosomal gel formulation. Themost satisfactory
formulation was sealed in a glassvial to a
temperature of 40° C for 1 month, then at 25°C for1
month, then at 40°C for 1 month. After this
ethosomal gel was exposed to ambient room
temperature and liquid exudates separating was
noted.At the end of 3 months, the samples were
analyzed for physical characteristic study and the
drugcontent.
RESULTS AND DISCUSSION
Preformulation studies
Organoleptic properties
The following properties of drug were evaluated
and results are obtained as:
Table: Organoleptic properties of fluconazole
Drug
Test
Specification
Observation
Fluconazole
Colour
White
crystalline
powder
White powder
Fluconazole
Odour
Odourless
Odourless
The observations noted were compared to
the specifications given in the pharmacopoeia to
confirm the identity of the drug and it was found
that observations noted complied with the
specifications.
Solubility studies
Solubility studies are performed to
determine the solubility of drug in different
solvents. The solubility is expressed in terms of
ratio of solute and solvent.Fluconazole was found to
be soluble in methanol, acetone, 0.1 N HCL,
ethanol, distilled water, hexane, PBS of pH 5.5, 6.8,
7.4, chloroform, ether and propylene glycol.
International Journal of Engineering Science Invention Research & Development; Vol. I Issue VIII February 2015
www.ijesird.com e-ISSN: 2349-6185
Neelam Indora, Dinesh Kaushik ijesird, Vol. I (VIII) February 2015/ 288
Table: Solubility profile of fluconazole
S.NO. Quantity of drug Solvent Quantity of
solvent
Inference
1. 50 mg Methanol 5 ml Freely soluble
2. 50 mg Acetone 5 ml Soluble
3. 50 mg 0.1 N HCL 5 ml Sparingly soluble
4. 50 mg Ethanol 5 ml Sparingly soluble
5. 50 mg Distilled water 5 ml Slightly soluble
6. 50 mg Hexane 5 ml Very slightly soluble
7. 50 mg PBS pH 5.5 5 ml Slightly soluble
8. 50 mg PBS pH 6.8 5 ml Slightly soluble
9. 50 mg PBS pH 7.4 5 ml Slightly soluble
10. 50 mg Chloroform 5 ml Sparingly soluble
11. 50 mg Ether 5 ml Slightly soluble
12. 50 mg Propylene glycol 5 ml Slightly soluble
Melting point
Melting point of fluconazole was found to
be 138 0C. Melting point was measured three times
and mean was noted. A sharp transition took place
from solid to liquid at 138 0C, indicating that the
sample was pure and free from impurities.
Partition co-efficient
Partition co-efficient was measured three
times and mean was noted. Hence partition
coefficient was found to be 1.01± 0.01.
Determination of pH
The pH was measured three times and mean was
noted. Hence pH of fluconazole was found to be
6.8.
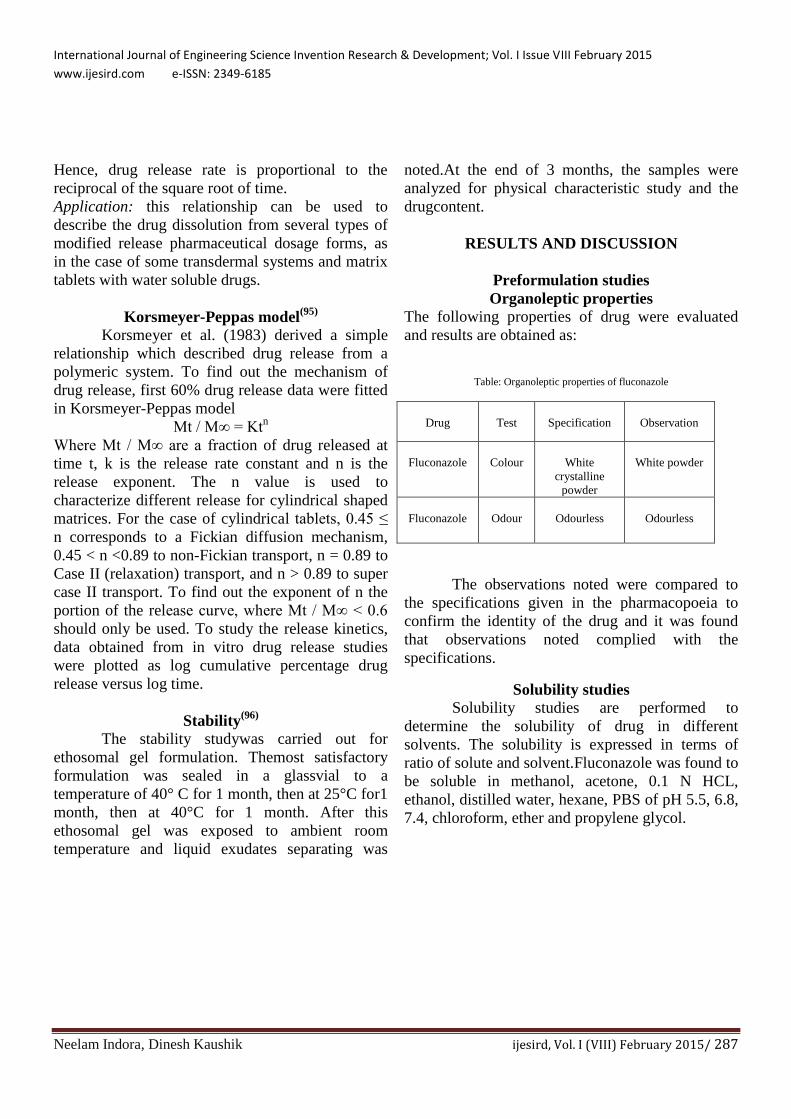
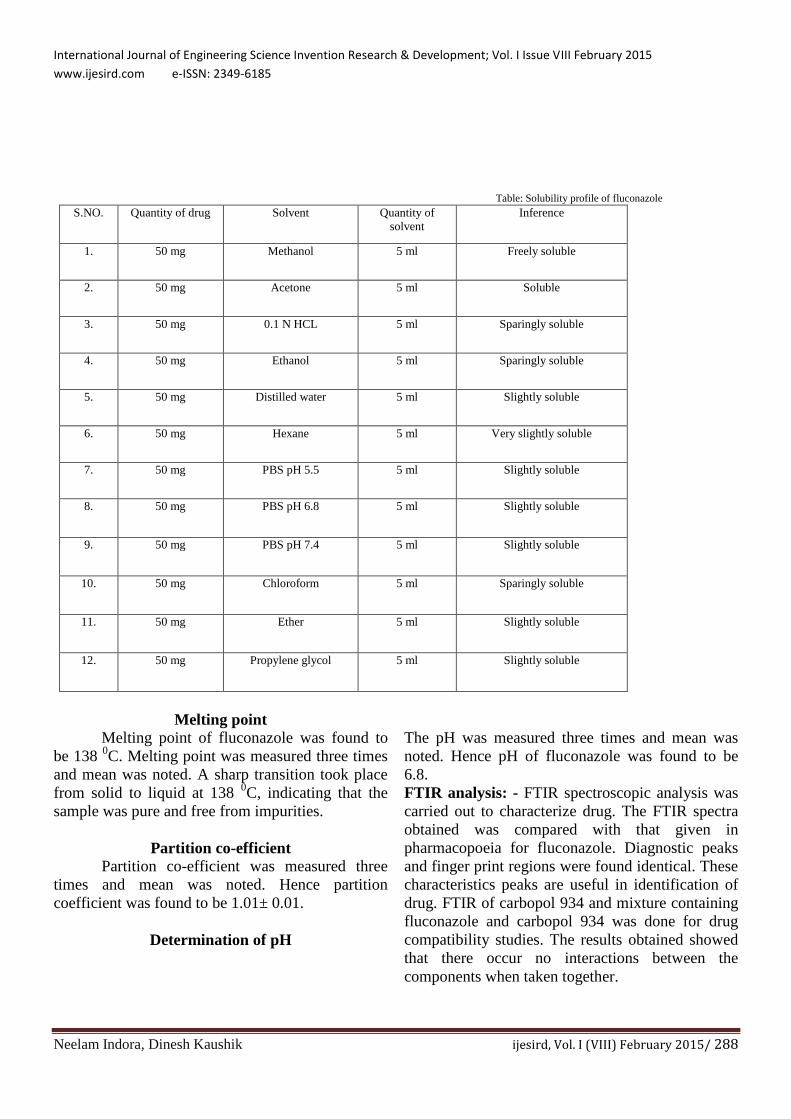
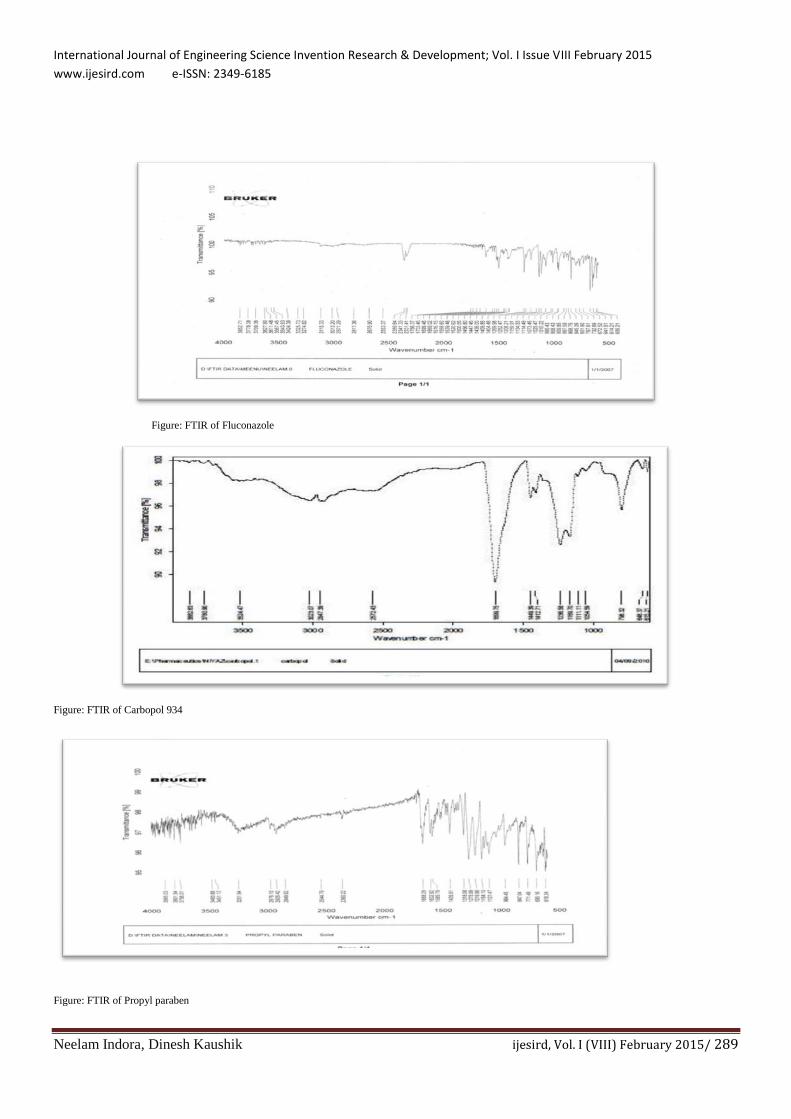
FTIR analysis: - FTIR spectroscopic analysis was
carried out to characterize drug. The FTIR spectra
obtained was compared with that given in
pharmacopoeia for fluconazole. Diagnostic peaks
and finger print regions were found identical. These
characteristics peaks are useful in identification of
drug. FTIR of carbopol 934 and mixture containing
fluconazole and carbopol 934 was done for drug
compatibility studies. The results obtained showed
that there occur no interactions between the
components when taken together.
International Journal of Engineering Science Invention Research & Development; Vol. I Issue VIII February 2015
www.ijesird.com e-ISSN: 2349-6185
Neelam Indora, Dinesh Kaushik ijesird, Vol. I (VIII) February 2015/ 289
Figure: FTIR of Fluconazole
Figure: FTIR of Carbopol 934
Figure: FTIR of Propyl paraben
International Journal of Engineering Science Invention Research & Development; Vol. I Issue VIII February 2015
www.ijesird.com e-ISSN: 2349-6185
Neelam Indora, Dinesh Kaushik ijesird, Vol. I (VIII) February 2015/ 290
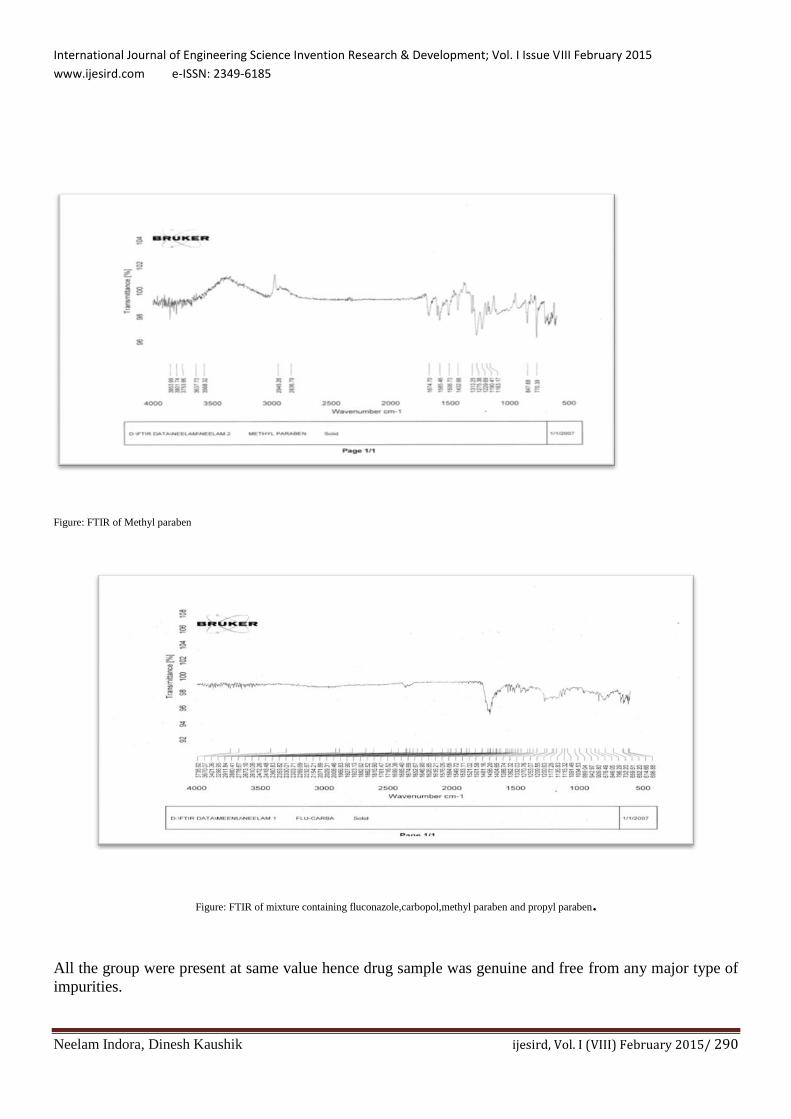
Figure: FTIR of Methyl paraben
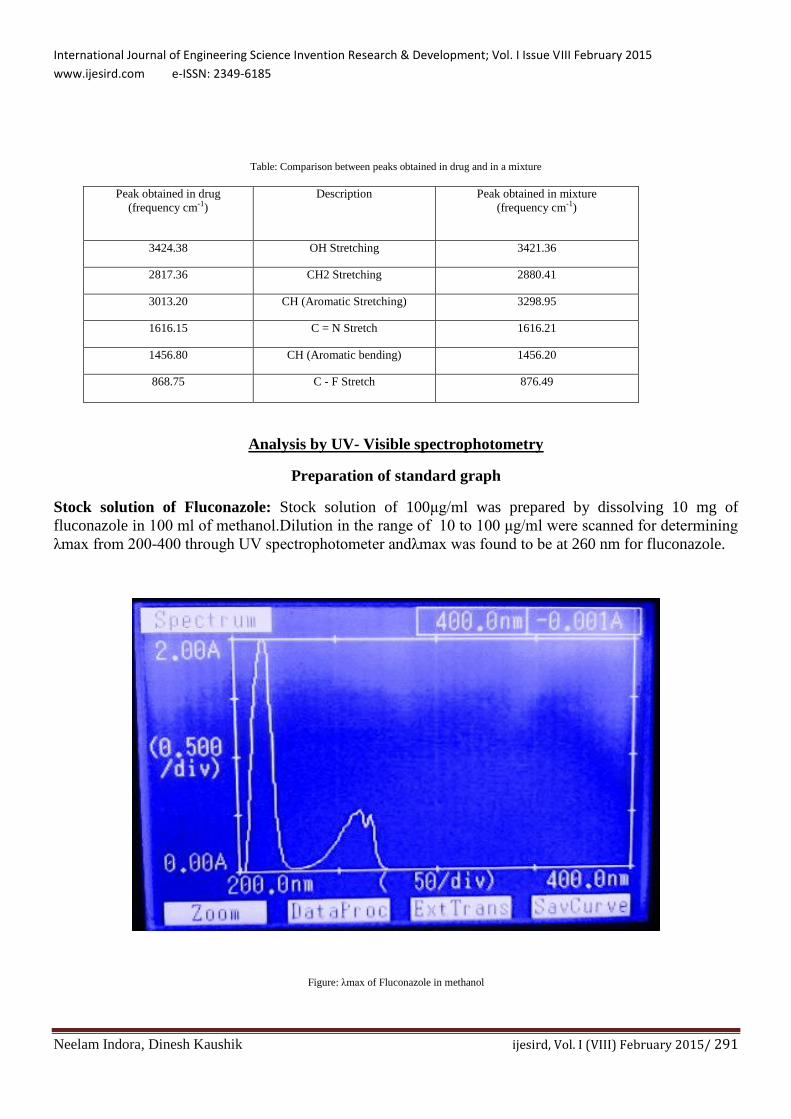
Figure: FTIR of mixture containing fluconazole,carbopol,methyl paraben and propyl paraben.
All the group were present at same value hence drug sample was genuine and free from any major type of
impurities.
International Journal of Engineering Science Invention Research & Development; Vol. I Issue VIII February 2015
www.ijesird.com e-ISSN: 2349-6185
Neelam Indora, Dinesh Kaushik ijesird, Vol. I (VIII) February 2015/ 291
Table: Comparison between peaks obtained in drug and in a mixture
Peak obtained in drug
(frequency cm-1)
Description Peak obtained in mixture
(frequency cm-1)
3424.38 OH Stretching 3421.36
2817.36 CH2 Stretching 2880.41
3013.20 CH (Aromatic Stretching) 3298.95
1616.15 C = N Stretch 1616.21
1456.80 CH (Aromatic bending) 1456.20
868.75 C - F Stretch 876.49
Analysis by UV- Visible spectrophotometry
Preparation of standard graph
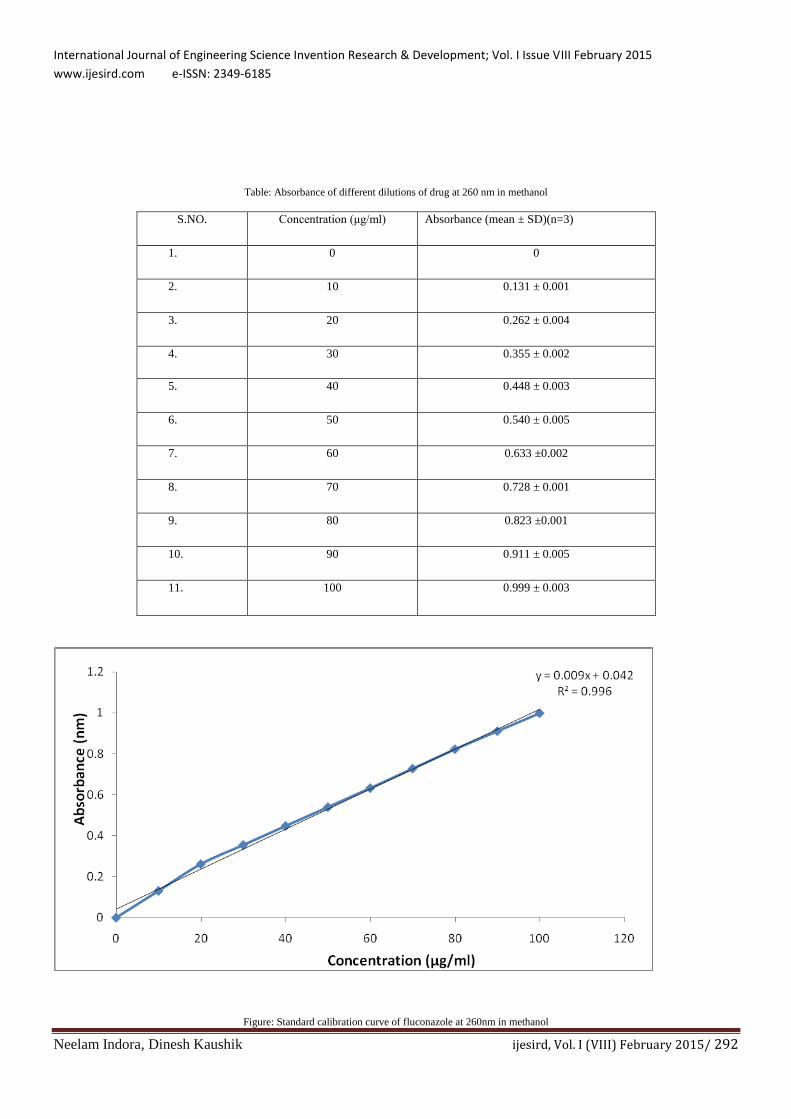
Stock solution of Fluconazole: Stock solution of 100μg/ml was prepared by dissolving 10 mg of
fluconazole in 100 ml of methanol.Dilution in the range of 10 to 100 μg/ml were scanned for determining
λmax from 200-400 through UV spectrophotometer andλmax was found to be at 260 nm for fluconazole.
Figure: λmax of Fluconazole in methanol
International Journal of Engineering Science Invention Research & Development; Vol. I Issue VIII February 2015
www.ijesird.com e-ISSN: 2349-6185
Neelam Indora, Dinesh Kaushik ijesird, Vol. I (VIII) February 2015/ 292
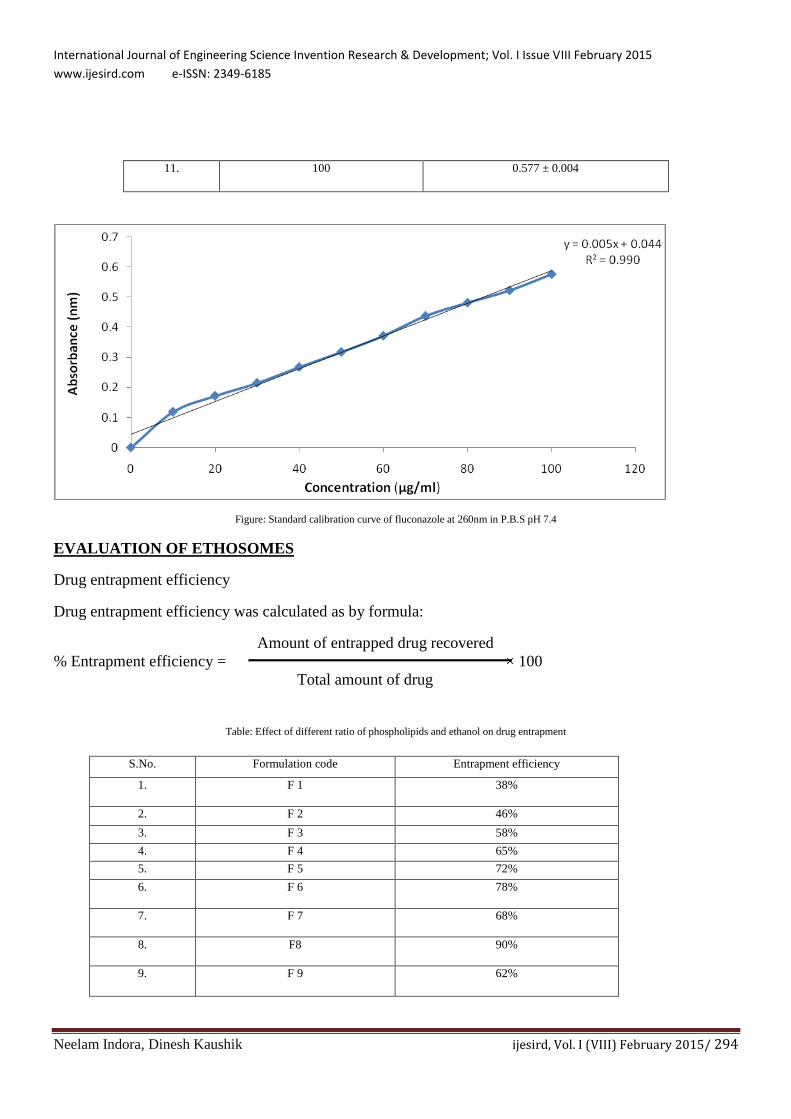
Table: Absorbance of different dilutions of drug at 260 nm in methanol
S.NO. Concentration (μg/ml) Absorbance (mean ± SD)(n=3)
1. 0 0
2. 10 0.131 ± 0.001
3. 20 0.262 ± 0.004
4. 30 0.355 ± 0.002
5. 40 0.448 ± 0.003
6. 50 0.540 ± 0.005
7. 60 0.633 ±0.002
8. 70 0.728 ± 0.001
9. 80 0.823 ±0.001
10. 90 0.911 ± 0.005
11. 100 0.999 ± 0.003
Figure: Standard calibration curve of fluconazole at 260nm in methanol

International Journal of Engineering Science Invention Research & Development; Vol. I Issue VIII February 2015
www.ijesird.com e-ISSN: 2349-6185
Neelam Indora, Dinesh Kaushik ijesird, Vol. I (VIII) February 2015/ 293
Preparation of calibration curve in PBS 7.4: sincePBS (7.4)
is taken as dissolution medium for ethosomal gel, the standard curve was obtained to calculate the
concentration of unknown samples for dissolution studies and drug content.
Figure: λmax of Fluconazole in P.B.S. pH 7.4
Table: Absorbance of different dilutions of drug at 260 nm in PBS pH 7.4
S.NO. Concentration (μg/ml) Absorbance (mean ± SD)(n=3)
1. 0 0
2. 10 0.119 ± 0.000
3. 20 0.172 ± 0.001
4. 30 0.215 ± 0.001
5. 40 0.268 ± 0.002
6. 50 0.318 ± 0.002
7. 60 0.372 ± 0.000
8. 70 0.438 ± 0.004
9. 80 0.482 ± 0.003
10. 90 0.523 ±0.003
International Journal of Engineering Science Invention Research & Development; Vol. I Issue VIII February 2015
www.ijesird.com e-ISSN: 2349-6185
Neelam Indora, Dinesh Kaushik ijesird, Vol. I (VIII) February 2015/ 294
11. 100 0.577 ± 0.004
Figure: Standard calibration curve of fluconazole at 260nm in P.B.S pH 7.4
EVALUATION OF ETHOSOMES
Drug entrapment efficiency
Drug entrapment efficiency was calculated as by formula:
Amount of entrapped drug recovered
% Entrapment efficiency = × 100
Total amount of drug
Table: Effect of different ratio of phospholipids and ethanol on drug entrapment
S.No. Formulation code Entrapment efficiency
1. F 1 38%
2. F 2 46%
3. F 3 58%
4. F 4 65%
5. F 5 72%
6. F 6 78%
7. F 7 68%
8. F8 90%
9. F 9 62%
International Journal of Engineering Science Invention Research & Development; Vol. I Issue VIII February 2015
www.ijesird.com e-ISSN: 2349-6185
Neelam Indora, Dinesh Kaushik ijesird, Vol. I (VIII) February 2015/ 295
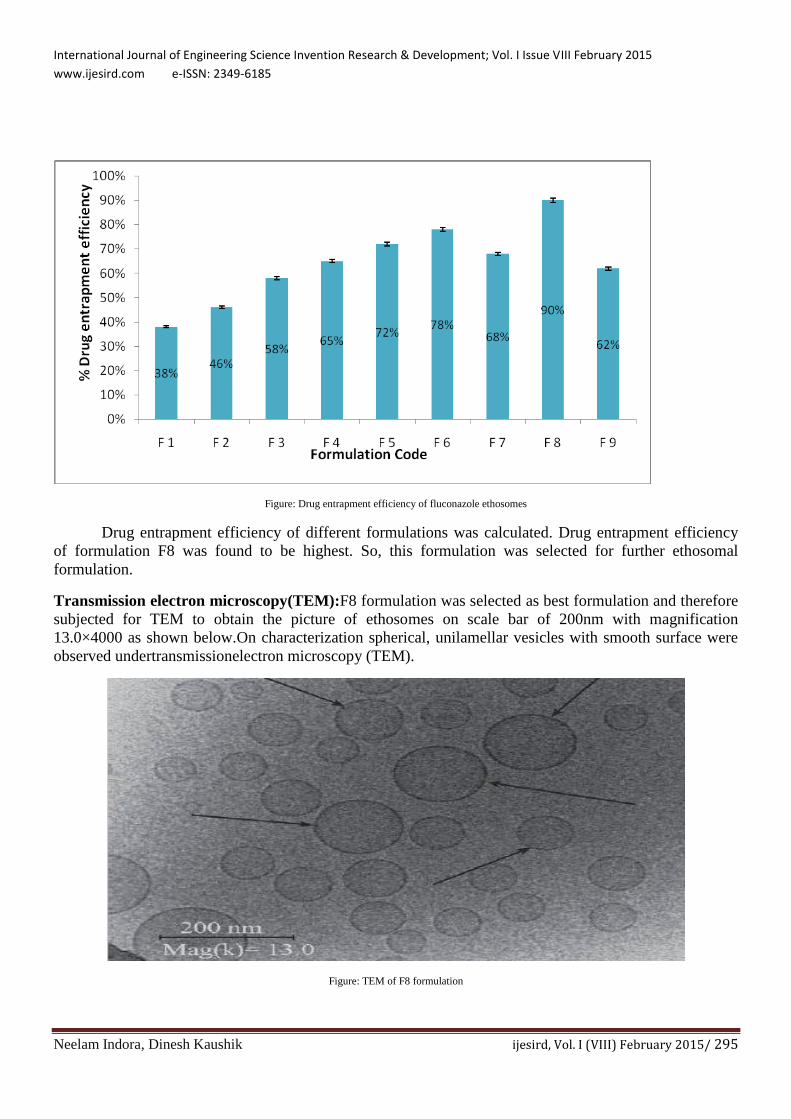
Figure: Drug entrapment efficiency of fluconazole ethosomes
Drug entrapment efficiency of different formulations was calculated. Drug entrapment efficiency
of formulation F8 was found to be highest. So, this formulation was selected for further ethosomal
formulation.
Transmission electron microscopy(TEM):F8 formulation was selected as best formulation and therefore
subjected for TEM to obtain the picture of ethosomes on scale bar of 200nm with magnification
13.0×4000 as shown below.On characterization spherical, unilamellar vesicles with smooth surface were
observed undertransmissionelectron microscopy (TEM).
Figure: TEM of F8 formulation
International Journal of Engineering Science Invention Research & Development; Vol. I Issue VIII February 2015
www.ijesird.com e-ISSN: 2349-6185
Neelam Indora, Dinesh Kaushik ijesird, Vol. I (VIII) February 2015/ 296
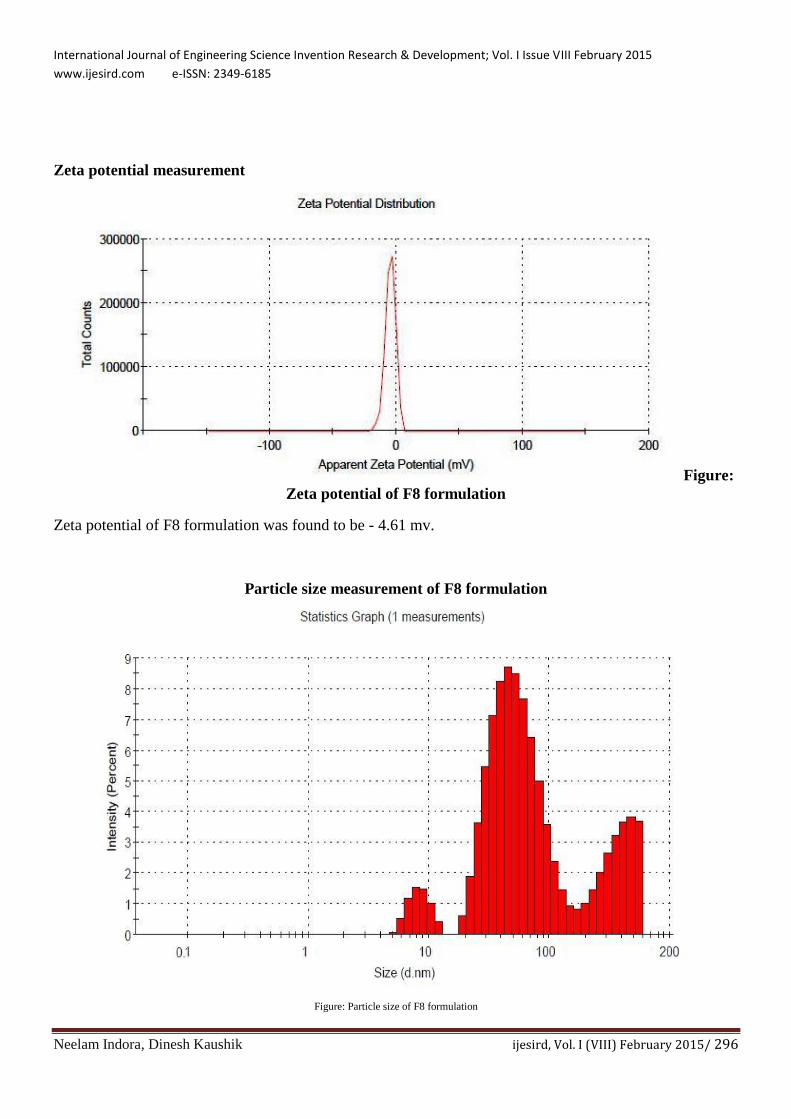
Zeta potential measurement
Figure:
Zeta potential of F8 formulation
Zeta potential of F8 formulation was found to be - 4.61 mv.
Particle size measurement of F8 formulation
Figure: Particle size of F8 formulation
International Journal of Engineering Science Invention Research & Development; Vol. I Issue VIII February 2015
www.ijesird.com e-ISSN: 2349-6185
Neelam Indora, Dinesh Kaushik ijesird, Vol. I (VIII) February 2015/ 297
Vesicular size of ethosomes of F8 formulation was in the range of 5 to 200 nm.
PHYSICAL EVALUATION OF ETHOSOMAL
GEL
The ethosomal gel formulation of
fluconazole was evaluated for
Organoleptic characteristics
Colour = pale (yellow) to colourless
Odour = characteristic
Appearance = translucent
Phase separation = no
Occlusiveness = yes
Washability = washable
Determination of pH of gel base and ethosomal
gel
The pH of gel base and freshly prepared F8
ethosomal gel was found to be 7.5 and 8.0
respectively.
Viscosity
The viscosity of carbopol 934 gel base and
ethosomal gel bybrookfield viscometer was found
to be 744,00 and 73,200 cps (centipoise).
Spreadability
The spreadability of ethosomal gel was
found to be 14.79 g.cm2. The spreadability results
showed that ethosomal gel was most effective i.e. it
showed best result for spreadability.
Extrudability study
The extrudability of ethosomal gel was found to be
positive.
Percentage yield
The % yield of ethosomal gel was found to
be 97.18 %.
Homogeneity and grittiness
Ethosomal gel was found to be
homogeneous and no grittiness was noted.
Skin irritation study
The results of skin irritation study revealed
no irritation from ethosomal gel.
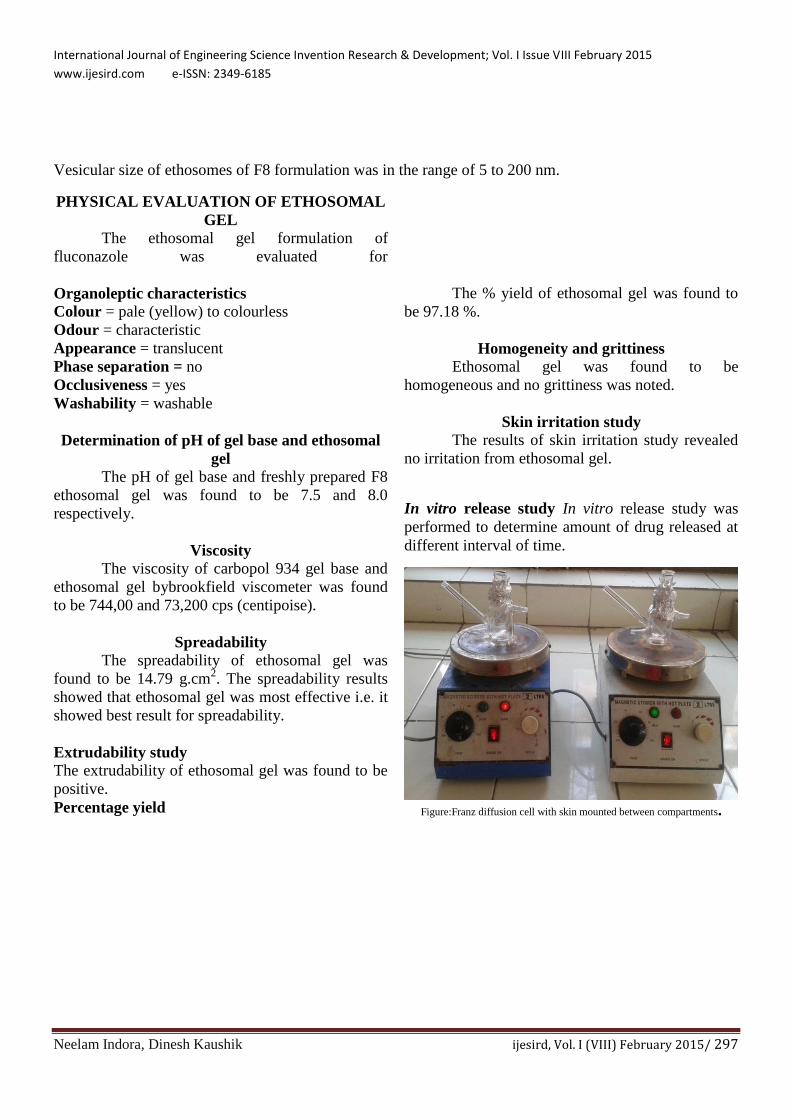
In vitro release study In vitro release study was
performed to determine amount of drug released at
different interval of time.
Figure:Franz diffusion cell with skin mounted between compartments.

International Journal of Engineering Science Invention Research & Development; Vol. I Issue VIII February 2015
www.ijesird.com e-ISSN: 2349-6185
Neelam Indora, Dinesh Kaushik ijesird, Vol. I (VIII) February 2015/ 298
Table: Release of drug from F8 formulation and marketed formulation.
Time
(min.)
% cumulative release of F8 formulation in 7.4
pH PBS
% cumulative release of marketed fluconazole
gel in 7.4 PBS
0 0 0
15 14.16 ± 0.12 8.52 ± 0.02
30 19.84 ± 0.15 12.08 ± 0.06
45 36.02 ± 0.10 17.56 ± 0.20
60 37.98 ± 0.16 19.02 ± 0.09
120 42.54 ± 0.18 25.66 ± 0.31
180 46.09 ± 0.17 27.03 ± 0.38
240 59.76 ± 0.11 36.78 ± 0.49
300 63.34 ± 0.19 42.08 ± 0.15
360 70.03 ± 0.20 50.98 ± 0.18
420 82.72 ± 0.13 61.78 ± 0.42
480 92.00 ± 0.79 70.00 ± 0.22
Figure: Rate release of drug from F8 formulation and marketed gel in P.B.S. pH 7.4
Rate of release from different formulation are given in graph and table. It may be observed that
release of drug occurred fast initially then after some time release become slower.From graph it was
observed that cumulative release of fluconazole was more from ethosomal formulation than marketed
International Journal of Engineering Science Invention Research & Development; Vol. I Issue VIII February 2015
www.ijesird.com e-ISSN: 2349-6185
Neelam Indora, Dinesh Kaushik ijesird, Vol. I (VIII) February 2015/ 299
fluconazole gel over a period oF8 hrs. Ethosomal formulation was desingned to achieve high permeability
and ultimately increase the bioavalibility of the drug.
KINETICS OF DRUG RELEASE
The release kinetic of F8 fomulation in phosphate buffer saline pH 7.4 was studied by various
kinetic models. The following data was obtained.
Table: Drug release data of F8 formulation in P.B.S. pH 7.4
Time
(minutes)
Log time Square
root of
time
% cumulative
release of F8
Log %
cumulative
release of F8
% cumulative
remaining
Log %
cumulative
remaining
0 0 0 0 0 100 2
15 1.18 3.87 14.16 1.151 85.84 1.933
30 1.48 5.48 19.84 1.297 80.16 1.903
45 1.65 6.71 36.02 1.556 63.98 1.806
60 1.75 7.75 37.98 1.579 62.02 1.792
120 2.08 10.95 42.54 1.628 57.46 1.759
180 2.26 13.42 46.09 1.663 53.91 1.731
240 2.38 15.49 59.76 1.776 40.24 1.604
300 2.48 17.32 63.34 1.801 36.66 1.564
360 2.56 18.97 70.03 1.845 29.97 1.476
420 2.62 20.49 82.72 1.917 17.28 1.237
480 2.68 21.91 92.00 1.971 6.36 0.803
International Journal of Engineering Science Invention Research & Development; Vol. I Issue VIII February 2015
www.ijesird.com e-ISSN: 2349-6185
Neelam Indora, Dinesh Kaushik ijesird, Vol. I (VIII) February 2015/ 300
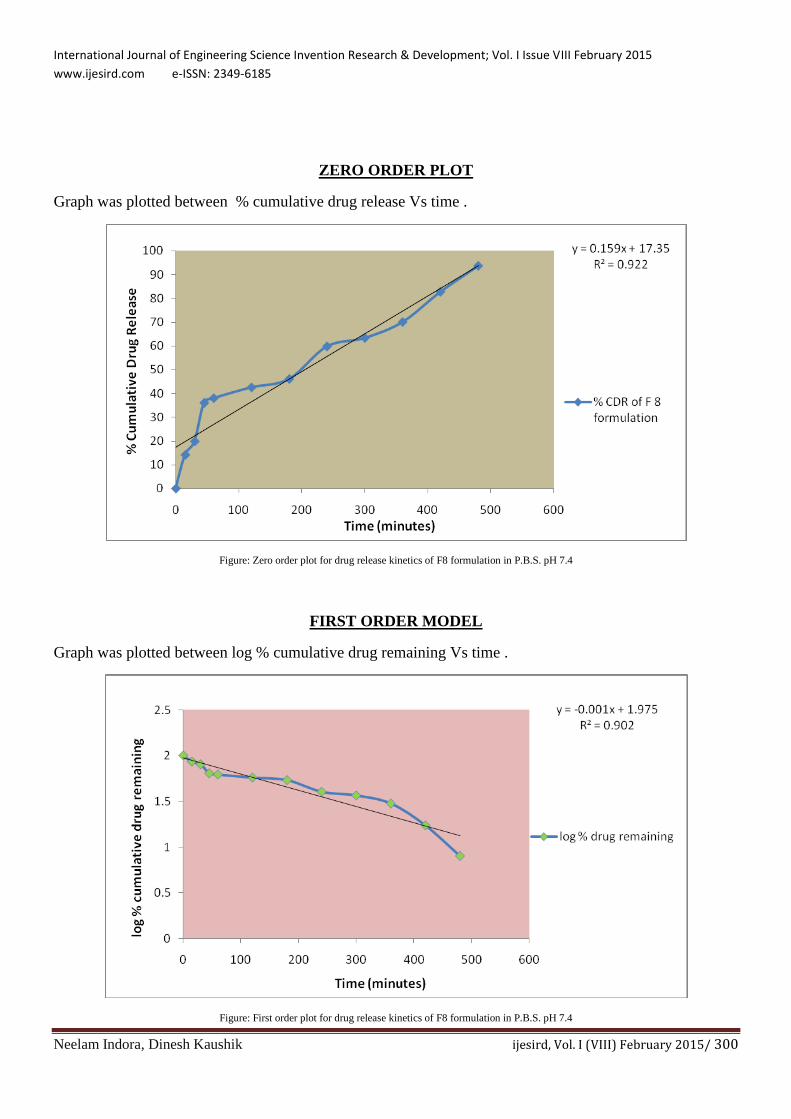
ZERO ORDER PLOT
Graph was plotted between % cumulative drug release Vs time .
Figure: Zero order plot for drug release kinetics of F8 formulation in P.B.S. pH 7.4
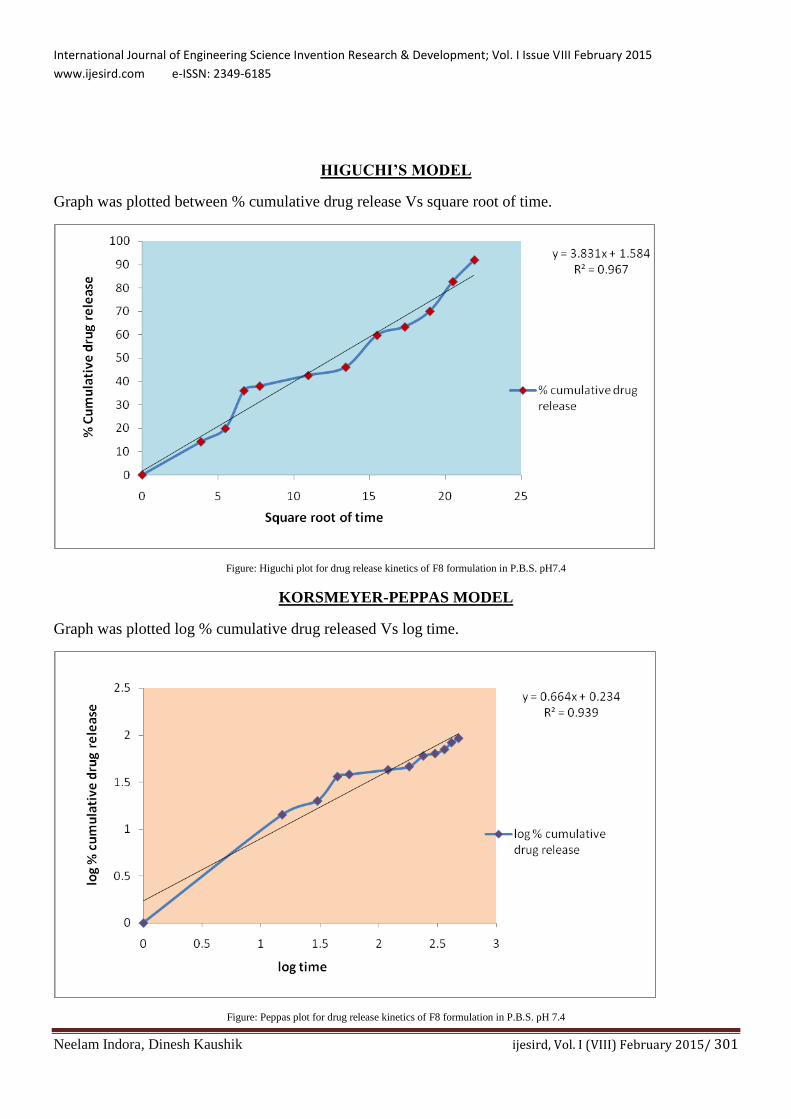
FIRST ORDER MODEL
Graph was plotted between log % cumulative drug remaining Vs time .
Figure: First order plot for drug release kinetics of F8 formulation in P.B.S. pH 7.4
International Journal of Engineering Science Invention Research & Development; Vol. I Issue VIII February 2015
www.ijesird.com e-ISSN: 2349-6185
Neelam Indora, Dinesh Kaushik ijesird, Vol. I (VIII) February 2015/ 301
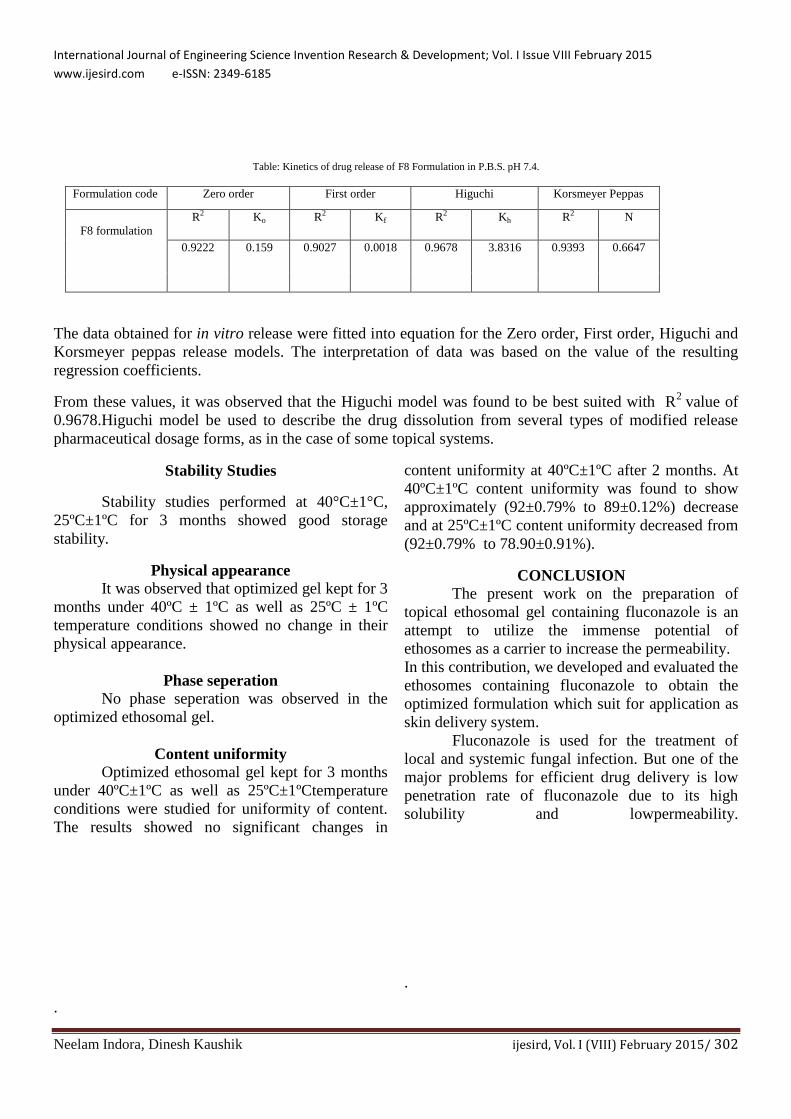
HIGUCHI’S MODEL
Graph was plotted between % cumulative drug release Vs square root of time.
Figure: Higuchi plot for drug release kinetics of F8 formulation in P.B.S. pH7.4
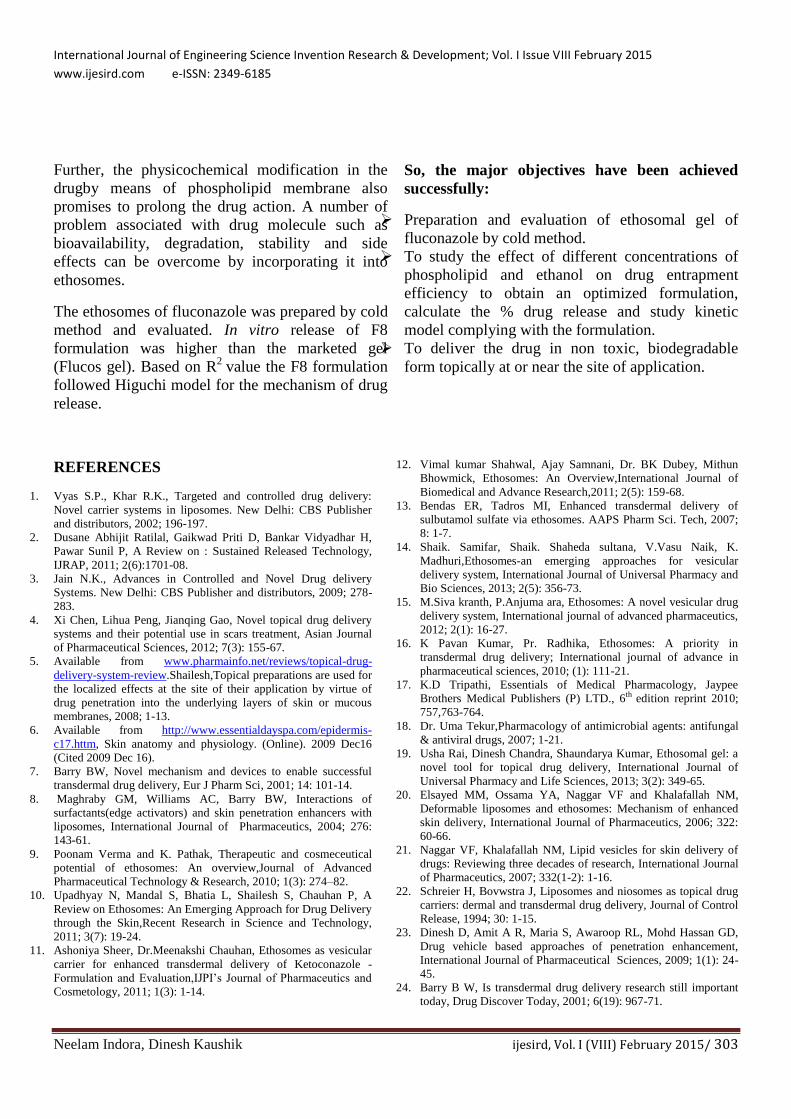
KORSMEYER-PEPPAS MODEL
Graph was plotted log % cumulative drug released Vs log time.
Figure: Peppas plot for drug release kinetics of F8 formulation in P.B.S. pH 7.4
International Journal of Engineering Science Invention Research & Development; Vol. I Issue VIII February 2015
www.ijesird.com e-ISSN: 2349-6185
Neelam Indora, Dinesh Kaushik ijesird, Vol. I (VIII) February 2015/ 302
Table: Kinetics of drug release of F8 Formulation in P.B.S. pH 7.4.
Formulation code Zero order First order Higuchi Korsmeyer Peppas
F8 formulation
R2 Ko R2 Kf R2 Kh R2 N
0.9222 0.159 0.9027 0.0018 0.9678 3.8316 0.9393 0.6647
The data obtained for in vitro release were fitted into equation for the Zero order, First order, Higuchi and
Korsmeyer peppas release models. The interpretation of data was based on the value of the resulting
regression coefficients.
From these values, it was observed that the Higuchi model was found to be best suited with R2
value of
0.9678.Higuchi model be used to describe the drug dissolution from several types of modified release
pharmaceutical dosage forms, as in the case of some topical systems.
Stability Studies
Stability studies performed at 40°C±1°C,
25ºC±1ºC for 3 months showed good storage
stability.
Physical appearance
It was observed that optimized gel kept for 3
months under 40ºC ± 1ºC as well as 25ºC ± 1ºC
temperature conditions showed no change in their
physical appearance.
Phase seperation
No phase seperation was observed in the
optimized ethosomal gel.
Content uniformity
Optimized ethosomal gel kept for 3 months
under 40ºC±1ºC as well as 25ºC±1ºCtemperature
conditions were studied for uniformity of content.
The results showed no significant changes in
content uniformity at 40ºC±1ºC after 2 months. At
40ºC±1ºC content uniformity was found to show
approximately (92±0.79% to 89±0.12%) decrease
and at 25ºC±1ºC content uniformity decreased from
(92±0.79% to 78.90±0.91%).
CONCLUSION
The present work on the preparation of
topical ethosomal gel containing fluconazole is an
attempt to utilize the immense potential of
ethosomes as a carrier to increase the permeability.
In this contribution, we developed and evaluated the
ethosomes containing fluconazole to obtain the
optimized formulation which suit for application as
skin delivery system.
Fluconazole is used for the treatment of
local and systemic fungal infection. But one of the
major problems for efficient drug delivery is low
penetration rate of fluconazole due to its high
solubility and lowpermeability.
.
.
International Journal of Engineering Science Invention Research & Development; Vol. I Issue VIII February 2015
www.ijesird.com e-ISSN: 2349-6185
Neelam Indora, Dinesh Kaushik ijesird, Vol. I (VIII) February 2015/ 303
Further, the physicochemical modification in the
drugby means of phospholipid membrane also
promises to prolong the drug action. A number of
problem associated with drug molecule such as
bioavailability, degradation, stability and side
effects can be overcome by incorporating it into
ethosomes.
The ethosomes of fluconazole was prepared by cold
method and evaluated. In vitro release of F8
formulation was higher than the marketed gel
(Flucos gel). Based on R2
value the F8 formulation
followed Higuchi model for the mechanism of drug
release.
So, the major objectives have been achieved
successfully:
Preparation and evaluation of ethosomal gel of
fluconazole by cold method.
To study the effect of different concentrations of
phospholipid and ethanol on drug entrapment
efficiency to obtain an optimized formulation,
calculate the % drug release and study kinetic
model complying with the formulation.
To deliver the drug in non toxic, biodegradable
form topically at or near the site of application.
REFERENCES
1. Vyas S.P., Khar R.K., Targeted and controlled drug delivery:
Novel carrier systems in liposomes. New Delhi: CBS Publisher
and distributors, 2002; 196-197.
2. Dusane Abhijit Ratilal, Gaikwad Priti D, Bankar Vidyadhar H,
Pawar Sunil P, A Review on : Sustained Released Technology,
IJRAP, 2011; 2(6):1701-08.
3. Jain N.K., Advances in Controlled and Novel Drug delivery
Systems. New Delhi: CBS Publisher and distributors, 2009; 278-
283.
4. Xi Chen, Lihua Peng, Jianqing Gao, Novel topical drug delivery
systems and their potential use in scars treatment, Asian Journal
of Pharmaceutical Sciences, 2012; 7(3): 155-67.
5. Available from www.pharmainfo.net/reviews/topical-drug-
delivery-system-review.Shailesh,Topical preparations are used for
the localized effects at the site of their application by virtue of
drug penetration into the underlying layers of skin or mucous
membranes, 2008; 1-13.
6. Available from http://www.essentialdayspa.com/epidermis-
c17.httm, Skin anatomy and physiology. (Online). 2009 Dec16
(Cited 2009 Dec 16).
7. Barry BW, Novel mechanism and devices to enable successful
transdermal drug delivery, Eur J Pharm Sci, 2001; 14: 101-14.
8. Maghraby GM, Williams AC, Barry BW, Interactions of
surfactants(edge activators) and skin penetration enhancers with
liposomes, International Journal of Pharmaceutics, 2004; 276:
143-61.
9. Poonam Verma and K. Pathak, Therapeutic and cosmeceutical
potential of ethosomes: An overview,Journal of Advanced
Pharmaceutical Technology & Research, 2010; 1(3): 274–82.
10. Upadhyay N, Mandal S, Bhatia L, Shailesh S, Chauhan P, A
Review on Ethosomes: An Emerging Approach for Drug Delivery
through the Skin,Recent Research in Science and Technology,
2011; 3(7): 19-24.
11. Ashoniya Sheer, Dr.Meenakshi Chauhan, Ethosomes as vesicular
carrier for enhanced transdermal delivery of Ketoconazole -
Formulation and Evaluation,IJPI’s Journal of Pharmaceutics and
Cosmetology, 2011; 1(3): 1-14.
12. Vimal kumar Shahwal, Ajay Samnani, Dr. BK Dubey, Mithun
Bhowmick, Ethosomes: An Overview,International Journal of
Biomedical and Advance Research,2011; 2(5): 159-68.
13. Bendas ER, Tadros MI, Enhanced transdermal delivery of
sulbutamol sulfate via ethosomes. AAPS Pharm Sci. Tech, 2007;
8: 1-7.
14. Shaik. Samifar, Shaik. Shaheda sultana, V.Vasu Naik, K.
Madhuri,Ethosomes-an emerging approaches for vesicular
delivery system, International Journal of Universal Pharmacy and
Bio Sciences, 2013; 2(5): 356-73.
15. M.Siva kranth, P.Anjuma ara, Ethosomes: A novel vesicular drug
delivery system, International journal of advanced pharmaceutics,
2012; 2(1): 16-27.
16. K Pavan Kumar, Pr. Radhika, Ethosomes: A priority in
transdermal drug delivery; International journal of advance in
pharmaceutical sciences, 2010; (1): 111-21.
17. K.D Tripathi, Essentials of Medical Pharmacology, Jaypee
Brothers Medical Publishers (P) LTD., 6th edition reprint 2010;
757,763-764.
18. Dr. Uma Tekur,Pharmacology of antimicrobial agents: antifungal
& antiviral drugs, 2007; 1-21.
19. Usha Rai, Dinesh Chandra, Shaundarya Kumar, Ethosomal gel: a
novel tool for topical drug delivery, International Journal of
Universal Pharmacy and Life Sciences, 2013; 3(2): 349-65.
20. Elsayed MM, Ossama YA, Naggar VF and Khalafallah NM,
Deformable liposomes and ethosomes: Mechanism of enhanced
skin delivery, International Journal of Pharmaceutics, 2006; 322:
60-66.
21. Naggar VF, Khalafallah NM, Lipid vesicles for skin delivery of
drugs: Reviewing three decades of research, International Journal
of Pharmaceutics, 2007; 332(1-2): 1-16.
22. Schreier H, Bovwstra J, Liposomes and niosomes as topical drug
carriers: dermal and transdermal drug delivery, Journal of Control
Release, 1994; 30: 1-15.
23. Dinesh D, Amit A R, Maria S, Awaroop RL, Mohd Hassan GD,
Drug vehicle based approaches of penetration enhancement,
International Journal of Pharmaceutical Sciences, 2009; 1(1): 24-
45.
24. Barry B W, Is transdermal drug delivery research still important
today, Drug Discover Today, 2001; 6(19): 967-71.
International Journal of Engineering Science Invention Research & Development; Vol. I Issue VIII February 2015
www.ijesird.com e-ISSN: 2349-6185
Neelam Indora, Dinesh Kaushik ijesird, Vol. I (VIII) February 2015/ 304
25. Biju SS, Sushama T, Mishra PR, Khar RK, Vesicular systems: An
overview, Ind. J. Pharma Sci, 2006; 68(2): 141-53.
26. CJ Beukelman, MJ Hoekstra, K Reimer, S Mueller, Anti-
inflammatory properties of a liposomal hydrogel with povidone-
iodine for wound healing in vitro burns,International Journal of
Pharmaceutics, 2008; 34(6): 845-55.
27. Lasic DD, P.M. Frederick, M.C.A. Stuart, Y Barenholz, T.J.
Mclntosh, Gelation of liposomes interior-A novel method for drug
encapsulation,International Journal of Pharmaceutics, 1992; 312:
255-58.
28. Peppas NA, Characterization of cross-linked structure of
hydrogels, Med. Pharm, 1986; 1: 27-56.
29. Mohammed MN, In vitro release of hydrophilic and hydrophobic
drugs from liposomal dispersions and gels, Act. Pharm, 2006; 56:
311-24.
30. Mezei M, Gulasekharam V, Liposomes - a selective drug delivery
system for the topical route of administration, Life Sci, 1980; 26:
1473-77.
31. Vermorken AJ, Hukkelhoven MW, Vermeesch AM, Goos CM,
Wirtz P, The use of liposomes in the topical application of
steroids, J. Pharm. Pharmacol., 1983; 36: 334-36.
32. Ganesan MG, Weiner ND, Flynn GL, Ho NFH, Influence of
liposomal drug entrapment on percutaneous absorption,
International Journal of Pharmaceutics, 1984; 20: 139-154.
33. Touitou, E, Composition of applying active substance to or
through the skin, US patent, 5, 540, 934, 1996.
34. Cevc G, Blume G, Schatzlein A, Gebauer D, Paul A, The skin
pathway for systemic treatment patches and lipid based agent
carriers, Advanced Drug Delivery Reviews, 1996; 18: 349-78.
35. Wollenberg B, Lang S, Schmitt B, Kastenbauer E, Zeidler R, In
vitro studies of liposome-mediated gene transfer into head and
neck cancer cell lines, Eur. Arch. Otorhinolaryngol, 1997; Suppl
1:S130-2; 254.
36. Touitou E, Composition of applying active substance to or
through the skin, US Patent: 5,716,638, 1998.
37. Hadgraft J, Passive enhancement strategies in topical and
transdermal drug delivery, Int. J Pharm, 1999; 184: 1–6.
38. Dayan N and Touitou E, Carrier for skin delivery of
trihexyphenidyl HCl: Ethosomes vs. Liposomes, Biomaterials,
2000; 21:1879-85.
39. Touitou E, Dayan N, Bergelson L, Godin B, Eliaz M, Ethosomes-
novel vesicular carriers for enhanced delivery: Characterization
and skin penetration properties, J Control Release, 2000; 65: 403–
18.
40. Touitou E, Godin B, Dayan N, Intracellular delivery mediated by
ethosomal carrier, Biomaterials, 2001; 22: 3055–9.
41. Touitou E, Drug delivery across skin, Expert opinion on
Biological Therapy, 2002; 2: 723-33.
42. EL Laithy HM, El Shaboury KM, The development of Cutina
lipogels and gel microemulsion for topical administration of
fluconazole, AAPS Pharm Sci. Tech, 2002; 3(4): 35-43.
43. Godin B, Touitou E, Ethosomes: new prospects in transdermal
delivery, Crit. Rev. Ther. Drug Carrier Syst, 2003; 20(1): 63-102.
44. Jain S, Umamaheshwari RB, Bhadra D, Jain NK, Ethosomes: A
novel vesicular carriers for enhanced transdermal delivery of an
anti HIV agent, Ind. J Pharm Sci, 2004; 66: 72-81.
45. Rivera PA, Martinez-Oharriz MC, Rubio M, Irache JM, Espuelas
S, Fluconazole encapsulation in PLGA microspheres by spray-
drying, J Micro encapsul, 2004; 21(2): 203-11.
46. Ainbinder D, Touitou E, Testosterone ethosomes for enhanced
transdermal delivery, Drug Delivery, 2005; 12: 297–303.
47. Jain S, Mishra D, Kuksal A, Tiwary AK and Jain NK, Vesicular
Approach for Drug Delivery into or across the Skin: Current
Status and Future Prospects , Int. J Pharm, 2006; 251-258, 269.
48. Jain S, Tiwary AK, Sapra B, Jain NK, Formulation and evaluation
of ethosomes for transdermal delivery of lamivudine, AAPS
Pharm Sci. Tech, 2007; 8: 111–19.
49. Taglietti M, Hawkins CN, Rao J, Novel topical drug delivery
systems and their potential use in acne vulgaris, Skin Therapy
Lett, 2008; 13(5): 6-8.
50. Rao Y, Zheng F, Zhang X, Gao J, Liang W, In vitro percutaneous
permeation and skin accumulation of finasteride using vesicular
ethosomal carriers, AAPS Pharm Sci. Tech, 2008; 9(3): 860-65.
51. Yogeshwar G. Bachhav, Vandana B. Patravale, Microemulsion
based vaginal gel of fluconazole: Formulation, in vitro and in vivo
evaluation, International Journal of Pharmaceutics, 2008; 365(1-
2): 175-79.
52. Mishra D, Mishra PK, Dabadghao S, Dubey V, Nahar M, Jain
NK, Comparative evaluation of hepatitis B surface antigen–
loaded elastic liposomes and ethosomes for human dendritic cell
uptake and immune response, Nanomedicine; Nanotechology,
Biology and Medicine, 2009; 6: 110-18.
53. Vijay Kumar, A. Abdul Hasan, Sathali M.R, Arun K, Formulation
and evaluation of Diclofenac potassium: Ethosome, International
Journal of Pharmacy & Pharmaceutical Sciences, 2010; 2(4): 82-
86.
54. Available from www.ncbi.nlm.nih.gov/m/pubmed/19558428,
Yim SM, Ko JH, Lee YW, Kim HW, Lee JY, Kim NI, Kye YC,
Park KC, Choi JH, Lee KH, Kim MN, Kim KJ, Ro YS, Ahn KJ,
Study to compare the efficacy and safety of fluconazole cream
with flutrimazole cream in the treatment of superficial mycosis: a
multicentre, randomised, double-blind, phase III trial, Mycoses,
2010; 53(6): 522-29.
55. Available from
www.sciencedirect.com/science/article/pii/s1319016410000666,
Ola H. El-Nesra, Soad A. Yahiyab, Omaima N. El-Gazayerly,
Effect of formulation design and freeze-drying on properties of
fluconazole multilamellar liposomes, Saudi pharmaceutical
journal, 2010; 18(4): 217-24.
56. Jaya raj Kumar.K, Jayachandran.E, Srinivas.GM, Giridhar.B,
Rahul Nair, Jayakandan.M,A Novel Thermo-Sensitive Sol-Gel
Reversible Buccal Adhesive Property of Fluconazole in Situ Gel
For Oral Thrush, J Biomed Sci. and Res, 2010; 2(2): 100-109.
57. Chourasia MK, Kang Lifeng, Chan Sui Yung, Nano-sized
ethosomes bearing ketoprofen for improved transdermal
delivery,Elsevier Results in Pharma Sciences,2011; 1: 60–67.
58. B. Niyaz Basha , Kalyani Prakasam, Divakar Goli, Formulation
and evaluation of Gel containing Fluconazole-Antifungal
Agent,International Journal of Drug Development & Research,
2011; 3(4): 109-28.
59. Available from www.ncbi.nlm.nih.gov/pubmed/21951195 , Gupta
M, Vaidya B, Mishra N, Vyas SP, Effect of surfactants on the
characteristics of fluconazole niosomes for enhanced cutaneous
delivery, Artif Cells Blood Substit Immobile Biotechnol, 2011;
39(6): 376-84.
60. Nevine S Abdelmalak, Shahira F EL-Menshawe, A new topical
fluconazole microsponge loaded hydrogel: preparation and
Characterization, International Journal of Pharmacy and
Pharmaceutical Sciences, 2011; 4(1
61. ): 460-68.
62. Available from www.ncbi.nlm.nih.gov/pubmed/21504616, Harish
M Nairy, Narayana R Charyulu, Veena A Shetty and Prabhu
Prabhakara, A pseudo-randomised clinical trial of in situ gels of
fluconazole for the treatment of oropharyngeal candidiasis, 2011;
12: 1-165.
International Journal of Engineering Science Invention Research & Development; Vol. I Issue VIII February 2015
www.ijesird.com e-ISSN: 2349-6185
Neelam Indora, Dinesh Kaushik ijesird, Vol. I (VIII) February 2015/ 305
63. Nikalje AP, Tiwari S, Ethosomes: A Novel Tool for Transdermal
Drug Delivery,International Journal of Research in Pharmacy and
Science, 2012; 2(1): 1-20.
64. Available from www.ncbi.nlm.nih.gov/pubmed/22694593, Kaur
IP, Rana C, Singh M, Bhushan S, Singh H, Kakkar S,
Development and evaluation of novel surfactant-based elastic
vesicular system for ocular delivery of fluconazole, Journal of
Ocular Pharmacology Therapeutics, 2012; 28(5): 484-96.
65. Available from http://www.ijddr.in, Samita Singla, S. L, Hari
Kumar, Geeta Aggarwal, Proniosomes for Penetration
Enhancement in Transdermal System, International Journal of
Drug Development & Research,2012; 4(2): 1-13.
66. Loveleen Preet Kaur, Topical Gel: A recent approach for novel
drug delivery, Asian Journal of Biomedical and Pharmaceutical
Sciences, 2013; 3(17): 1-10
67. Bhana R, Verma A, Jain S, Development and Characterization of
Ethosomes bearing losartan potassium for transdermal drug
delivery, International Journal of Pharmacy and Pharmaceutical
Sciences, 2013; 5(1): 35-40.
68. Mohammed N, Rejinold NS, Mangalathillam S, Biswas R, Nair
SV, Jayakumar R, Fluconazole loaded chitin nanogels as a topical
ocular drug delivery agent for corneal fungal infections, J Biomed
Nanotechnol, 2013; 9(9): 1521-31.
69. Ahad A, Raish M, Al-Mohizea AM, Al-Jenoobi FI, Alam MA,
Enhanced anti-inflammatory activity of carbopol loaded
meloxicam nanoethosomes gel, Int. J Biol. Macro mol, 2014; 67:
99-104.
70. Jain S, Patel N, Madan P, Lin S, Quality by design approach for
formulation, evaluation and statistical optimization of diclofenac-
loaded ethosomes via transdermal route, Pharm Dev. Technol,
2014: 1-12.
71. Pandey V, Golhani D, Shukla R, Ethosomes: versatile vesicular
carriers for efficient transdermal delivery of therapeutic agents,
Drug Delivery, 2014: 31-40.
72. Narges Alizadeh, Hamed Monadi Nori, Javad Golchi, Shahriar S
Eshkevari, Ehsan Kazemnejad, and Abbas Darjani, Comparison
the Efficacy of Fluconazole
73. and Terbinafine in Patients with Moderate to Severe Seborrheic
Dermatitis, Dermatology Research and Practice, 2014; 2014: 401-
05.
74. Amrita Sawant Dessai, Shripathi D, Dr. AR Shabaraya,
Formulation and in vitro characterization of nail lacquer
containing fluconazole for preungual drug delivery
system,International journal of Pharmaceutical research and bio-
science, 2014; 3(2): 200-14.
75. Indian pharmacopoeia, vol.2, 6thedition 2010, Publisher-Indian
pharmacopoeia commission, 1353-54.
76. Available from http://nsdl.niscair.res.in, Dr. Uma Tekur,
Antimicrobial Agents: Antifungal & Antiviral Drugs, 2007: 2-7.
77. Available from www.medicines.org.uk .
78. Available from www.medicinenet.com/fluconazole .
79. Available from
www.fao.org/ag/agn/ijecfa_additives_specs/monograph4/additive
s.
80. Available from www.pharmainfo.net, Avinash H. Hosmani,
Carbopol & its Pharmaceutical significance: A Review, 2006: 1-
10.
81. Available from www.usp.org, The United States Pharmacopoeia
National Formulary, vol. 2, 13th edition 2012, publisher-The
United States Pharmacopoeial Convention, 1729-30.
82. Available from www.mailto:[email protected].
83. European Pharmacopoeia, vol.2, 5thedition 2005, Publisher-
Council of Europe, 1545-46.
84. Available from www.huntman.com/pu.
85. European pharmacopoeia, vol.2, 5th edition 2005, Publisher-
Council of Europe, 2327-28.
86. Available from http://toxnet.nlm.nih.gov/index.html.
87. Ashok A Hajare, Mahesh N Mali, Sushil Sarvagod, Sachin
Kurane, Shweta Patwardhan, Arun S. Dange, Adsorption and
Partition Studies of Fluconazole, Asian J. Research Chem, 2009;
2(2): 213-19.
88. D Prasanthi, PK Lakshmi, Development of ethosomes with
taguchi robust design-based studies for transdermal delivery of
alfuzosin hydrochloride,International Current Pharmaceutical
Journal, 2012; 1(11): 370-75.
89. Meena Devi, Murugesan Senthil Kumar, Nanjaian Mahadevan,
Amphotericin-B loaded vesicular systems for the treatment of
topical fungal infection, International Journal of Recent Advances
in Pharmaceutical Research, 2011; (4): 37-46.
90. MK Bhalaria, Sachin Naik, AN Mishra, Ethosomes: A novel
delivery system for antifungal drugs in treatment of topical fungal
diseases, Indian Journal of Experimental Biology, 2009; 47: 368-
75.
91. Vivek Dave, Ashutosh Pareek, Sarvesh Paliwal, Ethosome: A
Novel Approach of Transdermal Drug Delivery System,
International Journal of Advanced Research in Pharmaceutical &
Bio Sciences, 2012; 2(4): 439- 52.
92. Available from Zeta Potential Using Laser Doppler
Electrophoresis – Malvern.Com Pharmaceutical Technology On-
Line.
93. Varun Thakur, Bharat Prashar, Sonia Arora, Formulation and in
vitro Evaluation of Gel for Topical Delivery of Antifungal Agent
Fluconazole Using Different Penetration Enhancers,Drug
Invention Today,2012; 4(8): 414-19.
94. Kamal Saroha, Sarabjeet Singh, Ajay Aggarwal and Sanju Nanda,
Transdermal Gels - An Alternative Vehicle For Drug
Delivery,International Journal Of Pharmaceutical, Chemical And
Biological Sciences, 2013; 3(3): 495-503.
95. AK Barupal, Vandana Gupta, Suman Ramteke, Preparation and
Characterization of Ethosomes for Topical delivery of
Aceclofenac, Indian Journal of Pharmaceutical Sciences, 2010;
72(5):582-86.
96. Phaldesai Saiesh, AR Shabaraya, Shripathy D, Leyana Soman,
Kinetic Modeling of Drug Release from Topical Gel,
International Journal of Universal Pharmacy and Bio Sciences,
2014; 3(3): 92-104.
97. Suvakanta Dash, Padala Narasimha Murthy, Lilakanta Nath,
Prasanta Chowdhury,Kinetic Modeling On Drug Release From
Controlled Drug Delivery Systems, Acta Poloniae Pharmaceutica
- Drug Research, 2010; 67(3): 217-23.
98. AR Rathore, H. Khambete, S. Jain, Preparation and
Characterization of Repaglinide Loaded Ethosomal Gel for the
Treatment of NIDDM, International Journal of Pharmaceutical &
Biological Archives, 2013; 4(2): 385-90.
99. Lalit Kumar, Ruchi Verma, In vitro evaluation of topical gel
prepared using natural polymer, International Journal of Drug
Delivery, 2010; (2): 58-63.
100. Available from http://www.informahealthcare.com/lpr, Rita
Cortesi, Romeo Romagnoli, Markus Drechsler, Enea Menegatti,
Abdel N Zaid, Laura Ravani, Elisabetta Esposito, Liposomes and
ethosomes-associated distamycins: a comparative study, Journal
of Liposome Research, 2009, 1-9.
101. Ashni Verma, Sukhdev Singh, Rupinder Kaur, Ajay Kumar,
Upendra K Jain, Formulation, Optimization And Evaluation Of
International Journal of Engineering Science Invention Research & Development; Vol. I Issue VIII February 2015
www.ijesird.com e-ISSN: 2349-6185
Neelam Indora, Dinesh Kaushik ijesird, Vol. I (VIII) February 2015/ 306
Clobetasol Propionate Gel,International Journal of Pharmacy and
Pharmaceutical Sciences, 2013; 5(4):666-74.
100. Verma DD, Verma S, Blume G, Fahr A, Ethosomes
increases skin penetration of entrapped and nonentrapped
hydrophilic substances into human skin: A skin penetration and
confocal scanning microscopy studies, Eur J Pharm Biopharm,
2003; 55: 271–77.
Top Related
Copyright © 2022 FDOKUMEN

