


Bahasa
Halaman
Hukum


Data Analytics Driven CyberinfrastructureOperations, Planning and Analysis Using XDMoDThomas R. Furlani∗, Barry I. Schneider† Matthew D. Jones∗, John Towns‡, David L. Hart§, Abani K. Patra∗,
Robert L. DeLeon∗, Steven M. Gallo∗, Charng-Da Lu∗, Amin Ghadersohi∗, Ryan J. Gentner∗,Andrew E. Bruno∗, John R. Boisseau¶, Fugang Wang‖, and Gregor von Laszewski‖
∗Center for Computational Research,University at Buffalo, State University of New York,
701 Ellicott Street, Buffalo NY 14203Email:{furlani, jonesm, smgallo, charngda, ag28, rgentner, abani, rldeleon, aebruno2}@buffalo.edu
†Office of Cyberinfrastructure,National Science Foundation,
4201 Wilson Boulevard, Arlington VA 22230Email: [email protected]
‡National Center for Supercomputing Applications,University of Illinois at Urbana-Champaign,
1205 W. Clark St., Urbana IL 61801Email: [email protected]
§National Center for Atmospheric Research,P.O. Box 3000, Boulder CO 80307-3000
Email: [email protected]¶Texas Advanced Computing Center,
Research Office Complex 1.101,J.J. Pickle Research Campus, Building 196,
10100 Burnet Road (R8700), Austin TX 78758-4497Email: [email protected]‖Pervasive Technology Institute,
Indiana University,2719 East 10th Street, Bloomington IN 47408Email:{kevinwangfg, laszewski}@gmail.com
Abstract—Historically high-end cyberinfrastructure planningat the campus, regional and national levels has been based onepisodic analysis of limited data and/or projections of demandwith minimal supporting comprehensive usage data. However,a repository of usage data for the TeraGrid and the follow-onXSEDE program provides a unique source of extensive datathat can be exploited to guide planning efforts. The XDMoDtool deployed by the Technology Audit Service (TAS) componentof XSEDE is designed to facilitate access to these data bymultiple stakeholder groups, providing a unique opportunity tocarry out comprehensive analysis of cyberinfrastructure usage.To complement usage data and strengthen XDMoD’s utility foroverall system analysis, a suite of application kernels has beendeveloped to help provide control data on system performance.Current and past utilization metrics, coupled with applicationkernel-based performance analysis, can be used to help guidefuture cyberinfrastructure investment decisions, plan system up-grades, tune machine performance, improve user job throughput,and facilitate routine system operation and maintenance. Inthis paper we present analysis of historical usage data fromthe TeraGrid and the follow-on XSEDE program and deriveinteresting insight into the nature of usage by discipline overtime. The analysis shows the remarkable growth in resources
and the impact this has had on the number of users, the numberand size of allocations, the job size in terms of number of cores,and the growth in simulation based engineering and science inmany fields. The utility of the XDMoD framework for facilitatingsystem performance assessment through the implementation ofapplication kernels is also demonstrated.
I. INTRODUCTION
Planning of high-end cyberinfrastructure (CI) can be donebest when it is based upon reliable, extensive data from pastusage. In addition, as described by Katz et. al. [1], the abilityto readily measure usage modalities for cyberinfrastructureleads to a greater understanding of the objectives of endusers and accordingly insight into the changes in CI to bettersupport their usage. The National Science Foundation (NSF)recognized the value of this data and through the TechnologyAudit Service (TAS) of XSEDE made a significant investmentin developing tools and infrastructure to make this sort of dataand data analysis easily accessible to a broader range of usersand resource managers. In this context, the XDMoD (XSEDEMetrics on Demand) auditing tool provides an extensive

range of metrics that gives users and XSEDE managementthe ability to rapidly access historical data broken out byvarious categories such as resource, user and field of science.While XDMoD has made reporting a much simpler and lesstime-consuming task, the range of metrics available has alsoprovided insight into the operation of TeraGrid/XSEDE thatwas not readily available, and in some cases not even possiblepreviously. Thus XDMoD augments qualitative past methods,such as surveys, one-on-one interviews with users, and work-shop reports, aimed at better understanding and improvingservice to TeraGrid/XSEDE users [2], [3], [4], [5].
Usage data is dependent on the idiosyncrasies ofuser/vendor implementation of algorithms – a significant draw-back in analyzing systems performance based on usage data.To alleviate this, the TAS XDMoD framework was expandedto also include an auditing system that utilizes computationallylightweight application kernels to provide a measure of overallsystem performance. These kernels, reminiscent of the “Berke-ley dwarfs” [6], are representative of the major computationalapplications that are routinely run on HPC resources. With theright selection of kernels, this allows continuous resource au-diting to measure all aspects of system performance includingfile-system performance, processor and memory performance,and network latency and bandwidth. The deployment of theseapplication kernels, which are standardized programs run onXSEDE resources exactly as a typical user runs them, can givethe user insight on potential performance for their applicationand provide resource managers with information on howapplications are performing on their systems. Routine use ofsuch kernels also provides resource managers early warningof anomalous systems behavior.
The remainder of this paper is organized as follows. Wefirst provide a brief overview of XDMoD to provide contextfor the discussion that follows. We then present the resultsof several XDMoD usage case studies, beginning with ananalysis of historical usage data from the TeraGrid and thefollow-on XSEDE program. The second case study demon-strates the utility of the XDMoD framework for facilitatingsystem performance assessment through the implementationof application kernels. The third and final case study shows,through several examples, how, like most analysis tools, caremust be exercised in the interpretation of data generated bythe XDMoD tool. The final section covers conclusions andfuture work.
II. XDMOD OVERVIEW
XDMoD provides a role-based web portal for mining HPCsystem usage data and performing statistical analysis. Thisrole-based framework is designed to meet the following ob-jectives: (1) provide the user community with a tool to moreeffectively and efficiently use their allocations and optimizetheir use of resources, (2) provide operational staff withthe ability to monitor and tune resource performance, (3)provide management with a diagnostic tool to facilitate CIplanning and analysis as well as monitor resource utilization
and performance, and (4) provide metrics to help measure sci-entific impact. Here we present a brief overview of XDMoD’sfunctionality, a more detailed description is contained in theappendix and an earlier publication [7].
In the present implementation of XDMoD, data is ingesteddaily from the XSEDE central data base (XDCDB) and queriesare tuned to provide results within a few seconds. To date,the focus has been on XSEDE’s compute resources, thoughfuture versions will be extended to include XSEDE’s visual-ization and storage resources. Furthermore, while XDMoD iscurrently tailored to work with the data stored in the XDCDB,future releases will allow for custom databases containingsimilar data collected by individual HPC centers. In themeantime, the open source package UB Metrics on Demand(UBMoD) is available to provide useful utilization metrics foracademic HPC centers [8].
The XDMoD portal [9] provides a rich set of featuresaccessible through an intuitive graphical interface, which istailored to the role of the user. Currently five roles aresupported: Public, User, Principal Investigator, Center Directorand Program Officer. Metrics provided by XDMoD include:number of jobs, service units (see next section for definition)charged, CPUs used, wait time, and wall time, with minimum,maximum and the average of these metrics, in addition tomany others. These metrics can be broken down by: field ofscience, institution, job size, job wall time, NSF directorate,NSF user status, parent science, person, principal investigator,and by resource. A context-sensitive drill-down capability hasbeen added to many charts allowing users to access additionalrelated information simply by clicking inside a plot and thenselecting the desired metric. For example, in Figure 1, whichis a plot of total CPU hours in 2011 by job size for all XSEDEresources, one can select any column in the plot and obtainadditional information (such as field of science) specific tothe range of data represented by the column. Metrics thatfocus on scientific impact, such as publications, citations andexternal funding, will be incorporated in future versions tohelp quantify the important role HPC centers play in advancingresearch and scholarship.
Fig. 1. The XDMoD interface. For the Program Officer role, seven tabsnear the top of the screen allow for navigation around the site to access thevarious metrics. The Plot shows the total CPU hours provided by all XSEDEresources in 2011 by job size.
III. XDMOD USAGE CASE STUDIES
A. A Data History of TeraGrid/XSEDE Usage: Defining aStrategy for Advanced Cyberinfrastructure
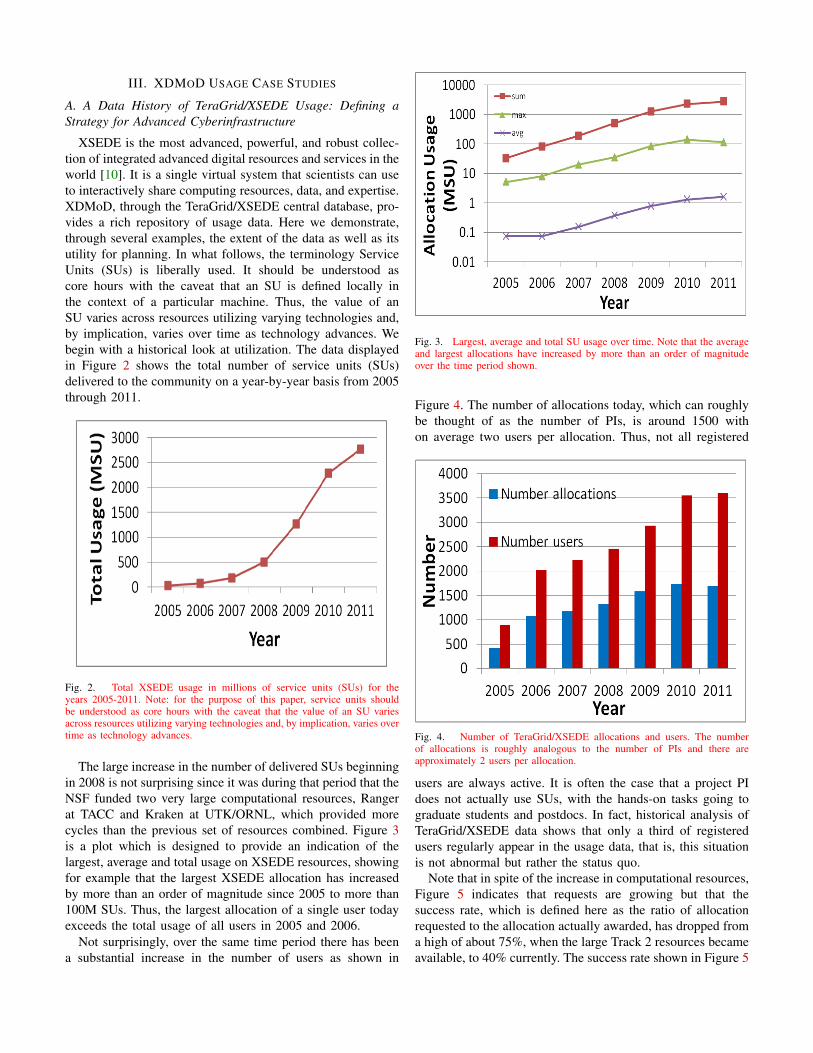
XSEDE is the most advanced, powerful, and robust collec-tion of integrated advanced digital resources and services in theworld [10]. It is a single virtual system that scientists can useto interactively share computing resources, data, and expertise.XDMoD, through the TeraGrid/XSEDE central database, pro-vides a rich repository of usage data. Here we demonstrate,through several examples, the extent of the data as well as itsutility for planning. In what follows, the terminology ServiceUnits (SUs) is liberally used. It should be understood ascore hours with the caveat that an SU is defined locally inthe context of a particular machine. Thus, the value of anSU varies across resources utilizing varying technologies and,by implication, varies over time as technology advances. Webegin with a historical look at utilization. The data displayedin Figure 2 shows the total number of service units (SUs)delivered to the community on a year-by-year basis from 2005through 2011.
Fig. 2. Total XSEDE usage in millions of service units (SUs) for theyears 2005-2011. Note: for the purpose of this paper, service units shouldbe understood as core hours with the caveat that the value of an SU variesacross resources utilizing varying technologies and, by implication, varies overtime as technology advances.
The large increase in the number of delivered SUs beginningin 2008 is not surprising since it was during that period that theNSF funded two very large computational resources, Rangerat TACC and Kraken at UTK/ORNL, which provided morecycles than the previous set of resources combined. Figure 3is a plot which is designed to provide an indication of thelargest, average and total usage on XSEDE resources, showingfor example that the largest XSEDE allocation has increasedby more than an order of magnitude since 2005 to more than100M SUs. Thus, the largest allocation of a single user todayexceeds the total usage of all users in 2005 and 2006.
Not surprisingly, over the same time period there has beena substantial increase in the number of users as shown in
Fig. 3. Largest, average and total SU usage over time. Note that the averageand largest allocations have increased by more than an order of magnitudeover the time period shown.
Figure 4. The number of allocations today, which can roughlybe thought of as the number of PIs, is around 1500 withon average two users per allocation. Thus, not all registered
Fig. 4. Number of TeraGrid/XSEDE allocations and users. The numberof allocations is roughly analogous to the number of PIs and there areapproximately 2 users per allocation.
users are always active. It is often the case that a project PIdoes not actually use SUs, with the hands-on tasks going tograduate students and postdocs. In fact, historical analysis ofTeraGrid/XSEDE data shows that only a third of registeredusers regularly appear in the usage data, that is, this situationis not abnormal but rather the status quo.
Note that in spite of the increase in computational resources,Figure 5 indicates that requests are growing but that thesuccess rate, which is defined here as the ratio of allocationrequested to the allocation actually awarded, has dropped froma high of about 75%, when the large Track 2 resources becameavailable, to 40% currently. The success rate shown in Figure 5
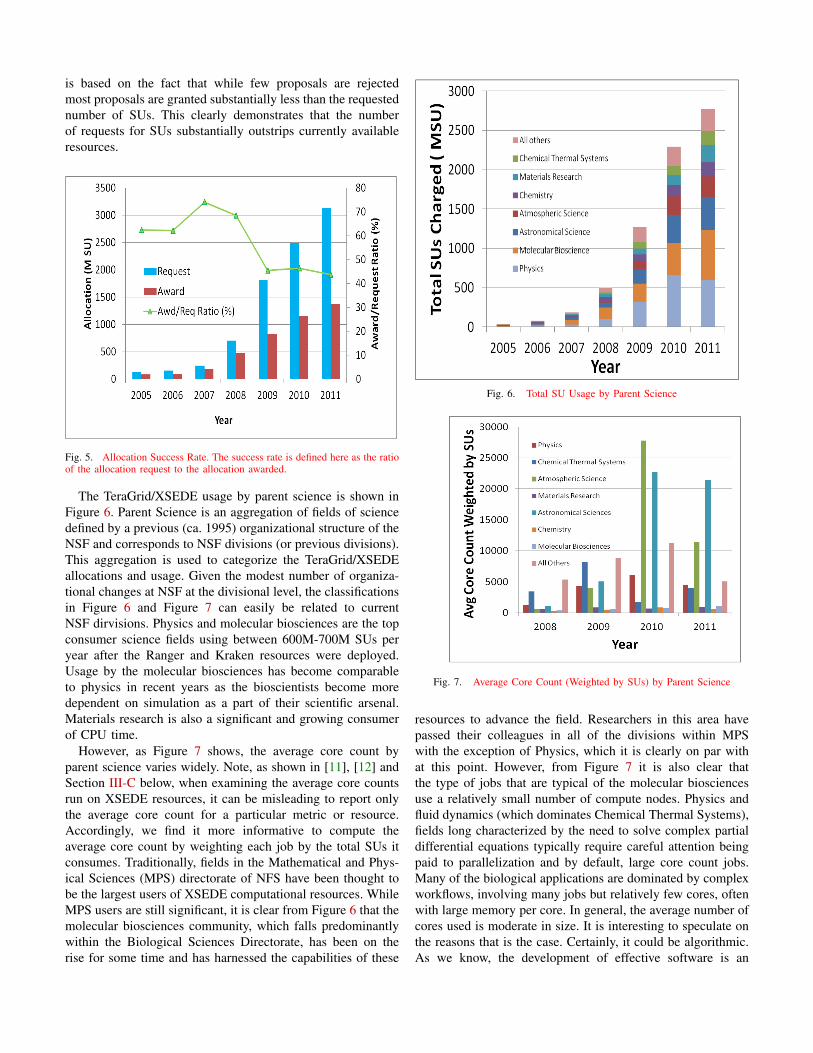
is based on the fact that while few proposals are rejectedmost proposals are granted substantially less than the requestednumber of SUs. This clearly demonstrates that the numberof requests for SUs substantially outstrips currently availableresources.
Fig. 5. Allocation Success Rate. The success rate is defined here as the ratioof the allocation request to the allocation awarded.
The TeraGrid/XSEDE usage by parent science is shown inFigure 6. Parent Science is an aggregation of fields of sciencedefined by a previous (ca. 1995) organizational structure of theNSF and corresponds to NSF divisions (or previous divisions).This aggregation is used to categorize the TeraGrid/XSEDEallocations and usage. Given the modest number of organiza-tional changes at NSF at the divisional level, the classificationsin Figure 6 and Figure 7 can easily be related to currentNSF dirvisions. Physics and molecular biosciences are the topconsumer science fields using between 600M-700M SUs peryear after the Ranger and Kraken resources were deployed.Usage by the molecular biosciences has become comparableto physics in recent years as the bioscientists become moredependent on simulation as a part of their scientific arsenal.Materials research is also a significant and growing consumerof CPU time.
However, as Figure 7 shows, the average core count byparent science varies widely. Note, as shown in [11], [12] andSection III-C below, when examining the average core countsrun on XSEDE resources, it can be misleading to report onlythe average core count for a particular metric or resource.Accordingly, we find it more informative to compute theaverage core count by weighting each job by the total SUs itconsumes. Traditionally, fields in the Mathematical and Phys-ical Sciences (MPS) directorate of NFS have been thought tobe the largest users of XSEDE computational resources. WhileMPS users are still significant, it is clear from Figure 6 that themolecular biosciences community, which falls predominantlywithin the Biological Sciences Directorate, has been on therise for some time and has harnessed the capabilities of these
Fig. 6. Total SU Usage by Parent Science
Fig. 7. Average Core Count (Weighted by SUs) by Parent Science
resources to advance the field. Researchers in this area havepassed their colleagues in all of the divisions within MPSwith the exception of Physics, which it is clearly on par withat this point. However, from Figure 7 it is also clear thatthe type of jobs that are typical of the molecular biosciencesuse a relatively small number of compute nodes. Physics andfluid dynamics (which dominates Chemical Thermal Systems),fields long characterized by the need to solve complex partialdifferential equations typically require careful attention beingpaid to parallelization and by default, large core count jobs.Many of the biological applications are dominated by complexworkflows, involving many jobs but relatively few cores, oftenwith large memory per core. In general, the average number ofcores used is moderate in size. It is interesting to speculate onthe reasons that is the case. Certainly, it could be algorithmic.As we know, the development of effective software is an

extremely time consuming and human intensive problem.Also, there are practical issues of turnaround. Many usershave learned to structure their jobs for optimal turnaround andthat often can be in conflict with optimal core count use. Inaddition, the use of average core count as a measure of theneed for machines with many processors, can be misleading.The job mix submitted by most users ranges over core count.Often it is necessary to run a significant number of smallercore count jobs as a preliminary to the single large core countrun. These all contribute to lowering the average core countnumber.
Fig. 8. Kraken Usage:Total SUs and Average Core Count Weighted by SUs
Fig. 9. Ranger Usage:Total SUs and Average Core Count Weighted by SUs
In this section, three of the XSEDE resources, namelyKraken, Ranger, and Steele, have been chosen as illustrativeof what appears in the current NSF portfolio and importantly,what each brings to the mix that is unique and valuable tospecific users. This is not an accident. It has been characteristicof the NSF program to try to provide a mix of computesystems each designed to be optimal for specific types ofjob flows. Figures 8 to 10 show total usage and average corecount (weighted by SUs) on each of these three resources. Anumber of scientific disciplines are positioned to use systemscontaining very large numbers of cores and requiring fast
Fig. 10. Steele Usage:Total SUs and Average Core Count Weighted by SUs
communications. For such users, systems such as Kraken andto a lesser extent Ranger are ideal, and this is reflected in theaverage core count. In the future, Stampede and Blue Waterswill likely be the systems of choice for such users. Lonestar, avery recent addition to the portfolio (not shown since the datais limited), is a smaller resource in terms of core count but withits more modern CPU (Westmere) has become the most highlyrequested resource in XSEDE, perhaps as much as 10 timesover-requested. Clearly, users not needing many thousands ofcores can make very effective use of Lonestar (average SUweighted core usage around 750 for NSF users), and since itsperformance is between 2 to 4 times faster than Kraken percore, it is preferred for those types of jobs. The PSC system,Blacklight, (also not shown) is a small core-count, very largeshared memory SGI system and also a very recent additionto the NSF portfolio. It is ideal for users needing randomaccess to very large data sets and to problems involving themanipulation of large, dense matrices which must be storedin central memory. So, problems in graph theory, large datasorts, quantum chemistry, etc., need such a resource to performoptimally. While the resources are dominated by disciplinesthat can make effective use of what was once called ”big iron”there are also many users that fall outside that category. Thishas always been part of the mantra of the TeraGrid/XSEDEprogram (deep and wide) and strong efforts continue in thesedirections today with the science gateways, campus championsand advanced user support programs.
An interesting observation looking at Figures 8 to 10, is thefact that early on in the life of a resource, the average corecount is larger than in the later life period. In the initial phase,the resource tends to have fewer users, and by design thoseusers are chosen to push the capability limits of the resource.As the machine ages and particularly as newer resources aredeployed, the profile of the user base evolves: the capabilityusers are moved to the newer resources and the broaderuser community has prepared itself to run on the machine.Thus, again by design, the average core count decreases toaccommodate the larger user base. The leveling off of SUcount in most resources is typical.
B. Facilitating System Operation and Maintenance
Most modern multipurpose HPC centers mainly rely uponsystem related diagnostics, such as network bandwidth uti-lized, processing loads, number of jobs run, and local usagestatistics in order to characterize their workloads and auditinfrastructure performance. However, this is quite differentfrom having the means to determine how well the computinginfrastructure is operating with respect to the actual scientificand engineering applications for which these HPC platformsare designed and operated. Some of this is discernible byrunning benchmarks; however in practice benchmarks are sointrusive that they are not run very often (see, for example,Reference [13] in which the application performance suite isrun on a quarterly basis), and in many cases only when theHPC platform is initially deployed. In addition benchmarksare typically run by a systems administrator on an idlesystem under preferred conditions and not a user in a normalproduction operation scenario and therefore do not necessarilyreflect the performance that a user would experience.
Modern HPC infrastructure is a complex combination ofhardware and software environments that is continuouslyevolving, so it is difficult at any one time to know if optimalperformance of the infrastructure is being realized. Indeed,as the examples below illustrate, it is more likely than notthat optimal performance across all applications is not beingrealized. Accordingly, the key to a successful and robust sci-ence and engineering-based HPC technology audit capabilitylies in the development of a diverse set of computationallylightweight application kernels that will run continuously onHPC resources to monitor and measure system performance,including critical components such as the global filesystemperformance, local processor and memory performance, andnetwork latency and bandwidth. The application kernels aredesigned to address this deficiency, and to do so from theperspective of the end-user applications.
We use the term ”Kernel” in this case to represent micro-and standard benchmarks that represent key performance fea-tures of modern scientific and engineering applications, aswell as small but representative calculations done with pop-ular open-source high-performance scientific and engineeringsoftware packages. Details can be found in Reference [7]. Wehave distilled lightweight benchmarking kernels from widelyused open source scientific applications that are designed torun quickly with an initially targeted wall-clock time of lessthan 10 minutes. However we also anticipate a need for moredemanding kernels in order to stress larger computing systemssubject to the needs of HPC resource providers to conductmore extensive testing. While a single application kernelwill not simultaneously test all of these aspects of machineperformance, the full suite of kernels will stress all of theimportant performance-limiting subsystems and components.
Crucial to the success of the application kernel testingstrategy, is the inclusion of historical test data within theXDMoD system. With this capability, site administrators caneasily monitor the results of application kernel runs for trou-
bleshooting performance issues at their site. Indeed, as thecases below illustrate, early implementation of applicationkernels have already proven invaluable in identifying under-performing and sporadically failing infrastructure that wouldhave likely gone unnoticed, resulting in wasted CPU cycles onmachines that are already oversubscribed as well as frustratedend users.
While the majority of the cases presented here are theresult of the application kernels run on the large productioncluster at the Center for Computational Research (CCR) at theUniversity at Buffalo, SUNY, the suite of application kernelsis currently running on some XSEDE resources and will soonbe running on all XSEDE resources as part of the TechnologyAudit Service of XSEDE.
2011
-06-28
2011
-07-05
2011
-07-12
2011
-07-19
2011
-07-26
2011
-08-02
0
200
400
600
800
Wal
l Tim
e [s
econ
ds]
8 cores (1 node)16 cores (2 nodes)32 cores (4 nodes)64 cores (8 nodes)
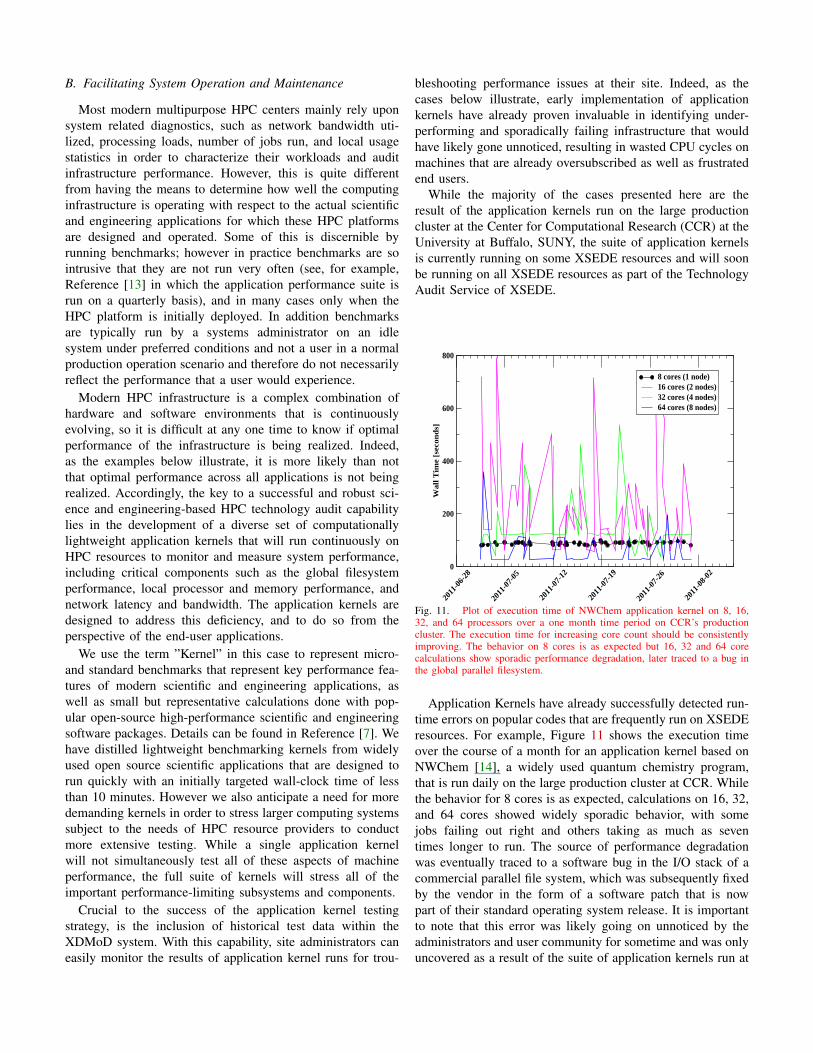
Fig. 11. Plot of execution time of NWChem application kernel on 8, 16,32, and 64 processors over a one month time period on CCR’s productioncluster. The execution time for increasing core count should be consistentlyimproving. The behavior on 8 cores is as expected but 16, 32 and 64 corecalculations show sporadic performance degradation, later traced to a bug inthe global parallel filesystem.
Application Kernels have already successfully detected run-time errors on popular codes that are frequently run on XSEDEresources. For example, Figure 11 shows the execution timeover the course of a month for an application kernel based onNWChem [14], a widely used quantum chemistry program,that is run daily on the large production cluster at CCR. Whilethe behavior for 8 cores is as expected, calculations on 16, 32,and 64 cores showed widely sporadic behavior, with somejobs failing out right and others taking as much as seventimes longer to run. The source of performance degradationwas eventually traced to a software bug in the I/O stack of acommercial parallel file system, which was subsequently fixedby the vendor in the form of a software patch that is nowpart of their standard operating system release. It is importantto note that this error was likely going on unnoticed by theadministrators and user community for sometime and was onlyuncovered as a result of the suite of application kernels run at
CCR.
2011
-06-14
2011
-06-21
2011
-06-28
2011
-07-05
2011
-07-12
2011
-07-19
2011
-07-26
200
300
400
500
600
700
3D C
olle
ctiv
e W
rite
Thr
ough
put [
MB
yte/
s]
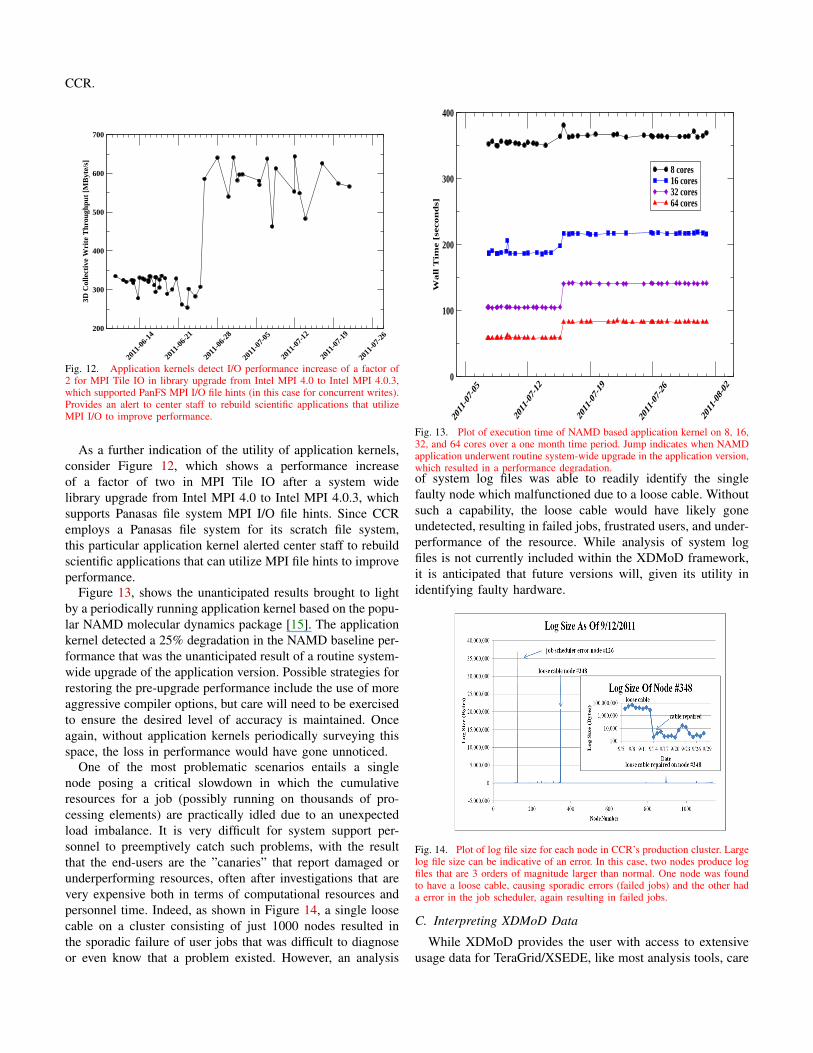
Fig. 12. Application kernels detect I/O performance increase of a factor of2 for MPI Tile IO in library upgrade from Intel MPI 4.0 to Intel MPI 4.0.3,which supported PanFS MPI I/O file hints (in this case for concurrent writes).Provides an alert to center staff to rebuild scientific applications that utilizeMPI I/O to improve performance.
As a further indication of the utility of application kernels,consider Figure 12, which shows a performance increaseof a factor of two in MPI Tile IO after a system widelibrary upgrade from Intel MPI 4.0 to Intel MPI 4.0.3, whichsupports Panasas file system MPI I/O file hints. Since CCRemploys a Panasas file system for its scratch file system,this particular application kernel alerted center staff to rebuildscientific applications that can utilize MPI file hints to improveperformance.
Figure 13, shows the unanticipated results brought to lightby a periodically running application kernel based on the popu-lar NAMD molecular dynamics package [15]. The applicationkernel detected a 25% degradation in the NAMD baseline per-formance that was the unanticipated result of a routine system-wide upgrade of the application version. Possible strategies forrestoring the pre-upgrade performance include the use of moreaggressive compiler options, but care will need to be exercisedto ensure the desired level of accuracy is maintained. Onceagain, without application kernels periodically surveying thisspace, the loss in performance would have gone unnoticed.
One of the most problematic scenarios entails a singlenode posing a critical slowdown in which the cumulativeresources for a job (possibly running on thousands of pro-cessing elements) are practically idled due to an unexpectedload imbalance. It is very difficult for system support per-sonnel to preemptively catch such problems, with the resultthat the end-users are the ”canaries” that report damaged orunderperforming resources, often after investigations that arevery expensive both in terms of computational resources andpersonnel time. Indeed, as shown in Figure 14, a single loosecable on a cluster consisting of just 1000 nodes resulted inthe sporadic failure of user jobs that was difficult to diagnoseor even know that a problem existed. However, an analysis
2011
-07-05
2011
-07-12
2011
-07-19
2011
-07-26
2011
-08-02
0
100
200
300
400
Wall
Tim
e [s
econ
ds]
8 cores16 cores32 cores64 cores
Fig. 13. Plot of execution time of NAMD based application kernel on 8, 16,32, and 64 cores over a one month time period. Jump indicates when NAMDapplication underwent routine system-wide upgrade in the application version,which resulted in a performance degradation.of system log files was able to readily identify the singlefaulty node which malfunctioned due to a loose cable. Withoutsuch a capability, the loose cable would have likely goneundetected, resulting in failed jobs, frustrated users, and under-performance of the resource. While analysis of system logfiles is not currently included within the XDMoD framework,it is anticipated that future versions will, given its utility inidentifying faulty hardware.
Fig. 14. Plot of log file size for each node in CCR’s production cluster. Largelog file size can be indicative of an error. In this case, two nodes produce logfiles that are 3 orders of magnitude larger than normal. One node was foundto have a loose cable, causing sporadic errors (failed jobs) and the other hada error in the job scheduler, again resulting in failed jobs.
C. Interpreting XDMoD Data
While XDMoD provides the user with access to extensiveusage data for TeraGrid/XSEDE, like most analysis tools, care
must be exercised in the interpretation of the generated data.This will be especially true for XDMoD given its open nature,the ease at which plots can be created, and the subtleties in theusage data that can require a fairly detailed understanding ofthe operation of TeraGrid/XSEDE [11], [12]. This is perhapsbest understood through the following examples. Consider, forexample, the mean core count across Physics parent sciencejobs on XSEDE resources during the period 2006-2011, whichcan be misleading given the distribution of job sizes as shownin Figure 15. The distribution of jobs is highly skewed by the
12-4 5-8 9-6
4
65-25
6
257-5
12
513-1
024
1k-8k
8k-32
k>3
2k
Job Size
0
2×10⁵
4×10⁵
6×10⁵
8×10⁵
Nu
mb
er o
f Jo
bs
Fig. 15. Distribution of job sizes for all parent science Physics jobs inTeraGrid/XSEDE resources for the period 2006-2011.
presence of large numbers of serial (single-core) calculations,a situation exacerbated by recent ”high throughput” computingresources, as we will show.
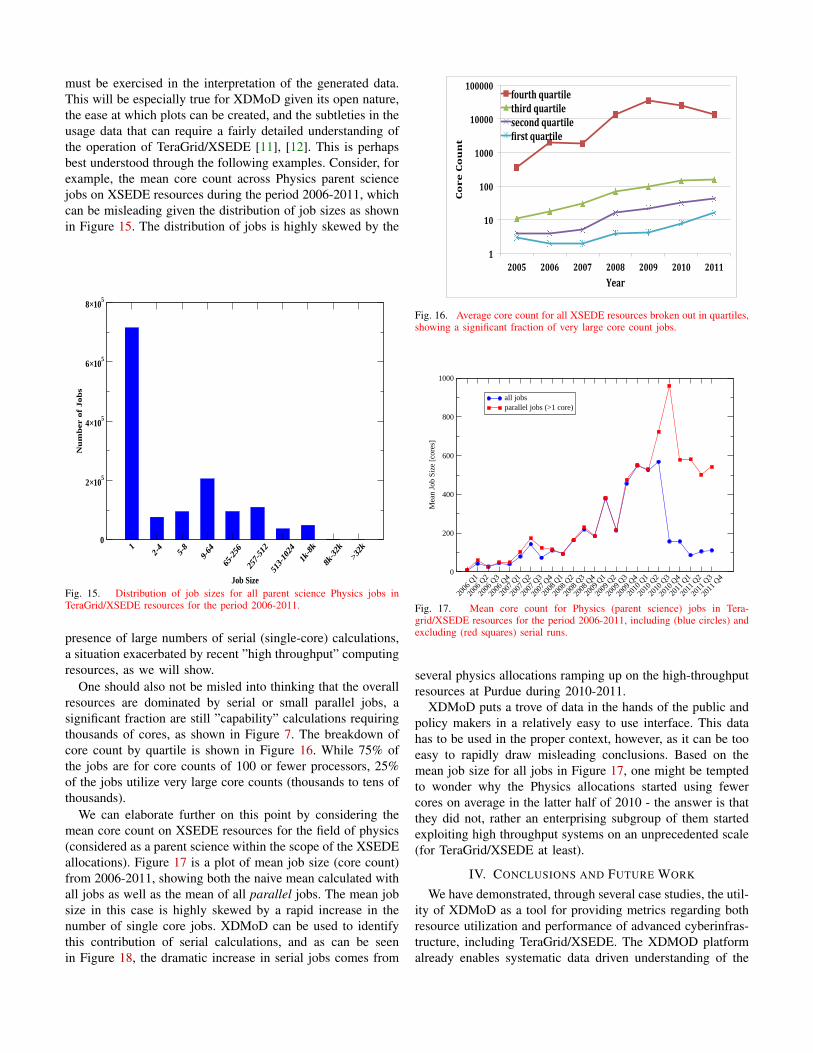
One should also not be misled into thinking that the overallresources are dominated by serial or small parallel jobs, asignificant fraction are still ”capability” calculations requiringthousands of cores, as shown in Figure 7. The breakdown ofcore count by quartile is shown in Figure 16. While 75% ofthe jobs are for core counts of 100 or fewer processors, 25%of the jobs utilize very large core counts (thousands to tens ofthousands).
We can elaborate further on this point by considering themean core count on XSEDE resources for the field of physics(considered as a parent science within the scope of the XSEDEallocations). Figure 17 is a plot of mean job size (core count)from 2006-2011, showing both the naive mean calculated withall jobs as well as the mean of all parallel jobs. The mean jobsize in this case is highly skewed by a rapid increase in thenumber of single core jobs. XDMoD can be used to identifythis contribution of serial calculations, and as can be seenin Figure 18, the dramatic increase in serial jobs comes from
1
10
100
1000
10000
100000
2005 2006 2007 2008 2009 2010 2011
Core Count
Year
fourth quartile third quartile second quartile ;irst quartile
Fig. 16. Average core count for all XSEDE resources broken out in quartiles,showing a significant fraction of very large core count jobs.
2006
Q1
2006
Q2
2006
Q3
2006
Q4
2007
Q1
2007
Q2
2007
Q3
2007
Q4
2008
Q1
2008
Q2
2008
Q3
2008
Q4
2009
Q1
2009
Q2
2009
Q3
2009
Q4
2010
Q1
2010
Q2
2010
Q3
2010
Q4
2011
Q1
2011
Q2
2011
Q3
2011
Q4
0
200
400
600
800
1000
Mea
n Jo
b Si
ze [c
ores
]
all jobsparallel jobs (>1 core)
Fig. 17. Mean core count for Physics (parent science) jobs in Tera-grid/XSEDE resources for the period 2006-2011, including (blue circles) andexcluding (red squares) serial runs.
several physics allocations ramping up on the high-throughputresources at Purdue during 2010-2011.
XDMoD puts a trove of data in the hands of the public andpolicy makers in a relatively easy to use interface. This datahas to be used in the proper context, however, as it can be tooeasy to rapidly draw misleading conclusions. Based on themean job size for all jobs in Figure 17, one might be temptedto wonder why the Physics allocations started using fewercores on average in the latter half of 2010 - the answer is thatthey did not, rather an enterprising subgroup of them startedexploiting high throughput systems on an unprecedented scale(for TeraGrid/XSEDE at least).
IV. CONCLUSIONS AND FUTURE WORK
We have demonstrated, through several case studies, the util-ity of XDMoD as a tool for providing metrics regarding bothresource utilization and performance of advanced cyberinfras-tructure, including TeraGrid/XSEDE. The XDMOD platformalready enables systematic data driven understanding of the
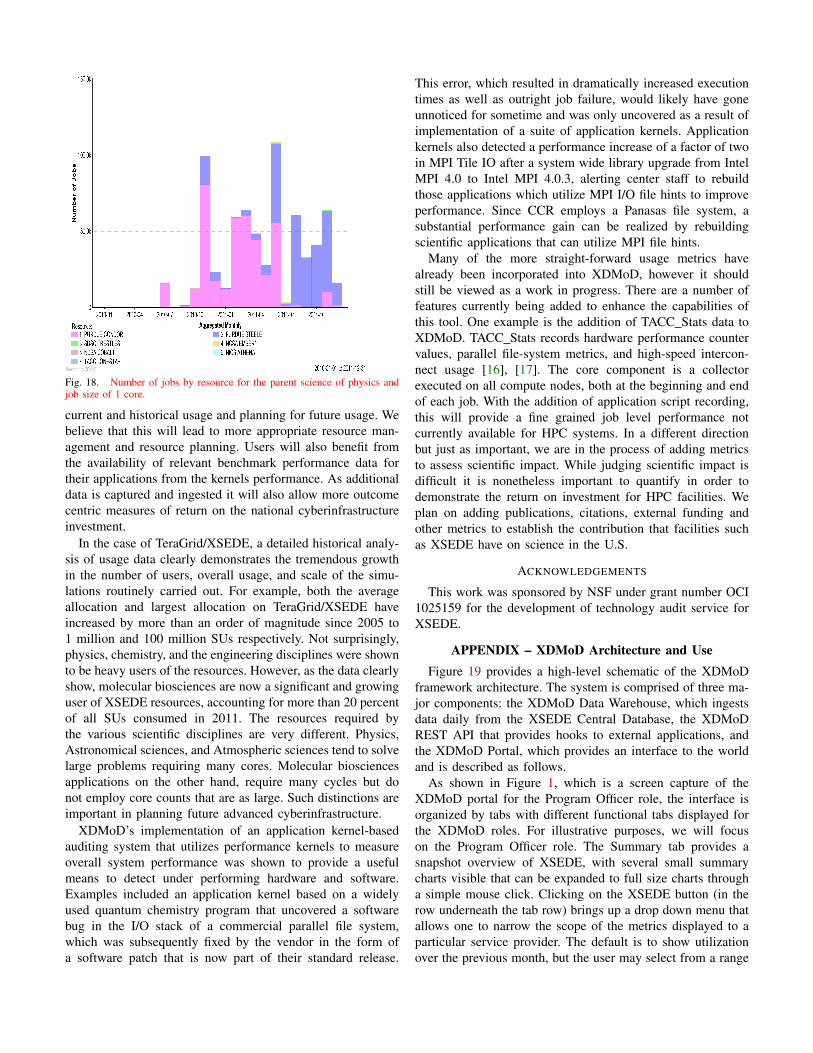
Fig. 18. Number of jobs by resource for the parent science of physics andjob size of 1 core.
current and historical usage and planning for future usage. Webelieve that this will lead to more appropriate resource man-agement and resource planning. Users will also benefit fromthe availability of relevant benchmark performance data fortheir applications from the kernels performance. As additionaldata is captured and ingested it will also allow more outcomecentric measures of return on the national cyberinfrastructureinvestment.
In the case of TeraGrid/XSEDE, a detailed historical analy-sis of usage data clearly demonstrates the tremendous growthin the number of users, overall usage, and scale of the simu-lations routinely carried out. For example, both the averageallocation and largest allocation on TeraGrid/XSEDE haveincreased by more than an order of magnitude since 2005 to1 million and 100 million SUs respectively. Not surprisingly,physics, chemistry, and the engineering disciplines were shownto be heavy users of the resources. However, as the data clearlyshow, molecular biosciences are now a significant and growinguser of XSEDE resources, accounting for more than 20 percentof all SUs consumed in 2011. The resources required bythe various scientific disciplines are very different. Physics,Astronomical sciences, and Atmospheric sciences tend to solvelarge problems requiring many cores. Molecular biosciencesapplications on the other hand, require many cycles but donot employ core counts that are as large. Such distinctions areimportant in planning future advanced cyberinfrastructure.
XDMoD’s implementation of an application kernel-basedauditing system that utilizes performance kernels to measureoverall system performance was shown to provide a usefulmeans to detect under performing hardware and software.Examples included an application kernel based on a widelyused quantum chemistry program that uncovered a softwarebug in the I/O stack of a commercial parallel file system,which was subsequently fixed by the vendor in the form ofa software patch that is now part of their standard release.
This error, which resulted in dramatically increased executiontimes as well as outright job failure, would likely have goneunnoticed for sometime and was only uncovered as a result ofimplementation of a suite of application kernels. Applicationkernels also detected a performance increase of a factor of twoin MPI Tile IO after a system wide library upgrade from IntelMPI 4.0 to Intel MPI 4.0.3, alerting center staff to rebuildthose applications which utilize MPI I/O file hints to improveperformance. Since CCR employs a Panasas file system, asubstantial performance gain can be realized by rebuildingscientific applications that can utilize MPI file hints.
Many of the more straight-forward usage metrics havealready been incorporated into XDMoD, however it shouldstill be viewed as a work in progress. There are a number offeatures currently being added to enhance the capabilities ofthis tool. One example is the addition of TACC Stats data toXDMoD. TACC Stats records hardware performance countervalues, parallel file-system metrics, and high-speed intercon-nect usage [16], [17]. The core component is a collectorexecuted on all compute nodes, both at the beginning and endof each job. With the addition of application script recording,this will provide a fine grained job level performance notcurrently available for HPC systems. In a different directionbut just as important, we are in the process of adding metricsto assess scientific impact. While judging scientific impact isdifficult it is nonetheless important to quantify in order todemonstrate the return on investment for HPC facilities. Weplan on adding publications, citations, external funding andother metrics to establish the contribution that facilities suchas XSEDE have on science in the U.S.
ACKNOWLEDGEMENTS
This work was sponsored by NSF under grant number OCI1025159 for the development of technology audit service forXSEDE.
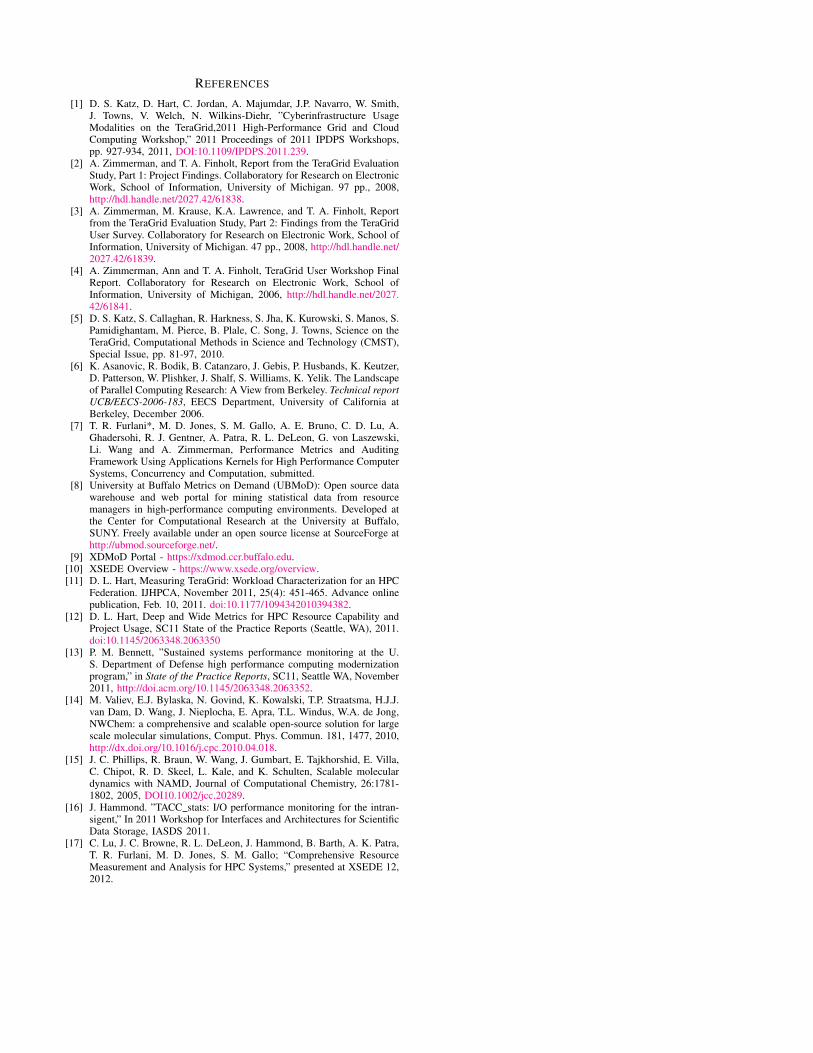
APPENDIX – XDMoD Architecture and UseFigure 19 provides a high-level schematic of the XDMoD
framework architecture. The system is comprised of three ma-jor components: the XDMoD Data Warehouse, which ingestsdata daily from the XSEDE Central Database, the XDMoDREST API that provides hooks to external applications, andthe XDMoD Portal, which provides an interface to the worldand is described as follows.
As shown in Figure 1, which is a screen capture of theXDMoD portal for the Program Officer role, the interface isorganized by tabs with different functional tabs displayed forthe XDMoD roles. For illustrative purposes, we will focuson the Program Officer role. The Summary tab provides asnapshot overview of XSEDE, with several small summarycharts visible that can be expanded to full size charts througha simple mouse click. Clicking on the XSEDE button (in therow underneath the tab row) brings up a drop down menu thatallows one to narrow the scope of the metrics displayed to aparticular service provider. The default is to show utilizationover the previous month, but the user may select from a range
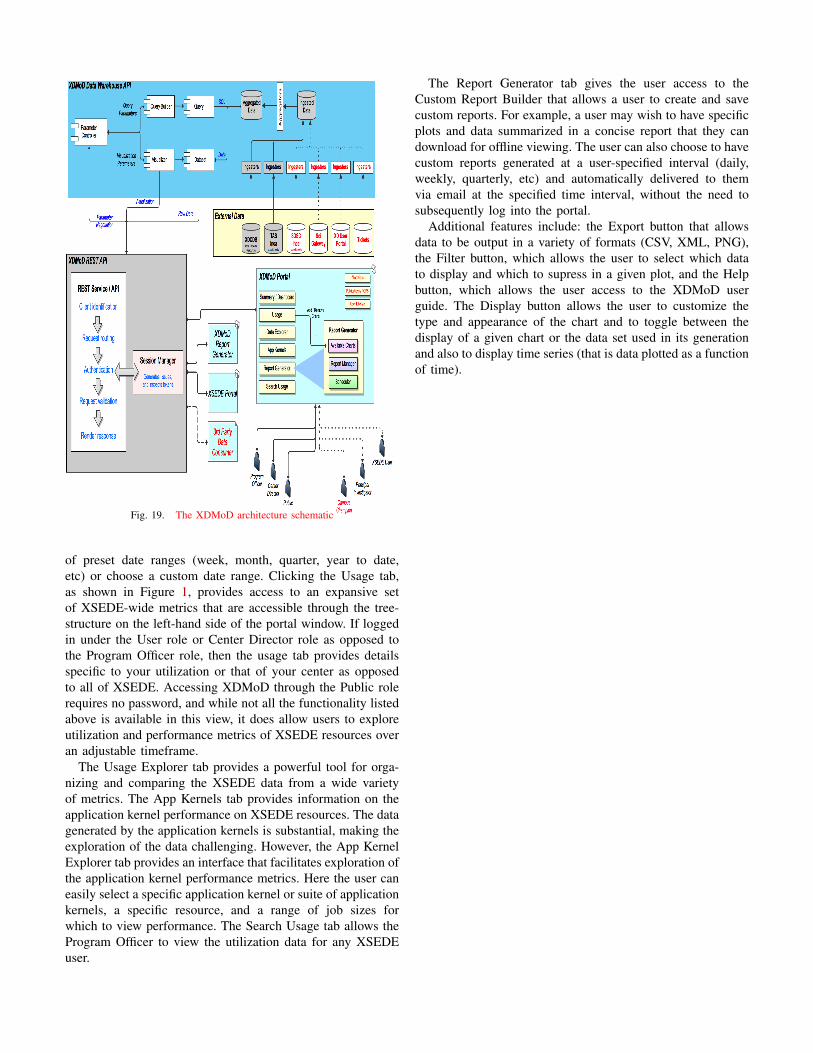
Fig. 19. The XDMoD architecture schematic
of preset date ranges (week, month, quarter, year to date,etc) or choose a custom date range. Clicking the Usage tab,as shown in Figure 1, provides access to an expansive setof XSEDE-wide metrics that are accessible through the tree-structure on the left-hand side of the portal window. If loggedin under the User role or Center Director role as opposed tothe Program Officer role, then the usage tab provides detailsspecific to your utilization or that of your center as opposedto all of XSEDE. Accessing XDMoD through the Public rolerequires no password, and while not all the functionality listedabove is available in this view, it does allow users to exploreutilization and performance metrics of XSEDE resources overan adjustable timeframe.
The Usage Explorer tab provides a powerful tool for orga-nizing and comparing the XSEDE data from a wide varietyof metrics. The App Kernels tab provides information on theapplication kernel performance on XSEDE resources. The datagenerated by the application kernels is substantial, making theexploration of the data challenging. However, the App KernelExplorer tab provides an interface that facilitates exploration ofthe application kernel performance metrics. Here the user caneasily select a specific application kernel or suite of applicationkernels, a specific resource, and a range of job sizes forwhich to view performance. The Search Usage tab allows theProgram Officer to view the utilization data for any XSEDEuser.
The Report Generator tab gives the user access to theCustom Report Builder that allows a user to create and savecustom reports. For example, a user may wish to have specificplots and data summarized in a concise report that they candownload for offline viewing. The user can also choose to havecustom reports generated at a user-specified interval (daily,weekly, quarterly, etc) and automatically delivered to themvia email at the specified time interval, without the need tosubsequently log into the portal.
Additional features include: the Export button that allowsdata to be output in a variety of formats (CSV, XML, PNG),the Filter button, which allows the user to select which datato display and which to supress in a given plot, and the Helpbutton, which allows the user access to the XDMoD userguide. The Display button allows the user to customize thetype and appearance of the chart and to toggle between thedisplay of a given chart or the data set used in its generationand also to display time series (that is data plotted as a functionof time).
REFERENCES
[1] D. S. Katz, D. Hart, C. Jordan, A. Majumdar, J.P. Navarro, W. Smith,J. Towns, V. Welch, N. Wilkins-Diehr, ”Cyberinfrastructure UsageModalities on the TeraGrid,2011 High-Performance Grid and CloudComputing Workshop,” 2011 Proceedings of 2011 IPDPS Workshops,pp. 927-934, 2011, DOI:10.1109/IPDPS.2011.239.
[2] A. Zimmerman, and T. A. Finholt, Report from the TeraGrid EvaluationStudy, Part 1: Project Findings. Collaboratory for Research on ElectronicWork, School of Information, University of Michigan. 97 pp., 2008,http://hdl.handle.net/2027.42/61838.
[3] A. Zimmerman, M. Krause, K.A. Lawrence, and T. A. Finholt, Reportfrom the TeraGrid Evaluation Study, Part 2: Findings from the TeraGridUser Survey. Collaboratory for Research on Electronic Work, School ofInformation, University of Michigan. 47 pp., 2008, http://hdl.handle.net/2027.42/61839.
[4] A. Zimmerman, Ann and T. A. Finholt, TeraGrid User Workshop FinalReport. Collaboratory for Research on Electronic Work, School ofInformation, University of Michigan, 2006, http://hdl.handle.net/2027.42/61841.
[5] D. S. Katz, S. Callaghan, R. Harkness, S. Jha, K. Kurowski, S. Manos, S.Pamidighantam, M. Pierce, B. Plale, C. Song, J. Towns, Science on theTeraGrid, Computational Methods in Science and Technology (CMST),Special Issue, pp. 81-97, 2010.
[6] K. Asanovic, R. Bodik, B. Catanzaro, J. Gebis, P. Husbands, K. Keutzer,D. Patterson, W. Plishker, J. Shalf, S. Williams, K. Yelik. The Landscapeof Parallel Computing Research: A View from Berkeley. Technical reportUCB/EECS-2006-183, EECS Department, University of California atBerkeley, December 2006.
[7] T. R. Furlani*, M. D. Jones, S. M. Gallo, A. E. Bruno, C. D. Lu, A.Ghadersohi, R. J. Gentner, A. Patra, R. L. DeLeon, G. von Laszewski,Li. Wang and A. Zimmerman, Performance Metrics and AuditingFramework Using Applications Kernels for High Performance ComputerSystems, Concurrency and Computation, submitted.
[8] University at Buffalo Metrics on Demand (UBMoD): Open source datawarehouse and web portal for mining statistical data from resourcemanagers in high-performance computing environments. Developed atthe Center for Computational Research at the University at Buffalo,SUNY. Freely available under an open source license at SourceForge athttp://ubmod.sourceforge.net/.
[9] XDMoD Portal - https://xdmod.ccr.buffalo.edu.[10] XSEDE Overview - https://www.xsede.org/overview.[11] D. L. Hart, Measuring TeraGrid: Workload Characterization for an HPC
Federation. IJHPCA, November 2011, 25(4): 451-465. Advance onlinepublication, Feb. 10, 2011. doi:10.1177/1094342010394382.
[12] D. L. Hart, Deep and Wide Metrics for HPC Resource Capability andProject Usage, SC11 State of the Practice Reports (Seattle, WA), 2011.doi:10.1145/2063348.2063350
[13] P. M. Bennett, ”Sustained systems performance monitoring at the U.S. Department of Defense high performance computing modernizationprogram,” in State of the Practice Reports, SC11, Seattle WA, November2011, http://doi.acm.org/10.1145/2063348.2063352.
[14] M. Valiev, E.J. Bylaska, N. Govind, K. Kowalski, T.P. Straatsma, H.J.J.van Dam, D. Wang, J. Nieplocha, E. Apra, T.L. Windus, W.A. de Jong,NWChem: a comprehensive and scalable open-source solution for largescale molecular simulations, Comput. Phys. Commun. 181, 1477, 2010,http://dx.doi.org/10.1016/j.cpc.2010.04.018.
[15] J. C. Phillips, R. Braun, W. Wang, J. Gumbart, E. Tajkhorshid, E. Villa,C. Chipot, R. D. Skeel, L. Kale, and K. Schulten, Scalable moleculardynamics with NAMD, Journal of Computational Chemistry, 26:1781-1802, 2005, DOI10.1002/jcc.20289.
[16] J. Hammond. ”TACC stats: I/O performance monitoring for the intran-sigent,” In 2011 Workshop for Interfaces and Architectures for ScientificData Storage, IASDS 2011.
[17] C. Lu, J. C. Browne, R. L. DeLeon, J. Hammond, B. Barth, A. K. Patra,T. R. Furlani, M. D. Jones, S. M. Gallo; “Comprehensive ResourceMeasurement and Analysis for HPC Systems,” presented at XSEDE 12,2012.
Copyright © 2022 FDOKUMEN

