


Bahasa
Halaman
Hukum

arX
iv:0
912.
0559
v1 [
cond
-mat
.sup
r-co
n] 3
Dec
200
9
Correlation between linear resistivity and Tcin the Bechgaard salts and the pnictide
superconductor Ba(Fe1−xCo
x)2As2
Nicolas Doiron-Leyraud,1, ∗ Pascale Auban-Senzier,2 Samuel Rene de Cotret,1
Claude Bourbonnais,1, 3 Denis Jerome,2, 3 Klaus Bechgaard,4 and Louis Taillefer1, 3, †
1Departement de physique and RQMP, Universite de Sherbrooke, Sherbrooke, Quebec, J1K 2R1 Canada2Laboratoire de Physique des Solides, UMR 8502 CNRS Universite Paris-Sud, 91405 Orsay, France
3Canadian Institute for Advanced Research, Toronto, Canada4Department of Chemistry, H.C. Ørsted Institute, Copenhagen, Denmark
(Dated: December 3, 2009)
The quasi-1D organic Bechgaard salt (TMTSF)2PF6 displays spin-density-wave (SDW) order andsuperconductivity in close proximity in the temperature-pressure phase diagram. We have measuredits normal-state electrical resistivity ρa(T ) as a function of temperature and pressure, in the T → 0limit. At the critical pressure where SDW order disappears, ρa(T ) ∝ T down to the lowest measuredtemperature (0.1 K). With increasing pressure, ρa(T ) acquires a curvature that is well describedby ρa(T ) = ρ0 + AT + BT 2, where the strength of the linear term, measured by the A coefficient,is found to scale with the superconducting transition temperature Tc. This correlation between A
and Tc strongly suggests that scattering and pairing in (TMTSF)2PF6 have a common origin, mostlikely rooted in the antiferromagnetic spin fluctuations associated with SDW order. Analysis ofpublished resistivity data on the iron-pnictide superconductor Ba(Fe1−xCox)2As2 reveals a detailedsimilarity with (TMTSF)2PF6, suggesting that antiferromagnetic fluctuations play a similar role inthe pnictides.
PACS numbers: 74.25.Fy, 74.70.Kn, 74.25.Dw
A number of strongly correlated metals share a com-mon property: their electrical resistivity grows linearlywith temperature T from T = 0, in stark contrast withthe standard Fermi liquid description of metals. Noto-rious examples of materials showing this linear resistiv-ity are the high-Tc cuprate superconductors1,2,3,4, suchas hole-doped La1.6−xNd0.4−xSrxCuO4 (Nd-LSCO)5 andelectron-doped Pr2−xCexCuO4
6, near their “stripe”7 andantiferromagnetic quantum critical point, respectively,and a number of quantum-critical heavy-fermion met-als8, such as CeCu6−xAux
8, CeCoIn59, and YbRh2Si2
10.But the origin of this phenomenon remains a subject ofdebate because it has not yet been observed in a mate-rial whose ground state is well understood, without thecomplication of a pseudogap phase, a nearby Mott insu-lator, or f -electron moments and the associated Kondoeffect. On the other hand, theoretical efforts are facedwith a major puzzle: while the scattering rate at antifer-romagnetic hot spots is linear in temperature, it is notclear how it will affect the electrical resistivity since onthe remaining segments of the Fermi surface it has theusual quadratic temperature dependence11. Thus, whilebeautifully simple in appearance, the linear resistivity ofcuprates and heavy-fermion metals remains a major openquestion in the physics of correlated electrons.
We have examined this issue by studyingthe archetypal quasi-1D organic Bechgaard salt(TMTSF)2PF6
12,13,14, whose phase diagram is shown inFig. 1. The conducting chains of organic molecules give(TMTSF)2PF6 a strong quasi-1D character, reflected inits Fermi surface, made up of two slightly warped parallelsheets that nest well. As a result, (TMTSF)2PF6 ordersin a spin-density-wave (SDW) state below a temperature
TSDW ≈ 12 K, which gets suppressed with pressure asnext-nearest chain hopping is enhanced. As TSDW falls,superconductivity rises and peaks with Tc ≈ 1.2 Kat the point where TSDW → 015,16, forming a domethat extends to above 20 kbar. The phase diagramof (TMTSF)2PF6, with its adjacent semi-metallicSDW and superconducting phases, therefore closelyresembles that of the iron-pnictide superconductorBa(Fe1−xCox)2As2 (see Fig. 1) and, to some extent,that of certain heavy-fermion metals8,17 and cuprates5,7.But a significant advantage of the Bechgaard salts istheir relative simplicity. They are free from Kondoand Mott physics and, owing to their single quasi-1DFermi surface, weak-coupling theory provides a gooddescription of their electronic properties, in particular,the superconducting phase on the border of SDWorder14,18.
Here we report measurements of the a-axis electricalresistivity in (TMTSF)2PF6, i.e., along the chains of or-ganic molecules, at low temperature as a function of pres-sure. Single crystals of (TMTSF)2PF6 were grown bythe usual method of electrocrystallization19. The sam-ples used have typical values of a-axis conductivity near500 (Ω cm)−1 at room temperature and pressure. Typi-cal sample dimensions are 1.5 x 0.2 x 0.05 mm3 with thelength, width and thickness along the a, b, and c crys-tallographic axes, respectively. The current was appliedalong the a-axis and the magnetic field along the c-axis.Electrical contacts were made with evaporated gold pads(typical resistance between 1 and 10 Ω) to which 17 µmgold wires were glued with silver paint. The electricalresistivity was measured with a resistance bridge usinga standard four-terminal AC technique. Low excitation
2
0.0 0.1 0.20
50
100
150
Tem
pera
ture
[ K
]
SC
SDW
TSDW
Tc
X
Ba(Fe1-xCox)2As2
xc
+ T2T T2
0 10 20 300
4
8
+ T2T T2
TSDW
Tc
Tem
pera
ture
[ K
]
Pressure [ kbar ]
(TMTSF)2PF6
SC
SDW
Pc
FIG. 1: Top: Temperature-pressure phase diagram of(TMTSF)2PF6, showing a spin-density-wave (SDW) phasebelow TSDW (grey dots) and superconductivity (SC) belowTc (black dots) (from15,16 and this work). The latter phaseends at the critical pressure Pc. Bottom: Temperature-doping phase diagram of the iron-pnictide superconductorBa(Fe1−xCox)2As2 reproduced from28, as a function of nomi-nal Co concentration x, showing a metallic SDW phase belowTSDW and superconductivity below a Tc which ends at thecritical doping xc. In both panels the vertical dashed lineseparates a regime where the resistivity ρ(T ) grows as T 2 (onthe right) from a regime where it grows as T + T 2 (on theleft) (see text).
currents of typically 30 µA were applied in order to elim-inate heating effects caused by the contact resistances.This was checked using different values of current aboveand below this value, at temperatures below 1 K. A non-magnetic piston-cylinder pressure cell was employed20,with Daphne oil 7373 as pressure transmitting medium.The pressure at room temperature and 4.2 K was mea-sured using the change in resistance and superconductingTc of a Sn sample, respectively. Only the values recordedat 4.2 K are quoted here.
In Fig. 2 we show the zero-field electrical resistivityof (TMTSF)2PF6 for a range of pressures that nearlyspan the entire superconducting phase, from 8.4 up to20.8 kbar. At P = 8.4 kbar, upon cooling the resis-tivity first rises suddenly when TSDW is crossed and(TMTSF)2PF6 enters the SDW state, and then dropssharply at the superconducting Tc. Increasing the pres-
10 15 200
2
4
0.0 0.5 1.00.0
0.2
0.4
0 5 10 150
4
8
12
T [ K ]
a [ c
m ]
(TMTSF)2PF6
T = 1 K
8.4 kbar
11.8 kbar13.8 kbar16.3 kbar16.9 kbar19.0 kbar20.8 kbar
0 [
cm
]
P [ kbar ]
a [
cm
]
Tc [ K ]
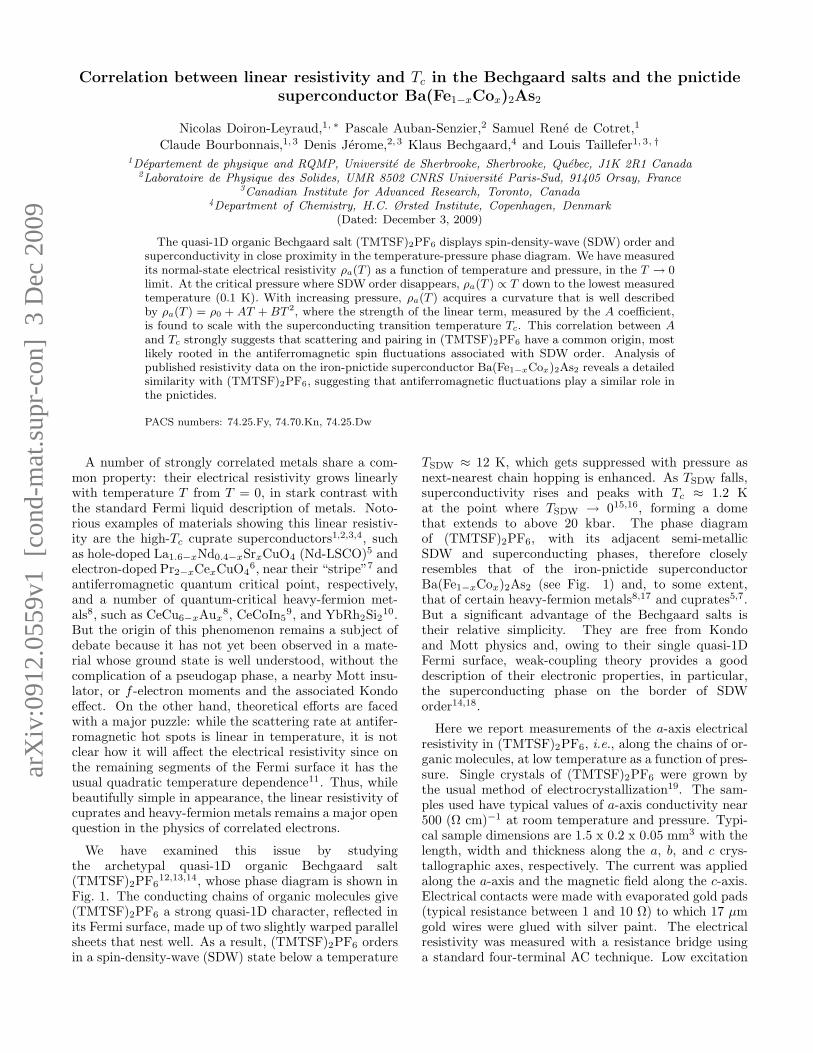
FIG. 2: (Color online) Top: a-axis electrical resistivity ρa(T )of (TMTSF)2PF6 as a function of temperature at variouspressures as indicated. Bottom left: residual resistivity ρ0
as a function of pressure. ρ0 is the measured value of thenormal state resistivity as T → 0, revealed by the applicationof a small magnetic field (see text and Fig. 3 and 4). Bottomright: inelastic part ∆ρa = ρa − ρ0 of the resistivity at 1 K.The dashed line is a linear fit to all the data points exceptthat at Tc = 0.87 K
sure further completely suppresses the SDW phase, andbrings a smooth and monotonic reduction of Tc and ofthe resistivity. Samples of organic matter are suscepti-ble to forming cracks caused by thermal cycling or pres-surization, which renders them useless for absolute mea-surements. We have measured a number of samples andhere we report data for a specimen which showed no signof cracks, therefore corresponding to the intrinsic evolu-tion with pressure and temperature of the resistivity of(TMTSF)2PF6. For instance, the resistance of this speci-men showed no sudden change during pressurization andit returned to its initial value after each cooling cycle.The weak pressure dependence of the residual resistiv-ity ρ0, shown in Fig. 2, further confirms the absence ofsignificant cracks.
At P = 11.8 kbar, near the critical pressure whereTSDW → 0 and Tc is the highest15,16, the resistivity de-creases monotonically with decreasing temperature anddisplays a strict linear temperature dependence below anupper temperature T0 = 8 K, as seen in Fig. 3. The ap-
3
0 5 10 150
4
8
12
0 100 200 3000
100
200
300
(TMTSF)2PF6
a [
cm
]
H = 0 H = 0.05 T
P = 11.8 kbar
T0
T0
ab [
cm
]
T [ K ]
Ba(Fe1-xCox)2As2
x = 0.10
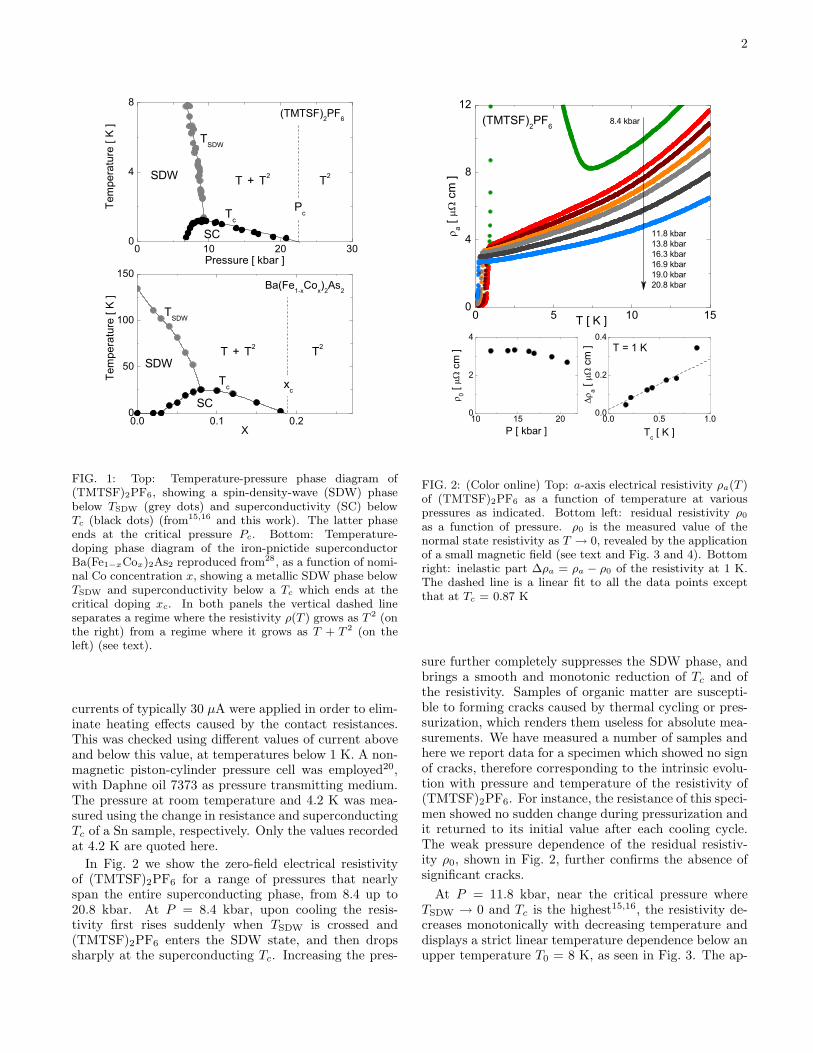
FIG. 3: (Color online) Top: a-axis electrical resistivity ρa(T )of (TMTSF)2PF6 at 11.8 kbar, in H = 0 and 0.05 T. Theblack line is a linear fit to the data up to T0 = 8 K. Bot-tom: in-plane (ab) electrical resistivity of Ba(Fe1−xCox)2As2at x = 0.10 (reproduced from28). The black line is a linear fitfrom Tc up to T0 = 125 K. The dashed line is a polynomialfit of the form ρ(T ) = ρ0 + AT + BT 2 from Tc up to 300 K.
plication of a small magnetic field of H = 0.05 T, whosesole effect, at all pressures, is to reveal the normal stateresistivity below Tc without any magnetoresistance, asseen in Fig. 3 and 4, shows that this pure linear resis-tivity extends to the lowest measured temperature, thuscovering nearly two decades in temperature, from ∼ 0.1up to 8.0 K. This finding is further emphasized in Fig. 4,where only the inelastic part of the normal state resistiv-ity is plotted on a log-log scale.
As the pressure is further increased, the low tempera-ture part of the resistivity below 4 K acquires a curvaturewhich, as seen in Fig. 4, approaches a T 2 dependence atthe highest measured pressure of 20.8 kbar, close to thepressure where the superconducting Tc vanishes. At in-termediate pressures, it is a sum of linear and T 2 termsthat seems to best describe the low temperature data, asshown in the bottom panel of Fig. 4 where the resistivityat 16.3 kbar is well fitted by a polynomial function of theform ρ(T ) = ρ0 + AT + BT 2, from 0.1 K up to 4 K. Wenote that early data on (TMTSF)2PF6 at one pressurepoint21 also display a non-Fermi-liquid temperature de-pendence of this kind, although it was not recognized assuch at the time. Using this approximate description, wetrack the evolution of the linear resistivity with pressure,from the critical point for SDW order to that for super-conductivity, which reveals our central finding, shown inFig. 5: the coefficient A of linear resistivity scales with Tc
0 1 2 3 4
3
4
1 10
0.1
1
10
16.3 kbar11.8 kbar
20.8 kbar
P = 16.3 kbar
(TMTSF)2PF6
T2
a [ c
m ]
T
8.4 kbar
H = 0 H = 0.03 T
a [
cm
]
T [ K ]
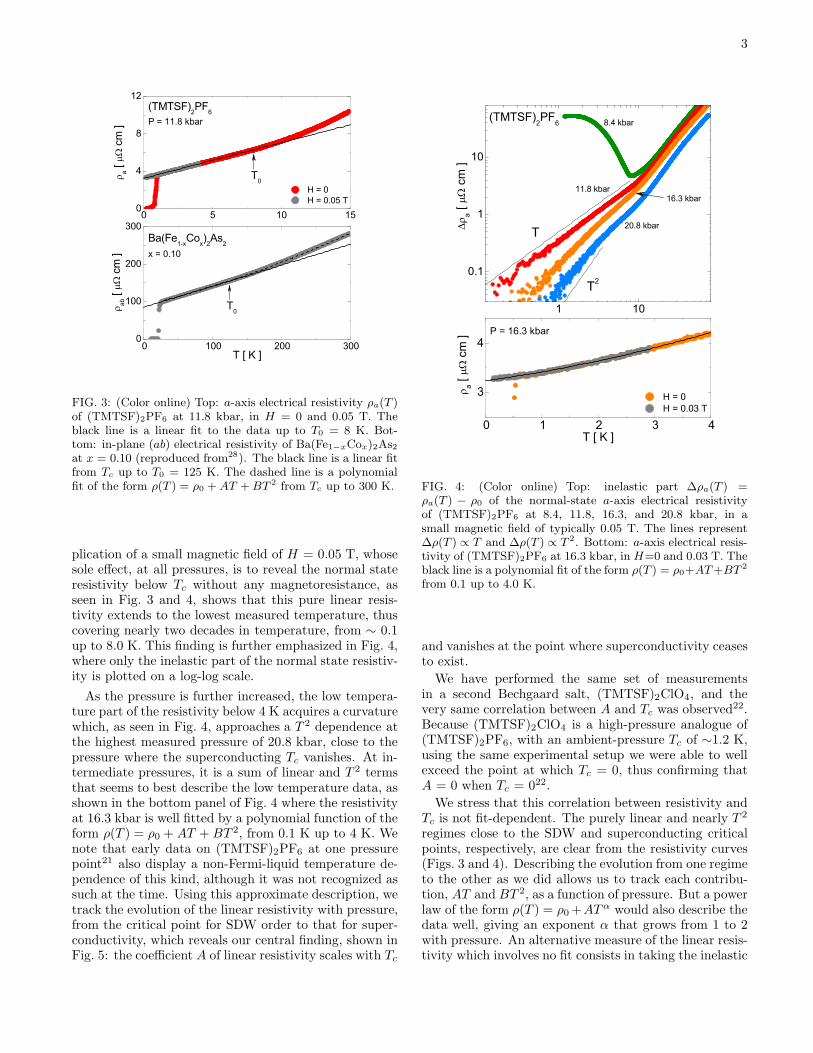
FIG. 4: (Color online) Top: inelastic part ∆ρa(T ) =ρa(T ) − ρ0 of the normal-state a-axis electrical resistivityof (TMTSF)2PF6 at 8.4, 11.8, 16.3, and 20.8 kbar, in asmall magnetic field of typically 0.05 T. The lines represent∆ρ(T ) ∝ T and ∆ρ(T ) ∝ T 2. Bottom: a-axis electrical resis-tivity of (TMTSF)2PF6 at 16.3 kbar, in H=0 and 0.03 T. Theblack line is a polynomial fit of the form ρ(T ) = ρ0+AT +BT 2
from 0.1 up to 4.0 K.
and vanishes at the point where superconductivity ceasesto exist.
We have performed the same set of measurementsin a second Bechgaard salt, (TMTSF)2ClO4, and thevery same correlation between A and Tc was observed22.Because (TMTSF)2ClO4 is a high-pressure analogue of(TMTSF)2PF6, with an ambient-pressure Tc of ∼1.2 K,using the same experimental setup we were able to wellexceed the point at which Tc = 0, thus confirming thatA = 0 when Tc = 022.
We stress that this correlation between resistivity andTc is not fit-dependent. The purely linear and nearly T 2
regimes close to the SDW and superconducting criticalpoints, respectively, are clear from the resistivity curves(Figs. 3 and 4). Describing the evolution from one regimeto the other as we did allows us to track each contribu-tion, AT and BT 2, as a function of pressure. But a powerlaw of the form ρ(T ) = ρ0 +AT α would also describe thedata well, giving an exponent α that grows from 1 to 2with pressure. An alternative measure of the linear resis-tivity which involves no fit consists in taking the inelastic

4
0.0 0.5 1.00.0
0.2
0.4
0.6
Fang et al. Chu et al. (arb. units)
A [
cm
/ K
]
Tc / Tcmax
Ba(Fe1-xCox)2As2
0.0 0.5 1.00.0
0.1
0.2
0.3
0.4
A [
cm
/ K
](TMTSF)2PF6
FIG. 5: Top: Coefficient A of linear resistivity as a functionof normalized Tc (Tmax
c= 1.1 K) for (TMTSF)2PF6, from a
second order polynomial fit over the range 0.1 - 4.0 K to allour resistivity curves at different pressure points between 11.8and 20.8 kbar. The vertical error bars show the variation ofA when the upper limit of the fit is changed by ± 1.0 K. Tc isdefined as the midpoint of the transition and the error barscome from the 10 % and 90 % points. The dashed line is alinear fit to all the data points except that at Tc = 0.87 K.Bottom: Coefficient A of linear resistivity as a function ofnormalized Tc (Tmax
c= 26 K) for Ba(Fe1−xCox)2As2. The
data points come from a second order polynomial fit over therange 30 - 300 K (except for x = 0.184 and 0.30, where Tc = 0and the range is 0 - 300 K) to the resistivity data of Fang etal. (red dots)28 and Chu et al. (blue dots)29. For the latter,A is expressed in arbitrary units. The vertical error barscome from an estimated ± 15 % uncertainty on the geometricfactors. The Tc and corresponding error bars are those quotedin28,29. The dashed line is a guide to the eye.
part ∆ρa = ρa − ρ0 of the resistivity at 1K - where theT 2 term is negligible - and plotting that quantity versusTc. As shown in Fig. 2, the correlation between ∆ρ at1K and Tc is the same as that seen between A and Tc,i.e., it extrapolates to the origin, showing that it is notthe result of a particular fitting procedure.
The observation of a strict linear resistivity as T → 0in the Bechgaard salt (TMTSF)2PF6 on the verge ofSDW order is highly reminiscent of the linear resistiv-ity seen in heavy fermion metals at an antiferromagneticquantum critical point where it is ascribed to fluctua-tions of the incipient magnetic order8,23. The correla-
tion between linear resistivity and Tc established herenow shows that scattering and pairing share a commonorigin, implying that antiferromagnetic spin fluctuationsand superconductivity are intimately connected, as dis-cussed in the context of heavy fermion, ruthenate, andcuprate superconductors24.
A weak-coupling solution to the problem of the in-terplay between antiferromagnetism and superconduc-tivity in the Bechgaard salts has been worked outusing the renormalization group approach18,25. Thecalculated phase diagram captures the essential fea-tures of the experimentally-determined phase diagram of(TMTSF)2PF6
18. The superconducting state below Tc
has d-wave symmetry26, with pairing coming from anti-ferromagnetic spin fluctuations. The normal state aboveTc is characterized by the constructive interference of an-tiferromagnetic and pairing correlations, which enhances
the amplitude of spin fluctuations18,25. The antiferro-magnetic correlation length ξ(T ) increases according toξ = c(T + Θ)−1/2 as T → Tc, where Θ is a positivetemperature scale18. This correlation length is expectedto impart an anomalous temperature dependence to anyquantity that depends on spin fluctuations. For instance,it was shown18 to account in detail for the deviation fromthe Fermi-liquid behavior in the NMR relaxation ratemeasured in the Bechgaard salts26,27. Through Umk-lapp scattering, antiferromagnetic spin fluctuations willalso convey an anomalous temperature dependence to thequasi-particle scattering rate τ−1, in addition to the reg-ular Fermi-liquid component which goes as T 2. Evalua-tion of the imaginary part of the one-particle self-energyyields τ−1 = aT ξ+bT 2, where a and b are constants. It isthen natural to expect the resistivity to contain a linearterm AT (in the limit T ≪ Θ), whose magnitude wouldpresumably be correlated with Tc, as both scattering andpairing are caused by the same antiferromagnetic corre-lations. Calculations of the conductivity are needed tosee whether the combined effect of pairing and antiferro-magnetic correlations conspires to produce the remark-ably linear resistivity observed in (TMTSF)2PF6 on theborder of SDW order.
Comparison with the resistivity data of Fang et
al.28 and Chu et al.
29 on the pnictide superconductorBa(Fe1−xCox)2As2 suggests that our findings on theBechgaard salts may be a more general property ofmetals near a SDW instability. The phase diagram ofBa(Fe1−xCox)2As2
28,29, shown in Fig. 1, is strikinglysimilar to that of (TMTSF)2PF6, with TSDW and Tc
both enhanced by a factor of about 20, and just abovethe critical doping where TSDW → 0 (at x ≈ 0.08), itsresistivity is purely linear below T0 ≈ 125 K, down toat least Tc ≈ 25 K (Fig. 3). We note that the ra-tio of T0 to the maximum Tc is roughly the same for(TMTSF)2PF6 and Ba(Fe1−xCox)2As2. Furthermore,in the overdoped regime (x > 0.08) and over a largetemperature range, from Tc up to 300 K, the resistiv-ity of Ba(Fe1−xCox)2As2
28,29 is well described by ρ(T ) =ρ0+AT +BT 2 (see Fig. 3), with a linear coefficient A that
5
decreases monotonically as Tc drops (Fig. 5), vanishing atthe critical doping xc ≈ 0.18 where Tc → 0. For x = xc
and beyond, A = 028,29. This reveals a detailed simi-larity with (TMTSF)2PF6, which further reinforces theconnection between linear resistivity, antiferromagneticfluctuations and superconductivity described above.
In the cuprates, it has long been known that thelow-temperature resistivity of strongly-overdoped non-superconducting samples has the form ρ(T ) = ρ0 +BT 2, as in Tl2Ba2CuO6+δ (Tl-2201) at p = 0.272 andLa2−xSrxCuO4 (LSCO) at p = 0.3330. It was also shownthat the evolution of ρ(T ) from ρ(T ) = ρ0 +AT near op-timal doping to ρ(T ) = ρ0 + BT 2 at high doping is bestdescribed by the approximate form ρ(T ) = ρ0+AT+BT 2
at intermediate doping31,32. The A coefficient thus ob-tained, when expressed per CuO2 plane, i.e., A/d, whered is the average distance between CuO2 planes, was re-cently found to be universal among hole-doped cupratesand shown to correlate with Tc, vanishing at the dopingwhere superconductivity disappears22. The same corre-lation was found in an analysis of low-temperature resis-tivity measurements in high magnetic fields on overdopedLSCO33. In the context of cuprates, a linear transportscattering rate was explained in terms of antiferromag-netic fluctuations34, or as a property of a marginal Fermiliquid35
In summary, we have observed a linear-T resistivityas T → 0 on the border of SDW order in the Bech-
gaard salt (TMTSF)2PF6, showing that it is a prop-erty of metals close to a magnetic instability which tran-scends the peculiarities of f -electron metals and theirKondo physics or copper oxides and their Mott physics.Away from the SDW phase, the low-temperature re-sistivity acquires a curvature and eventually becomesquadratic when Tc → 0. The correlation betweennon-Fermi-liquid resistivity (linear) and superconductingTc reveals that anomalous scattering and pairing have acommon origin. In (TMTSF)2PF6, all evidence suggestthat both are caused by antiferromagnetic spin fluctu-ations. The similar phase diagram, detailed tempera-ture dependence of the resistivity and correlation withTc observed in Ba(Fe1−xCox)2As2 strongly suggest thatantiferromagnetic fluctuations play a similar fundamen-tal role in the pnictide superconductors, with tempera-ture scales TSDW and Tc twenty times higher. While thesituation in cuprates is more complex, in particular be-cause of the ill-understood pseudogap phase, the fact thatthe same correlation between non-Fermi-liquid resistivityand Tc is observed outside the pseudogap phase in sev-eral cuprates22,33 would seem to also favour, by analogy,the same scenario, at least in the overdoped regime.
We thank H. Shakeripour for assistance with the dataanalysis. This work was supported by NSERC (Canada),FQRNT (Quebec), CFI (Canada), a Canada ResearchChair (L.T.), the Canadian Institute for Advanced Re-search, and CNRS (France).
∗ Electronic address: [email protected]† Electronic address: [email protected] H. Takagi, B. Batlogg, H. L. Kao, J. Kwo, R. J. Cava, J.
J. Krajewski, and W. F. Peck, Jr., Phys. Rev. Lett. 69,2975 (1992).
2 Takashi Manako, Yoshimi Kubo, and Yuichi Shimakawa,Phys. Rev. B 46, 11019 (1992).
3 T. Ito, K. Takenaka, and S. Uchida, Phys. Rev. Lett. 70,3995 (1993).
4 Yoichi Ando, Seiki Komiya, Kouji Segawa, S. Ono, and Y.Kurita, Phys. Rev. Lett. 93, 267001 (2004).
5 R. Daou, Nicolas Doiron-Leyraud, David LeBoeuf, S. Y.Li, Francis Laliberte, Olivier Cyr-Choiniere, Y. J. Jo, L.Balicas, J.-Q. Yan, J.-S. Zhou, J. B. Goodenough, andLouis Taillefer, Nature Phys. 5, 31 (2009).
6 P. Fournier, P. Mohanty, E. Maiser, S. Darzens, T.Venkatesan, C. J. Lobb, G. Czjzek, R. A. Webb, and R. L.Greene, Phys. Rev. Lett. 81, 4720 (1998).
7 N. Ichikawa, S. Uchida, J. M. Tranquada, T. Niemeoller,P. M. Gehring, S.-H. Lee, and J. R. Schneider, Phys. Rev.Lett. 85, 1738 (2000).
8 Hilbert v. Lohneysen, Achim Rosch, Matthias Vojta, andPeter Wolfle, Rev. Mod. Phys. 79, 1015 (2007).
9 Makariy A. Tanatar, Johnpierre Paglione, Cedomir Petro-vic, and Louis Taillefer, Science 316, 1320 (2007).
10 O. Trovarelli, C. Geibel, S. Mederle, C. Langhammer, F.M. Grosche, P. Gegenwart, M. Lang, G. Sparn, and F.Steglich, Phys. Rev. Lett. 85, 626 (2000).
11 R. Hlubina and T. M. Rice, Phys. Rev. B 51, 9253 (1995).
12 D. Jerome, Science 252, 1509 (1991).13 S. E. Brown, P. M. Chaikin, and M. J. Naughton,
in Physics of Organic Superconductors and Conductors,edited by A.G. Lebed, vol 110 in Springer Series in Mate-rials Science, 49 (2008).
14 C. Bourbonnais and D. Jerome, in Physics of Organic Su-perconductors and Conductors, edited by A.G. Lebed, vol110 in Springer Series in Materials Science, 357 (2008).arXiv:0904.0617.
15 T. Vuletic, P. Auban-Senzier, C. Pasquier, S. Tomic, D.Jerome1, M. Heritier, and K. Bechgaard, Euro. Phys. J. B25, 319 (2002).
16 B. Salameh, P. Auban-Senzier, N. Kang, C.R. Pasquier,and D. Jerome, Physica B 404, 476 (2009).
17 N. D. Mathur, F. M. Grosche, S. R. Julian, I. R. Walker,D. M. Freye, R. K. W. Haselwimmer, and G. G. Lonzarich,Nature 394, 39 (1998).
18 C. Bourbonnais and A. Sedeki, Phys. Rev. B 80, 085105(2009).
19 K. Bechgaard, C. S. Jacobsen, K. Mortensen, H. J. Peder-sen, and N. Thorup, Solid. State. Comm. 33, 1119 (1980).
20 R. Walker, Rev. Sci. Inst. 70, 3403 (1999).21 H. J. Schulz, D. Jerome, M. Ribault, A. Mazaud, and K.
Bechgaard, J. Phys. Lett. 42, L51 (1981).22 N. Doiron-Leyraud, P. Auban-Senzier, S. Rene de Cotret,
A. Sedeki, C. Bourbonnais, D. Jerome, K. Bechgaard, andLouis Taillefer, arXiv:0905.0964.
23 G. G. Lonzarich, in Electron: a centenary volume, editedby M. Springford, Cambridge University Press, 109 (1997).
6
24 P. Monthoux, D. Pines, and G. G. Lonzarich, Nature 450,1177 (2007).
25 J. C. Nickel, R. Duprat, C. Bourbonnais, and N. Dupuis,Phys. Rev. B 73, 165126 (2006).
26 J. Shinagawa, Y. Kurosaki, F. Zhang, C. Parker, S. E.Brown, D. Jerome, J. B. Christensen, and K. Bechgaard,Phys. Rev. Lett. 98, 147002 (2007).
27 F. Creuzet, D. Jerome, C. Bourbonnais and A. Moradpour,J. Phys. C: Solid State Phys. 18, L821 (1985).
28 Lei Fang, Huiqian Luo, Peng Cheng, Zhaosheng Wang,Ying Jia, Gang Mu, Bing Shen, I. I. Mazin, Lei Shan,Cong Ren, and Hai-Hu Wen, Phys. Rev. B 80, 140508 (R)(2009).
29 Jiun-Haw Chu, James G. Analytis, Chris Kucharczyk, andIan R. Fisher, Phys. Rev. B 79, 014506 (2009).
30 S. Nakamae, K. Behnia, N. Mangkorntong, M. Nohara, H.
Takagi, S. J. C. Yates, and N. E. Hussey, Phys. Rev. B 68,100502 (2003).
31 A. P. Mackenzie, S. R. Julian, D. C. Sinclair and C. T.Lin, Phys. Rev. B 53, 5848 (1996).
32 Cyril Proust, Etienne Boaknin, R. W. Hill, Louis Taillefer,and A. P. Mackenzie, Phys. Rev. Lett. 89, 147003 (2002).
33 R. A. Cooper, Y. Wang, B. Vignolle, O. J. Lipscombe, S.M. Hayden, Y. Tanabe, T. Adachi, Y. Koike, M. Nohara,H. Takagi, Cyril Proust, and N. E. Hussey, Science 323,603 (2009).
34 T. Moriya and K. Ueda, Adv. Phys. 49, 555 (2000).35 C. M. Varma, P. B. Littlewood, S. Schmitt-Rink, E. Abra-
hams and A. E. Ruckenstein, Phys. Rev. Lett. 63, 1996(1989).
Top Related
Copyright © 2022 FDOKUMEN

