


Bahasa
Halaman
Hukum


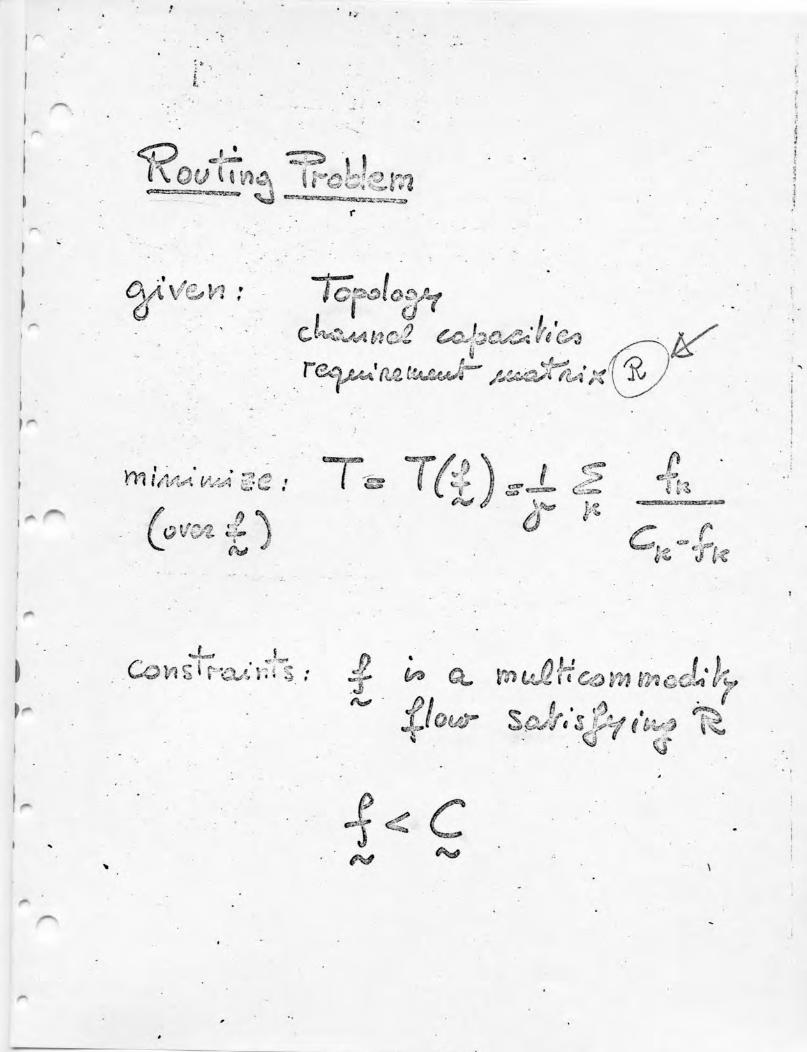
Applied Math 254: Computer Networks
Slides/Notes for Class 4: Computer Network Topology
Mario A. Gerla (Network Analysis Corporation)
March 1975
O
^•' I 5-^
^0
'a
O" f —""""
°
O
i/l
O
,
^3O
1', '->.
O
0
Q* .-—
</"/ ''
b o-u
^tc>
O
5
I
*I A
.
-c
;> D
?u o - M
- . 1,^"- -- ft ; ./VW ^ , J .A C-4
a, ©
ii'lv^jf '<-»C- «*y •
..
, I
(
/.
... ^"l <f t-U)? fy -
, i -PJ ,,, i w MI ' -t 1
T
"5>
9
J^>
r1

,•*»

>) > >
) ) •
If
o
c
''S.
z- &£* *TT
r<
*
i »^e «ry* ^«*
^' • • 1 -<<^
. "o W^ 1| - Ci
•J/Eft jP ti . .wwrww**-•"*-1"' | • *• X^^^^^
BtKKO* | *-^'*J /
*'^T ll a II ll>i WZ3K3SE;-;,,-,. ' JJ51 /X
«-*?* S -=" -^ f<
e/J)•T. "&^j
*\L1
t/l-*.
. •%0
±H±—±r
-{—fc^-a^aiw^
' w* -r
I«ao4
i1 i v> \ \r
/ ! qx fi" 1E P-5 SC* :-=-— >!
1 l2 v „, ^ LJ
1^5 !* j y
-* \ " a• ?r>l .-J• Sr.S"\ r Ji' s^ n
- . . . • • • v, A. ' • ; , , - . <^l** • ' • ;\' 1
i, ^«>-~»- '
'•O
«<>«» f*--
>. A ' "~"> ^F'\ '\& ' • f"X *' -*f- !• ^** r ."•''.
«# & i -4i— '/ | 3 » r,;)
I V • >.' i '& •rt.: 7»
3 • *">\ •
i ' ^
W'i\^y-\'-/ ' * -^v n x>^•» . _ _, • f;
• •Ww,.• • • ' |i
- ; - . ' ;. ' >--V.v
55
i

•
,, <?, "^-i . -/J
0 '•
V>.^»
mi/ faf\A-t->f.1 *'^v L^W/w* "»••„
VIA f 1 1 -• 1 to l.'« S*Vi c > . -
* - -

*«2*£n£Y4»
**^ f -1 * 4 <lC' fe-W *
,
I y o
\\H'i 1' - . ! I
i i
****
SJ
t t; ( i ;-.»,,..*.
\
9b«MAi l l
...',-." <:
>
Cv
fSsyf9 *fl» f£L$y*
•"=555..
I '
5kI
Oe-
« - 1— i
3
JL"
o*
k g i4to
• S
i
JL
IS
r
JU
(t
4/5
(VTX..a»
F-VI
X
$
V
_*>
.<-?
UVjJ^f.
i;. **
*
I
(
*
j y '=.<•'" $ i$ • "*
rf
**%*«: ~>
^
*V
»•
1
)
o
8£.***"":*•
^
CD
V.
i<r3
.
"J.
t/»*
•fe
4s
^ rti.-^ '—"<^j i /*n,.;••» !j -j?
. • • s~^V*A'&. ., ^o
^Otew-.-,
' • ; . . o^p
^ i: fl» j^
i•.' , «n
r|' 1"
•J1 «r<i- »(jj
^3VX^j
1 M J«
a «TX ?>,M ^*^ * «- -"»
1 r^"1 ' ^
S^
' tO
O
/
£0 S3 !*"ix !" 1»j-5 !«r--\
^j<^>.4
v
'&^K -if »
S
cjiP i-^!- i
4,-c^ I
jOjL . -««§• tj
fe 3*.'» i
ol<•-•* i1/3 «IjCa1
O
I
V-
o
40|-sp
fft li
-*•£
o
, F^ " fv* *Tf^ -^i > SJ C^»

i
C:
-i
f! /?<-.»
!C*
ri
\
a
ro
• ) oI e
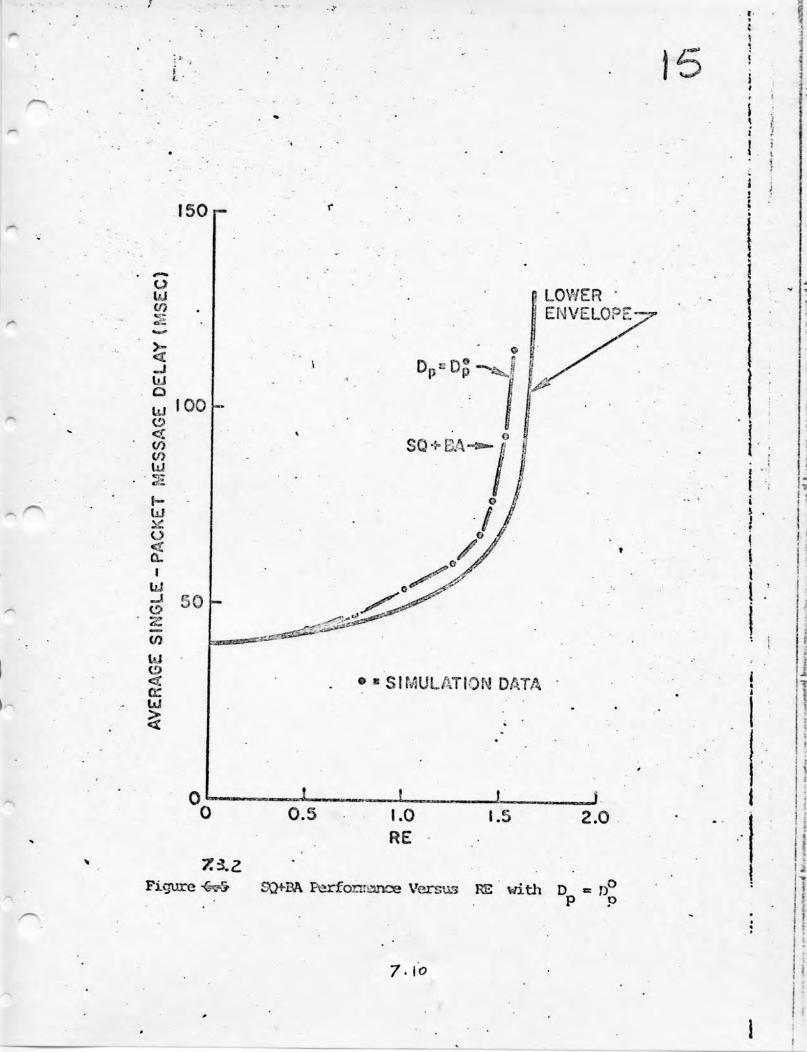
15
150
OUJV)
UJO
L'JO
COtil
HhJ
O
c£i
UJ
2:
UJ
ccUJ!
100
00
LOWER •ENVELOPE-
• * SIMULATION DATA
0.5 1.0RE
1.5 2.0
i ;
Figure SQ*-BA Perforti^inoe Versus RE with D.
7.10

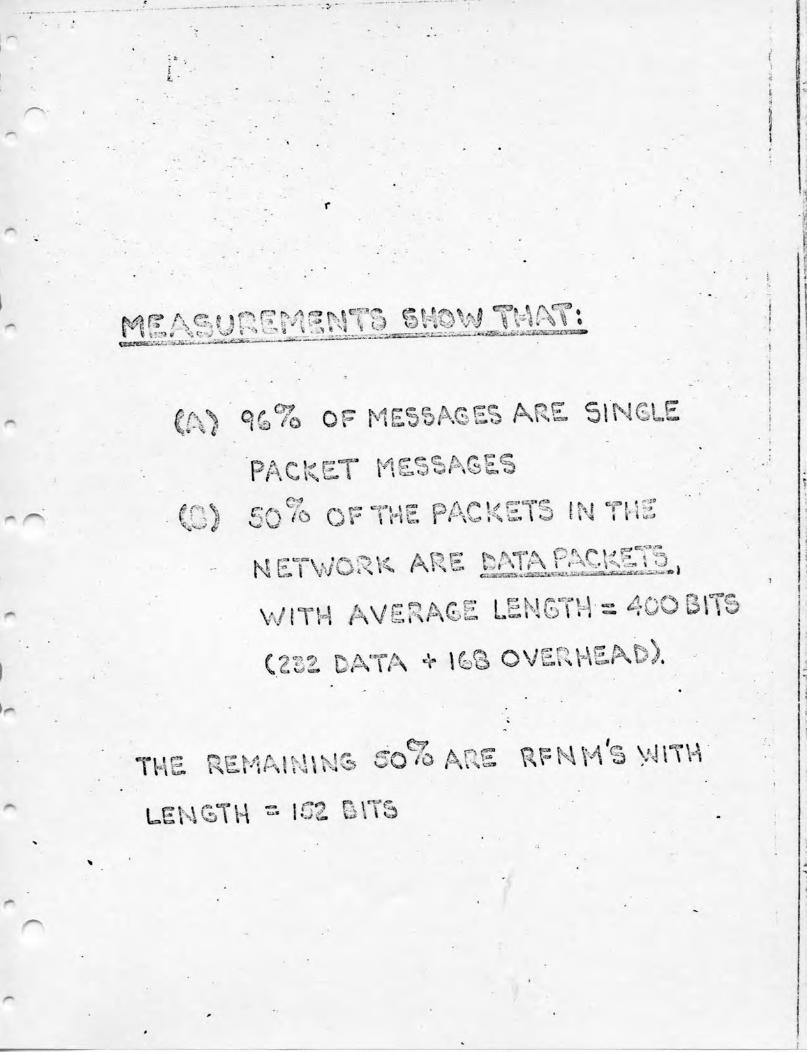
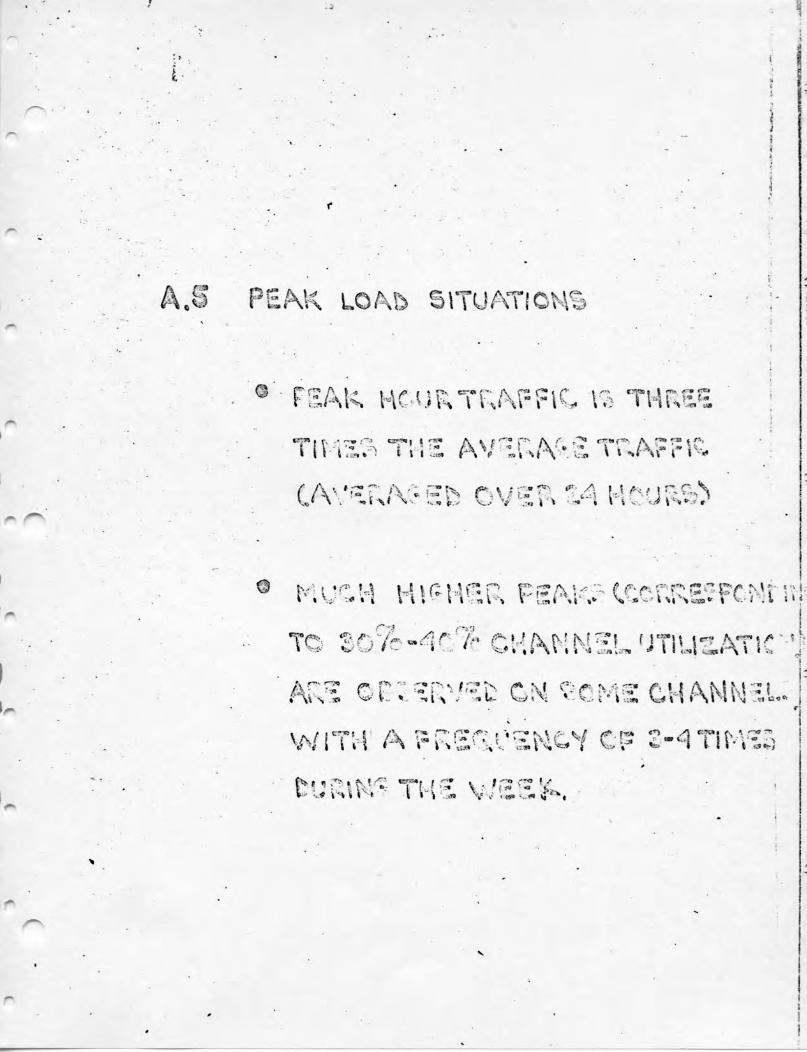
. TRAFFIC LOAD OF PRESENT ARPANET
A.1 TRAFFIC ANALYSIS .
1 1 fn v}G*T^ w 5
Ij
»s
I ~,j p- «... |"j |!v'iv-<i'i'"*'•"!^MCSM^MB^CiB.-T-ssat' Lv_.L_i
I . -
.t *3
P A rI r\V*
i
s. •*!*,-**.** ft f *>, f a t~«!v ^ ^f'"* *v ^- f\*WORK ARE t>\\Ag.-Jar;Mva'''i.v^.srj.-r^*ig'iLi» A:--.-3^— .-
WITH AVERAGE LENbTH'» 4DOBSTS
BE DATA * IfeS OVERHEAD), ••
THE WTW
LEHQTTH

OH
H1BNB1
, -•?
-t
_ I
•s I «> « 'VvJS- !lN » »v N !
HI-
-»3o%j

7.
O-
VJ<Cl-
TEIXX, PVNPf-'lC
A £\| f\ \ r- €!l V^^f } A 1T'I <*"*• M fA0^! \\O **J \3
F f^ A t < | i ,e> f * £?,l Mk HOU
"' (** < f* \^ cw» t I «». <r» ;*rFl^ \v? rHRE*\ A »
Ac •
A * ' ~ ? A • "i« % % - > E A < N-v
" ";V^ s » - v, * - < i s
» . cr*>/Vf 1 £v •< i t
f JTIM'*?
r r^Wi^l
, « '- « f. t'-• iM
< u \ Nrlr>lTl
J '"-T5*! fs«•««{ | j \I l { l
.
f ARPANE\ \|x I f \iN vc«. I
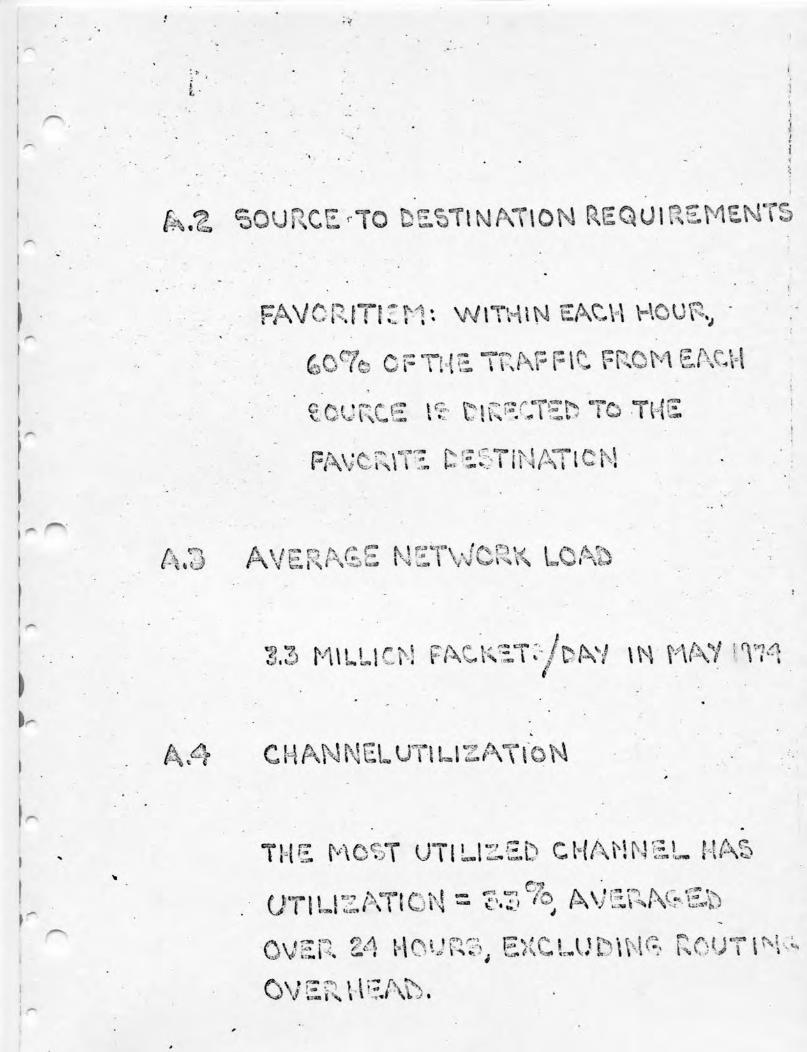
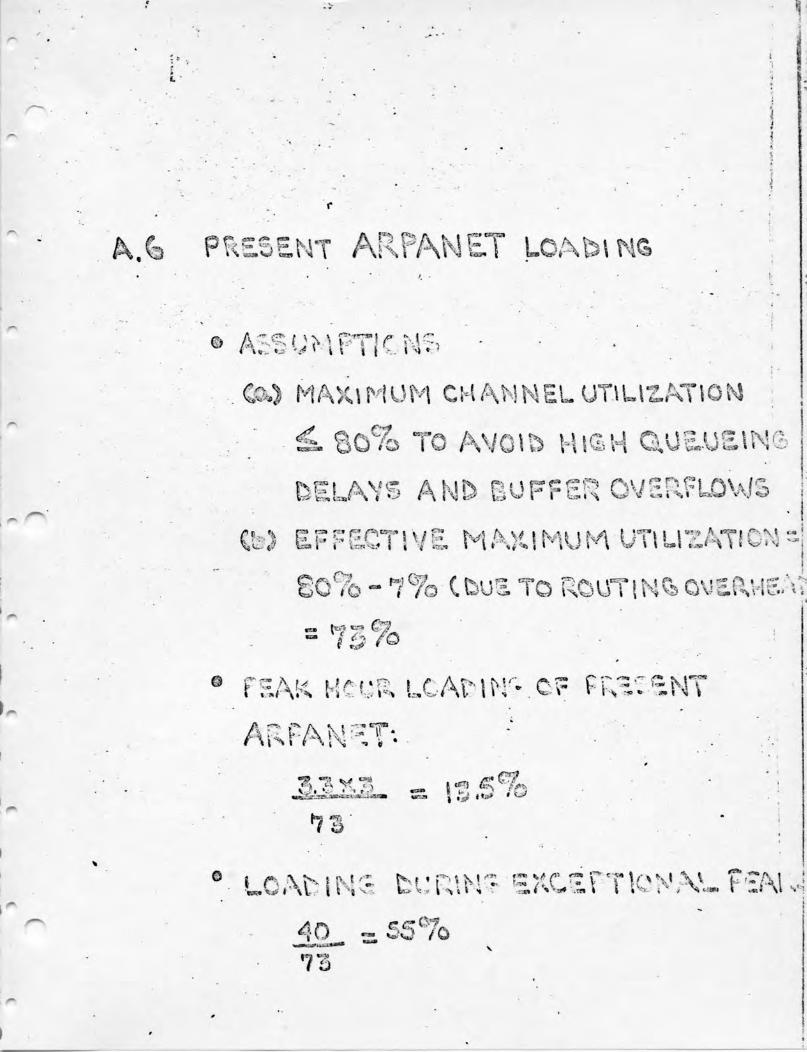
MAXIMUM CHANNEL UTILIZATION
© r ^ /\ 5^
A r* . »'?\\v i -- « c*rmRFAN5T
t «.&»
"Vi
4)
0
^ i Aver, A M 5-^i-.»f A * »-• * \5
^r-nT'^^ H^^IMUMi tn?!^< i i -a IM » \ *»% } i IV* > i %r t I
!- vi' fail C"7? ^ ft- i I -'" crF» /»,. 7 ' ;<te I l^*"& - 7 /o \wUS I D KOU
? @?f «' ""r ri#
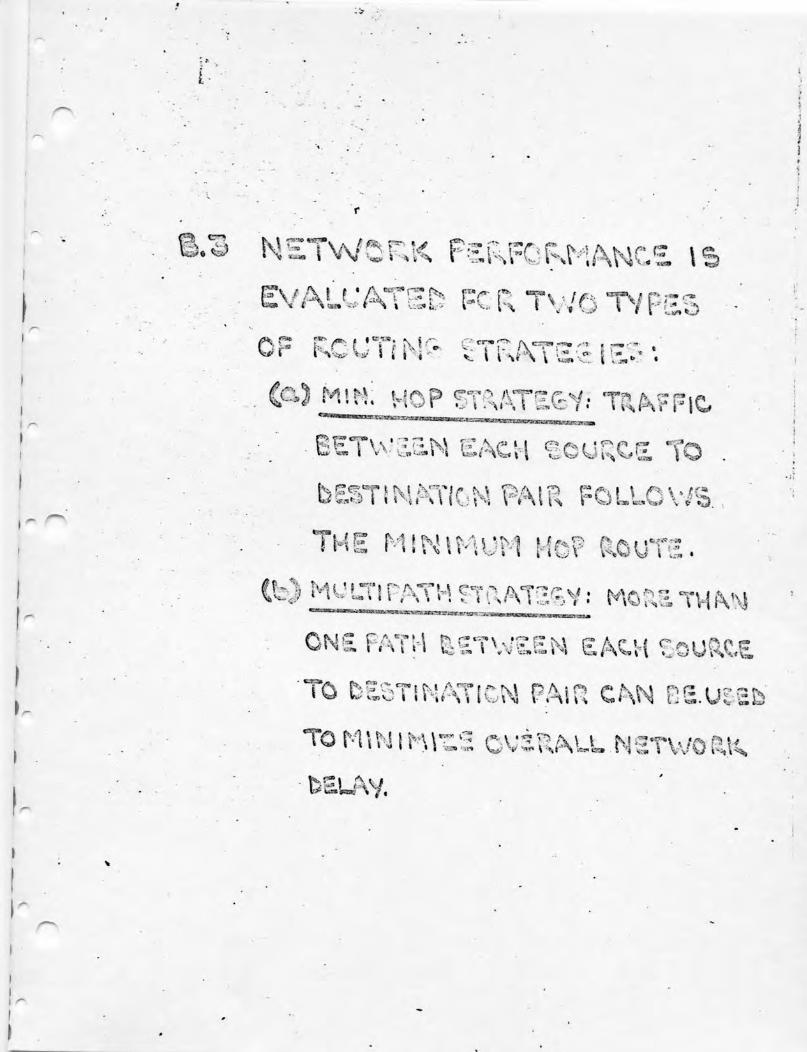
p >•? p. ?sr •« c M A M ri ••B»rSi W M iiAVNv^
SH. HOP \^!\N EACH
Tc
THE M I N I M U M Me? uOUTS,
CbJ MULT! P/XTH Hu/M'^^V :^ V-1
6
P>»D «?>» , fv i A i1 1 N ^ -\ . N. \> A 5 f^ ^ ,\* P"* f? I 1 1' «1 C M PA i u C P\ i - -«». v s •
M \ i M \^2 0 vRAsLL N iTVvO
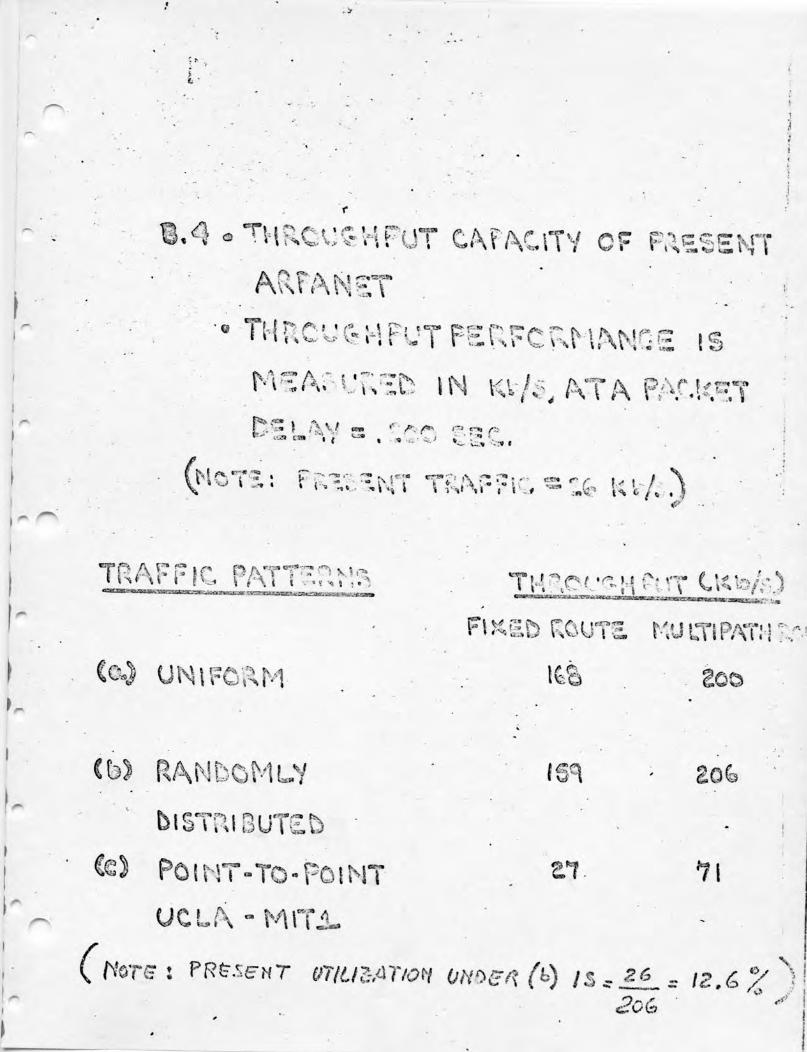
INT-TO-POINUCLA,
ff : vrtUZ-Arton OH^e^ fa I S * ?-6 r 12.6" "~ *
i.3 -THROUGHPUT C/KFACiTV OF
IN s, /VTAIS
t~i r~rT
T \
R ^ T-i f™ s ^.^i t i*^* r^ A*r-*( i '*- ^r iU u i I PA i H
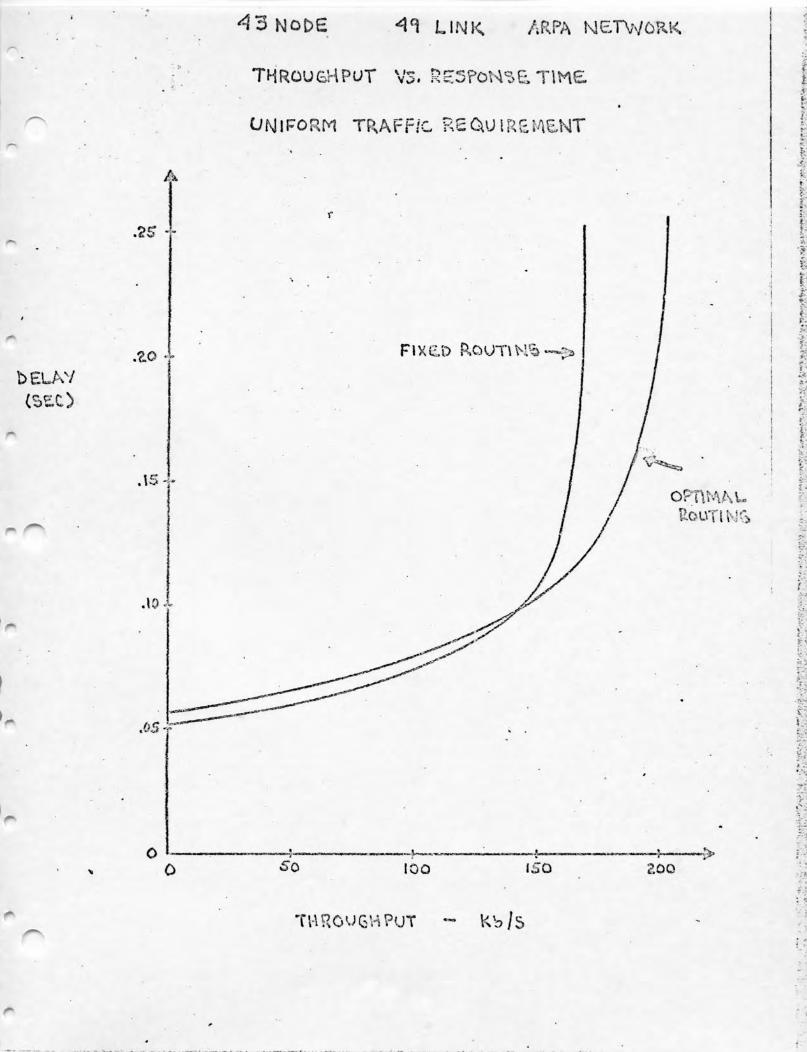
NODE LINK AftPA NETWORK
THROUGHPUT VS. RESPONSE T
UNIFORM TRAFF/C RSG^U IRE
ISO 2.0 G
THROUGHPUT
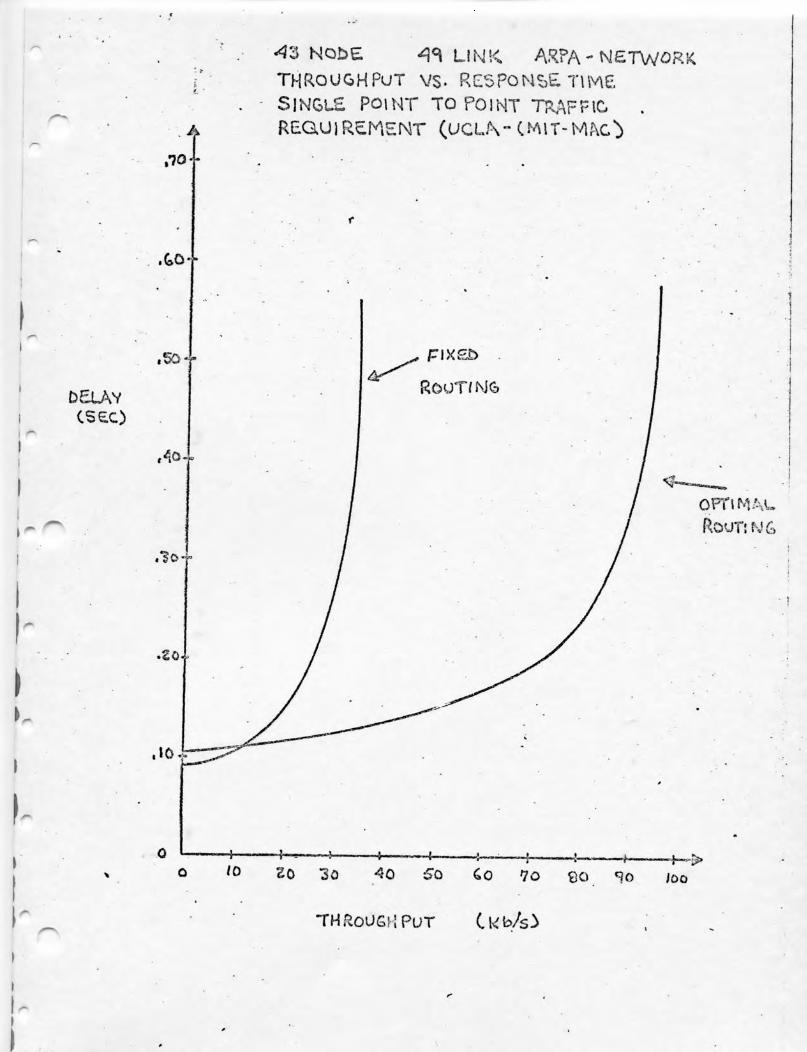
•43 KQbE LINK ARPA-NETWORK
DOAYcsec)
,•70
THROUGHPUT VS- RESPONSE TIMESINGLE POINT TO POINT TRAFFICREQUIREMENT
'0 EO 30 -30 50 Co 70 $0
THROUGHPUT

'S..?V
<3a:-;vi S.
# N
\, rjiw
^TSajJOW n
(

feS
«p"t2 >
o«
1:1
vf«i »
r T
©
o
£.5
*
"..3
«J "*7jH£V *•* "
<f r^> L^V ^«4 fe^t-v • H0 fc
1*
0
-'
II
?—• ~Z? f '?fe <U- t-^J
. ^
i
u
o
tsJz
|-
:>
4*
i Ifew {- * "" " f P r-7'H? r-.« f- fxj i-<s > ' % «« 4^ i • -?' 6 »•» « »< W
)> >" --.f '••'.• '.'.••:'.-;.;>i>>-V'.
- • • •
ONt
SjCO
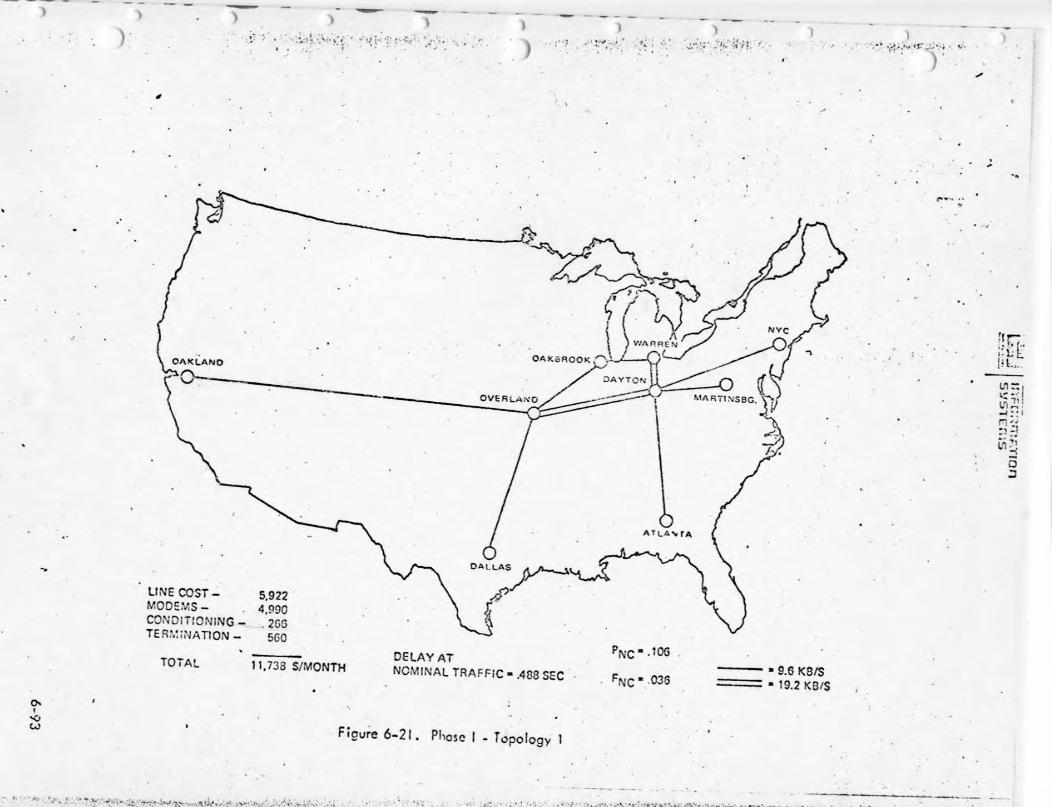
OAKSROOK rv/^ DAYTON
OVCHLANO
LIME COST- 5922M O D E M S - . 4,990C O N D I T I O N I N G - '2GGTERMINATION- 560
TOTAL 11.733 S/MONTHDELAY ATNOMINAL TRAFFIC • .408 SEC
6-21. Phase I - Topology 1
-03S; 9.6 K8/S
19.2 KB/S
fin:K
' v * -. ;>••;--i^.>>,. . , . . n,i;,',V'.1 • , • . » : • > , . '...';•.-'v>,.;';i,,-.;,:,; ' . • :/.': • ' . ' ' : - ' , . ' t > ' ' , ' • • '

LINE COST -MODEMS -CONDITIONINGTERMINATION
TOTAL 14,950 S/MONTHDELAY ATNOMINAL TRAFFIC « 3 t4SEC
PNC " -003
FNC«.OIO
3
ALL LINES 9.6 KB/S
Figure 6-27. Phase I - Topology 4
••;.. ' - . . . . ,.,.-,..,.......-. ,..,.,>;...;.. :v»: • • • • ' • ' • • • -',i • • ' • • • ' • • • '•" ••• r.W*""''.~..Ji^. .,*.. L.' *.-...- , j -.. ^ j ' - i_• .»<_ _ *. . . _ . ' _ . . ..
/ • .v •,•••• '• \.i '. ••••'.'*;''' -.'• i^v'-vs-i',';•*;!* *-'>tV^^\^;i^A"lv>;^s^Wh^*rtiiiA^jt:,/vit*»iif*'
1US
l-Vi I'M J> *i *•!
Tf u
LA

v£>M
o
*
•
-s?
VJ?
!LO
H:-?a
\
Ojf...
w
*•$.
».32n_
X
> ^h-
<J
o
D (F)
f° <
f° : STARTING FLOW? : LOCAL MINIMUM
Figure 5.6.2. Illustration of the FD Method.
Let us now investigate the effectiveness of DisCap in the
determination of the global minimum.
First of all, notice that the global minimum (f*,D*) is in
general not unique; more precisely, the optimal assignment C* is
unique (excluding pathological cases), but more than one flow f* does
in general satisfy T(f*,C*) <T . However, there is at least one** **» *"~ in 3.x
global solution (namely (f,C*), s.t. T(f,C*3 = min T(f,C*)) which is
also local, according to the previous definition.
DisCap finds local minima (which depend on the initial flow
f ) and therefore can determine the global minimum, if an appropriate
initial solution is chosen. Several initial flows can be generated and
several locals found with the random procedure described in Section 5.6;
141

6
4ASSIGN LENGTHS «j
AT RANDOMI J
ICOMPUTE SH ROUTEFLOW f°
APPLY FD ALGORITM
YES
ISELECT THE MINIMUM OF
THE LOCAL MINiMA
5 6 1 Block Discern of th» Rsndom Procedure for theof « SuboptimsJ So)utio«.
) )
GO
50
40
O IA ID 1
2,300 MJLES1.GCO MILES755 MILES
1-2,300
1CO
C[ Kb/sec]
150 200
I - 1,500
I -755
Figurt 5 8 2b. Powar Le*t Approximation of Dbcrtt* Chonnel Cost* (Pert 2).

D{K$/MQNTHJ
0109
•o•o3X
0
o
D«•' .ft
xf-
rsiK>
uz«4-lO
I
<N
II
o•oo
<
*JO
SC
K)*
00
3oo
3Si i . The results of the six runs are shewn in Tables S-8 5 to S.8.10.
For each run we give:\ cost of the best loc&l Kin: D ,
• . . ni n- distribution of the costs of the local oiniaa
I - ranCe of the .costs: « - °°"' D»in
Bin
where D is th« highest costMX
- relative cost improvement: e » ——^ —I Ufin
where D. is the initial cost end D- the final costin finfor th© best local runicaia '
of FD iterations psr local isiniauai
of arcs in the final topology
TABLE 5.6.5
KET A. && I (a. P
- Distribution of the coses:
D|$/nont.h] No. of solutions
88.400 - C8.SCO S
68,500 - £8,600 11
CS.600 - 03,700 11
GS.700 - 88, GOO 19
8S.EOO - gQ .000 _ 1
c « n . .ft • 12%
Number cf F^> I tcr t t iws f-"- eech local tain: 5 to 10. . . . - •
Number of «rcs in tne tin*! tro^t; rost' V v ' "'(including th« beat) have 31 arc*. ~*,a »ol.»t '^fts h«u« iO arcs.
. >
s
D . - 63,582•in
- Dis t r ibu t ion of the costs:
D($/nonth]
63,000 -
6\000 -
68,000 -
69,000 -
70,000 -
71,000 -
72,000 -
75,000 -
64,000
68,000
69 ,000
70,000
71,000
72,000
73,000
74,000
Number ofsolutions
1
5
8
19
6
2
3
8 .
TABLE S. ,8 .6
K'ET A. RUN 2 (a - 0,S) ^^ j!_J» «» W *
- 0 • 171
- e « 20%
- Number of FO iterations for each local Bin: 5 ro 13
- Nucber of arcs in the final topology: 27 to 30
o/
D « CONST
A) a = 1. (LOW CURVATURE OF D - CO.MST LEVEL CURVES):2 LOCAL MINIMA. WITH APPROXIMATELY SAME VALUE OF D
-VD £
D = CONST
B) SMALL a (HIGH CURVATURE OF D = CONST LEVEL CURVES):4 LOCAL MINIF^A. WITH VERY DIFFERENT VALUES OF D
Figure 5811 Geometric Interpretation of tha Dependence of Numtwr endDiJtributicn of Local Minims -from a

« t'** • » • ««•«
iU ;> AV i
, t<
o
£, —
€5*B
.-"g
OVr*%
77o<•—
-36-J* "• ' j.' ^
r?.
.«. *-•
•»»
l
-. "
£ - 2
O O
:. *
-n
'dT|
r
t
;"? r--f r
•^
*r>,T^' i-a!p
r>
«!
«««••'*
O
i. -»
-3
f?

i
TABLE 6.6.1
COST DDISC AM5 TRAFFIC LOAD o FORVARIOUS 26 i<ODE ARPA TOPOLOGIES
HAKS | DDISC J
[
Fully conn. < 89,559 :
JAM ; 94,228 1
J03S i 94,314 jKAX3T - i 94.357 j
Hi£h.conn.l ! 55,191 jELS j 95,621 i
T031 96,017 ;
CAZ 1 £7,100 ];
Hig^.cona.2 t 97.215 !.KAC ! 97,2^0 iBAH ' 98, OSS iD£C2 ; SS.478 IDFO ; 98.SS4 ;
JC?2 i 99. 7831
TG2 - C-9,f-92 ;
K&S2 100,207 •' VCG i 100,815 1RJ3 101,075 !
• dtll ' 101,703 (i
D/^2 103,164 :K&X2 103,571 .
1
Am • 105,652 ',L «MI • . M ^MMII • mm !>• Ill 1 1 • 1 • '• • IM f II HIM
M\ i 105, C401 *
, LAS • 10S.540BU5 j 108,644JO? } 112,659Q1S 118.579KL£2 122,203DGCIP 1S3.251 ;DGC 141. £25 j
i .;i i iso,cis •
p ' DCCXT . DCO:-.T.. HAn Irun disc : 0 •i
1.05 82,533 66,164 , 525 i* 1
1.00 03,792 68,709 ; 29
1.00 64.SS1 £6,154 551.05 68,877 83, £92 29 j
1.01 1 C2.149 62,466 41 1i i1.04 • S9,4£S 30,529 : 51 I
1.03 ! 89,154 69,154 ! 29
l.CO 03,537 i 88.S97 59 '1
1.02 £2,765 i 02,991 41I
1.03 85,006 " 83,006 341.C2 50,351 ; 91,427 S3l.CS 87,35,0 j 87,£SO S31.10 85.616 ' £6,616 55
}
1.03 88,405 i £8,764 , 51;
1.06 87,513 ; 87,574 S3
l.CO C&.7.S8 i 87,019 SOi1.03 G5,^)2 92,354 55
1
1.00 86.014 1 £6,614 551.C6 84.078 j 84,874 511.01 67.181 91,427 341.00 67,506 '' 87,728 55
'1.05 C4.6&0 87.SS9 34
1.00 i 29,270 •' 97,336 55i
1.10 ! SO.m , 90,124 i 51l.CO ! C7,£03 1 97, £41 ! 42
! ik.CO C3,941 : 91,602 , 541,00 , 91,556 I 94,553 5031.01 I SO, 470 50,431 291.03 £3,531 89,591 | 291.10 CO, 247 90,431 i 281.10 92,C91 i 92,991 . 51
NA
61
29
55
29
S3
51
29
35
53
54
SS
5?
SS
SI-ss
so35SS5154S3S2
S*
425334SO2D292350
WAS
'v> -< ' / /ojc > />^ ; • < '•'_;• vHlgl
1 %''•*W YT-J
0 100 200 300 4001 I I I I
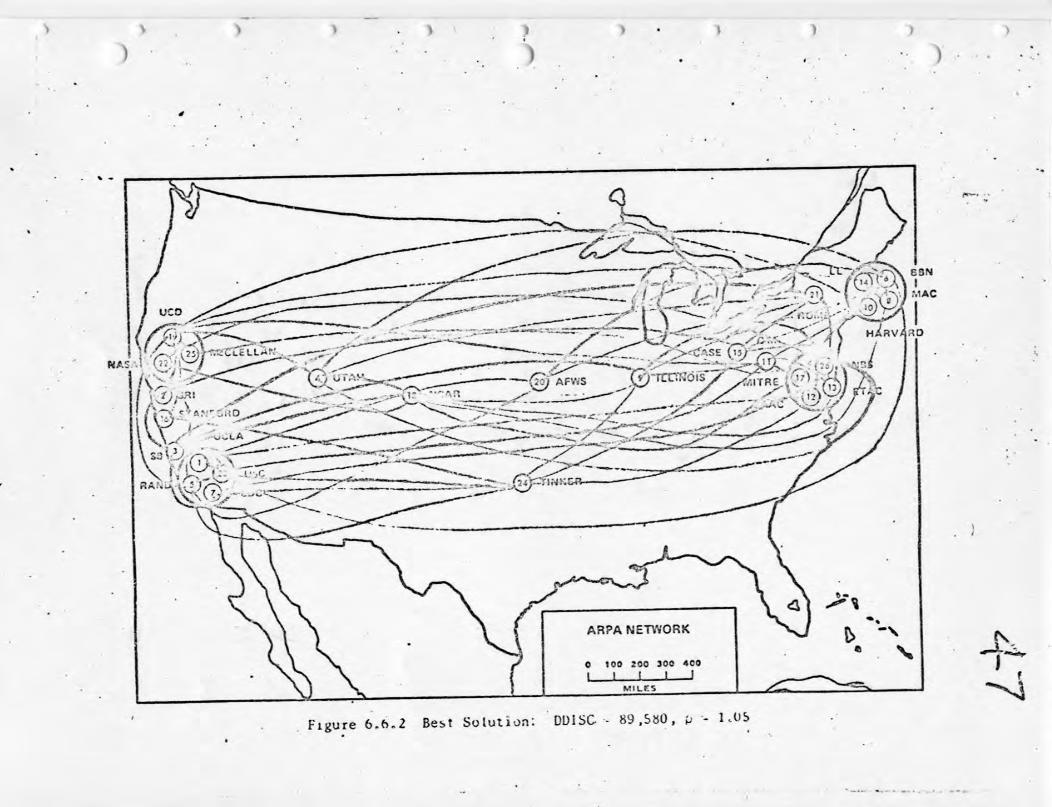
Figure 6.(>.2 Best Sulution: ' DD1SC - 89.S80, u - 1.0S
)
„ '«E .- , •" '\* •' """"v.^-^ .
0HARVARD
MITRI
SAAC
0 1C9 ICO 2CO1 I 1 I ]
MILES
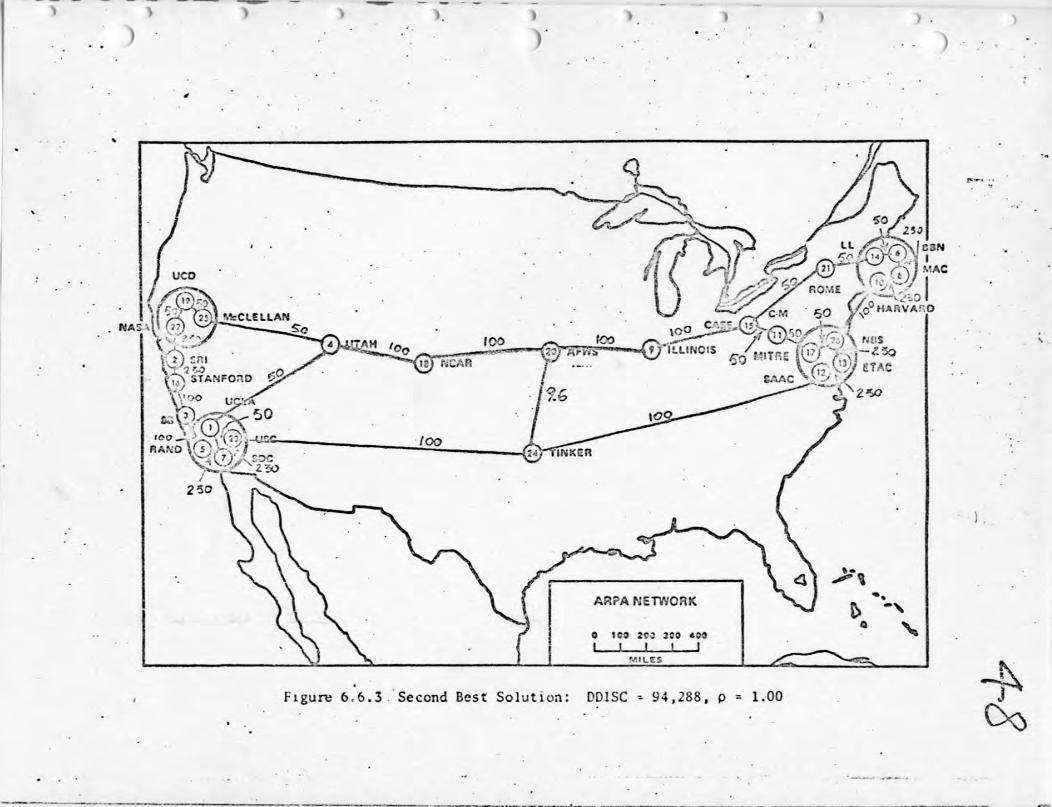
Figure 6,6.3 Second Best Solution: DD1SC - 94,288, p = 1.00
Oo
? f""* A S.-' t » / '*"*v
0 r ^ r f\. n r • r: r P rv ^* r- \ r f^ lV%WP t-ISr\\^»
f i. .• ,T r.7t * I s t7» I
, ( P- H 5"P> *-' A N• to'
•••• -~ fn. xj»
AW^ O
0 r? r-"T -,V *« t
A^-i<T-tc^A I ! v ;ts I — W j
-* r»
;n>o~~i*•
•y GO
<O •^r) r •-i ,? • / 5* <•-*<• •""% nX 9 «a: :
—I f%il
» B 1 :5o iiP -3
a
O
v^
O "-I *^V ia| •'-
5- O;-J-**\—/ , A •-•• ,**»•
• -•** fi»»7:9 ^ rcj
j'7 53T 1 ' ""<.,,] ^
<
'"> ••""( W <L« n
» -* •: t
I''*
f, '!ii <•
r80•• 3Hr
73.
i
J
-i
O
O
o r*r* i^*'» •«* n
>
n€;>C
•w
3
O•*- - J
C..3
na
^^
2
63
U (j r
iWc^-,£t •••..-•• 1
T5 A- *i I A—l«- 5 ^ ••>V, -„ ,.
wt

.9
.5
I •ff
1.0
.8
.7
. .60 /
V/
©
o
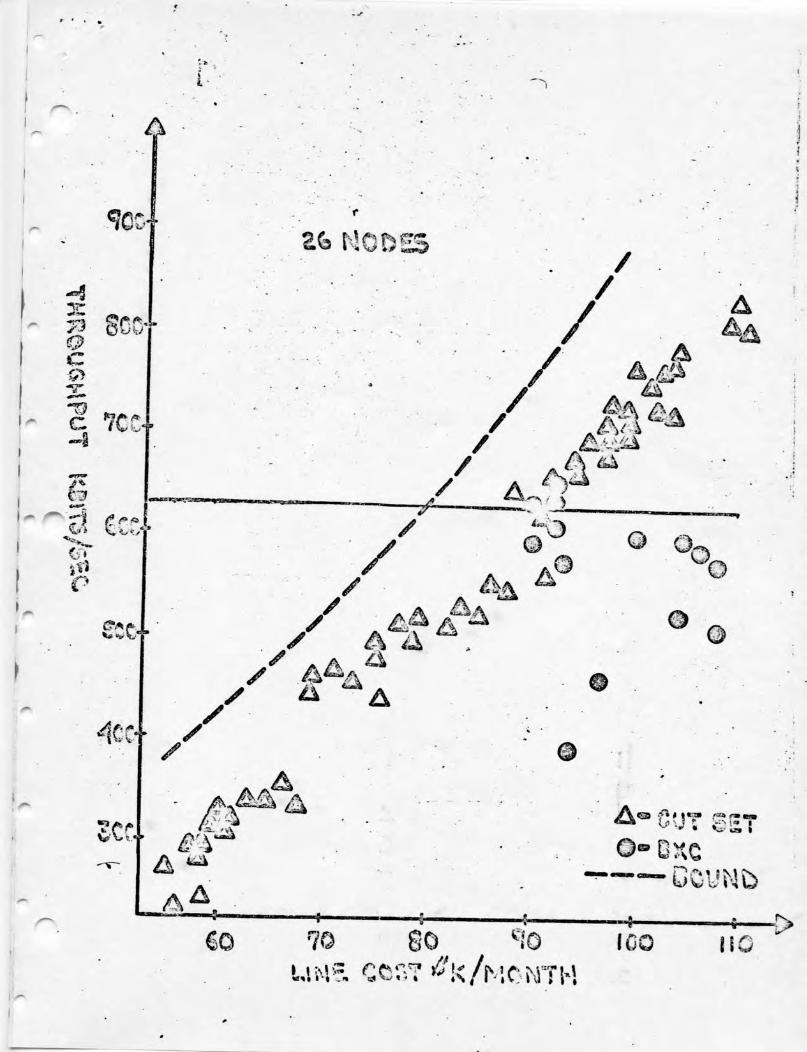
O CBE SOLUTIONS
D BRANCH X-CHANGE SOLUTIONS OBTAINEDBY NAC (SEE FIGS 6.9.1a AND 6 9.1b)
O THE LOWER BOUND CORRESPONDS TOCONTINUOUS.u FITTED SOLUTIONS
50 60 70 80
D[KS/MONTH]90 100 110
Figure 6.6 4b. Thruput p versus Cost D M Some Discrete Solutions Obtained m the Range p * 0.5 1 1.
°
-L809 rs
»fc> O Oi_4—
/
//
f/v- v V
y
S3QON ^2
O -ia.
-09^

Q S
•*» v»
*ai "** "V- '-
*«•
* 4M
^ •.."« i |
^ 11
_(V N ) X
Copyright © 2022 FDOKUMEN

