

Bahasa
Halaman
Hukum


Complex Dynamics of Osteoclast Formation and Death inLong-Term CulturesTimur Akchurin1, Tayeb Aissiou1,2, Naomi Kemeny1, Erin Prosk2¤, Nilima Nigam2, Svetlana V.
Komarova1*
1 Faculty of Dentistry, McGill University, Montreal, Quebec, Canada, 2 Department of Mathematics and Statistics, McGill University, Montreal, Quebec, Canada
Abstract
Background: Osteoclasts, cells responsible for bone resorption, contribute to the development of degenerative, metabolicand neoplastic bone diseases, which are often characterized by persistent changes in bone microenvironment. We aimed toinvestigate the dynamics of osteoclast formation and death in cultures that considerably exceeded the length of standardprotocol and to design a mathematical model describing osteoclastogenesis.
Methodology/Principal Findings: RAW 264.7 monocytic cells fuse to form multinucleated osteoclasts upon treatment withpro-resorptive cytokine RANKL. We have found that in long-term experiments (15–26 days), the dynamics of changes inosteoclast numbers was remarkably complex and qualitatively variable in different experiments. Whereas 19 of 46experiments exhibited single peak of osteoclast formation, in 27 experiments we observed development of successivewaves of osteoclast formation and death. Periodic changes in osteoclast numbers were confirmed in long-term cultures ofmouse bone marrow cells treated with M-CSF and RANKL. Because the dynamics of changes in osteoclast numbers wasfound to be largely independent of monocytes, a two-species model of ordinary differential equations describing thechanges in osteoclasts and monocytes was ineffective in recapitulating the oscillations in osteoclast numbers. Followingexperimental observation that medium collected from mature osteoclasts inhibited osteoclastogenesis in fresh cultures, weintroduced a third variable, factor f, to describe osteoclast-derived inhibitor. This model allowed us to simulate theoscillatory changes in osteoclasts, which were coupled to oscillatory changes in the factor f, whereas monocytes changedexponentially. Importantly, to achieve the experimentally observed oscillations with increasing amplitude, we also had toassume that osteoclast presence stimulates osteoclast formation.
Conclusions/Significance: This study identifies the critical role for osteoclast autocrine regulation in controlling long-termdynamic of osteoclast formation and death and describes the complementary roles for negative and positive feedbackmediators in determining the sharp dynamics of activation and inactivation of osteoclasts.
Citation: Akchurin T, Aissiou T, Kemeny N, Prosk E, Nigam N, et al. (2008) Complex Dynamics of Osteoclast Formation and Death in Long-Term Cultures. PLoSONE 3(5): e2104. doi:10.1371/journal.pone.0002104
Editor: Mark Isalan, Center for Genomic Regulation, Spain
Received February 4, 2008; Accepted March 27, 2008; Published May 7, 2008
Copyright: � 2008 Akchurin et al. This is an open-access article distributed under the terms of the Creative Commons Attribution License, which permitsunrestricted use, distribution, and reproduction in any medium, provided the original author and source are credited.
Funding: This study is supported by operating grants from CIHR/IMHA and NSERC. SVK holds Canada Research Chair in osteoclast biology.
Competing Interests: The authors have declared that no competing interests exist.
* E-mail: [email protected]
¤ Current address: Department of Mathematics, University of British Columbia, Vancouver, British Columbia, Canada
Introduction
Osteoclasts are cells responsible for bone destruction in
metabolic, degenerative and neoplastic bone disorders. Therapeu-
tic compounds aimed at blocking osteoclast formation and
resorptive activity, are widely used for treatment of these diseases.
However, the need in developing new therapeutics is still great as
well as diverse in its goals. First, more potent osteoclast blockers
are needed to treat irreversible severe destruction of mineralized
tissues in rheumatoid arthritis, periodontitis and metastatic bone
disease [1,2]. Second, for treatment of osteoporosis, the com-
pounds that would ‘‘normalize’’ rather than totally block osteoclast
activity are desired [2,3]. Moreover, bone related side effects of
numerous medications, including corticosteroids, immunosuppres-
sants and anticonvulsants [4] provide ongoing need to assess
potential effects of new therapies on bone cells, including
osteoclasts. To assist in drug development and testing, different
types of in vitro osteoclast formation and activity assays are
commonly used for screening pharmacological compounds [5,6].
Osteoclasts are terminally differentiated multinucleated cells of
hematopoetic origin, formed by fusion of osteoclast precursors of
monocyte-macrophage lineage. Cytokines RANKL (receptor
activator of nuclear factor kB ligand) and M-CSF (macrophage
colony-stimulating factor) have been identified as necessary and
sufficient to induce osteoclastogenesis. Murine monocytic cell line,
RAW 264.7, is widely used to study osteoclastogenesis [6–8], since
these cells require only stimulation with RANKL to form
multinucleated cells, whereas bone marrow or peripheral mono-
cytes need to be treated with a combination of M-CSF and
RANKL to achieve osteoclastogenesis. Upon stimulation with
RANKL, monocytes differentiate and fuse forming giant multi-
nucleated osteoclast-like cells, the process that requires 4–5 days to
accomplish. Osteoclasts can be observed in cultures for 2–4 days,
after which they die primarily by apoptosis [9,10]. The efficiency
PLoS ONE | www.plosone.org 1 May 2008 | Volume 3 | Issue 5 | e2104

of osteoclastogenesis in vitro is rather variable, however it rarely
reaches 100%, therefore undifferentiated mononuclear cells can
be readily detected together with mature osteoclasts. In contrast to
terminally differentiated osteoclasts, monocytes are capable of
proliferating in the culture, and they die primarily by apoptosis.
Both monocyte proliferation and death have been previously
reported to be affected by RANKL [11]. Better understanding of
the mechanisms governing the dynamics of changes in osteoclast
and monocyte numbers will improve predictive power of in vitro
assays and will provide new information regarding the regulation
of bone resorption in vivo.
Mathematical methods are now well acknowledged as integral
part of biomedical research, where they are used in data analysis,
predictive modeling and simulation modeling. One particular
aspect of simulation modeling is the potential to create models that
may be employed to perform experiments in silico, thus providing
cost- and animal-saving means for assessing the impact of potential
stimulators and inhibitors on the biological process of interest. In
this regard, a mathematical model accurately describing the
process of osteoclast formation is potentially of significant utility.
We [12,13], and others [14,15] have previously developed
mathematical models of bone turnover, which describe the
dynamics of changes in populations of different bone cells at the
site undergoing bone remodeling. Although useful in their power
to explain and predict different general phenomena, these models
are far removed from routine experimental conditions, resulting in
uncertainty in parameter estimations, and are of little use in
simulating specific in vitro experiments.
The goal of this study was to design a mathematical model
describing temporal changes in monocyte and osteoclast numbers,
and to estimate model parameters based on direct correlations
with the experiments. One of the important questions in the
mathematical modeling is concerned with the steady state of the
system, whereas the majority of experimental data capture only
initial dynamics of the process. In order to obtain more detailed
data on the long-term dynamics of monocytes and osteoclasts, we
performed experiments that considerably exceeded the length of
standard osteoclast cultures. Unexpectedly, we found that
osteoclast numbers change in a manner much more complex
than can be predicted by current knowledge. In particular, in a
large proportion of experiments we observed synchronized waves
of osteoclast formation and death. To account for such behavior,
we introduced feedback controls in our model, and demonstrated
that negative feedback is critical for obtaining oscillatory behavior
in the system, whereas positive feedback is required to achieve
experimentally observed osteoclast oscillations with increasing
amplitude.
Results
Long term dynamics in monocyte-osteoclast culturesTo assess long-term dynamics in osteoclast cultures, we treated
RAW 264.7 with RANKL (Fig. 1) for 15–26 days, which is
significantly longer than the standard protocol of 5–7 day
osteoclast culture. We observed that treatment with RANKL
leads to formation of multinucleated osteoclast-like cells that stain
positive for an osteoclast marker, tartrate-resistant acid phospha-
tase (Fig. 2A). First osteoclasts appeared in culture on day 4–5 after
plating. Osteoclast numbers remained high for 2–3 days and then
started to decline. The decrease in osteoclast numbers was
accompanied by the appearance of multinucleated cells with
distorted morphology, absent nuclei, and unclear cell periphery,
indicating osteoclast death. Osteoclast death, likely by apoptosis,
was confirmed by an increase in the percentage of osteoclasts
exhibiting nuclear fragmentation (Fig 2B). To our surprise, when
we cultured cells for a longer time, we often observed a second
wave of osteoclast formation, when after the temporary decline
osteoclast numbers increased again (Fig 2). In several experiments,
a third wave of osteoclast formation was also evident. Since RAW
264.7 cells are an immortalized cell line, we have also isolated
bone marrow monocytic cells and characterized the dynamics of
changes in osteoclast numbers in long-term primary cultures
treated with RANKL and MCSF. We have found that similarly to
RAW 264.7 cells, persistent stimulation of primary bone marrow
monocytes with MCSF and RANKL leads to periodic changes in
the numbers of osteoclasts (Fig 2C). It is of interest to note that in
many experiments with RAW 264.7 cells, and especially in
primary cultures, we have noticed that the size of osteoclasts tend
to increase in subsequent waves of osteoclastogenesis, compared to
the first wave.
Characterization of long-term dynamics in osteoclastcultures
We next varied initial monocyte plating density and concen-
tration of RANKL in long-term cultures of RAW 264.7 cells. We
found that the long-term dynamics of changes in osteoclast
numbers differed from experiment to experiment. Whereas in
some experiments only single peak of osteoclast formation was
observed, in other experiments clear oscillatory changes in
osteoclast numbers were evident. To analyze the patterns of
osteoclast dynamics, we pooled together 46 experiments that lasted
from 15 to 26 days and were performed with different plating
densities or different RANKL treatment. Since the amplitude of
osteoclast formation was quite variable, for each single experiment
we normalized the osteoclast numbers at different times by a
maximum observed in that experiment, and limited the time
Figure 1. Osteoclasts are formed by fusion of monocyticprecursors. A) Phase contrast micrograph of undifferentiated RAW264.7 cells grown for 5 days without additions. B) Multinucleatedosteoclast-like cells in the culture of RAW 264.7 cells treated for 5 dayswith RANKL (50 ng/ml). C) Schematic presentation of the processesoccurring during osteoclast formation in vitro. Monocytes are depictedto undergo proliferation with the rate Vm
+ and cell death with the rateof Vm
2. Osteoclasts are formed by fusion of monocytes with the rate ofVoc
+. Osteoclast death occur with the rate Voc2.
doi:10.1371/journal.pone.0002104.g001
Osteoclast Oscillations
PLoS ONE | www.plosone.org 2 May 2008 | Volume 3 | Issue 5 | e2104

duration to 17 days since this was the time frame for the majority
of experiments.
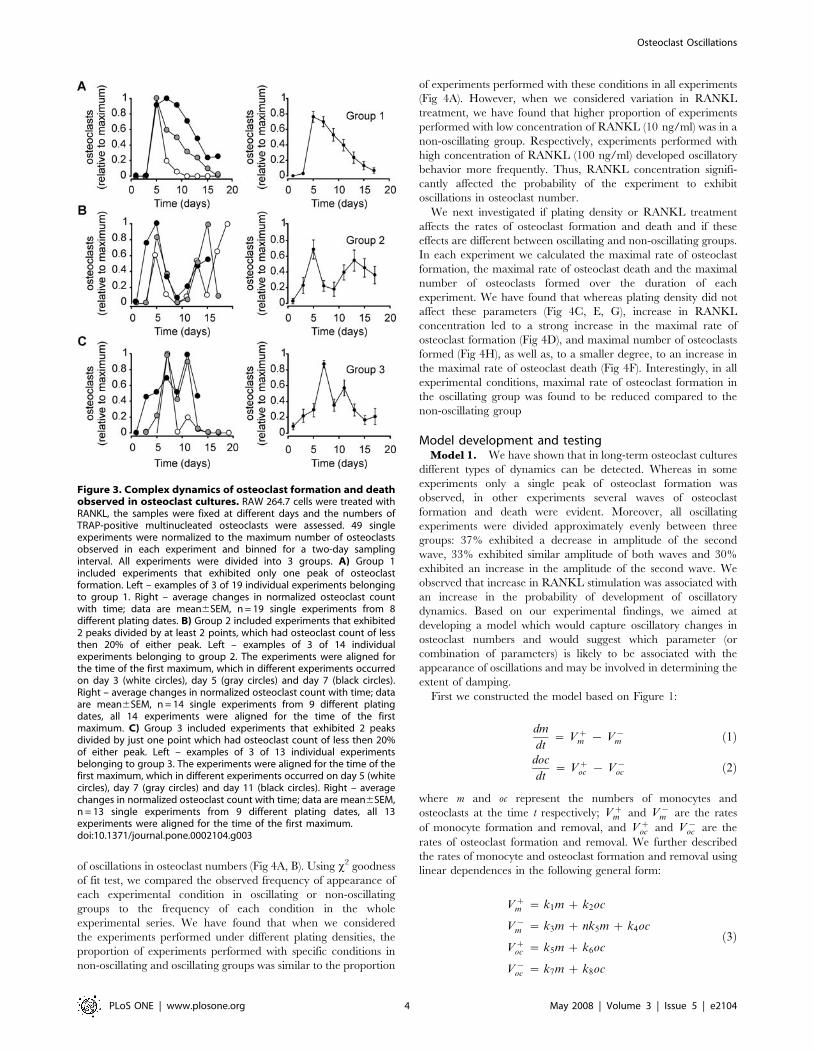
We next divided 46 single experiments into 3 groups depending
on the dynamics observed in each experiment. In group 1, we
combined 19 experiments that exhibited only one peak of
osteoclast formation (Fig. 3A). In group 2, we combined 14
experiments that exhibited 2 peaks divided by at least 2 points,
which had an osteoclast count of less than 20% of either peak
(Fig. 3B). In group 3, we combined 13 experiments that exhibited
2 peaks divided by just one point, which had an osteoclast count of
less than 20% of either peak (Fig. 3C). In groups 2 and 3 the peaks
in different experiments often did not coincide in time, resulting in
significant smoothing when average osteoclast count in these
groups was assessed. However, when we aligned the time of the
first maximum in all the experiments in groups 2 and 3, we have
found that the average osteoclast count captures the oscillatory
changes observed in individual experiments (Fig 3B, C right),
suggesting that in contrast to the initial dynamics of osteoclast
formation, which may depend on specific experimental conditions,
later dynamics of osteoclast changes are likely governed by the
same intrinsic mechanism. For further analysis we combined
experiments in group 2 and 3 as a single oscillating group. From
27 experiments in oscillating group, in 10 the amplitude of the
second peak was less than 50% of the first peak, in 9 experiments
the amplitude of the second peak was more than 50% but less than
150% of the first peak, and in 8 experiments the amplitude of the
second peak was more than 150% of the first peak.
The effect of initial conditions and RANKL treatment onlong-term osteoclast dynamics
We next assessed the effects of the plating density and RANKL
treatment on the long-term osteoclast dynamics in non-oscillating
and oscillating groups. We first examined if plating density or
RANKL concentration affects the probability of the development
Figure 2. Synchronized waves of osteoclast formation and death observed in long-term cultures. A, B) RAW 264.7 cells were treatedwith RANKL 50 ng/ml during 15 days. Samples were fixed, and either stained for TRAP to assess the numbers of TRAP-positive multinucleatedosteoclasts, or stained with DAPI to assess nuclear morphology. A) Micrographs of TRAP-stained samples taken at indicated days. Calibration barapplies to all images. B) Black circles: changes in osteoclast numbers during 15 days of culture; open circles: percentage of osteoclasts exhibitingnuclear fragmentation (apoptotic cells), normalized to the total number of osteoclasts. C) Mouse bone marrow cells were treated with MCSF (20 mg/ml) and RANKL (50 ng/ml) during 15 days. Samples were fixed, stained for TRAP, and numbers of TRAP-positive multinucleated osteoclasts werecounted. Arrow indicates days when RANKL was added.doi:10.1371/journal.pone.0002104.g002
Osteoclast Oscillations
PLoS ONE | www.plosone.org 3 May 2008 | Volume 3 | Issue 5 | e2104
of oscillations in osteoclast numbers (Fig 4A, B). Using x2 goodness
of fit test, we compared the observed frequency of appearance of
each experimental condition in oscillating or non-oscillating
groups to the frequency of each condition in the whole
experimental series. We have found that when we considered
the experiments performed under different plating densities, the
proportion of experiments performed with specific conditions in
non-oscillating and oscillating groups was similar to the proportion
of experiments performed with these conditions in all experiments
(Fig 4A). However, when we considered variation in RANKL
treatment, we have found that higher proportion of experiments
performed with low concentration of RANKL (10 ng/ml) was in a
non-oscillating group. Respectively, experiments performed with
high concentration of RANKL (100 ng/ml) developed oscillatory
behavior more frequently. Thus, RANKL concentration signifi-
cantly affected the probability of the experiment to exhibit
oscillations in osteoclast number.
We next investigated if plating density or RANKL treatment
affects the rates of osteoclast formation and death and if these
effects are different between oscillating and non-oscillating groups.
In each experiment we calculated the maximal rate of osteoclast
formation, the maximal rate of osteoclast death and the maximal
number of osteoclasts formed over the duration of each
experiment. We have found that whereas plating density did not
affect these parameters (Fig 4C, E, G), increase in RANKL
concentration led to a strong increase in the maximal rate of
osteoclast formation (Fig 4D), and maximal number of osteoclasts
formed (Fig 4H), as well as, to a smaller degree, to an increase in
the maximal rate of osteoclast death (Fig 4F). Interestingly, in all
experimental conditions, maximal rate of osteoclast formation in
the oscillating group was found to be reduced compared to the
non-oscillating group
Model development and testingModel 1. We have shown that in long-term osteoclast cultures
different types of dynamics can be detected. Whereas in some
experiments only a single peak of osteoclast formation was
observed, in other experiments several waves of osteoclast
formation and death were evident. Moreover, all oscillating
experiments were divided approximately evenly between three
groups: 37% exhibited a decrease in amplitude of the second
wave, 33% exhibited similar amplitude of both waves and 30%
exhibited an increase in the amplitude of the second wave. We
observed that increase in RANKL stimulation was associated with
an increase in the probability of development of oscillatory
dynamics. Based on our experimental findings, we aimed at
developing a model which would capture oscillatory changes in
osteoclast numbers and would suggest which parameter (or
combination of parameters) is likely to be associated with the
appearance of oscillations and may be involved in determining the
extent of damping.
First we constructed the model based on Figure 1:
dm
dt~ Vz
m { V{m ð1Þ
doc
dt~ Vz
oc { V{oc ð2Þ
where m and oc represent the numbers of monocytes and
osteoclasts at the time t respectively; Vzm and V{
m are the rates
of monocyte formation and removal, and Vzoc and V{
oc are the
rates of osteoclast formation and removal. We further described
the rates of monocyte and osteoclast formation and removal using
linear dependences in the following general form:
Vzm ~ k1m z k2oc
V{m ~ k3m z nk5m z k4oc
Vzoc ~ k5m z k6oc
V{oc ~ k7m z k8oc
ð3Þ
Figure 3. Complex dynamics of osteoclast formation and deathobserved in osteoclast cultures. RAW 264.7 cells were treated withRANKL, the samples were fixed at different days and the numbers ofTRAP-positive multinucleated osteoclasts were assessed. 49 singleexperiments were normalized to the maximum number of osteoclastsobserved in each experiment and binned for a two-day samplinginterval. All experiments were divided into 3 groups. A) Group 1included experiments that exhibited only one peak of osteoclastformation. Left – examples of 3 of 19 individual experiments belongingto group 1. Right – average changes in normalized osteoclast countwith time; data are mean6SEM, n = 19 single experiments from 8different plating dates. B) Group 2 included experiments that exhibited2 peaks divided by at least 2 points, which had osteoclast count of lessthen 20% of either peak. Left – examples of 3 of 14 individualexperiments belonging to group 2. The experiments were aligned forthe time of the first maximum, which in different experiments occurredon day 3 (white circles), day 5 (gray circles) and day 7 (black circles).Right – average changes in normalized osteoclast count with time; dataare mean6SEM, n = 14 single experiments from 9 different platingdates, all 14 experiments were aligned for the time of the firstmaximum. C) Group 3 included experiments that exhibited 2 peaksdivided by just one point which had osteoclast count of less then 20%of either peak. Left – examples of 3 of 13 individual experimentsbelonging to group 3. The experiments were aligned for the time of thefirst maximum, which in different experiments occurred on day 5 (whitecircles), day 7 (gray circles) and day 11 (black circles). Right – averagechanges in normalized osteoclast count with time; data are mean6SEM,n = 13 single experiments from 9 different plating dates, all 13experiments were aligned for the time of the first maximum.doi:10.1371/journal.pone.0002104.g003
Osteoclast Oscillations
PLoS ONE | www.plosone.org 4 May 2008 | Volume 3 | Issue 5 | e2104

where k1m is the rate of monocyte proliferation, proportional to the
current number of monocytes, k1.0; k2oc is a potential effect of
osteoclasts on monocyte formation; k3m is the rate of monocyte
death, k3.0; k4oc is a potential effect of osteoclasts on monocyte
removal; k5m is the rate of osteoclast formation from monocytes, n
is used to account for fusion, which takes more than one monocyte
to form one osteoclast, k5.0; k6oc is a potential effect of osteoclasts
on osteoclast formation; k7m is a potential effect of monocytes on
osteoclast death; and k8oc is the rate of osteoclast death, k8.0.
To estimate k1 and k2, we plated monocytes at different cell
densities, and either treated them with RANKL, or cultured
untreated for 4 days, while taking a daily sample to estimate the
monocyte number in the cultures (Fig. 5A). In these experiments
monocyte numbers reached a plateau at the density of
,56105 cells/cm2, likely representing the capacity of the dish,
when at higher densities some cells lost attachment and were
unintentionally removed while changing media. We have found
that either in the absence or presence of RANKL (and
consequently osteoclasts, which appear on day 3–4), the monocyte
numbers change exponentially, with a similar time constant. Thus,
we estimated k1 as a slope of the lnm(t) dependence (Fig. 5B) as
k1>1.2 day21, and k2 as negligible, k2 = 0. We also investigated if
the responsiveness of monocytes to RANKL may change during
osteoclast culture; however we have found that the monocytic cells
taken at different time from cultures containing osteoclasts are able
to form osteoclasts with similar efficiency (Fig. 5C).
To assess k3 and k4, we estimated the percentage of dead
monocytes as a proportion of total number of monocytes in
untreated cultures or cultures treated with RANKL (Fig. 5D). We
have found that the rate of monocyte death plateaued at ,10% of
total number of monocytes. We observed some trend for
temporary increase in monocyte death in the presence of RANKL,
although the difference was within experimental error. We
estimated k3>0.1 day21. We could not immediately estimate or
discard k4 on the basis of experimental data, only evaluated it as
likely positive.
We next estimated k5, n and k6. Based on the data we obtained
in experiments with varied monocyte plating densities, the rate of
osteoclast formation does not depend on the number of monocytes
in the range of monocyte plating densities of 2.5–106103 cells/
cm2 (Fig. 4C). When we have varied the plating densities from 250
to 15000 cells/cm2, we have found that the dependence is bell-
shaped: at very low plating densities the number of osteoclasts
formed are directly proportional to the plated monocyte number,
whereas very high monocyte concentration becomes inhibitory for
osteoclast formation (Fig. 5E). These data are in good agreement
with the dependence of the rate of osteoclast formation on the
number of monocytes reported previously [17]. We described the
rate of osteoclast formation in the following form:k5m
500 z mð Þ | 1500015000 z mð Þ, which in the range of m,500 is approx-
imated as k5m500 z mð Þ, at the range of 500,m,15000 is approximat-
ed as k5, and in the range of m.15000 is approximated as15000
15000 z mð Þ. We estimated k5 to vary from 20 to 500 cells/day
depending on RANKL treatment. The factor n relates to the
monocyte fusion, which results in the removal of several
Figure 4. Comparison of non-oscillating and oscillating groups.The experiments were divided into non-oscillating group, whichcontained 19 experiments and oscillating group, which contained 27experiments (combined groups 2 and 3). Within each group,experiments were divided according to the experimental conditions(plating density and RANKL treatment), and the following parameterswere assessed: A, B) We compared the ratio of the proportion ofexperiments performed with specific conditions in non-oscillating(white bars, Group 1) and oscillating (black bars, Group 2+3) groupsto the proportion of experiments performed with that condition in allexperiments. A) Plating densities did not affect long-term dynamics ofosteoclast cultures. B) RANKL concentration significantly affected theprobability of experiment to belong to oscillating group. P,0.05,assessed by x2 goodness of fit test. C, D) Maximal rate of osteoclastformation was estimated in each experiment and plotted as a functionof plating density (C) or RANKL concentration (D). E, F) Maximal rate ofosteoclast death was estimated in each experiment and plotted as afunction of plating density (E) or RANKL concentration (F). G, H)Maximal number of osteoclast formed in each experiment and plotted
as a function of plating density (G) or RANKL concentration (H). C–H)Data are mean6SEM, number of independent experiments are: RANKL(R) 50 ng/ml, plating density (p.d.) 56103 cells/cm2: n = 7 (group 1),n = 9 (group 2+3); R 50 ng/ml, p. d. 2.56103 cells/cm2: n = 4 (group 1),n = 6 (group 2+3); R 50 ng/ml, p. d. 106103 cells/cm2: n = 3 (group 1),n = 5 (group 2+3); R 10 ng/ml, p. d. 56103 cells/cm2: n = 3 (group 1),n = 2 (group 2+3); R 100 ng/ml, p. d. 56103 cells/cm2: n = 2 (group 1),n = 5 (group 2+3).doi:10.1371/journal.pone.0002104.g004
Osteoclast Oscillations
PLoS ONE | www.plosone.org 5 May 2008 | Volume 3 | Issue 5 | e2104
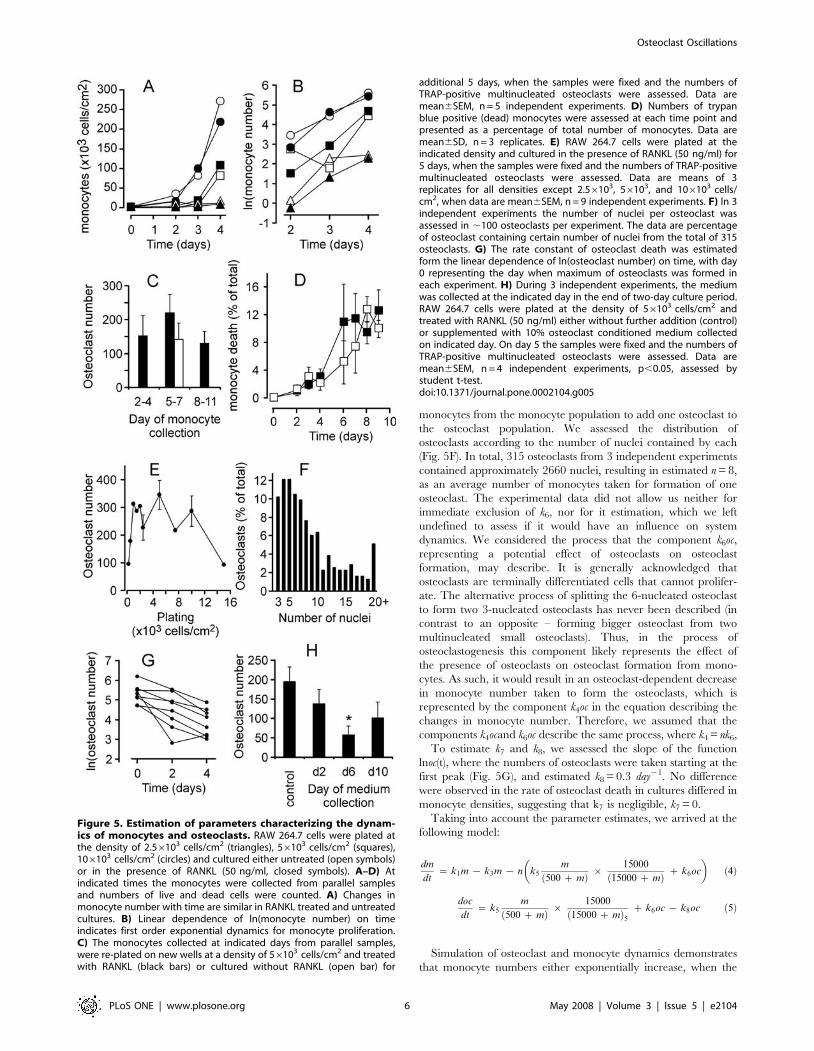
monocytes from the monocyte population to add one osteoclast to
the osteoclast population. We assessed the distribution of
osteoclasts according to the number of nuclei contained by each
(Fig. 5F). In total, 315 osteoclasts from 3 independent experiments
contained approximately 2660 nuclei, resulting in estimated n = 8,
as an average number of monocytes taken for formation of one
osteoclast. The experimental data did not allow us neither for
immediate exclusion of k6, nor for it estimation, which we left
undefined to assess if it would have an influence on system
dynamics. We considered the process that the component k6oc,
representing a potential effect of osteoclasts on osteoclast
formation, may describe. It is generally acknowledged that
osteoclasts are terminally differentiated cells that cannot prolifer-
ate. The alternative process of splitting the 6-nucleated osteoclast
to form two 3-nucleated osteoclasts has never been described (in
contrast to an opposite – forming bigger osteoclast from two
multinucleated small osteoclasts). Thus, in the process of
osteoclastogenesis this component likely represents the effect of
the presence of osteoclasts on osteoclast formation from mono-
cytes. As such, it would result in an osteoclast-dependent decrease
in monocyte number taken to form the osteoclasts, which is
represented by the component k4oc in the equation describing the
changes in monocyte number. Therefore, we assumed that the
components k4ocand k6oc describe the same process, where k4 = nk6,
To estimate k7 and k8, we assessed the slope of the function
lnoc(t), where the numbers of osteoclasts were taken starting at the
first peak (Fig. 5G), and estimated k8 = 0.3 day21. No difference
were observed in the rate of osteoclast death in cultures differed in
monocyte densities, suggesting that k7 is negligible, k7 = 0.
Taking into account the parameter estimates, we arrived at the
following model:
dm
dt~ k1m { k3m { n k5
m
500 z mð Þ |15000
15000 z mð Þ z k6oc
� �ð4Þ
doc
dt~ k5
m
500 z mð Þ |15000
15000 z mð Þ5z k6oc { k8oc ð5Þ
Simulation of osteoclast and monocyte dynamics demonstrates
that monocyte numbers either exponentially increase, when the
Figure 5. Estimation of parameters characterizing the dynam-ics of monocytes and osteoclasts. RAW 264.7 cells were plated atthe density of 2.56103 cells/cm2 (triangles), 56103 cells/cm2 (squares),106103 cells/cm2 (circles) and cultured either untreated (open symbols)or in the presence of RANKL (50 ng/ml, closed symbols). A–D) Atindicated times the monocytes were collected from parallel samplesand numbers of live and dead cells were counted. A) Changes inmonocyte number with time are similar in RANKL treated and untreatedcultures. B) Linear dependence of ln(monocyte number) on timeindicates first order exponential dynamics for monocyte proliferation.C) The monocytes collected at indicated days from parallel samples,were re-plated on new wells at a density of 56103 cells/cm2 and treatedwith RANKL (black bars) or cultured without RANKL (open bar) for
additional 5 days, when the samples were fixed and the numbers ofTRAP-positive multinucleated osteoclasts were assessed. Data aremean6SEM, n = 5 independent experiments. D) Numbers of trypanblue positive (dead) monocytes were assessed at each time point andpresented as a percentage of total number of monocytes. Data aremean6SD, n = 3 replicates. E) RAW 264.7 cells were plated at theindicated density and cultured in the presence of RANKL (50 ng/ml) for5 days, when the samples were fixed and the numbers of TRAP-positivemultinucleated osteoclasts were assessed. Data are means of 3replicates for all densities except 2.56103, 56103, and 106103 cells/cm2, when data are mean6SEM, n = 9 independent experiments. F) In 3independent experiments the number of nuclei per osteoclast wasassessed in ,100 osteoclasts per experiment. The data are percentageof osteoclast containing certain number of nuclei from the total of 315osteoclasts. G) The rate constant of osteoclast death was estimatedform the linear dependence of ln(osteoclast number) on time, with day0 representing the day when maximum of osteoclasts was formed ineach experiment. H) During 3 independent experiments, the mediumwas collected at the indicated day in the end of two-day culture period.RAW 264.7 cells were plated at the density of 56103 cells/cm2 andtreated with RANKL (50 ng/ml) either without further addition (control)or supplemented with 10% osteoclast conditioned medium collectedon indicated day. On day 5 the samples were fixed and the numbers ofTRAP-positive multinucleated osteoclasts were assessed. Data aremean6SEM, n = 4 independent experiments, p,0.05, assessed bystudent t-test.doi:10.1371/journal.pone.0002104.g005
Osteoclast Oscillations
PLoS ONE | www.plosone.org 6 May 2008 | Volume 3 | Issue 5 | e2104

rate of monocyte proliferation is higher than the rate of osteoclast
formation, or decrease to 0, when the rate of osteoclast formation
is higher then the rate of monocyte proliferation (Fig. 6A). In
contrast, in both situations osteoclasts change in a similar way, first
increasing in numbers and later decreasing to 0 either due to
inhibition by high number of monocytes, or due to lack of
monocytes to produce osteoclasts (Fig. 6B). In the range of
monocyte values 500,m,1500, the system is approximated by
the linear model:
dm
dt~ k1m { k3m z nk5 z nk6ocð Þ ð6Þ
doc
dt~ k5 z k6oc { k8oc ð7Þ
or presented in a matrix form:
m
oc
� �.
~k1 { k3 {nk6
0 k6 { k8
� �|
m
oc
� �z
{nk5
k5
� �ð8Þ
The eigenvalues of this matrix are l1 = k1–k3 and l2 = k6–k8, real
values at any value of ki, demonstrating that no oscillations can be
achieved in this model.
Model 2. To assess the possibility that a factor produced
during osteoclast culture may have an effect on osteoclast
formation, we collected the medium at different times of
osteoclast culture, then added this medium (10% of fresh
medium) to the freshly seeded monocytes and induced
osteoclastogenesis with RANKL (50 ng/ml). We have found that
medium collected at day 6, when many mature osteoclasts are
present had significant inhibitory effect on osteoclast formation
(Fig. 5H). Thus, we introduced a third variable to the model,
which describes the action of a negative regulator of
osteoclastogenesis, factor f that is produced by osteoclasts, and
removed proportionally to its value. The dynamics of the system
are now described by the following model:
dm
dt~ k1 { k3ð Þm { n k5
m
500 z mð Þ |15000
15000 z mð Þ z k6oc
� �ð9Þ
doc
dt~ k5
m
500 z mð Þ |15000
15000 z mð Þ5z k6oc { k8oc { k9f ð10Þ
df
dt~ k10oc { k11f ð11Þ
In the range of monocyte values 500,m,15000 the model can be
approximated by the linear model:
dm
dt~ k1 { k3ð Þm { nk6oc { nk5 ð12Þ
doc
dt~ k5 z k6 { k8ð Þoc { k9f ð13Þ
df
dt~ k10oc { k11f ð14Þ
or presented in a matrix form:
m
oc
f
0B@
1CA
.
~
k1 { k3 {nk6 0
0 k6 { k8 {k9
0 k10 {k11
0B@
1CA |
m
oc
f
0B@
1CAz
{nk5
k5
0
0B@
1CA ð15Þ
The eigenvalues of this matrix are
l1 ~ k1 { k3 ð16Þ
l2,3 ~k6 { k8 { k11 +
ffiffiffiffiffiffiffiffiffiffiffiffiffiffiffiffiffiffiffiffiffiffiffiffiffiffiffiffiffiffiffiffiffiffiffiffiffiffiffiffiffiffiffiffiffiffiffiffiffiffiffiffiffiffiffiffiffik6 { k8 { k11ð Þ2 { 4k9k10
q2
ð17Þ
where l1 characterizes the exponential dynamics of monocytes,
and l2,3 characterize the coupled dynamics of osteoclasts and
factor f. The development of oscillations in the model is
determined by the determinant of equation (17), with oscillation
present when (k6–k8–k11)224k9k10,0 (Fig. 6C, D). The 3-
dimensional parametric portrait of the system demonstrating the
plane separating the regions of non-oscillatory and oscillatory
behavior in the space of parameters k6–k8, k11 and k9k10 is
presented on the Fig. 7A. When (k6–k8–k11)224k9k10,0, the type
of the oscillations – damped, sustained or with increasing
amplitude – is determined by the sign of k6–k8–k11. The
oscillations are damped if k6–k8–k11,0, and develop with
increasing amplitude if k6–k8–k11.0. In this model, parameter
Figure 6. Dynamics of changes in monocyte and osteoclastnumbers predicted by the mathematical model. A, B) Simulationof changes in monocyte number (A) and osteoclast number (B)obtained using the two-species model described by the equations (4–5), with the following parameters: k1 = 0.2; 0.4; 0.6; 0.8; 1; 1.2; k3 = 0.1;k5 = 300; k6 = 0; k8 = 0.3; n = 8. C, D) Simulation of changes in monocytenumber (C) and osteoclast number (D) obtained using the three-species model described by the equations (7–9), with the followingparameters: k1 = 1; k3 = 0.1; k5 = 300; k6 = 0.5; k8 = 0.3; k9 = 1; k10 = 1;k11 = 0.5; n = 8doi:10.1371/journal.pone.0002104.g006
Osteoclast Oscillations
PLoS ONE | www.plosone.org 7 May 2008 | Volume 3 | Issue 5 | e2104

k6, representing a positive effect of osteoclasts on the rate of
osteoclast formation is essential in order to obtain oscillations with
increasing amplitude (Fig. 7B), since both k8 and k11 are positive
rate constants of removal of osteoclasts and factor f respectively. It
is of interest to note that while an increase in k6 led to development
of the oscillations with increasing amplitude, it also resulted in the
increase in amplitude of the first peak. In contrast, in our
experiments we had observed that when oscillations with
increasing amplitude developed, the first peak was generally
lower than in experiments without oscillations or with damped
oscillations. To simulate these experiments, we had to
simultaneously increase k6 and decrease k5 (Fig. 7C), suggesting
that k6 and k5 are not independent parameters, but likely part of
the same circuit designed to obtain robust osteoclastogenesis.
Another interesting feature of these simulations is that the period
of oscillations increases when the type of oscillations changes from
damped, to sustained, to unstable. We reviewed our experimental
data and confirmed that a similar trend is observed experimentally
(Fig 7D).
Discussion
In this study we endeavored to develop a mathematical model
describing the process of osteoclastogenesis in vitro. We have
found that in the system containing only two cell types, monocytes
and osteoclasts that are formed by fusion from monocytes, the
dynamics of changes in osteoclast numbers in long-term (15–26
days) cultures were remarkably complex and qualitatively variable
in different experiments. The spectrum of observed behavior was
consistent with the change in the nature of the steady state of the
system in different experiments, between stable nodes, and stable
and unstable foci. Since long-term dynamics in osteoclast cultures
were found to be largely independent of monocytes, a two-species
linear ODE model describing the changes in osteoclasts and
monocytes was ineffective in recapitulating the oscillatory behavior
of osteoclast numbers. We observed that medium collected from
mature osteoclasts exhibited an inhibitory effect on the osteoclas-
togenesis in fresh cultures; therefore we introduced a third
variable, describing the changes in osteoclast-derived factor f,
which has inhibitory effects on osteoclasts. This model allowed us
to simulate the oscillatory behavior in osteoclasts, which was
coupled to oscillatory changes in the factor f, whereas monocytes
changed monotonically in an exponential manner. In addition, the
positive effect of osteoclasts on their formation was critical in order
to recapitulate the experimentally observed oscillations with
increasing amplitude. Thus, we have found that two critical
assumptions are needed in order to reproduce experimental
behavior in our model: 1) there is a factor that is produced by
osteoclasts and has an inhibitory effect on osteoclast formation and
2) osteoclast presence has a positive effect on osteoclast formation.
An important question to ask is what could be the nature of
these regulatory feedbacks. RANKL and OPG, produced by
osteoblasts, are widely believed to be the most important
regulators of osteoclastogenesis [18,19]. While not in any way
diminishing the importance of the RANKL pathway, our study
demonstrates that the long-term dynamics of osteoclast changes
predominantly depend on autocrine signaling by osteoclasts. In
this regard, the studies specifically aimed at uncovering autocrine
Figure 7. Positive feedback on osteoclast formation is criticalfor obtaining oscillations with increasing amplitude. A)Parametric portrait of the system in the space of parameters k9k10;k6–k8; k11. Bifurcation surface (A), described by equation (k6–k8–k11)224k9k10 = 0, separates the regions of non-oscillatory (below thesurface), and oscillatory (above the surface) behavior. Bifurcationsurface (B), described by equation k6–k8–k11 = 0, separates the regionsof exponential growing and decaying behavior for osteoclasts andfactor f. B) Increase in the value of parameter k6 results in developmentof oscillations of osteoclast numbers with increasing amplitude. C)Simultaneously increasing the value of parameter k6 and decreasing thevalue of parameter k5 allows simulation of experimental observationthat the first peak is generally lower in experiments where osteoclastsoscillate with increasing amplitude compared to experiments withoutoscillations or with damped oscillations of osteoclasts. D) The 27experiments where oscillations were observed were classified asdamped oscillations, if the amplitude of the second peak was lessthen 50% of the first peak (n = 10), sustained oscillations, if the
amplitude of the second peak was more than 50% but less then 150%of the first peak (n = 9), or unstable oscillations if the amplitude of thesecond peak was more then 150% of the first peak (n = 8), and thedistance between 2 maximums was identified. Data are mean6SEM.doi:10.1371/journal.pone.0002104.g007
Osteoclast Oscillations
PLoS ONE | www.plosone.org 8 May 2008 | Volume 3 | Issue 5 | e2104
regulators of osteoclastogenesis [20,21] have found several positive
and negative regulators of osteoclast formation. Among the
positive regulators were interleukin 6 [21,22], calcium-dependent
phospholipid-binding protein annexin-II [20,21,23], and Adam8,
transmembrane disintegrin and metalloproteinase implicated in
cell-cell interactions by acting through integrin a9b1 [24,25]. In
addition, TGFb, produced by osteoclasts as well as liberated from
bone during resorption, has been shown to directly stimulate
osteoclast formation at low concentrations [26]. Negative auto-
crine regulators of osteoclast formation include interferon b, which
is induced in osteoclast precursors by RANKL and was shown to
suppress excessive osteoclastogenesis [27,28], nitric oxide, also
induced by RANKL [29], as well as osteoclast inhibitory peptides I
and II [21,24,30]. Our study suggests that both positive and
negative autocrine feedbacks are concurrently involved in
regulation of osteoclastogenesis. Whereas negative feedback is
carried out by the soluble factors produced by mature osteoclasts,
the positive feedback is of more complex nature, likely represent-
ing the ability of mature osteoclast to stimulate differentiation and
fusion of osteoclast precursors by direct cell-cell interaction.
Membrane bound factors, such as annexin-II, and ADAM-8, fit
the profile of the positive osteoclast regulator suggested by the
mathematical model. Another important suggestion of the model
is that positive feedback becomes evident only when osteoclasto-
genesis is sub-optimal, suggesting that experimentally it will be
observed only in situations when RANKL stimulation induces
insufficient response from osteoclast precursors. Thus, during
osteoclast differentiation, the positive feedback assures the robust
increase in osteoclastogenesis upon stimulation, whereas negative
feedback limits the effect of the stimulus, together resulting in
sharp dynamics of activation and inactivation of osteoclasts.
There are several physiological and pathological situations,
where periodic activation of osteoclasts has been detected. The
most prominent example is Paget’s disease of bone, which is
characterized by periodic local osteolysis followed each time by
bone formation by osteoblasts [31]. Interestingly, each subsequent
cycle is characterized by higher extent of bone resorption and
bone formation, thus resembling the oscillations with increasing
amplitude. The underlying pathology of Paget’s disease of bone is
believed to be associated with defect in the cells of osteoclast
lineage [31]. Another example is osteoclast recruitment during
physiological tooth eruption. During the eruption of rat first
mandibular molar, a first wave of osteoclast formation occurs at
day 3 postnatally [32,33]. Interestingly, a second wave of smaller
amplitude occurs at day 10 [33,34], and finally tooth erupts on day
18. Whereas a first wave of osteoclastogenesis was shown to
depend on factors produced by the dental follicle, such as MCSF
and RANKL, the stimulation underlying the second wave is
currently unresolved. Notably, the timing between two waves of
osteoclast formation during tooth eruption is similar to that
observed in our experiments, suggesting that potential stimulus for
the second wave of osteoclast formation may be intrinsic to
osteoclasts, rather than dependent on external factors. It is also
known that intracellular calcium oscillations play important roles
in mediating osteoclast responses to RANKL [35], and in
osteoclast movement and spreading [36]. However the time scale
of oscillation of intracellular calcium or calcium-dependent
currents is in the order of seconds to minutes, whereas oscillations
in osteoclast numbers occur with the periodicity in the order of
days, suggesting that the association between the two phenomena
is unlikely.
Osteoclasts are cells of hematopoetic origin. It is of interest to
mention that several hematopoetic disorders associated with
oscillations in cell numbers are known. Chronic eosinophilic
leukemia results in oscillations in white blood cells, platelets, and
bone marrow cellularity with a period of 60 days [37]. Cyclic
thrombocytopenia is a rare syndrome characterized by oscillations
in the blood platelet numbers with a period of 28–57 day,
sometimes associated with oscillations of other hematopoetic cells,
such as reticulocytes and neutrophils [38,39]. Cyclic neutropenia is
characterized by oscillations in circulating neutrophil numbers
which are often accompanied by oscillations in the platelets and
reticulocytes [40,41]. Such disorders appear to be inherent for the
hematopoetic cells, which are characterized by the ability to
rapidly respond to demands by changing their numbers, and are
lacking cell-cell contact and therefore relying on potent soluble
mediators to provide positive and negative feedback regulation.
This study identifies osteoclasts as rightful members of this cell
lineage and suggests that autocrine factors regulating osteoclast
formation are critical for bone physiology and pathology.
Overall, our study provides new information about the process
of osteoclastogenesis by taking into account long-term dynamics of
osteoclast changes. It constitutes the first step towards the
development of a mathematical model suitable for in silico
experimentation and highlights the difficulties in creating such
models in a biologically accurate manner. In times of wide
prevalence of large scale modeling [42], our study provides a word
of caution for developing and interpretation of these models and
calls for better understanding of dynamic regulation of elementary
processes.
Materials and Methods
RAW 264.7 cellsThe RAW 264.7 mouse monocytic cells (American Type
Culture Collection) were cultured in DMEM with 1.5 g/L sodium
bicarbonate, 4.5 g/L glucose, with glutamine (Wisent Inc. Cat No
319-020-CL), supplemented with 1% sodium pyruvate (Wisent
Inc. Cat No 600-110-EL), 1% antibiotics (10,000 IU penicillin,
10,000 mg/ml streptomycin, Wisent Inc. Cat No 450-201-EL) and
10% fetal bovine serum (Hyclone, SH 30396-03). For osteoclast
formation, RAW 264.7 cells were plated on coverslips at a density
of 2.56103, 56103, or 106103 cells/cm2 (as indicated), and 24 h
later (day 1) supplemented with RANKL (10, 50 or 100 ng/ml, as
indicated). Cultures were maintained for 15–26 days, supplement-
ed with fresh medium every other day. Samples (1–3 coverslips per
time point) were taken either every day or every 2 days and fixed
in 4% paraformaldehyde. Osteoclasts were identified as multinu-
cleated (more than 3 nuclei) cells that stained positive for tartrate-
resistant acid phosphatase (TRAP) (Sigma, Cat No 387A). To
examine monocytes, osteoclast cultures were treated with
CellStripper (Mediatech Inc. Cat No 25-056-CI) for 5–10 min,
the cell suspension was gently mixed and collected into eppendorf
tubes and the monocyte number was counted using hemocytom-
eter, with dead cells identified using the trypan blue exclusion test.
For re-plating, monocytes were centrifuged, resuspended in fresh
medium, plated at the density 56103 cells/cm2 and treated with
RANKL (50 ng/ml) for 5 days.
Bone marrow culturesTo assess osteoclast formation in primary cultures, mouse bone
marrow cells were isolated from the long bones of six weeks old
C57BL/6J mice as described previously [16]. The procedures
were approved by the McGill University Animal Care Committee
according to guidelines established by the Canadian Council on
Animal Care. Mouse bone marrow cells were collected from the
femur and tibia, seeded on glass coverslips at 56103 cells/cm2 and
cultured in DMEM supplemented with 1% sodium pyruvate, 1%
Osteoclast Oscillations
PLoS ONE | www.plosone.org 9 May 2008 | Volume 3 | Issue 5 | e2104
L-glutamine, 10% fetal bovine serum, and 1% antibiotics
(10,000 IU penicillin, 10,000 mg/ml streptomycin). Mouse bone
marrow cultures were treated with MCSF (20 mg/ml) and
RANKL (50 ng/ml) for 15–44 days, and supplemented with fresh
medium every other day. The samples were taken every 2 days,
fixed in 4% paraformaldehyde and osteoclasts were identified as
multinucleated (more than 3 nuclei), TRAP-positive cells.
Osteoclast deathAs a measure of cell death, nuclear fragmentation was examined
in osteoclasts differentiated from RAW 264.7 cells using the
nuclear stain 49,6-diamidino-2-phenylindole (DAPI, Invitrogen).
Fixed cells were washed in phosphate buffered saline (PBS),
permeablilized with 0.1% Triton –X100 for 10 min, washed in
PBS, stained for 30 min for F-actin with Bodipy 558/568
phalloidin (Invitrogen) to visualize cell border, washed in PBS
and counterstained for 5 min with DAPI. 10–15 random images
per time point were acquired using inverted fluorescence
microscope (Nikon) and the Volocity software (ImprovisionH,
UK). For each time point the total number of osteoclasts and the
number of osteoclasts exhibiting nuclear fragmentation were
assessed.
Statistical AnalysesIndependent experiments were defined as experiments per-
formed at different plating dates, thus starting from different
passages of Raw 264.7 cells. Single experiments were performed
with particular conditions, such as specific plating density and
specific RANKL treatment. Within most independent experiments
we varied either plating density or RANKL concentration;
therefore several single experiments belonged to one independent
experiment. Data are presented as traces of single experiments or
as a mean6standard error of the mean, with sample size (n)
indicating the number of independent experiments. Differences
were assessed by t-test or by x2 goodness of fit test, and accepted as
statistically significant at P,0.05.
Acknowledgments
We thank Evelyn Fitz, Kamal Al Marhoobi, Osama Hussein and Yubin
Guo, McGill University, for help in obtaining preliminary experimental
data for this project, and Marc Ryser, McGill University for helpful
discussions during the model development. We also thank Drs. E.V.
Mosharov (Columbia University), A.V. Pokhilko (University of Edinburgh)
P.M. Siegel (McGill University), and V.M. Vitvitsky (University of
Michigan) for helpful discussions during manuscript preparation.
Author Contributions
Conceived and designed the experiments: SK T Akchurin T Aissiou.
Performed the experiments: SK T Akchurin T Aissiou NK. Analyzed the
data: SK T Akchurin T Aissiou NK NN. Contributed reagents/materials/
analysis tools: SK. Wrote the paper: SK. Other: Supervised model
development: NN. Revised the paper: NN. Contributed to model
development: EP T Aissiou SK.
References
1. Stern PH (2007) Antiresorptive agents and osteoclast apoptosis. J Cell Biochem101: 1087–1096.
2. Grey A (2007) Emerging pharmacologic therapies for osteoporosis. Expert Opin
Emerg Drugs 12: 493–508.
3. Karsdal MA, Martin TJ, Bollerslev J, Christiansen C, Henriksen K (2007) Arenonresorbing osteoclasts sources of bone anabolic activity? J Bone Miner Res 22:
487–494.
4. Lawson J (2002) Drug-induced metabolic bone disorders. Semin MusculoskeletRadiol 6: 285–297.
5. Takahashi N, Udagawa N, Kobayashi Y, Suda T (2007) Generation of
osteoclasts in vitro, and assay of osteoclast activity. Methods Mol Med 135:285–301.
6. Collin-Osdoby P, Yu X, Zheng H, Osdoby P (2003) RANKL-mediated
osteoclast formation from murine RAW 264.7 cells. Methods Mol Med 80:153–166.
7. Goya M, Ishii G, Miyamoto S, Hasebe T, Nagai K, et al. (2006) Prostate-specific
antigen induces apoptosis of osteoclast precursors: potential role in osteoblasticbone metastases of prostate cancer. Prostate 66: 1573–1584.
8. O’Sullivan S, Naot D, Callon K, Porteous F, Horne A, et al. (2007) Imatinib
promotes osteoblast differentiation by inhibiting PDGFR signaling and inhibitsosteoclastogenesis by both direct and stromal cell-dependent mechanisms. J Bone
Miner Res 22: 1679–1689.
9. Pereverzev A, Komarova SV, Korcok J, Armstrong S, Tremblay GB, et al.(2007) Extracellular acidification enhances osteoclast survival through an NFAT-
independent, protein kinase C-dependent pathway. Bone.
10. Yun JH, Kim CS, Cho KS, Chai JK, Kim CK, et al. (2007) (-)-Epigallocatechingallate induces apoptosis, via caspase activation, in osteoclasts differentiated
from RAW 264.7 cells. J Periodontal Res 42: 212–218.
11. Bharti AC, Takada Y, Shishodia S, Aggarwal BB (2004) Evidence that receptoractivator of nuclear factor (NF)-kappaB ligand can suppress cell proliferation and
induce apoptosis through activation of a NF-kappaB-independent and TRAF6-
dependent mechanism. J Biol Chem 279: 6065–6076.
12. Komarova SV, Smith RJ, Dixon SJ, Sims SM, Wahl LM (2003) Mathematical
model predicts a critical role for osteoclast autocrine regulation in the control of
bone remodeling. Bone 33: 206–215.
13. Komarova SV (2005) Mathematical model of paracrine interactions between
osteoclasts and osteoblasts predicts anabolic action of parathyroid hormone on
bone. Endocrinology 146: 3589–3595.
14. Kroll MH (2000) Parathyroid hormone temporal effects on bone formation and
resorption. Bull Math Biol 62: 163–188.
15. Lemaire V, Tobin FL, Greller LD, Cho CR, Suva LJ (2004) Modeling theinteractions between osteoblast and osteoclast activities in bone remodeling.
J Theor Biol 229: 293–309.
16. Wani MR, Fuller K, Kim NS, Choi Y, Chambers T (1999) Prostaglandin E2cooperates with TRANCE in osteoclast induction from hemopoietic precursors:
synergistic activation of differentiation, cell spreading, and fusion. Endocrinology
140: 1927–1935.
17. Ishida N, Hayashi K, Hoshijima M, Ogawa T, Koga S, et al. (2002) Large scale
gene expression analysis of osteoclastogenesis in vitro and elucidation of NFAT2
as a key regulator. J Biol Chem 277: 41147–41156.
18. Boyce BF, Xing L (2007) Biology of RANK, RANKL, and osteoprotegerin.
Arthritis Res Ther 9 Suppl 1: S1.
19. Wada T, Nakashima T, Hiroshi N, Penninger JM (2006) RANKL-RANK
signaling in osteoclastogenesis and bone disease. Trends Mol Med 12: 17–25.
20. Takahashi S, Reddy SV, Chirgwin JM, Devlin R, Haipek C, et al. (1994)
Cloning and identification of annexin II as an autocrine/paracrine factor that
increases osteoclast formation and bone resorption. J Biol Chem 269:
28696–28701.
21. Roodman GD (2006) Regulation of osteoclast differentiation. Ann N Y Acad Sci
1068: 100–109.
22. Reddy SV, Takahashi S, Dallas M, Williams RE, Neckers L, et al. (1994)
Interleukin-6 antisense deoxyoligonucleotides inhibit bone resorption by giant
cells from human giant cell tumors of bone. J Bone Miner Res 9: 753–757.
23. Menaa C, Devlin RD, Reddy SV, Gazitt Y, Choi SJ, et al. (1999) Annexin II
increases osteoclast formation by stimulating the proliferation of osteoclast
precursors in human marrow cultures. J Clin Invest 103: 1605–1613.
24. Choi SJ, Han JH, Roodman GD (2001) ADAM8: a novel osteoclast stimulating
factor. J Bone Miner Res 16: 814–822.
25. Rao H, Lu G, Kajiya H, Garcia-Palacios V, Kurihara N, et al. (2006)
Alpha9beta1: a novel osteoclast integrin that regulates osteoclast formation and
function. J Bone Miner Res 21: 1657–1665.
26. Quinn JM, Itoh K, Udagawa N, Hausler K, Yasuda H, et al. (2001)
Transforming growth factor beta affects osteoclast differentiation via direct
and indirect actions. J Bone Miner Res 16: 1787–1794.
27. Takayanagi H (2007) Osteoimmunology: shared mechanisms and crosstalk
between the immune and bone systems. Nat Rev Immunol 7: 292–304.
28. Takayanagi H, Ogasawara K, Hida S, Chiba T, Murata S, et al. (2000) T-cell-
mediated regulation of osteoclastogenesis by signalling cross-talk between
RANKL and IFN-gamma. Nature 408: 600–605.
29. Zheng H, Yu X, Collin-Osdoby P, Osdoby P (2006) RANKL stimulates
inducible nitric-oxide synthase expression and nitric oxide production in
developing osteoclasts. An autocrine negative feedback mechanism triggered
by RANKL-induced interferon-beta via NF-kappaB that restrains osteoclasto-
genesis and bone resorption. J Biol Chem 281: 15809–15820.
30. Choi SJ, Reddy SV, Devlin RD, Menaa C, Chung H, et al. (1999) Identification
of human asparaginyl endopeptidase (legumain) as an inhibitor of osteoclast
formation and bone resorption. J Biol Chem 274: 27747–27753.
31. Reddy SV, Kurihara N, Menaa C, Roodman GD (2001) Paget’s disease of bone:
a disease of the osteoclast. Rev Endocr Metab Disord 2: 195–201.
Osteoclast Oscillations
PLoS ONE | www.plosone.org 10 May 2008 | Volume 3 | Issue 5 | e2104

32. Wise GE, Fan W (1989) Changes in the tartrate-resistant acid phosphatase cell
population in dental follicles and bony crypts of rat molars during tootheruption. J Dent Res 68: 150–156.
33. Yao S, Pan F, Wise GE (2007) Chronological gene expression of parathyroid
hormone-related protein (PTHrP) in the stellate reticulum of the rat:implications for tooth eruption. Arch Oral Biol 52: 228–232.
34. Wise GE, Lin F, Zhao L (1995) Transcription and translation of CSF-1 in thedental follicle. J Dent Res 74: 1551–1557.
35. Takayanagi H, Kim S, Koga T, Nishina H, Isshiki M, et al. (2002) Induction
and activation of the transcription factor NFATc1 (NFAT2) integrate RANKLsignaling in terminal differentiation of osteoclasts. Dev Cell 3: 889–901.
36. Espinosa L, Paret L, Ojeda C, Tourneur Y, Delmas PD, et al. (2002) Osteoclastspreading kinetics are correlated with an oscillatory activation of a calcium-
dependent potassium current. J Cell Sci 115: 3837–3848.
37. Xiao Z, Hao Y, Qin T, Han Z (2003) Periodic oscillation of blood leukocytes,
platelets, and hemoglobin in a patient with chronic eosinophilic leukemia. LeukRes 27: 89–91.
38. Go RS (2005) Idiopathic cyclic thrombocytopenia. Blood Rev 19: 53–59.
39. Fogarty PF, Stetler-Stevenson M, Pereira A, Dunbar CE (2005) Large granularlymphocytic proliferation-associated cyclic thrombocytopenia. Am J Hematol
79: 334–336.40. Horwitz M, Benson KF, Duan Z, Li FQ, Person RE (2004) Hereditary
neutropenia: dogs explain human neutrophil elastase mutations. Trends Mol
Med 10: 163–170.41. Colijn C, Mackey MC (2005) A mathematical model of hematopoiesis: II.
Cyclical neutropenia. J Theor Biol 237: 133–146.42. Defranoux NA, Stokes CL, Young DL, Kahn AJ (2005) In silico modeling and
simulation of bone biology: a proposal. J Bone Miner Res 20: 1079–1084.
Osteoclast Oscillations
PLoS ONE | www.plosone.org 11 May 2008 | Volume 3 | Issue 5 | e2104
Top Related
Copyright © 2022 FDOKUMEN

