


Bahasa
Halaman
Hukum

Planetary and Space Science 58 (2010) 1748–1757
Contents lists available at ScienceDirect
Planetary and Space Science
0032-06
doi:10.1
n Corr
E-m
gazeau@
journal homepage: www.elsevier.com/locate/pss
Combined experimental and theoretical studies on methane photolysisat 121.6 and 248 nm—implications on a program of laboratory simulationsof Titan’s atmosphere
C. Romanzin, E. Arzoumanian, Et. Es-sebbar, A. Jolly, S. Perrier, M.-C. Gazeau n, Y. Benilan
LISA, Laboratoire Interuniversitaire des Syst�emes Atmospheriques, UMR 7583, Universites Paris 7 et Paris 12, 61 Avenue du General de Gaulle, 94010 Creteil Cedex, France
a r t i c l e i n f o
Available online 7 July 2010
Keywords:
Methane
UV photolysis
Titan
Hydrocarbons
Photochemical model
Experimental simulations
33/$ - see front matter & 2010 Elsevier Ltd. A
016/j.pss.2010.07.001
esponding author. Tel.: +33 1 45171560
ail addresses: [email protected] (C
lisa.u-pec.fr (M.-C. Gazeau).
a b s t r a c t
Methane is, together with N2, the main precursor of Titan’s atmospheric chemistry. In our laboratory,
we are currently developing a program of laboratory simulations of Titan’s atmosphere, where methane
is intended to be dissociated by multiphotonic photolysis at 248 nm. A preliminary study has shown
that multiphotonic absorption of methane at 248 nm is efficient and leads to the production of
hydrocarbons such as C2H2 (Romanzin et al., 2008). Yet, at this wavelength, little is known about the
branching ratios of the hydrocarbon radicals (CH3, CH2 and CH) and their following photochemistry.
This paper thus aims at investigating methane photochemistry at 248 nm by comparing the chemical
evolution observed after irradiation of CH4 at 248 and at 121.6 nm (Ly-a). It is indeed important to see if
the chemistry is driven the same way at both wavelengths in particular because, on Titan, methane
photolysis mainly involves Ly-a photons. An approach combining experiments and theoretical analysis
by means of a specifically adapted 0-D model has thus been developed and is presented in this paper.
The results obtained clearly indicate that the chemistry is different depending on the wavelength. They
also suggest that at 248 nm, methane dissociation is in competition with ionisation, which could occur
through a three-photon absorption process. As a consequence, 248 nm photolysis appears to be
unsuitable to study methane neutral photochemistry alone. The implications of this result on our
laboratory simulation program and new experimental developments are discussed. Additional
information on methane photochemistry at 121.6 nm are also obtained.
& 2010 Elsevier Ltd. All rights reserved.
1. Introduction
Titan, the largest moon of Saturn, has a dense atmospheremainly composed of molecular nitrogen and methane. Thedissociation of these two compounds by solar ultraviolet (UV)photons and energetic electrons coming from the magnetosphereof Saturn initiates complex chemical reactions, which lead to theformation of many organic compounds such as nitriles andhydrocarbons. The Cassini–Huygens mission has given theopportunity to achieve a better knowledge of Titan’s atmosphereand surface. The data obtained in situ from the Huygens probe aswell as those provided by the Cassini spacecraft have revealedsome new facets of Titan’s atmospheric system. The chemicalcomposition of the upper atmosphere of Titan has been derivedfrom the measurements of an ion neutral mass spectrometer(INMS) instrument on board Cassini orbiter. The data delivered bythis instrument have allowed the determination of ethane and
ll rights reserved.
. Romanzin), marie-claire.
hydrogen volume mixing ratios in the upper atmosphere and ofthe abundances of some carbon–nitrile compounds (C2H2, C2H4,C2H6 and C3H4 as well as C3H8, C4H2, HCN, HC3N, C6H8 and C2N2)in the 1230–1174 km altitude range (Waite et al., 2005). As amatter of fact, most of these species have already been identifiedand quantified earlier in the lower atmosphere, thanks to CassiniInfrared Spectrometer (CIRS) measurements (Flasar et al., 2005).INMS data have also revealed the unexpected presence of heavyand complex molecules at higher altitudes than predicted (above1200 km) (Vuitton et al., 2006b; Waite et al., 2007).
This new image of Titan’s atmospheric chemistry hasbeen further improved by coupling observational results andtheoretical modelling (Lavvas et al., 2008a, b). In parallel, somelaboratory studies, focusing for instance on the determination ofspectroscopic parameters (Benilan et al., 2006; Jolly et al., 2007;Ferradaz et al., 2009), have allowed the identification of newspecies in the atmosphere of the satellite. One of the remainingchallenges in the understanding of Titan’s atmospheric system isto provide a full description of the chemical processes responsiblefor its evolution. This is the aim of S.E.T.U.P. (a French acronymfor Theoretical and Experimental Studies Useful for Planetology),a program of representative simulations based on a unique

C. Romanzin et al. / Planetary and Space Science 58 (2010) 1748–1757 1749
experimental device. This new device consists of a reactor wherethe initial gas mixture will be exposed, for the first time, to both ofthe major energy sources responsible for the chemical evolutionof Titan’s atmosphere (i.e. electrons and photons) (Romanzinet al., 2008). Chemistry of nitrogen and photochemistry ofmethane will thus be combined. So far, in such experiments, theanalysis was only performed on the resulting gas sample. Fromnow on, time resolved analysis of intermediates species as well asprimary products will be carried out in order to identify thechemical mechanisms taking place in the reactor.
In Titan’s atmosphere, photolysis of methane mainly involvesLyman-a photons (121.6 nm310.2 eV). Classical H2 photochemicallamps can deliver such UV photons. Unfortunately, these contin-uous sources are not suitable for high-speed kinetic studies.Therefore, in our simulation experiments, the use of a pulsed laser(KrF excimer delivering photons at 248 nm35 eV) has also beenconsidered to photodissociate methane. A comparative methanephotolysis study at 121.6 and 248 nm—involving one or twophotons respectively—has thus been performed as a first step of ourS.E.T.U.P. simulation program. Preliminary results based on IRanalysis of the stable products formed after irradiation of CH4 atboth wavelengths have shown that photolysis at 121.6 and 248 nmcould be considered as energetically equivalent (two-photonprocess at 248 nm) (Romanzin et al., 2008). However, the natureand the abundance of the resulting hydrocarbons suggested that thephotodissociation channels might be different. To explore thishypothesis, an approach combining similar irradiation experimentsand photochemical modelling has been developped and is reportedhere. This methodology is indeed well suited to test for the accuratedescription of the different mechanisms involved as already shownby our group in several studies (Smith et al., 1999; Smith andRaulin, 1999; Vuitton et al., 2006a).
The first aim of the present work is to characterize methanephotolysis at 248 and 121.6 nm. As discussed in a previouspublication, the available literature provides contradictory valuesfor photolytic decomposition pathways at Lyman-a while no dataare available at 248 nm (see Romanzin et al., 2005 and referencestherein). The present study also aims at evaluating the influenceof irradiation wavelength on nature and abundance of theresulting photoproducts. In Section 2, we describe two series ofmethane photolysis experiments performed at 121.6 and 248 nm.Modelling of these experiments is also discussed together withsome theoretical aspects of methane photodissociation atboth wavelengths. In the third section, the experimental andtheoretical results obtained are presented. They are compared anddiscussed in terms of photolytic decomposition pathwaysand chemical mechanisms in Section 4. We finally conclude onthe implications of this work for the future simulation experi-ments of Titan’s atmosphere within the S.E.T.U.P. program.
Fig. 1. Absorption infrared spectra of (a) the gaseous mixture after 5.5 h of
irradiation at 121.6 nm (see Table 2—experiment 1d for more details) and (b) the
gaseous mixture after 15 h of irradiation at 248 nm (see Table 3—experiment 2bE2
for more details).
Table 1Spectroscopic data.
Band ~n(cm�1) Sn [cm�2 atm�1
at 296 K]
Vibration mode Reference
C2H2 n5 729.1 735.0 CH bending GEISA
C2H4 n7 949.2 312.8 CH2 wagging GEISA
C2H6 n12 822.0 25 CH3 s-rocking GEISA
CH4 n3 3019.5 276 CH stretch GEISA
2. Experimental and theoretical tools
2.1. Experimental tools
2.1.1. Analytical cell
Irradiations are performed in a 3 L (V¼304275 cm3) stainlesssteel multireflexion White-cell (Fig. 2) filled with pure methane(CH4 N45 from Air Liquide) at various pressures depending on theexperiments (see Tables 2 and 3). Note that the photolysis cell ispumped down to 10�7 mbar prior to new experiment to preventany contamination. The chemical evolution of the gas mixtureresulting from methane irradiation is monitored by a Fouriertransform infrared spectrometer (Bruker Equinox 55) operating inthe 400–4000 cm�1 range. All the spectra were recorded with a
spectral resolution of 0.5 cm�1 and an optical path length of500 cm.
2.1.2. Spectroscopic modelling
Infrared spectra are integrated over 15 min (50 scans) duringthe irradiations to observe the disappearance of methane and theappearance and evolution of the photochemical products(see Fig. 1). Table 1 gives for each observed molecule the centerand the integrated strength of bands used to estimate theabsolute densities. These are obtained by direct comparisonbetween experimental and synthetic spectra. Calculated spectrahave been obtained using line by line spectroscopic parametersfrom the GEISA database (Jacquinet-Husson et al., 2005). Formethane, the comparison was made in the low absorption part ofthe spectra avoiding strongly saturated zones. In the case of highdensity acetylene spectra, the strong central Q-branch was alsoavoided in the comparison. For ethane and ethylene,the molecular densities could be obtained by comparing thecomplete bands since no saturation was observed.
The detection is not easy for every compound. The n5 bendingmode of C2H2 benefits from a strong integrated band intensity andalso from a very strong central Q-branch, which can be observedat very low densities. The n7 band of C2H4 benefits also fromstrong band intensity but the central Q-branch is not as sharp as
C. Romanzin et al. / Planetary and Space Science 58 (2010) 1748–17571750
for acetylene. Consequently, the detection limit for ethylene is 8times higher than for acetylene. The n12 band of C2H6 is the mostunfavourable case among the three studied photochemicalproducts since it has much lower band intensity and also muchdispersed spectra, lacking the strong central feature. As a result,using this band, ethane has a detection limit 25 times higher thanfor ethylene and thus 200 times higher than acetylene. Assuminga noise level of 2.5�10�3 in our absorbance spectra, densitylimits of 5�1011, 4�1012 and 1�1014 cm�3, respectively, forC2H2, C2H4 and C2H6 can be inferred from our synthetic spectracalculations. The intense n7 band of C2H6 around 3000 cm�1couldhave been used but unfortunately it is superimposed on the CH4
band and its spectroscopic parameters are poorly known.
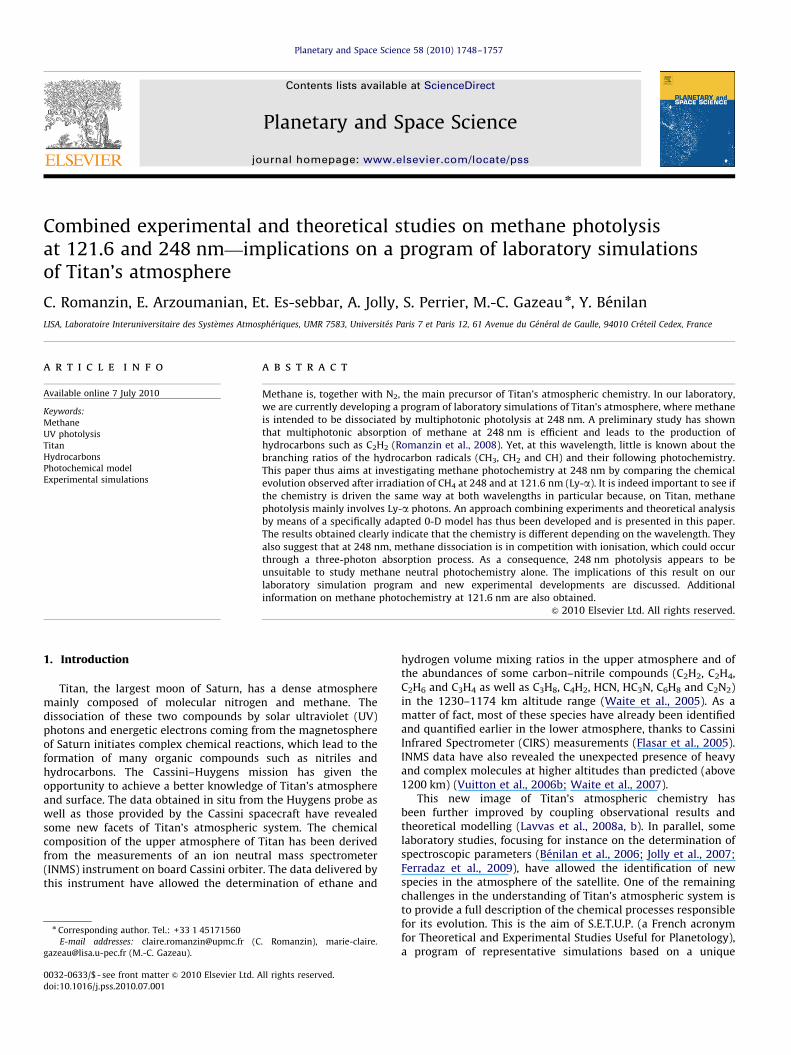
2.1.3. CH4 irradiations at 121.6 nm and actinometry
A schematic drawing of the experimental device used for our Ly-a photolysis experiments is presented in Fig. 2. The cell is equippedwith a MgF2 window (ؼ2.0 cm) allowing the transmission of UVphotons delivered by a photochemical discharge flow lamp directlyconnected to the cell. The gas mixture flowing through the lamp (2%of H2 in He (quality 4.9) from Linde gas) is excited by a microwavegenerator (Somelec, France) with a power of 200 W at 2450 MHz.With such a gas mixture, we expect mainly Ly-a photons to beemitted (Brehm and Siegert, 1965). Yet, the emission around160 nm commonly observed with these kinds of lamps may remainimportant (Fuchs et al., 1995; Cottin et al., 2003) though thiscontribution is poorly characterised.
Fig. 2. Schematic drawing of the experimental device used to study methane
dissociation at 121.6 nm. Ly-a photons are obtained by exciting an H2/He gas
mixture flowing through the lamp placed in a microwave cavity.
Table 2Experimental conditions of methane irradiation experiments at Ly-a.
Name PCH4 (atm) f0 (1015 hn.s�1) Total irradiation
time (h)
1a 3.17�10�4 4.470.1 25
1b 5.17�10�4 6.470.2 7
1c 7.25�10�4 6.870.2 5
1d 8.50�10�4 7.070.2 6
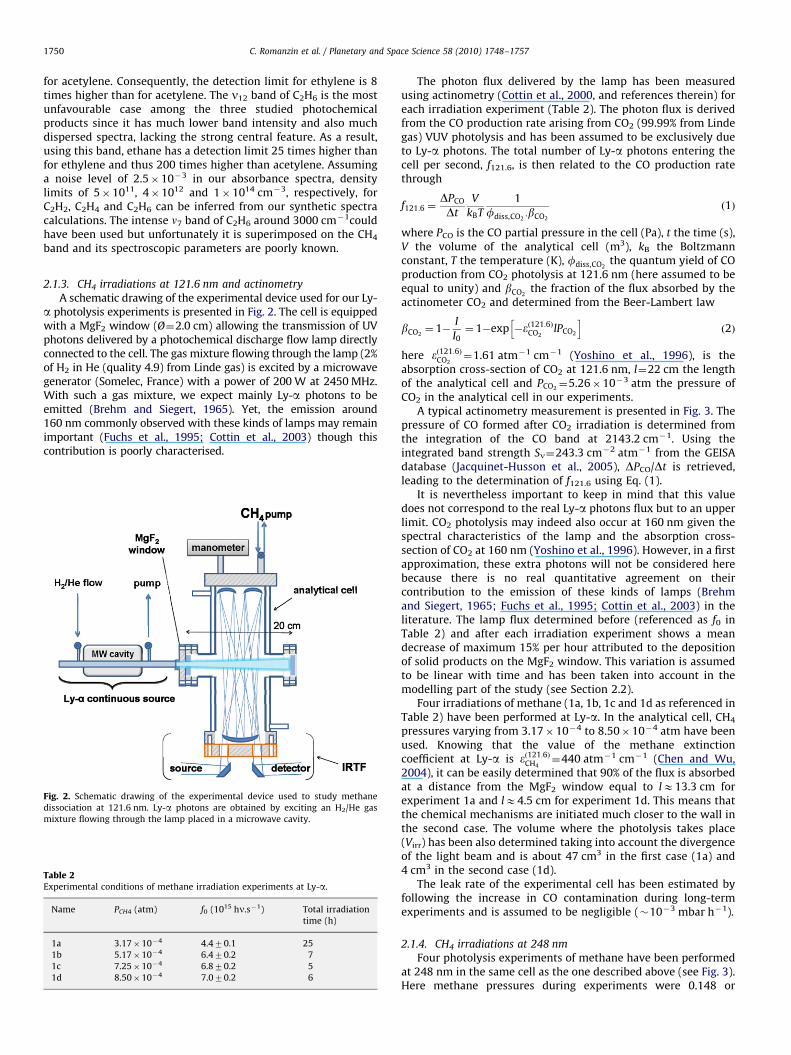
The photon flux delivered by the lamp has been measuredusing actinometry (Cottin et al., 2000, and references therein) foreach irradiation experiment (Table 2). The photon flux is derivedfrom the CO production rate arising from CO2 (99.99% from Lindegas) VUV photolysis and has been assumed to be exclusively dueto Ly-a photons. The total number of Ly-a photons entering thecell per second, f121.6, is then related to the CO production ratethrough
f121:6 ¼DPCO
Dt
V
kBT
1
fdiss,CO2:bCO2
ð1Þ
where PCO is the CO partial pressure in the cell (Pa), t the time (s),V the volume of the analytical cell (m3), kB the Boltzmannconstant, T the temperature (K), fdiss,CO2
the quantum yield of COproduction from CO2 photolysis at 121.6 nm (here assumed to beequal to unity) and bCO2
the fraction of the flux absorbed by theactinometer CO2 and determined from the Beer-Lambert law
bCO2¼ 1�
I
I0¼ 1�exp �eð121:6Þ
CO2lPCO2
h ið2Þ
here eð121:6ÞCO2
¼1.61 atm�1 cm�1 (Yoshino et al., 1996), is theabsorption cross-section of CO2 at 121.6 nm, l¼22 cm the lengthof the analytical cell and PCO2
¼5.26�10�3 atm the pressure ofCO2 in the analytical cell in our experiments.
A typical actinometry measurement is presented in Fig. 3. Thepressure of CO formed after CO2 irradiation is determined fromthe integration of the CO band at 2143.2 cm�1. Using theintegrated band strength Sn¼243.3 cm�2 atm�1 from the GEISAdatabase (Jacquinet-Husson et al., 2005), DPCO/Dt is retrieved,leading to the determination of f121.6 using Eq. (1).
It is nevertheless important to keep in mind that this valuedoes not correspond to the real Ly-a photons flux but to an upperlimit. CO2 photolysis may indeed also occur at 160 nm given thespectral characteristics of the lamp and the absorption cross-section of CO2 at 160 nm (Yoshino et al., 1996). However, in a firstapproximation, these extra photons will not be considered herebecause there is no real quantitative agreement on theircontribution to the emission of these kinds of lamps (Brehmand Siegert, 1965; Fuchs et al., 1995; Cottin et al., 2003) in theliterature. The lamp flux determined before (referenced as f0 inTable 2) and after each irradiation experiment shows a meandecrease of maximum 15% per hour attributed to the depositionof solid products on the MgF2 window. This variation is assumedto be linear with time and has been taken into account in themodelling part of the study (see Section 2.2).
Four irradiations of methane (1a, 1b, 1c and 1d as referenced inTable 2) have been performed at Ly-a. In the analytical cell, CH4
pressures varying from 3.17�10�4 to 8.50�10�4 atm have beenused. Knowing that the value of the methane extinctioncoefficient at Ly-a is eð121:6Þ
CH4¼440 atm�1 cm�1 (Chen and Wu,
2004), it can be easily determined that 90% of the flux is absorbedat a distance from the MgF2 window equal to lE13.3 cm forexperiment 1a and lE4.5 cm for experiment 1d. This means thatthe chemical mechanisms are initiated much closer to the wall inthe second case. The volume where the photolysis takes place(Virr) has been also determined taking into account the divergenceof the light beam and is about 47 cm3 in the first case (1a) and4 cm3 in the second case (1d).
The leak rate of the experimental cell has been estimated byfollowing the increase in CO contamination during long-termexperiments and is assumed to be negligible (�10�3 mbar h�1).
2.1.4. CH4 irradiations at 248 nm
Four photolysis experiments of methane have been performedat 248 nm in the same cell as the one described above (see Fig. 3).Here methane pressures during experiments were 0.148 or
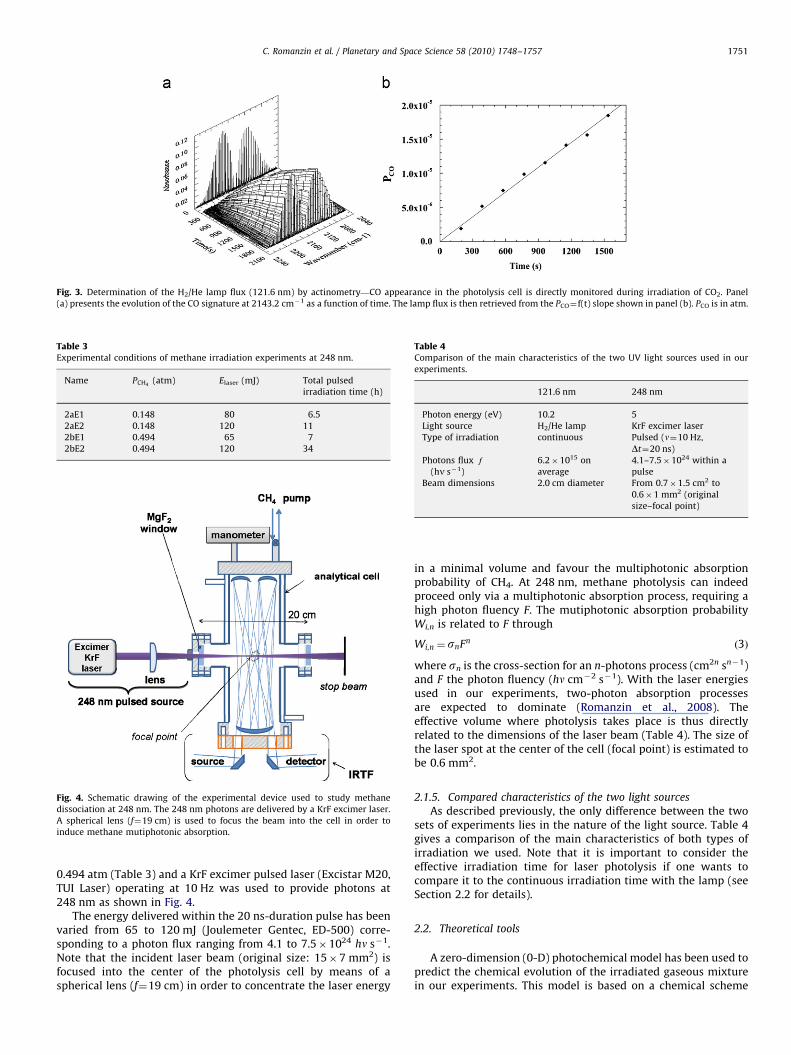
Fig. 3. Determination of the H2/He lamp flux (121.6 nm) by actinometry—CO appearance in the photolysis cell is directly monitored during irradiation of CO2. Panel
(a) presents the evolution of the CO signature at 2143.2 cm�1 as a function of time. The lamp flux is then retrieved from the PCO¼f(t) slope shown in panel (b). PCO is in atm.
Table 3Experimental conditions of methane irradiation experiments at 248 nm.
Name PCH4(atm) Elaser (mJ) Total pulsed
irradiation time (h)
2aE1 0.148 80 6.5
2aE2 0.148 120 11
2bE1 0.494 65 7
2bE2 0.494 120 34
Fig. 4. Schematic drawing of the experimental device used to study methane
dissociation at 248 nm. The 248 nm photons are delivered by a KrF excimer laser.
A spherical lens (f¼19 cm) is used to focus the beam into the cell in order to
induce methane mutiphotonic absorption.
Table 4Comparison of the main characteristics of the two UV light sources used in our
experiments.
121.6 nm 248 nm
Photon energy (eV) 10.2 5
Light source H2/He lamp KrF excimer laser
Type of irradiation continuous Pulsed (n¼10 Hz,
Dt¼20 ns)
Photons flux e
(hn s�1)
6.2�1015 on
average
4.1–7.5�1024 within a
pulse
Beam dimensions 2.0 cm diameter From 0.7�1.5 cm2 to
0.6�1 mm2 (original
size–focal point)
C. Romanzin et al. / Planetary and Space Science 58 (2010) 1748–1757 1751
0.494 atm (Table 3) and a KrF excimer pulsed laser (Excistar M20,TUI Laser) operating at 10 Hz was used to provide photons at248 nm as shown in Fig. 4.
The energy delivered within the 20 ns-duration pulse has beenvaried from 65 to 120 mJ (Joulemeter Gentec, ED-500) corre-sponding to a photon flux ranging from 4.1 to 7.5�1024 hn s�1.Note that the incident laser beam (original size: 15�7 mm2) isfocused into the center of the photolysis cell by means of aspherical lens (f¼19 cm) in order to concentrate the laser energy
in a minimal volume and favour the multiphotonic absorptionprobability of CH4. At 248 nm, methane photolysis can indeedproceed only via a multiphotonic absorption process, requiring ahigh photon fluency F. The mutiphotonic absorption probabilityWi,n is related to F through
Wi,n ¼ snFn ð3Þ
where sn is the cross-section for an n-photons process (cm2n sn�1)and F the photon fluency (hn cm�2 s�1). With the laser energiesused in our experiments, two-photon absorption processesare expected to dominate (Romanzin et al., 2008). Theeffective volume where photolysis takes place is thus directlyrelated to the dimensions of the laser beam (Table 4). The size ofthe laser spot at the center of the cell (focal point) is estimated tobe 0.6 mm2.
2.1.5. Compared characteristics of the two light sources
As described previously, the only difference between the twosets of experiments lies in the nature of the light source. Table 4gives a comparison of the main characteristics of both types ofirradiation we used. Note that it is important to consider theeffective irradiation time for laser photolysis if one wants tocompare it to the continuous irradiation time with the lamp (seeSection 2.2 for details).
2.2. Theoretical tools
A zero-dimension (0-D) photochemical model has been used topredict the chemical evolution of the irradiated gaseous mixturein our experiments. This model is based on a chemical scheme
C. Romanzin et al. / Planetary and Space Science 58 (2010) 1748–17571752
adapted from models previously developed for more complextheoretical studies of Titan’s atmosphere (Smith and Raulin, 1999;Hebrard et al., 2005, 2006; Vuitton et al., 2006a; Hebrard et al.,2007). Yet, only the hydrocarbon chemistry part is consideredhere, leading to a reduced chemical scheme made up of 283reactions involving 29 neutral species (molecules and radicalscontaining up to four carbon atoms, see Hebrard et al. (2006) fordetails of the reactions). The set of differential equations arisingfrom this chemical scheme is then solved using FacSimilesoftware (v.3.0.41 for Windows—Curtis, 1979).
In the model, the chemistry is explicitly detailed andphotolysis is described by a photolysis rate directly related tothe photolysis constant J (s�1) through Eq. (2):
dCi
dt¼�JiCi ð4Þ
The expression of J has been adapted in order to deal satisfactorilywith the experiments described above (see Section 2.1). Indeed, in theexperiments, photons are not distributed all over the cell but onlywithin the volume defined by the geometry of the light beam and theeffective length of absorption over the cell (see Section 2.1.3). Thisvolume corresponds to the irradiated volume Virr and photolysis doesonly occur in this region on a limited number of molecules. Acorrection factor corresponding to the ratio of the irradiated volumeover the total volume of the cell Virr/Vtot is thus applied to J. Thedifferent nature of the two photolytic processes implied in ourexperiments has also been taken into account by adapting theexpression of J with respect to the nature of the light sourceconsidered. It results in the following expressions:
(i)
TablPhot
are a
cros
Di
CH
C2
C2
C2
at 121.6 nm
J121:6i ¼
Virr
Vtotfdiss,isiF0 ð5Þ
where Virr is the volume of the region where photolysis occurs(cm3), Vtot the total volume of the cell (cm3), fdiss,i, thedissociation quantum yield of the molecule i, si the absorp-tion cross-section of the molecule i (cm2)and F0 the incidentphoton flux (hn cm�2 s�1)
e 5olysis schemes of CH4, C2H2, C2H4 and C2H6 at 10.2 eV used in our 121.6 nm model.
vailable at this wavelength, the set of branching ratios of CH4 at 121.6 nm has been
s-sections are specified in the table.
ssociation channels F References
4þhn-
CH3þH1CH2þH2
3CH2þ2H1CH2þ2H
CHþHþH2
(a) 0.291 F: (W
(b) 0.585 sabs:
(c) 0.000
(d) 0.066
(e) 0.068
H2þhn-C2HþH
C2þH2
(a) 0.30 F: (O
(b) 0.10 sabs:
H4þhn-C2H2þH2
C2H2þ2H(a) 0.58 F: (H
(b) 0.42 sabs:
H6þhn-
C2H4þH2
C2H4þ2H
C2H2þHþH2
CH4þ1 H2CH3þCH3
(a) 0.12 F: (A
(b) 0.30 sabs:
(c) 0.25
(d) 0.25
(e) 0.08
(ii)
For th
used
ang
(Vat
kabe
(Nak
olla
(Zel
kim
(Lee
at 248 nm
J248i ¼
Virr
Vtotfdiss,i/Wi,2S ð6Þ
where /Wi,2Sis the average value of the two-photon absorptionprobability for i. Virr the volume of the region where photolysisoccurs (cm3) and Vtot the total volume of the cell (cm3).
/Wi,2S is estimated on the basis of the laser photolysis fluencyaveraged over the beam path into the experimental cell. We indeedassume that in our experimental conditions the 248 nm methanephotolysis corresponds to a two-photon process according to ourprevious results (Romanzin et al., 2008). The two-photon absorptioncross-section s2 has been taken equal to 2.7�10�53 cm4 s photon�1
as estimated by Galasso (1992) from theoretical calculations.This photolysis description has been applied to methane and to C2
hydrocarbons for the modelling of the 121.6 nm irradiation experi-ments but only to methane for the 248 nm ones. Indeed, secondaryphotolysis of the hydrocarbons resulting from the chemistry inducedby methane photolysis at 248 nm has been assumed to be negligible.The weak absorption cross-section of these compounds at 248 nm(see Table 5 for detailed references) precludes the single-photonphotolysis process and the probability of a two-photon photolysisprocess is assumed to be really small according to the low density ofthese molecules with respect to methane. Table 5 summarizes thedifferent sets of branching ratios which have been used in our model.For methane, the scheme of Wang et al. (2000) has been appliedbecause this scheme is based on a whole set of experimental data andthus appears to be the most reliable one to date.
Other parameters have also been adapted to account for thespecificities of the two light sources. This is especially the case forthe laser pulsed irradiation experiments, where the photon flux e
delivered within a pulse has been scaled down by a factorn Dt¼2�10�7 in order to obtain an effective continuous photonflux of easier use in the model. It indeed allows considerablereduction of the computing time and simulation of the evolutionof the gaseous mixture over a longer period without introducingany significant bias in the simulation outputs as shown in Fig. 5.
e 248 nm model, only methane photolysis has been considered and as no data
in a first approximation. References for both branching ratios and absorption
et al., 2000)
sa and Volpp, 2001)
, 1981, 1983; Seki and Okabe, 1993),
ayama and Watanabe, 1964; Vattulainen et al., 1997; Benilan et al., 2000)
nd et al., 1997; Chang et al., 1998)
ikoff and Watanabe, 1953; Orkin et al., 1997)
oto et al., 1965; Hampson and McNesby, 1965a, 1965b; Lias et al., 1970)
et al., 2001)
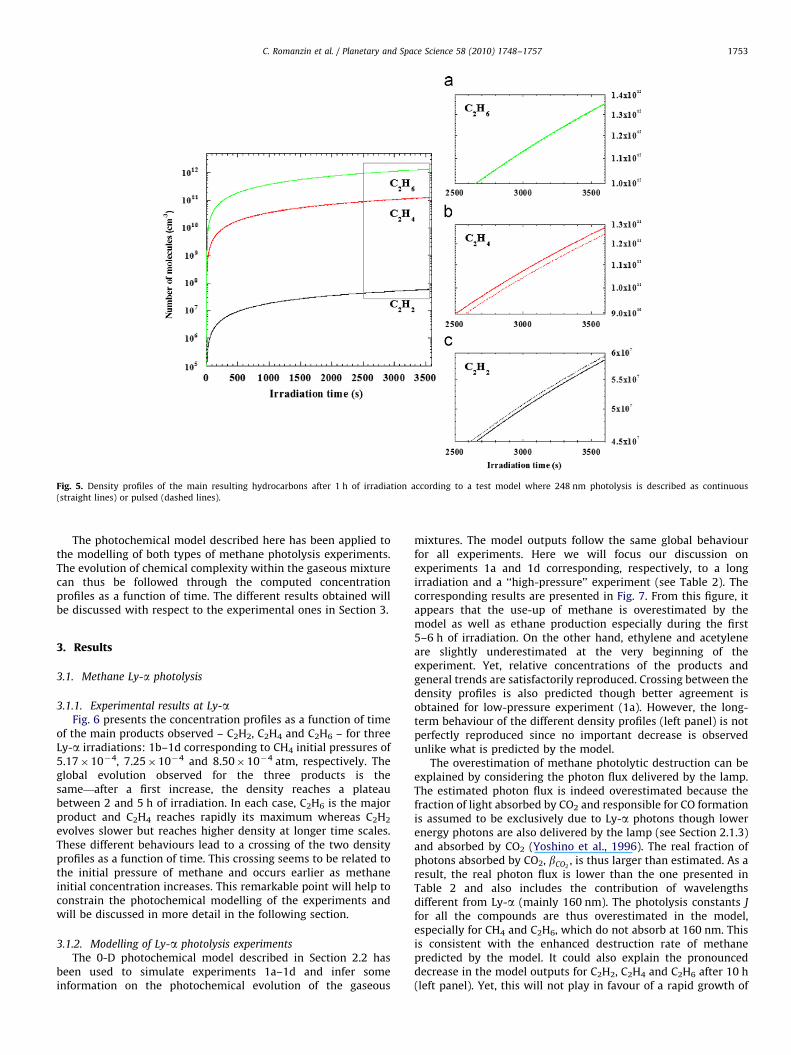
Fig. 5. Density profiles of the main resulting hydrocarbons after 1 h of irradiation according to a test model where 248 nm photolysis is described as continuous
(straight lines) or pulsed (dashed lines).
C. Romanzin et al. / Planetary and Space Science 58 (2010) 1748–1757 1753
The photochemical model described here has been applied tothe modelling of both types of methane photolysis experiments.The evolution of chemical complexity within the gaseous mixturecan thus be followed through the computed concentrationprofiles as a function of time. The different results obtained willbe discussed with respect to the experimental ones in Section 3.
3. Results
3.1. Methane Ly-a photolysis
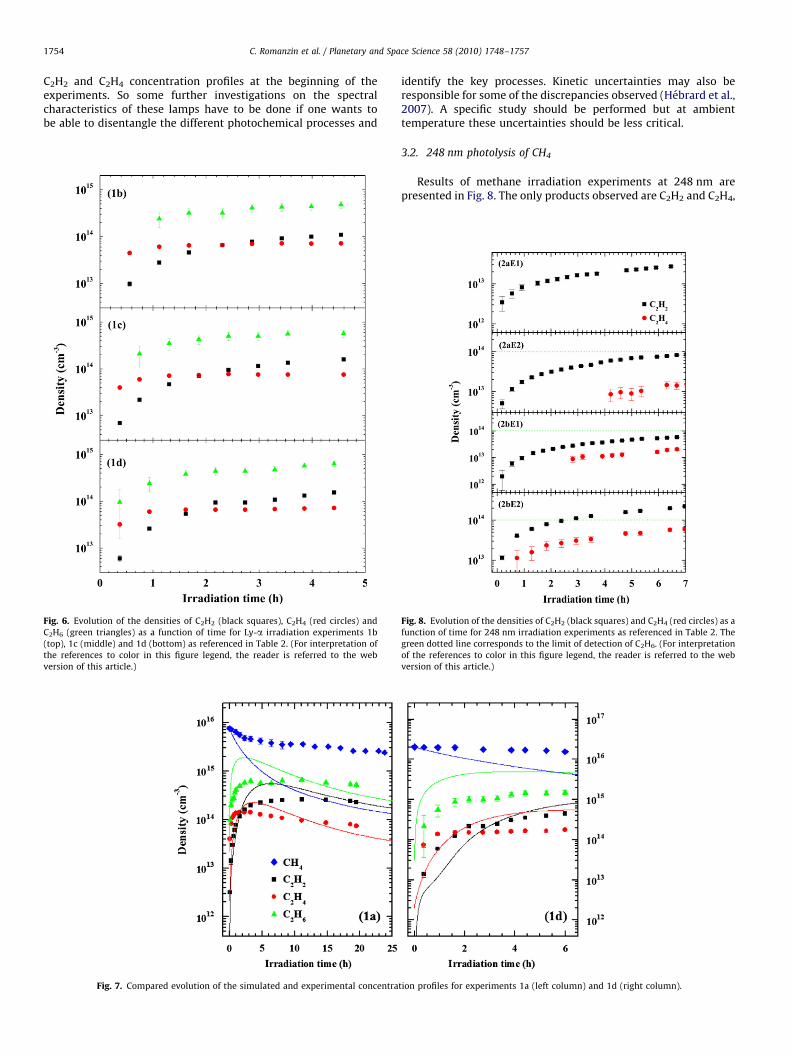
3.1.1. Experimental results at Ly-aFig. 6 presents the concentration profiles as a function of time
of the main products observed – C2H2, C2H4 and C2H6 – for threeLy-a irradiations: 1b–1d corresponding to CH4 initial pressures of5.17�10�4, 7.25�10�4 and 8.50�10�4 atm, respectively. Theglobal evolution observed for the three products is thesame—after a first increase, the density reaches a plateaubetween 2 and 5 h of irradiation. In each case, C2H6 is the majorproduct and C2H4 reaches rapidly its maximum whereas C2H2
evolves slower but reaches higher density at longer time scales.These different behaviours lead to a crossing of the two densityprofiles as a function of time. This crossing seems to be related tothe initial pressure of methane and occurs earlier as methaneinitial concentration increases. This remarkable point will help toconstrain the photochemical modelling of the experiments andwill be discussed in more detail in the following section.
3.1.2. Modelling of Ly-a photolysis experiments
The 0-D photochemical model described in Section 2.2 hasbeen used to simulate experiments 1a–1d and infer someinformation on the photochemical evolution of the gaseous
mixtures. The model outputs follow the same global behaviourfor all experiments. Here we will focus our discussion onexperiments 1a and 1d corresponding, respectively, to a longirradiation and a ‘‘high-pressure’’ experiment (see Table 2). Thecorresponding results are presented in Fig. 7. From this figure, itappears that the use-up of methane is overestimated by themodel as well as ethane production especially during the first5–6 h of irradiation. On the other hand, ethylene and acetyleneare slightly underestimated at the very beginning of theexperiment. Yet, relative concentrations of the products andgeneral trends are satisfactorily reproduced. Crossing between thedensity profiles is also predicted though better agreement isobtained for low-pressure experiment (1a). However, the long-term behaviour of the different density profiles (left panel) is notperfectly reproduced since no important decrease is observedunlike what is predicted by the model.
The overestimation of methane photolytic destruction can beexplained by considering the photon flux delivered by the lamp.The estimated photon flux is indeed overestimated because thefraction of light absorbed by CO2 and responsible for CO formationis assumed to be exclusively due to Ly-a photons though lowerenergy photons are also delivered by the lamp (see Section 2.1.3)and absorbed by CO2 (Yoshino et al., 1996). The real fraction ofphotons absorbed by CO2, bCO2
, is thus larger than estimated. As aresult, the real photon flux is lower than the one presented inTable 2 and also includes the contribution of wavelengthsdifferent from Ly-a (mainly 160 nm). The photolysis constants J
for all the compounds are thus overestimated in the model,especially for CH4 and C2H6, which do not absorb at 160 nm. Thisis consistent with the enhanced destruction rate of methanepredicted by the model. It could also explain the pronounceddecrease in the model outputs for C2H2, C2H4 and C2H6 after 10 h(left panel). Yet, this will not play in favour of a rapid growth of
C. Romanzin et al. / Planetary and Space Science 58 (2010) 1748–17571754
C2H2 and C2H4 concentration profiles at the beginning of theexperiments. So some further investigations on the spectralcharacteristics of these lamps have to be done if one wants tobe able to disentangle the different photochemical processes and
Fig. 7. Compared evolution of the simulated and experimental concentra
Fig. 6. Evolution of the densities of C2H2 (black squares), C2H4 (red circles) and
C2H6 (green triangles) as a function of time for Ly-a irradiation experiments 1b
(top), 1c (middle) and 1d (bottom) as referenced in Table 2. (For interpretation of
the references to color in this figure legend, the reader is referred to the web
version of this article.)
identify the key processes. Kinetic uncertainties may also beresponsible for some of the discrepancies observed (Hebrard et al.,2007). A specific study should be performed but at ambienttemperature these uncertainties should be less critical.
3.2. 248 nm photolysis of CH4
Results of methane irradiation experiments at 248 nm arepresented in Fig. 8. The only products observed are C2H2 and C2H4,
tion profiles for experiments 1a (left column) and 1d (right column).
Fig. 8. Evolution of the densities of C2H2 (black squares) and C2H4 (red circles) as a
function of time for 248 nm irradiation experiments as referenced in Table 2. The
green dotted line corresponds to the limit of detection of C2H6. (For interpretation
of the references to color in this figure legend, the reader is referred to the web
version of this article.)
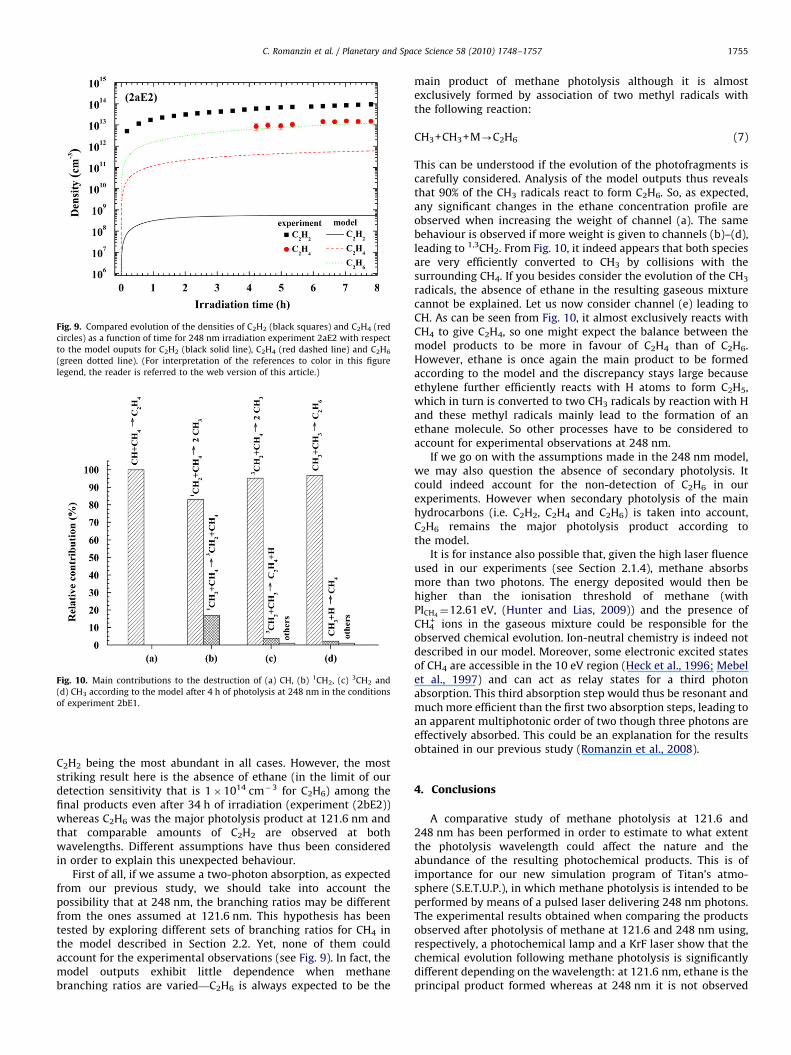
Fig. 9. Compared evolution of the densities of C2H2 (black squares) and C2H4 (red
circles) as a function of time for 248 nm irradiation experiment 2aE2 with respect
to the model ouputs for C2H2 (black solid line), C2H4 (red dashed line) and C2H6
(green dotted line). (For interpretation of the references to color in this figure
legend, the reader is referred to the web version of this article.)
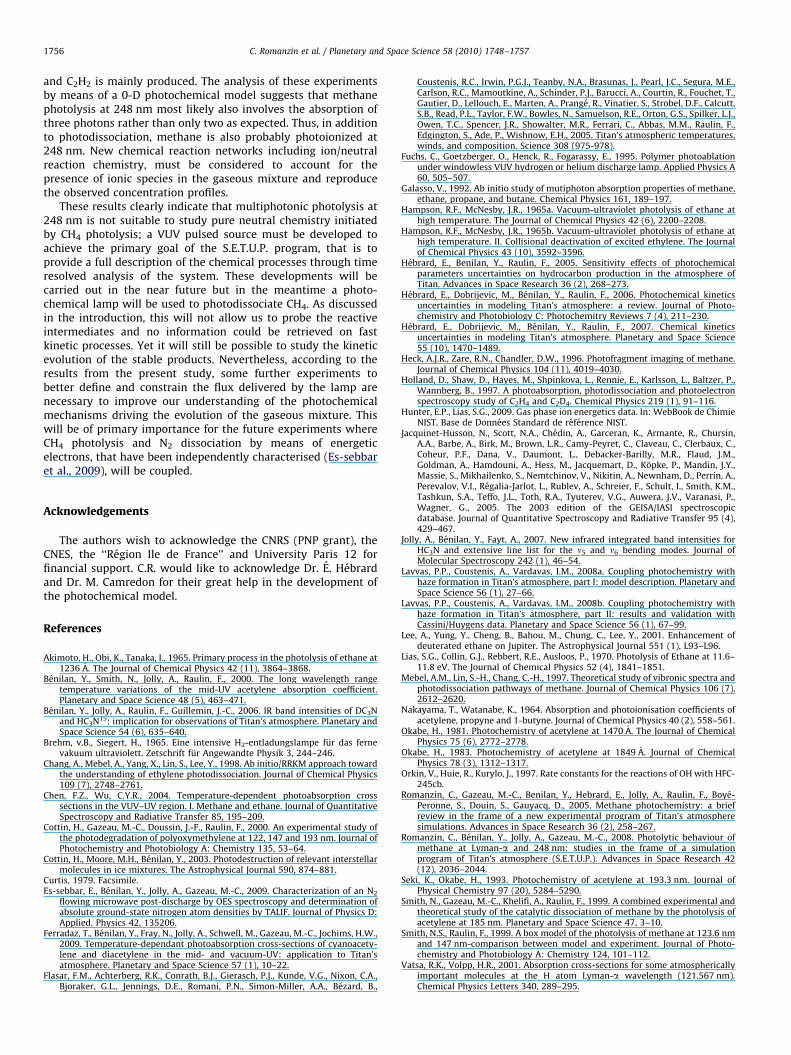
Fig. 10. Main contributions to the destruction of (a) CH, (b) 1CH2, (c) 3CH2 and
(d) CH3 according to the model after 4 h of photolysis at 248 nm in the conditions
of experiment 2bE1.
C. Romanzin et al. / Planetary and Space Science 58 (2010) 1748–1757 1755
C2H2 being the most abundant in all cases. However, the moststriking result here is the absence of ethane (in the limit of ourdetection sensitivity that is 1�1014 cm�3 for C2H6) among thefinal products even after 34 h of irradiation (experiment (2bE2))whereas C2H6 was the major photolysis product at 121.6 nm andthat comparable amounts of C2H2 are observed at bothwavelengths. Different assumptions have thus been consideredin order to explain this unexpected behaviour.
First of all, if we assume a two-photon absorption, as expectedfrom our previous study, we should take into account thepossibility that at 248 nm, the branching ratios may be differentfrom the ones assumed at 121.6 nm. This hypothesis has beentested by exploring different sets of branching ratios for CH4 inthe model described in Section 2.2. Yet, none of them couldaccount for the experimental observations (see Fig. 9). In fact, themodel outputs exhibit little dependence when methanebranching ratios are varied—C2H6 is always expected to be the
main product of methane photolysis although it is almostexclusively formed by association of two methyl radicals withthe following reaction:
CH3+CH3+M-C2H6 (7)
This can be understood if the evolution of the photofragments iscarefully considered. Analysis of the model outputs thus revealsthat 90% of the CH3 radicals react to form C2H6. So, as expected,any significant changes in the ethane concentration profile areobserved when increasing the weight of channel (a). The samebehaviour is observed if more weight is given to channels (b)–(d),leading to 1,3CH2. From Fig. 10, it indeed appears that both speciesare very efficiently converted to CH3 by collisions with thesurrounding CH4. If you besides consider the evolution of the CH3
radicals, the absence of ethane in the resulting gaseous mixturecannot be explained. Let us now consider channel (e) leading toCH. As can be seen from Fig. 10, it almost exclusively reacts withCH4 to give C2H4, so one might expect the balance between themodel products to be more in favour of C2H4 than of C2H6.However, ethane is once again the main product to be formedaccording to the model and the discrepancy stays large becauseethylene further efficiently reacts with H atoms to form C2H5,which in turn is converted to two CH3 radicals by reaction with Hand these methyl radicals mainly lead to the formation of anethane molecule. So other processes have to be considered toaccount for experimental observations at 248 nm.
If we go on with the assumptions made in the 248 nm model,we may also question the absence of secondary photolysis. Itcould indeed account for the non-detection of C2H6 in ourexperiments. However when secondary photolysis of the mainhydrocarbons (i.e. C2H2, C2H4 and C2H6) is taken into account,C2H6 remains the major photolysis product according tothe model.
It is for instance also possible that, given the high laser fluenceused in our experiments (see Section 2.1.4), methane absorbsmore than two photons. The energy deposited would then behigher than the ionisation threshold of methane (withPICH4
¼12.61 eV, (Hunter and Lias, 2009)) and the presence ofCH4
+ ions in the gaseous mixture could be responsible for theobserved chemical evolution. Ion-neutral chemistry is indeed notdescribed in our model. Moreover, some electronic excited statesof CH4 are accessible in the 10 eV region (Heck et al., 1996; Mebelet al., 1997) and can act as relay states for a third photonabsorption. This third absorption step would thus be resonant andmuch more efficient than the first two absorption steps, leading toan apparent multiphotonic order of two though three photons areeffectively absorbed. This could be an explanation for the resultsobtained in our previous study (Romanzin et al., 2008).
4. Conclusions
A comparative study of methane photolysis at 121.6 and248 nm has been performed in order to estimate to what extentthe photolysis wavelength could affect the nature and theabundance of the resulting photochemical products. This is ofimportance for our new simulation program of Titan’s atmo-sphere (S.E.T.U.P.), in which methane photolysis is intended to beperformed by means of a pulsed laser delivering 248 nm photons.The experimental results obtained when comparing the productsobserved after photolysis of methane at 121.6 and 248 nm using,respectively, a photochemical lamp and a KrF laser show that thechemical evolution following methane photolysis is significantlydifferent depending on the wavelength: at 121.6 nm, ethane is theprincipal product formed whereas at 248 nm it is not observed
C. Romanzin et al. / Planetary and Space Science 58 (2010) 1748–17571756
and C2H2 is mainly produced. The analysis of these experimentsby means of a 0-D photochemical model suggests that methanephotolysis at 248 nm most likely also involves the absorption ofthree photons rather than only two as expected. Thus, in additionto photodissociation, methane is also probably photoionized at248 nm. New chemical reaction networks including ion/neutralreaction chemistry, must be considered to account for thepresence of ionic species in the gaseous mixture and reproducethe observed concentration profiles.
These results clearly indicate that multiphotonic photolysis at248 nm is not suitable to study pure neutral chemistry initiatedby CH4 photolysis; a VUV pulsed source must be developed toachieve the primary goal of the S.E.T.U.P. program, that is toprovide a full description of the chemical processes through timeresolved analysis of the system. These developments will becarried out in the near future but in the meantime a photo-chemical lamp will be used to photodissociate CH4. As discussedin the introduction, this will not allow us to probe the reactiveintermediates and no information could be retrieved on fastkinetic processes. Yet it will still be possible to study the kineticevolution of the stable products. Nevertheless, according to theresults from the present study, some further experiments tobetter define and constrain the flux delivered by the lamp arenecessary to improve our understanding of the photochemicalmechanisms driving the evolution of the gaseous mixture. Thiswill be of primary importance for the future experiments whereCH4 photolysis and N2 dissociation by means of energeticelectrons, that have been independently characterised (Es-sebbaret al., 2009), will be coupled.
Acknowledgements
The authors wish to acknowledge the CNRS (PNP grant), theCNES, the ‘‘Region Ile de France’’ and University Paris 12 forfinancial support. C.R. would like to acknowledge Dr. E. Hebrardand Dr. M. Camredon for their great help in the development ofthe photochemical model.
References
Akimoto, H., Obi, K., Tanaka, I., 1965. Primary process in the photolysis of ethane at1236 A. The Journal of Chemical Physics 42 (11), 3864–3868.
Benilan, Y., Smith, N., Jolly, A., Raulin, F., 2000. The long wavelength rangetemperature variations of the mid-UV acetylene absorption coefficient.Planetary and Space Science 48 (5), 463–471.
Benilan, Y., Jolly, A., Raulin, F., Guillemin, J.-C., 2006. IR band intensities of DC3Nand HC3N15: implication for observations of Titan’s atmosphere. Planetary andSpace Science 54 (6), 635–640.
Brehm, v.B., Siegert, H., 1965. Eine intensive H2-entladungslampe fur das fernevakuum ultraviolett. Zetschrift fur Angewandte Physik 3, 244–246.
Chang, A., Mebel, A., Yang, X., Lin, S., Lee, Y., 1998. Ab initio/RRKM approach towardthe understanding of ethylene photodissociation. Journal of Chemical Physics109 (7), 2748–2761.
Chen, F.Z., Wu, C.Y.R., 2004. Temperature-dependent photoabsorption crosssections in the VUV–UV region. I. Methane and ethane. Journal of QuantitativeSpectroscopy and Radiative Transfer 85, 195–209.
Cottin, H., Gazeau, M.-C., Doussin, J.-F., Raulin, F., 2000. An experimental study ofthe photodegradation of polyoxymethylene at 122, 147 and 193 nm. Journal ofPhotochemistry and Photobiology A: Chemistry 135, 53–64.
Cottin, H., Moore, M.H., Benilan, Y., 2003. Photodestruction of relevant interstellarmolecules in ice mixtures. The Astrophysical Journal 590, 874–881.
Curtis, 1979. Facsimile.Es-sebbar, E., Benilan, Y., Jolly, A., Gazeau, M.-C., 2009. Characterization of an N2
flowing microwave post-discharge by OES spectroscopy and determination ofabsolute ground-state nitrogen atom densities by TALIF. Journal of Physics D:Applied. Physics 42, 135206.
Ferradaz, T., Benilan, Y., Fray, N., Jolly, A., Schwell, M., Gazeau, M.-C., Jochims, H.W.,2009. Temperature-dependant photoabsorption cross-sections of cyanoacety-lene and diacetylene in the mid- and vacuum-UV: application to Titan’satmosphere. Planetary and Space Science 57 (1), 10–22.
Flasar, F.M., Achterberg, R.K., Conrath, B.J., Gierasch, P.J., Kunde, V.G., Nixon, C.A.,Bjoraker, G.L., Jennings, D.E., Romani, P.N., Simon-Miller, A.A., Bezard, B.,
Coustenis, R.C., Irwin, P.G.J., Teanby, N.A., Brasunas, J., Pearl, J.C., Segura, M.E.,Carlson, R.C., Mamoutkine, A., Schinder, P.J., Barucci, A., Courtin, R., Fouchet, T.,Gautier, D., Lellouch, E., Marten, A., Prange, R., Vinatier, S., Strobel, D.F., Calcutt,S.B., Read, P.L., Taylor, F.W., Bowles, N., Samuelson, R.E., Orton, G.S., Spilker, L.J.,Owen, T.C., Spencer, J.R., Showalter, M.R., Ferrari, C., Abbas, M.M., Raulin, F.,Edgington, S., Ade, P., Wishnow, E.H., 2005. Titan’s atmospheric temperatures,winds, and composition. Science 308 (975-978).
Fuchs, C., Goetzberger, O., Henck, R., Fogarassy, E., 1995. Polymer photoablationunder windowless VUV hydrogen or helium discharge lamp. Applied Physics A60, 505–507.
Galasso, V., 1992. Ab initio study of mutiphoton absorption properties of methane,ethane, propane, and butane. Chemical Physics 161, 189–197.
Hampson, R.F., McNesby, J.R., 1965a. Vacuum-ultraviolet photolysis of ethane athigh temperature. The Journal of Chemical Physics 42 (6), 2200–2208.
Hampson, R.F., McNesby, J.R., 1965b. Vacuum-ultraviolet photolysis of ethane athigh temperature. II. Collisional deactivation of excited ethylene. The Journalof Chemical Physics 43 (10), 3592–3596.
Hebrard, E., Benilan, Y., Raulin, F., 2005. Sensitivity effects of photochemicalparameters uncertainties on hydrocarbon production in the atmosphere ofTitan. Advances in Space Research 36 (2), 268–273.
Hebrard, E., Dobrijevic, M., Benilan, Y., Raulin, F., 2006. Photochemical kineticsuncertainties in modeling Titan’s atmosphere: a review. Journal of Photo-chemistry and Photobiology C: Photochemitry Reviews 7 (4), 211–230.
Hebrard, E., Dobrijevic, M., Benilan, Y., Raulin, F., 2007. Chemical kineticsuncertainties in modeling Titan’s atmosphere. Planetary and Space Science55 (10), 1470–1489.
Heck, A.J.R., Zare, R.N., Chandler, D.W., 1996. Photofragment imaging of methane.Journal of Chemical Physics 104 (11), 4019–4030.
Holland, D., Shaw, D., Hayes, M., Shpinkova, L., Rennie, E., Karlsson, L., Baltzer, P.,Wannberg, B., 1997. A photoabsorption, photodissociation and photoelectronspectroscopy study of C2H4 and C2D4. Chemical Physics 219 (1), 91–116.
Hunter, E.P., Lias, S.G., 2009. Gas phase ion energetics data. In: WebBook de ChimieNIST, Base de Donnees Standard de reference NIST.
Jacquinet-Husson, N., Scott, N.A., Chedin, A., Garceran, K., Armante, R., Chursin,A.A., Barbe, A., Birk, M., Brown, L.R., Camy-Peyret, C., Claveau, C., Clerbaux, C.,Coheur, P.F., Dana, V., Daumont, L., Debacker-Barilly, M.R., Flaud, J.M.,Goldman, A., Hamdouni, A., Hess, M., Jacquemart, D., Kopke, P., Mandin, J.Y.,Massie, S., Mikhailenko, S., Nemtchinov, V., Nikitin, A., Newnham, D., Perrin, A.,Perevalov, V.I., Regalia-Jarlot, L., Rublev, A., Schreier, F., Schult, I., Smith, K.M.,Tashkun, S.A., Teffo, J.L., Toth, R.A., Tyuterev, V.G., Auwera, J.V., Varanasi, P.,Wagner, G., 2005. The 2003 edition of the GEISA/IASI spectroscopicdatabase. Journal of Quantitative Spectroscopy and Radiative Transfer 95 (4),429–467.
Jolly, A., Benilan, Y., Fayt, A., 2007. New infrared integrated band intensities forHC3N and extensive line list for the n5 and n6 bending modes. Journal ofMolecular Spectroscopy 242 (1), 46–54.
Lavvas, P.P., Coustenis, A., Vardavas, I.M., 2008a. Coupling photochemistry withhaze formation in Titan’s atmosphere, part I: model description. Planetary andSpace Science 56 (1), 27–66.
Lavvas, P.P., Coustenis, A., Vardavas, I.M., 2008b. Coupling photochemistry withhaze formation in Titan’s atmosphere, part II: results and validation withCassini/Huygens data. Planetary and Space Science 56 (1), 67–99.
Lee, A., Yung, Y., Cheng, B., Bahou, M., Chung, C., Lee, Y., 2001. Enhancement ofdeuterated ethane on Jupiter. The Astrophysical Journal 551 (1), L93–L96.
Lias, S.G., Collin, G.J., Rebbert, R.E., Ausloos, P., 1970. Photolysis of Ethane at 11.6–11.8 eV. The Journal of Chemical Physics 52 (4), 1841–1851.
Mebel, A.M., Lin, S.-H., Chang, C.-H., 1997. Theoretical study of vibronic spectra andphotodissociation pathways of methane. Journal of Chemical Physics 106 (7),2612–2620.
Nakayama, T., Watanabe, K., 1964. Absorption and photoionisation coefficients ofacetylene, propyne and 1-butyne. Journal of Chemical Physics 40 (2), 558–561.
Okabe, H., 1981. Photochemistry of acetylene at 1470 A. The Journal of ChemicalPhysics 75 (6), 2772–2778.
Okabe, H., 1983. Photochemistry of acetylene at 1849 A. Journal of ChemicalPhysics 78 (3), 1312–1317.
Orkin, V., Huie, R., Kurylo, J., 1997. Rate constants for the reactions of OH with HFC-245cb.
Romanzin, C., Gazeau, M.-C., Benilan, Y., Hebrard, E., Jolly, A., Raulin, F., Boye-Peronne, S., Douin, S., Gauyacq, D., 2005. Methane photochemistry: a briefreview in the frame of a new experimental program of Titan’s atmospheresimulations. Advances in Space Research 36 (2), 258–267.
Romanzin, C., Benilan, Y., Jolly, A., Gazeau, M.-C., 2008. Photolytic behaviour ofmethane at Lyman-a and 248 nm: studies in the frame of a simulationprogram of Titan’s atmosphere (S.E.T.U.P.). Advances in Space Research 42(12), 2036–2044.
Seki, K., Okabe, H., 1993. Photochemistry of acetylene at 193.3 nm. Journal ofPhysical Chemistry 97 (20), 5284–5290.
Smith, N., Gazeau, M.-C., Khelifi, A., Raulin, F., 1999. A combined experimental andtheoretical study of the catalytic dissociation of methane by the photolysis ofacetylene at 185 nm. Planetary and Space Science 47, 3–10.
Smith, N.S., Raulin, F., 1999. A box model of the photolysis of methane at 123.6 nmand 147 nm-comparison between model and experiment. Journal of Photo-chemistry and Photobiology A: Chemistry 124, 101–112.
Vatsa, R.K., Volpp, H.R., 2001. Absorption cross-sections for some atmosphericallyimportant molecules at the H atom Lyman-a wavelength (121.567 nm).Chemical Physics Letters 340, 289–295.

C. Romanzin et al. / Planetary and Space Science 58 (2010) 1748–1757 1757
Vattulainen, J., Wallenius, L., Stenberg, J., Hernberg, R., Linna, V., 1997.Experimental determination of SO2, C2H2 and O2 absorption cross sections atelevated temperatures and pressures. Applied Spectroscopy 57, 1311–1315.
Vuitton, V., Doussin, J.-F., Benilan, Y., Raulin, F., Gazeau, M.-C., 2006a. Experimentaland theoretical study of hydrocarbon photochemistry applied to Titanstratosphere. Icarus 185 (1), 287–300.
Vuitton, V., Yelle, R.V., Anicich, V.G., 2006b. The nitrogen chemistry of Titan’s upperatmosphere revealed. The Astrophysical Journal Letters 647 (2), L175–L178.
Waite Jr., J.H., Niemann, H., Yelle, R.V., Kasprzak, W.T., Cravens, T.E., Luhmann, J.G.,McNutt, R.L., Ip, W.-H., Gell, D., de La Haye, V., Muller-Wordag, I., Magee, B.,Borggren, N., Ledvina, S., Fletcher, G., Walter, E., Miller, R., Scherer, S., Thorpe,R., Xu, J., Block, B., Arnett, K., 2005. Ion neutral mass spectrometer results fromthe first flyby of Titan. Science 308 (5‘724), 982–986.
Waite Jr., J.H., Young, D.T., Cravens, T.E., Coates, A.J., Crary, F.J., Magee, B., Westlake,J., 2007. The process of tholin formation in Titan’s upper atmosphere. Science316 (5826), 870–875.
Wang, J.-H., Liu, K., Min, Z., Su, H., Bersohn, R., Preses, J., Larese, J.Z., 2000. Vacuumultraviolet photochemistry of CH4 and isotopomers. II. Product channelfields and absorption spectra. Journal of Chemical Physics 113 (10),4146–4152.
Yoshino, K., Esmond, J.R., Sun, Y., Parkinson, W.H., Ito, K., Matsui, T., 1996.Absorption cross-section measurements of carbon dioxide in the wavelengthregion 118.7–175.5 nm and the temerature dependance. Journal of Quantita-tive Spectroscopy and Radiative Transfer 55 (1), 53–60.
Zelikoff, M., Watanabe, K., 1953. Absorption coefficient of ethylene in the vacuumultraviolet. Journal of the American Optical Society 43 (9), 756–759.
Top Related
Copyright © 2022 FDOKUMEN

