


Bahasa
Halaman
Hukum

International Journal of Advance Engineering and Research Development
Volume 2,Issue 11, November -2015
@IJAERD-2015, All rights Reserved 185
Scientific Journal of Impact Factor(SJIF): 3.134 e-ISSN(O): 2348-4470
p-ISSN(P): 2348-6406
Class Wise - Classimate Faults and their Physical Properties D. V. Bihola
1, H. N. Amin
2, V. D. Shah
3
1Textile Manufacturing Technology, R.C. Technical Institute, Ahmedabad-380060, Gujarat.
2Textile Technology Department, Sarvajanik College of Engineering & Technology, Surat -395001,Gujarat.
3Textile Technology Department, L. D. College of Engineering, Near Gujarat University, Navarangpura, Ahmedabad-380015,
Abstract —This Trend has changed regarding the assessment of yarn quality from lower unevenness and imperfection
to better workability of yarn on further processing machines and final fabric appearance in respect of objectionable
faults. Today the customer of textile products is highly quality conscious. The machinery used for the production of th e
yarn to fabric are also being automated year after year. This requires minimum down time of the machine to get their
maximum benefit in terms of production, efficiency and cost. Therefore, in view of the above, objectionable faults in the
yarn have become a prime and burning problem of the day for the spinning industry. From whatever research work done
until now, very little information is available on the level for the various classes of faults as per the count. Uster statis tics
2001 does not provide any information on faults, while Uster statistics 1997 which provides information on faults does
not give guideline on the level of various classes of faults for different counts. Moreover the publication of the last ten
years, gives information about the sources of faults, there causes remedies and their effect on fabric appearance, there is
however no publication available on the categorization of the various classes of faults under different class wise and
their percent contribution.
Keywords- Yarn fault, classimat yarn fault, count, Uster classimat, Statimat – M, Thick , Thin, Slub, long thick, long thin
I. INTRODUCTION
There is considerable literature available on the research work done on the effect of various categories of faults, main ly
objectionable on the fabric appearance. Though it is documented in various papers that yarn faults (objectionable) not
only affect fabric appearance but also causes end breakage in subsequent processes resulting in to low production and
higher production cost with low efficiency, but this is not supported by any systematic study or data. No published
informat ion is available on the physical characteristic of the various faults according to classes, therefore the assessment
of physical properties of the faults under different classes of faults to understand their effect on the further processes is
necessary.
II. EXPERIMENTAL PLAN
To cover the range of count from coarse to fine, samples of d ifferent counts were collected from mills while some of
them were spun in the ATIRA pilot mill to get more number of faults so that the analysis is meaningful. The sample were
then tested on Uster classimat–II on cut mode using the parameters given subsequently and the faults B4, C3, C4, D2,
D3, D4 E, F, G, H1, H2, I1and I2 were collected on black sheet.
These sheets along with the fau lts were conditioned for four hours in standard temperature of 27 ± 2C and 65 ± 2 %
R.H. in the physical testing laboratory of ATIRA. These were then tested on Statimat – M with parameters given
subsequently, for testing the physical properties in terms of single yarn strength and elongation and compare them with
results of normal yarn, also tested that were on the same instrument. During the strength testing, observation was made,
whether the yarn broke from the fault region or elsewhere. Thus data bank has been prepared count wise and class wise
comparing the physical properties of the faults with the normal yarn (physical properties value) and efforts has been
made to identify the value and trade for the physical properties of the yarn faults count wise.
The counts used in the study are 20s K, 24s K, 30s K, 40s K, 40s C, 50s C, 60s K, 60s C, 80s K, 80s C, 95s C, 105s K,
and 105s C. Thus in th is project a total of 112 samples of the various counts collected and tested and prepared data bank
count wise and class wise.
The process flow of the experiment and Process parameters are given subsequently. The level of classimat faults
categorized class wise by instrument for all sample tested along with count wise average value is taken.
International Journal of Advance Engineering and Research Development (IJAERD)
Volume 2,Issue 11, November -2015, e-ISSN: 2348 - 4470 , print-ISSN:2348-6406
@IJAERD-2015, All rights Reserved 186
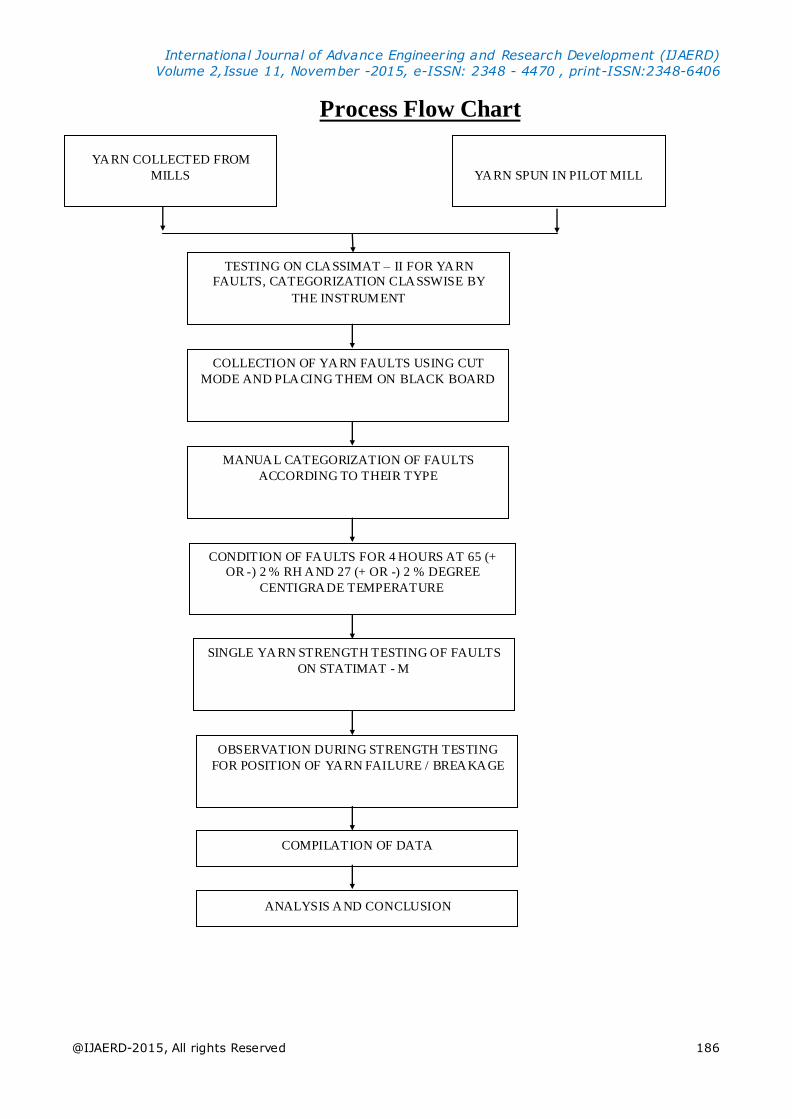
Process Flow Chart
YARN COLLECTED FROM
MILLS
YARN SPUN IN PILOT MILL
TESTING ON CLASSIMAT – II FOR YARN
FAULTS, CATEGORIZATION CLASSWISE BY
THE INSTRUMENT
COLLECTION OF YARN FAULTS USING CUT
MODE AND PLACING THEM ON BLACK BOARD
MANUAL CATEGORIZATION OF FAULTS
ACCORDING TO THEIR TYPE
SINGLE YARN STRENGTH TESTING OF FAULTS
ON STATIMAT - M
OBSERVATION DURING STRENGTH TESTING
FOR POSITION OF YARN FAILURE / BREAKAGE
COMPILATION OF DATA
ANALYSIS AND CONCLUSION
CONDITION OF FAULTS FOR 4 HOURS AT 65 (+
OR -) 2 % RH AND 27 (+ OR -) 2 % DEGREE
CENTIGRADE TEMPERATURE
International Journal of Advance Engineering and Research Development (IJAERD)
Volume 2,Issue 11, November -2015, e-ISSN: 2348 - 4470 , print-ISSN:2348-6406
@IJAERD-2015, All rights Reserved 187
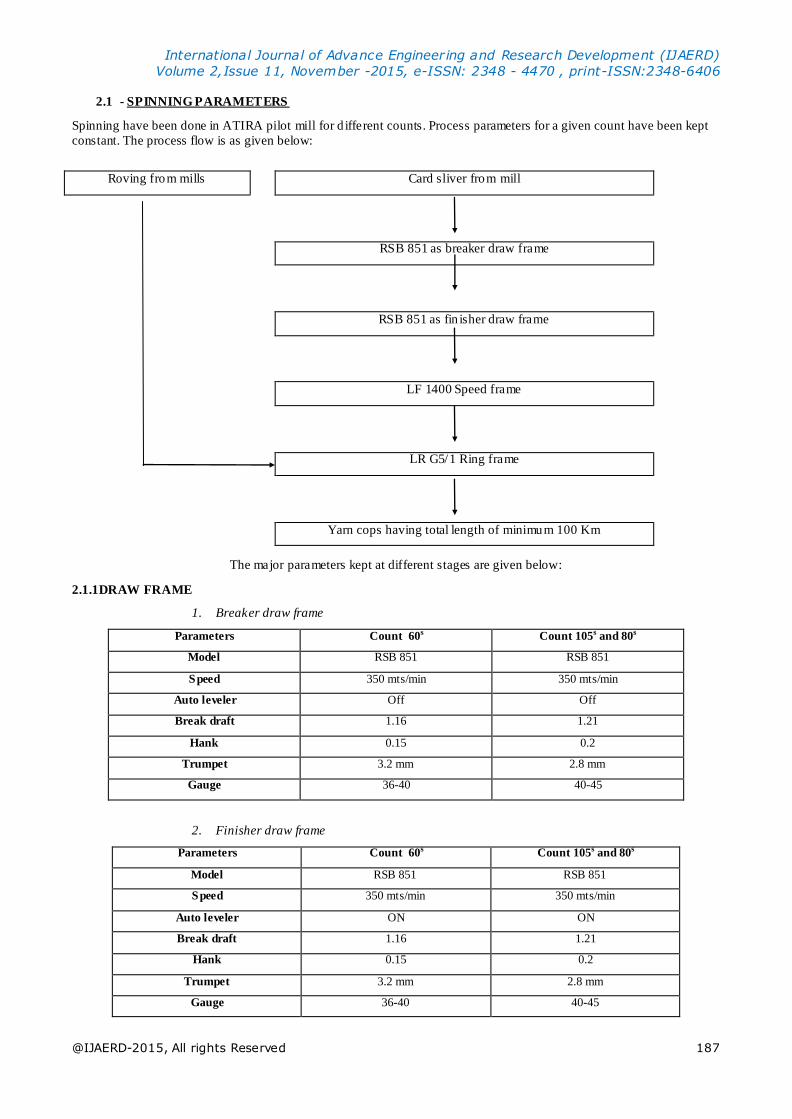
2.1 - SPINNING PARAMETERS
Spinning have been done in ATIRA pilot mill for d ifferent counts. Process parameters for a given count have been kept
constant. The process flow is as given below:
Roving from mills Card sliver from mill
RSB 851 as breaker draw frame
RSB 851 as fin isher draw frame
LF 1400 Speed frame
LR G5/1 Ring frame
Yarn cops having total length of minimum 100 Km
The major parameters kept at different stages are given below:
2.1.1DRAW FRAME
1. Breaker draw frame
Parameters Count 60s Count 105s and 80s
Model RSB 851 RSB 851
Speed 350 mts/min 350 mts/min
Auto leveler Off Off
Break draft 1.16 1.21
Hank 0.15 0.2
Trumpet 3.2 mm 2.8 mm
Gauge 36-40 40-45
2. Finisher draw frame
Parameters Count 60s Count 105s and 80s
Model RSB 851 RSB 851
Speed 350 mts/min 350 mts/min
Auto leveler ON ON
Break draft 1.16 1.21
Hank 0.15 0.2
Trumpet 3.2 mm 2.8 mm
Gauge 36-40 40-45
International Journal of Advance Engineering and Research Development (IJAERD)
Volume 2,Issue 11, November -2015, e-ISSN: 2348 - 4470 , print-ISSN:2348-6406
@IJAERD-2015, All rights Reserved 188
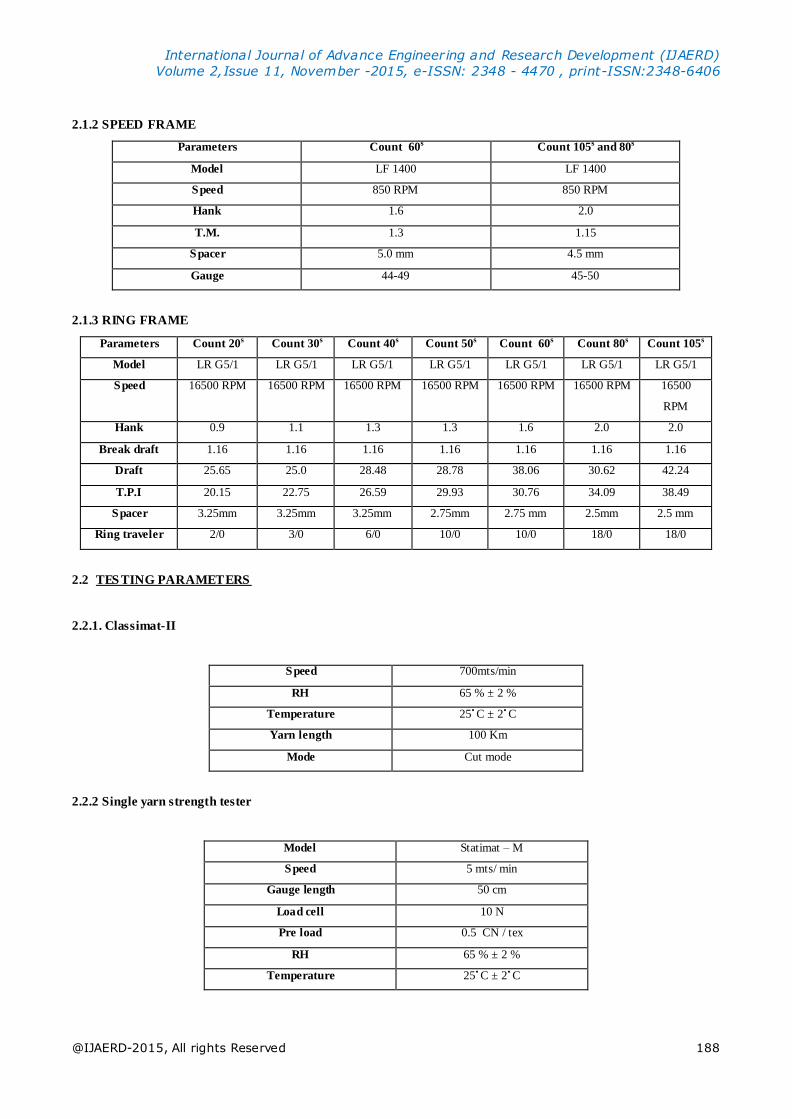
2.1.2 SPEED FRAME
Parameters Count 60s Count 105s and 80s
Model LF 1400 LF 1400
Speed 850 RPM 850 RPM
Hank 1.6 2.0
T.M. 1.3 1.15
Spacer 5.0 mm 4.5 mm
Gauge 44-49 45-50
2.1.3 RING FRAME
Parameters Count 20s Count 30s Count 40s Count 50s Count 60s Count 80s Count 105s
Model LR G5/1 LR G5/1 LR G5/1 LR G5/1 LR G5/1 LR G5/1 LR G5/1
Speed 16500 RPM 16500 RPM 16500 RPM 16500 RPM 16500 RPM 16500 RPM 16500
RPM
Hank 0.9 1.1 1.3 1.3 1.6 2.0 2.0
Break draft 1.16 1.16 1.16 1.16 1.16 1.16 1.16
Draft 25.65 25.0 28.48 28.78 38.06 30.62 42.24
T.P.I 20.15 22.75 26.59 29.93 30.76 34.09 38.49
Spacer 3.25mm 3.25mm 3.25mm 2.75mm 2.75 mm 2.5mm 2.5 mm
Ring traveler 2/0 3/0 6/0 10/0 10/0 18/0 18/0
2.2 TES TING PARAMETERS
2.2.1. Classimat-II
Speed 700mts/min
RH 65 % ± 2 %
Temperature 25 C ± 2 C
Yarn length 100 Km
Mode Cut mode
2.2.2 Single yarn strength tester
Model Statimat – M
Speed 5 mts/ min
Gauge length 50 cm
Load cell 10 N
Pre load 0.5 CN / tex
RH 65 % ± 2 %
Temperature 25 C ± 2 C
International Journal of Advance Engineering and Research Development (IJAERD)
Volume 2,Issue 11, November -2015, e-ISSN: 2348 - 4470 , print-ISSN:2348-6406
@IJAERD-2015, All rights Reserved 189
III. RES ULTS AND DISCUSSION One of the major purpose of the present study is to analyze the classimat faults and their physical propert ies. To analyze
properly, the data generated during this study, the discussion has been divided in to 4 parts as follows.
1) Analysis of level of classimat faults categorized class wise by the instrument for d ifferent counts and
mills.
2) Analysis of level of short thick object ionable faults class wise.
3) Analysis of class wise and count wise fault failu re rate.
4) Analysis of class wise short thick objectionable faults for their Strength, Elongation and B-work for
different counts
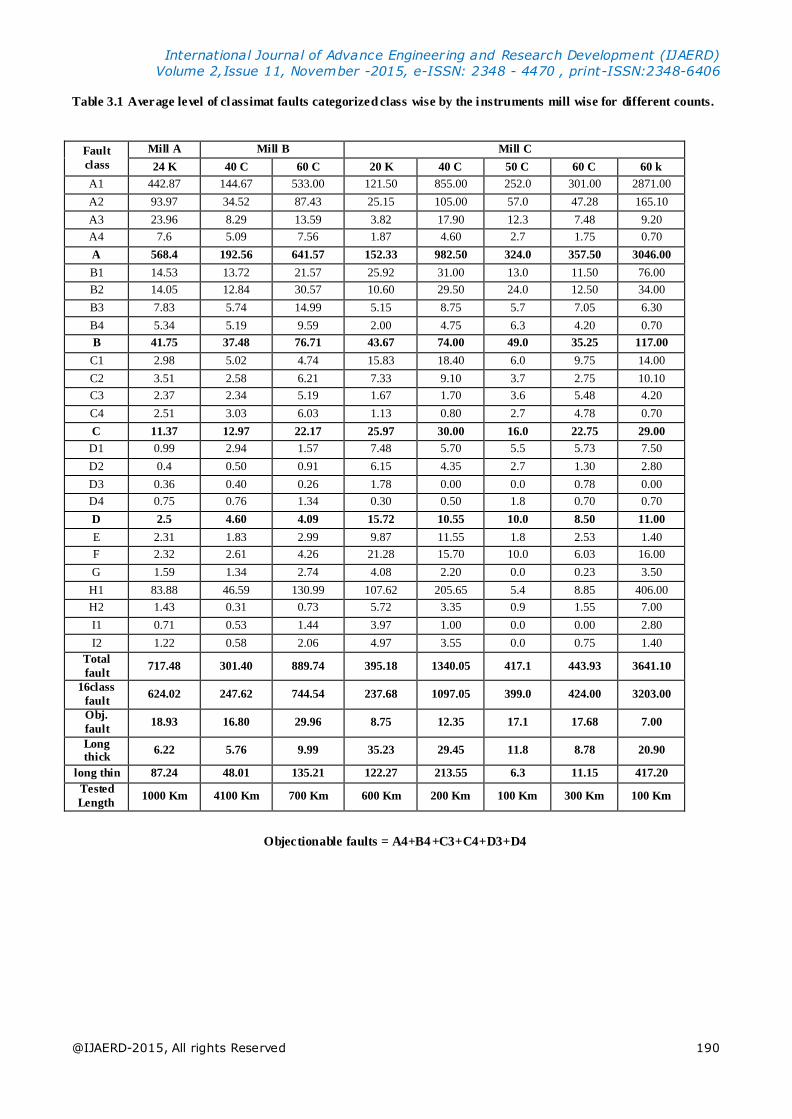
3.1. Analysis of level of classimat faults categorized class wise by the instrument for different counts and mills.
A All the yarns collected or spun were tested on the classimat for determining the level of yarn fault. The values
expressed for 100 km. of yarn are given in Appendix 2 the data, as can be seen is huge, and therefore we have averaged
the result and presented it count wise in table 3.1. They have also been segregated as carded and combed. It was observed
that, Though the no. of sample tested in each count are large and sufficient but the number of mill covered in the study
are very limited to draw conclusion on the level of fault existing in yarn spun from Indian mills therefore,The classimat
faults for various counts are averaged mill wise and tabulated in table 3.1. This has been done basically because the
house keeping, the maintenance schedules of a particular mill is likely to remain almost very similar for the different
counts being spun. To a great extend it can also be assumed that the quality of mixing in a part icular mill for d ifferent
count will be almost same in the sense that if the mill management has a tendency to use superior, inferior or normal
mixing for one count, it would also do so for rest of the count that are being spun in the mill.
The following is the analysis of the table
3.1.1. If yarn is spun from same mixing to count using optimum parameters, the level o f classimat faults
increases with fine count seen in the case of mill C.
3.1.2. Same finding of classimat faults increasing with fine count hold true in case of mill B and D also were
the mixing for both the count is not same but used approximately accord ing to the count. This implies
that Uster Statistics which has so far been publishing common level of clas simat faults for d ifferent
counts needs to be reviewed since classimat faults increase with count.
3.1.3. For the data studied, the increase in total classimat faults with the fineness of count increasing by about
20 units, is of order of 100 to 200 % while the increase in short thick objectionable faults is
correspondingly very less 60 to 80 %. This implies that short thick objectionable faults in the yarn are
less dependent on the mixing and process parameters as compare to the total faults. (from mill B and
mill D)
3.1.4. In the mills studied, the increase in long thin faults in all cases with increase in fineness of count by
about 20 units has been considerably high around 180 to 300 % while in case of increase in count by
about 40 units, the increase in long thin fau lts has been observed to be 400 %. (mill B and mill D)
International Journal of Advance Engineering and Research Development (IJAERD)
Volume 2,Issue 11, November -2015, e-ISSN: 2348 - 4470 , print-ISSN:2348-6406
@IJAERD-2015, All rights Reserved 190
Table 3.1 Average level of classimat faults categorized class wise by the instruments mill wise for different counts.
Fault
class
Mill A Mill B Mill C
24 K 40 C 60 C 20 K 40 C 50 C 60 C 60 k
A1 442.87 144.67 533.00 121.50 855.00 252.0 301.00 2871.00
A2 93.97 34.52 87.43 25.15 105.00 57.0 47.28 165.10
A3 23.96 8.29 13.59 3.82 17.90 12.3 7.48 9.20
A4 7.6 5.09 7.56 1.87 4.60 2.7 1.75 0.70
A 568.4 192.56 641.57 152.33 982.50 324.0 357.50 3046.00
B1 14.53 13.72 21.57 25.92 31.00 13.0 11.50 76.00
B2 14.05 12.84 30.57 10.60 29.50 24.0 12.50 34.00
B3 7.83 5.74 14.99 5.15 8.75 5.7 7.05 6.30
B4 5.34 5.19 9.59 2.00 4.75 6.3 4.20 0.70
B 41.75 37.48 76.71 43.67 74.00 49.0 35.25 117.00
C1 2.98 5.02 4.74 15.83 18.40 6.0 9.75 14.00
C2 3.51 2.58 6.21 7.33 9.10 3.7 2.75 10.10
C3 2.37 2.34 5.19 1.67 1.70 3.6 5.48 4.20
C4 2.51 3.03 6.03 1.13 0.80 2.7 4.78 0.70
C 11.37 12.97 22.17 25.97 30.00 16.0 22.75 29.00
D1 0.99 2.94 1.57 7.48 5.70 5.5 5.73 7.50
D2 0.4 0.50 0.91 6.15 4.35 2.7 1.30 2.80
D3 0.36 0.40 0.26 1.78 0.00 0.0 0.78 0.00
D4 0.75 0.76 1.34 0.30 0.50 1.8 0.70 0.70
D 2.5 4.60 4.09 15.72 10.55 10.0 8.50 11.00
E 2.31 1.83 2.99 9.87 11.55 1.8 2.53 1.40
F 2.32 2.61 4.26 21.28 15.70 10.0 6.03 16.00
G 1.59 1.34 2.74 4.08 2.20 0.0 0.23 3.50
H1 83.88 46.59 130.99 107.62 205.65 5.4 8.85 406.00
H2 1.43 0.31 0.73 5.72 3.35 0.9 1.55 7.00
I1 0.71 0.53 1.44 3.97 1.00 0.0 0.00 2.80
I2 1.22 0.58 2.06 4.97 3.55 0.0 0.75 1.40
Total
fault 717.48 301.40 889.74 395.18 1340.05 417.1 443.93 3641.10
16class
fault 624.02 247.62 744.54 237.68 1097.05 399.0 424.00 3203.00
Obj.
fault 18.93 16.80 29.96 8.75 12.35 17.1 17.68 7.00
Long thick
6.22 5.76 9.99 35.23 29.45 11.8 8.78 20.90
long thin 87.24 48.01 135.21 122.27 213.55 6.3 11.15 417.20
Tested
Length 1000 Km 4100 Km 700 Km 600 Km 200 Km 100 Km 300 Km 100 Km
Objectionable faults = A4+B4+C3+C4+D3+D4

International Journal of Advance Engineering and Research Development (IJAERD)
Volume 2,Issue 11, November -2015, e-ISSN: 2348 - 4470 , print-ISSN:2348-6406
@IJAERD-2015, All rights Reserved 191
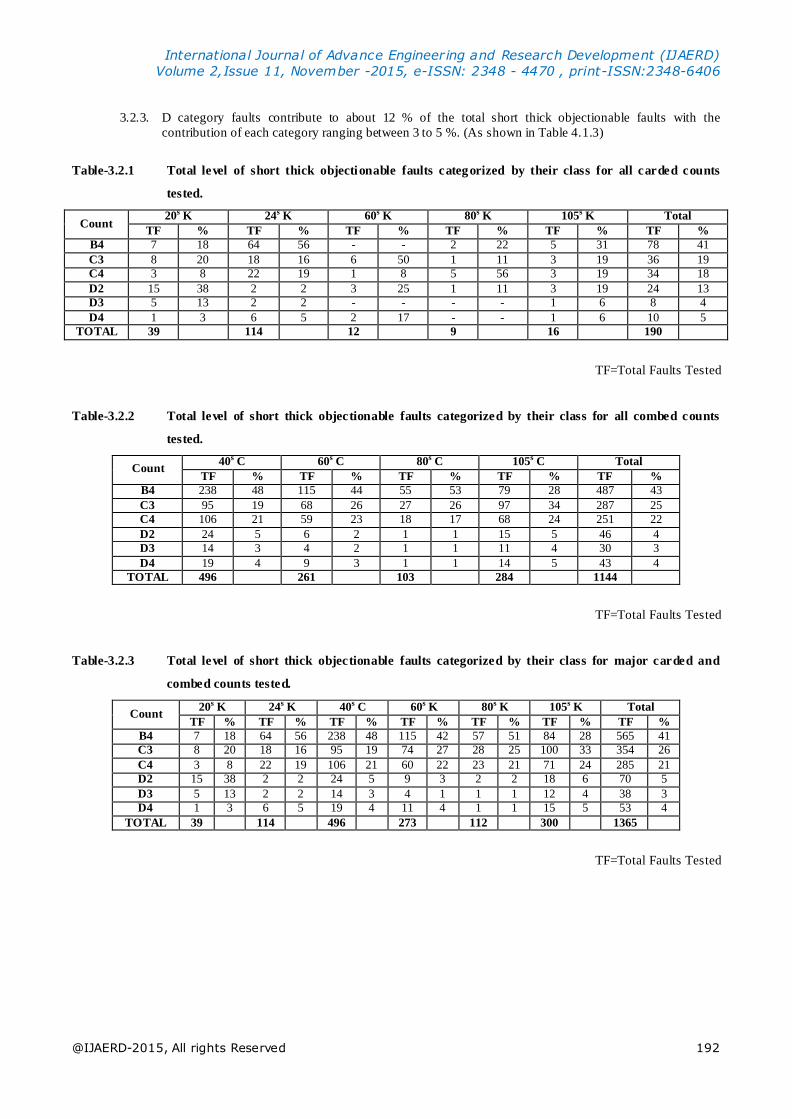
3.2. Analysis of level of short thick objectionable faults class wise.
So far all the data has been categorized and analyzed as per the type of fault, however in practical mill condition it is
difficult and time consuming for the mill to categorize various faults as per their types. Mills have class wise data of
faults with them as obtained from the testing instrument therefore we have redesigned the table as per the classes
obtained and analyzed accordingly for their ease and convenience.
3.2.1. As expected, the percent contribution of B4 category of faults to the total short thick objectionable fau lt
has been found to be highest of order of 41 % ranging from 30 to 50 %. (Can be seen from Table 4.1.1)
3.2.2. The C category fault which included C3 and C4 together contribute about 47 % of the total short thick
objectionable fault. The percent contribution in both category was found to be 26 and 21 % respectively.
(Table 4.1.3)
Fault Class
Mill C Mill E Mill F Mill D
80 C 80 K 105 C 105 K 50 C 95 C 40 C 80 C 105 C
A1 228.00 1122.00 541.00 2945.00 209.0 853.00 133.00 224.09 423.83
A2 55.00 108.00 97.50 219.00 45.0 154.50 28.93 46.43 96.75
A3 10.70 11.70 21.20 24.30 11.6 16.50 6.30 8.90 15.09
A4 3.30 2.30 8.30 2.70 5.4 2.50 2.77 5.22 7.86
A 297.00 1244.00 668.00 3191.00 271.00 1026.50 171.00 284.64 543.53
B1 17.00 21.00 30.00 75.00 14.0 39.50 4.53 13.36 18.65
B2 24.30 23.90 43.00 43.00 24.0 61.00 6.03 19.45 32.13
B3 3.40 4.60 17.10 12.20 6.2 24.60 3.23 8.05 17.70
B4 3.30 3.50 6.90 6.80 3.8 6.40 1.70 6.68 6.62
B 48.00 53.00 97.00 137.00 48.00 131.50 15.50 47.55 75.10
C1 6.00 3.00 8.30 14.00 3.8 8.00 0.23 1.60 4.20
C2 5.10 5.00 8.20 16.00 2.4 20.00 1.30 4.70 9.01
C3 3.40 1.20 9.60 6.90 0.7 18.55 1.57 2.77 7.13
C4 4.50 5.80 6.90 4.10 2.3 8.95 1.53 3.36 6.41
C 19.00 15.00 33.00 41.00 9.20 55.50 4.63 12.44 26.75
D1 4.50 1.20 3.00 7.40 1.5 3.20 0.87 0.11 0.15
D2 3.40 3.50 2.60 5.50 0.0 1.90 0.33 0.42 1.08
D3 1.10 1.20 2.70 1.40 1.5 3.50 0.17 0.21 1.00
D4 0.00 1.10 3.70 2.70 0.0 3.75 0.33 0.77 2.01
D 9.00 7.00 12.00 17.00 3.00 12.35 1.70 1.51 4.23
E 1.10 1.10 4.15 2.70 3.0 0.80 0.50 0.76 2.08
F 5.60 9.30 13.50 22.00 7.7 9.15 2.47 2.42 3.27
G 0.00 0.00 0.30 5.50 2.3 1.65 0.90 0.35 1.08
H1 35.00 287.70 413.55 986.00 12.9 92.80 2.93 26.85 109.60
H2 0.00 2.30 0.95 19.00 6.1 1.20 0.50 0.60 1.29
I1 0.00 0.00 0.30 1.30 0.0 0.85 0.77 0.25 1.07
I2 1.10 1.10 2.75 5.50 4.6 3.90 0.67 0.87 2.81
Total
fault 415.80 1620.50 1245.50 4428.00 367.80 1336.20 201.57 378.24 770.81
16class
fault 373.00 1319.00 810.00 3386.00 331.20 1225.85 192.83 346.13 649.62
Obj. fault
15.60 15.10 38.10 24.60 13.70 43.65 8.07 19.02 31.03
Long
thick 6.70 10.40 17.95 30.20 13.00 11.60 3.87 3.54 6.43
Long
thin 36.10 291.10 417.55 1011.80 23.60 98.75 4.87 28.57 114.77
Tested
Length 100 Km 100 Km 200 Km 100 Km 300 Km 1300 Km 1300 Km 100 Km 200 Km
International Journal of Advance Engineering and Research Development (IJAERD)
Volume 2,Issue 11, November -2015, e-ISSN: 2348 - 4470 , print-ISSN:2348-6406
@IJAERD-2015, All rights Reserved 192
3.2.3. D category faults contribute to about 12 % of the total short thick objectionable faults with the
contribution of each category ranging between 3 to 5 %. (As shown in Table 4.1.3)
Table-3.2.1 Total level of short thick objectionable faults categorized by their class for all carded counts
tested.
Count 20s K 24s K 60s K 80s K 105s K Total
TF % TF % TF % TF % TF % TF %
B4 7 18 64 56 - - 2 22 5 31 78 41
C3 8 20 18 16 6 50 1 11 3 19 36 19
C4 3 8 22 19 1 8 5 56 3 19 34 18
D2 15 38 2 2 3 25 1 11 3 19 24 13
D3 5 13 2 2 - - - - 1 6 8 4
D4 1 3 6 5 2 17 - - 1 6 10 5
TOTAL 39 114 12 9 16 190
TF=Total Faults Tested
Table-3.2.2 Total level of short thick objectionable faults categorized by their class for all combed counts
tested.
Count 40s C 60s C 80s C 105s C Total
TF % TF % TF % TF % TF %
B4 238 48 115 44 55 53 79 28 487 43
C3 95 19 68 26 27 26 97 34 287 25
C4 106 21 59 23 18 17 68 24 251 22
D2 24 5 6 2 1 1 15 5 46 4
D3 14 3 4 2 1 1 11 4 30 3
D4 19 4 9 3 1 1 14 5 43 4
TOTAL 496 261 103 284 1144
TF=Total Faults Tested
Table-3.2.3 Total level of short thick objectionable faults categorized by their class for major carded and
combed counts tested.
Count 20s K 24s K 40s C 60s K 80s K 105s K Total
TF % TF % TF % TF % TF % TF % TF %
B4 7 18 64 56 238 48 115 42 57 51 84 28 565 41
C3 8 20 18 16 95 19 74 27 28 25 100 33 354 26
C4 3 8 22 19 106 21 60 22 23 21 71 24 285 21
D2 15 38 2 2 24 5 9 3 2 2 18 6 70 5
D3 5 13 2 2 14 3 4 1 1 1 12 4 38 3
D4 1 3 6 5 19 4 11 4 1 1 15 5 53 4
TOTAL 39 114 496 273 112 300 1365
TF=Total Faults Tested
International Journal of Advance Engineering and Research Development (IJAERD)
Volume 2,Issue 11, November -2015, e-ISSN: 2348 - 4470 , print-ISSN:2348-6406
@IJAERD-2015, All rights Reserved 193
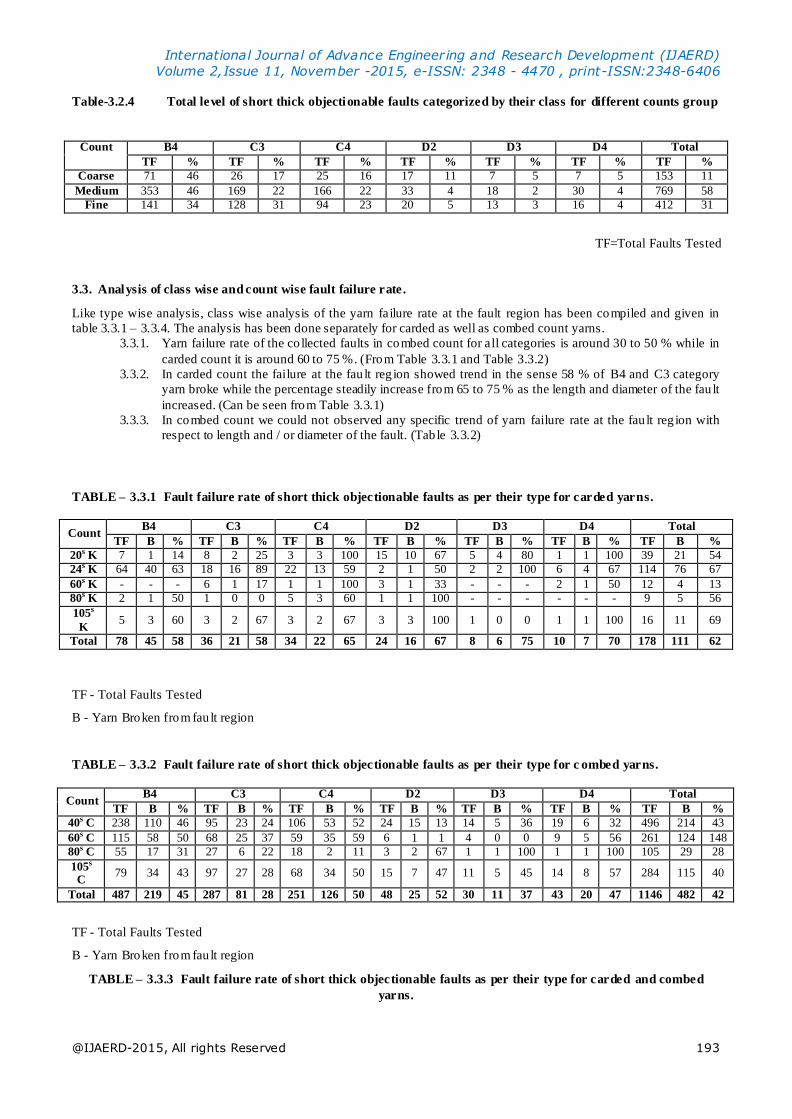
Table-3.2.4 Total level of short thick objectionable faults categorized by their class for different counts group
Count B4 C3 C4 D2 D3 D4 Total
TF % TF % TF % TF % TF % TF % TF %
Coarse 71 46 26 17 25 16 17 11 7 5 7 5 153 11
Medium 353 46 169 22 166 22 33 4 18 2 30 4 769 58
Fine 141 34 128 31 94 23 20 5 13 3 16 4 412 31
TF=Total Faults Tested
3.3. Analysis of class wise and count wise fault failure rate.
Like type wise analysis, class wise analysis of the yarn failure rate at the fault region has been compiled and given in
table 3.3.1 – 3.3.4. The analysis has been done separately for carded as well as combed count yarns.
3.3.1. Yarn failure rate of the co llected faults in combed count for all categories is around 30 to 50 % while in
carded count it is around 60 to 75 %. (From Table 3.3.1 and Table 3.3.2)
3.3.2. In carded count the failure at the fau lt reg ion showed trend in the sense 58 % of B4 and C3 category
yarn broke while the percentage steadily increase from 65 to 75 % as the length and diameter of the fau lt
increased. (Can be seen from Table 3.3.1)
3.3.3. In combed count we could not observed any specific trend of yarn failure rate at the fau lt reg ion with
respect to length and / or diameter of the fault. (Tab le 3.3.2)
TABLE – 3.3.1 Fault failure rate of short thick objectionable faults as per their type for carded yarns.
Count B4 C3 C4 D2 D3 D4 Total
TF B % TF B % TF B % TF B % TF B % TF B % TF B %
20s K 7 1 14 8 2 25 3 3 100 15 10 67 5 4 80 1 1 100 39 21 54
24s K 64 40 63 18 16 89 22 13 59 2 1 50 2 2 100 6 4 67 114 76 67
60s K - - - 6 1 17 1 1 100 3 1 33 - - - 2 1 50 12 4 13
80s K 2 1 50 1 0 0 5 3 60 1 1 100 - - - - - - 9 5 56
105s
K 5 3 60 3 2 67 3 2 67 3 3 100 1 0 0 1 1 100 16 11 69
Total 78 45 58 36 21 58 34 22 65 24 16 67 8 6 75 10 7 70 178 111 62
TF - Total Faults Tested
B - Yarn Broken from fau lt region
TABLE – 3.3.2 Fault failure rate of short thick objectionable faults as per their type for c ombed yarns.
Count B4 C3 C4 D2 D3 D4 Total
TF B % TF B % TF B % TF B % TF B % TF B % TF B %
40s C 238 110 46 95 23 24 106 53 52 24 15 13 14 5 36 19 6 32 496 214 43
60s C 115 58 50 68 25 37 59 35 59 6 1 1 4 0 0 9 5 56 261 124 148
80s C 55 17 31 27 6 22 18 2 11 3 2 67 1 1 100 1 1 100 105 29 28
105s C
79 34 43 97 27 28 68 34 50 15 7 47 11 5 45 14 8 57 284 115 40
Total 487 219 45 287 81 28 251 126 50 48 25 52 30 11 37 43 20 47 1146 482 42
TF - Total Faults Tested
B - Yarn Broken from fau lt region
TABLE – 3.3.3 Fault failure rate of short thick objectionable faults as per their type for carded and combed
yarns.
International Journal of Advance Engineering and Research Development (IJAERD)
Volume 2,Issue 11, November -2015, e-ISSN: 2348 - 4470 , print-ISSN:2348-6406
@IJAERD-2015, All rights Reserved 194
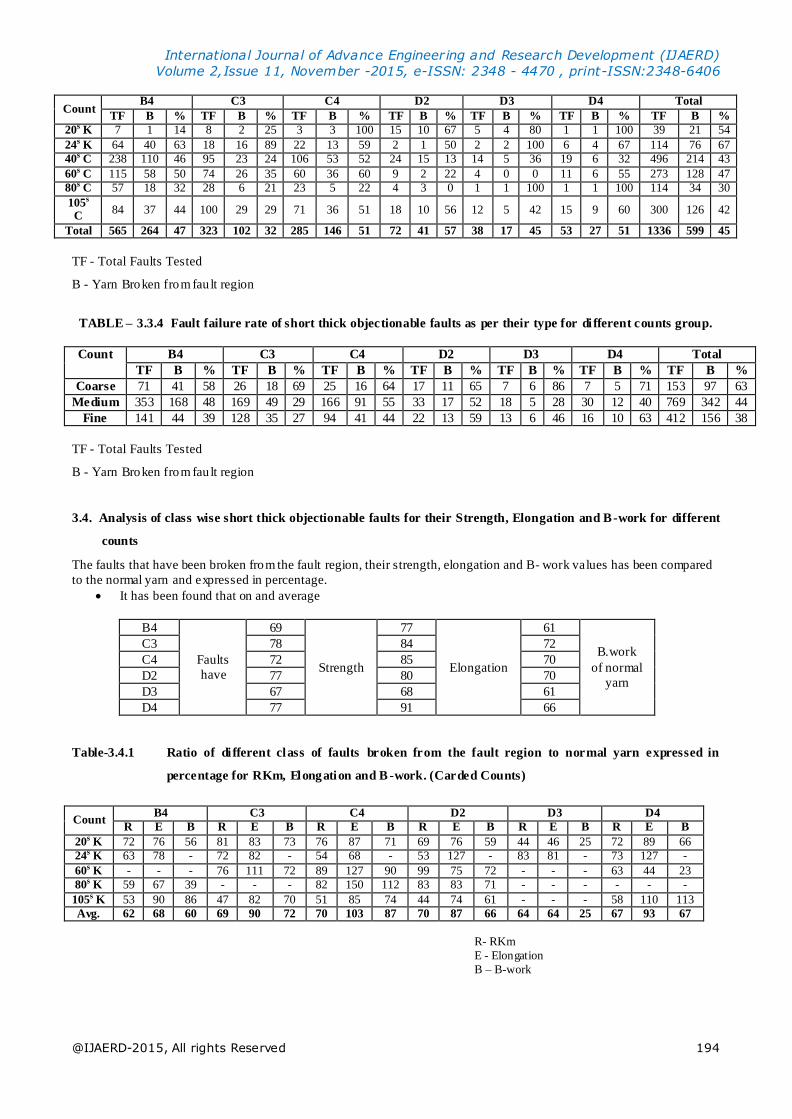
Count B4 C3 C4 D2 D3 D4 Total
TF B % TF B % TF B % TF B % TF B % TF B % TF B %
20s K 7 1 14 8 2 25 3 3 100 15 10 67 5 4 80 1 1 100 39 21 54
24s K 64 40 63 18 16 89 22 13 59 2 1 50 2 2 100 6 4 67 114 76 67
40s C 238 110 46 95 23 24 106 53 52 24 15 13 14 5 36 19 6 32 496 214 43
60s C 115 58 50 74 26 35 60 36 60 9 2 22 4 0 0 11 6 55 273 128 47
80s C 57 18 32 28 6 21 23 5 22 4 3 0 1 1 100 1 1 100 114 34 30
105s C
84 37 44 100 29 29 71 36 51 18 10 56 12 5 42 15 9 60 300 126 42
Total 565 264 47 323 102 32 285 146 51 72 41 57 38 17 45 53 27 51 1336 599 45
TF - Total Faults Tested
B - Yarn Broken from fau lt region
TABLE – 3.3.4 Fault failure rate of short thick objectionable faults as per their type for di fferent counts group.
Count B4 C3 C4 D2 D3 D4 Total
TF B % TF B % TF B % TF B % TF B % TF B % TF B %
Coarse 71 41 58 26 18 69 25 16 64 17 11 65 7 6 86 7 5 71 153 97 63
Medium 353 168 48 169 49 29 166 91 55 33 17 52 18 5 28 30 12 40 769 342 44
Fine 141 44 39 128 35 27 94 41 44 22 13 59 13 6 46 16 10 63 412 156 38
TF - Total Faults Tested
B - Yarn Broken from fau lt region
3.4. Analysis of class wise short thick objectionable faults for their Strength, Elongation and B-work for different
counts
The faults that have been broken from the fault region, their strength, elongation and B- work values has been compared
to the normal yarn and expressed in percentage.
It has been found that on and average
B4
Faults
have
69
Strength
77
Elongation
61
B.work
of normal
yarn
C3 78 84 72
C4 72 85 70
D2 77 80 70
D3 67 68 61
D4 77 91 66
Table-3.4.1 Ratio of di fferent class of faults broken from the fault region to normal yarn expressed in
percentage for RKm, Elongation and B -work. (Carded Counts)
Count B4 C3 C4 D2 D3 D4
R E B R E B R E B R E B R E B R E B
20s K 72 76 56 81 83 73 76 87 71 69 76 59 44 46 25 72 89 66
24s K 63 78 - 72 82 - 54 68 - 53 127 - 83 81 - 73 127 -
60s K - - - 76 111 72 89 127 90 99 75 72 - - - 63 44 23
80s K 59 67 39 - - - 82 150 112 83 83 71 - - - - - -
105s K 53 90 86 47 82 70 51 85 74 44 74 61 - - - 58 110 113
Avg. 62 68 60 69 90 72 70 103 87 70 87 66 64 64 25 67 93 67
R- RKm
E - Elongation
B – B-work
International Journal of Advance Engineering and Research Development (IJAERD)
Volume 2,Issue 11, November -2015, e-ISSN: 2348 - 4470 , print-ISSN:2348-6406
@IJAERD-2015, All rights Reserved 195
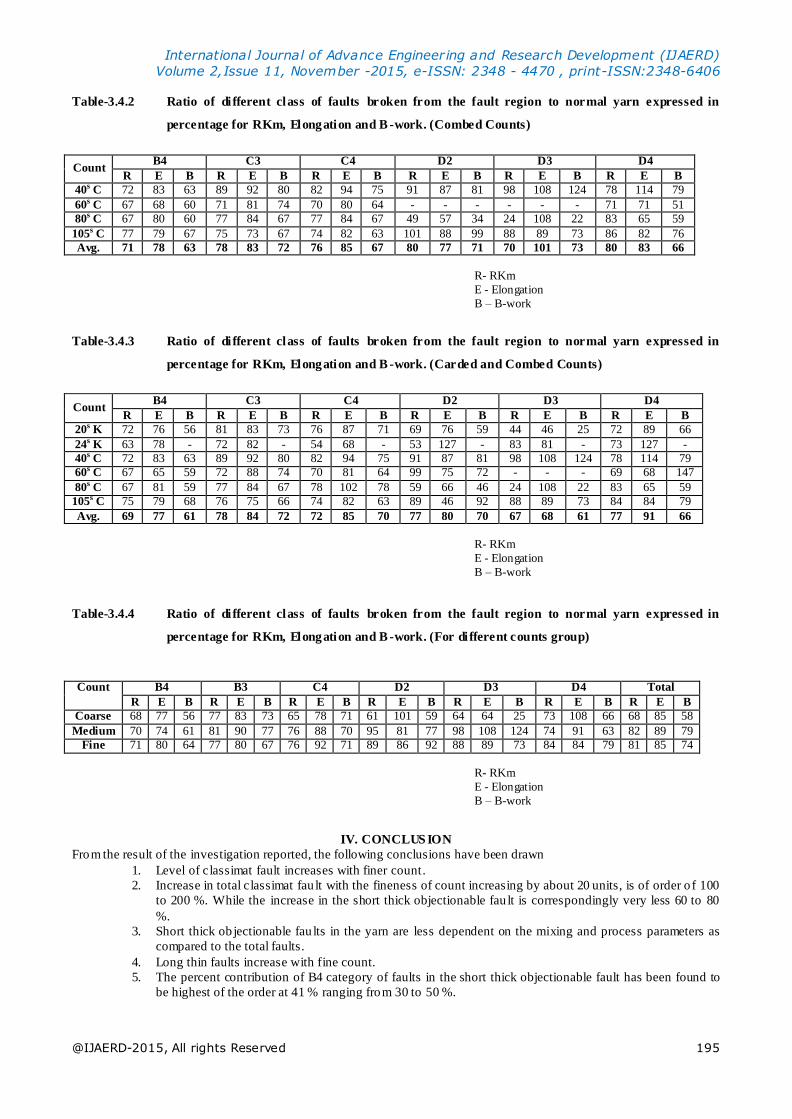
Table-3.4.2 Ratio of di fferent class of faults broken from the fault region to normal yarn expressed in
percentage for RKm, Elongation and B -work. (Combed Counts)
Count B4 C3 C4 D2 D3 D4
R E B R E B R E B R E B R E B R E B
40s C 72 83 63 89 92 80 82 94 75 91 87 81 98 108 124 78 114 79
60s C 67 68 60 71 81 74 70 80 64 - - - - - - 71 71 51
80s C 67 80 60 77 84 67 77 84 67 49 57 34 24 108 22 83 65 59
105s C 77 79 67 75 73 67 74 82 63 101 88 99 88 89 73 86 82 76
Avg. 71 78 63 78 83 72 76 85 67 80 77 71 70 101 73 80 83 66
R- RKm
E - Elongation
B – B-work
Table-3.4.3 Ratio of di fferent class of faults broken from the fault region to normal yarn expressed in
percentage for RKm, Elongation and B -work. (Carded and Combed Counts)
Count B4 C3 C4 D2 D3 D4
R E B R E B R E B R E B R E B R E B
20s K 72 76 56 81 83 73 76 87 71 69 76 59 44 46 25 72 89 66
24s K 63 78 - 72 82 - 54 68 - 53 127 - 83 81 - 73 127 -
40s C 72 83 63 89 92 80 82 94 75 91 87 81 98 108 124 78 114 79
60s C 67 65 59 72 88 74 70 81 64 99 75 72 - - - 69 68 147
80s C 67 81 59 77 84 67 78 102 78 59 66 46 24 108 22 83 65 59
105s C 75 79 68 76 75 66 74 82 63 89 46 92 88 89 73 84 84 79
Avg. 69 77 61 78 84 72 72 85 70 77 80 70 67 68 61 77 91 66
R- RKm
E - Elongation
B – B-work
Table-3.4.4 Ratio of di fferent class of faults broken from the fault region to normal yarn expressed in
percentage for RKm, Elongation and B -work. (For di fferent counts group)
Count B4 B3 C4 D2 D3 D4 Total
R E B R E B R E B R E B R E B R E B R E B
Coarse 68 77 56 77 83 73 65 78 71 61 101 59 64 64 25 73 108 66 68 85 58
Medium 70 74 61 81 90 77 76 88 70 95 81 77 98 108 124 74 91 63 82 89 79
Fine 71 80 64 77 80 67 76 92 71 89 86 92 88 89 73 84 84 79 81 85 74
R- RKm
E - Elongation
B – B-work
IV. CONCLUS ION
From the result of the investigation reported, the following conclusions have been drawn
1. Level of classimat fault increases with finer count.
2. Increase in total classimat fau lt with the fineness of count increasing by about 20 units, is of order o f 100
to 200 %. While the increase in the short thick objectionable fau lt is correspondingly very less 60 to 80
%.
3. Short thick ob jectionable fau lts in the yarn are less dependent on the mixing and process parameters as
compared to the total faults.
4. Long thin faults increase with fine count.
5. The percent contribution of B4 category of faults in the short thick objectionable fault has been found to
be highest of the order at 41 % ranging from 30 to 50 %.
International Journal of Advance Engineering and Research Development (IJAERD)
Volume 2,Issue 11, November -2015, e-ISSN: 2348 - 4470 , print-ISSN:2348-6406
@IJAERD-2015, All rights Reserved 196
6. The C category of faults which include C3 and C4 contribute about 47 % of the total short thick
objectionable faults.
7. D category faults contribute to about 12 % of the total short thick objectionable faults.
8. The yarn failure rate in combed count is around 30 to 50 % while in carded counts it is around 60 to 75
%.
9. About 58 % B4 and C3 categories yarn fault broke while percentage steadily increased from 65 to 95 %
as the length and diameter of fau lts increased.
10. In case of carded counts 62 % faults break at the fau lt region and 42 % in case of the combed yarn.
11. The failure rate from the fau lt region in carded yarn is much more than in combed yarn.
12. The probability of the yarn breaking from fault region low as the count becomes finer.
13. If the B-work of fault is around 50 to 55% of normal yarn, then about 75 to 85 % of such faults are likely
to break.
14. If B-work is above 70 % the possibility of yarn failure from fault region is around 20 to 25 %.
V. ACKNOWLEDGEMENT
The author extend his sincere thanks to his peers for the cooperation provided by them and other industrial personnel for
their support as well as every indiv iduals who knowingly or unknowingly supported me in my task of writ ing this
Research paper.
REFERENCES
[1] A. R. Garde, 37th All India Text ile conference., 1998, Page 87
[2] K. Kumarswamy and I. Sheriff-20th Joint Technological conference of A.B.S., 1997, Page 7.1
[3] Keisoki Kogyo, Text ile Trends India., 32, No. 7, Oct. 1989, Page 67-68
[4] M. N. Vijayshankar and A. K. Gupta, ATIRA., Oct. 1984, Page 1
[5] V. Ramachandran, Journal of the Text ile Association(Bombay).,Sept-Oct. 1996, No 3, P 153
[6] R. N. Yadav, Manmade Text ile India, 36, No. 5, May 1993, Page 185-188
[7] Aggarwal S. K. and Hari P. K., The Indian Textile Journal, Feb 1989, Page 118
[8] Subramanium T. A. and Hari P. K., Text ile Asia, Feb. 1987, Page 16
[9] Doleki M., J. Text. Inst., 1947, 68
[10] Textile Magazine (Madras)., Ju ly 2002, 43, No. 9, Page 31
[11] Biradar M. M. (Reymond Ltd)., Text ile Magazine (Madras)., Ju ly 2001, 42, No. 9, 117
[12] Gangopadhyay U. K., M. Tech. Thesis., M. S. University, Baroda, 1984
[13] Varma T. M. K., Ramaswamy S., Indian Text ile Journal, 102, No. 4, Jan. 1992, Page 88-91
[14] Textile Magazine(Madras)., Sept. 1998, 39, No. 11, Page 41
[15] K. P. Pillay, T. V. Ratan, SITRA, Dec. 1981, Vol. 21, No. 3
[16] K. Kumarswamy and Sharieff, Journal of Text ile Assoc., Vol. 40, Nov. 1979, No. 6, Page 213
[17] Viswanath C. S., Jumdar C. R., et al. ITJ, 102, No. 1, Oct. 1991, 90-93
[18] P. Bhat, C. D. Kane, et al., Technological Conference, Resume of Papers, BITRA, SITRA, NITRA and ATIRA., Apr. 1993, 65-72
Top Related
Copyright © 2022 FDOKUMEN

