


Bahasa
Halaman
Hukum

Biochemistry 1994, 33, 4019-4035 4019
Characterization of the Active Site of p21 ras by Electron Spin-Echo Envelope Modulation Spectroscopy with Selective Labeling: Comparisons between GDP and
GTP Forms? Christopher J. Halkides,* Christian T. Farrar,$ Russell G. Larsen,ll Alfred G. Redfield,',$ and David J. Singel',$
Department of Biochemistry, Brandeis University, Waltham, Massachusetts 02254, and Department of Chemistry, Haruard University, Cambridge, Massachusetts 021 38
Received December 7, 1993; Revised Manuscript Received January 24, 1994"
ABSTRACT: Selectively labeled samples of human H- or N-ras p21 ligated to MnIIGDP or MnIIGMPPNP were studied by electron spin-echo envelope modulation spectroscopy in order to define the protein environment around the divalent metal. We incorporated [4-13C]-labeled Asx into p21-MnI1GDP and found that the distance from the carboxyl 13C of Asp57 to MnIIis -4.1 A. Our result is consistent with indirect coordination of this residue to the metal. From a [2-ZH]Thr-labeled sample, we estimate that the distance from the Mn" ion to the ZH of Thr35 is at least 5.8 A. Thus, the only protein or nucleotide ligands to the metal appear to be Serl7 and the &phosphate of GDP, as previously reported [Larsen, R. G., Halkides, C. J., Redfield, A. G., & Singel, D. J. (1992b) J . Am. Chem. SOC. 114,9608-961 13. In the 5'-guanylylimido diphosphate (GMPPNP) form of p21, Thr35 has been reported by X-ray crystallography to be a ligand of the metal via its hydroxyl group, and this residue appears to play a key role in the biologically important conformational change upon nucleotide substitution [Pai, E. F., Krengel, U., Petsko, G., Goody, R. S., Kabsch, W., & Wittinghofer, A. (1990) EMBO J. 9, 2351-23591. The ESEEM spectrum of p21.MnIIGMPPNP labeled with [2-2H]Thr yields a Mn1I-*H distance of 4.9 A, a distance inconsistent with strong coordination. A sample of p21 in which the Thr residues were fully labeled with 13C and 15N yielded a value of 5.0 A for the distance from MnlI to the amide nitrogen of Thr35, while the 13C signal is much smaller than expected if Thr35 were coordinated. A [ 15N]~erine/glycine-labeled sample gives a distance to the amide 15N of Ser l7 of 3.9 A, consistent with the X-ray structure; a [4-13C]-labeled Asx sample of p21 gives a distance of -4 A between Mn" and the label of Asp57, again implying indirect coordination. Both of these values are very similar to those found for the GDP form of the protein. The results for Thr35, however, reveal a structural difference between the GDP and GTP forms in the region of Thr35. In addition, the position of this residue is found to be different from the crystal structure and in a manner suggesting that the metal ligation of Thr35 does not drive the conformational change that accompanies nucleotide substitution.
The human ras genes and their products, p21 N-, H-, and K-rad , have received intense scrutiny in the 15 years since their discovery. The normal ras gene products transmit a signal for cellular growth and differentiation (Bourne et al., 1990). Mutations within the ras gene are associated with
t Supported by USPHS Grant 7UI01 CA51992 to Onyx Corp. and NIH Grant 5R 37 GM20168. C.J.H. was supported by NIH Postdoctoral Fellowship CA08872. C.T.F. was supported by NIH Training Grant 5 T32 GM08313-04. R.G.L. was supported by NIH Training Grants GM083 13 and GM07598.
t Brandeis University. 5 Harvard University. 11 Present address: Department of Chemistry, University of California,
e Abstract published in Advance ACS Abstracts, March 15, 1994. Abbreviations: p21, product of the ras genes; N, neurobastoma; H,
Harvey; K, Kirsten; GAP, GTPase-activating protein; NF-1, product of the neurofibromatosis type- 1 gene; EF-Tu, elongation factor Tu; ESEEM, electron spin-echo envelope modulation; NMR, nuclear magnetic resonance; EPR, electron paramagnetic resonance; ENDOR, electron- nuclear double resonance; GC/MS, gas chromatography/mass spec- trometry; HPLC, high-performance liquid chromatography; GMPPNP, 5'-guanylylimido diphosphate; GMPPCP, 5'-guanylylmethylene diphos- phonate; GDP, guanosine 5'-diphosphate; GTP, guanosine 5'-triphosphate; GTPyS, guanosine 5'-0-(3-thiotriphosphate); LB, Luria broth; IPTG, isopropyl 0-D-thiogalactoside; SDS-PAGE, sodium dodecyl sulfate- polyacrylamide gel electrophoresis; Tris, tris(hydroxymethy1)ami- nomethane; DTT, dithiothreitol; PMSF, phenylmethanesulfonyl fluoride; EDTA, ethylenediaminetetraacetic acid; HEPES, N-(2-hydroxyethyl)- N-2-piperazineethanesulfonic acid; A , absorbance; AU, absorbance unit; RecA, recombination factor A; XAFS, X-ray absorption fine structure.
Berkeley, CA.
0006-2960 f 94 /0433-4019$04.50/0
roughly 30% of all human cancers (Downward, 1992); in colorectal tumors, mutations in the K-ras gene are found about 50% of the time (Shirasawa et al., 1993). Moreover, inactivation of the mutated K-ras gene by insertion of foreign DNA (in a homologous recombination event) caused colon cancer cells to grow more slowly and to lose the capacity for anchorage-independent growth, among other changes. This result implies that mutations in the K-ras gene are responsible for the malignant phenotype in these cell lines (Shirasawa et al., 1993).
The gene products of the three variants of ras p21 found in humans, H-ras, K-ras, and N-ras (henceforth collectively referred to as p21), have identical sequences through the first 80 amino acids and are very nearly identical beyond that, except for the C-terminal region (Barbacid, 1987). Their biochemical properties are generally quite similar. The ras proteins (Mr 21 600) avidly bind the divalent metal ion complexes of GDP or GTP. The GTP-bound form is active in signaling cells to grow or to differentiate, while the GDP- bound form is the predominant species in quiescent cells (Moodie et al., 1993). Conversion from the GDP-bound state is mediated by exchange factors; return to the GDP state via hydrolysis is stimulated by the proteins GAP and NF-1 (Bollag & McCormick, 1991). The mechanism by which GAP stimulates the GTPase rate of p21 by 1.5 X 105-fold (Gideon et al., 1992) is not known. The affinities of GAP for the three
0 1994 American Chemical Society
4020
variants of p21 ras are equal (Bollag & McCormick, 1991; G. Bollag, personal communication). GAP has also long been suspected of being the downstream target (effector) of p21 in the signaling pathway, and its affinity for the GTP-bound form of p21 is much greater than its affinity for the GDP- bound form (McCormick, 1989). Recently, a more plausible candidate for the effector of p21 has emerged, namely, p74 rafl (Moodie et al., 1993), although it is still not understood how p21 activates its effector.
Two independent research groups have determined the crystal structure of p21 in the GDP form (Schlichting et al., 1990; Tong et al., 1991) and in GTP analog forms (Pai et al., 1990; Brunger et al., 1990). Recently, a model of the p21.GDP structure based partly on the X-ray structure of EF-Tu-GDP was presented (Stouten et al., 1993). These studies have implicated three amino acid residues as possible ligands to the divalent metal associated with the GTPase action of p2 I : Serl7, Thr35, and Asp57. Site-specific mutation studies have shown that replacement of any one of the three residues by alanine abolishes the GAP-dependent GTPase of p21 and, apparently, the ability to transform cells (John et al., 1993). These mutations stand in contrast to mutations at positions 12 and 61, which abolish the GAP-dependent GTPase of p21 and confer transforming potential to p21 (McCormick, 1989).
According to the crystal structures, when GTP replaces GDP, a large conformational change occurs in the vicinity of Thr35, whose hydroxyl group is a ligand in the GTP- but not the GDP-bound state. This change in coordination is sometimes described as controlling the conformational change in this region of the protein (Marshall, 1993). Since residues 31-38, known as the effector region, are implicated by mutagenesis as being critical for the binding of the effector and GAP (Marshall, 1993), it is likely that these proteins recognize the conformational change in this region. Knowl- edge of this change may be crucial to understanding the precise contacts formed in these protein-protein interactions.
One disagreement between the two X-ray structures of p21.GDP pertains to the role of Asp57, which is conserved among all GTPase proteins, including EF-Tu (Bourne et al., 1991). The side-chain carboxyl group of this residue was reported to coordinate directly to magnesium in a structure of p2 1.GDP created from caged GTPsp21, after the cage group had been removed and hydrolysis had taken place (Schlicting et al., 1990). In a second reported structure, formed by crystallizing p2 1.GDP directly, the coordination of Asp57 was mediated through a water molecule (Tong et al., 1991). In support of the latter structure, EPR studies of p21.Mn"- GDP in 170-labeled water indicated that there were four water molecules in the coordination sphere of the metal, implying that Asp57 was not directly coordinated (Latwesen et al., 1992).
The hydroxyl group of Serl7 is observed in the crystal structure to be a ligand in both nucleotide forms, and its amide group forms a hydrogen bond with the nucleotide polyphos- phate chain (Milburn et al., 1990). Mutation of this widely conserved residue (Saraste et al., 1990) to asparagine leads to a remarkable dominant negative phenotype, in which the actions of both normal and oncogenic p21 are inhibited (Farnsworth & Feig, 1991).
ESEEM (electron spin-echo envelope modulation) spec- troscopy detects the magnetic resonance frequencies of nuclei coupled to the unpaired electrons of a paramagnetic center (Mims & Peisach, 198 1) and is well-suited to probe the local structure of a protein in the vicinity of a paramagnetic probe. ESEEM spectra report two kinds of interactions between the
Biochemistry, Vol. 33, No. 13, I994 Halkides et al.
unpaired electrons of a Mn" spin probe and NMR-active nuclei: dipolar coupling and contact coupling. Dipolar coupling is a through-space interaction that is a known function of the electron-nuclear distance. For Mn", it is reasonable to regard the coupling as an interaction between point magnetic dipoles located at the observed nucleus and the manganese atomic positions (deBeer et al., 1993; Larsen et al., 1993). Contact coupling is transmitted through bonding electrons, i.e., contact interaction can only occur when a linkage of chemical bonds is present between the nucleus of interest and the paramagnetic center. The size of the contact interaction is proportional to the spin density at the observed nucleus. The spin density depends upon both the degree of covalency of the bonds between the metal and ligands and the coordination geometry; therefore, it is not simple to predict the size of this interaction. The contact interaction is the predominant one for the @-phosphorus atom of p21.GDP, in which the @-phosphate group coordinates the divalent metal (Larsen et al., 1992b).
ESEEM can detect interactions that are too small to be observed by EPR in the solid state. One advantage of ESEEM spectroscopy over NMR is that somewhat smaller quantities of protein are required in an ESEEM study. Another is that ESEEM spectra are far less sensitive to the size of the molecule under study than are NMR spectra, a property that permits the use of ESEEM to study relatively large protein complexes of p21 and its cohorts. The fact that the ESEEM amplitude depends so strongly on the electron-nuclear distance imparts a high selectivity for nuclei near the paramagnetic center, and this fact allows one to focus on the active site of a macromolecule. A drawback of ESEEM spectroscopy is the typical requirement for cryogenic temperatures and glasslike samples, which necessitates an assessment of the effects of cryoprotective solutions on the activity of the protein.
We have previously reported results of ESEEM studies of p21.Mn"GDP in which the nitrogen of the amide group for each serine residue was selectively enriched with 15N. The amide nitrogen of Ser 17 gave a strong signal solely from dipolar interaction with Mn", and the distance between the two was in agreement with the X-ray data (Larsen et al., 1992b). The two phosphorus nuclei gave a rich spectrum in which the a-phosphorus gave a signal solely from dipolar interaction, similar to the amideof Serl7. The @-phosphorus, by contrast, sustains both dipolar and contact interactions with the Mn" ion. The distances from both nuclei were found to be similar to those determined by X-ray methods.
Samples of p21 selectively labeled with threonine or aspartate should produce ESEEM spectra because of the proximity of each side chain to Mn"; the intensity and position of the signals from each labeled nucleus will depend upon whether or not Thr35 or Asp57 is directly coordinated. A label incorporated into a noncoordinated residue within about a 6-A radius would be expected to give a characteristic ESEEM spectrum comprised of a fundamental peak at the nuclear Zeeman frequency (Y,), which is a property of the isotopic label, as well as a combination peak at 2v, (this signal is counterphase to the fundamental). The area of the ESEEM signal from this weakly coupled label would be proportional to r6, where r is the effective distance between the nucleus and the Mn" ion. Direct coordination of the residue, on the other hand, would bring the labeled nucleus closer to the metal, leading to larger dipolar interactions and, potentially, contact coupling. A nucleus with appreciable contact coupling exhibits an ESEEM spectrum comprising resolved fundamental lines at frequencies significantly different from v,, but the spectrum
ras p21 Active-Site Structure
retains a combination peak near 2v,. It is worth noting that dipolar broadening of the fundamental peaks can be com- pensated in the 2v, combination peak, thus increasing its observability relative to the fundamental (Larsen et al., 1992a).
Herein, we report further data on the residues thought to be ligands in one or the other nucleotide states. These studies were undertaken as a prelude to work on complexes of p21 and other proteins. Unexpectedly, we find that the change in position of Thr35 when GDP is exchanged for a GTP analog is smaller than that seen by X-ray diffraction. This result suggests a different interpretation of the conformational changes in solution caused by nucleotide substitution.
MATERIALS AND METHODS
Selectively labeled samples of p21 were produced by growing auxotrophic strains of Escherichia coli harboring the plasmid bearing the ras gene in a medium containing the labeled amino acid(s). The protein was refolded from inclusion bodies and purified as the GDP complex. In some protein samples the nucleotide was changed to a GTP analog using alkaline phosphatase, which degraded the tightly bound GDP, and samples of protein in both nucleotide forms were then put into the Mnr* form by equilibrium dialysis. The samples were cooled to 77 K for storage, and ESEEM spectra wererecorded at 4.2 K. Small samples of protein were hydrolyzed and submitted to GC/MS analysis to determine the extent of isotopic enrichment.
Reagents. [4-13C]Aspartic acid was purchased from Isotec or Cambridge Isotope Laboratories; [ lSN]glycine, D,L-[ W ] - lysine, [ l-ZH]acetaldehyde, [2-l3C]aceta1dehyde, and L-[ 1,2,3,4-13C,15N]threonine were from Cambridge Isotope Laboratories. N-Methylpiperidine and MnCly4HzO (99.99%) were purchased from Aldrich. Urea was from ICN Bio- medicals, Inc.; an 8 M stocksolution was stirred with molecular biology grade AG 501-X8(D) resin (20-50 mesh) from Bio- Rad for at least 2 h, filtered through Whatman no. 1, and stored at 4 OC (Spieker-Polet & Polet, 1976). The disodium salt of GDP and 4-nitrophenyl phosphate were obtained from Sigma. GMPPNP was supplied by Boehringer Mannheim Biochemicals and was purified as described previously (Miller et al., 1993). Commercial Sephadex G-10 columns were from Pharmacia. Constant-boiling HC1 was provided by Pierce; isobutyl alcohol, acetyl chloride, and heptafluorobutyric anhydride were provided by Alltech. Ethyl acetate was dried and distilled by standard methods or purchased dry from Aldrich.
Bacterial Strains. E . coli strain DL39TG, which is auxotrophic for threonine and glycine, as well as all of the amino acids of its parent strain, DL39 (LeMaster & Richards, 1988), was a gift from David LeMaster. The serine auxotroph, PA 360, was provided by Barbara Bachmann of the E. coli Stock Center.
Synthesis of D,L- Threonine. D,L- [2-2H]Threonine or D,L- [2-13C]threonine was synthesized from 1-5 g of [ l-ZH]- acetaldehyde or [2-l3C]aceta1dehyde and (N-pyruvylidene- glycinato)aquocopper(II) dihydrate (Ichikawa et al., 197 1) as described (Ohdan et al., 1974), with minor modifications. In a typical procedure, chilled acetaldehyde (5 g, 0.1 11 mol) was added to (N-pyruvylideneglycinato)aquocopper(II) di- hydrate (19.23 g, 0.074 mol), which had been taken to pH 9.8 with NaOH, in 375 mL of filter-degassed, glass-distilled water, and the reaction was taken to pH 9.8 and stoppered. The reaction was run at about 24 OC. The reaction time was typically 8 h, and the pH of the mixture was checked and, if necessary, readjusted to 9.8 several times during this period.
Biochemistry, Vol. 33, No. 13, 1994 4021
The pH of the solution was then taken to 4.5 with 5 M acetic acid, and the solution was loaded onto a 4 X 38 cm column of 50W-X4 (Bio-Rad) that had been prepared by rinsing with water (lX), ethanol (3X), 1 N HC1(3X), 0.9 N NaOH (3X), water ( l x ) , and HCl (2X), pouring the column, converting it to the H+ form, and rinsing with water. The amino acids were eluted with 5 L of HzO followed by 2 L of 0.5 M NH3, regardless of the scale of the synthesis. The flow rate was 6 mL/min. Ninhydrin-positive fractions were spotted onto silica TLC plates and developed with 70% ethanol/30% HzO (Brenner et al., 1969). Fractions containing threonine were pooled and concentrated by rotary evaporation; in some cases two pools were made. To form solid threonine, about 5 vol of ethanol were added and the mixture was allowed to stand overnight a t 4 "C, or the solution was lyophilized. In the former case, the mixture was filtered, the solid was washed with cold ethanol, and the threonine was dried in vacuo. The ratio of threonine to allothreonine was approximately 3:1, as judged by proton and carbon NMR integrations. The yield of L-threonine was approximately 37%. Some preparations contained a trace of glycine.
Expression and Purification ofp2l. All bacterial growths were performed at 37 OC; all other manipulations were performed at 6 "C, unless noted. Sterile techniques were employed throughout the growth until resuspension in soni- cation buffer. The pH values of buffers were adjusted at 23 f 2 OC, except as noted. Proteins were assayed using Coomassie brilliant blue G-250 (Bio-Rad) using serum albumin as a standard.
Auxotrophic strains of E . coli were transformed by electroporation with pTrc99C plasmids (Amann et al., 1988) bearing the N-ras gene or the H-ras gene, ampicillin resistance, and the Lac 1 4 gene. The former plasmid was provided by Onyx Pharmaceuticals, and the latter was constructed by standard cloning methodology from the plasmid pXVR, kindly provided by L. Feig (C. J. Halkides, unpublished experi- ments). To ensure that the plasmid would not be lost, ampicillin was 100 pg/L in all growth media.
The bacteria were grown and the protein was expressed as described previously (Miller et al., 1992; Hu & Redfield, 1993), with minor modifications. A single colony of an auxotrophic strain of E. coli was grown to stationary phase in LB containing ampicillin plus the antibiotic(s) required by the strain. The cells were centrifuged for 20 min at 2500g, and the pellet was resuspended in 50 mL of defined medium that was identical to one previously described (Muchmore et al., 1989), except that all of the amino acids, nucleosides, and nucloside bases were reduced 2-fold in concentration. When threonine was labeled, the strain DL39TG (aspC ilvE tyrB glyA::Tn5 Thr- 34::TnlO) was used, and 30 pg of tetracycline, 50 pg of kanamycin sulfate, and 0.11 5 g of L-threonine or 0.36 g of synthetic threonine mixture per liter of medium were included in the growth medium. The presence of D-threonine and D,L- allothreonine does not interfere with cell growth. This strain was also used to label Asp and asparagine residues by the inclusion of 200 mg/L [4-13C]Asp or to label lysine using 300 mg/L ~ , ~ - [ ~ - ~ ~ N ] l y s i n e . To label serine and glycine, strain PA360 (SerA-, streptomycinR) was grown in the presence of 30 pg/L streptomycin, serine was omitted from the medium, and 500 mg/L glycine was used.
The resuspended cells were added to a 1.5-L portion of defined medium plus antibiotics to bring the A660 to about 0.1. Bacteria were grown in a 6-L flask with shaking at approximately 220 rpm until A660 = 0.7-0.8. Then the cells were chilled rapidly on ice and spun at approximately 4300
4022
rpm in a JA-10 rotor (3200g at rmax) for 20-25 min. They were resuspended in 1.5 L of fresh, defined medium that was almost identical to the first, except that the appropriate labeled amino acids were substituted for unlabeled ones and 1 mM IPTG was included to induce the production of protein. Growth was continued in this medium until the cells reached stationary phase, and then the cells were spun down as before and resuspended in 40 mL of cold sonication buffer: 50 mM Tris (pH 7.5)/50 mM NaC1/5 mM DTT/5 mM MgC12/1 pM each pepstatin and leupeptin/ 1 mM PMSF (the PMSF was added just before use). The cells were sonicated 4X for 35 s, chilling to 2-3 "C between each sonication, and the mixture was centrifuged at 12 000 rpm (17400g) for 30 min. The pellet was resuspended in about 30 mL of 30% sucrose/ 10 mM EDTA (pH 7.0) and was spun at 14 000 rpm (23700g) for 50 min. The pellet was resuspended in 50 mM Tris (pH 7.5)/5 mM EDTA/10 mM DTT/l% Triton X-100 and centrifuged at 13 000 rpm for 30 min. The Triton step was repeated twice. All of the supernatants were set aside for later analysis by SDS-PAGE.
The protein was refolded from the remaining pellet fraction. After the pellet was solubilized in about 10 mL of 7 M urea/ 50 mM Tris.HC1 (pH 7.5)/5 mM EDTA/10 mM DTT, it was dialyzed overnight in the same buffer. The mixture was centrifuged at 17 500 rpm in a JA-20 (37000g at rmax) rotor for 50-60 min. The supernatant was saved, the pellet was resuspended in the same buffer, and the process was repeated two times. All supernatants were tested for the presence of protein by SDS-PAGE (Laemmli, 1970), and the greatest amount of protein was found in the urea supernatants. The urea supernatants were assayed for protein, pooled, diluted to 10.3 mg/mL with the same buffer, dialyzed against 2 M urea/50 mM Tris.HC1 (pH 7.5)/5 mM MgC12/5 mM DTT/ 50 pM GDP, and then dialyzed against the same buffer with 0.7 M urea. Next the protein was dialyzed 2 times against 50 mM Tris.HC1 (pH 7.5)/20 mM NaCl/5-10 mM DTT/5 mM MgC12/0.02% sodium azide/ 1 pM GDP and loaded onto a 2.7 X 27 cm column of QA-52 (Whatman) in the chloride form, equilibrated in this buffer, at 1 mL/min. The column was rinsed until the effluent had an '4280 value that was about 0.1 AU greater than that of the loading buffer (roughly 200 mL). The protein was eluted with a 20-300 mM linear gradient of NaCl in 900 mL of the same buffer at 1 mL/min. Fractions shown to contain protein by A280 were analyzed by SDS-PAGE; two pools were made and concentrated to roughly 10 mL by ultrafiltration through a YM-10 membrane with a stirred cell (Amicon). The pools were dialyzed two times against 20 mM TrisnHCl (pH 7.5)/50 mM NaCl/S mM MgC12/ 10 mM DTT/ 1 pM GDP/O.O2% sodium azide and concentrated in an ultrafiltration cell. The pools were concentrated further by centrifugation using a Centricon-3 (Amicon) prior to NMR experiments or nucleotide exchange, or they were stored as 50% glycerol stocks at -10 "C.
Nucleotide Exchange. Alkaline phosphatase was covalently immobilized onto Sepharose gel. Typically, 15 mg of calf intestine alkaline phosphatase (Boehringer Mannheim, enzyme immunoassay grade) was dialyzed three times against a buffer of 30 mM N-methylpiperidine hydrochloride (pH 10.0) and concentrated to 0.35 mL in a Centricon-10. The N-meth- ylpiperidine (Aldrich) had been stirred with CaH2 for 1 day and distilled shortly before use. Fifteen 0.5-g portions of CH- Sepharose 4B, activated as the 6-aminohexanoic acid N-hy- droxysuccinimide ester (Sigma), were rinsed twice with water and once with N-methylpiperidine buffer just before use. For each portion of dry gel, 1 mg of alkaline phosphatase was
Biochemistry, Vol. 33, No. 13, 1994 Halkides et al.
added in a minimal volume of buffer. From 0.1 to 5.0 mg of alkaline phosphatase has been immobilized using 0.3-0.5 dry g of gel with this procedure. The portions of gel were incubated at 30 "C for 4 h with shaking. Three 1-mL aliquots of 1.0 M Tris.HC1/0.02% azide/lO pM ZnCl2 were used to rinse away most of the free alkaline phosphatase and to derivatize unreacted sites on the gel. Protein assay of the combined washes showed that coupling efficiency was always at least 75% and generally >go%. Gels were stored at 4 "C in Tris- AP buffer (32 mM Tris-HC1 (pH 8)/200 mM (NH&S04/ 10 mM DTT/20 pM ZnC12/0.02% sodium azide/l pM each pepstatin and leupeptin), at -15 "C in the same buffer plus 50% glycerol, or at -80 "C in the same buffer plus 20% glycerol. Samples stored for about 3 months by these methods had approximately equal activity to each other, as judged qualitatively by using a 50-pL aliquot of 1 mM 4-nitrophe- nylphosphate in Tris-AP buffer and observing a yellow color. To prepare freshly immobilized alkaline phosphatase for the exchange reaction, a 1.5-mL portion of the gel was poured into a 3-mL disposable syringe with a plastic frit on the bottom. Tris-AP buffer was flowed over the column until the effluent had negligible alkaline phosphatase activity, which was assayed using 1 mM 4-nitrophenyl phosphate as the substrate and monitoring the increase in A410 with time.
Nucleotide exchange was carried out in Tris-AP buffer essentially as described using immobilized alkaline phosphatase to degrade the tightly bound GDP (Miller et al., 1993). Typically, a sample of up to 15 mg of p21 in 0.5-1 .O mL was exchanged into Tris-AP buffer by gel filtration chromatog- raphy using a PD-10 column (Pharmacia) and then concen- trated to about 0.5 mL in a Centricon-10. Then 1.5 equiv of GMPPNP was added to the p21, and the solution was loaded onto a 1.5-mL column of alkaline phosphataseSepharose, and the effluent (ca. 0.6 mL) was collected. The sample of p21 was reacted with the alkaline phosphatase on the column for 2-3 h. In some cases after about 1.5 h, a 0.4-mL portion of buffer was added to the top of the column, and the same volume was collected into the first fraction (bringing the total volume of the first fraction to about 1 mL). The purpose of this step is to allow the p21 to react with fresh alkaline phosphatase closer to the bottom of the column. The sample of p21 was then eluted from the column with Tris-AP buffer in a single 2-mL fraction, and 1 equiv of MgCl2 and 0.5 equiv of GMPPNP were added. After concentration to about 0.7 mL, the p21 was chromatographed on a PD-10 column equilibrated with 20 mM Tris.HC1 (pH 7.5), 50 mM NaC1, 5 mM MgCl2, 10 mM DTT, 0.02% sodium azide, and 1 pM GMPPNP, and the protein was concentrated as before. Samples of p21 (ca. 5 nmol) were prepared for nucleotide assay as described (Seckler et al., 1990), except that the nucleotide-containing solution was diluted to 1 :2 with the mobile phase. The replacement of GDP with GMPPNP was always at least 95% complete, as shown by integration of HPLC peaks (Miller et al., 1993; Seckler et al., 1990).
Analysis for Isotopic Enrichment. Typically, a 1-2.5-mg sample of p2 1 was dialyzed versus 0.001 M HC1, concentrated to roughly 2 mL, and lyophilized, usually in a vacuum hydrolysis tube. Approximately 1-1.5 mL of constant-boiling HCl was added, and the mixture was subjected to at least six cycles of freeze-pumpthaw. The hydrolysis was carried out at 115 "C for 24 h in a sand bath. The HC1 solution was removed with N2 gas. Derivatization to N-heptafluorobutyryl isobutyl amino acids was carried out essentially as described (MacKenzie, 1981). Typically, 2 mL of 2-propanol and 0.54 mL of acetyl chloride were used to esterify the amino acids;
ras p21 Active-Site Structure
the reaction was carried out for 35 min at 117 "C; excess reagents were removed with Nz at 25-45 OC. Heptafluo- robutyric anhydride (1 mL) was added, and the acylation was performed at 150 OC for 10-1 2 min. After the excess reagents were removed at about 25 OC, the derivatives were taken up in dry ethyl acetate.
The amino acid derivatives in ethyl acetate were chro- matographed on a 0.3 mm X 50 m column of SE-54. The temperature was 80 OC for 2.5 min, followed by a 4 "C/min gradient to a final temperature of 230 OC, which was held for 20 min. Methane chemical ionization was used (MacKenzie, 1984), and both scanning mode mass spectrometry and selected ion mode mass spectrometry were performed on a Hewlett- Packard mass spectrometer. Generally, the parent ion was used for analysis; we found that serine gave a normal distribution of ions at its parent peak, unlike a previous report (MacKenzie, 1984). Mass spectral intensities were analyzed by the average-mass method (Blom, 1988a,b) to calculate the isotopic enrichment. The level of isotopic enrichment is used in conjunction with the ESEEM amplitude to calculate distances; in addition, it demonstrates the specificity of labeling.
GTPase Assays. [y-32P]GTP (ICN) was exchanged for GDP bound to p21, and unbound nucleotides were removed in a manner similar to those described by other workers (Gideon et al., 1992). Glycerol or sucrose and 1 mM MgC12 or MnC12 were added to p2 1 .GTP, and the hydrolysis reaction (25 "C) was initiated with GAP334 (Gideon et al., 1992). 32Pi was extracted essentially as described (Shacter, 1984).
ESEEMSpectroscopy. Samples wereconverted to the Mn" form by dialysis against two changes of 20 mM HEPESSNaOH (pH 7.3)/50 mM NaC1/2 mM MnC12/10 mM DTT/O.O2% sodium azide/ 1 pM GDP or GMPPNP (as appropriate). The concentration of free Mn" was reduced by dialysis against two changes of the same buffer with [MnC12] = 1 pM. The sample was concentrated to 0.2-0.3 mL with a Centricon-10. Either 15-50% glycerol or 15% methyl a-D-glucopyranoside was added as a cryoprotectant to the sample, and the mixture was placed in a 4-mm EPR tube. The sample tubes were plunged in liquid nitrogen for cooling and storage.
Two- and three-pulse ESEEM experiments were carried out in a spectrometer described previously (Larsen et al., 1993). The ESEEM patterns recorded typically consisted of three scans of 200 time domain steps of 10-15 ns. At each step, - 500 electron spin-echoes were accumulated at a repetition rate of -300 Hz. ESEEM patterns were recorded at microwave frequencies in the range of 8-12 GHz. Typically, the ESEEM spectra were obtained with excitation at EPR intensity maxima.
Analysis of ESEEMData. Spectral analysis of the ESEEM patterns was performed in the following manner. To minimize the spectral amplitude in the zero-frequency neighborhood, which is dominated by the overall echo decay rather than by nuclear modulation effects, a decay function was fit to the time domain pattern, as previously described (Larsen et al., 1992b), and subtracted from it. The residual pattern was then multiplied by an extended cosine bell window function, zero-filled, and Fourier-transformed. Both magnitude and cosine transform spectra were examined; cosine transforms are displayed, except as indicated. Discrepancies between the fitted and actual decay functions can lead to artificial spectral features at frequencies below - 1 MHz. In addition, it should be noted that the windowing method used imparts a spectral line shape in cosine transform spectra that is reminiscent of the second derivative of a Gaussian function,
Biochemistry, Vol. 33, No. 13, 1994 4023
with a pair of (negative) side lobes symmetrically flanking the (positive) central peak. In regions of spectral congestion, the overlap of peaks and side lobes from neighboring signals can lead to complex, asymmetric spectral features.
We employ numerical simulations of the ESEEM spectra to evaluate the relevant nuclear hyperfine coupling constants. The simulation begins with a calculation of the ESEEM frequencies and amplitudes, according to the theory of Mims (1972), elaborated to account for the effects of high electron spin multiplicity (Larsen et al., 1993). From these data, we construct an ESEEM amplitude weighted frequency histo- gram. In order to generate a spectrum that is suitable for direct comparison to the experimental spectrum, we inverse Fourier transform this frequency histogram, multiply the resulting time domain pattern by the decay function fit to the relevant ESEEM data, and truncate the pattern so that it conforms to the experimental observation interval. The simulated pattern, like the experimental one, is then normalized to unity at its maximum-a scaling practice acceptable for weakly modulated ESEEM-and subjected to the same battery of preprocessing and transformation methods that was applied to the experimental ESEEM patterns.
All of the nuclei treated in detail in the present work appear to be distant enough so that they exhibit the ESEEM spectrum of a weakly coupled label; their hyperfine interactions with MnI1 are essentially purely dipolar in origin and may be interpreted with the simple point-dipole model (Larsen et al., 1993). Because there is some delocalization of electron spin density from Mn" to its oxygen ligands, the point-dipole model can be improved by taking a weighted sum of the point-dipole interactions between the nucleus and the spin density associated with each oxygen ligand and the Mn". The weights are determined by the fraction of spin density localized on the electron spin centers, and each center is treated as a point- dipole in its interactions with the nucleus of interest (deBeer et al., 1973). Comparison of the two models shows that the effective distance found in the simple point-dipole ap- proximation is extremely close to the actual one for distances greater than - 3.5 A and small delocalizations of spin density (deBeer et al., 1973)-the conditions of most of our experi- ments. The effective distance is never greater than the true distance.
Quantitative distance estimates are obtained by simulating the ESEEM spectra using various magnitudes of the dipolar interaction to achieve good agreement with the observed spectrum. ESEEM signal amplitudes for ZH, 13C, or 15N are proportional to isotopic enrichments; our simulations take these values into account. Wenote that even a moderateuncertainty in signal amplitude or isotopic enrichment leads to a much smaller uncertainty in distance; we estimate the uncertainty in the ESEEM distances at - 5%. For the GMPPNP-bound samples, the value of the axial zero-field splitting parameter used in the simulations was 200 G (G. Reed, personal communication). For samples incorporating deuterium, we use a quadrupole coupling value (e2@) of 0.135 MHz in our simulations (Liicken, 1969).
The simulation method described gives an accurate distance determination when the ESEEM signal derives from a single isotopic label. Our labeling method, however, results in labeling of selected positions within all residues of a given amino acid type. As a vehicle for discussing our results, we can assume that the residue closest to the paramagnetic center dominates the ESEEM response. This single-residue as- sumption can be justified on a case-by-case basis if a structural model is available, but the distance obtained is a lower bound
4024 Biochemistry, Vol. 33, No. 13, 1994 Halkides et al.
Table 1 : Samples of u21 in This Study strain labels % enrichment nucleotide notes
PA 360 [I5N]Ser [ lSN]Gly
DL39TG [ l-2H]Thr
DL39TG [2-2H]Thr
DL39TG [ 2 - W ] Thr
DL39TG [ 1 ,2,3,4-l3C,ISN]Thr
[4-"C]Asx
[4-"C] ASX [ lSN] Gly
] 15NIGly
73 GDP and GMPPNP 16 81 GDP and GMPPNP 84 89 GDP and GMPPNP H-ras, 15% methyl a-D-glucopyranoside 91 80 83 GDP and GMPPNP 52 75 GMPPNP
in any circumstance. It is noteworthy that other assumptions involved in the analysis of the ESEEM results-in particular, the modulation pattern normalization scheme, the point4ipole approximation of the hyperfine interaction, and the neglect of the decrease in protein volume with decreasing temperature (Tilton et al., 1992)-tend to lead to a slight underestimation of the interspin distance. Accordingly, our results may certainly be taken to provide reliable lower bounds on the distance between the paramagnetic center and the observed nucleus. For example, with the single-residue approximation, we previously obtained a distance between the amide nitrogen of Serl7 and Mn" of 3.8 f 0.3 A for p21.GDP (Larsen et al., 1992b). If we suppose that there was a second 15N nucleus 20% farther from the MnI1 than the nearest one, the calculated distance from MnI1 to the nearest 15N label would be too small (as a result of the intensity contribution of the second nucleus) by only about 5%. Inspection of the crystal structures of p21 shows that for aspartate, serine, or threonine residues the distance from MnI1 to the second closest amino acid of a given type is expected to be more than 20% greater than the distance from Mn" to the closest. This relation holds true for serine, even when the positions of glycine residues are also included (glycine colabels with serine under some conditions). Therefore, even though all residues of a given amino acid type are labeled, the contributions to the total ESEEM amplitude from distant residues are so small that they may safely be ignored.
In the case of amino acids prepared with multiple labels of some isotopes-for example, [ 1 ,2,3,4J3C] threonine-our analytical technique is extended in two ways. Within the single-residue framework, we may again assume that the entire ESEEM amplitude arises from the single closest nucleus. This single-nucleus assumption again establishes the minimum distance between the paramagnetic center and any of the relevant nuclei on the labeled amino acid. Alternatively, we may regard the labeled nuclei as equidistant from the Mn" ion. With this equivalent-nuclei assumption, we establish the maximum distance from MnI1 to the nearest labeled nucleus of the single residue (Thr35 in this example) assumed to generate the ESEEM. The distance obtained by the equiva- lent-nuclei assumption is greater than the distance obtained by the single-nucleus assumption by a factor of n1J6, where n is the number of labeled nuclei in the residue. In principle, actual distance estimates could be further refined by employing some model structure for p21 to estimate the contributions of each individual label. The analytical approaches delineated here, however, are sufficient for our purpose of probing issues of proximity and coordination of selected residues to the Mn" ion.
RESULTS
Cryoprotectants. The spectra discussed below were ob- tained with samples that contained either glycerol or methyl
I " " l " " I " " h
0 5 10 15 20 Frequency (MHz)
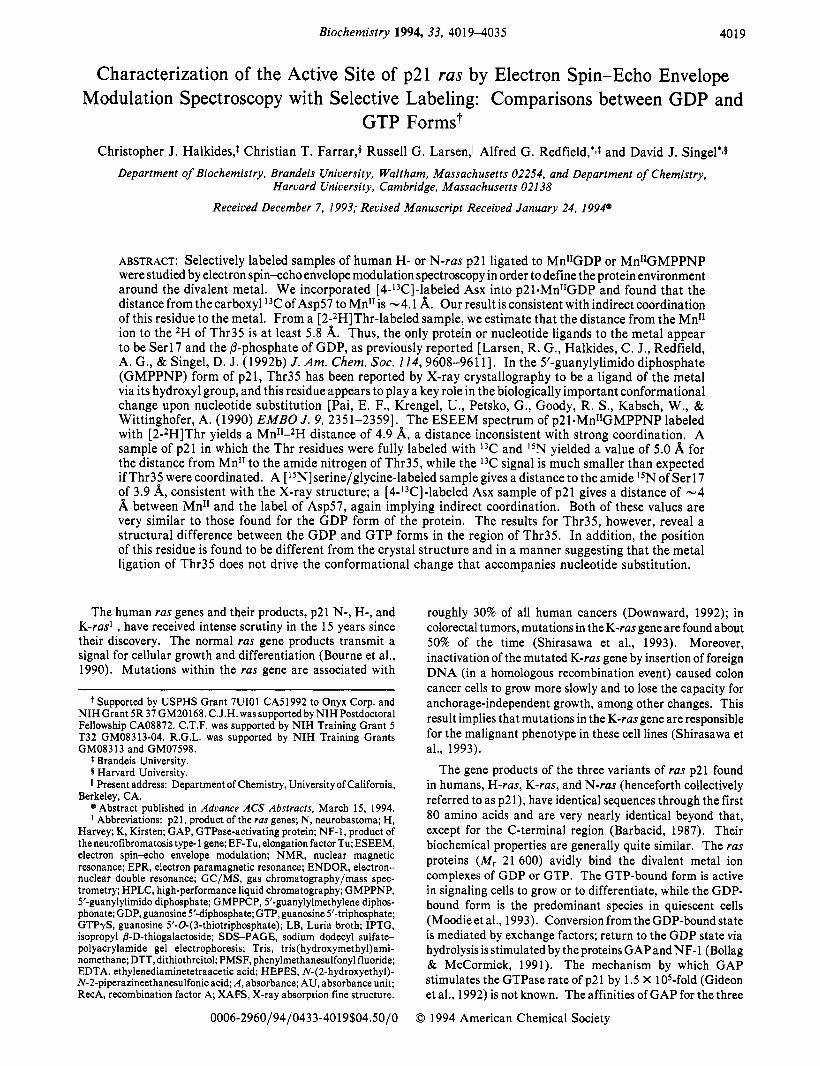
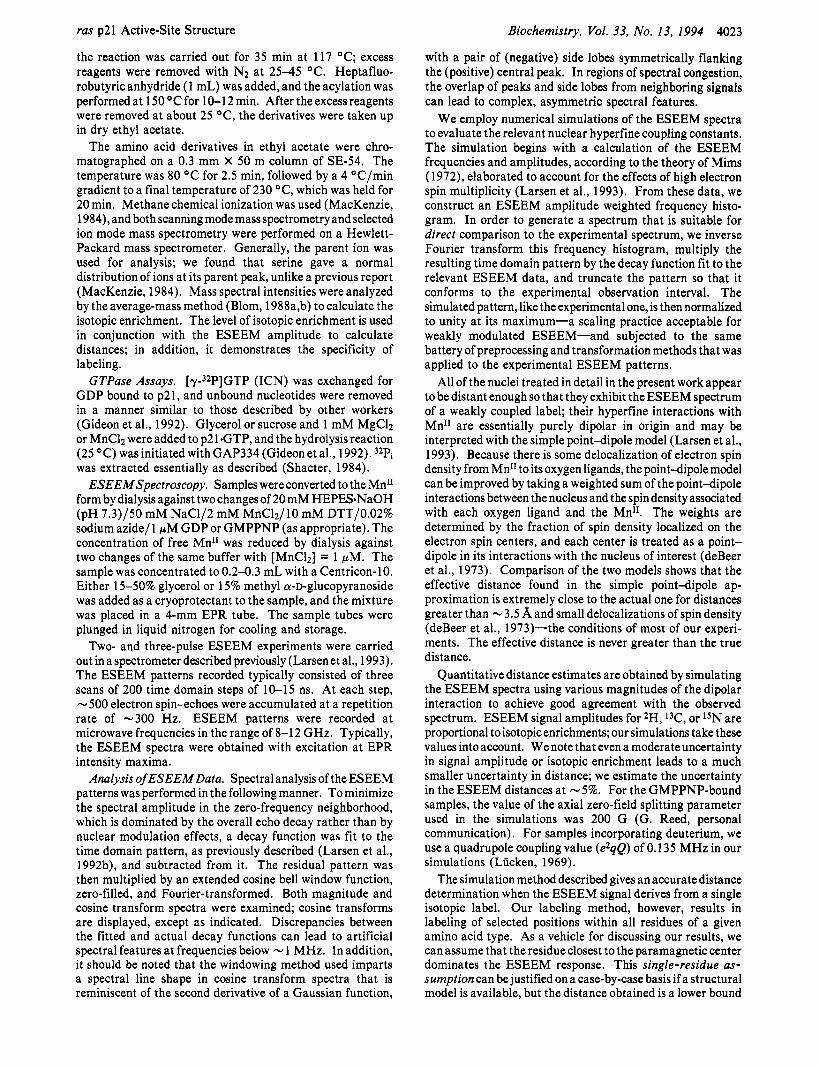
FIGURE 1: Two-pulse ESEEM spectrum of N-ras p21.MnI1GDP incorporating [L5N]Ser/[1SN]Gly. Peaks are apparent at 1.30 (15N), 3.39 (3LP), 7.75 (31P), 10.81 ("P), and 13.22 MHz (lH). Details of the sample composition are given in the text. The spectrum was obtained at 3104 G and an EPR frequency of 8.620 GHz.
a-D-glucopyranoside as the cryoprotectant (Table 1). The different cryoprotectants did not substantially change the intensities of ESEEM spectral peaks, but a significant reduction in line width as compared to samples frozen without cryoprotectants was noted. A more complete discussion of the interactions of glycerol and methyl a-D-glucopyranoside with p21 and the effects of freezing technique upon ESEEM spectra will appear elsewhere (C. J. Halkides, C. T. Farrar, A. G. Redfield, and D. J. Singel, manuscript in preparation).
GTPase Assays. To test the effects of the cryoprotectants, we assayed the GAP334-dependent GTPase activity of p2 1 at 0-50% glycerol and 6 1 5 % sucrose (taken as a model for methyl a-D-glucopyranoside). In 50% glycerol or 15% sucrose, the protein retains 70% of its GAP334-dependent GTPase activity. These results are similar to those seen for the intrinsic GTPase of the N-terminal domain of EF-Tu (Harmark et al., 1992). We also observe that 1 mM MnClz is about 3-fold more effective than MgClz in supporting the GAP334- dependent GTPase reaction.
ESEEM Spectroscopy of the GDP Form of p21
Phosphoryl Groups. Under the EPR conditions employed in this study, prominent features in the ESEEM spectrum of p21.Mn1*GDParise from 31P (Larsen et al., 1993). Themost pronounced 31P peaks are the fundamental found at 3.39 MHz and the antiphase combination at 10.8 1 MHz, shown in Figure 1. These features are shifted to 4.36 and 12.89 MHz, respectively, in Figure 2 because the latter was acquired at higher microwave frequency and external field strength. These and the other, less pronounced 31P spectral features exhibit a complicated field dependence of their frequencies, ampli-
ras p21 Active-Site Structure
I " " I " " I " " ~
Biochemistry, Vol. 33, No. 13, 1994 4025
0 5 10 15 20 Frequency (MHz)
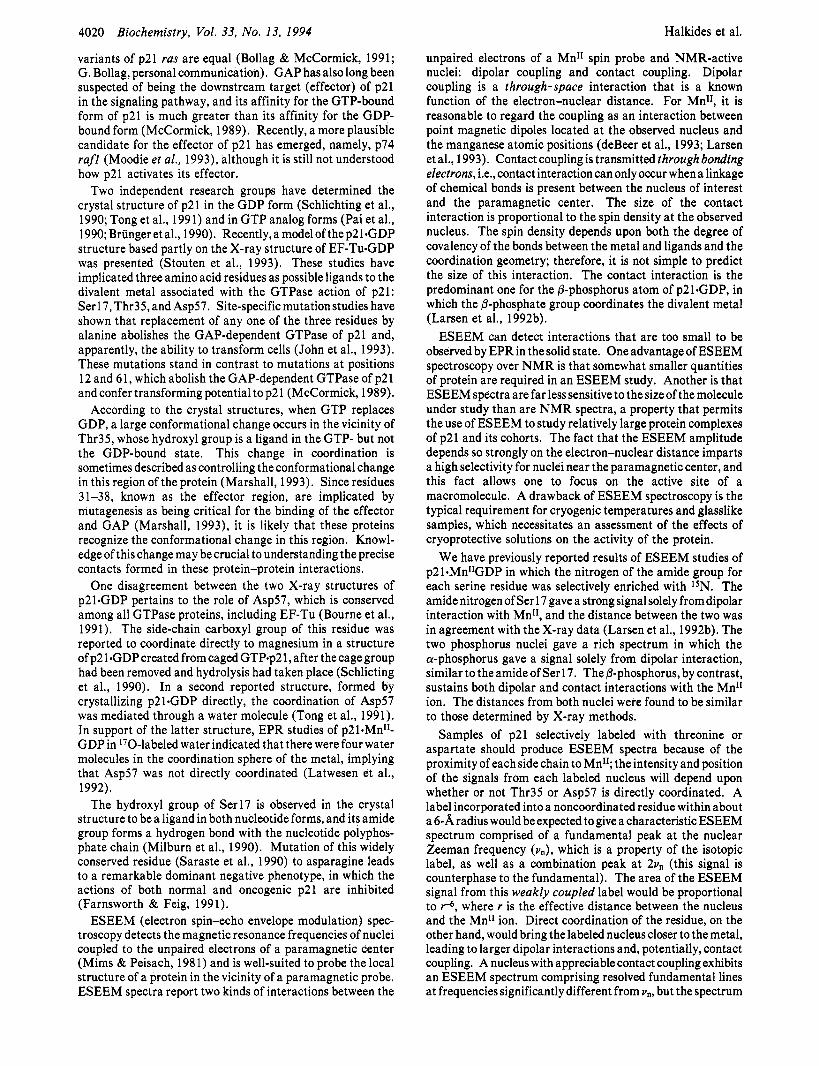
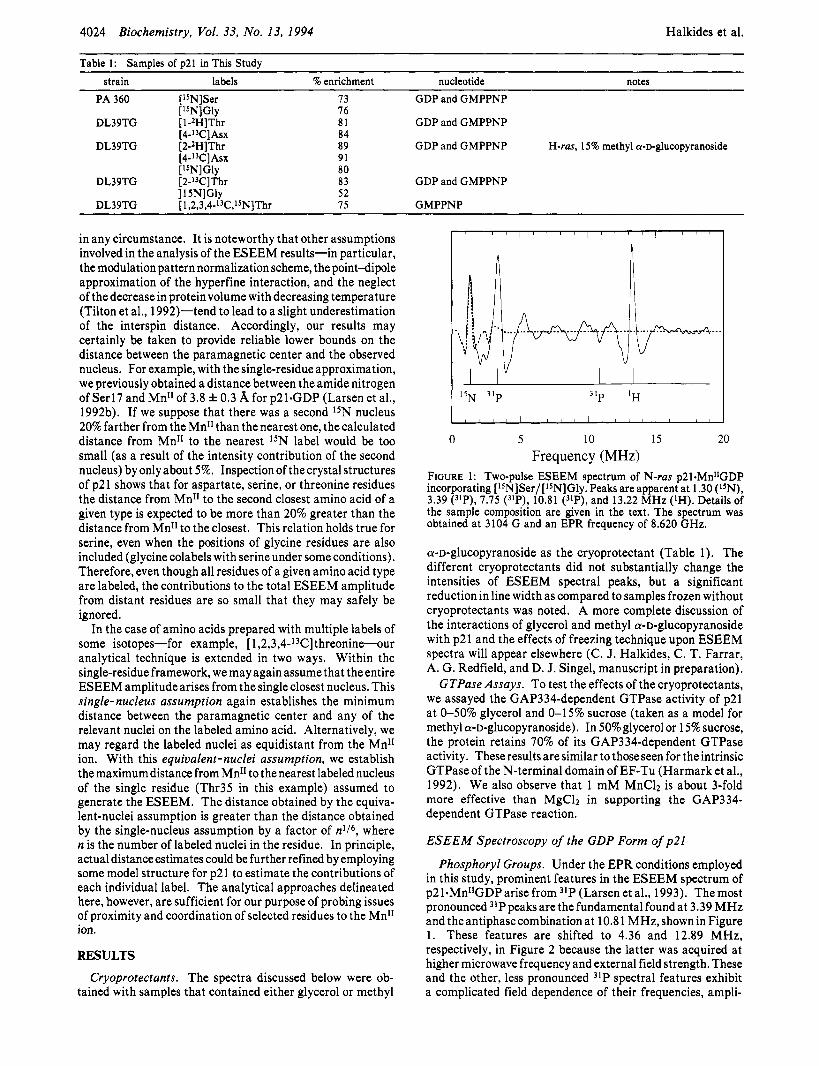
FIGURE 2: Two-pulse ESEEM spectrum of H-ras p21.MnI1GDP incorporating [2-ZH]Thr, [4-13C]Asx, and [ISN]Gly in the presence of 15% methyl a-d-glucopyranoside, Peaks are apparent at 2.54 (zH), 4.36 (I3C and "P), 8.08 (13C combination), 12.89 (31P combination), and 15.89 MHz (IH). The spectrum was obtained at a field setting of 3731 G and an EPR frequency of 9.805 GHz.
Table 2: by ESEEM Data and Those Found by X-ray Crystallography in
Comparison of Distances from the Divalent Metal Found
p2l.GDP (A) nu c 1 e u s ESEEM X-ray' X-rayb
8-31P 3.3c 3.6 3.16 a-31P 5.3c 5.5 4.45 [ "N]Ser 17 4.1 4.5 4.1 1 [ 2-2H]Thr35 >5.8 <4.8 >6.5 [2-W]Thr35 >4.5 3.68 7.56 [4-I3C]Asp57 4.1 4.3 4.8 1
"Schlichting et al., 1990. bTong et al., 1991. Larsen et al., 1992b.
tudes, and line widths. A detailed analysis of the 31Pspectrum has been reported elsewhere (Larsen et al., 1993).
Serine. The spectrum depicted in Figure 1 was obtained from a sample with amide 15N labeling of the serine and glycine residues. The peak at 1.30 MHz, the 15N Zeeman frequency, is attributable to weakly coupled 15N and is assigned, as discussed previously (Larsen et al., 1992b), to the single residue Serl7. The best agreement between simulation and experi- ment is obtained for the distance 4.1 A, which is comparable to the crystal-structure distances of 4.1 and 4.5 A (Table 2).
Aspartate and Asparagine. In order to probe the putative metal coordination of Asp57 (Schlichting et al., 1990), we introduced 13C into the carboxyl groups of aspartate residues; the method used also leads to 13C labeling of the carboxamide groups of asparagine residues. By comparison to the spectra of samples lacking this 13C enrichment, we can identify a single well-resolved peak in the spectrum of H-ras p21.GDP in 15% methyl a-D-glucopyranoside shown in Figure 2 as arising from 13C: the combination signal at 8.1 MHz (twice the Zeeman frequency). No signals are found that could correspond to the fundamental frequencies of a hypothetical I3C that sustains an appreciablecontact interaction (vide infra). A similarly labeled sample of N-ras p21 .GDP in 50% glycerol (Table 1) gave essentially the same results. Accordingly, we assume that the I3C nuclei incorporated into Asx are weakly coupled: the fundamental peak at vn, the Zeeman frequency, overlaps the low-frequency side lobe of the 31P peak at 4.36 MHz and induces the asymmetry in the 31P line shape in the cosine transform spectrum. By simulation of the well-resolved combination peak, we determine the distance from the Mn" to the Asp57 label to be 4.1 A. The simulation also predicts
l " ' I " ' I " '
A
l H I 'P
0 4 8 12 16 Frequency (MHz)
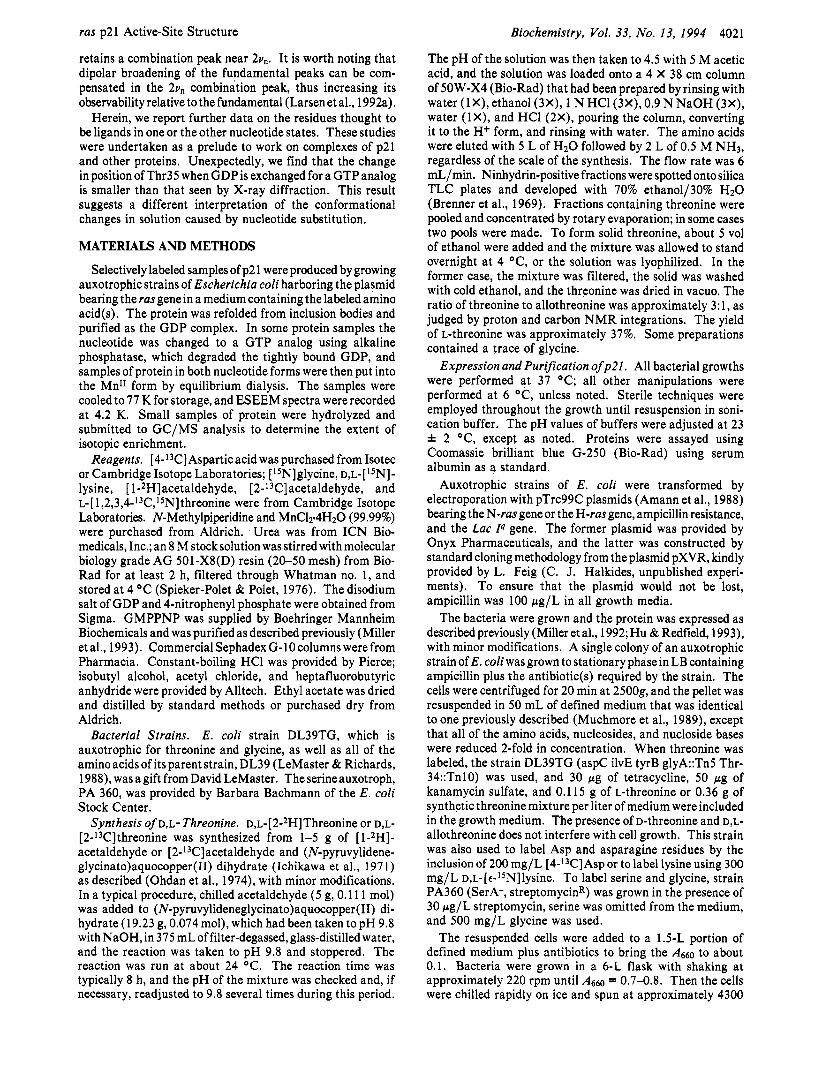
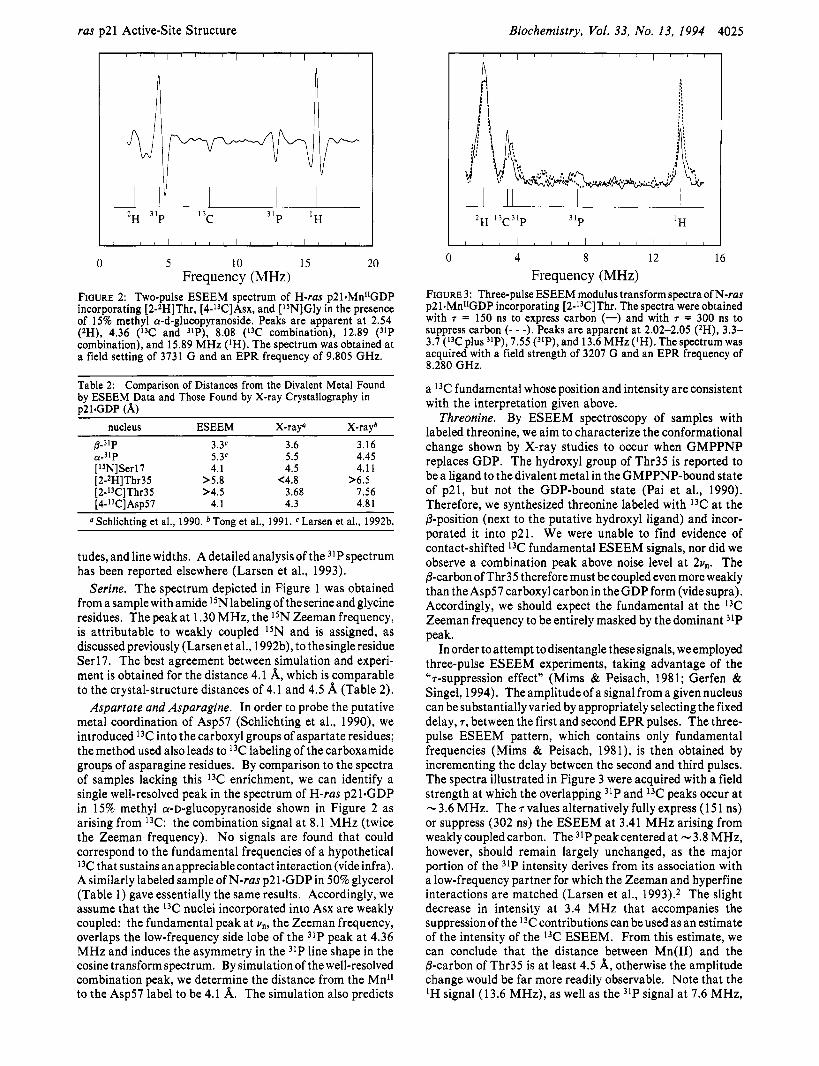
FIGURE 3: Three-pulse ESEEM modulus transform spectra of N-rus p21.Mn11GDP incorporating [2-I3C]Thr. The spectra were obtained with T = 150 ns to express carbon (-) and with T = 300 ns to suppress carbon (- - -). Peaks are apparent at 2.02-2.05 (2H), 3.3- 3.7 (I3C plus "P), 7.55 (31P), and 13.6 MHz (IH). The spectrum was acquired with a field strength of 3207 G and an EPR frequency of 8.280 GHz.
a 13C fundamental whose position and intensity are consistent with the interpretation given above.
Threonine. By ESEEM spectroscopy of samples with labeled threonine, we aim to characterize the conformational change shown by X-ray studies to occur when GMPPNP replaces GDP. The hydroxyl group of Thr35 is reported to be a ligand to the divalent metal in the GMPPNP-bound state of p21, but not the GDP-bound state (Pai et al., 1990). Therefore, we synthesized threonine labeled with 13C at the @-position (next to the putative hydroxyl ligand) and incor- porated it into p21. We were unable to find evidence of contact-shifted 13C fundamental ESEEM signals, nor did we observe a combination peak above noise level at 2v,. The @-carbon of Thr35 therefore must be coupled even more weakly than the Asp57 carboxyl carbon in the GDP form (vide supra). Accordingly, we should expect the fundamental at the I3C Zeeman frequency to be entirely masked by the dominant 31P peak.
In order to attempt todisentangle these signals, we employed three-pulse ESEEM experiments, taking advantage of the "7-suppression effect" (Mims & Peisach, 1981; Gerfen & Singel, 1994). The amplitude of a signal from a given nucleus can be substantially varied by appropriately selecting the fixed delay, 7, between the first and second EPR pulses. The three- pulse ESEEM pattern, which contains only fundamental frequencies (Mims & Peisach, 1981), is then obtained by incrementing the delay between the second and third pulses. The spectra illustrated in Figure 3 were acquired with a field strength at which the overlapping 31P and 13C peaks occur at N 3.6 MHz. The 7 values alternatively fully express (1 5 1 ns) or suppress (302 ns) the ESEEM at 3.41 MHz arising from weaklycoupledcarbon. The 31Ppeakcenteredat -3.8 MHz, however, should remain largely unchanged, as the major portion of the 31P intensity derives from its association with a low-frequency partner for which the Zeeman and hyperfine interactions are matched (Larsen et al., 1993).2 The slight decrease in intensity at 3.4 MHz that accompanies the suppression of the 13C contributions can be used as an estimate of the intensity of the 13C ESEEM. From this estimate, we can conclude that the distance between Mn(I1) and the @-carbon of Thr35 is at least 4.5 A, otherwise the amplitude change would be far more readily observable. Note that the lH signal (13.6 MHz), as well as the 31P signal at 7.6 MHz,
4026 Biochemistry, Vol. 33, No. 13, 1994
I " ' " ' ' ~ ' ~ ' ' " ' ~ ' ~ h
0 5 10 15 20 Frequency (MHz)
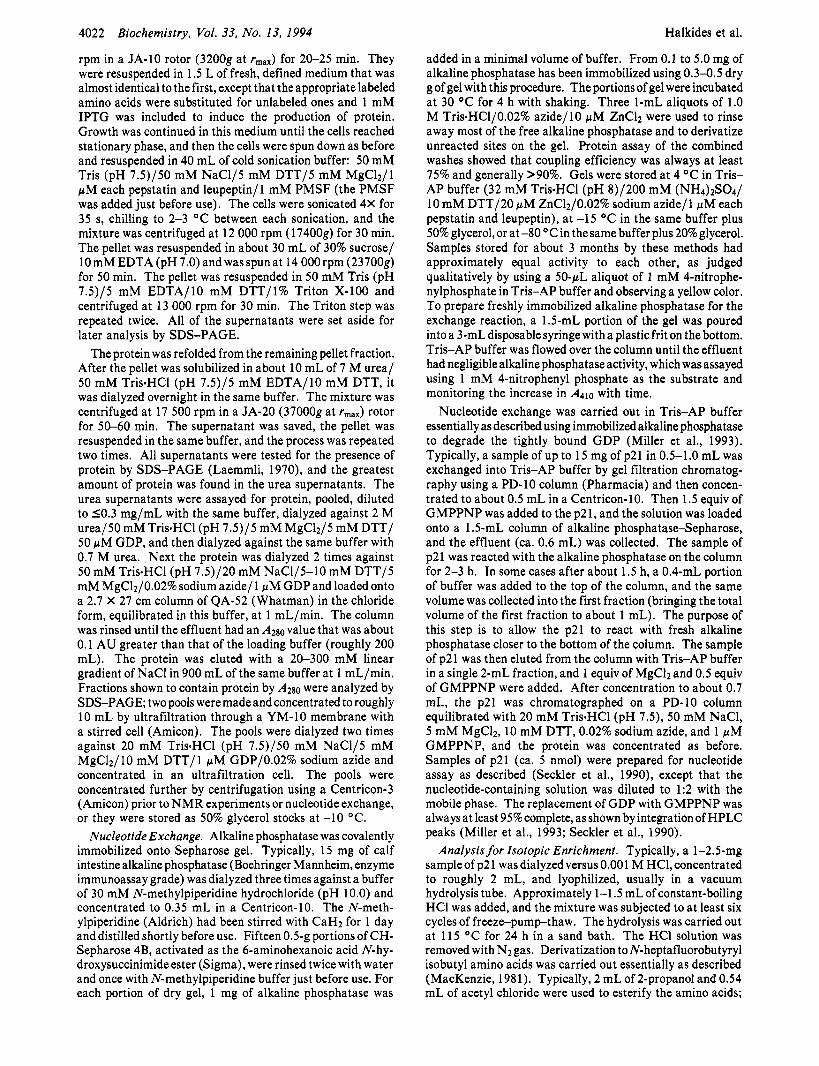
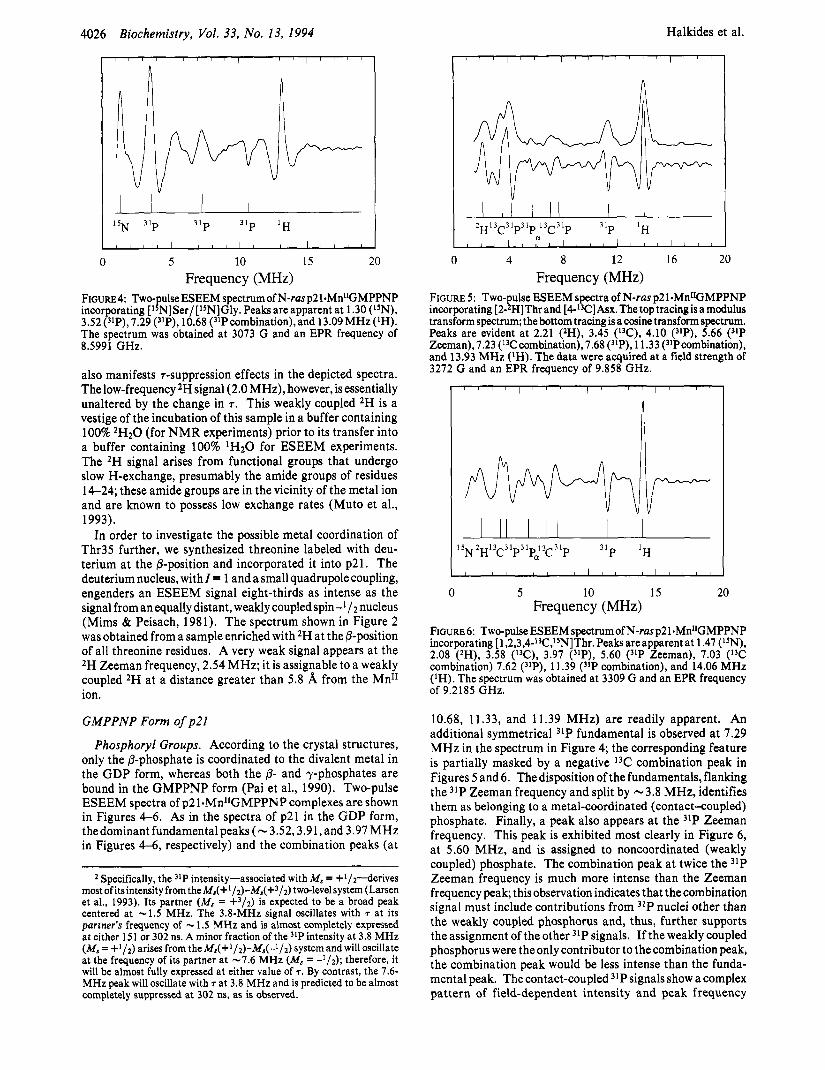
FIGURE4: Two-pulse ESEEM ~pectrumofN-rasp21.Mn~~GMPPNP incorporating [l5N]Ser/[l5N]Gly. Peaks are apparent at 1.30 (I5N), 3.52("P),7.29 ("P), 10.68 (31Pcombination),and 13.09MHz(IH). The spectrum was obtained at 3073 G and an EPR frequency of 8.5991 GHz.
also manifests 7-suppression effects in the depicted spectra. The low-frequency 2H signal (2.0 MHz), however, is essentially unaltered by the change in 7. This weakly coupled 2H is a vestige of the incubation of this sample in a buffer containing 100% 2H20 (for NMR experiments) prior to its transfer into a buffer containing 100% 'H2O for ESEEM experiments. The 2H signal arises from functional groups that undergo slow H-exchange, presumably the amide groups of residues 14-24; these amide groups are in the vicinity of the metal ion and are known to possess low exchange rates (Muto et al., 1993).
In order to investigate the possible metal coordination of Thr35 further, we synthesized threonine labeled with deu- terium at the @-position and incorporated it into p21. The deuterium nucleus, with I = 1 and a small quadrupole coupling, engenders an ESEEM signal eight-thirds as intense as the signal from an equally distant, weakly coupled spin-'/2 nucleus (Mims & Peisach, 1981). The spectrum shown in Figure 2 was obtained from a sample enriched with 2H at the @-position of all threonine residues. A very weak signal appears at the 2H Zeeman frequency, 2.54 MHz; it is assignable to a weakly coupled 2H at a distance greater than 5.8 A from the Mn" ion.
GMPPNP Form of p21
Phosphoryl Groups. According to the crystal structures, only the @-phosphate is coordinated to the divalent metal in the GDP form, whereas both the @- and y-phosphates are bound in the GMPPNP form (Pai et al., 1990). Two-pulse ESEEM spectra of p2 1SMnIIGMPPNP complexes are shown in Figures 4-6. As in the spectra of p21 in the GDP form, thedominant fundamental peaks (-3.52,3.91, and 3.97 MHz in Figures 4-6, respectively) and the combination peaks (at
2 Specifically, the 3lP intensity-associated with Ms = +I/~-derives most ofitsintensity from theMs(+l/2)-Ms(+3/2) two-levelsystem (Larsen et al., 1993). Its partner (Ms = +3/2) is expected to be a broad peak centered at -1.5 MHz. The 3.8-MHz signal oscillates with T at its partner's frequency of - 1.5 MHz and is almost completely expressed at either 151 or 302 ns. A minor fraction of the intensity at 3.8 MHz (Ms = +I /2 ) arises from the Ms(+1/2)-Ms(-1/2) system and will oscillate at the frequency of its partner at -7.6 MHz (Ms = -l/2); therefore, it will be almost fully expressed at either value of T . By contrast, the 7.6- MHz peak will oscillate with T at 3.8 MHz and is predicted to be almost completely suppressed at 302 ns, as is observed.
Halkides et al.
L
2 13 31 31 13 31 H C P P C P 31P 'H
0 4 8 12 16 20
Frequency (MHz) FIGURE 5: Two-pulse ESEEM spectra of N-ras p21.MnIIGMPPNP incorporating [2-2H]Thr and [4-I3C]Asx. The top tracing is a modulus transform spectrum; the bottom tracing is a cosine transform spectrum. Peaks are evident at 2.21 (zH), 3.45 (13C), 4.10 ("P), 5.66 Zeeman),7.23 (13Ccombination),7.68 (31P), 11.33 (31Pcombination), and 13.93 MHz (lH). The data were acquired at a field strength of 3272 G and an EPR frequency of 9.858 GHz.
1 5 2 13 31 31 13 31 N H C P Pa C P 31P 'H
0 5 10 15 20 Frequency (MHz)
FIGURE 6: Two-pulse ESEEM spectrum of N-ras p2 1-MnWMPPNP incorporating [1,2,3,4-13C,'5N]Thr. Peaks areapparent at 1.47 (lsN), 2.08 (2H), 3.58 (IT), 3.97 ("P), 5.60 (31P Zeeman), 7.03 ( I T combination) 7.62 ("P), 11.39 (31P combination), and 14.06 MHz (IH). The spectrum was obtained at 3309 G and an EPR frequency of 9.2185 GHz.
10.68, 11.33, and 11.39 MHz) are readily apparent. An additional symmetrical 31P fundamental is observed at 7.29 MHz in the spectrum in Figure 4; the corresponding feature is partially masked by a negative 13C combination peak in Figures 5 and 6. The disposition of the fundamentals, flanking the 31P Zeeman frequency and split by -3.8 MHz, identifies them as belonging to a metal-coordinated (contact-coupled) phosphate. Finally, a peak also appears at the 31P Zeeman frequency. This peak is exhibited most clearly in Figure 6, at 5.60 MHz, and is assigned to noncoordinated (weakly coupled) phosphate. The combination peak at twice the 31P Zeeman frequency is much more intense than the Zeeman frequency peak; this observation indicates that the combination signal must include contributions from 31P nuclei other than the weakly coupled phosphorus and, thus, further supports the assignment of the other 31P signals. If the weakly coupled phosphorus were the only contributor to the combination peak, the combination peak would be less intense than the funda- mental peak. The contact-coupled 31P signals show a complex pattern of field-dependent intensity and peak frequency
ras p21 Active-Site Structure Biochemistry, Vol. 33, No. 13, 1994 4027
Table 3: Comparison of Distances from the Divalent Metal Found through ESEEM Spectra and Those through X-ray Data for p2l.GMPPNP (A)
nucleus ESEEM X-ray' [ I5N] Ser 17 3.9 3.86 [2-*H]Thr35 4.9 14 .2 [1,2,3,4J3CC]Thr35 4.1b (5.2)c 5.30,4.08, 3.16, 4.17 [ 15N]Thr35 5.1 3.81 [4-L3C]A~p57 4 4.57 [2-I3C]Thr35 ? 3.16 [wPIGMPPNP 4.6 4.55 @ Pai et al., 1990. Single-nucleus presentation; see Materials and
Methods. Equivalent-nuclei presentation for four nuclei.
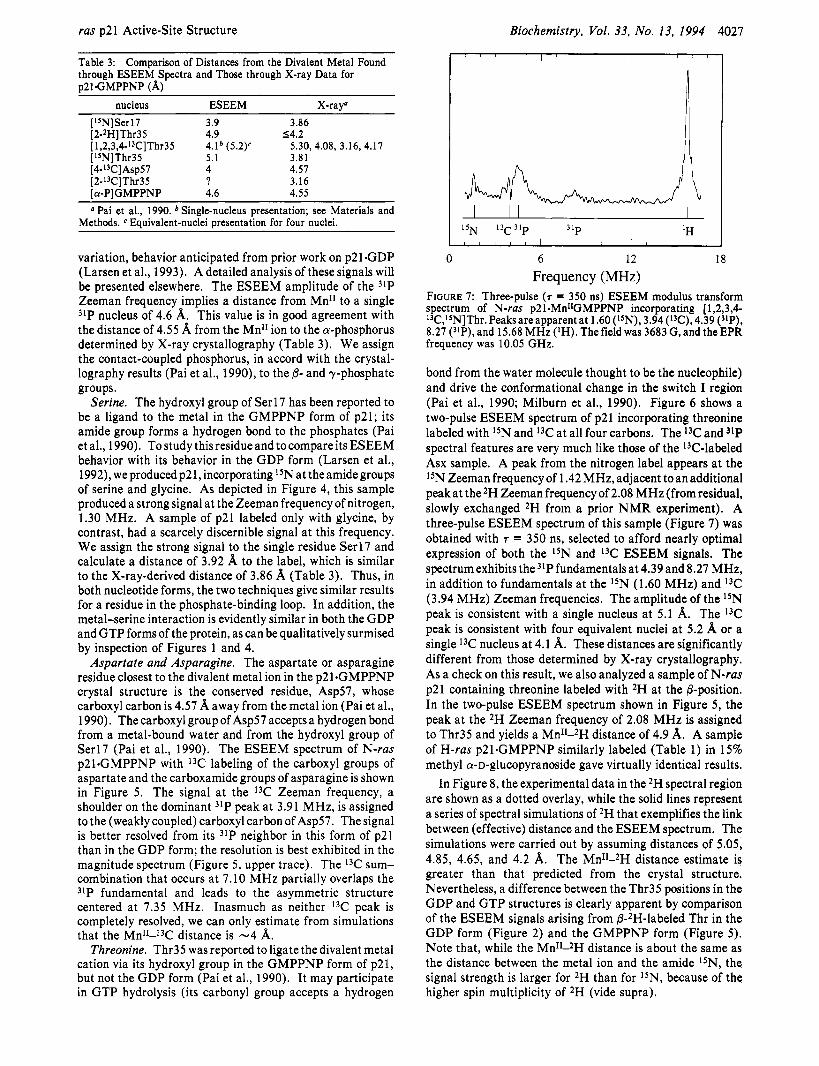
variation, behavior anticipated from prior work on p2 1.GDP (Larsen et al., 1993). A detailed analysis of these signals will be presented elsewhere. The ESEEM amplitude of the 31P Zeeman frequency implies a distance from Mn" to a single 31P nucleus of 4.6 h;. This value is in good agreement with the distance of 4.55 h; from the Mn" ion to the a-phosphorus determined by X-ray crystallography (Table 3). We assign the contact-coupled phosphorus, in accord with the crystal- lography results (Pai et al., 1990), to the @- and y-phosphate groups.
Serine. The hydroxyl group of Serl7 has been reported to be a ligand to the metal in the GMPPNP form of p21; its amide group forms a hydrogen bond to the phosphates (Pai etal., 1990). TostudythisresidueandtocompareitsESEEM behavior with its behavior in the GDP form (Larsen et al., 1992), weproducedp21, incorporating 15Nat theamidegroups of serine and glycine. As depicted in Figure 4, this sample produced a strong signal at the Zeeman frequency of nitrogen, 1.30 MHz. A sample of p21 labeled only with glycine, by contrast, had a scarcely discernible signal at this frequency. We assign the strong signal to the single residue Serl7 and calculate a distance of 3.92 h; to the label, which is similar to the X-ray-derived distance of 3.86 h; (Table 3). Thus, in both nucleotide forms, the two techniques give similar results for a residue in the phosphate-binding loop. In addition, the metal-serine interaction is evidently similar in both the GDP and GTP forms of the protein, as can be qualitatively surmised by inspection of Figures 1 and 4.
Aspartate and Asparagine. The aspartate or asparagine residue closest to the divalent metal ion in the p21.GMPPNP crystal structure is the conserved residue, Asp57, whose carboxyl carbon is 4.57 h; away from the metal ion (Pai et al., 1990). The carboxyl group of Asp57 accepts a hydrogen bond from a metal-bound water and from the hydroxyl group of Serl7 (Pai et al., 1990). The ESEEM spectrum of N-ras p21.GMPPNP with I3C labeling of the carboxyl groups of aspartate and the carboxamide groups of asparagine is shown in Figure 5. The signal at the 13C Zeeman frequency, a shoulder on the dominant 31P peak at 3.91 MHz, is assigned to the (weakly coupled) carboxyl carbon of Asp57. The signal is better resolved from its 31P neighbor in this form of p21 than in the GDP form; the resolution is best exhibited in the magnitude spectrum (Figure 5, upper trace). The 13C sum- combination that occurs at 7.10 MHz partially overlaps the 31P fundamental and leads to the asymmetric structure centered at 7.35 MHz. Inasmuch as neither 13C peak is completely resolved, we can only estimate from simulations that the Mnr1-13C distance is -4 h;.
Threonine. Thr35 was reported to ligate the divalent metal cation via its hydroxyl group in the GMPPNP form of p21, but not the GDP form (Pai et al., 1990). It may participate in GTP hydrolysis (its carbonyl group accepts a hydrogen
~~
0 6 12 18 Frequency (MHz)
FIGURE 7: Three-pulse (7 = 350 ns) ESEEM modulus transform spectrum of N-ras p2 1SMnIIGMPPNP incorporating [ 1,2,3,4- l3C,I5N]Thr. Peaksare apparent at 1.60 (I5N), 3.94 (I'C), 4.39 ("P), 8.27 (31P), and 15.68 MHz (IH). The field was 3683 G, and the EPR frequency was 10.05 GHz.
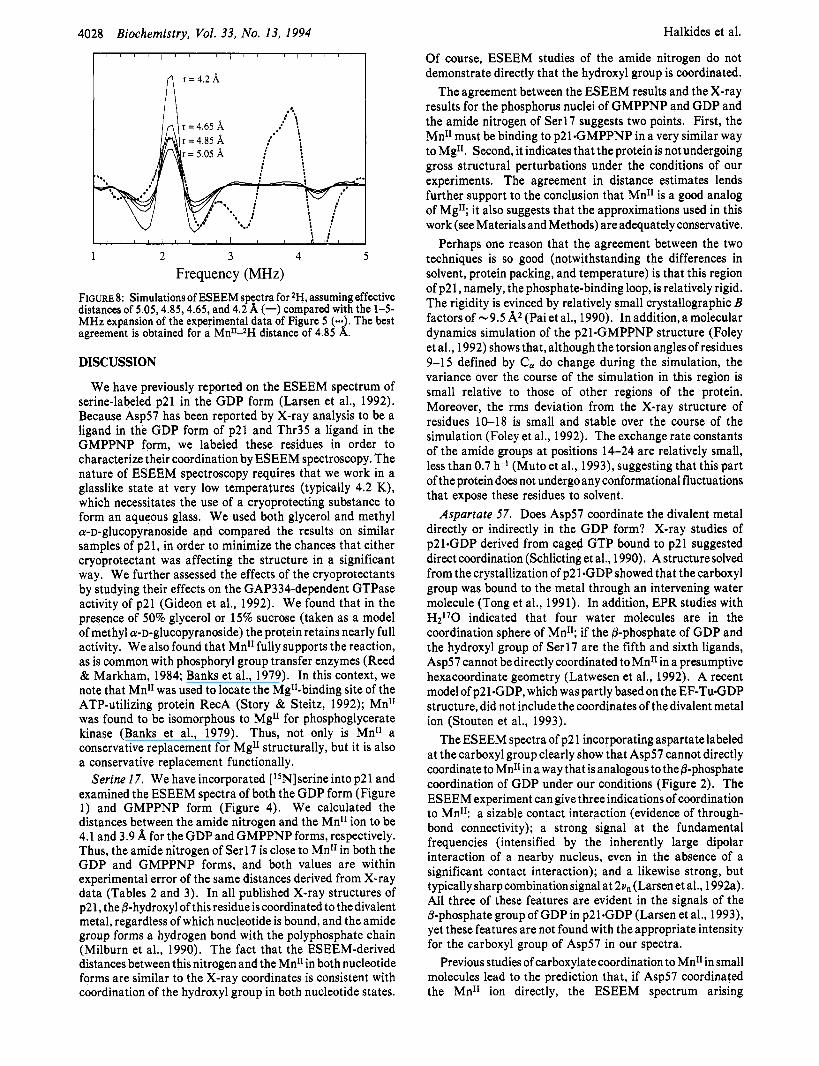
bond from the water molecule thought to be the nucleophile) and drive the conformational change in the switch I region (Pai et al., 1990; Milburn et al., 1990). Figure 6 shows a two-pulse ESEEM spectrum of p2 1 incorporating threonine labeled with 15N and 13C at all four carbons. The 13C and 31P spectral features are very much like those of the 13C-labeled Asx sample. A peak from the nitrogen label appears at the 15N Zeeman frequency of 1.42 MHz, adjacent to an additional peak at the 2H Zeeman frequency of 2.08 MHz (from residual, slowly exchanged 2H from a prior NMR experiment). A three-pulse ESEEM spectrum of this sample (Figure 7) was obtained with T = 350 ns, selected to afford nearly optimal expression of both the I5N and 13C ESEEM signals. The spectrum exhibits the 31Pfundamental~ at 4.39 and 8.27 MHz, in addition to fundamentals at the 15N (1.60 MHz) and 13C (3.94 MHz) Zeeman frequencies. The amplitude of the 15N peak is consistent with a single nucleus at 5.1 A. The I3C peak is consistent with four equivalent nuclei at 5.2 h; or a single 13C nucleus at 4.1 A. These distances are significantly different from those determined by X-ray crystallography. As a check on this result, we also analyzed a sample of N-ras p21 containing threonine labeled with 2H at the 8-position. In the two-pulse ESEEM spectrum shown in Figure 5, the peak at the 2H Zeeman frequency of 2.08 MHz is assigned to Thr35 and yields a Mn11-2H distance of 4.9 %r. A sample of H-ras p21.GMPPNP similarly labeled (Table 1) in 15% methyl a-D-glucopyranoside gave virtually identical results.
In Figure 8, the experimental data in the 2H spectral region are shown as a dotted overlay, while the solid lines represent a series of spectral simulations of *H that exemplifies the link between (effective) distance and the ESEEM spectrum. The simulations were carried out by assuming distances of 5.05, 4.85, 4.65, and 4.2 A. The Mn11-2H distance estimate is greater than that predicted from the crystal structure. Nevertheless, a difference between the Thr35 positions in the GDP and GTP structures is clearly apparent by comparison of the ESEEM signals arising from @-2H-labeled Thr in the GDP form (Figure 2) and the GMPPNP form (Figure 5). Note that, while the Mn11-2H distance is about the same as the distance between the metal ion and the amide lSN, the signal strength is larger for 2H than for 15N, because of the higher spin multiplicity of 2H (vide supra).
Halkides et al. 4028 Biochemistry, Vol. 33, No. 13, 1994
II/III/I
/ , , , , I , , I , l c , . , , I i :
1 2 3 4 5 Frequency (MHz)
FIGURE 8: Simulations of ESEEM spectra for 2H, assuming effective distances of 5.05,4.85,4.65, and 4.2 A (-) compared with the 1-5- MHz expansion of the experimental data of Figure 5 (-. . The best agreement is obtained for a MnIIAH distance of 4.85 d . DISCUSSION
We have previously reported on the ESEEM spectrum of serine-labeled p21 in the GDP form (Larsen et al., 1992). Because Asp57 has been reported by X-ray analysis to be a ligand in the GDP form of p21 and Thr35 a ligand in the GMPPNP form, we labeled these residues in order to characterize their coordination by ESEEM spectroscopy. The nature of ESEEM spectroscopy requires that we work in a glasslike state at very low temperatures (typically 4.2 K), which necessitates the use of a cryoprotecting substance to form an aqueous glass. We used both glycerol and methyl a-D-glucopyranoside and compared the results on similar samples of p21, in order to minimize the chances that either cryoprotectant was affecting the structure in a significant way. We further assessed the effects of the cryoprotectants by studying their effects on the GAP334-dependent GTPase activity of p21 (Gideon et al., 1992). We found that in the presence of 50% glycerol or 15% sucrose (taken as a model of methyl a-D-glucopyranoside) the protein retains nearly full activity. We also found that Mn" fully supports the reaction, as is common with phosphoryl group transfer enzymes (Reed & Markham, 1984; Banks et al., 1979). In this context, we note that Mn" was used to locate the MgII-binding site of the ATP-utilizing protein RecA (Story & Steitz, 1992); MnII was found to be isomorphous to Mg" for phosphoglycerate kinase (Banks et al., 1979). Thus, not only is MnI1 a conservative replacement for MgI1 structurally, but it is also a conservative replacement functionally.
Serine 17. We have incorporated [15N]serine into p21 and examined the ESEEM spectra of both the GDP form (Figure 1) and GMPPNP form (Figure 4). We calculated the distances between the amide nitrogen and the Mn" ion to be 4.1 and 3.9 8, for the GDP and GMPPNP forms, respectively. Thus, the amide nitrogen of Serli' is close to Mntl in both the GDP and GMPPNP forms, and both values are within experimental error of the same distances derived from X-ray data (Tables 2 and 3). In all published X-ray structures of p21, the @-hydroxyl of this residue is coordinated to the divalent metal, regardless of which nucleotide is bound, and the amide group forms a hydrogen bond with the polyphosphate chain (Milburn et al., 1990). The fact that the ESEEM-derived distances between this nitrogen and the Mn" in both nucleotide forms are similar to the X-ray coordinates is consistent with coordination of the hydroxyl group in both nucleotide states.
Of course, ESEEM studies of the amide nitrogen do not demonstrate directly that the hydroxyl group is coordinated.
The agreement between the ESEEM results and the X-ray results for the phosphorus nuclei of GMPPNP and GDP and the amide nitrogen of Serl7 suggests two points. First, the Mn" must be binding to p21.GMPPNP in a very similar way to MgII. Second, it indicates that the protein is not undergoing gross structural perturbations under the conditions of our experiments. The agreement in distance estimates lends further support to the conclusion that Mn" is a good analog of MgII; it also suggests that the approximations used in this work (see Materials and Methods) are adequately conservative.
Perhaps one reason that the agreement between the two techniques is so good (notwithstanding the differences in solvent, protein packing, and temperature) is that this region of p21, namely, the phosphate-binding loop, is relatively rigid. The rigidity is evinced by relatively small crystallographic B factors of -9.5 A2 (Pai et al., 1990). In addition, a molecular dynamics simulation of the p2 1.GMPPNP structure (Foley et al., 1992) shows that, although the torsion angles of residues 9-15 defined by C, do change during the simulation, the variance over the course of the simulation in this region is small relative to those of other regions of the protein. Moreover, the rms deviation from the X-ray structure of residues 10-18 is small and stable over the course of the simulation (Foley et al., 1992). The exchange rate constants of the amide groups at positions 14-24 are relatively small, less than 0.7 h-l (Muto et al., 1993), suggesting that this part of the protein does not undergo any conformational fluctuations that expose these residues to solvent.
Aspartate 57. Does Asp57 coordinate the divalent metal directly or indirectly in the GDP form? X-ray studies of p21.GDP derived from caged GTP bound to p21 suggested direct coordination (Schlicting et al., 1990). A structuresolved from the crystallization of p21.GDP showed that the carboxyl group was bound to the metal through an intervening water molecule (Tong et al., 1991). In addition, EPR studies with H2I7O indicated that four water molecules are in the coordination sphere of Mn"; if the @-phosphate of GDP and the hydroxyl group of Serl7 are the fifth and sixth ligands, Asp57 cannot be directly coordinated to MnIIin a presumptive hexacoordinate geometry (Latwesen et al., 1992). A recent model of p21.GDP, which was partly based on the EF-TwGDP structure, did not include the coordinates of the divalent metal ion (Stouten et al., 1993).
The ESEEM spectra of p2 1 incorporating aspartatelabeled at the carboxyl group clearly show that Asp57 cannot directly coordinate to MnIIin a way that is analogous to the @-phosphate coordination of GDP under our conditions (Figure 2). The ESEEM experiment can give three indications of coordination to Mn": a sizable contact interaction (evidence of through- bond connectivity); a strong signal at the fundamental frequencies (intensified by the inherently large dipolar interaction of a nearby nucleus, even in the absence of a significant contact interaction); and a likewise strong, but typically sharp combination signal at 2v, (Larsen et al., 1992a). All three of these features are evident in the signals of the @-phosphate group of GDP in p21.GDP (Larsen et al., 1993), yet these features are not found with the appropriate intensity for the carboxyl group of Asp57 in our spectra.
Previous studies of carboxylate coordination to MnII in small molecules lead to the prediction that, if Asp57 coordinated the Mntl ion directly, the ESEEM spectrum arising
ras p21 Active-Site Structure
I l l 1 , 1 1 1 I l l 1 I I I I 1 1 1 1 I l l 1
Biochemistry, Vol. 33, No. 13, 1994 4029
their dipolar broadening. This phenomenon occurs when the hyperfine and Zeeman interactions are matched (Larsen et al., 1992a, 1993); three such matched conditions occur for an S = 5 / 2 system. The first of these occurs when the Zeeman frequency is - 1.25 MHz (IMsl = 5 / 2 ) , the second at -2.0 MHz (IMsl = 3 / 2 ) , and the third at -7.0 MHz (IMsl = I / * ) .
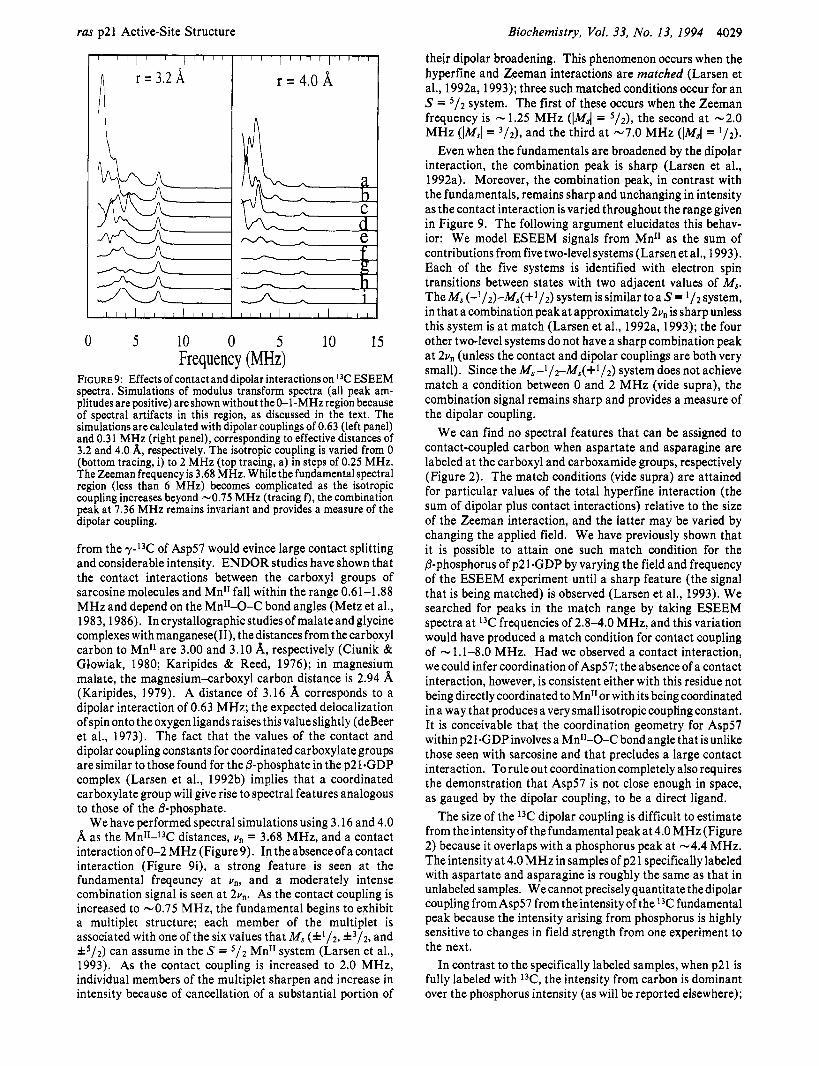
Even when the fundamentals are broadened by the dipolar interaction, the combination peak is sharp (Larsen et al., 1992a). Moreover, the combination peak, in contrast with the fundamentals, remains sharp and unchanging in intensity as the contact interaction is varied throughout the range given in Figure 9. The following argument elucidates this behav- ior: We model ESEEM signals from Mn" as the sum of contributions from five two-level systems (Larsen et al., 1993). Each of the five systems is identified with electron spin transitions between states with two adjacent values of M,. The M, (-I/2)-Ms(+l/2) system is similar to a S = l / 2 system, in that a combination peak at approximately 2vn is sharp unless this system is at match (Larsen et al., 1992a, 1993); the four other two-level systems do not have a sharp combination peak at 2v, (unless the contact and dipolar couplings are both very small). Since the M,-1/2-Ms(+1/2) system does not achieve match a condition between 0 and 2 MHz (vide supra), the combination signal remains sharp and provides a measure of the dipolar coupling.
We can find no spectral features that can be assigned to contact-coupled carbon when aspartate and asparagine are labeled at the carboxyl and carboxamide groups, respectively (Figure 2). The match conditions (vide supra) are attained for particular values of the total hyperfine interaction (the sum of dipolar plus contact interactions) relative to the size of the Zeeman interaction, and the latter may be varied by changing the applied field. We have previously shown that it is possible to attain one such match condition for the @-phosphorus of p2 1-GDP by varying the field and frequency of the ESEEM experiment until a sharp feature (the signal that is being matched) is observed (Larsen et al., 1993). We searched for peaks in the match range by taking ESEEM spectra at 13C frequencies of 2.8-4.0 MHz, and this variation would have produced a match condition for contact coupling of - 1.1-8.0 MHz. Had we observed a contact interaction, wecould infer coordination of Asp57; the absence of a contact interaction, however, is consistent either with this residue not being directly coordinated to Mn" or with its being coordinated in a way that produces a very small isotropic coupling constant. It is conceivable that the coordination geometry for Asp57 within p21.GDPinvolves a MnII-O-C bond angle that is unlike those seen with sarcosine and that precludes a large contact interaction. To rule out coordination completely also requires the demonstration that Asp57 is not close enough in space, as gauged by the dipolar coupling, to be a direct ligand.
The size of the I3C dipolar coupling is difficult to estimate from theintensity of the fundamental peakat 4.0 MHz (Figure 2) because it overlaps with a phosphorus peak at -4.4 MHz. The intensity at 4.0 MHz in samples of p2 1 specifically labeled with aspartate and asparagine is roughly the same as that in unlabeled samples. We cannot precisely quantitate thedipolar coupling from Asp57 from the intensity of the 13C fundamental peak because the intensity arising from phosphorus is highly sensitive to changes in field strength from one experiment to the next.
In contrast to the specifically labeled samples, when p21 is fully labeled with I3C, the intensity from carbon is dominant over the phosphorus intensity (as will be reported elsewhere);
\ I
a C
e f,
1 1 1 1 1 1 1 1 1 1 1 1 1 1 1 I I I I I I I I I I I I I I
0 5 10 0 5 10 15 Frequency (MHz)
FIGURE 9: Effects of contact and dipolar interactions on 13C ESEEM spectra. Simulations of modulus transform spectra (all peak am- plitudes are positive) are shown without the 0-I-MHz region because of spectral artifacts in this region, as discussed in the text. The simulations are calculated with dipolar couplings of 0.63 (left panel) and 0.31 MHz (right panel), corresponding to effective distances of 3.2 and 4.0 A, respectively. The isotropic coupling is varied from 0 (bottom tracing, i) to 2 MHz (top tracing, a) in steps of 0.25 MHz. The Zeeman frequency is 3.68 MHz. While the fundamentalspectral region (less than 6 MHz) becomes complicated as the isotropic coupling increases beyond -0.75 MHz (tracing f ) , the combination peak at 7.36 MHz remains invariant and provides a measure of the dipolar coupling.
from the y-I3C of Asp57 would evince large contact splitting and considerable intensity. ENDOR studies have shown that the contact interactions between the carboxyl groups of sarcosine molecules and Mn" fall within the range 0.61-1 -88 MHz and depend on the Mn"-0-C bond angles (Metz et al., 1983,1986). In crystallographicstudiesof malateand glycine complexes with manganese(II), thedistances from the carboxyl carbon to MnI1 are 3.00 and 3.10 A, respectively (Ciunik & Giowiak, 1980; Karipides & Reed, 1976); in magnesium malate, the magnesiumxarboxyl carbon distance is 2.94 (Karipides, 1979). A distance of 3.16 A corresponds to a dipolar interaction of 0.63 MHz; the expected delocalization of spin onto the oxygen ligands raises this value slightly (deBeer et al., 1973). The fact that the values of the contact and dipolar coupling constants for coordinated carboxylate groups are similar to those found for the P-phosphate in the p21.GDP complex (Larsen et al., 1992b) implies that a coordinated carboxylate group will give rise to spectral features analogous to those of the P-phosphate.
We have performed spectral simulations using 3.16 and 4.0 A as the MnI1-I3C distances, vn = 3.68 MHz, and a contact interaction of 0-2 MHz (Figure 9). In the absence of a contact interaction (Figure 9i), a strong feature is seen at the fundamental freqeuncy at vn, and a moderately intense combination signal is seen at 2vn. As the contact coupling is increased to -0.75 MHz, the fundamental begins to exhibit a multiplet structure; each member of the multiplet is associated with one of the six values that M, (f1/2, f 3 / 2 , and k5/2) can assume in the S = 5/2 Mn" system (Larsen et al., 1993). As the contact coupling is increased to 2.0 MHz, individual members of the multiplet sharpen and increase in intensity because of cancellation of a substantial portion of
4030
directly coordinated carboxyl carbon would be expected to be oneof the two largest contributors to this intensity. Thus, the carboxyl group of Asp57 is unlikely to be a major contributor to the l3C signal in the fully labeled sample.
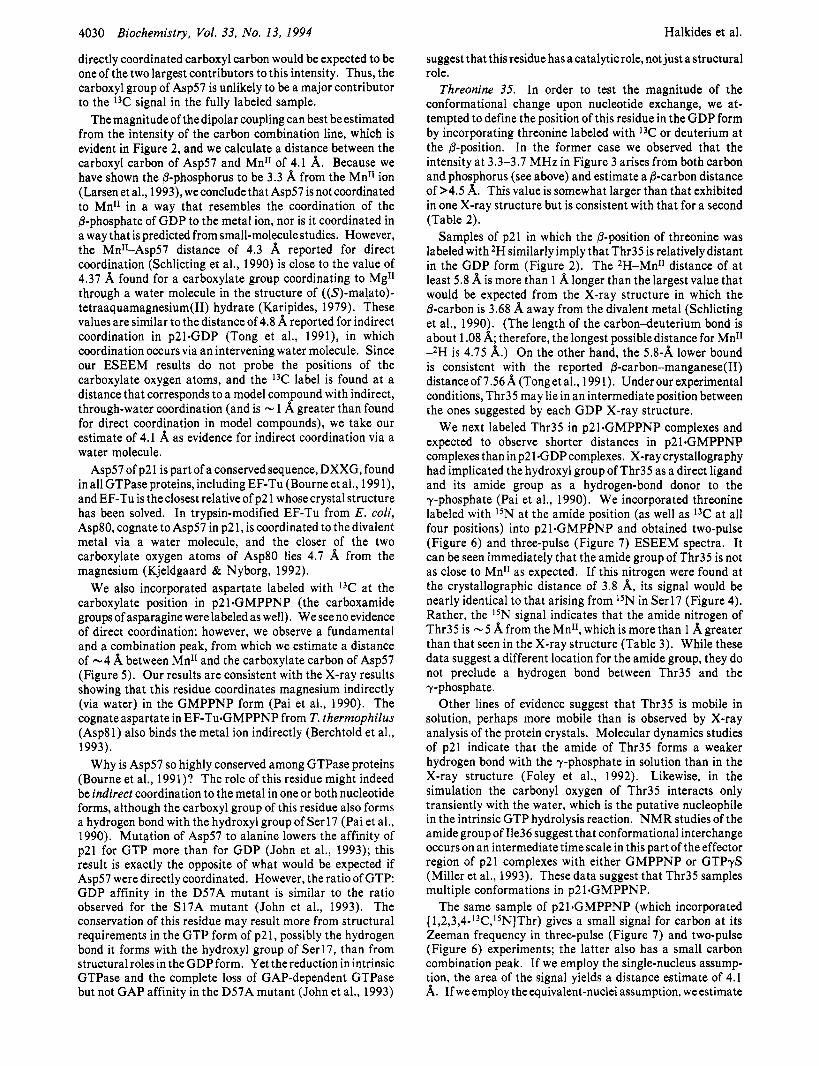
The magnitude of the dipolar coupling can best be estimated from the intensity of the carbon combination line, which is evident in Figure 2, and we calculate a distance between the carboxyl carbon of Asp57 and Mn" of 4.1 A. Because we have shown the P-phosphorus to be 3.3 A from the Mn" ion (Larsen et al., 1993), weconclude that Asp57 is not coordinated to Mn" in a way that resembles the coordination of the @-phosphate of GDP to the metal ion, nor is it coordinated in a way that is predicted from small-molecule studies. However, the MnII-Asp57 distance of 4.3 A reported for direct coordination (Schlicting et al., 1990) is close to the value of 4.37 A found for a carboxylate group coordinating to Mg" through a water molecule in the structure of ((S)-malato)- tetraaquamagnesium(I1) hydrate (Karipides, 1979). These values are similar to the distance of 4.8 A reported for indirect coordination in p21.GDP (Tong et al., 1991), in which coordination occurs via an intervening water molecule. Since our ESEEM results do not probe the positions of the carboxylate oxygen atoms, and the 13C label is found at a distance that corresponds to a model compound with indirect, through-water coordination (and is - 1 A greater than found for direct coordination in model compounds), we take our estimate of 4.1 as evidence for indirect coordination via a water molecule.
Asp57 of p21 is part of a conserved sequence, DXXG, found in all GTPase proteins, including EF-Tu (Bourne et al., 199 l) , and EF-Tu is the closest relative of p21 whose crystal structure has been solved. In trypsin-modified EF-Tu from E. coli, Asp80, cognate to Asp57 in p21, is coordinated to the divalent metal via a water molecule, and the closer of the two carboxylate oxygen atoms of Asp80 lies 4.7 A from the magnesium (Kjeldgaard & Nyborg, 1992).
We also incorporated aspartate labeled with 13C at the carboxylate position in p21.GMPPNP (the carboxamide groups of asparagine were labeled as well). We see no evidence of direct coordination; however, we observe a fundamental and a combination peak, from which we estimate a distance of -4 A between Mn" and the carboxylate carbon of Asp57 (Figure 5). Our results are consistent with the X-ray results showing that this residue coordinates magnesium indirectly (via water) in the GMPPNP form (Pai et al., 1990). The cognate aspartate in EF-Tu-GMPPNP from T. thermophilus (Asp81) also binds the metal ion indirectly (Berchtold et al., 1993).
Why is Asp57 so highly conserved among GTPase proteins (Bourne et al., 1991)? The role of this residue might indeed be indirect coordination to the metal in one or both nucleotide forms, although the carboxyl group of this residue also forms a hydrogen bond with the hydroxyl group of Ser 17 (Pai et al., 1990). Mutation of Asp57 to alanine lowers the affinity of p21 for GTP more than for GDP (John et al., 1993); this result is exactly the opposite of what would be expected if Asp57 were directly coordinated. However, the ratio of GTP: GDP affinity in the D57A mutant is similar to the ratio observed for the S17A mutant (John et al., 1993). The conservation of this residue may result more from structural requirements in the GTP form of p21, possibly the hydrogen bond it forms with the hydroxyl group of Serl7, than from structural roles in the GDP form. Yet the reduction in intrinsic GTPase and the complete loss of GAP-dependent GTPase but not GAP affinity in the D57A mutant (John et al., 1993)
Biochemistry, Vol. 33, No. 13, 1994 Halkides et al.
suggest that this residue has a catalytic role, not just a structural role.
Threonine 35. In order to test the magnitude of the conformational change upon nucleotide exchange, we at- tempted to define the position of this residue in the GDP form by incorporating threonine labeled with 13C or deuterium at the @-position. In the former case we observed that the intensity at 3.3-3.7 MHz in Figure 3 arises from both carbon and phosphorus (see above) and estimate a P-carbon distance of >4.5 A. This value is somewhat larger than that exhibited in one X-ray structure but is consistent with that for a second (Table 2).
Samples of p21 in which the /3-position of threonine was labeled with 2H similarly imply that Thr35 is relatively distant in the GDP form (Figure 2). The 2H-Mn11 distance of at least 5.8 A is more than 1 A longer than the largest value that would be expected from the X-ray structure in which the P-carbon is 3.68 8, away from the divalent metal (Schlicting et al., 1990). (The length of the carbon-deuterium bond is about 1.08 A; therefore, the longest possible distance for MnI1 -2H is 4.75 A.) On the other hand, the 5.8-A lower bound is consistent with the reported /3-carbon-manganese(I1) distanceof7.56A (Tonget al., 1991). Underour experimental conditions, Thr35 may lie in an intermediate position between the ones suggested by each GDP X-ray structure.
We next labeled Thr35 in p21.GMPPNP complexes and expected to observe shorter distances in p2 1 .GMPPNP complexes than in p2 1-GDP complexes. X-ray crystallography had implicated the hydroxyl group of Thr35 as a direct ligand and its amide group as a hydrogen-bond donor to the y-phosphate (Pai et al., 1990). We incorporated threonine labeled with 15N at the amide position (as well as 13C at all four positions) into p2 1 .GMPPNP and obtained two-pulse (Figure 6) and three-pulse (Figure 7) ESEEM spectra. It can be seen immediately that the amide group of Thr35 is not as close to Mntl as expected. If this nitrogen were found at the crystallographic distance of 3.8 A, its signal would be nearly identical to that arising from 15N in Serl7 (Figure 4). Rather, the I5N signal indicates that the amide nitrogen of Thr35 is -5 A from the Mn", which is more than 1 A greater than that seen in the X-ray structure (Table 3). While these data suggest a different location for the amide group, they do not preclude a hydrogen bond between Thr35 and the y-phosphate.
Other lines of evidence suggest that Thr35 is mobile in solution, perhaps more mobile than is observed by X-ray analysis of the protein crystals. Molecular dynamics studies of p21 indicate that the amide of Thr35 forms a weaker hydrogen bond with the y-phosphate in solution than in the X-ray structure (Foley et al., 1992). Likewise, in the simulation the carbonyl oxygen of Thr35 interacts only transiently with the water, which is the putative nucleophile in the intrinsic GTP hydrolysis reaction. NMR studies of the amide group of Ile36 suggest that conformational interchange occurs on an intermediate time scale in this part of the effector region of p21 complexes with either GMPPNP or GTPyS (Miller et al., 1993). These data suggest that Thr35 samples multiple conformations in p21 mGMPPNP.
The same sample of p21,GMPPNP (which incorporated [1,2,3,4-13C,1SN]Thr) gives a small signal for carbon at its Zeeman frequency in three-pulse (Figure 7) and two-pulse (Figure 6 ) experiments; the latter also has a small carbon combination peak. If we employ the single-nucleus assump- tion, the area of the signal yields a distance estimate of 4.1 A. If we employ the equivalent-nuclei assumption, we estimate
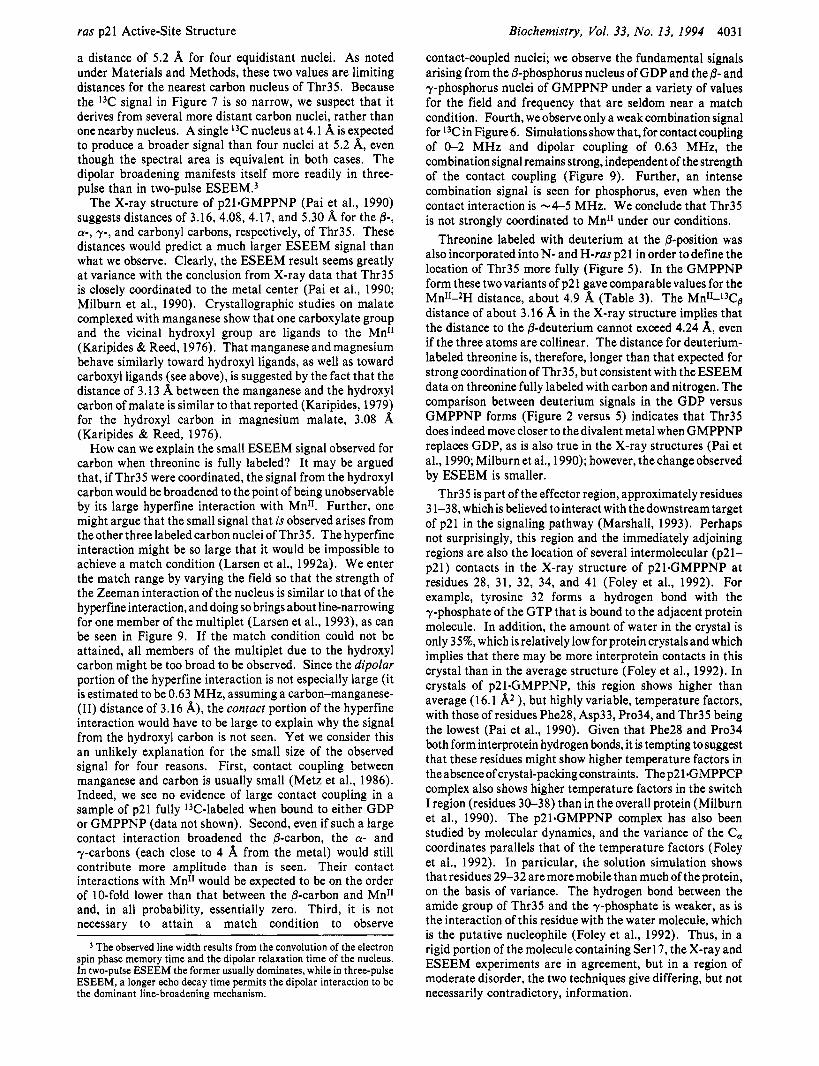
ras p21 Active-Site Structure
a distance of 5.2 A for four equidistant nuclei. As noted under Materials and Methods, these two values are limiting distances for the nearest carbon nucleus of Thr35. Because the 13C signal in Figure 7 is so narrow, we suspect that it derives from several more distant carbon nuclei, rather than one nearby nucleus. A single 13C nucleus at 4.1 A is expected to produce a broader signal than four nuclei at 5.2 A, even though the spectral area is equivalent in both cases. The dipolar broadening manifests itself more readily in three- pulse than in two-pulse ESEEM.3
The X-ray structure of p21.GMPPNP (Pai et al., 1990) suggests distances of 3.16, 4.08,4.17, and 5.30 A for the @-, a-, y-, and carbonyl carbons, respectively, of Thr35. These distances would predict a much larger ESEEM signal than what we observe. Clearly, the ESEEM result seems greatly at variance with the conclusion from X-ray data that Thr35 is closely coordinated to the metal center (Pai et al., 1990; Milburn et al., 1990). Crystallographic studies on malate complexed with manganese show that one carboxylate group and the vicinal hydroxyl group are ligands to the Mnrl (Karipides & Reed, 1976). That manganese and magnesium behave similarly toward hydroxyl ligands, as well as toward carboxyl ligands (see above), is suggested by the fact that the distance of 3.13 A between the manganese and the hydroxyl carbon of malate is similar to that reported (Karipides, 1979) for the hydroxyl carbon in magnesium malate, 3.08 A (Karipides & Reed, 1976).
How can we explain the small ESEEM signal observed for carbon when threonine is fully labeled? It may be argued that, if Thr35 were coordinated, the signal from the hydroxyl carbon would be broadened to the point of being unobservable by its large hyperfine interaction with Mn". Further, one might argue that the small signal that is observed arises from the other three labeled carbon nuclei of Thr35. The hyperfine interaction might be so large that it would be impossible to achieve a match condition (Larsen et al., 1992a). We enter the match range by varying the field so that the strength of the Zeeman interaction of the nucleus is similar to that of the hyperfine interaction, and doing so brings about line-narrowing for one member of the multiplet (Larsen et al., 1993), as can be seen in Figure 9. If the match condition could not be attained, all members of the multiplet due to the hydroxyl carbon might be too broad to be observed. Since the dipolar portion of the hyperfine interaction is not especially large (it is estimated to be 0.63 MHz, assuming a carbon-manganese- (11) distance of 3.16 A), the conracr portion of the hyperfine interaction would have to be large to explain why the signal from the hydroxyl carbon is not seen. Yet we consider this an unlikely explanation for the small size of the observed signal for four reasons. First, contact coupling between manganese and carbon is usually small (Metz et al., 1986). Indeed, we see no evidence of large contact coupling in a sample of p21 fully 13C-labeled when bound to either GDP or GMPPNP (data not shown). Second, even if such a large contact interaction broadened the @-carbon, the a- and y-carbons (each close to 4 A from the metal) would still contribute more amplitude than is seen. Their contact interactions with Mn" would be expected to be on the order of 10-fold lower than that between the @-carbon and MnI1 and, in all probability, essentially zero. Third, it is not necessary to attain a match condition to observe
Biochemistry, Vol. 33, No. 13, 1994 4031
contact-coupled nuclei; we observe the fundamental signals arising from the @-phosphorus nucleus of GDP and the 8- and y-phosphorus nuclei of GMPPNP under a variety of values for the field and frequency that are seldom near a match condition. Fourth, we observe only a weak combination signal for 13C in Figure 6. Simulations show that, for contact coupling of 0-2 MHz and dipolar coupling of 0.63 MHz, the combination signal remains strong, independent of the strength of the contact coupling (Figure 9). Further, an intense combination signal is seen for phosphorus, even when the contact interaction is -4-5 MHz. We conclude that Thr35 is not strongly coordinated to Mn" under our conditions.
Threonine labeled with deuterium at the @-position was also incorporated into N- and H-ras p21 in order to define the location of Thr35 more fully (Figure 5 ) . In the GMPPNP form these two variants of p21 gave comparable values for the Mn11-2H distance, about 4.9 A (Table 3). The Mn1I-l3C6 distance of about 3.16 A in the X-ray structure implies that the distance to the @-deuterium cannot exceed 4.24 A, even if the three atoms are collinear. The distance for deuterium- labeled threonine is, therefore, longer than that expected for strong coordination of Thr35, but consistent with the ESEEM data on threonine fully labeled with carbon and nitrogen. The comparison between deuterium signals in the GDP versus GMPPNP forms (Figure 2 versus 5 ) indicates that Thr35 does indeed move closer to the divalent metal when GMPPNP replaces GDP, as is also true in the X-ray structures (Pai et al., 1990; Milburn et al., 1990); however, the change observed by ESEEM is smaller.
Thr35 is part of the effector region, approximately residues 3 1-38, which is believed to interact with thedownstream target of p21 in the signaling pathway (Marshall, 1993). Perhaps not surprisingly, this region and the immediately adjoining regions are also the location of several intermolecular (p21- p21) contacts in the X-ray structure of p21.GMPPNP at residues 28, 31, 32, 34, and 41 (Foley et al., 1992). For example, tyrosine 32 forms a hydrogen bond with the y-phosphate of the GTP that is bound to the adjacent protein molecule. In addition, the amount of water in the crystal is only 35% which is relatively low for protein crystals and which implies that there may be more interprotein contacts in this crystal than in the average structure (Foley et al., 1992). In crystals of p2 1-GMPPNP, this region shows higher than average (16.1 A2 ), but highly variable, temperature factors, with those of residues Phe28, Asp33, Pro34, and Thr35 being the lowest (Pai et al., 1990). Given that Phe28 and Pro34 both form interprotein hydrogen bonds, it is tempting to suggest that these residues might show higher temperature factors in the absence of crystal-packing constraints. The p21.GMPPCP complex also shows higher temperature factors in the switch I region (residues 30-38) than in the overall protein (Milburn et al., 1990). The p21.GMPPNP complex has also been studied by molecular dynamics, and the variance of the C, coordinates parallels that of the temperature factors (Foley et al., 1992). In particular, the solution simulation shows that residues 29-32 are more mobile than much of the protein, on the basis of variance. The hydrogen bond between the amide group of Thr35 and the y-phosphate is weaker, as is the interaction of this residue with the water molecule, which is the putative nucleophile (Foley et al., 1992). Thus, in a rigid portion of the molecule containing Serl7, the X-ray and ESEEM experiments are in agreement, but in a region of moderate disorder, the two techniques give differing, but not necessarily contradictory, information.
3 The observed line width results from the convolution of the electron spin phase memory time and the dipolar relaxation time of the nucleus. In two-pulse ESEEM the former usually dominates, while in three-pulse ESEEM, a longer echo decay time permits the dipolar interaction to be the dominant line-broadening mechanism.
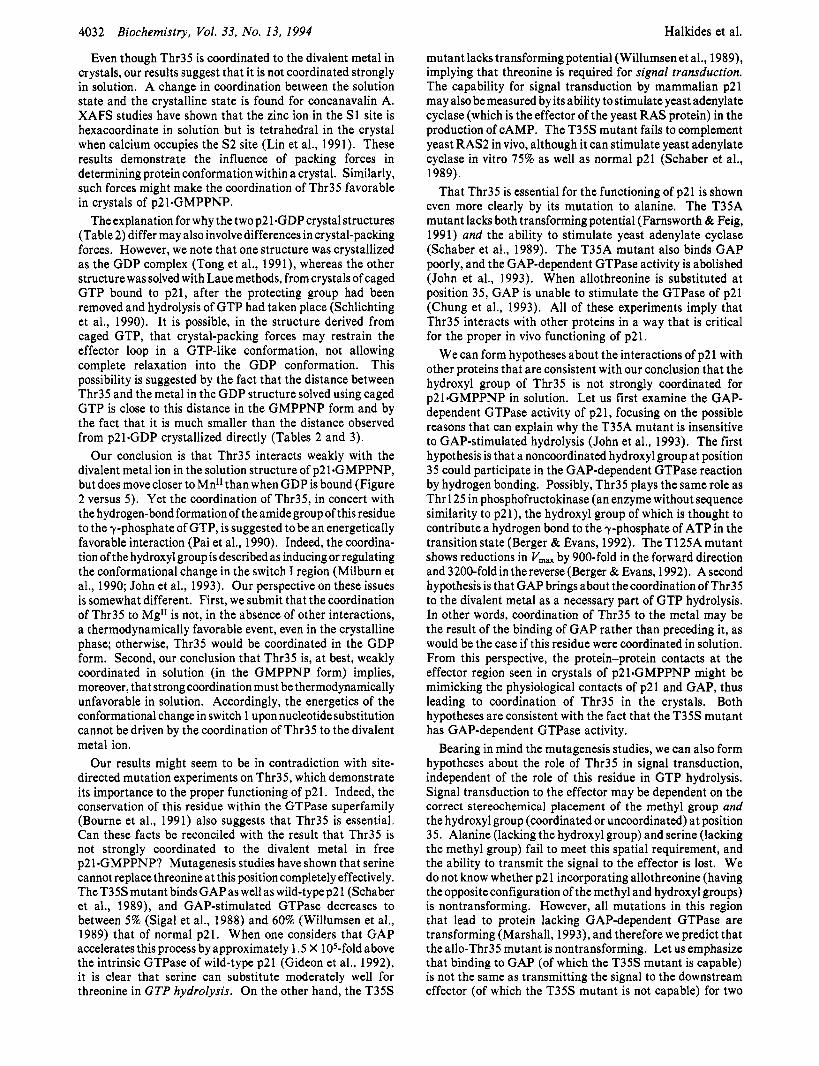
4032 Biochemistry, Vol. 33, No. 13, 1994
Even though Thr35 is coordinated to the divalent metal in crystals, our results suggest that it is not coordinated strongly in solution. A change in coordination between the solution state and the crystalline state is found for concanavalin A. XAFS studies have shown that the zinc ion in the S1 site is hexacoordinate in solution but is tetrahedral in the crystal when calcium occupies the S2 site (Lin et al., 1991). These results demonstrate the influence of packing forces in determining protein conformation within a crystal. Similarly, such forces might make the coordination of Thr35 favorable in crystals of p21.GMPPNP.
The explanation for why the two p21.GDP crystal structures (Table 2) differ may also involve differences in crystal-packing forces. However, we note that one structure was crystallized as the GDP complex (Tong et al., 1991), whereas the other structure was solved with Laue methods, from crystals of caged GTP bound to p21, after the protecting group had been removed and hydrolysis of GTP had taken place (Schlichting et al., 1990). It is possible, in the structure derived from caged GTP, that crystal-packing forces may restrain the effector loop in a GTP-like conformation, not allowing complete relaxation into the GDP conformation. This possibility is suggested by the fact that the distance between Thr35 and the metal in the GDP structure solved using caged GTP is close to this distance in the GMPPNP form and by the fact that it is much smaller than the distance observed from p21.GDP crystallized directly (Tables 2 and 3).
Our conclusion is that Thr35 interacts weakly with the divalent metal ion in the solution structure of p21*GMPPNP, but does move closer to Mn*I than when GDP is bound (Figure 2 versus 5). Yet the coordination of Thr35, in concert with the hydrogen-bond formation of the amide group of this residue to the y-phosphate of GTP, is suggested to be an energetically favorable interaction (Pai et al., 1990). Indeed, the coordina- tion of the hydroxyl group is described as inducing or regulating the conformational change in the switch I region (Milburn et al., 1990; John et al., 1993). Our perspective on these issues is somewhat different. First, we submit that the coordination of Thr35 to Mg" is not, in the absence of other interactions, a thermodynamically favorable event, even in the crystalline phase; otherwise, Thr35 would be coordinated in the GDP form. Second, our conclusion that Thr35 is, at best, weakly coordinated in solution (in the GMPPNP form) implies, moreover, that strong coordination must be thermodynamically unfavorable in solution. Accordingly, the energetics of the conformational change in switch 1 upon nucleotidesubstitution cannot be driven by the coordination of Thr35 to the divalent metal ion.
Our results might seem to be in contradiction with site- directed mutation experiments on Thr35, which demonstrate its importance to the proper functioning of p21. Indeed, the conservation of this residue within the GTPase superfamily (Bourne et al., 1991) also suggests that Thr35 is essential. Can these facts be reconciled with the result that Thr35 is not strongly coordinated to the divalent metal in free p2 1-GMPPNP? Mutagenesis studies have shown that serine cannot replace threonine at this position completely effectively. The T35S mutant binds GAP as well as wild-type p2 1 (Schaber et al., 1989), and GAP-stimulated GTPase decreases to between 5% (Sigal et al., 1988) and 60% (Willumsen et al., 1989) that of normal p21. When one considers that GAP accelerates this process by approximately 1.5 X 10⁵-fold above the intrinsic GTPase of wild-type p21 (Gideon et al., 1992), it is clear that serine can substitute moderately well for threonine in GTP hydrolysis. On the other hand, the T35S
Halkides et al.
mutant lacks transforming potential (Willumsen et al., 1989), implying that threonine is required for signal transduction. The capability for signal transduction by mammalian p21 may also be measured by its ability to stimulate yeast adenylate cyclase (which is the effector of the yeast RAS protein) in the production of CAMP. The T35S mutant fails to complement yeast RAS2 in vivo, although it can stimulate yeast adenylate cyclase in vitro 75% as well as normal p21 (Schaber et al., 1989).
That Thr35 is essential for the functioning of p21 is shown even more clearly by its mutation to alanine. The T35A mutant lacks both transforming potential (Farnsworth & Feig, 1991) and the ability to stimulate yeast adenylate cyclase (Schaber et al., 1989). The T35A mutant also binds GAP poorly, and the GAP-dependent GTPase activity is abolished (John et al., 1993). When allothreonine is substituted at position 35, GAP is unable to stimulate the GTPase of p21 (Chung et al., 1993). All of these experiments imply that Thr35 interacts with other proteins in a way that is critical for the proper in vivo functioning of p21.
We can form hypotheses about the interactions of p21 with other proteins that are consistent with our conclusion that the hydroxyl group of Thr35 is not strongly coordinated for p21.GMPPNP in solution. Let us first examine the GAP- dependent GTPase activity of p2 1, focusing on the possible reasons that can explain why the T35A mutant is insensitive to GAP-stimulated hydrolysis (John et al., 1993). The first hypothesis is that a noncoordinated hydroxyl group at position 35 could participate in the GAP-dependent GTPase reaction by hydrogen bonding. Possibly, Thr35 plays the same role as Thr 125 in phosphofructokinase (an enzyme without sequence similarity to p21), the hydroxyl group of which is thought to contribute a hydrogen bond to the y-phosphate of ATP in the transition state (Berger & Evans, 1992). The T125A mutant shows reductions in V,,, by 900-fold in the forward direction and 3200-fold in the reverse (Berger & Evans, 1992). A second hypothesis is that GAP brings about the coordination of Thr35 to the divalent metal as a necessary part of GTP hydrolysis. In other words, coordination of Thr35 to the metal may be the result of the binding of GAP rather than preceding it, as would be the case if this residue were coordinated in solution. From this perspective, the protein-protein contacts at the effector region seen in crystals of p21.GMPPNP might be mimicking the physiological contacts of p21 and GAP, thus leading to coordination of Thr35 in the crystals. Both hypotheses are consistent with the fact that the T35S mutant has GAP-dependent GTPase activity.
Bearing in mind the mutagenesis studies, we can also form hypotheses about the role of Thr35 in signal transduction, independent of the role of this residue in GTP hydrolysis. Signal transduction to the effector may be dependent on the correct stereochemical placement of the methyl group and the hydroxyl group (coordinated or uncoordinated) at position 35. Alanine (lacking the hydroxyl group) and serine (lacking the methyl group) fail to meet this spatial requirement, and the ability to transmit the signal to the effector is lost. We do not know whether p2 1 incorporating allothreonine (having the opposite configuration of the methyl and hydroxyl groups) is nontransforming. However, all mutations in this region that lead to protein lacking GAP-dependent GTPase are transforming (Marshall, 1993), and therefore we predict that the allo-Thr35 mutant is nontransforming. Let us emphasize that binding to GAP (of which the T35S mutant is capable) is not the same as transmitting the signal to the downstream effector (of which the T35S mutant is not capable) for two
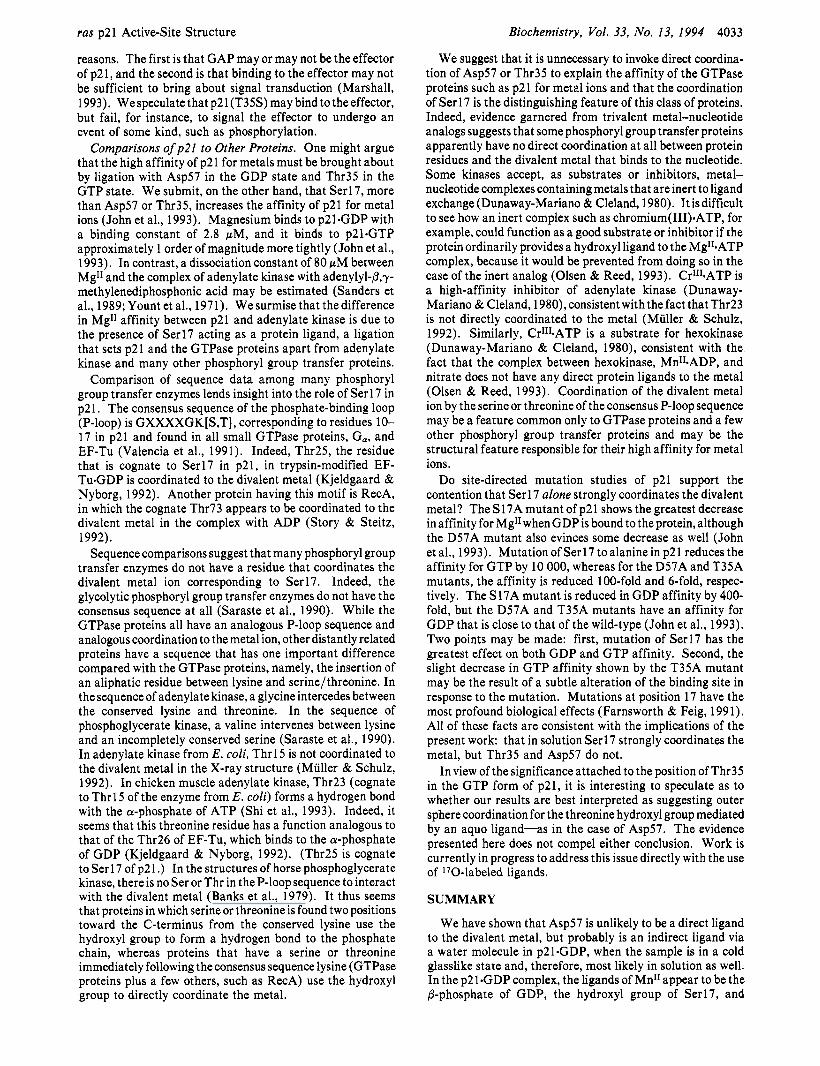
ras p21 Active-Site Structure
reasons. The first is that GAP may or may not be the effector of p21, and the second is that binding to the effector may not be sufficient to bring about signal transduction (Marshall, 1993). Wespeculatethat p21(T35S) may bindtotheeffector, but fail, for instance, to signal the effector to undergo an event of some kind, such as phosphorylation.
Comparisons of p21 to Other Proteins. One might argue that the high affinity of p21 for metals must be brought about by ligation with Asp57 in the GDP state and Thr35 in the GTP state. We submit, on the other hand, that Serl7, more than Asp57 or Thr35, increases the affinity of p21 for metal ions (John et al., 1993). Magnesium binds to p21.GDP with a binding constant of 2.8 pM, and it binds to p21.GTP approximately 1 order of magnitude more tightly (John et al., 1993). In contrast, a dissociation constant of 80 pM between MgI1 and the complex of adenylate kinase with adenylyl-0,y- methylenediphosphonic acid may be estimated (Sanders et al., 1989; Yount et al., 1971). We surmise that the difference in Mg" affinity between p21 and adenylate kinase is due to the presence of Serl7 acting as a protein ligand, a ligation that sets p21 and the GTPase proteins apart from adenylate kinase and many other phosphoryl group transfer proteins.
Comparison of sequence data among many phosphoryl group transfer enzymes lends insight into the role of Serl7 in p21. The consensus sequence of the phosphate-binding loop (P-loop) is GXXXXGK[S,T], corresponding to residues 10- 17 in p21 and found in all small GTPase proteins, G,, and EF-Tu (Valencia et al., 1991). Indeed, Thr25, the residue that is cognate to Serl7 in p21, in trypsin-modified EF- Tu-GDP is coordinated to the divalent metal (Kjeldgaard & Nyborg, 1992). Another protein having this motif is RecA, in which the cognate Thr73 appears to be coordinated to the divalent metal in the complex with ADP (Story & Steitz, 1992).
Sequence comparisons suggest that many phosphoryl group transfer enzymes do not have a residue that coordinates the divalent metal ion corresponding to Serl7. Indeed, the glycolytic phosphoryl group transfer enzymes do not have the consensus sequence at all (Saraste et al., 1990). While the GTPase proteins all have an analogous P-loop sequence and analogous coordination to the metal ion, other distantly related proteins have a sequence that has one important difference compared with the GTPase proteins, namely, the insertion of an aliphatic residue between lysine and serine/threonine. In the sequence of adenylate kinase, a glycine intercedes between the conserved lysine and threonine. In the sequence of phosphoglycerate kinase, a valine intervenes between lysine and an incompletely conserved serine (Saraste et al., 1990). In adenylate kinase from E . coli, Thrl5 is not coordinated to the divalent metal in the X-ray structure (Muller & Schulz, 1992). In chicken muscle adenylate kinase, Thr23 (cognate to Thr 15 of the enzyme from E . coli) forms a hydrogen bond with the a-phosphate of ATP (Shi et al., 1993). Indeed, it seems that this threonine residue has a function analogous to that of the Thr26 of EF-Tu, which binds to the a-phosphate of GDP (Kjeldgaard & Nyborg, 1992). (Thr25 is cognate to Ser 17 of p21.) In the structures of horse phosphoglycerate kinase, there is no Ser or Thr in the P-loop sequence to interact with the divalent metal (Banks et al., 1979). It thus seems that proteins in which serine or threonine is found two positions toward the C-terminus from the conserved lysine use the hydroxyl group to form a hydrogen bond to the phosphate chain, whereas proteins that have a serine or threonine immediately following the consensus sequence lysine (GTPase proteins plus a few others, such as RecA) use the hydroxyl group to directly coordinate the metal.
Biochemistry, Vol. 33, No. 13, 1994 4033
We suggest that it is unnecessary to invoke direct coordina- tion of Asp57 or Thr35 to explain the affinity of the GTPase proteins such as p21 for metal ions and that the coordination of Ser 17 is the distinguishing feature of this class of proteins. Indeed, evidence garnered from trivalent metal-nucleotide analogs suggests that some phosphoryl group transfer proteins apparently have no direct coordination at all between protein residues and the divalent metal that binds to the nucleotide. Some kinases accept, as substrates or inhibitors, metal- nucleotide complexes containing metals that are inert to ligand exchange (Dunaway-Mariano & Cleland, 1980). It is difficult to see how an inert complex such as chromium(III).ATP, for example, could function as a good substrate or inhibitor if the protein ordinarily provides a hydroxyl ligand to the Mg".ATP complex, because it would be prevented from doing so in the case of the inert analog (Olsen & Reed, 1993). CrlI1.ATP is a high-affinity inhibitor of adenylate kinase (Dunaway- Mariano & Cleland, 1980), consistent with the fact that Thr23 is not directly coordinated to the metal (Muller & Schulz, 1992). Similarly, CrlI1.ATP is a substrate for hexokinase (Dunaway-Mariano & Cleland, 1980), consistent with the fact that the complex between hexokinase, MnIIaADP, and nitrate does not have any direct protein ligands to the metal (Olsen & Reed, 1993). Coordination of the divalent metal ion by the serine or threonine of the consensus P-loop sequence may be a feature common only to GTPase proteins and a few other phosphoryl group transfer proteins and may be the structural feature responsible for their high affinity for metal ions.
Do site-directed mutation studies of p21 support the contention that Ser 17 alone strongly coordinates the divalent metal? The S17A mutant of p21 shows the greatest decrease in affinity for Mg" when GDP is bound to the protein, although the D57A mutant also evinces some decrease as well (John et al., 1993). Mutation of Serl7 to alanine in p21 reduces the affinity for GTP by 10 000, whereas for the D57A and T35A mutants, the affinity is reduced 100-fold and 6-fold, respec- tively. The S17A mutant is reduced in GDP affinity by 400- fold, but the D57A and T35A mutants have an affinity for GDP that is close to that of the wild-type (John et al., 1993). Two points may be made: first, mutation of Serl7 has the greatest effect on both GDP and GTP affinity. Second, the slight decrease in GTP affinity shown by the T35A mutant may be the result of a subtle alteration of the binding site in response to the mutation. Mutations at position 17 have the most profound biological effects (Farnsworth & Feig, 199 1 ). All of these facts are consistent with the implications of the present work: that in solution Serl7 strongly coordinates the metal, but Thr35 and Asp57 do not.
In view of the significance attached to the position of Thr35 in the GTP form of p21, it is interesting to speculate as to whether our results are best interpreted as suggesting outer sphere coordination for the threonine hydroxyl group mediated by an aquo ligand-as in the case of Asp57. The evidence presented here does not compel either conclusion. Work is currently in progress to address this issue directly with the use of "0-labeled ligands.
SUMMARY
We have shown that Asp57 is unlikely to be a direct ligand to the divalent metal, but probably is an indirect ligand via a water molecule in p21-GDP, when the sample is in a cold glasslike state and, therefore, most likely in solution as well. In the p21.GDP complex, the ligands of Mn" appear to be the 0-phosphate of GDP, the hydroxyl group of Serl7, and
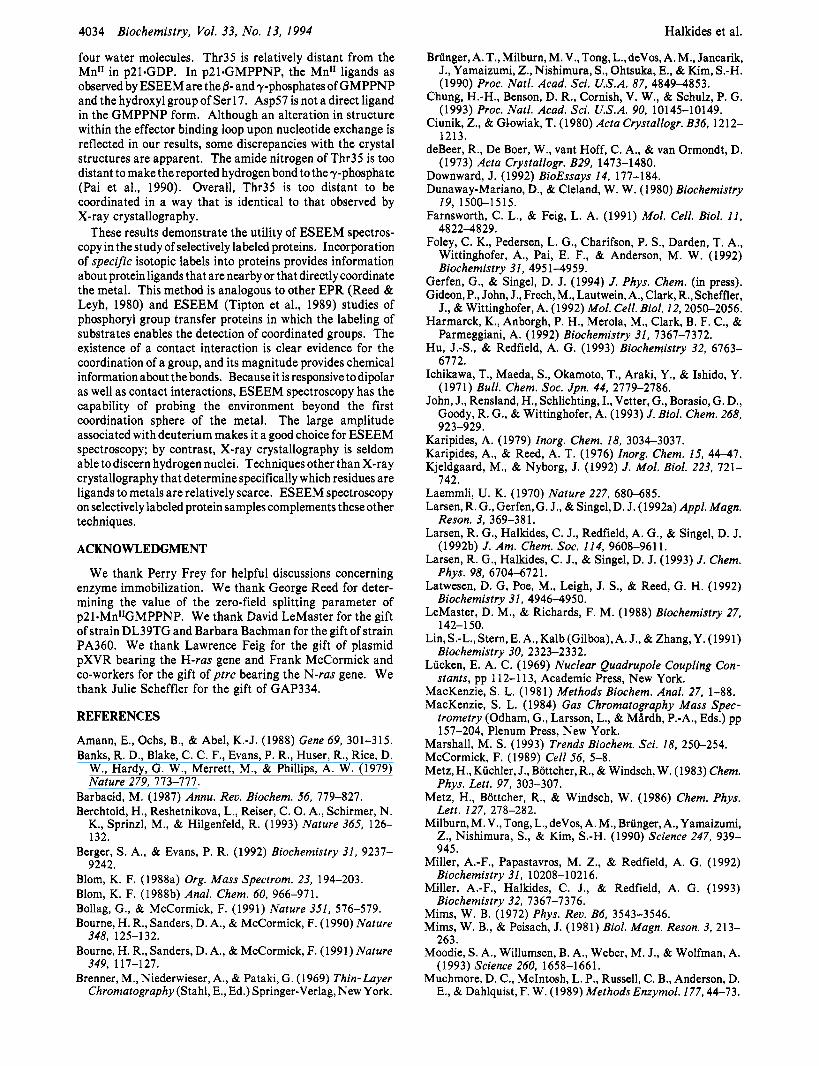
4034 Biochemistry, Vol. 33, No. 13, 1994
four water molecules. Thr35 is relatively distant from the Mnrl in p21-GDP. In p21*GMPPNP, the MnI1 ligands as observed by ESEEM are the /3- and y-phosphates of GMPPNP and the hydroxyl group of Serl7. Asp57 is not a direct ligand in the GMPPNP form. Although an alteration in structure within the effector binding loop upon nucleotide exchange is reflected in our results, some discrepancies with the crystal structures are apparent. The amide nitrogen of Thr35 is too distant to make the reported hydrogen bond to the y-phosphate (Pai et al., 1990). Overall, Thr35 is too distant to be coordinated in a way that is identical to that observed by X-ray crystallography.
These results demonstrate the utility of ESEEM spectros- copy in the study of selectively labeled proteins. Incorporation of specific isotopic labels into proteins provides information about protein ligands that are nearby or that directly coordinate the metal. This method is analogous to other EPR (Reed & Leyh, 1980) and ESEEM (Tipton et al., 1989) studies of phosphoryl group transfer proteins in which the labeling of substrates enables the detection of coordinated groups. The existence of a contact interaction is clear evidence for the coordination of a group, and its magnitude provides chemical information about the bonds. Because it is responsive to dipolar as well as contact interactions, ESEEM spectroscopy has the capability of probing the environment beyond the first coordination sphere of the metal. The large amplitude associated with deuterium makes it a good choice for ESEEM spectroscopy; by contrast, X-ray crystallography is seldom able to discern hydrogen nuclei. Techniques other than X-ray crystallography that determine specifically which residues are ligands to metals are relatively scarce. ESEEM spectroscopy on selectively labeled protein samples complements these other techniques.
ACKNOWLEDGMENT
We thank Perry Frey for helpful discussions concerning enzyme immobilization. We thank George Reed for deter- mining the value of the zero-field splitting parameter of p21.MnIIGMPPNP. We thank David LeMaster for the gift of strain DL39TG and Barbara Bachman for the gift of strain PA360. We thank Lawrence Feig for the gift of plasmid pXVR bearing the H-ras gene and Frank McCormick and co-workers for the gift of ptrc bearing the N-ras gene. We thank Julie Scheffler for the gift of GAP334.
Halkides et al.
REFERENCES
Amann, E., Ochs, B., & Abel, K.-J. (1988) Gene 69, 301-315. Banks, R. D., Blake, C. C. F., Evans, P. R., Huser, R., Rice, D.
W., Hardy, G. W., Merrett, M., & Phillips, A. W. (1979) Nature 279, 773-777.
Barbacid, M. (1987) Annu. Rev. Biochem. 56, 779-827. Berchtold, H., Reshetnikova, L., Reiser, C. 0. A,, Schirmer, N.
K., Sprinzl, M., & Hilgenfeld, R. (1993) Nature 365, 126- 132.
Berger, S. A,, & Evans, P. R. (1992) Biochemistry 31. 9237- 9242.
Blom, K. F. (1988a) Org. Mass Spectrom. 23, 194-203. Blom, K. F. (1988b) Anal. Chem. 60, 966-971. Bollag, G., & McCormick, F. (1991) Nature 351, 576-579. Bourne, H. R., Sanders, D. A., & McCormick, F. (1990) Nature
Bourne, H. R., Sanders, D. A,, & McCormick, F. (1991) Nature
Brenner, M., Niederwieser, A., & Pataki, G. (1969) Thin-Layer Chromatography (Stahl, E., Ed.) Springer-Verlag, New York.
348, 125-132.
349, 117-127.
Briinger, A. T., Milburn, M. V., Tong, L., deVos, A. M., Jancarik, J., Yamaizumi, Z., Nishimura, S., Ohtsuka, E., & Kim, S.-H. (1990) Proc. Natl. Acad. Sci. U.S.A. 87, 4849-4853.
Chung, H.-H., Benson, D. R., Cornish, V. W., & Schulz, P. G. (1993) Proc. Natl. Acad. Sci. U.S.A. 90, 10145-10149.
Ciunik, Z., & Giowiak, T. (1980) Acta Crystallogr. B36, 1212- 1213.
deBeer, R., De Boer, W., vant Hoff, C. A,, & van Ormondt, D. (1973) Acta Crystallogr. B29, 1473-1480.
Downward, J. (1992) BioEssays 14, 177-184. Dunaway-Mariano, D., & Cleland, W. W. (1980) Biochemistry
19, 1500-1515. Farnsworth, C. L., & Feig, L. A. (1991) Mol. Cell. Biol. 11,
4822-4829. Foley, C. K., Pedersen, L. G., Charifson, P. S., Darden, T. A.,
Wittinghofer, A., Pai, E. F., & Anderson, M. W. (1992) Biochemistry 31, 495 1-4959.
Gerfen, G., & Singel, D. J. (1994) J. Phys. Chem. (in press). Gideon, P., John, J., Frech, M., Lautwein, A,, Clark, R., Scheffler,
J., & Wittinghofer, A. (1992) Mol. Cell. Biol. 12,2050-2056. Harmarck, K., Anborgh, P. H., Merola, M., Clark, B. F. C., &
Parmeggiani, A. (1992) Biochemistry 31, 7367-7372. Hu, J.-S., & Redfield, A. G. (1993) Biochemistry 32, 6763-
6772. Ichikawa, T., Maeda, S., Okamoto, T., Araki, Y., & Ishido, Y.
(1971) Bull. Chem. SOC. Jpn. 44, 2779-2786. John, J., Rensland, H., Schlichting, I., Vetter, G., Borasio, G. D.,
Goody, R. G., & Wittinghofer, A. (1993) J. Biol. Chem. 268, 923-929.
Karipides, A. (1979) Inorg. Chem. 18, 3034-3037. Karipides, A., & Reed, A. T. (1976) Znorg. Chem. 15, 44-47. Kjeldgaard, M., & Nyborg, J. (1992) J. Mol. Biol. 223, 721-
Laemmli, U. K. (1970) Nature 227, 680-685. Larsen, R. G., Gerfen, G. J., & Singel, D. J. (1992a) Appl. Magn.
Larsen, R. G. , Halkides, C. J., Redfield, A. G., & Singel, D. J.
Larsen, R. G., Halkides, C. J., & Singel, D. J. (1993) J. Chem.
Latwesen, D. G, Poe, M., Leigh, J. S., & Reed, G. H. (1992)
LeMaster, D. M., & Richards, F. M. (1988) Biochemistry 27,
Lin,S.-L., Stern, E. A.,Kalb (Gilboa),A. J., & Zhang,Y. (1991)
Liicken, E. A. C. (1969) Nuclear Quadrupole Coupling Con-
MacKenzie, S. L. (1981) Methods Biochem. Anal. 27, 1-88. MacKenzie, S. L. (1984) Gas Chromatography Mass Spec-
trometry (Odham, G., Larsson, L., & MArdh, P.-A,, Eds.) pp 157-204, Plenum Press, New York.
742.
Reson. 3, 369-38 1.
(1992b) J. Am. Chem. SOC. 114, 9608-9611.
Phys. 98, 6704-6721.
Biochemistry 31, 4946-4950.
142-150.
Biochemistry 30, 23 23-23 3 2.
stants, pp 112-1 13, Academic Press, New York.
Marshall, M. S. (1993) Trends Biochem. Sci. 18, 250-254. McCormick, F. (1989) Cell 56, 5-8. Metz, H., Kiichler, J., Bottcher, R., & Windsch, W. (1983) Chem.
Phys. Lett. 97, 303-307. Metz, H., Bottcher, R., & Windsch, W. (1986) Chem. Phys.
Lett. 127, 278-282. Milburn, M. V.,Tong, L., deVos, A. M., Briinger, A., Yamaizumi,
Z., Nishimura, S., & Kim, S.-H. (1990) Science 247, 939- 945.
Miller, A.-F., Papastavros, M. Z., & Redfield, A. G. (1992) Biochemistry 31, 10208-10216.
Miller, A.-F., Halkides, C. J., & Redfield, A. G. (1993) Biochemistry 32, 7367-7376.
Mims, W. B. (1972) Phys. Rev. B6, 3543-3546. Mims, W. B., & Peisach, J. (1981) Biol. Magn. Reson. 3, 213-
263. Moodie, S. A., Willumsen, B. A., Weber, M. J., & Wolfman, A.
(1993) Science 260, 1658-1661. Muchmore, D. C., McIntosh, L. P., Russell, C. B., Anderson, D.
E., & Dahlquist, F. W. (1989) Methods Enzymol. I77,44-73.
ras p21 Active-Site Structure
Muller, C. W., & Schulz, G. E. (1992) J. Mol. Biol. 224, 159- 177.
Muto, Y., Yamasaki, K., Ito, Y.,Yajima,S., Masaki, H., Uozumi, T., Walchli, M., Nishimura S., Miyazawa, T., & Yokoyama, S. (1993) J. Biomol. Nucl. Magn. Reson. 3, 165-184.
Ohdan, S., Ichikawa, T., Araki, Y., & Ishido, Y. (1974) Bull. Chem. SOC. Jpn. 47, 1295-1296.
Olsen, L. R., & Reed, G. H. (1993) Arch. Biochem. Biophys.
Pai, E. F., Krengel, U., Petsko, G., Goody, R. S., Kabsch, W.,
Reed, G. H., & Leyh, T. S. (1980) Biochemistry 19,5472-5480. Reed, G. H., & Markham, G. D. (1984) Biol. Magn. Reson. 6,
Sanders, C. R., 11, Tian G., & Tsai, M.-D. (1989) Biochemistry
Saraste, M., Sibbald, P. R., & Wittinghofer, A. (1990) Trends Biochem. Sci. 15, 430-434.
Schaber, M. D., Garski, V. M., Boylan, D., Hill, W. S., Scolnick, E. M., Marshall, M. S., Sigal, I. S., & Gibbs, J. B. (1989) Proteins: Struct., Funct., Genet. 6, 306-3 15.
Schlicting, I., Almo, S. C., Rapp, G., Wilson, K., Petratos, K., Lentfer, A., Wittinghofer, A., Kabsch, W., Pai, E. F., Petsko, G. A,, & Goody, R. (1990) Nature 345, 309-315.
Seckler, R., Wu, G.-M., & Timasheff, S. N. (1990) J. Biol. Chem. 265, 7655-7661.
304, 242-247.
& Wittinghofer, A. (1990) EMBO J. 9, 2351-2359.
73-142.
28, 9028-9043.
Biochemistry, Vol. 33, No. 13, 1994 4035
Shacter, E. (1 984) Anal. Biochem. 138, 4 16-420. Shi, Z., Byeon, I.-J. L., Jiang, R.-T., & Tsai, M.-D. (1993)
Shirasawa, S., Furuse, M., Yokoyama, N., & Sasazuki, T. (1993)
Spieker-Polet, H., & Polet, H. (1976) 1. Biol. Chem. 251, 987-
Story, R. M., & Steitz, T. A. (1992) Nature 355, 374-376. Stouten, P. F. W., Sander, C., Wittinghofer, A., & Valencia, A.
Tilton, R. F., Dewan, J. C., & Petsko, G. A. (1992) Biochemistry
Tipton, P. A., McCracken, J., Cornelius, J. B., & Peisach, J.
Tong, L., deVos, A. M., Milburn, M. V., Brunger, A., & Kim,
Tsai, M.-D., & Yan, H. (1991) Biochemistry 30, 6806-6818. Valencia, A., Chardin, P., Wittinghofer, A., & Sander, C. (1991)
Biochemistry 30, 4637-4648. Willumsen, B. M., Adari, H., Zhang, K., Papageorge, A. G.,
Stone, J. C., McCormick, F., & Lowy, D. R. (1989) in The Guanine Nucleotide Binding Proteins, NATO AS1 Series A, Vol. 165, pp 165-177, Plenum Press, New York.
Yount, R. G., Babcock, D., Ballantyne, W., & Ojala, D. (1971) Biochemistry 10, 2484-2489.
Biochemistry 32, 6450-6458.
Science 260, 85-88.
992.
(1993) FEBS Lett. 320, 1-6.
31, 2469-248 1.
(1989) Biochemistry 28, 5720-5728.
S.-H. (1991) J . Mol. Biol. 217, 503-516.
Top Related
Copyright © 2022 FDOKUMEN

