Real and Nominal GDP and GDP as a Measure of Well being
20
0 Free-response/problem Explain why an economy’s income must equal its expenditure. CHAPTER 23 MEASURING A NATION’S INCOME
-
Upload
independent -
Category
Documents
-
view
1 -
download
0
Transcript of Real and Nominal GDP and GDP as a Measure of Well being

0
Free-response/problem
Explain why an economy’s income must equal
its expenditure.
CHAPTER 23 MEASURING A NATION’S INCOME
© 2007 Thomson South-Western, all rights reserved
N. G R E G O R Y M A N K I W
PowerPoint® Slides
by Ron Cronovich
23
ECONOMICSP R I N C I P L E S O F
F O U R T H E D I T I O N
Measuring a Nation’s Income

2 CHAPTER 23 MEASURING A NATION’S INCOME
Real versus Nominal GDP
Inflation can distort economic variables like GDP,
so we have two versions of GDP:
One is corrected for inflation, the other is not.
Nominal GDP values output using current prices.
It is not corrected for inflation.
Real GDP values output using the prices of
a base year. Real GDP is corrected for inflation.

3 CHAPTER 23 MEASURING A NATION’S INCOME
EXAMPLE:
Compute nominal GDP in each year:
2002: $10 x 400 + $2 x 1000 = $6,000
2003: $11 x 500 + $2.50 x 1100 = $8,250
2004: $12 x 600 + $3 x 1200 = $10,800
Pizza Latte
year P Q P Q
2002 $10 400 $2.00 1000
2003 $11 500 $2.50 1100
2004 $12 600 $3.00 1200
37.5%
Increase:
30.9%

4 CHAPTER 23 MEASURING A NATION’S INCOME
EXAMPLE:
Compute real GDP in each year,
using 2002 as the base year:
Pizza Latte
year P Q P Q
2002 $10 400 $2.00 1000
2003 $11 500 $2.50 1100
2004 $12 600 $3.00 1200
20.0%
Increase:
16.7%
$10 $2.00
2002: $10 x 400 + $2 x 1000 = $6,000
2003: $10 x 500 + $2 x 1100 = $7,200
2004: $10 x 600 + $2 x 1200 = $8,400
5 CHAPTER 23 MEASURING A NATION’S INCOME
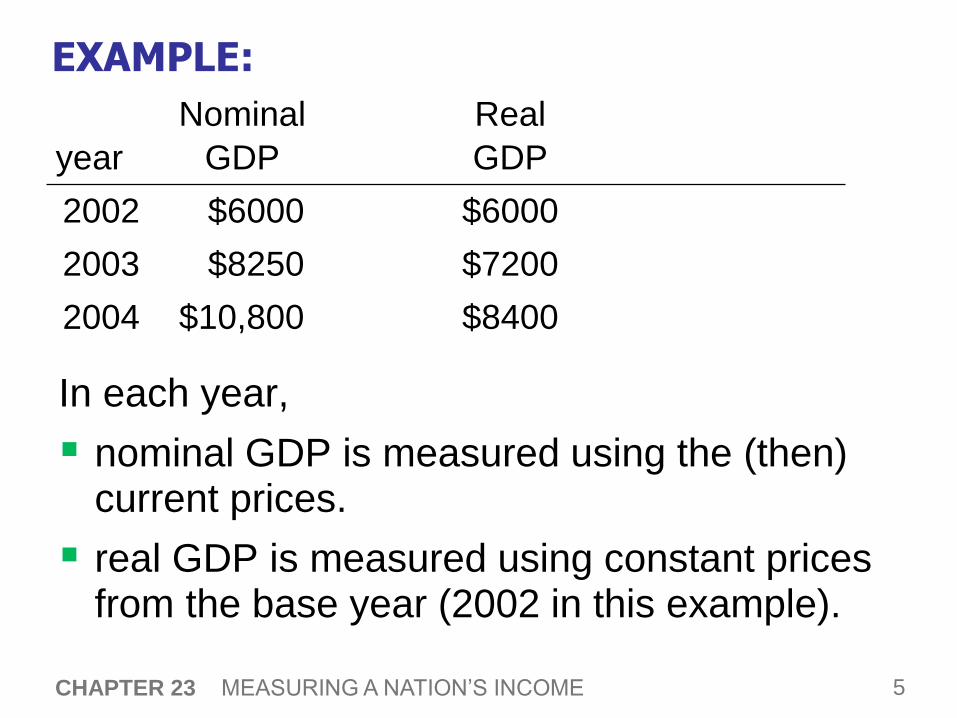
EXAMPLE:
In each year,
nominal GDP is measured using the (then) current prices.
real GDP is measured using constant prices from the base year (2002 in this example).
year
Nominal
GDP
Real
GDP
2002 $6000 $6000
2003 $8250 $7200
2004 $10,800 $8400
6 CHAPTER 23 MEASURING A NATION’S INCOME
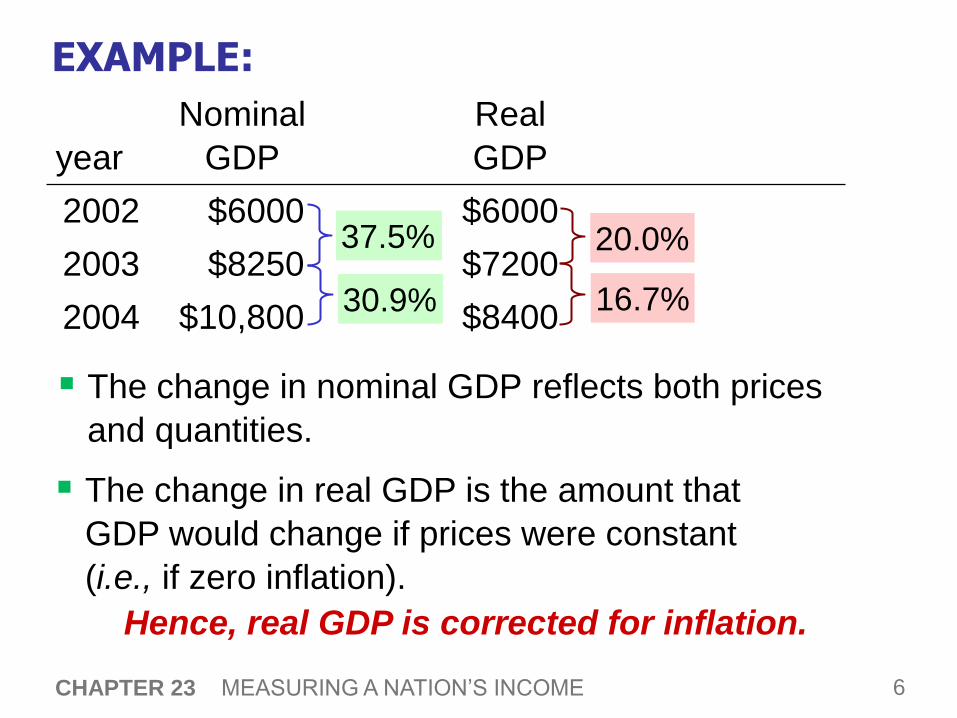
EXAMPLE:
The change in nominal GDP reflects both prices
and quantities.
year
Nominal
GDP
Real
GDP
2002 $6000 $6000
2003 $8250 $7200
2004 $10,800 $8400
20.0%
16.7%
37.5%
30.9%
The change in real GDP is the amount that
GDP would change if prices were constant
(i.e., if zero inflation).
Hence, real GDP is corrected for inflation.
7 CHAPTER 23 MEASURING A NATION’S INCOME
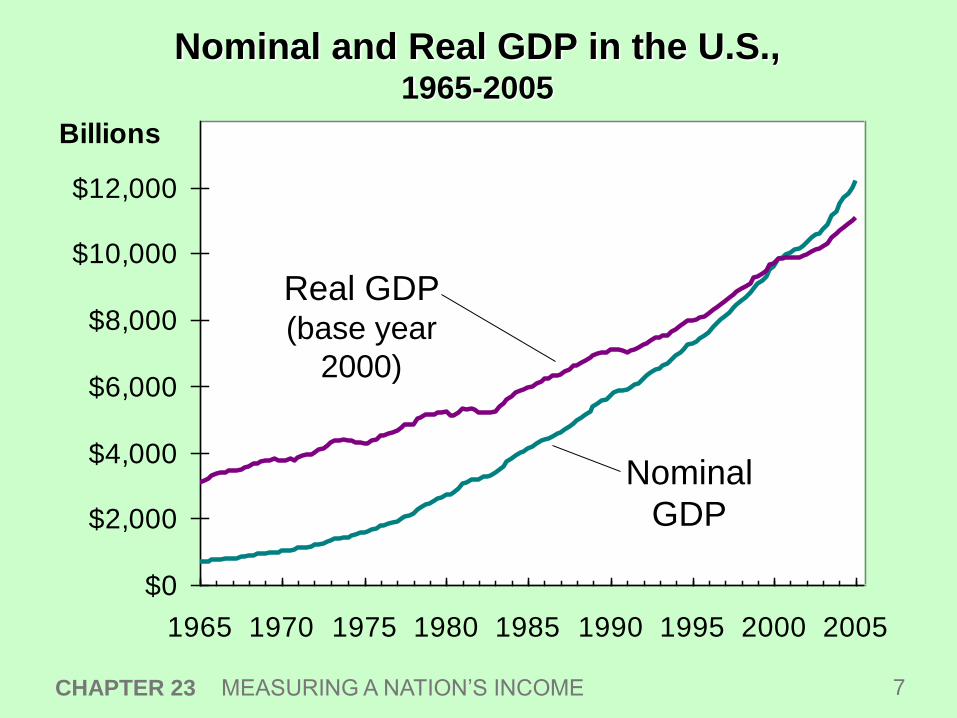
Nominal and Real GDP in the U.S., 1965-2005
$0
$2,000
$4,000
$6,000
$8,000
$10,000
$12,000
1965 1970 1975 1980 1985 1990 1995 2000 2005
Billions
Real GDP (base year
2000)
Nominal
GDP
8 CHAPTER 23 MEASURING A NATION’S INCOME
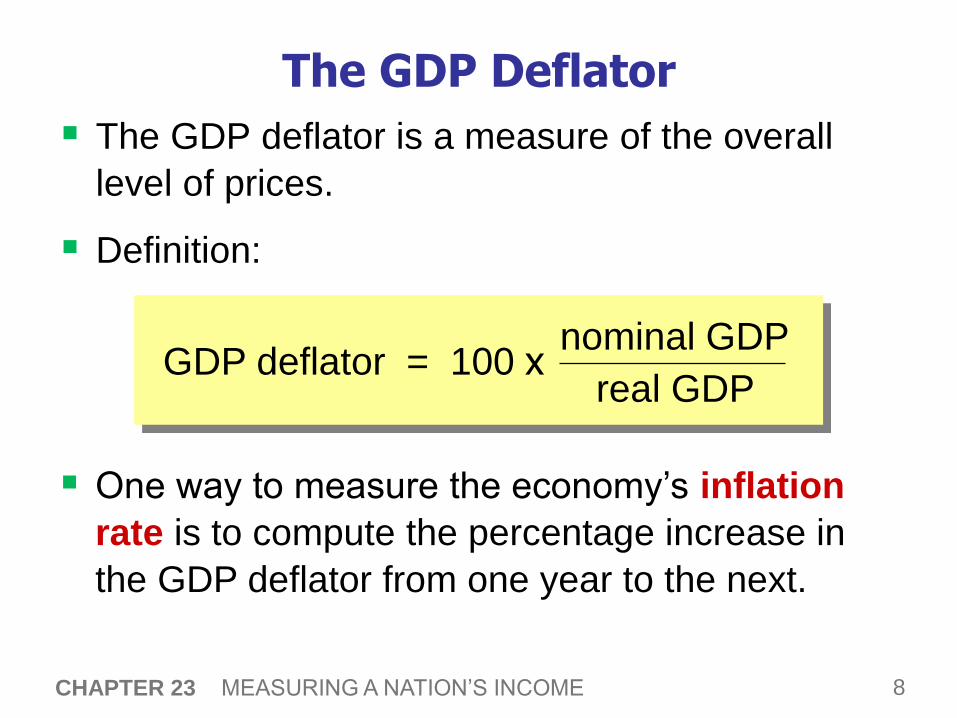
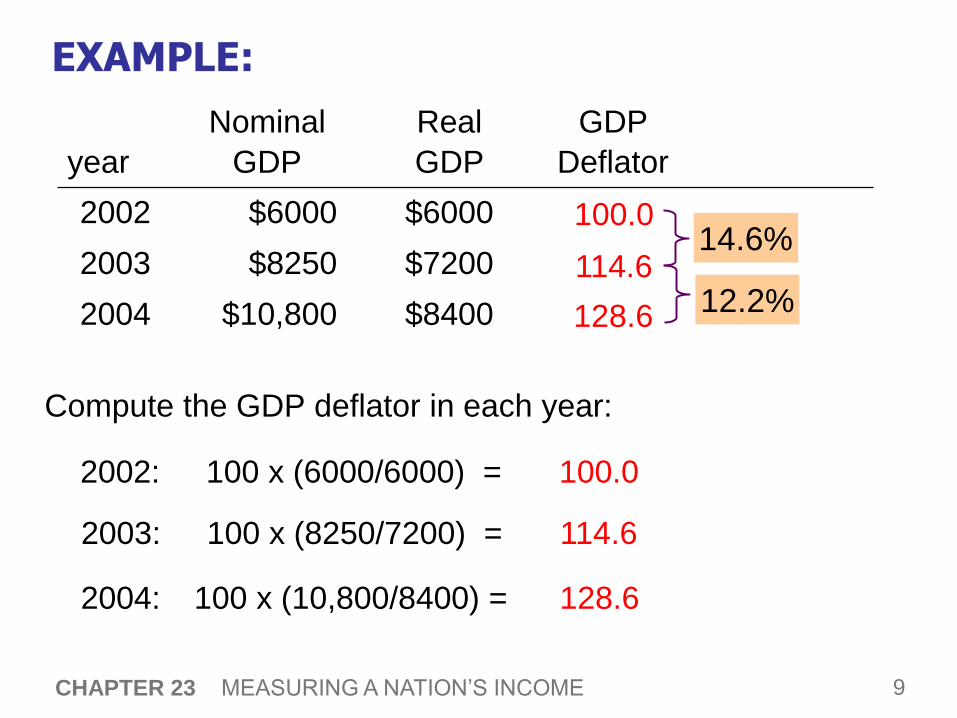
The GDP Deflator
The GDP deflator is a measure of the overall
level of prices.
Definition:
One way to measure the economy’s inflation
rate is to compute the percentage increase in
the GDP deflator from one year to the next.
GDP deflator = 100 x nominal GDP
real GDP
9 CHAPTER 23 MEASURING A NATION’S INCOME
EXAMPLE:
Compute the GDP deflator in each year:
year
Nominal
GDP
Real
GDP
GDP
Deflator
2002 $6000 $6000
2003 $8250 $7200
2004 $10,800 $8400
2002: 100 x (6000/6000) = 100.0
100.0
2003: 100 x (8250/7200) = 114.6
114.6
2004: 100 x (10,800/8400) = 128.6
128.6
14.6%
12.2%

A C T I V E L E A R N I N G 2:
Computing GDP
10
Use the above data to solve these problems:
A. Compute nominal GDP in 2004.
B. Compute real GDP in 2005.
C. Compute the GDP deflator in 2006.
2004 (base yr) 2005 2006
P Q P Q P Q
good A $30 900 $31 1,000 $36 1050
good B $100 192 $102 200 $100 205

A C T I V E L E A R N I N G 2:
Answers
11
A. Compute nominal GDP in 2004.
$30 x 900 + $100 x 192 = $46,200
B. Compute real GDP in 2005.
$30 x 1000 + $100 x 200 = $50,000
2004 (base yr) 2005 2006
P Q P Q P Q
good A $30 900 $31 1,000 $36 1050
good B $100 192 $102 200 $100 205
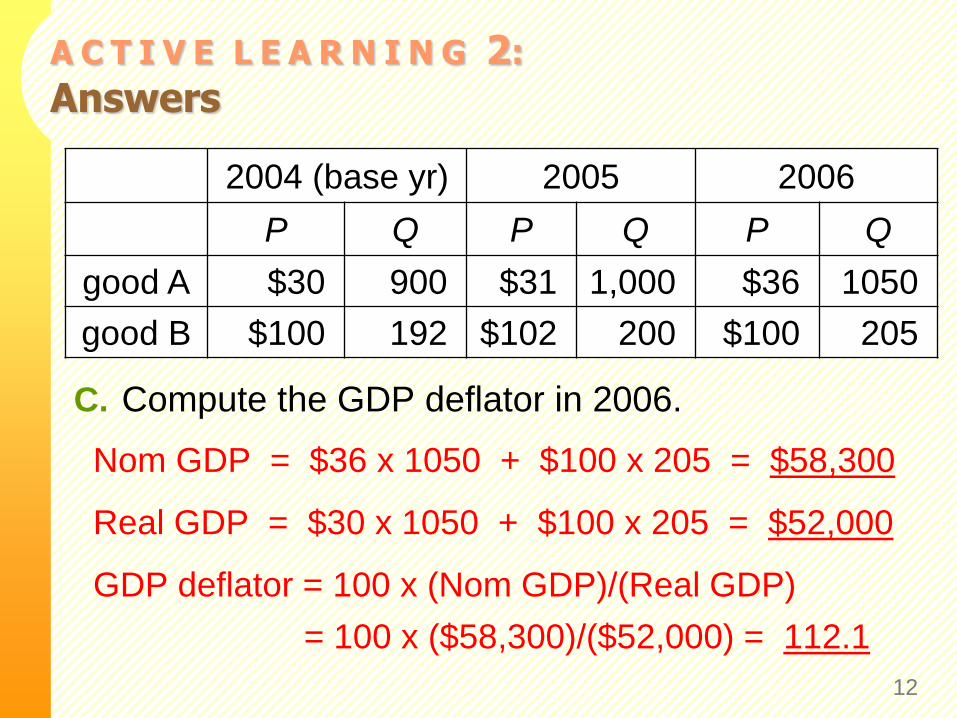
A C T I V E L E A R N I N G 2:
Answers
12
C. Compute the GDP deflator in 2006.
Nom GDP = $36 x 1050 + $100 x 205 = $58,300
Real GDP = $30 x 1050 + $100 x 205 = $52,000
GDP deflator = 100 x (Nom GDP)/(Real GDP)
= 100 x ($58,300)/($52,000) = 112.1
2004 (base yr) 2005 2006
P Q P Q P Q
good A $30 900 $31 1,000 $36 1050
good B $100 192 $102 200 $100 205
13 CHAPTER 23 MEASURING A NATION’S INCOME
GDP and Economic Well-Being
Real GDP per capita is the main indicator of
the average person’s standard of living.
But GDP is not a perfect measure of
well-being.
Robert Kennedy issued a very eloquent
yet harsh criticism of GDP:

Gross Domestic Product…
“… does not allow for the health of our
children, the quality of their education,
or the joy of their play. It does not
include the beauty of our poetry or
the strength of our marriages, the
intelligence of our public debate or
the integrity of our public officials.
It measures neither our courage, nor our wisdom,
nor our devotion to our country. It measures everything,
in short, except that which makes life worthwhile, and it
can tell us everything about America except why we are
proud that we are Americans.”
- Senator Robert Kennedy, 1968
15 CHAPTER 23 MEASURING A NATION’S INCOME
GDP Does Not Value:
the quality of the environment
leisure time
non-market activity, such as the child care
a parent provides his or her child at home
an equitable distribution of income
16 CHAPTER 23 MEASURING A NATION’S INCOME
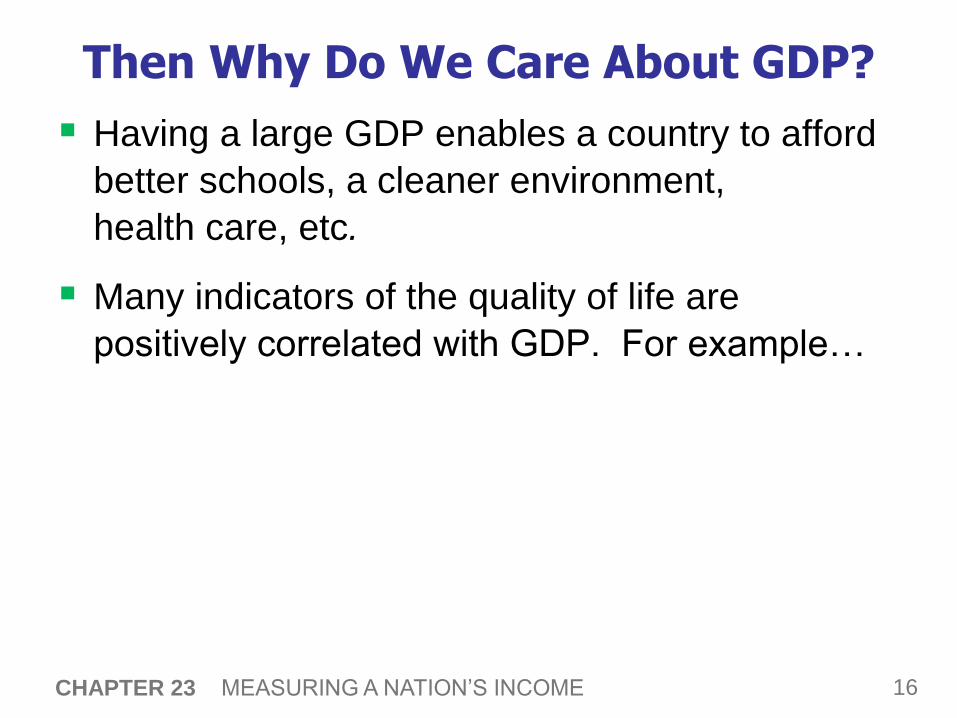
Then Why Do We Care About GDP?
Having a large GDP enables a country to afford
better schools, a cleaner environment,
health care, etc.
Many indicators of the quality of life are
positively correlated with GDP. For example…
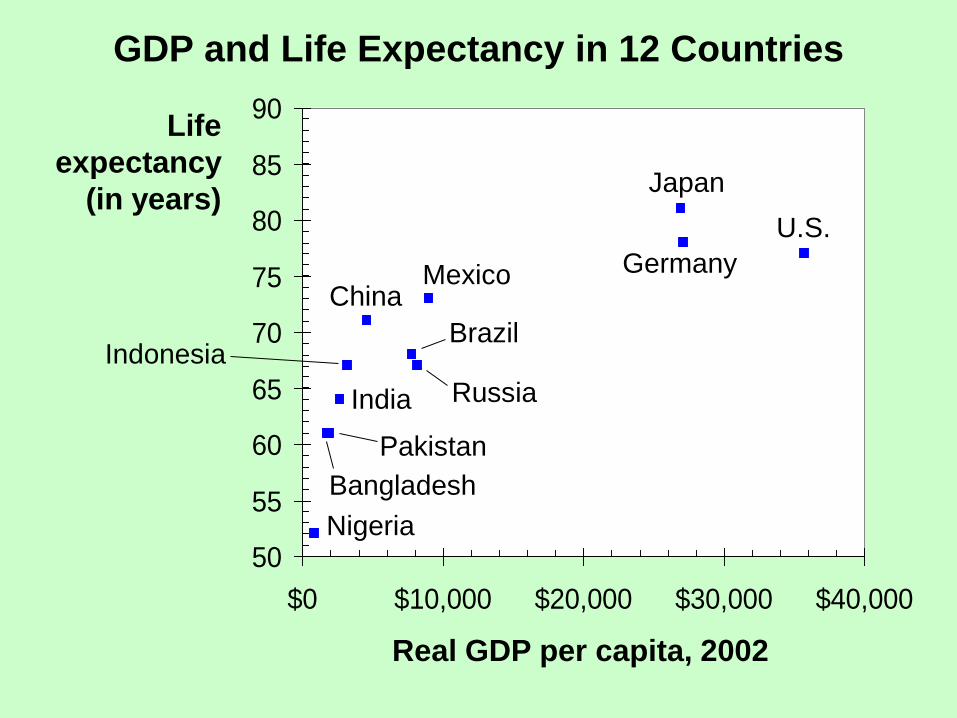
GDP and Life Expectancy in 12 Countries
50
55
60
65
70
75
80
85
90
$0 $10,000 $20,000 $30,000 $40,000
Life
expectancy
(in years)
Real GDP per capita, 2002
U.S.
Germany
Japan
Nigeria
Mexico
Russia
Brazil
China
Pakistan
Bangladesh
India
Indonesia

GDP and Adult Literacy in 12 Countries
30
40
50
60
70
80
90
100
$0 $10,000 $20,000 $30,000 $40,000
Adult
Literacy
(% of
population)
Real GDP per capita, 2002
U.S.
Germany
Japan
Russia
Nigeria
Mexico
Brazil
China
Pakistan
Bangladesh
India
Indonesia
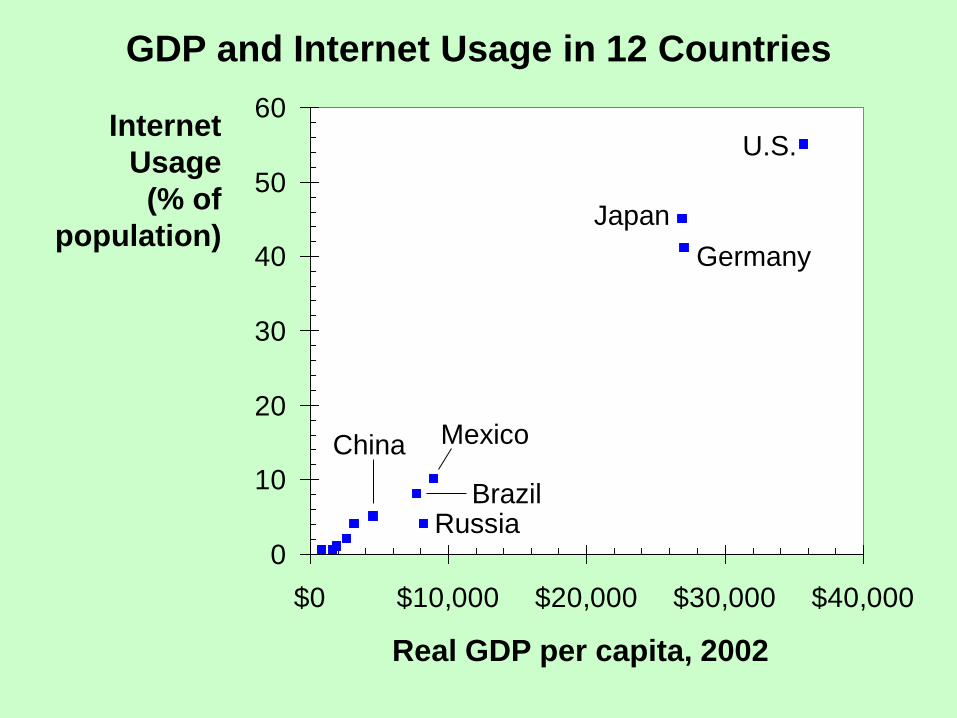
GDP and Internet Usage in 12 Countries
0
10
20
30
40
50
60
$0 $10,000 $20,000 $30,000 $40,000
Internet
Usage
(% of
population)
Real GDP per capita, 2002
U.S.
Germany
Japan
Mexico
Russia Brazil
China