


Bahasa
Halaman
Hukum

128
CHAPTER 4
Reduction of MnO2(birnessite) by Malonic Acid, Acetoacetic Acid,
Acetylacetone, and Structurally-Related compounds
4.1 Abstract
This study examines rates and pathways for redox reactions between a synthetic
MnO2(birnessite) and thirteen organic compounds, including eight β-diketones, two β-
ketocarboxylic acids, and three β-dicarboxylic acids. With β-diketones, high reactivity
generally corresponds to high enol content, which is contributed by the presence of labile
α-H atom(s). With β-dicarboxylic acids, malonic acid and dimethylmalonic acid are
much more reactive than dimethylmalonic acid, indicating that a α-H is required for
higher reactivity. Malonic acid oxidation via the conversion of a α-H into a α-OH to
yield tartronic acid has been proposed based upon product analysis. For acetylacetone,
acetoacetic acid, and malonic acid, the effect of pH on reactivity correlates well with the
pH dependence of adsorption.

129
4.2 Introduction
Studies are underway in our laboratory in an effort to understand and predict rates of
electron transfer between aliphatic organic compounds and manganese(III,IV)
(hydr)oxides. The previous paper in this series (1) included rates of dissolved MnII
production (R0) for the following four organic substrates:
R0 (µM/hr)
Oxalic acid HOOCCOOH 462
Pyruvic acid H3C(C=O)COOH 68
2,3-Butanedione H3C(C=O)(C=O)CH3 30
Oxalic acid Dimethyl Ester H3COOCCOOCH3 2.7
These rates were recorded using suspensions containing 200 µM synthetic MnO2, 5.0
mM organic substrate, and 10.0 mM butyrate buffer (pH 5.0). Reductive dissolution
reactions of this kind are believed to begin with organic substrate-surface precursor
complex formation, which is an adsorption process, and then proceed to electron transfer.
Free carboxylate groups facilitate reaction by facilitating precursor complex formation.
The presence of proximal carbonyl (C=O) groups in all four compounds yields electronic
delocalization via resonance, which lowers the activation barrier towards oxidation.
What happens when a methylene group (-CH2-) is inserted between the proximal
carbonyl groups of these four organic substrates, as illustrated by the four organic
substrates listed below?
Malonic acid HOOCCH2COOH
Acetoacetic acid H3C(C=O)CH2COOH
Acetylacetone H3C(C=O)CH2(C=O)CH3
130
Malonic acid Dimethyl Ester H3COOCCH2COOCH3
The resonance afforded by proximal carbonyl groups is no longer possible, but keto-enol
tautomerization and the acidity of the methylene C-H (i.e. alpha C-H) bond become
important considerations.
What role does the α-CH play in the oxidation of these organic substrates by
MnO2(birnessite)? Can we relate organic reactivities to their physical-chemical
properties, specifically keto-enol and protonation equilibria? To establish organic
structure-reactivity relationships, we have carefully selected eight β-diketones, two β-
ketocarboxylic acids, and three β-dicarboxylic acids for study (Tables 4.1 and 4.2),
including the four organic substrates mentioned in the previous paragraph. The effect of
pH on rates of organic reaction with MnO2(birnessite) has been examined, providing
additional property-reactivity information. Along with the identification of malonic acid
oxidation products, some details regarding the molecular-level mechanism of malonic
acid (and related analogues) oxidation are clarified.
Malonic acid is of considerable biogeochemical importance. Release of malonic
acid by plant roots, bacteria, and fungi yields measurable concentrations in soil interstitial
waters (2-4). Acetoacetic acid is a metabolic byproduct (5). β-diketones are synthetic
compounds with numerous practical applications. Traditional applications mostly reside
in the industrial field: metal complexes of β-diketones have been used as fuel additives
(6), as supercritical fluids for waste cleanup (7), in superconducting thin film
manufacturing (8), and in production of catalysts (9). Recently, the applications have
been expanded to the medicinal field: small β-diketones, such as acetylacetone, serve as
131
intermediates in preparation of anticancer reagents and HIV inhibitors (10-13), of which
the functionality comes from the antioxidant action in the β-diketone moiety (14, 15).
Substrate Properties: Keto-Enol and Protonation Equilibria.
Equilibrium Constants. The keto and enol tautomers are structural isomers that
are conceptually related by the shift of a hydrogen or one or more π bonds. Compared to
most simple ketones, the enol tautomers of β-diketones are relatively stable due to the
intramolecular H-bonding and conjugation within the 6-membered ring (16, 17). The α-
hydrogens of β-diketones are often acidic as result of the charge stabilization by
resonance, when deprotonates, the enolate anion forms.
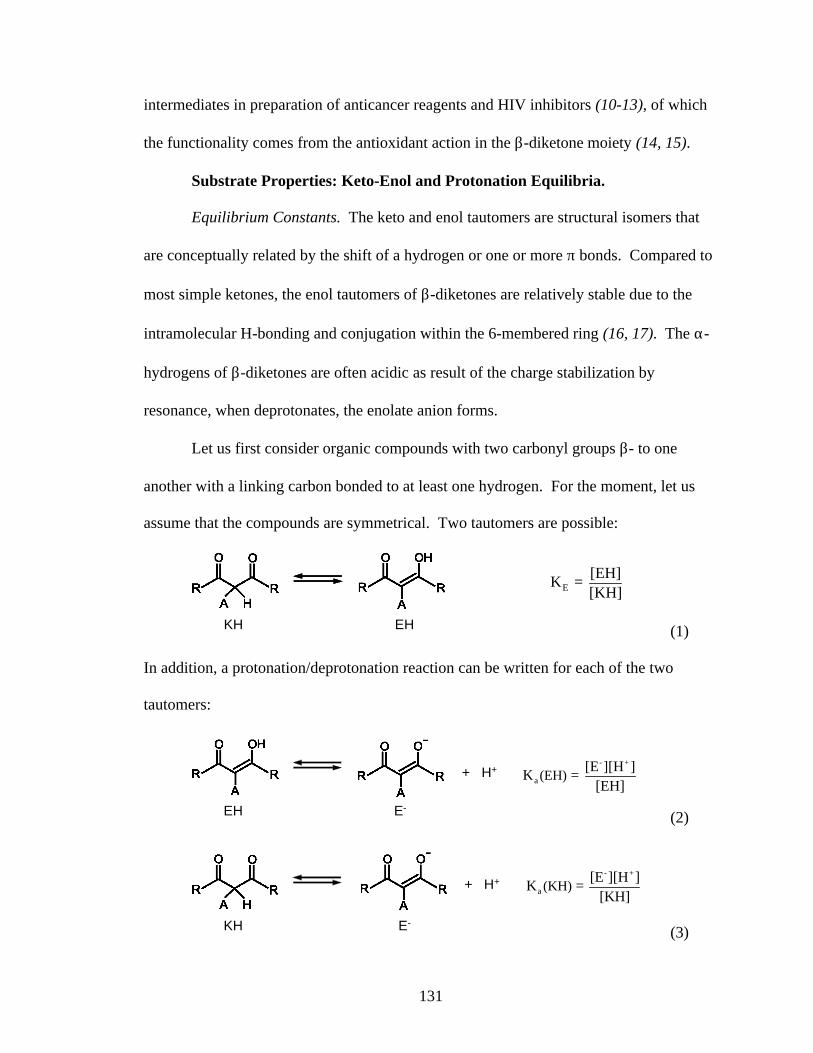
Let us first consider organic compounds with two carbonyl groups β- to one
another with a linking carbon bonded to at least one hydrogen. For the moment, let us
assume that the compounds are symmetrical. Two tautomers are possible:
KH EH
E[EH]K = [KH]
(1)
In addition, a protonation/deprotonation reaction can be written for each of the two
tautomers:
EH E-
+ H+- +
a (EH)[E ][H ]K =
[EH]
(2)
KH E-
+ H+- +
a (KH)[E ][H ]K =
[KH]
(3)
132
Simple acid-base titrations fail to distinguish between EH and KH, and hence yield a
composite protonation constant:
+ -
app E a aa
E E
[H ][E ] K K (EH) K (KH)K = = =
[KH] + [EH] 1 + K 1 + K (4)
Once Kaapp and KE are known, Ka(EH) and Ka(KH) can be calculated using Equation 4.
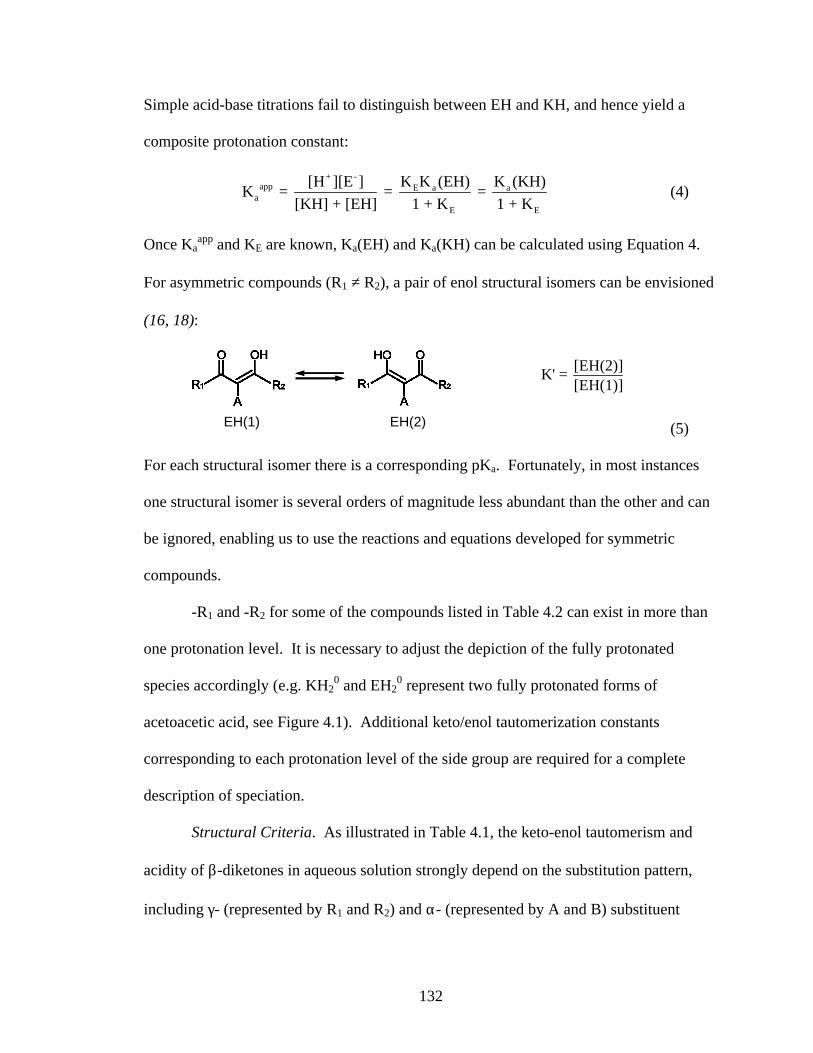
For asymmetric compounds (R1 ≠ R2), a pair of enol structural isomers can be envisioned
(16, 18):
[EH(2)]K' = [EH(1)]
EH(1) EH(2) (5)
For each structural isomer there is a corresponding pKa. Fortunately, in most instances
one structural isomer is several orders of magnitude less abundant than the other and can
be ignored, enabling us to use the reactions and equations developed for symmetric
compounds.
-R1 and -R2 for some of the compounds listed in Table 4.2 can exist in more than
one protonation level. It is necessary to adjust the depiction of the fully protonated
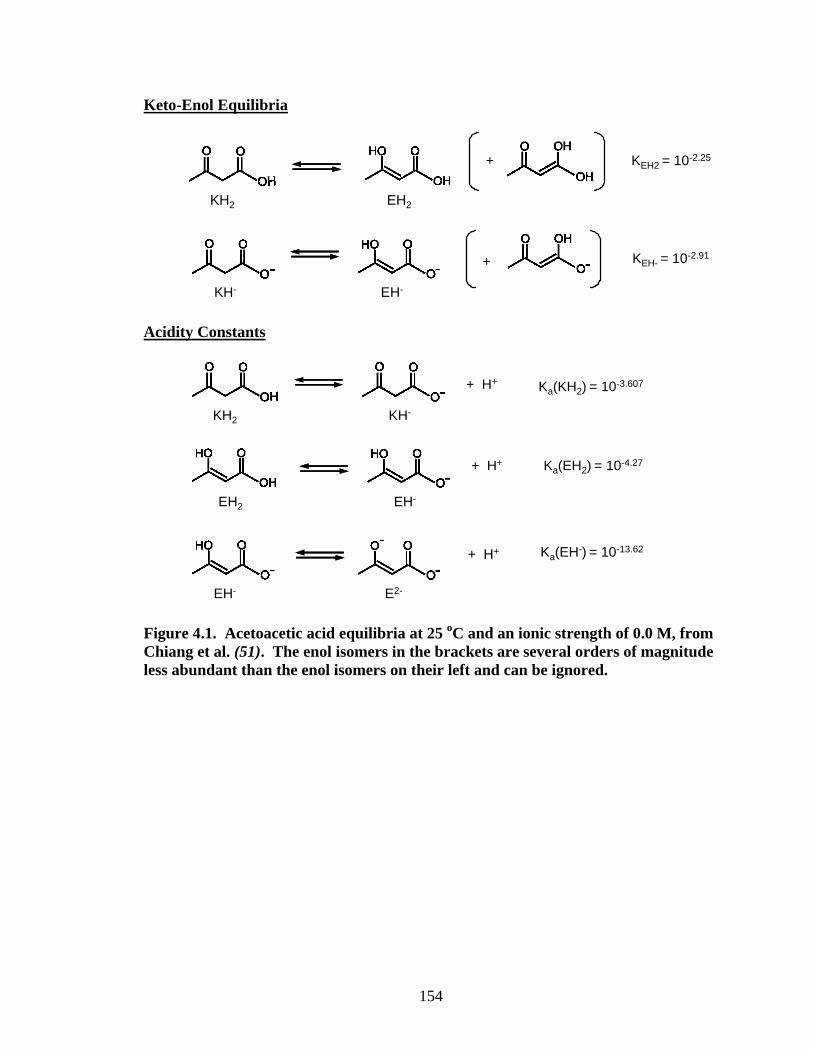
species accordingly (e.g. KH20 and EH2
0 represent two fully protonated forms of
acetoacetic acid, see Figure 4.1). Additional keto/enol tautomerization constants
corresponding to each protonation level of the side group are required for a complete
description of speciation.
Structural Criteria. As illustrated in Table 4.1, the keto-enol tautomerism and
acidity of β-diketones in aqueous solution strongly depend on the substitution pattern,
including γ- (represented by R1 and R2) and α- (represented by A and B) substituent
133
effects. Acetylacetone represents the fundamental structure of β-diketones in this study,
and is used as the baseline for comparison of other structures. 3,3-dimethyl-2,4-
pentanedione does not have an α-H, therefore enolization and deprotonation can not
occur. For this reason, the comparisons with regard to pKE (-logKE) and pKaeq values are
made among all other β-diketones.
The KE values depend upon steric, inductive and resonance effects caused by
substituents (16, 19). The lower the KE value, the lower the enol content. Four structures
below acetylacetone in Table 4.1 arise from substitution in the γ-position, that is, the -
CH3 group(s) of acetylacetone. The -C2H5 groups in 3,5-heptanedione only cause a slight
decrease in the enol content, which is generally true for substitution by the weakly
electron-donating alkyl groups in the γ-position (16). The -OCH3 group in methyl
acetoacetate causes a considerable decrease in enol content because the strongly electron-
donating -OCH3 group disfavors the electron delocalization crucial for enol stabilization
within the conjugated ring structure (16, 19). An additional -OCH3 group substitution
causes a further decrease in enol content; with the result that the enol content in dimethyl
malonate is too low to be measured in aqueous solution. The -CF3 group in 1,1,1-
trifluoro-2,4-pentanedione causes a significant decrease in enol content, which is
surprising at the first glance. The -CF3 group is strongly electron withdrawing because of
both inductive and resonance effects. Generally, electron-withdrawing groups tend to
stabilize the enol over the keto tautomer, because the resonance effect allows
delocalization of π-electrons within the conjugated ring structure (16, 19). The intrinsic
enol stabilization effect of the -CF3 group is, however, overwhelmed by its interaction
with water. Intermolecular H-bonding between F atoms in 1,1,1-trifluoro-2,4-
134
pentanedione and H atoms in H2O molecules causes the intramolecular H-bonding within
the enol tautomer to break, which dramatically decreases the enol content (19, 20). 3-
Chloro-2,4-pentanedione and 3-ethyl-2,4-pentanedione arise from substitution at the α-
position, that is, the H atom(s) of acetylacetone. The electron-withdrawing chloro
substituent in 3-chloro-2,4-pentanedione considerably increases the enol content (16, 19).
Unlike the γ-C2H5 groups in 3,5-heptanedione, the α-C2H5 group in 3-ethyl-2,4-
pentanedione dramatically decreases the enol content because the enol structure is
sensitive to the steric hindrance brought about by α-alkyl groups (16, 19, 21).
pKaapp values depend upon the stability of the conjugate base (i.e. enolate anion E-)
of β-diketones. The more stable the conjugate base, the more readily the conjugate acid
will lose a proton to form it, and thus the lower the pKaapp. The rule of thumb is that
electron-withdrawing groups stabilize the conjugate base; electron-donating groups
destabilize the conjugate base (22). The trend of pKaapp values of structures other than
3,3-dimethyl-2,4-pentanedione follows this rule. The higher pKaapp value of 3-ethyl-2,4-
pentanedione than that of 3,5-heptanedione is caused by steric hindrance at the α-position,
disfavoring deprotonation. The low pKaapp value of 1,1,1-trifluoro-2,4-pentanedione
suggests that H-bonding favors deprotonation, regardless of intermolecular or
intramolecular H-bonding (20).
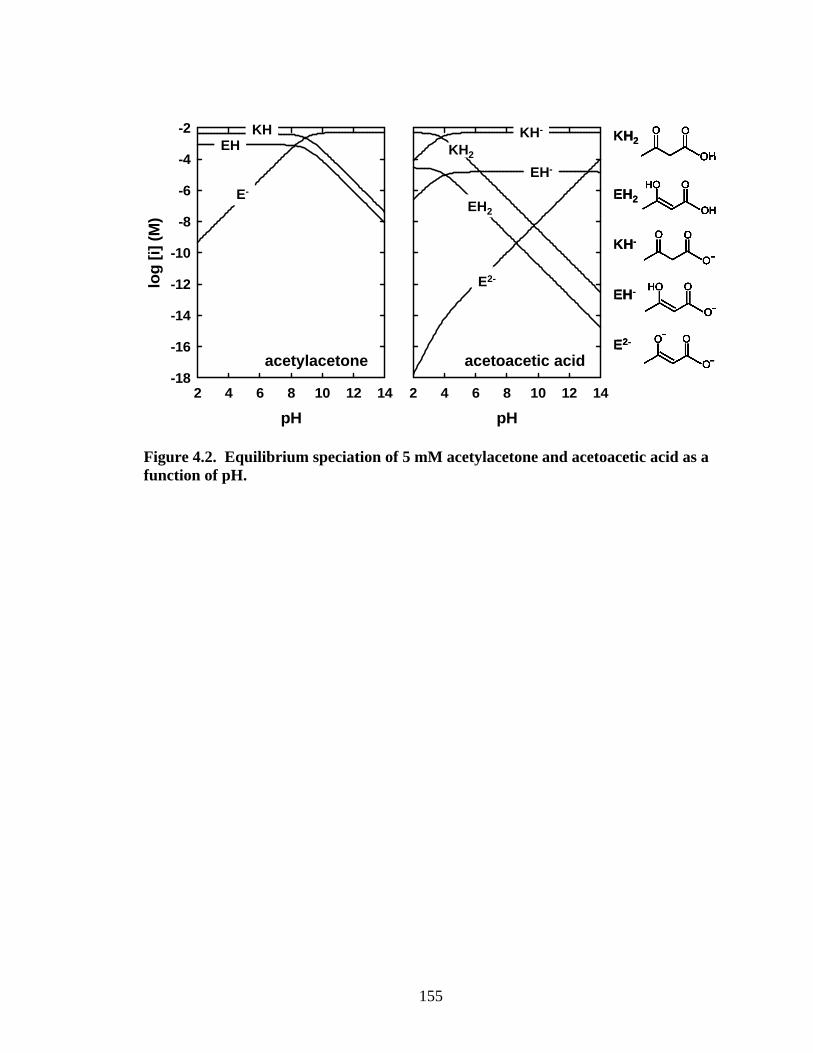
As shown in Figure 4.2, compared to acetylacetone, the introduction of a
carboxylic acid group in acetoacetic acid leads to a more complicated speciation, which
has been discussed earlier. The strong electron-donating effect of the carboxylic -OH
group (23) leads to much lower enol contents and the much higher pKa2app for the α-CH
(pKa2app > 14). Hence, the two carboxylic -OH groups in β-dicarboxylic acids should

135
lead to much lower enol content than the corresponding β-ketocarboxylic acids.
Enolization of malonic acid and methylmalonic acid has been addressed by several
authors (24, 25). The enol content is too low to be measured in aqueous solution by
current techniques.
4.3 Materials and Method
All solutions were prepared from reagent grade chemicals without further purification,
and distilled, deionized water (DDW) with a resistivity of 18 MΩ-cm (Millipore Corp.,
Milford, MA). Filter holders (Whatman Scientific, Maidstone, England) were soaked in
1N ascorbic acid (Aldrich, Milwaukee, WI) and rinsed with distilled water and DDW.
All bottles and glassware for MnO2(s, birnessite) and MnOOH(s, manganite) suspensions
were first soaked in 1N ascorbic acid and rinsed with distilled water. They were next put
in a 4N nitric acid (J. T. Baker, Phillipsburg, NJ) bath overnight and rinsed with distilled
water and DDW water prior to use.
4.3.1 Materials. Methylmalonic acid, dimethylmalonic acid, succinic acid,
acetylacetone, 3,5-heptanedione, methyl acetoacetate, dimethyl malonate, 1,1,1-trifluoro-
2,4-pentanedione, 3-chloro-2,4-pentanedione, 3,3-dimethyl-2,4-pentanedione, and 3-
ethyl-2,4-pentanedione were purchased from Aldrich. Malonic acid, potassium mono-
methyl malonate, and lithium acetoacetate were purchased from Fluka (Buchs,
Switzerland). Tartronic acid was purchased from Alfa Aesar (Ward Hill, MA).
Methyltartronic acid was purchased from Pfaltz & Bauer (Waterbury, CT). Potassium 4-
sulfobenzoate (Aldrich), sodium butyrate (Aldrich), 2-morpholinoethansulfonic acid
monohydrate (MES; Fluka), and 3-[N-morpholino]propanesulfonic acid (MOPS; Sigma,
136
St Louis, MO) were used as pH buffers for the reaction systems. HCl (hydrochloric acid),
NaOH (sodium hydroxide) and NaCl (sodium chloride) were purchased from J. T. Baker.
TiO2(rutile) was obtained from TiOxide Corp (Cleveland, England), and the
corresponding properties was summarized in Table S4.1.
Details regarding the synthesis and characterization of the preparation we will
refer to as MnO2 are provided elsewhere (26). It was synthesized according to the
method of Luo et al. (27) and consisted primarily of birnessite. A B.E.T. surface area of
174 m2/g was determined using a freeze-dried sample. The average Mn oxidation state
was found to be +3.78 based upon iodometric titration. If the MnII content is negligible,
then the preparation consists of 22 % MnIII and 78 % MnIV. The freeze-dried particles
weighed 97.10 grams per mole of manganese.
Synthesis and characterization of the preparation referred to as MnOOH was
described elsewhere (1). In brief, MnOOH was synthesized according to the method of
Giovanoli and Leuenberger (28) and stored in a flash-frozen state. X-ray diffraction and
TEM images confirmed that the preparation was predominantly manganite,
corresponding to a pure MnIII phase. Freeze-dried MnOOH yielded a B.E.T surface area
of 27.3 m2/g. The freeze-dried particles weighed 91.5 grams per mole of manganese.
4.3.2 Experimental Setup. Degradation Experiments. All batch experiments
were conducted in 100 mL polypropylene bottles in a constant temperature circulating
bath at 25 ± 0.2 oC and stirred with Teflon-coated stir bars. 10 mM 4-sulfobenzoate (pH
3.0 and 3.5), 10 mM butyrate (pH 4.0, 4.5 and 5.0), MES (pH 6.0), or MOPS (pH 7.0)
were employed to maintain constant pH. pH stability was verified by periodic
measurement (Fisher Accumet 825MP meter with Orion Combination semi-micro probe;
137
NIST-traceable standards). pH buffer concentrations were high enough to serve an
additional purpose, maintenance of constant ionic strength conditions. No additional
electrolyte was added.
Solutions containing organic substrate and pH buffer (plus additional constituents,
as appropriate) were sparged with Ar (BOC gases, Baltimore, MD) for one hour prior to
MnO2 or MnOOH addition. Sparging was turned off immediately before MnO2 or
MnOOH addition. Reactors were sealed, but not sparged during reaction. 4mL reaction
suspension aliquots were collected at periodic intervals. Reactions were quenched by
immediately filtering through 0.1 µm pore diameter track-etched polycarbonate filter
membranes (Whatman). Total dissolved manganese in the filtered solutions was
analyzed using flame atomic absorption spectrophotometry (AAS: Aanalyst 100, Perkin
Elmer, Norwalk, CT). Mn AAS standard was purchased from Aldrich. Additional
species in the filtered solutions were analyzed using capillary electrophoresis (see later
section). Inorganic carbonate was not monitored due to possible losses arising from
sparging.
Adsorption Experiments. Adsorption experiments were performed on a non-redox
active TiO2(rutile) surface. All experiments began by adding TiO2 stock suspension,
solution of the test compound (malonic acid, acetoacetic acid, and acetylacetone), NaCl
and DDW into 15 mL polypropylene bottles. Prior to use, DDW was sparged with Ar
overnight to eliminate inorganic carbonate. Sparging was continued during the duration
of the experiments. The pH was set by the addition of HCl or NaOH. NaCl stock
solution was added to ensure that the ionic strength was at least 1.0 mM. Given the other
system constituents, the ionic strength is usually in the low mM range. A circulating
138
constant temperature bath maintained the temperature at 25.0 ± 0.2 oC. Stirring was
performed using teflon-coated stir bars. Suspensions were equilibrated for two hours
prior to filtration through 0.1 µm pore diameter track-etched polycarbonate filter
membranes (Whatman). The concentrations of the test compound in the filtered solutions
were analyzed using capillary electrophoresis (see later section).
A small number of adsorption experiments were conducted with the solid phase
TiO2. The extent of adsorption was obtained by subtracting the concentration measured
in supernatant solution from the total added concentration. To confirm that degradation
was not taking place, experiments were conducted where the testing compound was
recovered from the TiO2 surface by raising the pH to 12, which caused all three
compounds to desorb.
4.3.3 Capillary Electrophoresis. A capillary electrophoresis unit from Beckman
Coulter (P/ACE MDQ, Fullerton, CA) with diode-array UV-visible detector was used for
all determinations. Bare fused silica capillaries (Polymicro Technologies, Phoenix, AZ)
with 75 µm ID × 60 cm total length were used for all separations. The effective length,
defined as the length from the inlet to the detector, was 52 cm. Between separations, the
capillary was sequentially rinsed by flushing DDW for 0.5 minute, 0.1 N NaOH for 1
minute, DDW again for 1 minute, and capillary electrolyte for 2 minutes. Anion mode
with constant applied voltage of -22 kV and -30 kV was employed for the direct and the
indirect UV photometric methods, respectively.
A direct UV photometric method, with a CE electrolyte consisting of 20 mM
pyrophosphate buffer (pH 7.5) and 0.4 mM tetradecyltrimethylammonium bromide
(TTAB: Aldrich) electroosmotic flow modifier, was employed to analyze MnIII(aq) (total
139
dissolved MnIII) and described in detail elsewhere (26). The pyrophosphate concentration
is high enough and MnIII sufficiently labile that all MnIII-containing species in the sample
are converted into MnIII-pyrophosphate complexes upon contact with the CE electrolyte
solution. A sharp, symmetrical peak, easily discernable at a detection wavelength of 235
nm, provided the means of measuring MnIII(aq) (total dissolved MnIII). The detection
limit for MnIII(aq) was about 1.5 µM at this wavelength.
CE electrolyte composition and detection wavelengths employed in the adsorption
and oxidation experiments are provided in Table S4.2. Carbonyl groups are the only
chromophoric groups for our analytes. Therefore, we have elected to use indirect
photometric detection. Benzoate and phthalate both absorb light within a wavelength
region convenient for CE (e.g. 200 to 230 nm). Displacement of these chromophoric
anions by electromigrating analyte molecules yield negative peaks, which can be
quantified. Tris or triethylamine are also added in the CE electrolyte to maintain constant
pH.
4.3.4 Data Analysis. Initial rates of MnII(aq) production (Ri, in units of µM/hr)
were obtained from the slopes of concentration versus time plots. Unless otherwise
stated, the slope corresponds to the least-squares fit of four or more data points collected
during the first 15 % of dissolution. r2 values were typically greater than 0.95.
When the pH was 5.0 or below, MnO2 gradually released dissolved MnII, even in
the absence of organic substrate. For results in the table below, only 200 µM MnO2 and
10 mM buffer were present:
Dissolution Dissolution pH (buffer) Rate (µM/hr) pH (buffer) Rate (µM/hr) 2.5 (self-buffering) 7.0 × 10⁻¹ 4.0 (butyrate) 2.2 × 10⁻¹
140
3.0 (4-sulfobenzoate) 2.6 × 10⁻¹ 4.5 (butyrate) 8.0 × 10⁻² 3.5 (4-sulfobenzoate) 2.3 × 10⁻¹ 5.0 (butyrate) 1.0 × 10⁻²
When organic substrates are present, we will assume that the gradual release of MnII(aq)
just described proceeds in parallel. Dissolution rates arising from reaction with the
organic substrate, which we will call R0, are calculated by subtracting the background
rates from Ri.
Protonation equilibria of organic substrates in homogeneous solution were
calculated using the acidity constants listed in Tables 4.1 and 4.2, and the equilibrium
program MINEQL+ (29). Activity corrections to equilibrium constants were calculated
using the Davis Equation (Stumm and Morgan (30), page 103).
4.4 Results and Discussion
4.4.1 Adsorption Experiments. Substrate-to-substrate differences in extent of
adsorption onto MnO2(birnessite) will affect the overall redox reaction. Organic
substrate adsorption onto MnO2(birnessite) surface, however, cannot be studied due to
the subsequent oxidation. Instead, the non-redox active TiO2(rutile) is selected as the
analogous surface for adsorption studies.
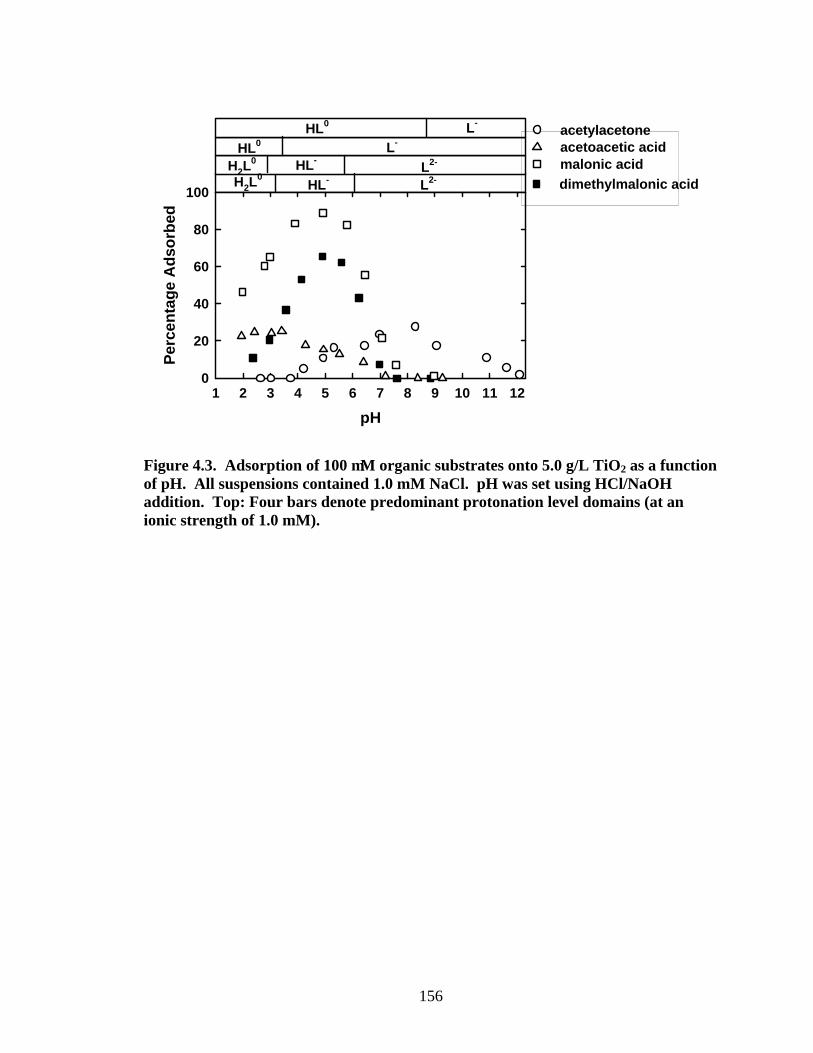
Figure 4.3 presents results for adsorption of 100 µM organic substrate
(acetylacetone, acetoacetic acid, malonic acid, and dimethylmalonic acid) onto 5.0 g/L
TiO2(rutile) as a function of pH. Note that for all organic substrates, the maximum
adsorption occurs near pKa(s). Acetylacetone adsorption below pH 4.0 is less than
measurable levels. The extent of adsorption gradually increases to a maximum as the pH
is increased to 8.5, quite close to pKaapp (9.00), and then gradually decreases as the pH is
raised up to pH 12. Acetoacetic acid exhibits a plateau of maximum adsorption at pH
141
values below the pKa (3.79). Increasing the pH above the pKa causes adsorption to
diminish. At pH 7.0, adsorption is below detectable levels. Malonic acid and
dimethylmalonic acid adsorb in a similar manner. For both compounds, adsorption
increases with increasing pH until a maximum is attained. Maximum adsorption pH
region lies between pKa1 and pKa2. Increasing pH above pKa2 causes adsorption to
diminish to negligible levels at pH 8.
The maximum adsorption extents for acetylacetone, acetoacetic acid, malonic
acid and dimethylmalonic acid are 27%, 25%, 87% and 66%, respectively. It is
interesting to note that the maximum adsorptions for the β-dicarboxylic acids- malonic
acid and dimethylmalonic acid are similar, but are much higher for the β-ketocarboxylic
acid- acetoacetic acid and the β-diketone- acetylacetone.
What can be said about adsorption onto MnO2(birnessite) based on what we have
observed onto TiO2(rutile)? TiO2(rutile) is a non-ion exchanging phase with a pHzpc of
6.1 (31), structurally similar to AlOOH(boehmite) and FeOOH(lepidocrocite) (32).
MnO2(birnessite) is a layered phase (33) with strong cation-exchange properties and a
pHzpc of 2.3 (34, 35). In spite of the chemical differences of the two types of oxides,
prior adsorption studies of carboxylate/phosphonate-based anions (1, 36, 37) and
phosphate ion (38) indicate that the general trends of pH dependence for a specific anion
adsorption onto the two types of (hydr)oxides are similar. In this study, we anticipate
that substrate-to-substrate differences in the trend of pH dependence for adsorption onto
MnO2(birnessite) follows that observed with TiO2(rutile).
4.4.2 Oxidation of β-Dicarboxylic Acids. Malonic Acid, Methylmalonic Acid,
and Dimethylmalonic Acid. As shown in Table 4.2, R0 values were obtained for
142
experiments employing 5.0 mM organic compound and 200 µM MnO2 (pH 2.5 and 5.0).
At both pHs, malonic acid and methylmalonic acid exhibit similar reactivities, with
malonic acid slightly more reactive (within a factor of three). Malonic acid is, however,
120-times and 27-times more reactive than dimethylmalonic acid at pH 2.5 and 5.0,
respectively. Dimethylmalonic acid exhibits the lowest pH dependence among the three.
As presented in an earlier section, malonic acid and dimethylmalonic acid
adsorption onto TiO2 exhibit similar pH dependence. The extents of adsorption with
malonic acid are only 4-times and 1.3-times the values with dimethylmalonic acid at pH
2.5 and 5.0, respectively. If we assume that adsorption onto MnO2 follows the trend with
TiO2, the small differences in adsorption cannot account for the significant reactivity
differences. Hence, the reactivity differences most likely arise from the different electron
transfer rates within the adsorbed species. Note that dimethylmalonic acid is the only
compound among the three that does not possess an α-H. It is plausible to propose that,
for malonic acid and methylmalonic acid, the presence of the α-H is responsible for the
higher susceptibility to electron transfer within the adsorbed species.
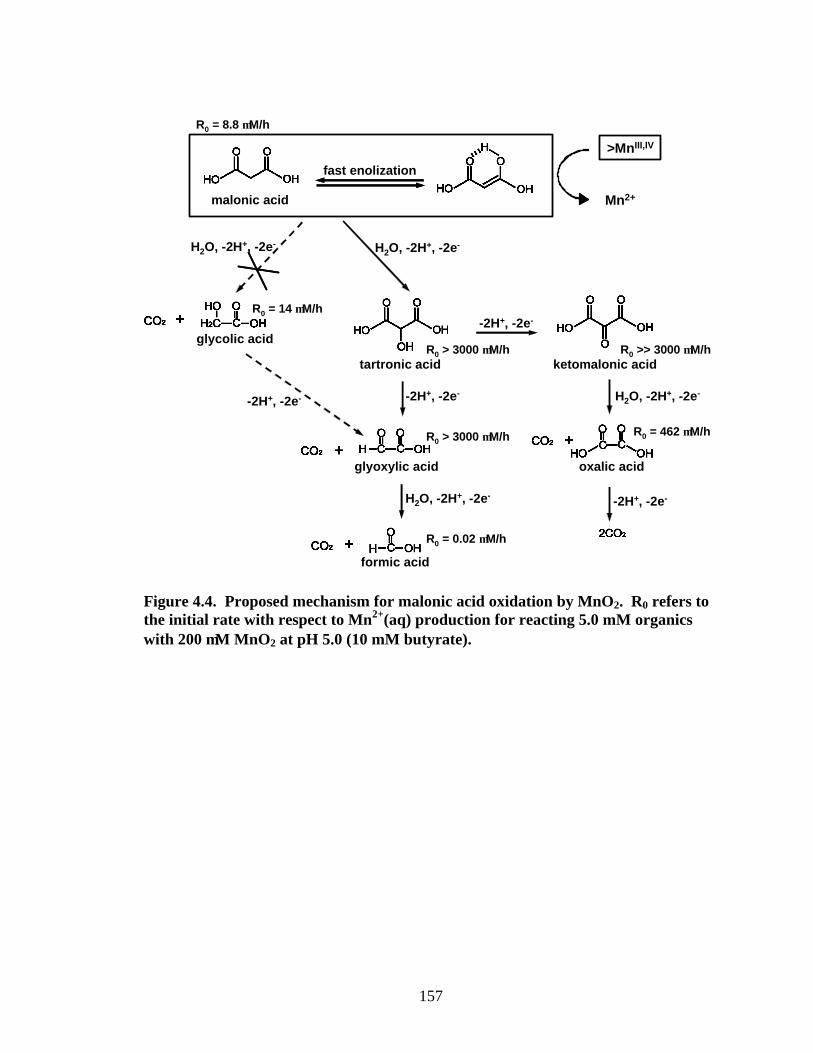
Proposed Mechanism for Malonic Acid Oxidation. As shown in the proposed
mechanism for malonic acid oxidation by MnO2 (Figure 4.4), a total of six organic
intermediates/products may form during reaction. Using capillary electrophoresis,
analytical methods have been successfully developed for all organics listed in Figure 4.4,
with detection limits 1-5 µM. Inorganic carbonate, which is believed to be an oxidation
product for malonic acid, is not discernible by CE. For reaction samples, owing to the
high resolution power of CE, any peak that grows upon addition of authentic standard is
considered positively identified.
143
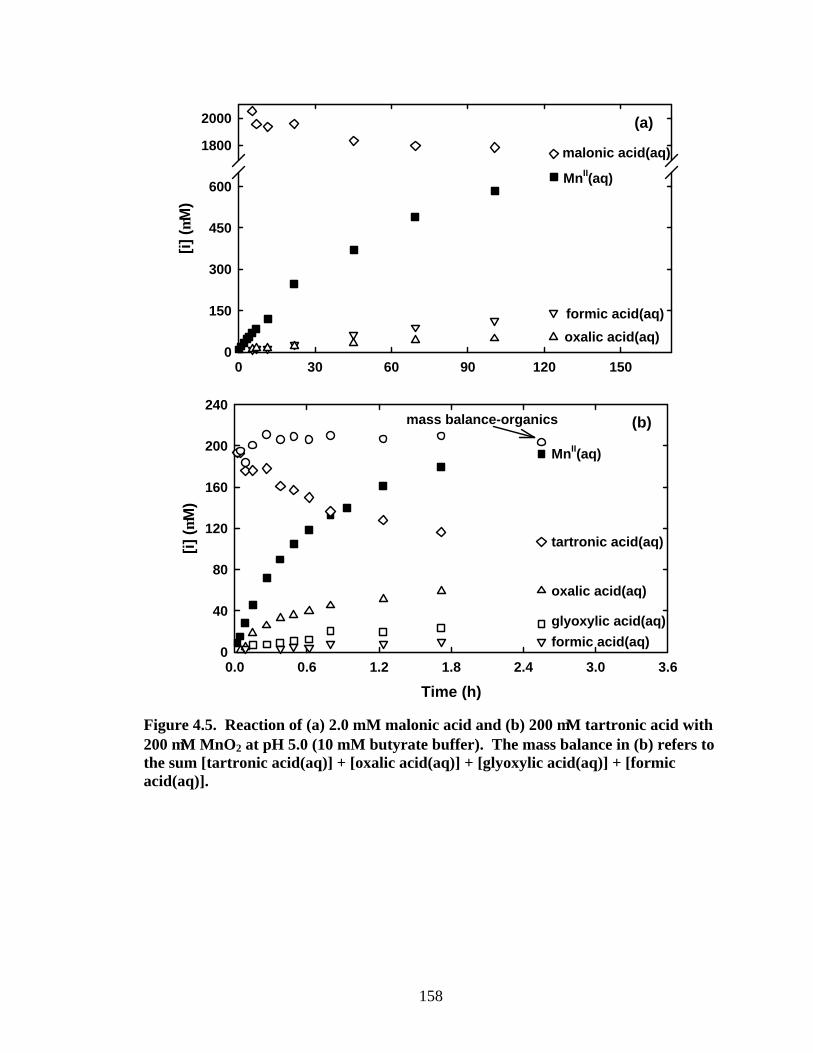
As illustrated in a time course plot (Figure 4.5a), reaction of malonic acid with
MnO2 only yields oxalic acid and formic acid in detectable quantities. Concentrations of
the other proposed organic intermediates, tartronic acid, ketomalonic acid, glyoxylic acid,
and glycolic acid, are below detectable levels throughout reaction. There are two
possible reasons for the insignificant concentrations of these intermediates: (i), the
proposed intermediates are formed during reaction, but are consumed too fast, i.e. too
reactive to accumulate concentrations high enough for CE analysis; (ii), the proposed
intermediates are not formed with the time scale of our experiments.
To test the two possible causes, R0 values (initial MnII(aq) production rates) are
obtained from a separate set of experiments employing 5.0 mM of the organics listed in
Figure 4.4 with 200 µM MnO2 at pH 5.0. As shown in Figure 4.4, R0 for tartronic acid,
ketomalonic acid and glyoxylic acids are more than 340-times, for oxalic acid is 50-times,
for glycolic acid is 1.6-times, and for formic acid is 0.2% that of malonic acid. The fact
that glycolic acid is not detected but the more reactive oxalic acid is detected during
malonic acid oxidation arises from (ii). More specifically, for the first two-electron
oxidation of malonic acid, the decarboxylation pathway that yields glycolic acid is
insignificant. An alternative pathway via conversion of α-hydrogen into α-hydroxyl
group that yields tartronic acid is predominant. The fact that tartronic acid, ketomalonic
acid and glyoxylic acid are not detected during malonic acid oxidation arises from (i), i.e.
caused by their high reactivities. Reaction of tartronic acid with MnO2 that yields
appreciable glyoxylic acid, oxalic acid and formic acid (Figure 4.5b) further confirms our
proposed mechanism for malonic acid oxidation. Once again, the undetectable
ketomalonic acid is due to its extremely high reactivity. A similar reaction scheme has
144
also been proposed for malonic acid oxidation by CrIV (39) and by MnIII-pyrophosphate
(40) in homogeneous solutions, where tartronic acid has been identified as the sole two-
electron-oxidation intermediate.
4.4.3 Oxidation of β-Diketones. The β-diketones listed in Table 4.1 were
reacted at pH 2.5 and 5.0 with 200 µM MnO2. A concentration of 5.0 mM β-diketone
was employed. Initial rates with respect to MnII(aq) production (R0) were obtained for
comparison (Table 4.1). The reactivity rankings among all eight β-diketones are the
same for reactions at both pHs: 3-chloro-2,4-pentandione > acetylacetone > 3,5-
heptanedione > 3-ethyl-2,4-pentanedione > methyl acetoacetate > 1,1,1-trifluoro-2,4-
pentanedione > 3,3-dimethyl-2,4-pentanedione > dimethyl malonate. At pH 5.0, the
range of reactivity is approximately 2400-fold. At pH 2.5, the range of reactivity is far
greater, more than 20,000-fold. As far as the effect of pH on R0 is concerned, dimethyl
malonate and 3,3-dimethyl-2,4-pentanedione, show very little pH dependence. For all
the other compounds, R0 values at pH 2.5 are in the range of 14 to 117 times higher than
at pH 5.0.
The reactivity comparisons enable us to evaluate the relationships between
reactivity and the keto-enol (and protonation) equilibria. Note that seven of the eight β-
diketones possess α-H atom(s), including four γ-substituted β-diketones (3,5-
heptanedione, methyl acetoacetate, 1,1,1-trifluoro-2,4-pentanedione, and dimethyl
malonate), two α-substituted β-diketones (3-chloro-2,4-pentandione and 3-ethyl-2,4-
pentanedione), and the non-substituted acetylacetone. For the γ-substituted β-diketones
along with acetylacetone, R0 values are higher for β-diketones with higher enol contents,
although not in a linear fashion. The same trend also applies for the α-substituted β-
145
diketones along with acetylacetone. An α-substituted β-diketone exhibits a higher R0
than a γ-substituted β-diketone with the similar enol content. For example, 3-ethyl-2,4-
pentanedione and 1,1,1-trifluoro-2,4-pentanedione have similar enol content. 3-Ethyl-
2,4-pentanedione is, however, 13-times and 8-times more reactive than 1,1,1-trifluoro-
2,4-pentanedione. The KE value for dimethyl malonate has not been reported because it
is too low to measure. Dimethyl malonate is actually the least reactive β-diketone. The
second least reactive β-diketone is 3,3-dimethyl-2,4-pentanedione, which does not have
an α-H.
The higher MnO2 reactivities for β-diketones with higher enol content indicates
that the oxidation and enolization of β-diketones may share some traits in the
fundamental processes. Since the correction between reactivity and enol content is not
always good, we can conclude that substitution at α- and γ- positions affect them
differently.
To explore the relationship between oxidation and enolization under the
mechanistic level, we need to know more about the role of the α-CH in β-diketone
degradation. Similarly to what we have observed with malonic acid oxidation, studies in
aqueous solution (41) and organic solvents (42-44) show that the first two-electron
oxidation leads to the conversion of an α-hydrogen into an α-hydroxyl group. The
cleavage of the alpha C-H bond, via the donation of H atom, is proposed to be the key for
oxidation (14). The presence of a labile α-H for enolization is also crucial for H atom
donating ability required for the oxidation. As with the rule of enol stabilization
discussed in the Introduction section, a resonance effect allows delocalization of the
unpaired electron and hence stabilizes α-C radicals created by H atom donation. The
146
stabilization of the α-C radicals decreases the activation energy for oxidation of β-
diketones. Unlike enolization, where α-alkyl substituents decreases the enol content due
to the steric hindrance, the greater number of α-alkyl substituents stabilizes α-C radicals
(45), and hence leads to higher susceptibility towards oxidation.
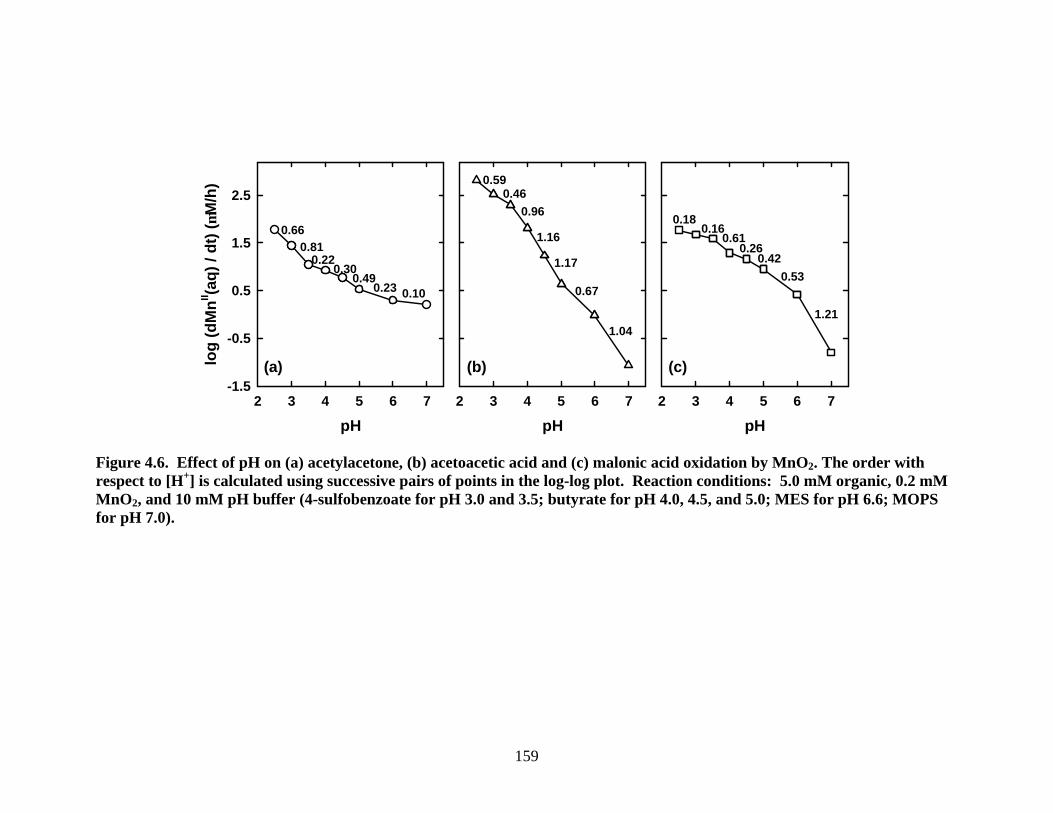
4.4.4 Acetylacetone, Acetoacetic Acid, and Malonic Acid. As shown in Figure
4.6, a detailed investigation was conducted on the effects of pH on the reaction of 200
µM MnO2 with 5.0 mM organic substrate. Orders with respect to [H+] have been
calculated as slopes between successive pairs of points on the logR0 versus pH plot
(Figure 4.6). For all three substrates, R0 decreases as the pH is increased. With
acetoacetic acid and malonic acid, R0 becomes more sensitive to [H+] as the pH is
increased. For malonic acid, slopes increases from nearly 0.2 to 1.2 between pH 2.5 and
7.0. Acetoacetic acid yields steeper slopes than malonic acid up to pH 6.0. With
acetylacetone, R0 becomes less sensitive to [H+] as the pH is increased. From pH 2.5 to
7.0, slopes decrease from nearly 0.7 to 0.1. Consequently, the order of reactivity is pH
dependent. Acetoacetic acid is the most reactive compound in the pH range of 2.5 to 4.5
and the least reactive compound at pH above 6. Acetylacetone and malonic acid have the
same rates at pH 2.5. Upon raising the pH, acetylacetone exhibits lower rates than
malonic acid until pH 6, but becomes more reactive than malonic acid near pH 7.
Combining the observed pH effect on reactivity in this section with the pH effect
on adsorption in section 4.4.1 (Adsorption Experiments), reactivity that arises from the
balance of adsorption and the subsequent electron transfer within the adsorbed species is
clearly seen. A plausible explanation is that lower pH accelerates electron transfer of
surface precursor species for all three organics. For acetylacetone, the unfavorable
147
adsorption at lower pH partially offsets the favorable electron transfer. For acetoacetic
acid, both adsorption and electron transfer are more favorable at lower pH. For malonic
acid, maximum adsorption occurs in the middle pH range. Adsorption starts to drop at
pH below 3, resulting in the very gradual increase in rate with decreasing pH.
Oxidation of acetylacetone and malonic acid occurs at the α-C site has been
proposed, where the liability of the α-H is the key. Since enolization is also dependent
on the liability of the α-H, the order of electron transfer rate within the adsorbed species
may be predicted based on KE values, i.e. acetylacetone > acetoacetic acid > malonic acid.
4.4.5 Carboxylic Acids versus Their Esters. Malonic acid is more reactive than
the corresponding esters, and the reactivity decreases in the order: malonic acid > methyl
malonate > dimethyl malonate. Acetoacetic acid is more reactive than its ester, methyl
acetoacetate. The binding of the carbonyl oxygen of esters is much weaker than the
binding of a free carboxylic group towards metal ions (46), which may cause less
adsorption. However, the diminished reactivities for esters are also observed in aqueous
solution (46), indicating electronic effects that govern the susceptibility to electron
transfer are responsible, rather than differences in adsorption properties.
4.5 Literature Cited (1) Wang, Y. and Stone, A. T. Reaction of MnIII,IV (hydr)oxides with oxalic acid,
glyoxylic acid, phosphonoformic acid, and structurally-related organic compounds. Submitted to Geochim. Cosmochim. Acta.
(2) Fox, T. R. and Comerford, N. B. Low-molecular-weight organic-acids in selected forest soils of the southeastern USA. Soil Sci. Soc. Am. J. 1990, 54, 1139-1144.
(3) Madigan, M. T., Martinko, J. M., and Parker, J. Brock Biology of Microorganisms. 10th ed. 2002, Upper Saddle River, NJ: Prentice Hall.
148
(4) Afif, E., Barron, V., and Torrent, J. Organic-matter delays but does not prevent phosphate sorption by Cerrado soils from Brazil. Soil Sci. 1995, 159, 207-211.
(5) Kirk, R. E. and Othmer, D. F. Kirk-Othmer Encyclopedia of Chemical Technology. 2004, New York: John Wiley.
(6) Sievers, R. E. and Sadlowski, J. E. Volatile metal-complexes. Science 1978, 201, 217-223.
(7) Ozel, M. Z., Burford, M. D., Clifford, A. A., Bartle, K. D., Shadrin, A., Smart, N. G., and Tinker, N. D. Supercritical fluid extraction of cobalt with fluorinated and non-fluorinated β-diketones. Anal. Chim. Acta 1997, 346, 73-80.
(8) Heimer, T. A., Darcangelis, S. T., Farzad, F., Stipkala, J. M., and Meyer, G. J. An acetylacetonate-based semiconductor-sensitizer linkage. Inorg. Chem. 1996, 35, 5319-5324.
(9) Lewis, F. D., Miller, A. M., and Salvi, G. D. Spectroscopy and photochemistry of nickel(II), palladium(II), and platinum(II) β-diketonates. Inorg. Chem. 1995, 34, 3173-3181.
(10) Venkateswarlu, S., Ramachandra, M., Rambabu, M., and Subbaraju, G. V. Synthesis of gingerenone-a and hirsutenone. Indian J. Chem. B 2001, 40, 495-497.
(11) Nakano, K., Nakayachi, T., Yasumoto, E., Morshed, S., Hashimoto, K., Kikuchi, H., Nishikawa, H., Sugiyama, K., Amano, O., Kawase, M., and Sakagami, H. Induction of apoptosis by β-diketones in human tumor cells. Anticancer Res. 2004, 24, 711-717.
(12) Adams, B. K., Ferstl, E. M., Davis, M. C., Herold, M., Kurtkaya, S., Camalier, R. F., Hollingshead, M. G., Kaur, G., Sausville, E. A., Rickles, F. R., Snyder, J. P., Liotta, D. C., and Shoji, M. Synthesis and biological evaluation of novel curcumin analogs as anti-cancer and anti-angiogenesis agents. Bioorg. Med. Chem. 2004, 12, 3871-3883.
(13) Vajragupta, O., Boonchoong, P., Morris, G. M., and Olson, A. J. Active site binding modes of curcumin in HIV-1 protease and integrase. Bioorg Med Chem Lett 2005, 15, 3364-3368.
(14) Jovanovic, S. V., Steenken, S., Boone, C. W., and Simic, M. G. H-atom transfer is a preferred antioxidant mechanism of curcumin. J. Am. Chem. Soc. 1999, 121, 9677-9681.
(15) Jovanovic, S. V., Boone, C. W., Steenken, S., Trinoga, M., and Kaskey, R. B. How curcumin works preferentially with water soluble antioxidants. J. Am. Chem. Soc. 2001, 123, 3064-3068.
149
(16) Toullec, J. Keto-enol equilibrium constant. In The chemistry of enols, Z. Rappoport, Editor. 1990, John Willey: Chichester, England. 323-398.
(17) Carey, F. A. and Sundberg, R. J. Advanced Organic Chemistry. 4th ed. 2000, New York: Plenum Press.
(18) Bunting, J. W., Kanter, J. P., Nelander, R., and Wu, Z. N. The acidity and tautomerism of β-diketones in aqueous-solution. Can. J. Chem.1995, 73, 1305-1311.
(19) Iglesias, E. Application of organized microstructures to study keto-enol equilibrium of β-dicarbonyl compounds. Curr. Org. Chem. 2004, 8, 1-24.
(20) Iglesias, E. Behavior of 1,1,1-trifluoroacetylacetone and 1,1,1-trifluoro-3-(2-thenoyl)acetone in aqueous micellar solutions of the cationic surfactants tetradecyltrimethylammonium bromide and tetradecyltrimethylammonium chloride. Langmuir 2000, 16, 8438-8446.
(21) Alcais, P. and Brouillard, R. New data on keto-enol equilibria of 3-alkylpentane-2,4-diones in aqueous-solution. J. Chem. Soc. Perk. T. 2 1976, 257-258.
(22) Perez, G. V. and Perez, A. L. Organic acids without a carboxylic acid functional group. J. Chem. Educ. 2000, 77, 910-915.
(23) Kresge, A. J. Ingold lecture. Reactive intermediates: Carboxylic acid enols and other unstable species. Chem. Soc. Rev. 1996, 25, 275-280.
(24) Field, R. J., Noyes, R. M., and Koros, E. Oscillations in chemical systems. 2. Thorough analysis of temporal oscillation in bromate-cerium-malonic acid system. J. Am. Chem. Soc. 1972, 94, 8649-8664.
(25) Hansen, E. W. and Ruoff, P. Estimation of malonic-acid and methylmalonic acid enolization rate constants by an isotopic-exchange reaction using 1H NMR spectroscopy. J. Phys. Chem. 1988, 92, 2641-2645.
(26) Wang, Y. and Stone, A. T. The citric acid-MnIII,IVO2(birnessite) reaction. Electron transfer, complex formation, and autocatalytic feedback. Submitted to Geochim. Cosmochim. Acta 2005.
(27) Luo, J. A., Zhang, Q. H., and Suib, S. L. Mechanistic and kinetic studies of crystallization of birnessite. Inorg. Chem. 2000, 39, 741-747.
(28) Giovanoli, R. and Leuenberger, U. Oxidation of manganese oxide hydroxide. Helv. Chim. Acta 1969, 52, 2333-2347.
(29) Schecher, W. D. and McAvoy, D. C. MINEQL+: A Chemical Equilibrium Modeling System. 2003, Environmental Research Software: Hallowell, ME.
150
(30) Stumm, W. and Morgan, J. J. Aquatic Chemistry -- Chemical Equilibria and Rates in Natural Waters. 3rd ed. 1996, New York: John Wiley.
(31) Vasudevan, D. and Stone, A. T. Adsorption of 4-nitrocatechol, 4-nitro-2-aminophenol, and 4- nitro-1,2-phenylenediamine at the metal (hydr)oxide/water interface: Effect of metal (hydr)oxide properties. J. Colloid Interf. Sci. 1998, 202, 1-19.
(32) Wells, A. F. Structural Inorganic Chemistry. 5th ed. 1984, Oxford, United Kingdom.: Clarendon Press.
(33) Post, J. E. and Veblen, D. R. Crystal-structure determinations of synthetic sodium, magnesium, and potassium birnessite using TEM and the Rietveld method. Am. Mineral. 1990, 75, 477-489.
(34) Murray, J. W. Surface chemistry of hydrous manganese-dioxide. J. Colloid Interf. Sci. 1974, 46, 357-371.
(35) Tonkin, J. W., Balistrieri, L. S., and Murray, J. W. Modeling sorption of divalent metal cations on hydrous manganese oxide using the diffuse double layer model. Appl. Geochem. 2004, 19, 29-53.
(36) Kummert, R. and Stumm, W. The surface complexation of organic-acids on hydrous γ-Al2O3. J. Colloid Interf. Sci. 1980, 75, 373-385.
(37) Nowack, B. and Stone, A. T. Adsorption of phosphonates onto the goethite-water interface. J. Colloid Interf. Sci. 1999, 214, 20-30.
(38) Yao, W. S. and Millero, F. J. Adsorption of phosphate on manganese dioxide in seawater. Environ. Sci. Technol. 1996, 30, 536-541.
(39) Senapati, M., Panigrahy, G. P., and Mahapatro, S. N. Pathways in chromic-acid oxidations. 3. Kinetics and mechanism of oxidation of malonic-acid. J. Org. Chem. 1985, 50, 3651-3655.
(40) Drummond, A. Y. and Waters, W. A. Stages in oxidations of organic compounds by potassium permanganate. 4. Oxidation of malonic acid and its analogues. J. Chem. Soc. 1954, 2456-2467.
(41) Gupta, M., Saha, S. K., and Banerjee, P. Kinetics and mechanism of the oxidation of ethyl acetoacetate and diethyl malonate by dodecatungstocobaltate(III). B. Chem. Soc. JPN 1990, 63, 609-613.
(42) Adam, W. and Smerz, A. K. Nickel-catalyzed hydroxylation of 1,3-dicarbonyl compounds by dimethyldioxirane. Tetrahedron 1996, 52, 5799-5804.
151
(43) Watanabe, T. and Ishikawa, T. Mild air-oxidation of 1,3-dicarbonyl compounds with cesium salts: Novel α-hydroxylation accompanied by partial hydrolysis of malonate derivatives. Tetrahedron Lett. 1999, 40, 7795-7798.
(44) Toullec, P. Y., Bonaccorsi, C., Mezzetti, A., and Togni, A. Expanding the scope of asymmetric electrophilic atom-transfer reactions: Titanium- and ruthenium-catalyzed hydroxylation of β-ketoesters. P. Natl. Acad. Sci. USA 2004, 101, 5810-5814.
(45) Perkins, M. J. Radical Chemistry. Ellis horwood series in organic chemistry. 1994, New York: Ellis Horwood.
(46) Deng, B. L. and Stone, A. T. Surface-catalyzed chromium(VI) reduction: The TiO2-CrVI-mandelic acid system. Environ. Sci. Technol. 1996, 30, 463-472.
(47) Koshimura, H., Okubo, T., and Saito, J. Effect of substituents on keto-enol equilibrium of alkyl-substituted β-diketones. B. Chem. Soc. JPN 1973, 46, 632-634.
(48) Martell, A. E., Smith, R. M., and Motekaitis, R. J. NIST Critically Selected Stability Constants of Metal Complexes Database. 2004, US Department of Commerce, National Institute of Standards and Technology: Gaithersburg, MD.
(49) Bunting, J. W. and Kanter, J. P. Acidity and tautomerism of β-keto-esters and amides in aqueous-solution. J. Am. Chem. Soc. 1993, 115, 11705-11715.
(50) pKa Value Calculated Using Advanced Chemistry Development (ACD) Software Solaris v4.67 (1994-2004) being cited by the electronic database SciFinder Scholar.
(51) Chiang, Y., Guo, H. X., Kresge, A. J., and Tee, O. S. Flash photolysis of 2,2,6-trimethyl-4h-1,3-dioxin-4-one in aqueous solution: Hydration of acetylketene and ketonization of acetoacetic acid enol. J. Am. Chem. Soc. 1996, 118, 3386-3391.
152
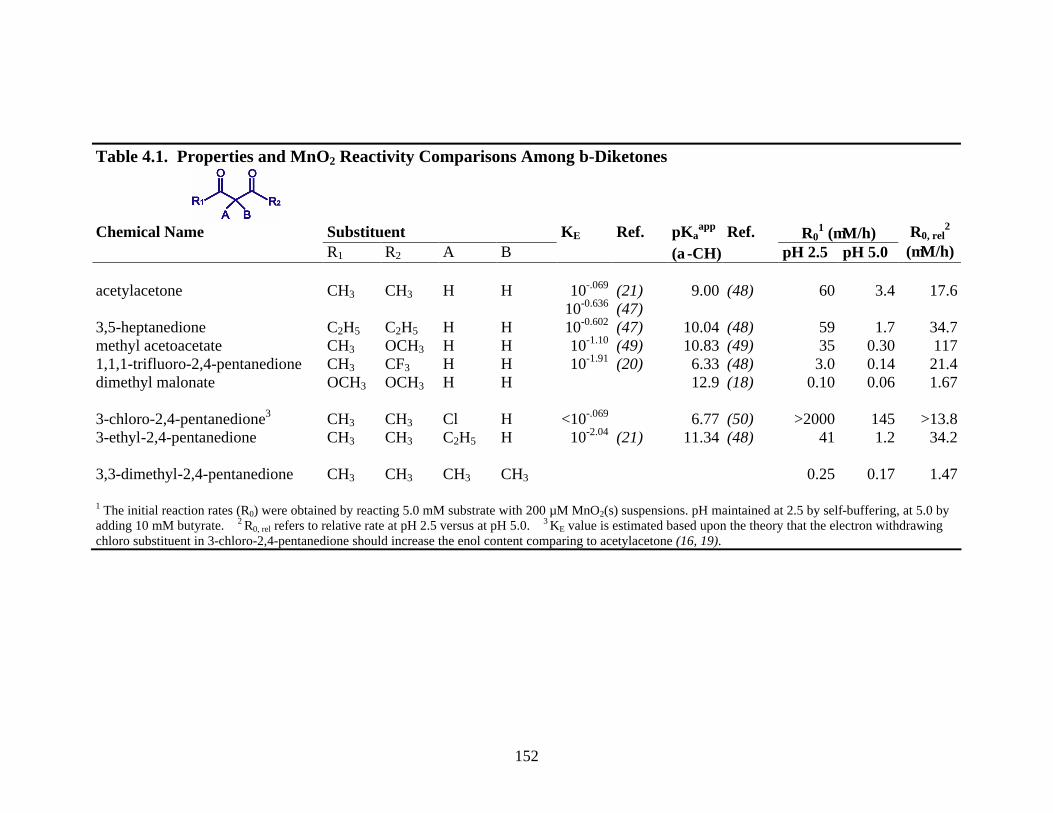
Table 4.1. Properties and MnO2 Reactivity Comparisons Among β-Diketones
Chemical Name Substituent KE Ref. pKa
app Ref. R01 (µM/h)
R1 R2 A B (α-CH) pH 2.5 pH 5.0 R0, rel
2 (µM/h)
acetylacetone CH3 CH3 H H 10-.069
10-0.636 (21) (47)
9.00 (48) 60 3.4 17.6
3,5-heptanedione C2H5 C2H5 H H 10-0.602 (47) 10.04 (48) 59 1.7 34.7 methyl acetoacetate CH3 OCH3 H H 10-1.10 (49) 10.83 (49) 35 0.30 117 1,1,1-trifluoro-2,4-pentanedione CH3 CF3 H H 10-1.91 (20) 6.33 (48) 3.0 0.14 21.4 dimethyl malonate OCH3 OCH3 H H 12.9 (18) 0.10 0.06 1.67 3-chloro-2,4-pentanedione3 CH3 CH3 Cl H <10-.069 6.77 (50) >2000 145 >13.8 3-ethyl-2,4-pentanedione CH3 CH3 C2H5 H 10-2.04 (21) 11.34 (48) 41 1.2 34.2 3,3-dimethyl-2,4-pentanedione CH3 CH3 CH3 CH3 0.25 0.17 1.47 1 The initial reaction rates (R0) were obtained by reacting 5.0 mM substrate with 200 µM MnO2(s) suspensions. pH maintained at 2.5 by self-buffering, at 5.0 by adding 10 mM butyrate. 2 R0, rel refers to relative rate at pH 2.5 versus at pH 5.0. 3 KE value is estimated based upon the theory that the electron withdrawing chloro substituent in 3-chloro-2,4-pentanedione should increase the enol content comparing to acetylacetone (16, 19).
153
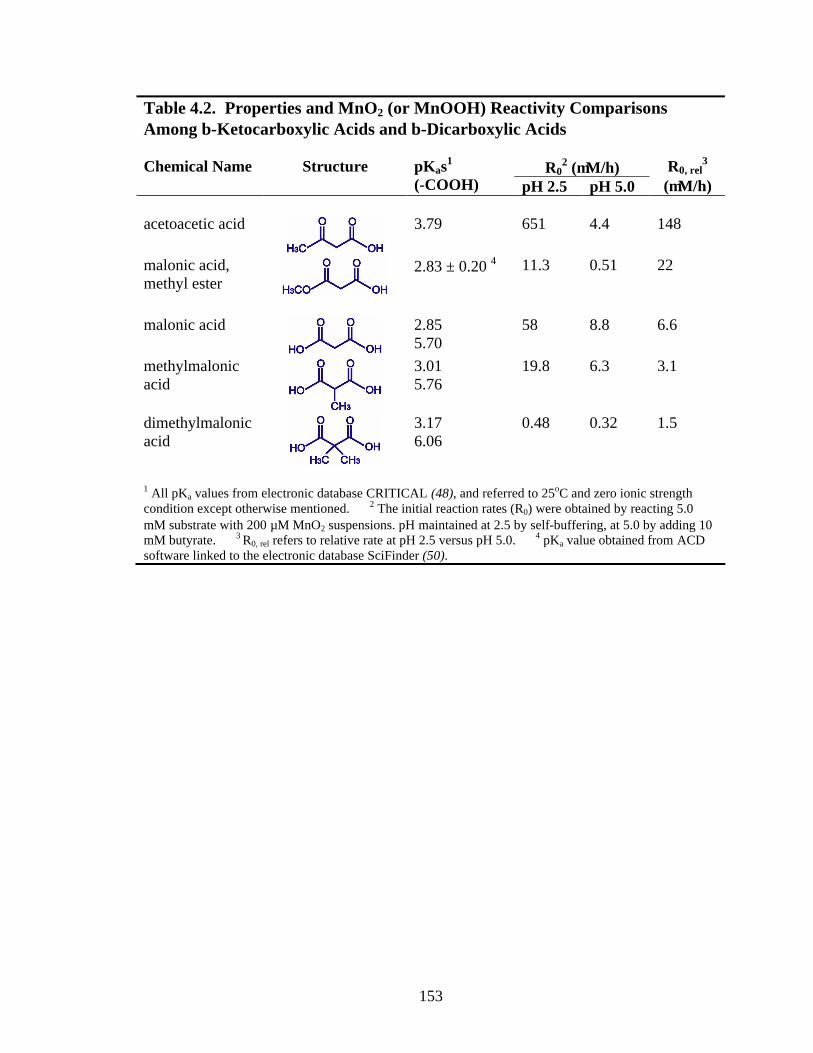
Table 4.2. Properties and MnO2 (or MnOOH) Reactivity Comparisons Among β-Ketocarboxylic Acids and β-Dicarboxylic Acids
R02 (µM/h) Chemical Name Structure pKas1
(-COOH) pH 2.5 pH 5.0 R0, rel
3 (µM/h)
acetoacetic acid
3.79 651 4.4 148
malonic acid, methyl ester
2.83 ± 0.20 4 11.3 0.51 22
malonic acid
2.85 5.70
58 8.8 6.6
methylmalonic acid
3.01 5.76
19.8 6.3 3.1
dimethylmalonic acid
3.17 6.06
0.48 0.32 1.5
1 All pKa values from electronic database CRITICAL (48), and referred to 25oC and zero ionic strength condition except otherwise mentioned. 2 The initial reaction rates (R0) were obtained by reacting 5.0 mM substrate with 200 µM MnO2 suspensions. pH maintained at 2.5 by self-buffering, at 5.0 by adding 10 mM butyrate. 3 R0, rel refers to relative rate at pH 2.5 versus pH 5.0. 4 pKa value obtained from ACD software linked to the electronic database SciFinder (50).
154
Keto-Enol Equilibria
+
KH2 EH2
KEH2 = 10-2.25
KEH- = 10-2.91
KH- EH-
+
Acidity Constants
+ H+
KH2 KH-
Ka(KH2) = 10-3.607
+ H+ Ka(EH2) = 10-4.27
EH2 EH-
+ H+ Ka(EH-) = 10-13.62
EH- E2-
Figure 4.1. Acetoacetic acid equilibria at 25 oC and an ionic strength of 0.0 M, from Chiang et al. (51). The enol isomers in the brackets are several orders of magnitude less abundant than the enol isomers on their left and can be ignored.
155
pH
2 4 6 8 10 12 14
pH
2 4 6 8 10 12 14
log
[i]
(M
)
-18
-16
-14
-12
-10
-8
-6
-4
-2EH
E-
KH KH2
EH2
KH-
EH-
E2-
KH2
EH2
F
KH-
E2-
EH-
acetylacetone acetoacetic acid
pH
2 4 6 8 10 12 14
pH
2 4 6 8 10 12 14
log
[i]
(M
)
-18
-16
-14
-12
-10
-8
-6
-4
-2EH
E-
KH KH2
EH2
KH-
EH-
E2-
KH2
EH2
F
KH-
E2-
EH-
acetylacetone acetoacetic acid
Figure 4.2. Equilibrium speciation of 5 mM acetylacetone and acetoacetic acid as a function of pH.
156
L-HL0
HL0 L-
L2-HL-H2L0
pH
1 2 3 4 5 6 7 8 9 10 11 12
Per
cen
tag
e A
dso
rbed
0
20
40
60
80
100H2L
0HL- L2- dimethylmalonic acid
acetylacetoneacetoacetic acidmalonic acid
Figure 4.3. Adsorption of 100 µM organic substrates onto 5.0 g/L TiO2 as a function of pH. All suspensions contained 1.0 mM NaCl. pH was set using HCl/NaOH addition. Top: Four bars denote predominant protonation level domains (at an ionic strength of 1.0 mM).
157
-2H+, -2e-
tartronic acid ketomalonic acid
formic acid
glyoxylic acid oxalic acid
H2O, -2H+, -2e-
fast enolization
malonic acid
>MnIII,IV
Mn2+
glycolic acidR0 > 3000 µM/h R0 >> 3000 µM/h
R0 = 14 µM/h
R0 = 8.8 µM/h
R0 > 3000 µM/h
R0 = 0.02 µM/h
R0 = 462 µM/h
H2O, -2H+, -2e- -2H+, -2e-
-2H+, -2e-
H2O, -2H+, -2e-
-2H+, -2e- H2O, -2H+, -2e-
Figure 4.4. Proposed mechanism for malonic acid oxidation by MnO2. R0 refers to the initial rate with respect to Mn2+(aq) production for reacting 5.0 mM organics with 200 µM MnO2 at pH 5.0 (10 mM butyrate).
158
Time (h)
0.0 0.6 1.2 1.8 2.4 3.0 3.6
[i]
( µM
)
0
40
80
120
160
200
240(b)
tartronic acid(aq)
oxalic acid(aq)
formic acid(aq)glyoxylic acid(aq)
mass balance-organics
MnII(aq)
0 30 60 90 120 150
[i]
( µM
)
0
150
300
450
600
1800
2000 (a)
malonic acid(aq)
MnII(aq)
formic acid(aq)
oxalic acid(aq)
Figure 4.5. Reaction of (a) 2.0 mM malonic acid and (b) 200 µM tartronic acid with 200 µM MnO2 at pH 5.0 (10 mM butyrate buffer). The mass balance in (b) refers to the sum [tartronic acid(aq)] + [oxalic acid(aq)] + [glyoxylic acid(aq)] + [formic acid(aq)].
159
pH
2 3 4 5 6 7
log
(d
Mn
II (aq
) / d
t) ( µ
M/h
)
-1.5
-0.5
0.5
1.5
2.5
pH
2 3 4 5 6 7
pH
2 3 4 5 6 7
0.660.81
0.220.30
0.490.23 0.10
0.590.46
0.96
1.16
1.17
0.67
1.04
0.180.16
0.610.26
0.420.53
1.21
(a) (b) (c)
Figure 4.6. Effect of pH on (a) acetylacetone, (b) acetoacetic acid and (c) malonic acid oxidation by MnO2. The order with respect to [H+] is calculated using successive pairs of points in the log-log plot. Reaction conditions: 5.0 mM organic, 0.2 mM MnO2, and 10 mM pH buffer (4-sulfobenzoate for pH 3.0 and 3.5; butyrate for pH 4.0, 4.5, and 5.0; MES for pH 6.6; MOPS for pH 7.0).
Top Related
Copyright © 2022 FDOKUMEN

