


Bahasa
Halaman
Hukum


Note: This is a working document
CAPE TOWN
South Africa Note: This is a working document
Contents
1. Background ............................................................................................... 1
1.1 Introduction to Cape Town .................................................................... 1
1.2 Transport infrastructure ......................................................................... 1
1.3 Tourism enterprises .............................................................................. 2
1.4 Overview of key attractions ................................................................... 2
2. Cape Town’s tourism performance ......................................................... 3
2.1 Key trends ............................................................................................. 3
2.1 Tourism source markets ....................................................................... 4
2.3 Seasonality trends ................................................................................ 4
3. Tourism development and management ................................................ 5
3.1 Destination management ...................................................................... 5
3.2 Tourism development policy ................................................................. 7
3.3 Destination marketing and positioning .................................................. 9
3.4 Performance measurement and monitoring ........................................ 13
3.5 Visitor satisfaction ............................................................................... 14
4. Environmental perspective .................................................................... 15
4.1 Sustainable tourism strategy and regulations ..................................... 15
4.2 Density ................................................................................................ 16
4.3 Public green spaces............................................................................ 19
4.4 Greenhouse gas emissions and energy efficiency .............................. 21
4.5 Mobility ................................................................................................ 22
4.6 Water quality and availability .............................................................. 24
4.7 Air quality ............................................................................................ 25
4.8 Waste management and recycling ...................................................... 26
4.9 Landscape and biodiversity protection ................................................ 27
5. Social and cultural perspective ............................................................. 28
5.1 Attractions ........................................................................................... 28
5.2 Events ................................................................................................. 29
5.3 Community attitudes ........................................................................... 30
5.4 Community engagement ..................................................................... 31
5.5 Gender equality .................................................................................. 31
5.6 Inclusion .............................................................................................. 32
5.7 Safety and security ............................................................................. 32
5.8 Authenticity ......................................................................................... 34
6. Case studies: examples of best practice .............................................. 35
6.1 CTT’s ‘Love Cape Town Neighbourhoods’ campaign ......................... 35
6.2 The V&A Waterfront ............................................................................ 38
6.3 Hotel Verde ......................................................................................... 42
Acknowledgements ........................................................................................ 48
Bibliography ................................................................................................... 49

1
1. Background
1.1 Introduction to Cape Town
Cape Town is the oldest and second largest city in South Africa and is the legislative
capital of the country. Situated in the south-west corner of the country near the Cape
of Good Hope, Cape Town is the capital of the Western Cape Province, the fourth
largest of nine provinces in South Africa.
The Cape Town metropolitan region has a large surface area of 2,461 km2 and a
total population of about 4 million (2016 estimates)1. It is the second most populous
urban area in South Africa after Johannesburg. Cape Town is home to two-thirds of
the Western Cape’s population, generates 72% of the region’s gross domestic
product (GDP), and contributes 11% to national GDP (2015).
One of the most multicultural cities in the world, underscoring its attraction as a
major destination for immigrants and expatriates to South Africa. Cape Town has a
population comprising approximately 42% of Coloured people, 39% Black African,
16% Whites, and 3% Asian and other2.
The city has a warm summer Mediterranean climate with mild, moderately wet
winters and dry, warm summers. The high season for tourism is considered to be
October to March and the low season April to September.
Known as the most cosmopolitan city in South Africa, Cape Town is a popular
international tourism destination. Visitors are attracted to its natural beauty, urban
landscape, sandy beaches, Mediterranean climate and well-developed infrastructure.
1.2 Transport infrastructure
The city has a well-developed transport infrastructure, comprising an airport, port,
roads and public transport, as well as a railway network catering to domestic,
national and international visitors.
Cape Town International Airport is the second busiest airport in South Africa and
third busiest in Africa. Located approximately 20 kilometres from the city centre, it is
the only airport in the Cape Town metropolitan area that offers scheduled passenger
services. The airport has domestic and international terminals, linked by a common
central terminal.
1 State of Cape Town report 2016. City of Cape Town.
2 Compiled by Strategic Development Information and GIS Department, City of Cape Town 2011,
and 2001 Census data supplied by Statistics South Africa

2
1.3 Tourism enterprises
The city has a total of nearly 4,000 tourism enterprises, including 2,742 in different
types of guest accommodation, 389 restaurants and 424 tourist attractions to cater to
international and domestic visitors. In addition, it has 170 conference venues for
business and other events.
Table 1.1 Different types of tourism enterprise
Type of enterprise Number
B&B 340
Resort, caravan park & camping sites 17
Guest house 1,127
Backpacker 30
Hotel 183
Lodge 70
Self-catering units 975
Conference venue 170
Transport operators, tour operators and tour guides 204
Attractions 424
Restaurants 389
Total number of tourism enterprises 3,929
Source: Economic Value of Tourism in Cape Town Report, June 2015
1.4 Overview of key attractions
The city’s key attractions include:
Table Mountain, part of the spectacular Table Mountain National Park;
City Bowl, a natural amphitheatre-shaped area bordered by Table Bay and
the mountains of Signal Hill, Lion’s Head, Table Mountain and Devil’s Peak;
Cape Point, a promontory at the southeast corner of the Cape Peninsula;
Robben Island, where Nelson Mandela was imprisoned for 27 years;
V&A Waterfront, the most visited tourism destination in South Africa;
Kirstenbosch National Botanical Gardens, one of the world’s greatest
botanical gardens; and
Groot Constantia, South Africa’s oldest wine producing estate.
Gastronomy, nightlife and entertainment are other key contributors to Cape Town’s
appeal as a leisure destination among international visitors. Over the years, Cape
Town, affectionately known as the “Mother City”, has received several accolades for
its appeal as an exciting tourism destination.
Most recently, Cape Town was chosen as the Best City in the World (for the fourth
year running) by The Daily Telegraph (2015/2016 Travel Awards). In Condé Nast’s
highly acclaimed Reader’s Choice Awards, Cape Town also took the top honours as
the number one food city in the world.
3
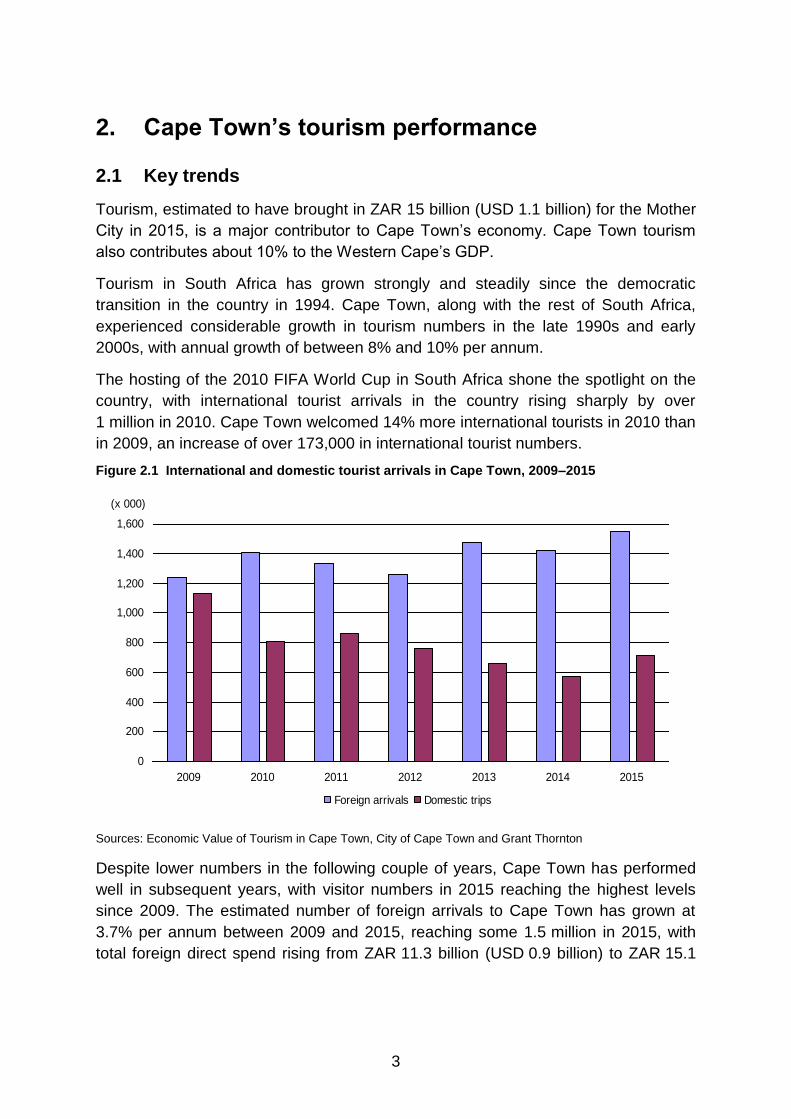
2. Cape Town’s tourism performance
2.1 Key trends
Tourism, estimated to have brought in ZAR 15 billion (USD 1.1 billion) for the Mother
City in 2015, is a major contributor to Cape Town’s economy. Cape Town tourism
also contributes about 10% to the Western Cape’s GDP.
Tourism in South Africa has grown strongly and steadily since the democratic
transition in the country in 1994. Cape Town, along with the rest of South Africa,
experienced considerable growth in tourism numbers in the late 1990s and early
2000s, with annual growth of between 8% and 10% per annum.
The hosting of the 2010 FIFA World Cup in South Africa shone the spotlight on the
country, with international tourist arrivals in the country rising sharply by over
1 million in 2010. Cape Town welcomed 14% more international tourists in 2010 than
in 2009, an increase of over 173,000 in international tourist numbers.
Figure 2.1 International and domestic tourist arrivals in Cape Town, 2009–2015
0
200
400
600
800
1,000
1,200
1,400
1,600
2009 2010 2011 2012 2013 2014 2015
(x 000)
Foreign arrivals Domestic trips
Sources: Economic Value of Tourism in Cape Town, City of Cape Town and Grant Thornton
Despite lower numbers in the following couple of years, Cape Town has performed
well in subsequent years, with visitor numbers in 2015 reaching the highest levels
since 2009. The estimated number of foreign arrivals to Cape Town has grown at
3.7% per annum between 2009 and 2015, reaching some 1.5 million in 2015, with
total foreign direct spend rising from ZAR 11.3 billion (USD 0.9 billion) to ZAR 15.1

4
billion (USD 1.1 billion) in the same period3. Cape Town’s share all foreign tourist
arrivals in the Western Cape is estimated at 95%.
In contrast, the number of domestic overnight trips to Cape Town shows a declining
trend – down from 1.1 million in 2009 to about 700,000 in 2015. However, domestic
tourism spend increased from ZAR 1.1 billion to ZAR 1.7 billion over this period.
2.1 Tourism source markets
As per the latest data (2016) from Cape Town Tourism (CTT), Europeans, led by
Germans and the British, account for majority of the visitors. Other source markets
making up the top ten are South Africa (domestic), United States, Namibia,
Netherlands, France, China, Canada and Switzerland.
2.3 Seasonality trends
Cape Town faces a seasonality issue in tourism, with a weaker performance in the
winter months. CTT’s Seasonality Index, designed to measure and better understand
the seasonal variation in demand, shows a major drop in demand during the low
season (April to September) compared with the high season (October to March). For
example, in the accommodation sector, occupancy levels average 71.8% in the high
season, dropping to 55.2% in the low season.
Figure 2.2 Seasonality of hotel occupancy in Cape Town by region, 2015
71.8 73.3
63.3
69.373.2
66.7
72.9
80.9
55.2
66.4
53.255.9 55.3
48.651.4
53.4
0
10
20
30
40
50
60
70
80
90
Overall
average
Northern
Suburbs
Southern
Suburbs
Southern
Peninsula
City Centre Helderburg Blaauw berg
Coast
Atlantic
Seaboard
percent High season Low season
Sources: Seasonality Index and Cape Town Accommodation Performance Review & Forecast Reports, Cape Town Tourism and Horwath HTL.
3 Research on the Monitoring of Trends in Economic Value of Tourism in Cape Town – report by
Grant Thornton

5
3. Tourism development and management
3.1 Destination management
Tourism in Cape Town is managed by the City of Cape Town, the metropolitan
municipality which governs the city and its suburbs and exurbs, in partnership with
Cape Town Tourism (CTT), the official tourism marketing organisation for the city.
The City of Cape Town drives the city’s local tourism mandate through its Tourism
Department, whose core functions include destination planning and policy making,
tourism regulation, tourism product development, training and capacity-building, and
providing tourism infrastructure and services.
CTT is responsible for tourism marketing, and for visitor and industry services for the
city. CTT was established in 2004 as a voluntary industry association made up of
tourism businesses in Cape Town. Subsequently, it took on the mandate to offer
visitor services (2006) and the destination marketing function (2008) for Cape Town
from the CoCT. In 2012, the mandate for destination marketing was amended to that
of tourism marketing.
A non-profit organization, CTT receives funding from CoCT for its activities, and also
generates its own income from its membership services and other sources such as
booking services, product sales, ticket sales, etc.
Table 3.1 Performance criteria for Cape Town Tourism
3.1.1 Main functions of Cape Town Tourism
Industry services: CTT serves an industry base of close to 1,300 tourism
businesses, providing its members with a range of benefits including
Performance criteria Yes (√) / No (×)
Destination growth strategy
• Existence of a DMO at the destination √
• Clear vision and governance structure for destination in place √
• Sustainable tourism policy and regulations within the overall development strategy of the city
√
• Differentiation of the destination (USP and/or UEP?) √
• Public and private sectors commitment/involvement √
• Collaboration with the stakeholders within and across sectors √
• Regular update of the strategy & action plan √
• Performance measurement tools in place √
Visitor satisfaction
• Repeat visitation (within 5 years)/recommendation √
• Analysis of the visitor satisfaction with different elements of destination √
• Analysis of the visitor satisfaction with their overall experience at the destination √

6
accreditation, networking sessions, access to market insights, brochure display
space in its visitor centres and marketing and promotional opportunities. It works
closely with its members to make tourism a more inclusive space.
Visitor services: CTT has six Visitor Information Centres situated at strategic
locations across the city, a contact centre and mobile information centres to offer
visitors local and regional information, as well as booking services for
accommodation, tours and activities, South African National Parks, events and
transport. A range of products such as city maps, postcards and local crafts is
also made available for sale.
Tourism marketing: CTT’s marketing services focus on promoting the city’s
iconic attractions and offerings, as well as the less-explored sites in the city, to
both the domestic and international markets. CTT participates in a number of
trade fairs and exhibitions globally, and in road shows in selected target markets.
The organization’s activities are overseen and guided by a Tourism Board
comprising CTT’s industry members and local government representatives.
Currently, the Tourism Board has 14 members, including two co-opted members.
CTT’s public-private partnership model is viewed as an example of best practice by
many international tourism leaders. CTT was invited to serve on the UNWTO
Destination and Business Council and was also asked to present its tourism model
at UNWTO’s annual general meeting for two years in a row.
CTT is a visitor-centric organization that has continually reinvented itself in response
to challenging times and changing trends in the industry. Its mantra is “to be a leader
in reinvention in order to remain relevant”.
Several innovative and creative initiatives have been undertaken in recent years to
benefit the city, industry, community and visitors. It is at the forefront of digital
innovation, online marketing and the use of social media for destination marketing,
and has received several global accolades for its achievements. (Some of its
initiatives are highlighted in a later section.)
3.1.2 Board Development Fund
CTT is committed to supporting and growing the small-scale business community in
the city. It has launched the Board Development Fund, which is intended to assist
historically disadvantaged individuals (HDI’s) with support to encourage skills
transfers, partnership, enterprise development and marketing opportunities.
Every year, two chosen businesses receive ZAR 50,000 in support of their
businesses’ growth, as well as non-financial support by CTT in the form of coaching
and mentoring.
7
3.2 Tourism development policy
3.2.1 Tourism Development Framework
Cape Town has strong policies for the development of tourism as a major engine for
job creation and a driving force for economic growth and development. Tourism
marketing and promotion is undertaken within the overall guidelines of the city’s
Tourism Development Framework, a strategic framework and policy document
through which Cape Town aims to achieve its vision of “a world-class competitor and
South Africa’s premier tourism destination and to maximize the economic spin-offs
and jobs created from the tourism sector”.
The five-year Tourism Development Framework (TDF), first developed in 2005, is
aligned with Cape Town’s five-year Integrated Development Plan (IDP). The IDP
provides the strategic framework for the city’s development – social, economic,
environmental, spatial and infrastructural – through which the city aims to realise its
vision for Cape Town as an inclusive, safe, caring and well-run city of opportunity.
The IDP recognizes tourism and tourism-related activities as key to economic growth
and job creation.
In 2013, a new five-year TDF (2013–2017) was developed, consisting of new
strategic focus areas, goals, key actions, projects and implementation guidelines for
tourism development in the context of emerging global and local trends,
opportunities and challenges facing the tourism industry.
Importantly, the city has a collaborative approach to policy development with inputs
sought from stakeholders within and across sectors, as well as the local community.
For example, the TDF was shaped jointly by industry partners and departments
within the CoCT, with extensive community consultation. A comprehensive public
participation process ensured broad participation by citizens and stakeholder groups.
The TDF was made available for perusal at city libraries throughout the city, public
engagement meetings were conducted in nine tourism development areas as
identified in the Spatial Development Framework, and information was made
available on the city’s website and through advertisements in local media. All policies
and plans undergo annual reviews, allowing for adjustment, as necessitated, in the
context of global and/or local situations and events.
Cape Town Tourism and the City of Cape Town have jointly set the bold target of
doubling the economic impact of tourism on the city by 2020, in a sustainable way
that will ensure widespread economic benefits and will permit further expansion in
the future.

8
3.2.2 Responsible Tourism Policy and Action plan
Cape Town has been at the forefront of responsible tourism implementation in South
Africa and globally, incorporating responsible tourism as a founding principle of its
first Tourism Development Framework.
The city is the birthplace of the Cape Town Declaration on Responsible Tourism,
endorsed by delegates from 20 countries at the first International Conference on
Responsible Tourism in Destinations held in Cape Town in 2002. The notion that
responsible tourism “creates better places for people to live in, and better places to
visit” was adopted at that time.
In 2009, a city-wide Responsible Tourism Action Team comprising key tourism
organizations and partners in Cape Town and a multi-department CoCT advisor
committee led the development of Cape Town’s Responsible Tourism Policy and
Action Plan4.
The city has also been instrumental in pioneering the Responsible Tourism Charter,
along with major tourism associations and organizations, committing the CoCT and
the industry to responsible tourism behaviour and practices. The charter identifies
seven key priorities: reducing water and energy use; decreasing waste generated;
increasing contributions to the welfare and livelihoods of local people through skills
development; buying local products and services; charitable giving; and supporting
local businesses5.
Cape Town was rewarded for its efforts with the Best Destination Category Award in
the 2009 Virgin Holidays Responsible Tourism Awards at the World Travel Market in
London.
Over the years, in its efforts to mainstream responsible tourism, the city has
undertaken a number of actions and initiatives targeting not just the industry, but also
residents and tourists, some of which are highlighted below.
3.2.3 Key actions and initiatives
Cape Town’s Green Goal programme – the plan behind greening the 2010 FIFA
World Cup held in South Africa (Cape Town hosted eight games), was supported
by information about responsible tourism for citizens, tourism businesses and
visitors though industry workshops, a dedicated website, a hands-on ‘how to
guide’, video and tips for travellers. The programme was awarded the
International Olympic Committee (IOC) Sport and Environment Award.
4 City of Cape Town Responsible Tourism Policy, 2009
5 Tourism Development Framework: 2013 to 2017

9
As one of the projects under the Green Goal programme, CoCT launched the
Cape Town Green Map, an interactive tool that showcases green living, nature,
social and cultural resources in the city for residents and visitors. (c.f. Section 4
for more details).
Launch of the annual Responsible Tourism Week, information sessions for
tourism association members and implementation workshops for tourism
businesses.
Launch of a pilot project involving 20 local tourism businesses (on a voluntary
basis) in a bid to raise awareness through action and to understand better the
practical issues with measuring and monitoring performance on responsible
tourism criteria and indicators.
Cape Town’s Responsible Tourism website (https://responsiblecapetown.co.za) has
become the hub of information on responsible tourism in the city, inspiring tourism
businesses to manage their operations and market themselves more responsibly. It
includes tools, case studies, a how-to guide, events and a blog. Online social media
is also used to raise awareness of, and promote the adoption of, responsible tourism
behaviour and practices.
Most recently, in 2016, in an innovative experiment, CoCT’s Tourism Department
launched the Responsible Tourism (RT) Challenge, whereby four small
accommodation establishments are being guided to implement sustainable operating
practices over a period of six months. During this period, the stories of their
‘responsible tourism journey’ are being shared online so that other tourism business
can follow their actions, achievements, and cost savings.
In a forward-thinking move, outreach efforts are also being made in schools and
colleges among both students and educators, to raise awareness of responsible
tourism principles and practices, and to motivate the future generation to adopt
environmentally sensitive behaviour, both as citizens and as future employees in the
tourism industry.
3.3 Destination marketing and positioning
3.3.1 People as attractions
Cape Town’s natural beauty, cultural history, urban landscape and advanced tourism
infrastructure are some of its special characteristics that draw visitors from across
the globe. Yet, one of its most striking features is the warmth and friendliness of its
people. That is, the ‘people’ component of the Cape Town tourism experience is the
singular selling proposition (USP) of the destination.

10
Thus, Cape Town Tourism considers people as attractions in its destination
marketing and positioning. Several products and campaigns have been launched,
strategically harnessing the power of the locals to provide unforgettable experiences
to visitors in Cape Town, and to encourage travellers to experience the destination
“as locals do”.
Cape Town Tourism has also taken to heart Nelson Mandela’s words: “If you talk to
a man in a language he understands, that goes to his head. If you talk to him in his
language, that goes to his heart.”
It has adopted “Love Cape Town” as its destination branding proposition, combining
the destination’s atttractions, its people and its communities to form a unique
emotional connection with visitors, promising them an authentic and immersive
holiday experience.
A key strategy has been to build around the hashtag #lovecapetown, encouraging
Cape Town residents and visitors to create content, so that the potential customer
has peer-to-peer information and reviews on which to rely. The ongoing campaign
has been hugely successful in creating visitor engagement, generating over 450,000
Facebook likes, 125,000 Twitter followers and 37,400 followers on Instagram until
now.
3.3.2 “Send your Facebook Profile to Cape Town” social media campaign
In 2012, Cape Town Tourism used Facebook as a tool for uncovering the City and its
abundance of attractions via an interactive travel game called My Cape Town
Holiday. The campaign was launched as a competition that saw Facebook profiles
being “sent on holiday to Cape Town” between October and December 2012, with
the offer of a real Cape Town holiday for three lucky winners announced in February
2013.
The Send your Facebook Profile to Cape Town invited Facebook users to send their
profiles on a virtual five-day tailor-made holiday. Facebook users worldwide became
CTT’s channels for spreading news and information about Cape Town. To create the
content, 150 POV (Point of View) videos were shot, over 400 status updates were
written and more than 10,000 holiday snaps were taken.
The hugely successful campaign achieved the following:
Almost 8,000 people travelled ‘virtually’ to Cape Town;
Over 350,000 potential tourists engaged with the campaign;
About half a million impressions were generated on Facebook alone;
44,000 ‘friends’ were invited to send their Facebook profiles to Cape Town
Tourism’s Facebook page, which received over 20,000 ‘likes’;

11
A Gold Lion award at the Cannes Lions International Festival of Creativity 2013 in
the Branded Content section – one of only two South African Golds;
Contributed to Cape Town Tourism winning a Travel + Leisure SMITTY Award in
2013 for Best Overall Use of Social Media, CVB, Global.
Mobile visitor information centres
In response to a rising trend of visitors using mobile and online portals to access
information about Cape Town, CTT launched Africa’s first mobile Visitor Information
Centre (VIC) in 2014. Named Thando (which means love in Xhosa), the mobile VIC
gave CTT the opportunity to meet travellers and local citizens whereever they are in
the city.
Thando was an instant hit with visitors, and the fleet was soon expanded to another
five vehicles, taking the total fleet count to two vans, two scooters and two motorised
bicycles.
The mobile Visitor Information vehicles are manned by enthusiastic Cape Town
Tourism team members to position an information service in high traffic areas in line
with events and seasonal hot spots. The original and largest Thando has a built-in
office to assist visitors in making bookings for their stay or buying tickets for events
and shows. An attractive relaxation area, featuring locally designed chairs and
tables, offers free Wi-Fi to visitors.
The choice of vehicle was deliberate as its Blue Efficiency package optimises fuel
consumption and reduced emissions, whilst boasting eco gear manual transmission
and a diesel filter. The entire operations element of the unit is solar powered,
emphasizing once again the importance of responsible tourism development.
CTT actively encourages use of the hashtag #thando in social media to create visitor
engagement with the community. The Thando team reported more than 43,400
interactions with visitors during 2016. This figure represents 25% of overall visitor
interactions in the Cape Town Tourism network.

12

13
3.3.3 ‘Love Cape Town Neighbourhoods’ video series
In response to the growing “travelling like a local” trend among global travellers, the
team at CTT has produced a range of content to help inspire travel in Cape Town
beyond the expected.
The Love Cape Town Neighbourhoods Series was conceived as a way to help
explore the Mother City’s most popular neighbourhoods, through the eyes of the
people who live there. Using locals, and interviewing the people who live and play in
the neighbourhoods featured, the videos encourage viewers to enjoy the areas as
the locals do. Playful, insightful and inspirational, the videos are aimed at driving
visitors to the areas to experience them first-hand.
This initiative sits hand-in-hand with the objective to promote the geographical
spread of visitors. More details are presented in the Case Study section.
3.3.4 ‘Hello Weekend’ campaign
A new destination marketing campaign Hello Weekend was launched in 2015, to
promote Cape Town as a year-round destination. A website was created
(http://helloweekend.capetown) that showcases a wide range of themed weekends,
promising unique experiences with affordable options, 365 days a year.
3.4 Performance measurement and monitoring
There are a number of tools in place for performance measurement and monitoring.
Cape Town Tourism has established Key Performance Indicators (KPIs) for the
organization as well as for the destination.
Annual performance and seasonal trend reports are generated. In addition,
increasing use is being made of research, with surveys being conducted across
tourism establishments and visitors to measure performance on an ongoing basis.
Until 2015, the City of Cape Town commissioned a series of annual Economic
Impact of Tourism Research studies, in order to establish the contribution of tourism
to Cape Town’s economy. This was deemed necessary to establish a baseline for
future long-term planning for the city, as tourism statistics provided by Statistics
South Africa and South Africa Tourism are only provided at national and provincial
level. This data was used to estimate the gross value added of tourism to Cape
Town’s economy. Cape Town has set a bold target of doubling the economic impact
of tourism on the city by 2020.
Other surveys conducted, or subscribed to, include:
Occupancy surveys on a monthly basis, covering B&Bs, guesthouses, hotels and
other accommodation types, by area;

14
In-destination visitor surveys on a monthly basis, covering domestic and
international visitors across the city;
Forward Keys’ real-time market data on travel trends based on booking
transactions globally; and
Seasonality Index that tracks performance within and between low and high
seasons.
3.5 Visitor satisfaction
Based on a brief from the City of Cape Town, Cape Town Tourism has recently
(2014) started a Visitor Satisfaction Survey. Launched as a three-year exercise with
a target sample size of 2,100, the survey data will form the baseline for an Annual
Visitor Satisfaction Index.
The survey captures the level of visitor satisfaction with Cape Town, broken down by
key source markets, as a destination overall and by sub-sectors including:
Attractions
Transportation
Accommodation
Restaurants
Retail shops
Immigration
It looks at visitor satisfaction with both the quality and value of key elements of their
stay. In addition, it captures data on frequency of visitation (first-time versus repeat
visit), intent to return to Cape Town, and intent to recommend Cape Town as a
destination to family and friends.
The key elements were based on requirements by the CoCT and industry. It is
flexible enough to incorporate new elements such as visas and customs in response
to global or national issues.
Data collection is ongoing, four times a month – two weekdays and two weekend
days, through intercept surveys at different access points including airports, hotels,
main attractions and CTT visitor information centres.
CTT reports on monthly and seasonal performance, including the results of the
visitor survey, with its Industry Performance Reports. Reports are sent to industry
members of CTT and to CoCT.
Significantly, the City of Cape Town also undertakes an annual Community
Satisfaction Survey. It is one of a few South African cities that uses independent
research to measure community satisfaction with the city’s performance. These
15
results are used by CoCT to enhance service delivery and to guide operational
planning and implementation.
Among the 13 key performance areas (that include public transport, environment,
nature reserves and tourism), performance in local tourism is measured on three
aspects:
The tourism infrastructure in each area, such as tourist attractions, signage, etc.;
The extent to which residents benefit from tourism in Cape Town;
The tourism services in each area, such as a tourism information office,
restaurants, etc.
4. Environmental perspective
4.1 Sustainable tourism strategy and regulations
Cape Town has a well-regulated environment with environmental policies in place for
most performance criteria. However, the city lacks measurement data on some
indicators, specifically with respect to tourism.
Table 4.1 Performance criteria for environmental indicators
Performance criteria Value Year of analysis
Source
% of tourism enterprises/establishments in the destination using voluntary certification/ labelling for environmental/ quality/ sustainability and/or Corporate Social Responsibility
18% 2017 Tourism Grading Council of South Africa
1% -2% 2017 Fair Trade Tourism, Heritage & Greenline Certification Standards
% of tourism enterprises involved in climate change mitigation schemes and ‘adaptation’ responses and actions
Data not available
Some examples of individual tourism enterprises reporting are available
Environmental impact (degradation/ conservation of nature): monitoring tools in place
No
The Tourism Grading Council of South Africa (TGCSA) is the only officially
recognized quality assurance body for tourism products in South Africa. The grading
criteria incorporate responsible environmental and business practices, including
indicators such as water and waste management, energy management, support of
local producers and local community initiatives6. Although this is a voluntary scheme,
Cape Town performs well with 18% of its 3,540 tourism enterprises (excluding
6 http://www.tourismgrading.co.za

16
restaurants)7 having been quality graded by the TGCSA, of which 74% have
achieved five-star or four-star grading.
In addition, about 1-2% of tourism enterprises in Cape Town have been certified by
other schemes in South Africa, which certify tourism enterprises for their
environmental/sustainability business practices and initiatives.
Seven tourism enterprises in Cape Town are Fair Trade Tourism-certified (among
68 across all of South Africa). Fair Trade Tourism is Southern Africa’s leading
responsible tourism non-governmental organization (NGO)8.
Six Cape Town accommodation establishments have been certified for their
environmental performance by the Heritage Environmental Management
Company (HEMC), under the Heritage Standard9.
Two tourism establishments in Cape Town are certified under the GreenLine
Responsible Tourism Rating Programme, which is aimed at smaller tourist
accommodation establishments with less than twenty rooms. GreenLine is a
certification programme designed to reflect those tourism-based businesses that
meet the South African National standard and globally competitive and
recognised responsible practice.
In addition, 11 beaches in Cape Town are certified by Blue Flag (the foundation
based in Denmark that certifies that a beach, marina or sustainable boating
tourism operator meets its stringent environmental and quality standards).
Notably, in a major review of its strategy, Fair Trade Tourism has taken a decision to
get more tourism businesses on board to “join the journey towards sustainable
tourism”, rather than just cater for businesses that are ready to apply for certification.
It is also taking on an advocacy position around topics of human rights, sustainable
development and the environment to get the government (at the national, provincial
and local level) to offer tax rebates and incentives to encourage tourism businesses
to operate responsibly.
4.2 Density
4.2.1 Measurements
Table 4.2 Performance criteria for density
7 Research on the Monitoring of Trends in Economic Value of Tourism in Cape Town, June 2015
produced by Grant Thornton (Page 25). 8 http://www.fairtrade.travel
9 http://www.heritagesa.co.za
Performance criteria Value Year of analysis
Source
Number of tourists per 100 residents 18.1 2015 Cape Town Tourism

17
Calculation: Average length of stay of total tourists per 100 residents
The ratio of tourists to local residents can be used as an indication of potential
pressure on the environmental and social resources of tourist-receiving regions and
local destinations. It can also indicate seasonal pressure.
In Cape Town, the number of tourists per 100 residents was calculated as 18.1
(2015 data from CTT), with the ratio far higher in high season (October to March)
than in low season (April to September).
In addition, millions of domestic day trips are made to the city (actual figures are not
available), putting additional pressure on the city’s resources. As an indication, the
number of domestic day trips to Western Cape numbered 7.2 million in 201510.
Extrapolating from the 2011 Domestic Tourism Survey raw data by the CoCT’s
Development Information team, nearly one-third (32%) of day trips in the Western
Cape were made to the city of Cape Town11.
4.2.2 Key actions and initiatives
In 2014, CTT developed a Seasonality Index to measure the seasonal variation in
demand for Cape Town, in order to develop strategy to improve visitor numbers
during low season and to achieve wider dispersion of visitors at lower densities.
In consultation with CoCT, industry partners and provincial government, CTT has
successfully launched initiatives to re-position Cape Town as a year-round
destination. Cape Town 365 is the motto, with an integrated events calendar for
stakeholders across business and leisure tourism.
A new destination marketing campaign, Hello Weekend, was launched in 2015,
to promote Cape Town year-round. A website was created
(http://helloweekend.capetown) that showcases a wide range of themed
weekends, promising unique experiences with affordable options, 365 days a
year.
The campaign, which was specifically designed to attract visitors in the off-peak
season, resulted in 21% increase in domestic bookings. The Seasonality Index
shows a narrowing of seasonality across most indicators.
10
Domestic Tourism Survey 2015, Statistics South Africa. 11
Domestic Day Trips to the Western Cape and Cape Town in 2011, Development Information and GIS Department City of Cape Town, June 2015.

18
Figures 4.1 and 4.2 Data on airport traffic and accommodation, 2013 to 2015
Source: Seasonality Index, Cape Town Tourism [Airport arrival figures supplied by the Airports Company South Africa (ACSA)]

19
4.3 Public green spaces
4.3.1 Performance measurement
Cape Town is blessed with a wealth of biodiversity hot spots of international
importance, green spaces and natural resources – it is one of few cities in the world
with a national park within the city’s limits. The city has a total of 3,571 parks that
include district and community parks and biodiversity areas. About 54,000 hectares,
or 22% of the total land area in the city, is covered by protected areas, conservation
areas and reservoirs.
The city has a robust set of policies to protect green spaces and environmentally
sensitive areas. The public open space (POS) provision per 1,000 people is
1.08 hectares12.
According to the 2011 African Green City Index, among 15 African cities, Cape Town
was rated as the city with the greenest space, with an estimated 289 m2 of green
space per person, about four times the index average of 74 m213.
Although Cape Town does not currently have a comprehensive tree or tree canopy
database, under CoCT’s Tree Management Policy 2015, existing trees will be
mapped and a valuation method established, in order for the City to understand the
economic, heritage, environmental and social value of its tree asset base.
Table 4.3 Parks and public green spaces
Performance criteria Volume/value Year of analysis
Source
Number of parks 3,571 2016 City of Cape Town
% of preserved areas/ reservoirs/ waterways/ parks in relation to total land area
22% 2016 City of Cape Town
% of trees in the city in relation to city area and/or population size
Not available
% of green space (public parks) coverage in relation to city area and/or population size
1.08 ha per 1,000 people
1 2016 City of Cape Town
289 m2 of green space
per person 2011
African Green City Index
% of green or public spaces in need of improvement
Not available
1Open spaces
; excludes cemetery land
4.3.2 Key actions and initiatives
In 2009, on World Environment Day, Cape Town launched the Cape Town Green
Map (http://www.capetowngreenmap.co.za). The first Green Map on the continent,
12 Source: Recreation & Parks Department Social Services Directorate 13
http://www.southafrica.net/blog/en/posts/entry/cape-town-leads-the-way-as-a-green-city

20
and the first in the world to start as an online map, it highlights green spaces,
biodiversity hot spots, sustainable living projects, local green events, green
accommodation, fair-trade businesses, etc.
The Green Map project began as part of the Green Goal 2010 programme that
aimed to make the 2010 FIFA World Cup™ the greenest world cup. The map,
powered by Open Green Map – an interactive mapmaking tool that quickly allows the
sharing of green sites – serves as a source for local Cape Town residents, as well as
for tourists and visitors who want to make their holidays “greener” and cultivate
environmentally conscious consumer habits.
A printable version of the map can be downloaded from the website. There are
currently eight editions of the Green Map, each highlighting different green areas
based on a theme. A printed version of the map is also available free of charge at all
Cape Town Tourism visitor information centres.
Since inception, a total of 537 green sites and projects have been listed on the Cape
Town Green Map website.
Source: City of Cape Town

21
4.4 Greenhouse gas emissions and energy efficiency
Table 4.4 Performance criteria
Source: City of Cape Town
Cape Town has a fairly high carbon footprint, as most of its energy supply, much like
the rest of the country, comes from coal-fired power stations. Coal is one of the most
carbon-intensive sources of power generation.
In 2012, GHG emissions in the city totalled 21.3 million tonnes of CO2 (tCO2e), with a
per capita carbon footprint of 5.6 tonnes14. Electricity consumption accounts for 64%
of carbon emissions, most of which are attributable to the residential and commercial
sectors (which account for 83% of electricity consumption). The city does not
currently monitor energy consumption at the sub-sector level, including in tourism
enterprises. At the present time, less than 1% of the total energy consumed in the
city comes from renewable sources. Data on the percentage of tourism enterprises
that take actions to reduce energy consumption is also unavailable
To reduce its carbon emissions and save energy, the city has incorporated climate
change and energy issues into its high level policy and planning documents,
particularly the city’s Integrated Development Plan and City Development Strategy,
and the longer term Cape Town in 2040 policy.
The Energy2040 Vision and Energy and Climate Action Plan (ECAP) provide the city
with an evidenced framework on which it can structure current and future action.
Energy2040 and ECAP are designed to achieve a reduction in carbon emissions of
13% by 2020 and 37% by 2040 (off the business-as-usual scenario for Cape Town).
This translates to 82 tons of carbon per USD 67,000 of gross value added (GVA) by
2020 and 49 tons of carbon per USD 67,000 GVA by 2040. The ECAP aims for a
10% reduction in city-wide electricity consumption and 10% renewable and cleaner
energy supply by 2020. The initiatives also aim to reduce energy poverty, stimulate
job creation, increase resource efficiency and reduce the disproportionate climate
risks facing the poor15.
14
Cape Town 2011, State of Energy and Energy Futures Report. 15
http://www.c40.org/awards/2016-awards/profiles/79
Performance criteria Volume/value Year of analysis
Total amount of GHG emissions for the city and per capita
21.3 million tonnes of CO2 (tCO2e); 5.6 tonnes per capita
2012
% of total energy consumed in the city that comes from renewable sources
Less than 1% 2012
Energy consumption per tourist night compared to general population energy consumption per resident night
Not available
% of tourism enterprises that take actions to reduce energy consumption
Not available

22
A number of campaigns and programmes aimed at reducing electricity consumption
and related CO2 emissions, and to increase energy security, have been initiated both
at the consumer and industry level:
In 2009, the city of Cape Town initiated an Electricity Savings Campaign which
encourages residential and commercial consumers to reduce electricity
consumption. It offers energy saving tips, posters and outreach training
programmes. Over the past ten years, it has reached over 680,000 residents.
The city is leading by example with energy efficiency and renewable energy in its
own buildings and operations, achieving savings of about ZAR 55 million
(USD 4.4 million) a year. To date it has retrofitted many inefficient buildings,
upgraded traffic lights and streetlights, trained facilities’ managers in energy
management and trained hundreds of employees in energy efficiency.
In 2009, the city launched the Energy Efficiency Forum for the commercial sector,
in partnership with Eskom and the South African Property Owners Association
(SAPOA). It shares practical knowledge with owners and managers of
commercial buildings and operations, and with public building managers, helping
to reduce the possibility of power outages and to lower Cape Town’s carbon
footprint. It has instituted an Annual Energy Efficiency Awards programme,
conducts site tours and participates in marketplace events to promote energy
efficiency.
These efforts have contributed to electricity consumption levels in Cape Town being
lower today than they were in 2007, and 24% below what they would have been for
‘business-as-usual’. In 2015, Cape Town had a carbon footprint of 5.5 tonnes per
person and consumed 6% of national electricity.
Energy consumption per tourist night compared with general population energy
consumption per resident night is not available at this stage. Energy consumption by
sector is reported for residential, commercial, industrial, transport, public service and
agriculture. Further disaggregation is not undertaken.
4.5 Mobility
Cape Town has a well-developed public transport system comprising rail, BRT (bus
rapid transit), bus and minibus taxi. However, daily commuting is dominated by
private vehicles, causing severe congestion problems in the city. It is estimated that
over 1.2 million passengers a day make use of private cars in Cape Town16. Average
commute time to work and education is 53 minutes and 31 minutes, respectively.
16
Source: City of Cape Town – Comprehensive Integrated Transport Plan 2013-2018

23
Non-motorised transport (NMT), which includes walking and cycling, accounts for a
small share of the transportation mode of choice during weekday morning peak
periods. The city’s existing cycle network covers at least 450 kilometres of cycle
lanes, yet just 1% of all trips in Cape Town are made by bicycle17. While cycling for
recreation and sport is a popular activity among citizens (mainly from the higher
income groups), utility cycling18, which includes trips made for school, tertiary
education and employment purposes and to access public transport, is very low.
Table 4.5 Performance criteria
Source: a City of Cape Town;
b Cape Town Tourism
The city of Cape Town recognizes that the bicycle is rapidly becoming a favoured
mode of transport in liveable cities, allowing for a low cost, environmentally friendly
and effective option for mobility and accessibility. Transport for Cape Town (TCT),
Cape Town’s Transport Authority, aims to extend the cycle network so that it is an
integrated and continuous network within the city’s transport system.
The city is drafting a Cycling Strategy (currently open for comment) with the aim of
encouraging utility cycling from 1% to 8% by 2030, which will contribute to the
reduction of commuter costs, traffic congestion and carbon emissions.
17
http://www.tct.gov.za/en/news/general/citys-efforts-to-cultivate-a-cycling-culture-in-cape-town-under-discussion-at-mobility-indaba/page-1/
18 Utility Cycling includes all cycling forms except cycling specifically for recreation and sport purposes. It
encompasses commuting (including for work and education), delivering goods, providing services, shopping, accessing services and social activities.
Performance criteria Volume/value Year of analysis
Transportation mode split (Percentage of each mode of transportation, i.e. private, public, bicycles, pedestrians)
Private: 53%; Public: 38% Non-motorized: 9%
2016a
Average commute time and cost 53 mins to work; 31 mins to education
2017b
% of tourists and same-day visitors using different modes of transport to arrive at the destination
Air: 86%; Road: 12%
2014-15a
% of tourists and same-day visitors using local/soft mobility/public transport services to get around the destination
Tour bus: 38%; Public transport: 24%; Taxi/shuttle: 20%; Rented car: 15%; Own vehicle: 2%; Other: 1%
2016a
Average travel (km) by tourists and same-day visitors from home to the destination
not available
Average carbon footprint of tourists and same-day visitors traveling from home to the destination
not available
Number of EV charging stations within the city 2 (private sector) 2016b
Kilometres of bicycle paths and lanes 450 km (Shared Pedestrian-Cycle lanes = 234 km and Cycle lanes only = 216 km)
2016b
Is car sharing available at destination? No
Is bike sharing available at destination? Yes (Operated by Private Company)

24
The city does not currently provide its own EV charging stations, and there are only
two EV charging stations in the city from the private sector – BMW and Nissan.
The city also does not yet provide a bike-sharing service, although a private
company, Up Cycles, does, with stations at a number of places in the city. Car
sharing is also not currently available in Cape Town19.
Table 4.6 Modes of transport used in Cape Town
Transportation mode: typical weekday morning peak period
Private Public NMT
53%
Rail Contracted bus BRT Minibus-taxi
9% 18% 6% 2% 12%
38%
NMT = non-motorized transport; BRT = bus rapid transport. Source: City of Cape Town
4.6 Water quality and availability
Cape Town performs extremely well on the criteria of water quality and availability.
The entire population of the city has access to adequate and safe drinking water that
meets the national minimum standards. The total water allocation for Cape Town per
annum (398.7 million kl) is above annual demand levels (330.0 million kl). Quality is
regularly tested (the city’s laboratory tests over 5,700 samples a year, drawn from
sampling points throughout the system on a weekly or bi-weekly basis).
The city of Cape Town’s Water and Sanitation Department reports water
consumption by several use categories including industry and commercial (retail and
offices), but there are no specific water-use statistics for sub-sectors such as tourism
and tourism-related businesses (this is part of the commercial billing category).
Currently, the department is unable to extract only, say, hotel consumption data from
its nearly 13,000 commercial accounts. Encouragingly, as part of future data
improvement exercises, it intends to add billing sub-categories in order to provide
such data.
Data on the percentage of tourism enterprises taking actions to reduce water
consumption and the percentage using recycled water is also not available. As an
indication, based on the number of quality-certified tourism establishments by the
Grading Council of South Africa (whose criteria include water management and
recycling), it may be surmised that up to 18% of tourism establishments in Cape
Town take some actions to reduce water consumption and to use recycled water.
19
www.upcycles.co.za

25
Table 4.7 Performance criteria regarding water consumption
Performance criteria Volume/value Year of analysis
Total amount of water availability 398.7 million kl / year
2016
Water quality index/score 99.7% 2015-16
Proportion of population with access to adequate and safe drinking water
100% 2016
Water consumption per tourist night compared to general population water consumption per resident night
not available
% of tourism enterprises taking actions to reduce water consumption
not available
% of tourism enterprises using recycled water not available
Source: City of Cape Town
4.7 Air quality
Cape Town’s major sources of air pollution are vehicle emissions, industrial activity
and fossil fuel burning. The effect of these is particularly evident on the city’s ambient
air quality during Cape Town’s ‘brown haze’ months from April to September, when
falling temperatures and windless conditions are prevalent.
To deal with air pollution and to reduce the health impacts of air pollution, Cape
Town has adopted the Air Quality Management Plan, a statutory plan attached to the
city’s Integrated Development Plan, which aims to achieve and maintain clean air in
the city over the next 10–20 years.
The city has established 14 air monitoring stations at various locations where
continuous testing of several pollutants is undertaken, including sulphur dioxide,
particulate matter, ozone, carbon monoxide, hydrogen sulphide and volatile organic
compounds. Daily readings are compared to international and national standards.
With proactive measures over the past several years, Cape Town has managed to
reduce air pollution levels across the city. Most sites in Cape Town meet the South
African national standard for PM10 levels, although various hotspots of poor air
quality remain20.
In 2015/16, the city exceeded air quality standards on only three days at two testing
sites, compared with five days in 2014/15. The law makes provision for standards to
be exceeded four times a year at each testing station.
Table 4.8 Performance criteria regarding air quality
20
State of Cape Town Report 2016
Performance criteria Volume/Value Year of analysis
Source
Levels of Particulate Matter (PM10 – mg/ m3) 30
2015 CoCT
Levels of Particulate Matter (PM2.5 – mg/m3) 16 2015 CoCT
Number of days per year on which alarm levels are exceeded 3 2015-16 CoCT

26
Key actions and initiatives:
Vehicular traffic is the biggest source of air pollution in Cape Town, accounting
for up to 66% of the visible portion of air pollution. Cape Town’s Air Quality
Management By-law sets limits on vehicle emissions for compression ignition
engines (i.e. diesel vehicles) and prohibits the use of vehicles that emit dark
smoke, with violations punishable by law.
Roadside diesel vehicle emissions testing is done on a daily basis in partnership
with the city’s Traffic Service, which has helped to reduce failures to meet
emission standards. In the six-month period to December 2015, less than half a
percent of vehicles failed the diesel emission tests, compared with the 17%
failure rate when the city first started doing these tests in 2000.
As part of its efforts to curb air pollution, the city’s Health Directorate also
encourages the public to report excessive smoke emissions from vehicles to the
city’s Air Quality Management Unit.
4.8 Waste management and recycling
Cape Town has strong and effective solid waste management policies and
regulations. The city monitors and enforces standards for proper disposal of waste,
particularly hazardous waste by the industrial sector. In addition, it has a number of
schemes to reduce and recycle waste. As a result, despite the rise in population, the
city’s solid waste generation has decreased from 2.5 million tonnes in 2007 to
2.0 million tonnes in 2015.
Landfill waste minimization efforts have also succeeded, with the percentage of
waste diverted from landfill rising from 4% in 2007 to 12-14% in 2015. In addition,
approximately 18% of total waste is diverted annually through private sector waste
minimization programmes.
In 2014–2015, the city reported reusing over 6.31% of the effluent that passes
through its sewage treatment works, for irrigation and industrial purposes, exceeding
its expectation of reusing approximately 4.75% of all effluent21.
The city has a number of ongoing initiatives and programmes to reduce waste
generation and to encourage recycling by residents and businesses.
21
http://www.timeslive.co.za/local/2015/11/01/Effluent-use-exceeds-City-of-Cape-Towns-expectations

27
Table 4.9 Performance criteria
Performance criteria Volume/value Year of analysis
Source
Recycling rate (percentage diverted from waste stream) 12-15% from landfills 18% direct by private sector
2015 State of Cape Town Report 2016
Volume of solid waste generated 2 million tonnes 2015 State of Cape Town Report 2016
Waste production per tourist night compared to general population waste production per person (kg)
not vailable
% of tourism enterprises separating different types of waste
not vailable
% of total waste recycled per tourist compared to total waste recycled per resident per year
not vailable
% of sewage from the destination treated to at least secondary level prior to discharge
6.3% 2015 City of Cape Town
Key actions and initiatives:
Cape Town has launched the Think Twice programme – a free door-to-door
recycling collection service. It is provided by city-appointed contractors to homes
and businesses in several areas across the city. There are also drop-off points.
The city of Cape Town has placed a Smart Living Handbook on its website,
providing useful information and handy tips to residents to reduce their energy
and water consumption and waste output.
Through its website, the city has also launched IWEX (Integrated Waste
Exchange) – a free online system that enables waste generators and users to
exchange waste materials.
4.9 Landscape and biodiversity protection
Cape Town has strong policies, plans and strategies for the protection, conservation
and management of local biodiversity and landscapes.
In 2009, as part of the Environmental Agenda 2009–2014, the city set itself a target
to conserve 60% of the Biodiversity Network (BioNet) by 2014. The Biodiversity
Network (BioNet) is a spatial representation of all the priority conservation areas
which are needed to meet, or get as close as possible to, national conservation
thresholds.
By December 2014, about 61% of the BioNet had been placed under conservation.
The achievement of the target is remarkable and indicates a commitment to long-
term biodiversity conservation in the city22.
For a number of its conservation projects, the city seeks partners from local industry.
However, it does not currently have a listing of local enterprises in the tourism sector
22
The fine-scale systematic biodiversity plan for the Cape Town metropolitan area (City of Cape Town, 2016a).

28
that actively support its projects and/or have independently initiated any conservation
efforts.
5. Social and cultural perspective
5.1 Attractions
Cape Town was the second city in South Africa (after Johannesburg) to establish an
Arts and Culture Department and the first to create an Arts, Culture and Creative
Industries Policy (2014). It is informed by key strategies and plans for the city such
as the Integrated Development Plan (2013), Cultural Heritage Tourism Strategy and
Action Plan for Cape Town (2010) and the Western Cape Design Strategy (2013),
among others.
Although a comprehensive database of cultural resources and attractions in Cape
Town is currently not available, it is believed that these number well over 100. The
Cultural Heritage Tourism Strategy and Action Plan identified 52 museums or places
of interpretation in the city. These included World Heritage Sites, national institutions,
local authority museums, private museums, community-based museums, museums
belonging to societies or associations or attached to government or tertiary
institutions23.
The city of Cape Town (CoCT), through its Arts and Culture Department, currently
manages 13 Arts & Culture Facilities, of which two are local history museums and
another two are theatres. A total budget of about ZAR 18 million (USD 1.4 million)
(including salaries but excluding capital spend) is allocated to culture. ZAR 13 million
is earmarked for capital investment – building new attractions and investing in
refurbishment and improvement of existing cultural infrastructure. In addition,
ZAR 1.2 million (USD 91,440) is being used for repair and maintenance work, and a
further ZAR 250,000 (USD 19,000) is being spent on the activation of these facilities.
CoCT manages a portion of public monuments (133), of which 30% are estimated to
be in need of conservation interventions.
The City has been running programmes and projects related to arts, culture and the
creative industries for a number of years. These initiatives have been taking place
across a wide range of departments, including those dealing with urban planning,
social development, sports and recreation, parks and forests, library services,
environment and heritage, tourism, economic development, and arts and culture,
among others. However, the full extent of these programmes is still un-documented,
23
Culture and Heritage Tourism Strategy and Action Plan for Cape Town

29
while the methods and benchmarking used to assess impacts are unclear or non-
existent.
Table 5.1 Cultural resources/attractions
Performance criteria Value Year of analysis
Number of cultural resources/attractions (i.e. theme parks, museums, operas, theatres, fairs & local traditions)
13 Arts & Culture Facilities of which 2 are local history museums and 2 are theatres
a
2017
% of municipal budget allocated to culture ± R18 million (US$1.4 million) including salaries but excluding capital spending
2017
Conservation/enhancement of the cultural infrastructure (investment in refurbishing and/or building new attractions)
± R13 million (US$1 million) for capital investment: building new and improving existing infrastructure
2017
% of local heritage in need of improvement 30%b 2017
a Managed by the Arts & Culture Department of the City of Cape Town Municipality
b Refers only to the proportion of public monuments (133) managed by the Arts & Culture Department
Source: Arts & Culture Department, City of Cape Town
5.2 Events
Cape Town hosts a variety of local and international events, from concerts and
cultural festivals to business conferences and international sports tournaments,
attended by more than 2 million people (in 2016), both residents and visitors.
A well-defined 15-year Integrated Events Strategy (2014–2030) for Cape Town and
the Western Cape has been developed to grow the events industry, thereby
maximising the economic, social and environmental benefits that can be realized
from hosting events.
Table 5.2 Performance criteria with regard to events
Performance criteria Value/Response Year of analysis
Source
Emphasis – more on business or leisure events?
Both, with an emphasis on maximizing economic development, social and environmental benefits
-
Events Department, CoCT; Integrated Events Strategy (2014-2030)
National vs. international events? Both. Cape Town aims to position itself as the ‘Events Capital of Africa’
2015-16 Events Department, CoCT
Stability, growth or decline in terms of interest for hosting the events in the city – trend over the past 5 years?
Growth 2017
Cape Town Tourism; City of Cape Town Integrated Annual Report 2015/16
Event visitation trend Year-on-year growth 2017 As above
% of the events that are focused on traditional/local culture and heritage
Not known
Cape Town aims to position itself as the ‘Events Capital of Africa’. The past five
years have seen growing interest among organizers for hosting events – local,
national and international – in the city.
30
Cape Town Tourism provided promotional support and tourism services to a total of
1,215 events in the 2015/16 financial year, an increase of 102% year-on-year. About
106 major events were supported by the city, compared to 80 in 2014/15 – 39 were
international events, up from 32 in the previous year.
Event visitation trends over the past several years indicate continued growth of
business and leisure events held in Cape Town.
The Africa Travel Week, comprising three co-located events of World Travel
Market (WTM) Africa, ibtm Africa and International Luxury Travel Market (ILTM)
Africa, is held at the Cape Town International Convention Centre. The number of
attendees increased by 25% in 2016 over the previous year, hailing from 47
countries around the world.
The Cape Town International Jazz Festival is an annual music festival. It is
recognised as the fourth largest jazz festival in the world and the largest jazz
festival on the African continent. The festival has grown since it first started in
2000, with attendance rising from 14,000 concert-goers to over 50,000 in 2016.
The Two Oceans Marathon is a 56-kilometre / 35-mile ultra-marathon and a
21-kilometre half-marathon held annually in Cape Town, on the Saturday of the
Easter weekend. Known globally as “the world’s most beautiful marathon”, the
race is run against a backdrop of spectacular scenery through the Cape
Peninsula. Participation in the race has risen from 20,000 in 2010 to over 33,000
in 2015.
5.3 Community attitudes
As indicated earlier, the city of Cape Town undertakes an annual Community
Satisfaction Survey. It uses independent research to measure resident perception
and satisfaction with the city’s performance, in order to enhance service delivery and
to guide operational planning and implementation. The total sample size for the
survey is 3,000.
Performance in local tourism is measured on three aspects, with scores showing
steady improvement in residents’ satisfaction over the past three years.
Table 5.3 Community attitudes towards tourism
Performance criteria Value/Response Year of
analysis
Analysis of community attitudes towards tourism not available
% of residents that are satisfied with the impact of tourism on the destination’s identity
Rating on 5-point scale: 2.6 Scale: 5 is excellent, 1 is poor)
2013-14a
Number of tourists/visitors per 100 residents Refer to Section 4.2 Density
Number of beds available in commercial accommodation establishments per 100 residents
1.2 (2 if Airbnb is included) 2017b
Sources: a Annual Community Satisfaction Survey, City of Cape Town;
b Cape Town Tourism
31
Table 5.4 Resident satisfaction with local tourism, 2013–14
Indicator 2010/11 2011/12 2012/13 2013/14
There being tourism infrastructure in your area such as tourist attractions, tourism signage, etc.
2.4 2.2 2.4 2.6
The extent to which you benefit from tourism in Cape Town 2.4 2.2 2.3 2.6
There being tourism services in your area such as a tourism information office, restaurants, etc.
2.3 2.2 2.3 2.6
Overall performance 2.4 2.2 2.3 2.6
Source: City of Cape Town; rating on a 5-point rating scale - 1=Poor, 2=Fair, 3=Good, 4=Very good, 5=Excellent
The total number of beds available in commercial accommodation establishments in
Cape Town is 50,000. In addition, Airbnb accommodation provides another 15,000
beds. The number of beds available in commercial accommodation establishments
per 100 residents is calculated as 1.2 (2.0 if Airbnb accommodation is included). This
figure is comparable to cities in Poland (1.3) and Greece (1.7)24.
5.4 Community engagement
Although data on the percentage of the population that participates in community
engagement programmes in Cape Town is not available, it is noteworthy that a fairly
large percentage of the population does engage with the City of Cape Town when it
invites public comment and feedback on policies, strategies and initiatives that affect
the residents of the city.
As an example, in the process of developing the Integrated Development Plan,
approximately 1 million people were involved in the extensive public participation
process, equivalent to about 25% of the local population.
While data on the percentage of employees in direct tourism employment who are
local is not available, it is understood that there were over 54,000 people employed
in the tourism sector (38,838 in permanent jobs and 15,489 in temporary jobs) in
2015, up from an estimated 49,000 in 201425.
5.5 Gender equality
Data on the gender distribution of employees in the tourism sector in Cape Town is
not available. Neither are there any statistics on the positions occupied by men and
women in the industry. However, as an indication, at the national level,
approximately 62% of jobs in the tourism sector are occupied by women, significantly
higher than the proportion of jobs occupied by women (45%) in the overall economy.
24
Source: Urban Europe — statistics on cities, towns and suburbs, 2014 25
http://www.capetown.travel/trade-media/tm-news/media-news/cape-town-tourism-2015-review-final-figures-encouraging-despite-challenges

32
5.6 Inclusion
Table 5.5 Performance criteria regarding corporate commitment to universal accessibility
Performance criteria Value/Response Year of analysis
% of businesses that have a budget for accessibility improvements
not available
% of rooms in commercial accommodation establishments accessible for people with disabilities
17% of total graded rooms 2017a
% of commercial accommodation establishments participating in recognized accessibility information schemes
2% of total graded establishments 2017a
% of public transport that is accessible to people with disabilities and specific access requirements
Currently only the My City Bus makes provision for Universal Access, but specific information is not available
2017b
% of tourist attractions that are accessible to people with disabilities and/or participate in recognized accessibility information schemes
Some information is available online 2017c
Sources: a Tourism Grading Council of South Africa;
b City of Cape Town,
c Universal Accessibility website
According to the South Africa National Grading Scheme, 2% of all graded
establishments (629) and 17% of all graded rooms (14,183) in Cape Town have
‘universal accessibility’ features. These figures are below national levels, but higher
than for the Western Cape province overall.
The city of Cape Town has a Universal Accessibility website (www.ctuat.co.za) that
provides information to visitors on various tourism attractions and services that have
accessibility features/facilities for people with disabilities and specific access
requirements. The information is submitted on a voluntary basis by the tourism
industry. The website has a total listing of 67 tourism enterprises in Cape Town, of
which 22 are listed under the category ‘attractions’ (includes nature reserves).
In terms of public transport, currently only the My City Bus makes provision for
universal access. However, further specific information is not available at present.
5.7 Safety and security
Safety and security are issues of continued importance in Cape Town in connection
with tourism development, as crimes against foreign visitors have an adverse effect
on visitor perception and can lead to a decrease in the number of arrivals.
Cape Town has been exceedingly vigilant since crime in the area received a bad
press before the 2010 FIFA World Cup. Public safety measures have been bolstered
with increased visible policing and installation of CCTV cameras throughout the city.
The majority of violent crime is seen in townships and impoverished areas of the city.
Most tourist areas are well protected and fairly safe. The bigger malls, central
business district, national landmarks and visitor hotspots have enhanced safety
measures in place. Security at major events and festivals is also beefed up to ensure
the safety of visitors and residents.
33
According to data provided by South Africa Police Service (SAPS), the rate of crime
against tourists in the Central Business District of Cape Town, one of the main tourist
areas, has been stable over the past months. In December 2016 and again in
January 2017, 19 crimes were reported. . Data on the overall percentage of tourists
who register a complaint with the police is not readily available.
Data on the seasonality of crime is not available, although it is generally true that the
incidence of crime is higher occurring in the high tourist season and during major
events and festivals that attract a large number of people.
Table 5.6 Incidence of crime
Performance criteria Value/response Year of
analysis
Comparison of the crime rates between the high and the low season periods
Higher incidence in high season, but specific data is not available
–
Comparison of the crime rates between the tourist centers and remaining parts of the city
Tourism centres well protected, with lower crime rates, but specific data is not available
–
Number of tourists who register a complaint with the police
19 in December 2016; 19 in January 2017
2016-2017
Source: South Africa Police Service (SAPS); Western Cape Dept. of Tourism Growth and Development
Mention must be made of the Tourism Safety and Support Programme (TSSP)
initiated under the aegis of the Western Cape Government’s Department of Tourism
Growth and Development. It is the only province in South Africa with such a
programme.
The TSSP is an aftercare service offering practical and emotional support and
assistance to foreign tourists in distress. The programme has a proactive
communication component to assist in preventing crime against tourists, and
reactive response procedures to any incident or crisis that may affect the tourism
industry.
The TSSP is activated when a crime, accident or health issue involving tourists is
brought to the attention of its team by the police or the tourism sector
(accommodations, attractions). The TSSP team then helps tourists by providing
services such as: medical and emotional support, including facilitating medical
treatment, help with contacting family or friends, advise on short-term, temporary
accommodation, facilitating counselling, facilitating embassy contact in case of lost
passports and visas, etc.
Between November 2016 and January 2017, a total of 21 incidents were referred to
the TSSP unit by the police and the accommodation sector in Cape Town.
The indications are that Cape Town’s various measures to improve and bolster
safety and security in the city are having a positive impact on visitor perceptions and
satisfaction levels. According to Cape Town Tourism’s Visitor Satisfaction Survey
(April-September 2015), over two-thirds (69%) of the visitors were very satisfied or

34
satisfied, 20% were neither satisfied nor dissatisfied and only one-tenth (11%) were
dissatisfied or very dissatisfied with their personal safety and security during their
visit to Cape Town.
5.8 Authenticity
Cape Town Tourism (CTT) is actively promoting neighbourhood tourism, in response
to the growing trend of “travelling like a local” among many global travellers. CTT
provides neighbourhood guides to different areas of the city, with “where to eat, play
and stay” recommendations. It has recently launched the ‘Love Cape Town
Neighbourhoods’ Video Series, as a way to help people explore the city’s most
popular neighbourhoods through the eyes of local residents. Further details on the
campaign are presented in the Showcase section of this report.
Cape Town’s natural and cultural heritage provides a rich and diverse resource base
for authentic tourist experiences. Cape Town’s beauty and diversity extends to its
culinary gastronomy, reflecting its multicultural, ‘melting pot’ community. The Mother
City is known as one of the world’s finest culinary capitals, and has been awarded a
number of international awards such as the Conde Nast Readers’ Travel Awards
2016 for Best Overseas City for Restaurants & Bars, and the Reader’s Choice Award
as the number one food city in the world for 2016
Cape Town is also famous for its wine industry, with the Constantia Valley, located
just 15 minutes from the city centre, being known as the local cradle of the wine
industry, with a wine-making history dating back to the 17th century. Other popular
tourist attractions include the Durbanville and Helderberg wine routes that are also
located in the Cape Town Metropole.
Cape Town’s various tourism products are promoted extensively by CTT and its
industry partners, especially itineraries that focus on authentic and immersive
experiences. CTT actively promotes the city’s gastronomy, and has produced a
listing of the top 50 restaurants in Cape Town “that locals love”. Tours to local wine
estates, with gourmet food and wine tasting experiences, are actively promoted by
CTT and the local tourism industry, promising an authentic experience for visitors.
For a deeper dive into local culture and traditions, a number of immersive tourism
products, such as cooking safaris, township gospel tours, cultural city walking tours,
etc., are promoted by local tour operators and ably supported by CTT. As an
example, local tour company Andulela (http://andulela.com) specializes in interactive
travel experiences that introduce participants to authentic cultural experiences in
Cape Town, with hands-on participation (e.g. cooking, music, arts, crafts) involving
local communities and families.
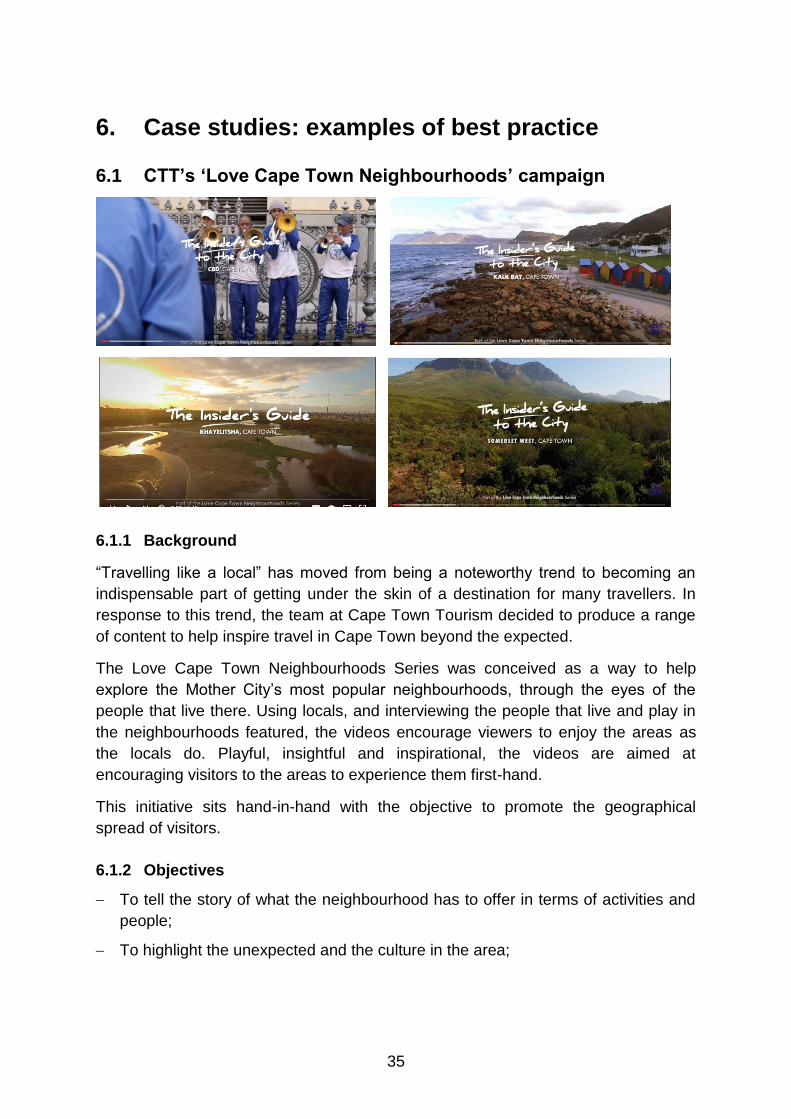
35
6. Case studies: examples of best practice
6.1 CTT’s ‘Love Cape Town Neighbourhoods’ campaign
6.1.1 Background
“Travelling like a local” has moved from being a noteworthy trend to becoming an
indispensable part of getting under the skin of a destination for many travellers. In
response to this trend, the team at Cape Town Tourism decided to produce a range
of content to help inspire travel in Cape Town beyond the expected.
The Love Cape Town Neighbourhoods Series was conceived as a way to help
explore the Mother City’s most popular neighbourhoods, through the eyes of the
people that live there. Using locals, and interviewing the people that live and play in
the neighbourhoods featured, the videos encourage viewers to enjoy the areas as
the locals do. Playful, insightful and inspirational, the videos are aimed at
encouraging visitors to the areas to experience them first-hand.
This initiative sits hand-in-hand with the objective to promote the geographical
spread of visitors.
6.1.2 Objectives
To tell the story of what the neighbourhood has to offer in terms of activities and
people;
To highlight the unexpected and the culture in the area;

36
To get visitors into the neighbourhood and make use of the experiences and
products there;
To engage with an audience and inspire them to travel like a local.
6.1.3 Key content
Interviews with 4–5 local business owners/influencers/residents in the
neighbourhood that offer insight and background into what there is to do in the
area;
Venues/products featured to indicate getting away from the expected and delving
into the heart of the area – the focus is on arts and culture, food and lifestyle;
Cape Town Tourism members that fit the storyline taken into account;
Love Cape Town Neighbourhood Series branding. 6.1.4 Promotional tactics
Each video series includes standard content and specific content during the
promotion month when the neighbourhood is being featured.
Standard content: Video – 2 minute and 30 second cut downs; Itinerary; ‘Insider’s
Guide’ article; Visitors Guide feature (Cape Town Tourism’s annual guide). All of
these are housed on the Love Cape Town website (www.capetown.travel), and links
through to the city areas.
Monthly activation: During the promotional month, various marketing tactics are
implemented, depending on the opportunities presented by each neighbourhood.
These include:
Social media
Facebook; Twitter; YouTube; Instagram;
Behind-the-scenes promotion while shooting the video prior to the promotional
month;
Video, 30” video cut-downs, article and imagery promoted posts;
Highlighting individuals behind the featured experiences and businesses.
Strategic placements
Airlines: South African Airways featuring videos on board;
Estate agencies: Greeff featuring videos for promotional purposes;
PR & media
Media pitching to targeted community media;
Building the itinerary into media hosting opportunities;
Identify speaking opportunities for promotion.
Love Cape Town Campaign
37
Inclusion in Cape Town Tourism’s annual seasonality campaign.
Events
Events profiled on the Love Cape Town website;
Thando mobile Visitor Information Centre (VIC) sent to selected events.
Visitor Information Centres
Video shown on the VIC screens across the metropolis.
Responsible tourism
Member outreach – identify a community outreach partner to promote during
this month and look at making membership accessible to them for the year.
6.1.5 Outcome and impact
A total of seven videos were produced in 2016 and a further five are planned for
2017. The Love Cape Town Neighbourhoods videos have received extensive press
coverage and positive feedback from the industry, communities, residents and
visitors, achieving a collective total of over 120,000 views already.
More significantly, the videos have evoked spontaneous and very positive qualitative
responses from viewers:
“Really love this new, more personal approach, it captures the mood of the
city very well.”
“A fresh perspective, and it’s great!”
“Cape Town seems to be a beautiful city. My dream vacation is to go to South
Africa, visit Cape Town & of course, see & photograph all of the wonderful
people...”
“Loved this well done upbeat, positive video on an interesting, creative, and
positive Cape Town neighbourhood.”

38
6.2 The V&A Waterfront
Image: V&A Waterfront
6.2.1 Introduction
Established in 1988, the V&A Waterfront (Victor & Arthur) is one of Africa’s most
visited destinations with 25 million visitors annually. It is situated in the oldest
working harbour in the southern hemisphere, with Table Mountain as its backdrop
and extensive views of the ocean.
The V&A Waterfront forms not only a part of South Africa’s historical legacy, but also
an integral part of the country as a whole. As a social, economic and environmentally
committed business, it is built around creating and fostering opportunities for the
citizens of this country – whether that be the blue chip businesses or the small-scale
entrepreneurs who call the V&A Waterfront home.

39
A mixed-use development, the V&A Waterfront covers 300 acres, comprising
residential and commercial property, hotels, retail, dining, leisure and entertainment
facilities for both local and international visitors. Along with heritage sites and tourism
landmarks, it also includes hotels, retail precincts, residential units, corporate offices,
markets and, soon, the Zeitz MOCCA museum – hosting the world’ largest collection
of contemporary art from Africa and its diaspora.
Some 21,800 people work at V&A every day, 1,500 people live there and 180,000
visitors come to V&A every day in peak season. Apart from the onsite employees,
over 17,500 indirect employees rely on the V&A for their livelihood.
Over the past 12 years, the V&A has contributed ZAR 335 billion (USD 25.8 billion)
to the South African economy.
6.2.2 A holistic approach to sustainability
The V&A vision is to be recognized as a premier destination for responsible tourism
and a leading city for good sustainability practices.
It is managed as a professional and environmentally conscious business,
acknowledging the impact that its operations may have on the environment. Its
holistic approach to sustainability entails having the right products/equipment,
systems and processes that collectively add up to a premier tourism destination that
benefits visitors and the communities in and around the V&A Waterfront.
6.2.3 Sustainability practices
Since 2008, the V&A has invested ZAR 58 million (USD 4.3 million) in energy
efficiency, water savings and waste recycling. The shareholders have embarked on
a programme to green the property in order for the entire operation to be
environmentally sustainable, improve efficiencies and save costs. This includes
efforts on several fronts such as:
Design and construction
Purchasing and procurement
Transport and vehicle maintenance
Biodiversity management
Resource management (water, electricity, gas, waste, etc.)
Community involvement, and many more.
Some of the measures undertaken include the following:
Transport infrastructure: in order to reduce vehicle traffic, reduce carbon footprint
and encourage use of public transport, the V&A has implemented several measures:

40
Reduced the vehicle fleet from 50 to 26 and purchased 16 bicycles for security
and parking;
Public bicycle and motorbike facilities have been provided, with dedicated bicycle
lanes, installation of bicycle racks and parking facilities for motorbikes;
Access to various means of public transport has been made available, such as
sedan taxis, MyCiti bus service (rapid bus transport system), Golden Arrow bus
service and water taxis.
Landscaping: Biodiversity management includes extensive use of indigenous
plants, planting 1,450 trees and the introduction of drip-feed irrigation to reduce
water consumption and wastage.
Resource management: Several measures have been implemented to reduce
water, electricity, gas and waste usage. These include:
Water-efficient toilets and urinals, water sensor taps in all bathrooms, drip
irrigation and variable irrigation times.
A waste minimization and recycling drive to reduce the amount of waste going to
landfills. Tenants were incentivized to reduce waste at source by introducing new
waste tariff structures.
Changes have been made to electricity tariffs, power, lighting and temperature
control. Solar panels have been installed on nine rooftops for harnessing solar
energy.
Extensive use of natural light in the shopping districts, with all lights in the main
shopping centre remaining off during the day. Where possible, buildings are not
lit at night.
Installation of LED lighting in the buildings. Education programme for shopping
centre tenants encourages them to refurbish and retrofit their premises with
energy saving LED lighting, wherever possible.
Use of seawater cooling systems and installation of new generation air-
conditioning units (district cooling) to save on energy consumption
Green buildings: A number of buildings on the premises meet the specifications of
the Green Building Council of South Africa, with several achieving four-star ‘existing
building’ ratings.
Since 2012, the V&A has introduced an environmental rating system to measure and
monitor its performance on environmental practices that it follows, and to
consistently introduce new innovative products and processes to improve its
performance ratings.

41
Visitors to the V&A are also encouraged to participate in its green ethics. Recycling
bins have been located throughout the property and visitors are encouraged to go
‘car-free’ and use bicycles. The V&A Waterfront Operations Team has also reduced
vehicle patrols by increasing bicycle patrols instead.
The V&A is also committed to enterprise development, through the establishment of
the Watershed Centre for craft, art, design and fashion from the African continent on
its premises. The craft market houses 150 small-scale craftsmen, providing them
with the space and training (and access to visitors) to become successful and
sustainable businesses.
The V&A has also put in place a number of social responsibility initiatives.
6.2.4 Outcome and impact
The reduction of V&A’s own vehicle fleet has contributed to an overall reduction
in carbon emissions saving of 20,083 tCO2e.
The drip feed irrigation systems have reduced water consumption by 60%
compared to the previous watering system.
Over 40% of waste is being recycled, preventing almost 12,000 tons of waste per
annum going into landfills.
There was a 25% saving in water consumption in 2016 over 2010’s level.
There has been a saving of 9000 kl per month or ZAR 1.5 million/year thanks to
the adoption of seawater cooling systems.
A 25% saving in electricity has been achieved by migrating from independent
chiller plants to district cooling.
9 rooftops fitted with solar panels currently produce 1 million megawatt hours of
energy a year.
There is an overall energy saving of 16% of total consumption or an additional
ZAR 11.6 million/year, using 2008/09 as the base year.
There has been a carbon footprint reduction of almost 34,000 metric tons of
carbon over four years.
Significantly, the total number of jobs created by the V&A (and its tenants) has
increased by 57% since 2002. However, the continued development of the V&A
contributes significantly to the creation of jobs – current projects in progress are
expected to create an additional 19,000 jobs nationally by 2026.

42
6.2.5 Awards and accolades
The V&A Waterfront remains one of the most visited destinations in South Africa. It is
consistently voted in the top ten tourism destinations in the world, and is the recipient
of the prestigious World Responsible Travel: Best Destination Responsible Tourism
Award (2014). Some of its other awards and accolades include:
Platinum Heritage Environmental Certification (2015, 2016);
Green Building Council of South Africa: 4-Star ‘Existing Building’ Ratings (2015);
No.5 Silo was awarded a six-star design rating in February 2017. West Quay
building block A & B was awarded a four-star existing building rating during 20;
The V&A Wharf Shopping Centre and merchant house buildings were both
awarded a four-star existing building rating during 2014;
Lilizela Awards: Best Single Resource Management Programme – Water (2013);
Energy (2013 & 2014);
Energy Efficiency Award: 2012 Energy Efficiency Forum Awards for Commercial
Buildings.
6.3 Hotel Verde
Image: Hotel Verde
6.3.1 Introduction
Hotel Verde is widely acknowledged as South Africa’s greenest hotel and the first
hotel in Africa to offer carbon-neutral accommodation and conference facilities.
43
Operating since 2013, Hotel Verde is a four-star hotel located 400 metres from Cape
Town International Airport. Home to 145 rooms and seven conference venues, the
hotel offers sustainability, luxury and convenience as one. The hotel is 100% carbon
neutral, and approximately 70% more efficient than a standard Cape Town hotel with
a renewable energy generation of 10% of total consumption.
6.3.2 Approach to sustainability
From the beginning of the project, it was the desire of owners Mario and Annemarie
Delicio, as well as the project team, to build a hotel that would lead the way for other
new and existing hotels to be built and operated in a sustainable and energy efficient
manner. More than 10% of total investment in the construction of Hotel Verde was
allocated to the sustainable interventions at the hotel.
Hotel Verde’s business model is based on the theory of “thrivability”, which
encompasses people, profit and the planet. As such, it was not only designed from
below the ground up to be as ecological as possible, but it also drives this concept
through daily operational practices and decisions including that of waste
management, the procurement chain and staff training.
6.3.3 Sustainability features and practices
Hotel Verde has a vast number of sustainable building features and resource
management processes in place, which include:
Vertical axis wind turbines;
Photovoltaic (PV) panels;
Energy generating gym equipment;
Elevators with regenerative braking;
Intelligent Building Management System;
Energy-efficient HVAC system using geothermal ground loops coupled with
heat pumps for central heating/cooling and domestic hot water;
Energy and/or water efficient equipment – Energy Star certified;
Water metering to enable monitoring and leak detection;
Motion/occupancy controlled lighting;
Main power isolation switch to each bedroom, office and meeting room;
Demand-controlled ventilation to bedrooms;
Grey water recycling plant; rainwater and subsoil drainage water harvesting;
Small urban farming setup/Aquaponics;
Recycling and Bokashi composting are.

44
6.3.4 Biodiversity
Hotel Verde has proactively supported biodiversity conservation in the city through
its intervention and management of the wetland adjoining its site.
The natural vegetation of the wetland adjacent to Hotel Verde is Cape Lowland
Freshwater Wetland. Prior to the hotel’s intervention, the wetland was slowly
degrading due to carelessly discarded refuse, rubble and copious amounts of
packaging and dust brought in by strong south-easterly winds.
Hotel Verde took on the task of managing the wetland from the city of Cape Town. It
is now well maintained, cleaned, landscaped and beautified on an ongoing basis.
The area is a green lung in the airport industrial precinct for all passers-by or hotel
guests to enjoy. The wetland now boasts over 100 types of indigenous plants, an
eco-trail, eco-pool, outdoor gym and two beehives housing over 60,000 Cape Honey
bees.
6.3.5 Carbon offsetting programme
Hotel Verde has adopted a socially responsible, carbon-neutral programme – the
first Hotel Carbon Management Initiative (HCMI) implementation of its kind in Africa.
Partnering with impactChoice, provider of end-to-end environmental sustainability
solutions, the hotel offers guests and conference delegates a guilt-free carbon-
neutral stay, by offsetting their carbon emissions via responsible carbon
capturing/reduction projects. Guests are incentivized for their sustainable behaviour
during their stay with ‘Verdinos’, the hotel’s in-house currency that can be redeemed
at the bar, used towards their bill or donated to charity.
6.3.6 Weekly Earth Hour
Hotel Verde hosts a Weekly Earth Hour every Wednesday night. All non-essential
equipment and lights are switched off, food is prepared without the use of electricity
and candle-lit dinners are served to guests. For International Earth Hour, the hotel
holds a night market showcasing local crafts and produce.
6.3.7 Staff training
All employees at Hotel Verde receive induction training, not just on their role, but
also on all of the sustainability initiatives. The hotel ensures that all employees are
well versed in the key elements of sustainability in the hotel in order to correctly and
enthusiastically communicate with guests on all the sustainable touch points in the
hotel.

45
In 2014, the hotel created a training programme called Avanti, which means “moving
forward” in Italian, with the aim to empower, educate and train employees through
awareness and event participation, and to help the hotel to improve environmental
savings through behavioural change and incentivizing employees through
departmental competitions and team building.
6.3.8 Environmental Committee
All heads of department form part of the hotel Green Team to monitor sustainability
performance within departments and in the hotel overall. The team meets monthly to
discuss and report on the latest performance and consumption statistics, assess
progress and provide feedback. Sustainability goals and targets are then created,
and new ideas are brought forward for implementation. All of this information is then
used for Avanti training purposes.
6.3.9 Education and awareness
The hotel encourages its guests to get
involved through many interfaces within
the operation of the hotel. Strategic
signage has been placed throughout the
building, offering guests a further point of
learning about the many sustainable
interventions at the hotel. Some signs
encourage the use of stairs while the
gyms’ signature “What the Watt” signage
engages guests with the concept of how
difficult it is to generate electricity versus
how easy it is to squander it. Image source: Hotel Verde
In addition, information is made available on the in-house televisions through the
sustainability channel, which pulls figures from the Building Management System to
illustrate resource consumption and avoidance, as well as the savings of the hotel to
its guests.
6.3.10 Local Community Support
Hotel Verde also cares deeply about the livelihoods and life chances of the people of
Cape Town. Quirky graffiti art in the parking basement and mosaic, applique and
wire art adorning corridors and walls are all products of collaboration between the
property and local learners and artists. Human resources are nurtured through an
internship programme and facility tours for learners, focusing on sustainable living

46
and careers in hospitality. Visiting schools are gifted a voucher for fundraising
purposes.
6.3.11 Outcome and impact
The successful operation of Hotel Verde demonstrates the commercial viability and
profitable returns on investment achievable in a sustainable project, even though
there are many benefits that are difficult to quantify.
Efficient and effective building, systems and equipment during design and installation
helped to avoid unnecessary capital expenditure at the construction stage.
Operational cost savings have also been realized, for example by installing efficient
and effective lighting, lighting controls, water-saving fittings and harnessing solar
panels.
Water and sewerage saving interventions have resulted in average monthly
savings of ZAR 31,387;
Energy-saving interventions have resulted in average monthly savings of
ZAR 126,546;
Total carbon offset by Hotel Verde for 2014/15 was 946.14 metric tonnes of
CO2e, which is equal to just over 5.3 million kilograms of coal burned.
One of the major outcomes of Hotel Verde’s sustainable business practices has
been the health and well-being improvement of the hotel’s employees due to
enhanced environmental quality and leading sustainable lifestyles. This, in turn, has
led to increased productivity and reduced absenteeism.
Since inception, Hotel Verde has garnered a significant amount of free media
exposure, valued at over ZAR 21 million. While this amount would not necessarily
have been spent by the hotel, it creates recognition of the Verde brand and directly
increases word of mouth, room nights and revenue.
6.3.12 Awards and accolades
Hotel Verde has brought a number of proud firsts to the South African and African
hospitality market.
First hotel in Africa to be certified with LEED Platinum for New Construction;
First hotel in Africa to offer accommodation and conferencing that is 100% carbon
neutral;
LEED Platinum for Existing Building Operation and Maintenance in 2015, making
it the first hotel globally to have double LEED Platinum certification;

47
Six-star rating from the Green Building Council of South Africa for the Green Star
SA Existing Buildings;
World Responsible Tourism Award for Best City Hotel (2014);
Green Hotelier Award for Africa and the Middle East – winner (2015)
Fair Trade Tourism Certified Business (2017); and several more local and global
awards and certifications

48
Acknowledgements
UNTWO and WTCF would like to thank all the individuals who contributed their time
for personal interviews with our tourism expert, and/or provided valuable information
for the development of this report:
Alison Davison, Head of Waste Minimisation, Solid Waste Management Department, City of Cape Town
Chantelle Cole, Executive Manager, Strategic Projects and Brand, V&A Waterfront, Cape Town
Colin Devenish, Executive Manager Operations, V&A Waterfront, Cape Town
Cynthia Jonas, Project Manager Tourism Department, City of Cape Town
Enver Duminy, Chief Executive Officer, Cape Town Tourism
Lindy Meiring, General Manager, Hotel Verde, Cape Town
Lizanda van Rensburg, Professional Officer, Sustainable Energy Markets Department, Energy & Climate Change, City of Cape Town
Louise Ing, Head of Cultural Spaces, Arts & Culture Branch, Social Development and ECD Department, Social Services Directorate, City of Cape Town
Madeleine Mitchell, Acting Deputy Director, Tourism Growth and Development, Chief Directorate, Economic Sector Support, Department of Economic Development and Tourism, Western Cape Government
Mariaan Opperman, Head of Events, Directorate, Tourism, Events and Marketing, City of Cape Town
Marisah Nieuwoudt, Research Manager, Cape Town Tourism
Markus Jordaan, Quality Protection Officer, Tourism Grading Council of South Africa
Monique Le Roux, Owner, Andulela Experience, Cape Town
Ntlotleng Manale, Marketing Manager, Fair Trade in Tourism South Africa
Pauline van der Spuy, Head of Strategic Tourism Infrastructure Development, City of Cape Town

49
Bibliography
Cape Town Energy and Climate Change Programme. Energy2040 Vision and Energy and Climate Action Plan (n.d.), (online), available at: www.c40.org (07-03-2017)
Cape Town Tourism and Horwath HTL (2016), Cape Town Accommodation Performance Review & Forecast Report, CTT, Cape Town
Cape Town Tourism 2015 Review. Final Figures Encouraging Despite Challenges (2017), (online), available at: www.capetown.travel (07-03-2017)
City’s efforts to cultivate a cycling culture in Cape Town under discussion at Mobility Indaba (2016), (online), available at: www.tct.gov.za (14-03-2017)
City Health Department, City of Cape Town (2005), Air Quality Management Plan for the City of Cape Town, CoCT, Cape Town
City of Cape Town (2016), Five-Year Integrated Development Plan 2012–2017; 2016/17 Review and Amendments, CoCT, Cape Town
City of Cape Town (2016), Integrated Annual Report 2015/16, CoCT, Cape Town
City of Cape Town (2015), State of Energy Report, CoCT, Cape Town
City of Cape Town (2015), City of Cape Town Tree Management Policy Review, CoCT, Cape Town
City of Cape Town (2014), Arts, Culture and Creative Industries Policy, CoCT, Cape Town
City of Cape Town (2013), Tourism Development Framework 2013 – 2017 for the City of Cape Town, CoCT, Cape Town
City of Cape Town (2012), Cape Town Spatial Development Framework Statutory Report, CoCT, Cape Town
City of Cape Town (2012), State of the Environment Report, CoCT, Cape Town
City of Cape Town (2011), Cape Town 2011 State of Energy and Energy Futures Report, CoCT, Cape Town
City of Cape Town and Sustainable Energy Africa NPC (2011), Cape Town’s Action Plan for Energy and Climate Change, CoCT, Cape Town.
City of Cape Town (2009), City of Cape Town Environmental Agenda 2009 - 2014, CoCT, Cape Town
City of Cape Town (2009), City of Cape Town Responsible Tourism Policy, CoCT, Cape Town
Department of the Premier, Western Cape Government (2014), The Cape of Great Events: Strategy Summary for 2014-2030, WCG, Cape Town

50
DI & GIS Department, City of Cape Town (2016), State of Cape Town Report 2016 – Overview with infographics, CoCT, Cape Town
DI & GIS Department, City of Cape Town (2015), Domestic Day Trips to the Western Cape and Cape Town in 2011, CoCT, Cape Town
Edge Tourism Solutions (2010), Culture and Heritage Tourism Strategy and Action Plan for Cape Town, ETS, Cape Town
Effluent use exceeds City of Cape Town’s expectations (2015), (online), available at: www.timeslive.co.za (20-03-2017)
Eurostat (2016), ‘Tourism and culture in cities’, Urban Europe — statistics on cities, towns and suburbs (electronic database), available at: http://ec.europa.eu (13-03-2017)
Grant Thornton (2016), Research on the Monitoring of Trends in Economic Value of Tourism in Cape Town, Grant Thornton, South Africa
Grant Thornton (2015), Research on the Monitoring of Trends in Economic Value of Tourism in Cape Town, Grant Thornton, South Africa, p.25
Rooney, C. (2016), ‘Tourism energizes South Africa’s job market’, World Bank [electronic], available at: http://blogs.worldbank.org (11-03-2017)
Statistics South Africa (2017), Domestic Tourism Survey 2015, SSA, Pretoria
Transport Planning Department, Transport and Urban Development Authority (2017), Draft Cycling Strategy for the City of Cape Town, TDA, Cape Town
Transport for Cape Town (2015), Comprehensive Integrated Transport Plan 2013-2018 - 2015 Review, TCT, Cape Town
Top Related
Copyright © 2022 FDOKUMEN

