


Bahasa
Halaman
Hukum


Bill Sikes and The Beano Offender Literacy: the facts and the fictions
Dr Michael Rice University of Cambridge Institute of Criminology
A LUMNI WEEKEND
2 010
Offender literacy: the historical assumptions
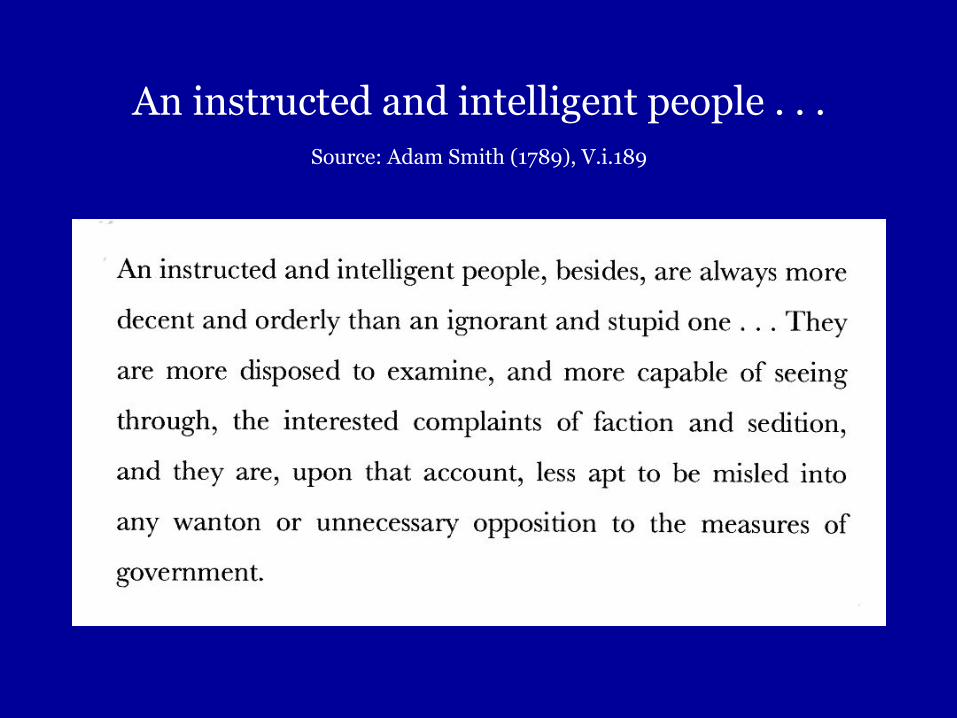
An instructed and intelligent people . . . Source: Adam Smith (1789), V.i.189
0
500
1000
1500
2000
2500
3000
3500
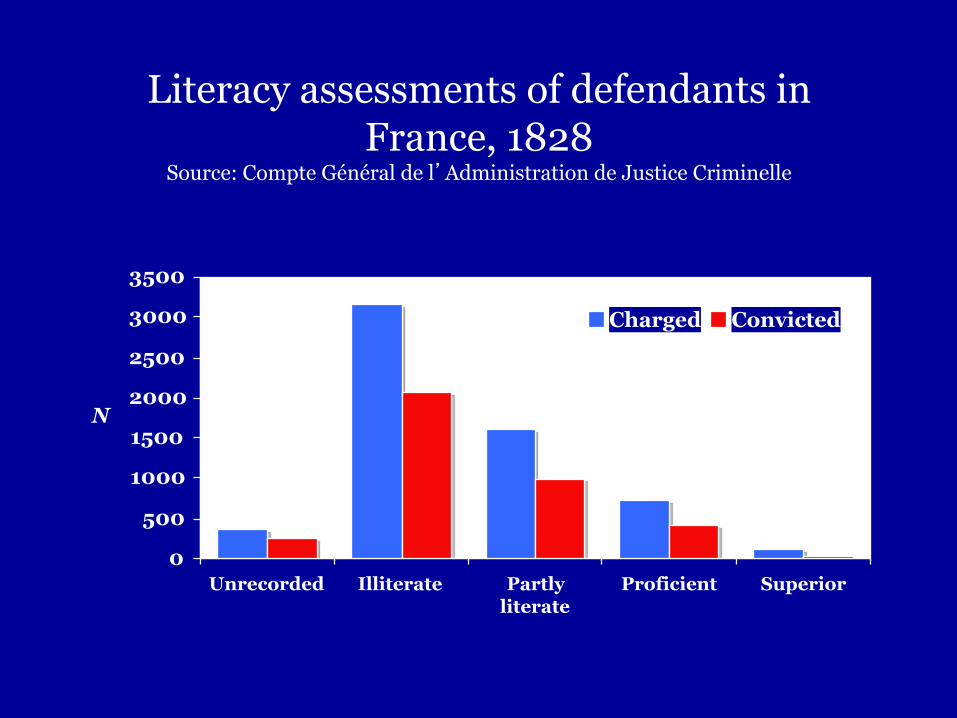
Unrecorded Illiterate Partlyliterate
Proficient Superior
N
Charged Convicted
Literacy assessments of defendants in France, 1828
Source: Compte Général de l’Administration de Justice Criminelle
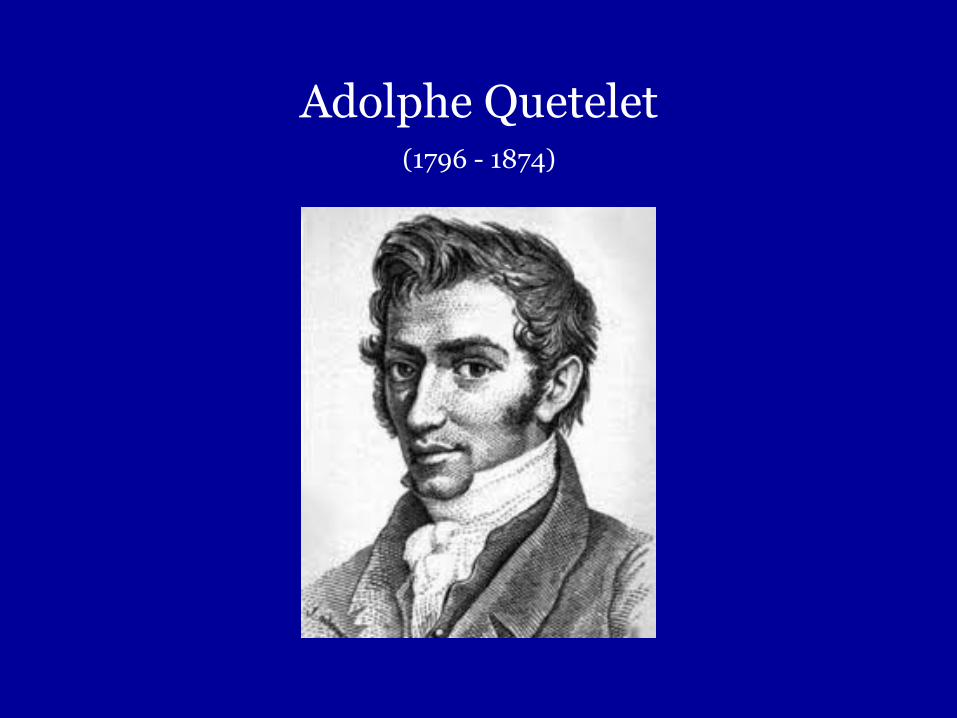
Adolphe Quetelet (1796 - 1874)

Offender literacy: what do we know (and is it knowledge)?
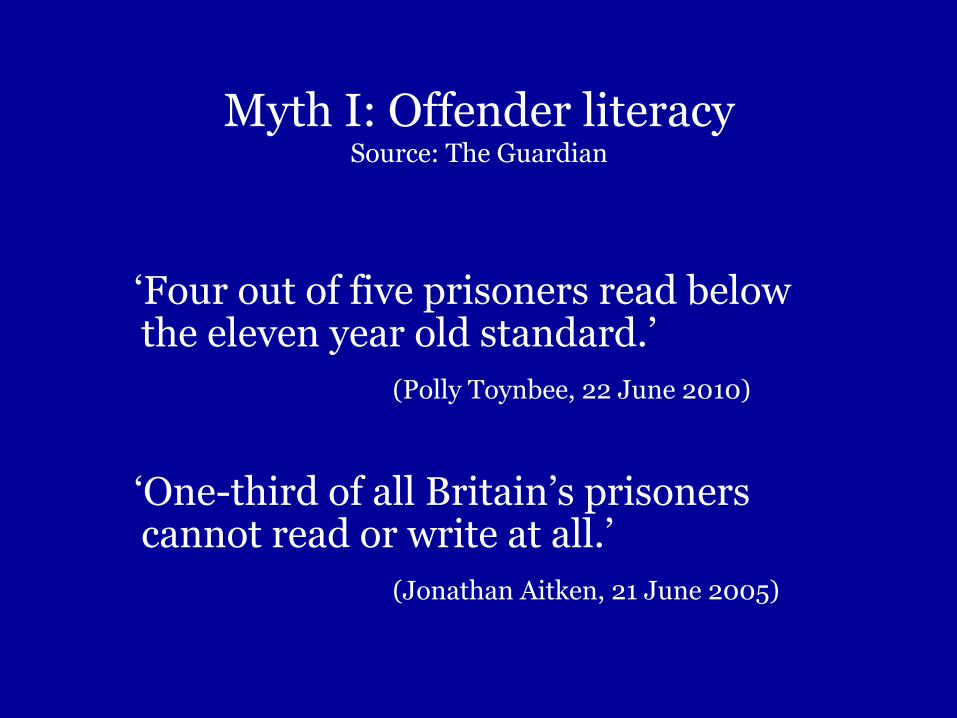
Myth I: Offender literacy Source: The Guardian
‘Four out of five prisoners read below the eleven year old standard.’
(Polly Toynbee, 22 June 2010)
‘One-third of all Britain’s prisoners
cannot read or write at all.’ (Jonathan Aitken, 21 June 2005)

The International Adult Literacy Survey 1996
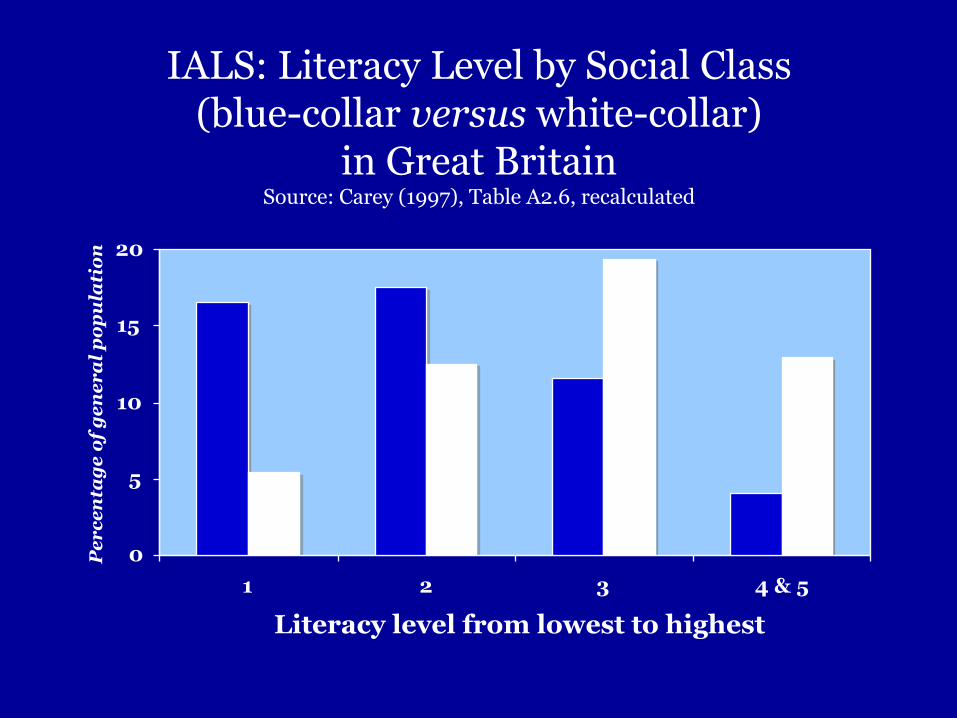
IALS: Literacy Level by Social Class (blue-collar versus white-collar)
in Great Britain Source: Carey (1997), Table A2.6, recalculated
0
5
10
15
20
1 2 3 4 & 5
Literacy level from lowest to highest
Pe
rc
en
tag
e o
f g
en
er
al
po
pu
lati
on
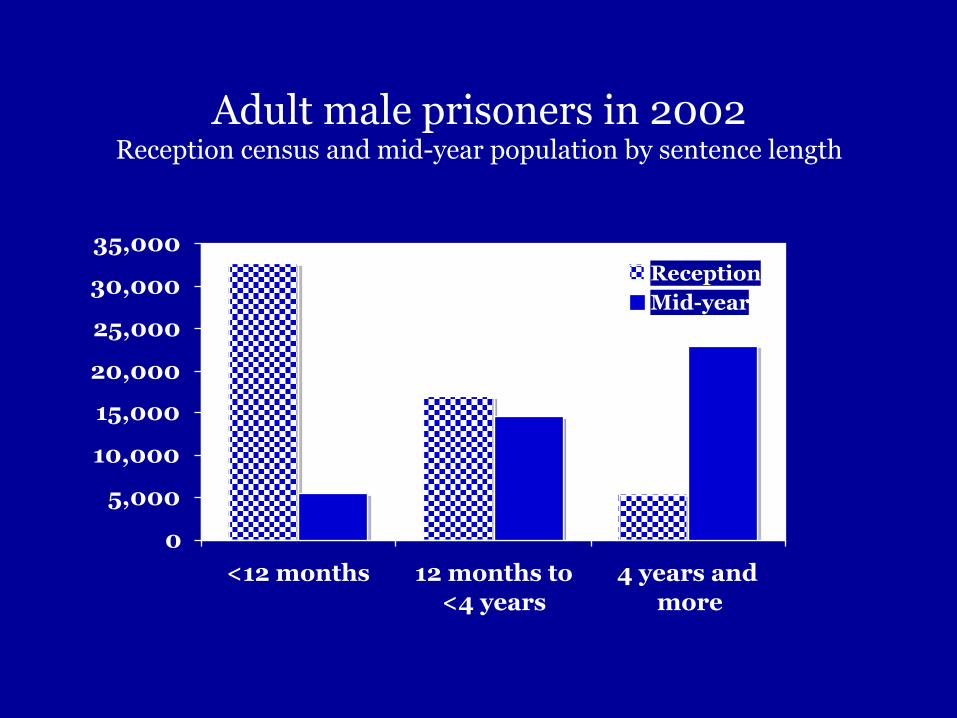
Adult male prisoners in 2002 Reception census and mid-year population by sentence length
0
5,000
10,000
15,000
20,000
25,000
30,000
35,000
<12 months 12 months to
<4 years
4 years and
more
Reception
Mid-year
Prisoners’ Information Book 2008
‘Arriving at prison can
be a bewildering and stressful experience.’

USA: Literacy Behind Prison Walls Source: Haigler, Harlow, O’Connor, and Campbell (1994)
'When the variables of sex, race/ethnicity, age, and level of education are held constant, the performance of the prison population on the three literacy scales is comparable to that of the household population. Thus, differences in overall performance between the prison and the household populations may be attributed to differences in demographic composition and educational attainment.’ (xix)

Australia: The Illiteracy Myth Source: Black, Rouse, and Wickert (1990)
'This study, the first serious attempt in Australia to look in some depth at the literacy abilities of prisoners, has made false the claim that many prisoners are illiterate or that their literacy abilities are to any great degree different from those found in the general adult community.’ (11)
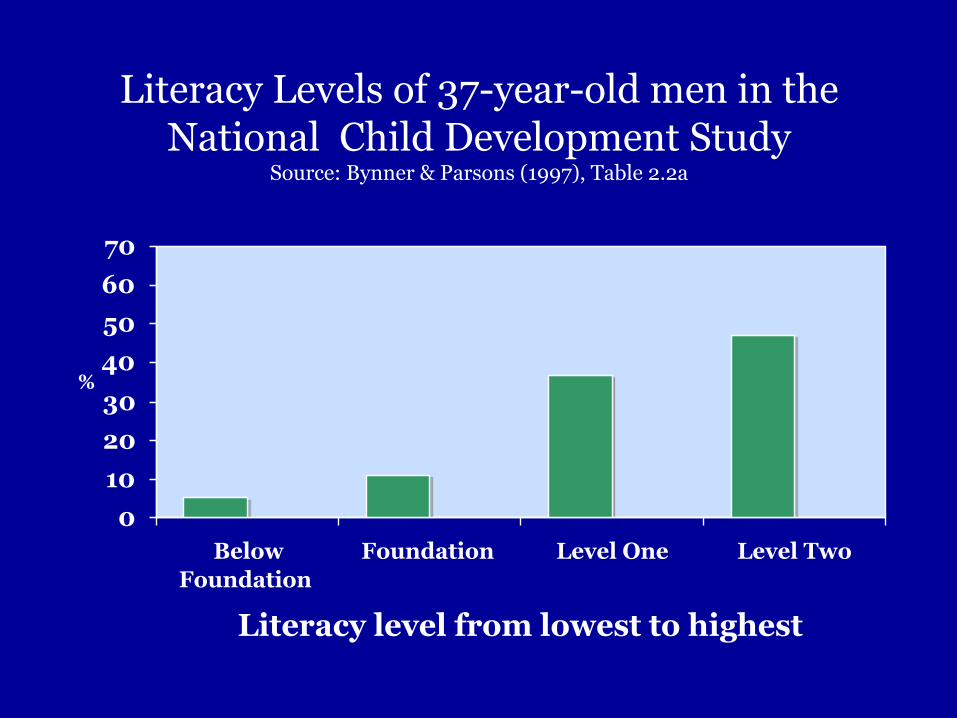
Literacy Levels of 37-year-old men in the National Child Development Study
Source: Bynner & Parsons (1997), Table 2.2a
0
10
20
30
40
50
60
70
Below
Foundation
Foundation Level One Level Two
Literacy level from lowest to highest
%
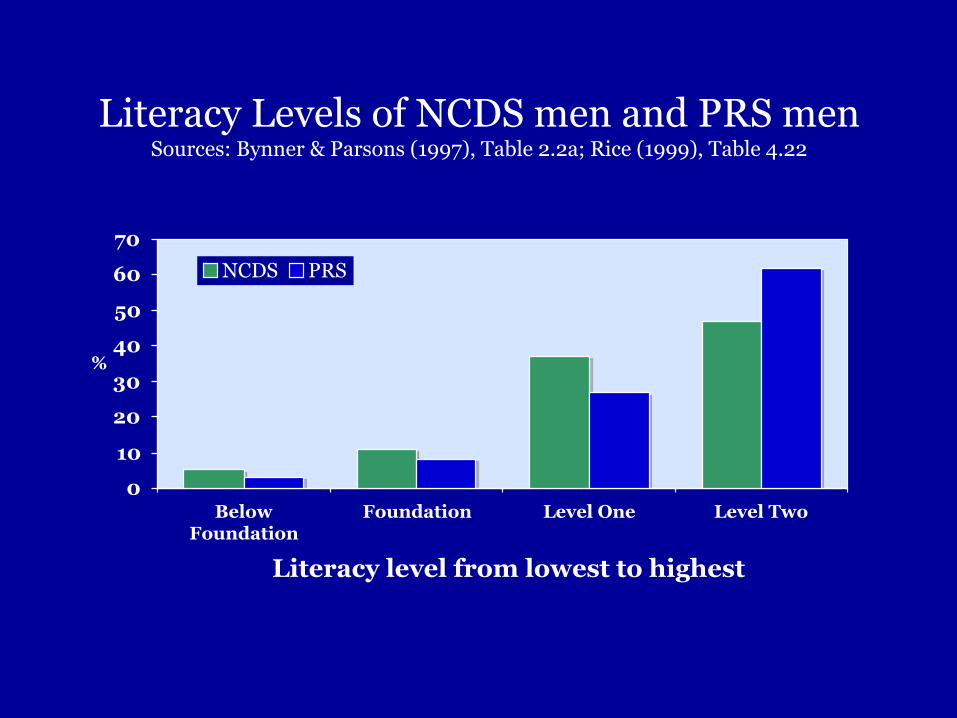
Literacy Levels of NCDS men and PRS men Sources: Bynner & Parsons (1997), Table 2.2a; Rice (1999), Table 4.22
0
10
20
30
40
50
60
70
BelowFoundation
Foundation Level One Level Two
Literacy level from lowest to highest
%
NCDS PRS
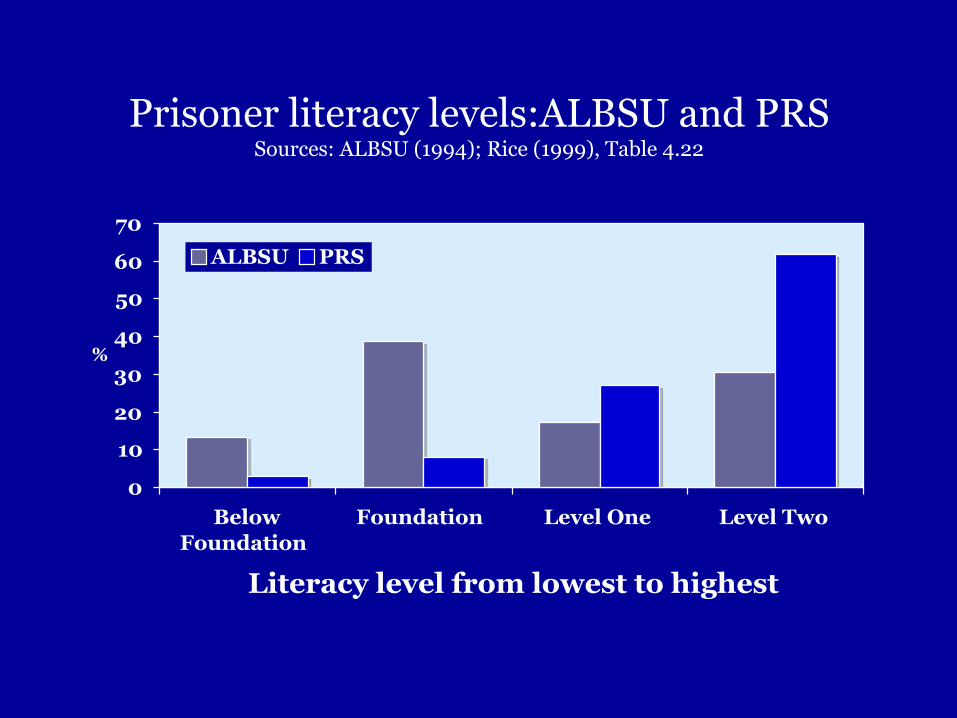
Prisoner literacy levels:ALBSU and PRS Sources: ALBSU (1994); Rice (1999), Table 4.22
0
10
20
30
40
50
60
70
Below
Foundation
Foundation Level One Level Two
Literacy level from lowest to highest
%
ALBSU PRS

Adult male prisoners in 2002 Reception census and mid-year population by sentence length
0
5,000
10,000
15,000
20,000
25,000
30,000
35,000
<12 months 12 months to
<4 years
4 years and
more
Reception
Mid-year
Developmental dyslexia in adults: a research review (2004)

Offender employability: what do we know (and is it knowledge)?
Myth II: Offender employability Source: Centre for Social Justice (2009)
‘It is estimated that at least half of our prisoners, approximately 40,000, do not possess the skills required by over 95 per cent of jobs.’
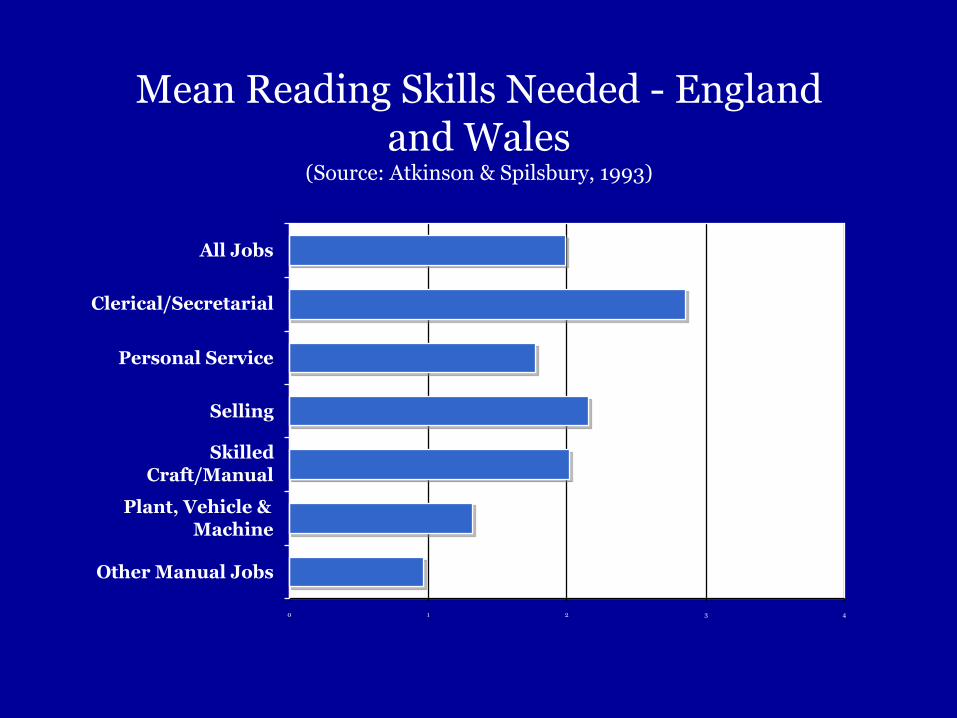
Mean Reading Skills Needed - England and Wales
(Source: Atkinson & Spilsbury, 1993)
0 1 2 3 4
Other Manual Jobs
Plant, Vehicle &Machine
SkilledCraft/Manual
Selling
Personal Service
Clerical/Secretarial
All Jobs
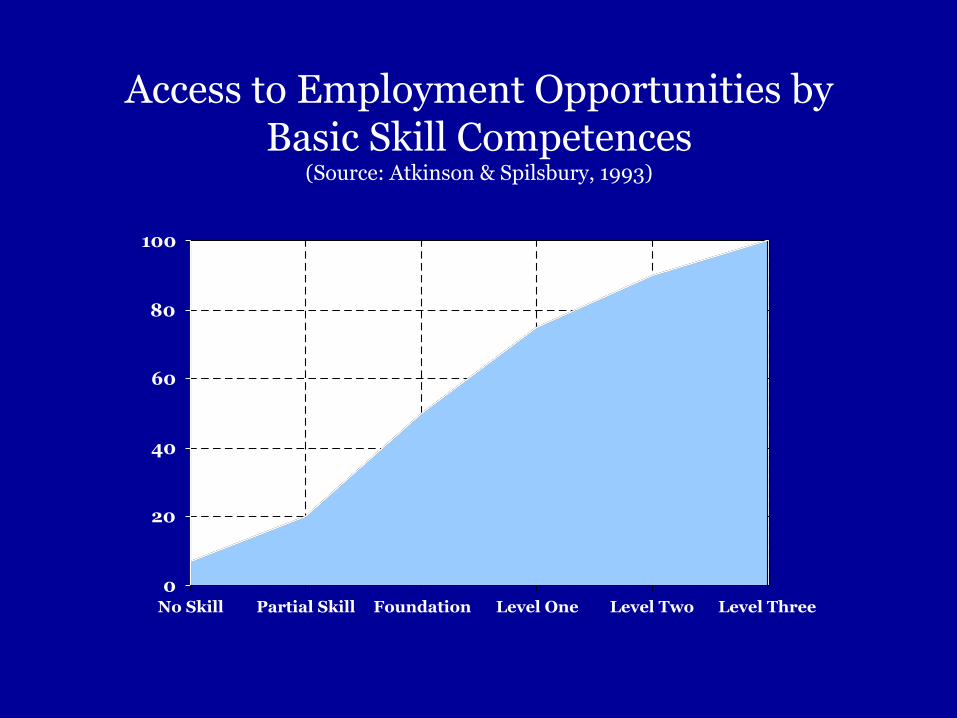
Access to Employment Opportunities by Basic Skill Competences
(Source: Atkinson & Spilsbury, 1993)
0
20
40
60
80
100
No Skill Partial Skill Foundation Level One Level Two Level Three
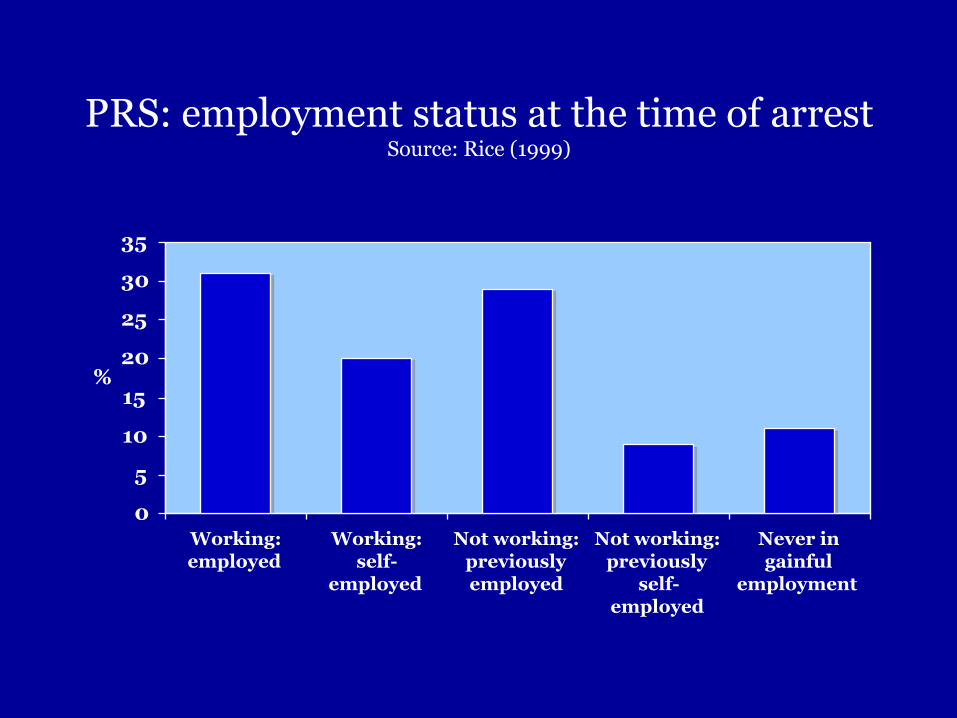
PRS: employment status at the time of arrest Source: Rice (1999)
0
5
10
15
20
25
30
35
Working:employed
Working:self-
employed
Not working:previouslyemployed
Not working:previously
self-employed
Never ingainful
employment
%
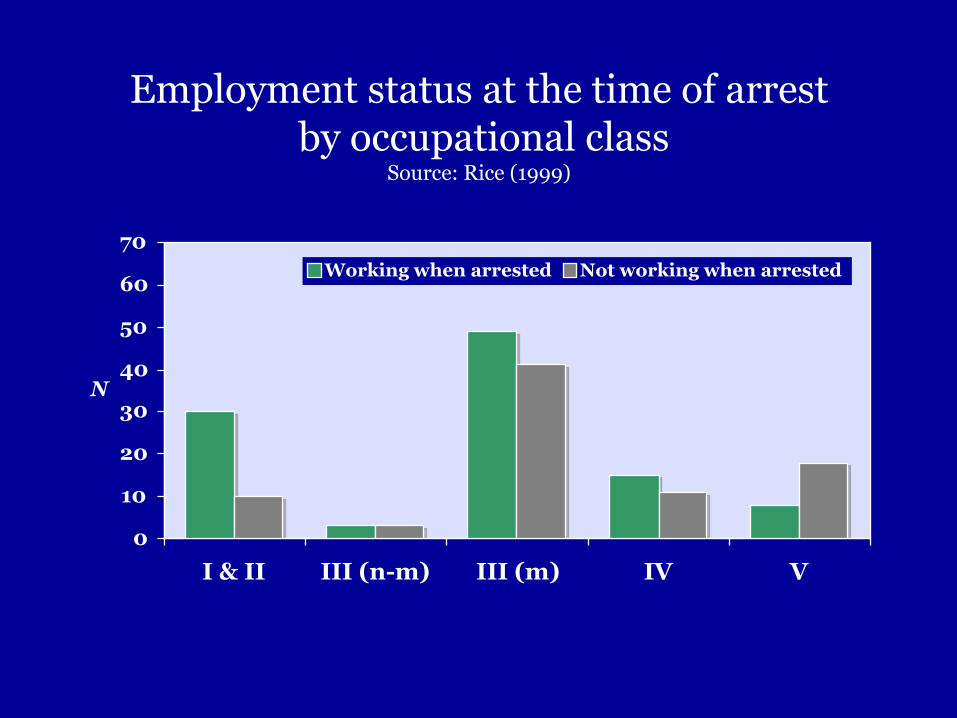
Employment status at the time of arrest by occupational class
Source: Rice (1999)
0
10
20
30
40
50
60
70
I & II III (n-m) III (m) IV V
N
Working when arrested Not working when arrested
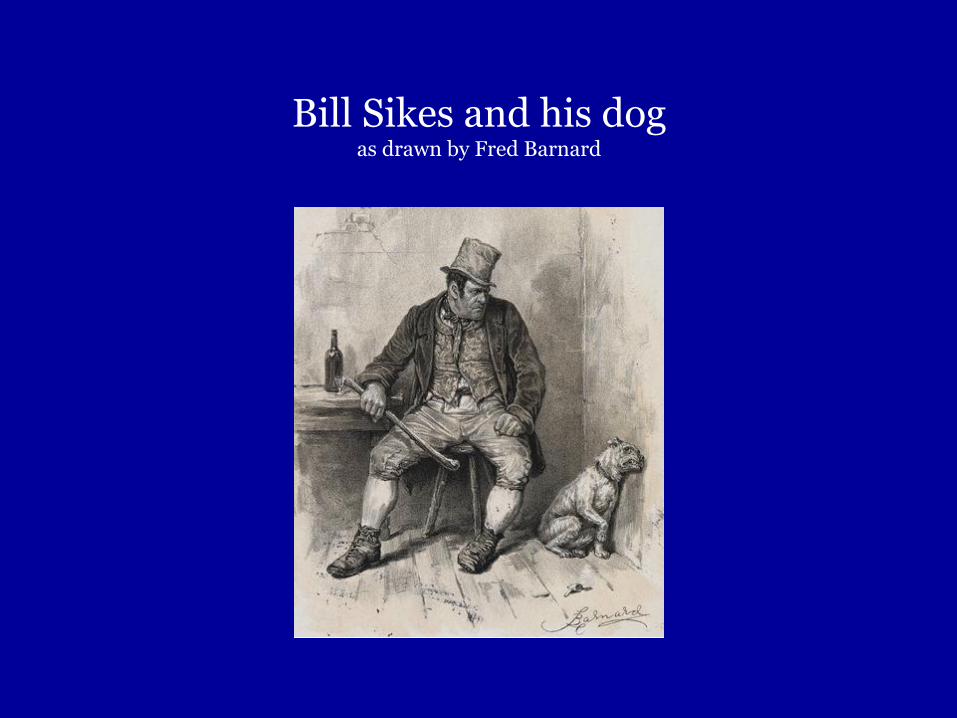
Bill Sikes and his dog as drawn by Fred Barnard

The Beano Thursday 10 March, 1954

‘The public role of criminology . . . is to use knowledge to challenge myth and falsehood (from wherever it hails) and
to make it possible to prevent and control crime in ways that are more
rational and evidence-based.’
Ian Loader & Richard Sparks, in Public Criminology (2010)
Copyright © 2022 FDOKUMEN

