


Bahasa
Halaman
Hukum


Benthic-Pelagic Coupling: Effects on NematodeCommunities along Southern European ContinentalMarginsEllen Pape1*, Daniel O. B. Jones2, Elena Manini3, Tania Nara Bezerra1, Ann Vanreusel1
1Marine Biology Research Group, Ghent University, Ghent, Belgium, 2National Oceanography Centre, Southampton, United Kingdom, 3 Institute of Marine Science -
National Research Council, Ancona, Italy
Abstract
Along a west-to-east axis spanning the Galicia Bank region (Iberian margin) and the Mediterranean basin, a reduction insurface primary productivity and in seafloor flux of particulate organic carbon was mirrored in the in situ organic matterquantity and quality within the underlying deep-sea sediments at different water depths (1200, 1900 and 3000 m).Nematode standing stock (abundance and biomass) and genus and trophic composition were investigated to evaluatedownward benthic-pelagic coupling. The longitudinal decline in seafloor particulate organic carbon flux was reflected bya reduction in benthic phytopigment concentrations and nematode standing stock. An exception was the station sampledat the Galicia Bank seamount, where despite the maximal particulate organic carbon flux estimate, we observed reducedpigment levels and nematode standing stock. The strong hydrodynamic forcing at this station was believed to be the maincause of the local decoupling between pelagic and benthic processes. Besides a longitudinal cline in nematode standingstock, we noticed a west-to-east gradient in nematode genus and feeding type composition (owing to an increasingimportance of predatory/scavenging nematodes with longitude) governed by potential proxies for food availability(percentage of nitrogen, organic carbon, and total organic matter). Within-station variability in generic composition waselevated in sediments with lower phytopigment concentrations. Standing stock appeared to be regulated by sedimentationrates and benthic environmental variables, whereas genus composition covaried only with benthic environmental variables.The coupling between deep-sea nematode assemblages and surface water processes evidenced in the present studysuggests that it is likely that climate change will affect the composition and function of deep-sea nematodes.
Citation: Pape E, Jones DOB, Manini E, Bezerra TN, Vanreusel A (2013) Benthic-Pelagic Coupling: Effects on Nematode Communities along Southern EuropeanContinental Margins. PLoS ONE 8(4): e59954. doi:10.1371/journal.pone.0059954
Editor: Sebastian C. A. Ferse, Leibniz Center for Tropical Marine Ecology, Germany
Received October 30, 2012; Accepted February 20, 2013; Published April 2, 2013
Copyright: � 2013 Pape et al. This is an open-access article distributed under the terms of the Creative Commons Attribution License, which permitsunrestricted use, distribution, and reproduction in any medium, provided the original author and source are credited.
Funding: This research was funded through the ESF-EuroDEEP BIOFUN project (FWO project number 3G067007), the European Commission’s SeventhFramework Programme HERMIONE project (grant number 226354) and FWO project nr G083512W. The funders had no role in study design, data collection andanalysis, decision to publish, or preparation of the manuscript.
Competing Interests: The authors have declared that no competing interests exist.
* E-mail: [email protected]
Introduction
Apart from benthos dependent on chemosynthesis, deep-sea
sediment communities ultimately depend for their dietary require-
ments on organic matter (OM) that is produced in the euphotic
zone. The quantity that is produced varies among seasons and
regions, and is determined by the physical properties and
dynamics of the euphotic zone [1]. The particulate OM (POM)
that is exported from the euphotic zone comprises phyto- and
zoodetritus, in addition to bacteria, protozoans, fecal pellets (which
mainly contain phytoplankton cells and gut bacteria) and in-
organic compounds [2]. The processes through which POM is
transferred to the deep-sea bottom are collectively termed ‘‘the
biological pump’’. During its descent through the water column
the POM particles are progressively broken down, and only
a limited fraction (1% on average) arrives at the deep-sea bed [1].
The fraction of exported POM that reaches the deep-sea
sediments, or the efficiency of the biological pump, is determined
by water depth, the sinking velocity (dependent on, amongst
others, the degree of POM aggregation and the seawater mineral
content) and the rate of decomposition (dependent on the pelagic
food web structure and seawater temperature) of the POM [3]. In
addition, laterally advected water masses may transport sinking
POM away from its point of origin [4–6].
Various time-series studies documented an elevation in standing
stock or metabolic activity, or both, of deep-sea benthic organisms
in response to a phytodetritus pulse [7–10]. Empirical evidence for
the coupling between the pelagic and the deep-sea benthic realm
comes from feeding experiments, showing rapid uptake of added
phytodetrital matter by all benthic size-classes, from prokaryotes to
megafauna [11–13], including those living at abyssal depths
[14,15]. Some authors, however, failed to detect a response of
(some of) the deep-sea benthic biota under study [16–18].
Meiofauna, a size-based invertebrate group dominated by
nematodes, are a ubiquitous and dominant metazoan component
of deep-sea sediments [19,20]. Most proof for benthic-pelagic
coupling stems from significant correlations between meiofaunal
parameters and abiotic variables related to OM input. The
magnitude of the flux of particulate organic carbon (POC) to the
seabed was documented to have a positive effect on meiobenthic
abundance [21,22]. The concentration of chlorophyll-a (chl-a),
and the sum of chl-a and its breakdown products (i.e. chloroplastic
PLOS ONE | www.plosone.org 1 April 2013 | Volume 8 | Issue 4 | e59954

pigment equivalents or CPE) are commonly used to quantify the
size of the fresh and total (fresh+degraded) phytodetrital pool,
respectively, within the sediments [23,24]. Sommer and Pfann-
kuche [21], Soltwedel [25], Neira et al. [26], Tselepides et al. [27],
and Lampadariou et al. [28] all described a positive association
between meiobenthic or nematode standing stock and pigment
concentrations. However, Danovaro et al. [29] and Shimanaga
et al. [30] did not observe a relationship between meiofaunal
abundance and pigment concentrations. As a consequence, it has
been argued that not food quantity, but food quality structures
deep-sea benthic assemblages [29]. Other factors that were
reported to correlate with deep-sea meiofaunal abundances or
composition are granulometric characteristics [31] and sedimen-
tary organic matter content [32,33]. However, the bulk of the OM
within deep-sea sediments is refractory and thus organic matter
content represents a poor measure of food availability [34].
We selected several study areas in southern Europe positioned
along a west-east axis, which are characterized by differential
trophic and oceanographic conditions, namely the Galicia Bank
(‘‘GB’’) region, and several basins within the western and eastern
Mediterranean. The GB is a seamount located on the northwest-
ern Iberian margin, which is marked by relatively high primary
productivity (,220 g C m22 yr21; [35]) owing to intense, wind-
driven seasonal upwelling [36]. However, unlike the non-
seamount stations in the GB region and the Mediterranean, the
waters atop of the GB are hydrodynamically active [37], and as
such bottom currents may interfere with OM deposition.
Mediterranean deep-sea sediments represent a highly oligotrophic
environment, because of the general nutrient depletion in surface
waters combined with the high water temperature promoting the
degradation of sinking OM [38]. Within the Mediterranean, there
is a well-established trophic divergence between the more
productive western and the less productive eastern basin [39–
41]. This gradient is generated by the higher nutrient input in the
western Mediterranean owing to river runoff and the inflow of
Atlantic surface water, and the outflow of relatively nutrient-rich
Levantine Intermediate Water through the Strait of Gibraltar (also
known as the inverse estuarine circulation) [42]. Nonetheless, there
appears to be substantial regional heterogeneity in surface
productivity within both the western and the eastern Mediterra-
nean basin owing to hydrological features and river runoff [43,44].
The aim of this study was to determine how differences in
oceanographic and productivity regimes between our study areas
are reflected in nematode community characteristics at different
bathyal and abyssal water depths (1200, 1900 and 3000 m).
Measures of surface productivity, seafloor POC flux and in situ
OM quality and quantity were used to verify and describe the
longitudinal trophic gradient. We hypothesized that the west-east
decline in primary production and sedimentation results in lower
standing stock and a gradient in the generic and trophic structure
of the nematode assemblages. In addition, we assessed the
importance of both POC flux and benthic environmental
characteristics for the distribution and structure of nematode
communities.
Materials and Methods
Ethics StatementNo specific permits were required for the described field studies
since the locations are not privately-owned or protected in any
way and no endangered or protected species were involved.
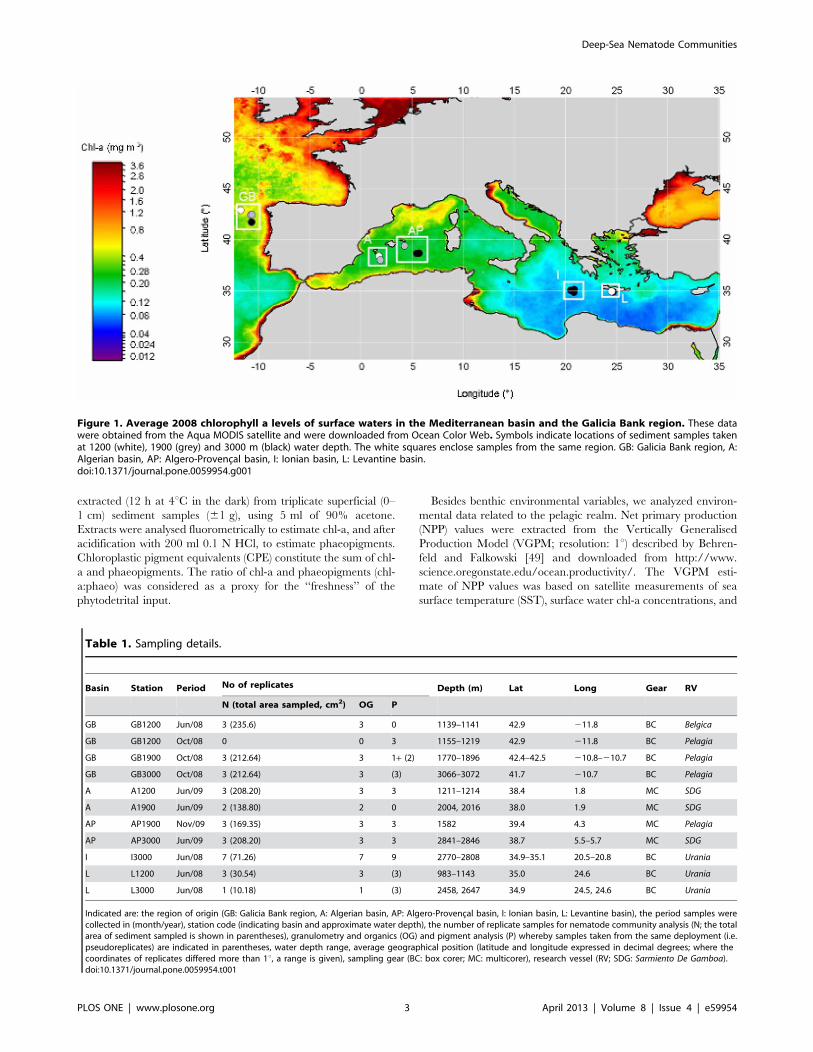
Study AreaThe Galicia Bank (‘‘GB’’) is a seamount situated on the Iberian
margin, about 200 km off the Galician coast. It is separated from
the shallower parts of the continental margin by the Galicia
Interior basin, which has an approximate depth of 3000 m (Fig. 1).
The dome-shaped GB seamount has a relatively flat quasi-
rectangular summit (between ca. 620 and 900 m water depth)
which is covered by a thick layer of foraminiferal ooze and is
bounded by steep scarps [32,37]. Duineveld et al. [37] measured
high current velocities (5–30 cm s21) at 1 m above the GB
summit. We collected samples at (1200 m; GB1200) and southeast
of the GB seamount (1900 and 3000 m; GB1900 and GB3000,
respectively) (Fig. 1). Hence, GB1200 is a seamount station, whilst
the deeper stations were positioned on the slope and the abyssal
plain. The oceanographic area in which these stations were
located is termed the GB region throughout the manuscript.
The Mediterranean Sea is split into the western and eastern
Mediterranean basin by the Strait of Sicily. The western
Mediterranean stations were situated in the Algerian (‘‘A’’,
A1200 and A1900) and in the Algero-Provencal (‘‘AP’’, AP1900
and AP3000) basin. The eastern Mediterranean samples were
collected in the Ionian Sea (‘‘I’’, I3000) and in the northern
Levantine basin (‘‘L’’, L3000), offshore southern Crete. Sediment
samples originating from each region were positioned on a west-
to-east axis with an increase in longitude according to
GB,A,AP, I,L (Fig. 1).
Sampling StrategySediment samples were gathered during various expeditions
undertaken in the frame of the BIOFUN (‘‘Biodiversity and
ecosystem functioning in southern European deep-sea environ-
ments: from viruses to megafauna’’) project (Table 1). We initially
planned to sample only with a multicorer, because this gear
produces the least disturbed sediment samples [45]. However,
because of absence or malfunctioning of the multicorer, most of
our samples comprised sub-samples from box cores taken with
multicorer cores. Both Galeron et al. [46] and Mokievskii et al.
[22] found no significant differences in meiobenthic abundances
between multicorer and box corer samples, whereas Bett et al.
[45] observed twice as much meiofauna in multicorer compared to
box corer samples. Samples taken in the same basin or region and
at the same water depth during the same expedition were
considered replicates of the same station. Note that the number of
replicate deployments varied among stations (1–9; Table 1). The
surface area of the sampling cores used was not constant, and
measured 78.54, 10.18, 70.88, 56.45 and 69.4 cm2 during the RV
Belgica, Urania, Pelagia 2008, Pelagia 2009 and the Sarmiento De
Gamboa expeditions, respectively. As a consequence, the total area
sampled for nematode community analysis varied among stations
(Table 1). All analyses were conducted on the top 0–1 cm of the
sediment cores.
Analysis of Environmental VariablesGranulometric analysis was conducted using a Malvern Mas-
tersizer hydro 2000 G. Sediment fractions were classified
according to the Wentworth scale [47]. Following freeze-drying
and homogenization, samples were acidified with 1% HCl. After
acidification and drying, total organic carbon (TOC) and nitrogen
(TN) content were measured using a Flash EA 1112+ MAs 200
elemental analyser (Thermo Interscience). Total organic matter
(TOM) content was determined after combustion of the sediment
samples at 550uC.Chlorophyll-a (chl-a) and phaeopigment analyses were carried
out according to Lorenzen and Jeffrey [48]. Pigments were
Deep-Sea Nematode Communities
PLOS ONE | www.plosone.org 2 April 2013 | Volume 8 | Issue 4 | e59954
extracted (12 h at 4uC in the dark) from triplicate superficial (0–
1 cm) sediment samples (61 g), using 5 ml of 90% acetone.
Extracts were analysed fluorometrically to estimate chl-a, and after
acidification with 200 ml 0.1 N HCl, to estimate phaeopigments.
Chloroplastic pigment equivalents (CPE) constitute the sum of chl-
a and phaeopigments. The ratio of chl-a and phaeopigments (chl-
a:phaeo) was considered as a proxy for the ‘‘freshness’’ of the
phytodetrital input.
Besides benthic environmental variables, we analyzed environ-
mental data related to the pelagic realm. Net primary production
(NPP) values were extracted from the Vertically Generalised
Production Model (VGPM; resolution: 1u) described by Behren-
feld and Falkowski [49] and downloaded from http://www.
science.oregonstate.edu/ocean.productivity/. The VGPM esti-
mate of NPP values was based on satellite measurements of sea
surface temperature (SST), surface water chl-a concentrations, and
Figure 1. Average 2008 chlorophyll a levels of surface waters in the Mediterranean basin and the Galicia Bank region. These datawere obtained from the Aqua MODIS satellite and were downloaded from Ocean Color Web. Symbols indicate locations of sediment samples takenat 1200 (white), 1900 (grey) and 3000 m (black) water depth. The white squares enclose samples from the same region. GB: Galicia Bank region, A:Algerian basin, AP: Algero-Provencal basin, I: Ionian basin, L: Levantine basin.doi:10.1371/journal.pone.0059954.g001
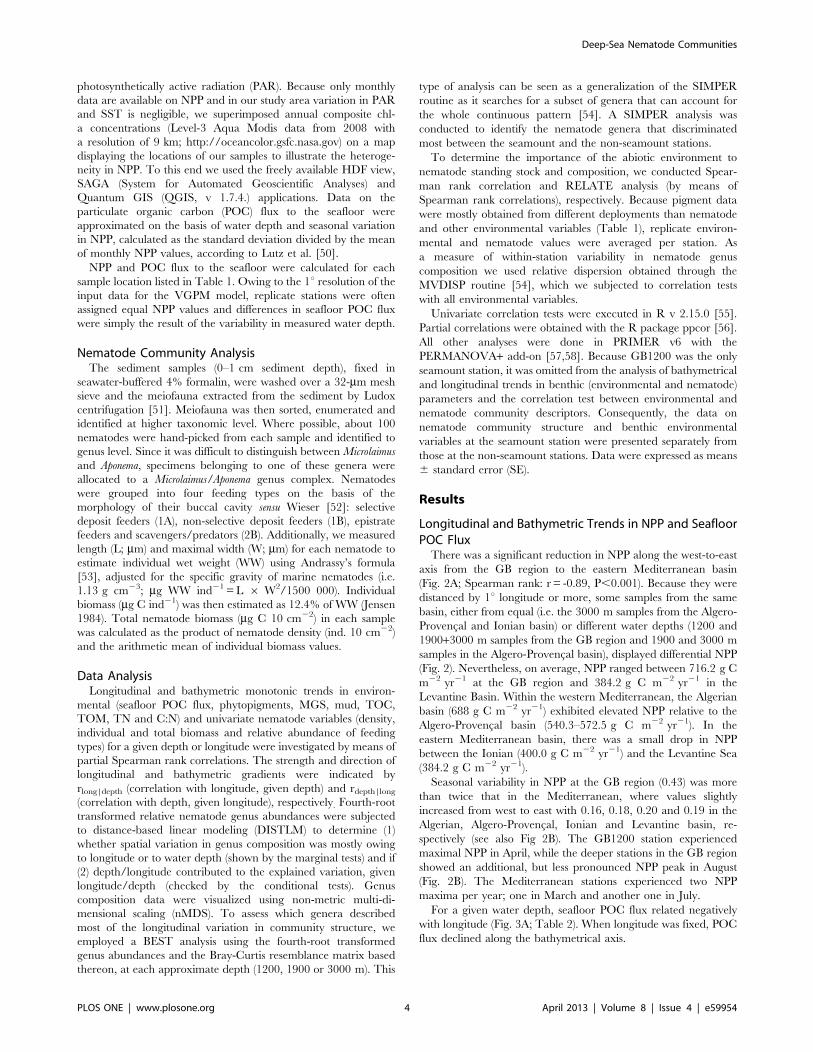
Table 1. Sampling details.
Basin Station Period No of replicates Depth (m) Lat Long Gear RV
N (total area sampled, cm2) OG P
GB GB1200 Jun/08 3 (235.6) 3 0 1139–1141 42.9 211.8 BC Belgica
GB GB1200 Oct/08 0 0 3 1155–1219 42.9 211.8 BC Pelagia
GB GB1900 Oct/08 3 (212.64) 3 1+ (2) 1770–1896 42.4–42.5 210.8–210.7 BC Pelagia
GB GB3000 Oct/08 3 (212.64) 3 (3) 3066–3072 41.7 210.7 BC Pelagia
A A1200 Jun/09 3 (208.20) 3 3 1211–1214 38.4 1.8 MC SDG
A A1900 Jun/09 2 (138.80) 2 0 2004, 2016 38.0 1.9 MC SDG
AP AP1900 Nov/09 3 (169.35) 3 3 1582 39.4 4.3 MC Pelagia
AP AP3000 Jun/09 3 (208.20) 3 3 2841–2846 38.7 5.5–5.7 MC SDG
I I3000 Jun/08 7 (71.26) 7 9 2770–2808 34.9–35.1 20.5–20.8 BC Urania
L L1200 Jun/08 3 (30.54) 3 (3) 983–1143 35.0 24.6 BC Urania
L L3000 Jun/08 1 (10.18) 1 (3) 2458, 2647 34.9 24.5, 24.6 BC Urania
Indicated are: the region of origin (GB: Galicia Bank region, A: Algerian basin, AP: Algero-Provencal basin, I: Ionian basin, L: Levantine basin), the period samples werecollected in (month/year), station code (indicating basin and approximate water depth), the number of replicate samples for nematode community analysis (N; the totalarea of sediment sampled is shown in parentheses), granulometry and organics (OG) and pigment analysis (P) whereby samples taken from the same deployment (i.e.pseudoreplicates) are indicated in parentheses, water depth range, average geographical position (latitude and longitude expressed in decimal degrees; where thecoordinates of replicates differed more than 1u, a range is given), sampling gear (BC: box corer; MC: multicorer), research vessel (RV; SDG: Sarmiento De Gamboa).doi:10.1371/journal.pone.0059954.t001
Deep-Sea Nematode Communities
PLOS ONE | www.plosone.org 3 April 2013 | Volume 8 | Issue 4 | e59954
photosynthetically active radiation (PAR). Because only monthly
data are available on NPP and in our study area variation in PAR
and SST is negligible, we superimposed annual composite chl-
a concentrations (Level-3 Aqua Modis data from 2008 with
a resolution of 9 km; http://oceancolor.gsfc.nasa.gov) on a map
displaying the locations of our samples to illustrate the heteroge-
neity in NPP. To this end we used the freely available HDF view,
SAGA (System for Automated Geoscientific Analyses) and
Quantum GIS (QGIS, v 1.7.4.) applications. Data on the
particulate organic carbon (POC) flux to the seafloor were
approximated on the basis of water depth and seasonal variation
in NPP, calculated as the standard deviation divided by the mean
of monthly NPP values, according to Lutz et al. [50].
NPP and POC flux to the seafloor were calculated for each
sample location listed in Table 1. Owing to the 1u resolution of the
input data for the VGPM model, replicate stations were often
assigned equal NPP values and differences in seafloor POC flux
were simply the result of the variability in measured water depth.
Nematode Community AnalysisThe sediment samples (0–1 cm sediment depth), fixed in
seawater-buffered 4% formalin, were washed over a 32-mm mesh
sieve and the meiofauna extracted from the sediment by Ludox
centrifugation [51]. Meiofauna was then sorted, enumerated and
identified at higher taxonomic level. Where possible, about 100
nematodes were hand-picked from each sample and identified to
genus level. Since it was difficult to distinguish between Microlaimus
and Aponema, specimens belonging to one of these genera were
allocated to a Microlaimus/Aponema genus complex. Nematodes
were grouped into four feeding types on the basis of the
morphology of their buccal cavity sensu Wieser [52]: selective
deposit feeders (1A), non-selective deposit feeders (1B), epistrate
feeders and scavengers/predators (2B). Additionally, we measured
length (L; mm) and maximal width (W; mm) for each nematode to
estimate individual wet weight (WW) using Andrassy’s formula
[53], adjusted for the specific gravity of marine nematodes (i.e.
1.13 g cm23; mg WW ind21 =L 6 W2/1500 000). Individual
biomass (mg C ind21) was then estimated as 12.4% of WW (Jensen
1984). Total nematode biomass (mg C 10 cm22) in each sample
was calculated as the product of nematode density (ind. 10 cm22)
and the arithmetic mean of individual biomass values.
Data AnalysisLongitudinal and bathymetric monotonic trends in environ-
mental (seafloor POC flux, phytopigments, MGS, mud, TOC,
TOM, TN and C:N) and univariate nematode variables (density,
individual and total biomass and relative abundance of feeding
types) for a given depth or longitude were investigated by means of
partial Spearman rank correlations. The strength and direction of
longitudinal and bathymetric gradients were indicated by
rlong|depth (correlation with longitude, given depth) and rdepth|long(correlation with depth, given longitude), respectively. Fourth-root
transformed relative nematode genus abundances were subjected
to distance-based linear modeling (DISTLM) to determine (1)
whether spatial variation in genus composition was mostly owing
to longitude or to water depth (shown by the marginal tests) and if
(2) depth/longitude contributed to the explained variation, given
longitude/depth (checked by the conditional tests). Genus
composition data were visualized using non-metric multi-di-
mensional scaling (nMDS). To assess which genera described
most of the longitudinal variation in community structure, we
employed a BEST analysis using the fourth-root transformed
genus abundances and the Bray-Curtis resemblance matrix based
thereon, at each approximate depth (1200, 1900 or 3000 m). This
type of analysis can be seen as a generalization of the SIMPER
routine as it searches for a subset of genera that can account for
the whole continuous pattern [54]. A SIMPER analysis was
conducted to identify the nematode genera that discriminated
most between the seamount and the non-seamount stations.
To determine the importance of the abiotic environment to
nematode standing stock and composition, we conducted Spear-
man rank correlation and RELATE analysis (by means of
Spearman rank correlations), respectively. Because pigment data
were mostly obtained from different deployments than nematode
and other environmental variables (Table 1), replicate environ-
mental and nematode values were averaged per station. As
a measure of within-station variability in nematode genus
composition we used relative dispersion obtained through the
MVDISP routine [54], which we subjected to correlation tests
with all environmental variables.
Univariate correlation tests were executed in R v 2.15.0 [55].
Partial correlations were obtained with the R package ppcor [56].
All other analyses were done in PRIMER v6 with the
PERMANOVA+ add-on [57,58]. Because GB1200 was the only
seamount station, it was omitted from the analysis of bathymetrical
and longitudinal trends in benthic (environmental and nematode)
parameters and the correlation test between environmental and
nematode community descriptors. Consequently, the data on
nematode community structure and benthic environmental
variables at the seamount station were presented separately from
those at the non-seamount stations. Data were expressed as means
6 standard error (SE).
Results
Longitudinal and Bathymetric Trends in NPP and SeafloorPOC FluxThere was a significant reduction in NPP along the west-to-east
axis from the GB region to the eastern Mediterranean basin
(Fig. 2A; Spearman rank: r = -0.89, P,0.001). Because they were
distanced by 1u longitude or more, some samples from the same
basin, either from equal (i.e. the 3000 m samples from the Algero-
Provencal and Ionian basin) or different water depths (1200 and
1900+3000 m samples from the GB region and 1900 and 3000 m
samples in the Algero-Provencal basin), displayed differential NPP
(Fig. 2). Nevertheless, on average, NPP ranged between 716.2 g C
m22 yr21 at the GB region and 384.2 g C m22 yr21 in the
Levantine Basin. Within the western Mediterranean, the Algerian
basin (688 g C m22 yr21) exhibited elevated NPP relative to the
Algero-Provencal basin (540.3–572.5 g C m22 yr21). In the
eastern Mediterranean basin, there was a small drop in NPP
between the Ionian (400.0 g C m22 yr21) and the Levantine Sea
(384.2 g C m22 yr21).
Seasonal variability in NPP at the GB region (0.43) was more
than twice that in the Mediterranean, where values slightly
increased from west to east with 0.16, 0.18, 0.20 and 0.19 in the
Algerian, Algero-Provencal, Ionian and Levantine basin, re-
spectively (see also Fig 2B). The GB1200 station experienced
maximal NPP in April, while the deeper stations in the GB region
showed an additional, but less pronounced NPP peak in August
(Fig. 2B). The Mediterranean stations experienced two NPP
maxima per year; one in March and another one in July.
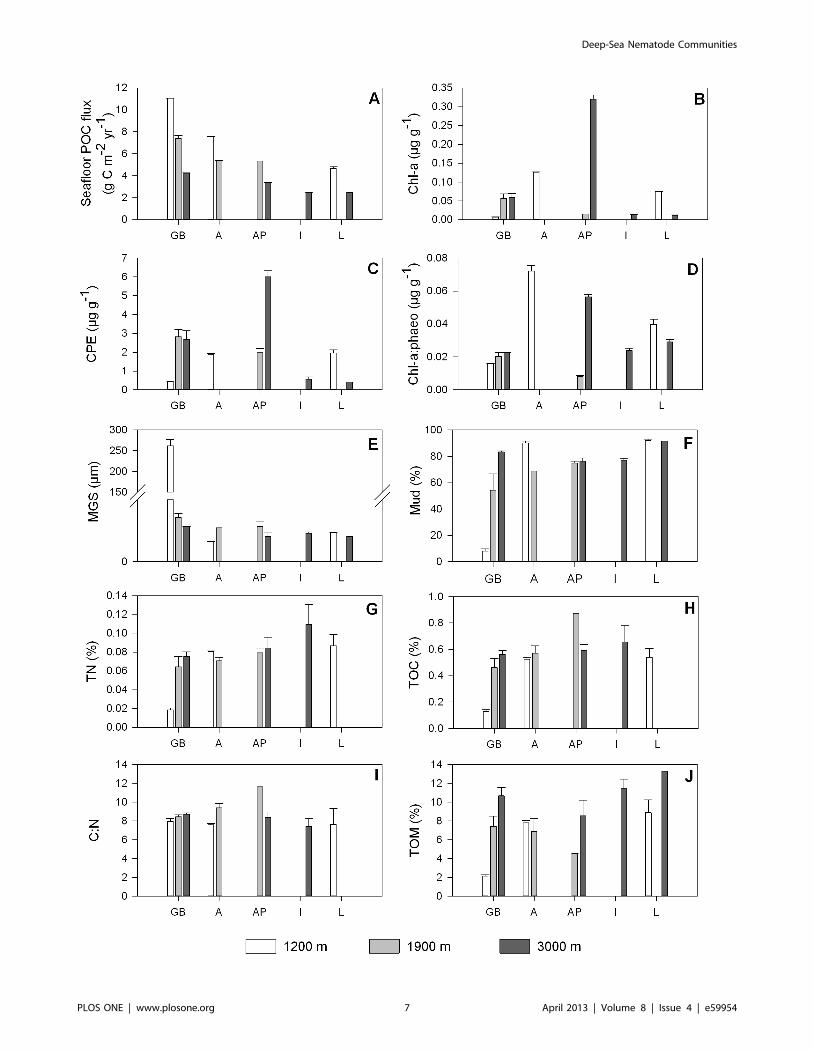
For a given water depth, seafloor POC flux related negatively
with longitude (Fig. 3A; Table 2). When longitude was fixed, POC
flux declined along the bathymetrical axis.
Deep-Sea Nematode Communities
PLOS ONE | www.plosone.org 4 April 2013 | Volume 8 | Issue 4 | e59954

Benthic Environmental and Nematode CommunityCharacteristics of the Seamount StationEven though we obtained the highest seafloor POC flux values
for seamount station GB1200 (Fig. 3A), this station was
characterized by the lowest phytopigment concentrations of all
(chl-a: 0.007060.0006 mg g21, CPE: 0.44160.035 mg g21)
(Fig. 3B–C). In addition, we observed divergently low values for
TN (0.04560.002%; Fig. 3G), TOC (0.1360.02%; Fig. 3H) and
TOM (2.1360.14%; Fig. 3J). The samples collected at GB1200
contained low numbers of nematodes (96.9627.7 ind. 10 cm22)
relative to the 1200 m station in the western Mediterranean
(203.165.0 ind. 10 cm22) and the deeper stations in the GB
region (GB1900:213.5613.7 ind. 10 cm22; GB3000:180.0654.7
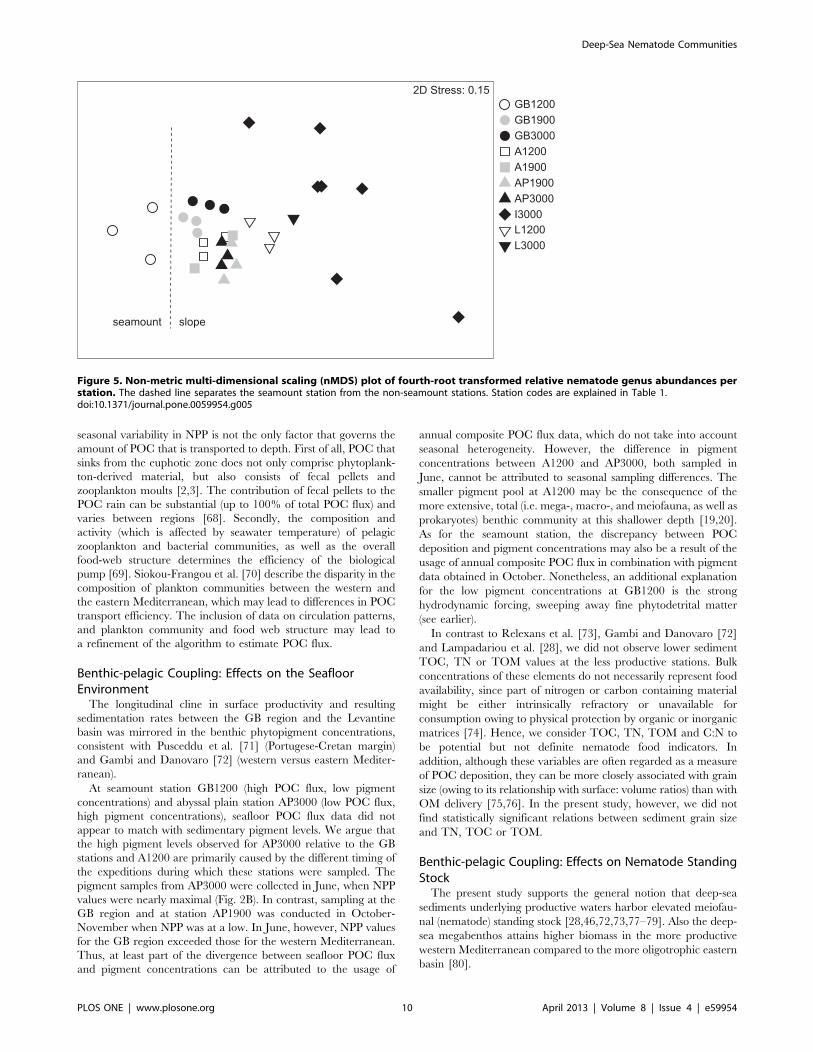
ind. 10 cm22) (Fig. 4). Fig. 5 shows that the nematode generic
composition at the seamount station diverged from that at the
non-seamount stations. The SIMPER analysis indicated that this
divergence (average dissimilarity: 60.4%) was partly driven by the
Figure 2. Satellite-based estimates of net primary productivity (NPP) in the Galicia Bank region and the Mediterranean. (A) Annualcomposite NPP in function of longitude. Symbols represent stations, indicating basin (shape) and water depth (colour). GB: Galicia Bank region, A:Algerian basin, AP: Algero-Provencal basin, I: Ionian basin, L: Levantine basin. (B) Monthly variation in NPP. Each line represents NPP values for stationslocated less than 1u longitude apart.doi:10.1371/journal.pone.0059954.g002
Deep-Sea Nematode Communities
PLOS ONE | www.plosone.org 5 April 2013 | Volume 8 | Issue 4 | e59954
higher relative abundance of Bolbolaimus, Desmodora, Metadesmolai-
mus, and Microlaimus/Aponema and the absence of Sphaerolaimus at
GB1200 (Table 3). Bolbolaimus was one of the 13 genera that were
restricted to station GB1200. Similar to the non-seamount stations,
the seamount station was dominated by deposit-feeding nematodes
(feeding types 1A +1B; 54.965.3%). Of all stations, GB1200 had
the highest fraction of epistrate feeders (2A; 44.265.5%) and the
lowest fraction of predators/scavengers (2B; 0.8860.45%; Fig. 6).
Benthic Environmental and Nematode CommunityCharacteristics of the Non-seamount Stations
Longitudinal and bathymetric trends in benthic
environmental variables. The partial Spearman rank corre-
lation coefficients describing longitudinal and bathymetrical trends
at a fixed depth and longitude, respectively, are presented in
Table 2. Station AP3000 displayed relatively low POC deposition,
albeit elevated sedimentary phytopigment levels (chl-a:
0.320560.0108 mg g21, CPE: 6.00560.324 mg g21) in compar-
ison with the stations in the GB region and the Algerian basin, and
with AP1900. We found a significant longitudinal decline in chl-
a and CPE levels (Fig. 3B–C), which was more pronounced (i.e.
more negative value of rlong|depth) when station AP3000 was
excluded from the analysis. Mud content (Fig. 3F) and MGS
(Fig. 3E) increased and decreased, respectively, from west to east.
The percentage of TOM showed a positive relation with longitude
and with water depth (Fig. 3J). Sedimentary TOC (Fig. 3H), TN
(Fig. 3G) and consequently C:N (Fig. 3I) values did not change
with depth or longitude.
Longitudinal and Bathymetric Trends in NematodeCommunity CharacteristicsThe relative densities of the various meiofaunal taxa encoun-
tered at each (seamount+non-seamount) station are listed in Table
S1. Nematodes prevailed at all stations, accounting for 70.0–
96.1% of meiofaunal abundance. The second most numerous
taxon were the copepods (adults+nauplii; 1.8–25.0%). At some
stations polychaetes, tardigrades or rotifers represented more than
1% of total meiofaunal abundance.
Table 2 contains the coefficients of the Spearman rank
correlations for nematode density and biomass with longitude
and depth. Nematode standing stock (i.e. total densities and
biomass) declined with longitude and with depth. Individual
nematode biomass also decreased from west to east but remained
constant with increasing water depth.
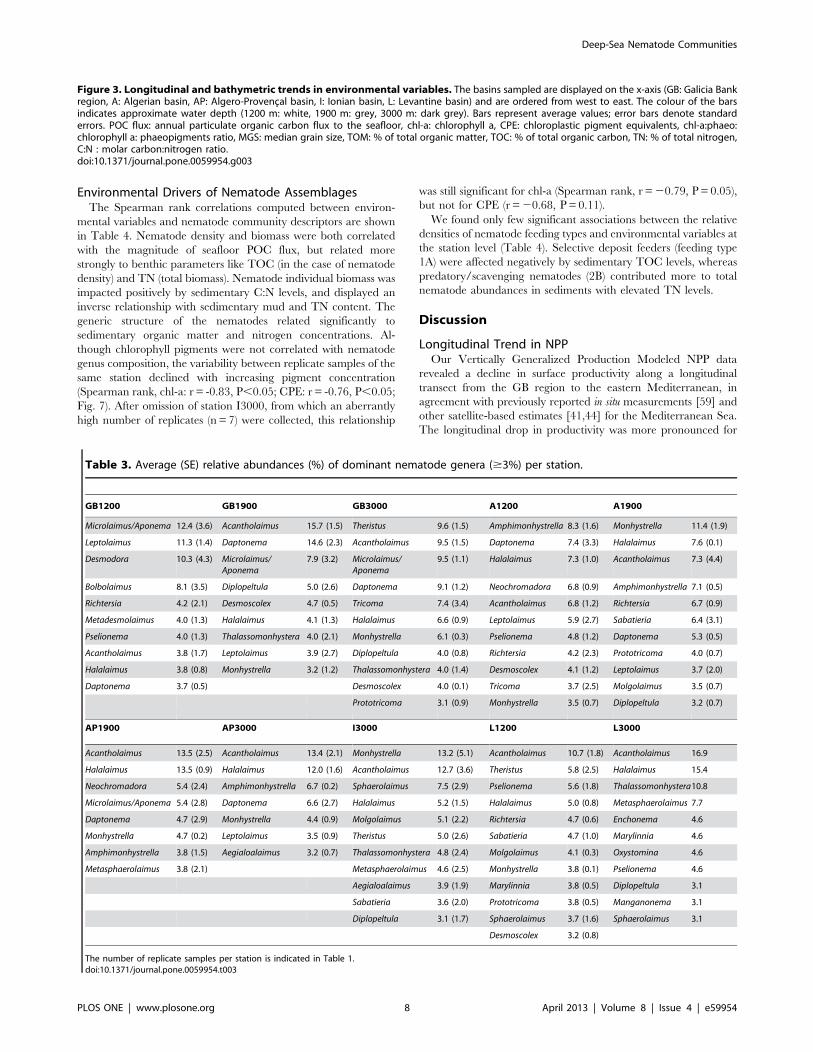
For all stations (seamount and non-seamount), we recorded 150
nematode genera of which the numerically dominant ones
(contributing $3% of total abundance) are listed in Table 3.
Acantholaimus and Halalaimus were amongst the dominant genera at
every station. Only eleven genera were encountered at all stations.
When water depth was fitted first in the DISTLM model
(excluding GB1200), there was a graded transition in nematode
genus composition from west to east (sequential tests, depth:
P,0.05; longitude: P,0.001; Fig. 5). Additionally, when longitude
was fixed, depth contributed significantly to the explained
variation in genus composition (sequential DISTLM tests,
longitude: P,0.001; depth: P,0.05). Longitude (depth fitted first:
18.6%, longitude fitted first: 18.5%) explained a greater fraction of
the variability in nematode genus composition than water depth
(depth fitted first: 6.9%, longitude fitted first: 7.0%). The BEST
analysis showed that at 1200 m depth the genus Chromadorina was
most responsible (R= 0.99) for the divergence between A1200 and
L1200, which was absent from the latter station. At the 1900 m
stations, Manganonema and Spirodesma, both only found at the GB
region, were steering the longitudinal gradient in genus compo-
sition (R= 0.62). Linhomoeus (absent from the Ionian and Levantine
basin), Metasphaerolaimus (more prevalent in the Levantine and
Ioanian basin) and Gnomoxyala (restricted to the Ionian Sea) were
the genera mainly responsible for the cline in genus composition at
the abyssal stations (R= 0.75).
The trophic structure of the nematode communities at all
(seamount+non-seamount) stations is illustrated in Fig. 6. De-
posit feeders (1A +1B) prevailed at all stations and accounted
for 45.7 to 85.7% of total nematode abundance. Except for half
of the I3000 samples, in which epistrate feeders (2A) attained
lowest relative abundances, predators/scavengers (2B) were
represented the least (range: 0–15.4%). The relative abundance
of predatory/scavenging nematodes displayed a positive longi-
tudinal gradient (Table 2).
Correlations between Seafloor POC Flux and BenthicEnvironmental VariablesSeafloor POC flux showed an inverse relationship with station-
averaged TOM (Spearman rank, r =20.78, P = 0.01).
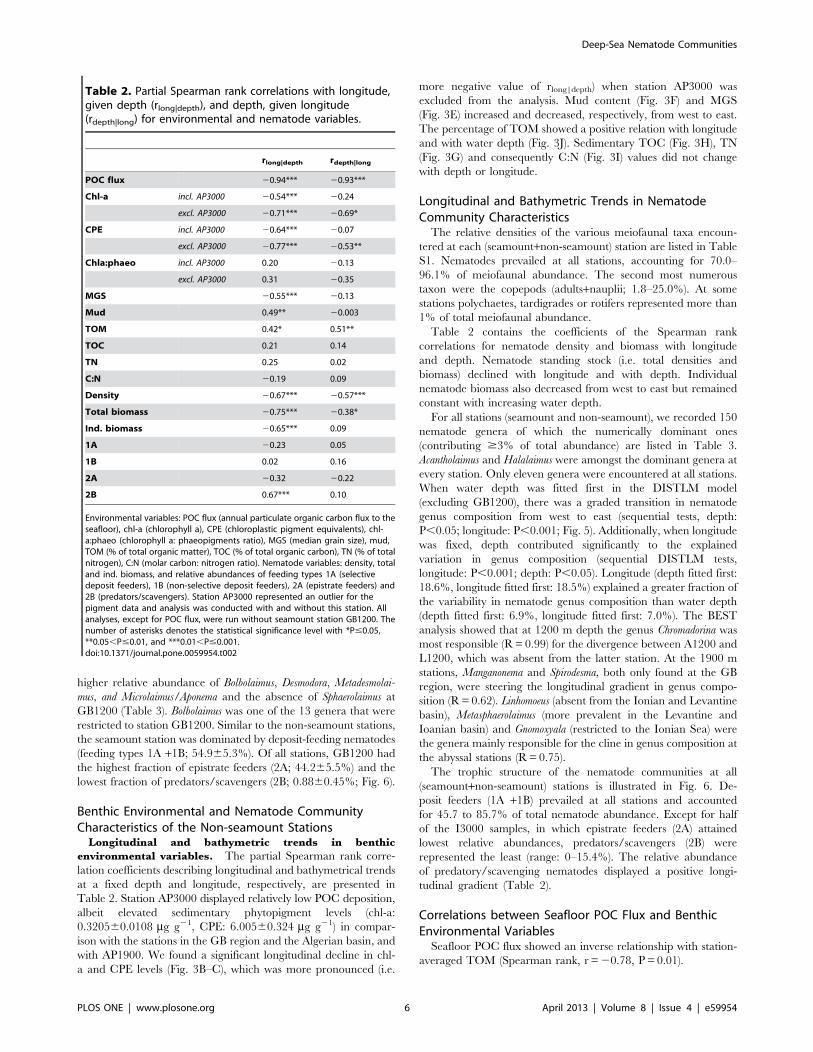
Table 2. Partial Spearman rank correlations with longitude,given depth (rlong|depth), and depth, given longitude(rdepth|long) for environmental and nematode variables.
rlong|depth rdepth|long
POC flux 20.94*** 20.93***
Chl-a incl. AP3000 20.54*** 20.24
excl. AP3000 20.71*** 20.69*
CPE incl. AP3000 20.64*** 20.07
excl. AP3000 20.77*** 20.53**
Chla:phaeo incl. AP3000 0.20 20.13
excl. AP3000 0.31 20.35
MGS 20.55*** 20.13
Mud 0.49** 20.003
TOM 0.42* 0.51**
TOC 0.21 0.14
TN 0.25 0.02
C:N 20.19 0.09
Density 20.67*** 20.57***
Total biomass 20.75*** 20.38*
Ind. biomass 20.65*** 0.09
1A 20.23 0.05
1B 0.02 0.16
2A 20.32 20.22
2B 0.67*** 0.10
Environmental variables: POC flux (annual particulate organic carbon flux to theseafloor), chl-a (chlorophyll a), CPE (chloroplastic pigment equivalents), chl-a:phaeo (chlorophyll a: phaeopigments ratio), MGS (median grain size), mud,TOM (% of total organic matter), TOC (% of total organic carbon), TN (% of totalnitrogen), C:N (molar carbon: nitrogen ratio). Nematode variables: density, totaland ind. biomass, and relative abundances of feeding types 1A (selectivedeposit feeders), 1B (non-selective deposit feeders), 2A (epistrate feeders) and2B (predators/scavengers). Station AP3000 represented an outlier for thepigment data and analysis was conducted with and without this station. Allanalyses, except for POC flux, were run without seamount station GB1200. Thenumber of asterisks denotes the statistical significance level with *P#0.05,**0.05,P#0.01, and ***0.01,P#0.001.doi:10.1371/journal.pone.0059954.t002
Deep-Sea Nematode Communities
PLOS ONE | www.plosone.org 6 April 2013 | Volume 8 | Issue 4 | e59954
Deep-Sea Nematode Communities
PLOS ONE | www.plosone.org 7 April 2013 | Volume 8 | Issue 4 | e59954
Environmental Drivers of Nematode AssemblagesThe Spearman rank correlations computed between environ-
mental variables and nematode community descriptors are shown
in Table 4. Nematode density and biomass were both correlated
with the magnitude of seafloor POC flux, but related more
strongly to benthic parameters like TOC (in the case of nematode
density) and TN (total biomass). Nematode individual biomass was
impacted positively by sedimentary C:N levels, and displayed an
inverse relationship with sedimentary mud and TN content. The
generic structure of the nematodes related significantly to
sedimentary organic matter and nitrogen concentrations. Al-
though chlorophyll pigments were not correlated with nematode
genus composition, the variability between replicate samples of the
same station declined with increasing pigment concentration
(Spearman rank, chl-a: r = -0.83, P,0.05; CPE: r = -0.76, P,0.05;
Fig. 7). After omission of station I3000, from which an aberrantly
high number of replicates (n = 7) were collected, this relationship
was still significant for chl-a (Spearman rank, r =20.79, P = 0.05),
but not for CPE (r =20.68, P = 0.11).
We found only few significant associations between the relative
densities of nematode feeding types and environmental variables at
the station level (Table 4). Selective deposit feeders (feeding type
1A) were affected negatively by sedimentary TOC levels, whereas
predatory/scavenging nematodes (2B) contributed more to total
nematode abundances in sediments with elevated TN levels.
Discussion
Longitudinal Trend in NPPOur Vertically Generalized Production Modeled NPP data
revealed a decline in surface productivity along a longitudinal
transect from the GB region to the eastern Mediterranean, in
agreement with previously reported in situ measurements [59] and
other satellite-based estimates [41,44] for the Mediterranean Sea.
The longitudinal drop in productivity was more pronounced for
Figure 3. Longitudinal and bathymetric trends in environmental variables. The basins sampled are displayed on the x-axis (GB: Galicia Bankregion, A: Algerian basin, AP: Algero-Provencal basin, I: Ionian basin, L: Levantine basin) and are ordered from west to east. The colour of the barsindicates approximate water depth (1200 m: white, 1900 m: grey, 3000 m: dark grey). Bars represent average values; error bars denote standarderrors. POC flux: annual particulate organic carbon flux to the seafloor, chl-a: chlorophyll a, CPE: chloroplastic pigment equivalents, chl-a:phaeo:chlorophyll a: phaeopigments ratio, MGS: median grain size, TOM: % of total organic matter, TOC: % of total organic carbon, TN: % of total nitrogen,C:N : molar carbon:nitrogen ratio.doi:10.1371/journal.pone.0059954.g003
Table 3. Average (SE) relative abundances (%) of dominant nematode genera ($3%) per station.
GB1200 GB1900 GB3000 A1200 A1900
Microlaimus/Aponema 12.4 (3.6) Acantholaimus 15.7 (1.5) Theristus 9.6 (1.5) Amphimonhystrella 8.3 (1.6) Monhystrella 11.4 (1.9)
Leptolaimus 11.3 (1.4) Daptonema 14.6 (2.3) Acantholaimus 9.5 (1.5) Daptonema 7.4 (3.3) Halalaimus 7.6 (0.1)
Desmodora 10.3 (4.3) Microlaimus/Aponema
7.9 (3.2) Microlaimus/Aponema
9.5 (1.1) Halalaimus 7.3 (1.0) Acantholaimus 7.3 (4.4)
Bolbolaimus 8.1 (3.5) Diplopeltula 5.0 (2.6) Daptonema 9.1 (1.2) Neochromadora 6.8 (0.9) Amphimonhystrella 7.1 (0.5)
Richtersia 4.2 (2.1) Desmoscolex 4.7 (0.5) Tricoma 7.4 (3.4) Acantholaimus 6.8 (1.2) Richtersia 6.7 (0.9)
Metadesmolaimus 4.0 (1.3) Halalaimus 4.1 (1.3) Halalaimus 6.6 (0.9) Leptolaimus 5.9 (2.7) Sabatieria 6.4 (3.1)
Pselionema 4.0 (1.3) Thalassomonhystera 4.0 (2.1) Monhystrella 6.1 (0.3) Pselionema 4.8 (1.2) Daptonema 5.3 (0.5)
Acantholaimus 3.8 (1.7) Leptolaimus 3.9 (2.7) Diplopeltula 4.0 (0.8) Richtersia 4.2 (2.3) Prototricoma 4.0 (0.7)
Halalaimus 3.8 (0.8) Monhystrella 3.2 (1.2) Thalassomonhystera 4.0 (1.4) Desmoscolex 4.1 (1.2) Leptolaimus 3.7 (2.0)
Daptonema 3.7 (0.5) Desmoscolex 4.0 (0.1) Tricoma 3.7 (2.5) Molgolaimus 3.5 (0.7)
Prototricoma 3.1 (0.9) Monhystrella 3.5 (0.7) Diplopeltula 3.2 (0.7)
AP1900 AP3000 I3000 L1200 L3000
Acantholaimus 13.5 (2.5) Acantholaimus 13.4 (2.1) Monhystrella 13.2 (5.1) Acantholaimus 10.7 (1.8) Acantholaimus 16.9
Halalaimus 13.5 (0.9) Halalaimus 12.0 (1.6) Acantholaimus 12.7 (3.6) Theristus 5.8 (2.5) Halalaimus 15.4
Neochromadora 5.4 (2.4) Amphimonhystrella 6.7 (0.2) Sphaerolaimus 7.5 (2.9) Pselionema 5.6 (1.8) Thalassomonhystera10.8
Microlaimus/Aponema 5.4 (2.8) Daptonema 6.6 (2.7) Halalaimus 5.2 (1.5) Halalaimus 5.0 (0.8) Metasphaerolaimus 7.7
Daptonema 4.7 (2.9) Monhystrella 4.4 (0.9) Molgolaimus 5.1 (2.2) Richtersia 4.7 (0.6) Enchonema 4.6
Monhystrella 4.7 (0.2) Leptolaimus 3.5 (0.9) Theristus 5.0 (2.6) Sabatieria 4.7 (1.0) Marylinnia 4.6
Amphimonhystrella 3.8 (1.5) Aegialoalaimus 3.2 (0.7) Thalassomonhystera 4.8 (2.4) Molgolaimus 4.1 (0.3) Oxystomina 4.6
Metasphaerolaimus 3.8 (2.1) Metasphaerolaimus 4.6 (2.5) Monhystrella 3.8 (0.1) Pselionema 4.6
Aegialoalaimus 3.9 (1.9) Marylinnia 3.8 (0.5) Diplopeltula 3.1
Sabatieria 3.6 (2.0) Prototricoma 3.8 (0.5) Manganonema 3.1
Diplopeltula 3.1 (1.7) Sphaerolaimus 3.7 (1.6) Sphaerolaimus 3.1
Desmoscolex 3.2 (0.8)
The number of replicate samples per station is indicated in Table 1.doi:10.1371/journal.pone.0059954.t003
Deep-Sea Nematode Communities
PLOS ONE | www.plosone.org 8 April 2013 | Volume 8 | Issue 4 | e59954

the in situ measurements of Moutin and Raimbault [59] (factor
2.2–2.9) compared to our data (1.8) and those of Bosc et al. [44]
(1.5). Standard algorithms used to convert ocean colour data to
chlorophyll concentrations have been proven to systematically
overestimate actual concentrations in the Mediterranean, espe-
cially in the oligotrophic parts of the basin [44,60]. However, the
west-east difference in productivity reported in this study, in which
standard algorithms were used, is larger than that recorded by
Bosc et al. [44] who employed a bio-optical algorithm adapted for
Mediterranean waters.
The NPP data estimated here were high compared to those
reported previously for the same oceanographic regions. This may
be related to the usage of different algorithms, which may provide
divergent estimates of NPP [61,62]. Joint el al. [35] provided
a regional NPP estimate for the northwestern Iberian margin,
where the GB is situated, of ,220 g C m22 yr21, which is about
three times lower than our value for the GB1200 station (693.5 g
C m22 yr21). This may point to a local NPP maximum associated
with the GB, which has been observed before for some seamounts
[63]. However, unlike seamount station GB1200, the deeper
stations in the GB region experience, besides a chlorophyll
maximum in spring, a NPP peak in late summer, resulting in
higher annual NPP. This second NPP maximum may result from
offshore transport of phytoplankton produced at the shelf
following coastal upwelling during summer [35]. Also for the
various Mediterranean regions, our NPP approximations (Fig. 2A)
were consistently a factor 3 to 4 higher than the satellite-based
values of Bosc et al. [44] (Algerian basin: 162.5 g C m22 yr21,
Algero-Provencal basin: 153 g C m22 yr21, Ionian basin: 120.4 g
C m22 yr21, Levantine basin: 106.3 g C m22 yr21). Because of
the presence of Saharan dust in Mediterranean surface waters,
standard algorithms, such as VGPM, tend to overestimate NPP in
this basin [44,60]. Bosc et al. [44] employed a regional algorithm,
adapted for Mediterranean waters, which was believed to generate
less biased NPP values.
Longitudinal Trend in Seafloor POC FluxThe productivity gradient between the GB region and the
eastern Mediterranean was accompanied by a reduction in
seafloor POC flux, conforming with sediment trap data for the
Mediterranean basin [39]. However, several factors may have
resulted in a bias in these estimated POC flux data.
The POC flux calculated for the seamount station was most
probably an overestimate since local strong near-bottom currents
may have diverted the POC rain [4–5,64]. The coarse sediment
texture at the GB was previously ascribed to the winnowing of the
fine sediment fraction by strong bottom currents [37,65]. At
station GB1200, maximal estimated POC deposition was associ-
ated with minimal benthic pigment concentrations, pointing to
a decoupling between NPP and POC deposition (but see later).
However, the POC flux we approximated for GB1200 (Fig. 2A)
was similar to the values of Duineveld et al. [37] at 800 m depth
(6.2–12.8 g C m22 yr21).
The POC sedimentation rates estimated for the Mediterranean
stations were either lower than or comparable to those previously
reported. At 3000 m depth in the Algero-Provencal basin, Zuniga
et al. [6] recorded a POC flux of 1 g C m22 yr21, which is one
third of the value we found for station AP3000. In the Antikythira
strait, which connects the Aegean with the Ionian Sea, the amount
of POC collected with a sediment trap placed 1345 m deep was
3.9 g C m22 yr21 [66], which is of the same order as the POC flux
we estimated for the same depth in the Levantine Sea (4.760.1 g
C m22 yr21). In the Cretan Sea, north of Crete, Danovaro et al.
[39] measured a four times lower POC flux of 1.2 g C m22 yr21,
inferred from sediment trap data. The divergence between
modeled POC flux and that measured by sediment traps may be
related to the systematic bias associated with the latter caused by,
amongst others, inclusion of swimmers, hydrodynamic biases,
degradation of trapped organic material [67].
Additional potential bias in the POC flux estimated via the
algorithm of Lutz et al. [50] may be introduced by (1) the limited
coverage of the data, on which the algorithm was based, relative to
the World ocean surface (including only two (rather productive)
locations from the Mediterranean), and (2) the fact that the
Figure 4. Longitudinal and bathymetric trends in densities,total and individual biomass of nematodes. The basins sampledare displayed on the x-axis (GB: Galicia Bank region, A: Algerian basin,AP: Algero-Provencal basin, I: Ionian basin, L: Levantine basin) and areordered from west to east. The colour of the bars indicates approximatewater depth (1200 m: white, 1900 m: grey, 3000 m: dark grey). Barsrepresent average values; error bars denote standard errors.doi:10.1371/journal.pone.0059954.g004
Deep-Sea Nematode Communities
PLOS ONE | www.plosone.org 9 April 2013 | Volume 8 | Issue 4 | e59954
seasonal variability in NPP is not the only factor that governs the
amount of POC that is transported to depth. First of all, POC that
sinks from the euphotic zone does not only comprise phytoplank-
ton-derived material, but also consists of fecal pellets and
zooplankton moults [2,3]. The contribution of fecal pellets to the
POC rain can be substantial (up to 100% of total POC flux) and
varies between regions [68]. Secondly, the composition and
activity (which is affected by seawater temperature) of pelagic
zooplankton and bacterial communities, as well as the overall
food-web structure determines the efficiency of the biological
pump [69]. Siokou-Frangou et al. [70] describe the disparity in the
composition of plankton communities between the western and
the eastern Mediterranean, which may lead to differences in POC
transport efficiency. The inclusion of data on circulation patterns,
and plankton community and food web structure may lead to
a refinement of the algorithm to estimate POC flux.
Benthic-pelagic Coupling: Effects on the SeafloorEnvironmentThe longitudinal cline in surface productivity and resulting
sedimentation rates between the GB region and the Levantine
basin was mirrored in the benthic phytopigment concentrations,
consistent with Pusceddu et al. [71] (Portugese-Cretan margin)
and Gambi and Danovaro [72] (western versus eastern Mediter-
ranean).
At seamount station GB1200 (high POC flux, low pigment
concentrations) and abyssal plain station AP3000 (low POC flux,
high pigment concentrations), seafloor POC flux data did not
appear to match with sedimentary pigment levels. We argue that
the high pigment levels observed for AP3000 relative to the GB
stations and A1200 are primarily caused by the different timing of
the expeditions during which these stations were sampled. The
pigment samples from AP3000 were collected in June, when NPP
values were nearly maximal (Fig. 2B). In contrast, sampling at the
GB region and at station AP1900 was conducted in October-
November when NPP was at a low. In June, however, NPP values
for the GB region exceeded those for the western Mediterranean.
Thus, at least part of the divergence between seafloor POC flux
and pigment concentrations can be attributed to the usage of
annual composite POC flux data, which do not take into account
seasonal heterogeneity. However, the difference in pigment
concentrations between A1200 and AP3000, both sampled in
June, cannot be attributed to seasonal sampling differences. The
smaller pigment pool at A1200 may be the consequence of the
more extensive, total (i.e. mega-, macro-, and meiofauna, as well as
prokaryotes) benthic community at this shallower depth [19,20].
As for the seamount station, the discrepancy between POC
deposition and pigment concentrations may also be a result of the
usage of annual composite POC flux in combination with pigment
data obtained in October. Nonetheless, an additional explanation
for the low pigment concentrations at GB1200 is the strong
hydrodynamic forcing, sweeping away fine phytodetrital matter
(see earlier).
In contrast to Relexans et al. [73], Gambi and Danovaro [72]
and Lampadariou et al. [28], we did not observe lower sediment
TOC, TN or TOM values at the less productive stations. Bulk
concentrations of these elements do not necessarily represent food
availability, since part of nitrogen or carbon containing material
might be either intrinsically refractory or unavailable for
consumption owing to physical protection by organic or inorganic
matrices [74]. Hence, we consider TOC, TN, TOM and C:N to
be potential but not definite nematode food indicators. In
addition, although these variables are often regarded as a measure
of POC deposition, they can be more closely associated with grain
size (owing to its relationship with surface: volume ratios) than with
OM delivery [75,76]. In the present study, however, we did not
find statistically significant relations between sediment grain size
and TN, TOC or TOM.
Benthic-pelagic Coupling: Effects on Nematode StandingStockThe present study supports the general notion that deep-sea
sediments underlying productive waters harbor elevated meiofau-
nal (nematode) standing stock [28,46,72,73,77–79]. Also the deep-
sea megabenthos attains higher biomass in the more productive
western Mediterranean compared to the more oligotrophic eastern
basin [80].
Figure 5. Non-metric multi-dimensional scaling (nMDS) plot of fourth-root transformed relative nematode genus abundances perstation. The dashed line separates the seamount station from the non-seamount stations. Station codes are explained in Table 1.doi:10.1371/journal.pone.0059954.g005
Deep-Sea Nematode Communities
PLOS ONE | www.plosone.org 10 April 2013 | Volume 8 | Issue 4 | e59954

The correlation analysis pointed towards the significance of food
availability, in terms of POC sedimentation rates and even more
importantly sedimentary TN and TOC levels, for nematode
standing stock. However, the results obtained for the seamount
station indicate that food may not be the only determinant of
nematode biomass. Correspondingly, in his review on meiofauna
along continental margins, Soltwedel [25] noticed considerable
variation in the relationship between CPE and meiofaunal
abundances between geographic regions, which he attributed to
the interference of other environmental and/or biotic factors. The
unusually low standing stock at GB1200 was believed to be the
result of the strong hydrodynamical forcing (inferred from the
coarse and well-sorted sediments [37,65]) either through the
exertion of physical stress or through the low food availability that
comes with it, or both. Food shortage at GB1200 is suggested by
the low amounts of phytopigments, nitrogen and organic matter
within the sediments. In support, Thistle and Levin [81]
documented reduced nematode abundances under experimental
strong near-bottom flow.
Opposed to Danovaro et al. [82], the longitudinal trophic
gradient was accompanied by a significant drop in individual
nematode biomass. Based on an extensive literature analysis,
Udalov et al. [83] described a positive effect of grain size and food
availability on individual nematode biomass. In contrast, Soetaert
et al. [84], who analyzed raw biomass data, found no effect of
grain size on individual biomass. In our study area, individual
nematode biomass decreased with increasing sedimentary mud
content, but strangely also with sedimentary TN concentrations.
This finding suggests that bulk TN concentrations might not
represent a suitable proxy for the amount of food available to
nematodes. Note that the lack of a relationship between nematode
size and labile phytodetritus, a potentially better measure for food
availability than TN, may be the result of the fact that we had to
average environmental and faunal variables per station, thereby
expunging (co)variation in both parameters at a smaller spatial
scale.
Benthic-pelagic Coupling: Effects on NematodeCommunity StructureThere was a highly significant and strong reduction in core
surface area from the GB region to the eastern Mediterranean
(Spearman rank, r = -0.74, P,0.001). Thus, since sample volume
might have an impact on genus composition (smaller samples
might contain comparatively less rare genera than larger sediment
samples), the observed longitudinal gradient could result partly
from the heterogeneity in core surface area. Nevertheless, the
generic composition of the nematode assemblages changed
gradually from the GB region to the eastern Mediterranean
together with several benthic environmental variables (TN, TOC
and TOM). The significance of (potential) food availability to the
structure of nematode assemblages was also demonstrated by
Ingels et al. [85] (TN, chl-a, chl-a:TOC) and Fonseca and
Soltwedel [86] (particulate proteins and phospholipids). Similar
to Fonseca and Soltwedel [86] (who studied nematode species
composition in the Arctic), we noted increased variability in
nematode community structure among replicate samples in
sediments with reduced phytopigment concentrations. Fonseca
and Soltwedel [86] invoked the energy-richness hypothesis [87] as
an explanation for this pattern. According to this hypothesis, low
energy levels result in small population sizes of species, and local
stochastic events restrict species’ distribution ranges.
The gradual change in nematode trophic structure from west
to east was mainly driven by the increased relative abundance
of predatory/scavenging nematodes (mainly Sphaerolaimus and
Metasphaerolaimus) with longitude. Although they found no
statistically significant relationship between predator/scavenger
abundance and longitude, Danovaro et al. [82] also noticed
a higher representation of this particular feeding guild in the
eastern compared to the western Mediterranean. The lower
fraction of predatory/scavenging nematodes in the more
productive western part of our transect implies that members
of this feeding guild do not relate directly to the supply of
surface-derived OM. As Gage [2] stated, in oligotrophic regions,
organisms feeding upon sedimented POC may suffer a disad-
vantage compared to those that do not. In support, Sibuet et al.
Figure 6. Longitudinal and bathymetrical trends in the relativeabundance of nematode feeding types. The basins sampled aredisplayed on the x-axis (GB: Galicia Bank region, A: Algerian basin, AP:Algero-Provencal basin, I: Ionian basin, L: Levantine basin) and areordered from west to east. The colour of the bars indicates approximatewater depth (1200 m: white, 1900 m: grey, 3000 m: dark grey). Barsrepresent average values; error bars denote standard errors. 1A:selective deposit feeder, 1B: non-selective deposit feeder, 2A: epistratefeeder, 2B: predator/scavenger).doi:10.1371/journal.pone.0059954.g006
Deep-Sea Nematode Communities
PLOS ONE | www.plosone.org 11 April 2013 | Volume 8 | Issue 4 | e59954

[88] counted most necrophagous amphipods at the most
oligotrophic site in the tropical Atlantic. In contrast, sediments
from the Nazare canyon [89] and from several Mediterranean
canyons [90], which receive high POC loadings, harbored
a higher percentage of predators/scavengers relative to adjacent
open slope stations. This paradox calls for more detailed
investigations into the environmental drivers of predator/
scavenger abundances.
Epistrate feeders were especially abundant at the GB seamount,
as observed for Maud Rise in the Antarctic [91] and for sediments
surrounding the Paluniro seamount in the western Mediterranean
[92]. However, at the Marsili seamount in the western Mediter-
ranean the share of epistrate feeders was limited and as such the
dominance of this feeding type in seamount sediments cannot be
generalized. Nevertheless, there were very few seamount studies
addressing nematode community structure with which we could
compare our results, and much more research in this field is
definitely needed.
ConclusionsAlong the longitudinal transect from the Galicia Bank region to
the eastern Mediterranean, downward benthic-pelagic coupling
was evident in terms of phytopigment concentrations, and in
standing stock, size, genus and trophic composition of nematodes
in bathyal and abyssal sediments. Standing stock seemed to be
regulated by POC deposition and benthic potential food indicators
(i.e. percentage of nitrogen, organic carbon, and total organic
matter), whereas genus composition was only related to the latter.
The significant relationship between nematode parameters and
POC flux does not necessarily imply these organisms feed upon
the sedimented OM directly; for instance bacteria, another
potential nematode food source, are often associated with
phytodetritus [93].
Climate change is expected to modify the biogeochemical
fluxes to the deep sea, which regulate the community structure
and function of deep-sea benthic communities [94]. Long-term
studies in the northeast Pacific and at the Porcupine abyssal
plain have revealed climate-driven variation in the community
structure of foraminiferans, mega- and macrofauna in abyssal
sediments [95]. The coupling between bathyal and abyssal
nematode assemblages and surface water processes, as evidenced
in the present study, suggests that it is likely that climate change
will affect the composition and function of deep-sea nematodes
as well.
Table 4. Spearman rank correlations between station-level nematode and environmental variables.
POC flux Chl-a CPE Chl-a:phaeo TOM TOC TN C:N MGS mud
Density 0.85** 0.62 0.60 0.12 20.52 20.88** 20.71 0.12 0.28 20.32
Ind. biomass 0.50 0.14 0.69 20.55 20.65 20.10 20.93** 0.76* 0.63 20.85**
Total biomass 0.77* 0.40 0.62 20.26 20.67 20.52 20.98*** 0.57 0.57 20.62
Genus comp. 0.02 20.17 0.30 20.23 0.44* 0.40* 0.40* 0.04 20.12 20.14
1A 0.20 0.17 20.14 0.45 0.25 20.76* 20.48 20.10 20.40 0.27
1B 20.08 0.24 0.31 0.14 0.15 0.14 0.05 20.05 20.02 20.08
2A 0.35 0.19 0.64 20.60 20.45 20.12 20.45 0.60 0.65 20.22
2B 20.57 20.38 20.64 0.17 0.37 0.60 0.79* 20.36 20.33 0.38
Environmental variables: POC flux (annual particulate organic carbon flux to the seafloor), chl-a (chlorophyll a), CPE (chloroplastic pigment equivalents), chl-a:phaeo(chlorophyll a: phaeopigments ratio), TOM (% of total organic matter), TOC (% of total organic carbon), TN (% of total nitrogen), C:N (molar carbon: nitrogen ratio) MGS(median grain size) and mud. Nematode variables: density, total and ind. biomass, and relative abundances of feeding types 1A (selective deposit feeders), 1B (non-selective deposit feeders), 2A (epistrate feeders) and 2B (predators/scavengers). Correlations between genus composition (genus comp.) and environmental variableswere obtained through the RELATE procedure. The number of asterisks denotes the statistical significance level with *P#0.05, **0.05,P#0.01, and ***0.01,P#0.001.doi:10.1371/journal.pone.0059954.t004
Figure 7. Within-station variability in nematode genus com-position in function of sedimentary phytopigment concentra-tions. Top: chlorophyll a (chl-a) concentrations. Bottom: chloroplasticpigment equivalents (CPE). Pigment data were missing for stationA1900. Only one sample was collected at L3000, prohibiting theassessment of within-station variability in community structure.doi:10.1371/journal.pone.0059954.g007
Deep-Sea Nematode Communities
PLOS ONE | www.plosone.org 12 April 2013 | Volume 8 | Issue 4 | e59954
Supporting Information
Table S1 Average (SE) relative meiofaunal taxon densi-ties (%) per station. The number of replicate deployments per
station can be found in Table 1.
(DOCX)
Acknowledgments
We are indebted to the crew and scientific personnel during expeditions
aboard the RV Belgica (Belgica cruise 2008/13b), RV Pelagia (cruises
64PE295–296 and 64PE314), RV Urania (BIOFUN cruise 2008) and
Sarmiento de Gamboa (BIOFUN 2009 Trans-Mediterranean cruise). Dr.
Murray Brown is greatly acknowledged for his help with the import of
satellite chlorophyll a data into GIS software. Dirk Van Gansbeke and Bart
Beuselinck are thanked for the analysis of granulometry and sediment
organics. We appreciated the help of Niels Viaene in measuring nematode
biovolume, and that of Annick Van Kenhove and Guy De Smet in
preparing slides for nematode identification.
Author Contributions
Conceived and designed the experiments: EP AV. Performed the
experiments: EP DOBJ EM TNB. Analyzed the data: EP. Contributed
reagents/materials/analysis tools: EP DOBJ EM. Wrote the paper: EP AV.
References
1. Lutz M, Dunbar R, Caldeira K (2002) Regional variability in the vertical flux ofparticulate organic carbon in the ocean interior. Global Biogeochem Cycles 16:
11–18.
2. Gage JD (2003) Food inputs, utilization, carbon flow and enegetics. In: Tyler P,
editor. Ecosystems of the World. 315–382.
3. De La Rocha CL, Passow U (2007) Factors influencing the sinking of POC and
the efficiency of the biological carbon pump. Deep-Sea Res II 54: 639–658.
4. Gorsky G, Prieur L, Taupier-Letage I, Stemmann L, Picheral M (2002) Large
particulate matter in the Western Mediterranean: I. LPM distribution related tomesoscale hydrodynamics. J Mar Syst 33–34: 289–311.
5. Gorsky G, Borgne RL, Picheral M, Stemmann L (2003) Marine snow latitudinaldistribution in the equatorial Pacific along 180u. J Geophys Res 108: 8146.
doi:10.1029/2001JC001064.
6. Zuniga D, Calafat A, Sanchez-Vidal A, Canals M, Price B, et al. (2007)
Particulate organic carbon budget in the open Algero-Balearic Basin (WesternMediterranean): Assessment from a one-year sediment trap experiment. Deep-
Sea Res I 54: 1530–1548.
7. Pfannkuche O (1993) Benthic response to the sedimentation of particulate
organic-matter at the Biotrans station, 47-degrees-N, 20-degrees-W. Deep-Sea
Res II 40: 135–149.
8. Pfannkuche O, Boetius A, Lochte K, Lundgreen U, Thiel H (1999) Responses of
deep-sea benthos to sedimentation patterns in the North-East Atlantic in 1992.Deep-Sea Res I 46: 573–596.
9. Duineveld GCA, Tselepides A, Witbaard R, Bak RPM, Berghuis EM, et al.(2000) Benthic-pelagic coupling in the oligotrophic Cretan sea. Prog Oceanogr
46: 457–480.
10. Galeron J, Sibuet M, Vanreusel A, Mackenzie K, Gooday AJ, et al. (2001)
Temporal patterns among meiofauna and macrofauna taxa related to changes insediment geochemistry at an abyssal NE Atlantic site. Prog Oceanogr 50: 303–
324.
11. Witte U, Aberle N, Sand M, Wenzhofer F (2003) Rapid response of a deep-sea
benthic community to POM enrichment: an in situ experimental study. Mar
Ecol Prog Ser 251: 27–36.
12. Ingels J, Van den Driessche P, De Mesel I, Vanhove S, Moens T, et al. (2010)
Preferred use of bacteria over phytoplankton by deep-sea nematodes in polarregions. Mar Ecol Prog Ser 406: 121–133.
13. Jeffreys RM, Lavaleye MSS, Bergman MJN, Duineveld GCA, Witbaard R(2011) Do abyssal scavengers use phytodetritus as a food resource? Video and
biochemical evidence from the Atlantic and Mediterranean. Deep-Sea Res I 58:415–428.
14. Aberle N, Witte U (2003) Deep-sea macrofauna exposed to a simulatedsedimentation event in the abyssal NE Atlantic: in situ pulse-chase experiments
using 13C-labelled phytodetritus. Mar Ecol Prog Ser 251: 37–47.
15. Witte U, Wenzhofer F, Sommer S, Boetius A, Heinz P, et al. (2003) In situ
experimental evidence of the fate of a phytodetritus pulse at the abyssal sea floor.Nature 424: 763–766.
16. Gooday AJ, Pfannkuche O, Lambshead PJD (1996) An apparent lack ofresponse by metazoan meiofauna to phytodetritus deposition in the bathyal
north-eastern Atlantic. J Mar Biol Ass UK 76: 297–310.
17. Pfannkuche O, Sommer S, Kahler A (2000) Coupling between phytodetritus
deposition and the small-sized benthic biota in the deep Arabian Sea: analyses of
biogenic sediment compounds. Deep-Sea Res II 47: 2805–2833.
18. Witbaard R, Dunieveld GCA, Van der Weele JA, Berghuis EM, Reyss JP (2000)
The benthic response to the seasonal deposition of phytopigments at thePorcupine Abyssal Plain in the North East Atlantic. J Sea Res 43: 15–31.
19. Rex MA, Etter RJ, Morris JS, Crouse J, McClain CR, et al. (2006) Globalbathymetric patterns of standing stock and body size in the deep-sea benthos.
Mar Ecol Prog Ser 317: 1–8.
20. Wei CL, Rowe GT, Escobar-Briones E, Boetius A, Soltwedel T, et al. (2010)
Global patterns and predictions of seafloor biomass using random forests. PlosOne 5: e15323.
21. Sommer S, Pfannkuche O (2000) Metazoan meiofauna of the deep Arabian Sea:standing stocks, size spectra and regional variability in relation to monsoon
induced enhanced sedimentation regimes of particulate organic matter. Deep-Sea Res II 47: 2957–2977.
22. Mokievskii V, Udalov A, Azovskii A (2007) Quantitative distribution of
meiobenthos in deep-water zones of the World Ocean. Oceanology 47: 797–
813.
23. Boon AR, Duineveld GCA (1996) Phytopigments and fatty acids as molecular
markers for the quality of near-bottom particulate organic matter in the North
Sea. J Sea Res 35: 279–291.
24. Stephens MP, Kadko DC, Smith CR, Latasa M (1997) Chlorophyll-a and
pheopigments as tracers of labile organic carbon at the central equatorial Pacific
seafloor. Geochim Cosmochim Acta 61: 4605–4619.
25. Soltwedel T (2000) Metazoan meiobenthos along continental margins: a review.
Prog Oceanogr 46: 59–84.
26. Neira C, Sellanes J, Levin LA, Arntz WE (2001) Meiofaunal distributions on the
Peru margin: relationship to oxygen and organic matter availability. Deep-Sea
Res I 48: 2453–2472.
27. Tselepides A, Lampadariou N, Hatziyanni E (2004) Distribution of meiobentbos
at bathyal depths in the Mediterranean Sea. A comparison between sites of
contrasting productivity. Sci Mar 68: 39–51.
28. Lampadariou N, Tselepides A, Hatziyanni E (2009) Deep-sea meiofaunal and
foraminiferal communities along a gradient of primary productivity in the
eastern Mediterranean Sea. Sci Mar 73: 337–345.
29. Danovaro R, Croce della R, Eleftheriou A, Fabiano M, Papadopoulou N, et al.
(1995) Meiofauna of the deep eastern Mediterranean Sea: distribution and
abundance in relation to bacterial biomass, organic matter composition and
other environmental factors. Prog Oceanogr 36: 329–341.
30. Shimanaga M, Nomaki H, Suetsugu K, Murayama M, Kitazato H (2007)
Standing stock of deep-sea metazoan meiofauna in the Sulu Sea and adjacent
areas. Deep-Sea Res II 54: 131–144.
31. Tietjen JH (1984) Distribution and species diversity of deep-sea nematodes in the
Venezuela basin. Deep-Sea Res I 31: 119–132.
32. Flach E, Muthumbi A, Heip C (2002) Meiofauna and macrofauna community
structure in relation to sediment composition at the Iberian margin compared to
the Goban Spur (NE Atlantic). Prog Oceanogr 52: 433–457.
33. Tselepides A, Lampadariou N (2004) Deep-sea meiofaunal community structure
in the Eastern Mediterranean: are trenches benthic hotspots? Deep-Sea Res I
51: 833–847.
34. Soetaert K, Vanaverbeke J, Heip C, Herman PMJ, Middelburg JJ, et al. (1997)
Nematode distribution in ocean margin sediments of the Goban Spur (northeast
Atlantic) in relation to sediment geochemistry. Deep-Sea Res I 44: 1671–1683.
35. Joint I, Groom SB, Wollast R, Chou L, Tilstone GH, et al. (2002) The response
of phytoplankton production to periodic upwelling and relaxation events at the
Iberian shelf break: estimates by the C-14 method and by satellite remote
sensing. J Mar Syst 32: 219–238.
36. McClain CR, Chao SY, Atkinson LP, Blanton JO, Decastillejo F (1986) Wind-
driven upwelling in the vicinity of Cape Finisterre, Spain. Journal of Geophysical
Research-Oceans 91: 8470–8486.
37. Duineveld GCA, Lavaleye MSS, Berghuis EM (2004) Particle flux and food
supply to a seamount cold-water coral community (Galicia Bank, NW Spain).
Mar Ecol Prog Ser 277: 13–23.
38. Tyler PA (2003) The peripheral deep seas. In: Tyler PA, editor. Ecosystems of
the World. Amsterdam: Elsevier. 261–293.
39. Danovaro R, Dinet A, Duineveld G, Tselepides A (1999) Benthic response to
particulate fluxes in different trophic environments: a comparison between the
Gulf of Lions-Catalan Sea (western-Mediterranean) and the Cretan Sea (eastern-
Mediterranean). Prog Oceanogr 44: 287–312.
40. Turley CM, Bianchi M, Christaki U, Conan P, Harris JRW, et al. (2000)
Relationship between primary producers and bacteria in an oligotrophic sea -
the Mediterranean and biogeochemical implications. Mar Ecol Prog Ser 193:
11–18.
41. D’Ortenzio F, Ribera d’Alcala M (2009) On the trophic regimes of the
Mediterranean Sea: a satellite analysis. Biogeosciences 6: 139–148. doi:10.5194/
bg-6-139-2009.
42. Bergamasco A, Malanotte-Rizzoli P (2010) The circulation of the Mediterranean
Sea: a historical review of experimental investigations. Advances in Oceanog-
raphy and Limnology 1: 11–28.
Deep-Sea Nematode Communities
PLOS ONE | www.plosone.org 13 April 2013 | Volume 8 | Issue 4 | e59954

43. Estrada M (1996) Primary production in the northwestern Mediterranean. Sci
Mar 60: 55–64.44. Bosc E, Bricaud A, Antoine D (2004) Seasonal and interannual variability in
algal biomass and primary production in the Mediterranean Sea, as derived
from 4 years of SeaWiFS observations. Global Biogeochemical Cycles 18:GB1005.
45. Bett BJ, Vanreusel A, Vincx M, Soltwedel T, Pfannkuche O, et al. (1994)Sampler bias in the quantitative study of deep-sea meiobenthos. Mar Ecol Prog
Ser 104: 197–203.
46. Galeron J, Sibuet M, Mahaut ML, Dinet A (2000) Variation in structure andbiomass of the benthic communities at three contrasting sites in the tropical
Northeast Atlantic. Mar Ecol Prog Ser 197: 121–137.47. Wentworth CK (1922) A scale of grade and class terms for clastic sediments.
J Geol 30: 377–392.48. Lorenzen CJ, Jeffrey SW (1980) Determination of chlorophyll in seawater.
Unesco Tech Pap Mar Sci 35: 1–20.
49. Behrenfeld MJ, Falkowski PG (1997) Photosynthetic rates derived from satellite-based chlorophyll concentration. Limnol Oceanogr 42: 1–20.
50. Lutz MJ, Caldeira K, Dunbar RB, Behrenfeld MJ (2007) Seasonal rhythms ofnet primary production and particulate organic carbon flux to depth describe the
efficiency of biological pump in the global ocean. Journal of Geophysical
Research-Oceans 112. doi:10.1029/2006JC003706.51. Heip C, Vincx M, Vranken G (1985) The ecology of marine nematodes.
Oceanogr Mar Biol Ann Rev 23: 399–489.52. Wieser W (1953) Die Beziehung zwischen Mundhohlengestalt, Ernahrungsweise
und Vorkommen bei freilebenden marinen Nematoden. Eine okologisch-morphologische Studie. Ark Zool 4: 439–483.
53. Andrassy I (1956) The determination of volume and weight of nematodes. Acta
Zool Hung 2: 1–15.54. Clarke K, Warwick R (2001) Change in marine communities: an approach to
statistical analysis and interpretation. Plymouth Marine Laboratory: PRIMER-ELtd.
55. R Core Team (2012) R: A Language and Environment for Statistical
Computing. Vienna, Austria: R Foundation for Statistical Computing. Avail-able: http://www.R-project.org/.
56. Kim S (2011) ppcor: Partial and Semi-partial (Part) correlation.57. Clarke K, Gorley R (2006) PRIMER v6: User Manual/tutorial. Plymouth:
Primer-E Ltd.58. Anderson MJ, Gorley RN, Clarke KR (2008) PERMANOVA+ for PRIMER:
guide for software and statistical methods. Plymouth: Primer-E Ltd.
59. Moutin T, Raimbault P (2002) Primary production, carbon export and nutrientsavailability in western and eastern Mediterranean Sea in early summer 1996
(MINOS cruise). J Mar Syst 33–34: 273–288.60. Claustre H, Morel A, Hooker SB, Babin M, Antoine D, et al. (2002) Is desert
dust making oligotrophic waters greener? Geophys Res Lett 29: 1469.
doi:10.1029/2001GL014056.61. Campbell J, Antoine D, Armstrong R, Arrigo K, Balch W, et al. (2002)
Comparison of algorithms for estimating ocean primary production from surfacechlorophyll, temperature, and irradiance. Global Biogeochemical Cycles 16. doi:
10.1029/2001gb001444.62. Carr M-E, Friedrichs MAM, Schmeltz M, Noguchi Aita M, Antoine D, et al.
(2006) A comparison of global estimates of marine primary production from
ocean color. Deep-Sea Res II 53: 741–770.63. Clark MR, Rowden AA, Schlacher T, Williams A, Consalvey M, et al. (2010)
The ecology of seamounts: structure, function, and human impacts. Ann RevMar Sci 2: 253–278.
64. Smith KL, Kaufmann RS, Baldwin RJ, Carlucci AF (2001) Pelagic-benthic
coupling in the abyssal eastern North Pacific: An 8-year time-series study of foodsupply and demand. Limnol Oceanogr 46: 543–556.
65. Van Weering TCE, De Stigter HC, Boer W, De Haas H (2002) Recent sedimenttransport and accumulation on the NW Iberian margin. Prog Oceanogr 52:
349–371.
66. Kerherve P, Heussner S, Charriere B, Stavrakakis S, Ferrand J-L, et al. (1999)Biogeochemistry and dynamics of settling particle fluxes at the Antikythira Strait
(Eastern Mediterranean). Prog Oceanogr 44: 651–675.67. Gardner WD (2000) Sediment trap sampling in surface waters. In: Hanson RB,
Ducklow HW, Field JG, editors. The Changing Ocean Carbon Cycle: Amidterm synthesis of the Joint Global Ocean Flux Study. New York: Cambridge
University Press. 240–281.
68. Ducklow H, Steinberg D, Buesseler K (2001) Upper ocean carbon export andthe biological pump. Oceanography 14: 50–58.
69. Legendre L, Rivkin RB (2002) Fluxes of carbon in the upper ocean: regulationby food-web control nodes. Mar Ecol Prog Ser 242: 95–109.
70. Siokou-Frangou I, Christaki U, Mazzocchi MG, Montresor M, D’ Alcala MR,
et al. (2010) Plankton in the open Mediterranean Sea: a review. Biogeosciences7: 1543–1586. doi:10.5194/bg-7-1543-2010.
71. Pusceddu A, Bianchelli S, Canals M, Sanchez-Vidal A, De Madron XD, et al.
(2010) Organic matter in sediments of canyons and open slopes of thePortuguese, Catalan, Southern Adriatic and Cretan Sea margins. Deep-Sea Res I
57: 441–457.
72. Gambi C, Danovaro R (2006) A multiple-scale analysis of metazoan meiofaunal
distribution in the deep Mediterranean Sea. Deep-Sea Res I 53: 1117–1134.
73. Relexans JC, Deming J, Dinet A, Gaillard JF, Sibuet M (1996) Sedimentary
organic matter and micro-meiobenthos with relation to trophic conditions in thetropical northeast Atlantic. Deep-Sea Res I 43: 1343–1368.
74. Burdige DJ (2007) Preservation of organic matter in marine sediments: controls,mechanisms, and an imbalance in sediment organic carbon budgets? Chem Rev
107: 467–485.
75. Mayer LM (1994) Relationships between mineral surfaces and organic carbon
concentrations in soils and sediments. Chem Geol 114: 347–363.
76. Hedges JI, Keil RG (1995) Sedimentary organic matter preservation: an
assessment and speculative synthesis. Mar Chem 49: 81–115.
77. Lampadariou N, Tselepides A (2006) Spatial variability of meiofaunalcommunities at areas of contrasting depth and productivity in the Aegean Sea
(NE Mediterranean). Prog Oceanogr 69: 19–36.
78. Bianchelli S, Gambi C, Zeppilli D, Danovaro R (2010) Metazoan meiofauna in
deep-sea canyons and adjacent open slopes: A large-scale comparison with focus
on the rare taxa. Deep-Sea Res I 57: 420–433.
79. Gambi C, Lampadariou N, Danovaro R (2010) Latitudinal, longitudinal andbathymetric patterns of abundance, biomass of metazoan meiofauna: impor-
tance of the rare taxa and anomalies in the deep Mediterranean Sea. Advances
in Oceanography and Limnology 1: 167–197.
80. Tecchio S, Ramirez-Llodra E, Sarda F, Company JB, Palomera I, et al. (2011)Drivers of deep Mediterranean megabenthos communities along longitudinal
and bathymetric gradients. Mar Ecol Prog Ser 439: 181–219.
81. Thistle D, Levin LA (1998) The effect of experimentally increased near-bottom
flow on metazoan meiofauna at a deep-sea site, with comparison data on
macrofauna. Deep-Sea Res I 45: 625–638.
82. Danovaro R, Gambi C, Lampadariou N, Tselepides A (2008) Deep-seanematode biodiversity in the Mediterranean basin: testing for longitudinal,
bathymetric and energetic gradients. Ecography 31: 231–244.
83. Udalov AA, Azovsky AI, Mokievsky VO (2005) Depth-related pattern in
nematode size: What does the depth itself really mean? Prog Oceanogr 67: 1–23.
84. Soetaert K, Franco M, Lampadariou N, Muthumbi A, Steyaert M, et al. (2009)
Factors affecting nematode biomass, length and width from the shelf to the deepsea. Mar Ecol Prog Ser 392: 123–132.
85. Ingels J, Tchesunov AV, Vanreusel A (2011) Meiofauna in the Gollum Channelsand the Whittard Canyon, Celtic Margin-How Local Environmental Conditions
Shape Nematode Structure and Function. Plos One 6: e20094. doi: 10.1371/journal.pone.0020094.
86. Fonseca G, Soltwedel T (2009) Regional patterns of nematode assemblages inthe Arctic deep seas. Pol Biol 32: 1345–1357.
87. Hawkins BA, Field R, Cornell HV, Currie DJ, Guegan J-F, et al. (2003) Energy,water and broad-scale geographic patterns of species richness. Ecology 84:
3105–3117.
88. Sibuet M, Albert Charmasson, Deming J, Dinet A, et al. (1993) The benthic
ecosystem in the 3 EUMELI sites in the northeast tropical Atlantic - generalperspectives and initial results on biological abundance and activities. Annales de
l’institut oceanographique 69: 21–30.
89. Ingels J, Kiriakoulakis K, Wolff GA, Vanreusel A (2009) Nematode diversity and
its relation to the quantity and quality of sedimentary organic matter in the deepNazare Canyon, Western Iberian Margin. Deep-Sea Res I 56: 1521–1535.
90. Soetaert K, Heip C (1995) Nematode assemblages of deep-sea and shelf breaksites in the North Atlantic and Mediterranean Sea. Mar Ecol Prog Ser 125: 171–
183.
91. Guilini K, Veit-Kohler G, Mayr C, De Troch M, Van Gansbeke D, et al. (in
press) Latitudinal and temporal variability in the community structure and fattyacid composition of deep-sea nematodes in the Southern Ocean. Prog Oceanog.
92. Pusceddu A, Gambi C, Zeppilli D, Bianchelli S, Danovaro R (2009) Organicmatter composition, metazoan meiofauna and nematode biodiversity in
Mediterranean deep-sea sediments. Deep-Sea Res II 56: 755–762.
93. Danovaro R, Marrale D, Della Croce N, Parodi P, Fabiano M (1999)
Biochemical composition of sedimentary organic matter and bacterialdistribution in the Aegean Sea: trophic state and pelagic-benthic coupling.
J Sea Res 42: 117–129.
94. Smith CR, De Leo FC, Bernardino AF, Sweetman AK, Arbizu PM (2008)
Abyssal food limitation, ecosystem structure and climate change. Trends EcolEvol 23: 518–528.
95. Smith KL, Ruhl HA, Bett BJ, Billett DSM, Lampitt RS, et al. (2009) Climate,carbon cycling, and deep-ocean ecosystems. Proc Natl Acad Sci U S A 106:
19211–19218.
Deep-Sea Nematode Communities
PLOS ONE | www.plosone.org 14 April 2013 | Volume 8 | Issue 4 | e59954
Top Related
Copyright © 2022 FDOKUMEN

