


Bahasa
Halaman
Hukum

Journal of Vibration and Control, in Press 1997
Automobile Passenger Comfort Assured Through
Lqg�Lqr Active Suspension
Hamid D� Taghirad
Center for Intelligent Machines� McGill University�
���� University St�� Montr�eal� Qu�ebec� Canada� H�A �A
Phone �� �� ��������� Fax �� �� �������� E�mail taghirad�cim�mcgill�ca
and
E� Esmailzadeh
Department of Mechanical Engineering
Sharif University of Technology
P�O� Box �������� Tehran� Iran�
Phone ����� �� ����� �� Fax ����� � ������� � E�mail esmailza�mech�sharif�ac�ir
Abstract� An analytical investigation of a half�car model including passenger dynamics� subjected to
random road disturbances is performed� and the advantage of active over conventional passive suspension
systems are examined� Two di�erent performance indices for optimal controller design are proposed� The
performance index is a quanti�cation of both ride comfort and road handling� Due to practical limitations�
all the states required for the state�feedback controller are not measurable� and thus must be estimated
with an observer� Stochastic inputs are applied to simulate realistic road surface conditions� and statistical
comparisons between passive system and the two controllers� with and without state estimator� are carried
out to gain a clearer insight into the performance of the controllers� The simulation results demonstrate
that an optimal observer�based controller� when including passenger acceleration in the performance index�
retains both excellent ride comfort and road handling characteristics�
Key Words� Active suspension� observer�based control� ride comfort� passenger dynamics�
� Introduction
Demands for better ride comfort and controllability of road vehicles has motivated many automotive
industries to consider the use of active suspensions� These electronically controlled suspension systems can
potentially improve the ride comfort as well as the road handling of the vehicle� Generally� a vehicle suspension
system may be categorised as either passive� semi�active or fully�active�
Passive suspension systems consist of conventional springs and shock absorbers used in most cars� The
springs are assumed to have almost linear characteristics� while� most of the shock absorbers exhibit nonlinear
�
relationship between force and velocity� In passive systems� these elements have �xed characteristics and�
hence� have no mechanism for feedback control� �Miller� ���
Semi�active suspensions provide controlled real�time dissipation of energy� �Crosby et al�� ����� For an
automotive suspension this is achieved through a mechanical device called an active damper which is used in
parallel to a conventional spring� The main feature of this system is the ability to adjust the damping of the
suspension system� without any use of actuators� This type of system requires some form of measurement
with a controller board in order to properly tune the damping�
Active suspension employs pneumatic or hydraulic actuators which in turn creates the desired force in the
suspension system� �Esmailzadeh� ����� and Wright et al�� �� � The actuator is secured in parallel with a
spring and shock absorber� Active suspension requires sensors to be located at di�erent points of the vehicle
to measure the motions of the body� suspension system and�or the unsprung mass� This information is used
in the online controller to command the actuator in order to provide the exact amount of force required�
Active suspensions may consume large amounts of energy in providing the control force� and therefore� in the
design procedure for the active suspension the power limitations of actuators should also be considered as an
important factor�
In any vehicle suspension system� there are a variety of performance parameters which need to be optimized�
Among them there are four important quantities which should be considered carefully in designing a suspension
system� namely� ride comfort� body motion� road handling� and suspension travel� The trade o� between ride
comfort and road handling characteristics is usually a trial and error procedure�Moreover� no suspension
system can simultaneously minimize all four of the above mentioned parameters� The advantage of controlled
suspension is that a better set of design trade�o�s are possible in comparison to passive systems �Miller� ���
State�feedback control for active suspension is a powerful tool for designing a controller� �Esmailzadeh et al��
����� and Shannon et al�� ���� In this approach a mathematical quanti�cation of ride comfort and road
handling will be optimized considering the actuator limitations� Since body motion and suspension travel are
also functions of the system states� they will also be optimized during the design�
Linear optimal control theory provides a systematic approach to design the active suspension controllers
�Chen� ����� and has been used by several investigators� Sinha et al� ���� and Caudill et al� ���� have
used this method to design active suspension controllers for railroad vehicles� Esmailzadeh ����� investigated
a pneumatic controlled active suspension for automobiles� Hrovat ������ ���� appends this method with the
concept of dynamic absorber for improved performance for quarter�car and half�car models� Elmadany �����
considered using integral and state feedback controllers for active suspension for half�car model� Shannan et al�
���� considered the lateral and longitudinal motion for a full car model� and implemented active controller
with linear optimal control� Observer based controller design is discussed by Alleyne et al� ������ Elmadany
et al� ����� and Rajamani et al� ������
In this study� we are again considering state�feedback control for active suspension� however� our intention
is not to compare this method with other control approaches� as done by Yue et al� ���� and Sharp et al�
����� We intend to emphasize the e�ective methodology of controller design in order to satisfy a preassigned
set of design criteria� In the numerical example given in this paper� the parameters of a typical mid size car are
�

used with the road information extracted from ISO� in order to illustrate how the methodology presented here
can be utilized to satisfy a speci�ed performance within the natural limitations of actuators and controllers�
There are two main contributions of the present research� First� we present a model of vehicle including
passenger dynamics� which to our knowledge is given little attention in the existing literature� This has
been accomplished in a framework of a half car model� which may be generalized further to a full�car model�
This research illustrates the importance of passenger dynamics� when the objective would be to improve the
passenger ride comfort as well as to satisfy the road handling requirements� Second� we developed a statistical
technique for quantitative comparison of the system� This method extracts useful quantitative data from the
time history of important variables� which results into relative ease in comparing di�erent methods� Here�
this approach is used to compare the two controller designs� with and without state estimation� to the passive
system� However� it can well be utilized as an e�ective platform for comparison of di�erent controller designs�
� Mathematical Modelling
This section is devoted to the mathematical modelling of vehicle� considering the passengers dynamics and
road disturbance� A linear model is considered to represent the vehicle�passenger dynamics� while a normal
random pro�le is used to model the road roughness�
��� Vehicle�Passenger Model
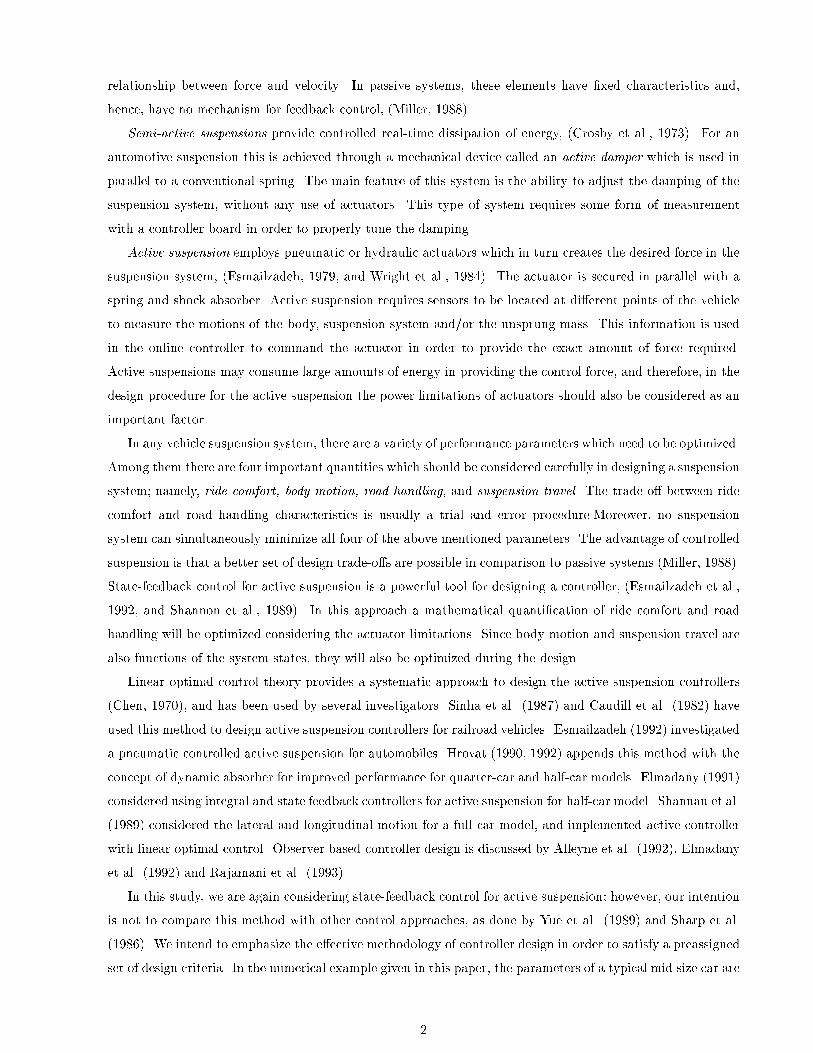
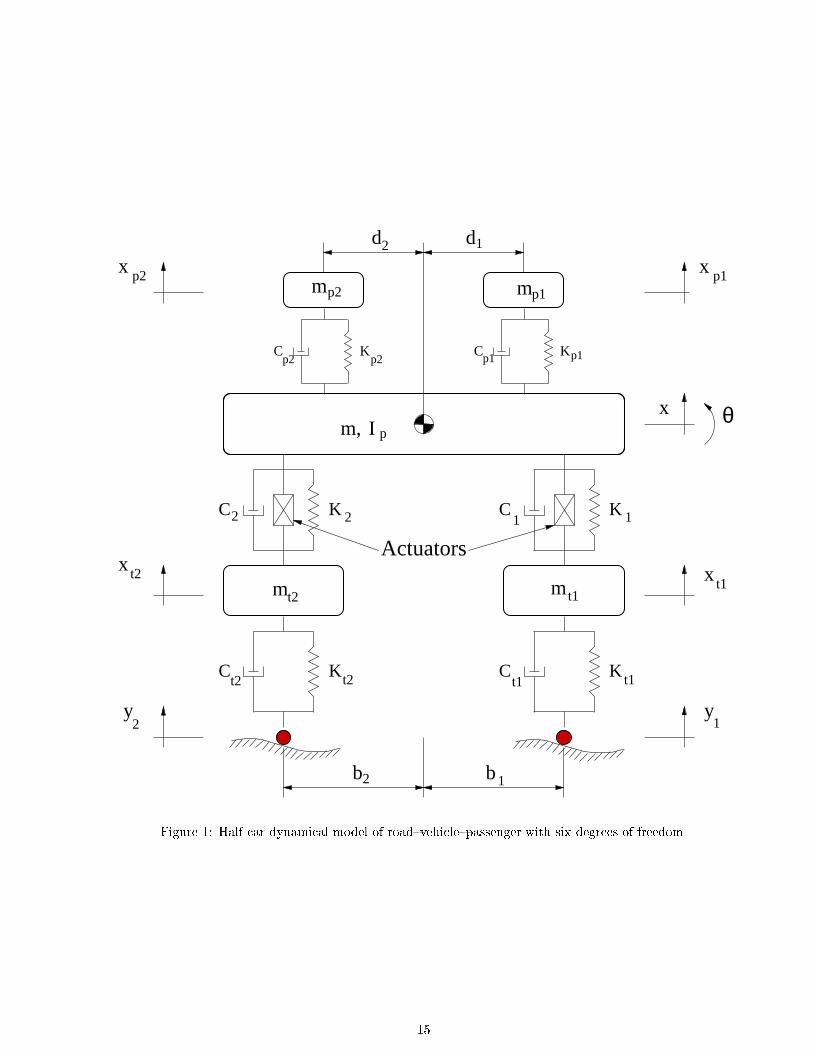
Figure � illustrates the half�car model of a passenger car� which has six degrees of freedom �� dof� The
model consisted of a body� two axles and two passengers� Body motions are considered to be bounce and
pitch� with every axle having its own bounce� The passengers are considered to have only vertical oscillations�
The suspension� tire� and passengers seats are modelled by linear springs in parallel to viscous dampers� The
actuators are considered to be a source of controllable force� and located parallel to the suspension spring and
shock absorber�
The system variable notations with their corresponding values are presented in Nomenclatures� The pa�
rameters related to the tires are denoted with subscript t� while� the passenger parameters have subscript p�
The system with six degrees of freedom are represented by the following states� body bounce� x� body pitch�
�� tire de�ection� xt�� xt�� and passenger vertical motions� xp�� xp��
The following equations of motion can be derived using Newton�Euler method�
�x � � �
m�k� � k� � kp� � kp�x� �
m�k�b� � k�b� � kp�d� � kp�d��
�kp�mxp� �
kp�mxp� �
k�mxt� �
k�mxt� �
cp�m�xp� �
cp�m�xp� �
c�m�xt� �
c�m�xt� ��
� �
m�c� � c� � cp� � cp� �x� �
m�c�b� � c�b� � cp�d� � cp�d� �� �
f��f�m
�� � � �
Ip�k�b� � k�b� � kp�d� � kp�d�x� �
Ip�k�b
�� � k�b
�� � kp�d
�� � kp�d
���
�kp�d�Ip
xp� �kp�d�Ip
xp� � k�b�Ip
xt� �k�b�Ip
xt� ��
� �
Ip�c�b� � c�b� � cp�d� � cp�d� �x� �
Ip�c�b
�� � c�b
�� � cp�d
�� � cp�d
����
�
� cp�d�Ip�xp� �
cp�d�Ip�xp� � c�b�
Ip�xt� �
c�b�Ip�xt� �
�
Ip�f�b� � f�b�
�xp� ��
mp��kp�x� kp�d�� � kp�xp� �
�
mp�
�cp� �x� cp�d� �� � cp� �xp�
���
�xp� ��
mp��kp�x� kp�d�� � kp�xp� �
�
mp�
�cp� �x� cp�d� �� � cp� �xp�
��
�xt� ��
mt��k�x� k�b�� � �k� � kt�xt� � kt�y� � f� ��
� �
mt�
�c� �x� c�b� �� � �c� � ct� �xt� � ct� �y�
�
�xt� ��
mt��k�x� k�b�� � �k� � kt�xt� � kt�y� � f� ��
� �
mt�
�c� �x� c�b� �� � �c� � ct� �xt� � ct� �y�
�
These equations can be simply written as a matrix equation�
�x � Ax�Bu�Gw ��
where the state vector x is composed of�
x �
�� x�
�x�
�� � x� � �x � � � xp� � xp� � xt� � xt��
T�
The input vector u representing the two actuator forces� while the disturbance vector w consists of road
disturbance�
u � �f� � f��T� w � �y� � y� � �y� � �y��
T��
The matrix representation of Equation � would be the basis for linear optimal controller design�
��� Road Roughness Model
In the early days of studying the performance of vehicles on rough roads� simple functions such as sine
waves� step functions� or triangular waves were generally applied as disturbances from the ground� While
these inputs provide a basic idea for comparative evaluation of designs� it is recognized that the road surface
is usually not represented by these simple functions� and therefore� the deterministic irregular shapes cannot
serve as a valid basis for studying the actual behaviour of the vehicle�
In this study a real road surface� taken as a random exciting function� is used as the input to the vehicle�
road model� Power spectral density �PSD analysis is used to describe the basic properties of random data�
Several attempts have been made to classify the roughness of a road surface� In this study� classi�cations
are based on the International Organization for Standardization �ISO� The ISO has proposed road roughness
classi�cation using the PSD values �ISO� ���� as shown in Table ��
To make use of the above mentioned classi�cation� a normal random input is generated with a variable
amplitude� Using fast Fourier transform�FFT� a trial and error attempt is proposed in order to obtain the
desired PSD characteristics of the random input� Table � illustrates the stochastical characteristics of the �nal
random input design� which corresponds to the poor road condition as being classi�ed by ISO�
Table �� Road roughness values classi�ed by ISO�
Degree of Roughness S��� ����
Road Class Range Geometric mean
A �Very good �
B �Good � �� ��
C �Average ��� �� �
D �Poor ��� ��� ���
E �Very poor ���� �� ���
F �� � ��� ���
G ���� ���� ���
H ���� �
� Optimal Controller Design
The performance characteristics which are of most interest when designing the vehicle suspension are
passengers ride comfort� body motion� road handling� and suspension travel� The passenger acceleration has
been used here as an indicator of ride comfort� Suspension travel and body motion are the states of the system�
but road handling is related to the tire de�ection� The controller should minimize all these quantities�
The linear time�invariant system� �LTI� is described by Equation �� For controller design it is assumed
that all the states are available and also can be measured exactly� First of all let us consider a state variable
feedback regulator�
u � �K � x ���
where K is the state feedback gain matrix� The optimization procedure consists of determining the control
input u� which minimizes the performance index� The performance index J represents the performance
characteristic requirement as well as the controller input limitations�
In this paper two di�erent approaches are taken in order to evaluate the performance index� and hence
designing the optimal controller� The �rst approach is the conventional method� in which only the system
states and inputs are penalized in the performance index� However� in the second approach special attention
is paid to the ride comfort and hence� the passenger acceleration terms are also included in the performance
Table �� Stochastical characteristic of road random disturbance�
Random Input Characteristics
Spatial �mm PSD �m��cycle
Min � � �
Max � ����� ����
Mean � ���� ����
STD �� ����� ����
�

index�
��� Conventional Method �CM�
In this method� the performance index J penalizes the state variables and the inputs� thus� it has the
standard form of�
J �
Z �
�
�xTQ x� uTR u
�dt ���
where Q and R are positive de�nite� being called weighting matrices� Here the passenger acceleration which
is an indicator of ride comfort is not being penalized�
To obtain a solution for the optimal controller introduced in Equation �� the LTI system must be stabiliz�
able� �Bryson et al�� ����� This condition unlike controllability is rather more accessible� A system is de�ned
stabilizable when only the unstable modes are controllable� Therefore� for a system with no unstable mode�
being the case considered in this paper� the optimal solution is guaranteed�
Linear optimal control theory provides the solution of Equation �� in the form of Equation ��� The gain
matrix K is computed from�
K � R��BTP ���
where the matrix P is evaluated being the solution of the Algebraic Riccati Equation� �ARE�
AP�ATP�PBR��BTP�Q � � ���
Equation � for the optimal closed�loop system� being used for computer simulation� can be written in the form
of�
�x � �A�BKx�Gw ��
��� Acceleration Dependent Method �ADM�
In this method the two passenger accelerations are included in the performance index� Suppose that the
vector z represents the passengers acceleration� in the form of�
z �
�� �xp�
�xp�
�� ���
The performance index can be written in the following form
J�
Z �
�
�xTQ x� uTR u� zTS z
�dt ���
The weighting matrix for acceleration terms in the simple case may be assumed diagonal�
S �
�� S� �
� S�
�� ���
Therefore� Equation �� becomes
J�
Z �
�
�xTQx� uTRu� �xTp�S��xp� � �x
Tp�S��xp�
�dt ��
�

Equation � can be further modi�ed� since both passenger accelerations are linearly dependent on the state
variables� Hence�
�xp� � v� x � �xp� � v� x ���
where v� and v� are two constant row vectors depending on system parameters� Thus� Equation � can be
written as�
J�
Z �
�
�xT
�Q� vT� S�v� � v
T� S�v�
�x� uTRu
�dt ���
or in the simple form of
J �
Z �
�
�xTQn x� uTR u
�dt ���
where�
Qn � Q� vT� S�v� � v
T� S�v� ���
The optimal solution for Equation �� can be found in a similar manner to that of Equation ��� Equation ��
shows that the optimal solution and its �nal performance of the closed�loop system are directly related to the
initial values of weighting matrices� Q and R�
� Optimal Observer Design
In previous section we assumed that the state vector is available for use in the optimal state feedback
law� It might appear that the state feedback method is not applicable in practice� since the whole state
feedback is not available� However� it is possible to estimate the states of the system� provided the system is
detectable�This is done by designing a dynamical system called State Observer� It is possible to recover much
of the behavior of the state feedback law by using state estimates instead of states in the feedback law�
The input to the state observer is the measured outputs of the system y� which generally can be expressed
in the form
y � Cx� v ���
where� x is the system states� and v is the measurement noise� A typical sensor arrangement for passenger
cars can provide the relative suspension travel� and the relative passenger bounce� For this case�
C �
��
�� �b� � � � �
�� �b� � � � �
�� �d� � � � �
�� �d� � � � �
��
��
The observer structure is in the form of�
��x � A�x�Bu� L�y �C�x ���
where L is the optimal observer gain matrix� which produces an LQG optimal estimate of x� denoted as �x�
Similar to Section ���� L can be evaluated from�
L � PCTV�� ���
�
where P is the positive de�nite solution of the Riccati equation�
AP�PAT �PCTV��CP�W � � ���
and W � E�wwT ��V � E�vvT � are the plant disturbance and measurement noise covariances� Notice in
Equation ��� �x is a function of output y and input u� but the input u itself is generated by a state feedback
law as
u � �K�x ��
Therefore� for simulation purpose we can augment the system dynamic equation �Equation �� with that of
the observer�Equation ���� and solve the whole at once as illustrated by the following equation��� �x
��x
�� �
�� A �BKLC A�BK� LC
�� �
�� x
�x
���
�� G �
� L
�� �
�� w
v
�� ���
� Simulation Results
A program has been written using Matlab� to handle the controller and observer design and simulation�
For Controller design Equation ���� for observer design Equation ��� and for simulation Equation ��� are
the basis of the program�
��� Statistical Consideration
To have a quantitative comparison between the di�erent simulation results� a statistical approach is fol�
lowed� Since the input to the system is in the form of normal random distribution� it is expected to have
normal distributed outputs� Therefore� we can calculate useful probability values for the signals�
For a Gaussian normal distribution� the probability function of the random signal x�t can be written�
�Thomson� ���
Prob ���� � x�t � ��� �
�
�p��
R ����� e
� x�
��� dx � Erf�
�p�
����
and�
Prob �jx�tj � ��� �
�� Prob ���� � x�t � ��� � Erfc�
�p�
����
where � is the standard deviation �STD� � is a real number� Erf denotes error function and Erfc denotes
complementary error function�
In this study� some limits are assigned for all the states� both passenger acceleration� and actuator limits in
order to satisfy the required ride comfort� road handling� and the design restriction� These limits are illustrated

Table �� Variable limits assigned for the controller design�
Variables x � xp� xp� xt� xt� �xp� �xp� f� f�
Limits ���� ���� ���� ���� ���� ���� ���� g ���� g ��� ���
in Table �� The �rst condition in designing the controller is to satisfy these limits� This can be examined by
checking the probability values of the outputs�
For a quantitative comparison between the two controllers� for each variable the amount of bounding limit
with ��� probability is calculated� This quantity can be easily obtained using standard deviation of the signal
together with Equation ���� Let Erf�� represents the inverse error function� Then Equation �� will transform
to�
��� �p� Erf������ ���
and
x�� � ��� � � �mean�x�t� ���
where x�� represents the bounding limit of the random signal x with ��� probability� This quantity can be
used to compare di�erent designs quantitatively�
The problem of controller design is then a challenge of �nding suitable weightings that satis�es the design
performances� This can be done by trying an arbitrary weighting matrixW and comparing the resultant x�� of
the closed loop system to the prescribed limits� and adjusting the weighting elements due to this comparison�
This methodology has been forwarded for a typical mid size car and the results are illustrated in Figures � �
��
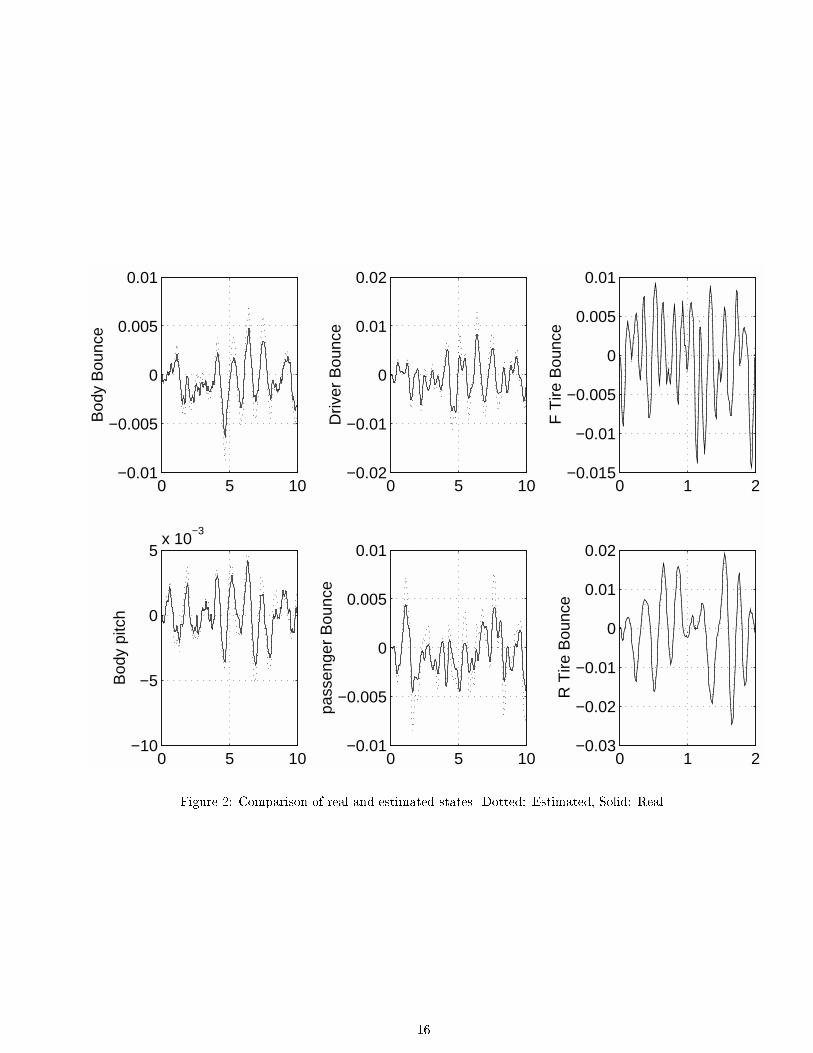
��� Observer Performance
Figure � compares the estimated states to the real ones� The numerical values used in the simulation for
system parameters are given in Nomenclature� As it is clearly illustrated� the estimated states� despite the
randomness of the signal is quite close to the real states� This performance is achieved by employing optimal
observer design� where both the speed of the response and its initial error is penalized in the optimization cost
function�
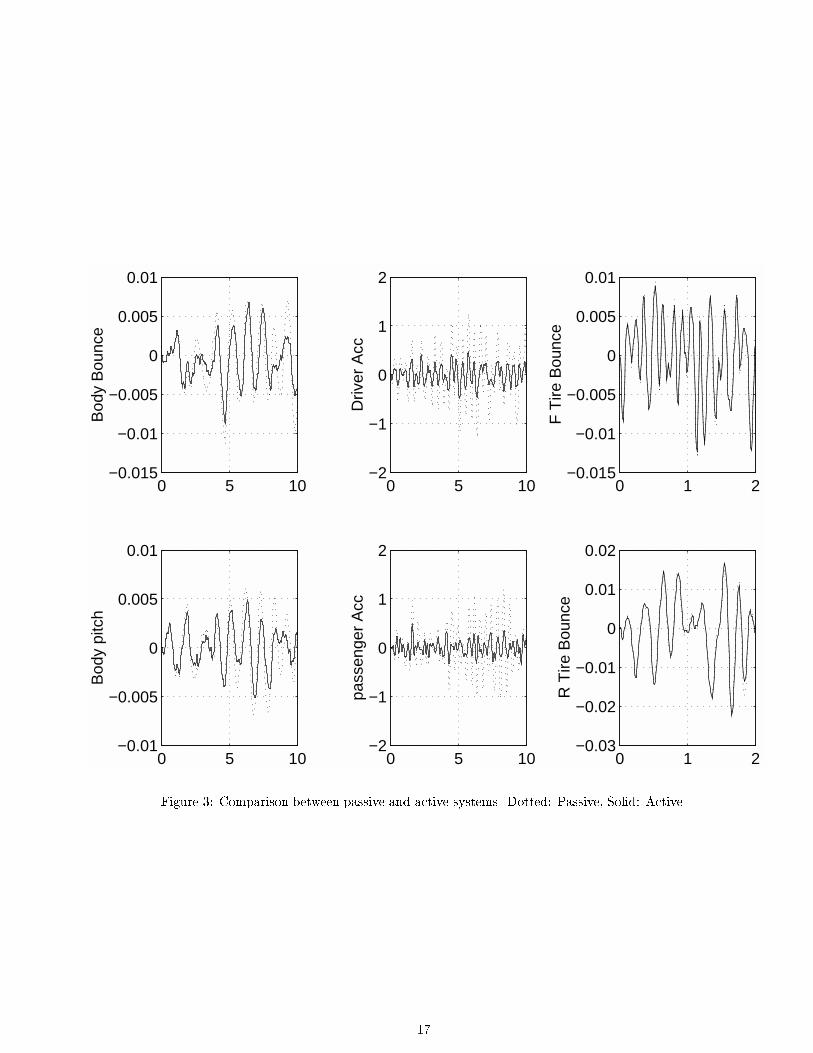
��� Active and Passive Comparison
Let us now examine the e�ect of active system to remedy the drawbacks of the passive system� Figure �
illustrates how the active suspension can e�ectively absorb the vehicle vibration in comparison to the passive
system� There are the body motions� passengers acceleration� and tires de�ection compared in this �gure�
acceleration dependent method �ADM is used for the controller design in the active system� The passenger
accelerations in the active system are reduced signi�cantly� which guarantee better ride comfort� Moreover�
the tire de�ection is also smaller in the active suspension system� therefore� it is concluded that the active
system retain both better ride comfort and road handling characteristics compared to the passive system�
Table gives quantitative comparison of these systems� which illustrates the system variables bounds with
�
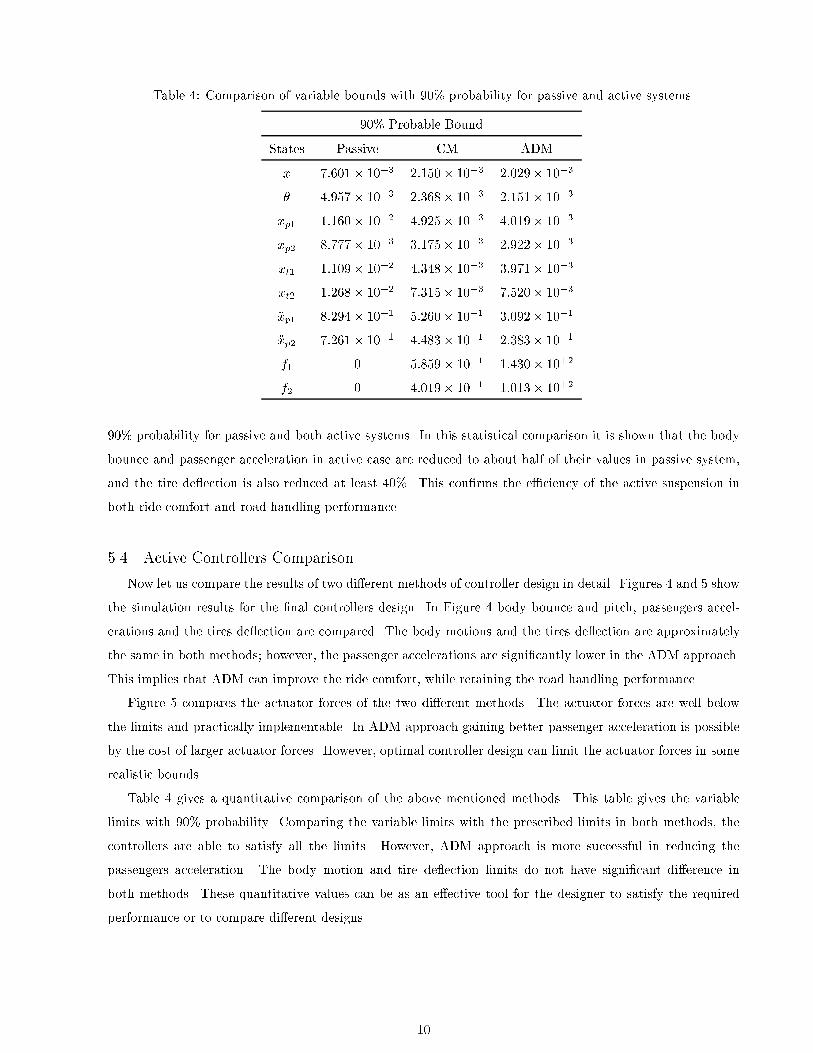
Table � Comparison of variable bounds with ��� probability for passive and active systems�
��� Probable Bound
States Passive CM ADM
x ������ ���� ������ ���� ������ ����
� ����� ���� ����� ���� ������ ����
xp� ������ ���� ����� ���� ����� ����
xp� ����� ���� ������ ���� ������ ����
xt� ������ ���� �� � ���� ������ ����
xt� ����� ���� ������ ���� ������ ����
�xp� ��� � ���� ������ ���� ������ ����
�xp� ������ ���� � �� ���� ����� ����
f� � ����� ���� �� ��� ����
f� � ����� ���� ������ ����
��� probability for passive and both active systems� In this statistical comparison it is shown that the body
bounce and passenger acceleration in active case are reduced to about half of their values in passive system�
and the tire de�ection is also reduced at least ��� This con�rms the e ciency of the active suspension in
both ride comfort and road handling performance�
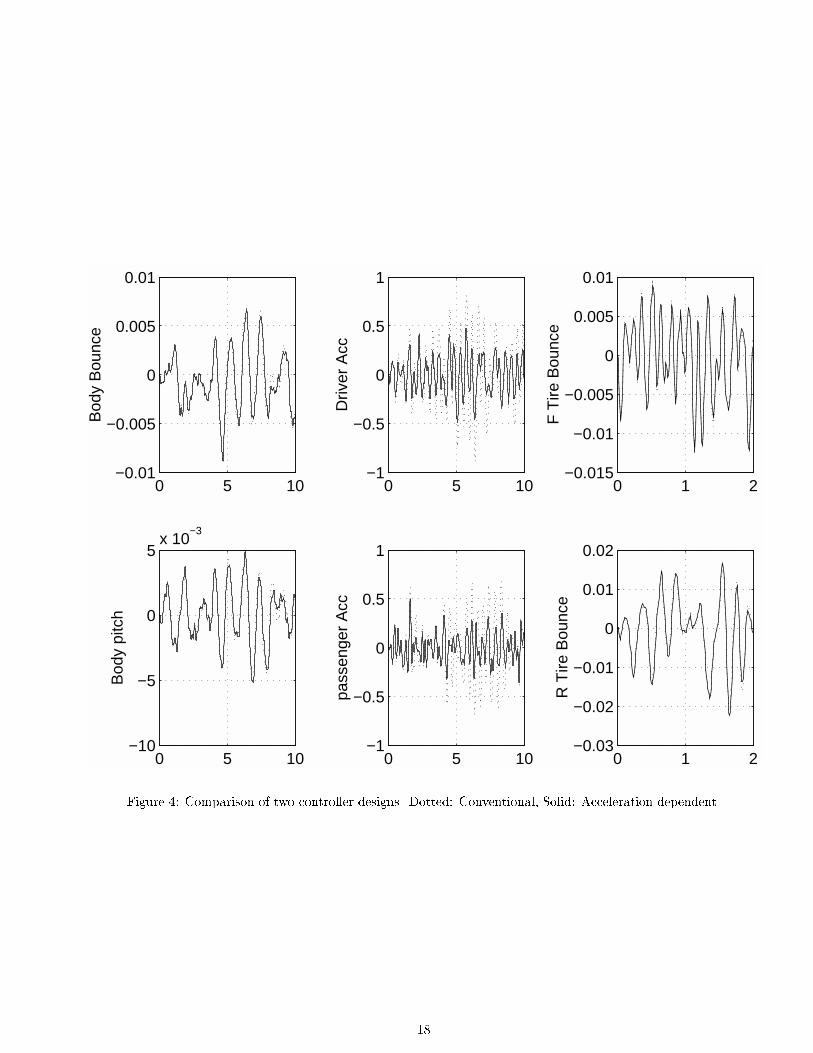
�� Active Controllers Comparison
Now let us compare the results of two di�erent methods of controller design in detail� Figures and � show
the simulation results for the �nal controllers design� In Figure body bounce and pitch� passengers accel�
erations and the tires de�ection are compared� The body motions and the tires de�ection are approximately
the same in both methods� however� the passenger accelerations are signi�cantly lower in the ADM approach�
This implies that ADM can improve the ride comfort� while retaining the road handling performance�
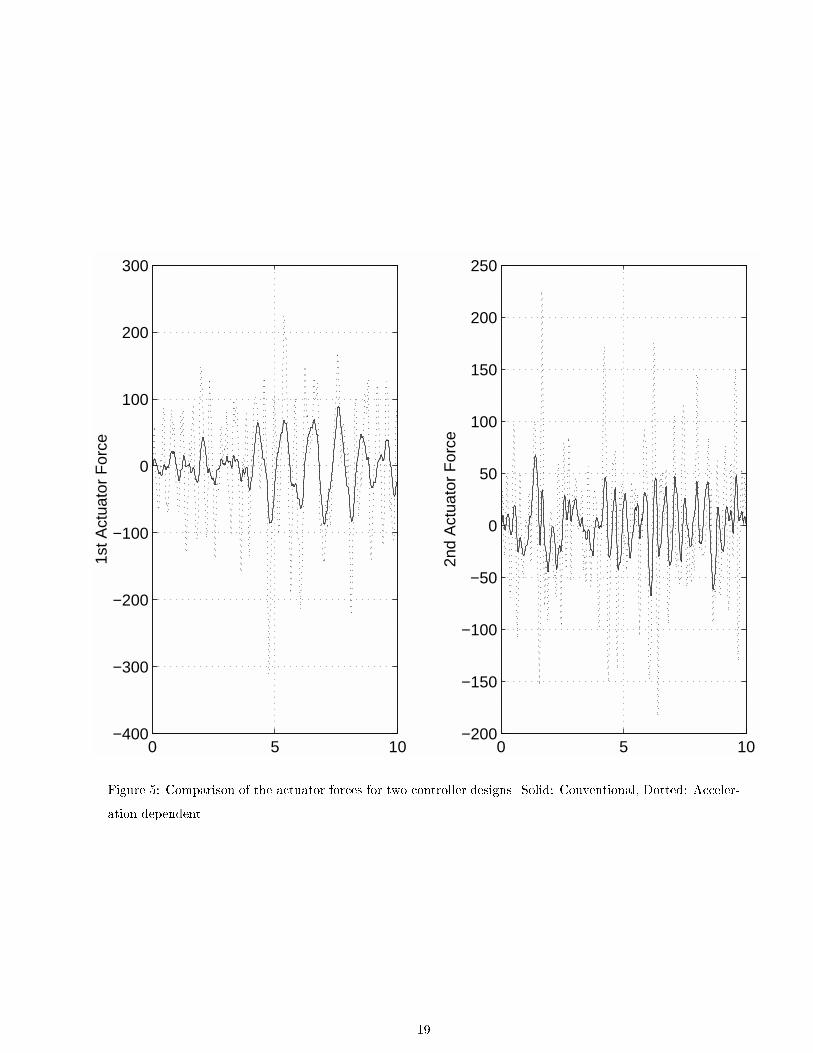
Figure � compares the actuator forces of the two di�erent methods� The actuator forces are well below
the limits and practically implementable� In ADM approach gaining better passenger acceleration is possible
by the cost of larger actuator forces� However� optimal controller design can limit the actuator forces in some
realistic bounds�
Table gives a quantitative comparison of the above mentioned methods� This table gives the variable
limits with ��� probability� Comparing the variable limits with the prescribed limits in both methods� the
controllers are able to satisfy all the limits� However� ADM approach is more successful in reducing the
passengers acceleration� The body motion and tire de�ection limits do not have signi�cant di�erence in
both methods� These quantitative values can be as an e�ective tool for the designer to satisfy the required
performance or to compare di�erent designs�
��
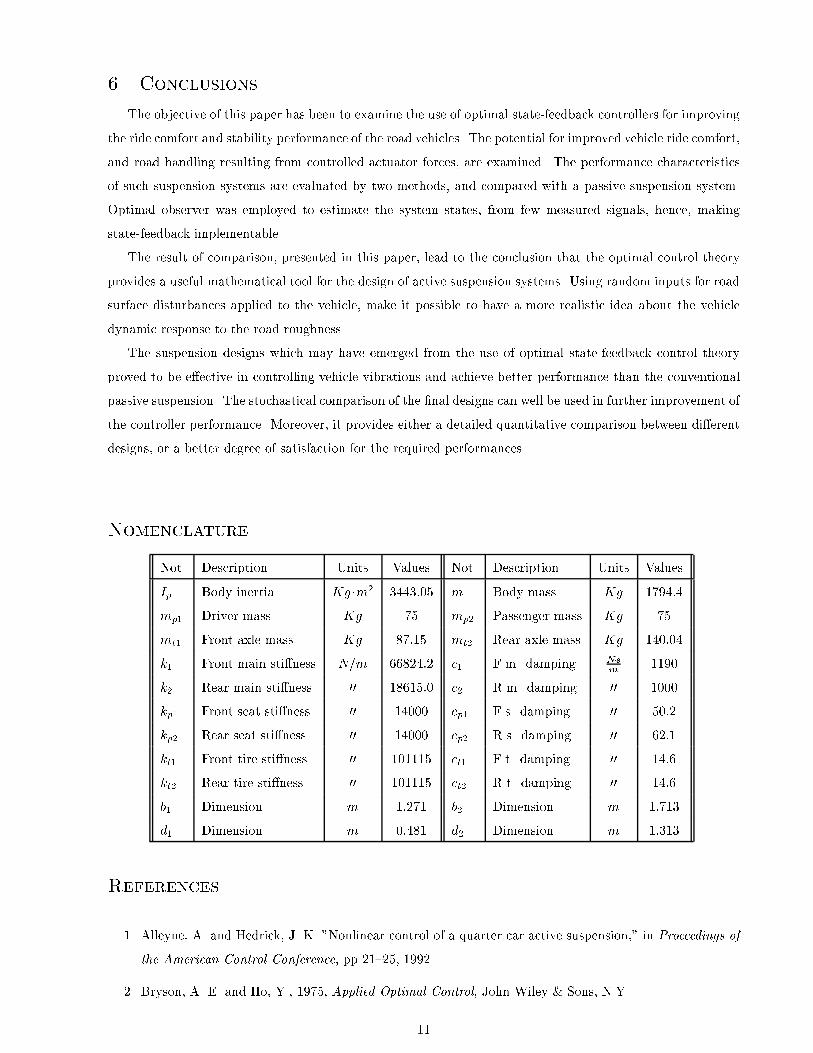
� Conclusions
The objective of this paper has been to examine the use of optimal state�feedback controllers for improving
the ride comfort and stability performance of the road vehicles� The potential for improved vehicle ride comfort�
and road handling resulting from controlled actuator forces� are examined� The performance characteristics
of such suspension systems are evaluated by two methods� and compared with a passive suspension system�
Optimal observer was employed to estimate the system states� from few measured signals� hence� making
state�feedback implementable�
The result of comparison� presented in this paper� lead to the conclusion that the optimal control theory
provides a useful mathematical tool for the design of active suspension systems� Using random inputs for road
surface disturbances applied to the vehicle� make it possible to have a more realistic idea about the vehicle
dynamic response to the road roughness�
The suspension designs which may have emerged from the use of optimal state�feedback control theory
proved to be e�ective in controlling vehicle vibrations and achieve better performance than the conventional
passive suspension� The stochastical comparison of the �nal designs can well be used in further improvement of
the controller performance� Moreover� it provides either a detailed quantitative comparison between di�erent
designs� or a better degree of satisfaction for the required performances�
Nomenclature
Not� Description Units Values Not� Description Units Values
Ip Body inertia Kg �m� � ���� m Body mass Kg ��� �
mp� Driver mass Kg �� mp� Passenger mass Kg ��
mt� Front axle mass Kg ���� mt� Rear axle mass Kg � ���
k� Front main sti�ness N�m ��� �� c� F�m� damping N�sm
����
k� Rear main sti�ness �� ������ c� R�m� damping �� ����
kp� Front seat sti�ness �� � ��� cp� F�s� damping �� ����
kp� Rear seat sti�ness �� � ��� cp� R�s� damping �� ����
kt� Front tire sti�ness �� ������ ct� F�t� damping �� � ��
kt� Rear tire sti�ness �� ������ ct� R�t� damping �� � ��
b� Dimension m ����� b� Dimension m �����
d� Dimension m �� � d� Dimension m �����
References
�� Alleyne� A� and Hedrick� J� K� !Nonlinear control of a quarter car active suspension�! in Proceedings of
the American Control Conference� pp ������ �����
�� Bryson� A� E� and Ho� Y�� ����� Applied Optimal Control� John Wiley " Sons� N�Y��
��
�� Caudill� R�J�� Sweet� L�M�� and Oda� K�� ���� !Magnetic guidance of conventional railroad vehicles�!
ASME J� of Dynamic Systems� Measurement and Control� �� ������ ��
� Chen� C� T�� ����� Introduction to Linear System Theory� Holt� Rinehart and Winston� Inc�� New York�
�� Crosby� M�J� and Karnopp� D�C�� ����� !The active damper�! Shock and Vibration Bulletin� ��������
���
�� Elmadany� M�M�� ����� !Integral and state variable feedback controllers for improved performance in
automotive vehicles�! Computers and Structures� ��������� �
�� Elmadany� M�M� and Samaha� M�E�� ����� !On the optimum ride control of a stochastic model of a
tractor�semitrailer vehile�! Journal of Sound and Vibration� �������������
� Esmailzadeh� E� ����� !Servo�valve controlled pneumatic suspensions�! J� of Mechanical Engineering
Science� ���������
�� Esmailzadeh E� and Bateni H�� ����� !Optimal active vehicle suspensions with full state feedback con�
trol�! SAE Transactions� Journal of Commercial Vehicles� ����� �����
��� Esmailzadeh E� and Taghirad H�D�� ����� !State�feedback control for passenger ride dynamics�! Trans�
actions of the Canadian Society for Mechanical Engineering� ��� � ������
��� Hrovat� D�� ����� !Optimal active suspension structures for quarter�car vehicle models�! Automatica�
����� �����
��� ISO� ���� !Reporting vehicle road surface irregularities�! Technical report� ISO� ISO�TC���SC��WG
N���
��� Krtolica� R� and Hrovat� D�� ����� !Optimal active suspension control based on a half�car model� An
analytical solution�! IEEE Trans� on Automatic Control� ��� ��������
� � Miller� L�R�� ��� !Tuning passive� semi�active� and fully active suspension system�! IEEE Proceedings
of the �th Conference on Decision and Control� pages �� �������
��� Rajamani� R� and Hedrick� J�K�� ����� !Adaptive observer for active automotive suspensions�! Proceed�
ings of the American Control Conference� pages ��������
��� Shannan� J�E� and Vanderploeg M�J�� ���� !A vehicle handling model with active suspensions�! J� of
Mechanisms� Transmissions� and Automation in Design� �������������
��� Sharp� R� and Hassan� S�� ���� !The relative performance of passive� active� and semi�active car sus�
pension systems�! Proc� of the Institution of Mechanical Engineers� ����D���������
�� Sinha� P�K�� Wormely� D�N�� and Hedrick� J�K�� ���� !Rail passenger vehicle lateral dynamic perfor�
mance improvement through active control�! ASME Publication� ��WA�DSC�� �
��� Thomson� W� T�� ��� Theory of Vibration with Application� Prentice�Hall� N�J�
��
��� Wright� P�G� and Williams� D�A� �� � !The application of active suspension to high performance road
vehicles�! ImechE� C���� �
��� Yue� C�� Butsuen� T�� and Hedrick� J�K�� ���� !Alternative control for automative active suspensions�!
ASME J� of Dynamic Systems� Measurement and Control� �����������
��
List of Figures
� Half�car dynamical model of road�vehicle�passenger with six degrees of freedom� � � � � � � � � ��
� Comparison of real and estimated states� Dotted� Estimated� Solid� Real� � � � � � � � � � � � � ��
� Comparison between passive and active systems� Dotted� Passive� Solid� Active� � � � � � � � � ��
Comparison of two controller designs� Dotted� Conventional� Solid� Acceleration dependent� � � �
� Comparison of the actuator forces for two controller designs� Solid� Conventional� Dotted�
Acceleration dependent� � � � � � � � � � � � � � � � � � � � � � � � � � � � � � � � � � � � � � � � � ��
List of Tables
� Road roughness values classi�ed by ISO� � � � � � � � � � � � � � � � � � � � � � � � � � � � � � � � �
� Stochastical characteristic of road random disturbance� � � � � � � � � � � � � � � � � � � � � � � � �
� Variable limits assigned for the controller design� � � � � � � � � � � � � � � � � � � � � � � � � � � �
Comparison of variable bounds with ��� probability for passive and active systems� � � � � � � ��
�
KC KC
KC
KC KC
x
KC
mt1
mp2
t1t1
1122
t2t2
p1
p
p1p1p2p2
Im,
m
m
t2
bb
dd
12
12
x
x
x
x
y y1
t1
p1p2
t2
2
θ
Actuators
Figure �� Half�car dynamical model of road�vehicle�passenger with six degrees of freedom�
��
0 5 10−0.01
−0.005
0
0.005
0.01
Bod
y B
ounc
e
0 5 10−10
−5
0
5x 10
−3
Bod
y pi
tch
0 5 10−0.02
−0.01
0
0.01
0.02
Driv
er B
ounc
e
0 5 10−0.01
−0.005
0
0.005
0.01
pass
enge
r B
ounc
e
0 1 2−0.015
−0.01
−0.005
0
0.005
0.01
F T
ire B
ounc
e
0 1 2−0.03
−0.02
−0.01
0
0.01
0.02R
Tire
Bou
nce
Figure �� Comparison of real and estimated states� Dotted� Estimated� Solid� Real�
��
0 5 10−0.015
−0.01
−0.005
0
0.005
0.01
Bod
y B
ounc
e
0 5 10−0.01
−0.005
0
0.005
0.01
Bod
y pi
tch
0 5 10−2
−1
0
1
2
Driv
er A
cc
0 5 10−2
−1
0
1
2
pass
enge
r A
cc
0 1 2−0.015
−0.01
−0.005
0
0.005
0.01
F T
ire B
ounc
e
0 1 2−0.03
−0.02
−0.01
0
0.01
0.02R
Tire
Bou
nce
Figure �� Comparison between passive and active systems� Dotted� Passive� Solid� Active�
��
0 5 10−0.01
−0.005
0
0.005
0.01
Bod
y B
ounc
e
0 5 10−10
−5
0
5x 10
−3
Bod
y pi
tch
0 5 10−1
−0.5
0
0.5
1
Driv
er A
cc
0 5 10−1
−0.5
0
0.5
1
pass
enge
r A
cc
0 1 2−0.015
−0.01
−0.005
0
0.005
0.01
F T
ire B
ounc
e
0 1 2−0.03
−0.02
−0.01
0
0.01
0.02R
Tire
Bou
nce
Figure � Comparison of two controller designs� Dotted� Conventional� Solid� Acceleration dependent�
�
0 5 10−400
−300
−200
−100
0
100
200
300
1st A
ctua
tor
For
ce
0 5 10−200
−150
−100
−50
0
50
100
150
200
250
2nd
Act
uato
r F
orce
Figure �� Comparison of the actuator forces for two controller designs� Solid� Conventional� Dotted� Acceler�
ation dependent�
��
Top Related
Copyright © 2022 FDOKUMEN

