The end of an assured tenancy as a forced move. Its incidence and experience
21
The end of an assured shorthold tenancy as a forced move. Its incidence and experience. Darren Baxter, The University of York [email protected]
Transcript of The end of an assured tenancy as a forced move. Its incidence and experience
The end of an assured shorthold tenancy as a forced move. Its
incidence and experience.
Darren Baxter, The University of [email protected]
Why study the end of assured shorthold tenancies
• Missing information – probably increasing, if not proportionally then numerically
• Policy relevance – Shelter report
• End of assured shorthold tenancies are feeding into homelessness
• Fits within wider debates – i.e. Precarity, flexibilisation of the labour market
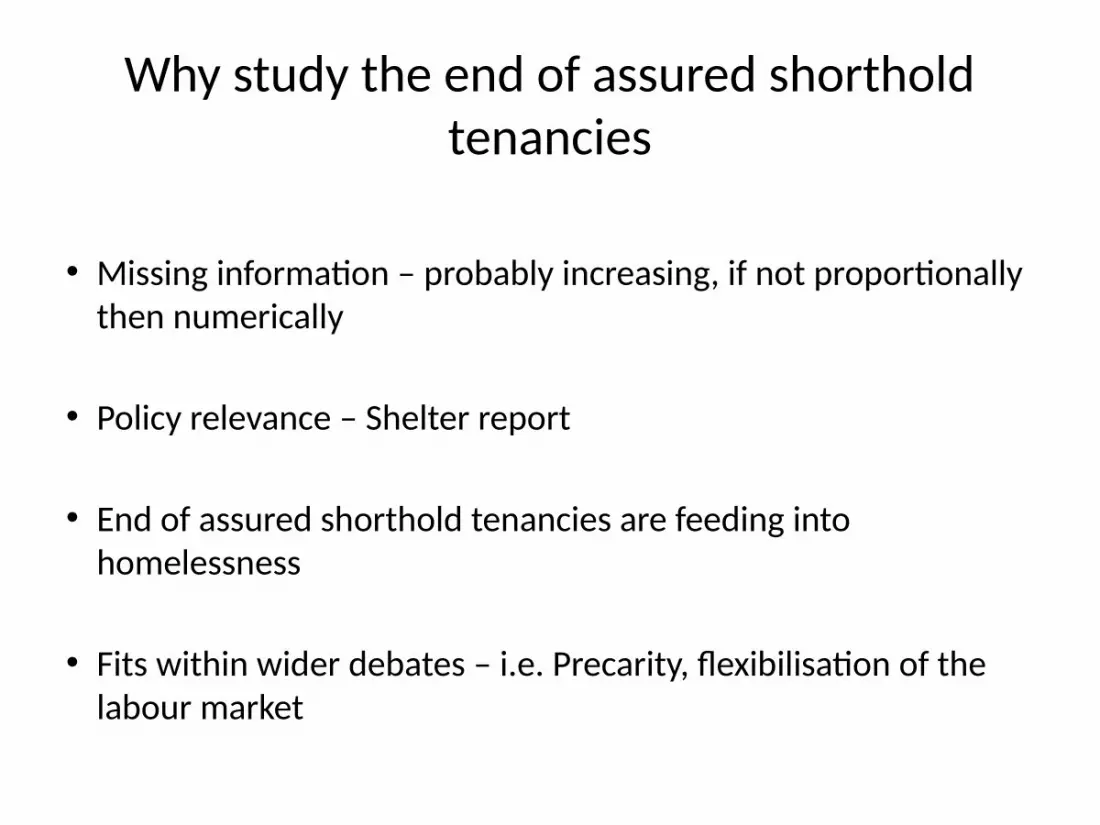
Evictions in the UK (1)
19901991
19921993
19941995
19961997
19981999
20002001
20022003
20042005
20062007
20082009
20102011
20122013
0
0.5
1
1.5
2
2.5
Possesion orders per 1000 of the population in the United Kingdom, 1990-2013
England and Wales - Full orders - Owner Oc-cupiedEngland and Wales - Suspended orders - Owner OccupiedNorthern Ireland - Full orders - Owner OccupiedEngland and wales - Orders - SRSScotland - Orders - SRSNorthern Ireland - Orders (combined SRS and PRS)England and Wales - Orders (Standard pro-cedure) - PRSEngland and Wales - Orders (accelarated pro-cedure) - PRS

Evictions in the UK (2)
Scotla
nd - Ord
ers - S
RS
Engla
nd and W
ales -
Orders
(Stan
dard proced
ure) - P
RS
Engla
nd and W
ales -
Susp
ended
orders - O
wner Occu
pied
Northern
Irelan
d - Ord
ers (c
ombined SR
S and PRS)
Engla
nd and W
ales -
Full o
rders - O
wner Occu
pied
Engla
nd and W
ales -
Orders (a
ccelar
ated pro
cedure)
- PRS
Engla
nd and w
ales -
Orders - S
RS
Northern
Irelan
d - Full o
rders - O
wner Occu
pied0
0.20.40.60.8
11.21.4
Possesion orders per 1000 of the population in the United Kingdom, 2012

Evictions in the UK (3)
What is an assured shorthold tenancy
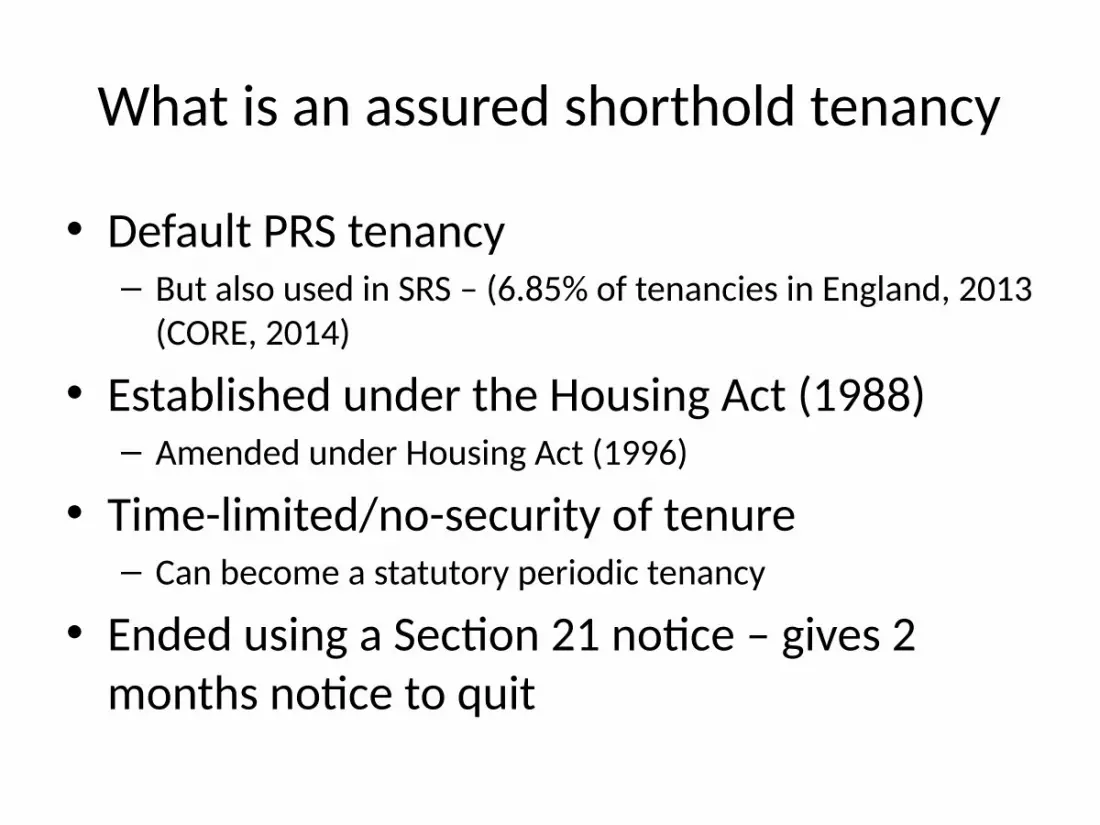
• Default PRS tenancy– But also used in SRS – (6.85% of tenancies in England, 2013
(CORE, 2014)
• Established under the Housing Act (1988)– Amended under Housing Act (1996)
• Time-limited/no-security of tenure– Can become a statutory periodic tenancy
• Ended using a Section 21 notice – gives 2 months notice to quit
Research questions
• What is the incidence of moves due to the end of an assured shorthold tenancy?
• What are the reasons behind the ending of tenancies?
• What the characteristics of moves and movers?

Methodology
• Secondary data analysis of the English Housing Survey 2012/13 and EU SILC housing conditions ad hoc module, 2012– Will look at 09/10,10/11,11/12 EHS datasets for
incidence
• Weights applied to EHS to apply findings to general population

Methodology• Looking at those who:
• Moved in the last three years
• Were previously renting on an assured shorthold tenancy
• Self reported that they ‘were asked to leave by their landlord/agent’
• Methodological challenges
• Retrospective questions
• Self reporting
Incidence
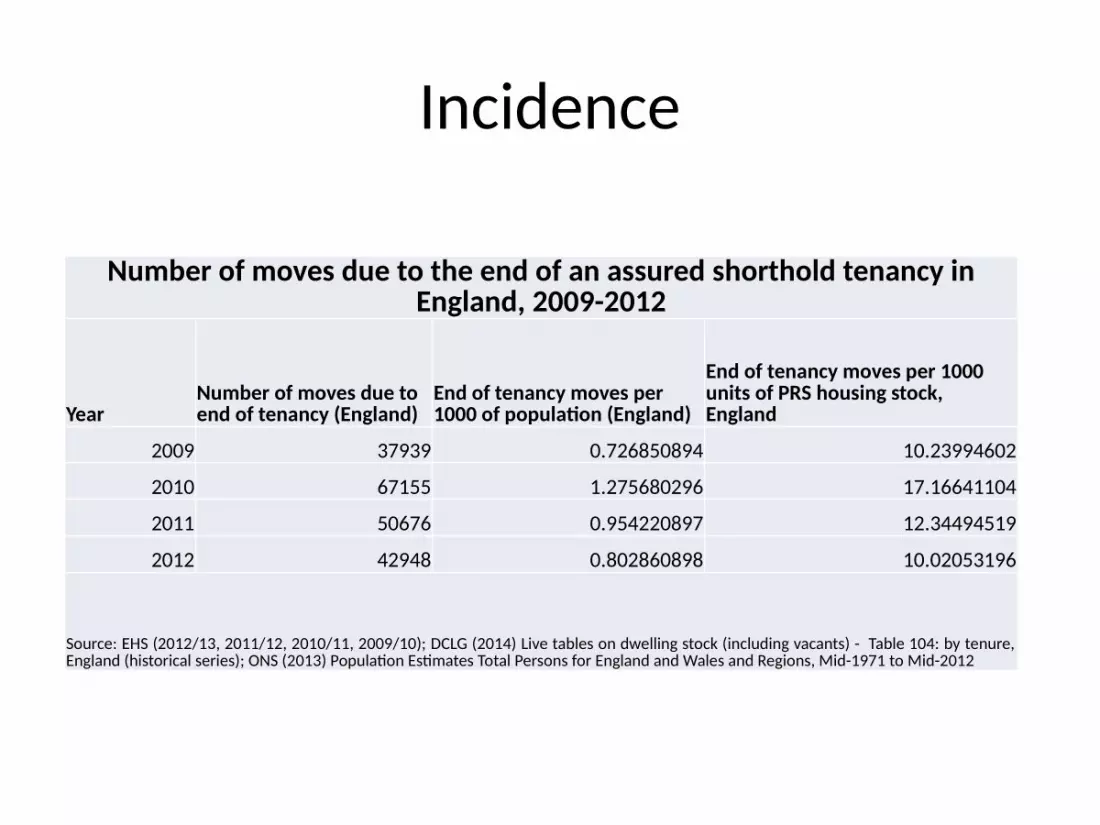
Number of moves due to the end of an assured shorthold tenancy in England, 2009-2012
YearNumber of moves due to end of tenancy (England)
End of tenancy moves per 1000 of population (England)
End of tenancy moves per 1000 units of PRS housing stock, England
2009 37939 0.726850894 10.23994602
2010 67155 1.275680296 17.16641104
2011 50676 0.954220897 12.34494519
2012 42948 0.802860898 10.02053196
Source: EHS (2012/13, 2011/12, 2010/11, 2009/10); DCLG (2014) Live tables on dwelling stock (including vacants) - Table 104: by tenure, England (historical series); ONS (2013) Population Estimates Total Persons for England and Wales and Regions, Mid-1971 to Mid-2012
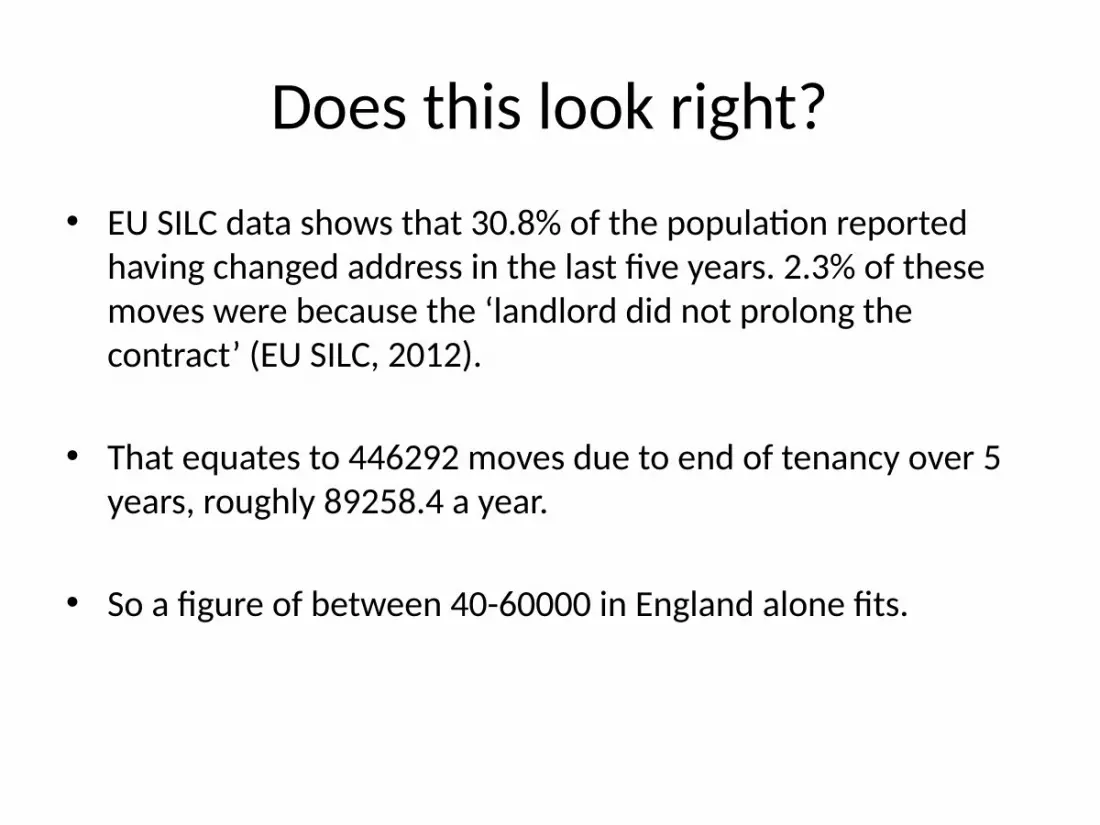
Does this look right?• EU SILC data shows that 30.8% of the population reported
having changed address in the last five years. 2.3% of these moves were because the ‘landlord did not prolong the contract’ (EU SILC, 2012).
• That equates to 446292 moves due to end of tenancy over 5 years, roughly 89258.4 a year.
• So a figure of between 40-60000 in England alone fits.

Incidence cont.
Owner occupied - Full orders Social rented - full orders Private rented sector - full orders
Ending by landlord of an assured shorthold tenancy
0
2
4
6
8
10
12
14
16
2
15
3
12
End of tenancy compared to traditional forms of reposession per 1000 dwelling stock, 2010-12 average
3 year average

Incidence cont.

Why are tenancies being ended?
Non paymen
t of re
nt
Difficu
lties with
paymen
t of H
ousing B
enefi
t/Local
Housing A
llowan
ce
Landlord
dissati
sfied or n
eighbours
complained
to la
ndlord
Landlord
wanted
to se
ll/use
propert
y
Problem
s with
property
Some o
ther rea
son0.00
10.0020.0030.0040.0050.0060.0070.00
11.59 3.62 0.91
62.86
0.96
23.69
Reason tenant asked to leave by their landlord, 2012
%

What are the characteristics of the moves?

Tenure (destination)
Owner occupied Private rented Social rented0
10
20
30
40
50
60
70
80
3
74
23
Destination tenure of those moving due the forced ending of an assured shorthold tenancy
%
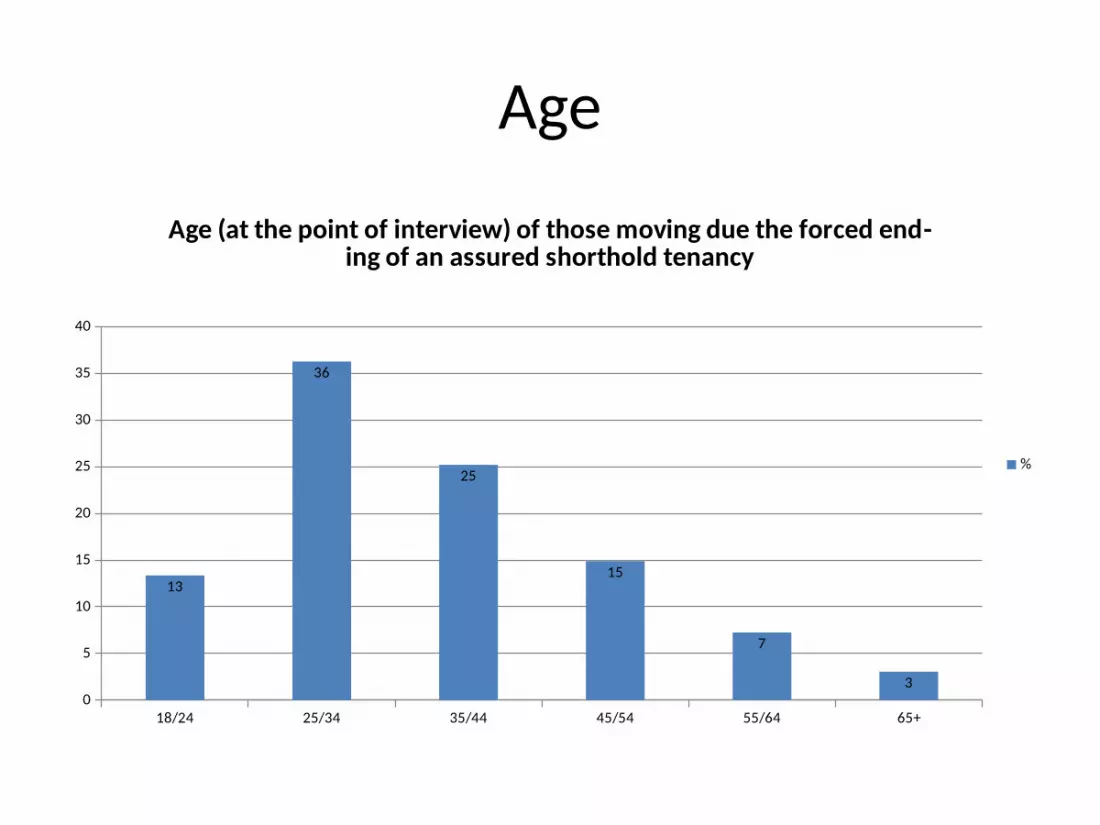
Age
18/24 25/34 35/44 45/54 55/64 65+0
5
10
15
20
25
30
35
40
13
36
25
15
7
3
Age (at the point of interview) of those moving due the forced end-ing of an assured shorthold tenancy
%
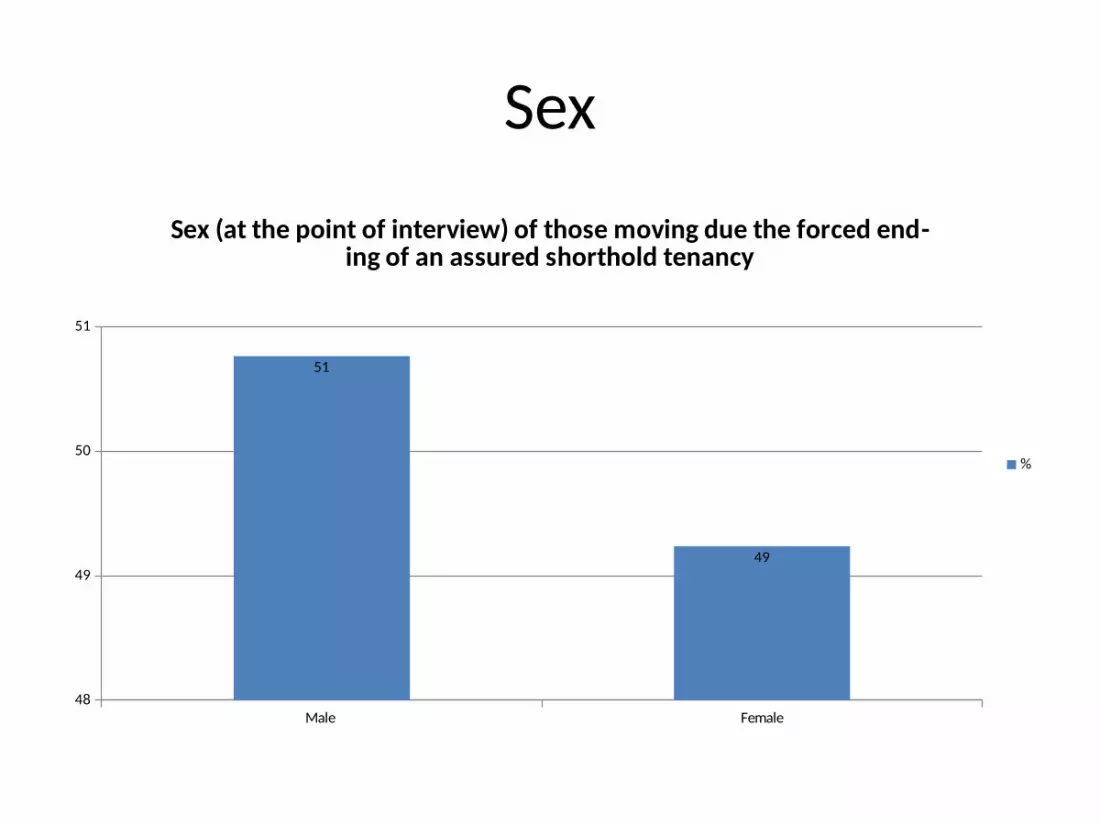
Sex
Male Female48
49
50
51
51
49
Sex (at the point of interview) of those moving due the forced end-ing of an assured shorthold tenancy
%
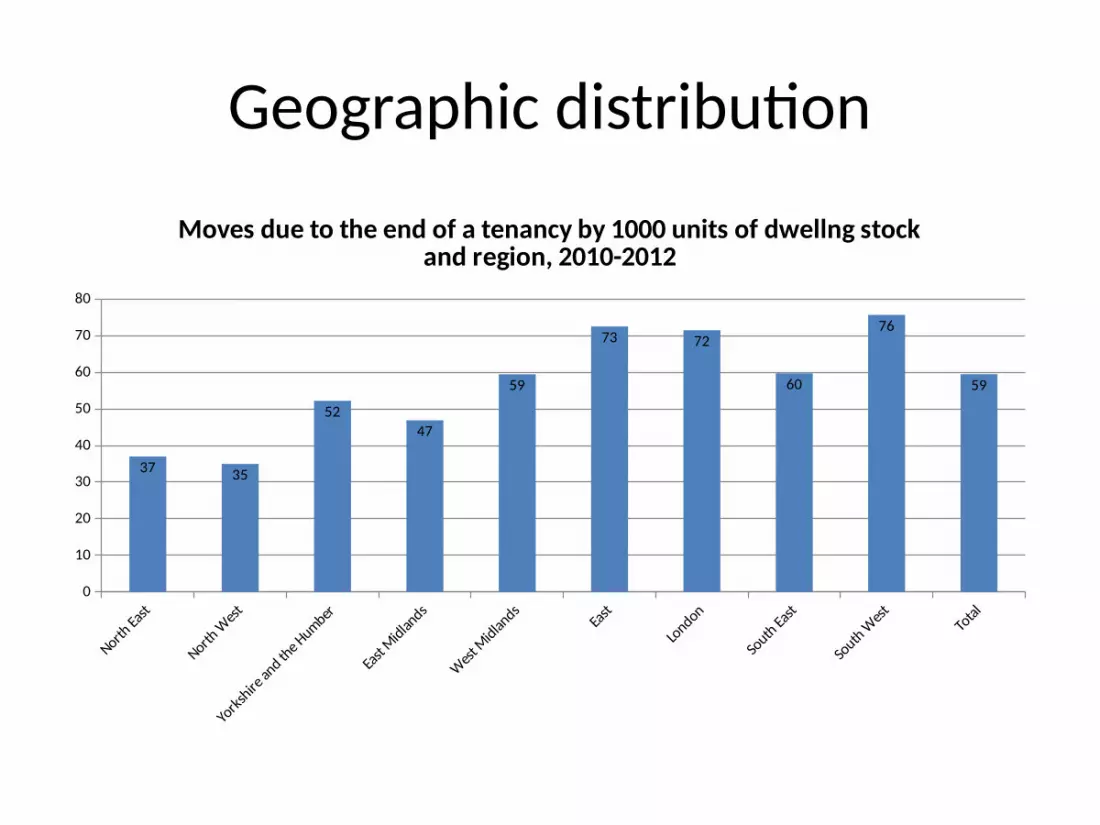
Geographic distribution
North Ea
st
North W
est
Yorks
hire an
d the H
umber
East M
idlands
West M
idlands
East
London
South Ea
st
South W
est Total
0
10
20
30
40
50
60
70
80
37 35
5247
59
73 72
60
76
59
Moves due to the end of a tenancy by 1000 units of dwellng stock and region, 2010-2012
Conclusions
• End of AST contributes notably to mobility – more so than other forms of eviction
• Reasons predominantly to with issues with tenant (although rent arrears a key reason) – calls into question landlord side security
• Moves predominantly made into the PRS• Housing markets appear to contribute to
mobility

Bibliography• DCLG (2014) Live tables on dwelling stock (including vacants) - Table 104: by tenure, England (historical
series)• CORE Statistics (2014) DCLG: London• English Housing Survey (2012/13) • EU SILC Housing Consitions Module, 2012• Ministry of Justice (2013) Table 5: Landlord possession claims in the County Courts of England and
Wales by type of procedure and landlord, 1990 - 2013• Ministry of Justice (2013) Table 5: Landlord possession claims in the County Courts of England and
Wales by type of procedure and landlord, 1990 - 2013• Northern Ireland Courts and Tribunals Service (2014) Table: County Court Ejectment Cases Disposed• ONS (2013) Population Estimates Total Persons for England and Wales and Regions, Mid-1971 to Mid-
2012 • The Scottish Government (2013) Eviction actions against council tenants: financial year 2001-02 to
latest avaiable: Notice of Proceedings Issued; The Scottish Government (2013) Eviction actions against council tenants: financial year 2001-02 to latest avaiable: Number of cases resulting in an eviciton order
• The Scottish Government (2014) Civil law statistics Scotland main tables, 2012-13: Table 18: Repossession and eviction cases initiated and disposed of in the Sheriff Courts, by case type, 2008-09-2012-13