


Bahasa
Halaman
Hukum

Automated web based system for bone age assessment using histogram technique. pp 107-121
Malaysian Journal of Computer Science. Vol. 25(3), 2012
107
AUTOMATED WEB BASED SYSTEM FOR BONE AGE ASSESSMENT
USING HISTORAM TECHNIQUE
Marjan Mansourvar¹, Ram Gopal Raj²,MaizatulAkmar Ismail
3,Sameem Abdul Kareem
4, Saravanan Shanmugam
5,
Shahrom Wahid6, Rohana Mahmud
7,RukainiHj. Abdullah
8, FarizaHanum Nasaruddin
9, Norisma Idris
10
1, 3, 9
Department of Information System, 2, 4, 7, 8, 10
Department of Artificial Intelligence, 5School of Computing Science and Engineering, VIT University
6Member of Forensic Science Society of Malaysia
Faculty of Computer Science and Information Technology, University of Malaya, 50603, Kuala Lumpur
Email:
ABSTRACT
Bone age assessment (BAA) is often used to evaluate the growth status of children as part of the detection of hormonal problems and genetic disorders. The determination of skeletal maturity is done based on a radiological examination of the hand-wrist skeletal area.This paper introduces a novel approach for BAA that utilizes a histogram based comparison technique. This approach is executed as a web based system that uses an image repository and similarity measures based on content-based image retrieval. This study aims to overcome to the limitations of traditional methods utilized to estimate human age which were often imprecise.The system provides age prediction for hand and wrist x-ray
images up till age of 18 years. The results of the system evaluation indicate this method as a reliable method for BAA with the error rates of -0.170625 years compared with BoneXpert system that have returned error rate of between ±0.46 to ±0.37 years.
Keywords: Forensic Science,Bone Age Assessment (BAA),ImageProcessing,Content Based Image Retrieval (CBIR),
Histogram.
1.0 INTRODUCTION
Determination of subject age based on radiological evidence, x-rays, or bone age assessment (BAA) is useful but time consuming process in clinical and forensic science. BAA is an important tool in diagnosing growth disorders in children, whether hormonal, potentially endocrine related, or genetic, [1].There is a considerable need for forensic age estimation, as a result of global growing in cross-border migration recently and as a guidelines applying to age assessment in criminal court. Estimation the chronological age of an unknown person is significant from the legal, criminal and ethical
viewas well as it is considerable for officially identificationthe individual and it is also the basis for investigating crimes, mass disasters, war crimes or asylum proceedings[2]. In radiology, BAA is performed on the left wrist and when a deviation or inconsistency from the chronological norm is detected, it is indicative of an abnormality in skeletal maturity, [3]. This type of analysis is also applicable in diagnosis of metabolic problems as well as in the management of bone dysplasia, [4].Subject age is prediction based on an
analysis of the four ossification zones in the hand, namely the epiphyses bone, the medial carpal, the radius as well as
Automated web based system for bone age assessment using histogram technique. pp 107-121
Malaysian Journal of Computer Science. Vol. 25(3), 2012
108
the ulna. The epiphysis will often begin to ossify within a few days of birth and will grow out from the initial central location with age. The development of the epiphysis will continue until the edges of the metaphyses appear. As adulthood approaches, the gap or strip between the epiphysis and metaphysis will begin to disappear. The carpal bones are also another feature that varies with age, primarily between the early stages of childhood and early adulthood. The carpals increase in size and change shape continuously until an optimal point is reached, [5]. Carpal bones will start to overlap in females of about 5 years of age and in males of about 7 years of age. This means that using this method for
BAA will not produce reliable results for children above 12 years of age, [6]. There are various standard ways of performing BAA, and although these ways may utilize different methods, all of them are performed using and x-ray image of the left hand and wrist. The difference in the methods is primarily in the comparison algorithm or technique used in the maturity assessment of the bones,[7]. The following section is a brief presentation of the various methods and techniques used in BAA.
2.0 RELATEDRESEARCH
While there is currently no preferred or at least standard method for BAA in clinical routine, the most popular methods are the Greulich and Pyle (G&P) method as well as the Tanner and Whitehouse (TW) method. Of the two, the G&P method is the more commonly used technique, primarily because it is faster and simpler to perform. The TW method is however, the more accurate of the two, [6].
In the G&P method, the left hand and wrist x-ray is compared with a standard atlas of radiographs, composed of left hand and wrist x-ray image samples that have been categorized into their respective age groups. The gender of the subject being compared is important, for as mentioned earlier, females’ bones reach the relevant growth stages earlier than that of males. Thus the atlas used in the G&P method is segregated into male and female sections, [4].
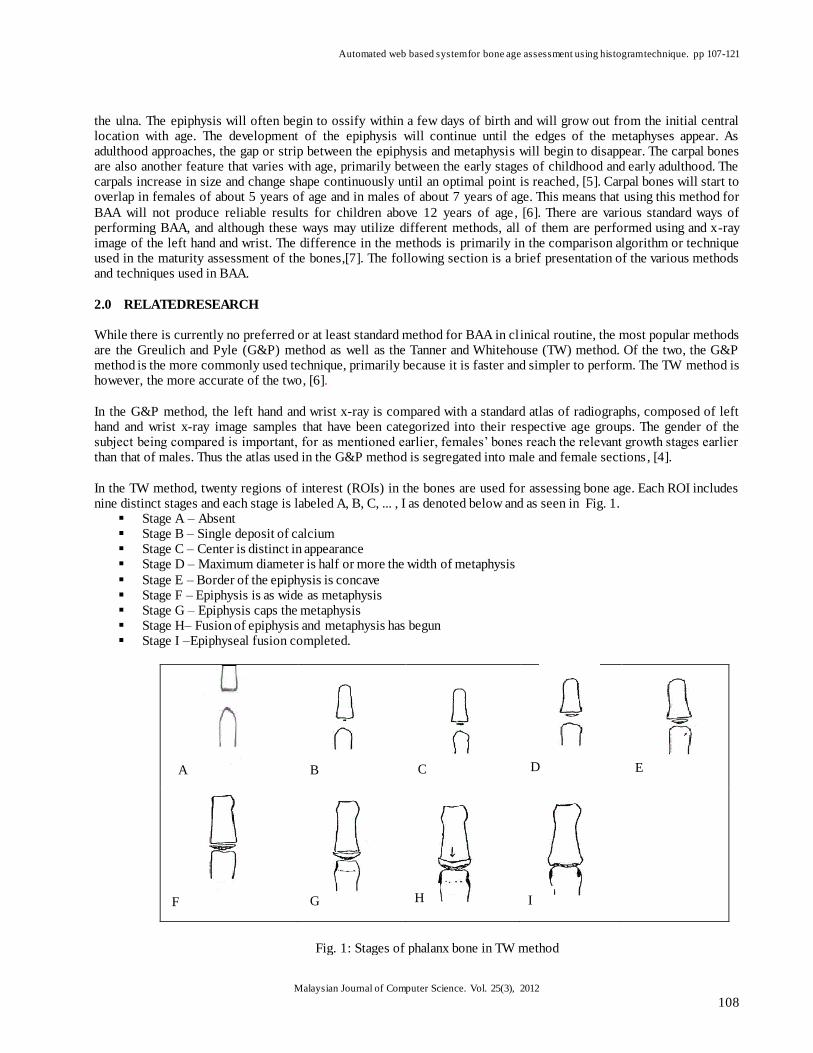
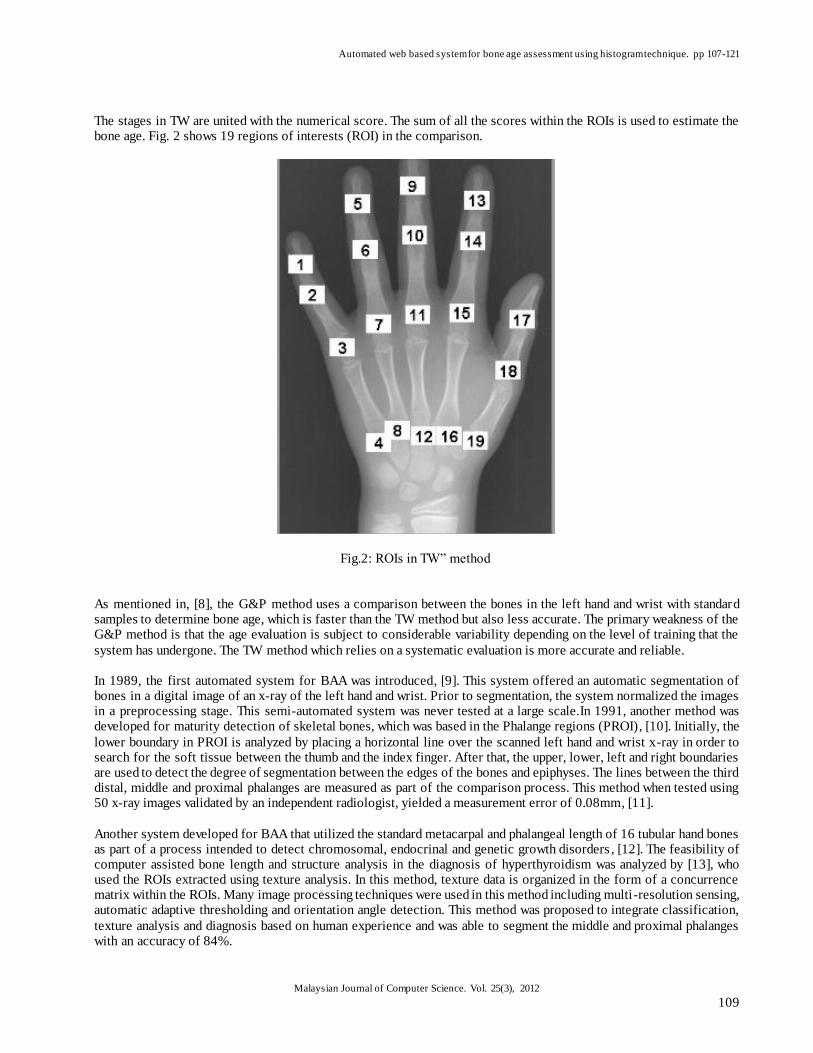
In the TW method, twenty regions of interest (ROIs) in the bones are used for assessing bone age. Each ROI includes nine distinct stages and each stage is labeled A, B, C, ... , I as denoted below and as seen in Fig. 1.
Stage A – Absent Stage B – Single deposit of calcium Stage C – Center is distinct in appearance Stage D – Maximum diameter is half or more the width of metaphysis
Stage E – Border of the epiphysis is concave Stage F – Epiphysis is as wide as metaphysis Stage G – Epiphysis caps the metaphysis Stage H– Fusion of epiphysis and metaphysis has begun Stage I –Epiphyseal fusion completed.
A B C D E
F H G I
Fig. 1: Stages of phalanx bone in TW method
Automated web based system for bone age assessment using histogram technique. pp 107-121
Malaysian Journal of Computer Science. Vol. 25(3), 2012
109
The stages in TW are united with the numerical score. The sum of all the scores within the ROIs is used to estimate the bone age. Fig. 2 shows 19 regions of interests (ROI) in the comparison.
As mentioned in, [8], the G&P method uses a comparison between the bones in the left hand and wrist with standard samples to determine bone age, which is faster than the TW method but also less accurate. The primary weakness of the G&P method is that the age evaluation is subject to considerable variability depending on the level of training that the
system has undergone. The TW method which relies on a systematic evaluation is more accurate and reliable. In 1989, the first automated system for BAA was introduced, [9]. This system offered an automatic segmentation of bones in a digital image of an x-ray of the left hand and wrist. Prior to segmentation, the system normalized the images in a preprocessing stage. This semi-automated system was never tested at a large scale.In 1991, another method was developed for maturity detection of skeletal bones, which was based in the Phalange regions (PROI), [10]. Initially, the
lower boundary in PROI is analyzed by placing a horizontal line over the scanned left hand and wrist x-ray in order to search for the soft tissue between the thumb and the index finger. After that, the upper, lower, left and right boundaries are used to detect the degree of segmentation between the edges of the bones and epiphyses. The lines between the third distal, middle and proximal phalanges are measured as part of the comparison process. This method when tested using 50 x-ray images validated by an independent radiologist, yielded a measurement error of 0.08mm, [11].
Another system developed for BAA that utilized the standard metacarpal and phalangeal length of 16 tubular hand bones as part of a process intended to detect chromosomal, endocrinal and genetic growth disorders , [12]. The feasibility of computer assisted bone length and structure analysis in the diagnosis of hyperthyroidism was analyzed by [13], who used the ROIs extracted using texture analysis. In this method, texture data is organized in the form of a concurrence matrix within the ROIs. Many image processing techniques were used in this method including multi-resolution sensing, automatic adaptive thresholding and orientation angle detection. This method was proposed to integrate classification,
texture analysis and diagnosis based on human experience and was able to segment the middle and proximal phalanges with an accuracy of 84%.
Fig.2: ROIs in TW‖ method
Automated web based system for bone age assessment using histogram technique. pp 107-121
Malaysian Journal of Computer Science. Vol. 25(3), 2012
110
In order to produce compact models of shapes based on the appearance of flexible objects,the Point Distribution Model (PDM) was introduced, [14]. In a PDM, the model is focused to identify shapes using points placed strategically at specific points in the image and is generated by statistical testing of point positions. PDMs have also been used in segmentation of hand and wrist bones, [15], and includes two stages namely the training stage and the classification stage. At the training stage, each individual bone image is segmented and the representational model is generated to represent the individual classes. At the classification stage, the representational model is used to tag an input image, x-
ray, using a closest match algorithm. In 2000, a fully implemented digital hand atlas and computer-aided diagnostic (CAD) was presented. The system was the web based and utilized an existing picture archiving and communication system (PACS), [16]. This system consisted of a hand atlas database, the CAD module as well as the Java based web user interface. The digital atlas itself was composed of a large set of clinically normal hand images for various races. In order to examine the skeletal maturity of
hand and wrist x-ray images, the quantitative feature of the images were extracted from the relational image database. In the system presented byPospiech, [17],a computer assisted BAA workstation was also integrated with PACS. In this case, the BAA process was carried out in three parts. The preprocessing level removed the noise from the images, isolated the image of the hand and wrist itself and located six ROIs. Then the image segmentation level processed the image to clarify the visual of the bone structure and the relevant edges. Finally the last level would perform the bone assessment proper using a fuzzy classifier. The integration with the clinical PACS increased the accuracy of the system
primarily because it was available online and provided easy access to a large database of related images, [16]. BAA has also been performed using a knowledge-based vision system via a decision theoretic technique that uses a hierarchical knowledgebase schema to identify the bones within an image,[18]. Systems using comparisons of left hand and wrist x-rays against a tagged repository of similar images for BAA that preceded the G&P method such as that presented by,[19], used shape analysis of the hand performed in two phases. The first phase being a landmark based
analysis and the second phase involving intensity based analysis utilizing mutual information. Another alternative method used is a knowledgebase comparison method for segmentation of carpal bones to perform BAA for individuals up to the ages of seven years using fuzzy classification of selected information, [6]. Geometric feature analysis based on shape, area and sequence extracted from hand and wrist x-rays yielded similar levels of accuracy to the G&P method,[20]. An automated end to end system using the third generation TW, TW3, methodology that assesses bone age using a Generalized Softmax Perceptron (GSP) neural network (NN) to compare the radius and ulna was introduced by,
[21]. The use of hand atlases are quite a common technique in BAA although their exact layout tends to vary and the classifications of the images being different, but most separate the genders and races, though the precise number of races tends to vary as well. The ROIs tend to vary in number as well and finally the actual comparator mechanisms are different, but most of the recent BAA system rely on some form of fuzzy classifying, [22].Some systems utilize a large
number of ROIs,[23], isolating thirteen radial ulnar ROIs and seven carpal ROIs and utilizing a third generation TW, TW3, methodology. The comparator mechanism is based on particle swarm optimization (PSO), where critical features such as size, morphology as well as the fusional / adjacent stages of each ROI are extracted and fed into adaptive neural network classifiers. BoneXpert,[24], uses a generative model that performs BAA based on the shape, intensity and texture scores extracted
from the feature analysis. The architecture of the model is divided into three main sections. The first section isolates the bone borders based on an Active Appearance Model (AAM), while the second section calculates the intrinsic bone age and the third section transforms the bone age value into a final score using either the TW method. Giordano used a combination of a second generation TW, TW2, and Epiphyses / Metaphyses ROI (EMROI) as well as Carpal ROI (CROI), [25]. This system is reliable for females up to the age of 7 years and males up to the age of 10 years. The Difference of Gaussian (DoG) image processing technique was used to perform the feature analysis of the EMROI,
while automatic knowledge integration and trigonometric concepts were used in the CROI analysis. The error rate for this system was between ±0.46 to ±0.37 years.[26] presented a method with anisotropic diffusion used for image pre-processing and a novel Bounded Area Elimination (BAE) for post-processing. This algorithm improves on the algorithm of ossification site localization technique are designed with the intent of improving the adaptive segmentation result and the region-of interest (ROI) localization accuracy. The results presented showed that the BAE algorithm proposed is capable of removing the artifacts generated in adaptive segmentation.
Automated web based system for bone age assessment using histogram technique. pp 107-121
Malaysian Journal of Computer Science. Vol. 25(3), 2012
111
Despite the fact that the number of automated systems for BAA have increased, most are still within the experimental phase because of imprecise nature of their predictions and thus the lack of accuracy, [27]. Most of the techniques and methods used for BAA as presented in literature utilized segmentation of specific regions of hand and wrist x-ray images and experienced low accuracy rates due to limitations in image processing, [3] and[28]. The method presented in this paper overcomes this limitation by performing BAA using histograms technique, eliminating the need for segmentation.
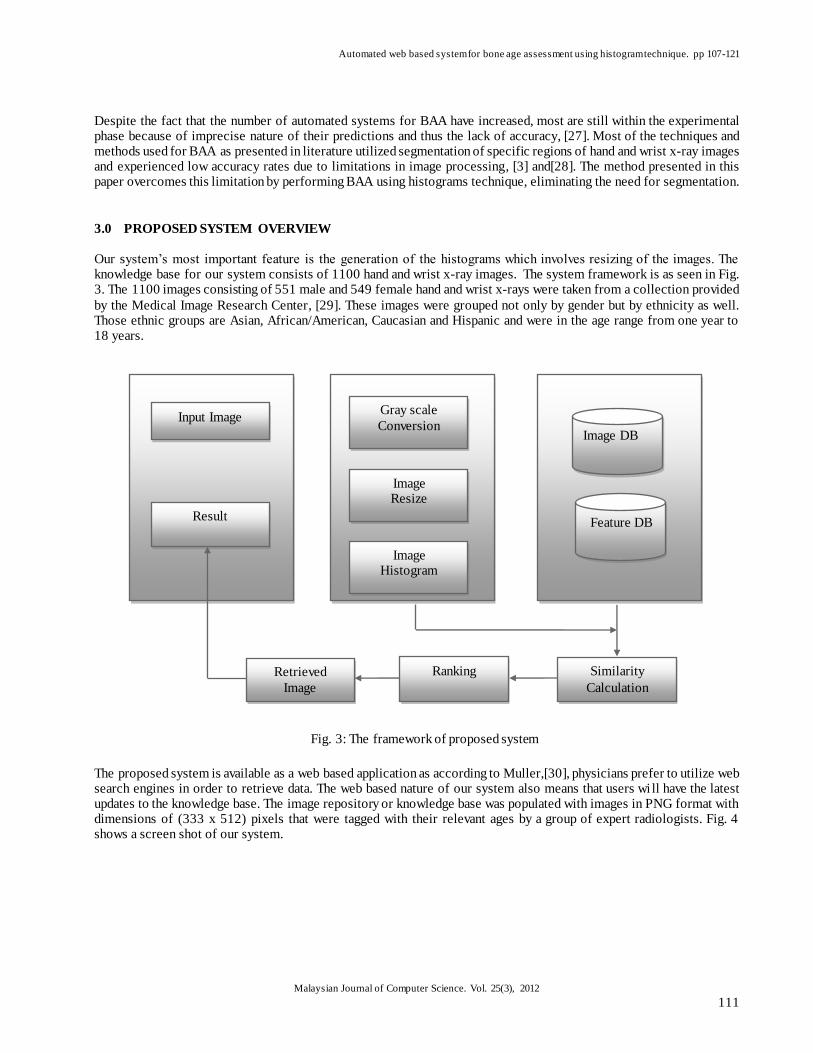
3.0 PROPOSED SYSTEM OVERVIEW
Our system’s most important feature is the generation of the histograms which involves resizing of the images. The knowledge base for our system consists of 1100 hand and wrist x-ray images. The system framework is as seen in Fig. 3. The 1100 images consisting of 551 male and 549 female hand and wrist x-rays were taken from a collection provided
by the Medical Image Research Center, [29]. These images were grouped not only by gender but by ethnicity as well. Those ethnic groups are Asian, African/American, Caucasian and Hispanic and were in the age range from one year to 18 years.
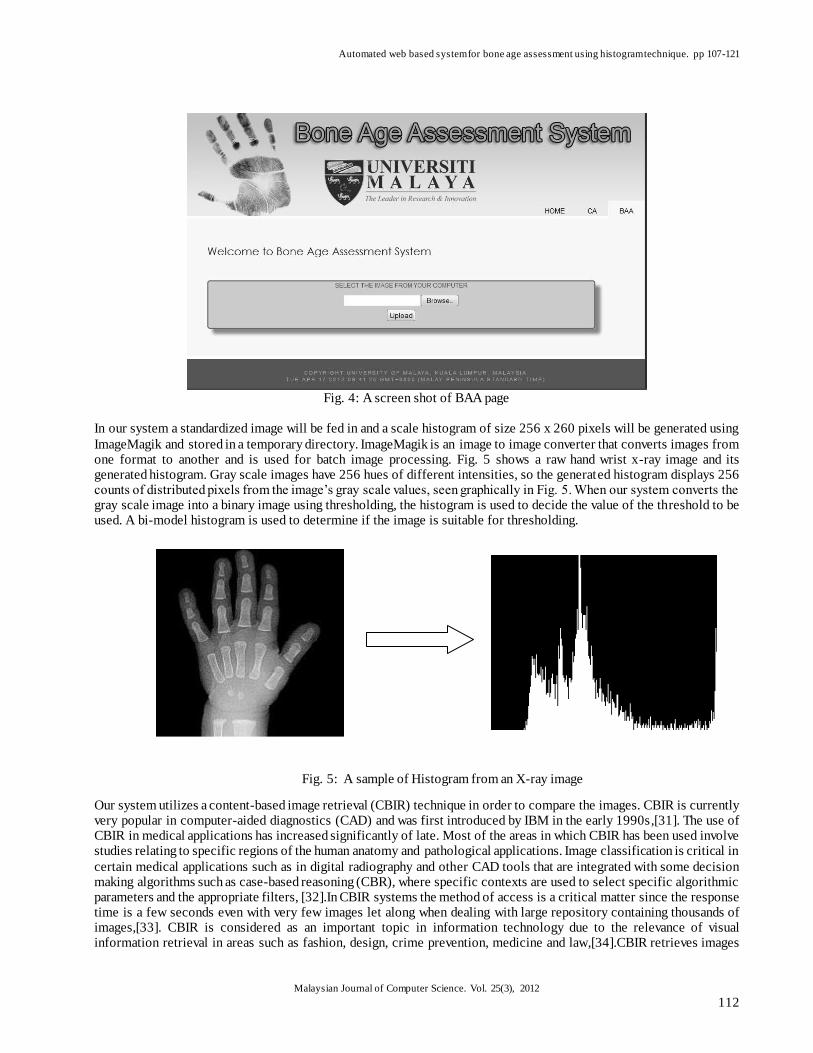
The proposed system is available as a web based application as according to Muller,[30], physicians prefer to utilize web search engines in order to retrieve data. The web based nature of our system also means that users wi ll have the latest updates to the knowledge base. The image repository or knowledge base was populated with images in PNG format with dimensions of (333 x 512) pixels that were tagged with their relevant ages by a group of expert radiologists. Fig. 4 shows a screen shot of our system.
Input Image
Result
Gray scale
Conversion
Image Resize
Image Histogram
Image DB
Feature DB
Similarity
Calculation
Ranking Retrieved
Image
Fig. 3: The framework of proposed system
Automated web based system for bone age assessment using histogram technique. pp 107-121
Malaysian Journal of Computer Science. Vol. 25(3), 2012
112
Fig. 4: A screen shot of BAA page
In our system a standardized image will be fed in and a scale histogram of size 256 x 260 pixels will be generated using
ImageMagik and stored in a temporary directory. ImageMagik is an image to image converter that converts images from one format to another and is used for batch image processing. Fig. 5 shows a raw hand wrist x-ray image and its generated histogram. Gray scale images have 256 hues of different intensities, so the generated histogram displays 256 counts of distributed pixels from the image’s gray scale values, seen graphically in Fig. 5. When our system converts the gray scale image into a binary image using thresholding, the histogram is used to decide the value of the threshold to be used. A bi-model histogram is used to determine if the image is suitable for thresholding.
Our system utilizes a content-based image retrieval (CBIR) technique in order to compare the images. CBIR is currently very popular in computer-aided diagnostics (CAD) and was first introduced by IBM in the early 1990s,[31]. The use of CBIR in medical applications has increased significantly of late. Most of the areas in which CBIR has been used involve studies relating to specific regions of the human anatomy and pathological applications. Image classification is critical in
certain medical applications such as in digital radiography and other CAD tools that are integrated with some decision making algorithms such as case-based reasoning (CBR), where specific contexts are used to select specific algorithmic parameters and the appropriate filters, [32].In CBIR systems the method of access is a critical matter since the response time is a few seconds even with very few images let along when dealing with large repository containing thousands of images,[33]. CBIR is considered as an important topic in information technology due to the relevance of visual information retrieval in areas such as fashion, design, crime prevention, medicine and law,[34].CBIR retrieves images
Fig. 5: A sample of Histogram from an X-ray image
Automated web based system for bone age assessment using histogram technique. pp 107-121
Malaysian Journal of Computer Science. Vol. 25(3), 2012
113
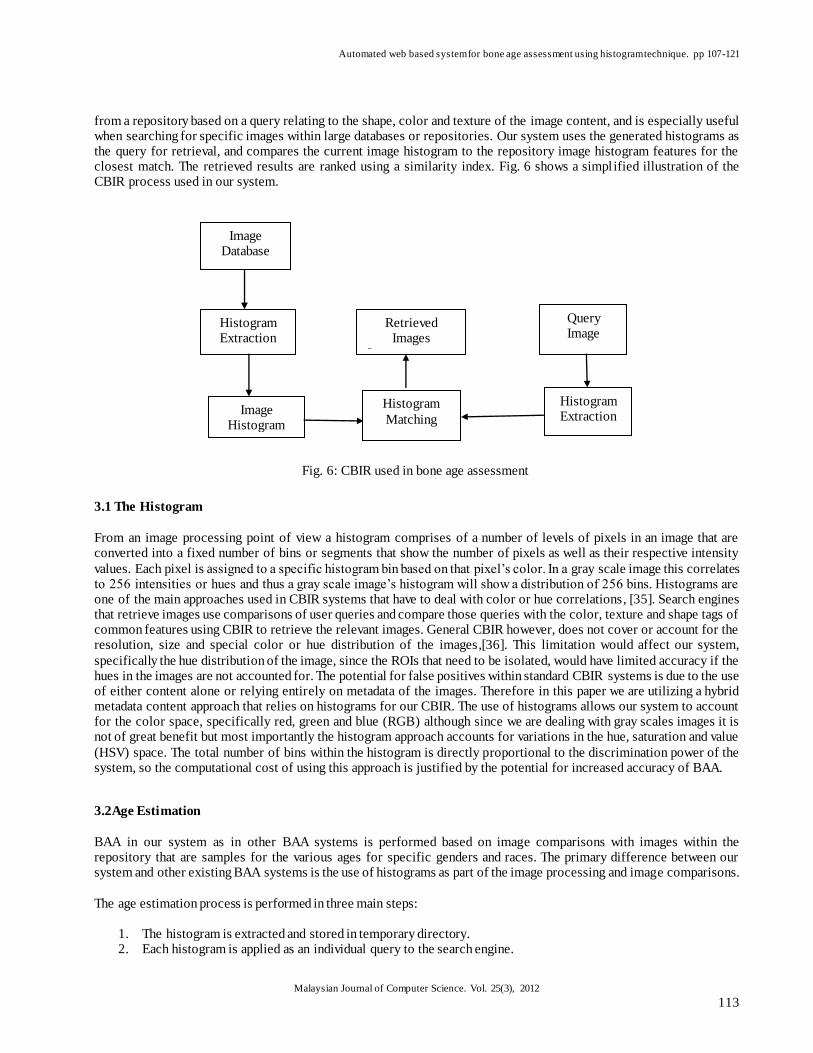
from a repository based on a query relating to the shape, color and texture of the image content, and is especially useful when searching for specific images within large databases or repositories. Our system uses the generated histograms as the query for retrieval, and compares the current image histogram to the repository image histogram features for the closest match. The retrieved results are ranked using a similarity index. Fig. 6 shows a simplified illustration of the CBIR process used in our system.
3.1 The Histogram
From an image processing point of view a histogram comprises of a number of levels of pixels in an image that are converted into a fixed number of bins or segments that show the number of pixels as well as their respective intensity
values. Each pixel is assigned to a specific histogram bin based on that pixel’s color. In a gray scale image this correlates to 256 intensities or hues and thus a gray scale image’s histogram will show a distribution of 256 bins. Histograms are one of the main approaches used in CBIR systems that have to deal with color or hue correlations, [35]. Search engines that retrieve images use comparisons of user queries and compare those queries with the color, texture and shape tags of common features using CBIR to retrieve the relevant images. General CBIR however, does not cover or account for the resolution, size and special color or hue distribution of the images,[36]. This limitation would affect our system,
specifically the hue distribution of the image, since the ROIs that need to be isolated, would have limited accuracy if the hues in the images are not accounted for. The potential for false positives within standard CBIR systems is due to the use of either content alone or relying entirely on metadata of the images. Therefore in this paper we are utilizing a hybrid metadata content approach that relies on histograms for our CBIR. The use of histograms allows our system to account for the color space, specifically red, green and blue (RGB) although since we are dealing with gray scales images it is not of great benefit but most importantly the histogram approach accounts for variations in the hue, saturation and value
(HSV) space. The total number of bins within the histogram is directly proportional to the discrimination power of the system, so the computational cost of using this approach is justified by the potential for increased accuracy of BAA.
3.2Age Estimation
BAA in our system as in other BAA systems is performed based on image comparisons with images within the repository that are samples for the various ages for specific genders and races. The primary difference between our system and other existing BAA systems is the use of histograms as part of the image processing and image comparisons.
The age estimation process is performed in three main steps:
1. The histogram is extracted and stored in temporary directory. 2. Each histogram is applied as an individual query to the search engine.
Histogram Extraction
Image Database
Image Histogram
Histogram
Matching
Retrieved Images
Ima
Histogram Extraction
Query Image
Fig. 6: CBIR used in bone age assessment
Automated web based system for bone age assessment using histogram technique. pp 107-121
Malaysian Journal of Computer Science. Vol. 25(3), 2012
114
Input Image Grayscale
Conversion Image Resize
Image
Histogram
Similarity
Feature Vector
Images
Image
Dataset
Retrieved Image Ranking Bone Age
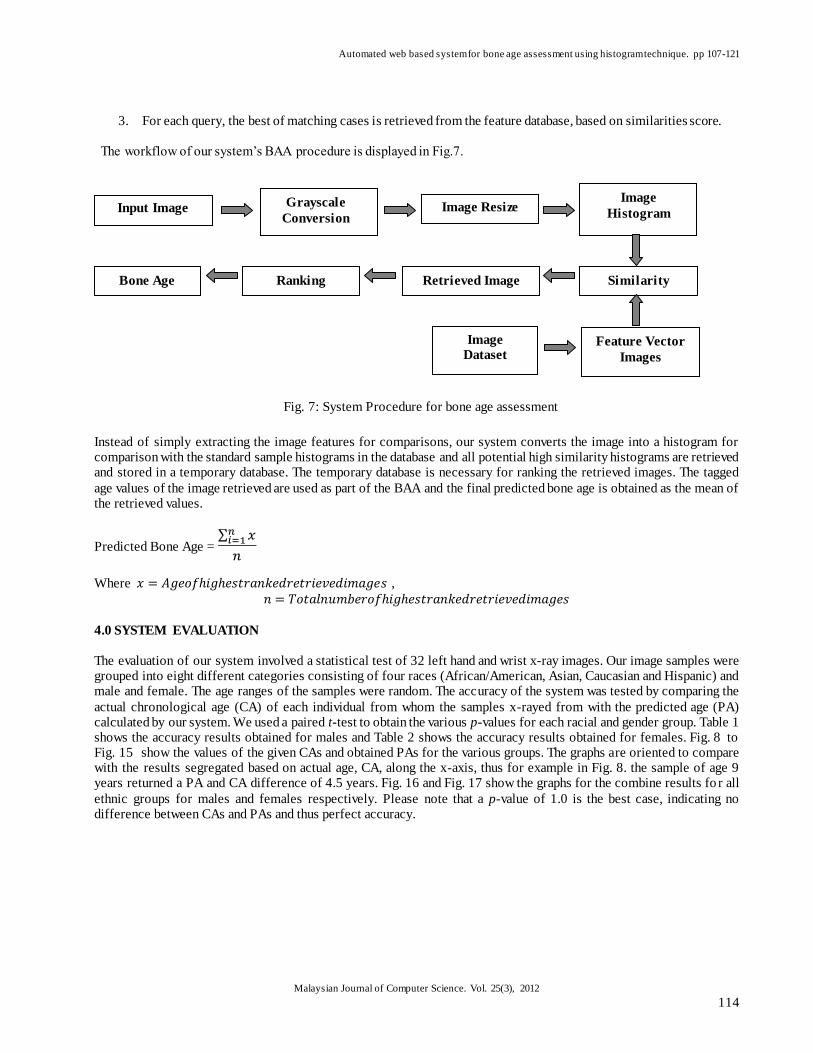
3. For each query, the best of matching cases is retrieved from the feature database, based on similarities score.
The workflow of our system’s BAA procedure is displayed in Fig.7.
Instead of simply extracting the image features for comparisons, our system converts the image into a histogram for comparison with the standard sample histograms in the database and all potential high similarity histograms are retrieved and stored in a temporary database. The temporary database is necessary for ranking the retrieved images. The tagged
age values of the image retrieved are used as part of the BAA and the final predicted bone age is obtained as the mean of the retrieved values.
Predicted Bone Age = ∑
Where ,
4.0 SYSTEM EVALUATION
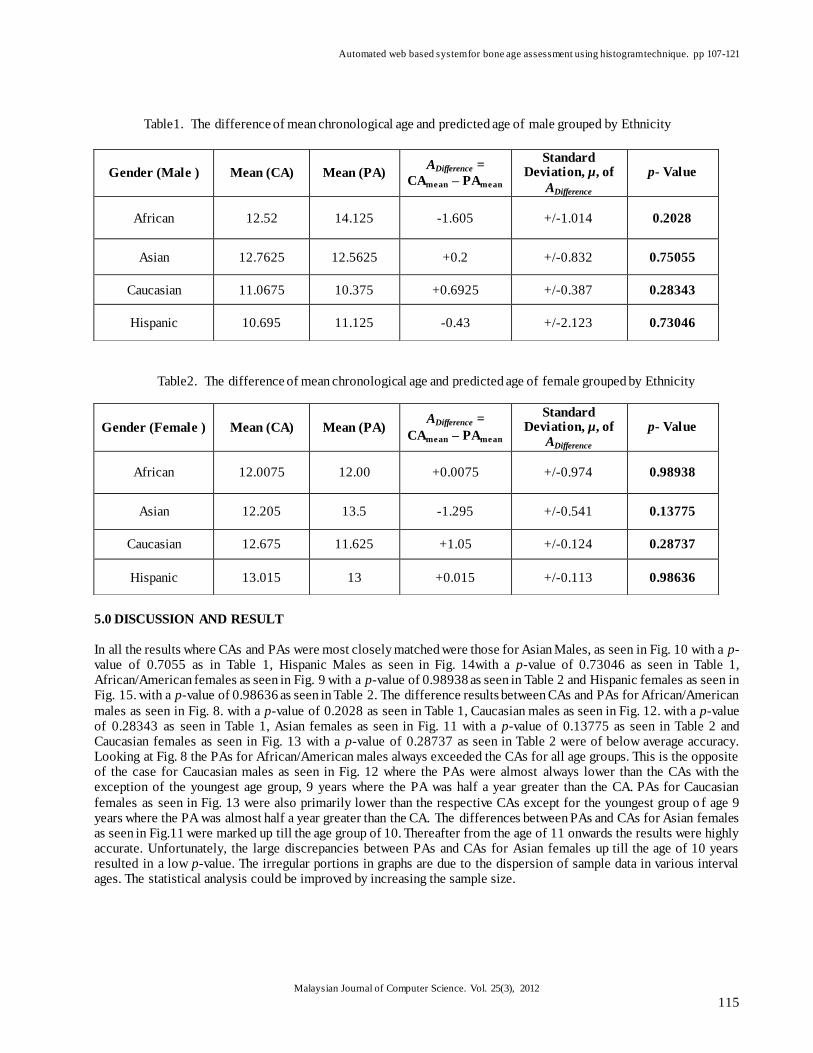
The evaluation of our system involved a statistical test of 32 left hand and wrist x-ray images. Our image samples were grouped into eight different categories consisting of four races (African/American, Asian, Caucasian and Hispanic) and male and female. The age ranges of the samples were random. The accuracy of the system was tested by comparing the
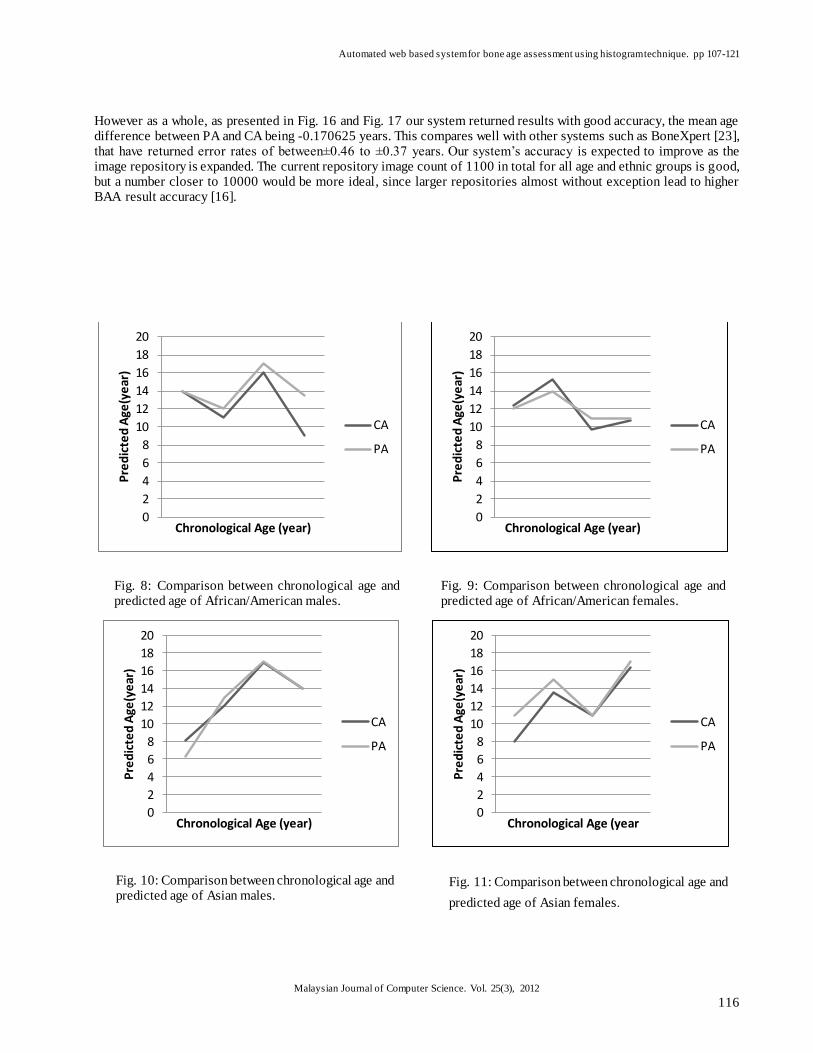
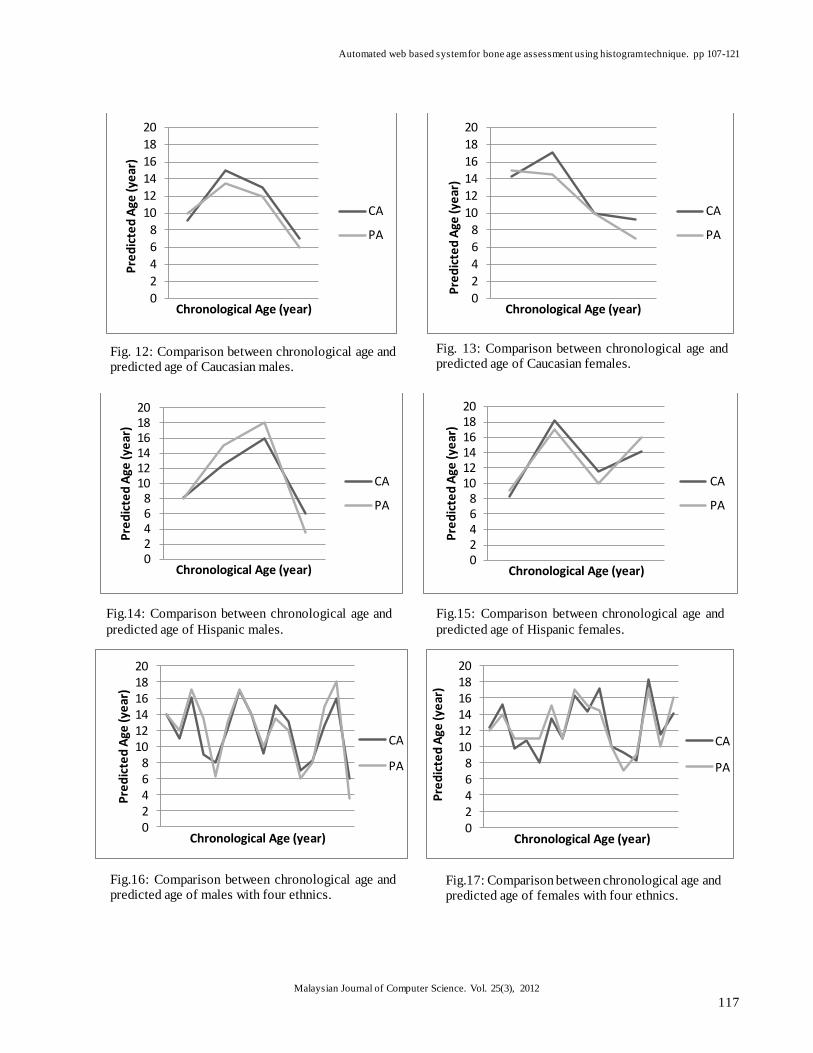
actual chronological age (CA) of each individual from whom the samples x-rayed from with the predicted age (PA) calculated by our system. We used a paired t-test to obtain the various p-values for each racial and gender group. Table 1 shows the accuracy results obtained for males and Table 2 shows the accuracy results obtained for females. Fig. 8 to Fig. 15 show the values of the given CAs and obtained PAs for the various groups. The graphs are oriented to compare with the results segregated based on actual age, CA, along the x-axis, thus for example in Fig. 8. the sample of age 9 years returned a PA and CA difference of 4.5 years. Fig. 16 and Fig. 17 show the graphs for the combine results fo r all
ethnic groups for males and females respectively. Please note that a p-value of 1.0 is the best case, indicating no difference between CAs and PAs and thus perfect accuracy.
Fig. 7: System Procedure for bone age assessment
Automated web based system for bone age assessment using histogram technique. pp 107-121
Malaysian Journal of Computer Science. Vol. 25(3), 2012
115
5.0 DISCUSSION AND RESULT
In all the results where CAs and PAs were most closely matched were those for Asian Males, as seen in Fig. 10 with a p-value of 0.7055 as in Table 1, Hispanic Males as seen in Fig. 14with a p-value of 0.73046 as seen in Table 1, African/American females as seen in Fig. 9 with a p-value of 0.98938 as seen in Table 2 and Hispanic females as seen in Fig. 15. with a p-value of 0.98636 as seen in Table 2. The difference results between CAs and PAs for African/American
males as seen in Fig. 8. with a p-value of 0.2028 as seen in Table 1, Caucasian males as seen in Fig. 12. with a p-value of 0.28343 as seen in Table 1, Asian females as seen in Fig. 11 with a p-value of 0.13775 as seen in Table 2 and Caucasian females as seen in Fig. 13 with a p-value of 0.28737 as seen in Table 2 were of below average accuracy. Looking at Fig. 8 the PAs for African/American males always exceeded the CAs for all age groups. This is the opposite of the case for Caucasian males as seen in Fig. 12 where the PAs were almost always lower than the CAs with the exception of the youngest age group, 9 years where the PA was half a year greater than the CA. PAs for Caucasian
females as seen in Fig. 13 were also primarily lower than the respective CAs except for the youngest group o f age 9 years where the PA was almost half a year greater than the CA. The differences between PAs and CAs for Asian females as seen in Fig.11 were marked up till the age group of 10. Thereafter from the age of 11 onwards the results were highly accurate. Unfortunately, the large discrepancies between PAs and CAs for Asian females up till the age of 10 years resulted in a low p-value. The irregular portions in graphs are due to the dispersion of sample data in various interval ages. The statistical analysis could be improved by increasing the sample size.
Gender (Male ) Mean (CA) Mean (PA) ADifference =
CAmean – PAmean
Standard Deviation, µ, of
ADifference
p- Value
African 12.52 14.125 -1.605 +/-1.014 0.2028
Asian 12.7625 12.5625 +0.2 +/-0.832 0.75055
Caucasian 11.0675 10.375 +0.6925 +/-0.387 0.28343
Hispanic 10.695 11.125 -0.43 +/-2.123 0.73046
Gender (Female ) Mean (CA) Mean (PA) ADifference =
CAmean – PAmean
Standard Deviation, µ, of
ADifference
p- Value
African 12.0075 12.00 +0.0075 +/-0.974 0.98938
Asian 12.205 13.5 -1.295 +/-0.541 0.13775
Caucasian 12.675 11.625 +1.05 +/-0.124 0.28737
Hispanic 13.015 13 +0.015 +/-0.113 0.98636
Table1. The difference of mean chronological age and predicted age of male grouped by Ethnicity
Table2. The difference of mean chronological age and predicted age of female grouped by Ethnicity
Automated web based system for bone age assessment using histogram technique. pp 107-121
Malaysian Journal of Computer Science. Vol. 25(3), 2012
116
However as a whole, as presented in Fig. 16 and Fig. 17 our system returned results with good accuracy, the mean age difference between PA and CA being -0.170625 years. This compares well with other systems such as BoneXpert [23], that have returned error rates of between±0.46 to ±0.37 years. Our system’s accuracy is expected to improve as the image repository is expanded. The current repository image count of 1100 in total for all age and ethnic groups is good, but a number closer to 10000 would be more ideal, since larger repositories almost without exception lead to higher BAA result accuracy [16].
0
2
4
6
8
10
12
14
16
18
20
Pre
dic
ted
Age
(ye
ar)
Chronological Age (year)
CA
PA
0
2
4
6
8
10
12
14
16
18
20
Pre
dic
ted
Age
(ye
ar)
Chronological Age (year)
CA
PA
0
2
4
6
8
10
12
14
16
18
20
Pre
dic
ted
Age
(ye
ar)
Chronological Age (year)
CA
PA
0
2
4
6
8
10
12
14
16
18
20
Pre
dic
ted
Age
(ye
ar)
Chronological Age (year
CA
PA
Fig. 8: Comparison between chronological age and predicted age of African/American males.
Fig. 9: Comparison between chronological age and predicted age of African/American females.
Fig. 10: Comparison between chronological age and predicted age of Asian males.
Fig. 11: Comparison between chronological age and
predicted age of Asian females.
Automated web based system for bone age assessment using histogram technique. pp 107-121
Malaysian Journal of Computer Science. Vol. 25(3), 2012
117
0
2
4
6
8
10
12
14
16
18
20P
red
icte
d A
ge (y
ear
)
Chronological Age (year)
CA
PA
0
2
4
6
8
10
12
14
16
18
20
Pre
dic
ted
Age
(ye
ar)
Chronological Age (year)
CA
PA
02468101214161820
Pre
dic
ted
Age
(ye
ar)
Chronological Age (year)
CA
PA
02468101214161820
Pre
dic
ted
Age
(ye
ar)
Chronological Age (year)
CA
PA
02468101214161820
Pre
dic
ted
Age
(ye
ar)
Chronological Age (year)
CA
PA
02468101214161820
Pre
dic
ted
Age
(ye
ar)
Chronological Age (year)
CA
PA
Fig. 12: Comparison between chronological age and predicted age of Caucasian males.
Fig. 13: Comparison between chronological age and predicted age of Caucasian females.
Fig.14: Comparison between chronological age and
predicted age of Hispanic males.
Fig.15: Comparison between chronological age and
predicted age of Hispanic females.
Fig.16: Comparison between chronological age and predicted age of males with four ethnics.
Fig.17: Comparison between chronological age and predicted age of females with four ethnics.
Automated web based system for bone age assessment using histogram technique. pp 107-121
Malaysian Journal of Computer Science. Vol. 25(3), 2012
118
6.0 CONCLUSION AND FUTURE WORK
This paper introduced an automated web based BAA system that used histograms as a part of a novel BAA estimation method. This method uses CBIR that retrieves images based on both image content as well as metadata using the images’ respective histograms to increase sensitivity to primarily hues. The primary benefit of the approach presented in this paper is it overcomes the segmentation problem as experienced by other automated BAA systems[8-25]. The system
was tested using 32 random samples from four different ethnic groups and both genders and returned an average error rate of -0.170625 years. This compared well with previous systems that returned error rates of between ±0.46 to ±0.37 years [23]. The adopted method was found to be reasonably adequate for age groups of 0-18 years despite the limited number of available images, from IRMA, which were used in theknowledge base, thatcontributed toward bone age assessment predictions.
We contend that prediction accuracy of our system will be improved by expanding the current image repository with more samples. Future work will involve expansion of the system to cater for ages above 18 years. This additional capability will require other approaches other than the use of hand and wrist x-rays to be used since the bones of the hand and wrist change little once the age of 18 is reached.
ACKNOWLEDEMENT
This research was supported by Flagship Research Grant FL012/2012, University of Malaya (UM).The authors would like to thank Image Retrieval in Medical Applications (IRMA) for the images they have provided. REFERENCES
[1] A. K. Poznanski, R. J. Hern´andez, K. E. Guire, U. L. Bereza, and S. M. Garn, ―Carpal length in children—A
useful measurement in the diagnosis of rheumatoid arthritis and some congenital malformation syndromes,‖ Ped. Rad., vol. 129, pp. 661–668, Dec. 1978.
[2] Schmeling, A., G. Geserick, et al. (2007). "Age estimation." Forensic science international 165(2): 178 -181. [3] Niblack W, Barber R, Equitz W, et al. The QBIC project: querying images by content using color, texture and
shape. Proc SPIE 1993;1908: 173-87. [4] D. R. Kirks, Practical Pediatric Imaging. Diagnostic Radiology of Infants and Children, 1st ed. Boston, MA:
Little, Brown & Co., 1984,ch. 6, pp. 198–201. [5] W. W. Greulich and S. Pyle, Radiographic Atlas of Skeletal Development of Hand Wrist. Stanford University
Press, 1971. [6] Johnston FE, Jahina SB. The contribution of the carpal bones to the assessment of skeletal age. Am J P hys
Anthrop 1965;23:349–54. [PubMed: 4287192] [7] A. Zhang , A. Gertych , B. Liu, ―Automatic bone age assessment for young children from newborn to 7 -year-
old using carpal bones‖, Computerized Medical Imaging and Graphics , vol. 31 , Issue 4 - 5 , pp. 299 – 310, 2007.
[8] Bull, R., P. Edwards, et al. (1999). "Bone age assessment: a large scale comparison of the Greulich and Pyle, and Tanner and Whitehouse (TW2) methods." Archives of disease in childhood81(2): 172-173.
[9] Michael , D.J., Nelson, A.C.: HANDX: a model-based system for automatic segmentation of bones from digital
hand radiographs. IEEE Transactions on Medical Imaging, 8(1):64–69, 1989.
Automated web based system for bone age assessment using histogram technique. pp 107-121
Malaysian Journal of Computer Science. Vol. 25(3), 2012
119
[10] Pietka E, Kaabi L, Kuo ML, Huang HK: Feature extraction in carpal-bone analysis. IEEE transactions on medical imaging 1993, 12:44-49.
[11] Pietka, E., A. Gertych, et al. (2001). "Computer-assisted bone age assessment: Image preprocessing and epiphyseal/metaphyseal ROI extraction." Medical Imaging, IEEE Transactions on20(8): 715-729.
[12] S. M. Garn, K. P. Hertzog, A. K. Poznanski, and J. M. Nagy, ―Metacarpophalangeal length in the evaluation of
skeletal malformation,‖ Radiology, vol. 105, pp. 375-381, 1972. [13] S.N.C.Cheng, H.Chen, L.T.Niklason, R.S.Alder, ―Automated segmentation of regions on hand radiographs‖,
Med. Phy., vol. 21, pp.1293-1300, 1994. [14] T. F. Cootes, A. Hill, C. J. Taylor, and J. Haslam, ―The Use of Active Shape Models for Locating Structures in
Medical Images,‖ in Proceedings of 13th Int. Conf. on IPMI, (London,UK), pp. 33–47, Springer-Verlag, 1993. [15] Al-Taani, A.T., Ricketts, I.W., Cairns, A.Y.,―Classification Of Hand Bones For Bone Age Assessment‖,
Proceedings of the Third IEEE International Conference on Electronics,Circuits, and Systems, ICECS '96., pp.1088-1091, 1996.
[16] Cao, F., H. Huang, et al. (2000). "Digital hand atlas and web-based bone age assessment: system design and implementation." Computerized Medical Imaging and Graphics 24(5): 297-307.
[17] Pietka, E., S. Pospiech-Kurkowska, et al. (2003). "Integration of computer assisted bone age assessment with
clinical PACS." Computerized Medical Imaging and Graphics27(2): 217-228.
[18] Mahmoodi, S., Sharif, B.S., Chester, E.G., Owen, J.P., Lee, R.E.J.: ―Automated vision system for skeletal age assessment using knowledge based techniques.‖ IEEE conference publication,ISSN 0537-9989, issue 443: 809–813, 1997.
[19] Miguel A. Martin-Fernandez, Marcos Martin-Fernandez, Carlos Alberola-Lopez, ―Automatic bone age
assessment: a registration approach‖, Medical Imaging 2003: Image Processing,Proceedings of SPIE, vol. 5032,
pp. 1765-1776, 2003. [20] Chi-Wen Hsieh, Tai-Lang Jong, Yi-Hong Chou and Chui-Mei Tiu, ―Computerized geometric features of carpal
bone for bone age estimation‖, Chinese Medical Journal, 120(9):767-770,2007. [21] Tristan-Vega, A. and J. I. Arribas (2008). "A radius and ulna TW3 bone age assessment system." Biomedical
Engineering, IEEE Transactions on55(5): 1463-1476. [22] Gertych, A., A. Zhang, et al. (2007). "Bone age assessment of children using a digital hand atlas."
Computerized Medical Imaging and Graphics 31(4): 322-331. [23] Liu, J., J. Qi, et al. (2008). "Automatic bone age assessment based on intelligent algorithms and comparison
with TW3 method." Computerized Medical Imaging and Graphics 32(8): 678-684. [24] H. Thodberg, S. Kreiborg, A. Juul, and K. Pedersen, ―The Bone Xpert Method for Automated Determination of
Skeletal Maturity‖, IEEE Trans Med Imaging, vol. 28, no. 1, pp. 52–66,2009. [25] D. Giordano, C. Spampinato, G. Scarciofalo, R. Leonardi, ―An Automatic System for Skeletal Bone Age
Measurement by Robust Processing of Carpal and Epiphysial/Metaphysial Bones‖,IEEE Trans. on Instrumentation and Measurement, vol.59, issue 10, pp. 2539-2553, 2010.
[26] Chai, H.Y., et al., An artifacts removal post-processing for epiphyseal region-of-interest (EROI) localization in
automated bone age assessment (BAA). Biomedical engineering online, 2011. 10: p. 87. [27] Jonsson K: Fundamentals of Hand and Wrist Imaging. Acta Radiologica 2002, 43:236-236.
Automated web based system for bone age assessment using histogram technique. pp 107-121
Malaysian Journal of Computer Science. Vol. 25(3), 2012
120
[28] Tristan-Vega, A. and J. I. Arribas (2008). "A radius and ulna TW3 bone age assessment system." Biomedical
Engineering, IEEE Transactions on55(5): 1463-1476. [29] Fischer, B., et al., Web-based bone age assessment by content-based image retrieval for case-based reasoning.
International journal of computer assisted radiology and surgery, 2011: p. 1-11.
[30] Muller H, Despont-Gros C, Hersh W et al (2006) Health care professionals’image use and search behaviour. In:
Proceedings of MIE, pp 24–32. [31] Niblack W, Barber R, Equitz W, et al. The QBIC project: querying images by content using color, texture and
shape. Proc SPIE 1993;1908: 173-87.
[32] Lehmann, T. M., M. O. Güld, et al. (2005). "Automatic categorization of medical images for content -based
retrieval and data mining." Computerized Medical Imaging and Graphics29(2): 143-155. [33] Alfonso, B., et al., Definition of an automated Content-Based Image Retrieval (CBIR) system for the
comparison of dermoscopic images of pigmented skin lesions. Biomedical engineering online, 2009. 8.
[34] Mustaffa, M.R., et al., Content-based image retrieval based on color-spatial features. Malaysian Journal of
Computer Science, 2008. 21(1): p. 1-12. [35] Konstantinidis, K., A. Gasteratos, et al. (2005). "Image retrieval based on fuzzy color histogram processing."
Optics Communications248(4): 375-386.
[36] Arjunan, R. V. and V. V. Kumar (2009). Image Classification in CBIR systems with color histogram features,
IEEE.
BIOGRAPHY
MarjanMansourvar received the M.Sc. degree in computer science in 2010 from University of Malaya. She is currently the PhD candidate at the University of Malaya (UM) attached to the Department of Information System.
Ram Gopal Raj holds a PhD from the University of Malaya (UM) and is attached to the Department of Artificial Intelligence of the Faculty of Computer Science and Information Technology at UM. MaizatulAkmarBinti Ismailholds a PhD from the University of Malaya (UM).She is currently a senior lecturer at the Department of Information System of the Faculty of Computer Science and Information Technology at UM.
SameemBinti Abdul Kareemholds a PhD from the University of Malaya (UM).She is currently a senior lecturer at the Department of Artificial Intelligence of the Faculty of Computer Science and Information Technology at UM. SaravananShanmugamisa master student inschool of Computing Science and Engineering, VIT University from India. He spent his internship for six months at theUniversity of Malaya (UM).
Shahrom Wahidis an Associate. Professor and Consultant forensic pathologist Unit, Medical Faculty, University Kebangsan Malaysia. He is a special advisor (Forensic Pathology) to the Attorney General of Malaysia. He is the chairman for Forensic sub-specialty of National Specialists Register of Malaysia.
Rohana Mahmudholds a PhD from the Manchester University, United Kingdom. She is currently a senior lecturer at
the Department of Artificial Intelligence of the Faculty of Computer Science and Information Technology at UM.

Automated web based system for bone age assessment using histogram technique. pp 107-121
Malaysian Journal of Computer Science. Vol. 25(3), 2012
121
RukainiHj. Abdullahholds a PhD from Leeds University, UK. She is currently a senior lecturer at the Department of Artificial Intelligence of the Faculty of Computer Science and Information Technology at UM.
FarizaHanumNasrudin holds a Master Degree from Northern Illinois University, DeKalb. She is currently a senior lecturer at the Department of Information System of the Faculty of Computer Science and Information Technology at UM.
NorismaBintiIdrisholds a PhD from the University of Malaya (UM) and is attached with the Department of Artificial Intelligence of the Faculty of Computer Science and Information Technology at UM.
Top Related
Copyright © 2022 FDOKUMEN

