


Bahasa
Halaman
Hukum

Automated in-chip-catalytic-spectrophotometric method for
determination of copper(II) using a multisyringe flow injection analysis-multipumping flow system (Chip-MSFIA-
MPFS)
Journal: Analytical Methods
Manuscript ID: AY-ART-06-2014-001499
Article Type: Paper
Date Submitted by the Author: 24-Jun-2014
Complete List of Authors: Phansi, Piyawan; University of Mahidol, Henríquez, Camelia; University of the Balearic Islands, Palacio, Edwin; University of the Balearic Islands, Nacapricha, Duangjai; Mahidol University, Chemistry Cerdà, Victor; University of the Balearic Islands, Chemistry
Analytical Methods
Statement of social impact
This is the first proposed automated method which uses MSFIA-MPFS coupled to a
chip for catalytic spectrophotometric determination. The chip is a new design in order
to reduce the 2,6-dichlorophenolindophenol (DCPI) prior to its oxidation by hydrogen
peroxide reaction, catalyzed by Cu(II). The Chip-MSFIA-MPFS system is very suitable
method for measurement of trace Cu(II) with high sensitivity (µg L-1
level), precision,
and accuracy. The reaction is rapid allowing high sample throughput. Moreover, the
proposed system is fully automated and controlled by a computer which improves its
repeatability, efficiency and robustness. The proposed method was applied to
determine Cu(II) in water, pharmaceutical, and tissue samples. It has been validated
using two different certified reference materials of water, a reference method (ICP-
AES) and spike-recovery study.
Page 1 of 30 Analytical Methods
123456789101112131415161718192021222324252627282930313233343536373839404142434445464748495051525354555657585960
Automated in-chip-catalytic-spectrophotometric method for determination of
copper(II) using a multisyringe flow injection analysis-multipumping flow system
(Chip-MSFIA-MPFS)
Piyawan Phansi ab, Camelia Henríquez c, Edwin Palacio c, Duangjai Nacapricha ab, Víctor Cerdà c*
a Flow Innovation-Research for Science and Technology Laboratories (FIRST labs.), Thailand
bDepartment of Chemistry and Center of Excellence for Innovation in Chemistry, Faculty of
Science, Mahidol University, Rama 6 Road, Bangkok 10400, Thailand cLaboratory of Environmental Analytical Chemistry. University of the Balearic Islands, Carretera
Valldemossa km 7.5, E-07122 Palma de Mallorca, Spain
* Corresponding author: [email protected]
Abstract
In this work a fully automated catalytic-spectrophotometric method for determination of copper
at trace level using a multisyringe flow injection system (MSFIA) and a multipumping flow system
(MPFS) coupled to a micro-chip (Chip-MSFIA-MPFS) is presented. The reaction is based on the
catalytic effect of Cu(II) on the oxidation of the in situ reduced form of
dichlorophenolindophenol (DCPI)r, by hydrogen peroxide. Due to the importance of the mixing
order of the reagents, a new design of the chip is proposed. The DCPI, ascorbic acid and buffer
are first propelled to mix in the front section of the chip using MPFS. Then this reagent mixture,
together with hydrogen peroxide and sample, are simultaneously dispensed to the rear section
of the chip by a multisyringe for mixing, heating and absorbance measurement of the product at
600 nm. The optimum conditions are 0.9 mmol L-1 DCPI, 3.6 mmol L-1 ascorbic acid, 0.8 mol L-1
ammonium chloride buffer, pH 10.5, and 0.3 mol L-1 H2O2. The proposed system is simple, rapid,
selective and sensitive. We can determine trace levels of Cu(II) at room temperature (25 °C)
without extraction and separation steps. The main analytical characteristics of the proposed
method are detection limit of 0.12 µg L-1 of Cu(II), working range of 0.4-35 µg L-1 of Cu(II), and
relative standard deviation of 0.79 % (10 µg L-1 Cu(II), n=15). The system was successfully applied
to water samples, certified reference material (CRM) of river and waste water, pharmaceutical
products and animal tissue with sample throughput of 31 injections h-1.
Keywords: automated, catalytic spectrophotometric, chip, multisyringe, multipumping
Introduction Copper is an essential micronutrient for living organisms. It is necessary for growth and is
present in various proteins involved in biological processes1-3. WHO (1996) has estimated that
the average copper requirement is 12.5 μg kg-1 body weight per day for adults and 50 μg kg-1
body weight per day for infants 4. The intake of copper in human is via water, food, or skin
contact 5, 6. However high copper level has toxic effects1, 2, 7 and over a long-term may cause
Page 2 of 30Analytical Methods
123456789101112131415161718192021222324252627282930313233343536373839404142434445464748495051525354555657585960
vomiting and liver damage 4, 8. Copper is released to the environment from many sources, such
as fertilizers, wood preservatives, fungicides, algaecides or corrosion of copper water pipes.
Increased copper levels in environment can be dangerous for water plants, fish and
invertebrates, which can bioaccumulate Cu and incorporate it into the food chain 4, 9. Generally,
copper concentration in natural water is very low (µg L-1 level) 4, 8. Therefore, sensitive methods
are required for measurements of trace amounts of copper in environmental samples.
There are several sensitive techniques for trace copper determination, such as
voltammetry 10, 11, flame atomic absorption spectrometry (FAAS) 6, 9, inductively coupled plasma-
atomic emission spectrometry (ICP-AES) 12, 13, and inductively coupled plasma-mass
spectrometry (ICP-MS) 14, 15. However, these methods need some pre-concentration and/or
separation steps, and the instruments are expensive. Catalytic spectrophotometry on the other
hand is a simple, sensitive, robust and very inexpensive method for trace level determination of
Cu(II) 16-18.
Flow techniques are widely used in chemical analysis due to its many advantages, such as
low volumes (µL scale) of sample and reagents, greater reproducibility, and the possibility of
measurement before attaining final equilibrium state. Multisyringe Flow Injection Analysis
(MSFIA) is a flow technique that includes the advantages of Flow Injection Analysis (FIA), in terms
of efficiency of mixing, and of Sequential Injection Analysis (SIA) with regards to robustness and
versatility 19, 20. MSFIA is an automated system, completely controlled through computer
software which includes data acquisition and a very precise control of operation time. Therefore,
it is a very appropriate flow technique to automate kinetics measurements. The efficient and
highly reproducible mixing of solutions obtained with MSFIA are the critical requirements
needed for kinetic-catalytic determinations21, 22. Moreover the combination of MSFIA with a
multipumping flow systems (MPFS) increases versatility of these flow techniques23, 24. The use of
solenoid micropumps allows large liquid volumes to be propelled in a short time. These small
devices are low-cost, robust, and can be employed for both sample-reagent introduction and
manifold commutation. Furthermore, the pulsating flow generated by micro-pumps promotes
better mixing of solutions than other flow techniques 24. For these reasons, MSFIA-MPFS has
been proposed as a more efficient and versatile combination of flow methods24.
Kinetic-catalytic analytical methods require a strict control of experimental conditions,
especially the temperature during the reaction progress and measurement. However it is not
common to find thermostated detection flow cell. Therefore, we have designed a microfluidic
device, called “Chip”, which is combined with flow techniques for the automation of kinetic-
catalytic methods.
Abouhiat et al. presented a Chip-MSFIA for the spectrophotometric-catalytic
determination of iodide based on the Sandell-Kolthoff reaction 21. Later, Phansi et al. proposed
another chip design which included the detection cell in a thermostated zone 22. This new
configuration allows the use of the initial rate determination method. This Chip-MSFIA method
was applied to spectrophotometric-catalytic determination of Mo(VI) in water samples and
medicinal products. In general, these chips are made of poly(methylmethacrylate) (PMMA) and
integrates different steps in the analytical procedure, such as the confluent point, the mixing
coil, the detection cell. All these are in the thermostated chamber to control the temperature
Page 3 of 30 Analytical Methods
123456789101112131415161718192021222324252627282930313233343536373839404142434445464748495051525354555657585960
during measurement22, 25. The automated Chip-MSFIA system has proved to be very useful for
catalytic reactions for obtaining high sensitivity, accuracy, and precision measurements21, 22, 25.
In this work, a Chip-MSFIA-MPFS is proposed for the spectrophotometric-catalytic
determination of Cu(II) based on its catalytic effect on the oxidation of reduced form of
dichlorophenolindophenol (DCPI)r by hydrogen peroxide in a NH3/NH4Cl buffer 16. In this process
the order of addition and mixing of the reagents is very important towards the products
formation. DCPI is first reduced with ascorbic acid, with a colour change from dark blue to
colourless. This reduced compound is then oxidized by H2O2, with Cu(II) as a catalyst, to give a
blue-violet product. Therefore, a new design of the chip, specially adapted for this reaction was
constructed and coupled to a MSFIA-MPFS system. This allowed the determination of Cu(II) in
water, certified reference material (CRM) of river and waste water, pharmaceuticals, and an
animal tissue.
Experimental section
Reagents and standards
All chemicals were of analytical reagent grade. Milli-Q water (Milli-Q plus, 18.2 MΩ cm-1) was
used for preparing the standard and reagent solutions. Working Cu(II) standard solutions were
prepared by appropriate dilution of stock AAS grade 1000 mg L-1 Cu(II) solution (copper(II)
nitrate in 0.50 mol L-1 HNO3, Scharlau, Spain). 1 mmol L-1 dichlorophenolindophenol (DCPI) stock
solution was prepared by dissolving 73 mg of dichlorophenolindophenol sodium salt hydrate
(Fluka, Switzerland) in 250 mL of a solution containing 210 mg NaHCO3 L-1 (Probus, Spain). The
DCPI solution was kept in a refrigerator prior to use 16. The 10 mmol L-1 ascorbic acid solution
was prepared by dissolving 440 mg of ascorbic acid (Scharlau, Spain) in water and made up to
250 mL. A 0.30 mol L-1 H2O2 solution was prepared daily by appropriate dilution of a
concentrated solution (9.97 mol L-1, Scharlau, Spain). Ammonia-ammonium chloride buffer
solution was prepared by mixing appropriate quantities of 2 mol L-1 NH3 solution and 2 mol L-1
NH4Cl, and made up volume with Milli-Q water 26. A 2 mol L-1 NH3 was prepared from
concentrated (14.80 mol L-1) ammonia solution (Scharlau, Spain) solution. A 2 mol L-1 NH4Cl was
prepared by dissolving 5.35 g of NH4Cl (Panreac, Spain) in 50 mL of water.
Reagents for interference study
Appropriate solutions of Fe(III), V(V), and Cd(II) were prepared from AAS grade stock 1000 mg L-1
Fe(III), V(V), and Cd(II), respectively (Scharlau, Spain). A stock solution of Fe(II), 1000 mg L-1, was
prepared by dissolving 1404 mg of ammonium iron(II) sulphate 6-hydrate (Panreac, Spain) in
water and made up to 20 mL. Stock solution of Mg (II), 1000 mg L-1, was prepared by dissolving
203 mg of MgSO4.7H2O (Probus, Spain) in 20 mL Milli-Q water.
Sample collection and preparation
Rain water was obtained from water tanks of houses in Mallorca. The water is used for drinking
and household use. Samples of demolition leachate wastewater were collected from different
areas of Mallorca. All water samples were collected in plastic bottles (previously cleaned with
Page 4 of 30Analytical Methods
123456789101112131415161718192021222324252627282930313233343536373839404142434445464748495051525354555657585960
HNO3 10% v/v) and transported to the laboratory, where they were filtered through 0.45 µm
cellulose acetate membrane (Sartorious Stedium Biotech, Germany).
A Certified Reference Material of river water (SLRS-4, National Research Council Canada)
was adjusted to neutral pH before analysis. A stock Quality Control Material of waste water (SPS-
WWW2, batch 106, Spectrapure Standards, Norway) was diluted with Milli-Q water, and
adjusted to neutral pH.
Two pharmaceutical samples, Multicentrum and Pharmaton®, were used for method
validation. One tablet of Multicentrum contains 500 µg of copper (Multicentrum 1.39 ± 0.01
g/tablet), whereas Pharmaton has 1000 µg of copper per tablet (Pharmaton® 1.02 ± 0.01
g/tablet). For each product, 10 tablets were powdered in an agate mortar. Then 209 mg of the
Multicentrum and 153 mg of Pharmaton® powder were accurately weighed and transferred into
100 mL Teflon digestion vessels. Then 10 mL of ultrapure concentrated HNO3 (65%) (Scharlau,
Spain) were added and the closed vessels placed in a microwave oven (Milestone, START D) to
digest the samples. The oven is equipped with a 2450 MHz microwave power supply (0-1200 W),
a 6-position turntable and 100 mL Teflon liners with 355° rotatable pressure release valves,
resistant up to 350 psi and 210 °C. The step of microwave program for pharmaceutical sample
digestion was 1000 W, 200 °C, 30 minutes. The digested solutions were cooled to room
temperature and then evaporated to reduce their volume to a small drop. Finally, the volume
was adjusted to 100 mL with MilliQ water to obtain a 750 µg L-1 and 1500 µg L-1 copper solution
for Multicentrum and Pharmaton®, respectively.
In order to compare results obtained for samples directly diluted with that from
digestion, copper medicine solution (“Cobre”) were analyzed with only a dilution step or
digested using a similar procedure for solid sample, as described previously.
Solutions of pig heart tissue and fish tissue certified reference material (DORM-2) were
obtained by microwave digestion. Tissue sections of pig heart were first lyophilized for 36 h.
Then 0.500 g of the lyophilized tissue and DORM-2 powder were accurately weighed and
transferred into 100 mL Teflon digestion vessel, 8 mL of ultrapure concentrated HNO3 (65%,
Scharlau, Spain) and 2 mL of H2O2 (30%, Scharlau, Spain) were added and the closed vessels were
placed in the microwave oven. The microwave program was 10 min increasing to 120 °C, 5 min
at 120 °C, then 10 min increasing to 200 °C, 15 min at 200 °C, and finally 20 min for ventilation.
After digestion, solutions were cooled to room temperature and evaporated to reduce their
volume to a small drop. The volume were finally adjusted to 25 mL with HNO3 2% v/v.
ICP-AES was used as a reference method for the quantification of Cu(II) in water samples
previously acidified with concentrated HNO3 (65%, Scharlau, Spain) to 2% v/v. An ICP-AES
(Optima 5300 DV, Perkin Elmer® Inc.) equipped with a Gem Tip Cross-flow pneumatic nebulizer
(Waltham, MA, USA) was operated using the following instrumental parameters: RF generator
power 1300 W, RF frequency 40 MHz, plasma argon flow 15 L min−1, nebulizer argon flow 0.8 L
min−1, auxiliary argon flow 0.5 L min−1, integration time 5 s and aspiration rate 1.5 mL min−1.
Wavelength for emission measurements was 324.752 nm. All measurements were done in
triplicate.
Page 5 of 30 Analytical Methods
123456789101112131415161718192021222324252627282930313233343536373839404142434445464748495051525354555657585960
Flow conduit chip
The chip was constructed from three rectangular poly(methylmethacrylate) (PMMA) plates, with
modification to the design previously reported by Abouhiat et al. and Phansi et al. 21, 22. One
piece, with dimensions 115 x 44 x 10 mm, was used for the flow channels and the other two
pieces, 115 x 44 x 10 mm and 115 x 44 x 15 mm, respectively, formed the thermostating unit, as
shown in Fig. 1. Two serpentine channels, 1.5 mm wide x 1.0 mm deep x 39 mm long, together
with various confluence points, were made using a 3-axis PC controlled CNC milling machine (see
Fig. 1(a)) Threads of ¼" 28 fittings were drilled in this flow plate for connecting to tubings for the
reagents, carrier and sample, and to the waste outlet line. At the outlet end of the second
serpentine groove a straight channel, 40 mm, was made spanning the width of the plate. This
formed the detection flow cell. At the two ends of this linear channel two threads of UNF ¼" 36
fittings were drilled for connecting the optical fibers (see Fig. 1(a)). As for the other two plates, a
rectangular cavity, 45 x 41 x 8 mm for the thinner plate and 45 x 41 x 13 mm for the thicker base
plate, was milled out (see Fig.1(b)). These two plates were then glued together so that the two
cavities formed a reservoir for the circulation of thermostated water. The grooved plate was
then glued, with the grooves facing downwards, to the upper plate of the reservoir so that the
outlet section of the chip, with the detection flow channel, was over the reservoir. To glue the
various plates together, a thin film of methacrylic acid was first applied, the plates tightly
clamped together, followed by UV curing for 1 h.
Flow analyzer
The final automated Chip-MSFIA-MSFS system is shown in Fig 2. A multisyringe piston pump
module (model Bu 4S) was purchased from Crison Instruments S.A. (Allela, Barcelona, Spain).
The module was equipped with two 1 mL glass syringes (S1, and S2) and one 5 mL glass syringe
(S4). Solenoid valves (V1, V2, and V4) allowed connection of each syringe with either the chip
(position ON, activated) or with the respective solution reservoir (position OFF, deactivated) for
refilling. Solutions in the syringes were H2O2 in S1, and Milli-Q water (carrier) in S3 and S4.
Furthermore, an external three-way solenoid valve (V5) from Takasago (STV-3 1/4UKG, Nagoya,
Japan) was powered and controlled using an auxiliary supply port of the multisyringe module. V5
was used for sample introduction (position ON), and its common position was connected to a
holding coil of 255 cm length and 1.00 mm i.d. The MPFS set-up consists of three solenoid
micropumps (BIOChem Valve, NJ, USA) with stroke volumes of 8 μL. The MPFS system was used
for propelling DCPI (M1), ascorbic acid (M2), and ammonia-ammonium chloride buffer solutions
(M3). The flow rate of MPFS is set by the frequency and volume dispensed at each pulse.
All tubings of the flow system were of PTFE with 0.8 mm i.d. The chip has a continuous
flow through the cavity of water from a thermostated bath (Selecta, Barcelona) via silicon tubes
(ca. 20 cm, 1 cm id). The cavity served as a heated source to accelerate the reaction in the
serpentine channel. For batch analysis, a 45 position autosampler with 10 mL sample vials
(Crison Instruments S.A., Barcelona, Spain) was connected to the sampling tube. The
multisyringe module and the autosampler were connected in series via a RS232C interface to a
PC for remote software control (AutoAnalysis 5.0, Sciware Systems SL, Bunyola, Spain). A DH-
2000 deuterium lamp (TOP Sensor Systems, Eerbeek, Netherlands) was used as light source, and
Page 6 of 30Analytical Methods
123456789101112131415161718192021222324252627282930313233343536373839404142434445464748495051525354555657585960
an USB-2000 miniature CCD spectrophotometer (Ocean Optics Inc., Dunedin, FL, USA) as the
detector.
Analytical protocol and flow method
The operation procedure is shown in Table 1. First, the three reagents were mixed (Step 1) by
activation of the micropumps M1, M2, and M3 to propel 0.250 mL of DCPI, ascorbic acid, and
ammonia-ammonium chloride buffer into the front section of the chip (Fig. 2). During this
process the solution in the channel changed from a dark blue colour to colourless. In Step 2
0.100 mL of carrier (S4), 0.020 mL of carrier (S2), and of H2O2 (S1) were rapidly dispensed into
the chip to clear the interconnecting channels between the two serpentine sections of any
reagent solution. In Step 3 1.900 mL of the carrier solution in Syringe 4 was pumped through the
rear section of the chip to clean out the serpentine channel and the flow cell. Then 0.250 mL of
sample was aspirated via V5 (Step 4) into the holding coil HC (using the multi-syringe). A 0.05 mL
of the sample in the HC was next dispensed (Step 5)into the chip so that this plug at the head of
the sample plug which would be diluted by the solution in the tubing between the valve V5 and
the chip would not be mixed with the reagents in the next step. The remaining 0.200 mL of
sample and the equivalent volume (0.040 mL) of the mixed reagents (in the first section of the
chip) and the hydrogen peroxide (in S1) were next loaded in the detector zone of the chip. The
flow was stopped for 5 seconds for the oxidation process to proceed (Step 6) and then 1.900 mL
of the reacting solution was pumped through the detector flow channel and the absorbance
measured at 600 nm, with a reference absorbance measured at 760 nm to eliminate any
schlieren effect (Steps 7-9). Finally all 4 syringes were refilled with their reagents with the pistons
returned to their initial positions.
Results and discussion
Optimization of the experimental conditions
Multivariate optimization
Fractionated two level (24-1) factorial design was used to screen the four important
parameters for their effects. The concentration of DCPI, ascorbic acid, H2O2, and ammonia-
ammonium chloride buffer were varied within the experimental range of 0.30-0.50 mmol L-1,
2.00-4.00 mmol L-1, 0.02-0.10 mol L-1, and 0.10-0.50 mol L-1, respectively. These values refer to
the concentration in the reagent reservoirs. The temperature was maintained at room
temperature (25 °C), buffer pH set at 10.5 and the stopped-time at 5 s. Differences between
standard and blank signals could not be observed after 5 seconds using pH less than 10, but
standard and blank signals were very different when a pH 10.5 was used. At pH higher than 10.5
the capacity of ammonia-ammonium chloride buffer decreased, therefore pH 10.5 was selected
for all experiments.
The measured signals for these experiments were the absorbance peak heights. The ratio
of the analytical signal of standard 15 µg L-1 Cu(II) and blank (standard/blank), and the difference
between the absorbance peak height of standard and blank divided by the concentration of the
standard (slope) ((standard-blank)/15) were selected as response variables in order to obtain the
maximal relationship or differences between the catalysed and uncatalysed reactions. Using
Page 7 of 30 Analytical Methods
123456789101112131415161718192021222324252627282930313233343536373839404142434445464748495051525354555657585960
these two response variables, and taking into account the increasing blank signal, the
experimental conditions were obtained with the highest sensitivity,
Fractionated two level (24-1) factorial design fitted well to a 2-way interaction for both
standard/blank and slope observations without any significant lack of fit (r2=0.99) and a very low
absolute error. The statistical results obtained from standard/blank and slope (shown in the
supplementary material Table A-1) indicated that concentration of DCPI, ascorbic acid, H2O2,
ammonia-ammonium chloride buffer, interaction between concentration of DCPI and ascorbic
acid, and interaction between concentration of DCPI and buffer are significant factors. The
analytical response increased at higher H2O2 and buffer concentration. For ascorbic acid, the
analytical response decreased with the increment of ascorbic acid concentration. This is because
an excess of ascorbic acid could reduce the oxidised blue-violet product to the colourless
product again. However, a too low ascorbic acid concentration may not be enough to reduce the
DCPI to colourless product, so increasing the blank signal. Therefore, the ratio between DCPI and
ascorbic acid concentration was selected at 1:4, which is the lowest concentration of ascorbic
acid that can completely reduce DCPI to colourless product.
The profiles of predicted values and desirability function were used to define the optimal
experimental conditions and the behaviour of both response variables. The analytical response
obtained for standard/blank ratio was negative, while analytical response obtained for slope was
positive. This apparent contradiction is due to the increment of blank signal with the DCPI
concentration which affects more the ratio than the slope response variable. The maximum
response zone of the profile of predicted values and the desirability function for ratio and slope
correspond to DCPI, and were 0.40 mmol L-1 DCPI, 2.0 mmol L-1 ascorbic acid, 0.1 mol L-1 H2O2,
and 0.5 mol L-1, ammonia-ammonium chloride buffer. However, the significant interaction
between DCPI and ammonia-ammonium chloride buffer concentration require further study of
this condition, In this case a Doehlert design was used in a concentration range of 0.40-1.00
mmol L-1 for DCPI, and 0.50-1.00 mol L-1 for buffer (at 25 ºC, 0.1 mol L-1 H2O2, stopped time 5 s).
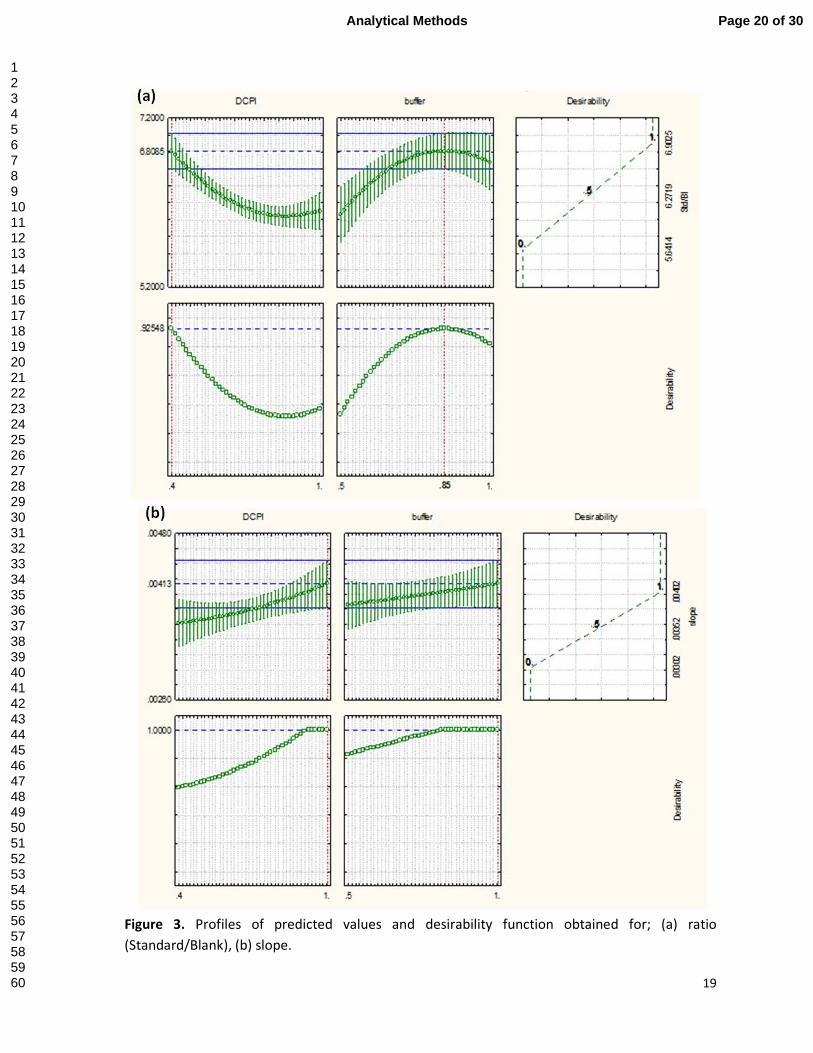
Doehlert design fitted well to a 2-way interaction for both ratio and slope response
without any significant lack of fit, and a very low absolute error. The analytical response
increased at high concentration of buffer. For DCPI the analytical response were similar to the
results in fractionated two level (24-1) factorial design. The maximum response of the profile of
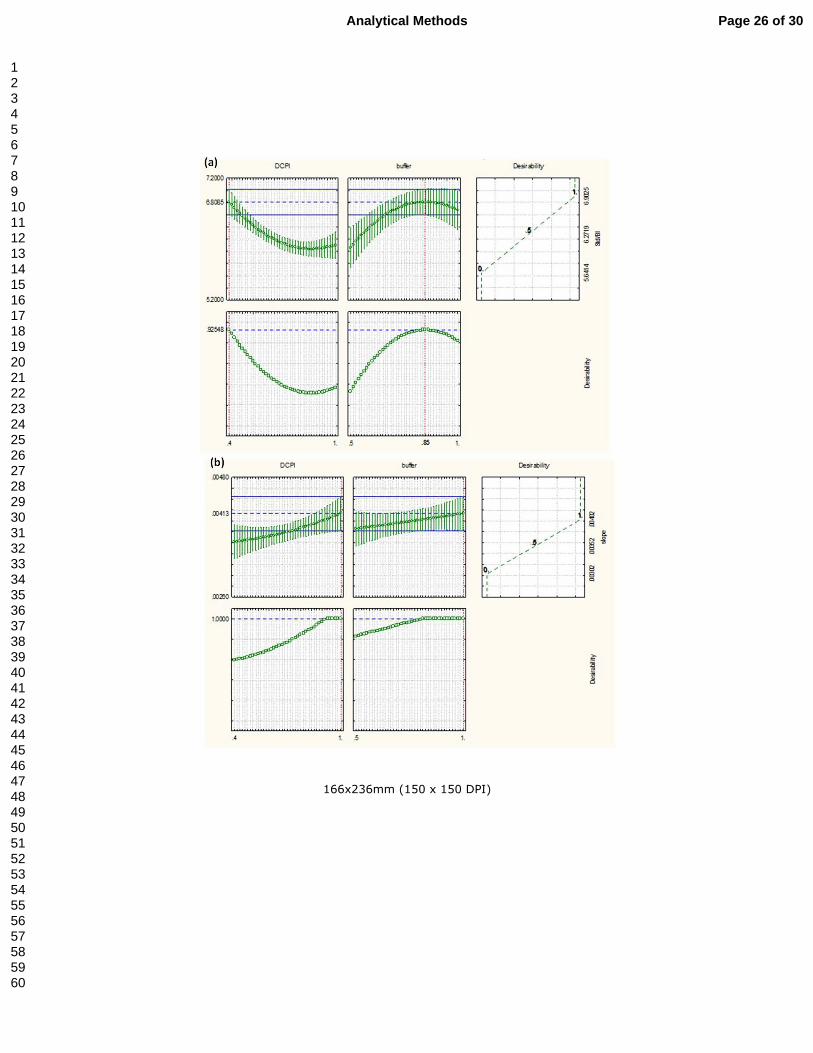
predicted values and the desirability function obtained for ratio and slope of DCPI were 0.40 and
0.90 mmol L-1, respectively as shown in Fig.3. However, the distortion of ratio response with the
increasing blank signal with the DCPI concentration led us to select the slope as the most
appropriate response variable. Therefore, 0.90 mmol L-1 of DCPI was selected as optimal. The
standard signal increased with buffer concentration but also the blank signal. The maximum
response zone of the profile of predicted values and the desirability function obtained for ratio
and slope of buffer are 0.85 and 1.00 mol L-1, respectively. However, buffer concentrations
higher than 0.80 mol L-1 did not vary significantly the slope as shown in Fig. 3 (b), and higher
buffer concentration increased the blank signal. Therefore, 0.80 mol L-1 was selected for this
work.
Page 8 of 30Analytical Methods
123456789101112131415161718192021222324252627282930313233343536373839404142434445464748495051525354555657585960
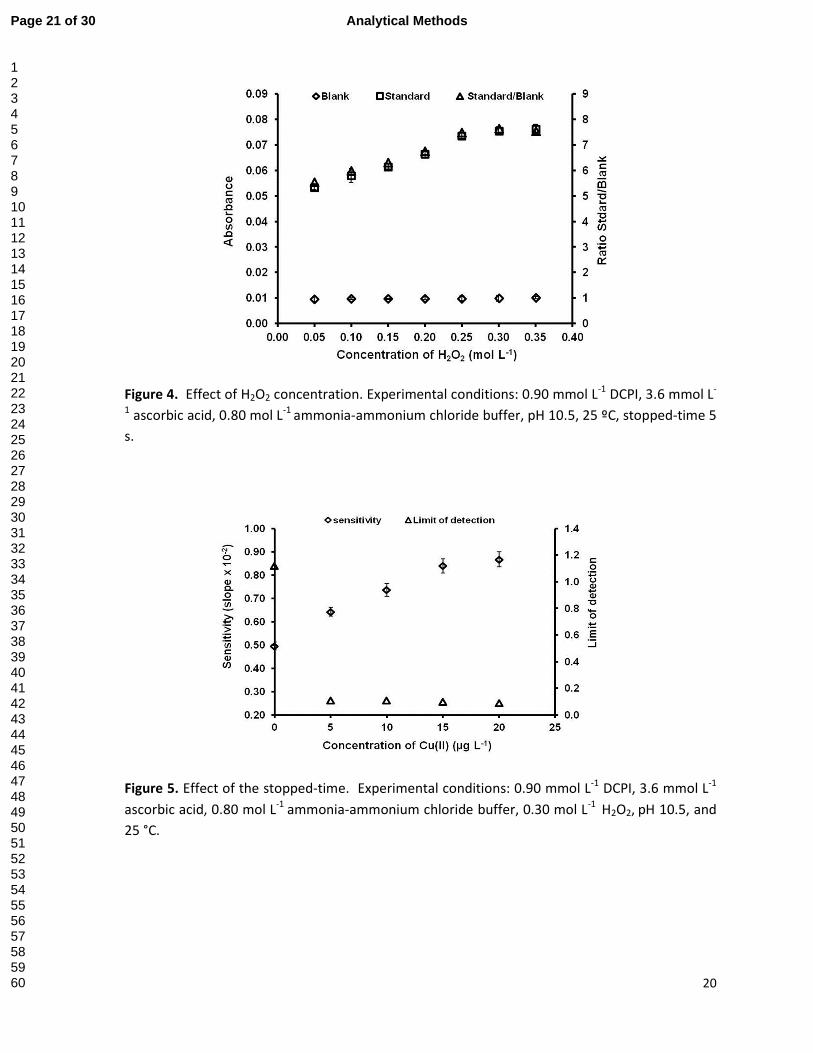
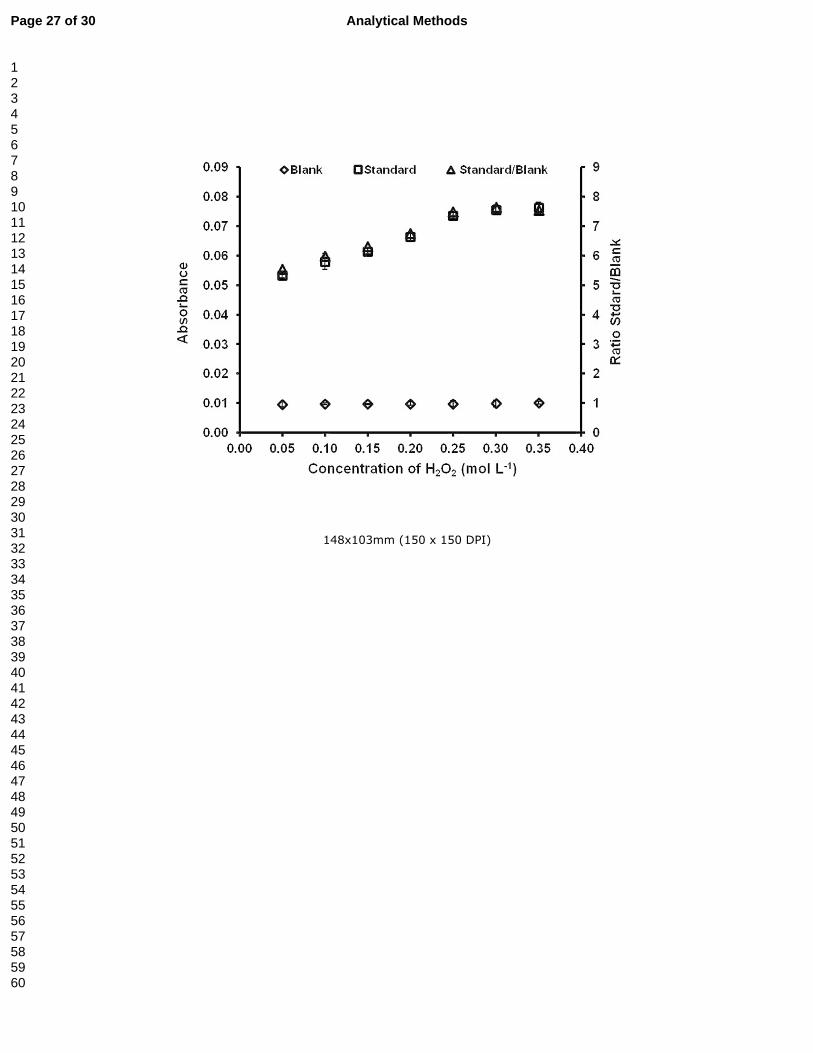
Effect of H2O2 concentration
The concentration of H2O2 was optimized by an univariate procedure at 0.90 mmol L-1
DCPI, 3.6 mmol L-1 ascorbic acid, 0.80 mol L-1 ammonia-ammonium chloride buffer, pH 10.5, 25
ºC, and stopped-time of 5 s. The signal of 15 µg L-1 Cu(II) standard and blank (water) were
observed. The results indicated that the signal for the standard increased with the concentration
of H2O2, while the blank signal was not significantly different. Therefore, 0.30 mol L-1 H2O2 was
selected for this work, obtaining a maximum ratio between standard and blank signal which
remained constant at higher H2O2 concentration, as shown in Fig. 4.
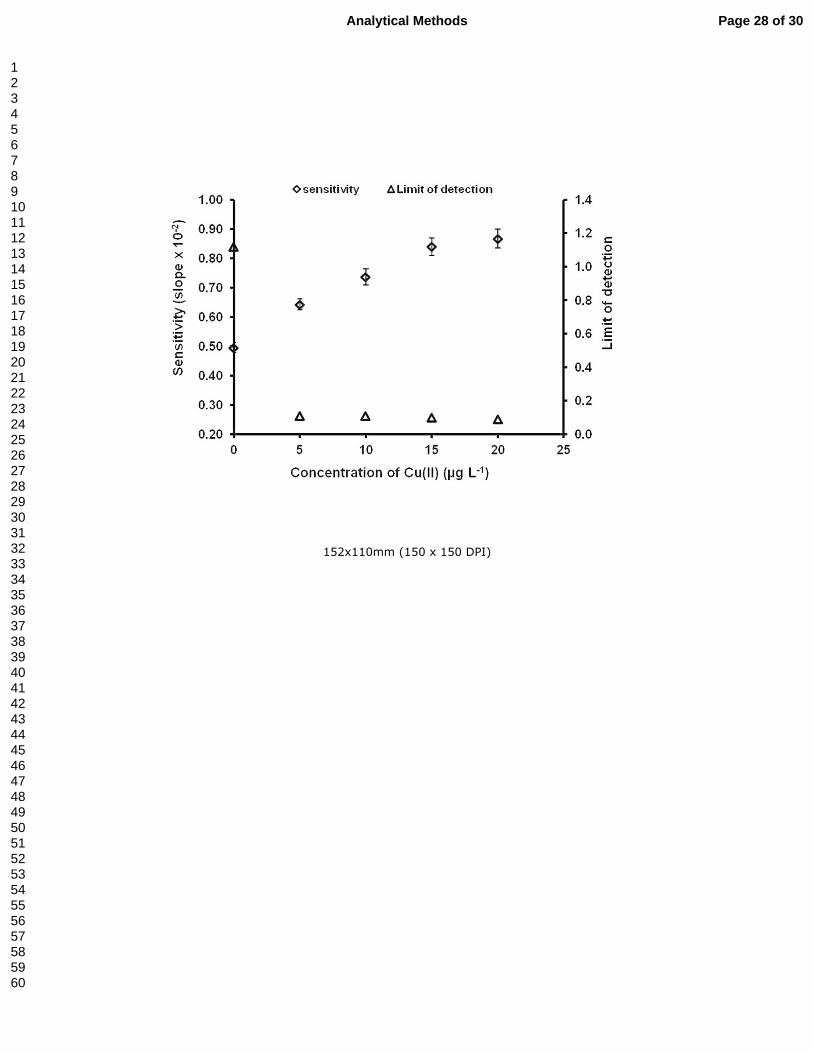
Effect of stopping time
The effect of the stopping time was observed by injecting standard Cu(II) at 0.4-40 µg L-1
under optimum experimental conditions; 0.90 mmol L-1 DCPI, 3.6 mmol L-1 ascorbic acid, 0.80
mol L-1 ammonia-ammonium chloride buffer, pH 10.5, and 0.30 mol L-1 H2O2 (at 25 °C). The
results indicated that the sensitivity (slope) increased when the stopped-time were increased
(Fig. 5). On comparing continuous flow with stopped-time of 5 s, the sensitivity of stopped-flow
mode was very different from continuous flow. The limit of detection (LOD) obtained for the
stopped-flow was much lower than the LOD obtained for continuous flow. The linear range of
0.4-35 µg L-1 Cu(II) was obtained for both continuous flow and stopping flow for 5 s. A stopped-
time greater than 5 s would increase the sensitivity. However, the LOD did not significantly differ
between 5 and 20 s stopped-time. The linear range decreased to 1-30 µg L-1 Cu(II) for stopped-
times 10 - 12 s. Therefore, a stopped-time of 5 s was selected for this work in order to obtain
highest sensitivity, low LOD, high sample throughput, and the widest working range.
Effect of temperature
Temperatures between 25 and 35 °C was studied using standard Cu(II) 0.4-35 µg L-1 and
the optimum reagents conditions: 0.90 mmol L-1 DCPI, 3.6 mmol L-1 ascorbic acid, 0.80 mol L-1
ammonia-ammonium chloride buffer, pH 10.5, 0.30 mol L-1 H2O2, and stopped-time of 5 s. The
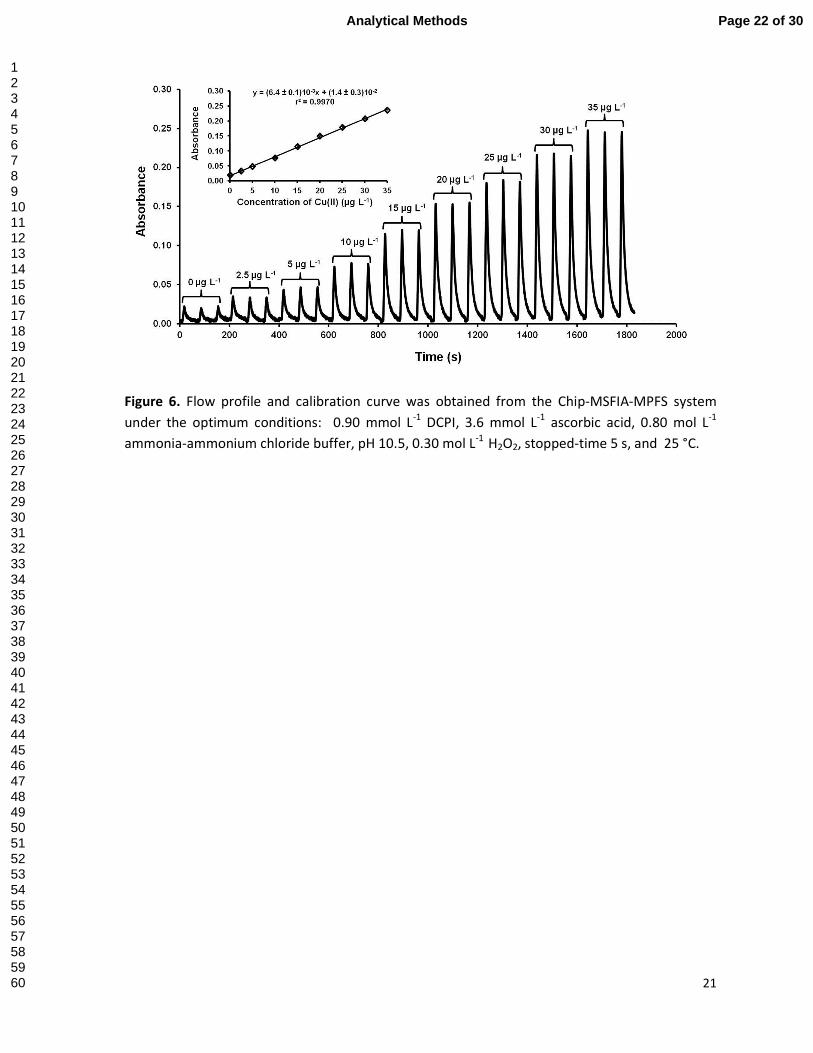
calibration equations obtained at 25 ºC and 35 ºC were y = (6.4 ± 0.1)10-3x + (1.4 ± 0.3)10-2 (r2 =
0.997) and, y = (7.3 ± 0.1)10-3x + (1.8 ± 0.3)10-2 (r2 = 0.998), respectively. The limit of detection at
35 °C (LOD=0.09 µg L-1) was only slightly lower than that obtained at 25 ºC (LOD=0.12 µg L-1).
However at temperature higher than 35 ºC, although the sensitivity increased, many bubbles
were formed affecting the reproducibility of the measurement.
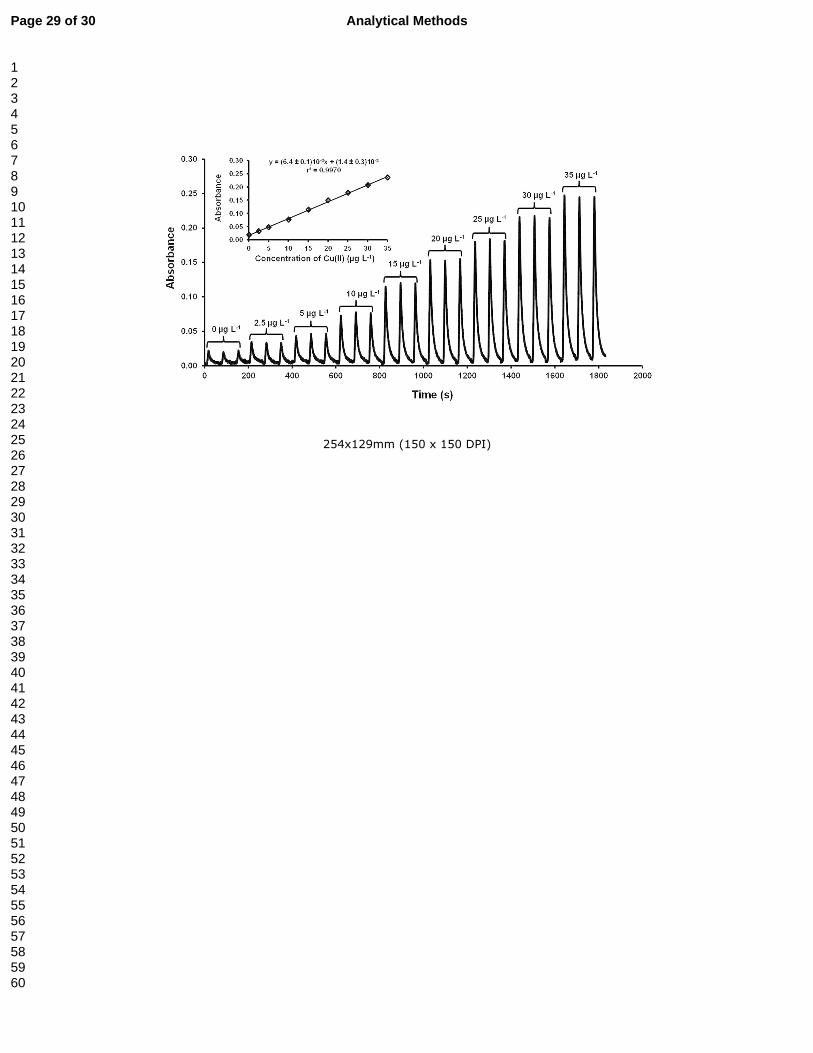
Analytical characteristics
Analytical features obtained using the proposed Chip-MSFIA-MSFS system are summarized in
Table 2. Flow profile and calibration curve (Fig. 6) were obtained under the optimum conditions:
0.90 mmol L-1 DCPI, 3.6 mmol L-1 ascorbic acid, 0.80 mol L-1 ammonia-ammonium chloride buffer,
pH 10.5, 0.30 mol L-1 H2O2, stopped-time 5 s, and 25 °C.
Other analytical methods based on copper kinetic-catalytic redox reaction have been
reported16-18, 27-29. Some of these methods are summarized in Table 2. In order to evaluate the
advantages and competitiveness of our new proposed method, their characteristics have been
compared with those obtained by other similar analytical methods currently reported. Most of
these methods are not automated, since they are carried out batch-wise16, 18, 28-30. FIA methods
has also been used for increasing the degree of automation of analysis 17. However, reported FIA
methods are not fully automated since the samples are manually injected. Prodromidis et al.
Page 9 of 30 Analytical Methods
123456789101112131415161718192021222324252627282930313233343536373839404142434445464748495051525354555657585960
proposed the determination Cu(II) based on the catalytic activity of Cu(II) on the oxidation of
leucocompound of the 2,6-dichlorophenol, (DCPI)r, by hydrogen peroxide in ammonia-
ammonium chloride buffer solution 16. The reaction is rapid, sensitive, and has a high tolerance
to other metal ions, especially Fe(III) and Mg(II) which are present in water samples. Moreover,
the reaction is simple, and could be applied to different types of samples. Therefore, this
reaction was selected for this work. The Chip-MSFIA-MPFS improved the sensitivity and precision
obtained with batch method due to the full automation and computer control of the system.
Besides, the significant effect of temperature is controlled in the chip during both the reaction
step and measurement. The reagents and sample are dispensed by the multisyringe module with
a very high precision, allowing complete mixing, heating, and measurement inside the chip. The
MPFS is a very good system for mixing reagent in a short time due to its turbulent flow and
precise flow rate. Therefore, the fully automated Chip-MSFIA-MPFS is a very rapid, sensitive,
precision, accuracy, and robustness method for Cu(II) determination in water, pharmaceutical
and tissue samples.
Interference study
The interference effect of some foreign ions in the proposed reaction have been studied in a
previous work 16, which showed that only V and Cd interfered significantly. However, water
samples in Mallorca have high concentrations of Fe and Mg. Therefore, Fe(III), Fe(II), Mg(II), V(V),
and Cd(II) were studied in this work using a Cu(II) standard of 10 µg L-1. The system was found to
be tolerant to Fe(III) and Fe(II) up to 1000 µg L-1 level, with changes in the absorbance of the
catalytic reaction less than 5%. The tolerance ratio of Cu to Fe of 1:100 allows Cu determination
in samples such as Mallorca natural water with Fe content lower than 1000 µg L-1. Medicinal
samples can also be measured by sample dilution to decrease the Fe interference. The system
could tolerate Mg(II) up to 3500 µg L-1. At Mg(II) concentration higher than 3500 µg L-1 the
analytical signal increased producing a positive error. For V(V), and Cd(II), the tolerance level was
20 µg L-1. However, in general water samples have V(V), and Cd(II) at concentrations lower than
this value. The high sensitivity of the present method allows avoiding interference effect by just
sample dilution.
The tolerance limit of the Chip-MSFIA-MPFS system is lower than the previous work
proposed by Prodomidis et al. 16. Our new system has higher sensitivity, and the interferences
study was carried out with a 10-times lower concentration of Cu (II) standard of 10 µg L-1. This
allows the application of the proposed method to a wider diversity of samples, including those
with very low concentrations, such as natural waters.
Application and validation
The proposed method has been validated according to the IUPAC directives 31. For this purpose,
three certified reference material of water sample were used, as well as a reference method
(ICP-AES), and also spiked samples for the spike-recovery test. The Cu(II) content in CRM (SLRS-4,
National Research Council , Canada) obtained using the Chip-MSFIA-MPFS method (1.84 ± 0.10
µg L-1) agrees well with CRM reported value (1.81 ± 0.08 µg L-1). The Cu(II) content in Quality
Control Material of waste water (SPS-WWW2, batch 106, Spectrapure Standards, Norway)
Page 10 of 30Analytical Methods
123456789101112131415161718192021222324252627282930313233343536373839404142434445464748495051525354555657585960
obtained using our Chip-MSFIA-MPFS method (1998.85 ± 6.41 µg L-1) is not significantly different
from that QCM reported value (2000 ± 10 µg L-1).
The analysis of rainwater and drinking water samples demonstrates the applicability of
the proposed method to different matrix of water samples. The concentration values obtained
with the Chip-MSFIA-MPFS agree well with those obtained with ICP-AES, as shown in Table 3. No
significant differences were found between these methods at a 95% confidence level by t-test (t-
obs < t-crit =2.92). The Cu(II) content in rainwater and drinking water is very low. Therefore
three concentration levels 5, 10 and 15 µg L-1 Cu(II) were spiked into the samples to evaluate the
matrix effect on the reaction. The recoveries obtained were between 94 and 105 %. It should be
highlighted that Cu(II) levels are notably high in some collected rain water samples, probably
because Cu(II) was released from alloy pipes leading to the reservoir.
Furthermore, the proposed method was applied to pharmaceutical and tissue samples.
The observed Cu(II) value was not significantly different from the reported value for the
pharmaceutical product and heart tissue samples. No significant differences were found
between these methods at a 95% confidence level by t-test (t-obs < t-crit =2.92) as shown in
Table 4. The standard 10 µg L-1 Cu(II)) were spiked into the samples to evaluate the matrix effect
on the reaction. The recoveries obtained were between 96 and 107 %. Moreover, the Cu(II)
value in “Cobre” medicine solutions obtained from direct dilution was similar to Cu(II) level
obtained from digestion. This means that the proposed method is not affected by the matrix of
this medicine product.
Conclusions
This is the first proposed automated method which uses MSFIA-MPFS coupled to a chip
for catalytic spectrophotometric determination. The chip is a new design in order to reduce the
2,6-dichlorophenolindophenol (DCPI) prior to its oxidation by hydrogen peroxide reaction,
catalyzed by Cu(II). The Chip-MSFIA-MPFS system is very suitable method for measurement of
trace Cu(II) with high sensitivity (µg L-1 level), precision, and accuracy. The reaction is rapid
allowing high sample throughput. Moreover, the proposed system is fully automated and
controlled by a computer which improves its repeatability, efficiency and robustness. The
proposed method was applied to determine Cu(II) in water, pharmaceutical, and tissue samples.
It has been validated using two different certified reference materials of water, a reference
method (ICP-AES) and spike-recovery study.
Acknowledgments
The authors acknowledge the financial support from the Spanish Ministry of Science and
Innovation through the project CTQ2013-47461-R and from the Conselleria d’Economia,
Hacienda, e Innovació of the Government of the Balearic Islands through the allowance to
competitive groups (43/2011) through FEDER Funds. Scholarship from The Royal Golden Jubilee
TRF-Ph. D. scholarship (for PP) is gratefully acknowledged. Finally, the authors would like to
thank Assoc.Prof. Prapin Wilairat for his useful comments and editing.
Page 11 of 30 Analytical Methods
123456789101112131415161718192021222324252627282930313233343536373839404142434445464748495051525354555657585960
Appendix, Supplementary material
Supplementary data associated with this article can be found in online version.
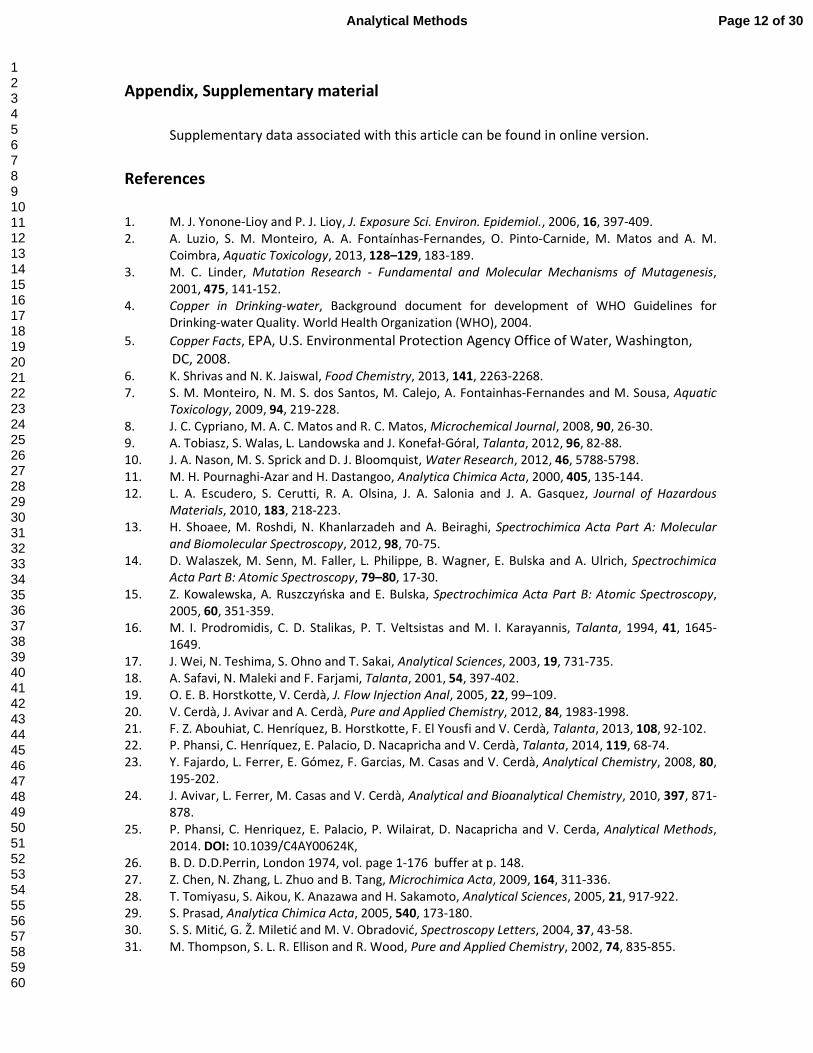
References
1. M. J. Yonone-Lioy and P. J. Lioy, J. Exposure Sci. Environ. Epidemiol., 2006, 16, 397-409. 2. A. Luzio, S. M. Monteiro, A. A. Fontaínhas-Fernandes, O. Pinto-Carnide, M. Matos and A. M.
Coimbra, Aquatic Toxicology, 2013, 128–129, 183-189. 3. M. C. Linder, Mutation Research - Fundamental and Molecular Mechanisms of Mutagenesis,
2001, 475, 141-152. 4. Copper in Drinking-water, Background document for development of WHO Guidelines for
Drinking-water Quality. World Health Organization (WHO), 2004.
5. Copper Facts, EPA, U.S. Environmental Protection Agency Office of Water, Washington, DC, 2008. 6. K. Shrivas and N. K. Jaiswal, Food Chemistry, 2013, 141, 2263-2268. 7. S. M. Monteiro, N. M. S. dos Santos, M. Calejo, A. Fontainhas-Fernandes and M. Sousa, Aquatic
Toxicology, 2009, 94, 219-228. 8. J. C. Cypriano, M. A. C. Matos and R. C. Matos, Microchemical Journal, 2008, 90, 26-30. 9. A. Tobiasz, S. Walas, L. Landowska and J. Konefał-Góral, Talanta, 2012, 96, 82-88. 10. J. A. Nason, M. S. Sprick and D. J. Bloomquist, Water Research, 2012, 46, 5788-5798. 11. M. H. Pournaghi-Azar and H. Dastangoo, Analytica Chimica Acta, 2000, 405, 135-144. 12. L. A. Escudero, S. Cerutti, R. A. Olsina, J. A. Salonia and J. A. Gasquez, Journal of Hazardous
Materials, 2010, 183, 218-223. 13. H. Shoaee, M. Roshdi, N. Khanlarzadeh and A. Beiraghi, Spectrochimica Acta Part A: Molecular
and Biomolecular Spectroscopy, 2012, 98, 70-75. 14. D. Walaszek, M. Senn, M. Faller, L. Philippe, B. Wagner, E. Bulska and A. Ulrich, Spectrochimica
Acta Part B: Atomic Spectroscopy, 79–80, 17-30. 15. Z. Kowalewska, A. Ruszczyńska and E. Bulska, Spectrochimica Acta Part B: Atomic Spectroscopy,
2005, 60, 351-359. 16. M. I. Prodromidis, C. D. Stalikas, P. T. Veltsistas and M. I. Karayannis, Talanta, 1994, 41, 1645-
1649. 17. J. Wei, N. Teshima, S. Ohno and T. Sakai, Analytical Sciences, 2003, 19, 731-735. 18. A. Safavi, N. Maleki and F. Farjami, Talanta, 2001, 54, 397-402. 19. O. E. B. Horstkotte, V. Cerdà, J. Flow Injection Anal, 2005, 22, 99–109. 20. V. Cerdà, J. Avivar and A. Cerdà, Pure and Applied Chemistry, 2012, 84, 1983-1998. 21. F. Z. Abouhiat, C. Henríquez, B. Horstkotte, F. El Yousfi and V. Cerdà, Talanta, 2013, 108, 92-102. 22. P. Phansi, C. Henríquez, E. Palacio, D. Nacapricha and V. Cerdà, Talanta, 2014, 119, 68-74. 23. Y. Fajardo, L. Ferrer, E. Gómez, F. Garcias, M. Casas and V. Cerdà, Analytical Chemistry, 2008, 80,
195-202. 24. J. Avivar, L. Ferrer, M. Casas and V. Cerdà, Analytical and Bioanalytical Chemistry, 2010, 397, 871-
878. 25. P. Phansi, C. Henriquez, E. Palacio, P. Wilairat, D. Nacapricha and V. Cerda, Analytical Methods,
2014. DOI: 10.1039/C4AY00624K, 26. B. D. D.D.Perrin, London 1974, vol. page 1-176 buffer at p. 148. 27. Z. Chen, N. Zhang, L. Zhuo and B. Tang, Microchimica Acta, 2009, 164, 311-336. 28. T. Tomiyasu, S. Aikou, K. Anazawa and H. Sakamoto, Analytical Sciences, 2005, 21, 917-922. 29. S. Prasad, Analytica Chimica Acta, 2005, 540, 173-180. 30. S. S. Mitić, G. Ž. Miletić and M. V. Obradović, Spectroscopy Letters, 2004, 37, 43-58. 31. M. Thompson, S. L. R. Ellison and R. Wood, Pure and Applied Chemistry, 2002, 74, 835-855.
Page 12 of 30Analytical Methods
123456789101112131415161718192021222324252627282930313233343536373839404142434445464748495051525354555657585960
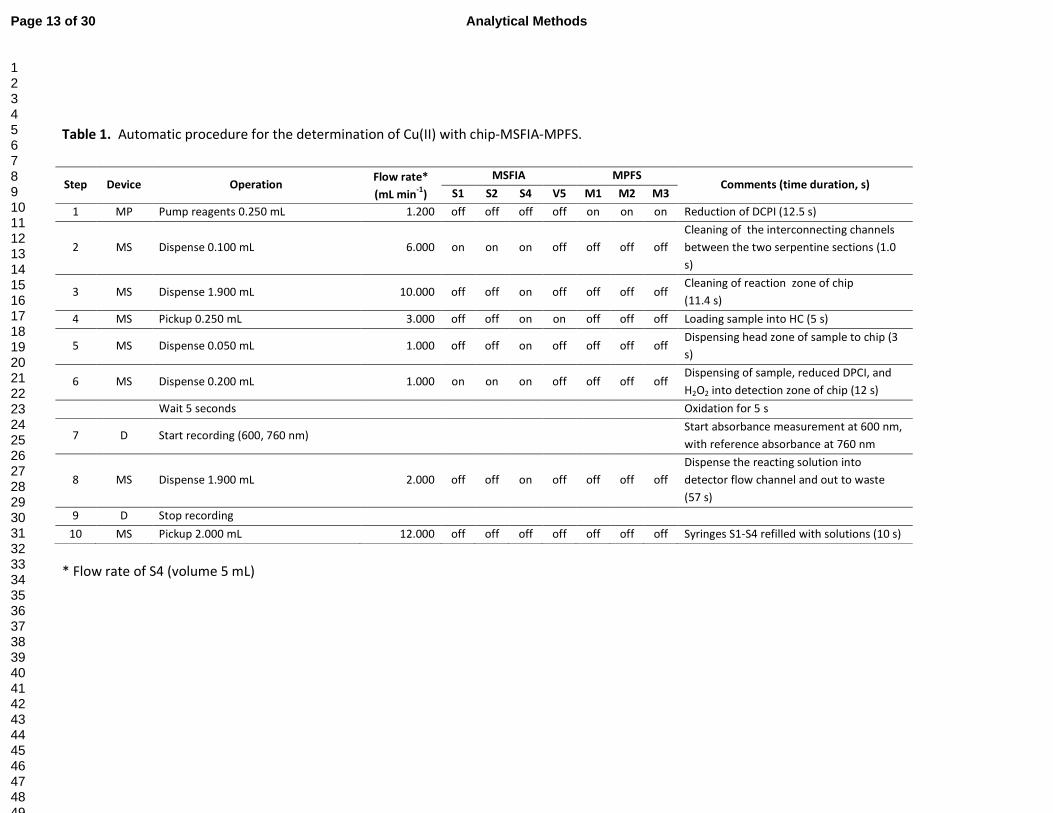
Table 1. Automatic procedure for the determination of Cu(II) with chip-MSFIA-MPFS.
Step Device Operation Flow rate*
(mL min-1
)
MSFIA MPFS Comments (time duration, s)
S1 S2 S4 V5 M1 M2 M3
1 MP Pump reagents 0.250 mL 1.200 off off off off on on on Reduction of DCPI (12.5 s)
2 MS Dispense 0.100 mL 6.000 on on on off off off off
Cleaning of the interconnecting channels
between the two serpentine sections (1.0
s)
3 MS Dispense 1.900 mL 10.000 off off on off off off off Cleaning of reaction zone of chip
(11.4 s)
4 MS Pickup 0.250 mL 3.000 off off on on off off off Loading sample into HC (5 s)
5 MS Dispense 0.050 mL 1.000 off off on off off off off Dispensing head zone of sample to chip (3
s)
6 MS Dispense 0.200 mL 1.000 on on on off off off off Dispensing of sample, reduced DPCI, and
H2O2 into detection zone of chip (12 s)
Wait 5 seconds Oxidation for 5 s
7 D Start recording (600, 760 nm) Start absorbance measurement at 600 nm,
with reference absorbance at 760 nm
8 MS Dispense 1.900 mL 2.000 off off on off off off off
Dispense the reacting solution into
detector flow channel and out to waste
(57 s)
9 D Stop recording
10 MS Pickup 2.000 mL 12.000 off off off off off off off Syringes S1-S4 refilled with solutions (10 s)
* Flow rate of S4 (volume 5 mL)
Page 13 of 30 Analytical Methods
123456789101112131415161718192021222324252627282930313233343536373839404142434445464748495051525354555657585960
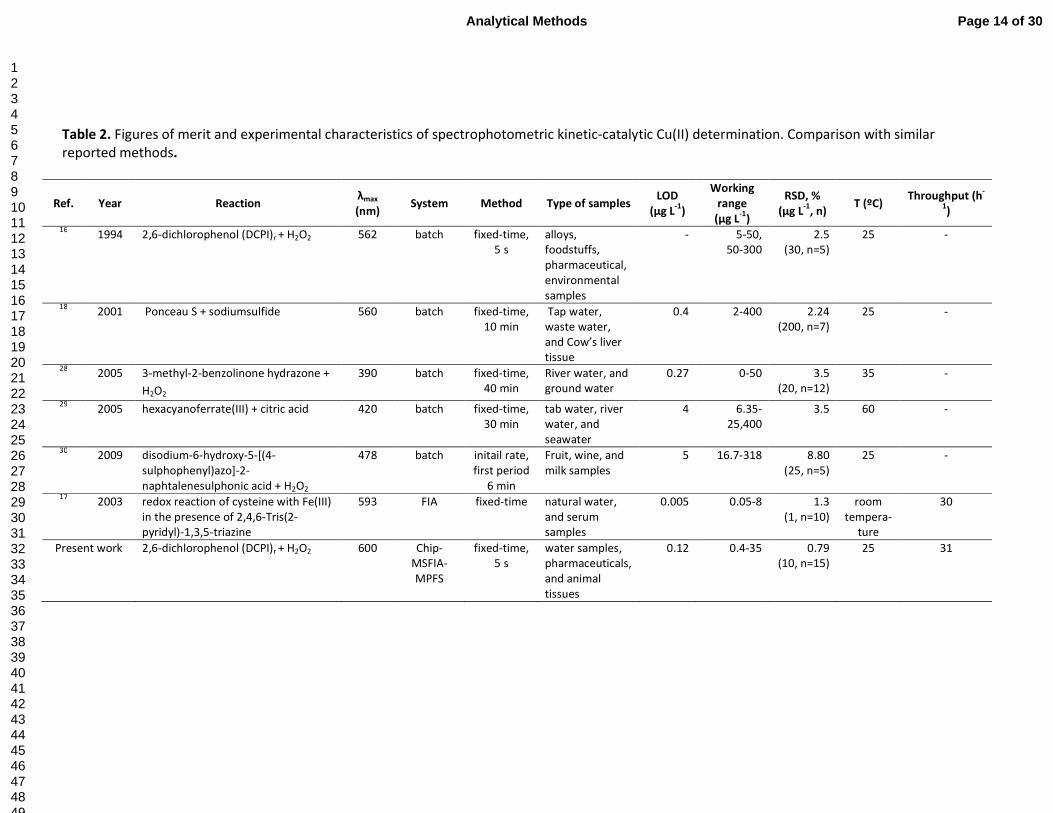
Table 2. Figures of merit and experimental characteristics of spectrophotometric kinetic-catalytic Cu(II) determination. Comparison with similar reported methods.
Ref. Year Reaction λmax
(nm) System Method Type of samples
LOD
(µg L-1
)
Working
range
(µg L-1
)
RSD, %
(µg L-1
, n) T (ºC)
Throughput (h-
1)
16 1994 2,6-dichlorophenol (DCPI)r + H2O2 562 batch fixed-time, 5 s
alloys, foodstuffs, pharmaceutical, environmental samples
- 5-50, 50-300
2.5 (30, n=5)
25 -
18 2001 Ponceau S + sodiumsulfide 560 batch fixed-time,
10 min Tap water, waste water, and Cow’s liver tissue
0.4 2-400 2.24 (200, n=7)
25 -
28 2005 3-methyl-2-benzolinone hydrazone +
H2O2
390 batch fixed-time, 40 min
River water, and ground water
0.27 0-50 3.5 (20, n=12)
35 -
29 2005 hexacyanoferrate(III) + citric acid 420 batch fixed-time,
30 min tab water, river water, and seawater
4 6.35- 25,400
3.5 60 -
30 2009 disodium-6-hydroxy-5-[(4-sulphophenyl)azo]-2-naphtalenesulphonic acid + H2O2
478 batch initail rate, first period
6 min
Fruit, wine, and milk samples
5 16.7-318 8.80 (25, n=5)
25 -
17 2003 redox reaction of cysteine with Fe(III)
in the presence of 2,4,6-Tris(2-pyridyl)-1,3,5-triazine
593 FIA fixed-time natural water, and serum samples
0.005 0.05-8 1.3 (1, n=10)
room tempera-
ture
30
Present work
2,6-dichlorophenol (DCPI)r + H2O2 600 Chip-MSFIA-MPFS
fixed-time, 5 s
water samples, pharmaceuticals, and animal tissues
0.12 0.4-35 0.79 (10, n=15)
25 31
Page 14 of 30Analytical Methods
123456789101112131415161718192021222324252627282930313233343536373839404142434445464748495051525354555657585960
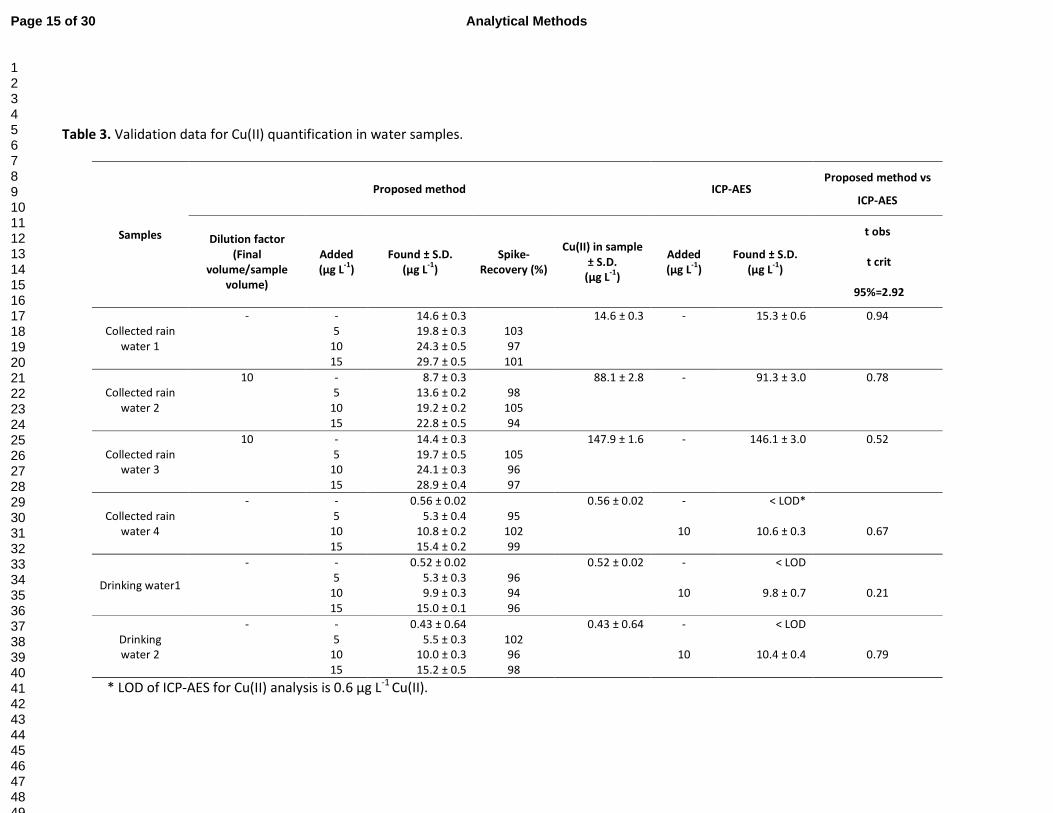
Table 3. Validation data for Cu(II) quantification in water samples.
* LOD of ICP-AES for Cu(II) analysis is 0.6 µg L-1 Cu(II).
Samples
Proposed method ICP-AES Proposed method vs
ICP-AES
Dilution factor
(Final
volume/sample
volume)
Added
(µg L-1
)
Found ± S.D.
(µg L-1
)
Spike-
Recovery (%)
Cu(II) in sample
± S.D.
(µg L-1
)
Added
(µg L-1
)
Found ± S.D.
(µg L-1
)
t obs
t crit
95%=2.92
Collected rain water 1
- - 14.6 ± 0.3 14.6 ± 0.3 - 15.3 ± 0.6 0.94 5 19.8 ± 0.3 103 10 24.3 ± 0.5 97 15 29.7 ± 0.5 101
Collected rain water 2
10 - 8.7 ± 0.3 88.1 ± 2.8 - 91.3 ± 3.0 0.78 5 13.6 ± 0.2 98 10 19.2 ± 0.2 105 15 22.8 ± 0.5 94
Collected rain water 3
10 - 14.4 ± 0.3 147.9 ± 1.6 - 146.1 ± 3.0 0.52 5 19.7 ± 0.5 105 10 24.1 ± 0.3 96 15 28.9 ± 0.4 97
Collected rain water 4
- - 0.56 ± 0.02 0.56 ± 0.02 - < LOD* 5 5.3 ± 0.4 95 10 10.8 ± 0.2 102 10 10.6 ± 0.3 0.67 15 15.4 ± 0.2 99
Drinking water1
- - 0.52 ± 0.02 0.52 ± 0.02 - < LOD 5 5.3 ± 0.3 96 10 9.9 ± 0.3 94 10 9.8 ± 0.7 0.21 15 15.0 ± 0.1 96
Drinking water 2
- - 0.43 ± 0.64 0.43 ± 0.64 - < LOD 5 5.5 ± 0.3 102 10 10.0 ± 0.3 96 10 10.4 ± 0.4 0.79 15 15.2 ± 0.5 98
Page 15 of 30 Analytical Methods
123456789101112131415161718192021222324252627282930313233343536373839404142434445464748495051525354555657585960
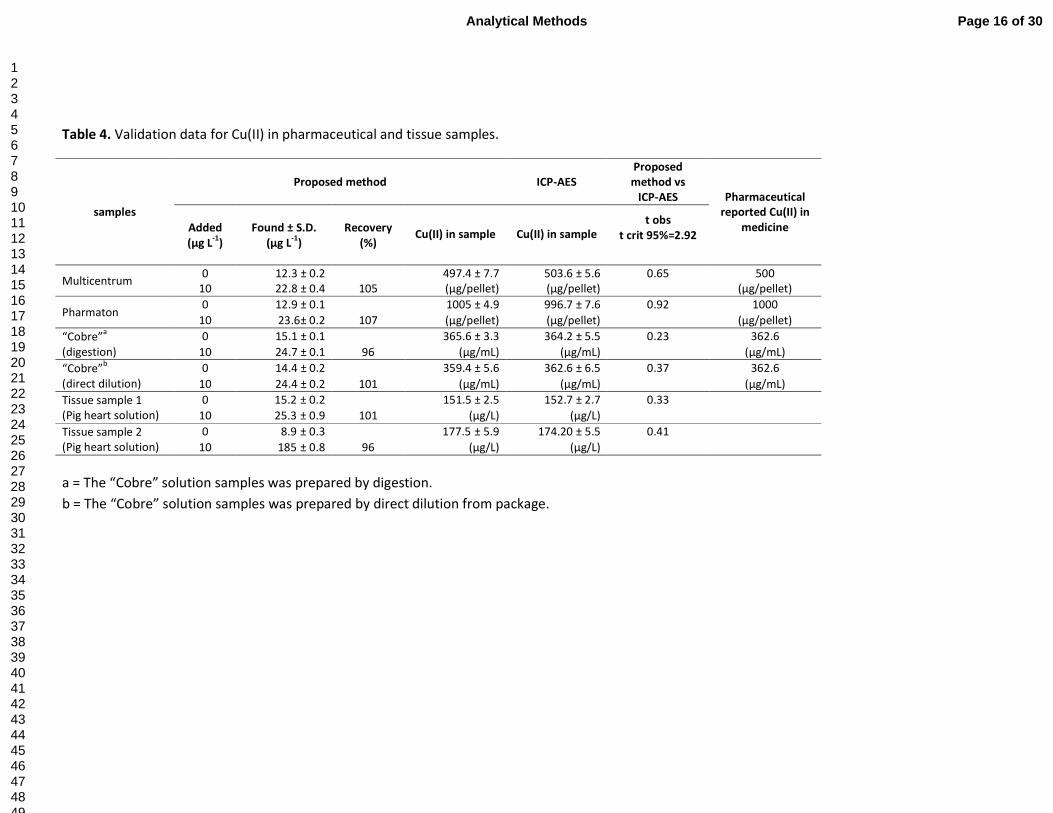
Table 4. Validation data for Cu(II) in pharmaceutical and tissue samples.
samples
Proposed method ICP-AES
Proposed
method vs
ICP-AES Pharmaceutical
reported Cu(II) in
medicine Added
(µg L-1
)
Found ± S.D.
(µg L-1
)
Recovery
(%) Cu(II) in sample Cu(II) in sample
t obs
t crit 95%=2.92
Multicentrum 0 12.3 ± 0.2 497.4 ± 7.7 503.6 ± 5.6 0.65 500
10 22.8 ± 0.4 105 (µg/pellet) (µg/pellet) (µg/pellet)
Pharmaton 0 12.9 ± 0.1 1005 ± 4.9 996.7 ± 7.6 0.92 1000
10 23.6± 0.2 107 (µg/pellet) (µg/pellet) (µg/pellet)
“Cobre”a
(digestion)
0 15.1 ± 0.1 365.6 ± 3.3 364.2 ± 5.5 0.23 362.6
10 24.7 ± 0.1 96 (µg/mL) (µg/mL) (µg/mL)
“Cobre”b
(direct dilution)
0 14.4 ± 0.2 359.4 ± 5.6 362.6 ± 6.5 0.37 362.6
10 24.4 ± 0.2 101 (µg/mL) (µg/mL) (µg/mL)
Tissue sample 1 (Pig heart solution)
0 15.2 ± 0.2 151.5 ± 2.5 152.7 ± 2.7 0.33
10 25.3 ± 0.9 101 (µg/L) (µg/L)
Tissue sample 2 (Pig heart solution)
0 8.9 ± 0.3 177.5 ± 5.9 174.20 ± 5.5 0.41
10 185 ± 0.8 96 (µg/L) (µg/L)
a = The “Cobre” solution samples was prepared by digestion.
b = The “Cobre” solution samples was prepared by direct dilution from package.
Page 16 of 30Analytical Methods
123456789101112131415161718192021222324252627282930313233343536373839404142434445464748495051525354555657585960
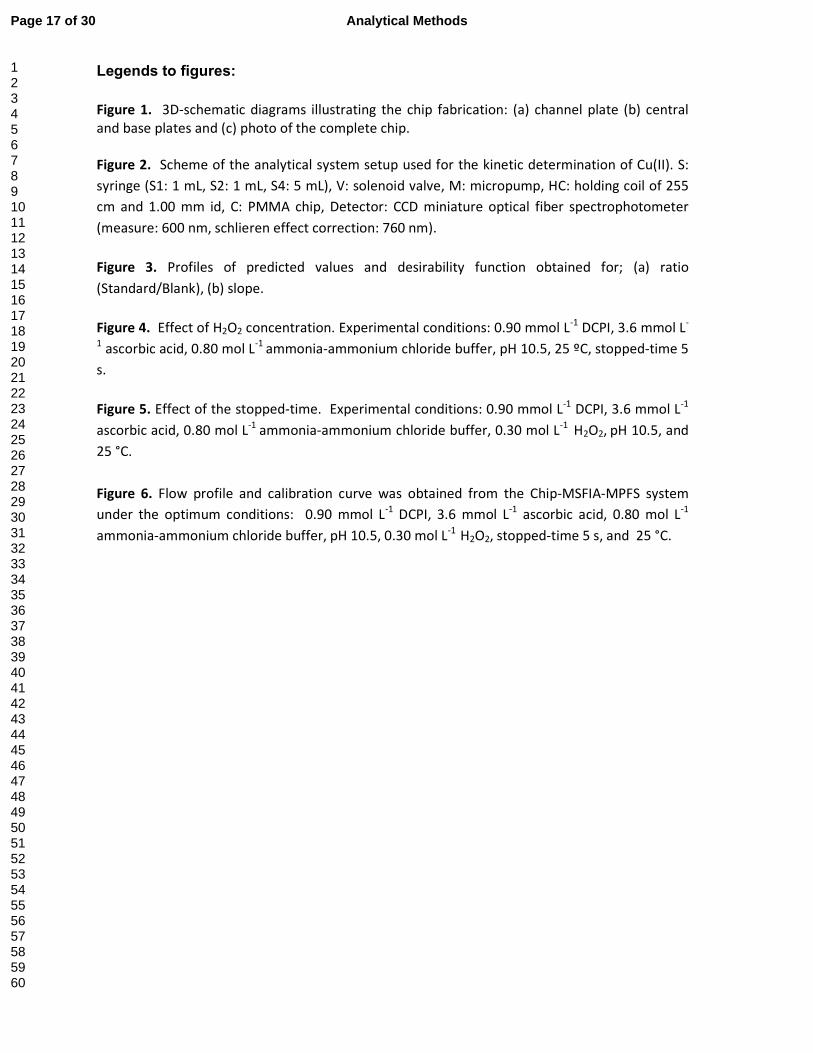
Legends to figures:
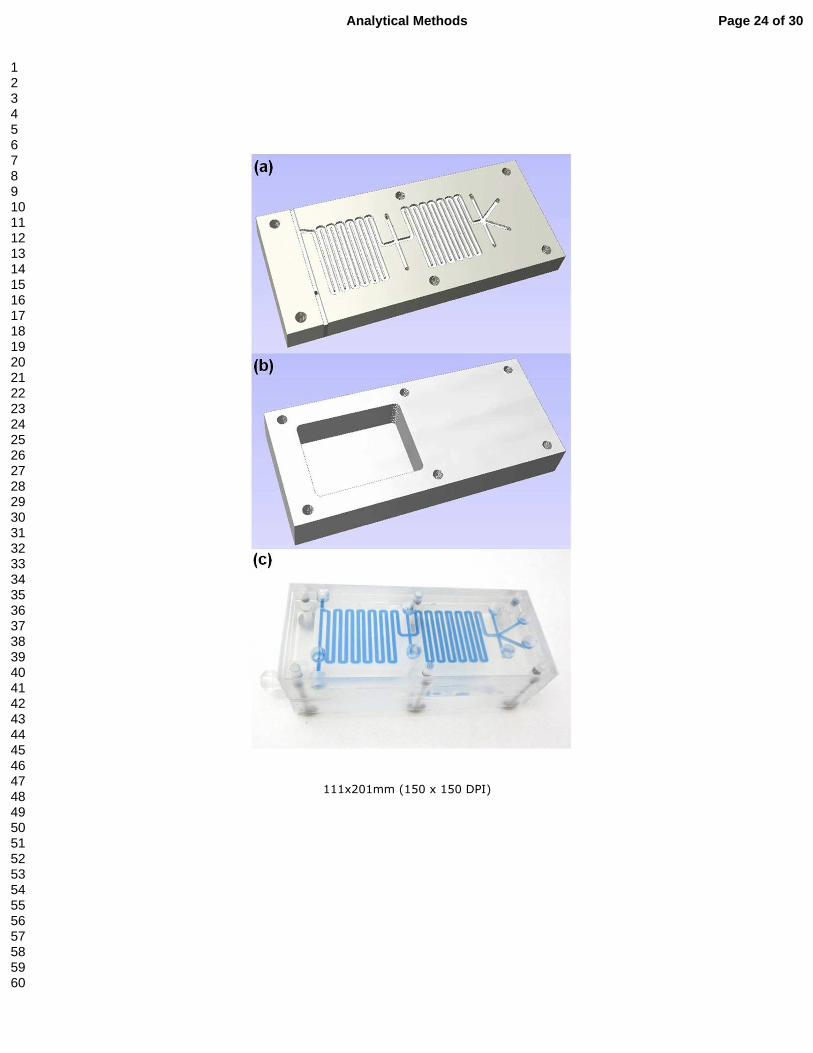
Figure 1. 3D-schematic diagrams illustrating the chip fabrication: (a) channel plate (b) central and base plates and (c) photo of the complete chip.
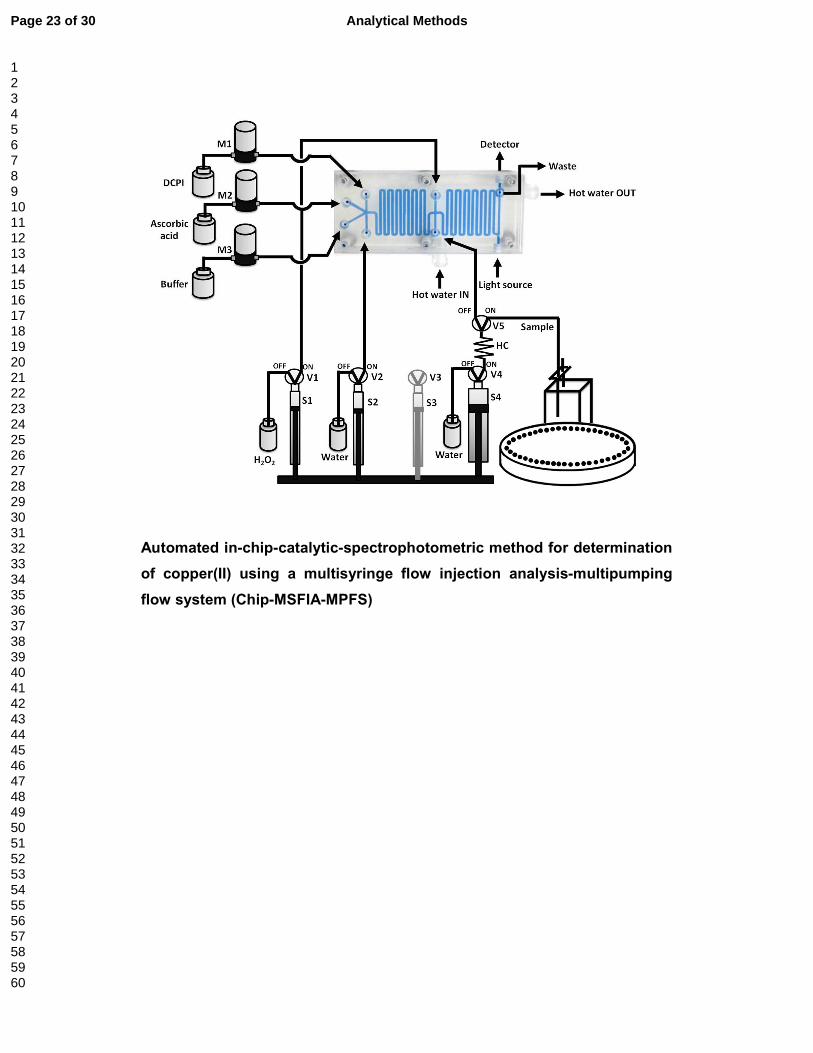
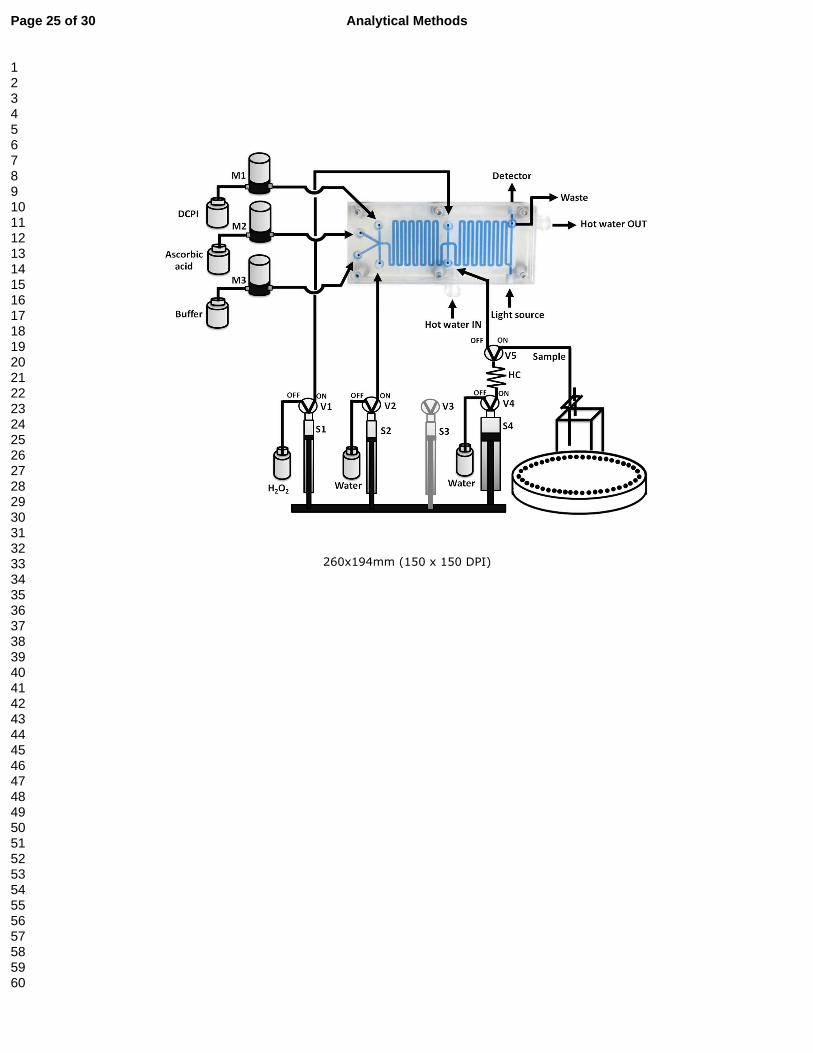
Figure 2. Scheme of the analytical system setup used for the kinetic determination of Cu(II). S:
syringe (S1: 1 mL, S2: 1 mL, S4: 5 mL), V: solenoid valve, M: micropump, HC: holding coil of 255
cm and 1.00 mm id, C: PMMA chip, Detector: CCD miniature optical fiber spectrophotometer
(measure: 600 nm, schlieren effect correction: 760 nm).
Figure 3. Profiles of predicted values and desirability function obtained for; (a) ratio
(Standard/Blank), (b) slope.
Figure 4. Effect of H2O2 concentration. Experimental conditions: 0.90 mmol L-1 DCPI, 3.6 mmol L-
1 ascorbic acid, 0.80 mol L-1 ammonia-ammonium chloride buffer, pH 10.5, 25 ºC, stopped-time 5
s.
Figure 5. Effect of the stopped-time. Experimental conditions: 0.90 mmol L-1 DCPI, 3.6 mmol L-1
ascorbic acid, 0.80 mol L-1 ammonia-ammonium chloride buffer, 0.30 mol L-1 H2O2, pH 10.5, and
25 °C.
Figure 6. Flow profile and calibration curve was obtained from the Chip-MSFIA-MPFS system
under the optimum conditions: 0.90 mmol L-1 DCPI, 3.6 mmol L-1 ascorbic acid, 0.80 mol L-1
ammonia-ammonium chloride buffer, pH 10.5, 0.30 mol L-1 H2O2, stopped-time 5 s, and 25 °C.
Page 17 of 30 Analytical Methods
123456789101112131415161718192021222324252627282930313233343536373839404142434445464748495051525354555657585960
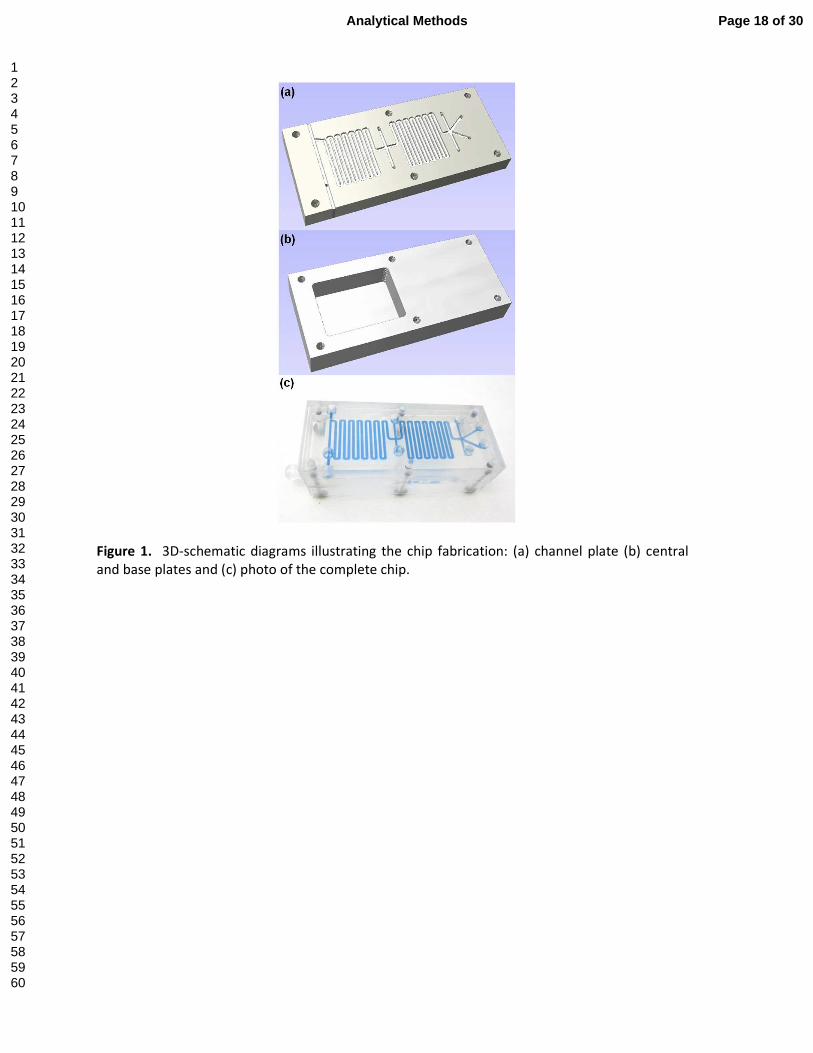
Figure 1. 3D-schematic diagrams illustrating the chip fabrication: (a) channel plate (b) central and base plates and (c) photo of the complete chip.
Page 18 of 30Analytical Methods
123456789101112131415161718192021222324252627282930313233343536373839404142434445464748495051525354555657585960
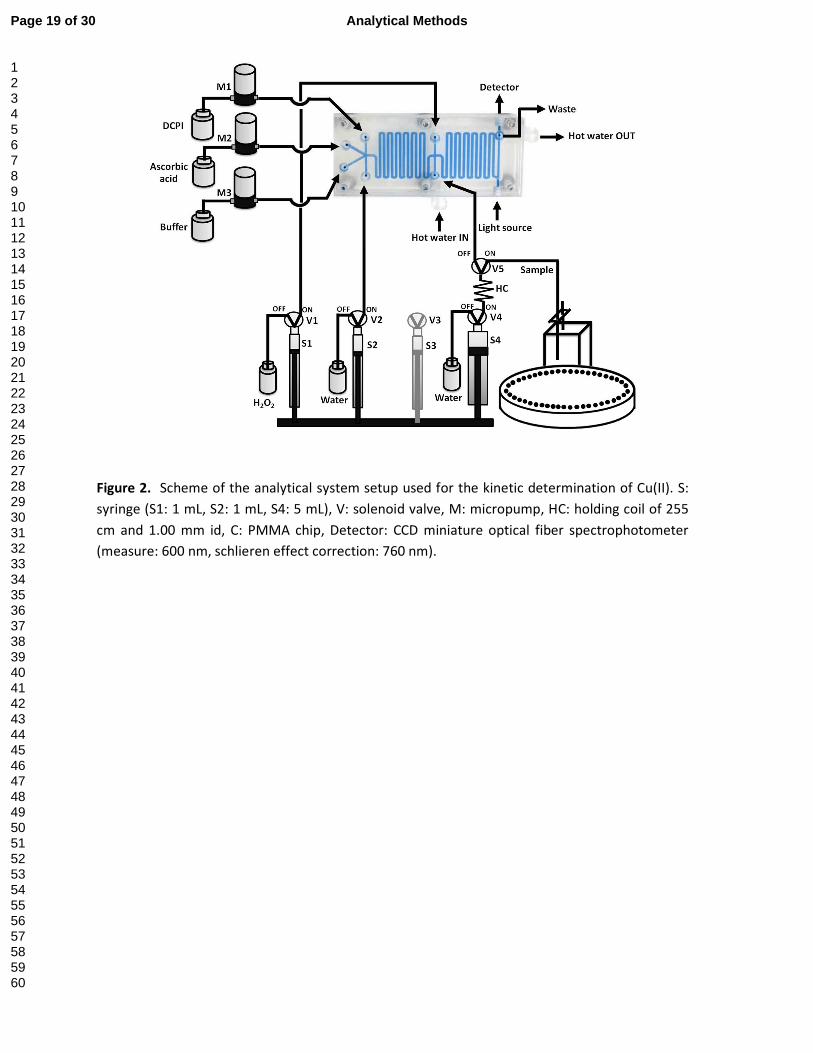
Figure 2. Scheme of the analytical system setup used for the kinetic determination of Cu(II). S:
syringe (S1: 1 mL, S2: 1 mL, S4: 5 mL), V: solenoid valve, M: micropump, HC: holding coil of 255
cm and 1.00 mm id, C: PMMA chip, Detector: CCD miniature optical fiber spectrophotometer
(measure: 600 nm, schlieren effect correction: 760 nm).
Page 19 of 30 Analytical Methods
123456789101112131415161718192021222324252627282930313233343536373839404142434445464748495051525354555657585960
19
Figure 3. Profiles of predicted values and desirability function obtained for; (a) ratio
(Standard/Blank), (b) slope.
Page 20 of 30Analytical Methods
123456789101112131415161718192021222324252627282930313233343536373839404142434445464748495051525354555657585960
20
Figure 4. Effect of H2O2 concentration. Experimental conditions: 0.90 mmol L-1 DCPI, 3.6 mmol L-
1 ascorbic acid, 0.80 mol L-1 ammonia-ammonium chloride buffer, pH 10.5, 25 ºC, stopped-time 5
s.
Figure 5. Effect of the stopped-time. Experimental conditions: 0.90 mmol L-1 DCPI, 3.6 mmol L-1
ascorbic acid, 0.80 mol L-1 ammonia-ammonium chloride buffer, 0.30 mol L-1 H2O2, pH 10.5, and
25 °C.
Page 21 of 30 Analytical Methods
123456789101112131415161718192021222324252627282930313233343536373839404142434445464748495051525354555657585960
21
Figure 6. Flow profile and calibration curve was obtained from the Chip-MSFIA-MPFS system
under the optimum conditions: 0.90 mmol L-1 DCPI, 3.6 mmol L-1 ascorbic acid, 0.80 mol L-1
ammonia-ammonium chloride buffer, pH 10.5, 0.30 mol L-1 H2O2, stopped-time 5 s, and 25 °C.
Page 22 of 30Analytical Methods
123456789101112131415161718192021222324252627282930313233343536373839404142434445464748495051525354555657585960
Automated in-chip-catalytic-spectrophotometric method for determination
of copper(II) using a multisyringe flow injection analysis-multipumping
flow system (Chip-MSFIA-MPFS)
Page 23 of 30 Analytical Methods
123456789101112131415161718192021222324252627282930313233343536373839404142434445464748495051525354555657585960
111x201mm (150 x 150 DPI)
Page 24 of 30Analytical Methods
123456789101112131415161718192021222324252627282930313233343536373839404142434445464748495051525354555657585960
260x194mm (150 x 150 DPI)
Page 25 of 30 Analytical Methods
123456789101112131415161718192021222324252627282930313233343536373839404142434445464748495051525354555657585960
166x236mm (150 x 150 DPI)
Page 26 of 30Analytical Methods
123456789101112131415161718192021222324252627282930313233343536373839404142434445464748495051525354555657585960
148x103mm (150 x 150 DPI)
Page 27 of 30 Analytical Methods
123456789101112131415161718192021222324252627282930313233343536373839404142434445464748495051525354555657585960
152x110mm (150 x 150 DPI)
Page 28 of 30Analytical Methods
123456789101112131415161718192021222324252627282930313233343536373839404142434445464748495051525354555657585960
254x129mm (150 x 150 DPI)
Page 29 of 30 Analytical Methods
123456789101112131415161718192021222324252627282930313233343536373839404142434445464748495051525354555657585960
Automated in-chip-catalytic-spectrophotometric method for determination of
copper(II) using a multisyringe flow injection analysis-multipumping flow system
(Chip-MSFIA-MPFS)
Piyawan Phansi a b
, Camelia Henríquez c, Edwin Palacio
c, Duangjai Nacapricha
ab, Víctor Cerdà
c*
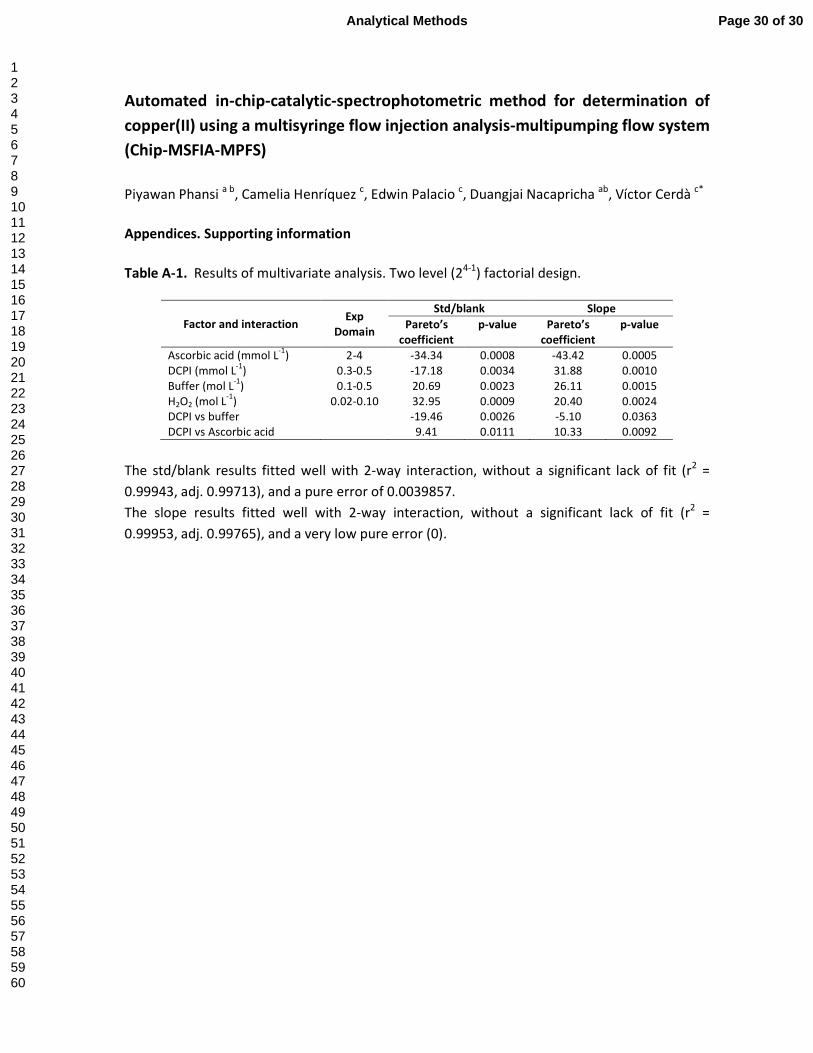
Appendices. Supporting information
Table A-1. Results of multivariate analysis. Two level (24-1
) factorial design.
Factor and interaction Exp
Domain
Std/blank Slope
Pareto’s
coefficient
p-value Pareto’s
coefficient
p-value
Ascorbic acid (mmol L-1
) 2-4 -34.34 0.0008 -43.42 0.0005
DCPI (mmol L-1
) 0.3-0.5 -17.18 0.0034 31.88 0.0010
Buffer (mol L-1
) 0.1-0.5 20.69 0.0023 26.11 0.0015
H2O2 (mol L-1
) 0.02-0.10 32.95 0.0009 20.40 0.0024
DCPI vs buffer -19.46 0.0026 -5.10 0.0363
DCPI vs Ascorbic acid 9.41 0.0111 10.33 0.0092
The std/blank results fitted well with 2-way interaction, without a significant lack of fit (r2 =
0.99943, adj. 0.99713), and a pure error of 0.0039857.
The slope results fitted well with 2-way interaction, without a significant lack of fit (r2 =
0.99953, adj. 0.99765), and a very low pure error (0).
Page 30 of 30Analytical Methods
123456789101112131415161718192021222324252627282930313233343536373839404142434445464748495051525354555657585960
Top Related
Copyright © 2022 FDOKUMEN

