


Bahasa
Halaman
Hukum


www.elsevier.com/locate/heares
Hearing Research 196 (2004) 109–114
Auditory evoked magnetic fields in relation to interauralcross-correlation of band-pass noise
Yoshiharu Soeta a,*, Takuya Hotehama b, Seiji Nakagawa a,Mitsuo Tonoike a, Yoichi Ando b
a Institute for Human Science and Biomedical Engineering, National Institute of Advanced Industrial Science and Technology (AIST),
1-8-31 Midorigaoka, Ikeda, Osaka 563-8577, Japanb Graduate School of Science and Technology, Kobe University, Rokkodai, Nada, Kobe 657-8501, Japan
Received 3 March 2004; accepted 25 May 2004
Available online 21 August 2004
Abstract
Auditory evoked magnetic fields of the human brain were analyzed in relation to the magnitude of the inter-aural cross-corre-
lation (IACC). IACC of the stimuli was controlled by mixing diotic bandpass and dichotic independent bandpass noise in appro-
priate ratios. The auditory stimuli were binaurally delivered through plastic tubes and earpieces inserted into ear canals of the nine
volunteers with normal hearing who took part in this study. All source signals had the same sound pressure level. Auditory evoked
fields (AEFs) were recorded using a neuromagnetometer in a magnetically shielded room. Combinations of a reference stimulus
(IACC=1.0) and test stimuli (IACC=0.2, 0.6, 0.85) were presented alternately at a constant interstimulus interval of 0.5 s and
MEGs recorded. The results showed that the N1m latencies were not affected by IACC; however, the peak amplitude of N1m
significantly decreased with increasing IACC.
� 2004 Elsevier B.V. All rights reserved.
Keywords: Magnetoencephalography (MEG); Auditory evoked response; N1m; Interaural crosscorrelation function
1. Introduction
The interaural cross-correlation of a dichotic stimu-
lus is a measure of the similarity of the waveforms pre-sented to left and right ears. The concept of interaural
cross-correlation is a fundamental one in the study of
binaural hearing; in which the width and distance of
0378-5955/$ - see front matter � 2004 Elsevier B.V. All rights reserved.
doi:10.1016/j.heares.2004.07.002
* Corresponding author. Tel.: +81-72-751-8526; fax: +81-72-751-
8416.
E-mail address: [email protected] (Y. Soeta).
Abbreviations: ANOVA, analysis of variance; AEF, auditory evo-
ked field; AEP, auditory evoked potential; BMLD, binaural masking
level difference; ECD, equivalent current dipole; IC, inferior colliculus;
IACC, interaural cross-correlation coefficient; ITD, interaural time
difference; MEG, magnetoencephalography; MSO, medial superior
olive; RMS, root-mean-square
the sound image changes according to the interaural
cross-correlation coefficient (IACC) (Kurozumi and Oh-
gushi, 1983; Licklider, 1948). The IACC is also a signif-
icant factor in determining the perceived horizontaldirection of a sound and the degree of subjective diffuse-
ness of a sound field (Damaske and Ando, 1972). When
the IACC is high, a well-defined direction is perceived.
Additionally, numerous psychoacoustical studies have
shown that the IACC is the dominant factor in the
determination of the binaural masking level difference
(BMLD) (Durlach, 1964; Durlach et al., 1986; Licklider,
1948; Osman, 1971; Osman et al., 1975).In the field of architectural acoustics, it has been
shown that both the degree of subjective preference
and diffuseness for sound with a single echo depend
greatly on the IACC (Ando, 1977; Ando and Kurihara,
1986; Barron, 1971; Blauert and Lindemann, 1986a),

110 Y. Soeta et al. / Hearing Research 196 (2004) 109–114
leading to a recognition of the need for early lateral
reflections to decrease the IACC in concert halls. Subjec-
tive diffuseness, or no spatial impression of the sound
field, in a room is one of the fundamental attributes as-
cribed to good acoustics.
Electrophysiological recordings of the interaural timedifferences (ITDs)-sensitive neurons in the inferior colli-
culus (IC) of the guinea pig have shown that the re-
sponse to bandpass noise is influenced by the IACC of
the stimulus, that is, neurons� responses were modulated
with interaural delay for higher IACC and neurons were
insensitive to interaural delay for noise with zero IACC
(Palmer et al., 1999). It has also been shown that the
ITD sensitivity of low-frequency cells in medial superiorolive (MSO) and IC of the cat also reflects a process of
IACC (Yin et al., 1987). Compatible finding has also
been obtained in the optic tectum of the barn owl (the
avian homologue of the mammalian IC), where
the responsiveness of ITD-sensitive neurons declines as
the IACC is decreased (Saberi et al., 1998).
The psychological responses to IACC have largely
been obtained in humans, while the neurophysiologicalresponses are confined to animal studies. Further, since
neurophysiological responses to IACC has examined in
the auditory brainstem (Ando et al., 1991), there is little
evidence of the cortical responses to IACC. To obtain
such response, the present study used MEG to examine
whether or not there is an activity in the auditory cortex
corresponding to the IACC variations of band-pass
noise.
2. Method
2.1. Measurement of magnetic response
Bandpass noises were employed for acoustic signals.
To create bandpass noises, white noises were digitally fil-
tered between 200 and 3000 Hz (Chebychev bandpass:
order 18). The interaural cross-correlation function
between two sound signals at both ears fl(t) and fr(t) is
defined by
UlrðsÞ ¼1
2T
Z þT
�Tf 0l ðtÞf 0
r ðt þ sÞdt; ð1Þ
where f0l(t) and f 0r(t) are obtained after passing through
the A-weighted network, which approximately corre-sponds to ear sensitivity (Ando et al., 1987; Ando,
1998). The normalized interaural cross-correlation is
defined by
/lrðsÞ ¼UlrðsÞffiffiffiffiffiffiffiffiffiffiffiffiffiffiffiffiffiffiffiffiffiffiffiffiffi
Ullð0ÞUrrð0Þp ; ð2Þ
where Ull(0) and Urr(0) are the autocorrelation functions
at s=0 for the left and right ear, respectively. The mag-
nitude of the interaural cross-correlation function,
IACC, is defined by the possible maximum interaural
time delay, say, jsj61.0 ms.
The IACC of the stimuli was controlled by mixing in-
phase diotic bandpass and dichotic independent band-
pass noises in appropriate ratios (Blauert, 1983). Thefrequency range of these noises was always kept the
same. Fig. 1 shows examples of the power spectrum,
the temporal waveform, and the interaural cross-corre-
lation function of the stimulus used in this study. The
auditory stimuli were delivered to subjects through plas-
tic tubes and inserted earpieces at a comfortable listen-
ing level of approximately 68 dB, A-weighted, adjusted
separately for each subject. The sound pressure wasmeasured with an ear simulator, including a micro-
phone and a preamplifier, and an adaptor connected
to the earpiece. The interaural level difference was set
to 0 dB and there was no interaural delay between ear
signals, i.e., the maximum of the IACC was always at
s=0.
Nine volunteers with normal hearing (22–28 years; all
right-handed) took part in the study. Informed consentwas obtained from each subject after explaining to her/
him the nature of the study. The experiments were con-
ducted in accordance with the principles of the Declara-
tion of Helsinki. Brain activities evoked by sound
stimuli were recorded using a 122 channel whole-head
DC superconducting quantum interference device
(DC-SQUID) magnetometer (Neuromag-122TM; Neu-
romag Ltd., Helsinki, Finland) in a magneticallyshielded room (Knuutila et al., 1993). Combinations of
a reference stimulus (IACC=1.0) and test stimuli
(IACC=0.85, 0.6, 0.2) were presented alternately at a
constant 0.5 s interstimulus interval. During the experi-
ment, subjects were asked to close their eyes to fully con-
centrate on the stimuli. The magnetic data were sampled
at 0.4 kHz after being bandpass filtered between 0.03
and 100 Hz, and averaged more than 50 times. Any re-sponses coinciding with magnetic signals exceeding 3000
fT/cm were rejected from further analysis. The averaged
responses were digitally filtered between 1.0 and 30.0
Hz. The analysis time was 0.7 s from 0.2 s prior to the
stimulus onset. The average of the 0.2 s prestimulus per-
iod served as the baseline. The Neuromag-122TM has
two pick-up coils in each position, which measure two
tangential derivatives, oBz/ox and oBz/oy, of the fieldcomponent Bz. To evaluate the amplitude and the la-
tency of the response, the root-mean-square (RMS) of
oBz/ox and oBz/oy were determined as the amplitude
of the responses at each recording position. The N1m
peak amplitude and latency was defined as the RMS
peak and the latency in the latency range from 70–130
ms over the right and left hemisphere. In each subject,
we employed the N1m peak latency and amplitude witha channel that showed the maximum amplitude placed
at each hemisphere.

0 0.1 0.2 0.3 0.4 0.5
Time [s]
0 0.1 0.2 0.3 0.4 0.5
Time [s]
Rel
ativ
e am
plitu
de
100 1000-100
-50
0
Frequency [kHz]
Am
plitu
de [d
B]
100 1000-100
-50
0
5000
5000
50
50
(a)
(b)
(c)
(d)
Frequency [kHz]
-1 -0.8 -0.6 -0.4 -0.2 0 0.2 0.4 0.6 0.8 1-1
0
1
Delay time [ms]
lr
(e)
Frequency [Hz]
Frequency [Hz]
Time [s]
Time [s]
Fig. 1. Examples of the temporal waveform at the left (a) and right (b) ears, the power spectrum at the left (c) and right (d) ears, and the interaural
cross-correlation function (e) of the stimulus (IACC=0.6).
Y. Soeta et al. / Hearing Research 196 (2004) 109–114 111
To estimate the location and the strength of the
underlying neural activity of the N1m wave, a single
equivalent current dipole (ECD) was assumed as thesource of the magnetic field of the N1m wave. ECDs
were found by a least square search in each hemisphere
at the N1m peak latencies. Calculations were based on
the spherical conductor model, which takes into account
the volume current within a sphere (Kaukoranta et al.,
1986). All ECDs with goodness-of-fit values exceeding
80% were used in further analyses.
3. Results
Clear N1m responses were observed in both right and
left temporal regions in all subjects (Fig. 2). Fig. 3 shows
the response waveforms (RMS) in a subject for all kinds
of IACC, observed at the channel where the maximum
N1m amplitude was observed. The N1m latencies were
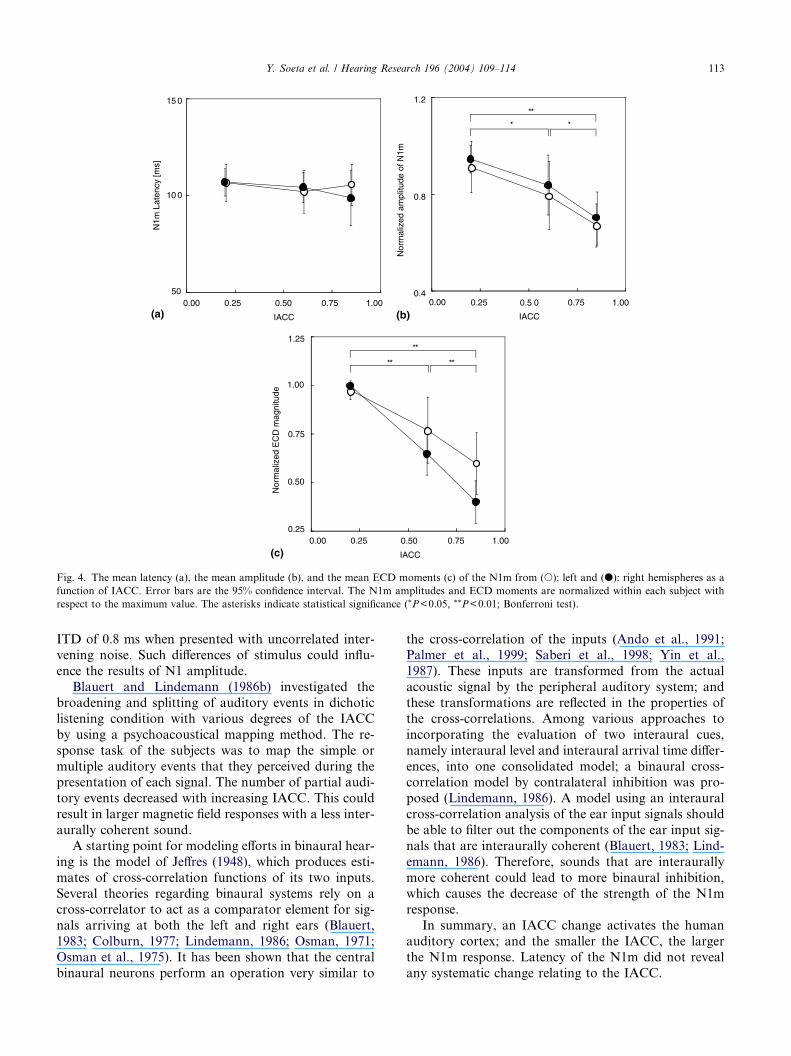
not systematically affected by the IACC as shown inFig. 4a. Two way analysis of variance (ANOVA) did
not show any significant effects of the IACC [F(2,
2)=0.43, P>0.05] or hemisphere [F(1, 2)=0.11,
P>0.05] on N1m latency. Fig. 4b depicts the mean
N1m amplitude (across nine subjects) as a function of
the IACC. The N1m amplitudes were normalized within
each subject with respect to the maximum value. Basi-
cally, a smaller IACC provided a larger N1m amplitude.Two way ANOVA (IACC·hemisphere) revealed a sig-
nificant effect of the IACC on N1m amplitude [F(2,
2)=9.79, P<0.001]. Variability in the left and right hem-
ispheres was not significantly different [F(1, 2)=0.60,
P>0.05]. Fig. 4c depicts the normalized mean N1m
ECD moment as a function of the IACC. A two way

Fig. 2. Typical waveforms of auditory evoked magnetic fields from 122 channels in a subject.
Fig. 3. Waveforms of brain magnetic field (RMS) observed in the right
temporal area in a subject.
112 Y. Soeta et al. / Hearing Research 196 (2004) 109–114
ANOVA (IACC·hemisphere) showed the significant
main effects were the IACC [F(2, 2)=34.42, P<0.001]
and the hemisphere [F(1, 2)=6.56, P<0.05]. There was
no significant interaction [F(2, 2)=2.99, P>0.05].
4. Discussion and conclusions
Using auditory evoked magnetic fields, the brain
activities corresponding to the IACC were analyzed in
this study. A previous study on auditory evoked poten-
tial (AEP) investigated the IACC using a one-third
octave bandpass-filtered noise with the center frequency
of 500 Hz as a sound signal (Ando et al., 1987). The re-
sults there showed that the peak-to-peak amplitude N1–
P2 decreases with increasing IACC. In the present study,
a higher IACC provided for a significantly smaller
amplitude of N1m, P2m, and the peak-to-peak ampli-
tude N1m–P2m, as shown in Figs. 4b and 5. A previousstudy on N1m response to dichotic tones of different fre-
quencies found that N1m increased with the interaural
frequency disparity (Yvert et al., 1998). Significantly
smaller AEPs or AEFs amplitudes were obtained with
binaural stimulation, compared to those obtained with
monaural contralateral stimulation; indicating some
kind of interference between ipsilateral and contralateral
pathways (�binaural interaction�) (Pantev et al., 1986;McPherson and Starr, 1993). It is considered that the
more sounds differed arriving at both ears, the larger
the N1m amplitude might be.
McEvoy et al. (1991) recorded AEPs to identical bin-
aural noise with an ITD of 0.8 ms. The noise was pre-
sented with intervening noise that was identical
between the two ears (IACC=1.0), or with uncorrelated
intervening noise (IACC=0.0). The noise with corre-lated intervening noise produced a larger N1 amplitude
than that with uncorrelated intervening noise. The result
does not seem to be consistent with the present finding.
In the study of McEvoy et al. (1991), the stimulus oc-
curred as a change in the ongoing ITD of the noise from
0 to 0.8 ms when presented with correlated intervening
noise, in contrast, the stimulus consisted of a change
from uncorrelated noise to correlated noise with an
0.25
0.50
0.75
1.00
1.25
Nor
mal
ized
EC
D m
agni
tude
0.00 0.25 0.50 0.75 1.00
IACC(c)
**
** **
50
10 0
15 0
N1m
Lat
ency
[ms]
0.00 0.25 0.50 0.75 1.00
IACC(a)
0.4
0.8
1.2
0.00 0.25 0.5 0 0.75 1.00
Nor
mal
ized
am
plitu
de o
f N1m
IACC(b)
*** *
Fig. 4. The mean latency (a), the mean amplitude (b), and the mean ECD moments (c) of the N1m from (s): left and (d): right hemispheres as a
function of IACC. Error bars are the 95% confidence interval. The N1m amplitudes and ECD moments are normalized within each subject with
respect to the maximum value. The asterisks indicate statistical significance (*P<0.05, **P<0.01; Bonferroni test).
Y. Soeta et al. / Hearing Research 196 (2004) 109–114 113
ITD of 0.8 ms when presented with uncorrelated inter-vening noise. Such differences of stimulus could influ-
ence the results of N1 amplitude.
Blauert and Lindemann (1986b) investigated the
broadening and splitting of auditory events in dichotic
listening condition with various degrees of the IACC
by using a psychoacoustical mapping method. The re-
sponse task of the subjects was to map the simple or
multiple auditory events that they perceived during thepresentation of each signal. The number of partial audi-
tory events decreased with increasing IACC. This could
result in larger magnetic field responses with a less inter-
aurally coherent sound.
A starting point for modeling efforts in binaural hear-
ing is the model of Jeffres (1948), which produces esti-
mates of cross-correlation functions of its two inputs.
Several theories regarding binaural systems rely on across-correlator to act as a comparator element for sig-
nals arriving at both the left and right ears (Blauert,
1983; Colburn, 1977; Lindemann, 1986; Osman, 1971;
Osman et al., 1975). It has been shown that the central
binaural neurons perform an operation very similar to
the cross-correlation of the inputs (Ando et al., 1991;Palmer et al., 1999; Saberi et al., 1998; Yin et al.,
1987). These inputs are transformed from the actual
acoustic signal by the peripheral auditory system; and
these transformations are reflected in the properties of
the cross-correlations. Among various approaches to
incorporating the evaluation of two interaural cues,
namely interaural level and interaural arrival time differ-
ences, into one consolidated model; a binaural cross-correlation model by contralateral inhibition was pro-
posed (Lindemann, 1986). A model using an interaural
cross-correlation analysis of the ear input signals should
be able to filter out the components of the ear input sig-
nals that are interaurally coherent (Blauert, 1983; Lind-
emann, 1986). Therefore, sounds that are interaurally
more coherent could lead to more binaural inhibition,
which causes the decrease of the strength of the N1mresponse.
In summary, an IACC change activates the human
auditory cortex; and the smaller the IACC, the larger
the N1m response. Latency of the N1m did not reveal
any systematic change relating to the IACC.

0.4
0.8
1.2
0.00 0.25 0.50 0.75 1.0 0
Nor
mal
ized
am
plitu
de o
f P2m
IACC
****
(a)
0. 4
0. 8
1. 2
0.0 0 0.2 5 0.50 0.7 5 1.00
Nor
mal
ized
am
plitu
de o
f N1m
-P2m
IACC
**** *
(b)
Fig. 5. The mean amplitude of the P2m (a) and the peak-to-peak
amplitude N1m–P2m (b) from (s): left and (d): right hemispheres as a
function of IACC. Error bars are the 95% confidence interval. The P2m
amplitudes and the peak-to-peak amplitude N1m–P2m are normalized
within each subject with respect to the maximum value. The asterisks
indicate statistical significance (*P<0.05, **P<0.01; Bonferroni test).
114 Y. Soeta et al. / Hearing Research 196 (2004) 109–114
Acknowledgements
This research was supported by a Grant-in-Aid for
Scientific Research from the Japan Society for the Pro-
motion of Science.
References
Ando, Y., 1977. Subjective preference in relation to objective param-
eters of music sound fields with a single echo. J. Acoust. Soc. Am.
62, 1436–1441.
Ando, Y., 1998. Architectural Acoustics: Blending Sound Sources,
Sound Fields, and Listeners. AIP Press, New York.
Ando, Y., Kurihara, Y., 1986. Nonlinear response in evaluating the subje-
ctive diffuseness of sound fields. J. Acoust. Soc. Am. 80, 833–836.
Ando, Y., Kang, S.H., Nagamatsu, H., 1987. On the auditory-evoked
potential in relation to the IACC of sound field. J. Acoust. Soc.
Jpn. (E) 8, 183–190.
Ando, Y., Yamamoto, K., Nagamastu, H., Kang, S.H., 1991.
Auditory brainstem response (ABR) in relation to the horizontal
angle of sound incidence. Acoust. Lett. 15, 57–64.
Barron, M., 1971. The subjective effects of first reflections in concert
halls – the need for lateral reflections. J. Sound Vib. 15, 475–494.
Blauert, J., 1983. Spatial Hearing: The Psychophysics of Human
Sound Localization. MIT Press, Cambridge, MA.
Blauert, J., Lindemann, W., 1986a. Auditory spaciousness: some
further psychoacoustic analyses. J. Acoust. Soc. Am. 80, 533–541.
Blauert, J., Lindemann, W., 1986b. Spatial mapping of intracranical
auditory events for various degrees of interaural coherence. J.
Acoust. Soc. Am. 79, 806–813.
Colburn, H.S., 1977. Theory of binaural interaction based on
auditory-nerve data. II. Detection of tones in noise. J. Acoust.
Soc. Am. 61, 525–533.
Damaske, P., Ando, Y., 1972. Interaural crosscorrelation for multi-
channel loudspeaker reproduction. Acustica 27, 232–238.
Durlach, N.I., 1964. Note on binaural masking-level differences as a
function of interaural correlation of the masking noise. J. Acoust.
Soc. Am. 36, 1613–1617.
Durlach, N.I., Gabriel, K.J., Colburn, H.S., Trahiotis, C., 1986.
Interaural correlation discrimination: II. Relation to binaural
unmasking. J. Acoust. Soc. Am. 79, 1548–1557.
Jeffres, L.A., 1948. A place theory of sound localization. J. Comp.
Physiol. Psych. 61, 468–486.
Kaukoranta, E., Hamalainen,M., Sarvas, J., Hari, R., 1986.Mixed and
sensory nerve stimulations activate different cytoarchitectonic areas
in the human primary somatosensory cortex SI: neuromagnetic
recordings and statistical considerations. Exp. Brain Res. 63, 60–66.
Knuutila, J., Ahonen, A., Hamalainen, M., Kajola, M., Laine, P.,
Lounasmaa, O.V., Parkkonen, L., Simola, J., Tesche, C., 1993. A
122-channel whole cortex SQUID system for measuring the brain�smagnetic fields. IEEE Trans. Magn. 29, 3315–3320.
Kurozumi, K., Ohgushi, K., 1983. The relationship between the cross-
correlation coefficient of two-channel acoustic signals and sound
image quality. J. Acoust. Soc. Am. 74, 1726–1733.
Licklider, J.C.R., 1948. The influence of interaural phase relations
upon masking of speech by white noise. J. Acoust. Soc. Am. 20,
150–159.
Lindemann, W., 1986. Extension of a binaural cross-correlation model
by means of contralateral inhibition, I: Simulation of lateralization
of stationary signals. J. Acoust. Soc. Am. 80, 1608–1622.
McEvoy, L.K., Picton, T.W., Champagne, S.C., 1991. The timing of
the processes underlying lateralization: psychophysical and evoked
potential measures. Ear Hearing 12, 389–398.
McPherson, D.L., Starr, A., 1993. Binaural interaction in auditory
evoked potentials: Brainstem, middle- and long-latency compo-
nents. Hearing Res. 66, 91–98.
Osman, E., 1971. A correlation model of binaural masking level
differences. J. Acoust. Soc. Am. 50, 1494–1511.
Osman, E., Tzuo, H.Y., Lin-Tzuo, P.F., 1975. Theoretical analysis of
detection of monaural signals as a function of interaural noise
correlation and signal frequency. J. Acoust. Soc. Am. 57, 939–942.
Palmer, A.R., Jiang, D., McAlpine, D., 1999. Desynchronizing
responses to correlated noise: a mechanism for binaural masking
level differences at the inferioir colliculus. J. Physiol. 417, 722–734.
Pantev, C., Lutkenhorner, B., Hoke, M., Lehnertz, K., 1986. Com-
parison between simultaneously recorded auditory-evoked mag-
netic fields and potentials elicited by ipsilateral, contralateral, and
binaural tone burst stimulation. Audiology 25, 54–61.
Saberi, K., Takahashi, Y., Konishi, M., Albeck, Y., Arthur, B.J.,
Farahbod, H., 1998. Effects of interaural decorrelation on neural
and behavioral detection of spatial cues. Neuron 21, 789–798.
Yin, T.C., Chan, J.C.K., Carney, L.H., 1987. Effects of interaural time
delays of noise stimuli on low-frequency cells in the cat�s inferior
colliculus. III. Evidence for cross-correlation. J. Neurophysiol. 58,
562–583.
Yvert, B., Bertrand, O., Pernier, J., Ilmoniemi, R.J., 1998. Human
cortical responses evoked by dichotically presented tones of
different frequencies. NeuroReport 9, 1115–1119.
Top Related
Copyright © 2022 FDOKUMEN

