


Bahasa
Halaman
Hukum


Remote Sens. 2022, 14, 1556. https://doi.org/10.3390/rs14071556 www.mdpi.com/journal/remotesensing
Article
Assessing the Sensitivity of Vegetation Cover to Climate Change in the Yarlung Zangbo River Basin Using Machine Learning Algorithms Lizhuang Cui 1,2, Bo Pang 1,2,*, Gang Zhao 1,2,3, Chunguang Ban 1,2, Meifang Ren 4,5, Dingzhi Peng 1,2, Depeng Zuo 1,2
and Zhongfan Zhu 1,2
1 College of Water Sciences, Beijing Normal University, Beijing 100875, China; [email protected] (L.C.); [email protected] (G.Z.); [email protected] (C.B.); [email protected] (D.P.); [email protected] (D.Z.); [email protected] (Z.Z.)
2 Beijing Key Laboratory of Urban Hydrological Cycle and Sponge City Technology, Beijing 100875, China 3 School of Geographical Science, University of Bristol, Bristol BS8 1SS, UK 4 China Academy of Urban Planning & Design, Beijing 100044, China; [email protected] 5 Department of Hydraulic Engineering, Tsinghua University, Beijing 100084, China * Correspondence: [email protected]
Abstract: Vegetation is a key indicator of the health of most terrestrial ecosystems and different types of vegetation exhibit different sensitivity to climate change. The Yarlung Zangbo River Basin (YZRB) is one of the highest basins in the world and has a wide variety of vegetation types because of its complex topographic and climatic conditions. In this paper, the sensitivity to climate change for different vegetation types, as reflected by the Normalized Difference Vegetation Index (NDVI), was assessed in the YZRB. Three machine learning models, including multiple linear regression, support vector machine, and random forest, were adopted to simulate the response of each vegeta-tion type to climatic variables. We selected random forest, which showed the highest performance in both the calibration and validation periods, to assess the sensitivity of the NDVI to temperature and precipitation changes on an annual and monthly scale using hypothetical climatic scenarios. The results indicated there were positive responses of the NDVI to temperature and precipitation changes, and the NDVI was more sensitive to temperature than to precipitation on an annual scale. The NDVI was predicted to increase by 1.60%–4.68% when the temperature increased by 1.5 °C, while it only changed by 0.06%–0.24% when the precipitation increased by 10% in the YZRB. Monthly, the vegetation was more sensitive to temperature changes in spring and summer. Spa-tially, the vegetation was more sensitive to temperature increases in the upper and middle reaches, where the existing temperatures were cooler. The time-lag effects of climate were also analyzed in detail. For both temperature and precipitation, Needleleaf Forest and Broadleaf Forest had longer time lags than those of other vegetation types. These findings are useful for understanding the eco-hydrological processes of the Tibetan Plateau.
Keywords: vegetation response; attribution analysis; machine learning; NDVI; the Yarlung Zangbo River Basin
1. Introduction The sensitivity to climate change for different vegetation types in terrestrial ecosys-
tems can have important feedback on hydrology, climate, and ecology [1–4]. Owing to the spatial heterogeneity, vegetation’s response to climate change varies greatly, with differ-ent temporal responses and spatial patterns [5]. Given the importance of identifying eco-logically sensitive areas for land planning and water resource management, it is essential
Citation: Cui, L.; Pang, B.; Zhao, G.;
Ban, C.; Ren, M.; Peng, D.; Zuo, D.;
Zhu, Z. Assessing the Sensitivity of
Vegetation Cover to Climate Change
in the Yarlung Zangbo River Basin
Using Machine Learning
Algorithms. Remote Sens. 2022, 14,
1556. https://doi.org/10.3390/
rs14071556
Academic Editors: Pingping Luo,
Xindong Wei, Kanhua Yu, Bin Guo
and Joshua Viers
Received: 4 February 2022
Accepted: 14 March 2022
Published: 23 March 2022
Publisher’s Note: MDPI stays neu-
tral with regard to jurisdictional
claims in published maps and institu-
tional affiliations.
Copyright: © 2022 by the authors. Li-
censee MDPI, Basel, Switzerland.
This article is an open access article
distributed under the terms and con-
ditions of the Creative Commons At-
tribution (CC BY) license (https://cre-
ativecommons.org/licenses/by/4.0/).

Remote Sens. 2022, 14, 1556 2 of 17
to identify and then prioritize vegetation that is sensitive to climate change, especially in ecologically fragile regions such as the Tibetan Plateau [6–8].
The sensitivity of vegetation to climate change is the focus of global climate change and terrestrial ecosystem research [9–11]. A variety of dynamic and statistical models have been developed to explore the response of vegetation to climate change [12]. Dynamic models, including the Lund-Potsdam-Jena Model [13,14] and the Sheffield Dynamic Global Vegetation Model [15], can simulate dynamic ecosystem processes and provide information on spatiotemporal changes in vegetation under climate change [16–18]. How-ever, data availability often restricts the application of dynamic models, especially for data-scarce regions [19]. Statistical models, which simulate the relationship between veg-etation indices, such as the Normalized Difference Vegetation Index (NDVI) [20], Net Pri-mary Productivity (NPP) [21], Enhanced Vegetation Index (EVI) [9], Leaf Area Index (LAI) [22], and climatic variables, have been valuable supplements for dynamic models in many application scenarios [23,24]. The most popular regression equation models—the machine learning models—have attracted widespread interest from researchers owing to their ad-vantages in simulating complex nonlinear systems and their ability to handle multi-di-mensional and multi-variety data [10,25,26].
The Yarlung Zangbo River is the largest river on the Tibetan Plateau. The vegetation in the Yarlung Zangbo River Basin (YZRB) has a significant influence on the biological processes of the Tibetan Plateau [27,28]. The fragile ecological environment, especially the state of vegetation in the YZRB, is sensitive to temperature and precipitation changes [29]. Owing to the high elevation and complex topography, there is a lack of hydro-meteoro-logical gauges and hence a lack of data in the YZRB, which restricts the application of dynamic models and presents challenges for assessing the sensitivity of each vegetation type in the YZRB to climate change. The relationship between vegetation indices and cli-matic variables has been investigated by previous studies [20,23]. However, statistical modeling of vegetation and quantitative assessment of the sensitivity to climate change for different vegetation types in the YZRB are relatively rare. It is difficult to apply regres-sion equation models in the YZRB owing to the multiple climate zones, complex topogra-phy, and diversity of vegetation. However, machine learning may be able to overcome these problems. Ensemble learning methods, such as random forest (RF), can not only simulate the relationship between vegetation indices and climatic variables but also iden-tify climatic variables’ contribution to vegetation growth, which helps in the understand-ing of the climatic variables’ time-lag effects.
The objectives of this paper are to: i) construct statistical vegetation models using machine learning methods, ii) quantitatively assess the sensitivity of each vegetation type in the YZRB to climate change, and iii) explore the time-lag effects for each vegetation type through correlation with the proposed models.
2. Materials and Methods 2.1. Study Area and Data 2.1.1. Study Area
The Yarlung Zangbo River is one of the highest rivers in the world, with a length of 2229 km and a drainage area of 2.42×10⁵ km2. The YZRB is long and narrow, running from west to east, with the Himalayas to the south and the Gangdise Mountains to the north [27,30]. The topography of the YZRB changes from mountains to plains and there are both perennial snow-covered areas with an altitude of more than 7000 masl and hot and humid valleys with an altitude of less than 200 masl (Figure 1a).
The climate varies across the basin. The upper reaches have a plateau cold temperate climate, while the middle reaches have a plateau temperate climate, and the lower reaches have a tropical and subtropical climate. The temperature increases from northwest to southeast, and precipitation increases from the upper to lower reaches [29]. Because of these climatic differences, the vegetation in the YZRB shows clear spatial heterogeneity

Remote Sens. 2022, 14, 1556 3 of 17
[31]. There is mainly Alpine Vegetation (17.6%), Meadow (35.5%), and Scrub (13.3%) in the upper and middle reaches, while Meadow and Steppe (17.1%) are distributed across the basin. The main vegetation in the lower reaches is Cultivated Vegetation (1.8%), Broadleaf Forest (5.3%), and Needleleaf Forest (5.9%) (Figure 1b). In this paper, the YZRB was divided into 32 sub-catchments based on the hydro-climatic characteristics and wa-tershed boundaries (Figure 1c).
Figure 1. The topography, vegetation types, and sub-catchments of the Yarlung Zangbo River Basin (YZRB) ((a) Topography, (b) Vegetation types, (c) Sub-catchments).

Remote Sens. 2022, 14, 1556 4 of 17
2.1.2. Data Collection The China Meteorological Forcing Dataset (CMFD) used in this paper was generated
from the Institute of Tibetan Plateau Research of the Chinese Academy of Sciences (http://westdc.westgis.ac.cn/ accessed on 10 May 2021). The CMFD’s spatial and temporal resolutions are 0.1° and 3 h. We calculated monthly temperature and precipitation for each pixel by averaging the 3-hourly temperature values and summing the 3-hourly precipita-tion values over each month. Furthermore, the monthly temperature and precipitation of each vegetation type were calculated by averaging the values of pixels of the correspond-ing vegetation.
The Global Inventory Monitoring and Modeling System NDVI dataset used in this study was generated from NOAA’s advanced high-resolution radiometer (https://eco-cast.arc.nasa.gov/data/pub/gimms/ accessed on 10 May 2021), with a spatial resolution of 8 km. The monthly NDVI data of each vegetation was also calculated by averaging NDVI values of pixels of the corresponding vegetation
2.2. Methodology 2.2.1. NDVI Models
Three machine learning models, including multiple linear regression (MLR), support vector machine (SVM), and RF, were used to simulate NDVI changes. All the models were implemented in Python 3.7 using the scikit-learn package version 0.21.3.
MLR relies on a matrix of regression coefficients and is often used to simulate the dependent variable values using multiple predictors [32]. It relies on a matrix of regression coefficients which represent the correlations between the dependent and independent variables. SVM represents a supervised machine learning method based on statistical learning. Support vector regression is an extension of the support vector machine method and can express the non-linear relationship between the dependent variable and independent variables. Therefore, generalized regression efficiency is achieved based on the minimization of training errors [33].
RF was first proposed by Breiman in 2001 as a new machine learning model based on classification and regression tree (CART) algorithms [34]. RF estimates the error of the model through the out-of-bag error (EOOB) with built-in cross-validation running in parallel to the training process. This model can evaluate variable importance by randomly permuting these variables and observing the difference in model performance using OOB samples. At the end of the process, RF obtains variable importance by averaging the differences, which are then normalized by the standard deviation. This method is widely used by hydrologists in classification and regression analysis [25], statistical downscaling [35], and hydrological modeling [26].
The monthly NDVI for different vegetation types were modeled using 12 different climatic variables including temperature and precipitation at time lags of 0–5 months (Ta-ble 1). Then, we used data from the first 70% of years for model calibration and the re-maining 30% for validation. Finally, Nash–Sutcliffe coefficient (NASH), root mean square errors (RMSE), mean absolute percentage error (MAE), correlation coefficient (r), and nor-malized mean bias (NMB) were used to assess the predictive performance of the models [26,36,37], which were defined as:
𝑁𝑁ASH = 1 − ∑ (𝑌𝑌𝑖𝑖,𝑜𝑜𝑜𝑜𝑜𝑜−𝑌𝑌𝑖𝑖,𝑜𝑜𝑖𝑖𝑠𝑠)2𝑛𝑛𝑖𝑖=1∑ (𝑌𝑌𝑖𝑖,𝑜𝑜𝑜𝑜𝑜𝑜−𝑌𝑌𝑜𝑜𝑜𝑜𝑜𝑜)2𝑛𝑛𝑖𝑖=1
(1)
𝑅𝑅𝑅𝑅𝑅𝑅𝑅𝑅 = �∑ (𝑌𝑌𝑖𝑖,𝑜𝑜𝑜𝑜𝑜𝑜−𝑌𝑌𝑖𝑖,𝑜𝑜𝑖𝑖𝑠𝑠)2𝑛𝑛𝑖𝑖=1
𝑛𝑛 (2)
𝑅𝑅𝑀𝑀𝑅𝑅 = ∑ �𝑌𝑌𝑖𝑖,𝑜𝑜𝑜𝑜𝑜𝑜−𝑌𝑌𝑖𝑖,𝑜𝑜𝑖𝑖𝑠𝑠�𝑛𝑛𝑖𝑖=1
𝑛𝑛 (3)
𝑟𝑟 = ∑ �(𝑌𝑌𝑖𝑖,𝑜𝑜𝑜𝑜𝑜𝑜−𝑌𝑌𝑜𝑜𝑜𝑜𝑜𝑜)(𝑌𝑌𝑖𝑖,𝑜𝑜𝑖𝑖𝑠𝑠−𝑌𝑌𝑜𝑜𝑖𝑖𝑠𝑠)�𝑛𝑛𝑖𝑖=1
�∑ (𝑌𝑌𝑖𝑖,𝑜𝑜𝑜𝑜𝑜𝑜−𝑌𝑌𝑜𝑜𝑜𝑜𝑜𝑜)2𝑛𝑛𝑖𝑖=1 �∑ (𝑌𝑌𝑖𝑖,𝑜𝑜𝑖𝑖𝑠𝑠−𝑌𝑌𝑜𝑜𝑖𝑖𝑠𝑠)2𝑛𝑛
𝑖𝑖=1
(4)

Remote Sens. 2022, 14, 1556 5 of 17
𝑁𝑁𝑅𝑅𝑁𝑁(%) = ∑ (𝑌𝑌𝑖𝑖,𝑜𝑜𝑖𝑖𝑠𝑠−𝑌𝑌𝑖𝑖,𝑜𝑜𝑜𝑜𝑜𝑜)𝑛𝑛𝑖𝑖=1∑ (𝑌𝑌𝑖𝑖,𝑜𝑜𝑜𝑜𝑜𝑜)𝑛𝑛𝑖𝑖=1
∗ 100 (5)
where 𝑌𝑌𝑖𝑖,𝑜𝑜𝑜𝑜𝑜𝑜 represents the vector of the observed predictands of number i, 𝑌𝑌𝑖𝑖,𝑜𝑜𝑖𝑖𝑠𝑠 is the vector of the simulated predictands of number i, 𝑌𝑌𝑜𝑜𝑜𝑜𝑜𝑜����� is the mean of the observed pre-dictands, and 𝑌𝑌𝑜𝑜𝑠𝑠𝑠𝑠����� is the mean of the simulated predictands.
Table 1. The climatic variables for model input.
Climatic Variables Temperature Precipitation Time lags (month) 0 1 2 3 4 5 0 1 2 3 4 5
Input factors t0 t1 t2 t3 t4 t5 p0 p1 p2 p3 p4 p5
2.2.2. The sensitivity of NDVI to climate change The sensitivity to temperature and precipitation changes for different vegetation
types were assessed by simulated NDVI changes using hypothetic climatic scenarios and observed climate data. According to previous studies on climate prediction of the Tibetan Plateau, the temperature was expected to change by 0.9–2.3 °C, while the precipitation was expected to change by -3%–16% in the middle of this century [38–40]. We used eight climatic scenarios to assess the sensitivity, which was defined as: (i) −2.0 °C to 2.0 °C tem-perature change in 0.5 °C intervals; and (ii) −20% to 20% precipitation change in 5% inter-vals. In this paper, the sensitivity is defined as:
ε =NDVIh-NDVIo
NDVIo (6)
where ε is the sensitivity to climate change; NDVIo is the simulated NDVI using observed data; NDVIh is the simulated NDVI using hypothetic climatic scenarios.
3. Results 3.1. The Spatiotemporal Variations of the NDVI and Climatic Variables
The inter-annual variations in the NDVI and climatic variables from 1982 to 2015 were shown in Figure 2. According to Figure 2a–b, the precipitation increased insignifi-cantly at the rate of 19 mm/10a (R2=0.11, P=0.031), while temperature increased signifi-cantly at the rate of 0.42 °C/10a (R2=0.56, P=0.000). The NDVI did not show a significant trend (R2=0.18, P=0.007). This finding is in accordance with previous studies that non-sig-nificant increasing trends in precipitation and NDVI were observed in the YZRB (with low R2 value for precipitation and NDVI) [23,27]. According to Figure 2c–d, although the NDVI of the YZRB showed a slightly increasing trend, the NDVI trend of different vege-tation types showed clear variations. The trends of different vegetation types were de-tected by summarizing the slopes of all pixels for each vegetation type with a violin plot (Figure 2d). It was shown that Needleleaf Forest, Scrub, and Alpine Vegetation had a greening trend in most areas (slope>0), although there was also a declining trend in some areas (slope<0). Steppe and Meadow did not show a clear trend. Broadleaf Forest, which was distributed in the lower reaches, mainly showed a declining trend.
The spatial distribution of the multi-annual mean values of temperature, precipita-tion, and the NDVI across the YZRB as well as their trends was detected by the Mann–Kendall trend test and Sen's slope [7,41] (Figure 3). From Figure 3a–c, we can observe that temperature, precipitation, and the NDVI of the YZRB increased gradually from the upper to the lower reaches. As Figure 3d–f shows, most of the temperature pixels exhibited sig-nificant increasing trends, and temperature in the upper reaches increased faster than that in other regions. However, the precipitation and the NDVI trends showed high spatial variability. For precipitation, the eastern part of the upper reaches and the northern part of the lower reaches exhibited significant decreasing trends while the other regions showed significant increasing trends. This finding is in accordance with previous studies that some areas in the upper and lower reaches showed a decreasing trend [20]. For the

Remote Sens. 2022, 14, 1556 6 of 17
NDVI, most pixels in the upper and middle reaches exhibited significant increasing trends, while parts of the lower reaches and a minority of parts of the upper reaches showed significant decreasing trends.
Figure 2. Basin-averaged inter-annual variations in the Normalized Difference Vegetation Index (NDVI) and climatic variables as well as the slope of the NDVI for each vegetation type in the YZRB ((a) Annual total precipitatin, (b) Annual average temperature, (c) NDVI, (d) Slope of NDVI) (NF: Needleleaf Forest, BF: Broadleaf Forest, Sc: Scrub, St: Steppe, M: Meadow, AV: Alpine Vegetation, CV: Cultivated Vegetation).
Figure 3. Basin-averaged inter-annual variations of climatic variables and the NDVI as well as their slope in the YZRB ((a) Temperature, (b) Precipitation, (c) NDVI, (d) Slope of temperature, (e) Slope of precipitation, (f) Slope of NDVI).

Remote Sens. 2022, 14, 1556 7 of 17
3.2. NDVI Modeling The results for the three machine learning models—MLR, SVM, and RF—that were
selected to simulate the relationships between vegetation and climatic variables are sum-marized in Table 2.
According to the five metrics shown in Table 2, RF models were better than the com-parative models and performed well in the calibration and validation period. The average NASH of the MLR, SVM, and RF was 0.83, 0.75, and 0.98 in the calibration period and 0.81, 0.78, and 0.84 in the validation period. The observed and predicted monthly NDVI series in the validation period from the random forest for different vegetation types were shown in Figure 4. They illustrated the good performance of NDVI modeling using RF for all vegetation types.
Table 2. Performance evaluation of all models in the calibration and validation period.
Vegetation Types
Mod-els
Calibration Validation NASH RMSE MAE r NMB NASH RMSE MAE r NMB
Needleleaf Forest
MLR 0.67 0.04 0.03 0.82 0.00 0.64 0.05 0.04 0.80 -0.28 SVM 0.65 0.04 0.04 0.81 0.23 0.59 0.04 0.03 0.72 -1.53 RF 0.95 0.02 0.01 0.98 0.04 0.61 0.05 0.04 0.78 -0.85
Broadleaf Forest
MLR 0.68 0.03 0.03 0.82 0.00 0.68 0.03 0.03 0.83 0.46 SVM 0.81 0.04 0.03 0.91 1.69 0.62 0.05 0.04 0.78 -3.52 RF 0.95 0.01 0.01 0.98 -0.01 0.65 0.04 0.04 0.81 -0.01
Scrub MLR 0.86 0.04 0.03 0.93 0.00 0.82 0.04 0.03 0.91 -2.11 SVM 0.81 0.04 0.03 0.91 0.16 0.80 0.04 0.03 0.89 -1.00 RF 0.99 0.01 0.01 0.99 0.01 0.87 0.03 0.03 0.94 -3.75
Steppe MLR 0.94 0.02 0.01 0.97 0.00 0.92 0.02 0.02 0.96 1.03 SVM 0.71 0.03 0.03 0.85 3.07 0.89 0.02 0.02 0.95 2.11 RF 1.00 0.00 0.00 1.00 -0.06 0.96 0.01 0.01 0.98 -0.71
Meadow MLR 0.94 0.02 0.02 0.97 0.00 0.94 0.02 0.02 0.97 0.48 SVM 0.67 0.03 0.03 0.81 6.73 0.93 0.02 0.02 0.98 0.55 RF 1.00 0.01 0.00 1.00 0.02 0.97 0.01 0.01 0.99 -0.93
Alpine Vegetation
MLR 0.91 0.02 0.02 0.96 0.00 0.89 0.02 0.02 0.95 -3.58 SVM 0.68 0.03 0.03 0.83 6.77 0.87 0.03 0.03 0.94 7.11 RF 0.99 0.01 0.00 1.00 0.02 0.94 0.02 0.01 0.97 -4.52
Cultivated Vegetation
MLR 0.83 0.03 0.02 0.91 0.00 0.79 0.03 0.02 0.89 -1.08 SVM 0.92 0.02 0.02 0.96 0.19 0.76 0.04 0.03 0.87 3.11 RF 0.99 0.01 0.01 0.99 0.04 0.87 0.03 0.02 0.93 -2.38
Average MLR 0.83 0.03 0.02 0.91 0.00 0.81 0.03 0.02 0.90 -0.73 SVM 0.75 0.03 0.03 0.87 1.73 0.78 0.04 0.03 0.88 0.76 RF 0.98 0.01 0.01 0.99 0.00 0.84 0.03 0.02 0.91 -2.26

Remote Sens. 2022, 14, 1556 8 of 17
Figure 4. The observed and predicted NDVI series in the validation period from the random forest for different vegetation types.
3.3. The Sensitivity to Climate Change for Different Vegetation Types The sensitivity to temperature and precipitation changes for different vegetation
types was assessed based on RF models that showed the best performance, which was shown in Figure 5 and Figure 6. The results indicated that the NDVI of each vegetation type would rise with an increase in temperature. In general, the NDVI of the YZRB in-creased by 1.60%–4.68%, when the temperature increased by 1.5 °C. The sensitivity of dif-ferent vegetation types to temperature differed (Figure 5a). We found that the vegetation located in the upper and middle reaches, including Alpine Vegetation, Meadow, Steppe,

Remote Sens. 2022, 14, 1556 9 of 17
Figure 5. The response to temperature and precipitation for different vegetation types on an an-nual scale ((a) The response of NDVI to temperature, (b) The response of NDVI to Precipitation).
(b) The response of NDVI to precipitation
(a) The response of NDVI to temperature
Remote Sens. 2022, 14, 1556 10 of 17
Scrub, and Cultivated Vegetation, was sensitive to temperature. However, the vegetation in the lower reaches, such as Needleleaf Forest and Broadleaf Forest, was not sensitive to temperature changes. Spatially, the vegetation was more sensitive to temperature in the upper and middle reaches; in other words, in higher altitude areas with lower tempera-tures, the vegetation was more sensitive to temperature changes (Figure 6a). These find-ings are consistent with the results of similar studies. Park et al. [42] found vegetation was more sensitive to temperature changes in a cold environment. Sun et al. [23] pointed out that higher temperatures would produce more snow-melt water for vegetation to use, which was important in the cold and dry regions of the YZRB.
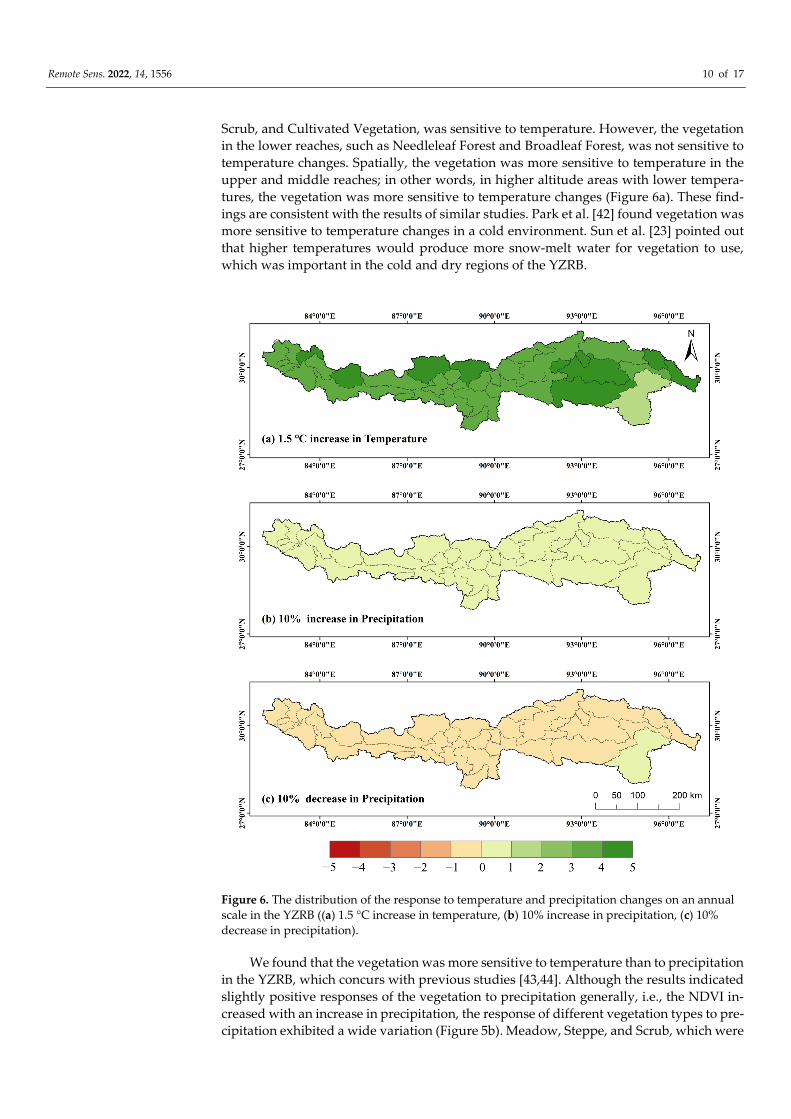
Figure 6. The distribution of the response to temperature and precipitation changes on an annual scale in the YZRB ((a) 1.5 °C increase in temperature, (b) 10% increase in precipitation, (c) 10% decrease in precipitation).
We found that the vegetation was more sensitive to temperature than to precipitation in the YZRB, which concurs with previous studies [43,44]. Although the results indicated slightly positive responses of the vegetation to precipitation generally, i.e., the NDVI in-creased with an increase in precipitation, the response of different vegetation types to pre-cipitation exhibited a wide variation (Figure 5b). Meadow, Steppe, and Scrub, which were

Remote Sens. 2022, 14, 1556 11 of 17
mainly located in the arid and semi-arid regions, were slightly sensitive to precipitation. However, the other vegetation types, including Alpine Vegetation, Cultivated Vegetation, Needleleaf Forest, and Broadleaf Forest, were not sensitive to precipitation. According to Figure 6b–c, the NDVI of the YZRB would increase by 0.06%–0.24% when the precipita-tion increased by 10%. The NDVI showed a slightly positive response (< 1%) to precipita-tion in the scenarios with a precipitation increase of 10% or a decrease of 10% in most sub-catchments. However, the NDVI showed only a slight increase in both scenarios in the lower reaches because of the non-sensitive response of the vegetation in the catchment, which was dominated by Needleleaf Forest and Broadleaf Forest.
The sensitivity to temperature and precipitation changes on a monthly scale was also investigated according to the outputs of the NDVI models in three hypothetical climate scenarios, i.e., 1.5 °C increase in temperature, 10% increase in precipitation, and 10% de-crease in precipitation. As shown in Figure 7, the monthly NDVI was more sensitive to temperature than to precipitation. In Figure 7a, the monthly distributions of the sensitivity to climate change were similar for the seven vegetation types, with a peak in April to June and a trough in August to October. All vegetation types were more sensitive to tempera- ture
Figure 7. The response to temperature and precipitation for different vegetation types on a monthly scale ((a) 1.5 °C increase in temperature, (b) 10% increase in precipitation, (c) 10% de-crease in precipitation).

Remote Sens. 2022, 14, 1556 12 of 17
increases at the start of spring and summer. The reason may be that the vegetation is sup-plied with sufficient snow-melt water as the temperature rises in the period [45,46]. How-ever, we also found that Needleleaf Forest and Broadleaf Forest had a slightly negative response to temperature in autumn, which may result from the increasing evaporation when temperatures are higher [47,48]. For precipitation (Figure 7b–c), the difference in the monthly distribution of the sensitivity to precipitation was not obvious, which indicated that precipitation was not the main factor affecting vegetation growth in the YZRB.
We also identified the seasonal distribution of the sensitivity to temperature changes (Figure 8), which were the average sensitivities for different seasonal months. The NDVI is most sensitive to a temperature change in spring, which is predicted to rise by approx-imately 3.4%–7.8%. Spatially, the NDVI appears less sensitive in the south of the lower reaches, which is in accordance with the spatial distribution of response on an annual scale. Because the monthly NDVI is not sensitive to precipitation and shows a positive sensitivity of < 1% to precipitation change, its seasonal distributions are not included in this paper.
4. Discussion 4.1 The time-lag effects of temperature and precipitation on different types of vegetation
The time-lag effects of temperature and precipitation on different types of vegetation were investigated through their correlation coefficients at time lags of 0–3 months (Table 3). We found that the highest correlations for Scrub, Steppe, Meadow, Alpine Vegetation, and Cultivated Vegetation in response to temperature and precipitation were with a 1-month lag. However, the highest correlations for Needleleaf Forest and Broadleaf Forest were with 2-month lag and 3-month lag for temperature, respectively, and with a 3-month lag for both for precipitation. We found that the most correlated variables for all vegeta-tion types were all temperatures with different time lags. The correlation coefficients var-ied from 0.75 to 0.89.
Table 3. The correlation coefficients between the NDVI of different vegetation types and tempera-ture and precipitation at time lags of 0–3 months.
The NDVI of Different Vegetation Types
Input Factors
t0 p0 t1 p1 t2 p2 t3 p3 Needleleaf Forest 0.32 0.09 0.61 0.44 0.76 0.65 0.72 0.67 Broadleaf Forest 0.02 0.34 0.34 0.11 0.63 0.42 0.75 0.58
Scrub 0.71 0.65 0.86 0.80 0.81 0.70 0.57 0.44 Steppe 0.84 0.81 0.89 0.84 0.73 0.53 0.39 0.11
Meadow 0.85 0.84 0.88 0.85 0.72 0.52 0.37 0.09 Alpine Vegetation 0.80 0.77 0.89 0.85 0.77 0.63 0.47 0.28
Cultivated Vegetation 0.73 0.66 0.85 0.81 0.77 0.70 0.51 0.42
The RF model was able to successfully evaluate the contributions of the predictors based on its built-in variable importance evaluation processes. We plotted both the rank of the correlation coefficients (Figure 9a) and the rank of the predictors’ importance (Fig-ure 9b) to explore the time-lag effects of climatic variables on each type of vegetation. The results of the two methods were similar, although some differences remained. Both meth-ods indicated the NDVI was more sensitive to temperature than to precipitation for all vegetation types. In the two methods, the NDVI of Needleleaf Forest, Broadleaf Forest, Scrub, and Cultivated Vegetation had the same time lag to temperature, while the NDVI of Steppe, Meadow, and Alpine Vegetation had a 1-month lag to temperature in the cor-relation analysis and a 0-month lag in the RF importance evaluation. However, we found that 0-month was the second most correlated period for temperature in the correlation

Remote Sens. 2022, 14, 1556 13 of 17
analysis and 1-month was the second important period in the RF importance evaluation. The time lags of temperature for different vegetation types were very similar for the two methods.
Figure 8. The distribution of the responses to a temperature increase (1.5 °C) on a monthly scale in the YZRB ((a) Spring, (b) Summer, (c) Autumn, (d) Winter).
The time lags for precipitation in the different vegetation types showed higher vari-ation. Although the time lags for Needleleaf Forest were all 3 months, those of Scrub,

Remote Sens. 2022, 14, 1556 14 of 17
Steppe, Meadow, Alpine Vegetation, and Cultivated Vegetation were all 0–1 month for the two methods. The reason for the differences may be that the RF importance evaluation considered the inherent correlation of the climate variables and showed more differences between less important variables than that of the correlation analysis [49,50].
Figure 9. The correlations between the NDVI and climatic variables at time lags of 0-3 months for different vegetation types ((a) Rank of correlation coefficients, (b) Rank of importance).
4.2 Limitations There were some limitations in our research. One limitation was that vegetation
change or evolution in the YZRB was not considered in this study, which may lead to inaccuracies in the simulation. At the same time, we explored the effects of temperature and precipitation disturbances on vegetation separately but did not consider the com-bined effects. Vegetation is also affected by variables, such as human activities, soil mois-ture content, and CO2 [51,52]. We will explore these factors as part of the model inputs in our future research. In addition, this study established basin-scale machine learning mod-els based on different vegetation types. In the future, we will try to explore the relation-ship between NDVI and climatic variables at higher resolutions. Vegetation cover is deeply affected by global climate change and its sensitivity to climatic variables has at-tracted worldwide attention. Due to the differences in ecological patterns and climatic conditions, the sensitivity of vegetation cover to climate change varies significantly [53,54]. This is the first attempt to assess the vegetation sensitivity of YZRB to climate change, which is one of the highest basins of the world with a complex topography and diverse vegetation. Our conclusions will not only support the land planning and water resources management of the Tibetan Plateau but also have reference value for vegetation sensitivities studies of high-altitude basins [55–57].
5. Conclusions We assessed the sensitivity to climate change for different vegetation types in the
YZRB using machine learning methods. To analyze spatiotemporal variability, three ma-chine learning models, MLR, SVM, and RF, were adopted to simulate the relationships between vegetation and climatic variables. RF, the best performing model, was then used to quantitatively evaluate the sensitivity of each vegetation type to temperature and pre-cipitation change. The time-lag effects of each vegetation type on climate were also ana-lyzed with the proposed models. The main findings of this study are summarized as fol-lows.
(1) RF models successfully simulated the relationships between the NDVI and cli-matic variables, which were better than MLR models and SVM models. The average NASH of MLR, SVM, and RF was 0.83, 0.75, and 0.98 in the calibration period and 0.81,

Remote Sens. 2022, 14, 1556 15 of 17
0.78, and 0.84 in the validation period. RF models exhibited the highest simulation effi-ciency according to the four metrics.
(2) Different vegetation types responded positively to temperature and precipitation changes on an annual scale, but the vegetation was more sensitive to temperature than to precipitation in the YZRB. The NDVI was predicted to increase by 1.60%–4.68% when the temperature increased by 1.5 °C, while it only changed by 0.06%–0.24% when the precip-itation increased by 10% in the YZRB. The NDVI was more sensitive to temperature changes in spring and summer on a monthly scale. The NDVI was also more sensitive to temperature rises in the upper and middle reaches, where the existing temperature was cooler.
(3) The time-lag effects of climate for each vegetation were analyzed using correlation analysis and RF importance evaluation. For temperature, Needleleaf Forest and Broadleaf Forest showed a 2-month lag and 3-month lag, respectively; Scrub and Cultivated Vege-tation both showed a 1-month lag, while Steppe, Meadow, and Alpine Vegetation showed a 0–1 month lag. For precipitation, Needleleaf Forest and Broadleaf Forest also had longer time lags than those of other vegetation types, although the two methods had slightly different results.
Author Contributions: Conceptualization, L.C. and B.P.; data curation, L.C., B.P., C.B., and M.R.; formal analysis, L.C.; software, L.C. and G.Z; validation, G.Z., C.B., and M.R.; writing—original draft preparation, L.C.; writing—review and editing, B.P., D.P., D.Z., and Z.Z. All authors have read and agreed to the published version of the manuscript.
Funding: This research was funded by The National Natural Science Foundation of China (51879008 and 52179003).
Institutional Review Board Statement: Not applicable.
Informed Consent Statement: Not applicable.
Data Availability Statement: Not applicable.
Acknowledgments: We thank Leonie Seabrook, PhD and Liwen Bianji (Edanz) (www.liwenbi-anji.cn accessed on 15 January 2022) for editing the language of a draft of this manuscript.
Conflicts of Interest: The authors declare no conflict of interest.
References 1. Piao, S.; Mohammat, A.; Fang, J.; Cai, Q.; Feng, J. NDVI-based increase in growth of temperate grasslands and its responses to
climate changes in China. Glob. Environ. Chang. 2006, 16, 340–348. https://doi.org/10.1016/j.gloenvcha.2006.02.002. 2. Huang, S.; Ming, B.; Huang, Q.; Leng, G.; Hou, B. A case study on a combination NDVI forecasting model based on the entropy
weight method. Water Resour. Manag. 2017, 31, 3667–3681. https://doi.org/10.1007/s11269-017-1692-8. 3. Kumar, A.; Kumar, M.; Pandey, R.; Yu, Z.G.; Cabral-Pinto, M. Forest soil nutrient stocks along altitudinal range of Uttarakhand
Himalayas: An aid to Nature Based Climate Solutions. Catena 2021, 207, 105667. 4. Lemordant, L.; Gentine, P.; Swann, A.S.; Cook, B.I.; Scheff, J. Critical impact of vegetation physiology on the continental hydro-
logic cycle in response to increasing CO2. Proc. Natl. Acad. Sci. USA 2018, 115, 4093–4098. https://doi.org/10.1073/pnas.1720712115.
5. Wu, D.H.; Zhao, X.; Liang, S.L.; Zhou, T.; Huang, K.C.; Tang, B.J.; Zhao, W.Q. Time-lag effects of global vegetation responses to climate change. Glob. Chang. Biol. 2015, 21, 3520–3531. https://doi.org/10.1111/gcb.12945.
6. Seddon, A.W.R.; Macias-Fauria, M.; Long, P.R.; Benz, D.; Willis, K.J. Sensitivity of global terrestrial ecosystems to climate vari-ability. Nature 2016, 531, 229–232. https://doi.org/10.1038/nature16986.
7. Wei, X.; Wang, N.; Luo, P.; Yang, J.; Zhang, J.; Lin, K. Spatiotemporal assessment of land marketization and its driving forces for sustainable Urban–Rural development in Shaanxi Province in China. Sustainability 2021, 13, 7755. https://doi.org/10.3390/su13147755.
8. Luo, P.; Mu, Y.; Wang, S.; Zhu, W.; Mishra, B.K.; Huo, A.; Zhou, M.; Lyu, J.; Hu, M.; Duan, W.; et al. Exploring sustainable solutions for the water environment in Chinese and Southeast Asian cities. Ambio 2021, 51, 1199–1218. https://doi.org/10.1007/s13280-021-01654-3.
9. Fu, J.; Niu, J.; Sivakumar, B. Prediction of vegetation anomalies over an inland river basin in north-western China. Hydrol. Processes 2018, 32, 1814–1827. https://doi.org/10.1002/hyp.11626.

Remote Sens. 2022, 14, 1556 16 of 17
10. Ge, J.; Meng, B.; Liang, T.; Feng, Q.; Gao, J.; Yang, S.; Huang, X.; Xie, H. Modeling alpine grassland cover based on MODIS data and support vector machine regression in the headwater region of the Huanghe River, China. Remote Sens. Environ. 2018, 218, 162–173. https://doi.org/10.1016/j.rse.2018.09.019.
11. Kim, J.B.; Kerns, B.K.; Drapek, R.J.; Pitts, G.S.; Halofsky, J.E. Simulating vegetation response to climate change in the Blue Mountains with MC2 dynamic global vegetation model. Clim. Serv. 2018, 10, 20–32. https://doi.org/10.1016/j.cliser.2018.04.001.
12. Bao, Z.; Zhang, J.; Wang, G.; Guan, T.; Jin, J.; Liu, Y.; Li, M.; Ma, T. The sensitivity of vegetation cover to climate change in multiple climatic zones using machine learning algorithms. Ecol. Indic. 2021, 124, 107443. https://doi.org/10.1016/j.ecolind.2021.107443.
13. Gerten, D.; Schaphoff, S.; Haberlandt, U.; Lucht, W.; Sitch, S. Terrestrial vegetation and water balance—Hydrological evaluation of a dynamic global vegetation model. J. Hydrol. 2004, 286, 249–270. https://doi.org/10.1016/j.jhydrol.2003.09.029.
14. Winter, J.M.; Pal, J.S.; Eltahir, E.A.B. Coupling of integrated biosphere simulator to Regional Climate Model Version 3. J. Clim. 2009, 22, 2743–2757. https://doi.org/10.1175/2008jcli2541.1.
15. Piao, S.; Wang, X.; Ciais, P.; Zhu, B.; Wang, T.A.O.; Liu, J.I.E. Changes in satellite-derived vegetation growth trend in temperate and boreal Eurasia from 1982 to 2006. Glob. Chang. Biol. 2011, 17, 3228–3239. https://doi.org/10.1111/j.1365-2486.2011.02419.x.
16. Bondeau, A.; Smith, P.C.; Zaehle, S.; Schaphoff, S.; Lucht, W.; Cramer, W.; Gerten, D.; Lotze-Campen, H.; MÜLler, C.; Reichstein, M.; et al. Modelling the role of agriculture for the 20th century global terrestrial carbon balance. Glob. Chang. Biol. 2007, 13, 679–706. https://doi.org/10.1111/j.1365-2486.2006.01305.x.
17. Smith, B.; Knorr, W.; Widlowski, J.-L.; Pinty, B.; Gobron, N. Combining remote sensing data with process modeling to monitor boreal conifer forest carbon balances. For. Ecol. Manag. 2008, 255, 3985–3994. https://doi.org/10.1016/j.foreco.2008.03.056.
18. Schroter, D.; Cramer, W.; Leemans, R.; Prentice, I.C.; Araujo, M.B.; Arnell, N.W.; Bondeau, A.; Bugmann, H.; Carter, T.R.; Gracia, C.A.; et al. Ecosystem service supply and vulnerability to global change in Europe. Science 2005, 310, 1333–1337. https://doi.org/10.1126/science.1115233.
19. Zaehle, S.; Sitch, S.; Smith, B.; Hatterman, F. Effects of parameter uncertainties on the modeling of terrestrial biosphere dynam-ics. Glob. Biogeochem. Cycles 2005, 19, GB3020. https://doi.org/10.1029/2004GB002395.
20. Zuo, D.; Han, Y.; Xu, Z.; Li, P.; Ban, C.; Sun, W.; Pang, B.; Peng, D.; Kan, G.; Zhang, R.; et al. Time-lag effects of climatic change and drought on vegetation dynamics in an alpine river basin of the Tibet Plateau, China. J. Hydrol. 2021, 600, 126532. https://doi.org/10.1016/j.jhydrol.2021.126532.
21. Zheng, K.; Wei, J.Z.; Pei, J.Y.; Cheng, H.; Zhang, X.L.; Huang, F.Q.; Li, F.M.; Ye, J.S. Impacts of climate change and human activities on grassland vegetation variation in the Chinese Loess Plateau. Sci. Total Environ. 2019, 660, 236–244. https://doi.org/10.1016/j.scitotenv.2019.01.022.
22. Yuan, H.H.; Yang, G.J.; Li, C.C.; Wang, Y.J.; Liu, J.G.; Yu, H.Y.; Feng, H.K.; Xu, B.; Zhao, X.Q.; Yang, X.D. Retrieving soybean leaf area index from unmanned aerial vehicle hyperspectral remote sensing: Analysis of RF, ANN, and SVM regression models. Remote Sens. 2017, 9, 309. https://doi.org/10.3390/rs9040309.
23. Sun, W.; Wang, Y.; Fu, Y.H.; Xue, B.; Wang, G.; Yu, J.; Zuo, D.; Xu, Z. Spatial heterogeneity of changes in vegetation growth and their driving forces based on satellite observations of the Yarlung Zangbo River Basin in the Tibetan Plateau. J. Hydrol. 2019, 574, 324–332. https://doi.org/10.1016/j.jhydrol.2019.04.043.
24. Li, H.; Jiang, J.; Chen, B.; Li, Y.; Xu, Y.; Shen, W. Pattern of NDVI-based vegetation greening along an altitudinal gradient in the eastern Himalayas and its response to global warming. Environ. Monit. Assess. 2016, 188, 186. https://doi.org/10.1007/s10661-016-5196-4.
25. Krakauer, N.; Lakhankar, T.; Anadón, J. Mapping and attributing normalized difference vegetation index trends for Nepal. Remote Sens. 2017, 9, 986. https://doi.org/10.3390/rs9100986.
26. Chi, K.; Pang, B.; Cui, L.; Peng, D.; Zhu, Z.; Zhao, G.; Shi, S. Modelling the vegetation response to climate changes in the Yarlung Zangbo River Basin using random forest. Water 2020, 12, 1433. https://doi.org/10.3390/w12051433.
27. You, Q.; Kang, S.; Wu, Y.; Yan, Y. Climate change over the Yarlung Zangbo River Basin during 1961–2005. J. Geogr. Sci. 2007, 17, 409–420. https://doi.org/10.1007/s11442-007-0409-y.
28. Guo, B.; Han, F.; Jiang, L. An improved dimidiated pixel model for vegetation fraction in the Yarlung Zangbo River Basin of Qinghai-Tibet Plateau. J. Indian Soc. Remote Sens. 2017, 46, 219–231. https://doi.org/10.1007/s12524-017-0692-8.
29. Yang, K.; Ye, B.; Zhou, D.; Wu, B.; Foken, T.; Qin, J.; Zhou, Z. Response of hydrological cycle to recent climate changes in the Tibetan Plateau. Clim. Chang. 2011, 109, 517–534. https://doi.org/10.1007/s10584-011-0099-4.
30. Li, F.; Xu, Z.; Liu, W.; Zhang, Y. The impact of climate change on runoff in the Yarlung Tsangpo River basin in the Tibetan Plateau. Stoch. Environ. Res. Risk Assess. 2013, 28, 517–526. https://doi.org/10.1007/s00477-013-0769-z.
31. Xu, Z.X.; Liu, W.; Li, F.P.; Liu, P. Vegetation change and its relationship with precipitation on the southern Tibetan Plateau. IAHS Publ. 2013, 359, 418–424.
32. Ren, M.; Pang, B.; Xu, Z.; Yue, J.; Zhang, R. Downscaling of daily extreme temperatures in the Yarlung Zangbo River Basin using machine learning techniques. Theor. Appl. Climatol. 2018, 136, 1275–1288. https://doi.org/10.1007/s00704-018-2552-z.
33. Mohammadi, B.; Mehdizadeh, S. Modeling daily reference evapotranspiration via a novel approach based on support vector regression coupled with whale optimization algorithm. Agric. Water Manag. 2020, 237, 106145. https://doi.org/10.1016/j.ag-wat.2020.106145.
34. Breiman, L. Random forests. Mach. Learn. 2001, 45, 5–32. https://doi.org/10.1023/A:1010933404324.

Remote Sens. 2022, 14, 1556 17 of 17
35. Pang, B.; Yue, J.; Zhao, G.; Xu, Z. Statistical Downscaling of Temperature with the Random Forest Model. Adv. Meteorol. 2017, 2017, 7265178. https://doi.org/10.1155/2017/7265178.
36. Nash, J.E.; Sutcliffe, J.V. River flow forecasting through conceptual models part I—A discussion of principles. J. Hydrol. 1970, 3, 282–290. https://doi.org/10.1016/0022-1694(70)90255-6.
37. Simon, H.; Baker, K.R.; Phillips, S. Compilation and interpretation of photochemical model performance statistics published between 2006 and 2012. Atmos. Environ. 2012, 61, 124–139.
38. Su, F.G.; Duan, X.L.; Chen, D.L.; Hao, Z.C.; Cuo, L. Evaluation of the global climate ,models in the CMIP5 over the Tibetan Plateau. Int. J. Climatol. 2013, 26, 3187–3208. https://doi.org/10.1175/Jcli-D-12-00321.1.
39. Gao, Q.Z.; Guo, Y.Q.; Xu, H.M.; Ganjurjav, H.; Li, Y.; Wan, Y.F.; Qin, X.B.; Ma, X.; Liu, S. Climate change and its impacts on vegetation distribution and net primary productivity of the alpine ecosystem in the Qinghai-Tibetan Plateau. Sci. Total Environ. 2016, 554, 34–41.
40. Zhang, J.Y.; Lun, Y.R.; Liu, L.; Liu, Y.X.; Li, X.; Xu, Z.X. CMIP6 evaluation and projection of climate change over the Tibetan Plateau. J. Beijing Norm. Univ. Nat. Sci. 2022, 58, 77–89. https://doi.org/10.12202/j.0476-0301.2021114.
41. Sen, P.K. Estimates of the regression coefficient based on Kendall’s Tau. J. Am. Stat. Assoc. 1968, 63, 1379–1389. https://doi.org/10.1080/01621459.1968.10480934.
42. Park, H.; Jeong, S.J.; Ho, C.H.; Kim, J.; Brown, M.E.; Schaepman, M.E. Nonlinear response of vegetation green-up to local tem-perature variations in temperate and boreal forests in the Northern Hemisphere. Remote Sens. Environ. 2015, 165, 100–108. https://doi.org/10.1016/j.rse.2015.04.030.
43. Han, X.M.; Zuo, D.P.; Xu, Z.X.; Cai, S.Y.; Gao, X.X. Analysis of vegetation condition and its relationship with meteorological variables in the Yarlung Zangbo River Basin of China. Proc. Int. Assoc. Hydrol. Sci. 2018, 379, 105–112. https://doi.org/10.5194/piahs-379-105-2018.
44. Li, H.D.; Li, Y.K.; Shen, W.S.; Li, Y.N.; Lin, J.; Lu, X.Y.; Xu, X.; Jiang, J. Elevation-dependent vegetation greening of the Yarlung Zangbo River Basin in the Southern Tibetan Plateau, 1999–2013. Remote Sens. 2015, 7, 16672–16687. https://doi.org/10.3390/rs71215844.
45. Wang, K.; Zhang, L.; Qiu, Y.B.; Ji, L.; Tian, F.; Wang, C.Z.; Wang, Z.Y. Snow effects on alpine vegetation in the Qinghai-Tibetan Plateau. Int. J. Digit. Earth 2015, 8, 56–73. https://doi.org/10.1080/17538947.2013.848946.
46. Wan, Y.F.; Gao, Q.Z.; Li, Y.; Qin, X.B.; Ganjurjav; Zhang, W.N.; Ma, X.; Liu, S. Change of snow cover and its impact on alpine vegetation in the source regions of large rivers on the Qinghai-Tibetan Plateau, China. Arct. Antarct. Alp. Res. 2014, 46, 632–644. https://doi.org/10.1657/1938-4246-46.3.632.
47. Ban, C.; Xu, Z.; Zuo, D.; Zhang, R.; Chen, H.; Ye, C.; Wang, J.; Waciren, D. Impact of variability in the hydrological cycle com-ponents on vegetation growth in an alpine basin of the southeastern Tibet Plateau, China. Hydrol. Res. 2022, 53, 124–140. https://doi.org/10.2166/nh.2021.086.
48. Liu, X.W.; Xu, Z.X.; Liu, W.F.; Liu, L. Responses of hydrological processes to climate change in the Yarlung Zangbo River basin. Hydrol. Sci. J. 2019, 64, 2057–2067. https://doi.org/10.1080/02626667.2019.1662908.
49. Lu, Y.Y.; Liu, F.; Zhao, Y.G.; Song, X.D.; Zhang, G.L. An integrated method of selecting environmental covariates for predictive soil depth mapping. J. Integr. Agric. 2019, 18, 301–315. https://doi.org/10.1016/S2095-3119(18)61936-7.
50. Fabris, F.; Doherty, A.; Palmer, D.; de Magalhaes, J.P.; Freitas, A.A. A new approach for interpreting Random Forest models and its application to the biology of ageing. Bioinformatics 2018, 34, 2449–2456. https://doi.org/10.1093/bioinformatics/bty087.
51. Li, H.; Liu, L.; Liu, X.; Li, X.; Xu, Z. Greening Implication Inferred from Vegetation Dynamics interacted with climate change and human activities over the Southeast Qinghai–Tibet Plateau. Remote Sens. 2019, 11, 2421. https://doi.org/10.3390/rs11202421.
52. Liu, L.; Niu, Q.; Heng, J.; Li, H.; Xu, Z. Transition characteristics of the Dry-Wet regime and vegetation dynamic responses over the Yarlung Zangbo River Basin, Southeast Qinghai-Tibet Plateau. Remote Sens. 2019, 11, 1254. https://doi.org/10.3390/rs11101254.
53. Filippa, G.; Cremonese, E.; Galvagno, M.; Isabellon, M.; Bayle, A.; Choler, P.; Carlson, B.Z.; Gabellani, S.; di Cella, U.M.; Migliavacca, M. Climatic drivers of greening trends in the Alps. Remote Sens. 2019, 11, 2527. https://doi.org/10.3390/rs11212527.
54. Jiao, K.W.; Gao, J.B.; Wu, S.H.; Hou, W.J. Research progress on the response processes of vegetation activity to climate change. Acta Ecol. Sin. 2018, 38, 2229–2238.
55. Afuye, G.A.; Kalumba, A.M.; Orimoloye, I.R. Characterisation of vegetation response to climate change: A review. Sustainability 2021, 13, 7265.
56. Zha, X.B.; Luo, P.P.; Zhu, W.; Wang, S.T.; Lyu, J.Q.; Zhou, M.M.; Huo, A.D.; Wang, Z.H. A bibliometric analysis of the research on Sponge City: Current situation and future development direction. Ecohydrology 2021, e2328. https://doi.org/10.1002/eco.2328
57. Luo, P.P.; Xu, C.Y.; Kang, S.X.; Huo, A.D.; Lyu, J.; Zhou, M.M.; Nover, D. Heavy metals in water and surface sediments of the Fenghe River Basin, China: assessment and source analysis. Water Science and Technology 2021, 84, 3072-3090. https://doi.org/ 10.2166/wst.2021.335.
Copyright © 2022 FDOKUMEN

