


Bahasa
Halaman
Hukum


This article was downloaded by: [National Chiao Tung University 國立交通大學]On: 10 July 2014, At: 04:28Publisher: Taylor & FrancisInforma Ltd Registered in England and Wales Registered Number: 1072954 Registered office: MortimerHouse, 37-41 Mortimer Street, London W1T 3JH, UK
Journal of Civil Engineering and ManagementPublication details, including instructions for authors and subscription information:http://www.tandfonline.com/loi/tcem20
Application of importance-satisfaction analysis andinfluence-relations map to evaluate design delayfactorsWei-Chih Wanga, Chia-Li Linb, Shih-Hsu Wangc, Jang-Jeng Liua & Ming-Tsung Leea
a Department of Civil Engineering, National Chiao Tung University, Hsinchu, Taiwanb Department of Recreation Management, Shih Chien University, 200 University Road,Neimen, 845 Kaohsiung, Taiwanc Department of Civil Engineering, ROC Military Academy, Kaohsiung, TaiwanPublished online: 10 Mar 2014.
To cite this article: Wei-Chih Wang, Chia-Li Lin, Shih-Hsu Wang, Jang-Jeng Liu & Ming-Tsung Lee (2014) Application ofimportance-satisfaction analysis and influence-relations map to evaluate design delay factors, Journal of Civil Engineeringand Management, 20:4, 497-510, DOI: 10.3846/13923730.2013.801922
To link to this article: http://dx.doi.org/10.3846/13923730.2013.801922
PLEASE SCROLL DOWN FOR ARTICLE
Taylor & Francis makes every effort to ensure the accuracy of all the information (the “Content”) containedin the publications on our platform. However, Taylor & Francis, our agents, and our licensors make norepresentations or warranties whatsoever as to the accuracy, completeness, or suitability for any purpose ofthe Content. Any opinions and views expressed in this publication are the opinions and views of the authors,and are not the views of or endorsed by Taylor & Francis. The accuracy of the Content should not be reliedupon and should be independently verified with primary sources of information. Taylor and Francis shallnot be liable for any losses, actions, claims, proceedings, demands, costs, expenses, damages, and otherliabilities whatsoever or howsoever caused arising directly or indirectly in connection with, in relation to orarising out of the use of the Content.
This article may be used for research, teaching, and private study purposes. Any substantial or systematicreproduction, redistribution, reselling, loan, sub-licensing, systematic supply, or distribution in anyform to anyone is expressly forbidden. Terms & Conditions of access and use can be found at http://www.tandfonline.com/page/terms-and-conditions
Corresponding author: Wei-Chih Wang E-mail: [email protected] Copyright © 2014 Vilnius Gediminas Technical University (VGTU) Press www.tandfonline.com/tcem 497
JOURNAL OF CIVIL ENGINEERING AND MANAGEMENT
ISSN 1392-3730 / eISSN 1822-3605 2014 Volume 20(4): 497–510
doi:10.3846/13923730.2013.801922
APPLICATION OF IMPORTANCE-SATISFACTION ANALYSIS AND INFLUENCE-RELATIONS MAP TO EVALUATE DESIGN DELAY FACTORS
Wei-Chih WANGa, Chia-Li LINb, Shih-Hsu WANGc, Jang-Jeng LIUa, Ming-Tsung LEEa aDepartment of Civil Engineering, National Chiao Tung University, Hsinchu, Taiwan
bDepartment of Recreation Management, Shih Chien University, 200 University Road, Neimen, 845 Kaohsiung, Taiwan
cDepartment of Civil Engineering, ROC Military Academy, Kaohsiung, Taiwan Received 05 Nov 2011; accepted 21 May 2012
Abstract. Design delays can negatively influence the total completion time of a facility construction project. Knowing the factors to which design delays are most sensitive supports the time management of designs. However, factors that cause design delays are several and interrelated. This study proposes a new model to identify key factors that drive design de-lays. The core of the model integrates importance-satisfaction analysis (ISA) and an influence-relations map (IRM). The ISA evaluates the performance of each delay factor, while the IRM captures the causal relationships among factors. Addi-tionally, the IRM is generated using a decision making trial and evaluation laboratory technique (DEMATEL). The model is applied to a real-world high-tech facility construction project to indicate the strengths of the model. In this investigation, four first-level delay factors and 17 second-level delay sub-factors are derived. The factor of “organization’s decision making and budget constraints” is identified as the key driver of design delays in the project of interest. The results sup-port management in determining which problem factors should be given priority attention. The proposed model can be employed in other decision-making situations that involve interrelated factors. Keywords: design delays, importance-satisfaction analysis (ISA), influence-relations map (IRM), decision making trial and evaluation laboratory technique (DEMATEL), high-tech facility construction project. Reference to this paper should be made as follows: Wang, W.-C.; Lin, C.-L.; Wang, S.-H.; Liu, J.-J.; Lee, M.-T. 2014. Application of importance-satisfaction analysis and influence-relations map to evaluate design delay factors, Journal of Civil Engineering and Management 20(4): 497–510. http://dx.doi.org/10.3846/13923730.2013.801922
Introduction The design of a facility construction project involves conceptual design, schematic design and detailed design. During the conceptual and schematic design phases, a prime designer (architect/engineer or A/E) seeks to con-sider information from a wide range of disciplines; repre-sent candidate solutions, and generate new states of de-sign from the current states to fulfil the requirements of the project client (or owner), including for example, the budget and spatial arrangements (Baldwin et al. 1999; Rivard, Fenves 2000). These two early phases ensure that the design deliverables satisfy the general needs of the project client. In the detailed design phase, the required design work is explicated; the design deliverables must be delivered in a timely fashion to prevent delays to fu-ture construction work.
When a design delay occurs, the completion time of the entire project may be postponed. Identifying design delay factors for improvement is critical to managing de-sign duration (Yang, Wei 2010). However, many interre-lated factors affect the design duration. These include, for example, the clarity of user needs, the timing of decisions
made by the client, the design capabilities of A/E, and the management abilities of project management. When user needs are not clearly specified or client’s decisions change frequently, the design deliverables are likely to be deter-mined by trial and error. As time passes, the A/E begins to lose patience and spends less time on design. Consequent-ly, the project client is unsatisfied with the design delivera-bles. Each factor influences each other factor. Finally, project participants (including facility users, decision mak-ers, project management, and A/E) complain to each other, exacerbating delays. If key factors that drive design delays can be identified, and attention paid to them, then such delays can be eliminated or, at least, prevented from being increased. Nevertheless, identifying the cause-effect rela-tionships among delay factors is difficult when a project involves numerous project participants and includes spe-cialty knowledge (such as concerning a clean room or special mechanical/electrical/plumbing layout require-ments).
This study proposes a new model to help identify the key factors that govern design delays. Correcting the key factors that most strongly affect delays is effective in preventing design delays. A real-world high-tech facility
Dow
nloa
ded
by [
Nat
iona
l Chi
ao T
ung
Uni
vers
ity ]
at 0
4:28
10
July
201
4
W.-C. Wang et al. Application of importance-satisfaction analysis and influence-relations map…
498
construction project in northern Taiwan is considered to demonstrate the advantages of the proposed model.
The rest of this paper is organized as follows. Sec-tion 1 reviews recent related studies. Section 2 presents details of the proposed model. Section 3 illustrates a case study of the proposed model. The final section draws conclusions and provides recommendations for future research.
1. Literature review This section reviews past studies related to duration man-agement design and delay factor identification for con-struction projects.
1.1. Management of design duration The importance of efficient design management in ensur-ing the smooth running of a project is being increasingly appreciated (Chua et al. 2003; Senthilkumar et al. 2010). Much research has been undertaken to control design processes, and thereby increase the effectiveness of the management of design duration. For example, Sanvido and Norton (1994) proposed a building design process model that indicates the tasks on which a successful de-sign depends. Bogus et al. (2005) developed a concurrent engineering approach that involved overlapping sequen-tial design activities to reduce design duration.
Several researchers have directly dealt with design schedule management (Chua, Hossain 2011). For exam-ple, considering the uncertainty in the number of itera-tions of design activities, Luh et al. (1999) developed an optimization-based method to schedule the design pro-cess in a manufacturing project. Considering design itera-tions and information dependency, Austin et al. (2000) presented a model to schedule a building design project. Taking the uncertainty in the number of iterations and the number of design participants into account, and consider-ing the possibility of conducting multiple design projects simultaneously, Wang et al. (2006) devised a simulation-based model to produce design schedules for a design firm.
1.2. Identification of delay factors An increasing number of construction projects have expe-rienced extensive delays (Odeh, Bataineh 2002). Causes of delays (i.e. delay factors) arise in all project phases. Research on delay factor identification has received con-siderable attention in the past several decades because timely identification is the basis for resolving delays (Baldwin, Manthei 1971; Yang, Wei 2010). Practitioners should foresee potential delay factors likely to confront their current and future projects and avoid or reduce these delays in a timely manner (Long et al. 2004; Sweis et al. 2008).
Past research studies may be broadly divided into two types: identifying delay factors in general and evalu-ating specific delay factors in detail:
1) In the first type of research, for instance, a survey conducted by Sweis et al. (2008) found that the fi-nancial difficulties faced by the contractor and an
excess of change orders made by the project client are the two factors that most responsible for con-struction delays. Delay factors arising in interna-tional countries have been explored, such as Vietnam (Long et al. 2004), Nigeria (Aibinu, Odeyinka 2006), Malaysia (Sambasivan, Soon 2007), Jordan (Odeh, Bataineh 2002; Sweis et al. 2008), Saudi Arabia (Assaf, Al-Hejji 2006; Al-Kharashi, Skitmore 2009), Thailand (Ogunlana et al. 1996; Toor, Ogunlana 2008), Egypt (El-Razek et al. 2008), Zambia (Kaliba et al. 2009), Gaza Strip (Enshassi et al. 2009), Ghana (Fugar, Agyakwah‐Baah 2010), Taiwan (Yang, Wei 2010), and India (Doloi et al. 2011).
2) In the second type of research, researchers assessed specific delay factors to find solutions to mitigate the delay impact. These specific delay factors in-clude labor productivity (Alinaitwe et al. 2007), weather-related factor (Apipattanavis et al. 2010), and order variations (Enshassi et al. 2010). For ex-ample, Apipattanavis et al. (2010) identified the weather attributes (such as temperature and rain) that cause construction delays and developed a weather prediction model for mitigating disputes arising from weather-related delays. Ramanathan et al. (2012) recently reviewed 113
construction delay factors from 41 studies around the world. Their analyses concluded several findings, includ-ing:
1) All 41 studies conducted semi- or full-structured expert interviews and performed questionnaire sur-veys to analyse the data obtained from the respons-es. Various indices such as importance index, fre-quency index and severity indices were then used to evaluate the factors.
2) Delay factors are specific to various countries (de-veloped versus developing countries), project sizes (project contract price amount) and project types (such as housing, industrial and commercial pro-jects) and that no root causes can be generalized. This finding is agreed by some researchers (Sweis et al. 2008).
3) None of these studies can be generalized and direct-ly applicable “as is”. This critical review presented a strong case against opinion surveys and suggested conducting statistical analyses of actual projects to generate meaningful results. Existing studies are too numerous to describe in de-
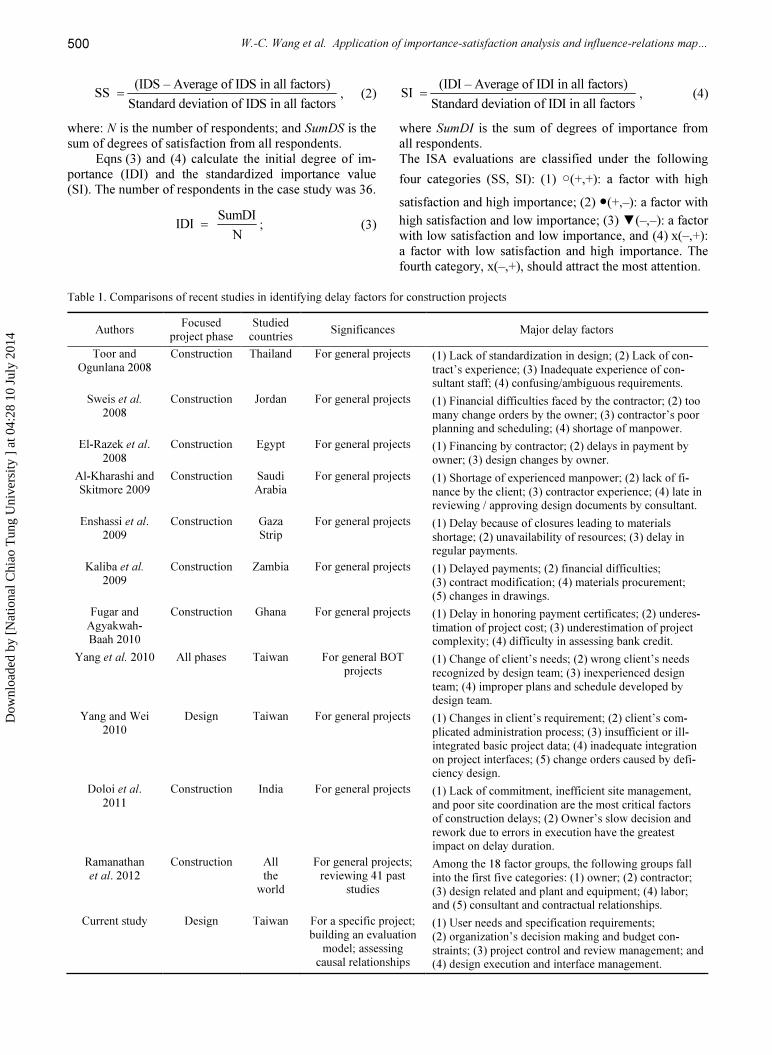
tail. Summaries are available in Toor and Ogunlana (2008) and Ramanathan et al. (2012). Table 1 compares some of recent studies and this work for indicating the significances of this study, including:
1) This study focuses on the design phase, while most past studies focused on the construction phase. Only very few studies discussed the delay factors occur-ring in the design phase (Wei 2005; Yang, Wei 2010; Yang et al. 2010). For instance, based on 95 valid responses from consultant engineers, Yang and Wei (2010) found that “changes in the client’s requirements” are the main causes of both planning and design phase delays. Focusing on public con-
Dow
nloa
ded
by [
Nat
iona
l Chi
ao T
ung
Uni
vers
ity ]
at 0
4:28
10
July
201
4
Journal of Civil Engineering and Management, 2014, 20(4): 497–510
499
struction projects under the build-operate-transfer contract model, Yang et al. (2010) indicated several design delay causes, such as change in client’s needs, wrong client’s needs recognized by the de-sign team, inexperienced design team and improper plans and schedule developed by the design team. These design delay factors are applied for general projects.
2) Past studies identified delay factors for general pro-jects. This study focuses on developing a model to identify factors and evaluate their cause-effect rela-tionships. The identified delay factors are for a par-ticular project (and are not intended to apply to gen-eral projects), although they may serve as references for other projects.
3) The proposed model here assesses the cause-effect relationships among factors to identify the key driv-ing factors. Only a few past studies considered the correlations among factors and used different corre-lation analyses. For instance, several researchers used the Spearman rank correlation coefficient to analyse the agreement/disagreement between project parties or survey respondents (El-Razek et al. 2008; Al-Kharashi, Skitmore 2009). Their studies indicat-ed that the clients and contractors often have oppos-ing views. Doloi et al. (2011) used factor analysis to assess the correlations among delay attributes and grouped the highly correlated attributes into factors (such as lack of commitment and inefficient site management). They also developed a regression model to indicate that slow decisions from the own-er and rework due to mistakes in construction had the greatest impact on construction delays in Indian construction projects. In summary, this study has three major significances:
it focuses on the design phase; it develops an evaluation model for a specific project and it evaluates causal rela-tionships among factors for finding driving delay factors.
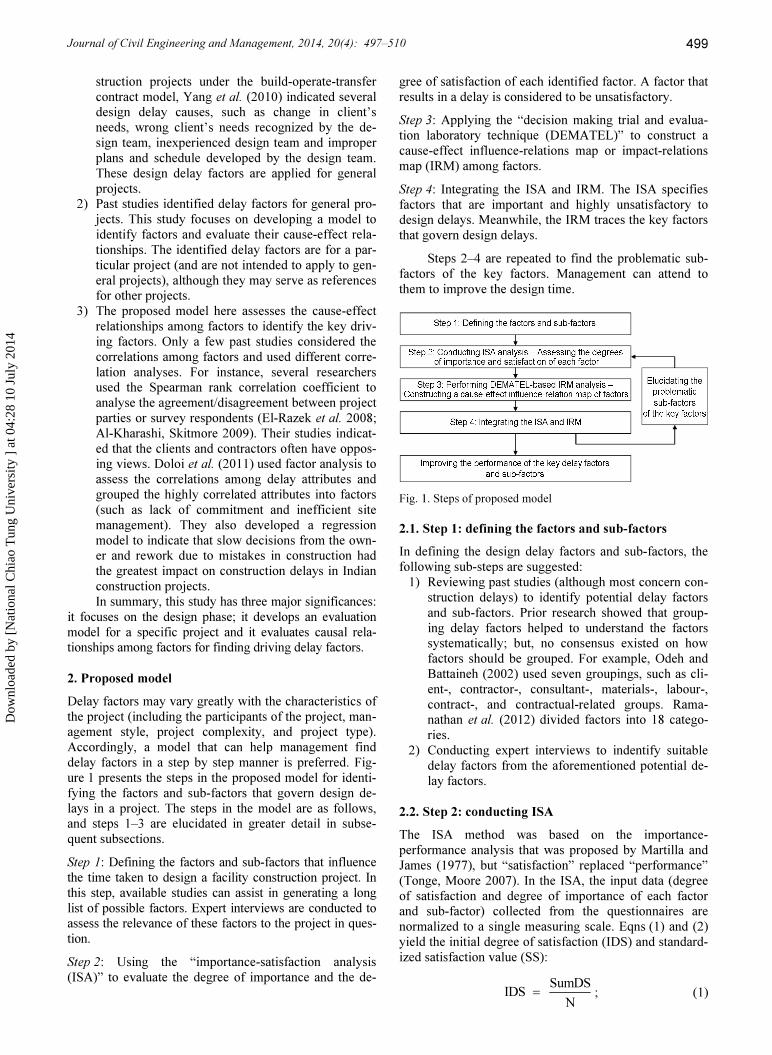
2. Proposed model Delay factors may vary greatly with the characteristics of the project (including the participants of the project, man-agement style, project complexity, and project type). Accordingly, a model that can help management find delay factors in a step by step manner is preferred. Fig-ure 1 presents the steps in the proposed model for identi-fying the factors and sub-factors that govern design de-lays in a project. The steps in the model are as follows, and steps 1–3 are elucidated in greater detail in subse-quent subsections. Step 1: Defining the factors and sub-factors that influence the time taken to design a facility construction project. In this step, available studies can assist in generating a long list of possible factors. Expert interviews are conducted to assess the relevance of these factors to the project in ques-tion. Step 2: Using the “importance-satisfaction analysis (ISA)” to evaluate the degree of importance and the de-
gree of satisfaction of each identified factor. A factor that results in a delay is considered to be unsatisfactory. Step 3: Applying the “decision making trial and evalua-tion laboratory technique (DEMATEL)” to construct a cause-effect influence-relations map or impact-relations map (IRM) among factors. Step 4: Integrating the ISA and IRM. The ISA specifies factors that are important and highly unsatisfactory to design delays. Meanwhile, the IRM traces the key factors that govern design delays.
Steps 2–4 are repeated to find the problematic sub-factors of the key factors. Management can attend to them to improve the design time.
Fig. 1. Steps of proposed model
2.1. Step 1: defining the factors and sub-factors In defining the design delay factors and sub-factors, the following sub-steps are suggested:
1) Reviewing past studies (although most concern con-struction delays) to identify potential delay factors and sub-factors. Prior research showed that group-ing delay factors helped to understand the factors systematically; but, no consensus existed on how factors should be grouped. For example, Odeh and Battaineh (2002) used seven groupings, such as cli-ent-, contractor-, consultant-, materials-, labour-, contract-, and contractual-related groups. Rama-nathan et al. (2012) divided factors into 18 catego-ries.
2) Conducting expert interviews to indentify suitable delay factors from the aforementioned potential de-lay factors.
2.2. Step 2: conducting ISA The ISA method was based on the importance-performance analysis that was proposed by Martilla and James (1977), but “satisfaction” replaced “performance” (Tonge, Moore 2007). In the ISA, the input data (degree of satisfaction and degree of importance of each factor and sub-factor) collected from the questionnaires are normalized to a single measuring scale. Eqns (1) and (2) yield the initial degree of satisfaction (IDS) and standard-ized satisfaction value (SS):
SumDSIDS N
= ; (1)
Dow
nloa
ded
by [
Nat
iona
l Chi
ao T
ung
Uni
vers
ity ]
at 0
4:28
10
July
201
4
W.-C. Wang et al. Application of importance-satisfaction analysis and influence-relations map…
500
(IDS – Average of IDS in all factors)SS Standard deviation of IDS in all factors= ,
(2)
where: N is the number of respondents; and SumDS is the sum of degrees of satisfaction from all respondents.
Eqns (3) and (4) calculate the initial degree of im-portance (IDI) and the standardized importance value (SI). The number of respondents in the case study was 36.
SumDIIDI N
= ; (3)
(IDI – Average of IDI in all factors)SI Standard deviation of IDI in all factors= , (4)
where SumDI is the sum of degrees of importance from all respondents. The ISA evaluations are classified under the following four categories (SS, SI): (1) ○(+,+): a factor with high satisfaction and high importance; (2) ●(+,–): a factor with high satisfaction and low importance; (3) ▼(–,–): a factor with low satisfaction and low importance, and (4) x(–,+): a factor with low satisfaction and high importance. The fourth category, x(–,+), should attract the most attention.
Table 1. Comparisons of recent studies in identifying delay factors for construction projects
Authors Focused project phase
Studied countries Significances Major delay factors
Toor and Ogunlana 2008
Construction Thailand For general projects (1) Lack of standardization in design; (2) Lack of con-tract’s experience; (3) Inadequate experience of con-sultant staff; (4) confusing/ambiguous requirements.
Sweis et al. 2008
Construction Jordan For general projects (1) Financial difficulties faced by the contractor; (2) too many change orders by the owner; (3) contractor’s poor planning and scheduling; (4) shortage of manpower.
El-Razek et al. 2008
Construction Egypt For general projects (1) Financing by contractor; (2) delays in payment by owner; (3) design changes by owner.
Al-Kharashi and Skitmore 2009
Construction Saudi Arabia
For general projects (1) Shortage of experienced manpower; (2) lack of fi-nance by the client; (3) contractor experience; (4) late in reviewing / approving design documents by consultant.
Enshassi et al. 2009
Construction Gaza Strip
For general projects (1) Delay because of closures leading to materials shortage; (2) unavailability of resources; (3) delay in regular payments.
Kaliba et al. 2009
Construction Zambia For general projects (1) Delayed payments; (2) financial difficulties; (3) contract modification; (4) materials procurement; (5) changes in drawings.
Fugar and Agyakwah-Baah 2010
Construction Ghana For general projects (1) Delay in honoring payment certificates; (2) underes-timation of project cost; (3) underestimation of project complexity; (4) difficulty in assessing bank credit.
Yang et al. 2010 All phases Taiwan For general BOT projects
(1) Change of client’s needs; (2) wrong client’s needs recognized by design team; (3) inexperienced design team; (4) improper plans and schedule developed by design team.
Yang and Wei 2010
Design Taiwan For general projects (1) Changes in client’s requirement; (2) client’s com-plicated administration process; (3) insufficient or ill-integrated basic project data; (4) inadequate integration on project interfaces; (5) change orders caused by defi-ciency design.
Doloi et al. 2011
Construction India For general projects (1) Lack of commitment, inefficient site management, and poor site coordination are the most critical factors of construction delays; (2) Owner’s slow decision and rework due to errors in execution have the greatest impact on delay duration.
Ramanathan et al. 2012
Construction All the
world For general projects; reviewing 41 past
studies Among the 18 factor groups, the following groups fall into the first five categories: (1) owner; (2) contractor; (3) design related and plant and equipment; (4) labor; and (5) consultant and contractual relationships.
Current study Design Taiwan For a specific project; building an evaluation
model; assessing causal relationships
(1) User needs and specification requirements; (2) organization’s decision making and budget con-straints; (3) project control and review management; and (4) design execution and interface management.
Dow
nloa
ded
by [
Nat
iona
l Chi
ao T
ung
Uni
vers
ity ]
at 0
4:28
10
July
201
4
Journal of Civil Engineering and Management, 2014, 20(4): 497–510
501
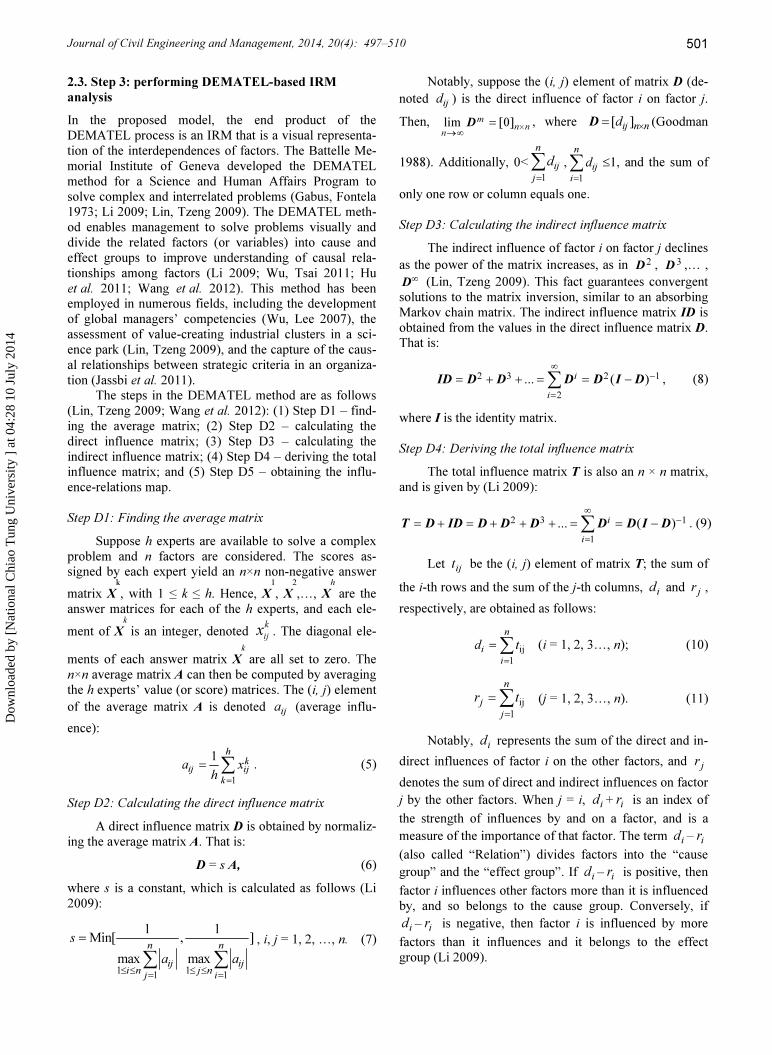
2.3. Step 3: performing DEMATEL-based IRM analysis In the proposed model, the end product of the DEMATEL process is an IRM that is a visual representa-tion of the interdependences of factors. The Battelle Me-morial Institute of Geneva developed the DEMATEL method for a Science and Human Affairs Program to solve complex and interrelated problems (Gabus, Fontela 1973; Li 2009; Lin, Tzeng 2009). The DEMATEL meth-od enables management to solve problems visually and divide the related factors (or variables) into cause and effect groups to improve understanding of causal rela-tionships among factors (Li 2009; Wu, Tsai 2011; Hu et al. 2011; Wang et al. 2012). This method has been employed in numerous fields, including the development of global managers’ competencies (Wu, Lee 2007), the assessment of value-creating industrial clusters in a sci-ence park (Lin, Tzeng 2009), and the capture of the caus-al relationships between strategic criteria in an organiza-tion (Jassbi et al. 2011).
The steps in the DEMATEL method are as follows (Lin, Tzeng 2009; Wang et al. 2012): (1) Step D1 – find-ing the average matrix; (2) Step D2 – calculating the direct influence matrix; (3) Step D3 – calculating the indirect influence matrix; (4) Step D4 – deriving the total influence matrix; and (5) Step D5 – obtaining the influ-ence-relations map.
Step D1: Finding the average matrix
Suppose h experts are available to solve a complex problem and n factors are considered. The scores as-signed by each expert yield an n×n non-negative answer matrix X
k, with 1 ≤ k ≤ h. Hence, X1, X
2,…, Xh are the
answer matrices for each of the h experts, and each ele-ment of Xk is an integer, denoted k
ijx . The diagonal ele-ments of each answer matrix X
k are all set to zero. The n×n average matrix A can then be computed by averaging the h experts’ value (or score) matrices. The (i, j) element of the average matrix A is denoted ija (average influ-ence):
1
1 hkij ij
ka x
h=
= ∑ .
(5)
Step D2: Calculating the direct influence matrix A direct influence matrix D is obtained by normaliz-
ing the average matrix A. That is: D = s A, (6) where s is a constant, which is calculated as follows (Li 2009):
1 11 1
1 1Min[ , ]max max
n nij iji n j nj i
s
a a≤ ≤ ≤ ≤= =
=
∑ ∑, i, j = 1, 2, …, n. (7)
Notably, suppose the (i, j) element of matrix D (de-noted ijd ) is the direct influence of factor i on factor j. Then, lim [0]m
n nn
×→∞
=D , where [ ]ij n nd ×=D (Goodman
1988). Additionally, 0<1
nij
jd=
∑ ,1
nij
id
=
∑ ≤1, and the sum of
only one row or column equals one.
Step D3: Calculating the indirect influence matrix The indirect influence of factor i on factor j declines
as the power of the matrix increases, as in 2D , 3D ,… , ∞D (Lin, Tzeng 2009). This fact guarantees convergent
solutions to the matrix inversion, similar to an absorbing Markov chain matrix. The indirect influence matrix ID is obtained from the values in the direct influence matrix D. That is:
2 3 2 1
2... ( )i
i
∞−
=
= + + = = −∑ID D D D D I D , (8)
where I is the identity matrix.
Step D4: Deriving the total influence matrix The total influence matrix T is also an n × n matrix,
and is given by (Li 2009):
2 3 1
1... ( )i
i
∞−
=
= + = + + + = = −∑T D ID D D D D D I D . (9)
Let ijt be the (i, j) element of matrix T; the sum of the i-th rows and the sum of the j-th columns, id and jr , respectively, are obtained as follows:
ij1
n
ii
d t=
=∑ (i = 1, 2, 3…, n); (10)
ij1
nj
jr t
=
=∑ (j = 1, 2, 3…, n). (11)
Notably, id represents the sum of the direct and in-direct influences of factor i on the other factors, and jr denotes the sum of direct and indirect influences on factor j by the other factors. When j = i, id + ir is an index of the strength of influences by and on a factor, and is a measure of the importance of that factor. The term id – ir (also called “Relation”) divides factors into the “cause group” and the “effect group”. If id – ir is positive, then factor i influences other factors more than it is influenced by, and so belongs to the cause group. Conversely, if id – ir is negative, then factor i is influenced by more
factors than it influences and it belongs to the effect group (Li 2009).
Dow
nloa
ded
by [
Nat
iona
l Chi
ao T
ung
Uni
vers
ity ]
at 0
4:28
10
July
201
4
W.-C. Wang et al. Application of importance-satisfaction analysis and influence-relations map…
502
Step D5: Obtaining the influence-relations map To visualize the complex causal relationships
among factors using a visible structural model, an IRM is developed from the values of d + r and d – r, represented on the x axis and the y axis, respectively, of a graph (Lin, Tzeng 2009). Furthermore, the net influence matrix N is provided to evaluate the strength of the effect of one fac-tor on another: ij ij jiN Net t t= = − . (12)
3. Case study This section presents the results of applying the proposed model to a case project. The project background is pre-sented; factors and sub-factors are defined; input data are collected, the ISA and IRM methods are evaluated, and the results are discussed.
3.1. Project background The case project is the construction of a high-tech facility of a national research centre located in northern Taiwan. The total floor area of the facility is approximately 53,000 m2. The case project comprises three main com-ponents: (1) civil and building construction (Civil); (2) mechanical, electrical and plumbing (MEP) works; and (3) special equipment construction (SPE). The Civil and MEP design is contracted out to an A/E. However, the SPE is designed by an internal team of the project client, because the SPE depends on particular domain knowledge, such as synchrotron accelerators and re-sistance against micro-vibrations. The planned design and construction durations of the Civil and MEP components of the facility are about one year and 2.5 years, respec-tively. The consultant fee for the A/E is around US $3.3 million, while the budget for construction (Civil and MEP) is approximately US $77.4 million.
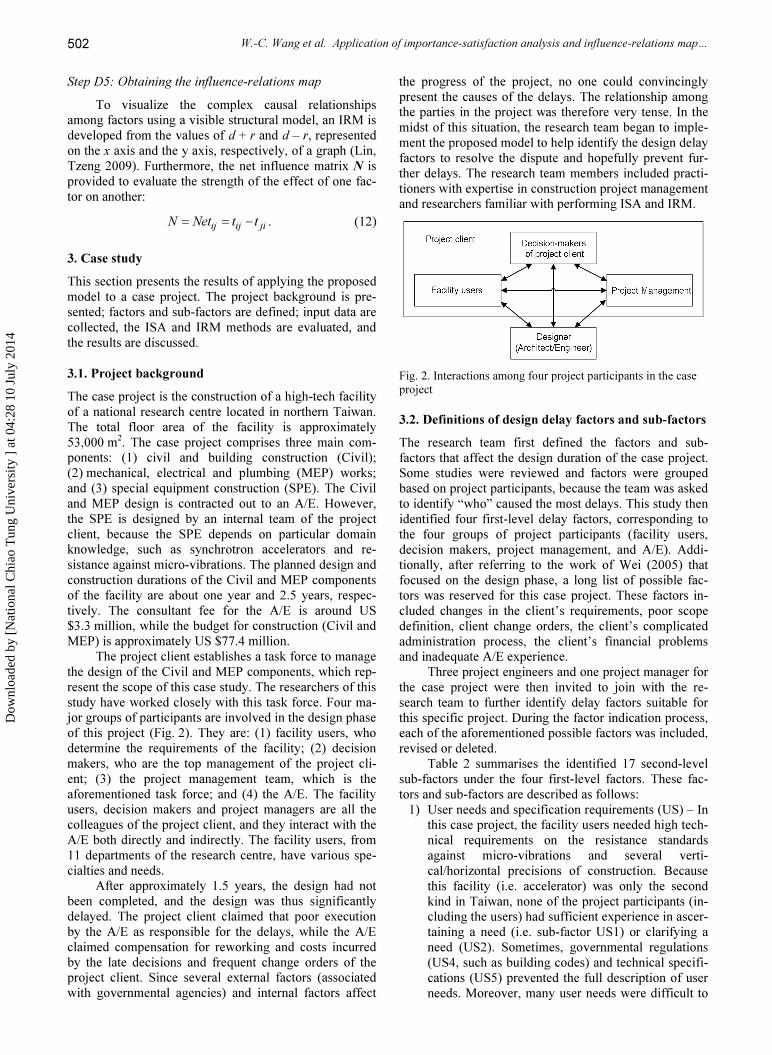
The project client establishes a task force to manage the design of the Civil and MEP components, which rep-resent the scope of this case study. The researchers of this study have worked closely with this task force. Four ma-jor groups of participants are involved in the design phase of this project (Fig. 2). They are: (1) facility users, who determine the requirements of the facility; (2) decision makers, who are the top management of the project cli-ent; (3) the project management team, which is the aforementioned task force; and (4) the A/E. The facility users, decision makers and project managers are all the colleagues of the project client, and they interact with the A/E both directly and indirectly. The facility users, from 11 departments of the research centre, have various spe-cialties and needs.
After approximately 1.5 years, the design had not been completed, and the design was thus significantly delayed. The project client claimed that poor execution by the A/E as responsible for the delays, while the A/E claimed compensation for reworking and costs incurred by the late decisions and frequent change orders of the project client. Since several external factors (associated with governmental agencies) and internal factors affect
the progress of the project, no one could convincingly present the causes of the delays. The relationship among the parties in the project was therefore very tense. In the midst of this situation, the research team began to imple-ment the proposed model to help identify the design delay factors to resolve the dispute and hopefully prevent fur-ther delays. The research team members included practi-tioners with expertise in construction project management and researchers familiar with performing ISA and IRM.
Fig. 2. Interactions among four project participants in the case project 3.2. Definitions of design delay factors and sub-factors The research team first defined the factors and sub-factors that affect the design duration of the case project. Some studies were reviewed and factors were grouped based on project participants, because the team was asked to identify “who” caused the most delays. This study then identified four first-level delay factors, corresponding to the four groups of project participants (facility users, decision makers, project management, and A/E). Addi-tionally, after referring to the work of Wei (2005) that focused on the design phase, a long list of possible fac-tors was reserved for this case project. These factors in-cluded changes in the client’s requirements, poor scope definition, client change orders, the client’s complicated administration process, the client’s financial problems and inadequate A/E experience.
Three project engineers and one project manager for the case project were then invited to join with the re-search team to further identify delay factors suitable for this specific project. During the factor indication process, each of the aforementioned possible factors was included, revised or deleted.
Table 2 summarises the identified 17 second-level sub-factors under the four first-level factors. These fac-tors and sub-factors are described as follows:
1) User needs and specification requirements (US) – In this case project, the facility users needed high tech-nical requirements on the resistance standards against micro-vibrations and several verti-cal/horizontal precisions of construction. Because this facility (i.e. accelerator) was only the second kind in Taiwan, none of the project participants (in-cluding the users) had sufficient experience in ascer-taining a need (i.e. sub-factor US1) or clarifying a need (US2). Sometimes, governmental regulations (US4, such as building codes) and technical specifi-cations (US5) prevented the full description of user needs. Moreover, many user needs were difficult to
Dow
nloa
ded
by [
Nat
iona
l Chi
ao T
ung
Uni
vers
ity ]
at 0
4:28
10
July
201
4
Journal of Civil Engineering and Management, 2014, 20(4): 497–510
503
meet in design or in construction (US2). Each factor could cause a delay. For example, if the user needs were unclear (US2), then A/E would have problems in comprehensively translating these needs into de-sign deliverables, leading to a design delay.
2) Organization’s decision making and budget con-straints (OB) – This OB factor was mainly involved the project client’s decision-making and manage-ment abilities. Two top managers fully supervised the whole project and made most decisions, such as user needs, budget allocation, building architecture and layout. Consequently, whether or not their deci-sions were made timely (OB1), their supervising methods were appropriate (OB2) and their budget allocation was efficient (OB4) could impact design duration. Additionally, the project client was re-sponsible for the effects of external factors, such as the project budget approved by governmental agen-cies (OB3). If part of budget was not available (OB3) or budget was allocated too much to certain components (such as the accelerator MEP systems, OB4), user needs might be altered and budget would be insufficient for other parts of the facility, leading to a redesign.
3) Project control and review management (PM) – This factor related to the effectiveness of project man-agement, in terms of both communication and expe-rience. The project client formed a project manage-ment team. Although most PM members had expertise in construction projects (PM2), they basi-cally managed this high-tech facility construction project in a conventional way. For instance, no ad-vanced management tools for scheduling were used
(PM1) and no standard design review operating pro-cedures were strictly implemented (PM4). Further-more, the PM’s communication with other partici-pants was not effective (PM3). Overall, it was considered that the PM managed the project reac-tively.
4) Design execution and interface management (DM) – Although this A/E had plenty of experience in de-signing high-tech facilities, he tended to be over-confident and neglected the demands of this project. This factor concerned the A/E’s abilities in drawing and design (DM1), estimating costs (DM2), and al-locating design man-hours (DM4). Moreover, this project’s MEP design involved numerous compli-cated systems developed by A/E subcontractors. A/E’s ability to manage his subcontractors became crucial to timely design deliverables (DM3). Most of the design delay factors and sub-factors
identified here are similar but more specific than those suggested by past studies. For example, prior research often categorized these factors into two broader groups (i.e. client and consultant), while this study further divid-ed the client group into two groups (i.e. facility users and decision makers) and divided the consultant group into two groups (i.e. project management and A/E). A few factors here were unique because of the characteristics of the case project. For instance, sub-factors US3, US4 and US5 (related to facility users) occurred due to the high technical micro-vibration resistance and construction precision requirements for this case project. Sub-factor OB4 (decision makers’ budget allocation management) and sub-factor DM3 (A/E’s subcontractor management) might not be common to other projects.
Table 2. Factors and sub-factors that affect design delays
First-level factors / second-level sub-factors Description 1. User needs and specification requirements (US) 1.1 Uncertainty of user needs (US1) Whether or not to include a user need is uncertain. 1.2 Clarity of user needs (US2) User needs are not clearly defined. 1.3 Difficulty of meeting user needs (US3) User requirements are too strict or difficult to meet. 1.4 Limitations imposed by regulations (US4) Governmental regulations prevent user needs from being met. 1.5 Limitations imposed by specifications (US5) Technical specifications do not suffice to meet user needs.
2. Organization’s decision making and budget constraints (OB) 2.1 DM’s decision making (OB1) Decisions made by decision makers are not timely or definite. 2.2 DM’s supervising ability (OB2) DM’s supervision methods are inefficient. 2.3 Budget availability (OB3) Project budgets are tight, so DM must change user needs. 2.4 DM’s resource allocation (OB4) DM’s budget allocation is inefficient.
3. Project control and review management (PM) 3.1 PM’s management method (PM1) PM’s project control methods are inefficient. 3.2 PM’s experience (PM2) PM’s experience and professionalism are insufficient. 3.3 PM’s communications (PM3) PM’s communications with other parties are inefficient. 3.4 PM’s reviews (PM4) PM’s reviews of design deliverables are inefficient.
4. Design execution and interface management (DM) 4.1 Design ability (DM1) A/E’s ability in drawings and design is poor. 4.2 Designer’s cost estimations (DM2) A/E’s experience of estimating costs is poor. 4.3 Subcontractor management (DM3) A/E manages his design subcontractors ineffectively. 4.4 A/E’s resource allocation (DM4) A/E allocates designers to design jobs ineffectively.
Dow
nloa
ded
by [
Nat
iona
l Chi
ao T
ung
Uni
vers
ity ]
at 0
4:28
10
July
201
4

W.-C. Wang et al. Application of importance-satisfaction analysis and influence-relations map…
504
3.3. Collection of input data The required input data for the ISA and (DEMATEL-based) IRM are obtained using a set of questionnaires. Thirty-six experts (engineers, section managers or man-agers who were involved in this case project) were asked to fill out each questionnaire. Table 3 shows an example of the response from the questionnaire for executing ISA. In Table 3, the degree of importance and the degree of satisfaction range between ten (highest importance or satisfaction) and zero (lowest importance or satisfaction).
Table 3. Example of the response from the ISA questionnaire
Factors and sub-factors
Degree of importance
Degree of satisfaction
1. US 1.1 US1 8 5 1.2 US2 8 5 1.3 US3 7 5 1.4 US4 9 4 1.5 US5 8 8
2. OB 2.1 OB1 8 5 2.2 OB2 7 5 2.3 OB3 7 6 2.4 OB4 7 6
3. PM 3.1 PM1 9 7 3.2 PM2 8 8 3.3 PM3 8 8 3.4 PM4 7 8
4. DM 4.1 DM1 8 7 4.2 DM2 8 7 4.3 DM3 8 7 4.4 DM4 7 6
Note: Degrees of importance and satisfaction range between ten (highest importance or satisfaction) and zero (lowest im-portance or satisfaction).
Table 4. Example of the response from the IRM questionnaire
Factor j Factor i
1. US 2. OB 3. PM 4. DM
1. US 3 2. OB 3. PM 1 4. DM
Note: 0: no influence; 1: weak direct influence; 2: moderate direct influence; 3: strong direct influence; 4: very strong direct influence. Table 4 presents an example of the response from
the questionnaire for generating IRM. Each respondent was asked to evaluate the strength of the direct influence (effect) of a factor on each of the other factors using an integer scale (from zero to four). In Table 4, for example, suppose factor i (PM) has a weak direct influence on factor j (US): a score of “1” is given to represent this
weak influence. Conversely, if the US factor has a strong direct influence on the PM factor, a score of “3” is as-signed. A high score represents the belief that an im-provement in the PM factor relies strongly on an im-provement in the US factor.
The research team held several meetings to illustrate the details of the questionnaire to the experts in order to ensure that the questionnaires could respond effectively. Cronbach’s α is utilized to test the reliability of data col-lected from the questionnaires in this case project. The test results reveal that these questionnaires used in the ISA and IRM analyses are reliable (as α exceeds 0.7) (Table 5).
Table 5. Reliability tests on questionnaires
Reliability tests Cronbach’s alpha Results
In ISA analysis: Data on degree of importance 0.899 High Data on degree of satisfaction 0.908 High In IRM analysis: Data on first-level factors 0.849 High Data on sub-factors under each factor 1. Data on second-level sub-factor under US factor 0.834 High
2. Data on second-level sub-factor under OB factor 0.858 High
3. Data on second-level sub-factor under PM factor 0.896 High
4. Data on second-level sub-factor under DM factor 0.881 High
Table 6. Degrees of satisfaction and importance of factors
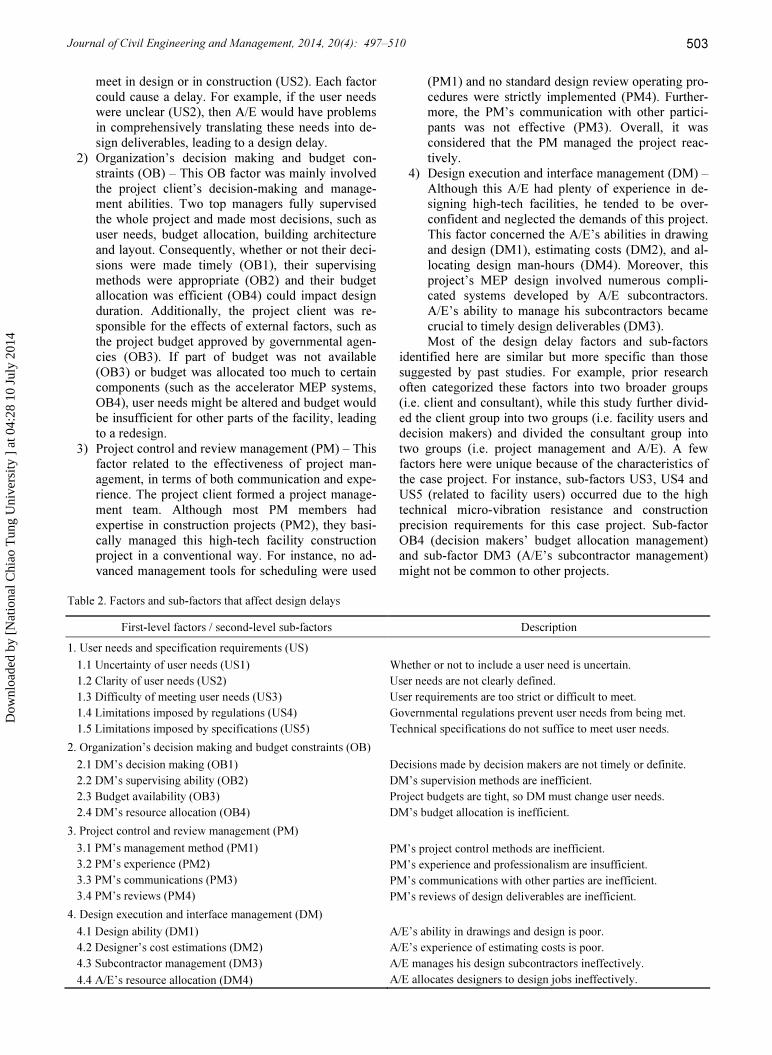
Degree of satisfaction Degree of importance Factors Initial value SS Initial value SI (SS, SI ) 1. US 6.233 0.217 7.772 –1.209 ● (+,–) 2. OB 5.583 –1.415 8.153 1.128 x (–,+) 3. PM 6.521 0.939 8.035 0.403 ○ (+,+) 4. DM 6.250 0.259 7.917 –0.322 ● (+,–)
3.4. Evaluation of ISA Table 6 shows the evaluations made using ISA in the case study. As indicated earlier, the fourth category, x (–,+), should attract the most attention. In this case study, the OB factor (organization’s decision making and budget constraints) falls under the fourth category: the OB factor is considered to be highly important, but with a low de-gree of satisfaction. Therefore, this OB factor should be improved immediately. Figure 3 graphically represents the results of the ISA evaluation. Factors (including the OB factor herein) that are in the second quadrant are easily identified for improvement. 3.5. Generation of IRM The research team then carried out the steps of the DEMATEL method, as follows.
Dow
nloa
ded
by [
Nat
iona
l Chi
ao T
ung
Uni
vers
ity ]
at 0
4:28
10
July
201
4
Journal of Civil Engineering and Management, 2014, 20(4): 497–510
505
Fig. 3. ISA analysis of first-level factors Step D1: Finding the average matrix – Table 7 presents an initial average matrix (average matrix A) of the factors in the case project. The value of h in Eqn (5) is 36 (36 respondents). For example, the initial average value of the effect of the US factor on the OB factor (US�OB) is calculated to be 3.111, indicating a high direct influence (as 4.0 is the highest value).
Table 7. Initial average matrix A of factors Factors US OB PM DM Sum 1. US 0 3.111 2.972 2.861 8.944 2. OB 3.167 0 3.056 2.750 8.973 3. PM 2.500 2.361 0 2.861 7.722 4. DM 2.583 2.361 2.778 0 7.722 Sum 8.250 7.833 8.806 8.472
Step D2: Calculating the direct influence matrix – In Table 7, the sum of the second row is the maximum value (8.973) of
1 1max
niji n ja
≤ ≤ =∑
and
1 1max
nijj n ia
≤ ≤ =∑ . Therefore, the
value of s equals 1/8.973. Accordingly, based on Eqn (6) and the values of the average matrix A (Table 7), a direct influence matrix D is obtained and presented in Table 8. For instance, the value of direct influence US�OB is calculated to be around 0.347 (= 3.111/8.973).
Table 8. Direct influence matrix D of factors Factors US OB PM DM Sum 1. US 0 0.347 0.331 0.319 0.997 2. OB 0.353 0 0.341 0.307 1.000 3. PM 0.279 0.263 0 0.319 0.861 4. DM 0.288 0.263 0.310 0 0.861 Sum 0.920 0.873 0.982 0.945
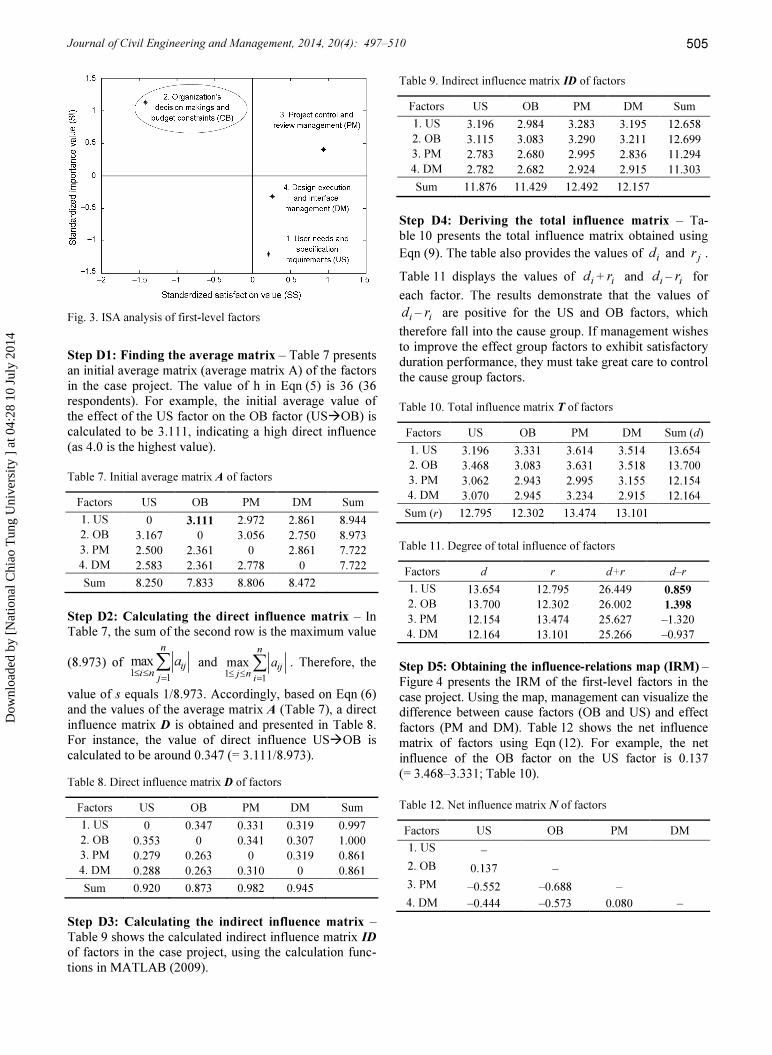
Step D3: Calculating the indirect influence matrix – Table 9 shows the calculated indirect influence matrix ID of factors in the case project, using the calculation func-tions in MATLAB (2009).
Table 9. Indirect influence matrix ID of factors Factors US OB PM DM Sum 1. US 3.196 2.984 3.283 3.195 12.658 2. OB 3.115 3.083 3.290 3.211 12.699 3. PM 2.783 2.680 2.995 2.836 11.294 4. DM 2.782 2.682 2.924 2.915 11.303 Sum 11.876 11.429 12.492 12.157
Step D4: Deriving the total influence matrix – Ta-ble 10 presents the total influence matrix obtained using Eqn (9). The table also provides the values of id and jr . Table 11 displays the values of id + ir and id – ir for each factor. The results demonstrate that the values of id – ir are positive for the US and OB factors, which
therefore fall into the cause group. If management wishes to improve the effect group factors to exhibit satisfactory duration performance, they must take great care to control the cause group factors.
Table 10. Total influence matrix T of factors Factors US OB PM DM Sum (d) 1. US 3.196 3.331 3.614 3.514 13.654 2. OB 3.468 3.083 3.631 3.518 13.700 3. PM 3.062 2.943 2.995 3.155 12.154 4. DM 3.070 2.945 3.234 2.915 12.164 Sum (r) 12.795 12.302 13.474 13.101
Table 11. Degree of total influence of factors Factors d r d+r d–r 1. US 13.654 12.795 26.449 0.859 2. OB 13.700 12.302 26.002 1.398 3. PM 12.154 13.474 25.627 –1.320 4. DM 12.164 13.101 25.266 –0.937
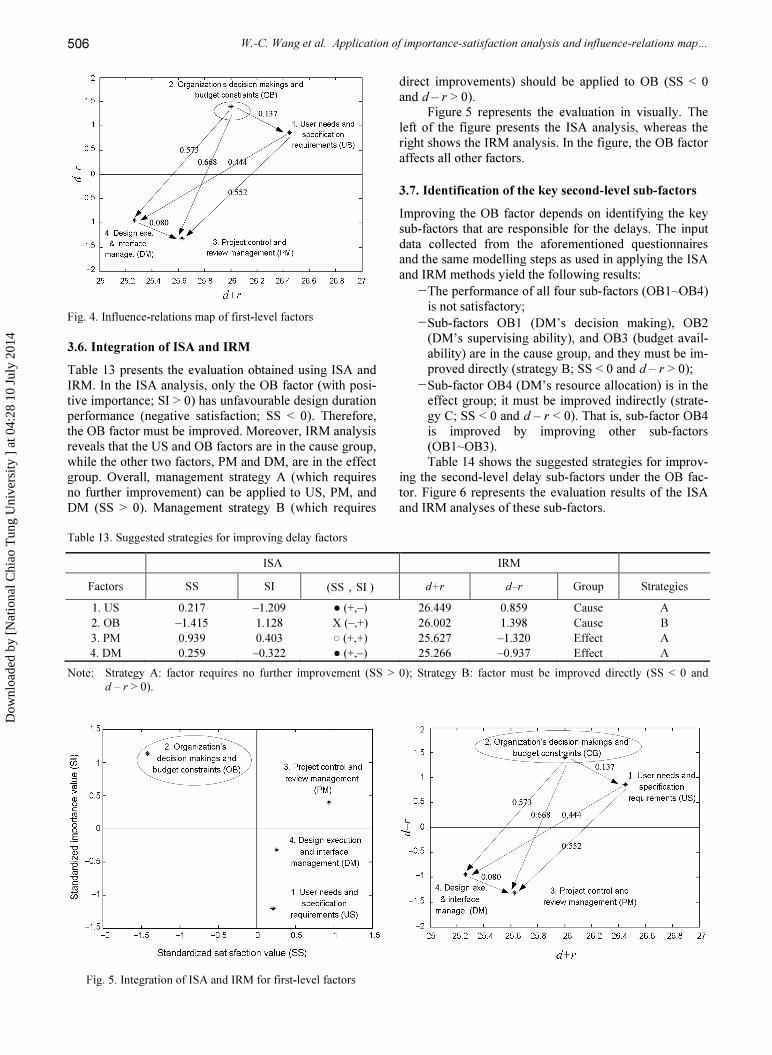
Step D5: Obtaining the influence-relations map (IRM) – Figure 4 presents the IRM of the first-level factors in the case project. Using the map, management can visualize the difference between cause factors (OB and US) and effect factors (PM and DM). Table 12 shows the net influence matrix of factors using Eqn (12). For example, the net influence of the OB factor on the US factor is 0.137 (= 3.468–3.331; Table 10).
Table 12. Net influence matrix N of factors Factors US OB PM DM 1. US – 2. OB 0.137 – 3. PM –0.552 –0.688 – 4. DM –0.444 –0.573 0.080 –
Dow
nloa
ded
by [
Nat
iona
l Chi
ao T
ung
Uni
vers
ity ]
at 0
4:28
10
July
201
4
W.-C. Wang et al. Application of importance-satisfaction analysis and influence-relations map…
506
Fig. 4. Influence-relations map of first-level factors
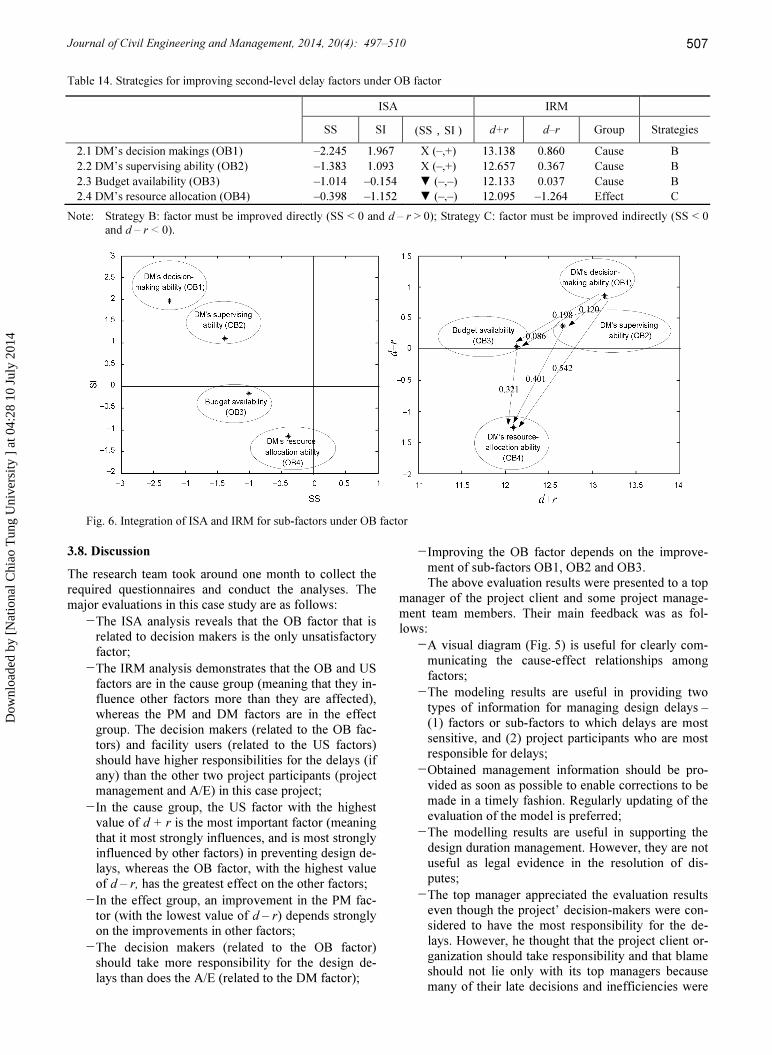
3.6. Integration of ISA and IRM Table 13 presents the evaluation obtained using ISA and IRM. In the ISA analysis, only the OB factor (with posi-tive importance; SI > 0) has unfavourable design duration performance (negative satisfaction; SS < 0). Therefore, the OB factor must be improved. Moreover, IRM analysis reveals that the US and OB factors are in the cause group, while the other two factors, PM and DM, are in the effect group. Overall, management strategy A (which requires no further improvement) can be applied to US, PM, and DM (SS > 0). Management strategy B (which requires
direct improvements) should be applied to OB (SS < 0 and d – r > 0).
Figure 5 represents the evaluation in visually. The left of the figure presents the ISA analysis, whereas the right shows the IRM analysis. In the figure, the OB factor affects all other factors.
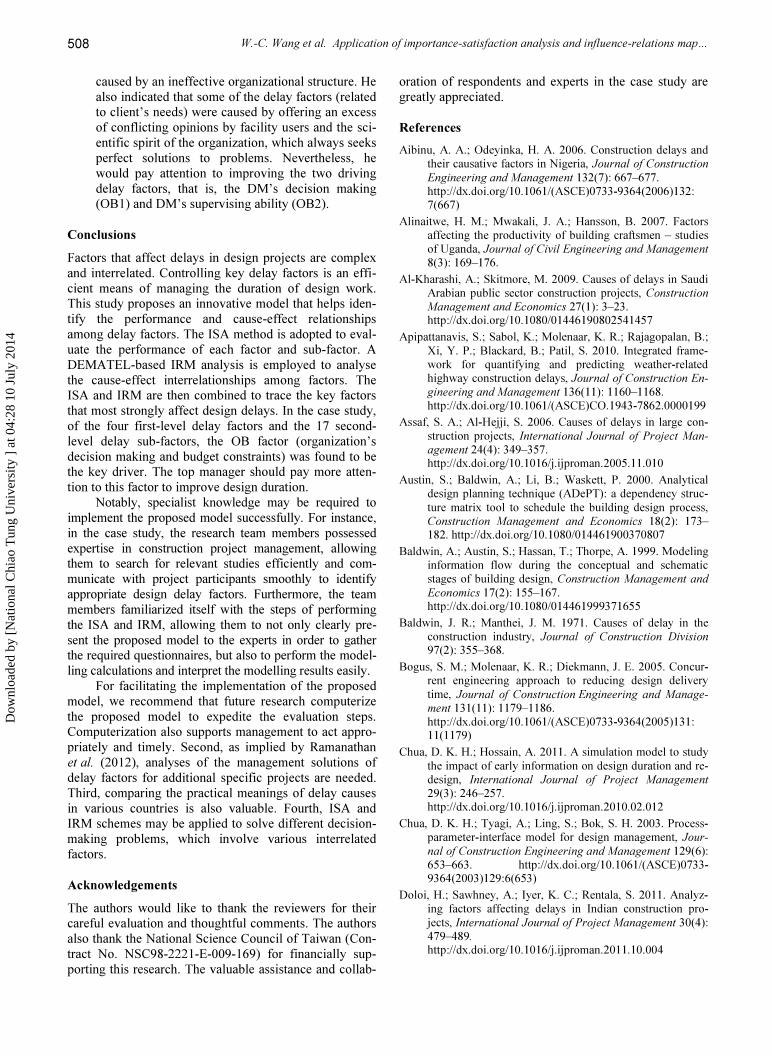
3.7. Identification of the key second-level sub-factors Improving the OB factor depends on identifying the key sub-factors that are responsible for the delays. The input data collected from the aforementioned questionnaires and the same modelling steps as used in applying the ISA and IRM methods yield the following results:
− The performance of all four sub-factors (OB1~OB4) is not satisfactory;
− Sub-factors OB1 (DM’s decision making), OB2 (DM’s supervising ability), and OB3 (budget avail-ability) are in the cause group, and they must be im-proved directly (strategy B; SS < 0 and d – r > 0);
− Sub-factor OB4 (DM’s resource allocation) is in the effect group; it must be improved indirectly (strate-gy C; SS < 0 and d – r < 0). That is, sub-factor OB4 is improved by improving other sub-factors (OB1~OB3). Table 14 shows the suggested strategies for improv-
ing the second-level delay sub-factors under the OB fac-tor. Figure 6 represents the evaluation results of the ISA and IRM analyses of these sub-factors.
Table 13. Suggested strategies for improving delay factors
ISA IRM Factors SS SI (SS,SI ) d+r d–r Group Strategies 1. US 0.217 –1.209 ● (+,–) 26.449 0.859 Cause A 2. OB –1.415 1.128 X (–,+) 26.002 1.398 Cause B 3. PM 0.939 0.403 ○ (+,+) 25.627 –1.320 Effect A 4. DM 0.259 –0.322 ● (+,–) 25.266 –0.937 Effect A
Note: Strategy A: factor requires no further improvement (SS > 0); Strategy B: factor must be improved directly (SS < 0 and d – r > 0).
Fig. 5. Integration of ISA and IRM for first-level factors
Dow
nloa
ded
by [
Nat
iona
l Chi
ao T
ung
Uni
vers
ity ]
at 0
4:28
10
July
201
4
Journal of Civil Engineering and Management, 2014, 20(4): 497–510
507
Table 14. Strategies for improving second-level delay factors under OB factor
ISA IRM
SS SI (SS,SI ) d+r d–r Group Strategies 2.1 DM’s decision makings (OB1) –2.245 1.967 X (–,+) 13.138 0.860 Cause B 2.2 DM’s supervising ability (OB2) –1.383 1.093 X (–,+) 12.657 0.367 Cause B 2.3 Budget availability (OB3) –1.014 –0.154 ▼ (–,–) 12.133 0.037 Cause B 2.4 DM’s resource allocation (OB4) –0.398 –1.152 ▼ (–,–) 12.095 –1.264 Effect C
Note: Strategy B: factor must be improved directly (SS < 0 and d – r > 0); Strategy C: factor must be improved indirectly (SS < 0 and d – r < 0).
Fig. 6. Integration of ISA and IRM for sub-factors under OB factor
3.8. Discussion The research team took around one month to collect the required questionnaires and conduct the analyses. The major evaluations in this case study are as follows:
− The ISA analysis reveals that the OB factor that is related to decision makers is the only unsatisfactory factor;
− The IRM analysis demonstrates that the OB and US factors are in the cause group (meaning that they in-fluence other factors more than they are affected), whereas the PM and DM factors are in the effect group. The decision makers (related to the OB fac-tors) and facility users (related to the US factors) should have higher responsibilities for the delays (if any) than the other two project participants (project management and A/E) in this case project;
− In the cause group, the US factor with the highest value of d + r is the most important factor (meaning that it most strongly influences, and is most strongly influenced by other factors) in preventing design de-lays, whereas the OB factor, with the highest value of d – r, has the greatest effect on the other factors;
− In the effect group, an improvement in the PM fac-tor (with the lowest value of d – r) depends strongly on the improvements in other factors;
− The decision makers (related to the OB factor) should take more responsibility for the design de-lays than does the A/E (related to the DM factor);
− Improving the OB factor depends on the improve-ment of sub-factors OB1, OB2 and OB3. The above evaluation results were presented to a top
manager of the project client and some project manage-ment team members. Their main feedback was as fol-lows:
− A visual diagram (Fig. 5) is useful for clearly com-municating the cause-effect relationships among factors;
− The modeling results are useful in providing two types of information for managing design delays – (1) factors or sub-factors to which delays are most sensitive, and (2) project participants who are most responsible for delays;
− Obtained management information should be pro-vided as soon as possible to enable corrections to be made in a timely fashion. Regularly updating of the evaluation of the model is preferred;
− The modelling results are useful in supporting the design duration management. However, they are not useful as legal evidence in the resolution of dis-putes;
− The top manager appreciated the evaluation results even though the project’ decision-makers were con-sidered to have the most responsibility for the de-lays. However, he thought that the project client or-ganization should take responsibility and that blame should not lie only with its top managers because many of their late decisions and inefficiencies were
Dow
nloa
ded
by [
Nat
iona
l Chi
ao T
ung
Uni
vers
ity ]
at 0
4:28
10
July
201
4
W.-C. Wang et al. Application of importance-satisfaction analysis and influence-relations map…
508
caused by an ineffective organizational structure. He also indicated that some of the delay factors (related to client’s needs) were caused by offering an excess of conflicting opinions by facility users and the sci-entific spirit of the organization, which always seeks perfect solutions to problems. Nevertheless, he would pay attention to improving the two driving delay factors, that is, the DM’s decision making (OB1) and DM’s supervising ability (OB2).
Conclusions Factors that affect delays in design projects are complex and interrelated. Controlling key delay factors is an effi-cient means of managing the duration of design work. This study proposes an innovative model that helps iden-tify the performance and cause-effect relationships among delay factors. The ISA method is adopted to eval-uate the performance of each factor and sub-factor. A DEMATEL-based IRM analysis is employed to analyse the cause-effect interrelationships among factors. The ISA and IRM are then combined to trace the key factors that most strongly affect design delays. In the case study, of the four first-level delay factors and the 17 second-level delay sub-factors, the OB factor (organization’s decision making and budget constraints) was found to be the key driver. The top manager should pay more atten-tion to this factor to improve design duration.
Notably, specialist knowledge may be required to implement the proposed model successfully. For instance, in the case study, the research team members possessed expertise in construction project management, allowing them to search for relevant studies efficiently and com-municate with project participants smoothly to identify appropriate design delay factors. Furthermore, the team members familiarized itself with the steps of performing the ISA and IRM, allowing them to not only clearly pre-sent the proposed model to the experts in order to gather the required questionnaires, but also to perform the model-ling calculations and interpret the modelling results easily.
For facilitating the implementation of the proposed model, we recommend that future research computerize the proposed model to expedite the evaluation steps. Computerization also supports management to act appro-priately and timely. Second, as implied by Ramanathan et al. (2012), analyses of the management solutions of delay factors for additional specific projects are needed. Third, comparing the practical meanings of delay causes in various countries is also valuable. Fourth, ISA and IRM schemes may be applied to solve different decision-making problems, which involve various interrelated factors.
Acknowledgements The authors would like to thank the reviewers for their careful evaluation and thoughtful comments. The authors also thank the National Science Council of Taiwan (Con-tract No. NSC98-2221-E-009-169) for financially sup-porting this research. The valuable assistance and collab-
oration of respondents and experts in the case study are greatly appreciated.
References Aibinu, A. A.; Odeyinka, H. A. 2006. Construction delays and
their causative factors in Nigeria, Journal of Construction Engineering and Management 132(7): 667–677. http://dx.doi.org/10.1061/(ASCE)0733-9364(2006)132: 7(667)
Alinaitwe, H. M.; Mwakali, J. A.; Hansson, B. 2007. Factors affecting the productivity of building craftsmen – studies of Uganda, Journal of Civil Engineering and Management 8(3): 169–176.
Al-Kharashi, A.; Skitmore, M. 2009. Causes of delays in Saudi Arabian public sector construction projects, Construction Management and Economics 27(1): 3–23. http://dx.doi.org/10.1080/01446190802541457
Apipattanavis, S.; Sabol, K.; Molenaar, K. R.; Rajagopalan, B.; Xi, Y. P.; Blackard, B.; Patil, S. 2010. Integrated frame-work for quantifying and predicting weather-related highway construction delays, Journal of Construction En-gineering and Management 136(11): 1160–1168. http://dx.doi.org/10.1061/(ASCE)CO.1943-7862.0000199
Assaf, S. A.; Al-Hejji, S. 2006. Causes of delays in large con-struction projects, International Journal of Project Man-agement 24(4): 349–357. http://dx.doi.org/10.1016/j.ijproman.2005.11.010
Austin, S.; Baldwin, A.; Li, B.; Waskett, P. 2000. Analytical design planning technique (ADePT): a dependency struc-ture matrix tool to schedule the building design process, Construction Management and Economics 18(2): 173–182. http://dx.doi.org/10.1080/014461900370807
Baldwin, A.; Austin, S.; Hassan, T.; Thorpe, A. 1999. Modeling information flow during the conceptual and schematic stages of building design, Construction Management and Economics 17(2): 155–167. http://dx.doi.org/10.1080/014461999371655
Baldwin, J. R.; Manthei, J. M. 1971. Causes of delay in the construction industry, Journal of Construction Division 97(2): 355–368.
Bogus, S. M.; Molenaar, K. R.; Diekmann, J. E. 2005. Concur-rent engineering approach to reducing design delivery time, Journal of Construction Engineering and Manage-ment 131(11): 1179–1186. http://dx.doi.org/10.1061/(ASCE)0733-9364(2005)131: 11(1179)
Chua, D. K. H.; Hossain, A. 2011. A simulation model to study the impact of early information on design duration and re-design, International Journal of Project Management 29(3): 246–257. http://dx.doi.org/10.1016/j.ijproman.2010.02.012
Chua, D. K. H.; Tyagi, A.; Ling, S.; Bok, S. H. 2003. Process-parameter-interface model for design management, Jour-nal of Construction Engineering and Management 129(6): 653–663. http://dx.doi.org/10.1061/(ASCE)0733-9364(2003)129:6(653)
Doloi, H.; Sawhney, A.; Iyer, K. C.; Rentala, S. 2011. Analyz-ing factors affecting delays in Indian construction pro-jects, International Journal of Project Management 30(4): 479–489. http://dx.doi.org/10.1016/j.ijproman.2011.10.004
Dow
nloa
ded
by [
Nat
iona
l Chi
ao T
ung
Uni
vers
ity ]
at 0
4:28
10
July
201
4
Journal of Civil Engineering and Management, 2014, 20(4): 497–510
509
El-Razek, M. E. A.; Bassioni, H. A.; Mobarak, A. M. 2008. Causes of delay in building construction projects in Egypt, Journal of Construction Engineering and Management 134(11): 831–841. http://dx.doi.org/10.1061/(ASCE)0733-9364(2008)134:11(831)
Enshassi, A.; Arain, F.; Al-Raee, S. 2010. Causes of variation orders in construction projects in the Gaza Strip, Journal of Civil Engineering and Management 16(4): 540–551. http://dx.doi.org/10.3846/jcem.2010.60
Enshassi, A.; Mohamed, S.; Abushaban, S. 2009. Factors affect-ing the performance of construction projects in the Gaza Strip, Journal of Civil Engineering and Management 15(3): 269–280. http://dx.doi.org/10.3846/1392-3730.2009.15.269-280
Fugar, F. D. K.; Agyakwah‐Baah, A. B. 2010. Delays in build-ing construction projects in Ghana, Australasian Journal of Construction Economics and Building 10(1/2): 103–116.
Gabus, A.; Fontela, E. 1973. Perceptions of the world problem-atique: communication procedure, communicating with those bearing collective responsibility. DEMATEL Report No. 1, Geneva, Switzerland, Battelle Geneva Re-search Center.
Goodman, R. 1988. Introduction to stochastic models. Califor-nia, U.S.: Benjamin/Cummings Publishing Company Inc.
Hu, H. Y.; Chiu, S. I.; Cheng, C. C.; Yen, T. M. 2011. Applying the IPA and DEMATEL models to improve the order-winner criteria: a case study of Taiwan’s network com-munication equipment manufacturing industry, Expert Systems with Applications 38(8): 9674–9683. http://dx.doi.org/10.1016/j.eswa.2011.01.147
Jassbi, J.; Mohamadnejad, F.; Nasrollahzadeh, H. 2011. A fuzzy DEMATEL framework for modeling cause and effect re-lationships of strategy map, Expert Systems with Applica-tions 38(5): 5967–5973. http://dx.doi.org/10.1016/j.eswa.2010.11.026
Kaliba, C.; Muya, M.; Kumba, K. 2009. Cost escalation ad schedule delays in road construction projects in Zambia, International Journal of Project Management 27(5): 522–531. http://dx.doi.org/10.1016/j.ijproman.2008.07.003
Li, C. W. 2009. A structure evaluation model for technology policies and programs: PhD Dissertation, Institute of Management of Technology, National Chiao Tung Uni-versity, Taiwan.
Lin, C. L.; Tzeng, G. H. 2009. A value-created system of sci-ence (technology) park by using DEMATEL, Expert Sys-tems with Applications 36(6): 9683–9697. http://dx.doi.org/10.1016/j.eswa.2008.11.040
Long, N. D.; Ogunlana, S.; Quang, T.; Lam, K. C. 2004. Large construction projects in developing countries: a case study from Vietnam, International Journal of Project Manage-ment 22(7): 553–561. http://dx.doi.org/10.1016/j.ijproman.2004.03.004
Luh, P. B.; Liu, F.; Moser, B. 1999. Scheduling of design pro-jects with uncertain number of iterations, European Jour-nal of Operational Research 113(3): 575–592. http://dx.doi.org/10.1016/S0377-2217(98)00027-7
Martilla, J. A.; James, J. C. 1977. Importance-performance analysis, Journal of Marketing 41(1): 77–79. http://dx.doi.org/10.2307/1250495
MATLAB, 2009. The Mathworks, Inc. [online], [cited 11 June 2009]. Available from Internet: http://www.mathworks.com/patents
Odeh, A. M.; Battaineh, H. T. 2002. Causes of construction delay: traditional contracts, International Journal of Pro-ject Management 20(1): 67–73. http://dx.doi.org/10.1016/S0263-7863(00)00037-5
Ogunlana, S. O.; Promkuntong, K.; Jearkjirm, V. 1996. Con-struction delays in a fast-growing economy: comparing Thailand with other economies, International Journal of Project Management 14(1): 37–45. http://dx.doi.org/10.1016/0263-7863(95)00052-6
Ramanathan, C.; Narayanan, S. P.; Idrus, A. B. 2012. Construc-tion delays causing risks on time and cost – a critical re-view, Australasian Journal of Construction Economics and Building 12(1): 37–57.
Rivard, H.; Fenves, S. J. 2000. A representation for conceptual design of building, Journal of Computing in Civil Engi-neering 14(3): 151–159. http://dx.doi.org/10.1061/(ASCE)0887-3801(2000)14: 3(151)
Sambasivan, M.; Soon, Y. W. 2007. Causes and effects of de-lays in Malaysian construction industry, International Journal of Project Management 25(5): 517–526. http://dx.doi.org/10.1016/j.ijproman.2006.11.007
Sanvido, V. E.; Norton, K. J. 1994. Integrated design-process model, Journal of Management in Engineering 10(5): 55–62. http://dx.doi.org/10.1061/(ASCE)9742-597X(1994) 10:5(55)
Senthilkumar, V.; Varghese, K.; Chandran, A. 2010. A web-based system for design interface management of con-struction projects, Automation in Construction 19(2): 197–212. http://dx.doi.org/10.1016/j.autcon.2009.10.007
Sweis, G.; Sweis, R.; Abu Hammad, A.; Shboul, A. 2008. De-lays in construction projects: the case of Jordan, Interna-tional Journal of Project Management 26(6): 665–674. http://dx.doi.org/10.1016/j.ijproman.2007.09.009
Tonge, J.; Moore, S. A. 2007. Importance-satisfaction analysis for marine-park hinterlands: a Western Australian case study, Tourism Management 28(3): 768–776. http://dx.doi.org/10.1016/j.tourman.2006.05.007
Toor, S. U. R.; Ogunlana, S. O. 2008. Problems causing delays in major construction projects in Thailand, Construction Management and Economics 26(4): 395–408. http://dx.doi.org/10.1080/01446190801905406
Wang, W. C.; Lin, Y. H.; Lin, C. L.; Chuang, C. H.; Lee, M. T. 2012. DEMATEL-based model to improve performance in a matrix organization, Expert Systems with Applications 39(5): 4978–4986. http://dx.doi.org/10.1016/j.eswa.2011.10.016
Wang, W. C.; Liu, J. J.; Liao, T. S. 2006. Modeling of design iterations through simulation, Automation in Construction 15(5): 589–603. http://dx.doi.org/10.1016/j.autcon.2005.07.010
Wei, P. R. 2005. A study of delay causes analysis in the plan-ning and design phases of public construction projects: MS Thesis, Chunghua University, Taiwan.
Wu, H. H.; Tsai, Y. N. 2011. A DEMATEL method to evaluate the causal relations among the criteria in auto spare parts industry, Applied Mathematics and Computation 218(5): 2334–2342. http://dx.doi.org/10.1016/j.amc.2011.07.055
Wu, W. W.; Lee, Y. T. 2007. Developing global managers’ competencies using the fuzzy DEMATEL method, Expert Systems with Applications 32(2): 499–507. http://dx.doi.org/10.1016/j.eswa.2005.12.005
Dow
nloa
ded
by [
Nat
iona
l Chi
ao T
ung
Uni
vers
ity ]
at 0
4:28
10
July
201
4

W.-C. Wang et al. Application of importance-satisfaction analysis and influence-relations map…
510
Yang, J. B.; Wei, P. R. 2010. Causes of delay in the planning and design phases for construction projects, Journal of Architectural Engineering 16(2): 80–83. http://dx.doi.org/10.1061/(ASCE)1076-0431(2010)16:2(80)
Yang, J. B.; Yang, C. C.; Kao, C. K. 2010. Evaluating schedule delay causes for private participating public construction works under the build-operate-transfer model, Interna-tional Journal of Project Management 28(6): 569–579. http://dx.doi.org/10.1016/j.ijproman.2009.10.005
Wei-Chih WANG is a Professor in the Department of Civil Engineering at National Chiao Tung University, Taiwan. He received his PhD degree from the University of California at Berkeley in 1996. He is a member of the Construction Man-agement Association of Taiwan. His research interests include construction procurement, high-tech facility project man-agement, and construction simulation. Chia-Li LIN is an Assistant Professor in the Department of Recreation Management, Shih Chien University, Taiwan. He received his PhD degree from the Institute of Management of Technology at National Chiao Tung University. His re-search interests include technology policy and cluster spillover, product evaluation and service selection, service devel-opment strategies of 4C, electric commerce and service, information behavior and social networking service. Shih-Hsu WANG is an Assistant Professor in the Department of Civil Engineering at ROC Military Academy, Taiwan. He received his PhD degree from the Department of Civil Engineering at National Chiao Tung University. His research interests include national competitiveness and construction consultant service. Jang-Jeng LIU is a PhD candidate in the Department of Civil Engineering at National Chiao Tung University, Taiwan. Currently, he is also working as an engineering research at the National Synchrotron Radiation Research Center in Tai-wan. His research interests include construction simulation and scheduling of design projects. Ming-Tsung LEE is working as an Engineering Researcher at the National Synchrotron Radiation Research Center in Taiwan. He received his MS degree from the Department of Civil Engineering at National Chiao Tung University, Tai-wan. His research interests include building information modelling and financial management.
Dow
nloa
ded
by [
Nat
iona
l Chi
ao T
ung
Uni
vers
ity ]
at 0
4:28
10
July
201
4
Top Related
Copyright © 2022 FDOKUMEN

