


Bahasa
Halaman
Hukum

�����������������
Citation: Sann, R.; Lai, P.-C.; Liaw,
S.-Y.; Chen, C.-T. Predicting Online
Complaining Behavior in the
Hospitality Industry: Application of
Big Data Analytics to Online Reviews.
Sustainability 2022, 14, 1800. https://
doi.org/10.3390/su14031800
Academic Editor: Hak-Seon Kim
Received: 11 January 2022
Accepted: 31 January 2022
Published: 4 February 2022
Publisher’s Note: MDPI stays neutral
with regard to jurisdictional claims in
published maps and institutional affil-
iations.
Copyright: © 2022 by the authors.
Licensee MDPI, Basel, Switzerland.
This article is an open access article
distributed under the terms and
conditions of the Creative Commons
Attribution (CC BY) license (https://
creativecommons.org/licenses/by/
4.0/).
sustainability
Article
Predicting Online Complaining Behavior in the HospitalityIndustry: Application of Big Data Analytics to Online ReviewsRaksmey Sann 1,* , Pei-Chun Lai 2, Shu-Yi Liaw 3 and Chi-Ting Chen 4,*
1 Department of Tourism Innovation Management, Faculty of Business Administration and Accountancy,Khon Kaen University, Khon Kaen 40000, Thailand
2 Department of Hotel and Restaurant Management, National Pingtung University of Science and Technology,Pingtung 912, Taiwan; [email protected]
3 Department of Business Administration, National Pingtung University of Science and Technology,Pingtung 912, Taiwan; [email protected]
4 Department of Hospitality Management, School of Tourism, Ming Chuan University,Taoyuan City 333, Taiwan
* Correspondence: [email protected] (R.S.); [email protected] (C.-T.C.)
Abstract: Purpose: This study aims to enrich the published literature on hospitality and tourismby applying big data analytics and data mining algorithms to predict travelers’ online complaintattributions to significantly different hotel classes (i.e., higher star-rating and lower star-rating). De-sign/methodology/approach: First, 1992 valid online complaints were manually obtained from over350 hotels located in the UK. The textual data were converted into structured data by utilizing contentanalysis. Ten complaint attributes and 52 items were identified. Second, a two-step analysis approachwas applied via data-mining algorithms. For this study, sensitivity analysis was conducted to identifythe most important online complaint attributes, then decision tree models (i.e., the CHAID algorithm)were implemented to discover potential relationships that might exist between complaint attributes inthe online complaining behavior of guests from different hotel classes. Findings: Sensitivity analysisrevealed that Hotel Size is the most important online complaint attribute, while Service Encounter andRoom Space emerged as the second and third most important factors in each of the four decision treemodels. The CHAID analysis findings also revealed that guests at higher-star-rating hotels are mostlikely to leave online complaints about (i) Service Encounter, when staying at large hotels; (ii) Valuefor Money and Service Encounter, when staying at medium-sized hotels; (iii) Room Space and ServiceEncounter, when staying at small hotels. Additionally, the guests of lower-star-rating hotels are mostlikely to write online complaints about Cleanliness, but not Value for Money, Room Space, or ServiceEncounter, and to stay at small hotels. Practical implications: By utilizing new data-mining algo-rithms, more profound findings can be discovered and utilized to reinforce the strengths of hoteloperations to meet the expectations and needs of their target guests. Originality/value: The study’smain contribution lies in the utilization of data-mining algorithms to predict online complainingbehavior between different classes of hotel guests.
Keywords: online complaining behavior; decision trees; hotel class; online complaining attributes;data mining algorithms; big data analytics
1. Introduction
Travelers today increasingly book their holiday accommodation online. An increasein the preference for online booking has coincided with an increase in the power andpersuasiveness of online peer reviews [1–4]. Customers consider peer reviews more inde-pendent and trustworthy and tend to rely on them more than information provided bybusiness entities [5]. With the rapid growth of online communication platforms and theexplosion of the bidirectional exchange of information on consumer products and services,online reviews, notifications, opinions, and recommendations have become a source of real
Sustainability 2022, 14, 1800. https://doi.org/10.3390/su14031800 https://www.mdpi.com/journal/sustainability
Sustainability 2022, 14, 1800 2 of 22
opportunities and challenges in the tourism and hospitality industry [6]. In other words,consumers consider the content of online reviews more useful than recommendations fromother online information sources [7]. Online reviews are particularly influential in thetourism sector and the hotel industry [8].
Shifting through the vast number of easily accessible online recommendations, anddeciding which ones to trust, represents one of the most challenging tasks for customerswhen choosing a hotel or restaurant. Customers tend to select a subset of reviews to reducethe set of possible alternatives. When reading online reviews, customers evaluate the overallrating at 66%, review valence (whether it is positive or negative) at 63%, review detail at 62%,and reviewer’s status at 40% as being the top four factors for consideration [9]. In terms ofreview valence (positive and negative), consumers more easily credit negative than positiveinformation, according to the theory of negative effects; thus, negative information canhave a stronger influence on purchase decisions [10]. Additionally, online reviews have thepower to procure 30 times more consumer commitments [11].
An interconnected world facilitates the spread of guests’ dissatisfaction through onlinerather than face-to-face means. Understanding guests’ (dis)satisfaction should reveal themain causes of guests’ complaints. To do so, it is vital to discriminate among customers’preferences according to guest categories at the level of individual hotel attributes [12]. Dis-cussing the differences between guests’ preferences at higher-star-rating and lower-star-ratinghotels, Liu et al. (2017) [12] remarked that some hotels with fewer stars can outperformhotels that have more stars, with regard to guests’ ratings. In terms of customer complaints,Hu, Zhang, Gao, & Bose (2019) [13] found that facility problems or cleanliness are the majorsources of guests’ dissatisfaction for lower-star-rating hotels, while service-related problemsand overpricing are the major sources of guests’ complaints about higher-star-rating hotels.Therefore, it is very important for hoteliers to obtain an in-depth understanding of how dif-ferent hotel-class guests focus on different hotel attributes. Analyzing real-world data (i.e.,complaint reviews) through decision tree (DT) algorithms allows researchers to discoversignificant empirical and practical information. This study follows the emerging style ofresearch that takes advantage of user-generated data by looking at complaint reviews andattempting to understand online complaining behavior (OCB), as it differs between guestsat higher star-rated and lower star-rated hotels. Furthermore, this research aims to predicttravelers’ online complaining behavior in different hotel sectors.
Machine learning algorithms have been successfully applied to many topics includingengineering [14], firm performance [15], complaints management [16], shopping prefer-ences [17], customer complaints in the mobile telecom industry [18], health insurance [19],drought monitoring [20], review helpfulness [21], traffic sign comprehension [22], ionogramidentification [23], handling stakeholder conflict [24], medical diagnosis [25], a design for acircular economy [26] and web mining, document analysis, and scientific data analysis [27].However, regarding the prediction of guest OCB in the hotel industry, there is far less dis-cussion; therefore, this research attempts to extend and amplify the tourism and hospitalityliterature by using machine learning algorithm analysis.
These specific data-mining algorithms (DMAs) have not been broadly implemented toexplore hotel-rating guest complaint behavior in the online environment. Big data analyticspermits us to explore guest OCB from different kinds of hotels in depth, particularly in thehotel performance context. Specifically, the main purposes of this study are:
i To explore the literature related to big data analytics and data mining with regard tothe fields of hospitality and tourism;
ii To investigate the best performance model in predicting OCB in the fields of hospitalityand tourism;
iii To predict the complaint attributions that significantly differ, from various hotel classes(i.e., higher star-rating and lower star-rating) of travelers in terms of their OCB.
A total of 1992 valid individual online complaints from over 350 hotels, located inthe United Kingdom (UK) and considered representative in their category, were fed intodata-mining algorithms. First, to convert unstructured textual content into structured data,
Sustainability 2022, 14, 1800 3 of 22
qualitative content analysis was conducted. This process generated the analytical variablesof the new qualification algorithms. Ten complaint attributes and 52 specific items wereidentified. Then, to further the aims of this study, two kinds of algorithms, a sensitivityalgorithm and DT (i.e., the CHAID Algorithm), were linked together. The study objectiveswere three-fold. First, this research attempted to evaluate the performance of predictionmodels by employing different classification models (e.g., C&R tree, QUEST, CHAID, andC5.0). CHAID showed the best performance in predicting guest OCB; therefore, CHAIDwas employed in this study experiment. Then, sensitivity analysis was performed toidentify the most important online complaining attributes. Finally, the CHAID procedure,illustrated as a decision tree, was utilized to actualize this analysis in the case of thecomplaint attributions significantly differing across various hotel classes. The analyses ofthis mix of qualitative content analysis and quantitative algorithms reinforced the processof data triangulation.
The study’s main contribution lies in the utilization of DMAs to predict the OCBbetween different classes of hotel guests. Additionally, this study seems to constitute oneof the first attempts in the literature to relate big data analytics and data mining to the fieldof hospitality and the tourism industry; other work has been limited to only a handfulof prior studies [16–18,21]. The results of this study should benefit both researchers andpractitioners since determining the guests’ complaint behavior using real-world data (i.e.,negative reviews) can help prevent further complaints and improve a business’s reputation.Thus, the identification of factors (i.e., online complaint attributes) that can accuratelypredict the guests’ OCB is of great interest.
2. Theoretical Background and Research Scope2.1. Online Review and Complaining Behavior in the Hospitality Industry
According to a 2011 survey by the Tourism Industry Wire Organization, 60% of U.S.travelers take online suggestions into account when booking a vacation in part. One mainreason behind this is that travel websites provide a means for customers to readily discoverwhat other consumers think about hotels and restaurants, as well as other tourism productsor services (as cited in [7,28]). Previous studies have argued that compared to positivereviews, customers give more weight to negative reviews in both reputation-building anddecision-making tasks [6,10,29–31]. Customer complaints behavior is most often consideredto be a set of multiple responses emerging as a result of purchase dissatisfaction [32,33].However, the “locus of causality” or complaint attribution is one of the least-studied top-ics within customer complaint behavior-related research in the hospitality and tourismindustries [34]. Practitioners will benefit from understanding these causes of guests’ com-plaints in terms of problem-solving, guest satisfaction enhancement, and service qualityimprovement [35,36].
Furthermore, negative reviews or comments may lead to a negative impact on allaspects of the business [37]. For instance, guests complain about their hotels on issues rang-ing from poor service delivery to dated or inadequate décor [31]. Fernandes and Fernandes(2018) reported that hotel guests tend to complain more than once. This indicates that chainsof complaints do occur in the hospitality industry. An unsatisfied customer often makesa series of complaints. This study aims to investigate how an online review negativelyimpacts consumer behavior so that hoteliers can improve service quality, referencing acomplaint route through electronic word-of-mouth (eWOM).
2.2. Big Data
Big data analytics, as a research paradigm, uses a variety of data sources to makeinferences and predictions about reality [38]. Textual data or content from the web offersa huge shared cognitive and cultural context, and advanced language processing andmachine learning capabilities have been applied to this web data to analyze various do-mains [39]. Big data analytics is defined as “the extraction of hidden insight about consumerbehavior from big data and the exploitation of that insight through advantageous interpre-
Sustainability 2022, 14, 1800 4 of 22
tations” [40], p. 897. The immensity of data generated, its relentless rapidity, and diverserichness are all transforming marketing decision-making [40]. The aforementioned dimen-sions help define big data via three distinctive features: volume, velocity, variety [40,41], andtwo additional essential characteristics when collecting, analyzing, and extracting insightsfrom big data: veracity and value [40]. Volume refers to the quantity of data, velocity describesthe speed of data processing, and variety means the type of data [41]. Meanwhile, veracityrefers to data quality (e.g., accuracy), and value describes clean, useful data that excludes oreliminates unimportant and irrelevant data [40]. By utilizing big data analytics as researchmethodology, researchers are able to work backward, starting with data collection, thenanalyzing it in order to gain insights. Despite the advantages and potential of big dataanalytics, very few recently published studies apply this approach to the tourism andhospitality industry [41]. This study will try to fill that gap.
2.3. Data Mining
Recently, some researchers have been utilizing data mining (DM) procedures in con-ducting their studies on the tourism and hospitality industry. For instance, [42] Golmoham-madi, Jahandideh, and O’Gorman (2012) studied the application of DM, specifically usingDT to model tourists’ behavior in the online environment. DM has also been studied interms of its importance and influence in the hotel marketing field, and how this approachcan help companies to reach their potential customers by understanding their behavior [43].Thus, DM techniques that focus on an analysis of the textual contents from travelers’ re-views/feedback have been used in a number of published papers [43]. With the help ofa DM approach, hoteliers can receive invaluable information that enables them to gainbetter insight regarding customer behavior and to develop effective customer retentionstrategies [42].
While data retrieved from customer feedback is usually unstructured textual data,most DM approaches deal only with structured data. Retrieved data is often voluminousbut of low value and has little direct usefulness in its raw form. It is the hidden informationin the data that has value [44,45]. Retrieved data must be reorganized and stored accordingto clear field structures before DM can be carried out efficiently and accurately [46]. Usingdifferent techniques, DM can identify nuggets of information in bodies of data. It extractsinformation that can be used in areas such as decision support, prediction, forecasts,and estimation. Few researchers have studied new artificial intelligence (AI) algorithmsand mining techniques for unstructured data and information, however, resulting inthe frequent loss of valuable customer-related information [46]. DM’s advantage lies incombining researcher knowledge (or expertise) of the data with advanced, active analysistechniques in which algorithms identify the underlying relationships and features inthe data.
The process of DM generates models from historical data that are later used forpredictions, pattern detection, and more. DM techniques offer feasible methods by whichto detect causal relationships, specify which variables have significant dependence onthe problem of interest, and expand models that forecast the future [20]. DM can beclassified into three types of modeling methods: (i) classification, (ii) association, and(iii) segmentation [47]. In some contexts, DM can be termed as knowledge discovery indatabases (KDD) since “it generates hidden and interesting patterns, and it also comprisesthe amalgamation of methodologies from various disciplines, such as statistics, neuralnetworks, database technology, machine learning and information retrieval, etc.” [48],p. 645. This study furthers its aims by applying DT algorithms. The following sub-sectionsbriefly review the main components of the proposed method.
2.4. Decision Tree
DT is one of the most popular DM techniques. With the objective of building classifica-tion models, DT can predict the value of a target attribute, based on the input attributes [22].DT constructs a tree structure using three components: internal nodes, branches, and
Sustainability 2022, 14, 1800 5 of 22
leaves [21]. Each internal node denotes one input variable [22], each branch is set to equala number of possible values of the input variable [49], and each leaf node is the terminalnode that holds a class label [23] or a value of a target attribute [22]. In DT, the influentialfactors in determining the value of the target attribute are the primary splitters that areconnected with the leaf nodes [22]. Due to DT’s many advantages—for instance, it is easyto understand and interpret, needs little data preparation, can handle both numerical andcategorical data, performs very well with a large dataset in a short time, and, most impor-tantly, can create excellent visualizations of results and their relationships—DT has becomeincreasingly prevalent in DM [15]. There are many specific DT algorithms; however, theC5.0, C&R tree, QUEST, and CHAID algorithms are the most widely used.
2.4.1. C5.0 Algorithm
Developed by Quinlan in 1993, C5.0 is one of the most popular DT inducers, based onthe ID3 (iterative dichotomiser 3) classification algorithm [19]. The C5.0 model splits thesample based on the field that provides the maximum information gain at each level [47].The input can be either categorical or continuous, but the output or target field must becategorical. C5.0 is significantly faster, has superior memory performance than other DTalgorithms, and can also produce more accurate rules [14]. It also uses a pruning strategy(e.g., pre-pruning and post-pruning methods) in which a branch is pruned to establish aDT, starting from the top level of the tree [15,19].
2.4.2. CHAID Algorithm
The chi-squared automatic interaction detector (CHAID) is “a powerful technique forpartitioning data into more homogeneous groups” [50], p. 125. CHAID is a highly efficientstatistical technique for segmentation, or tree growing, developed by Kass in 1980 [51].CHAID makes predictions in the same way for regression analysis and classification, as wellas detecting interactions between variables [15]. CHAID uses multi-level splits [52], whichcan generate nonbinary trees, meaning that some trees have more than two branches [47].It works for every type of variable due to its acceptance of both case weights and frequencyvariables [51]. More importantly, CHAID handles missing values by treating them all as asingle valid category.
2.4.3. QUEST Algorithm
The quick, unbiased, efficient statistical tree algorithm (QUEST) is a relatively newbinary tree-growing algorithm for classification and DM [51]. QUEST is similar to the clas-sification and regression trees (C&RT) algorithm [15]; however, it is designed to reduce theprocessing time required for large C&RT analyses, while also reducing the tendency foundin classification tree methods to favor inputs that allow more splits [47]. QUEST deals withfield selection and split-point selection separately. The univariate split in QUEST performsunbiased field selections; that is, all predictor fields are equally informative with respectto the target field. QUEST selects any of the predictor fields with equal probability [51].It produces unmanageable trees, but by applying automatic cost-complexity pruning, itminimizes their size [15]. Input fields in QUEST can be numeric ranges (when continuous),but the target field must be categorical, and all splits are binary [47].
2.4.4. C&RT Algorithm
The C&RT algorithm splits the tree on a binary level into only two subgroups [52]and generates a DT that allows researchers to predict or classify future observations [47].The C&RT algorithm was created by Breiman, Friedman, Olshen, and Stone in 1984 [53].The method uses recursive partitioning: the data is partitioned into two subsets so that therecords within each subset are more homogeneous than in the previous subset. Then, eachof those two subsets is split again, and the process repeats until the homogeneity criterionis reached or until some other stopping criterion is satisfied (or considered “pure”) [54].The same predictor field may be used many times at different levels in the tree. The
Sustainability 2022, 14, 1800 6 of 22
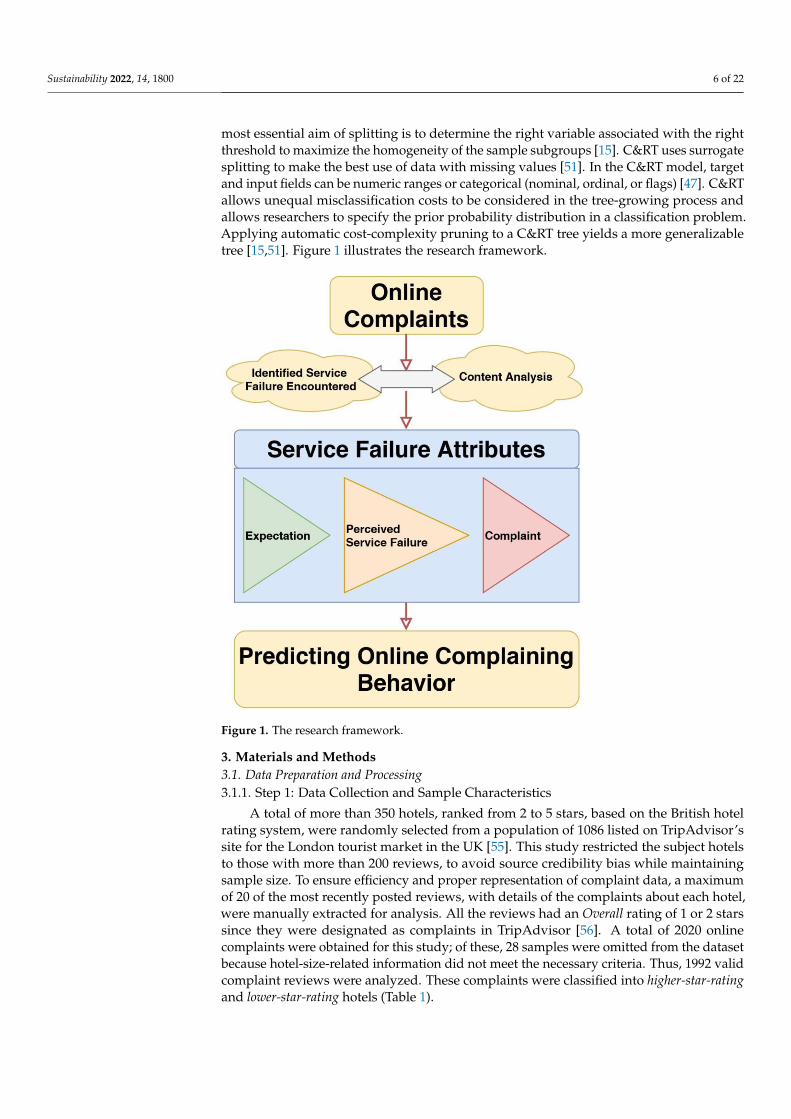
most essential aim of splitting is to determine the right variable associated with the rightthreshold to maximize the homogeneity of the sample subgroups [15]. C&RT uses surrogatesplitting to make the best use of data with missing values [51]. In the C&RT model, targetand input fields can be numeric ranges or categorical (nominal, ordinal, or flags) [47]. C&RTallows unequal misclassification costs to be considered in the tree-growing process andallows researchers to specify the prior probability distribution in a classification problem.Applying automatic cost-complexity pruning to a C&RT tree yields a more generalizabletree [15,51]. Figure 1 illustrates the research framework.
Sustainability 2022, 14, x FOR PEER REVIEW 6 of 24
2.4.4. C&RT Algorithm. The C&RT algorithm splits the tree on a binary level into
only two subgroups [52] and generates a DT that allows researchers to predict or classify
future observations [47]. The C&RT algorithm was created by Breiman, Friedman, Olshen,
and Stone in 1984 [53]. The method uses recursive partitioning: the data is partitioned into
two subsets so that the records within each subset are more homogeneous than in the
previous subset. Then, each of those two subsets is split again, and the process repeats
until the homogeneity criterion is reached or until some other stopping criterion is
satisfied (or considered “pure”) [54]. The same predictor field may be used many times at
different levels in the tree. The most essential aim of splitting is to determine the right
variable associated with the right threshold to maximize the homogeneity of the sample
subgroups [15]. C&RT uses surrogate splitting to make the best use of data with missing
values [51]. In the C&RT model, target and input fields can be numeric ranges or
categorical (nominal, ordinal, or flags) [47]. C&RT allows unequal misclassification costs
to be considered in the tree-growing process and allows researchers to specify the prior
probability distribution in a classification problem. Applying automatic cost-complexity
pruning to a C&RT tree yields a more generalizable tree [15,51]. Figure 1 illustrates the
research framework.
Figure 1. The research framework.
3. Materials and Methods
3.1. Data Preparation and Processing
3.1.1. Step 1: Data Collection and Sample Characteristics
A total of more than 350 hotels, ranked from 2 to 5 stars, based on the British hotel
rating system, were randomly selected from a population of 1086 listed on TripAdvisor’s
Figure 1. The research framework.
3. Materials and Methods3.1. Data Preparation and Processing3.1.1. Step 1: Data Collection and Sample Characteristics
A total of more than 350 hotels, ranked from 2 to 5 stars, based on the British hotelrating system, were randomly selected from a population of 1086 listed on TripAdvisor’ssite for the London tourist market in the UK [55]. This study restricted the subject hotelsto those with more than 200 reviews, to avoid source credibility bias while maintainingsample size. To ensure efficiency and proper representation of complaint data, a maximumof 20 of the most recently posted reviews, with details of the complaints about each hotel,were manually extracted for analysis. All the reviews had an Overall rating of 1 or 2 starssince they were designated as complaints in TripAdvisor [56]. A total of 2020 onlinecomplaints were obtained for this study; of these, 28 samples were omitted from the datasetbecause hotel-size-related information did not meet the necessary criteria. Thus, 1992 validcomplaint reviews were analyzed. These complaints were classified into higher-star-ratingand lower-star-rating hotels (Table 1).
Sustainability 2022, 14, 1800 7 of 22
Table 1. Breakdown of samples for each hotel category.
Hotel Category Frequency %
Hotel SizeLarge Hotel 208 10.4
Medium Hotel 825 41.4Small Hotel 959 48.1
Hotel Star-Rating2-Star 297 14.93-Star 547 27.54-Star 603 30.35-Star 545 27.4
Hotel ClassHigher Star-Rating 1148 57.6Lower Star-Rating 844 42.4
Total 1992 100.0
3.1.2. Step 2: Coding of Online Complaining Attributes
First, each online complaint was obtained manually from each hotel website and storedin a .doc file for textual data, and a .xls file for numerical data. The unstructured textualdata needed to be transformed into meaningful knowledge via a decoding mechanism [57].Therefore, qualitative content analysis was applied to convert unstructured textual contentinto structured data [46]. Second, coding categories were developed to conduct the manualcoding content analysis of texts. Two independent coders added, removed, or merged thecoding items and variables to avoid overlapping themes and reduce content ambiguity.Then, the coding subjects were independently categorized into various complaint attributesand items. This study’s researchers assigned codes manually in order to capture theidiosyncrasies of the reviews and account for nuances [58]. Reviews often contributed tomore than one attribute and/or item. Attributes and items that were not mentioned in thereviews were coded as NO. Finally, another categorical data file was created for testingalgorithm models by utilizing the above coding attributes. In total, this study identified 10complaint attributes. All the attributes were then exported as reports in an .xls data formatfor later use in DT analyses. Table 2 depicts the description of complaint variables andexamples of coding details.
3.1.3. Step 3: Coding Reliability Testing
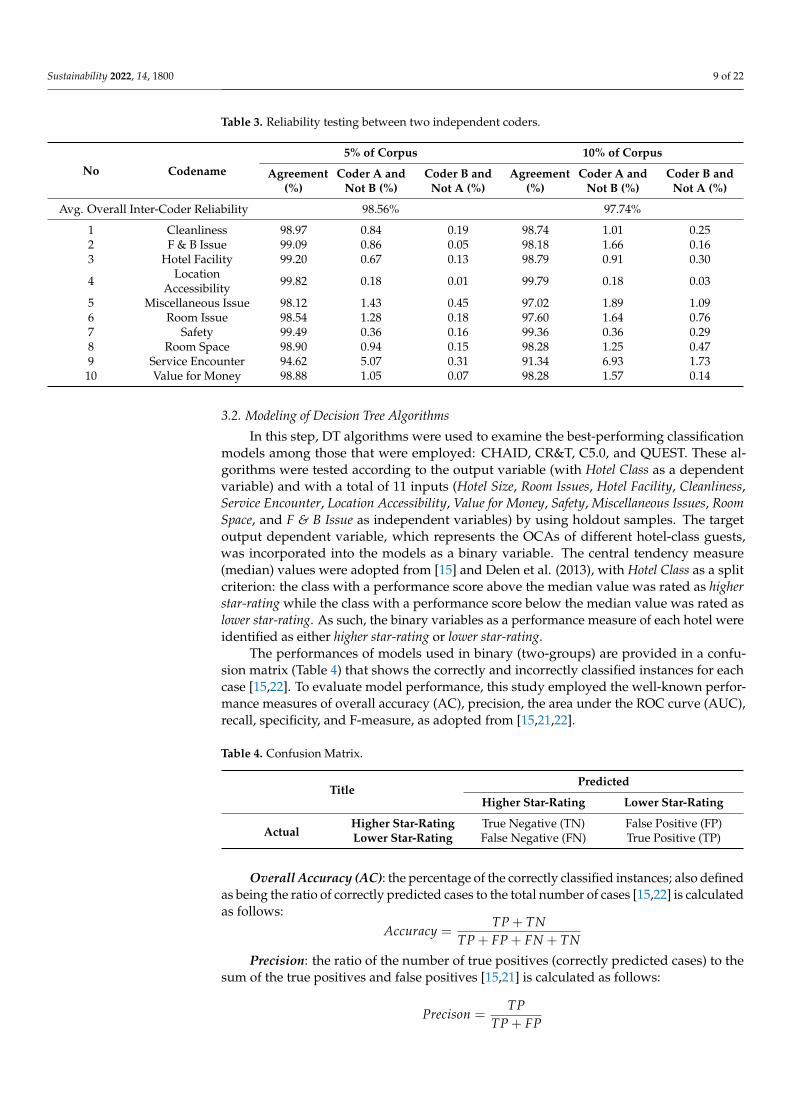
Lombard, Snyder-Duch, and Bracken (2002) [59] and Gerdt et al. (2019) [58] suggestthat acceptable coding results require two independent coders. This study followed Cenniand Goethals’s (2017) two-step inter-code reliability test [60]. The inter-coder reliabilitywas determined utilizing the percentage of agreement (from 0.00—no agreement, to 1.00—perfect agreement). Two inter-code reliability tests were conducted: the first after coding5% of the full set of coded reviews, and the second, after coding another 10%. Both codinggrids were >90% in agreement, which was judged acceptable (Table 3).
Sustainability 2022, 14, 1800 8 of 22
Table 2. The description of the complaint variables.
Source Data Type Variables Coding Descriptions
Hotel Numerical Rooms The amount of hotel rooms.Hotel Categorical Hotel Size Small (less than 99 rooms), Medium (100–299 rooms), Large (300 room-ups)Hotel Numerical Hotel Star Rating The average of hotel ratings (2 to 5 stars)Hotel Categorical Hotel Class Higher star-rating (4 to 5 stars) and lower star-rating (2 to 3 stars)
Coding Categorical Service EncounterUnfriendly Staff, Impoliteness, Poor Customer Service, Lack of Responsiveness, Check-in and Check-out
Matters, Reservation Difficulties, Insufficient Information, Less Social Interaction, Poor Courtesy,Poor Competency, Personal Bias
Coding Categorical Room Issue Inadequate Amenities, Poor Layout, Few Welcoming Extra, Poor Décor/Design, Less LightingCoding Categorical Hotel Facility Wi-Fi Problem, Insufficient Public Facilities, Dated Hotel/BuildingCoding Categorical Cleanliness Poor Cleanliness in General, Bedroom Uncleanliness, Poor Public Areas Cleanliness, Filthy Toilet
Coding Categorical LocationAccessibility
Far from City Center/CBD *, Far from Public Transportation, Away from Attractions, Far from Airport,Inconvenient Location, Poor Accessibility
Coding Categorical Value for Money Unreasonable Price for QP *, Expensive Room Price, Food Overpriced, Not Value for Money, Expensivein General
Coding Categorical Safety Less Safe, Not Feeling Safe, Unsafe NeighborhoodCoding Categorical Room Space Small Room Space, Small Toilet Space
Coding Categorical F & B Issue Poor Dining Environment, Lack of Special Food Service, No Innovative Menu, Limited Variety,Disappointing Breakfast, Poor Upselling of RFF *, Bad Tasty Food
Coding Categorical Miscellaneous Issue Annoying Insects, Uncomfortable Bedding, Disgusting Smell, Lack of Facility Maintenance,Noise, Bad Outside Views
* Note: CBD: commercial business district; QP: quality provided; RFF: recommendation for food.
Sustainability 2022, 14, 1800 9 of 22
Table 3. Reliability testing between two independent coders.
No Codename
5% of Corpus 10% of Corpus
Agreement(%)
Coder A andNot B (%)
Coder B andNot A (%)
Agreement(%)
Coder A andNot B (%)
Coder B andNot A (%)
Avg. Overall Inter-Coder Reliability 98.56% 97.74%
1 Cleanliness 98.97 0.84 0.19 98.74 1.01 0.252 F & B Issue 99.09 0.86 0.05 98.18 1.66 0.163 Hotel Facility 99.20 0.67 0.13 98.79 0.91 0.30
4 LocationAccessibility 99.82 0.18 0.01 99.79 0.18 0.03
5 Miscellaneous Issue 98.12 1.43 0.45 97.02 1.89 1.096 Room Issue 98.54 1.28 0.18 97.60 1.64 0.767 Safety 99.49 0.36 0.16 99.36 0.36 0.298 Room Space 98.90 0.94 0.15 98.28 1.25 0.479 Service Encounter 94.62 5.07 0.31 91.34 6.93 1.7310 Value for Money 98.88 1.05 0.07 98.28 1.57 0.14
3.2. Modeling of Decision Tree Algorithms
In this step, DT algorithms were used to examine the best-performing classificationmodels among those that were employed: CHAID, CR&T, C5.0, and QUEST. These al-gorithms were tested according to the output variable (with Hotel Class as a dependentvariable) and with a total of 11 inputs (Hotel Size, Room Issues, Hotel Facility, Cleanliness,Service Encounter, Location Accessibility, Value for Money, Safety, Miscellaneous Issues, RoomSpace, and F & B Issue as independent variables) by using holdout samples. The targetoutput dependent variable, which represents the OCAs of different hotel-class guests,was incorporated into the models as a binary variable. The central tendency measure(median) values were adopted from [15] and Delen et al. (2013), with Hotel Class as a splitcriterion: the class with a performance score above the median value was rated as higherstar-rating while the class with a performance score below the median value was rated aslower star-rating. As such, the binary variables as a performance measure of each hotel wereidentified as either higher star-rating or lower star-rating.
The performances of models used in binary (two-groups) are provided in a confu-sion matrix (Table 4) that shows the correctly and incorrectly classified instances for eachcase [15,22]. To evaluate model performance, this study employed the well-known perfor-mance measures of overall accuracy (AC), precision, the area under the ROC curve (AUC),recall, specificity, and F-measure, as adopted from [15,21,22].
Table 4. Confusion Matrix.
TitlePredicted
Higher Star-Rating Lower Star-Rating
ActualHigher Star-Rating True Negative (TN) False Positive (FP)Lower Star-Rating False Negative (FN) True Positive (TP)
Overall Accuracy (AC): the percentage of the correctly classified instances; also definedas being the ratio of correctly predicted cases to the total number of cases [15,22] is calculatedas follows:
Accuracy =TP + TN
TP + FP + FN + TNPrecision: the ratio of the number of true positives (correctly predicted cases) to the
sum of the true positives and false positives [15,21] is calculated as follows:
Precison =TP
TP + FP
Sustainability 2022, 14, 1800 10 of 22
Recall/Sensitivity/True Positive Rate: the ratio of the number of true positives to thesum of the true positives and the false negatives [15,21] is calculated as follows:
Recall =TP
TP + FN
Specificity/True Negative Rate: shows the ratio of the number of true negatives to thesum of the true negatives and false positives [15,22] is calculated as follows:
Speci f icity =TN
TN + FP
F-measure: the measure of the precision-recall curve that takes the harmonic mean ofthe precision and recall performance measures [21,22]. A high F-measure value demon-strates a high classification quality [21]:
F−measure = 2× Precison× RecallPrecision + Recall
Area Under Curve (AUC): a plot of the true positive rate (e.g., recall) against the falsepositive rate at various threshold settings [22]; for example, “Excellent” if AUC ≥ 0.9;“Good” if 0.9 > AUC ≥ 0.8; “Fair” if 0.8 > AUC ≥ 0.7; “Poor” if 0.7 > AUC ≥ 0.6; and “VeryPoor” if AUC < 0.6 [21].
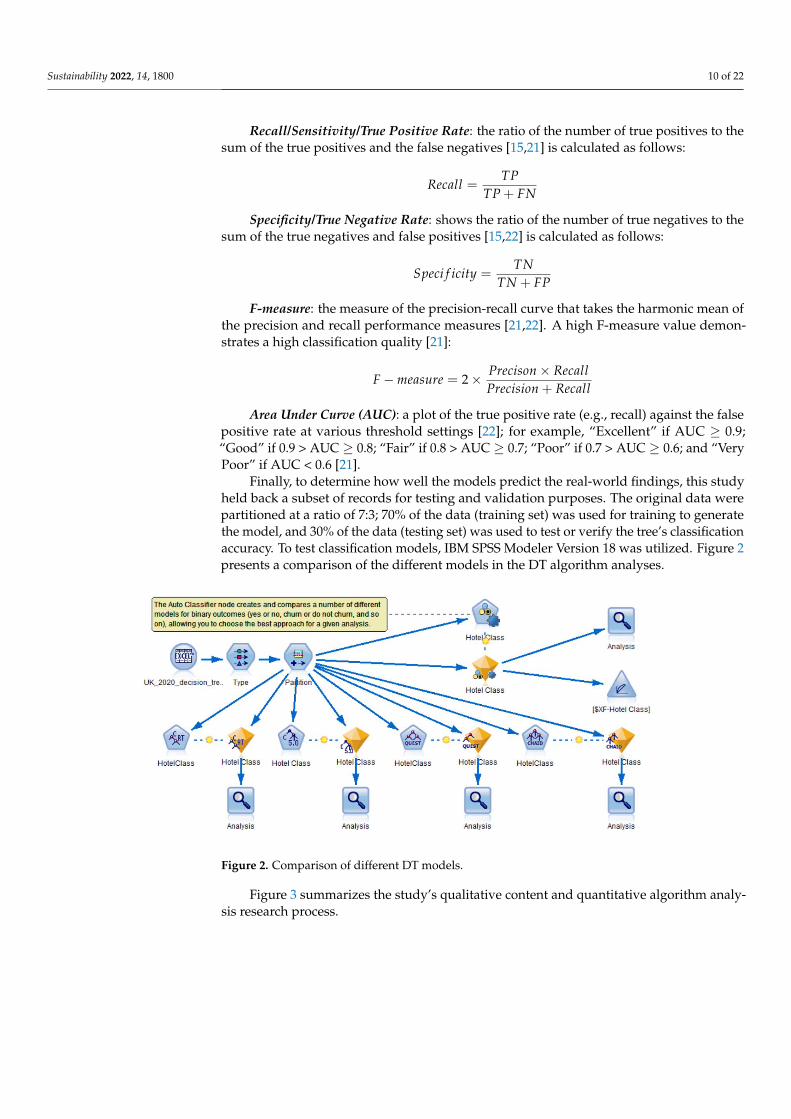
Finally, to determine how well the models predict the real-world findings, this studyheld back a subset of records for testing and validation purposes. The original data werepartitioned at a ratio of 7:3; 70% of the data (training set) was used for training to generatethe model, and 30% of the data (testing set) was used to test or verify the tree’s classificationaccuracy. To test classification models, IBM SPSS Modeler Version 18 was utilized. Figure 2presents a comparison of the different models in the DT algorithm analyses.
Sustainability 2022, 14, x FOR PEER REVIEW 10 of 24
Overall Accuracy (AC): the percentage of the correctly classified instances; also
defined as being the ratio of correctly predicted cases to the total number of cases [15,22]
is calculated as follows:
𝐴𝑐𝑐𝑢𝑟𝑎𝑐𝑦 =𝑇𝑃 + 𝑇𝑁
𝑇𝑃 + 𝐹𝑃 + 𝐹𝑁 + 𝑇𝑁
Precision: the ratio of the number of true positives (correctly predicted cases) to the
sum of the true positives and false positives [15,21] is calculated as follows:
𝑃𝑟𝑒𝑐𝑖𝑠𝑜𝑛 =𝑇𝑃
𝑇𝑃 + 𝐹𝑃
Recall/Sensitivity/True Positive Rate: the ratio of the number of true positives to the
sum of the true positives and the false negatives [15,21] is calculated as follows:
𝑅𝑒𝑐𝑎𝑙𝑙 =𝑇𝑃
𝑇𝑃 + 𝐹𝑁
Specificity/True Negative Rate: shows the ratio of the number of true negatives to
the sum of the true negatives and false positives [15,22] is calculated as follows:
𝑆𝑝𝑒𝑐𝑖𝑓𝑖𝑐𝑖𝑡𝑦 =𝑇𝑁
𝑇𝑁 + 𝐹𝑃
F-measure: the measure of the precision-recall curve that takes the harmonic mean of
the precision and recall performance measures [21,22]. A high F-measure value
demonstrates a high classification quality [21]:
𝐹 − 𝑚𝑒𝑎𝑠𝑢𝑟𝑒 = 2 ×𝑃𝑟𝑒𝑐𝑖𝑠𝑜𝑛 × 𝑅𝑒𝑐𝑎𝑙𝑙
𝑃𝑟𝑒𝑐𝑖𝑠𝑖𝑜𝑛 + 𝑅𝑒𝑐𝑎𝑙𝑙
Area Under Curve (AUC): a plot of the true positive rate (e.g., recall) against the false
positive rate at various threshold settings [22]; for example, “Excellent” if AUC ≥ 0.9;
“Good” if 0.9 > AUC ≥ 0.8; “Fair” if 0.8 > AUC ≥ 0.7; “Poor” if 0.7 > AUC ≥ 0.6; and “Very
Poor” if AUC < 0.6 [21].
Finally, to determine how well the models predict the real-world findings, this study
held back a subset of records for testing and validation purposes. The original data were
partitioned at a ratio of 7:3; 70% of the data (training set) was used for training to generate
the model, and 30% of the data (testing set) was used to test or verify the tree’s
classification accuracy. To test classification models, IBM SPSS Modeler Version 18 was
utilized. Figure 2 presents a comparison of the different models in the DT algorithm
analyses.
Figure 2. Comparison of different DT models.
Figure 3 summarizes the study’s qualitative content and quantitative algorithm
analysis research process.
Figure 2. Comparison of different DT models.
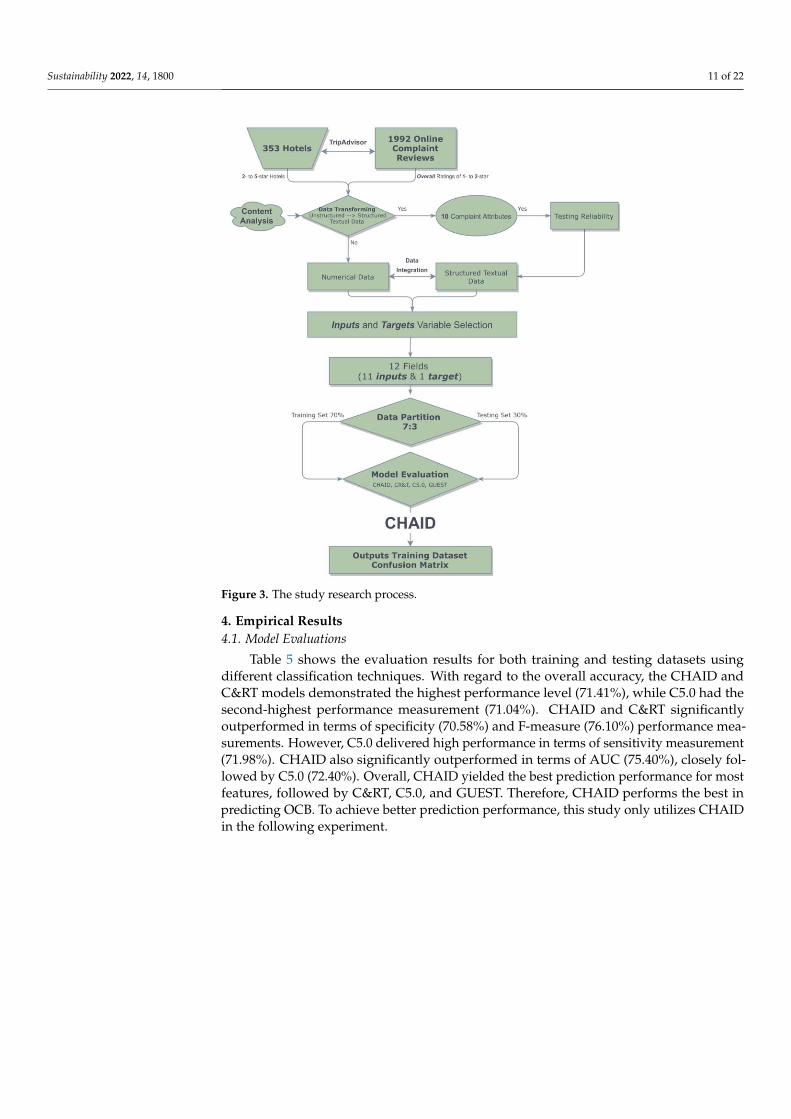
Figure 3 summarizes the study’s qualitative content and quantitative algorithm analy-sis research process.
Sustainability 2022, 14, 1800 11 of 22Sustainability 2022, 14, x FOR PEER REVIEW 11 of 24
Figure 3. The study research process.
4. Empirical Results
4.1. Model Evaluations
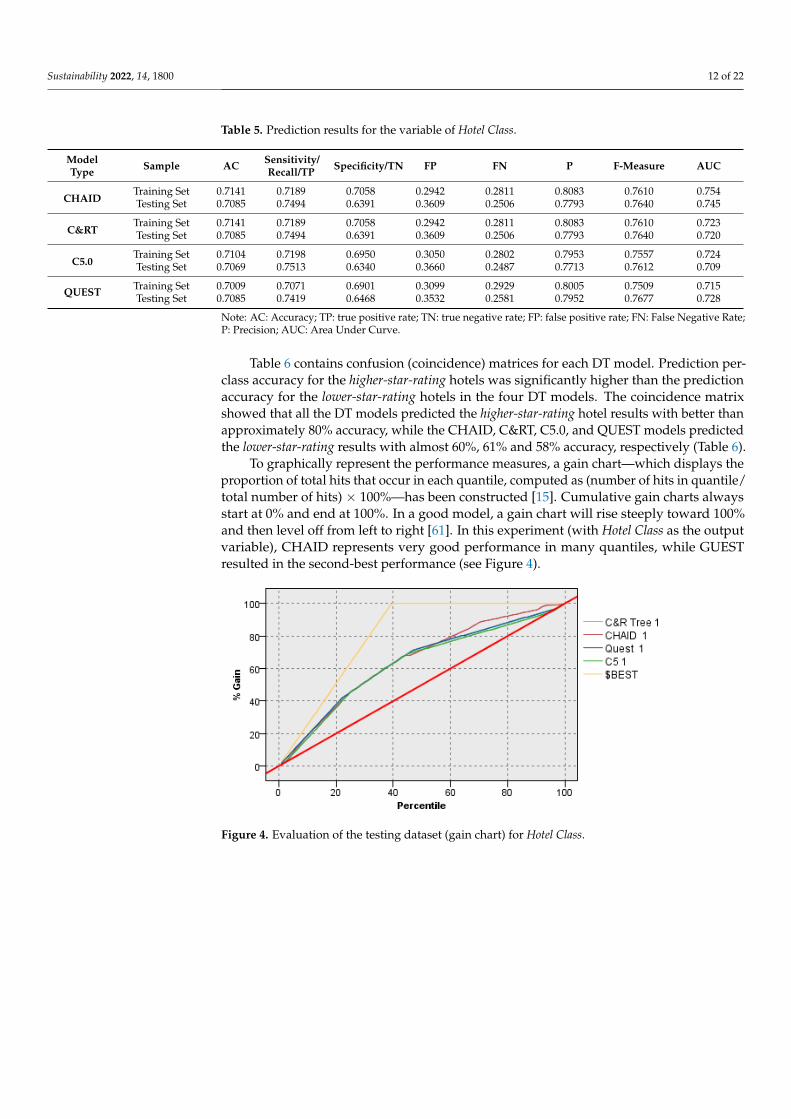
Table 5 shows the evaluation results for both training and testing datasets using
different classification techniques. With regard to the overall accuracy, the CHAID and
C&RT models demonstrated the highest performance level (71.41%), while C5.0 had the
second-highest performance measurement (71.04%). CHAID and C&RT significantly
outperformed in terms of specificity (70.58%) and F-measure (76.10%) performance
measurements. However, C5.0 delivered high performance in terms of sensitivity
measurement (71.98%). CHAID also significantly outperformed in terms of AUC (75.40%),
closely followed by C5.0 (72.40%). Overall, CHAID yielded the best prediction
performance for most features, followed by C&RT, C5.0, and GUEST. Therefore, CHAID
performs the best in predicting OCB. To achieve better prediction performance, this study
only utilizes CHAID in the following experiment.
Figure 3. The study research process.
4. Empirical Results4.1. Model Evaluations
Table 5 shows the evaluation results for both training and testing datasets usingdifferent classification techniques. With regard to the overall accuracy, the CHAID andC&RT models demonstrated the highest performance level (71.41%), while C5.0 had thesecond-highest performance measurement (71.04%). CHAID and C&RT significantlyoutperformed in terms of specificity (70.58%) and F-measure (76.10%) performance mea-surements. However, C5.0 delivered high performance in terms of sensitivity measurement(71.98%). CHAID also significantly outperformed in terms of AUC (75.40%), closely fol-lowed by C5.0 (72.40%). Overall, CHAID yielded the best prediction performance for mostfeatures, followed by C&RT, C5.0, and GUEST. Therefore, CHAID performs the best inpredicting OCB. To achieve better prediction performance, this study only utilizes CHAIDin the following experiment.
Sustainability 2022, 14, 1800 12 of 22
Table 5. Prediction results for the variable of Hotel Class.
ModelType Sample AC Sensitivity/
Recall/TP Specificity/TN FP FN P F-Measure AUC
CHAIDTraining Set 0.7141 0.7189 0.7058 0.2942 0.2811 0.8083 0.7610 0.754Testing Set 0.7085 0.7494 0.6391 0.3609 0.2506 0.7793 0.7640 0.745
C&RTTraining Set 0.7141 0.7189 0.7058 0.2942 0.2811 0.8083 0.7610 0.723Testing Set 0.7085 0.7494 0.6391 0.3609 0.2506 0.7793 0.7640 0.720
C5.0Training Set 0.7104 0.7198 0.6950 0.3050 0.2802 0.7953 0.7557 0.724Testing Set 0.7069 0.7513 0.6340 0.3660 0.2487 0.7713 0.7612 0.709
QUEST Training Set 0.7009 0.7071 0.6901 0.3099 0.2929 0.8005 0.7509 0.715Testing Set 0.7085 0.7419 0.6468 0.3532 0.2581 0.7952 0.7677 0.728
Note: AC: Accuracy; TP: true positive rate; TN: true negative rate; FP: false positive rate; FN: False Negative Rate;P: Precision; AUC: Area Under Curve.
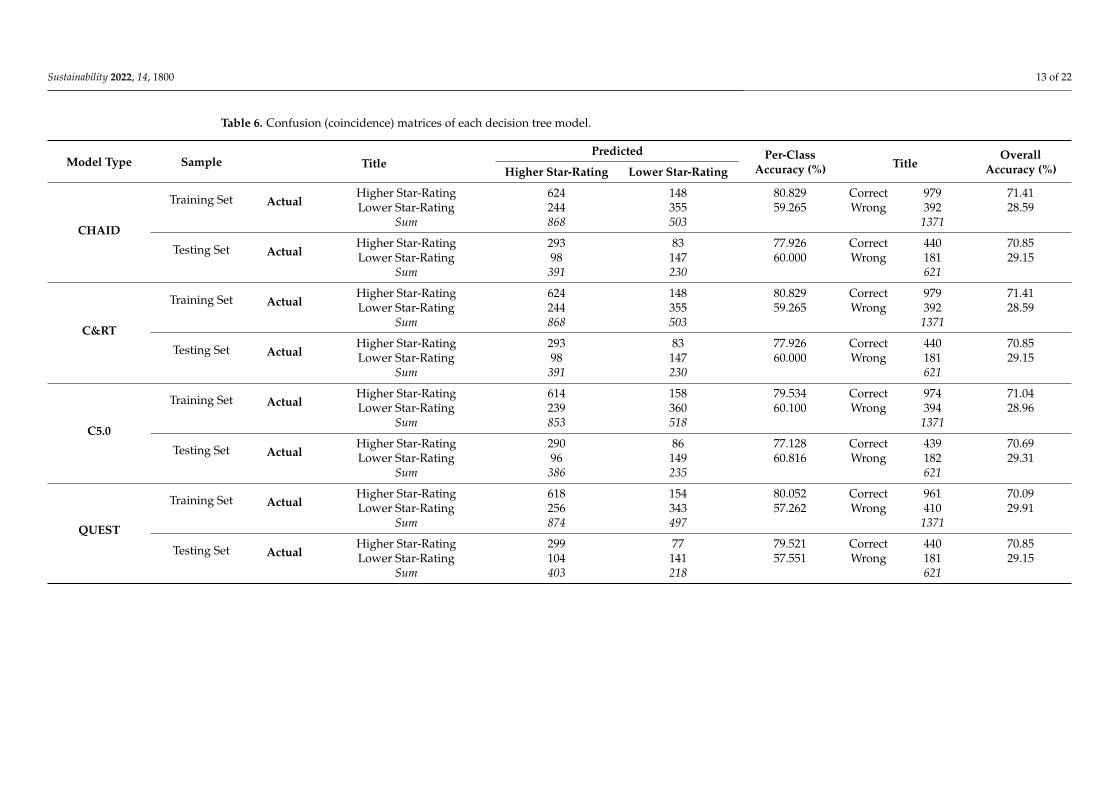
Table 6 contains confusion (coincidence) matrices for each DT model. Prediction per-class accuracy for the higher-star-rating hotels was significantly higher than the predictionaccuracy for the lower-star-rating hotels in the four DT models. The coincidence matrixshowed that all the DT models predicted the higher-star-rating hotel results with better thanapproximately 80% accuracy, while the CHAID, C&RT, C5.0, and QUEST models predictedthe lower-star-rating results with almost 60%, 61% and 58% accuracy, respectively (Table 6).
To graphically represent the performance measures, a gain chart—which displays theproportion of total hits that occur in each quantile, computed as (number of hits in quantile/total number of hits) × 100%—has been constructed [15]. Cumulative gain charts alwaysstart at 0% and end at 100%. In a good model, a gain chart will rise steeply toward 100%and then level off from left to right [61]. In this experiment (with Hotel Class as the outputvariable), CHAID represents very good performance in many quantiles, while GUESTresulted in the second-best performance (see Figure 4).
Sustainability 2022, 14, x FOR PEER REVIEW 14 of 24
To graphically represent the performance measures, a gain chart—which displays
the proportion of total hits that occur in each quantile, computed as (number of hits in
quantile/ total number of hits) x 100%—has been constructed [15]. Cumulative gain charts
always start at 0% and end at 100%. In a good model, a gain chart will rise steeply toward
100% and then level off from left to right [61]. In this experiment (with Hotel Class as the
output variable), CHAID represents very good performance in many quantiles, while
GUEST resulted in the second-best performance (see Figure 4).
Figure 4. Evaluation of the testing dataset (gain chart) for Hotel Class.
4.2. Attribute Assessment (Sensitivity Analysis)
To further analyze the influences of OCAs using DT models, complaint variables
were ranked in order of importance (Table 7). The variable, or predictor, importance, as
measured by sensitivity analysis, attempts to establish the relative importance of the
independent variables, as related to the output variables [51]. Predictor importance
focuses on the predictor fields that matter most and considers eliminating or ignoring
those that matter least [54]. This method assesses the value of input attributes by
measuring the information gained with respect to the target or output attribute [22]. While
predictor importance indicates the relative value of each predictor (output) in estimating
the model, it does not relate to model accuracy. That is, it merely suggests the importance
of each predictor in making a prediction, not whether that prediction is accurate [54]. The
higher the information gain, the more impact an attribute has on predicting different Hotel
Class guests’ OCB. Although the ranking illustrates that nine OCAs are involved in the
DT construction process, the Hotel Size, Service Encounter, Room Space, Value for Money, and
Cleanliness attributes are the five most important variables. Due to pre-pruning, not all
nine variables are involved in the construction of DT models [14]. For all OCAs, Hotel Size
has the highest impact or importance, while the next most influential attributes are Service
Encounter, Room Space, Value for Money, and Cleanliness, respectively, the leading variables
for Hotel Class. Table 7 presents the relative importance of the output variables from the
highest (most important) to the lowest (least important) regarding Hotel Class.
Figure 4. Evaluation of the testing dataset (gain chart) for Hotel Class.
Sustainability 2022, 14, 1800 13 of 22
Table 6. Confusion (coincidence) matrices of each decision tree model.
Model Type Sample TitlePredicted Per-Class
Accuracy (%) TitleOverall
Accuracy (%)Higher Star-Rating Lower Star-Rating
CHAID
Training Set ActualHigher Star-Rating 624 148 80.829 Correct 979 71.41Lower Star-Rating 244 355 59.265 Wrong 392 28.59
Sum 868 503 1371
Testing Set ActualHigher Star-Rating 293 83 77.926 Correct 440 70.85Lower Star-Rating 98 147 60.000 Wrong 181 29.15
Sum 391 230 621
C&RT
Training Set ActualHigher Star-Rating 624 148 80.829 Correct 979 71.41Lower Star-Rating 244 355 59.265 Wrong 392 28.59
Sum 868 503 1371
Testing Set ActualHigher Star-Rating 293 83 77.926 Correct 440 70.85Lower Star-Rating 98 147 60.000 Wrong 181 29.15
Sum 391 230 621
C5.0
Training Set ActualHigher Star-Rating 614 158 79.534 Correct 974 71.04Lower Star-Rating 239 360 60.100 Wrong 394 28.96
Sum 853 518 1371
Testing Set ActualHigher Star-Rating 290 86 77.128 Correct 439 70.69Lower Star-Rating 96 149 60.816 Wrong 182 29.31
Sum 386 235 621
QUEST
Training Set ActualHigher Star-Rating 618 154 80.052 Correct 961 70.09Lower Star-Rating 256 343 57.262 Wrong 410 29.91
Sum 874 497 1371
Testing Set ActualHigher Star-Rating 299 77 79.521 Correct 440 70.85Lower Star-Rating 104 141 57.551 Wrong 181 29.15
Sum 403 218 621
Sustainability 2022, 14, 1800 14 of 22
4.2. Attribute Assessment (Sensitivity Analysis)
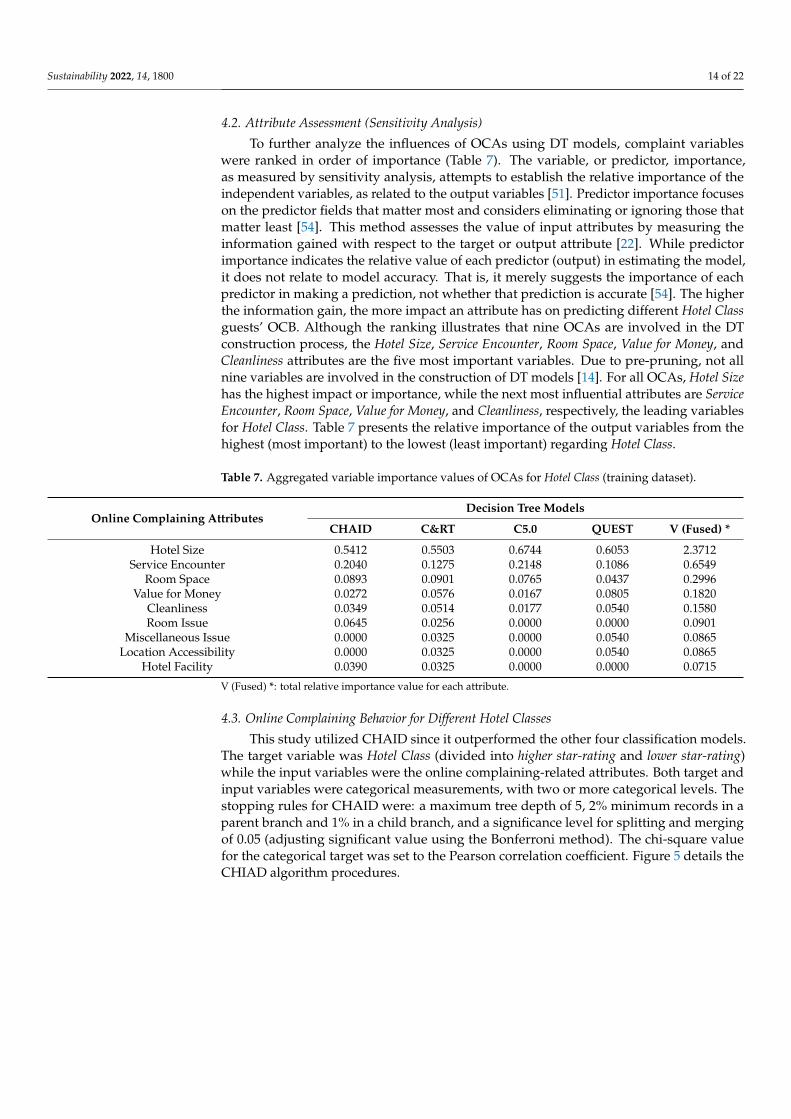
To further analyze the influences of OCAs using DT models, complaint variableswere ranked in order of importance (Table 7). The variable, or predictor, importance,as measured by sensitivity analysis, attempts to establish the relative importance of theindependent variables, as related to the output variables [51]. Predictor importance focuseson the predictor fields that matter most and considers eliminating or ignoring those thatmatter least [54]. This method assesses the value of input attributes by measuring theinformation gained with respect to the target or output attribute [22]. While predictorimportance indicates the relative value of each predictor (output) in estimating the model,it does not relate to model accuracy. That is, it merely suggests the importance of eachpredictor in making a prediction, not whether that prediction is accurate [54]. The higherthe information gain, the more impact an attribute has on predicting different Hotel Classguests’ OCB. Although the ranking illustrates that nine OCAs are involved in the DTconstruction process, the Hotel Size, Service Encounter, Room Space, Value for Money, andCleanliness attributes are the five most important variables. Due to pre-pruning, not allnine variables are involved in the construction of DT models [14]. For all OCAs, Hotel Sizehas the highest impact or importance, while the next most influential attributes are ServiceEncounter, Room Space, Value for Money, and Cleanliness, respectively, the leading variablesfor Hotel Class. Table 7 presents the relative importance of the output variables from thehighest (most important) to the lowest (least important) regarding Hotel Class.
Table 7. Aggregated variable importance values of OCAs for Hotel Class (training dataset).
Online Complaining AttributesDecision Tree Models
CHAID C&RT C5.0 QUEST V (Fused) *
Hotel Size 0.5412 0.5503 0.6744 0.6053 2.3712Service Encounter 0.2040 0.1275 0.2148 0.1086 0.6549
Room Space 0.0893 0.0901 0.0765 0.0437 0.2996Value for Money 0.0272 0.0576 0.0167 0.0805 0.1820
Cleanliness 0.0349 0.0514 0.0177 0.0540 0.1580Room Issue 0.0645 0.0256 0.0000 0.0000 0.0901
Miscellaneous Issue 0.0000 0.0325 0.0000 0.0540 0.0865Location Accessibility 0.0000 0.0325 0.0000 0.0540 0.0865
Hotel Facility 0.0390 0.0325 0.0000 0.0000 0.0715
V (Fused) *: total relative importance value for each attribute.
4.3. Online Complaining Behavior for Different Hotel Classes
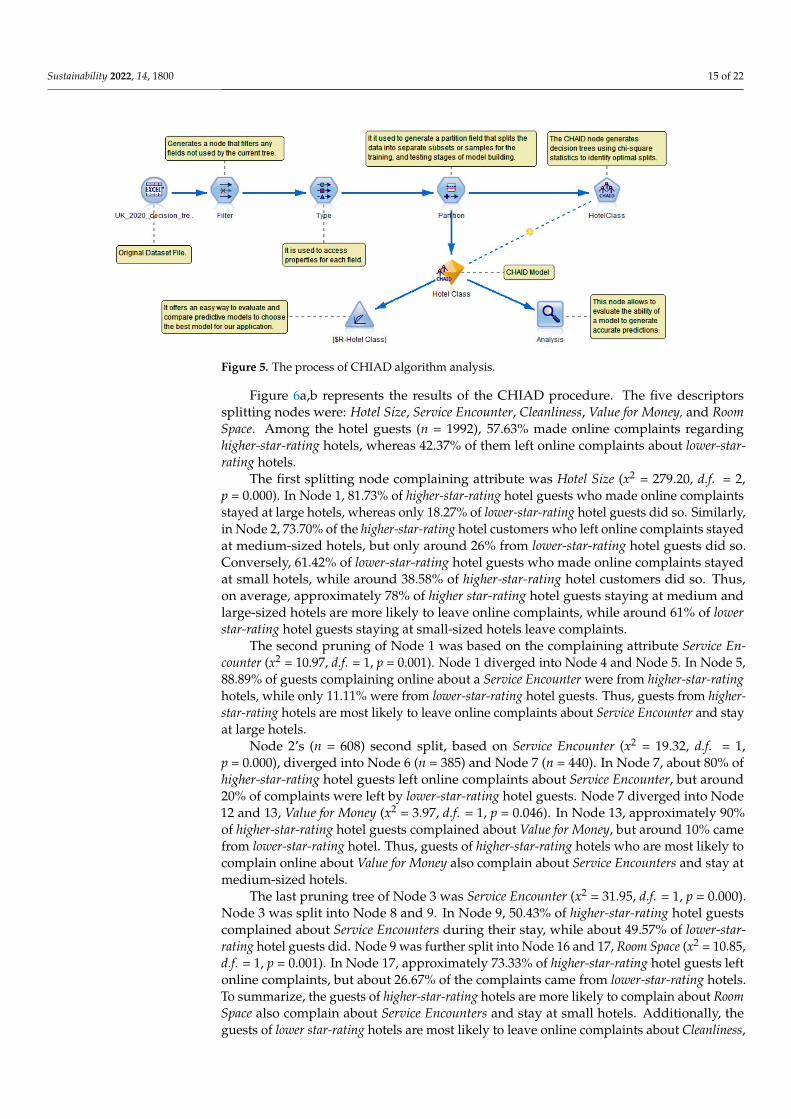
This study utilized CHAID since it outperformed the other four classification models.The target variable was Hotel Class (divided into higher star-rating and lower star-rating)while the input variables were the online complaining-related attributes. Both target andinput variables were categorical measurements, with two or more categorical levels. Thestopping rules for CHAID were: a maximum tree depth of 5, 2% minimum records in aparent branch and 1% in a child branch, and a significance level for splitting and mergingof 0.05 (adjusting significant value using the Bonferroni method). The chi-square valuefor the categorical target was set to the Pearson correlation coefficient. Figure 5 details theCHIAD algorithm procedures.
Sustainability 2022, 14, 1800 15 of 22
Sustainability 2022, 14, x FOR PEER REVIEW 15 of 24
Table 7. Aggregated variable importance values of OCAs for Hotel Class (training dataset).
Online Complaining Attributes Decision Tree Models
CHAID C&RT C5.0 QUEST V (Fused) *
Hotel Size 0.5412 0.5503 0.6744 0.6053 2.3712
Service Encounter 0.2040 0.1275 0.2148 0.1086 0.6549
Room Space 0.0893 0.0901 0.0765 0.0437 0.2996
Value for Money 0.0272 0.0576 0.0167 0.0805 0.1820
Cleanliness 0.0349 0.0514 0.0177 0.0540 0.1580
Room Issue 0.0645 0.0256 0.0000 0.0000 0.0901
Miscellaneous Issue 0.0000 0.0325 0.0000 0.0540 0.0865
Location Accessibility 0.0000 0.0325 0.0000 0.0540 0.0865
Hotel Facility 0.0390 0.0325 0.0000 0.0000 0.0715
V (Fused) *: total relative importance value for each attribute.
4.3. Online Complaining Behavior for Different Hotel Classes
This study utilized CHAID since it outperformed the other four classification models.
The target variable was Hotel Class (divided into higher star-rating and lower star-rating)
while the input variables were the online complaining-related attributes. Both target and
input variables were categorical measurements, with two or more categorical levels. The
stopping rules for CHAID were: a maximum tree depth of 5, 2% minimum records in a
parent branch and 1% in a child branch, and a significance level for splitting and merging
of 0.05 (adjusting significant value using the Bonferroni method). The chi-square value for
the categorical target was set to the Pearson correlation coefficient. Figure 5 details the
CHIAD algorithm procedures.
Figure 5. The process of CHIAD algorithm analysis.
Figure 6a,b represents the results of the CHIAD procedure. The five descriptors
splitting nodes were: Hotel Size, Service Encounter, Cleanliness, Value for Money, and Room
Space. Among the hotel guests (n = 1992), 57.63% made online complaints regarding higher-
star-rating hotels, whereas 42.37% of them left online complaints about lower-star-rating
hotels.
The first splitting node complaining attribute was Hotel Size (x2 = 279.20, d.f. = 2, p =
0.000). In Node 1, 81.73% of higher-star-rating hotel guests who made online complaints
stayed at large hotels, whereas only 18.27% of lower-star-rating hotel guests did so.
Similarly, in Node 2, 73.70% of the higher-star-rating hotel customers who left online
complaints stayed at medium-sized hotels, but only around 26% from lower-star-rating
hotel guests did so. Conversely, 61.42% of lower-star-rating hotel guests who made online
complaints stayed at small hotels, while around 38.58% of higher-star-rating hotel
Figure 5. The process of CHIAD algorithm analysis.
Figure 6a,b represents the results of the CHIAD procedure. The five descriptorssplitting nodes were: Hotel Size, Service Encounter, Cleanliness, Value for Money, and RoomSpace. Among the hotel guests (n = 1992), 57.63% made online complaints regardinghigher-star-rating hotels, whereas 42.37% of them left online complaints about lower-star-rating hotels.
The first splitting node complaining attribute was Hotel Size (x2 = 279.20, d.f. = 2,p = 0.000). In Node 1, 81.73% of higher-star-rating hotel guests who made online complaintsstayed at large hotels, whereas only 18.27% of lower-star-rating hotel guests did so. Similarly,in Node 2, 73.70% of the higher-star-rating hotel customers who left online complaints stayedat medium-sized hotels, but only around 26% from lower-star-rating hotel guests did so.Conversely, 61.42% of lower-star-rating hotel guests who made online complaints stayedat small hotels, while around 38.58% of higher-star-rating hotel customers did so. Thus,on average, approximately 78% of higher star-rating hotel guests staying at medium andlarge-sized hotels are more likely to leave online complaints, while around 61% of lowerstar-rating hotel guests staying at small-sized hotels leave complaints.
The second pruning of Node 1 was based on the complaining attribute Service En-counter (x2 = 10.97, d.f. = 1, p = 0.001). Node 1 diverged into Node 4 and Node 5. In Node 5,88.89% of guests complaining online about a Service Encounter were from higher-star-ratinghotels, while only 11.11% were from lower-star-rating hotel guests. Thus, guests from higher-star-rating hotels are most likely to leave online complaints about Service Encounter and stayat large hotels.
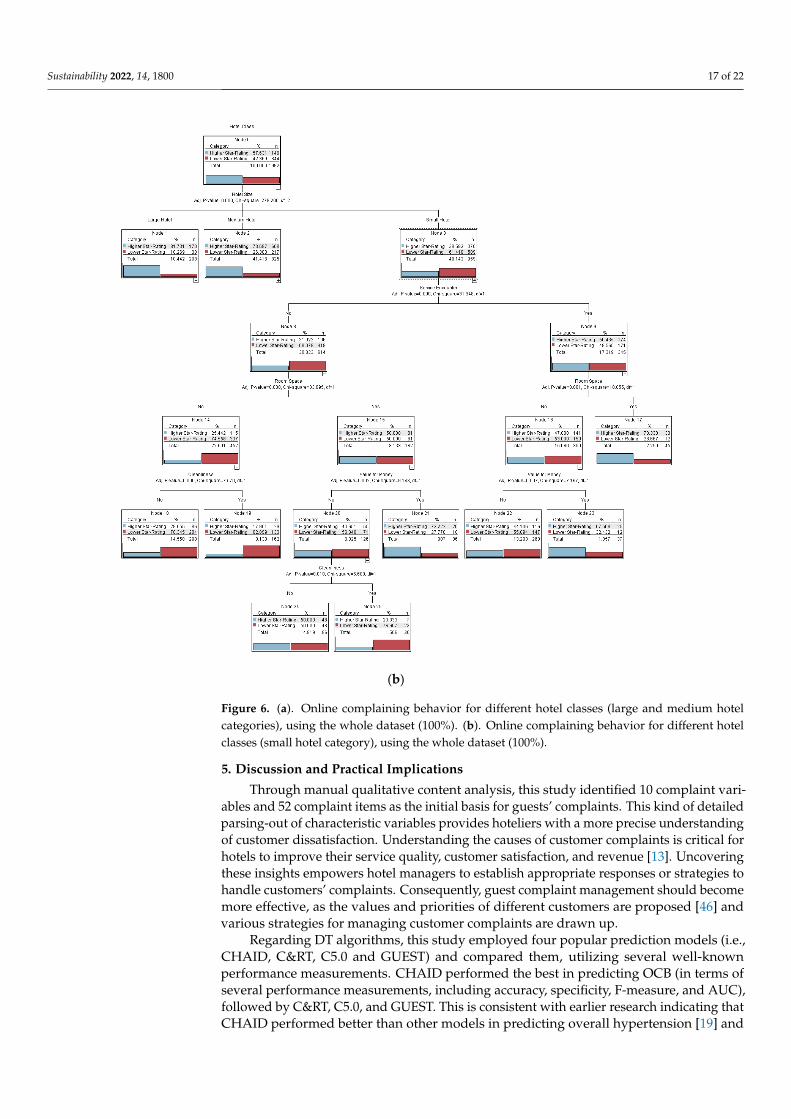
Node 2’s (n = 608) second split, based on Service Encounter (x2 = 19.32, d.f. = 1,p = 0.000), diverged into Node 6 (n = 385) and Node 7 (n = 440). In Node 7, about 80% ofhigher-star-rating hotel guests left online complaints about Service Encounter, but around20% of complaints were left by lower-star-rating hotel guests. Node 7 diverged into Node12 and 13, Value for Money (x2 = 3.97, d.f. = 1, p = 0.046). In Node 13, approximately 90%of higher-star-rating hotel guests complained about Value for Money, but around 10% camefrom lower-star-rating hotel. Thus, guests of higher-star-rating hotels who are most likely tocomplain online about Value for Money also complain about Service Encounters and stay atmedium-sized hotels.
The last pruning tree of Node 3 was Service Encounter (x2 = 31.95, d.f. = 1, p = 0.000).Node 3 was split into Node 8 and 9. In Node 9, 50.43% of higher-star-rating hotel guestscomplained about Service Encounters during their stay, while about 49.57% of lower-star-rating hotel guests did. Node 9 was further split into Node 16 and 17, Room Space (x2 = 10.85,d.f. = 1, p = 0.001). In Node 17, approximately 73.33% of higher-star-rating hotel guests leftonline complaints, but about 26.67% of the complaints came from lower-star-rating hotels.To summarize, the guests of higher-star-rating hotels are more likely to complain about RoomSpace also complain about Service Encounters and stay at small hotels. Additionally, theguests of lower star-rating hotels are most likely to leave online complaints about Cleanliness,
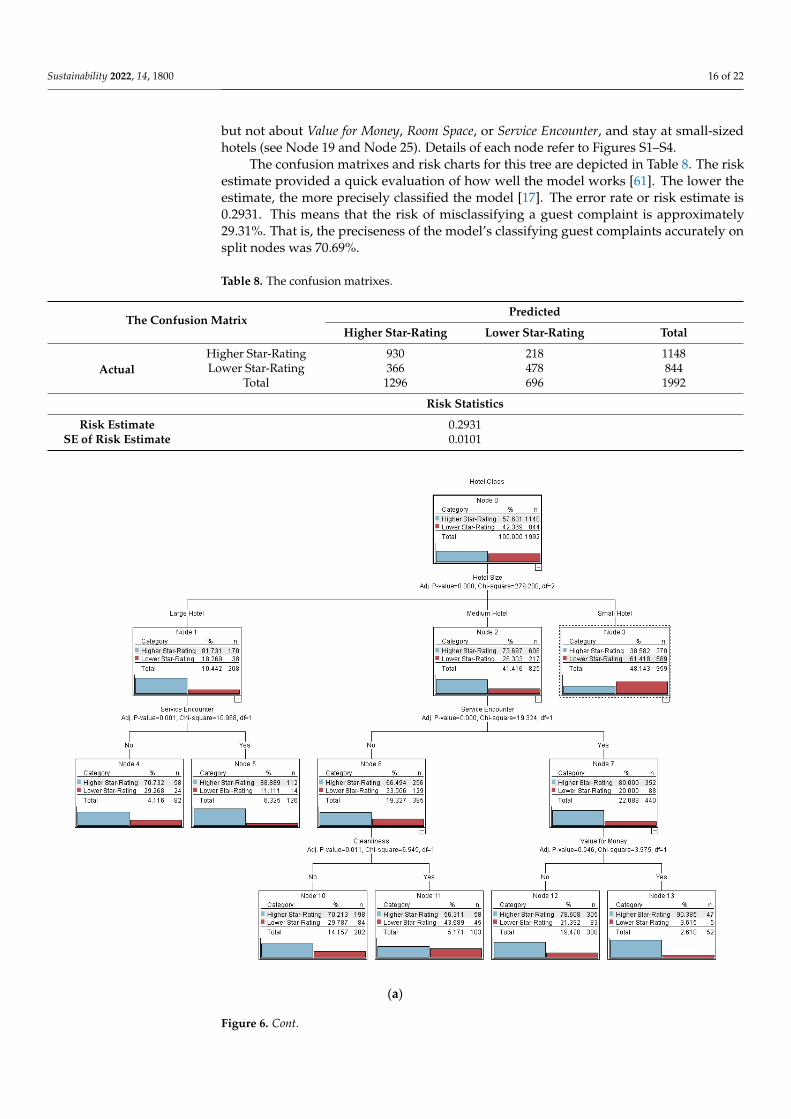
Sustainability 2022, 14, 1800 16 of 22
but not about Value for Money, Room Space, or Service Encounter, and stay at small-sizedhotels (see Node 19 and Node 25). Details of each node refer to Figures S1–S4.
The confusion matrixes and risk charts for this tree are depicted in Table 8. The riskestimate provided a quick evaluation of how well the model works [61]. The lower theestimate, the more precisely classified the model [17]. The error rate or risk estimate is0.2931. This means that the risk of misclassifying a guest complaint is approximately29.31%. That is, the preciseness of the model’s classifying guest complaints accurately onsplit nodes was 70.69%.
Table 8. The confusion matrixes.
The Confusion MatrixPredicted
Higher Star-Rating Lower Star-Rating Total
ActualHigher Star-Rating 930 218 1148Lower Star-Rating 366 478 844
Total 1296 696 1992
Risk Statistics
Risk Estimate 0.2931SE of Risk Estimate 0.0101
Sustainability 2022, 14, x FOR PEER REVIEW 17 of 24
(a)
Figure 6. Cont.
Sustainability 2022, 14, 1800 17 of 22
Sustainability 2022, 14, x FOR PEER REVIEW 18 of 24
(b)
Figure 6. (a). Online complaining behavior for different hotel classes (large and medium hotel categories), using the whole dataset (100%). (b). Online
complaining behavior for different hotel classes (small hotel category), using the whole dataset (100%). Figure 6. (a). Online complaining behavior for different hotel classes (large and medium hotelcategories), using the whole dataset (100%). (b). Online complaining behavior for different hotelclasses (small hotel category), using the whole dataset (100%).
5. Discussion and Practical Implications
Through manual qualitative content analysis, this study identified 10 complaint vari-ables and 52 complaint items as the initial basis for guests’ complaints. This kind of detailedparsing-out of characteristic variables provides hoteliers with a more precise understandingof customer dissatisfaction. Understanding the causes of customer complaints is critical forhotels to improve their service quality, customer satisfaction, and revenue [13]. Uncoveringthese insights empowers hotel managers to establish appropriate responses or strategies tohandle customers’ complaints. Consequently, guest complaint management should becomemore effective, as the values and priorities of different customers are proposed [46] andvarious strategies for managing customer complaints are drawn up.
Regarding DT algorithms, this study employed four popular prediction models (i.e.,CHAID, C&RT, C5.0 and GUEST) and compared them, utilizing several well-knownperformance measurements. CHAID performed the best in predicting OCB (in terms ofseveral performance measurements, including accuracy, specificity, F-measure, and AUC),followed by C&RT, C5.0, and GUEST. This is consistent with earlier research indicating thatCHAID performed better than other models in predicting overall hypertension [19] and
Sustainability 2022, 14, 1800 18 of 22
firm performance [15]. Additionally, after developing the prediction models, this studydetermined the ranked importance of OCAs, utilizing sensitivity analysis on the four typesof DT models. The predictor importance measures were then fused and illustrated in atabular format (Table 7). The results retrieved, using Hotel Class as a dependent variable,indicated that the most important OCAs are Hotel Size, Service Encounter, Room Space, Valuefor Money, and Cleanliness, respectively. These variables had the highest impact in predictingguests’ OCB from different hotel classes. It is noteworthy that Hotel Size was the mostimportant attribute; Service Encounter and Room Space attributes emerged as the secondand third most important factors in each of the four DT models. Surprisingly, Safety andF&B Issue complaint attributes did not contribute to any important variables, indicatingthat these complaint attributes are not particularly helpful in predicting guests’ OCB fromdifferent hotel classes.
From the CHAID results, five descriptor-splitting nodes were discovered. The firstsplitting OCA was Hotel Size, followed by Service Encounter, Cleanliness, Value for Money,and Room Space, respectively. The study also found that:
(i) On average, approximately 78% of higher-star-rating hotel guests staying at mediumand large hotels are likely to leave online complaints, while only around 61% oflower-star-rating hotel guests staying at small hotels leave online complaints.
(ii) Guests of higher-star-rating hotels who stay at large hotels are most likely to leaveonline complaints about Service Encounter.
(iii) Guests of higher-star-rating hotels who stay at medium-sized hotels are most likelyto leave online complaints about Value for Money and also complain about ServiceEncounter.
(iv) Guests of higher star-rating hotels who stay at small-sized hotels are more likely toleave online complaints about Room Space and also to complain about Service Encounter.Additionally, guests of lower-star-rating hotels, staying at small-sized hotels, are mostlikely to leave online complaints about Cleanliness, but not about Value for Money,Room Space, or Service Encounter.
Since smaller hotels received more guest complaints regarding service encounters,room space, value for money, and cleanliness, this shows that the standard operatingprocedure (SOP) is very important for smaller hotels. This can also support the argumentthat most larger hotels are chain hotels with a carefully designed SOP. As a consequence,guests tend to complain only about the service encounter. These results are also similar tothose of Hu et al. (2019), who found that facility-related issues or cleanliness for low-endhotels are the major sources of guests’ dissatisfaction [13]. On the other hand, for high-endhotels, the major triggers of guests’ complaints are service-related issues, such as servicefailure. This can be seen in the following complaint reviews:
“[ . . . ] however, it does not deserve its 5-star rating. The housekeeping left much tobe desired. There was a 3-hour delay on receiving non-allergenic bedding despite beingrequested in good time . . . They were slow to supply . . . the customer care attitude waspoor . . . Terribly cramped and no space to place luggage, etc. . . . and lack of security onthe front door.”
“Cheap but no sleep . . . It’s cheap and cheerful, although the level of cleanliness could defi-nitely be improved—some staining to pillowcases and towels etc., and a fairly unpleasantsmell about the room . . . I still won’t recommend you to have a sleep in the 2-star . . . ”
The findings of this study are practical and readily applicable to the industry. Re-garding Service Encounter, customers had higher expectations in service delivery fromhigher-star-rating hotels, which tend to be more expensive. To reduce the gaps betweenservice delivery and guests’ expectations, front-desk staff should be trained to exercisepoliteness and courtesy, deal responsively with guests’ problems, promote positive socialinteractions with the guests, and, finally, effectively and efficiently handle both the reserva-tion and the check-in and check-out processes. Specifically, this suggests that hotels shouldoffer good Value for Money because once guests perceive a property as being good value for
Sustainability 2022, 14, 1800 19 of 22
money, the demands that they place on service decrease, and vice versa [12]. RegardingRoom Space, it is understandable that most of the hotels located in London offer limitedroom space. Since space generally cannot be changed without incurring major expense,alternative strategies should be implemented. For instance, hotels with smaller roomsmight offer a free welcome fruit/snack basket or a free shuttle bus to areas of interest, inorder to cultivate customer satisfaction. Regarding Cleanliness, on average, approximately83% of lower-star-rating hotel guests made complaints, specifically about bedroom, bath-room, and public area cleanliness. lower-star-rating hotels should consistently ensure thefunctionality of their core facilities and maintain cleanliness, although lower-star-ratinghotels tend to only provide basic facilities and services to cut costs [13,62,63]. Feickert et al.(2006) demonstrated that cleanliness has a very important relationship with security [64].The security of hotels might be related to less-secure surrounding locations. This is evidentfrom complaint phrases such as: “drunken shouting opposite hotel, loud angry arguments nearby,at night full of drunken locals, unsafe surroundings.” In order to improve guests’ safety, securitycameras should be equipped in key areas of the hotel, as well as in the surrounding areas.Security guards should be employed for 24 hours, and importantly, remain on stand-by atthe front doors. Outside guests should not be allowed unrestricted access to the hotel afteroffice hours. Additionally, during the check-in process, front-desk staff should recommendthat guests lock their valuables in a safe to avoid loss.
This study also offers evidence that DT techniques can be used to effectively predictthe OCB of different hotel-class guests. The CHAID approach is superior to other statisticalmethods, in that one dependent variable with two or more levels is directly connected toindependent variables with two or more levels, forming one tree that explicitly accounts forrelationships among variables [17]. Moreover, CHAID offers cumulative statistics [19] andis adept at finding OCAs by taking the best segments of the sample. Importantly, since theCHAID results are presented graphically, they are easier to understand and interpret [17].The rules generated by such trees reveal the most influential factors affecting OCB by guestsfrom various classes of hotels, thus helping hoteliers to identify the most likely complaintareas and subsequently take the required measures to manage them effectively.
6. Conclusions and Future Research Recommendations
This study aims to enrich the literature on the hospitality and tourism industry byutilizing the tools of big data analytics and data mining to predict the complaint attributionsof travelers’ OCB from different hotel classes (i.e., higher star rating and lower star rating).The study achieved this goal by applying classification models to analyze TripAdvisorcomplaint reviews in the UK. Due to the methodological advantages of manual contentanalysis and data-mining algorithms, this research not only corroborates the conclusionsreached by previous studies but goes beyond them by revealing significant differences inOCB from guests staying in various hotel classes.
The main contribution of this innovative study includes the utilization of machinelearning algorithms to predict the OCB in the tourism and hospitality industry, whereasprevious studies most often relied on traditional methods (e.g., surveys or questionnaires).By analyzing real-world data (i.e., complaint reviews), researchers discovered additionalempirical and quantitative categories through DT algorithms. Therefore, the authorscontend that there is a need for further in-depth investigations utilizing DM techniquesto explore the details of OCB within the tourism and hospitality context. Specifically,more research should apply the increasingly popular tools of data/text mining to thediscipline of hospitality and tourism. Additional investigations will help both researchersand practitioners to understand not only how algorithms might be useful in predictingcustomers’ complaint behavior, but also provide insight into, and hence overcome, some ofthe barriers of traditional approaches.
The current research is not without its limitations, although its constraints suggestmethods that might assist in refining further efforts. The accuracy of this study’s model isconsidered to be in the range of “acceptable”, due to data limitations. The time-consuming
Sustainability 2022, 14, 1800 20 of 22
and labor-intensive method used to develop the dataset in the study, manual contentanalysis, restricted its size. Further research is recommended to increase the data volumesand automate comparisons. More studies are encouraged to compare the findings of thisstudy to those of tourist complaints in destinations outside the UK.
Supplementary Materials: The supporting information can be downloaded at: https://www.mdpi.com/article/10.3390/su14031800/s1. Figure S1: Online complaining behavior for different hotelclasses (hotel size node), using the whole dataset (100%). Figure S2: Online complaining behaviorfor different hotel classes (large hotel category node), using the whole dataset (100%). Figure S3:Online complaining behavior for different hotel classes (medium hotel category node), using thewhole dataset (100%). Figure S4: Online complaining behavior for different hotel classes (small hotelcategory node), using the whole dataset (100%).
Author Contributions: Conceptualization, R.S. and P.-C.L.; methodology, R.S.; software, S.-Y.L.;validation, R.S. and S.-Y.L.; formal analysis, R.S.; investigation, R.S. and S.-Y.L.; resources, R.S.; datacuration, R.S.; writing—original draft preparation, R.S.; writing—review and editing, R.S., P.-C.L.and C.-T.C.; visualization, R.S.; supervision, P.-C.L.; project administration, R.S.; funding acquisition,R.S. and P.-C.L. All authors have read and agreed to the published version of the manuscript.
Funding: This research received no external funding.
Institutional Review Board Statement: Not applicable “studies not involving humans or animals”.
Informed Consent Statement: Not applicable “studies not involving humans”.
Data Availability Statement: Data available on request due to privacy restrictions.
Acknowledgments: Raksmey Sann would like to express very great appreciation to the anonymousreviewers for their valuable and constructive suggestions during the review process. Their willingnessto give their time so generously is sincerely appreciated.
Conflicts of Interest: The authors declare no conflict of interest.
References1. Lee, M.; Youn, S. Electronic word of mouth (eWOM) How eWOM platforms influence consumer product judgement. Int. J. Advert.
2009, 28, 473–499. [CrossRef]2. Babic Rosario, A.; Sotgiu, F.; de Valck, K.; Bijmolt, T.H. The effect of electronic word of mouth on sales: A meta-analytic review of
platform, product, and metric factors. J. Mark. Res. 2016, 53, 297–318. [CrossRef]3. Fernandes, T.; Fernandes, F. Sharing Dissatisfaction Online: Analyzing the Nature and Predictors of Hotel Guests Negative
Reviews. J. Hosp. Mark. Manag. 2018, 27, 127–150. [CrossRef]4. Donthu, N.; Kumar, S.; Pandey, N.; Pandey, N.; Mishra, A. Mapping the electronic word-of-mouth (eWOM) research: A systematic
review and bibliometric analysis. J. Bus. Res. 2021, 135, 758–773. [CrossRef]5. Zhao, X.; Wang, L.; Guo, X.; Law, R. The influence of online reviews to online hotel booking intentions. Int. J. Contemp. Hosp.
Manag. 2015, 27, 1343–1364. [CrossRef]6. Ladhari, R.; Michaud, M. eWOM effects on hotel booking intentions, attitudes, trust, and website perceptions. Int J. Hosp. Manag.
2015, 46, 36–45. [CrossRef]7. Casaló, L.V.; Flavián, C.; Guinalíu, M.; Ekinci, Y. Avoiding the dark side of positive online consumer reviews: Enhancing reviews’
usefulness for high risk-averse travelers. J. Bus. Res. 2015, 68, 1829–1835. [CrossRef]8. Mellinas, J.P.; Maria-Dolores, S.M.M.; Garcia, J.J.B. Effects of the Booking.com scoring system. Tour. Manag. 2016, 57, 80–83.
[CrossRef]9. Guerreiro, J.; Moro, S. Are Yelp′s tips helpful in building influential consumers? Tour. Manag. Perspect. 2017, 24, 151–154.
[CrossRef]10. Tsao, W.C.; Hsieh, M.T.; Shih, L.W.; Lin, T.M.Y. Compliance with eWOM: The influence of hotel reviews on booking intention
from the perspective of consumer conformity. Int J. Hosp. Manag. 2015, 46, 99–111. [CrossRef]11. Abubakar, A.M.; Ilkan, M. Impact of online WOM on destination trust and intention to travel: A medical tourism perspective. J.
Destin. Mark. Manag. 2016, 5, 192–201. [CrossRef]12. Liu, Y.; Teichert, T.; Rossi, M.; Li, H.X.; Hu, F. Big data for big insights: Investigating language-specific drivers of hotel satisfaction
with 412,784 user-generated reviews. Tour. Manag. 2017, 59, 554–563. [CrossRef]13. Hu, N.; Zhang, T.; Gao, B.; Bose, I. What do hotel customers complain about? Text analysis using structural topic model. Tour.
Manag. 2019, 72, 417–426. [CrossRef]
Sustainability 2022, 14, 1800 21 of 22
14. Yu, F.; Li, G.; Chen, H.; Guo, Y.; Yuan, Y.; Coulton, B. A VRF charge fault diagnosis method based on expert modification C5.0decision tree. Int. J. Refrig. 2018, 92, 106–112. [CrossRef]
15. Delen, D.; Kuzey, C.; Uyar, A. Measuring firm performance using financial ratios: A decision tree approach. Expert Syst. Appl.2013, 40, 3970–3983. [CrossRef]
16. Hsiao, Y.H.; Chen, L.F.; Choy, Y.L.; Su, C.T. A novel framework for customer complaint management. Serv. Ind. J. 2016, 36, 675–698.[CrossRef]
17. Kim, S.S.; Timothy, D.J.; Hwang, J.S. Understanding Japanese tourists’ shopping preferences using the Decision Tree Analysismethod. Tour. Manag. 2011, 32, 544–554. [CrossRef]
18. Choi, C. Predicting Customer Complaints in Mobile Telecom Industry Using Machine Learning Algorithms. Ph.D. Thesis, PurdueUniversity, West Lafayette, IN, USA, 2018.
19. Chae, Y.M.; Ho, S.H.; Cho, K.W.; Lee, D.H.; Ji, S.H. Data mining approach to policy analysis in a health insurance domain. Int J.Med. Inform. 2001, 62, 103–111. [CrossRef]
20. Nourani, V.; Molajou, A. Application of a hybrid association rules/decision tree model for drought monitoring. Glob. Planet.Change 2017, 159, 37–45. [CrossRef]
21. Lee, P.J.; Hu, Y.H.; Lu, K.T. Assessing the helpfulness of online hotel reviews: A classification-based approach. Telemat. Inform.2018, 35, 436–445. [CrossRef]
22. Taamneh, M. Investigating the role of socio-economic factors in comprehension of traffic signs using decision tree algorithm. J.Saf. Res. 2018, 66, 121–129. [CrossRef] [PubMed]
23. Lan, T.; Zhang, Y.N.; Jiang, C.H.; Yang, G.B.; Zhao, Z.Y. Automatic identification of Spread F using decision trees. J. Atmos. Sol.Terr. Phys. 2018, 179, 389–395. [CrossRef]
24. Anand, R.V.; Dinakaran, M. Handling stakeholder conflict by agile requirement prioritization using Apriori technique. Comput.Electr. Eng. 2017, 61, 126–136. [CrossRef]
25. Kalgotra, P.; Sharda, R. BIARAM: A process for analyzing correlated brain regions using association rule mining. Comput. MethodsPrograms Biomed. 2018, 162, 99–108. [CrossRef] [PubMed]
26. Spreafico, C.; Russo, D.; Spreafico, M. Investigating the evolution of pyrolysis technologies through bibliometric analysis ofpatents and papers. J. Anal. Appl. Pyrolysis 2021, 159, 105021. [CrossRef]
27. Jabbour, S.; Mazouri, F.E.E.; Sais, L. Mining negatives association rules using constraints. Procedia Comput. Sci. 2018, 127, 481–488.[CrossRef]
28. Casaló, L.V.; Flavián, C.; Guinalíu, M.; Ekinci, Y. Do online hotel rating schemes influence booking behaviors? Int J. Hosp. Manag.2015, 49, 28–36. [CrossRef]
29. Sparks, B.A.; Browning, V. The impact of online reviews on hotel booking intentions and perception of trust. Tour. Manag. 2011,32, 1310–1323. [CrossRef]
30. Zhang, Z.; Zhang, Z.; Yang, Y. The power of expert identity: How website-recognized expert reviews influence travelers′ onlinerating behavior. Tour. Manag. 2016, 55, 15–24. [CrossRef]
31. Dinçer, M.Z.; Alrawadieh, Z. Negative word of mouse in the hotel industry: A content analysis of online reviews on luxury hotelsin Jordan. J. Hosp. Mark. Manag. 2017, 26, 785–804. [CrossRef]
32. Yuksel, A.; Kilinc, U.; Yuksel, F. Cross-national analysis of hotel customers’ attitudes toward complaining and their complainingbehaviours. Tour. Manag. 2006, 27, 11–24. [CrossRef]
33. Ngai, E.W.T.; Heung, V.C.S.; Wong, Y.H.; Chan, F.K.Y. Consumer complaint behaviour of Asians and non-Asians about hotelservices—An empirical analysis. Eur. J. Mark. 2007, 41, 1375–1391. [CrossRef]
34. Koc, E. Service failures and recovery in hospitality and tourism: A review of literature and recommendations for future research.J. Hosp. Mark. Manag. 2019, 28, 513–537. [CrossRef]
35. Arora, S.D.; Chakraborty, A. Intellectual structure of consumer complaining behavior (CCB) research: A bibliometric analysis. J.Bus. Res. 2021, 122, 60–74. [CrossRef]
36. Tosun, P.; Sezgin, S.; Uray, N. Consumer complaining behavior in hospitality management. J. Hosp. Mark. Manag. 2021,31, 247–264. [CrossRef]
37. Cantallops, A.S.; Salvi, F. New consumer behavior: A review of research on eWOM and hotels. Int J. Hosp. Manag. 2014, 36, 41–51.[CrossRef]
38. Xiang, Z.; Du, Q.; Ma, Y.; Fan, W. A comparative analysis of major online review platforms: Implications for social media analyticsin hospitality and tourism. Tour. Manag. 2017, 58, 51–65. [CrossRef]
39. Xiang, Z.; Fesenmaier, D.R.; Werthner, H. Knowledge Creation in Information Technology and Tourism: A Critical Reflection andan Outlook for the Future. J. Travel Res. 2021, 60, 1371–1376. [CrossRef]
40. Erevelles, S.; Fukawa, N.; Swayne, L. Big Data consumer analytics and the transformation of marketing. J. Bus. Res. 2016,69, 897–904. [CrossRef]
41. Cheng, M.; Jin, X. What do Airbnb users care about? An analysis of online review comments. Int J. Hosp. Manag. 2019, 76, 58–70.[CrossRef]
42. Golmohammadi, A.R.; Jahandideh, B.; O′Gorman, K.D. Booking on-line or not: A decision rule approach. Tour. Manag. Perspect.2012, 2, 85–88. [CrossRef]
Sustainability 2022, 14, 1800 22 of 22
43. Moro, S.; Rita, P.; Coelho, J. Stripping customers′ feedback on hotels through data mining: The case of Las Vegas Strip. Tour.Manag. Perspect. 2017, 23, 41–52. [CrossRef]
44. Khade, A.A. Performing customer behavior analysis using big data analytics. Procedia Comput. Sci. 2016, 79, 986–992. [CrossRef]45. Christodoulou, E.; Gregoriades, A.; Pampaka, M.; Herodotou, H. Combination of Topic Modelling and Decision Tree Classification for
Tourist Destination Marketing; Springer International Publishing: Cham, Switzerland, 2020; pp. 95–108.46. Liu, J.W. Using big data database to construct new GFuzzy text mining and decision algorithm for targeting and classifying
customers. Comput. Ind. Eng. 2019, 128, 1088–1095. [CrossRef]47. SPSS. IBM SPSS Modeler 16 User′s Guide; SPSS: Chicago, IL, USA, 2013.48. Bhandari, A.; Gupta, A.; Das, D. Improvised Apriori Algorithm Using Frequent Pattern Tree for Real Time Applications in Data
Mining. Procedia Comput. Sci. 2015, 46, 644–651. [CrossRef]49. Lee, W.H.; Cheng, C.C. Less is more: A new insight for measuring service quality of green hotels. Int J. Hosp. Manag. 2018,
68, 32–40. [CrossRef]50. Kass, G.V. An Exploratory Technique for Investigating Large Quantities of Categorical Data. Appl. Stat. 1980, 29, 119–127.
[CrossRef]51. SPSS. IBM SPSS Modeler 18.0 Algorithms Guide; SPSS: Chicago, IL, USA, 2016.52. Hung, C. Tree Model: CHAID, C&RT, Boosted Trees & Random; The Data-Shack Limited: London, UK, 2018d; pp. DM0002–DM0003
& DM0005–DM0006.53. Breiman, L.; Friedman, J.; Olshen, R.; Stone, C. Cart. Classification and Regression Trees; Wadsworth and Brooks/Cole: Monterey,
CA, USA, 1984.54. SPSS. IBM SPSS Modeler 18.0 Modeling: Nodes; SPSS: Chicago, IL, USA, 2016.55. TripAdvisor London 2018: Best of London, England Tourism—TripAdvisor Hotel Statistics. Available online: https://www.
tripadvisor.com/Tourism-g186338-London_England-Vacations.html (accessed on 9 November 2018).56. Stringam, B.B.; Gerdes, J. An Analysis of Word-of-Mouse Ratings and Guest Comments of Online Hotel Distribution Sites. J.
Hosp. Mark. Manag. 2010, 19, 773–796. [CrossRef]57. Huang, J. The dining experience of Beijing Roast Duck: A comparative study of the Chinese and English online consumer reviews.
Int J. Hosp. Manag. 2017, 66, 117–129. [CrossRef]58. Gerdt, S.O.; Wagner, E.; Schewe, G. The relationship between sustainability and customer satisfaction in hospitality: An
explorative investigation using eWOM as a data source. Tour. Manag. 2019, 74, 155–172. [CrossRef]59. Lombard, M.; Snyder-Duch, J.; Bracken, C.C. Content analysis in mass communication: Assessment and reporting of intercoder
reliability. Hum. Commun. Res. 2002, 28, 587–604. [CrossRef]60. Cenni, I.; Goethals, P. Negative hotel reviews on TripAdvisor: A cross-linguistic analysis. Discourse Context Media 2017, 16, 22–30.
[CrossRef]61. SPSS. IBM SPSS Decision Tree 2; SPSS: Chicago, IL, USA, 2012.62. Sann, R.; Lai, P.-C.; Chang, H.-C. Does Culture of Origin Have an Impact on Online Complaining Behaviors? The Perceptions of
Asians and Non-Asians. Sustainability 2020, 12, 1838. [CrossRef]63. Sann, R.; Lai, P.C. Understanding homophily of service failure within the hotel guest cycle: Applying NLP-aspect-based sentiment
analysis to the hospitality industry. Int J. Hosp. Manag. 2020, 91, 102678. [CrossRef]64. Feickert, J.; Verma, R.; Plaschka, G.; Dev, C.S. Safeguarding your customers: The guest’s view of hotel security. Cornell Hotel.
Restaur. Adm. Q. 2006, 47, 224–244. [CrossRef]
Top Related
Copyright © 2022 FDOKUMEN

