


Bahasa
Halaman
Hukum

SHORT COMMUNICATION
Acoustically induced bubbles in a microfluidic channelfor mixing enhancement
S. S. Wang Æ Z. J. Jiao Æ X. Y. Huang ÆC. Yang Æ N. T. Nguyen
Received: 23 June 2008 / Accepted: 8 October 2008 / Published online: 25 October 2008! Springer-Verlag 2008
Abstract Due to small dimensions and low fluid velocity,mixing in microfluidic systems is usually poor. In this
study, we report a method of enhancing microfluidic
mixing using acoustically induced gas bubbles. The effectof applied frequency on mixing was investigated over the
range 0.5–10 kHz. Under either low frequency 0.5 kHz or
high frequency 10 kHz, no noticeable improvement in thepresent mixer was observed. However, a significant
increase in the mixing efficiency was achieved within a
window of the frequencies between 1.0 and 5.0 kHz. It wasfound in our present microfluidic structure, single (or
multi-) bubble(s) could be acoustically generated under the
frequency ranging from 1.0 to 5.0 kHz by a piezoelectricdisc. The interaction between bubble and acoustic field
causes bubble oscillation which in turn could disturb local
flow field to result in mixing enhancement.
Keywords Microfluidics ! Mixing ! Acoustic cavitation
1 Introduction
Microfluidic devices promise to offer a viable microfluidic
platform for miniature chemical, medical, environmentaland security diagnostic kits as well as well controlled
fundamental chemistry and biology research (Erickson and
Li 2004). The main advantages of microfluidic systemsinclude portability, cost-effective, time reduction, little
sample consumption, and less contamination (Tudos et al.2001). Micromixing is one of important functions of
microfluidic systems; for example the processes such as
DNA hybridization, cell activation, enzyme reactions, andprotein folding require fast reactions that involve mixing of
the regents or/and reactants. However, due to small
dimensions, the Reynolds number is usually quite low, andflow in microfluidic systems is absolutely laminar. As a
result, the mixing is mainly based on molecular diffusion,
and hence long mixing length/time is required and themixing efficiency is poor (Beebe et al. 2002).
In order to achieve complete mixing within a reasonable
time and channel length scale, numerous mixing techniqueshave been developed, and mixing devices can be catego-
rized as either passive mixers or active mixers (Nguyen and
Wu 2005; Hessel et al. 2005). Passive mixers utilize geo-metrical advantages to enhance mixing and they do not
require external forces. Approaches such as lamination
with zig-zag paths (Liau et al. 2005) and splitting andrecombining streams (He et al. 2001) can increase the
interfacial area for diffusion. Using a 3D-serpentine mi-crochannel can generate chaotic advection to stretch and
fold volumes of fluids to be mixed over the cross-section of
channel (Liu et al. 2000; Stroock et al. 2002). A dropletbased microfluidic system was also reported to achieve fast
mixing by inducing chaotic flow inside droplets moving
through winding microchannels (Song et al. 2006). Activemixers utilize external driving forces to disturb the flow to
enhance mixing. Examples are the mixing devices using
oscillating pressure (Glasgow and Aubry 2003), magneto-hydrodynamic (Bau et al. 2001), electrohydrodynamic (El
Moctar et al. 2003), and electrokinetic instability (Oddy
et al. 2001) and electrokinetic heterogeneity (Biddiss et al.2004). In the literature, several studies on acoustic field
enhanced microfluidic mixing were reported. Yang et al.
S. S. Wang ! Z. J. Jiao ! X. Y. Huang ! C. Yang (&) !N. T. NguyenSchool of Mechanical and Aerospace Engineering,Nanyang Technological University,Singapore, Singaporee-mail: [email protected]
123
Microfluid Nanofluid (2009) 6:847–852
DOI 10.1007/s10404-008-0357-6
(2001) designed an ultrasonic micromixer based on ultra-
sonic vibration produced by a PZT diaphragm excited with60 kHz and 50 Vpp. The mixer chamber was fabricated
using silicon wafer covered with glass. However, it still
needs long time to achieve complete mixing in this device.Another drawback is that the rate of mixing could not be
increased with input power and there is a problem associ-
ated with temperature rise induced by high-frequencyultrasonic irradiation. Liu et al. (2002) developed an
acoustic micromixer relying on bubble oscillation to inducesecondary flow similar to a sink-source flow pattern. It was
demonstrated that complete mixing can be achieved within
several tens of seconds, with a significant improvementcompared to the mixing time reported by Yang et al.
(2001). Low energy was consumed with 2.0 kHz and
5 Vpp. However, foreign gas bubbles were needed to beintroduced and trapped on the mixer chamber wall.
In this communication, we report a technique to enhance
mixing in a polymer based microfluidic structure usingacoustically induced gas bubbles by a piezoelectric unit. It
will be demonstrated that in the present microfluidic
structure, enhanced mixing can be achieved under a win-dow of applied acoustic actuation frequencies. Different
from Yang et al. (2001)’s work where no gas bubble was
present, the mixing enhancement is achieved throughacoustically generated gas bubbles, and the required fre-
quency is much lower so that the problem associated with
temperature rise due to acoustic irradiation can be reduced.Compared to Liu et al. (2002)’s study where a foreign
bubble is needed to be trapped on the mixer chamber wall,
the gas bubble in our case is automatically generated byacoustic field so that we can have a better control. Exper-
iments were conducted to study the effect of applied
frequency on the mixing processes over the frequencyrange 0.5–10 kHz.
2 Experimental
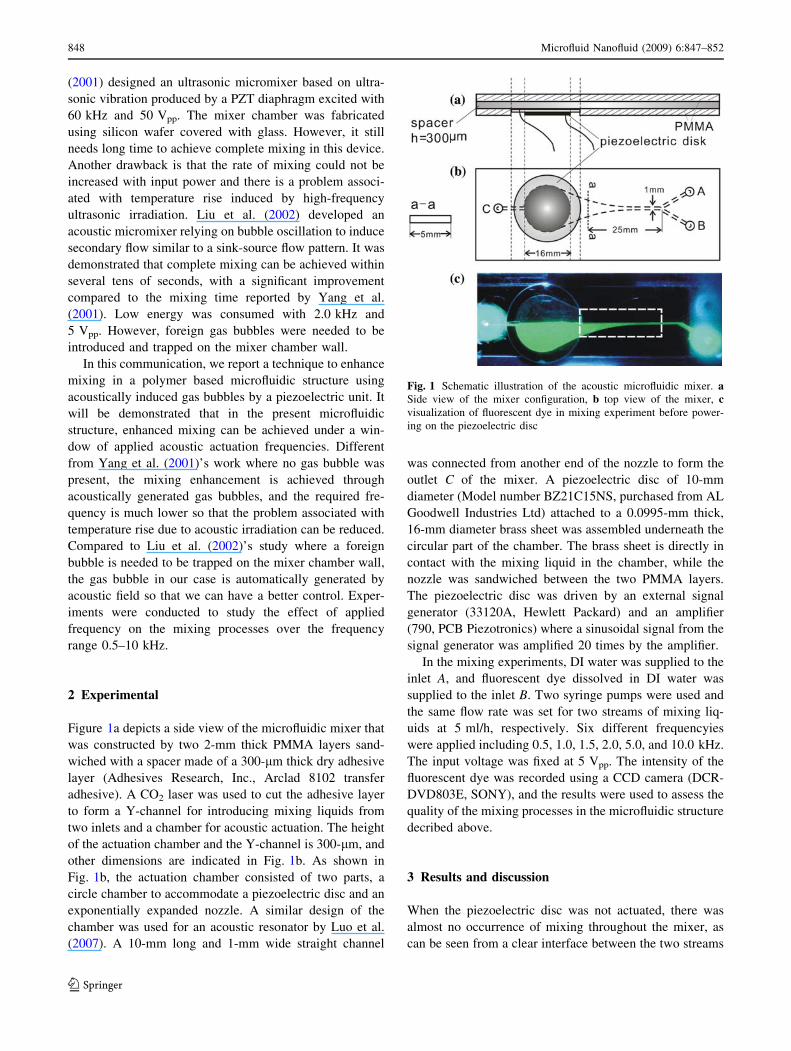
Figure 1a depicts a side view of the microfluidic mixer thatwas constructed by two 2-mm thick PMMA layers sand-
wiched with a spacer made of a 300-lm thick dry adhesive
layer (Adhesives Research, Inc., Arclad 8102 transferadhesive). A CO2 laser was used to cut the adhesive layer
to form a Y-channel for introducing mixing liquids from
two inlets and a chamber for acoustic actuation. The heightof the actuation chamber and the Y-channel is 300-lm, and
other dimensions are indicated in Fig. 1b. As shown in
Fig. 1b, the actuation chamber consisted of two parts, acircle chamber to accommodate a piezoelectric disc and an
exponentially expanded nozzle. A similar design of the
chamber was used for an acoustic resonator by Luo et al.(2007). A 10-mm long and 1-mm wide straight channel
was connected from another end of the nozzle to form theoutlet C of the mixer. A piezoelectric disc of 10-mm
diameter (Model number BZ21C15NS, purchased from AL
Goodwell Industries Ltd) attached to a 0.0995-mm thick,16-mm diameter brass sheet was assembled underneath the
circular part of the chamber. The brass sheet is directly in
contact with the mixing liquid in the chamber, while thenozzle was sandwiched between the two PMMA layers.
The piezoelectric disc was driven by an external signal
generator (33120A, Hewlett Packard) and an amplifier(790, PCB Piezotronics) where a sinusoidal signal from the
signal generator was amplified 20 times by the amplifier.
In the mixing experiments, DI water was supplied to theinlet A, and fluorescent dye dissolved in DI water was
supplied to the inlet B. Two syringe pumps were used and
the same flow rate was set for two streams of mixing liq-uids at 5 ml/h, respectively. Six different frequencyies
were applied including 0.5, 1.0, 1.5, 2.0, 5.0, and 10.0 kHz.
The input voltage was fixed at 5 Vpp. The intensity of thefluorescent dye was recorded using a CCD camera (DCR-
DVD803E, SONY), and the results were used to assess the
quality of the mixing processes in the microfluidic structuredecribed above.
3 Results and discussion
When the piezoelectric disc was not actuated, there wasalmost no occurrence of mixing throughout the mixer, as
can be seen from a clear interface between the two streams
Fig. 1 Schematic illustration of the acoustic microfluidic mixer. aSide view of the mixer configuration, b top view of the mixer, cvisualization of fluorescent dye in mixing experiment before power-ing on the piezoelectric disc
848 Microfluid Nanofluid (2009) 6:847–852
123
of liquids shown in Fig. 1c. This should be expected
because the characteristic Reynolds number is of orderO(1) (estimated from the characteristic velocity, 10-mm/s,
the characteristic hydraulic diameter, 0.46-mm, and the
kinetic viscosity, 1-mm2/s), suggesting that the mixing inthis laminar flow case is dominated by molecular diffusion
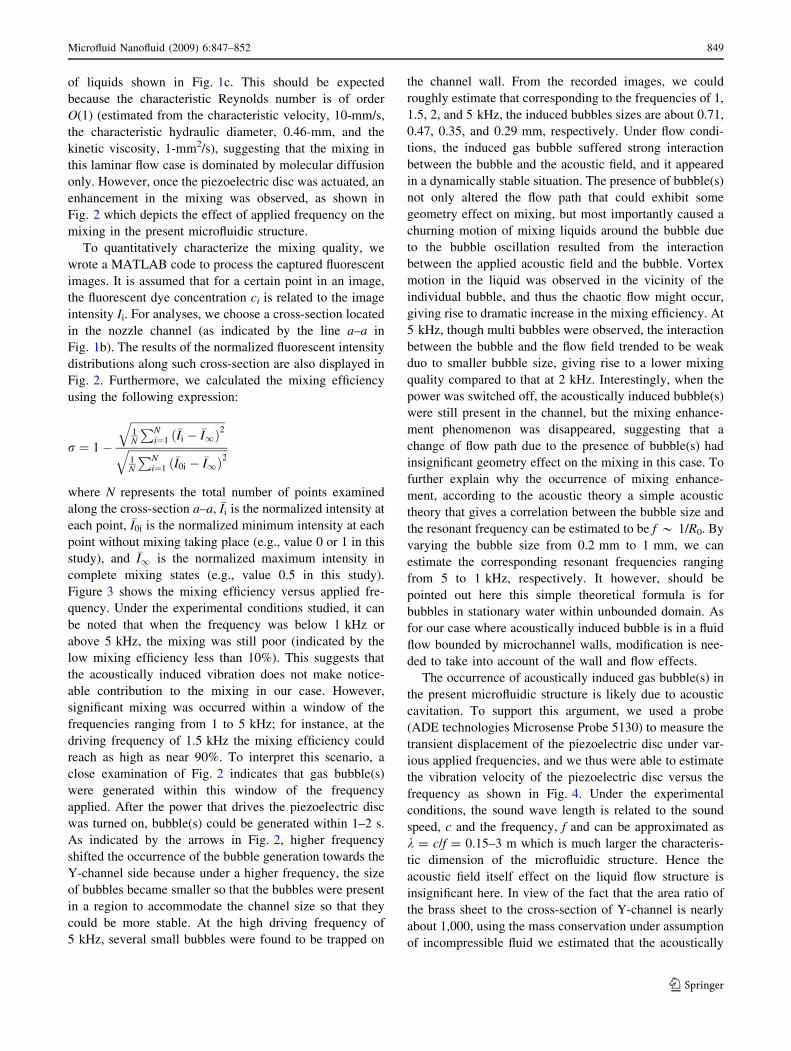
only. However, once the piezoelectric disc was actuated, an
enhancement in the mixing was observed, as shown inFig. 2 which depicts the effect of applied frequency on the
mixing in the present microfluidic structure.To quantitatively characterize the mixing quality, we
wrote a MATLAB code to process the captured fluorescent
images. It is assumed that for a certain point in an image,the fluorescent dye concentration ci is related to the image
intensity Ii. For analyses, we choose a cross-section located
in the nozzle channel (as indicated by the line a–a inFig. 1b). The results of the normalized fluorescent intensity
distributions along such cross-section are also displayed in
Fig. 2. Furthermore, we calculated the mixing efficiencyusing the following expression:
r " 1#
!!!!!!!!!!!!!!!!!!!!!!!!!!!!!!!!!!1N
PNi"1
!Ii # !I1$ %2q
!!!!!!!!!!!!!!!!!!!!!!!!!!!!!!!!!!!!1N
PNi"1
!I0i # !I1$ %2q
where N represents the total number of points examinedalong the cross-section a–a, !Ii is the normalized intensity at
each point, !I0i is the normalized minimum intensity at each
point without mixing taking place (e.g., value 0 or 1 in thisstudy), and !I1 is the normalized maximum intensity in
complete mixing states (e.g., value 0.5 in this study).
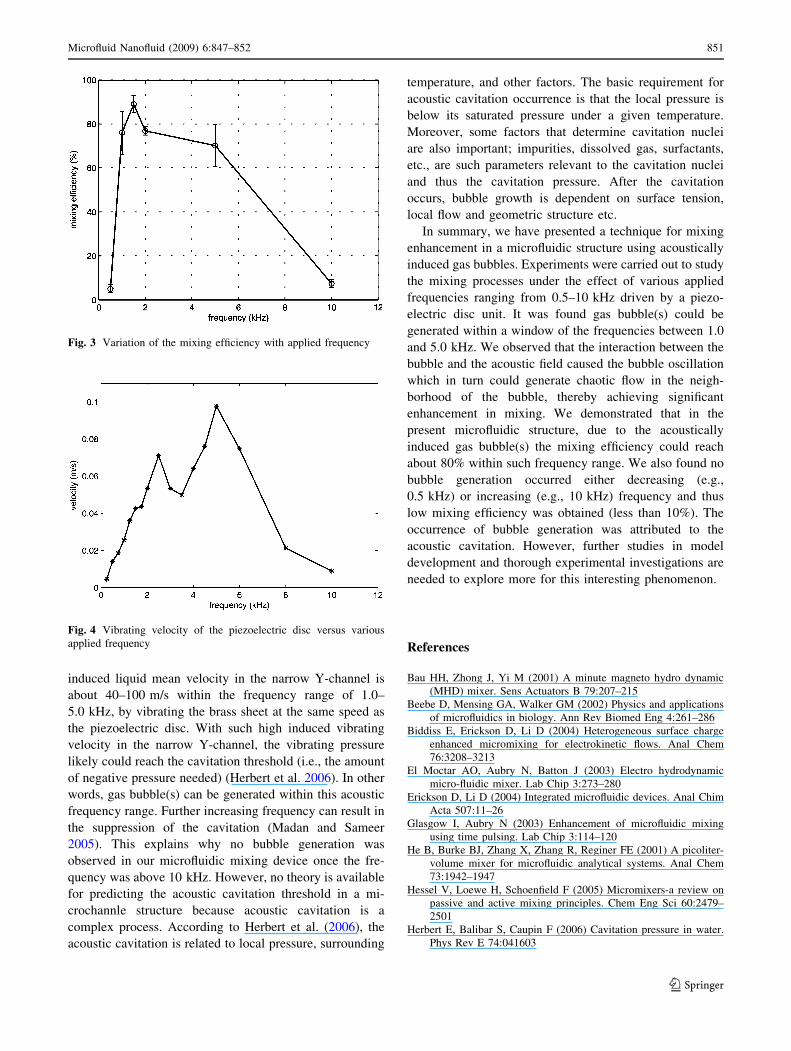
Figure 3 shows the mixing efficiency versus applied fre-quency. Under the experimental conditions studied, it can
be noted that when the frequency was below 1 kHz or
above 5 kHz, the mixing was still poor (indicated by thelow mixing efficiency less than 10%). This suggests that
the acoustically induced vibration does not make notice-
able contribution to the mixing in our case. However,significant mixing was occurred within a window of the
frequencies ranging from 1 to 5 kHz; for instance, at the
driving frequency of 1.5 kHz the mixing efficiency couldreach as high as near 90%. To interpret this scenario, a
close examination of Fig. 2 indicates that gas bubble(s)
were generated within this window of the frequencyapplied. After the power that drives the piezoelectric disc
was turned on, bubble(s) could be generated within 1–2 s.As indicated by the arrows in Fig. 2, higher frequency
shifted the occurrence of the bubble generation towards the
Y-channel side because under a higher frequency, the sizeof bubbles became smaller so that the bubbles were present
in a region to accommodate the channel size so that they
could be more stable. At the high driving frequency of5 kHz, several small bubbles were found to be trapped on
the channel wall. From the recorded images, we could
roughly estimate that corresponding to the frequencies of 1,
1.5, 2, and 5 kHz, the induced bubbles sizes are about 0.71,0.47, 0.35, and 0.29 mm, respectively. Under flow condi-
tions, the induced gas bubble suffered strong interaction
between the bubble and the acoustic field, and it appearedin a dynamically stable situation. The presence of bubble(s)
not only altered the flow path that could exhibit some
geometry effect on mixing, but most importantly caused achurning motion of mixing liquids around the bubble due
to the bubble oscillation resulted from the interactionbetween the applied acoustic field and the bubble. Vortex
motion in the liquid was observed in the vicinity of the
individual bubble, and thus the chaotic flow might occur,giving rise to dramatic increase in the mixing efficiency. At
5 kHz, though multi bubbles were observed, the interaction
between the bubble and the flow field trended to be weakduo to smaller bubble size, giving rise to a lower mixing
quality compared to that at 2 kHz. Interestingly, when the
power was switched off, the acoustically induced bubble(s)were still present in the channel, but the mixing enhance-
ment phenomenon was disappeared, suggesting that a
change of flow path due to the presence of bubble(s) hadinsignificant geometry effect on the mixing in this case. To
further explain why the occurrence of mixing enhance-
ment, according to the acoustic theory a simple acoustictheory that gives a correlation between the bubble size and
the resonant frequency can be estimated to be f * 1/R0. By
varying the bubble size from 0.2 mm to 1 mm, we canestimate the corresponding resonant frequencies ranging
from 5 to 1 kHz, respectively. It however, should be
pointed out here this simple theoretical formula is forbubbles in stationary water within unbounded domain. As
for our case where acoustically induced bubble is in a fluid
flow bounded by microchannel walls, modification is nee-ded to take into account of the wall and flow effects.
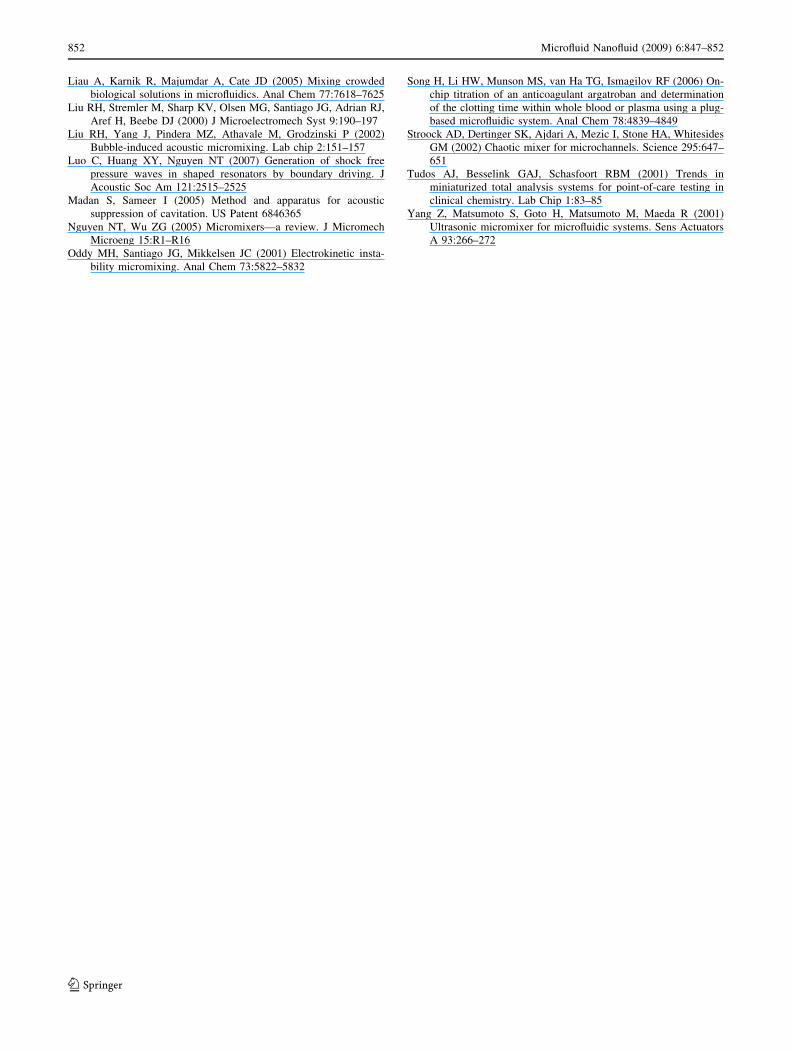
The occurrence of acoustically induced gas bubble(s) in
the present microfluidic structure is likely due to acousticcavitation. To support this argument, we used a probe
(ADE technologies Microsense Probe 5130) to measure the
transient displacement of the piezoelectric disc under var-ious applied frequencies, and we thus were able to estimate
the vibration velocity of the piezoelectric disc versus the
frequency as shown in Fig. 4. Under the experimentalconditions, the sound wave length is related to the sound
speed, c and the frequency, f and can be approximated as
k = c/f = 0.15–3 m which is much larger the characteris-tic dimension of the microfluidic structure. Hence the
acoustic field itself effect on the liquid flow structure is
insignificant here. In view of the fact that the area ratio ofthe brass sheet to the cross-section of Y-channel is nearly
about 1,000, using the mass conservation under assumption
of incompressible fluid we estimated that the acoustically
Microfluid Nanofluid (2009) 6:847–852 849
123
Fig. 2 Visualization and inten-sity distribution of fluorescentdye in the mixer for variousapplied frequencies. Theexperimental images (left) usedfor assessing mixing quality aretaken from the region indicatedby the dashed-line rectangle inFig. 1c. Arrows show thelocation of acoustically inducedgas bubbles. The fluorescentintensity distribution (right) areobtained by digitized thefluorescent images along thecross-section, a–a shown inFig. 1b
850 Microfluid Nanofluid (2009) 6:847–852
123
induced liquid mean velocity in the narrow Y-channel isabout 40–100 m/s within the frequency range of 1.0–
5.0 kHz, by vibrating the brass sheet at the same speed as
the piezoelectric disc. With such high induced vibratingvelocity in the narrow Y-channel, the vibrating pressure
likely could reach the cavitation threshold (i.e., the amount
of negative pressure needed) (Herbert et al. 2006). In otherwords, gas bubble(s) can be generated within this acoustic
frequency range. Further increasing frequency can result in
the suppression of the cavitation (Madan and Sameer2005). This explains why no bubble generation was
observed in our microfluidic mixing device once the fre-
quency was above 10 kHz. However, no theory is availablefor predicting the acoustic cavitation threshold in a mi-
crochannle structure because acoustic cavitation is a
complex process. According to Herbert et al. (2006), theacoustic cavitation is related to local pressure, surrounding
temperature, and other factors. The basic requirement for
acoustic cavitation occurrence is that the local pressure isbelow its saturated pressure under a given temperature.
Moreover, some factors that determine cavitation nuclei
are also important; impurities, dissolved gas, surfactants,etc., are such parameters relevant to the cavitation nuclei
and thus the cavitation pressure. After the cavitation
occurs, bubble growth is dependent on surface tension,local flow and geometric structure etc.
In summary, we have presented a technique for mixingenhancement in a microfluidic structure using acoustically
induced gas bubbles. Experiments were carried out to study
the mixing processes under the effect of various appliedfrequencies ranging from 0.5–10 kHz driven by a piezo-
electric disc unit. It was found gas bubble(s) could be
generated within a window of the frequencies between 1.0and 5.0 kHz. We observed that the interaction between the
bubble and the acoustic field caused the bubble oscillation
which in turn could generate chaotic flow in the neigh-borhood of the bubble, thereby achieving significant
enhancement in mixing. We demonstrated that in the
present microfluidic structure, due to the acousticallyinduced gas bubble(s) the mixing efficiency could reach
about 80% within such frequency range. We also found no
bubble generation occurred either decreasing (e.g.,0.5 kHz) or increasing (e.g., 10 kHz) frequency and thus
low mixing efficiency was obtained (less than 10%). The
occurrence of bubble generation was attributed to theacoustic cavitation. However, further studies in model
development and thorough experimental investigations are
needed to explore more for this interesting phenomenon.
References
Bau HH, Zhong J, Yi M (2001) A minute magneto hydro dynamic(MHD) mixer. Sens Actuators B 79:207–215
Beebe D, Mensing GA, Walker GM (2002) Physics and applicationsof microfluidics in biology. Ann Rev Biomed Eng 4:261–286
Biddiss E, Erickson D, Li D (2004) Heterogeneous surface chargeenhanced micromixing for electrokinetic flows. Anal Chem76:3208–3213
El Moctar AO, Aubry N, Batton J (2003) Electro hydrodynamicmicro-fluidic mixer. Lab Chip 3:273–280
Erickson D, Li D (2004) Integrated microfluidic devices. Anal ChimActa 507:11–26
Glasgow I, Aubry N (2003) Enhancement of microfluidic mixingusing time pulsing. Lab Chip 3:114–120
He B, Burke BJ, Zhang X, Zhang R, Reginer FE (2001) A picoliter-volume mixer for microfluidic analytical systems. Anal Chem73:1942–1947
Hessel V, Loewe H, Schoenfield F (2005) Micromixers-a review onpassive and active mixing principles. Chem Eng Sci 60:2479–2501
Herbert E, Balibar S, Caupin F (2006) Cavitation pressure in water.Phys Rev E 74:041603
Fig. 3 Variation of the mixing efficiency with applied frequency
Fig. 4 Vibrating velocity of the piezoelectric disc versus variousapplied frequency
Microfluid Nanofluid (2009) 6:847–852 851
123
Liau A, Karnik R, Majumdar A, Cate JD (2005) Mixing crowdedbiological solutions in microfluidics. Anal Chem 77:7618–7625
Liu RH, Stremler M, Sharp KV, Olsen MG, Santiago JG, Adrian RJ,Aref H, Beebe DJ (2000) J Microelectromech Syst 9:190–197
Liu RH, Yang J, Pindera MZ, Athavale M, Grodzinski P (2002)Bubble-induced acoustic micromixing. Lab chip 2:151–157
Luo C, Huang XY, Nguyen NT (2007) Generation of shock freepressure waves in shaped resonators by boundary driving. JAcoustic Soc Am 121:2515–2525
Madan S, Sameer I (2005) Method and apparatus for acousticsuppression of cavitation. US Patent 6846365
Nguyen NT, Wu ZG (2005) Micromixers—a review. J MicromechMicroeng 15:R1–R16
Oddy MH, Santiago JG, Mikkelsen JC (2001) Electrokinetic insta-bility micromixing. Anal Chem 73:5822–5832
Song H, Li HW, Munson MS, van Ha TG, Ismagilov RF (2006) On-chip titration of an anticoagulant argatroban and determinationof the clotting time within whole blood or plasma using a plug-based microfluidic system. Anal Chem 78:4839–4849
Stroock AD, Dertinger SK, Ajdari A, Mezic I, Stone HA, WhitesidesGM (2002) Chaotic mixer for microchannels. Science 295:647–651
Tudos AJ, Besselink GAJ, Schasfoort RBM (2001) Trends inminiaturized total analysis systems for point-of-care testing inclinical chemistry. Lab Chip 1:83–85
Yang Z, Matsumoto S, Goto H, Matsumoto M, Maeda R (2001)Ultrasonic micromixer for microfluidic systems. Sens ActuatorsA 93:266–272
852 Microfluid Nanofluid (2009) 6:847–852
123
Top Related
Copyright © 2022 FDOKUMEN

