


Bahasa
Halaman
Hukum


GENES, CHROMOSOMES & CANCER 00:000–000 (2012)
Aberrant Promoter Methylation of Beta-1,4Galactosyltransferase 1 as Potential Cancer-SpecificBiomarker of Colorectal Tumors
Maria Luana Poeta,1*† Emanuela Massi,2† Paola Parrella,3 Pasquale Pellegrini,2,4 Mariangela De Robertis,2
Massimiliano Copetti,3 Carla Rabitti,5 Giuseppe Perrone,5 Andrea Onetti Muda,5 Francesca Molinari,6
Elena Zanellato,6 Stefano Crippa,6 Damiano Caputo,7 Marco Caricato,7 Milo Frattini,6 Roberto Coppola,7
and Vito Michele Fazio2,3
1Departmentof Bioscience,Biotechnologyand Pharmacological Sciences,Universityof Bari,Italy2Laboratory for Molecular Medicine and Biotechnology,CIR,University Campus Bio-Medico of Rome,Italy3Laboratoryof Oncology,IRCCSCasa Sollievo della Sofferenza,San Giovanni Rotondo,FG,Italy4Cancer Epigenetics and Biology Program (PEBC),Bellvitge Institute for Biomedical Research (IDIBELL),Barcelona,Spain5Departmentof Pathology,University Campus Bio-Medico of Rome,Italy6Institute of Pathology,Locarno,Switzerland7Departmentof Surgery,University Campus Bio-Medico of Rome,Italy
Epigenetic alterations, such as CpG islands methylation and histone modifications, are recognized key characteristics of
cancer. Glycogenes are a group of genes which epigenetic status was found to be changed in several tumors. In this study,
we determined promoter methylation status of the glycogene beta-1,4-galactosyltransferase 1 (B4GALT1) in colorectal can-
cer patients. Methylation status of B4GALT1 was assessed in 130 colorectal adenocarcinomas, 13 adenomas, and in paired
normal tissue using quantitative methylation specific PCR (QMSP). B4GALT1 mRNA expression was evaluated in methyl-
ated/unmethylated tumor and normal specimens. We also investigated microsatellite stability and microsatellite instability
status and KRAS/BRAF mutations. Discriminatory power of QMSP was assessed by receiving operating curve (ROC) analysis
on a training set of 24 colorectal cancers and paired mucosa. The area under the ROC curve (AUC) was 0.737 (95%
confidence interval [CI]:0.591–0.881, P ¼ 0.005) with an optimal cutoff value of 2.07 yielding a 54% sensitivity (95%
CI: 35.1%–72.1%) and a specificity of 91.7% (95% CI: 74.1%–97.7%). These results were confirmed in an independent vali-
dation set where B4GALT1 methylation was detected in 52/106 patients. An inverse correlation was observed between
methylation and B4GALT1 mRNA expression levels (r ¼ �0.482, P ¼ 0.037). Significant differences in methylation levels
and frequencies was demonstrated in invasive lesions as compared with normal mucosa (P ¼ 0.0001) and in carcinoma
samples as compared with adenoma (P ¼ 0.009). B4GALT1 methylation is a frequent and specific event in colorectal cancer
and correlates with downregulation of mRNA expression. These results suggest that the glycogene B4GALT1 represent a
valuable candidate biomarker of invasive phenotype of colorectal cancer. VVC 2012 Wiley Periodicals, Inc.
INTRODUCTION
Colorectal cancer (CRC) represents the third
most commonly diagnosed malignancy in males
and the second in females world-wide, with over
1.2 million of new cases and over 600 thousand
deaths estimated to have occurred in 2008 (Jemal
et al., 2010; 2011). An effective screening for pre-
malignant adenomas and early stage cancers
would have substantial clinical benefits, and
would reduce the mortality of patients with CRC
(Levin et al., 2008; Rennert et al., 2009; Smith
et al., 2011). In recent time, the United States is
the only country where a significant decrease in
incidence rates was recorded in both males and
females, reflecting the relevant impact of early
detection and removal of precancerous lesions
through CRC screening programs (Whitlock
et al., 2008; Center et al., 2009; Edwards et al.,
2010). Despite significant improvements in
screening methods for CRC, only 30%–40% of
patients are diagnosed at an early stage (Smith
Additional Supporting Information may be found in the onlineversion of this article.
Supported by: AIRC MFAG 10520; Progetto ITINERIS 2FILAS Regione Lazio ‘‘articolo 180 comma 4 lettera C) L.R.04/06-Azioni Verticali’’. E. Massi is recipient of a post-doctoral fel-lowship from University Campus Bio-Medico of Rome (BandoAteneo 2009), Center for Integrated Research.
yThese authors contributed equally to this work.
*Correspondence to: Maria Luana Poeta, Department of Bio-science, Biotechnology and Pharmacological Sciences, Universityof Bari, Via Amendola 165/A, 70126, Bari, Italy.E-mail: [email protected]
Received 13 January 2012; Accepted 25 July 2012
DOI 10.1002/gcc.21998
Published online inWiley Online Library (wileyonlinelibrary.com).
RESEARCH ARTICLE
VVC 2012 Wiley Periodicals, Inc.

et al., 2006). Several molecular markers have
been proposed for diagnostic, prognostic, and sur-
veillance purpose in CRC, but their clinical util-
ity remain controversial, due to the lack of
sensitivity and specificity. The first step of a bio-
marker discovery pipeline begins with preclinical
studies and requires a comparison between tumor
tissues and non-tumor tissues. A panel of differ-
ent genes can help reach higher sensitivity levels,
but a more critical issue in CRC screening is
specificity. Specificity is a very high priority for
screening markers as recommended by Early
Detection Research Network, given that even a
small false-positive rate translates itself into a
large number of people subjected to unnecessary
costly diagnostic procedures (Pepe et al., 2001).
CRC arises as a multistep process involving pro-
gressive accumulation of genetic (Fearon and
Vogelstein, 1990) and epigenetic alterations
(Grady and Markowitz, 2002; Herceg and Hainaut,
2007), which could be used as markers for CRC
(Verma and Manne, 2006; Corvalan and Maturana,
2010). Aberrant methylation of CpG islands at the
promoter region of a gene is an epigenetic change
that induces the transcriptional silencing of tumor
suppressor genes (TSGs) (Herman and Baylin,
2003; Ballestar and Esteller, 2008). Hypermethyl-
ation of CpG islands in TSGs has been reported
for several human cancers, including CRCs (Jones
and Baylin, 2007; Rodrıguez-Paredes and Esteller,
2011; van Engeland et al., 2011). The epigenetic
progenitor stem cell model of carcinogenesis
(Feinberg et al., 2006; Mathews et al., 2009;
Yamada and Watanabe, 2010; Tsai and Baylin,
2011) and the specificity of cancer-related epige-
netic modifications strongly support these new mo-
lecular markers for early diagnosis (Hoque et al.,
2006a, b; Schmid, 2010), prognosis (Herranz and
Esteller, 2007), follow-up and therapy response
(Parrella et al., 2009; Sharma et al., 2009). Although
hypermethylated TSGs have been proposed as in-
triguing biomarkers for CRC, only few genes har-
boring high level of specificity have been
identified (Lind et al., 2011).
Previous studies included a genome-wide
methylation analysis using a new promoter struc-
ture algorithm and microarray data sets generated
from 20 cancer cell lines of five different major
cancers treated with demethylating agent 5-aza-
2’-deoxycytidine (Hoque et al., 2008). The aim of
the present study was to identify novel cancer
specific methylated genes. Preliminary data
obtained using bisulfite DNA sequencing and
MSP (methylation specific PCR) in colon cancer
cell lines and tissues samples allowed us to
identify novel cancer-specific methylated genes,
thus showing a methylation frequency ranging
from 60% to 100%. Among cancer-specific meth-
ylated genes in CRC we found that the promoter
of the glycogene beta-1,4-galactosyltransferase 1
(B4GALT1) was hypermethylated in colon cancer
cells and in an initial set of tumor primary tissues
(Hoque et al., 2008, Kim et al., 2009). Despite
the fact that DNA methylation, histone modifica-
tion, chromatin remodeling, and noncoding RNA
have been identified as fundamental elements
controlling gene expression, only a few studies
have investigated the epigenetic mechanisms
underlying aberrant expression of glycan genes in
cancer cells. In this study, we validated the pro-
moter methylation status of B4GALT1 in an inde-
pendent and large series of 130 CRCs and paired
histopathologically normal colonic mucosa. We
found that B4GALT1 aberrant promoter methyla-
tion is associated with reduced mRNA expression
in tumor tissues as compared with normal tissues
and unmethylated cancer cases. We further inves-
tigated the relationship between the methylation
status of B4GALT1 and KRAS/BRAF mutation
status in microsatellite stable and microsatellite
instable (MSI) CRC. Synchronous colon adeno-
mas have been analyzed. Although they harbored
some degree of methylation at B4GALT1 pro-
moter, only invasive lesions showed a statistically
significant difference in methylation levels and
frequencies, compared with normal colic mucosa.
MATERIALS AND METHODS
CRC Patient Samples
A total of 130 CRC and paired normal samples
were retrospectively collected from the archive of
the department of pathology of two hospitals
(University of Campus Bio-Medico of Rome,
Italy N ¼ 52 cases; Institute of Pathology,
Locarno Switzerland N ¼ 78 cases) and stored in
accordance with institutional guidelines.
Fifty-two cases were immediately frozen after
surgery and kept at �80�C until nucleic acid
extraction. Seventy-eight cases consisting of tu-
mor and paired normal mucosa were formalin-
fixed paraffin embedded specimens (FFPE). Syn-
chronous adenocarcinoma, adenoma, and normal
colonic mucosa were obtained from 13 cases
(Institute of Pathology, Locarno). Twenty-four
cases have been used as training set and 106
specimens represented a validation set.
2 POETA ETAL.
Genes, Chromosomes & Cancer DOI 10.1002/gcc

Tumor samples with at least 70% cancer cells
were eligible for molecular studies. Tumors with
low neoplastic cellularity (<70%) were microdis-
sected to enrich the malignant cells.
Pathological data of 130 patients included pT,
pN, and pM classification, grading, histologic sub-
type, tumor location, and stage. Clinical data,
including gender, age, and follow-up times were
retrieved for the 52 Italian cohort of patients,
with a median follow-up time of 66 months
(range 1–93 months). All human materials used in
the study were collected according to the guide-
lines of the Local Ethical Committee. Prior writ-
ten and informed consent was obtained from each
patient accordingly with institutional guidelines.
DNA and RNA Extraction
Colon tumor and normal mucosa samples were
rapidly frozen at –80�C (52/130) or paraffin-em-
bedded (78/130). A series of 5-micron sections
were cut from the primary tumor specimens for
hematoxylin-eosin staining to inspect the presence
of neoplastic cells and to ensure absence of neo-
plastic cells in normal mucosa specimens. From
frozen tissues, additional 12 micron sections were
cut and placed in 1% SDS and proteinase K at
48�C overnight followed by DNA extraction with
phenol/chloroform and precipitated with ethanol.
From FFPE specimens, 10 micron sections were
used for DNA extraction using the QIAamp Mini
kit (Qiagen, Chatsworth, CA) according to the
manufacturer’s instructions. Total RNA was also
available for a subset (n ¼ 19) of the Italian CRC
patients. Total RNA was extracted using the Invi-
trogen TRIzol reagent (Carlsbad, CA). DNA and
RNA concentrations were quantified by the ab-
sorbance measurement at 260 and 280 nm using
the Nanodrop spectrophotometer.
Bisulfite Treatment and Quantitative
Methylation Specific PCR
Two lg of DNA extracted from tumor, ade-
noma, and normal colon mucosa was subjected to
bisulfite treatment and DNA purification using
the Epitect Bisulfite kit (Qiagen Sci, MD)
according to manufacturer’s instructions.
Bisulfite-modified DNA was used as template
for fluorescence-based real-time quantitative meth-
ylation specific PCR (QMSP) as previously
described (Hoque et al., 2006b). Amplification
reactions were carried out in triplicate in a volume
of 20 lL that contained 90 ng of bisulfite-modified
DNA, 600 nM forward and reverse primers, 200 nMprobe, 0.6 U of Platinum Taq polymerase
(Invitrogen, Inc., Rockville, MD), 200 lM each of
dATP, dCTP, dGTP, and dTTP, and 5.5 mMMgCl2. Primers and probe of the gene of interest
(B4GALT1 Forward 50-TAGGAAACGGGTTTCG
ACG-30, Reverse 50-CCGTCCACTTTCTTTA
CCG-30, probe 50-CGTTAAACAACGAAATCCA
ACCGAA-30) were designed to amplify specifically
the bisulfite modified region containing the puta-
tive methylated CpGs, whereas primers and probe
for the reference gene (ACTB Forward 50-TGG
TGATGGAGGAGGTTTAGTAAGT-30, Reverse50-AACCAATAAAACCTACTCCTCCCTTAA-30,probe 50-ACCACCACCCAACACACAATAACAA
ACACA-30) were designed to amplify specifically a
bisulfite modified region not containing CpGs. The
genomic region of B4GALT1 where CpG have been
analysed for methylation status is shown in the Fig-
ure 1, Supporting Information. Amplifications were
carried out using the following conditions: one step
at 95�C for 2 min, 40 cycles at 95�C for 15 sec, and
56�C for 1 min. Amplification reactions were carried
out in 384-well plates in a 7900HT Fast Real Time
PCR Systems (Applied Biosystems, Carlsbad, CA)
and were analyzed by sequence detection system
2.3 software (Applied Biosystems, Foster City, CA).
Serial dilutions (90–0.009 ng) of CpGenomeTM
Universal Methylated DNA (Serologicals Corp.,
Norcross, GA) were used to construct a calibration
curve for both target and reference gene. Each
plate included calibration curves for the ACTB and
B4GALT1 genes, patient DNA samples, positive
Figure 1. Box plot for B4GALT1/ACT ratios determined by QMSPin tumor samples (n ¼ 24) and normal paired colonic tissue (n ¼24). The boxes mark the IQR (interval between the 25th and 75thpercentile). The lines inside the boxes denote median values. Thewhiskers represent the interval between the 10th and 90th percen-tiles (Mann-Whitney U test P ¼ 0.001). The asterisks (*) indicate out-liers. [Color figure can be viewed in the online issue, which isavailable at wileyonlinelibrary.com.]
B4GALT1 PROMOTER HYPERMETHYLATION IN COLORECTAL CANCER 3
Genes, Chromosomes & Cancer DOI 10.1002/gcc
control (CpGenomeTM Universal Methylated
DNA, Serologicals Corp., Norcross, GA) and multi-
ple water blanks. For each sample, the analysis
was repeated in two separate plates. The number
of cycles at which the fluorescence signal crossed a
detection threshold was determined automatically
with the ABI PRISM 7900HT Sequence Detec-
tion System Software, and referred to as CT (cycle
threshold). CTs average value of triplicates for all
samples were converted to a relative ‘‘quantity’’
scale using a standard curve of serially diluted
methylated DNA. The level of methylated DNA
in each sample was determined as a ratio of
B4GALT1 quantity to ACTB quantity and then
multiplied by 1,000 for easier tabulation
(B4GALT1 Qty/ACTB Qty � 1,000) (Ostrow
et al., 2010; Durr et al., 2010). The samples were
categorized as unmethylated or methylated based
on optimal cutoff derived from receiving operating
curve (ROC) analysis.
Real Time RT-PCR
One lg of RNA was reverse-transcribed using
High Capacity cDNA Reverse Transcription kit
(Applied Biosystems) and RNasin Plus RNAse In-
hibitor (Promega Corporation). Quantitative fluo-
rescence-based reverse transcription PCR (RT-
qPCR) was set up in 384-well plates in a total vol-
ume of 20 ll containing 2 ll cDNA (100 ng), 1 llB4GALT1 Taqman
VR
Gene Expression Assays
(Assay ID: Hs00155245_m1 Applied Biosystems),
and 10 ll of TaqmanVR
Gene Expression Master
Mix (Applied Biosystems). Reactions were run on
7900HT Fast Real-Time PCR System (Applied
Biosystems) and analyzed by the sequence detec-
tion system 2.3 software (Applied Biosystems).
The target gene transcription levels were normal-
ized using the Gene Expression Assay for Human
Large Ribosomal Protein, RPLPO (Assay ID:
4326314E, Applied Biosystems) as the reference
gene. A relative quantification method with stand-
ard curve was developed, mRNA levels in each
sample were determined as the ratio of the
B4GALT1 expression level to the RPLPO expres-
sion and then multiplied by 1,000 for easier tabu-
lation (B4GALT1/RPLPO � 1,000).
Real Time-PCR was performed using the fol-
lowing thermal conditions: one step at 95�C for
10 min, 40 cycles at 95�C for 15 sec and 60�C for
1 min. Relative expression in tumor samples as
compared with paired normal colon tissue was
calculated according to the following formula:
2�DDCt (see ABI PRISM 7900 Sequence Detec-
tion System User Bulletin #2). Relative expres-
sion ratios (RERs) were determined as the level
of mRNA expression in the tumor sample to the
expression in the paired normal tissue.
Immunohistochemistry
Immunohistochemistry (IHC) experiments
were performed on 10 surgical pathology speci-
mens used for diagnosis. Samples were fixed in
4% neutral buffered formaldehyde. Representa-
tive tumor blocks were sectioned at 3 lm thick-
ness. IHC was performed by the streptavidin–
biotin method. Endogenous peroxidase in the
section was blocked by incubation with 3%
hydrogen peroxide. A rabbit polyclonal antibody
against the human B4GALT1 protein
(HPA010806, Sigma-Aldrich) was used as primary
antibody at a 1/10 dilution. Sections were incu-
bated with LSAB2 (Dakocytomation, Carpinteria,
CA). 3-30-diaminobenzidine was used for color
development and hematoxylin was used for coun-
terstaining. Negative controls were obtained by
omitting primary antibody. Scoring for B4GALT1
was based on relative intensities of staining of
tumor cells with reference to the normally pres-
ent B4GALT1 staining of tissue-associated mac-
rophages. The staining intensity was scored on a
scale from 0 to 3þ (0, negative; 1þ, weak; 2þ,
moderate; 3þ, strong) in the tumor cells in 10
high power fields. Immunostaining was assessed
by two blinded and independent pathologists and
differences in scoring were resolved by a concur-
rent review and consensus score.
KRAS/BRAF Mutation and MSI Analysis
Genomic DNA obtained from tissue specimens
was amplified by PCR for the clinically relevant
KRAS codons 12/13 (exon 2) and BRAF codon
600 (exon 15) mutations as already published
(Molinari et al., 2011).
Primer sequences for KRAS and BRAF were:
KRAS (F 50-TGGTGGAGTATTTGATAGTGT
A-30; R 50-CATGAAAATGGTCAGAGAA-30) andBRAF (F 50-TCATAATGCTTGCTCTGATAG
GA-30; R 50-GGCCAAAAATTTAATCAGTGG
A-30). PCR conditions used were: 95�C 10 min,
95�C 15 sec, 55�C for KRAS and 52�C for BRAF
30 sec, 72�C 30 sec, 72�C 3 min, 40 cycles. Sam-
ples were then subjected to automated sequenc-
ing of single stranded PCR products using the
ABI Prism 3130 Genetic Analyzer (Applied Bio-
systems). All mutated cases were confirmed twice
with independent PCR reactions.
4 POETA ETAL.
Genes, Chromosomes & Cancer DOI 10.1002/gcc

Analysis of MSI status was conducted on multi-
plex amplification of the 5 microsatellite Be-
thesda-panel (BAT25, BAT26, D2S123, D5S346,and D17S250), as previously reported (Frattini
et al., 2004). Primer sequences for MSI analysis
were: BAT25 (F 50-TCGCCTCCAAGAATGTA
AGT-30; R 50-TCTGCATTTTAACTATGGCT
C-30); BAT26 (F 50-TGACTACTTTTGACTTC
AGCC-30; R 50-AACCATTCAACATTTTTAAC
CC-30), D2S123 (F 50-AAACAGGATGCCTGCC
TTTA-30; R 50-GGACTTTCCACCTATGGGA
C-30), D5S346 (F 50-ACTCACTCTAGTGATAA
ATCGGG-30; R 50-AGCAGATAAGACAGTATT
ACTAGTT-30), D17S250 (F 50-GGAAGAATCAA
ATAGACAAT-30; R 50-GCTGGCCATATATAT
ATTTAAACC-30). Forward primers were labeled
with 6-FAM at the 50-end. MSI was confirmed by
the presence of an additional peak in tumor sam-
ple in comparison with normal paired tissue.
Statistical Analysis
Patients’ baseline characteristics were reported
as median and interquartile range (IQR). The
discriminatory power of B4GALT1 was assessed
by estimating the area under the receiver operat-
ing characteristics (ROC) curves, using methyla-
tion levels in normal colon tissues and tumor
samples. The optimal cutoff was assessed maxi-
mizing jointly sensitivity and specificity. Sensitiv-
ity and specificity, computed at the optimal
cutoff, were reported along with their 95% confi-
dence intervals (CI). The area under the ROC
curve (AUC) was also reported along its 95% CI.
Colorectal samples were classified as methylated
(M) or unmethylated based on whether B4GALT1to ACTB ratios were above or below cutoff values,
respectively. Correlation between B4GALT1/ACTB ratios and mRNA transcript levels were
assessed using the Pearson’s correlation coeffi-
cient (r). Time to progression was defined as the
time between surgery and the first progression
event. Overall survival time was defined as the
time between surgery and death.
Associations between B4GALT1 methylation
status and clinicopathological parameters were
assessed using the Pearson Chi-Squared test and
Mann-Whitney U test for categorical and continu-
ous variables, respectively.
Time to event analyses were performed using
the Kaplan–Meier method with a log-rank test
and the proportional hazards Cox regression mod-
els. A P value < 0.05 was considered statistically
significant. All analyses were performed using
SAS v9.1 and SPSS 17.0.
RESULTS
Tumor Specific Hypermethylation of the B4GALT1
Promoter in CRC Patients
Using the QMSP assay the methylation status
of the B4GALT1 promoter was assessed in an ini-
tial training set of 24 CRC patients, obtained
from the Department of Pathology, University
Campus Bio-Medico of Rome, Italy. For each
sample, the analysis was repeated in two separate
plates and the median value of the B4GALT1/ACTB ratio of the two plates was used for statisti-
cal analyses.
The median values and IQR of B4GALT1/ACTB ratios were 0 (IQR 0–0) for normal colon
mucosa and 3.50 (IQR 0–50.75) for tumor speci-
mens (P ¼ 0.001 Mann Whitney test) (Fig. 1).
No differences in B4GALT1/ACTB ratios were
demonstrated among paraffin embedded samples
and snap frozen specimens.
The B4GALT1/ACTB ratios in the normal colon
tissues and in tumor samples were used to draw a
ROC curve (Fig. 2) in order to assess the discrim-
inatory power of the B4GALT1 QMSP assay. The
AUC value was 0.737 (95% CI: 0.591–0.881, P ¼0.005) (Fig. 2). Based on the ROC curve, an opti-
mal cut off value of 2.07 was assessed maximizing
sensitivity and specificity yielding a 54% (95%
CI: 35.1%–72.1%) sensitivity and a 91.7% (95%
CI: 74.1%–97.7%) specificity. Methylation of
B4GALT1 showed a highly discriminative ROC
Figure 2. ROC Curve of B4GALT1: ROC curve for QMSP assaywas designed on the basis of B4GALT1/ACTB ratios in a training set ofcolorectal tumor samples (n ¼ 24) and normal paired colon samples(n ¼ 24). The AUC is 0.736 (95% CI: 0.591–0.881; P ¼ 0.005). Opti-mal cut-off value (2.07) was considered for methylation analysis in val-idation set (n ¼ 106). [Color figure can be viewed in the onlineissue, which is available at wileyonlinelibrary.com.]
B4GALT1 PROMOTER HYPERMETHYLATION IN COLORECTAL CANCER 5
Genes, Chromosomes & Cancer DOI 10.1002/gcc

curve profile, clearly distinguishing CRC from
corresponding normal distant mucosa.
In a second independent validation set of 106
tumors, including 28 Italian cases and a Swiss
CRC cohort of 78 patients obtained from Insti-
tute of Pathology, Locarno (Switzerland),
B4GALT1 promoter methylation was detected in
49% (52/106) of patients.
Baseline and pathological characteristics of the
Italian and Swiss populations (130 cases) are
shown in Table 1. Clinical data were available for
52 Italian cases (24 training set and 28 validation
set). No statistically significant association was
found between B4GALT1 methylation status and
clinicopathological data.
Correlation of B4GALT1 Promoter Methylation
and B4GALT1 mRNA and Protein Expression in
CRC Patients
To elucidate whether the hypermethylation of
the B4GALT1 promoter impacts the expression of
the gene we analyzed the mRNA expression lev-
els in 19 representative clinical samples, including
primary CRC specimens and paired normal colo-
rectal mucosa (9 methylated and 10 unmethylated
samples). A statistically significant inverse correla-
tion was observed between methylation levels and
B4GALT1 mRNA expression levels (r ¼ �0.482,
P ¼ 0.037, Pearson correlation). For each patient,
we calculated the RERs as the ratio between
mRNA in the tumor sample to the expression in
the paired normal tissue. The B4GALT1 RER val-
ues ranged from 0.06 to 4.76 with a median value
of 0.65 (IQR 0.41–1.54). Moreover, as shown in
Figure 3, methylated tumors showed lower RERs
(Median 0.43 IQR 0.29–1.17) as compared with
unmethylated samples (Median 0.92 IQR 0.57–
2.93) (P ¼ 0.015 Mann Whitney test), further
suggesting that mRNA B4GALT1 expression is
epigenetically regulated.
In order to assess the B4GALT1 protein
expression level, we performed immunohisto-
chemistry analysis on 10 tumor cases and 10 nor-
mal matched mucosa specimens. We divided
samples into methylated and unmethylated
groups (5 vs. 5). B4GALT1 immunohistochemis-
try of colorectal tissue revealed a membrane/cyto-
plasmic staining in tumor and normal epithelial
cells. A weak-moderate staining for B4GALT1
was observed in 80% (4/5) of methylated cases
and in 40% (2/5) of unmethylated cases, but
the difference was not statistically significant
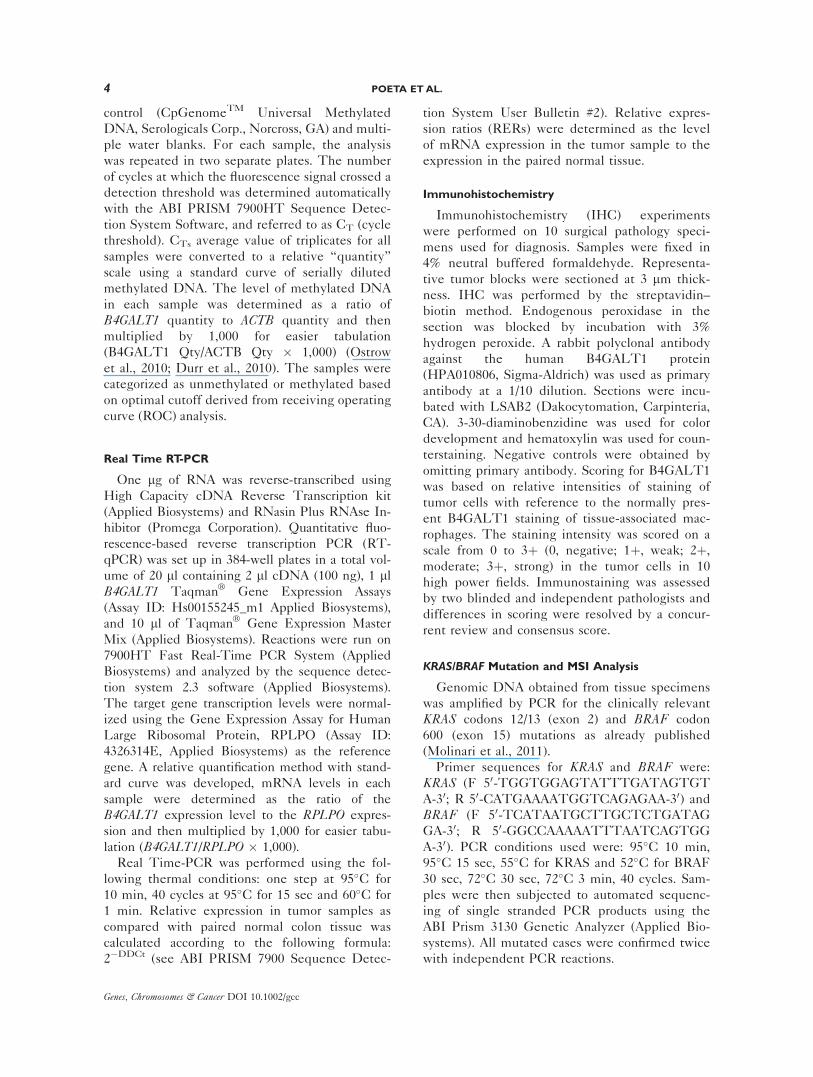
(P >0.05 Fisher Exact Test). Representative
images of immunohistochemical staining are
shown in Figure 4.
B4GALT1 Promoter Hypermethylation Marks the
Onset of Invasive Phenotype in CRC
In order to establish the timing of B4GALT1promoter methylation in colorectal carcinogenesis,
we also analyzed 13 CRC for which synchronous
tubulovillous adenoma lesions were available along
with normal colonic mucosa. The median values
and inter quartile ranges (IQR) of B4GALT1/ACTBratios were 37.55 (IQR 0–292.19) for CRC and 0.0
for colorectal adenoma (IQR 0–9.14) and normal
colic mucosa (IQR 0–0) (P ¼ 0.0001 Kruskall
Wallis Test) (Table 2). Between groups analysis
demonstrated statistically significant differences in
B4GALT1 promoter methylation levels and fre-
quencies in invasive carcinomas as compared with
normal mucosa samples (P ¼ 0.0001 Mann Whit-
ney test; P ¼ 0.0001 Chi-Squared test) and ade-
noma (P ¼ 0.009 Mann Whitney test; P ¼ 0.04
Chi-Squared test), whereas no statistically signifi-
cant differences were demonstrated between nor-
mal tissue and adenoma samples (P ¼ 0.07 Mann
Whitney test; P ¼ 0.22 Chi-Squared test).
B4GALT1 Promoter Methylation and KRAS,
BRAF Mutation, and MSI Status
Key molecular events in CRC are mutations
in the KRAS and BRAF genes as well as MSI
(Table 1). We examined KRAS (exon 2, including
codons 12 and 13) mutational status in 128/130
CRC cases. Mutations of KRAS occurred in 50/
128 (39%) of cases. Among the observed muta-
tions, 37/50 (74%) were found in codon 12 and
the remaining 13/50 (26%) in codon 13.
BRAF (exon 15, including codon 600) mutation
and MSI status were investigated in 77 of 130
patients. The BRAFV600E mutation was
observed in 5/77 (6.5%), whereas MSI was
detected in 7/77 (9%) cases. No statistically sig-
nificant relationship was found between muta-
tions in KRAS or BRAF, or MSI status and
methylation of B4GALT1 promoter.
DISCUSSION
Glycoproteins like carcinoembryonic antigen
(CEA) and glycosylated mucins like CA 19-9 are
biomarkers commonly used in the clinical setting
of CRC. However, the clinical usefulness of these
glycomarkers for diagnostic, prognostic, and sur-
veillance purpose remain controversial (Locker
6 POETA ETAL.
Genes, Chromosomes & Cancer DOI 10.1002/gcc

TABLE 1. Demographic and Clinicopathological Characteristics of Colorectal Cancer Cases (130)
B1,4GALTI methylation status
Methylated Unmethylated
Variable Patients no. No. (%) P value
Total patients 130 64/130 (49.2) 66/130 (50.7)
Gender 130 0.0783Male 67 38/67 (56.7) 29/67 (43.3)Female 63 26/63 (41.3) 37/63 (58.7)
Age 130 0.7298Median (Range) 71.0 (61.0–78.0) 73.0 (65.0–78.5)
Tumor site 129 0.8305Rectum 16 6/16 (37.5) 10/16 (62.5)Sigmoid colon 28 14/28 (50.0) 14/28 (50.0)Descending colon 33 16/33 (48.5) 17/33 (51.5)Transverse colon 3 1/3 (33.3) 2/3 (66.7)Ascending colon 49 26/49 (53.0) 23/49 (47.0)
Histologic type and grading 52 0.728Adenocarcinoma G2 43 17/43 (39.5) 26/43 (60.5)Adenocarcinoma G3 9 3/9 (33.3) 6/9 (66.7)
Pathologic tumor stage 130 0.8118T1 9 3/9 (33.3) 6/9 (66.7)T2 8 4/8 (50.0) 4/8 (50.0)T3 87 46/87 (52.9) 41/87 (47.1)T4 26 11/26 (42.3) 15/26 (57.7)
Pathologic nodal stage 129 0.1329Nþ 62 26/62 (41.9) 36/62 (58.1)N- 67 37/67 (55.2) 30/67 (44.8)
UICC stagea 130 0.2405I 12 5/12 (41.7) 7/12 (58.3)II A 38 17/38 (44.7) 21/38 (55.3)II B 11 4/11 (36.4) 7/11 (63.6)III A 5 2/5 (40.0) 3/5 (60.0)III B 37 22/37 (59.5) 15/37 (40.5)III C 22 12/22 (54.5) 10/22 (45.5)IV 5 2/5 (40.0) 3/5 (60.0)
Alcohol 48 0.4888Never-drinkers 25 10/25 (40.0) 15/25 (60.0)Former/Current drinkers 23 7/23 (30.4) 16/23 (69.9)
Smoking 48 0.3111No 18 8/18 (44.4) 10/18 (55.6)Yes 30 9/30 (30.0) 21/30 (70.0)
KRAS mutation 128 0.777WTa 78 37/78 (47.4) 41/78 (52.6)Codon 12/13 exon 2 50 25/50 (50.0) 25/50 (50.0)
Codon 12 37 16/37 (43.2) 21/37 (56.8) 0.2616Codon 13 13 9/13 (69.2) 4/13 (30.8)
BRAF mutation 77 0.8465WTb 72 40/72 (55.5) 32/72 (44.5)V600E exon 15 5 3/5 (60.0) 2/5 (40.0)
MSI status 77 0.1275MSS 70 41/70 (58.6) 29/70 (41.4)MSI 7 2/7 (28.6) 5/7 (71.4)
Recurrence 49 0.6741No 37 15/37 (40.5) 22/37 (59.5)Locoregional 1 0 1/1 (100.0)Distant 11 5/11 (45.5) 6/11 (54.5)
Death (at last follow-up) 52 0.872Alive 41 16/41 (39.0) 25/41 (61.0)Died 11 4/11 (36.4) 7/11 (63.6)
aUICC, Union for International Cancer ControlbWT, wild type
B4GALT1 PROMOTER HYPERMETHYLATION IN COLORECTAL CANCER 7
Genes, Chromosomes & Cancer DOI 10.1002/gcc

et al., 2006). CEA is actually the only marker rou-
tinely used for monitoring metastatic CRC during
systemic therapy. Bearing in mind that aberrant
glycosylation could be considered an hallmark for
cancer, extensive studies have highlighted the role
of glycans as cancer biomarkers (Hakomori, 2002;
Abd Hamid et al., 2008; Hart and Copeland, 2010).
This study provides evidence that the pro-
moter of B4GALT1, a galactosyltransferase
involved in glycan biosynthesis (Furukawa and
Sato, 1999), is hypermethylated in 50% (65/130)
of CRC cases with an higher-than-90% specificity
rate. Highly specific markers can make bio-
markers in clinical setting more robust, thus
enhancing their cost-effectiveness. Promoter
methylation of B4GALT1 was analyzed in primary
tumor and normal matched mucosa by QMSP. In
the last years, a plethora of genes have been
found to be hypermethylated in CRC and two
promising markers Vimentin (ColoSure test) and
SEPT9 (Epi ProColon) are the only biomarkers
currently included in patented noninvasive tests.
They are used for early detection of stool and
blood analyses in CRC patients, respectively
(Chen et al., 2005; de Vos et al., 2009). In partic-
ular Vimentin is methylated in 0–29% of colo-
rectal normal mucosa (Kann et al., 2006; Zou
et al., 2007; Cho et al., 2010). Bearing in mind
that B4GALT1 has shown a methylation fre-
quency of 50% and a specificity overlapping with
the above mentioned markers (see Vimentin),
this gene could be considered a valuable cancer-
specific biomarker for CRC, especially if included
in a panel of hypermethylated genes.
Glycans of cancer cell surfaces undergo rele-
vant changes during malignant transformation
Figure 4. B4GALT1 protein expression by immunohistochemicalanalysis. Representative results of B4GALT1 immunostaining: Image A:normal colon mucosa; Images B, C: weak staining in CRC cases withmethylated B4GALT1; Images D, E: strong staining in CRC cases withno methylation at the B4GALT1 promoter. Tissue-associated macro-phages are positive for B4GALT1 staining and are used as internalpositive controls. Original magnification. X200 A, B, C, D, E images;X400 squared area of A image. [Color figure can be viewed in theonline issue, which is available at wileyonlinelibrary.com.]
Figure 3. Inverse correlation between B4GALT1 RERs and pro-moter methylation in colorectal tumor samples. B4GALT1 RERs of 13CRC patients (with fold change >2) were categorized by relativemethylation status (UNMET; unmethylated group, N ¼ 7, MET; meth-ylated group, N ¼ 6). P-value was calculated using the Mann-WhitneyU test. The asterisks (*) indicate outliers. [Color figure can be viewedin the online issue, which is available at wileyonlinelibrary.com.]
8 POETA ETAL.
Genes, Chromosomes & Cancer DOI 10.1002/gcc

(An et al., 2009; Satomaa et al., 2009), suggesting
that the expression of complex glycan structures
is in some way impaired upon malignant transfor-
mation. Incomplete synthesis and neosynthesis
are still the two major and relevant concepts for
cancer-associated alterations of cell surface carbo-
hydrate determinants, as formulated by Hakomori
almost 25 years ago (Hakomori et al., 1985). In
particular suppression of normal gene transcrip-
tion is proposed to lie behind incomplete glycan
synthesis in cancer cells. Despite the fact that
epigenetic mechanisms, such as DNA methyla-
tion, histone modification, chromatin remodeling,
and noncoding RNA, are key regulatory elements
needed to control gene expression, there have
been few studies addressing the epigenetic mech-
anisms of glycosyltransferase expression and only
a small number of glycogenes are known to be
silenced by DNA methylation (Kawamura et al.,
2008; Yusa et al., 2009). Indeed, cancer cells tend
to accumulate glycan branches with simpler struc-
tures in comparison to normal cells through epi-
genetic silencing of glycogenes involved in the
synthesis of complex carbohydrate determinants
and this is in line with the classical concept of
‘‘incomplete synthesis’’ advanced by Hakomori
(Kannagi et al., 2008). As promoter methylation
plays a critical role in transcription gene silencing,
we investigated the mRNA expression status of
B4GALT1 in primary CRC showing that the
expression level of B4GALT1 decreased in 68%
(13/19) of cases, and that promoter methylation
was correlated with reduced B4GALT1 transcript
levels, compared with normal colonic mucosa and
unmethylated cancer specimens. The concord-
ance between the mRNA level and the DNA
methylation strongly suggests that B4GALT1 is
downregulated through the DNA methylation in
CRC. Thus, we also evaluated the concordance
between methylation levels and protein expres-
sion, as determined by IHC analysis in five
unmethylated and five methylated tumors.
Although methylated tumors more frequently
showed weak/moderate B4GALT1 immunostain-
ing compared with unmethylated cases, this
difference was not statistically significant. We
believe that the reason for this imperfect correla-
tion between B4GALT1 expression and promoter
methylation might be due to the intrinsic tumor
heterogeneity. Indeed, IHC was performed on
the FFPE block used for diagnosis, whereas
methylation and mRNA expression were eval-
uated on the same fresh frozen specimen.
B4GALT1 is a beta-1,4-galactosyltransferase
that catalyzes the transfer of galactose from the
sugar nucleotide donor uridine diphosphate
galactose to glycoside residues with a terminal
N-acetylglucosamine (GlcNAc) moiety (Furukawa
and Sato, 1999). B4GALT1-deficient mice (Asano
et al.,1997) exhibit enhancement of epithelial cell
proliferation of the skin and small intestine and
abnormal cell differentiation in intestinal villi,
thus suggesting that B4GALT1 plays a critical role
in the regulation of proliferation and in the differ-
entiation of epithelial cells after birth. It is rea-
sonable to speculate that epigenetic silencing of
B4GALT1 expression could contribute to aberrant
epithelial differentiation. Previous studies have
suggested that epigenetic silencing of glycogenes
may occur at early stage of malignant transforma-
tion (Kannagi et al., 2008, 2010; Kawamura et al.,
2008). Although we found some levels of
B4GALT1 aberrant methylation in 3 out of 13
adenoma synchronous to adenocarcinoma, meth-
ylation levels were significantly higher in invasive
lesions compared with benign lesions, suggesting
that B4GALT1 methylation may mark the
onset of invasive phenotype in colorectal
cancerogenesis.
Mutations in the KRAS and BRAF genes as
well as MSI represent key genetic events in CRC
(Zlobec et al., 2010; Price et al., 2011). Previous
works have shown that B4GALT1 may play a role
in the RAS/BRAF pathway; SMMC-7721 human
hepatocarcinoma cells transfected with B4GALT1were more susceptible to cycloheximide-induced
apoptosis than the mock transfected cells trough
EGFR-PKB/Akt pathway (Zhu et al., 2003; Li
TABLE 2. Methylation Status of Synchronous Lesions of Colorectal Adenocarcinoma and Adenoma
Normal tissue, n(%) Adenoma, n(%) Carcinoma, n(%) P
UMa 13/13 (100%) 10/13 (77%) 4/13 (31%) 0.001b
Mc 0/13 (0) 3/13 (23%) 9/13 (69%)Median (IQR) 0 (0–0) 0 (0–9.14) 37.55 (0–292.19) 0.0001d
aUM, Unmethylated.bFisher Exact Test.cM, Methylated.dKruskall Wallis Test.
B4GALT1 PROMOTER HYPERMETHYLATION IN COLORECTAL CANCER 9
Genes, Chromosomes & Cancer DOI 10.1002/gcc

et al., 2006). We investigated the correlation
between these alterations and the methylation
status of B4GALT1. Aberrant epigenetic status of
this glycogene seems to be unrelated to gene
mutations in KRAS or BRAF and MSI. We also
evaluated whether aberrant methylation of
B4GALT1 could be related to pathological data
and outcome. Follow-up data were available for
52 out of 130 cases and no statistically significant
correlations were found. However, these results
may be due to the low number of cases and
events (death or progression) in this cohort.
In conclusion, our findings suggest that the gly-
cogene B4GALT1 is frequently methylated in
CRC and that it may be a specific biomarker for
colorectal neoplasia. Furthermore, methylation of
B4GALT1 have also been detected in adenoma
lesions, but methylation levels and frequencies
are significantly different than normal mucosa
only in invasive cancer lesions, thus suggesting
that this glycogene could be a valuable and spe-
cific candidate biomarker for detection of invasive
phenotype, providing preliminary evidence for
future studies aiming at investigating a wider
panel of galactosyltransferases which can elucidate
the lack of synthesis of cancer surface glycans. A
characterization of the epigenetic profile of glyco-
syltrasferase can be adopted as an alternative
approach to infer possible changes that may occur
in the structures of normal and cancer glycans,
thus overcoming the limits and technical difficul-
ties of studying complex glycoproteic markers.
REFERENCES
Abd Hamid UM, Royle L, Saldova R, Radcliffe CM, Harvey DJ,Storr SJ, Pardo M, Antrobus R, Chapman CJ, Zitzmann N,Robertson JF, Dwek RA, Rudd PM. 2008. A strategy to revealpotential glycan markers from serum glycoproteins associatedwith breast cancer progression. Glycobiology 18:1105–1118.
An HJ, Kronewitter SR, de Leoz ML, Lebrilla C. 2009. Glycomicsand disease markers. Curr Opin Chem Biol 13:601–607.
Asano M, Furukawa K, Kido M, Matsumoto S, Umesaki Y,Kochibe N, Iwakura Y. 1997. Growth retardation and earlydeath of b1,4-galactosyltransferase knockout mice with aug-mented proliferation and abnormal differentiation of epithelialcells. EMBO J 16:1850–1857.
Ballestar E, Esteller M. 2008. Epigenetic gene regulation in can-cer. Adv Genet 61:247–267.
Center MM, Jemal A, Smith RA, Ward E. 2009. Worldwide varia-tions in colorectal cancer. CA Cancer J Clin 59:366–378.
Chen WD, Han ZJ, Skoletsky J, Olson J, Sah J, Myeroff L, Plat-zer P, Lu S, Dawson D, Willis J, Pretlow TP, Lutterbaugh J,Kasturi L, Willson JK, Rao JS, Shuber A, Markowitz SD. 2005.Detection in fecal DNA of colon cancer-specific methylation ofthe nonexpressed vimentin gene. J Natl Cancer Inst 97:1124–1132.
Cho MH, Lee YM, Kim JS, Kim HS, Lee KH, Juhng SW, LeeJH. 2010. Aberrant promoter methylation of the vimentin genein colorectal cancer associated with the adenoma-carcinomasequence. Korean J Pathol 2:179–186.
Corvalan AH, Maturana MJ. 2010. Recent patents of DNA meth-ylation biomarkers in gastrointestinal oncology. Recent PatDNA Gene Seq 4:202–209.
de Vos T, Tetzner R, Model F, Weiss G, Schuster M, Distler J,Steiger KV, Grutzmann R, Pilarsky C, Habermann JK, FleshnerPR, Oubre BM, Day R, Sledziewski AZ, Lofton-Day C. 2009.Circulating methylated SEPT9 DNA in plasma is a biomarkerfor colorectal cancer. Clin Chem 55:1337–1346.
Durr ML, Mydlarz WK, Shao C, Zahurak ML, Chuang AY,Hoque MO, Westra WH, Liegeois NJ, Califano JA, SidranskyD, Ha PK. 2010. Quantitative methylation profiles for multipletumor suppressor gene promoters in salivary gland tumors.PLoS One 5:e10828.
Edwards BK, Ward E, Kohler BA, Eheman C, Zauber AG, Ander-son RN, Jemal A, Schymura MJ, Lansdorp-Vogelaar I, SeeffLC, van Ballegooijen M, Goede SL, Ries LA. 2010. Annualreport to the nation on the status of cancer, 1975–2006, featur-ing colorectal cancer trends and impact of interventions (riskfactors, screening, and treatment) to reduce future rates. Cancer116:544–573.
Fearon ER, Vogelstein B. 1990. A genetic model for colorectal tu-morigenesis. Cell 61:759–767.
Feinberg AP, Ohlsson R, Henikoff S. 2006. The epigenetic pro-genitor origin of human cancer. Nat Rev Genet 7:21–33.
Frattini M, Balestra D, Suardi S, Oggionni M, Alberici P, RadiceP, Costa A, Daidone MG, Leo E, Pilotti S, Bertario L, PierottiMA. 2004. Different genetic features associated with colon andrectal carcinogenesis. Clin Cancer Res 10:4015–4021.
Furukawa K, Sato T. 1999. Beta-1,4-galactosylation of N-glycansis a complex process. Biochim Biophys Acta 1473:54–66.
Grady WM, Markowitz SD. 2002. Genetic and epigenetic alterationsin colon cancer. Annu Rev Genomics Hum Genet 3:101–128.
Hakomori S. 1985. Aberrant glycosylation in cancer cell mem-branes as focused on glycolipids: Overview and perspectives.Cancer Res 45:2405–2414.
Hakomori S. 2002. Glycosylation defining cancer malignancy: Newwine in an old bottle. Proc Natl Acad Sci USA 99:10231–10233.
Hart GW, Copeland RJ. 2010. Glycomics hits the big time. Cell143:672–676.
Herceg Z, Hainaut P. 2007. Genetic and epigenetic alterations asbiomarkers for cancer detection, diagnosis and prognosis. MolOncol 1:26–41.
Herman JG, Baylin SB. 2003. Gene silencing in cancer in associationwith promoter hypermethylation. N Engl J Med 349:2042–2054.
Herranz M, Esteller M. 2007. DNA methylation and histone mod-ifications in patients with cancer: Potential prognostic and ther-apeutic targets. Methods Mol Biol 361:25–62.
Hoque MO, Begum S, Topaloglu O, Chatterjee A, Rosenbaum E,Van Criekinge W, Westra WH, Schoenberg M, Zahurak M,Goodman SN, Sidransky D. 2006a. Quantitation of promotermethylation of multiple genes in urine DNA and bladder can-cer detection. J Natl Cancer Inst 98:996–1004.
Hoque MO, Feng Q, Toure P, Dem A, Critchlow CW, HawesSE, Wood T, Jeronimo C, Rosenbaum E, Stern J, Yu M, TrinkB, Kiviat NB, Sidransky D. 2006b. Detection of aberrant meth-ylation of four genes in plasma DNA for the detection of breastcancer. J Clin Oncol 24:4262–4269.
Hoque MO, Kim Ms, Ostrow KL, Liu J, Wisman GB, Park HL,Poeta ML, Jeronimo C, Henrique R, Lendvai A, Schuuring E,Begum S, Rosenbaum E, Ongenaert M, Yamashita K, CalifanoJ, Westra W, van der Zee AG, Van Criekinge W, Sidransky D.2008. Genome-wide promoter analysis uncovers portions of thecancer methylome. Cancer Res 68:2661–2670.
Jemal A, Siegel R, Xu J, Ward E. 2010. Cancer statistics, 2010.CA Cancer J Clin 60:277–300.
Jemal A, Bray F, Center MM, Ferlay J, Ward E, Forman D. 2011.Global cancer statistics. CA Cancer J Clin 61:69–90.
Jones PA, Baylin SB. 2007. The epigenomics of cancer. Cell128:683–692.
Kann L, Han J, Ahlquist D, Levin T, Rex D, Whitney D, Marko-witz S, Shuber A. 2006. Improved marker combination fordetection of de novo genetic variation and aberrant DNA incolorectal neoplasia. Clin Chem 12:2299–2302.
Kannagi R, Yin J, Miyazaki K, Izawa M. 2008. Current relevanceof incomplete synthesis and neo-synthesis for cancer-associatedalteration of carbohydrate determinants-Hakomori’s conceptsrevisited. Biochim Biophys Acta 1780:525–531.
Kannagi R, Sakuma K, Miyazaki K, Lim KT, Yusa A, Yin J, IzawaM. 2010. Altered expression of glycan genes in cancers inducedby epigenetic silencing and tumor hypoxia: Clues in theongoing search for new tumor markers. Cancer Sci 101:586–593.
10 POETA ETAL.
Genes, Chromosomes & Cancer DOI 10.1002/gcc

Kawamura YI, Toyota M, Kawashima R, Hagiwara T, Suzuki H,Imai K, Shinomura Y, Tokino T, Kannagi R, Dohi T. 2008.DNA hypermethylation contributes to incomplete synthesis ofcarbohydrate determinants in gastrointestinal cancer. Gastroen-terology 135:142–151.
Kim MS, Louwagie J, Carvalho B, Terhaar Sive Droste Js, ParkHL, Chae YK, Yamashita K, Liu J, Ostrow KL, Ling S, Guer-rero-Preston R, Demokan S, Yalniz Z, Dalay N, Meijer GA,Van Criekinge W, Sidransky D. 2009. Promoter DNA methyla-tion of oncostatin m receport–beta as novel diagnostic and ther-apeutic marker in colon cancer. PLoS One 4:e6555.
Levin B, Lieberman DA, McFarland B, Smith RA, Brooks D,Andrews KS, Dash C, Giardiello FM, Glick S, Levin TR, Pick-hardt P, Rex DK, Thorson A, Winawer SJ; American CancerSociety Colorectal Cancer Advisory Group; US Multi-SocietyTask Force; American College of Radiology Colon CancerCommittee. 2008. Screening and surveillance for the earlydetection of colorectal cancer and adenomatous polyps, 2008: Ajoint guideline from the American Cancer Society, the USMulti-Society Task Force on Colorectal Cancer, and the Ameri-can College of Radiology. CA Cancer J Clin 58:130–160.
Li Z, Zong H, Kong X, Zhang S, Wang H, Sun Q, Gu J. 2006.Cell surface beta 1, 4-galactosyltransferase 1 promotes apoptosisby inhibiting epidermal growth factor receptor pathway. MolCell Biochem 291:69–76.
Lind GE, Danielsen SA, Ahlquist T, Merok MA, Andresen K,Skotheim RI, Hektoen M, Rognum TO, Meling GI, Hoff G,Bretthauer M, Thiis-Evensen E, Nesbakken A, Lothe RA.2011. Identification of an epigenetic biomarker panel with highsensitivity and specificity for colorectal cancer and adenomas.Mol Cancer 10:85.
Locker GY, Hamilton S, Harris J, Jessup JM, Kemeny N, Mac-donald JS, Somerfield MR, Hayes DF, Bast RC Jr; ASCO.2006. ASCO 2006 update of recommendations for the use oftumor markers in gastrointestinal cancer. J Clin Oncol 24:5313–5327.
Mathews LA, Crea F, Farrar WL. 2009. Epigenetic gene regula-tion in stem cells and correlation to cancer. Differentiation78:1–17.
Molinari F, Felicioni L, Buscarino M, De Dosso S, Buttitta F,Malatesta S, Movilia A, Luoni M, Boldorini R, Alabiso O, Girl-ando S, Soini B, Spitale A, Di Nicolantonio F, Saletti P, CrippaS, Mazzucchelli L, Marchetti A, Bardelli A, Frattini M. 2011.Increased detection sensitivity for KRAS mutations enhancesthe prediction of anti-EGFR monoclonal antibody resistance inmetastatic colorectal cancer. Clin Cancer Res 17:4901–4914.
Ostrow KL, Hoque MO, Loyo M, Brait M, Greenberg A, Sieg-fried JM, Grandis JR, Gaither Davis A, Bigbee WL, Rom W,Sidransky D. 2010. Molecular analysis of plasma DNA for theearly detection of lung cancer by quantitative methylation-spe-cific PCR. Clin Cancer Res 6:3463–3472.
Parrella P, la Torre A, Copetti M, Valori VM, Barbano R, Nota-rangelo A, Bisceglia M, Gallo AP, Balsamo T, Poeta ML, Care-lla M, Catapano D, Parisi S, Dallapiccola B, Maiello E,D’Angelo V, Fazio VM. 2009. High specificity of quantitativemethylation-specific PCR analysis for MGMT promoter hyper-methylation detection in gliomas. J Biomed Biotechnol2009:531692.
Pepe MS, Etzioni R, Feng Z, Potter JD, Thompson ML, Thorn-quist M, Winget M, Yasui Y. 2001. Phases of biomarker devel-opment for early detection of cancer. J Natl Cancer Inst93:1054–1061.
Price TJ, Hardingham JE, Lee CK, Weickhardt A, Townsend AR,Wrin JW, Chua A, Shivasami A, Cummins MM, Murone C,Tebbutt NC. 2011. Impact of KRAS and BRAF gene mutationstatus on outcomes from the phase III AGITG MAX trialof capecitabine alone or in combination with bevacizumaband mitomycin in advanced colorectal cancer. J Clin Oncol 29:2675–2682.
Rennert G. 2009. Are we getting closer to molecular populationscreening for colorectal cancer? J Natl Cancer Inst 101:902–903.
Rodrıguez-Paredes M, Esteller M. 2011. Cancer epigeneticsreaches mainstream oncology. Nat Med 17:330–339.
Satomaa T, Heiskanen A, Leonardsson I, Angstrom J, Olonen A,Blomqvist M, Salovuori N, Haglund C, Teneberg S, Natunen J,Carpen O, Saarinen J. 2009. Analysis of the human cancer gly-come identifies a novel group of tumor-associated N-acetylglu-cosamine glycan antigens. Cancer Res 69:5811–5819.
Schmid G. 2010. The use of molecular markers in the diagnosis ofcolorectal cancer screening. Dig Dis 28:625–628.
Sharma S, Salehi F, Scheithauer BW, Rotondo F, Syro LV, KovacsK. 2009. Role of MGMT in tumor development, progression,diagnosis, treatment and prognosis. Anticancer Res 29:3759–3768.
Smith RA, Cokkinides V, Eyre HJ. 2006. American Cancer Soci-ety for the guidelines early detection of cancer, 2006. CA Can-cer J Clin 56:11–25.
Smith RA, Cokkinides V, Brooks D, Saslow D, Shah M, BrawleyOW. 2011. Cancer screening in the United States, 2011: Areview of current American Cancer Society guidelines andissues in cancer screening. CA Cancer J Clin 61:8–30.
Tsai HC, Baylin SB. 2011. Cancer epigenetics: linking basic biol-ogy to clinical medicine. Cell Res 21:502–517.
van Engeland M, Derks S, Smits KM, Meijer GA, Herman JG.2011. Colorectal cancer epigenetics: complex simplicity. J ClinOncol 29:1382–1391.
Verma M, Manne U. 2006. Genetic and epigenetic biomarkers incancer diagnosis and identifying high risk populations. Crit RevOncol Hematol 60:9–18.
Whitlock EP, Lin JS, Liles E, Beil TL, Fu R. 2008. Screening forcolorectal cancer: A targeted, updated systematic review for theU.S. Preventive Services Task Force. Ann Intern Med 149:638–658.
Yamada Y, Watanabe A. 2010. Epigenetic codes in stem cells andcancer stem cells. Adv Genet 70:177–199.
Yusa A, Miyazaki K, Kimura N, Izawa M, Kannagi R. 2009. Epi-genetic silencing of sulfate transporter DTDST in colon cancercells leads to decreased sulfated glycan expression. Proceedingsfor 68th Annual Meeting of the Japanese Cancer Association,Tokyo: Japanese Cancer Association 41.
Zhu X, Chen S, Yin X, Shen A, Ji S, Shen Z, Gu J. 2003. Consti-tutively active PKB/Akt inhibited apoptosis and down-regulatedbeta 1,4-galactosyltransferase 1 in hepatocarcinoma cells. Bio-chem Biophys Res Commun 309:279–285.
Zlobec I, Kovac M, Erzberger P, Molinari F, Bihl MP, Rufle A,Foerster A, Frattini M, Terracciano L, Heinimann K, Lugli A.2010. Combined analysis of specific KRAS mutation, BRAF andmicrosatellite instability identifies prognostic subgroups ofsporadic and hereditary colorectal cancer. Int J Cancer 127:2569–2575.
Zou H, Harrington JJ, Shire Am, Rego RL, Wang L, CampbellME, Oberg AL, Ahlquist DA. 2007. Highly methylated genesin colorectal neoplasia: Implications for screening. Cancer Epi-demiol Biomarkers Prev 12:2686–2696.
B4GALT1 PROMOTER HYPERMETHYLATION IN COLORECTAL CANCER 11
Genes, Chromosomes & Cancer DOI 10.1002/gcc
Top Related
Copyright © 2022 FDOKUMEN

