


Bahasa
Halaman
Hukum

A Neuroeconomic Study of Social Observability and Personal
Responsibility in Decision Making: An fMRI Experiment
Jaroslaw Grygolec*, Giorgio Coricelli**, Aldo Rustichini***
November 2007
We designed the fMRI experiment to investigate whether and how nature of social observability (private vs. social), degree of responsibility (external vs. personal) and their interactions influence the evaluation of outcomes in a simple decision problem. Nature of social observability and degree of responsibility matter in the process of outcome evaluation as the outcomes can influence the social ranking of the decision-maker by providing information about his wealth and ability, and can be used for learning.
The analysis of behavioral data shows that the very same positive outcome is more desirable if it is socially observable rather than privately, and in case of personal rather than external responsibility (or chance). There is also the positive interaction between social observability and personal responsibility. The results of brain data analysis conform to behavioral findings. If outcomes are socially observable rather than just privately we find increased activity in ventral striatum, a part of neural reward system, and Brodmann Areas 6 and 8, both implicated in the process of attributing mental states to others. In situations ensuing personal rather than external responsibility we find increased activation in two parts of neural reward system: orbitofrontal cortex and ventral striatum. Both behavioral and neural findings imply that social observability and personal responsibility can play the role of motivating factors for human competition.
This neuroeconomic study suggests that a plausible positive theory of choice should incorporate the effects of observability and responsibility.
* Job Market Paper, Department of Economics, University of Minnesota, USA, email: [email protected]. ** Institut des Sciences Cognitives (CNRS), Lyon, France, email: [email protected]. *** Department of Economics, University of Minnesota, USA, email: [email protected].
2
1. Introduction
Are humans regretful evaluating the obtained outcome relative to the better
alternative they could have had? Are humans regretful more if they, rather than just pure chance, are responsible for obtaining the outcome? Are humans regretful more in social situations (or envious)? Are humans envious more if they, rather than chance, are responsible for obtaining the outcome? Those are the types of the questions we address in this paper. In other words, we study whether the comparison of the obtained outcome relative to the counterfactual outcome, or what a person could have had, matters. More, we analyze two factors: nature of observability, social versus private, and the degree of responsibility, personal versus external (or chance), that may influence the importance of counterfactual comparisons. Finally, we ask whether social observability and personal responsibility reinforce each other, or there is complementarity between the two factors, elevating the relevance of counterfactual comparisons.
Those questions are important as the ex post regret seems to be necessary to justify ex ante regret avoidance at the moment of decision-making. The regret avoidance was proposed by Bell (1982) and independently by Sudgen, Loomes (1982) to explain many behavioral violations of the expected utility theory of von Neumann, Morgenstern (1944), for instance Allais (1952) paradox. On the applied side social version of regret – envy was shown by Ljungqvist, Uhlig (2000) to justify traditional Keynesian demand management (procyclical taxes) in neoclassical economies. Caplin, Eliaz (2003) discuss the role of regret avoidance in the reluctance to take AIDS tests. The above quote from the book on investing written by George Soros (1994), one of the most successful investors, points to the importance of counterfactual comparisons (“relief” or “malicious pleasure”) in financial decisions.
We designed and implemented the functional Magnetic Resonance Imaging (fMRI) experiment to address those important questions on nature of counterfactual comparisons,
“My approach to the market was not as abstract as it sounds. It took an intensely personal, emotional form: testing was closely associated with pain, success with relief. When I asserted that `markets are always biased’ I was giving expression to a deeply felt attitude: I had a very low regard for the sagacity of professional investors and the more influential their position the less I considered them capable of making the right decisions. My partner and I took a malicious pleasure in making money by selling short stocks that were institutional favorites. But we differed in our attitudes to our own activities. He regarded only the other participants’ views as flawed, while I thought that we had as good a chance of being wrong as anyone else.”
George Soros in “The Alchemy of Finance: Reading the Mind of the Market,” p. 15.
3
of which experienced regret or envy are examples. We focused our analysis on 20 subjects for whom we collected both behavioral and neural data. Subjects were choosing between two simple risky lotteries. We highlight that our questions concern the ex post importance of counterfactual comparisons. To answer them we need to have observable proxies for experienced utility of the outcome profile (x, y), where x is the outcome obtained by the subject and y is the counterfactual outcome that a subject could have had. We used self-reported affective ratings as a proxy for behavioral experienced utility, and neural activity in striatum, the essential part of reward processing circuitry in the brain, as a proxy for neural experienced utility (or changes of it). The reason for the importance of counterfactual evaluations of the outcomes of decisions is that these evaluations can be useful in learning. However, in our experiment there is not much to learn about the task overtime, as the instances of the task are independent1 from each other. In a sense, our experimental design provides a minimal setup to confirm that counterfactual evaluations matter. If confirmed, this may suggest that counterfactual comparisons are automatic, or hard-wired into the brain, be it due to either genes or experience. Why may counterfactual comparisons become more important if nature of observability changes from private to social (social observability effect)? Let’s consider the outcome profile (x ,y) in social environment, where x is the outcome obtained by the subject, this is as before, while y is the outcome the subject could have had but now also someone else got it. Note that in private situation each subject learns nothing about the outcome profile of the others. Significance of counterfactual comparison increases in social as opposed to private environment, since in the former situation the social status of the parties is affected. The social status is at play due to wealth and informational effects. For example, if the counterfactual comparison of outcomes x to y is to the advantage of the subject x-y>0, his wealth increases relative to someone else that got just y, and so does the social status. The informational effect is due to what the outcome profile says on the subject’s ability relative to someone else’s. A large evidence on eavesdropping in animal literature shows that the desirability of an outcome is enhanced when someone else is observing. Below we provide evidence supporting social observability effect, or in other words that humans are social animals indeed. Why counterfactual comparisons matter more if degree of responsibility changes from external to personal (personal responsibility effect)? In terms of counterfactual comparison within the outcome profile (x , y), the fact that the subject obtained outcome x instead of outcome y might be due to pure chance (external responsibility) or due to the active choice of the subject (personal responsibility). If the outcome profile is a consequence of an external event (chance) - outside the control of the subject, then this provides no information on the subject, so there is no motivation for learning. Instead, if the outcome is determined, at least in part, by a choice of the subject, the evaluation of the outcome x in comparison to the outcome y of the other unselected option can be useful in making choices in the future, and in evaluating the individual. It provides signal about subject’s skill, which can be used to extrapolate subject’s performance into the future.
1 Subjects were informed before the experiment that instances of the task are independent from one another. Specifically, each instance of the lottery will lead to the independent resolution of uncertainty.
4
In addition, it is reasonable to think that there is positive interaction in counterfactual evaluations between two factors: nature of responsibility and degree of responsibility (complementarity effect). Personal versus external responsibility distinction matters in private environment due to informational effect about subject’s skill. However this distinction matters even more in social as compared to private environment. The reason is that in social environment and personal responsibility case we receive information about the subject’s income and skill relative to those of someone else. The persistence of skill, as opposed to luck, translates the comparison of relative gains at the current moment, to comparison of expected lifetime wealth levels. Clearly the latter is much important than the former.
1.1. Results overview
In this section we provide brief overview of the results, both behavioral and neural. In our experiment we observe the following variables: the outcome profile (x, y), where x is the obtained outcome by the subject and y is counterfactual one (someone else’s or his winnings he could have had, if he chose differently or by chance). We observe also behavioral variable mood, a self-reported affective rating, and neural variable Blood Oxygenation Level Dependent (BOLD) signal in brain reward circuitry among other areas, neural analog of affective rating. Both variables mood and BOLD signal in reward areas are proxies for the experienced utility of the outcome profile (x, y). Given those observable variables we were able to confirm the hypothesis that the subjective value of outcome profile (x, y) depends not only on the obtained outcome x, but also on the counterfactual one y. In other words counterfactual comparisons DO matter. We provide evidence that counterfactual comparisons matter more in social rather than private environment (social observability effect) and in personal rather than external responsibility cases (personal responsibility effect). The above results coincide for neural and behavioral data. We show evidence for neural complementarity effect of two factors: nature of observability (private, social) and degree of responsibility (external, personal). As to behavioral data we can’t reject the hypothesis that the two factors are independent. However, we want to highlight that this is the only inconsistency between neural and behavioral results. In addition, we argue that this could be due to subtle misreporting of affective ratings along private versus social dimensions. We provide neural evidence supporting this explanation and intuitive reasoning behind it.
1.2. Related literature2
In economic literature our work is most closely related to the discussion of regret avoidance in decision-making initiated by Bell (1982) and Loomes, Sugden (1982). The experimental work put to test the predictions of individual decision theory with regret, for example Loomes, Sugden (1987). The recent work on social decision theory of 2 This subsection is not intended to be the comprehensive review of the literature. Numerous important contributions, from which we indirectly draw, are omitted.
5
Maccheroni, Marinacci, Rustichini (2007), later MMR, extends decision-theoretic model of regret into social context. There is extensive applied literature in economics that is related, for example on “catching up with the Joneses” in macroeconomics, Abel (1990), and on fairness3 in behavioral economics, Rabin (1994).
Our paper crosses disciplinary borders and is related to neuroscience literature. Most closely it is related to the work on regret of Camille et al (2004) and Coricelli et al (2005). One important finding in these two papers is that orbito-frontal cortex (OFC) is important for expression of regret at the decision-making stage as well as the stage of outcomes evaluations. There is enormous literature in neuroscience about the role of striatum in the reward processing, O’Doherty et al (2002), Schultz et al (1997), Rolls et al (2007) and many others omitted here. From our perspective the most important finding in this literature implicates activity in ventral striatum to be correlated with prediction error (also called temporal difference), which is defined as the difference between the actual reward and the expected reward. Sutton, Barto (1998) provide the theoretical account of the role of prediction error in learning.
1.3. Plan of the Paper
We start in the section 2 with description of experimental design. In the section 3 we present theoretical framework that will guide analysis of data. In the section 4 we discuss behavioral results. The detailed analysis of neural data is presented in the section 5. More specifically, the subsection 5.1 addresses solely the issues related to nature of observability, private versus social. It provides evidence for social observability effect in neural data. In turn, the subsection 5.2 is devoted exclusively to degree of responsibility, external versus personal. We present the results supporting personal responsibility effect. We discuss complementarity between two factors, nature of observability and degree of responsibility, in the subsection 5.3. We conclude the paper in the section 6. The section 7 contains Appendix “Methods” that discusses experimental methods in more detail.
2. Experiment
We conducted the controlled experiment, in which subjects were choosing between two simple risky lotteries in each of 70 rounds. Three subjects performed the symmetric experimental task in each session. One male subject was placed inside functional Magnetic Resonance Imaging (fMRI) machine in order to collect measurements of his brain activity. The two others were making their choices at computers in a separate room. We conducted 20 experimental sessions recruiting subjects among undergraduate students at University of Minnesota. The main focus of this paper is on the 20 scanned subjects, for whom we collected both behavioral and neural data. In the other subsections below we provide sufficient explanation to understand the experiment and the results. For more detailed explanation experimental design please consult the Appendix “Methods.”
3 Is it fairness, or rather strategic envy in disguise?
6
2.1. Lotteries
The experimental task was about choosing between two simple risky lotteries (see
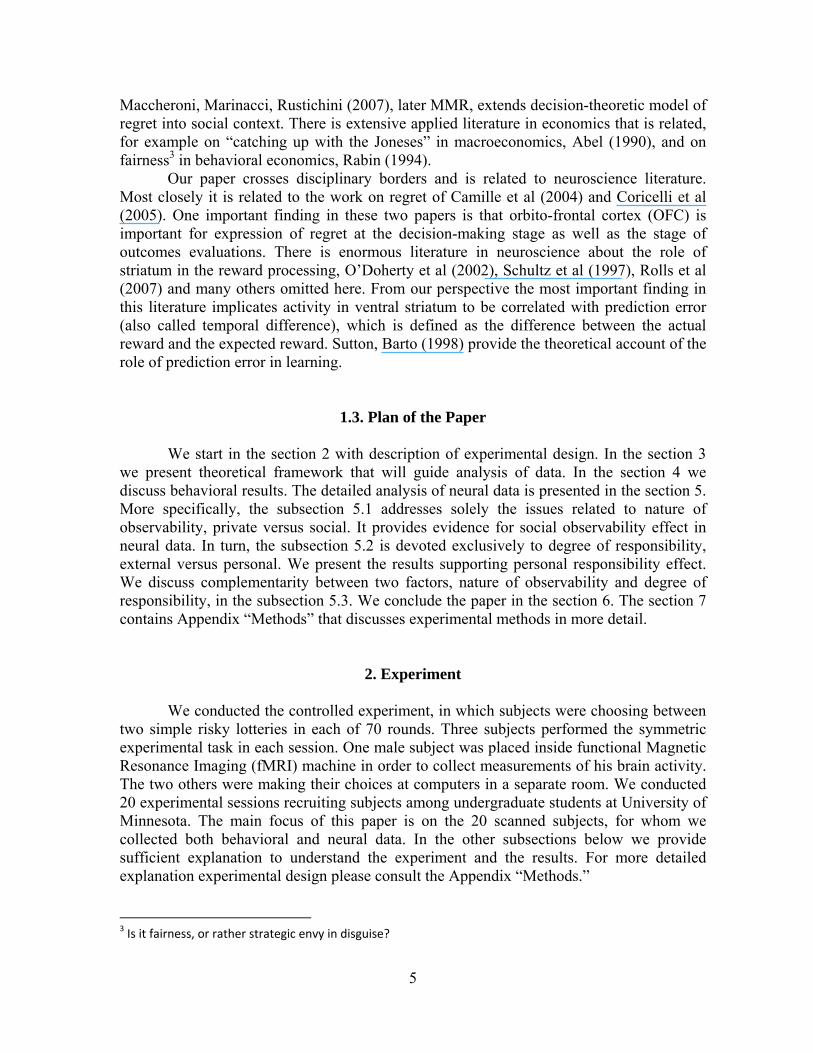
Figure 1: Panel A). Each lottery had two outcomes ranging from -$5 to $25. A lottery was presented graphically with a pie chart, like roulette. Each of 2 slices of the pie contained a number representing the outcome for a given slice. The slice size relative to the whole pie corresponded to the probability of given outcome of a lottery. We used 20 pairs of lotteries, see the Appendix “Methods”. These pairs were calibrated in a pilot behavioral experiment so that subjects wouldn’t have obvious choices. In each pair, there was one high risk & high return (or dollar bet) and one low risk & low return lottery (or probability bet).
Panel A Panel B
Figure 1: Panel A shows the screen with example pair of lotteries we presented to the subjects to choose from. Panel B contains the screen presented at Comparison event, when the subject (“he”) conducted counterfactual evaluation of “what he got” as compared to “what he could have had” in the most relevant counterfactual comparison. See subsection 2.3 for explanation of the words “most relevant.”
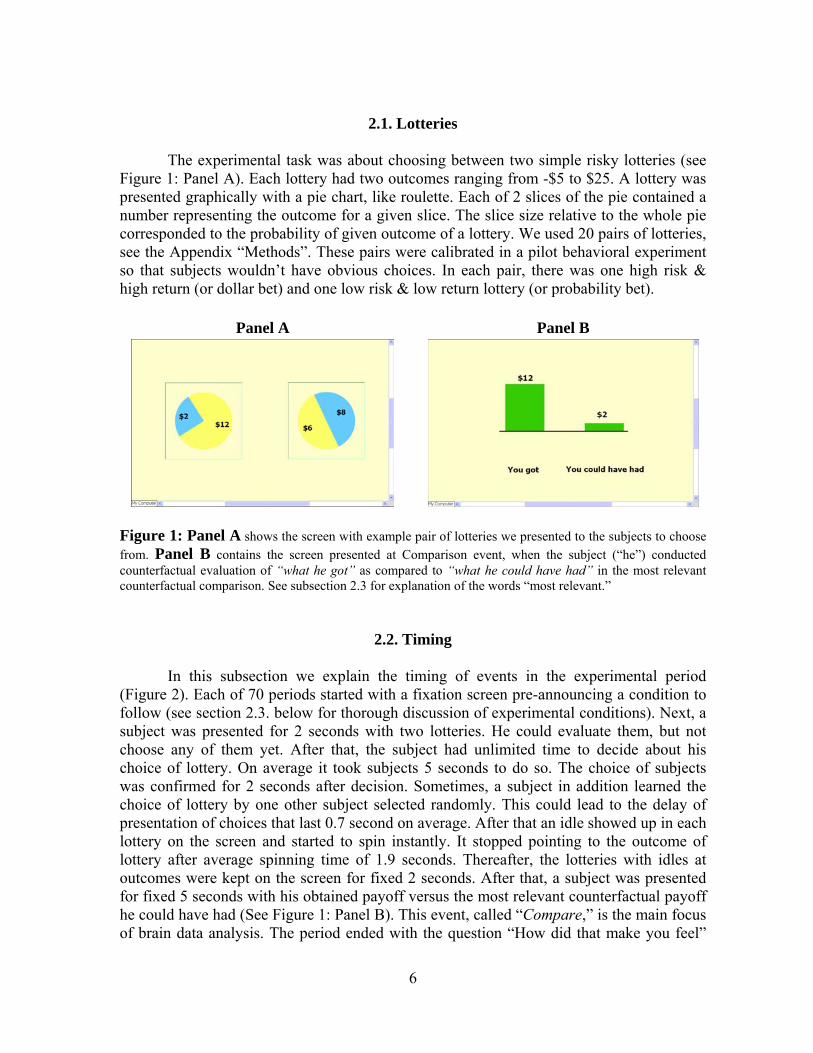
2.2. Timing
In this subsection we explain the timing of events in the experimental period (Figure 2). Each of 70 periods started with a fixation screen pre-announcing a condition to follow (see section 2.3. below for thorough discussion of experimental conditions). Next, a subject was presented for 2 seconds with two lotteries. He could evaluate them, but not choose any of them yet. After that, the subject had unlimited time to decide about his choice of lottery. On average it took subjects 5 seconds to do so. The choice of subjects was confirmed for 2 seconds after decision. Sometimes, a subject in addition learned the choice of lottery by one other subject selected randomly. This could lead to the delay of presentation of choices that last 0.7 second on average. After that an idle showed up in each lottery on the screen and started to spin instantly. It stopped pointing to the outcome of lottery after average spinning time of 1.9 seconds. Thereafter, the lotteries with idles at outcomes were kept on the screen for fixed 2 seconds. After that, a subject was presented for fixed 5 seconds with his obtained payoff versus the most relevant counterfactual payoff he could have had (See Figure 1: Panel B). This event, called “Compare,” is the main focus of brain data analysis. The period ended with the question “How did that make you feel”
7
that a subject answered on the integer scale 0-10, with 0 – “Bad”, 5 – “Neutral” and 10 – “Good.”
Period Timeline
Fixation ~3.2s Lotteries =2s Deciding ~5s Choice =2s
9
Spin ~1.9s Outcome =2s Compare =5s Rating ~1.9s
~0.7s
Figure 2: Period timeline showing all eight events.
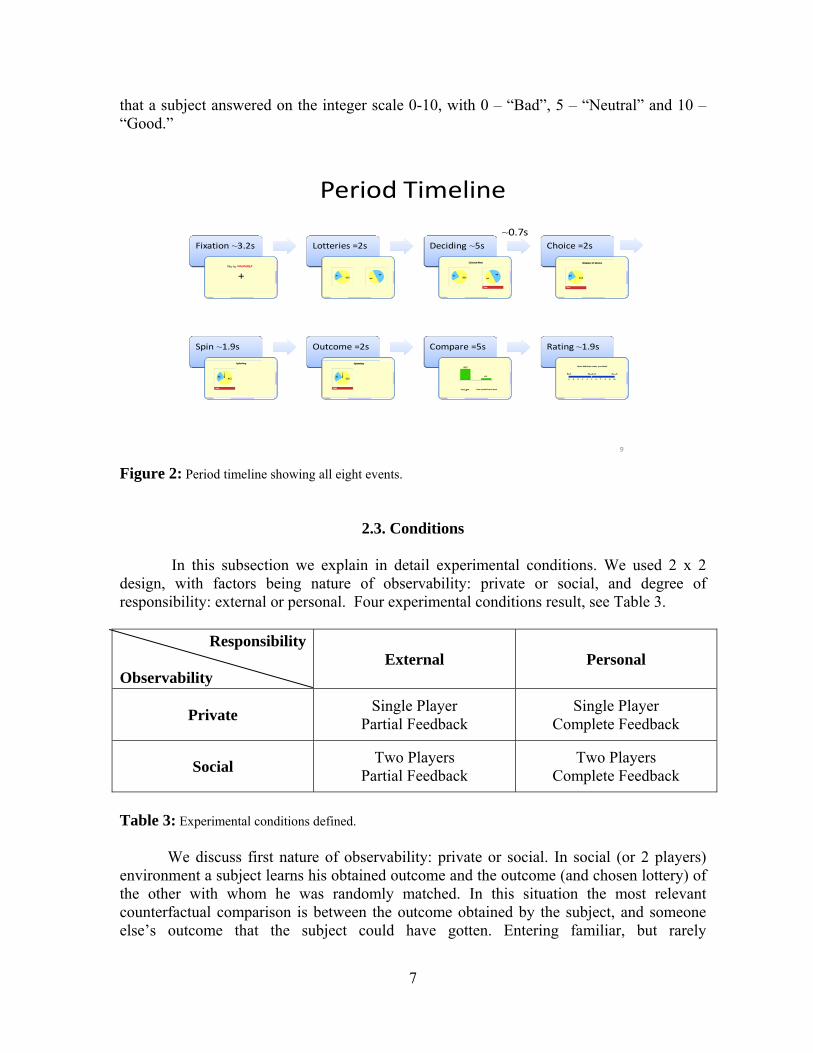
2.3. Conditions
In this subsection we explain in detail experimental conditions. We used 2 x 2 design, with factors being nature of observability: private or social, and degree of responsibility: external or personal. Four experimental conditions result, see Table 3.
Responsibility
Observability
External Personal
Private Single Player Partial Feedback
Single Player Complete Feedback
Social Two Players Partial Feedback
Two Players Complete Feedback
Table 3: Experimental conditions defined.
We discuss first nature of observability: private or social. In social (or 2 players) environment a subject learns his obtained outcome and the outcome (and chosen lottery) of the other with whom he was randomly matched. In this situation the most relevant counterfactual comparison is between the outcome obtained by the subject, and someone else’s outcome that the subject could have gotten. Entering familiar, but rarely
8
acknowledged territory: the gloating (envy) ensues if one receives higher (lower) payoff than the other. In contrast, in private (one player) environment a subject learns nothing about the outcomes obtained by others. The most relevant counterfactual comparison is between the obtained outcome and the counterfactual one without knowledge whether it was received by someone else or not. In private situation neither envy nor gloating are present.
We varied the degree of subjects’ responsibility for outcomes by providing different feedback across external and personal conditions. In external responsibility case we provided the subject with partial feedback, or just with the outcome of the selected lottery, while withdrawing the outcome of the unselected one. The most relevant counterfactual comparison in this situation is between a payoff obtained by the subject and the unrealized outcome within the very same lottery. Clearly, the difference between these outcomes is due to chance, which is external force to the subject. This is why we dubbed this situation as external responsibility condition. We say in this case that the subject experiences elation (disappointment) if the obtained payoff is larger (lower) than the unrealized one within the same lottery. In contrast, in personal responsibility case the subject receives complete feedback. In other words he learns the outcomes of both, the lottery he chose and the lottery he rejected. In this situation the most salient counterfactual comparison by the subject is between the obtained outcome and the outcome of a lottery he could have chosen, but didn’t. We advance the interpretation that the difference between those outcomes is more due to active choice of the subject rather than just pure chance. This is the reason we call this situation a personal responsibility condition.
In the beginning of each period (event Fixation in Figure 2) subjects are informed whether they will be in private or social condition only. Subjects don’t know, while deciding between lotteries (event Deciding in Figure 2), whether they are at external or personal responsibility condition. They learn this information as the choices of subjects are confirmed (event Choice in Figure 2). By doing so we wanted to avoid information overload of the subjects.
3. Theory
To have reasonable discussion of experimental results we need theoretical framework as a guide. We employ to this role a model of social decision theory laid out in Maccheroni, Marinacci, Rustichini (2007), shortly MMR model.
3.1. MMR Model The model is based on a classical Anscombe, Aumann (1963) setup: there is a set S
of states, a set of consequences C, and acts f: S → C, which are functions from states to consequences. The decision maker evaluates acts according to a subjective utility.
The model provides axiomatic foundation based on choice of the value that subjects assign to pair of their own act and the act of the other. The model includes private and social environments, thus providing theoretical foundation for the analysis of regret/relief (private) and envy/gloating (social environment). The model also distinguishes between
9
external and private responsibility conditions allowing to disentangle regret/relief (personal responsibility) from disappointment/elation (external responsibility).
MMR distinguish between the act f of the subject and the act g of the “other.” When the environment is social, the ``other’’ is a different individual; when it is private, the ``other’’ is the subject himself, in both situations in the counterfactual thought that he might have chosen that act. In this model, the ex-ante value for the subject of the act f of the subject and g of the other is:
EVi
j (f,g) = Eu(f) + EGij ( f – g ) [1]
, where superscript i = 0,1 depending on whether the condition is private or social, and subscript j = 0,1 depending on whether this is external or personal responsibility. The expectation E is taken with respect to a subjective belief over the set of states S. One of the main features of the model is that it provides separation of the personal - u(f) and relative4 - Gi
j ( f – g ) utility. In this study we focus on the latter. In standard expected utility framework relative utility Gi
j ( f – g ) functions are assumed to be zero. Off course, the Gij
functions have natural interpretation. For example, the function G00 is the elation function
(private environment and external responsibility), the function G01 the relief function
(private environment and personal responsibility), and G1j the gloating function (social
environment, and either external or personal responsibility). At the moment in which the outcome is communicated, the value is a function only
of the outcomes of the two acts: if f(s) =x and g(s) = y, then the ex-post value (or experienced utility) is:
Vi
j (x,y) = u(x) + Gij ( x – y) [2]
If this model is taken as a model of the ex-ante choice of the act, then a linear G
function would make the model identical to expected utility: that is, it would produce the same choice. Instead, the function Gi
j is increasing, but in general non linear, and not necessarily concave or convex. In the typical applications it is bounded, so it cannot be either convex or concave, so that a sigmoid shape is often assumed.
In this paper we focus on the ex-post effects of the choices made and outcomes received/observed, that is on the process of evaluating outcomes. In other words, when we take this as a model to study these issues, a linear function Gi
j (for example, a linear approximation to the true non linear Gi
j) still provides an interesting tool. For this reason we will often refer to Gi
j as slopes of linear functions.
4 In the formulation provided by equation [1], the Gi
j functions are dependent of the difference among payoffs. The MMR paper discusses in detail the conceptual difference between models in which the externality function Gi
j depends on the difference between utility and the difference between payoffs.
10
3.2. Testing the Theory
Obviously, the subjective value V(x,y) of the outcome profile is not observed. What we observe are the values x and y, the variable mood (affective rating of the outcome of choice provided by a subject) and the Blood Oxygenation Level Dependent signal (BOLD signal) at different voxels (brain “points”). We are especially interested in BOLD signal in the brain areas involved in reward processing, of which striatum (with emphasis on its ventral part) is of the first importance. The neuroscience literature provides evidence that the brain activity in the ventral striatum is increasing in the prediction error, or the difference between the realized value and the expected value, Schultz et al (1998), O'Doherty (2002), Rolls et al (2007); We anticipate that this region will be central to counterfactual comparisons we study in this per. To make our model testable we introduce two further assumptions on the variable mood and the BOLD signal in striatum: Assumption 1: The variable mood is monotonically increasing in V(x,y) Assumption 2: The BOLD signal in striatum is increasing in the value V(x, y). The assumptions 1 and 2 provide us with observable proxies of experienced utility: behavioral one: variable mood, and neural one: BOLD signal in striatum. These proxies of V(x,y) together with the observed outcomes: x obtained by the subject, and counterfactual y by the “other” allow us to estimate behavioral and neural relative utility functions Gi
j. It is high time to state our hypothesis, which we introduced informally above, in terms of MMR model, or more specifically in terms of slopes of Gi
j functions5:
Main Hypotheses:
1. Are the functions Gij significantly different from zero, and increasing?
2. Is there social observability effect, i.e. G1j – G0
j > 0 ? 3. Is there personal responsibility effect, i.e. Gi
1 – G0j > 0 ?
4. Is there positive interaction (or complementarity) between two factors of social observability (i) and personal responsibility (j), i.e. G1
1 – G01 > G1
0 – G00 ?
5. Correspondence between behavioral and neural effects.
The first hypothesis addresses the issue whether people engage in counterfactual thinking at the moment of outcomes evaluations. In other words: Does the subject’s value of the obtained outcome x while he could have had the outcome y depends on the comparison of x and y? If affirmative answer is true, we should obtain non-zero estimates of the functions Gi
j. In addition, we hypothesize that the functions Gij are increasing. In
other words, the subject’s relative utility Gij is increasing in the subject’s advantage x-y
over the “other”, where x is the outcome x obtained by the subject and the outcome y by the “other” or other payoff.
The second hypothesis of social observability effect states that the counterfactual comparison matters more in social rather than private situation in general. In terms of 5 Note that we refer to G meaning linear function, but most of time meaning the slope of it.
11
MMR model the slope of the relative utility in the advantage x-y in social situation is higher than in private, i.e. G1
j – G0j > 0. Simply put if the subject earns $1 more than the
other person his relative utility is larger as compared to earning $1 more than the other counterfactual outcome he could have had in private.
The third hypothesis concerns personal responsibility effect. This effect states that the slope of relative utility function is larger in personal rather than external responsibility case. Intuitively, the subject is more affected in terms of relative utility if advantage in counterfactual thought is more due to his active choice rather than just pure chance.
The second and the third hypotheses can be stated jointly in MMR framework. Note that the set of indices of Gi
j function has a partial order, so that these two hypotheses together amount to asking whether the slope of Gi
j is increasing with respect to this partial order. For example in the linear case we test whether G0
1 - G00 > 0 (that is, relief is stronger
than elation), and so on. The forth hypothesis is complementarity effect, or positive interaction in other
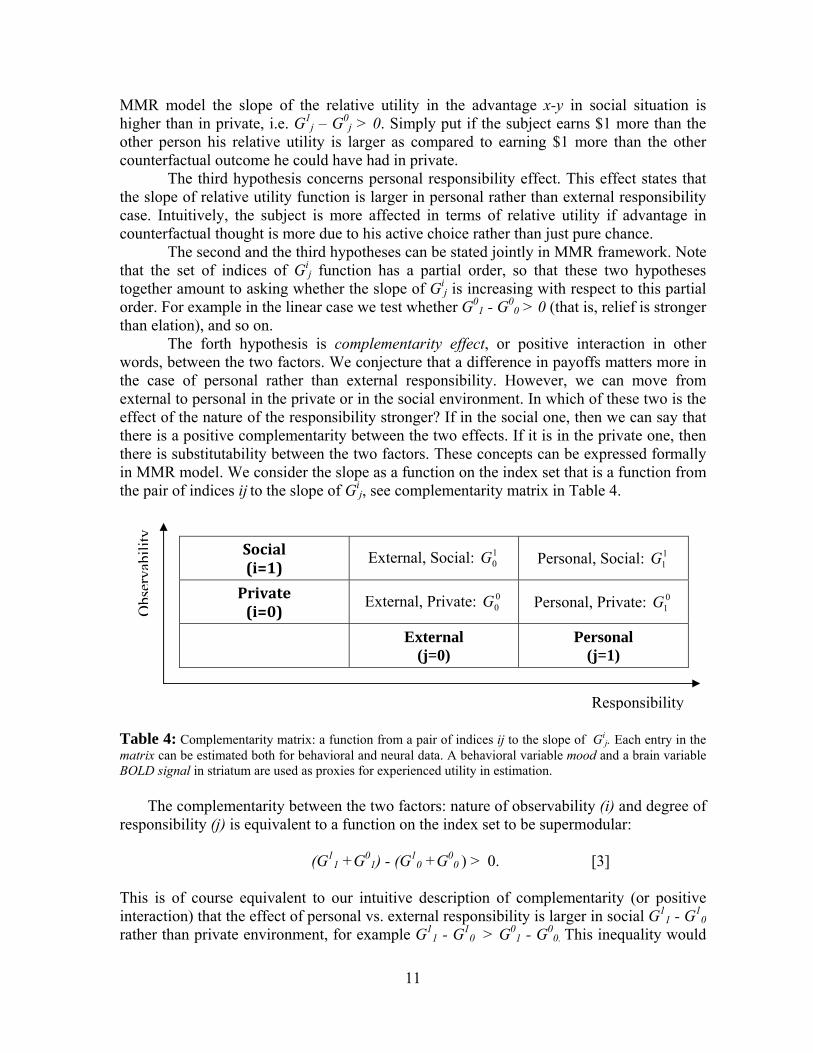
words, between the two factors. We conjecture that a difference in payoffs matters more in the case of personal rather than external responsibility. However, we can move from external to personal in the private or in the social environment. In which of these two is the effect of the nature of the responsibility stronger? If in the social one, then we can say that there is a positive complementarity between the two effects. If it is in the private one, then there is substitutability between the two factors. These concepts can be expressed formally in MMR model. We consider the slope as a function on the index set that is a function from the pair of indices ij to the slope of Gi
j, see complementarity matrix in Table 4.
Social (i=1)
External, Social: 10G Personal, Social: 1
1G
Private (i=0)
External, Private: 00G Personal, Private: 0
1G
External (j=0)
Personal (j=1)
Table 4: Complementarity matrix: a function from a pair of indices ij to the slope of Gi
j. Each entry in the matrix can be estimated both for behavioral and neural data. A behavioral variable mood and a brain variable BOLD signal in striatum are used as proxies for experienced utility in estimation. The complementarity between the two factors: nature of observability (i) and degree of responsibility (j) is equivalent to a function on the index set to be supermodular:
(G11 +G0
1) - (G10 +G0
0 ) > 0. [3]
This is of course equivalent to our intuitive description of complementarity (or positive interaction) that the effect of personal vs. external responsibility is larger in social G1
1 - G10
rather than private environment, for example G11 - G1
0 > G01 - G0
0. This inequality would
Responsibility
Obs
erva
bilit
y
12
indicate a positive interaction (complementarity) between the two factors; the opposite inequality would indicate substitutability between the two.
The last fifth hypothesis is the correspondence between the neural and behavioral effects. We take the view that the behavioral data on self-reported affective states of subjects provide useful information about experienced utility. However, we consider the neural data to be less noisy in this respect. We will provide the evidence for the last claim below.
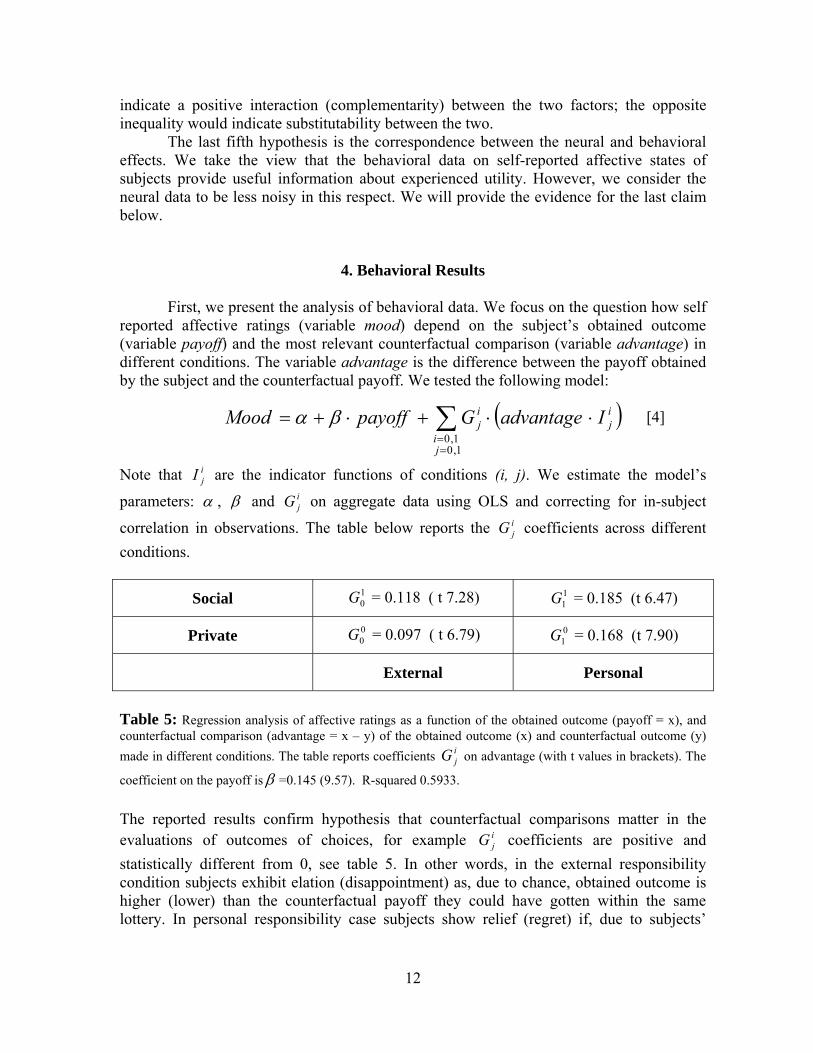
4. Behavioral Results
First, we present the analysis of behavioral data. We focus on the question how self
reported affective ratings (variable mood) depend on the subject’s obtained outcome (variable payoff) and the most relevant counterfactual comparison (variable advantage) in different conditions. The variable advantage is the difference between the payoff obtained by the subject and the counterfactual payoff. We tested the following model: [4] Note that i
jI are the indicator functions of conditions (i, j). We estimate the model’s
parameters: α , β and ijG on aggregate data using OLS and correcting for in-subject
correlation in observations. The table below reports the ijG coefficients across different
conditions.
Social 10G = 0.118 ( t 7.28) 1
1G = 0.185 (t 6.47)
Private 00G = 0.097 ( t 6.79) 0
1G = 0.168 (t 7.90)
External Personal
Table 5: Regression analysis of affective ratings as a function of the obtained outcome (payoff = x), and counterfactual comparison (advantage = x – y) of the obtained outcome (x) and counterfactual outcome (y) made in different conditions. The table reports coefficients i
jG on advantage (with t values in brackets). The
coefficient on the payoff isβ =0.145 (9.57). R-squared 0.5933. The reported results confirm hypothesis that counterfactual comparisons matter in the evaluations of outcomes of choices, for example i
jG coefficients are positive and statistically different from 0, see table 5. In other words, in the external responsibility condition subjects exhibit elation (disappointment) as, due to chance, obtained outcome is higher (lower) than the counterfactual payoff they could have gotten within the same lottery. In personal responsibility case subjects show relief (regret) if, due to subjects’
( )∑==
⋅⋅+⋅+=
1,01,0
ji
ij
ij IadvantageGpayoffMood βα
13
decisions rather than chance, obtained outcome is higher (lower) than the counterfactual outcome of the lottery they didn’t choose. The next question we address is whether there exists the effect of personal responsibility. In other words, given fixed obtained and counterfactual outcomes, we ask whether people are more affected by counterfactual comparisons if personal responsibility rather than external one (or chance) is involved. In terms of the model we are testing, these questions translate into whether there are positive differences between coefficients
00
01 GG − in personal and 1
011 GG − in external responsibility treatments. As the table 6
reports those differences are positive and significant. This directly confirms our hypothesis of personal responsibility effect.
Social 10G = 0.118 < 0.185 = 1
1G (F 28.33)
Private 00G = 0.097 < 0.168 = 0
1G (F 12.15)
External < Personal
Table 6: Personal responsibility effect is observed both in private ( 0 0
001 >− GG ) and social
( 0 10
11 >− GG ) environments. The effect is highly significant in both cases.
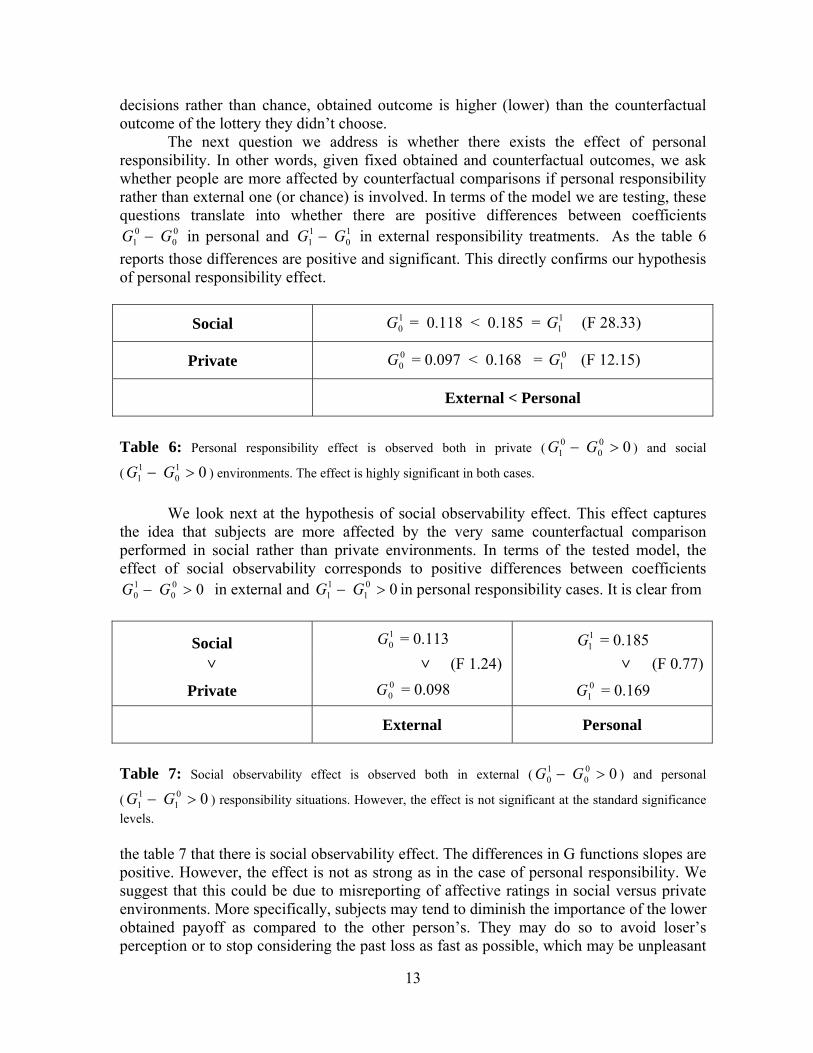
We look next at the hypothesis of social observability effect. This effect captures
the idea that subjects are more affected by the very same counterfactual comparison performed in social rather than private environments. In terms of the tested model, the effect of social observability corresponds to positive differences between coefficients
0 00
10 >− GG in external and 0 0
111 >− GG in personal responsibility cases. It is clear from
Table 7: Social observability effect is observed both in external ( 0 0
010 >− GG ) and personal
( 0 01
11 >− GG ) responsibility situations. However, the effect is not significant at the standard significance
levels. the table 7 that there is social observability effect. The differences in G functions slopes are positive. However, the effect is not as strong as in the case of personal responsibility. We suggest that this could be due to misreporting of affective ratings in social versus private environments. More specifically, subjects may tend to diminish the importance of the lower obtained payoff as compared to the other person’s. They may do so to avoid loser’s perception or to stop considering the past loss as fast as possible, which may be unpleasant
Social 10G = 0.113 1
1G = 0.185
> > (F 1.24) > (F 0.77)
Private 00G = 0.098 0
1G = 0.169
External Personal
14
in itself. On the other hand, if a subject obtains higher payoff than someone else, he may be also reluctant to show it off too much, as this is usually negatively perceived in the society. Later, we will provide some neural evidence supporting this subtle misreporting of affective rating along private/social dimension.
5. Neural Results In this section we present detailed analysis of the brain data collected as subjects performed the experimental task. For our purposes the brain is around 40,000 voxels. We collected Blood Oxygenation Level Dependent (BOLD) signal in each voxel every 2 seconds using fMRI machine. There is extensive literature documenting correlation of BOLD signal with neuronal activity. From the econometric point of view the brain activity data are 40,000 time-courses for each subject.
We focus on the brain activity when subjects evaluated the outcomes of choices they made. Two events during each period are especially important in this regard: “Outcome” and “Compare”. The event “Outcome” started instantly after a spinner within a lottery stopped pointing to the final outcome. During the event a subject was shown for 2 seconds the outcomes of lotteries he was choosing between in the way that depended on the actual experimental condition that applied. The event “Compare” followed without a delay for 5 seconds from the end of Outcome event. At the event “Compare” a subject was presented with the obtained payoff and the most relevant counterfactual payoff that depended on the condition. We focus the analysis of the brain data on these two events. We use two types of predictors in our brain data analysis: quintile predictors and continuous ones. The relative advantage of the former is that it doesn’t make any assumptions about the actual shape of the relationship between stimulus and brain response, while the relative disadvantage is that it ignores some information about covariance of stimulus and brain response that is already available. Additional motivation for the use of the two types of predictors is that this paper is on the interdisciplinary border between economics and neuroscience. In economics the use of continuous predictors dominates, while quintile ones are most commonly used in the neuroscience literature. See Bϋchel et al (1998) for comprehensive discussion of using continuous predictors in analyzing brain data.
5.1. Private and Social Observability First, we want to focus on the reward processing depending on the nature of social observability: private or social. We use the term counterfactual payoff (or other payoff) to denote the payoff that the subject did not get, but either he could have gotten in private environment or that someone else got in social environment. We ignore here the issue of the responsibility for the outcome.
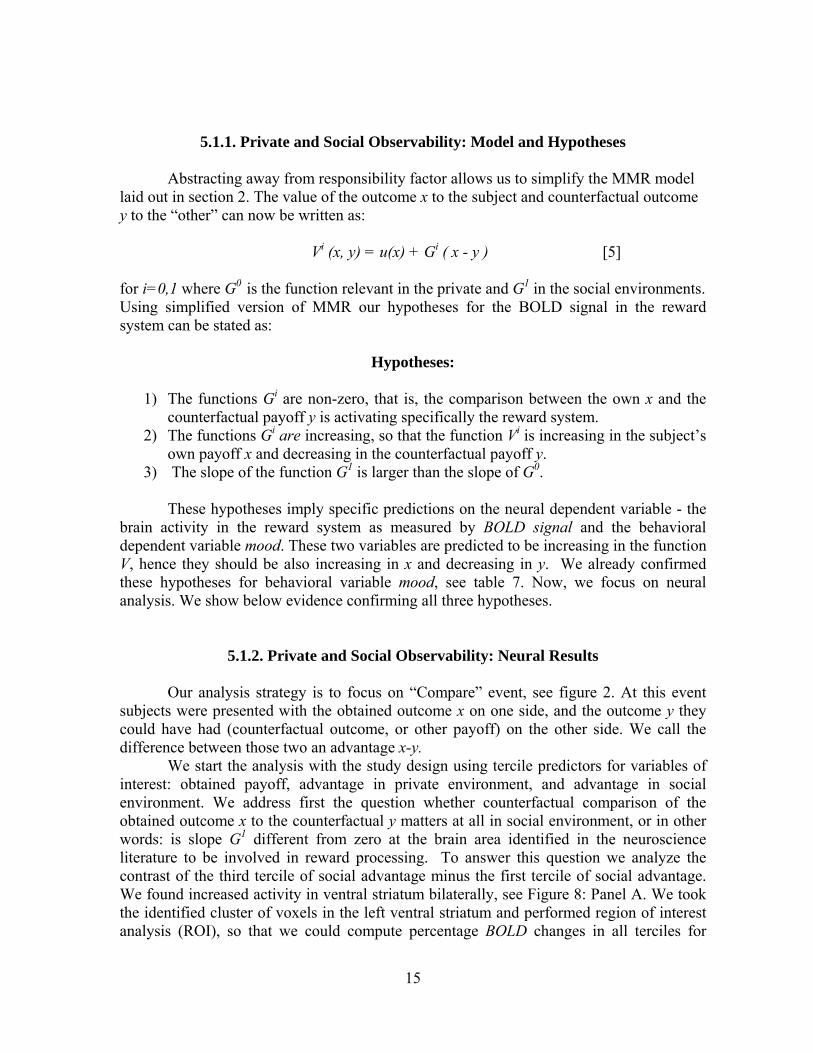
15
5.1.1. Private and Social Observability: Model and Hypotheses Abstracting away from responsibility factor allows us to simplify the MMR model
laid out in section 2. The value of the outcome x to the subject and counterfactual outcome y to the “other” can now be written as:
Vi (x, y) = u(x) + Gi ( x - y ) [5] for i=0,1 where G0
is the function relevant in the private and G1 in the social environments. Using simplified version of MMR our hypotheses for the BOLD signal in the reward system can be stated as:
Hypotheses:
1) The functions Gi are non-zero, that is, the comparison between the own x and the
counterfactual payoff y is activating specifically the reward system. 2) The functions Gi are increasing, so that the function Vi is increasing in the subject’s
own payoff x and decreasing in the counterfactual payoff y. 3) The slope of the function G1 is larger than the slope of G0.
These hypotheses imply specific predictions on the neural dependent variable - the
brain activity in the reward system as measured by BOLD signal and the behavioral dependent variable mood. These two variables are predicted to be increasing in the function V, hence they should be also increasing in x and decreasing in y. We already confirmed these hypotheses for behavioral variable mood, see table 7. Now, we focus on neural analysis. We show below evidence confirming all three hypotheses.
5.1.2. Private and Social Observability: Neural Results
Our analysis strategy is to focus on “Compare” event, see figure 2. At this event subjects were presented with the obtained outcome x on one side, and the outcome y they could have had (counterfactual outcome, or other payoff) on the other side. We call the difference between those two an advantage x-y.
We start the analysis with the study design using tercile predictors for variables of interest: obtained payoff, advantage in private environment, and advantage in social environment. We address first the question whether counterfactual comparison of the obtained outcome x to the counterfactual y matters at all in social environment, or in other words: is slope G1 different from zero at the brain area identified in the neuroscience literature to be involved in reward processing. To answer this question we analyze the contrast of the third tercile of social advantage minus the first tercile of social advantage. We found increased activity in ventral striatum bilaterally, see Figure 8: Panel A. We took the identified cluster of voxels in the left ventral striatum and performed region of interest analysis (ROI), so that we could compute percentage BOLD changes in all terciles for
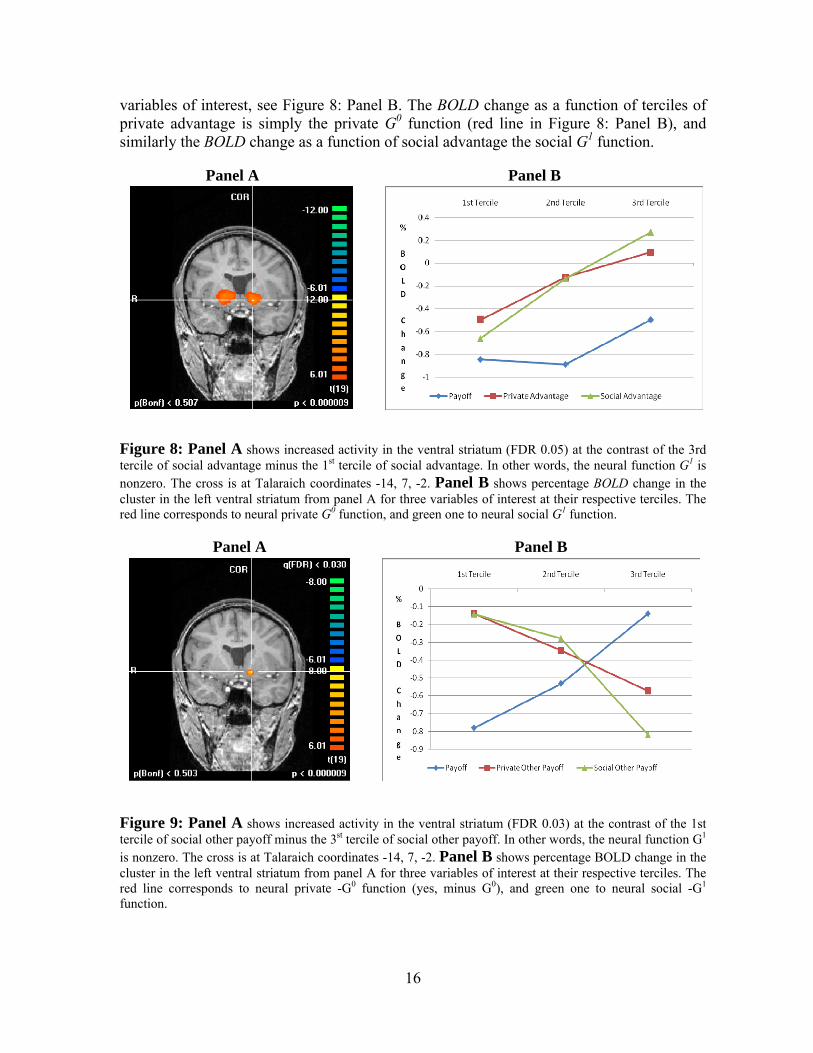
16
variables of interest, see Figure 8: Panel B. The BOLD change as a function of terciles of private advantage is simply the private G0 function (red line in Figure 8: Panel B), and similarly the BOLD change as a function of social advantage the social G1 function.
Figure 8: Panel A shows increased activity in the ventral striatum (FDR 0.05) at the contrast of the 3rd tercile of social advantage minus the 1st tercile of social advantage. In other words, the neural function G1 is nonzero. The cross is at Talaraich coordinates -14, 7, -2. Panel B shows percentage BOLD change in the cluster in the left ventral striatum from panel A for three variables of interest at their respective terciles. The red line corresponds to neural private G0 function, and green one to neural social G1 function.
Figure 9: Panel A shows increased activity in the ventral striatum (FDR 0.03) at the contrast of the 1st tercile of social other payoff minus the 3st tercile of social other payoff. In other words, the neural function G1 is nonzero. The cross is at Talaraich coordinates -14, 7, -2. Panel B shows percentage BOLD change in the cluster in the left ventral striatum from panel A for three variables of interest at their respective terciles. The red line corresponds to neural private -G0 function (yes, minus G0), and green one to neural social -G1 function.
Panel A Panel B
Panel A Panel B
17
Figure 8: Panel B provides evidence that social neural G1 function (green line) has higher slope than private neural G0 function (red line). This evidence supports the hypothesis of social observability effect. We address this issue also using the other payoff (counterfactual) y instead of advantage x-y as a predictor. Note that the former y is less correlated with the payoff x as compared to the latter x-y. Furthermore Gi(x-y) functions are decreasing in the other payoff y. Using the study design with terciles of variables of interest: payoff, private other payoff and social other payoff we look first the contrast 1st tercile of social other payoff minus 3rd tercile of social other payoff. We again find increased activity in the left ventral striatum, which implies that G1 function is non-zero, or that counterfactual comparisons in social environment matter. Similarly as for variable advantage above we obtain from ROI analysis percentage BOLD changes for variables of interest, see Figure 9: Panel B. We get the result that the slope of neural private -G0 function (red line) is larger than of neural social –G1 function (green line), which is consistent with previous evidence supporting social observability effect.
Now we want to get direct estimates of neural Gi functions using the study design with linear predictors in variables of interest: payoff, private advantage and social advantage. In what follows we use average time courses6 of BOLD signal in the left ventral striatum cluster from Figure 9: Panel A. This cluster was shown to be involved in counterfactual comparisons in social environment using the quantile study designs both with advantage and other payoff as predictors. Observe that there is a clear overlap of clusters in the left ventral striatum in Figure 8: Panel A and in Figure 9: Panel B. We estimate the following model subject by subject:
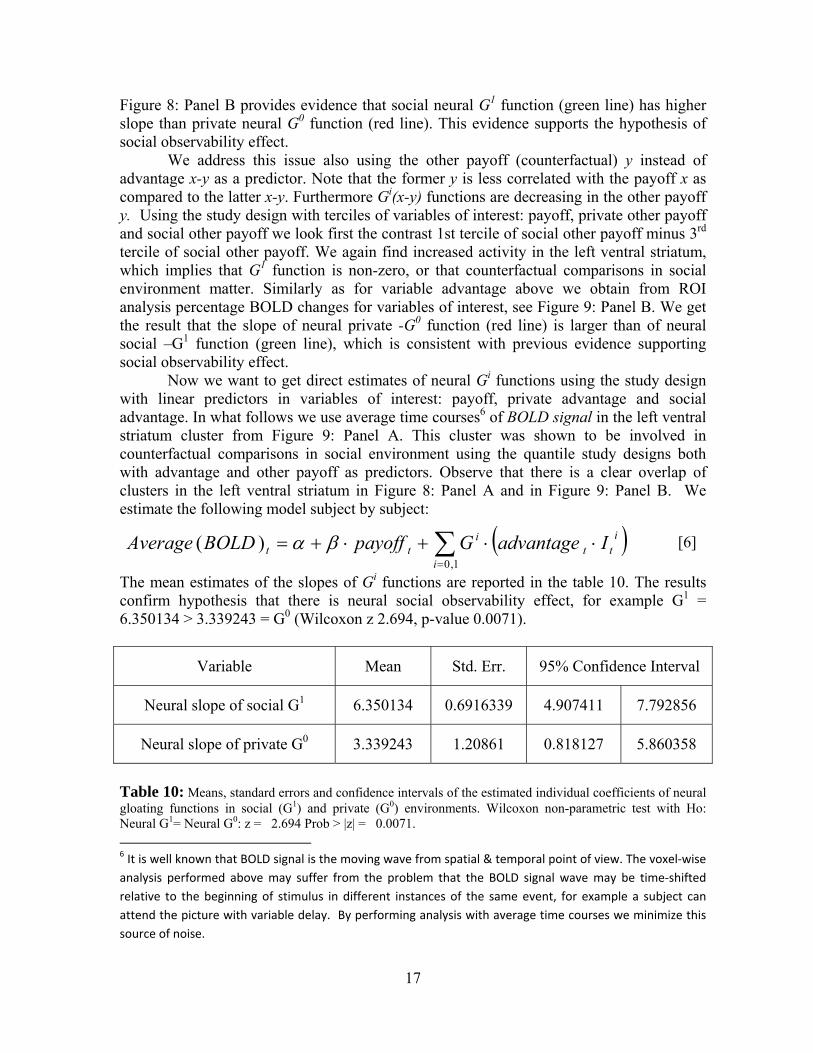
The mean estimates of the slopes of Gi functions are reported in the table 10. The results confirm hypothesis that there is neural social observability effect, for example G1 = 6.350134 > 3.339243 = G0 (Wilcoxon z 2.694, p-value 0.0071).
Variable Mean Std. Err. 95% Confidence Interval
Neural slope of social G1 6.350134 0.6916339 4.907411 7.792856
Neural slope of private G0 3.339243 1.20861 0.818127 5.860358
Table 10: Means, standard errors and confidence intervals of the estimated individual coefficients of neural gloating functions in social (G1) and private (G0) environments. Wilcoxon non-parametric test with Ho: Neural G1= Neural G0: z = 2.694 Prob > |z| = 0.0071. 6 It is well known that BOLD signal is the moving wave from spatial & temporal point of view. The voxel‐wise analysis performed above may suffer from the problem that the BOLD signal wave may be time‐shifted relative to the beginning of stimulus in different instances of the same event, for example a subject can attend the picture with variable delay. By performing analysis with average time courses we minimize this source of noise.
( )∑=
⋅⋅+⋅+=1,0
)(i
itt
itt IadvantageGpayoffBOLDAverage βα [6]
18
Finally, we perform the voxel-wise analysis using the study design with linear
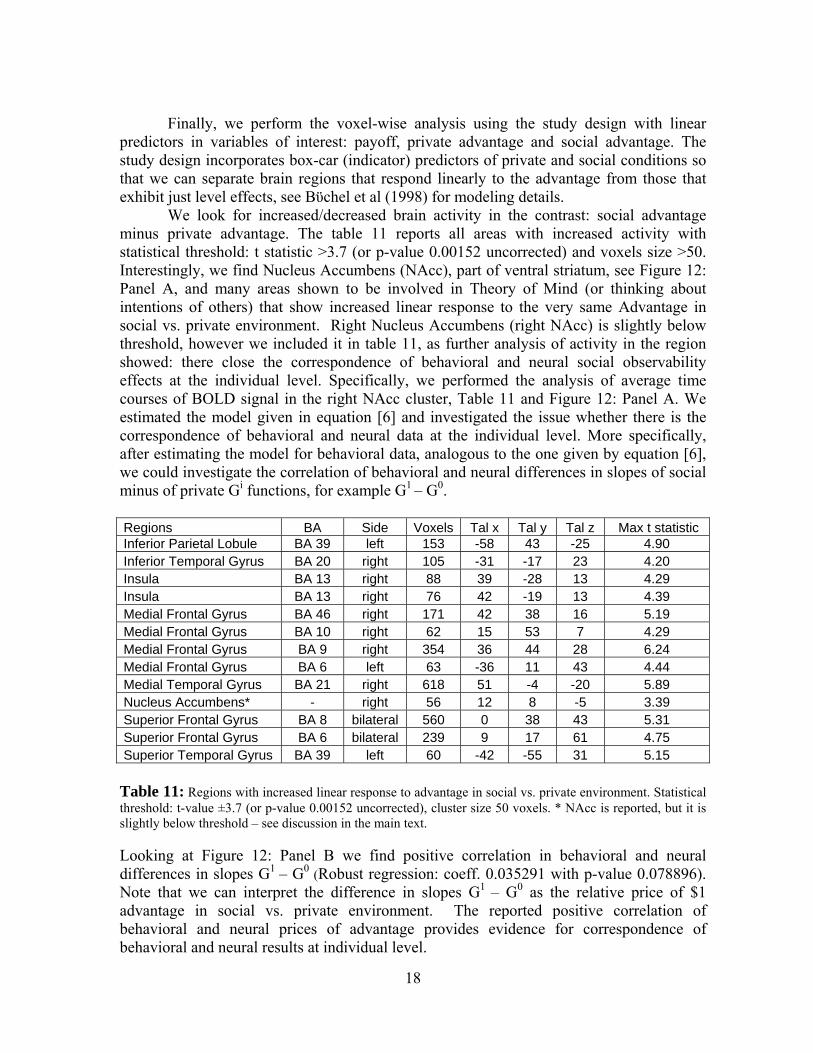
predictors in variables of interest: payoff, private advantage and social advantage. The study design incorporates box-car (indicator) predictors of private and social conditions so that we can separate brain regions that respond linearly to the advantage from those that exhibit just level effects, see Bϋchel et al (1998) for modeling details.
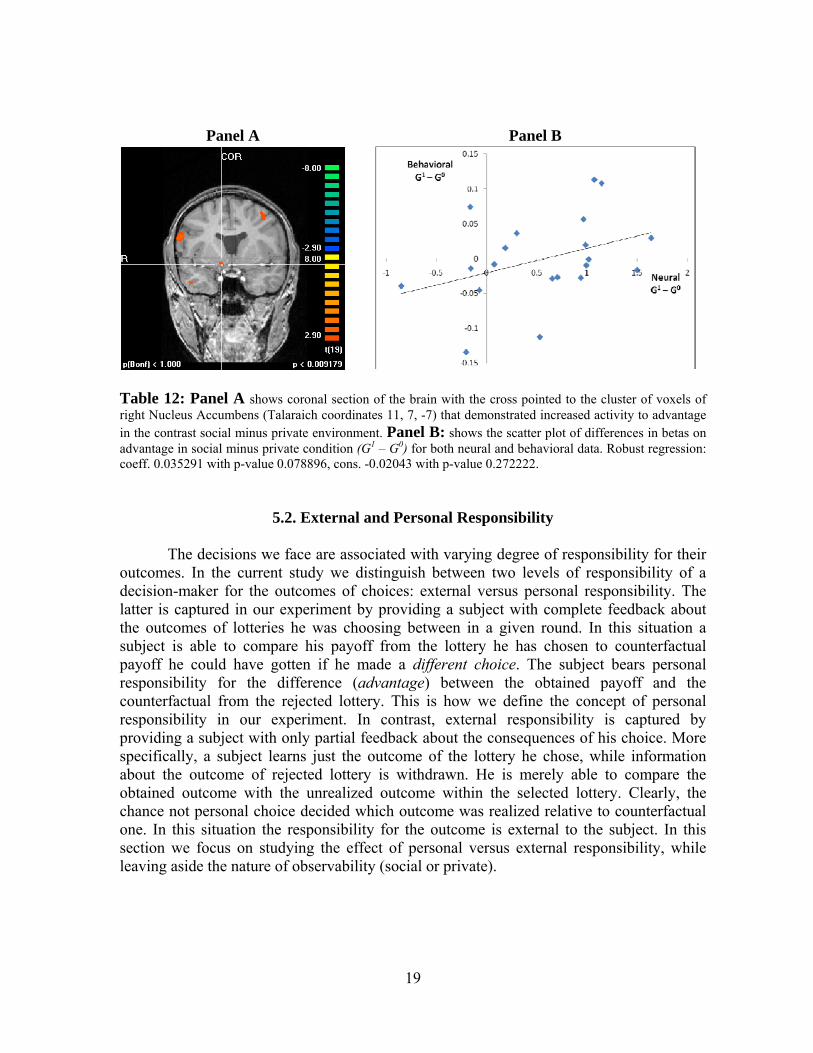
We look for increased/decreased brain activity in the contrast: social advantage minus private advantage. The table 11 reports all areas with increased activity with statistical threshold: t statistic >3.7 (or p-value 0.00152 uncorrected) and voxels size >50. Interestingly, we find Nucleus Accumbens (NAcc), part of ventral striatum, see Figure 12: Panel A, and many areas shown to be involved in Theory of Mind (or thinking about intentions of others) that show increased linear response to the very same Advantage in social vs. private environment. Right Nucleus Accumbens (right NAcc) is slightly below threshold, however we included it in table 11, as further analysis of activity in the region showed: there close the correspondence of behavioral and neural social observability effects at the individual level. Specifically, we performed the analysis of average time courses of BOLD signal in the right NAcc cluster, Table 11 and Figure 12: Panel A. We estimated the model given in equation [6] and investigated the issue whether there is the correspondence of behavioral and neural data at the individual level. More specifically, after estimating the model for behavioral data, analogous to the one given by equation [6], we could investigate the correlation of behavioral and neural differences in slopes of social minus of private Gi functions, for example G1 – G0. Regions BA Side Voxels Tal x Tal y Tal z Max t statistic Inferior Parietal Lobule BA 39 left 153 -58 43 -25 4.90 Inferior Temporal Gyrus BA 20 right 105 -31 -17 23 4.20 Insula BA 13 right 88 39 -28 13 4.29 Insula BA 13 right 76 42 -19 13 4.39 Medial Frontal Gyrus BA 46 right 171 42 38 16 5.19 Medial Frontal Gyrus BA 10 right 62 15 53 7 4.29 Medial Frontal Gyrus BA 9 right 354 36 44 28 6.24 Medial Frontal Gyrus BA 6 left 63 -36 11 43 4.44 Medial Temporal Gyrus BA 21 right 618 51 -4 -20 5.89 Nucleus Accumbens* - right 56 12 8 -5 3.39 Superior Frontal Gyrus BA 8 bilateral 560 0 38 43 5.31 Superior Frontal Gyrus BA 6 bilateral 239 9 17 61 4.75 Superior Temporal Gyrus BA 39 left 60 -42 -55 31 5.15 Table 11: Regions with increased linear response to advantage in social vs. private environment. Statistical threshold: t-value ±3.7 (or p-value 0.00152 uncorrected), cluster size 50 voxels. * NAcc is reported, but it is slightly below threshold – see discussion in the main text. Looking at Figure 12: Panel B we find positive correlation in behavioral and neural differences in slopes G1 – G0 (Robust regression: coeff. 0.035291 with p-value 0.078896). Note that we can interpret the difference in slopes G1 – G0 as the relative price of $1 advantage in social vs. private environment. The reported positive correlation of behavioral and neural prices of advantage provides evidence for correspondence of behavioral and neural results at individual level.
19
Table 12: Panel A shows coronal section of the brain with the cross pointed to the cluster of voxels of right Nucleus Accumbens (Talaraich coordinates 11, 7, -7) that demonstrated increased activity to advantage in the contrast social minus private environment. Panel B: shows the scatter plot of differences in betas on advantage in social minus private condition (G1 – G0) for both neural and behavioral data. Robust regression: coeff. 0.035291 with p-value 0.078896, cons. -0.02043 with p-value 0.272222.
5.2. External and Personal Responsibility
The decisions we face are associated with varying degree of responsibility for their outcomes. In the current study we distinguish between two levels of responsibility of a decision-maker for the outcomes of choices: external versus personal responsibility. The latter is captured in our experiment by providing a subject with complete feedback about the outcomes of lotteries he was choosing between in a given round. In this situation a subject is able to compare his payoff from the lottery he has chosen to counterfactual payoff he could have gotten if he made a different choice. The subject bears personal responsibility for the difference (advantage) between the obtained payoff and the counterfactual from the rejected lottery. This is how we define the concept of personal responsibility in our experiment. In contrast, external responsibility is captured by providing a subject with only partial feedback about the consequences of his choice. More specifically, a subject learns just the outcome of the lottery he chose, while information about the outcome of rejected lottery is withdrawn. He is merely able to compare the obtained outcome with the unrealized outcome within the selected lottery. Clearly, the chance not personal choice decided which outcome was realized relative to counterfactual one. In this situation the responsibility for the outcome is external to the subject. In this section we focus on studying the effect of personal versus external responsibility, while leaving aside the nature of observability (social or private).
Panel A Panel B
20
5.2.1. External and Personal Responsibility: Model and Hypotheses
As before for observability factor, we can simplify MMR model to focus solely on
responsibility factor under study. The equation for experienced utility Vj (x, y) can be written now as:
Vj (x, y) = u(x) + Gj ( x - y ) [7]
for j=0,1, where G0 is the function relevant in the external condition and G1 in the personal one. Let us recall our main hypotheses.
Hypotheses:
1) The functions Gj are non-zero; that is, the comparison between the own and the counterfactual outcome is activating specifically the reward system.
2) The functions Gj are increasing, so that the function Vi is increasing in the subject’s own payoff (the x in the equation 1) and decreasing in the counterfactual payoff y.
3) The slope of the function G1 is larger than the slope of G0.
We observe the brain activity in the reward system as measured by BOLD signal and the behavioral variable mood. These two variables are predicted to be increasing in the function V, hence they should be also increasing in x and decreasing in y. For the variable mood they are those that we have already tested. Now we want to test those hypotheses for the BOLD signal in the brain reward system (ventral striatum). We provide below evidence confirming all three hypotheses.
5.2.2. External and Personal Responsibility: Neural Results Analyzing the brain data we focused on the event “Compare” in each round, during
which a subject was presented (for 5 seconds) with his obtained payoff x versus the most relevant counterfactual payoff y. The main interest is to look into predictors that model counterfactual payoff. Of course we have two natural possibilities here to consider: 1) difference between obtained payoff and counterfactual one – we call this difference advantage; 2) counterfactual payoff alone – we call it also other payoff. In our analysis we control for the actual payoff a subject has received, which implies that the model with other payoff rather than advantage exhibits less correlation.
We start with the study design with tercile predictors of variables of interest: payoff, external advantage, personal advantage. We address first the question whether counterfactual comparisons matter at all in personal responsibility condition, for example is the function G1 is non-zero. We look at the contrast of the 3rd tercile of personal advantage minus 1st tercile of external advantage. We find increased activity bilaterally in ventral striatum, the reward area, see Figure 13: Panel A. Next we perform region of interest analysis (ROI) in the left cluster of ventral striatum demonstrated to be involved in counterfactual comparisons in personal condition. We compute percentage BOLD changes
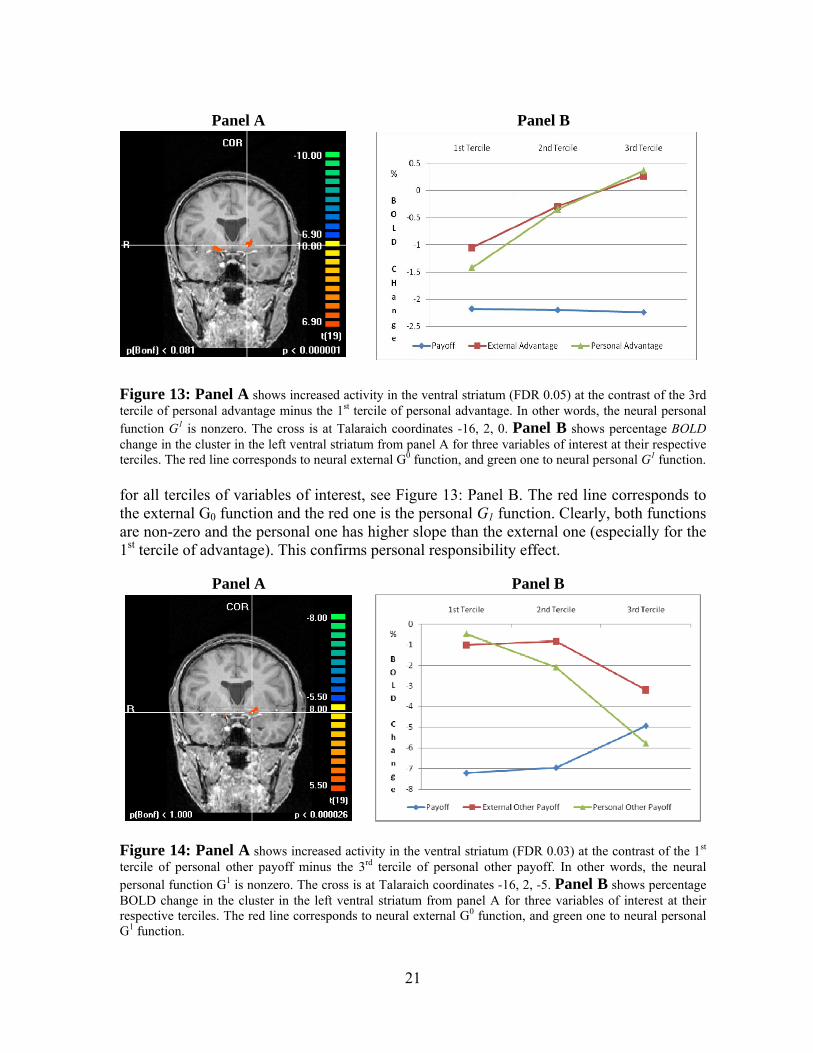
21
Figure 13: Panel A shows increased activity in the ventral striatum (FDR 0.05) at the contrast of the 3rd tercile of personal advantage minus the 1st tercile of personal advantage. In other words, the neural personal function G1 is nonzero. The cross is at Talaraich coordinates -16, 2, 0. Panel B shows percentage BOLD change in the cluster in the left ventral striatum from panel A for three variables of interest at their respective terciles. The red line corresponds to neural external G0 function, and green one to neural personal G1 function.
for all terciles of variables of interest, see Figure 13: Panel B. The red line corresponds to the external G0 function and the red one is the personal G1 function. Clearly, both functions are non-zero and the personal one has higher slope than the external one (especially for the 1st tercile of advantage). This confirms personal responsibility effect.
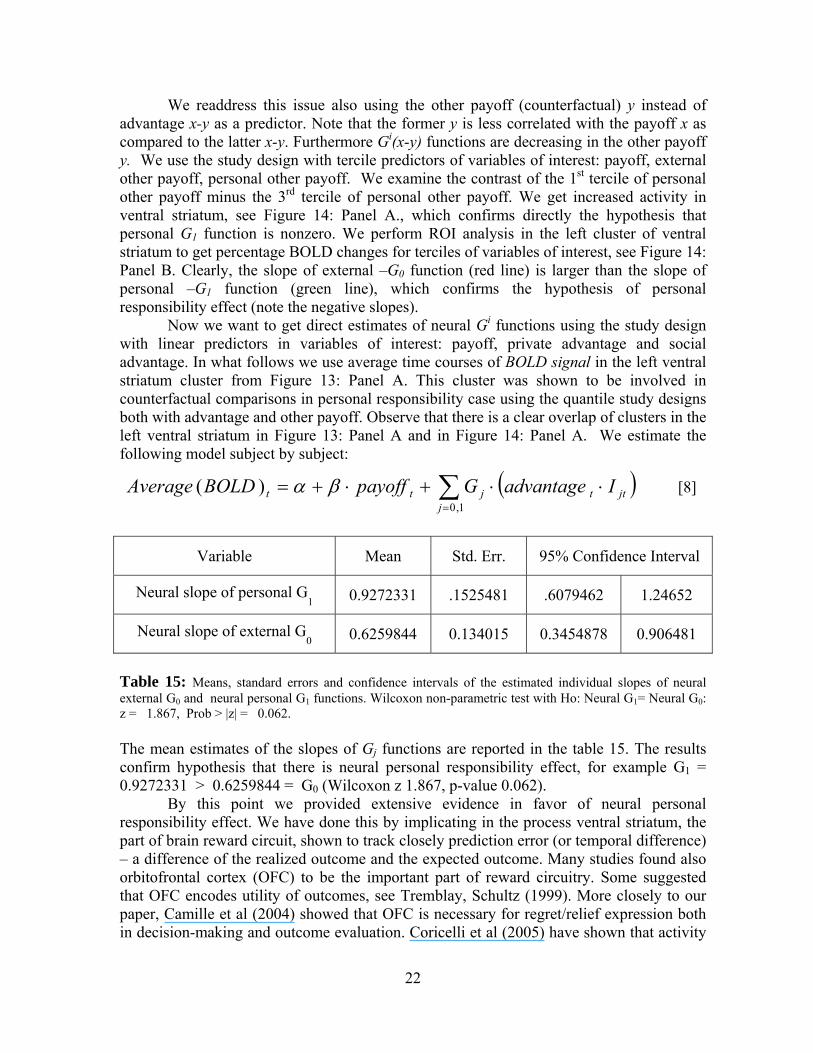
Figure 14: Panel A shows increased activity in the ventral striatum (FDR 0.03) at the contrast of the 1st tercile of personal other payoff minus the 3rd tercile of personal other payoff. In other words, the neural personal function G1 is nonzero. The cross is at Talaraich coordinates -16, 2, -5. Panel B shows percentage BOLD change in the cluster in the left ventral striatum from panel A for three variables of interest at their respective terciles. The red line corresponds to neural external G0 function, and green one to neural personal G1 function.
Panel A Panel B
Panel A Panel B
22
We readdress this issue also using the other payoff (counterfactual) y instead of advantage x-y as a predictor. Note that the former y is less correlated with the payoff x as compared to the latter x-y. Furthermore Gi(x-y) functions are decreasing in the other payoff y. We use the study design with tercile predictors of variables of interest: payoff, external other payoff, personal other payoff. We examine the contrast of the 1st tercile of personal other payoff minus the 3rd tercile of personal other payoff. We get increased activity in ventral striatum, see Figure 14: Panel A., which confirms directly the hypothesis that personal G1 function is nonzero. We perform ROI analysis in the left cluster of ventral striatum to get percentage BOLD changes for terciles of variables of interest, see Figure 14: Panel B. Clearly, the slope of external –G0 function (red line) is larger than the slope of personal –G1 function (green line), which confirms the hypothesis of personal responsibility effect (note the negative slopes).
Now we want to get direct estimates of neural Gi functions using the study design with linear predictors in variables of interest: payoff, private advantage and social advantage. In what follows we use average time courses of BOLD signal in the left ventral striatum cluster from Figure 13: Panel A. This cluster was shown to be involved in counterfactual comparisons in personal responsibility case using the quantile study designs both with advantage and other payoff. Observe that there is a clear overlap of clusters in the left ventral striatum in Figure 13: Panel A and in Figure 14: Panel A. We estimate the following model subject by subject:
Variable Mean Std. Err. 95% Confidence Interval
Neural slope of personal G1 0.9272331 .1525481 .6079462 1.24652
Neural slope of external G0 0.6259844 0.134015 0.3454878 0.906481
Table 15: Means, standard errors and confidence intervals of the estimated individual slopes of neural external G0 and neural personal G1 functions. Wilcoxon non-parametric test with Ho: Neural G1= Neural G0: z = 1.867, Prob > |z| = 0.062. The mean estimates of the slopes of Gj functions are reported in the table 15. The results confirm hypothesis that there is neural personal responsibility effect, for example G1 = 0.9272331 > 0.6259844 = G0 (Wilcoxon z 1.867, p-value 0.062).
By this point we provided extensive evidence in favor of neural personal responsibility effect. We have done this by implicating in the process ventral striatum, the part of brain reward circuit, shown to track closely prediction error (or temporal difference) – a difference of the realized outcome and the expected outcome. Many studies found also orbitofrontal cortex (OFC) to be the important part of reward circuitry. Some suggested that OFC encodes utility of outcomes, see Tremblay, Schultz (1999). More closely to our paper, Camille et al (2004) showed that OFC is necessary for regret/relief expression both in decision-making and outcome evaluation. Coricelli et al (2005) have shown that activity
( )∑=
⋅⋅+⋅+=1,0
)(j
jttjtt IadvantageGpayoffBOLDAverage βα [8]
23
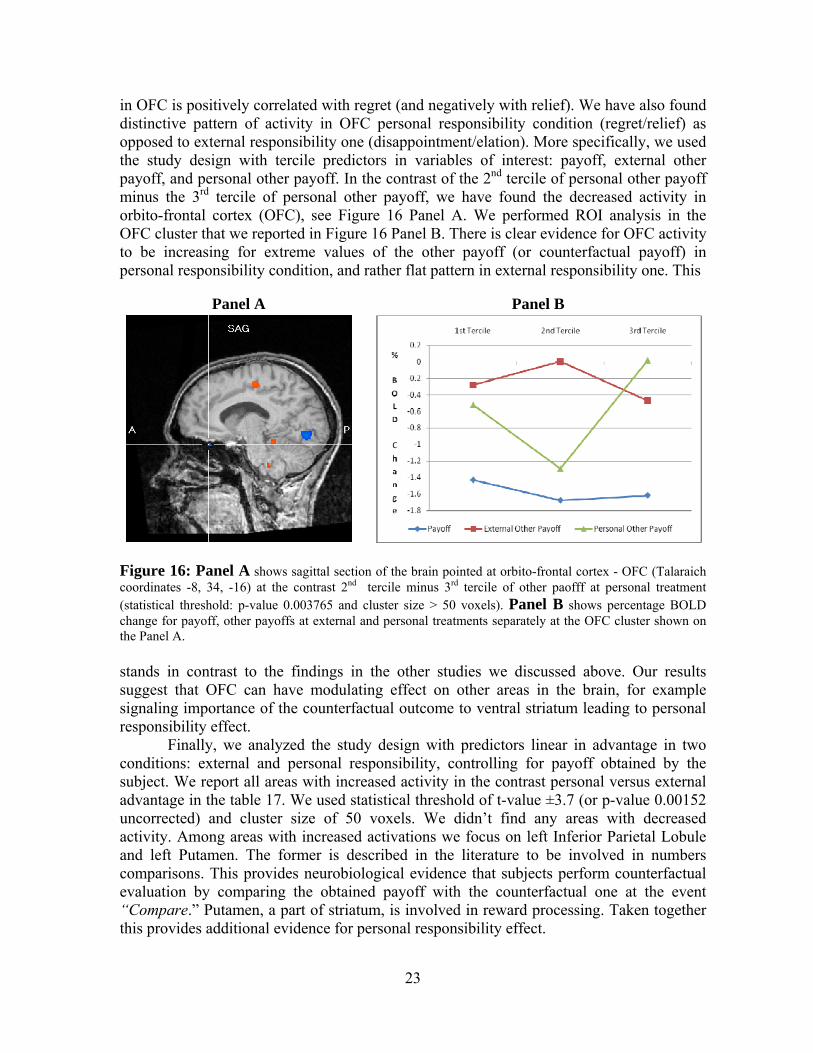
in OFC is positively correlated with regret (and negatively with relief). We have also found distinctive pattern of activity in OFC personal responsibility condition (regret/relief) as opposed to external responsibility one (disappointment/elation). More specifically, we used the study design with tercile predictors in variables of interest: payoff, external other payoff, and personal other payoff. In the contrast of the 2nd tercile of personal other payoff minus the 3rd tercile of personal other payoff, we have found the decreased activity in orbito-frontal cortex (OFC), see Figure 16 Panel A. We performed ROI analysis in the OFC cluster that we reported in Figure 16 Panel B. There is clear evidence for OFC activity to be increasing for extreme values of the other payoff (or counterfactual payoff) in personal responsibility condition, and rather flat pattern in external responsibility one. This
Figure 16: Panel A shows sagittal section of the brain pointed at orbito-frontal cortex - OFC (Talaraich coordinates -8, 34, -16) at the contrast 2nd tercile minus 3rd tercile of other paofff at personal treatment (statistical threshold: p-value 0.003765 and cluster size > 50 voxels). Panel B shows percentage BOLD change for payoff, other payoffs at external and personal treatments separately at the OFC cluster shown on the Panel A. stands in contrast to the findings in the other studies we discussed above. Our results suggest that OFC can have modulating effect on other areas in the brain, for example signaling importance of the counterfactual outcome to ventral striatum leading to personal responsibility effect.
Finally, we analyzed the study design with predictors linear in advantage in two conditions: external and personal responsibility, controlling for payoff obtained by the subject. We report all areas with increased activity in the contrast personal versus external advantage in the table 17. We used statistical threshold of t-value ±3.7 (or p-value 0.00152 uncorrected) and cluster size of 50 voxels. We didn’t find any areas with decreased activity. Among areas with increased activations we focus on left Inferior Parietal Lobule and left Putamen. The former is described in the literature to be involved in numbers comparisons. This provides neurobiological evidence that subjects perform counterfactual evaluation by comparing the obtained payoff with the counterfactual one at the event “Compare.” Putamen, a part of striatum, is involved in reward processing. Taken together this provides additional evidence for personal responsibility effect.
Panel A Panel B
24
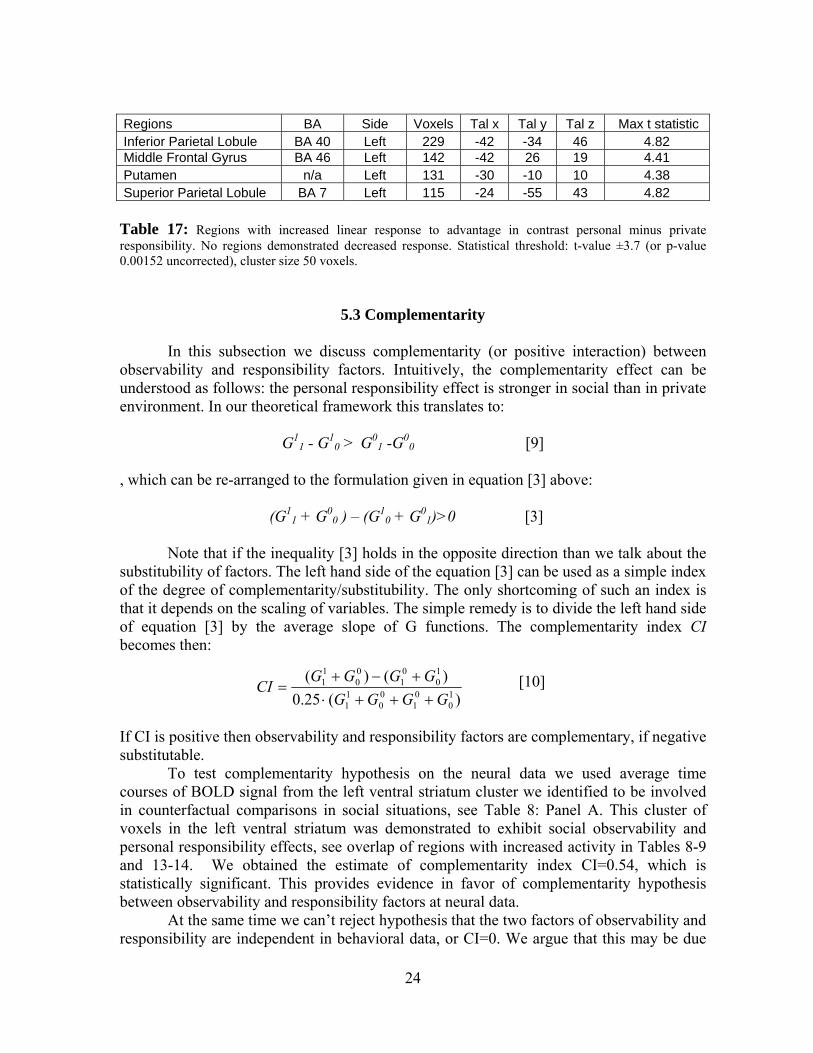
Regions BA Side Voxels Tal x Tal y Tal z Max t statistic Inferior Parietal Lobule BA 40 Left 229 -42 -34 46 4.82 Middle Frontal Gyrus BA 46 Left 142 -42 26 19 4.41 Putamen n/a Left 131 -30 -10 10 4.38 Superior Parietal Lobule BA 7 Left 115 -24 -55 43 4.82 Table 17: Regions with increased linear response to advantage in contrast personal minus private responsibility. No regions demonstrated decreased response. Statistical threshold: t-value ±3.7 (or p-value 0.00152 uncorrected), cluster size 50 voxels.
5.3 Complementarity
In this subsection we discuss complementarity (or positive interaction) between observability and responsibility factors. Intuitively, the complementarity effect can be understood as follows: the personal responsibility effect is stronger in social than in private environment. In our theoretical framework this translates to:
G1
1 - G10 > G0
1 -G00 [9]
, which can be re-arranged to the formulation given in equation [3] above:
(G11 + G0
0 ) – (G10 + G0
1)>0 [3]
Note that if the inequality [3] holds in the opposite direction than we talk about the substitubility of factors. The left hand side of the equation [3] can be used as a simple index of the degree of complementarity/substitubility. The only shortcoming of such an index is that it depends on the scaling of variables. The simple remedy is to divide the left hand side of equation [3] by the average slope of G functions. The complementarity index CI becomes then:
[10]
If CI is positive then observability and responsibility factors are complementary, if negative substitutable.
To test complementarity hypothesis on the neural data we used average time courses of BOLD signal from the left ventral striatum cluster we identified to be involved in counterfactual comparisons in social situations, see Table 8: Panel A. This cluster of voxels in the left ventral striatum was demonstrated to exhibit social observability and personal responsibility effects, see overlap of regions with increased activity in Tables 8-9 and 13-14. We obtained the estimate of complementarity index CI=0.54, which is statistically significant. This provides evidence in favor of complementarity hypothesis between observability and responsibility factors at neural data.
At the same time we can’t reject hypothesis that the two factors of observability and responsibility are independent in behavioral data, or CI=0. We argue that this may be due
)(25.0)()(
10
01
00
11
10
01
00
11
GGGGGGGG
CI+++⋅
+−+=
25
to misreporting of self-reported affective ratings along social/private dimension. As we mentioned before, the relatively weak effect of social observability effect in behavioral data may be due to subjects instinctively avoiding loser’s and show-off’s perceptions in social environment, which leads to understatement of extreme ratings in this situation. If this were the case, then we would exactly observe the patterns we have found, for example less complementarity in behavioral as compared to neural data.
We can actually test whether the neural data provide some evidence for misreporting of affective ratings in social rather than private environments. To see how, consider the study of Kerns et al (2004) that implicates Anterior Cingulate Cortex (ACC) in conflict monitoring. The conflict is about which response to the stimulus one should implement: the automatic one or the alternative one suggested by cognitive control mechanism. In our situation one could expect conflict between revealing true versus cognitively misreported affective ratings. The latter could have been adjusted relative to the
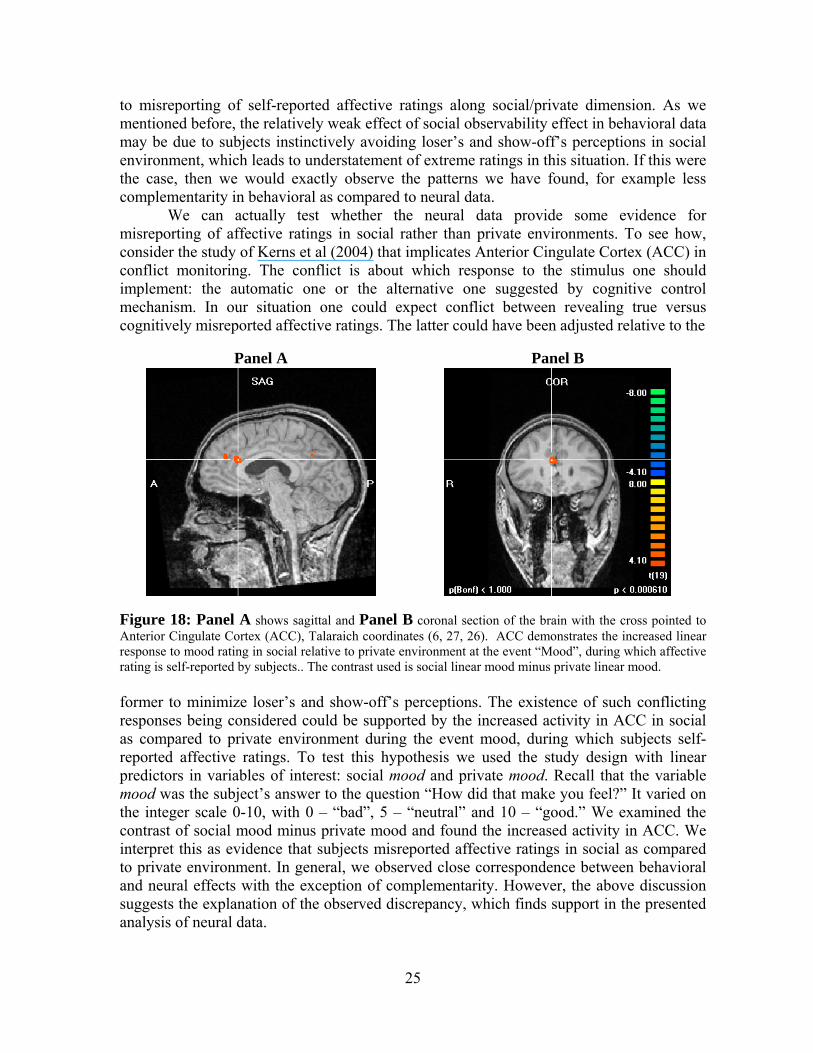
Figure 18: Panel A shows sagittal and Panel B coronal section of the brain with the cross pointed to Anterior Cingulate Cortex (ACC), Talaraich coordinates (6, 27, 26). ACC demonstrates the increased linear response to mood rating in social relative to private environment at the event “Mood”, during which affective rating is self-reported by subjects.. The contrast used is social linear mood minus private linear mood. former to minimize loser’s and show-off’s perceptions. The existence of such conflicting responses being considered could be supported by the increased activity in ACC in social as compared to private environment during the event mood, during which subjects self-reported affective ratings. To test this hypothesis we used the study design with linear predictors in variables of interest: social mood and private mood. Recall that the variable mood was the subject’s answer to the question “How did that make you feel?” It varied on the integer scale 0-10, with 0 – “bad”, 5 – “neutral” and 10 – “good.” We examined the contrast of social mood minus private mood and found the increased activity in ACC. We interpret this as evidence that subjects misreported affective ratings in social as compared to private environment. In general, we observed close correspondence between behavioral and neural effects with the exception of complementarity. However, the above discussion suggests the explanation of the observed discrepancy, which finds support in the presented analysis of neural data.
Panel A Panel B
26
6. Conclusions
In this paper we presented the results of an fMRI experiment that focused on evaluations of outcomes after decisions were made. We collected both behavioral and neural data, which allowed us to demonstrate the close correspondence of behavioral and neural effects. Specifically, we showed that the subjective value of the obtained outcome x in the outcome profile (x, y) depends on the counterfactual outcome y that that the subject could have had. In other words counterfactual comparisons do matter. Our 2 x 2 design allowed as to distinguish the conditions under which counterfactual comparisons matter more from those in which they matter less so. We considered two factors in our experimental design: nature of observability (private or social) and degree of responsibility (external or personal). We found evidence in favor of social observability effect. In other words if the outcome profile (x, y) is socially observable, with outcome x obtained by the subject as compared to someone else’s outcome y he could have had, then subjective value of x will depend on the counterfactual outcome to higher extent as compared to private environment. Similarly, we found evidence for personal responsibility effect. In other words, if the subject obtained the outcome x instead of the counterfactual outcome y due to his choice rather than just pure chance the importance of counterfactual comparison is elevated. In addition we provided evidence supporting complementarity effect in neural data. We suggest that the lack of complementarity effect in behavioral data is due to subtle subjects’ misreporting of affective ratings along private/social dimension. This interpretation found support in the additional analysis of neural data.
From neuroscientific point of view, ventral striatum and orbito-frontal cortex (OFC) seem to be essential for counterfactual comparisons. The activity in ventral striatum was shown to closely track the difference between the obtained outcome and counterfactual one. The slope of activity changes increased from private to social environment (social observability effect), and from external to personal responsibility case (personal responsibility effect). At the same time we found evidence for OFC activity to increase for extreme values of counterfactual payoff in personal responsibility condition, suggesting that it may provide a signal to other brain regions about the importance of counterfactual comparison in this case. From the neuroscientific viewpoint it is important to highlight that the subjects looked at the lotteries with spinners pointing to outcomes 2 seconds before the actual outcome profile (x ,y) was singled out on the subsequent screen presented to the subjects (the event “Compare”). We documented thoroughly the increased activity in ventral striatum during the event “Compare” as outcome profile was already known earlier. In neuroscience literature the ventral striatum was shown to respond only the unexpected part of the reward. We view our findings as supporting the extended role of ventral striatum to measure not only unexpected gains/losses, but also the highly relevant (but well known) differences in the realized and counterfactual outcomes.
Much work remains to be done to uncover the nature of reward processing and motivation system in the brain. At the current stage, it would be interesting to study whether there are gender differences in social observability and personal responsibility effects. The other direction of further research we envision is to study whether humans are more prone to imitate high performers, or rather differentiate their actions to have a chance to outperform them.
27
References
Abel, A. B. (1990): “Asset Prices under Habit Formation and Catching up with the Joneses.,” The American Economic Review, 80(2), p. 38-42. Allais, M. (1953): “Le comportement de l’homme rationnel devant le risque, critique des postulats et axiomes de l’ecole americaine,” Econometrica, 21, 53–526. Anscombe, F. J., AND R. Aumann (1963): “A Definition Bϋchel, C., A. P. Holmes, AND K. J. Friston (1998): “Characterizing stimulus-response functions using nonlinear regressors in parametric fMRI experiments,” NeuroImage, 8, 140-148. Caplin, A. AND K. Eliaz (2003): “AIDS Policy and Psychology: A Mechanism-Design Approach,” Rand Journal of Economics, 34(4), 631-646. Corbit, L., J. Muir, AND B.W. Balleine, (2001): “The Role of Nucleus Accumbens in Instrumental Conditioning: Evidence for a Functional Disassociation between Accumbens Core and Shell,” Journal of Neuroscience, 21, 3251-3260. Camille, N., G. Coricelli, J. Sallet, P. Pradat-Diehl, J.-R. Duhamel, AND A. Sirigu (2004): “The Involvement of Orbitofrontal Cortex in the Experience of Regret,” Science, 304, 1167-1170. Coricelli, G., H. D. Critchley, M. Joffily, J. P. O’Doherty, A. Sirigu, AND R.J. Dolan (2005): “Regret and its avoidance: a neuroimaging study of choice behavior,” Nature Neuroscience, 8(9), 1255-1262. Coricelli, G., R. J. Dolan, AND A. Sirigu (2007): “Brain, Emotion and Decision Making: The Paradigmatic Example of Regret,” Trends in Cognitive Sciences, 11(6), 258-265. Dayan, P., AND B.W. Balleine (2002): “Reward, Motivation, Learning,” Neuron, 36, 285-298. Kerns, G. J., J. D. Cohen, A. W. MacDonald, III, R. Y. Cho, V. A. Stenger, AND C. S. Carter (2004): “Anterior Cingulate Conflict Monitoring and Adjustments in Control,” Science, 303, 1023-1026. Loomes, G., AND R. Sudgen (1982): “Regret Theory: An Alternative Theory of Rational Choice under Uncertainty,” The Economic Journal, 92, 805-824. Loomes, G., AND R. Sudgen (1987): “Testing for Regret and Disappointment in Choice under Uncertainty,” The Economic Journal, 97, 118-129. Maccheroni, F., M. Marinacci, A. Rustichini (2007): “Social Decision Theory,” unpublished manuscript. Montague, P. R., B. King-Casas, and J. D. Cohen (2006): “Imaging Valuation Models in Human Choice,” The Annual Review of Neuroscience, 29, 417-448. Nichols, T.E., M Brett, J. Andersson, T. Wager, AND J-B. Poline (2005): “Valid conjunction inference with the minimum statistic,” NeuroImage, vol. 25, p. 653–660. O’Doherty, J., P. Dayan, J. Schultz, R. Deichmann, K. Friston, AND R.J. Dolan (2004): “Dissociable Roles of Ventral and Dorsal Striatum in Instrumental Conditioning,” Science, 304(5669), 452-454. Rabin, M. (1994): “Incorporating Fairness into Game Theory and Economics,” The American Economic Review, 83(5), 1281-1302. Rolls, T. E. , C. McCabe, AND J. Redoute (2007): “Expected Value, Reward Outcome, and Temporal Difference Error Representations in Probabilistic Decision Task,” Cerebral Cortex, online ahead of print.
28
Schultz, W., P. Dayan, AND P. R. Montague (1997): “A Neural Substrate of Prediction and Reward,” Science, 275, 1593-1599. Seymour, B., N. Daw, P. Dayan, T. Singer, AND R. Dolan (2007): “Differential Encoding of Losses and Gains in the Human Striatum,” Journal of Neuroscience, 27, 4826-4831. Soros, G. (1994): The Alchemy of Finance, Hoboken, NJ, John Wiley & Sons. Sutton, S. R, AND G. A. Barto (1998): Reinforcement Learning: An Introduction, Cambridge, MA, The MIT Press. Tom, S. M., C. R. Fox, C. Trepel, AND Poldrack R.A. (2007): “The Neural Basis of Loss Aversion in Decision-making under Risk,” Science, 315, 515-518. Tremblay, L., AND W. Schultz (1999): “Relative Reward Preference in Primate Orbitofrontal Cortex,” Nature, 398(6729), 704-708. von Neumann, J., AND O. Morgenstern (1944): Theory of Games and Economic Behavior, Princeton, NJ, Princeton University Press.
7. Appendix: “Methods”
7.1. Participants
Participants were recruited from principles courses in microeconomics and macroeconomics at University of Minnesota. In total, 60 subjects took part in 20 experimental sessions. Within a session, one subject was placed in magnetic resonance imaging scanner (MRI scanner), and 2 other at computers outside the scanner in the small conference room. All 20 scanned participants were right-handed, healthy males. In this way we avoided confounds related to handedness and gender. There were 24 males, and 16 females among 40 subjects participating outside the scanner. All subjects gave informed consent to participate according to the procedures approved by University of Minnesota Institutional Review Board.
7.2. Experimental Sessions
For each experimental session three subjects were scheduled to arrive at the same time at the Center for Magnetic Resonance Research at University of Minnesota. After arrival of all three, the two participating outside the MRI scanner were led to a small conference room with two laptop computers, where they were provided with instructions. Separately, the subject to be scanned was given instructions after being screened for MRI safety. All participants were repeatedly informed that they will interact over the internet during the actual experiment.
7.3. Task
In each period a subject was to choose a lottery out of a pair of lotteries presented. There were 70 periods. In the beginning of a period each subject was informed about the condition the period would fall into. The message “Play by Yourself” signaled a private
29
environment, while a message “Play with Others” a social environment – see section Conditions below for details. In the private treatment a subject didn’t learn anything about lotteries selected by others, and symmetrically others didn’t learn anything, while in a treatment TP he learned a lottery (and its outcome) - selected by a randomly matched person. After learning the condition in the period, a subject was presented with a pair of lotteries. To avoid careless decision-making a subject could only choose a lottery after 2 seconds from the onset of presentation of lotteries. A participant outside MRI who selected a lottery faster than the other subject outside MRI forced this other subject to face the unselected lottery. This design created incentives for participants outside MRI to decide fast and effectively it prevented situations in which a scanned subject would wait for decisions of others. In contrast, a scanned subject was given unrestricted time to select a lottery as his behavior and brain activity was the main focus of the study. After choosing a lottery a subject observed his selected lottery for 2 seconds as confirmation. Immediately thereafter an idle showed up in each lottery on the screen (see section Conditions for details) and started to rotate clockwise without delay. Once spinning finished, idles pointing to the outcome of lotteries we kept on the screen for 2 seconds. Next a comparison of outcome of chosen lottery was presented versus alternative outcome, (see section Conditions for details). A period finished with a subject being asked to answer a question: “How did that make you feel?” on the integer scale from 0 (bad) to 10 (good), with a bar at initial position 5 (neutral). The timing of a period is shown in the figure 2 in the main text.
7.4. Lotteries
The lotteries were presented graphically in the form of pie charts. Each lottery had two possible outcomes. A possible outcome was denoted by a payment number written in a sector of a pie chart. A sector area corresponded to probability of a given outcome. We used 20 distinct pairs of lotteries, see table 19 below. For each pair there was similar pair that differed by small perturbations of probabilities and possible outcomes. In other words, we had 10 classes of lotteries. Within a pair of lotteries, one was relatively riskier ($-Bet) than the other (P-Bet), however they were similar in expected values. We tested the initial set of lotteries behaviorally on a small group of subject. Using test results we made some fine-tuning to payoffs and probabilities so that the choice between two lotteries would seem less obvious. We drew the outcomes of lotteries before the beginning of this study, so each subject faced exactly the same resolution of uncertainty. We used pairs of lotteries repeatedly, 10 types were used 4 times and the other 10 types were used 3 times, which gives 70 periods involving choice. The table below contains pairs of lotteries used in the experiment.
7.5. Conditions
There were 2 ex ante conditions: private (single player) and social (two players) environment. In private treatment each subject didn’t learn anything about the actual choices or payoffs of others. In social condition, each subject was matched with another one and learned his choice of lottery as well as his obtained outcome. The ex ante private
30
condition breaks down to two ex post conditions after choices were made: external responsibility (partial feedback) and personal responsibility (complete feedback). In the private and external condition the unselected lottery disappeared from the screen, so a participant could observe only the resolution of uncertainty in the chosen lottery, and no information about the outcome of the unselected one (partial feedback). In other words, in external condition a subject could face disappointment (or relief), if the actual outcome was lower (higher) than the alternative outcome within a chosen lottery. The difference in outcomes in this counterfactual comparison is more due to external event rather than the active choice of the subject. In contrast, in the ex post private and personal treatment both lotteries, the selected and unselected ones were kept on the screen. In this situation the subject was provided with complete feedback, so that the difference in outcomes of lotteries in due to personal decision of the subject rather than just external chance. There are two ex post conditions for the ex ante social treatment: external responsibility (partial feedback) and personal responsibility (complete feedback). In social & personal condition two matched subjects (social environment) have chosen different lotteries from a pair presented while in social & external condition the same lottery. Obviously, social & personal condition both subjects in the match observed outcomes of both lotteries. In contrast in condition social & personal the unselected lottery was replaced with the exact copy of the selected lottery. This allowed implementing independent spinning of lotteries for both partners. In summary, we had two ex ante conditions: private and personal, and four ex post condition: private & external, private & and personal, social & external and social & personal.
7.6. Payments
In order to attract subjects to participate we promised to pay a show-up fee of $15. A subject to be scanned inside MRI machine was getting additional $25. To cover potential losses a participant was promised a cushion of $15. In addition, subjects were paid the outcomes of 3 lotteries they chose during 70 periods. Outcomes of lotteries varied from -$5 to $25, so losses were possible. We endowed subjects with additional $15 to cushion against the worst possible scenario. In total fixed payments to a scanned subject amounted to $55 and to outside MRI subjects $30. The 3 paid lotteries were determined in the end of the study using a software randomizing device with uniform distribution for each subject separately. The average total payment (payments from 3 paid lotteries are in parenthesis) to subjects scanned in MRI was $66.25 ($11.25), with maximum $94 ($39), minimum $51 (-$4), and standard deviation $10.97 ($10.97). The average total payment (again payments from 3 paid lotteries are in parenthesis) to subjects participating outside MRI was $42.80 ($12.80), with maximum $76 ($46), minimum $23 (-$7), and standard deviation $12.39 ($12.39).
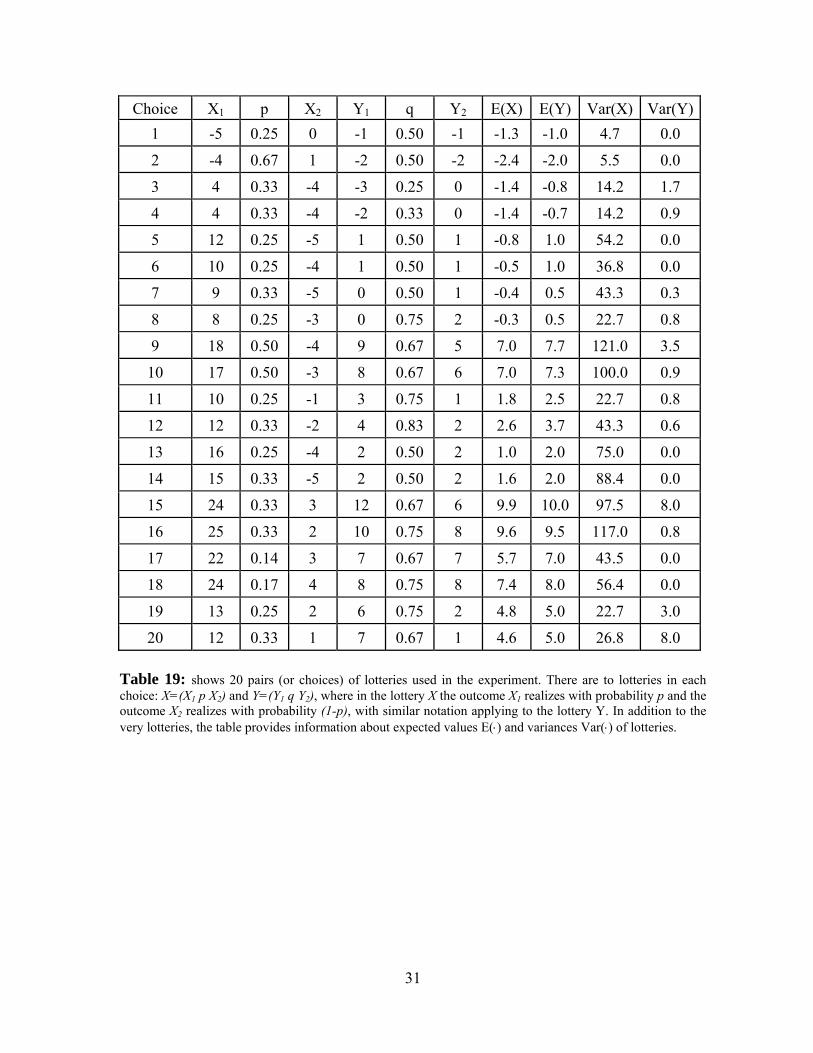
31
Choice X1 p X2 Y1 q Y2 E(X) E(Y) Var(X) Var(Y)1 -5 0.25 0 -1 0.50 -1 -1.3 -1.0 4.7 0.0
2 -4 0.67 1 -2 0.50 -2 -2.4 -2.0 5.5 0.0
3 4 0.33 -4 -3 0.25 0 -1.4 -0.8 14.2 1.7
4 4 0.33 -4 -2 0.33 0 -1.4 -0.7 14.2 0.9
5 12 0.25 -5 1 0.50 1 -0.8 1.0 54.2 0.0
6 10 0.25 -4 1 0.50 1 -0.5 1.0 36.8 0.0
7 9 0.33 -5 0 0.50 1 -0.4 0.5 43.3 0.3
8 8 0.25 -3 0 0.75 2 -0.3 0.5 22.7 0.8
9 18 0.50 -4 9 0.67 5 7.0 7.7 121.0 3.5
10 17 0.50 -3 8 0.67 6 7.0 7.3 100.0 0.9
11 10 0.25 -1 3 0.75 1 1.8 2.5 22.7 0.8
12 12 0.33 -2 4 0.83 2 2.6 3.7 43.3 0.6
13 16 0.25 -4 2 0.50 2 1.0 2.0 75.0 0.0
14 15 0.33 -5 2 0.50 2 1.6 2.0 88.4 0.0
15 24 0.33 3 12 0.67 6 9.9 10.0 97.5 8.0
16 25 0.33 2 10 0.75 8 9.6 9.5 117.0 0.8
17 22 0.14 3 7 0.67 7 5.7 7.0 43.5 0.0
18 24 0.17 4 8 0.75 8 7.4 8.0 56.4 0.0
19 13 0.25 2 6 0.75 2 4.8 5.0 22.7 3.0
20 12 0.33 1 7 0.67 1 4.6 5.0 26.8 8.0 Table 19: shows 20 pairs (or choices) of lotteries used in the experiment. There are to lotteries in each choice: X=(X1 p X2) and Y=(Y1 q Y2), where in the lottery X the outcome X1 realizes with probability p and the outcome X2 realizes with probability (1-p), with similar notation applying to the lottery Y. In addition to the very lotteries, the table provides information about expected values E(⋅) and variances Var(⋅) of lotteries.
Top Related
Copyright © 2022 FDOKUMEN

