


Bahasa
Halaman
Hukum

Biophysical Journal Volume 85 August 2003 695–706 695
The Unbinding of ATP from F1-ATPase
Iris Antes,* David Chandler,* Hongyun Wang,y and George Osterz
*Department of Chemistry, University of California, Berkeley, California 94720; yDepartment of Applied Mathematics and Statistics,Jack Baskin School of Engineering, University of California, Santa Cruz, California 95064; and zDepartments of Molecularand Cellular Biology and ESPM, University of California, Berkeley, California 94720
ABSTRACT Using molecular dynamics, we study the unbinding of ATP in F1-ATPase from its tight binding state to its weakbinding state. The calculations are made feasible through use of interpolated atomic structures from Wang and Oster [Nature1998, 396: 279–282]. These structures are applied to atoms distant from the catalytic site. The forces from these distant atomsgradually drive a large primary region through a series of sixteen equilibrated steps that trace the hinge bending conformationalchange in the b-subunit that drives rotation of g-subunit. As the rotation progresses, we find a sequential weakening andbreaking of the hydrogen bonds between the ATP molecule and the a- and b-subunits of the ATPase. This finding agrees withthe ‘‘binding-zipper’’ model [Oster and Wang, Biochim. Biophys. Acta 2000, 1458: 482–510.] In this model, the progressiveformation of the hydrogen bonds is the energy source driving the rotation of the g-shaft during hydrolysis. Conversely, thecorresponding sequential breaking of these bonds is driven by rotation of the shaft during ATP synthesis. Our results for theenergetics during rotation suggest that the nucleotide’s coordination with Mg21 during binding and release is necessary toaccount for the observed high efficiency of the motor.
INTRODUCTION
This article reports on the use of computer simulations,
combined with prior coarse-grained estimates of structure, to
examine how ATP is released from the catalyic site of F1-
ATPase. Our results shed light on the role of hydrogen bonds
and the coordination of Mg21 in the functioning of this
molecular motor. The dynamics we examine take place over
timescales much longer than those accessible by straightfor-
ward computer simulation. Our method for addressing this
timescale issue should be useful in many other contexts.
ATP synthase, also known as F0F1-ATP synthase, is the
universal protein that synthesizes ATP from ADP and
inorganic phosphate using as its energy source a trans-
membrane protonmotive force (Mitchell, 1961; Boyer, 1993,
1997; Weber and Senior, 2000). It is located in membranes
of mitochondria, chloroplasts and bacteria. ATP synthase
consists of two motors: a membrane-spanning portion, F0,
and a soluble portion, F1. F0 uses the transmembrane elec-
trochemical gradient to generate a rotary torque to drive ATP
synthesis in F1. When driven backward by the torque gen-
erated in F1, F0 pumps ions uphill against their trans-
membrane electrochemical gradient. The rotary torque in F1
is generated by hydrolyzing ATP at its three catalytic sites
(Walker, 2000; Elston et al., 1998; Abrahams et al., 1994).
A schematic view of the structure of ATP synthase is
shown in Fig. 1 a. The asymmetric membrane-spanning F0
region consists of subunits a and c10–14 (the number of
c-subunits varies between species), which contain the proton
channels. The soluble F1 region consists of the subunits d, b2,
a, e, b, and the g-shaft. The three catalytic sites are located in
the a3b3 hexamer. The g-shaft connecting a3b3 to c10–14 is
an antiparallel coiled-coil of two a-helices, which penetrates
the a3b3 hexamer of alternating a and b-subunits. F1 and F0
are connected to each other by the central g-shaft and by the
peripheral subunits b2 via the d-subunit on F1 and the a-
subunit on F0 (see Fig. 1) (Walker, 2000; Pedersen et al.,
2000). Proton flow through the membrane channel at the
interface of the c and a-subunits generates a torque that
rotates the c ring relative to the a-subunit. Because of the two
stalk coupling between F0 and F1, this torque rotates the
g-shaft relative to the a3b3 headpiece. This induces confor-
mational changes in the a3b3 headpiece that drive the release
or binding of ATP. Thus the motor can be divided into two
counter rotating regions: a ‘‘stator’’ consisting of a, b2, d,
a3b3 and a ‘‘rotor’’ consisting of the g, e, and the c ring. At
each a/b-interface one nucleotide can be bound. However,
the sites are not symmetrical: their binding residues lie mainly
in one subunit or the other. Only the binding pockets that are
mainly in theb-subunits catalyze hydrolysis. During each full
rotation of g, three ATP molecules are sequentially
synthesized or hydrolyzed in the three catalytic sites.
Therefore the rotation can be divided into three steps per
revolution, where each 1208 step is associated with the
hydrolysis of one ATP (Sun et al., 2003; Yasuda et al., 2001).
The asymmetry of the catalytic site contributes to the substeps
during rotation. The motor uses the ATP binding free energy
to close the binding pocket and to drive the g-shaft. The
energy necessary for one revolution of the g-subunit is about
three times the hydrolysis free energy of ATP. Thus the motor
works with a very high efficiency of more than 90% (Kinosita
et al., 2000; Yasuda et al., 1998). The conformational
changes of neighboring subunits are coupled such that the
rates of ATP hydrolysis are accelerated up to five orders of
magnitude in multisite catalysis compared with unisite
Submitted November 1, 2002, and accepted for publication March 13,
2003.
Address reprint requests George Oster, E-mail: [email protected].
edu.
� 2003 by the Biophysical Society
0006-3495/03/08/695/12 $2.00
catalysis (Penefsky and Cross, 1991; Senior, 1992; Weber
and Senior, 1997, 2000).
Due to the F1-ATPase’s size (around 50,000 atoms) and
due to the timescale of the ATP release or binding
(milliseconds), the release or binding of ATP cannot be
studied by straightforward molecular dynamics simulations.
To circumvent the large system size, we use a setup that
focuses on the dynamics of only a fraction of the total
system. To surmount the long timescale, we make use of
a series of interpolated structures to examine the system’s
configurations between the tight and the weak binding states
of ATP. The interpolated structures constructed by Wang
and Oster are based on the x-ray crysallographic structure of
Abrahams et al. (Abrahams et al., 1994; Wang and Oster,
1998). A set of 16 equidistant structures were used in our
study, starting at the closed and ending at the open ATP
binding pocket configuration.
The rationale for these interpolated structures was the
demonstration of very tight coupling of the mechanical
motions, a tight coordination of the chemical cycle to the
mechanical rotation, and especially the generation of a nearly
constant torque by the motor (Wang and Oster, 1998; Elston
et al., 1998; Oster and Wang, 2000a,b). To generate
a constant torque, it is necessary to provide a fairly
continuous energy flow from the ATP binding pocket
toward the g-shaft throughout an ATP binding or unbinding
event. Due to this high efficiency and tight coupling of the
motor, a trajectory is expected to fall close to a smooth curve
in configuration space, making interpolated structures useful
at a spatially coarse level. On the other hand, one cannot
expect this picture to be correct on small length scales
characterizing details like the formation of hydrogen bonds.
Since the small length-scale details are of interest here, our
use of the interpolated structures is confined to atoms that are
relatively distant from the nucleotide. In this study, we
assumed that the trajectory of the coarse-grained structure in
the configuration space is a smooth curve. Under this
assumption, the coarse-grained structure in the configuration
space can be approximately recovered by a carefully chosen
interpolation method. The 16 structures are 16 points on this
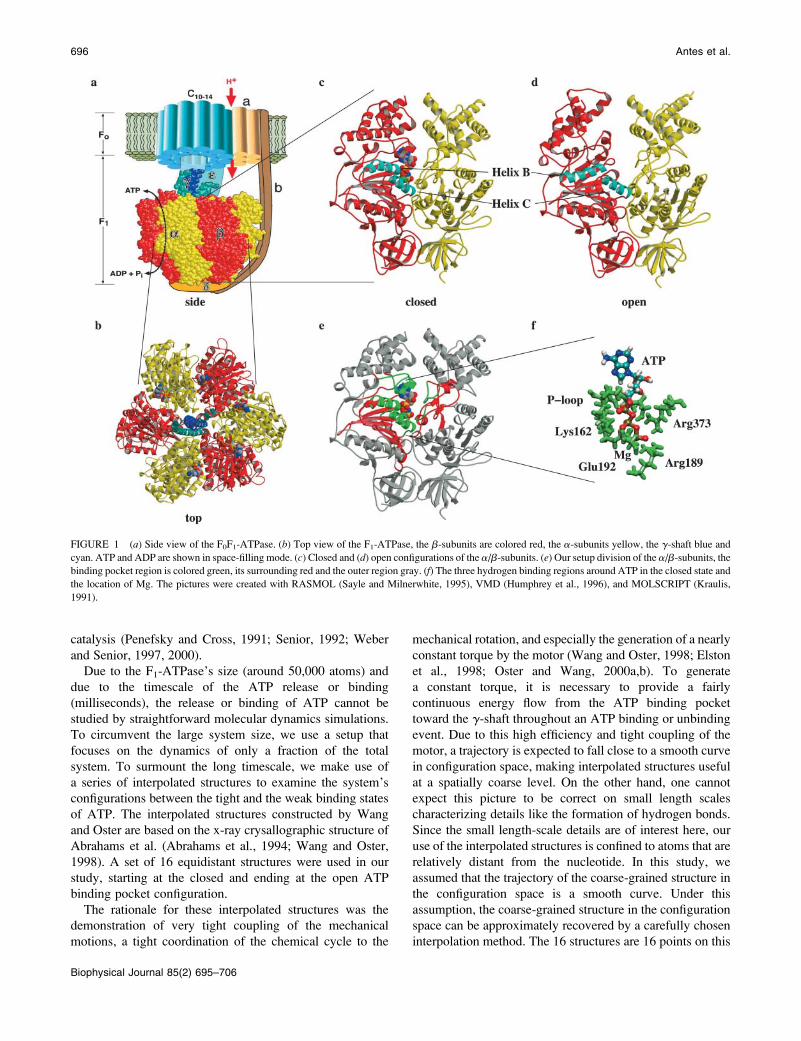
FIGURE 1 (a) Side view of the F0F1-ATPase. (b) Top view of the F1-ATPase, the b-subunits are colored red, the a-subunits yellow, the g-shaft blue and
cyan. ATP and ADP are shown in space-filling mode. (c) Closed and (d) open configurations of the a/b-subunits. (e) Our setup division of the a/b-subunits, the
binding pocket region is colored green, its surrounding red and the outer region gray. (f) The three hydrogen binding regions around ATP in the closed state and
the location of Mg. The pictures were created with RASMOL (Sayle and Milnerwhite, 1995), VMD (Humphrey et al., 1996), and MOLSCRIPT (Kraulis,
1991).
696 Antes et al.
Biophysical Journal 85(2) 695–706

recovered curve. The index of the interpolated structures
does not represent the time, and consequently the sequence
of 16 structures does not necessarily represent the real time
course. The approach of using the interpolated structures is
valid as long as the trajectory of the coarse-grained structure
in the configuration space can be well approximated by
interpolation. This approach should be used with caution,
especially if the two end structures for interpolation are too
far apart or if there are large diffusive steps in the trajectory
(e.g. myosin).
As illustrated in Fig. 1 e, we divided the a- and b-subunits
into three regions centered around the ATP binding pocket.
The central region includes the ATP and all residues making
direct contact with it. A secondary buffer region surrounding
the primary region is used to protect the primary region from
possible effects (such as unphysical heating) due to small
length-scale errors in the interpolated structure. The remain-
ing atoms surround the secondary region and remain fixed at
their interpolated structure positions. The two inner regions
include all secondary structure elements in the binding
pocket vicinity including the b-sheet of the b-subunit, all
a-helices surrounding the ATP, and additional small regions
of the a-subunit. With this selection we cover all residues
which belong to the common binding motifs found in
various nucleotide binding enzymes, e.g. myosin, kinesins,
GroEl, etc. (Walker et al., 1982). The movements of the B
and C helices reflect the motions taking place in the catalytic
site during ATP binding. The role of helices B and C is
illustrated in Fig. 1, c and d, which shows the backbone
structures of the closed and open configurations of the a- and
b-subunits. As the binding pocket opens the relative
movement of the two helices with respect to each other
increases the gap between the a- and b-subunits through
which ATP leaves or enters the binding pocket.
For each interpolated structure, we move the atoms in the
primary and secondary regions by molecular dynamics with
the external forces arising from the fixed atoms in the tertiary
region. The molecular dynamics of the secondary region
uses friction and fluctuating forces to control the temperature
at 3008K. These dissipative terms allow the secondary region
to remove energy from hot spots that may arise at the
interface between the secondary and tertiary regions. Thus
the secondary region serves to buffer the primary region
from small length-scale errors in the interpolated structures
used to fix the tertiary region. The molecular dynamics of the
primary region follows from the interatomic forces only,
with no friction and no random forces. Therefore, our use of
distant interpolated structures imposes a natural bias on
conformational changes in the binding pocket.
We began our sequence of simulations in the tight binding
configuration pocket and drove the primary region toward
the open configuration by changing the interpolated co-
ordinates from structure 1 (bTP (Abrahams et al., 1994)) to
16 (bE). We equilibrated the dynamics regions for each
interpolated structure of the surrounding tertiary atoms. To
begin the molecular dynamics with the nth interpolated
structure of the tertiary region (for n[1), the coordinates of
the two inner regions were taken from the (n � 1)th
equilibrated simulation step, i.e., the simulation with the (n�1)th interpolated structure of the tertiary region. This scheme
provides sixteen equilibrated structures along the opening
pathway of the ATP binding pocket. The use of the
equilibrated coordinates of the previous simulation helps to
keep the system relatively close to equilibrium throughout
the conformational change in the binding pocket region.
Only the very first simulation must be initiated differently
(see below), and therefore does not benefit from this feature
of relatively gentle change. Since each equilibration spans
times of the order of 1–10 ns, the computational effort
required to study the entire sequence of 16 structures visited
by the motor over a period of milliseconds is of the order of
that required to create a straightforward trajectory of only
;100 ns in length.
In a previous molecular dynamics study of the mechanism
of F1, the opening of the binding pocket was studied by
forcing a 1208 rotation of the g-shaft over a period of about
one nanosecond (Bockmann and Grubmuller, 2002). At the
end of this fast driven rotation, the system was run for
another 3.5 ns in an effort to equilibrate. In our experience,
from 1 to 10 ns is required to propagate the reversible effects
of 1/16 of that rotation angle. Therefore, the major structural
and energetic changes in the binding pocket occur only
during the final equilibration period. This behavior is
qualitatively different from the mechanism of the F1 motor,
in which the rotation of g and the opening and closing of the
binding pocket occur in a nearly reversible manner,
influencing each other through continuous propagation of
the conformational changes. Our setup moves the system
through the same rotation, but through sixteen independently
equilibrated steps. We will see that this difference in
methodology leads to significant differences in the results.
Another molecular dynamics study of F1 used the method
of targeted molecular dynamics to follow the entire 1208
rotation of the F1 headpiece and shaft (Ma et al., 2002;
Schlitter et al., 1994). The simulation time (500 ps) was even
shorter than that of the earlier Bockmann and Grubmuller
calculation. As such, small length-scale conformational
changes in the binding pocket could not be resolved. Rather,
the calculation by Ma et al. (2002) can be viewed as a source
of interpolated structures that are strongly biased by the
structural difference between the moving structure and the
target structure. We cannot tell whether this interpolated
structure is consistent with, or relates to, that used in our
work. Indeed, Ma et al. (2002) curiously neglect the
existence of the prior interpolated structures (Wang and
Oster, 1998).
For the analysis of our simulations, we study the energetic
and conformational changes in the ATP binding pocket,
the changes in the coordination of the Mg21 cation, and the
changes in the hydrogen bond pattern between ATP and
Unbinding of ATP 697
Biophysical Journal 85(2) 695–706

the catalytic site. The hydrogen bonds between the ATP
molecule and the binding pocket are crucial for the binding
process.
The binding process proceeds in two steps, first the
diffusion and docking of the ATP molecule into the open
binding pocket (weak binding state) and second, the closing
of the pocket around the ATP molecule as it anneals into the
tightly bound state. The energy transduction takes place
during the transition from the weak binding state to the tight
binding state, a process we call the ‘‘binding transition.’’
When an ATP docks into the catalytic site, it may not be
necessary to strip its hydration waters all at once. Instead,
ATP may progressively exchange its hydrogen bonds to
hydration waters with bonds to the catalytic site. In its tightly
bound state, ATP forms ;15 to 20 hydrogen bonds with the
binding pocket. There are three regions to which ATP is
hydrogen bound. First, the so-called Walker or P-loop
(residues b-Gly-159-b-Val-164) at the beginning of helix B.
Second, the beginning region of helix C, namely b-Arg-189.
And third, the residue a-Arg-373 from the a-subunit (see
Fig. 1, c–e) (Abrahams et al., 1994). Sequential formation of
these 15–20 hydrogen bonds ensures nearly constant force
generation throughout the whole duration of the binding
transition. This ‘‘binding zipper’’ sequence would lead to the
smooth closing motion of the pocket and continuous
conformational changes throughout the b-subunit (Oster
and Wang, 2000a; Elston et al., 1998; Oster and Wang,
2000b). Thus, the binding zipper sequence would provide
the requisite constant torque consistent with the high
efficiency of the motor. Due to thermal fluctuations, there
must be some deviation from this picture at a molecular
level. Although these deviations are apparent in our
simulations, we will see that the qualitative truth of the
zipper model is also apparent.
METHODS
As noted in the Introduction, we effectively reduce the size of the simulated
system by dividing the a and b-subunits into three regions, as shown in
Fig. 1 e. The division into these regions was made according to the physical
importance of the secondary structure elements for the ATP release and
binding (binding pocket region (green in Fig. 1 e): residues a-Ser-335 -
a-Asp-347, a-Leu-369 - a-Thr-380, b-Ala-158 - b-Val-173, b-Glu-188 -
b-Gly-204, b-Arg-337 - b-Val-348, and b-Gln-416 - b-Lys-430, surround-
ing region (red in Fig. 1 e): a-Ile-136 - a-Gly-169, a-Ser-320 - a-Val-334,
a-Gly-348 - a-Gly-368, b-Lys-151 - b-Gly-157, b-Ala-174 - b-Gly-187,
b-Val-205 - b-Gln-221, b-Gln-249 - b-Arg-274, b-Lys-301 - b-Asp-316,
b-Asp-330 - b-Ser-336, b-Asp-349 - b-Ile-357, b-Ser-415, and b-Leu-431).
In addition, due to our special interest in hydrogen bonding, the two
dynamical regions were surrounded by a 30-A radius sphere of water
molecules. The number of water molecules that fit into this volume changes
in the interpolated structures. For the first of our 16 simulation steps, the
volume contained 1342 waters. At the last step, it contained 1808 waters.
The interpolated atomic positions of the outer region of our system are based
on the x-ray crystallographic structure of Abraham et.al. (Abrahams et al.,
1994) for the closed (starting structure) and open (end structure) states
(Wang and Oster, 1998).
For all our simulation steps, we used the CHARMM27 program package
(Brooks et al., 1983). Our force field parameters were based on the
CHARMM all-atom force field (MacKerell et al., 1998) and for the solvent
we used the TIP3P water model (Jorgensen et al., 1990). For the nonbonded
interactions the force-switching method was used with a cutoff radius of
14 A. The interaction energies in Fig. 8 were evaluated without cutoff. The
SHAKE algorithm (Ryckaert et al., 1977) was applied for all bonds
involving hydrogen atoms, which allowed the use of a 2-fs time step. First,
we equilibrated the whole b-subunit and the green and red regions of the
a-subunit shown in Fig. 1 e in their closed state (bTP). This region was
surrounded by a nonspherical shell of water molecules with a minimum
surface distance of 18 A (9070 water molecules). For the placement of
internal water molecules we used the program DOWSER, and the program
SOLVATE was used for the placement of the surrounding water molecules
(Zhang and Hermans, 1996; Eichinger et al., 2000). To ensure the stability of
the volume and shape of our solvent shell, we used a continuously increasing
friction coefficient and harmonic constraints for the outermost 6 A of our
solvent shell. The goal was to obtain equilibrated starting coordinates for the
two inner regions. We first quenched the system for 10,000 steps and then
heated it from 0 to 300 K for 300 ps. Afterwards the system was equilibrated
at 300 K for another 1000 ps.
For the setup of our main simulation, we used the equilibrated
coordinates from the above simulation for the inner two regions and
a spherical solvent shell with a radius of 14 A around the ATP molecule. For
the outer gray region in Fig. 1 e, we took the interpolated coordinates of the
first structure (the tight binding state, bTP) from (Wang and Oster, 1998).
The solvent shell was enlarged to a radius of 30 A, centered on the ATP
molecule. This enlargement surrounded the entire dynamics region with
solvent. Afterwards, we quenched the dynamic region and the solvent for
1000 steps. To ensure constant volume we used the SBOUND approach for
our solvent shell, which applies a soft boundary potential to represent the
average influence of the bulk water on the explicit solvent region (Brooks
and Karplus, 1983). We applied stochastic forces on the solvent molecules
within the outermost 5 A of the shell, using Langevin dynamics with friction
constants up to b ¼ 12 ps�1. For the ATPase region in which we use
stochastic dynamics, b ¼ 10 ps�1 was applied. The system was heated from
0 to 300 K for 500 ps and equilibrated for another 1000 ps.
The equilibrated coordinates of this simulation were then used to set up
and equilibrate the second simulation step. In this case, the interpolated
coordinates of the second structure were used for the outer region. After this
simulation was equilibrated, a third was begun with the coordinates of
the third interpolated structure for the outer region and the equilibrated
coordinates of the second simulation for the inner parts, and so on. Sixteen
simulation steps were performed in this way, until the weak binding state
(bE) was achieved. The equilibration times for the various structures were
usually between 1 and 2 ns. We chose simulation times between 2 and 3 ns
from the second to the 11th steps, and extended the run time to 6.5 ns for the
12th to 15th steps, and to 10 ns for the 16th step. To check for equilibration,
we monitored the overall root-mean-square deviations in atomic positions
from the starting structure (interpolated coordinates for the outer region
combined with the coordinates of the n � 1 step for the two inner regions)
for the two dynamics regions of our simulated structures during the
simulations. We continued the simulations until we had found no significant
drift in this quantity as a function of time for ;1 ns. The final deviations
from the starting structures were between 1.4 and 2.2 A. In addition, we
calculated the final root-mean-square deviations in atomic positions between
the final structures of our simulations and the interpolated structures for each
step, which were between 1.61 and 2.47 A for the binding pocket (green)
region and between 0.92 and 1.44 A for the surrounding (red) region. The
root-mean-square deviations in atomic positions from the closed x-ray
structure were 1.58, 1.74, 1.79, 2.25, 2.45, 2.82, 3.35, 3.77, 3.94, 4.41, 4.70,
4.97, 5.64, 5.84, 6.43, and 6.92 A, respectively, for the binding pocket
region of the final structures from the first to the 16th step . The deviations
from the open x-ray structure decreased correspondingly from 6.84 to 1.92 A
from the first to the 16th step. In addition, from the behavior of the kinetic
698 Antes et al.
Biophysical Journal 85(2) 695–706
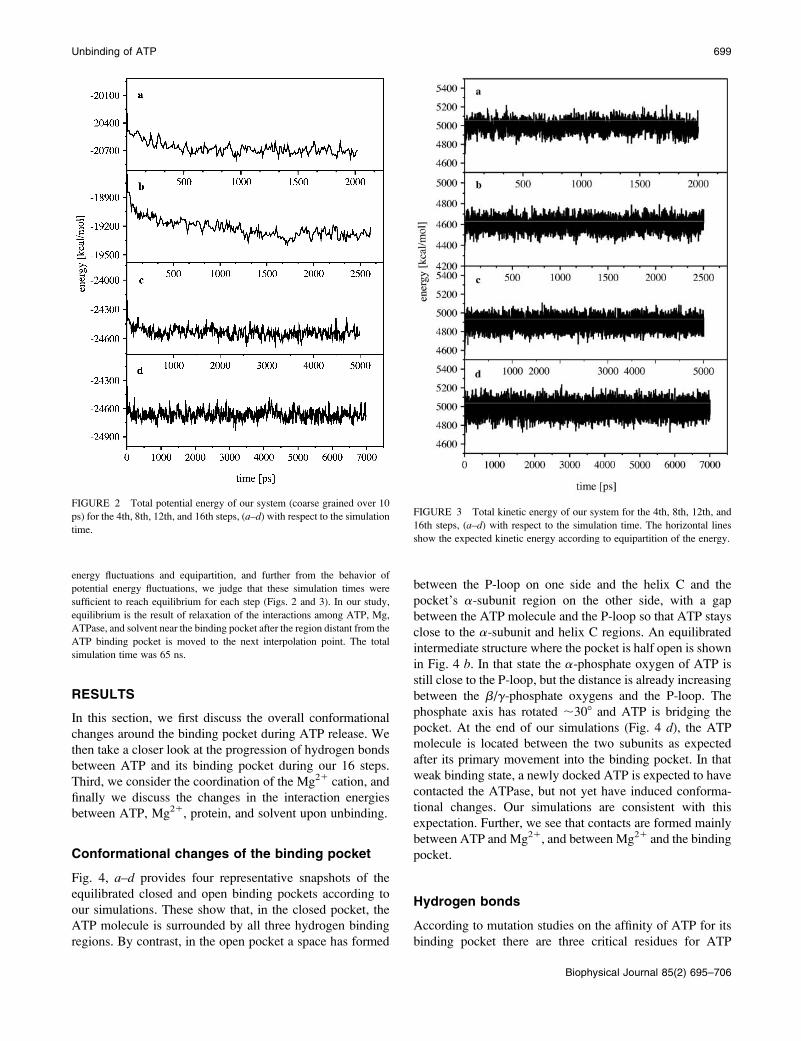
energy fluctuations and equipartition, and further from the behavior of
potential energy fluctuations, we judge that these simulation times were
sufficient to reach equilibrium for each step (Figs. 2 and 3). In our study,
equilibrium is the result of relaxation of the interactions among ATP, Mg,
ATPase, and solvent near the binding pocket after the region distant from the
ATP binding pocket is moved to the next interpolation point. The total
simulation time was 65 ns.
RESULTS
In this section, we first discuss the overall conformational
changes around the binding pocket during ATP release. We
then take a closer look at the progression of hydrogen bonds
between ATP and its binding pocket during our 16 steps.
Third, we consider the coordination of the Mg21 cation, and
finally we discuss the changes in the interaction energies
between ATP, Mg21, protein, and solvent upon unbinding.
Conformational changes of the binding pocket
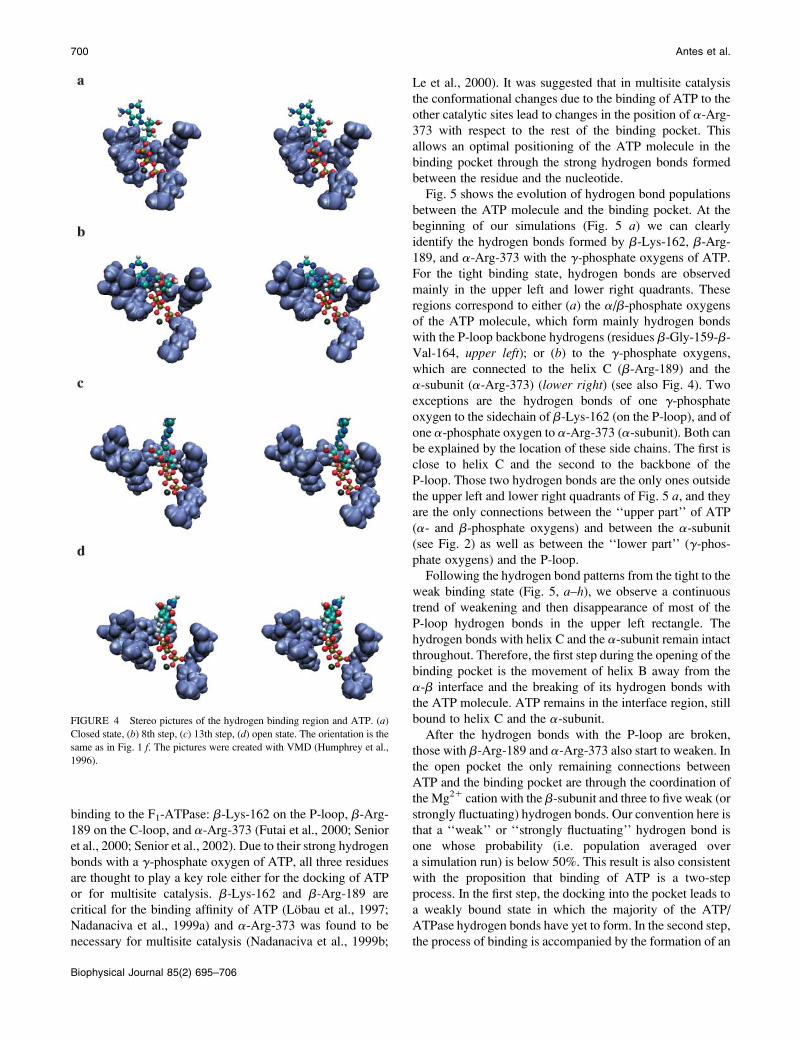
Fig. 4, a–d provides four representative snapshots of the
equilibrated closed and open binding pockets according to
our simulations. These show that, in the closed pocket, the
ATP molecule is surrounded by all three hydrogen binding
regions. By contrast, in the open pocket a space has formed
between the P-loop on one side and the helix C and the
pocket’s a-subunit region on the other side, with a gap
between the ATP molecule and the P-loop so that ATP stays
close to the a-subunit and helix C regions. An equilibrated
intermediate structure where the pocket is half open is shown
in Fig. 4 b. In that state the a-phosphate oxygen of ATP is
still close to the P-loop, but the distance is already increasing
between the b/g-phosphate oxygens and the P-loop. The
phosphate axis has rotated ;308 and ATP is bridging the
pocket. At the end of our simulations (Fig. 4 d), the ATP
molecule is located between the two subunits as expected
after its primary movement into the binding pocket. In that
weak binding state, a newly docked ATP is expected to have
contacted the ATPase, but not yet have induced conforma-
tional changes. Our simulations are consistent with this
expectation. Further, we see that contacts are formed mainly
between ATP and Mg21, and between Mg21 and the binding
pocket.
Hydrogen bonds
According to mutation studies on the affinity of ATP for its
binding pocket there are three critical residues for ATP
FIGURE 2 Total potential energy of our system (coarse grained over 10
ps) for the 4th, 8th, 12th, and 16th steps, (a–d) with respect to the simulation
time.
FIGURE 3 Total kinetic energy of our system for the 4th, 8th, 12th, and
16th steps, (a–d) with respect to the simulation time. The horizontal lines
show the expected kinetic energy according to equipartition of the energy.
Unbinding of ATP 699
Biophysical Journal 85(2) 695–706
binding to the F1-ATPase: b-Lys-162 on the P-loop, b-Arg-
189 on the C-loop, and a-Arg-373 (Futai et al., 2000; Senior
et al., 2000; Senior et al., 2002). Due to their strong hydrogen
bonds with a g-phosphate oxygen of ATP, all three residues
are thought to play a key role either for the docking of ATP
or for multisite catalysis. b-Lys-162 and b-Arg-189 are
critical for the binding affinity of ATP (Lobau et al., 1997;
Nadanaciva et al., 1999a) and a-Arg-373 was found to be
necessary for multisite catalysis (Nadanaciva et al., 1999b;
Le et al., 2000). It was suggested that in multisite catalysis
the conformational changes due to the binding of ATP to the
other catalytic sites lead to changes in the position of a-Arg-
373 with respect to the rest of the binding pocket. This
allows an optimal positioning of the ATP molecule in the
binding pocket through the strong hydrogen bonds formed
between the residue and the nucleotide.
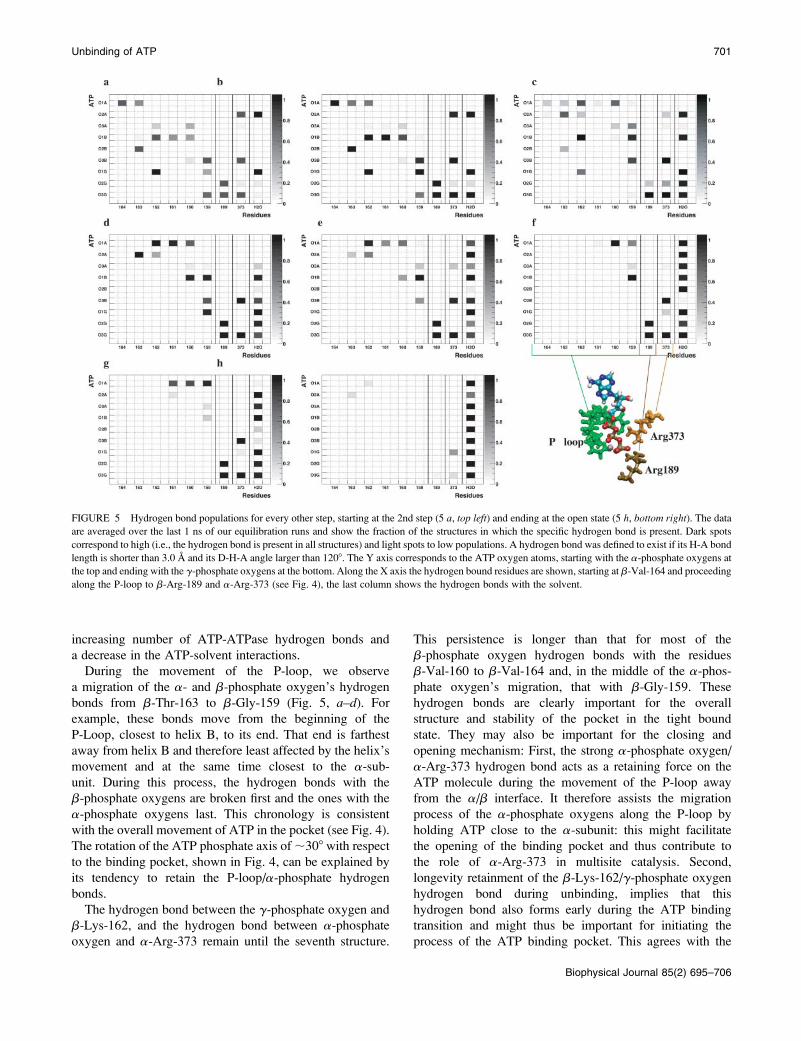
Fig. 5 shows the evolution of hydrogen bond populations
between the ATP molecule and the binding pocket. At the
beginning of our simulations (Fig. 5 a) we can clearly
identify the hydrogen bonds formed by b-Lys-162, b-Arg-
189, and a-Arg-373 with the g-phosphate oxygens of ATP.
For the tight binding state, hydrogen bonds are observed
mainly in the upper left and lower right quadrants. These
regions correspond to either (a) the a/b-phosphate oxygens
of the ATP molecule, which form mainly hydrogen bonds
with the P-loop backbone hydrogens (residues b-Gly-159-b-
Val-164, upper left); or (b) to the g-phosphate oxygens,
which are connected to the helix C (b-Arg-189) and the
a-subunit (a-Arg-373) (lower right) (see also Fig. 4). Two
exceptions are the hydrogen bonds of one g-phosphate
oxygen to the sidechain of b-Lys-162 (on the P-loop), and of
one a-phosphate oxygen to a-Arg-373 (a-subunit). Both can
be explained by the location of these side chains. The first is
close to helix C and the second to the backbone of the
P-loop. Those two hydrogen bonds are the only ones outside
the upper left and lower right quadrants of Fig. 5 a, and they
are the only connections between the ‘‘upper part’’ of ATP
(a- and b-phosphate oxygens) and between the a-subunit
(see Fig. 2) as well as between the ‘‘lower part’’ (g-phos-
phate oxygens) and the P-loop.
Following the hydrogen bond patterns from the tight to the
weak binding state (Fig. 5, a–h), we observe a continuous
trend of weakening and then disappearance of most of the
P-loop hydrogen bonds in the upper left rectangle. The
hydrogen bonds with helix C and the a-subunit remain intact
throughout. Therefore, the first step during the opening of the
binding pocket is the movement of helix B away from the
a-b interface and the breaking of its hydrogen bonds with
the ATP molecule. ATP remains in the interface region, still
bound to helix C and the a-subunit.
After the hydrogen bonds with the P-loop are broken,
those with b-Arg-189 and a-Arg-373 also start to weaken. In
the open pocket the only remaining connections between
ATP and the binding pocket are through the coordination of
the Mg21 cation with the b-subunit and three to five weak (or
strongly fluctuating) hydrogen bonds. Our convention here is
that a ‘‘weak’’ or ‘‘strongly fluctuating’’ hydrogen bond is
one whose probability (i.e. population averaged over
a simulation run) is below 50%. This result is also consistent
with the proposition that binding of ATP is a two-step
process. In the first step, the docking into the pocket leads to
a weakly bound state in which the majority of the ATP/
ATPase hydrogen bonds have yet to form. In the second step,
the process of binding is accompanied by the formation of an
FIGURE 4 Stereo pictures of the hydrogen binding region and ATP. (a)
Closed state, (b) 8th step, (c) 13th step, (d) open state. The orientation is the
same as in Fig. 1 f. The pictures were created with VMD (Humphrey et al.,
1996).
700 Antes et al.
Biophysical Journal 85(2) 695–706
increasing number of ATP-ATPase hydrogen bonds and
a decrease in the ATP-solvent interactions.
During the movement of the P-loop, we observe
a migration of the a- and b-phosphate oxygen’s hydrogen
bonds from b-Thr-163 to b-Gly-159 (Fig. 5, a–d). For
example, these bonds move from the beginning of the
P-Loop, closest to helix B, to its end. That end is farthest
away from helix B and therefore least affected by the helix’s
movement and at the same time closest to the a-sub-
unit. During this process, the hydrogen bonds with the
b-phosphate oxygens are broken first and the ones with the
a-phosphate oxygens last. This chronology is consistent
with the overall movement of ATP in the pocket (see Fig. 4).
The rotation of the ATP phosphate axis of ;308 with respect
to the binding pocket, shown in Fig. 4, can be explained by
its tendency to retain the P-loop/a-phosphate hydrogen
bonds.
The hydrogen bond between the g-phosphate oxygen and
b-Lys-162, and the hydrogen bond between a-phosphate
oxygen and a-Arg-373 remain until the seventh structure.
This persistence is longer than that for most of the
b-phosphate oxygen hydrogen bonds with the residues
b-Val-160 to b-Val-164 and, in the middle of the a-phos-
phate oxygen’s migration, that with b-Gly-159. These
hydrogen bonds are clearly important for the overall
structure and stability of the pocket in the tight bound
state. They may also be important for the closing and
opening mechanism: First, the strong a-phosphate oxygen/
a-Arg-373 hydrogen bond acts as a retaining force on the
ATP molecule during the movement of the P-loop away
from the a/b interface. It therefore assists the migration
process of the a-phosphate oxygens along the P-loop by
holding ATP close to the a-subunit: this might facilitate
the opening of the binding pocket and thus contribute to
the role of a-Arg-373 in multisite catalysis. Second,
longevity retainment of the b-Lys-162/g-phosphate oxygen
hydrogen bond during unbinding, implies that this
hydrogen bond also forms early during the ATP binding
transition and might thus be important for initiating the
process of the ATP binding pocket. This agrees with the
FIGURE 5 Hydrogen bond populations for every other step, starting at the 2nd step (5 a, top left) and ending at the open state (5 h, bottom right). The data
are averaged over the last 1 ns of our equilibration runs and show the fraction of the structures in which the specific hydrogen bond is present. Dark spots
correspond to high (i.e., the hydrogen bond is present in all structures) and light spots to low populations. A hydrogen bond was defined to exist if its H-A bond
length is shorter than 3.0 A and its D-H-A angle larger than 1208. The Y axis corresponds to the ATP oxygen atoms, starting with the a-phosphate oxygens at
the top and ending with the g-phosphate oxygens at the bottom. Along the X axis the hydrogen bound residues are shown, starting at b-Val-164 and proceeding
along the P-loop to b-Arg-189 and a-Arg-373 (see Fig. 4), the last column shows the hydrogen bonds with the solvent.
Unbinding of ATP 701
Biophysical Journal 85(2) 695–706
experimentally determined importance of this residue for
ATP binding (Lobau et al., 1997).
The plot of hydrogen bond numbers in Fig. 6 summarizes
these results. It shows a mostly continuous overall decrease
in the P-loop hydrogen bonds, starting at the fifth step. The
number of hydrogen bonds with the helix C and a-subunit
remains constant until the last two steps, when it starts to
decrease as well.
Coordination of Mg21
The coordination of ATP to the Mg21 cation and the cation’s
coordination with the binding pocket play an important role
in ATP’s affinity for the pocket and its binding mechanism
(Weber et al., 1988; Senior et al., 2000; Frasch, 2000).
Without the cation, the affinity of ATP is the same for all
three catalytic sites and is much lower than for the ATP/
Mg21 complex. The addition of Mg21 makes it possible
for ATP to proceed to the tight binding state, bending the
b through its full range. Since not all three b-subunits can
bend completely at the same time without violating steric
constraints, there must be an asymmetry in the ATP binding
affinities of three catalytic sites. Addition of Mg21 increases
the ATP affinity for the tight binding site up to five orders of
magnitude (Weber et al., 1988). EPR studies of the binding
of VO21 as a Mg21 analog to the F1-ATPase and mutation
based kinetic studies, demonstrated the important role of the
residues b-Thr-163, b-Glu-192, and the WHB homolog
b-Asp-248 for cation binding and coordination (Frasch,
2000). In addition, mutation of b-Glu-188 was found to
inhibit ATP hydrolysis, although not the binding of ATP
(Weber et al., 1988). In an x-ray crystallographic structure
(Abrahams et al., 1994) b-Glu-188 was found in a position
which allows the residue to align the water molecule nec-
essary for the hydrolysis step during the reaction. Mutation
of b-Glu-192, b-Thr-163, and b-Glu-188 lead to the loss of
the motor’s capacity for multisite catalysis, indicating
a connection between the cation binding and coordination
and the conformational changes driving the rotation of g.
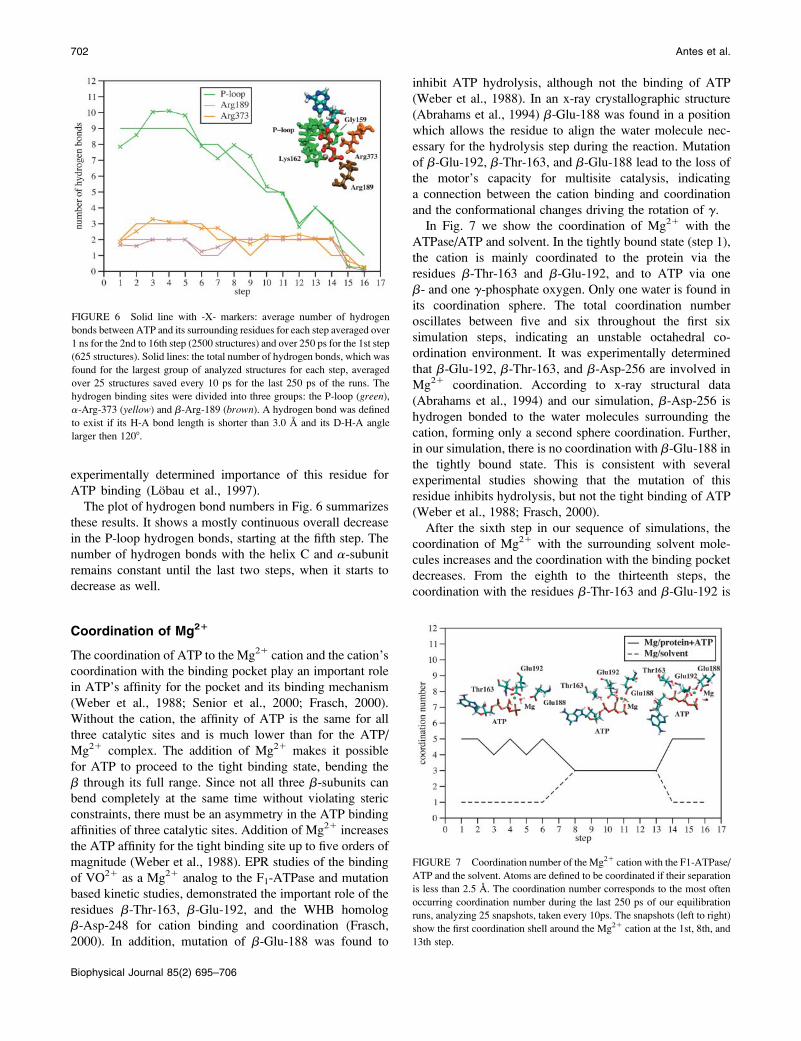
In Fig. 7 we show the coordination of Mg21 with the
ATPase/ATP and solvent. In the tightly bound state (step 1),
the cation is mainly coordinated to the protein via the
residues b-Thr-163 and b-Glu-192, and to ATP via one
b- and one g-phosphate oxygen. Only one water is found in
its coordination sphere. The total coordination number
oscillates between five and six throughout the first six
simulation steps, indicating an unstable octahedral co-
ordination environment. It was experimentally determined
that b-Glu-192, b-Thr-163, and b-Asp-256 are involved in
Mg21 coordination. According to x-ray structural data
(Abrahams et al., 1994) and our simulation, b-Asp-256 is
hydrogen bonded to the water molecules surrounding the
cation, forming only a second sphere coordination. Further,
in our simulation, there is no coordination with b-Glu-188 in
the tightly bound state. This is consistent with several
experimental studies showing that the mutation of this
residue inhibits hydrolysis, but not the tight binding of ATP
(Weber et al., 1988; Frasch, 2000).
After the sixth step in our sequence of simulations, the
coordination of Mg21 with the surrounding solvent mole-
cules increases and the coordination with the binding pocket
decreases. From the eighth to the thirteenth steps, the
coordination with the residues b-Thr-163 and b-Glu-192 is
FIGURE 6 Solid line with -X- markers: average number of hydrogen
bonds between ATP and its surrounding residues for each step averaged over
1 ns for the 2nd to 16th step (2500 structures) and over 250 ps for the 1st step
(625 structures). Solid lines: the total number of hydrogen bonds, which was
found for the largest group of analyzed structures for each step, averaged
over 25 structures saved every 10 ps for the last 250 ps of the runs. The
hydrogen binding sites were divided into three groups: the P-loop (green),
a-Arg-373 (yellow) and b-Arg-189 (brown). A hydrogen bond was defined
to exist if its H-A bond length is shorter than 3.0 A and its D-H-A angle
larger then 1208.
FIGURE 7 Coordination number of the Mg21 cation with the F1-ATPase/
ATP and the solvent. Atoms are defined to be coordinated if their separation
is less than 2.5 A. The coordination number corresponds to the most often
occurring coordination number during the last 250 ps of our equilibration
runs, analyzing 25 snapshots, taken every 10ps. The snapshots (left to right)
show the first coordination shell around the Mg21 cation at the 1st, 8th, and
13th step.
702 Antes et al.
Biophysical Journal 85(2) 695–706

broken, and the cation assumes coordination with three water
molecules, two ATP oxygens and only one amino acid
residue (b-Glu-188). After the thirteenth step, the cation
reforms its coordination with b-Glu-192 at the cost of its
interactions with two water molecules.
Regarding the structures shown in Fig. 4, the cation
migrates from b-Thr-163 toward b-Glu-188 as our simu-
lations progress from the tight binding state to the weak
binding state. This migration is consistent with the relative
movement of the helices B (b-Thr-163) and C (b-Glu-188
and b-Glu-192) with respect to each other. In the tight
binding state Mg21 coordinates with both B and C helices,
adding to the overall stability of the binding pocket. The
opening of the pocket leads first to an intermediate
coordination between Mg21 and one residue of the two
helices, ATP and three water molecules, and subsequently to
the formation of a new coordination shell mainly with the
ATP molecule and the binding pocket and only one water
molecule. However, at this step all coordination residues are
located on helix C. At the end of our simulations at the
equilibrated sixteenth step, the cation is still attached to the
ATPase, forming the weak binding state.
Energy
In order to gain quantitative information on the energetics
accompanying the conformational changes, we calculated
and averaged the interaction energies between ATP, Mg21,
ATPase, and solvent for each of our simulations. This is
shown in Fig. 8.
Fig. 8 a shows the interaction energy between ATP and
ATPase/solvent. The overall increase in energy upon
unbinding is 47 kcal/mol (;80 kT). The major changes in
the interaction energies coincide with the breaking of the
ATP/ATPase hydrogen bonds as shown in Figs. 5 and 6. The
energy barrier along our interpolated structures for this
process is 80 kcal/mol (;136 kT).
In Fig. 8 b, interaction energies between ATP and Mg21
have been added to the data of Fig. 8 a. The ATP/Mg21
interaction energies are shown separately in Fig. 8 d. They
are 20 kcal/mol (34 kT) less favorable in the weak binding
state than in the tight binding state. Thus the total energy
gain in Fig. 8 b upon tight binding increases to 68 kcal/mol
(115 kT), and the energy barrier increases to ;92 kcal/mol
(156 kT).
In Fig. 8 c, the Mg21 interaction energies with the ATPase
and the solvent have been added to the energies in Fig. 8 b,
thus showing the total change in the interaction energies of
ATP and Mg21 during the unbinding of ATP. The Mg21
interaction energies with the ATPase and the solvent are
given separately in Fig. 8 e. They are ;65 kcal/mol (110 kT)
less favorable in the tight binding state than in the weak
binding state. The difference is due to the overall unfavor-
able coordination of Mg21 with the binding pocket and
solvent in the tight binding state. The Mg21 interaction
energy drops 52 kcal/mol (88 kT) from the first to the ninth
step. Therefore, adding the Mg21/ATPase 1 solvent
interaction energy to the values in Fig. 8 b leads to
qualitative changes in the features of the energy curve. We
observe two energetic barriers. The first can be associated
with the optimization of the Mg21 interactions (Fig. 8 e), the
second with the breaking of the ATP/ATPase hydrogen
bonds (Fig. 8 a). The barrier during the hydrogen bond
breaking is lowered by 47 kcal/mol (80 kT) in the ATP
release direction, compared with Fig. 8 b.
Regarding the Mg21 interactions with its surroundings,
the large drop in the Mg21/ATPase 1 water interactions
FIGURE 8 Different components of the interaction energies between ATP,
the F1-ATPase, Mg21, and the solvent. The components were calculated for
each step as the sum of the van der Waals and Coulomb interactions between
the regions considered. The values were averaged over the last 1 ns of the
simulation for the 2nd to 16th steps and over the last 250 ps for the 1st step. (a)
Interaction energies between ATP and the F1-ATPase 1 solvent starting at
the closed and ending at the open ATP binding pocket (steps 1–16). (b)
Interaction energies between ATP and the F1-ATPase 1 solvent 1 Mg. (c)
Interaction energies of (ATP with ATPase) 1 (ATP with solvent) 1 (ATP
with Mg) 1 (Mg with ATPase) 1 (Mg with solvent). The interaction energy
of ATPase with solvent was not calculated because we did not enclose the
entire ATPase with solvent. (d) Interaction energies between ATP and Mg. (e)
Interaction energies between Mg and the F1-ATPase1 solvent. The energies
are therefore added together in the following way: 8(a) 1 8(d) ¼ 8(b), 8(b) 1
8(e)¼ 8(c). The error bars were obtained using the blocking method (Jaccucci
and Rahman, 1984), within a confidence level of 68.3%.
Unbinding of ATP 703
Biophysical Journal 85(2) 695–706
(Fig. 8 e, 65 kcal/mol (110 kT)) is counterbalanced by the
interaction energies between ATP and Mg21, which become
more unfavorable during unbinding, but the overall change
of the latter is much lower (20 vs. 65 kcal/mol) and the
Mg21/ATPase 1 water interactions are the dominant part.
The energetic changes at the beginning of our unbinding
simulations are mainly related to the Mg21 interactions with
the binding pocket and solvent: the sequential breaking of
the hydrogen bonds between ATP and the protein start much
later. Therefore, the Mg21 interactions might facilitate, or
even initiate the hydrogen bond breaking and the release of
ATP. Experimental observations showed that Mg21 enhan-
ces the binding rates of ATP and the hydrolysis and synthesis
reactions of the ATPase and led to the suggestion that the
optimization of the coordination shell of Mg21 shell is
important for the binding and release mechanism (Senior
et al., 2000). These suggestions are consistent with our
results, indicating a catalytic role of Mg21 by initiating the
hydrogen bond breaking between ATP and the binding
pocket.
In summary, our simulations suggest that the unbinding
process from the tight to the weak bound state proceeds in
two major stages. The first involves the change in the
coordination of the Mg21. The second involves the breaking
of the ATP/protein hydrogen bonds. The overall energetic
changes are 6 kcal/mol from the tight to the weak binding
state. The 6 kcal/mol in Fig. 8 c correspond to the change in
interaction energy of (ATP with ATPase) 1 (ATP with
solvent) 1 (ATP with Mg) 1 (Mg with ATPase) 1 (Mg with
solvent) and are reliable within 63–5 kcal/mol. These 6 kcal/
mol do not correspond to the free energy change of the
binding process, which may be dominated by the entropic
factors.
DISCUSSION
The results described here provide a microscopic interpre-
tation of the binding zipper model (Wang and Oster, 1998).
In the tight binding state ATP forms hydrogen bonds with
three regions at the a/b-interface of the ATPase: the P-loop,
b-Arg-189, and a-Arg-373. The conformational changes
and the corresponding changes in the hydrogen bonding
patterns during our simulations can be summarized as
follows. During the first steps of ATP release, the P-loop
moves from the a/b interface and from the hydrogen bond
sites that are located directly at the interface. The P-loop
movement leads to a progressive increase in its distance from
the other two hydrogen bond sites in going from the tight to
the weak binding state. Because ATP is bound to both
regions, as the distance between them increases, the
hydrogen bonds to the ATP molecule become increasingly
strained. Finally, ATP loses its hydrogen bonds with the
P-loop, first by the weakening of its b-phosphate oxygen
bonds and then by the movement of the a-and b-phosphate
oxygens toward the end of the P-loop and the a/b interface.
The result is a sequential decrease in the number of hydrogen
bonds between ATP and the P-loop as it retracts and slides
off the ATP (Figs. 5 and 6).
Our simulation results are consistent with mutation studies
that have identified several residues as playing important
roles for the binding and release of ATP and for multisite
catalysis (Futai et al., 2000; Senior et al., 2000, 2002). The
importance of b-Lys-162, b-Arg-189, and a-Arg-373, for
example, was connected to their formation of hydrogen
bonds with ATP. In our simulations, these residues form the
strongest and the last to break hydrogen bonds with the
g-phosphate oxygens. In addition, a-Arg-373 forms a hy-
drogen bond with one of the a-phosphate oxygens, acting as
a restraining force for ATP during the movement of the
P-loop and therefore facilitating the migration of the
a-phosphate oxygens along the P-loop. b-Lys-162 forms
the longest lasting hydrogen bond between the P-loop and
a g-phosphate oxygen. This hydrogen bond is not broken
until the end of the movement of the P-loop. Because this
hydrogen bond is the only one between the lower part of
ATP and the P-loop and remains longer than the P-loop/b-
phosphate oxygen hydrogen bonds, its importance might be
due to the formation of the first contact between ATP and the
P-loop during ATP binding. Therefore, consistent with
mutation studies, this residue is critical for the closing
mechanism of the binding pocket (Lobau et al., 1997).
As mentioned in the Introduction, another molecular
dynamics study was performed on the rotary mechanism of
the F1-ATPase (Bockmann and Grubmuller, 2002). In that
study, it was found that the hydrogen bonds to the
g-phosphate oxygens break first, contrary to our results.
However, for the reasons noted in the Introduction, we
suspect that the differences are due to the fact that the
simulation does not equilibrate sufficiently to describe the
chronology of hydrogen bond breaking reliably.
An interesting aspect of our simulation results concerns
the role of the Mg21 cation. Mutation studies suggest its
coordination to b-Glu-192, b-Thr-163, and b-Asp-256
(Frasch, 2000; Weber et al., 1988). All of these residues
are necessary for proper ATP binding and multisite catalysis.
During our simulations, the coordination of the Mg21 cation
changes considerably. In the tight binding state, it coor-
dinates directly to b-Glu-192 and b-Thr-163, and in the
second coordination shell to b-Asp-256. This agrees with the
results of the mutation studies and an x-ray crystallographic
structure. During unbinding, it loses its coordination with
b-Thr-163 due to the movement of the P-loop, and forms
one coordination with b-Glu-188. However, this residue
was shown experimentally to be unnecessary for ATP
binding. Our simulation results suggest that it is involved in
the early stages of Mg21 binding; however, because it con-
tributes only to one coordination site, it might not be crucial
for the binding process. The most important residue for
Mg21 coordination is b-Glu-192, because it coordinates to
the cation in the weak and tight bound state.
704 Antes et al.
Biophysical Journal 85(2) 695–706
Although we observe significant rearrangement of the
ATP hydrogen bonds during the first five steps of our
simulations, no sequential breaking of the hydrogen bonds is
observed during this period. However, we do observe an
optimization of the Mg’s coordination and a decrease in its
interaction energies with its surrounding during this period.
Only after these changes have taken place, do the hydrogen
bonds to ATP start to break and the pocket begins to open up.
Thus the conformational changes during optimization of the
octahedral coordination of the Mg21 seem to be prerequisite
for ATP unbinding from the tightly bound state. This finding
could explain the experimental observation that mutation of
b-Thr-163 and b-Glu-192 significantly alters the hydrolysis
rate of ATP (Frasch, 2000; Weber et al., 1988). The fact that
their mutants do not show multisite catalysis demonstrates
the importance of proper coordination for the binding
mechanism. The crucial geometric requirements on the
cation’s coordination could also explain the observation that
with Ca21 as a cofactor (which has a different radius than
Mg21), the binding and hydrolysis rates are much lower.
Combining the above statements with our analysis of the
interaction energies between ATP, Mg21, ATPase, and the
solvent, we observe that the unfavorable Mg21 coordination
with the ATPase and solvent in the tight binding pocket
considerably lowers the energy barrier for ATP release along
our interpolated structures. This is due to the energy gain
upon better coordination during the unbinding process (Fig.
8 c versus Fig. 8 a). This energetic drop is counterbalanced
by an increase of the ATP/ATPase 1 solvent energy barrier
due to the ATP/Mg21 interactions during unbinding (Fig. 8
b versus Fig. 8 a). However, the total energetic contributions
of the latter are much smaller. Therefore inclusion of the
Mg21 interaction energies leads to a decrease of the energy
barrier for hydrogen bond breaking of 35 kcal/mol (60 kT),
compared with the pure ATP/ATPase1solvent interactions
(Fig. 8 c versus Fig. 8 a). However, an additional barrier
occurs between the first and the seventh step due to the Mg21
interactions. During that period the ATP interaction energy
remains nearly constant. Therefore, our energy diagram in
Fig. 8 c can be divided into two parts: a first energetic barrier,
related to the optimization of the Mg21 coordination, and
a second barrier, which is due mainly to the breaking of the
ATP/ATPase hydrogen bonds. These changes agree with the
experimental observation that the hydrolysis rate increases
dramatically in the presence of Mg21 (Senior et al., 2000).
The energetic contribution of the Mg21 interactions
facilitates the release of ATP during the second half of the
unbinding process and the Mg21 interactions are also the
major agents for the transition from structure one through
seven. This proposition agrees with the fact that multisite
catalysis and the formation of the tight binding state depend
on the presence of Mg21 and its coordinating residues
b-Thr-163 and b-Glu-192 (Frasch, 2000). Our energetics
could explain the lower hydrolysis rate without multisite
catalysis and in the absence of the Mg21 cation. We suggest
that early changes during unbinding, or the late changes
during binding of ATP (step one to seven), are mainly due to
the presence of Mg21. Therefore, we propose that Mg21 is
necessary to ‘‘guide’’ ATP into the tight binding position;
without it the binding might stop around the seventh
structure, with an incomplete alignment of the binding
pocket and its water for the hydrolysis reaction and thus
a lower reaction rate.
It is not possible to compare directly our interaction
energies with the experimental binding free energy of 12
kcal/mol (20 kT) (Senior, 1992). We have considered only
the first stage in the release of ATP, whereas the biochemical
measurements include both the tight binding transition and
the docking. In addition, our energetics do not include all of
the entropic effects, which have been estimated at around 20
kcal/mol (34 kT) elsewhere (Massova and Kollman, 1999).
Possible conformational changes in the more distant regions
of the binding pocket, which we have not included in our
setup could contribute to that entropy. The entropic aspects
of the binding process are important components of the free
energy but studying them using molecular dynamics
simulations is computationally prohibitive. Nevertheless, it
is noteworthy that the experimental binding free energy
agrees very well with our overall energetic change of 6 kcal/
mol (8.5 kT). Our analysis is consistent with the idea that the
continuous hydrogen bond formation/breaking between the
ATP molecule and the ATPas are rate determining steps
during ATP binding/release and that the correct coordination
of Mg21 is important for the overall process.
We thank Sean Sun, Pieter Rein ten Wolde, and Aaron Dinner for helpful
discussions.
Financial support of this work was provided to one of us (I.A.) initially
from the German Science Foundation and subsequently from the U.S.
Department of Energy Basic Energy Sciences Program with DE-FG03-
99ER14987. Support for another of us (D.C.) was also provided by the
Department of Energy with grant DE-FG03-87ER13793. Computational
resources were provided by NERSC at the Lawrence Berkeley National
Laboratory, and by an equipment grant supplement to Department of
Energy grant DE-FG03-87ER13793. HW was supported by NSF grant
DMS-0077971. G.O. was supported by NIH grant GM59875-02.
REFERENCES
Abrahams, J. P., A. G. W. Leslie, and J. E. Walker. 1994. Structure at 2.8-angstrom resolution of F1-ATPase from bovine heart-mitochondria.Nature. 370:621–628.
Bockmann, R. A., and H. Grubmuller. 2002. Nanoseconds moleculardynamics simulation of primary mechanical energy transfer steps in F1-ATP synthase. Nat. Struct. Biol. 9:198–202.
Boyer, P. D. 1993. The binding change mechanism for ATP synthase -some probabilities and possibilities. Biochim. Biophys. Acta. 1140:215–250.
Boyer, P. D. 1997. The ATP synthase - A splendid molecular machine.Annu. Rev. Biochem. 66:717–749.
Brooks, B. R., R. E. Buccoleri, B. D. Olafson, D. J. States, S. Swaminathan,and M. Karplus. 1983. CHARMM - A program for macromolecularenergy, minimization, and dynamics calculations. J. Comput. Chem.4:187–217.
Unbinding of ATP 705
Biophysical Journal 85(2) 695–706
Brooks, C. L., and M. Karplus. 1983. Deformable stochastic boundaries inmolecular-dynamics. J. Chem. Phys. 79:6312–6325.
Eichinger, M., H. Heller, and H. Grubmuller. 2000. EGO - An efficientmolecular dynamics program and its application to protein dynamicssimulation. In Workshop on Molecular Dynamics on Parallel Computers.R. Esser, P. Grassberger, J. Grotendorst, and M. Lewerenz, editors.World Scientific Singapore. 154–174.
Elston, T., H. Wang, and G. Oster. 1998. Energy transduction in ATPsynthase. Nature. 391:510–514.
Frasch, W. D. 2000. The participation of metals in the mechanism of the F1-ATPase. Biochim. Biophys. Acta. 1458:310–325.
Futai, M., H. Omote, Y. Sambongi, and Y. Wada. 2000. ATP Synthase(H1 ATPase): coupling between catalysis, mechanical work, and protontranslocation. Biochim. Biophys. Acta. 1458:276–288.
Humphrey, W., A. Dalke, and K. Schulten. 1996. VMD: Visual moleculardynamics. J. Mol. Graph. 14:33–38.
Jaccucci, G., and A. Rahman. 1984. Comparing the efficiency of metropolisMonte-Carlo and molecular-dynamics methods for configuration spacesampling. Nuovo Cimento. D4:341–356.
Jorgensen, W. L., R. W. Impey, J. Chandrasekhar, J. D. Madura, and M. L.Klein. 1990. Comparison of simple potential functions for simulatingliquid water. J. Chem. Phys. 79:926–935.
Kraulis, P. J. 1991. MolScript: a program to produce both detailed andschematic plots of protein structures. J. Appl. Crystallogr. 24:946–950.
Kinosita, K., R. Yasuda, H. Noji, and K. Adachi. 2000. A rotary molecularmotor that can work at near 100% efficiency. Philos. Trans. R. Soc.Lond. B. Biol. Sci. 355:473–490.
Le, N. P., H. Omote, Y. Wada, M. K. Al-Shawi, R. K. Nakamoto, and M.Futai. 2000. Escherichia coli ATP synthase a-subunit Arg-376: Thecatalytic site arginine does not participate in the hydrolysis/synthesisreaction but is required for promotion to the steady state. Biochemistry.39:2778–2783.
Lobau, S., J. Weber, S. Wilke-Mounts, and A. E. Senior. 1997. F1ATPase,roles of three catalytic site residues. J. Biol. Chem. 6:3648–3656.
Ma, J., T. C. Flynn, Q. Cui, A. G. W. Leslie, J. E. Walker, and M. Karplus.2002. A dynamic analysis of the rotation mechanism for conformationalchange in F1-ATPase. Structure. 10:921–931.
MacKerell, A. D., D. Bashford, M. Bellott, R. L. Dunbrack, J. D. Evanseck,M. J. Field, S. Fischer, J. Gao, H. Guo, S. Ha, D. Joseph-McCarth, L.Kuchnir, K. Kuczera, F. T. K. Lau, C. Mattos, S. Michnick, T. Ngo, D.T. Nguyen, B. Prodhom, W. E. Reiher, B. Roux, M. Schlenkrich, J.Smith, R. Stote, J. Straub, M. Watanabe, J. Wiorkiewicz-Kuczera, D.Yin, and M. Karplus. 1998. All-atom empirical potential for molecularmodeling and dynamics studies of proteins. J. Chem. Phys. 102:3586–3616.
Massova, M., and P. Kollman. 1999. Computational alanine scanning toprobe protein-protein interactions: a novel approach to evaluate bindingfree energies. J. Am. Chem. Soc. 121:8133–8143.
Mitchell, P. 1961. Coupling of phosphorylation to electron and hydrogentransfer by a chemi-osmotic type of mechanism. Nature. 191:144–148.
Nadanaciva, S., J. Weber, and A. Senior. 1999a. The role of b-Arg-182, anessential catalytic site residue in Escherichia coli F1-ATPase. Bio-chemistry. 38:7670–7677.
Nadanaciva, S., J. Weber, S. Wilke-Mounts, and A. Senior. 1999b.Importance of F1-ATPase residue a-Arg-376 for catalytic transition statestabilization. Biochemistry. 38:15493–15499.
Oster, G., and H. Wang. 2000a. Reverse engineering a protein: themechanochemistry of ATP synthase. Biochim. Biophys. Acta. 1458:482–510.
Oster, G., and H. Wang. 2000b. Why is the efficiency of F1 ATPase sohigh? J. Bioenerg. Biomembr. 32:459–469.
Pedersen, P., Y. Ko, and S. Hong. 2000. ATP synthases in the year 2000:evolving views about the structures of these remarkable enzymecomplexes. J. Bioenerg. Biomembr. 32:325–332.
Penefsky, H. S., and R. L. Cross. 1991. Structure and mechanism of F0F1-type ATP synthases and ATPases. Adv. Enzymol. Relat. Areas Mol. Biol.64:173–214.
Ryckaert, J. P., G. Ciccotti, and H. J. C. Berendsen. 1977. Numerical-integration of cartesian equations of motion of a system with constraints -molecular-dynamics of N-Alkanes. J. Comput. Phys. 23:327–341.
Sayle, R. A., and E. J. Milnerwhite. 1995. RASMOL - biomoleculargraphics for all. Trends Biochem. Sci. 20:374–376.
Schlitter, J., M. Engels, and P. Kruger. 1994. Targeted molecular-dynamics- a new approach for searching pathways of conformational transitions.J. Mol. Graph. 12:84–89.
Senior, A. E. 1992. Catalytic sites of Escherichia coli F1-ATPase. J.Bioenerg. Biomembr. 24:479–484.
Senior, A. E., S. Nadanaciva, and J. Weber. 2000. Rate acceleration of ATPhydrolysis by F1F0-ATP synthase. J. Exp. Biol. 203:35–40.
Senior, A. E., S. Nadanaciva, and J. Weber. 2002. The molecularmechanism of ATP synthesis by F1F0-ATP synthase. Biochim. Biophys.Acta. 1553:188–211.
Sun, S., D. Chandler, A. Dinner, and G. Oster. 2003. Elastic energy storagein F1-ATPase. Eur. Biophys. J. In press.
Walker, J. E., M. Saraste, M. J. Runswick, and N. J. Gay. 1982. Distantlyrelated sequences in the a-subunits and b-subunits of ATP synthase,myosin, kinases and other ATP-requiring enzymes and a commonnucleotide binding fold. EMBO J. 1:945–951.
Walker, J. editor. 2000. The mechanism of F1F0-ATPase. Biochim.Biophys. Acta. 1458: 221–510.
Wang, H., and G. Oster. 1998. Energy transduction in the F1 motor of ATPsynthase. Nature. 396:279–282.
Weber, J., S. T. Hammond, S. Wilke-Mounts, and A. E. Senior. 1988.Mg21 coordination in catalytic sites of F1-ATPase. Biochemistry.37:608–614.
Weber, J., and A. E. Senior. 1997. Catalytic mechanism of F1-ATPase.Biochim. Biophys. Acta. 1319:19–58.
Weber, J., and A. E. Senior. 2000. ATP synthase: what we know aboutATP hydrolysis and what we do not know about ATP synthesis.Biochim. Biophys. Acta. 1458:300–309.
Yasuda, R., H. Noji, K. Kinosita, and M. Yoshida. 1998. F1-ATPase isa highly efficient molecular motor that rotates with discrete 1208 steps.Cell. 93:1117–1124.
Yasuda, R., H. Noji, M. Yoshida, K. Kinosita, and H. Itoh. 2001.Resolution of distinct rotational substeps by submillisecond kineticanalysis of F1-ATPase. Nature. 410:989–904.
Zhang, L., and J. Hermans. 1996. Hydrophilicity of cavities in proteins.Proteins. 24:433–438.
706 Antes et al.
Biophysical Journal 85(2) 695–706
Top Related
Copyright © 2022 FDOKUMEN

