


Bahasa
Halaman
Hukum


International Journal of Control and Automation
Vol. 6, No. 1, February, 2013
13
A Hybrid PSO_Fuzzy_PID Controller for Gas Turbine Speed
Control
Azadeh Mansouri Mansourabad1, Mohammad Taghi Hamidi Beheshti
2
and Mohsen Simab 1Department of Technical and Engineering, International Campus-Kish Island,
Tehran University, Kish, Iran 2Faculty of Electrical and Computer Engineering,
Tarbiat Modares University, Tehran, Iran 3Department of Electrical Engineering, Science and Research Branch,
Islamic Azad University, Fars, Iran
Abstract
In this paper, a hybrid PSO_Fuzzy_PID controller is designed for speed control of a gas
turbine. The aim of the controller is to maintain the turbine speed and the exhaust
temperature in a desired interval during startup and operating condition. Here, different
parts of the fuzzy controller such as fuzzification, rule base, inference engine, defuzzification,
and particle swarm optimization (PSO) algorithm are presented. computer simulations of the
controller and gas turbine based on Matlab / simulink simulation platform are performed to
investigate the effectiveness of the proposed algorithm. The performance of the proposed
algorithm is evaluated during startup and operating condition of the gas turbine. Simulation
results well show that the response of the PSO_Fuzzy_PID controller is effectively improved
compared with other controllers. The characteristics of the step response such as rise time,
settling time and overshoot are considerably decreased, and the value of the steady state
error is minimized.
Keywords: Gas Turbine, Fuzzy Control, Speed Control, PSO algorithm
1. Introduction
Nowadays power generation by means of gas turbine power plants is playing a major role
worldwide [1]. Wide spread application of a gas turbine in electricity generation and the
dynamic nature of this system has doubled the necessity of its accurate modeling and
variables control. Also exact identification of the parameters of the system, and temperature
and speed control are important issues.. Nonlinear controllers, such as sliding mode controller
presented in [2]. In [3], a genetic algorithm based multipurpose controller was presented for
gas turbine. In [4], an optimized LQR controller was suggested. In [5], a particle swarm
optimization (PSO) algorithm was used in optimizing the PID controller parameters for the
exhaust temperature control of a gas turbine system. In [6], the mathematical model of an
exhaust temperature control of micro turbines was discussed. In [7], an H∞ robust controller
have been designed for a gas turbine to control speed and exhaust gas temperature
simultaneously. In [8], the non-linear mathematical model of a gas turbine was simulated in
Matlab/Simulink using the Park transformation. a PID fuzzy controller was designed to the
speed control of gas turbine generator sets, and the simulation results of this model were
significantly acceptable. In [9], a neural fuzzy network control was proposed for nonlinear
models, a speed control scheme for a single shaft gas turbine was suggested and simulated in
Matlab/Simulink. The results showed that by tuning the fuzzy neural network controller, the

International Journal of Control and Automation
Vol. 6, No. 1, February, 2013
14
performance of the system can be achieved in a wide range of operating conditions compared
to the fuzzy logic controller and fuzzy PID controller. It indicated that the controller has
adaptive ability and robustness. In [10], a neural-fuzzy controller was presented to control the
gas turbine. This controller was comprised of two inputs (speed and mechanical power); an
output (fuel), while a neural network was designed to tune the gains of fuzzy logic controller
based on the operating condition of the biomass-based power plants. The simulation results
showed that by tuning fuzzy logic controllers, optimal time domain performance of the
system can be achieved in a wide range of operating condition compared to fixed parameter
fuzzy logic controllers and PID controllers. Various mathematical and thermodynamic
models have been proposed for a gas turbine. Among the various models, the Rowen models
[11] are simple and practical [7]. The other models are more precise but have not been chosen
quite often for control purposes due to nonlinearity or complexity [7].
The purpose of this paper is to design a PSO_Fuzzy_PID controller to control the speed of
the gas turbine. The results is compared with responses of the other controllers for the same
turbine model. The paper is sectioned as follows: in Section 2, the dynamic modeling of the
gas turbine is presented. In Section 3, the algorithms of applying fuzzy logic and PSO in gas
turbine speed control are discussed. In the fourth section, the results of the designed controller
during startup and operating condition of the gas turbine are well illustrated, and finally, in
Section 5, the conclusion is presented.
2. Gas Turbine Modeling
Gas turbines are generally comprised of compressor, combustion chamber, and turbine,
where the gas pressure (usually air) is initially increased in compressor (in multi-stage
compressors up to 12 times) and the pressured gas is heated in combustion chamber then.
Afterwards, the gas is injected with high pressure and temperature to the turbine and the
thermal energy of the gas is converted in to mechanical energy. The general view of gas
turbine is illustrated in Figure 1.
Figure 1. General Schematic of a Gas Turbine
One of the limitations should be considered in turbines is the fact that the turbine speed
should not overstep a certain level since the frequency of the generated power is directly
related to the turbine speed. The exhaust temperature should also be limited because of the
physical and economical consideration. In order to have a correct and normal function,
different protection and control systems are applied in gas turbine plants. These systems
control different parameters such as turbine input/output temperature, shaft speed, shaft
vibration rate, flame condition, the amount of cooling airflow, etc, among of which, some
parameters are more significant. Each parameter’s variation should stay in a permitted range.
An alarm is initially activated if the amount of a parameter exceeds the permitted level. The

International Journal of Control and Automation
Vol. 6, No. 1, February, 2013
15
turbine might damage if the problem is not overcome. Therefore, the turbine is compulsively
out of service.
Gas turbines usually possess the following five controllers:
1. Start controller: This controller is in charge of system start and turbine speed
increase, which is accomplished in open-loop form through several stages and steps.
2. Speed controller: This controller removes the start controller out of service in the
speeds close to the nominal speed and is in charge of increasing the turbine speed at
the end of starting stage and accurately regulating the speed before the unit
synchronization and close the generator breaker.
3. Load controller: The turbine control is transferred automatically from the speed
controller to the load controller after generator breaker closing and unit
synchronization. The load controller is in charge of turbine load increase and
decrease to reach the determined unit load level.
4. Turbine’s maximum temperature limit controller: This controller is the turbine
temperature limiter. The controller is responsible to prevent the turbine overloading
if the temperature exceeds the maximum turbine’s tolerable temperature threshold.
5. Turbine’s mechanical load limit controller: this controller limits the mechanical
load of the turbine and prevents turbine to reach the maximum tolerable torque.
The output signals of the above-mentioned controllers enter to a MIN gate block, in which,
it is determined which controller is active and controls the turbine operation. During the unit
operation, all above controllers are active all together while the one with lower sending signal
actually controls the turbine.
In this paper, Rowen model has been used. In this model, the low value selector (LVS)
system inputs are three output signals obtained from speed, temperature, and acceleration
control systems. Here, the acceleration should not exceed 0.01 pu/sec.
The dynamic model of gas turbine and its control systems is illustrated in Figure 2. Two
functions exist in model structure. The first one, f1, calculates the exhaust temperature in
terms of the turbine speed, N, and the fuel flow, WF. The second one, f2, calculates the
generated turbine torque in terms of N and WF. Here, a, b and c are the fuel system transfer
function coefficient, TF1 is fuel system time constant, KF is fuel system feedback. In this
model, a first order system with time constant (TCD) is allocated for the compressor and a
pure delay (ECR and ETD) is considered for the combustion reaction time and the exhaust
system transport. The values of the applied variables and constants are expressed in appendix.
3. PSO_Fuzzy_PID Controller Application for Gas Turbine Speed Control
In this paper, fuzzy, PSO, and PID controllers are designed to control the gas turbine speed
and operate in parallel in the hybrid controller. The hybrid PSO_Fuzzy_PID controller is
shown in Figure 3.
3.1. Fuzzy Logic Structure
The basic structure of a fuzzy logic controller is illustrated in Figure 4. A fuzzy logic
controller commonly consists of four sections including: fuzzification, inference engine, rule
bases, and defuzzification. A rule base is made up of series of IF-THEN rules corresponding
to the fuzzy inputs and leading to the fuzzy outputs. The rules can be developed using
knowledge from experts or operators in the field, as well as historical experience.

International Journal of Control and Automation
Vol. 6, No. 1, February, 2013
16
Figure 2. Dynamic Model of Gas Turbine and its Control Systems
Figure 3. Hybrid PSO_Fuzzy_PID Controller
Figure 4. Fuzzy Logic Controller Structure
To design the fuzzy controller some variable which can represent the dynamic performance
of the system should be chosen to be fed as the inputs [10]. In this paper, the fuzzy logic
controller has two inputs and one output. The inputs are turbine speed deviation (e) and its
derivative (∆e) and the output is the change in controller position. The number of linguistic
terms for each linguistic variable is selected as seven (Negative Big=NB, Negative
Mean=NM, Negative Small=NS, Positive Small=PS, Positive Mean=PM, Positive Big=PB).
The inference mechanism is based on Mamdani technique. In this design, the minimum is
applied for data AND operator, maximum for OR operator, minimum for implication operator,

International Journal of Control and Automation
Vol. 6, No. 1, February, 2013
17
maximum for aggregation operator, and finally centroid technique for defuzzification. The
membership functions for inputs variations are Gaussian and they are considered triangular
for the controller output variations. The membership function of inputs and the output
variations are shown in Figure 5 and Figure 6, respectively. In this system, 49 fuzzy rules are
defined for startup and operating condition of gas turbine. The rule table for speed controller
is shown in Table 1.
Figure 5. Membership Functions for Inputs
Figure 6. Membership Functions for Output
Table 1. Control Rules
∆e(t)
NB NM NS Z PS PM PB
e(t)
NB NB NB NB NM NM NS Z
NM NB NB NM NM NS Z PS
NS NB NM NS NS Z PS PM
Z NM NM NS Z PS PM PM
PS NM NS Z PS PS PM PB
PM NS Z PS PM PM PB PB
PB Z PS PM PM PB PB PB

International Journal of Control and Automation
Vol. 6, No. 1, February, 2013
18
3.2. PSO Algorithm
The principle of PSO is to simulate a collective behavior used to show the motion of birds
and fish. PSO has simulated the birds’ motion along two directions. The position of each
individual (representative) is represented by x y vectors and Vx (velocity on x-axis) and Vy
(velocity on y-axis) express the velocity. Although in PSO, each member has an adaptive
speed (location change) due to which moves in search space, each one has a memory, in other
words, it remembers the best position it has reached in the search space. Therefore, each
member moves on two directions. 1- Towards the best position they have met, 2- Towards the
best position the best member has met in neighborhood.
According to the issues mentioned above, the position of each member is determined via
its own speed and position. The velocity and position of each particle is modified according to
Eq.1 and Eq.2, respectively [12]:
(1)
(2)
Where ,
current velocity of particle i at iteration k
: new velocity of particle i at next iteration k+1
: current position of particle i at interation k
: new position of particle i at next iteration k+1
: adjustable cognitive and social acceleration constants
: random number between 0 and 1
p : personal best of particle i
gbest: global best of the population
The following weighting function is usually utilized in Eq.1.
(3) Where,
W: inertia weight
: initial inertia weight
: final inertia weight
: maximum number of iterations
iter: current iteration
The algorithmic steps involved in PSO algorithm are as follows:
1. Initialize the population – positions and velocities
2. Evaluate the desired optimization fitness function of the individual particle (pbest)
International Journal of Control and Automation
Vol. 6, No. 1, February, 2013
19
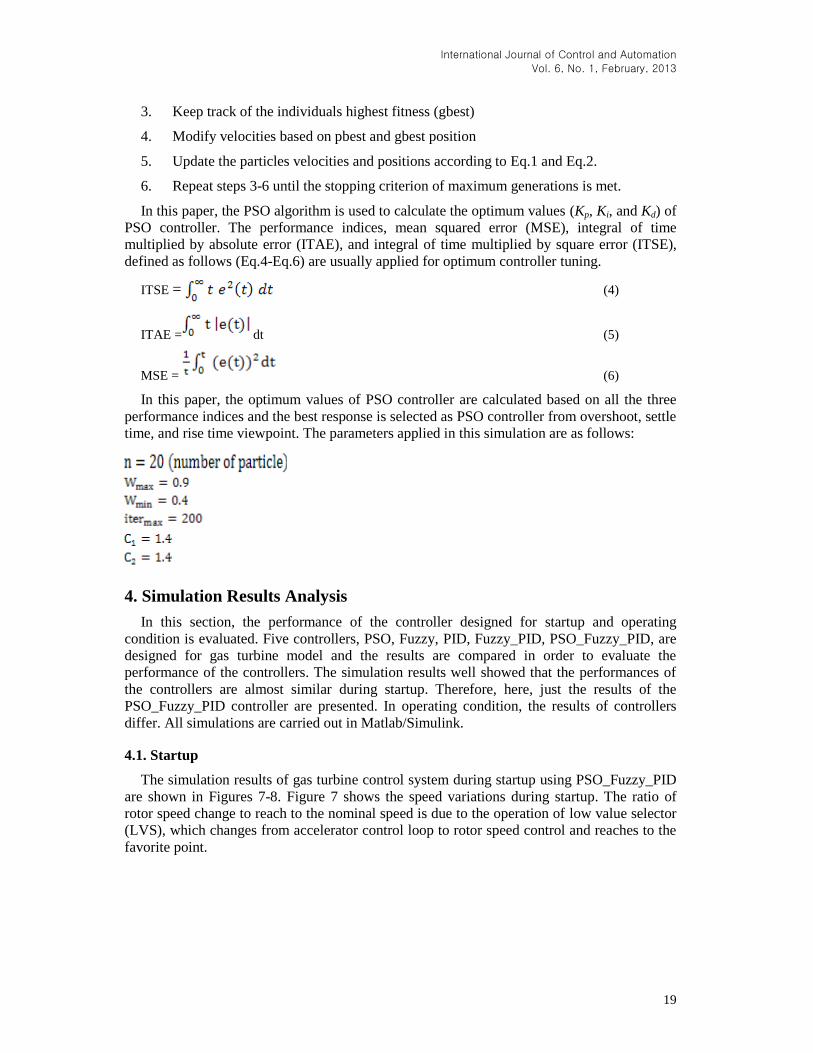
3. Keep track of the individuals highest fitness (gbest)
4. Modify velocities based on pbest and gbest position
5. Update the particles velocities and positions according to Eq.1 and Eq.2.
6. Repeat steps 3-6 until the stopping criterion of maximum generations is met.
In this paper, the PSO algorithm is used to calculate the optimum values (Kp, Ki, and Kd) of
PSO controller. The performance indices, mean squared error (MSE), integral of time
multiplied by absolute error (ITAE), and integral of time multiplied by square error (ITSE),
defined as follows (Eq.4-Eq.6) are usually applied for optimum controller tuning.
ITSE = (4)
ITAE = dt (5)
MSE = (6)
In this paper, the optimum values of PSO controller are calculated based on all the three
performance indices and the best response is selected as PSO controller from overshoot, settle
time, and rise time viewpoint. The parameters applied in this simulation are as follows:
4. Simulation Results Analysis
In this section, the performance of the controller designed for startup and operating
condition is evaluated. Five controllers, PSO, Fuzzy, PID, Fuzzy_PID, PSO_Fuzzy_PID, are
designed for gas turbine model and the results are compared in order to evaluate the
performance of the controllers. The simulation results well showed that the performances of
the controllers are almost similar during startup. Therefore, here, just the results of the
PSO_Fuzzy_PID controller are presented. In operating condition, the results of controllers
differ. All simulations are carried out in Matlab/Simulink.
4.1. Startup
The simulation results of gas turbine control system during startup using PSO_Fuzzy_PID
are shown in Figures 7-8. Figure 7 shows the speed variations during startup. The ratio of
rotor speed change to reach to the nominal speed is due to the operation of low value selector
(LVS), which changes from accelerator control loop to rotor speed control and reaches to the
favorite point.

International Journal of Control and Automation
Vol. 6, No. 1, February, 2013
20
Figure 7. Speed Variations during Startup
Figure 8 shows the temperature variations of exhaust gas. The temperature reaches to
412°F steady state temperature after passing the transient state. The temperature increase
amount in transient state does not exceed the protective thresholds and consequently the
turbine does not get out of the operation mode in starting stage and does not show trips.
4.1.1. Speed Tracking During Startup, Figure 9 shows the operation and the performance
of the controller in tracking the speed variations during startup. In this simulation, the turbine
speed changed from 200 sec with 1% unit base slope to evaluate the system performance.
This figure shows the modest ability of this controller in speed tracking. In this figure, the
speed tracking is in a way that no overshoot is seen in system response and an appropriate
tracking is obtained.
Figure 8. Temperature Variations in Turbine’s Chimney
Figure 9. Speed Variations Tracking During Startup

International Journal of Control and Automation
Vol. 6, No. 1, February, 2013
21
4.2. Operating Condition
To investigate the performance of the designed controller under different operating
condition, the operating condition of the system has been changed. The load variation rate is
considered 0.3 of the base unit in step form. The load variations curve is shown in Figure 10.
Figure 10. Load Variations in Operating Condition
Figure 11 shows the operation of the five controllers in power controlling against the load
variations. As shown in this figure, it is obvious that the controllers have reached to the
favorite value and show a proper response. Here, the PSO_Fuzzy_PID controller shows the
optimum response.
Figure 11. Produced Power of Gas Turbine
In Table 2, the simulation results of several controllers in this state are illustrated. The
overshoot rate of the PSO_Fuzzy_PID controller is 8.87%, which is the least among all
controllers. The maximum overshoot, 34.5%, is of PSO controller. PSO_Fuzzy_PID
controller shows the minimum settling time 3.87 sec. the maximum settling time is 11 sec.
and belongs to Fuzzy controller. The performance indices values of controllers are well
shown in Table 2. This table depicts that the PSO_Fuzzy_PID controller shows the minimum
error value among all controllers.

International Journal of Control and Automation
Vol. 6, No. 1, February, 2013
22
Table 2. Simulation Results
ITAE ITSE MSE
%Speed Error
Overshoot Settling
Time Rise Time
PSO 536.9573 100.7593 0.01708 1.005 34.5028 8.04 0.82
Fuzzy 571.3392 101.1843 0.01710 1.669 24.6596 11.043 0.216
PID 542.5325 100.8700 0.01709 1.189 19.3934 5.65 0.694
Fuzzy_PID 539.2664 100.7206 0.01708 0.985 12.4376 4.04 0.4
PSO_Fuzzy_PID 523.4590 100.5233 0.01701 0.601 8.8681 3.87 0.45
In Figure 12, the speed variations of controllers caused by load variations are shown. It is
obvious that the PSO_Fuzzy_PID controller has the best response. The steady state
percentage of the speed error is illustrated in Table 2. The minimum steady state error
percentage is 0.6% and the maximum is 1.67%.
Figure 12. Turbine Speed
The simulation results and the comparisons show that the PSO_Fuzzy_PID controller has a
considerable advantage in compare with other controller in load tracking and speed control.
The overshot and settling time values are considerably decreased in this controller.
5. Conclusion
In this paper, a PSO_Fuzzy_PID controller is designed to control the gas turbine speed. In
the proposed model, PID, Fuzzy, and PSO controllers operate in parallel. In this paper, seven
linguistic states are selected for each variable and the triangular membership function is
applied to these variables. In this controller, 49 rules are defined to control the gas turbine in
starting and operating condition. PSO algorithm is applied to calculate the optimum controller

International Journal of Control and Automation
Vol. 6, No. 1, February, 2013
23
values and performance indices are considered as target functions to tune them. In this paper,
the performance of the designed controller is presented for startup and operating condition.
The simulation results show that the PSO_Fuzzy_PID controller has the minimum
overshootand minimum settling time values and the speed steady state error value is tiny. The
results comparison depicts that the PSO_Fuzzy_PID controller shows more efficient response
in compare with other investigated controllers.
References [1] A. Rodriguez-Martinez, R. Garduno-Ramirez and L. G. Vela-Valdes, “PI Fuzzy Gain-Scheduling Speed
Control at Startup of a Gas-Turbine Power Plant”, IEEE Transactions On Energy Conversion, vol. 26, no. 1,
(2011).
[2] S. Panda and B. Bandyopadhyay, “Sliding mode control of gas turbines using multirate-output feedback”, J
Eng Gas Turbines Power – Trans ASME 2008, vol. 130, (2008).
[3] A. Chipperfield and P. Fleming, “Multiobjective gas turbine engine controller design using genetic
algorithms”, lEEE Trans Ind. Electron, vol. 43, no. 5, (1996).
[4] S. M. Camporeale, B. Fortunato and A., Dumas, “Non-linear simulation model and multivariable control of a
regenerative single shaft gas turbine”, In: Proceedings of IEEE international conference on control
applications, (1997) USA.
[5] A. Marzoughi, H. Selamat and F. Marzoughi, “Application of particle swarm optimization approach to
improve PID performance for a gas turbine temperature control system”, IEEE Student Conference on
Research and Development, (2010) Skudai, Malaysia.
[6] J. J. I Wang, Y. Y. Jing and C. F. Zhang, “Self-Adaptive Neuron PID Control in Exhaust Temperature of
Micro Gas Turbine”, Proceedings of the Seventh International Conference on Machine Learning and
Cybernetics, (2008) Kunming.
[7] E. Najimi and M. H. Ramezani, “Robust control of speed and temperature in a power plant gas turbine”, ISA
Transactions, vol. 51, no. 2, (2012).
[8] Z. Wang and S. Li, “Simulation Study on Fuzzy PID Control of Gas Turbine Generating Sets Speed”, IEEE
International Conference on Intelligent Computing and Intelligent Systems, (2009) Harbin, China.
[9] W. Deng and H. Zhang, “Fuzzy Neural Networks Adaptive Control of Micro Gas Turbine with Prediction
Model”, Proceedings of the International Conference on Networking, Sensing and Control, (2006) Shenyang.
[10] F. Jurado, M. Ortega, A. Cano and J Carpio, “Neuro-fuzzy controller for gas turbine in biomass-based electric
power plant”, Electric Power Systems Research, vol. 60, no. 3, (2002).
[11] W. I. Rowen, “Simplified mathematical representations of heavy-duty gas turbines”, ASME J Eng Power, vol.
105, (1983), pp. 865–869.
[12] J. Kennedy and R. Eberhart, “Particle swarm optimization”, Proc. IEEE Int. Conf. Neural Networks, (1995)
Australia.

International Journal of Control and Automation
Vol. 6, No. 1, February, 2013
24
Appendix
The values of the applied variables and constants are expressed in Table I.
Table I. Dynamic Model Parameters
Value Parameters
16.7 W
0.6 X
1 Y
1 Z
1.5 MAX
-0.1 MIN
1 A
0.05 B
1 C
0.23 Wmin
0.4 TF1
0 KF
0.01 ECR
0.04 ETD
0.2 TCD
950 TR
450 Tt
Tx=TR-700*(1-WF)+550*(1-N) f1
1.3*(WF-0.23)+0.5*(1-N) f2
15.64 TI
Top Related
Copyright © 2022 FDOKUMEN

