


Bahasa
Halaman
Hukum


ORI GIN AL PA PER
A dual effect of urban expansion on flood risk in the PearlRiver Delta (China) revealed by land-use scenariosand direct runoff simulation
Shiqiang Du • Anton Van Rompaey • Peijun Shi • Jing’ai Wang
Received: 7 June 2014 / Accepted: 29 December 2014� Springer Science+Business Media Dordrecht 2015
Abstract Since the late 1970s, the Pearl River Delta (PRD) in China has undergone a
rapid transition from an agricultural landscape to a metropolitan area. The rapid urbani-
zation has not only increased the area of impervious surfaces in the central plain; it has
displaced farmland to the hilly peripheral areas. The objectives of this study are to: (1)
analyze how these changes in land use in the PRD have influenced flood incidence over the
past 20 years and (2) explore possible changes in flood incidence in the coming two
decades. An integrated simulation of the land-use changes and the hydrological processes
is employed to investigate the impact of urbanization on the volume of direct runoff.
Historical flood records are used for validation. The simulation results indicate that land-
use change in the PRD has markedly increased direct runoff over the past two decades.
Changes in direct runoff generation and in land use are significantly correlated with his-
torical floods at the county level. These results suggest that the increase in floods stems
from the dual effect of urbanization on land use through the expansion of impervious
surfaces and the displacement of farmlands to the hilly outskirts. The simulations suggest
Electronic supplementary material The online version of this article (doi:10.1007/s11069-014-1583-8)contains supplementary material, which is available to authorized users.
S. Du � P. Shi (&) � J. WangState Key Laboratory of Earth Surface Processes and Resources Ecology, Beijing Normal University,Xinjiekouwai Street 19, Beijing 100875, People’s Republic of Chinae-mail: [email protected]
S. DuDepartment of Geography, Shanghai Normal University, Guilin Road 100, Shanghai 200234,People’s Republic of China
S. Du � A. Van RompaeyGeography Research Group, Department of Earth and Environmental Sciences, Katholieke UniversiteitLeuven, Celestijnenlaan 200E, Heverlee 3001, Belgium
J. WangKey Laboratory of Regional Geography, College of Geography and Remote Sensing Science, BeijingNormal University, Xinjiekouwai Street 19, Beijing 100875, People’s Republic of China
123
Nat HazardsDOI 10.1007/s11069-014-1583-8

that the dual effect would continue in a future of business as usual. Stopping farmland
replacement would likely reduce the increase in direct runoff generation, and this reduction
would be augmented if changes in farmland replacement were combined with compact city
development.
Keywords Urbanization � Farmland replacement � Scenario analysis � Cellular automata �Hydrological model
1 Introduction
Urbanization is a process of urban land-use expansion to hold a growing number of urban
dwellers (Bai et al. 2012). Rapid urbanization takes place when the internal processes
through which cities develop are accelerated by immigration or industrial expansion (Bai
et al. 2014; Grimm et al. 2008). Accelerated land-use change in the process of rapid
urbanization is often blamed for increasing threats to ecosystems and human health
(Alberti et al. 2007; MEA 2005; Mileti 1999; Vermeiren et al. 2012). With respect to
hydrological processes, urban expansion is also believed to reduce a landscape’s capacity
to control floodwaters because paved surfaces, such as roads and parking lots, create large
expanses of impervious ground (Gilroy and McCuen 2012; Solin et al. 2011). Impervious
surfaces reduce infiltration during storm events and increase direct runoff that, in turn,
increases flooding in urban areas (Bosch and Hewlett 1982; Richert et al. 2011). The
growing incidence of urban flooding is a major challenge to urban sustainability efforts that
calls for integrated land–water management solutions in urban planning and development
(Mileti 1999; Shi et al. 2005).
The impact of urbanization on flood risk in more developed countries has been studied
using field measurements, experimental watersheds, and statistical modeling (Bosch and
Hewlett 1982; DeFries and Eshleman 2004). In less developed countries, however, urban
flooding is more common and more complicated than the flooding experienced in the cities
of developed countries (Cheng 2005; Zhang and Wang 2007; Zhou et al. 2011). One
explanation for this situation is the concentrated increase of the global urban population in
developing countries (Balica et al. 2012; Hallegatte et al. 2013). In addition, most
developing countries have relatively inadequate flood risk mitigation and they generally
lag behind on sustainable land-use practices, such as best storm management (Battiata et al.
2010), green roof (Mentens et al. 2006), and green infrastructure (European-Commission
2007). Furthermore, and perhaps most fundamentally, developing countries generally face
great challenges in resolving the trade-offs between the demands of city development and
the need to reduce flood risk in the midst of rapid urbanization (Cheng 2005; Xiang et al.
2011).
China has been experiencing a process of rapid and massive urbanization since the late
1970s. China added 500 million residents to its urban population between 1980 and 2011,
increasing the urbanization rate from 20 to 51 % (NBSC 2012; Yusuf and Saich 2008).
This trend is expected to continue in the coming decades: China’s urban population is
projected to add another 300 million residents by 2050 (UN 2012). This rapid urbanization
has brought with it intimidating challenges to the sustainability of China’s cities. These
challenges relate to not only expanding city size and the infrastructure needed to hold the
rapidly growing population; they also point to the need to ameliorate the unwelcome
Nat Hazards
123
effects of urbanization on the incidence of natural disasters, such as floods (Cheng 2005;
Xiang et al. 2011).
In China, rapid urban expansion usurps valuable farmland. Thus, China also faces
potential food shortages for its population and for export (Brown 1995; Liu et al. 2010). To
protect the food supply and promote the efficient use of urban land, China instituted the
New Land Administration Law (NLAL) in 1999 that permits urban development of
farmland only when an equivalent area of new farmland is developed elsewhere (LAL
2004). This policy of ‘‘no net loss’’ of farmland intends to ensure that the area of farmland
remains the same despite urbanization (Lichtenberg and Ding 2008; Wang et al. 2012).
The implementation of NLAL introduced a new dimension to the relationship of
urbanization to flood incidence. Since it took effect, urbanization has been argued to
influence flood incidence in two ways. First, it directly increases the incidence of flooding
by increasing the area of impervious surfaces that block the ground absorption of rainwater
(Shi et al. 2007; Weng 2001). Second, urbanization compensates for displaced farmland
with forested land, which reduces the land’s ability to retain rainfall and thereby increases
the generation of direct runoff (Cheng 2005; Zhang et al. 2008). Between 2000 and 2005,
China converted about 42 % of its unused land that was located mainly on the periphery
into farmland (Liu et al. 2010). In the Pearl River Delta (PRD) of Southern China, urban
expansion in the central PRD has pushed farmlands into its hilly peripheral areas (Du et al.
2014). Thus, farmland replacement and urban expansion are linked as a dual influence of
urbanization on direct runoff generation and flood risk. Understanding this still largely
overlooked dual effect of urbanization on flood risk is undoubtedly important for guiding
urban planning and minimizing conflicts between economic development and environ-
mental protection.
To gain a better understanding of the dual effect of urbanization on flood incidence, we
developed an integrated analysis by combining a land-use model with a hydrological
model using the PRD area in Southern China as a case study. Following a description of the
study area, Sect. 2 describes the development of three land-use scenarios and the employed
hydrological model. Section 3 shows the detailed impacts of land-use changes on direct
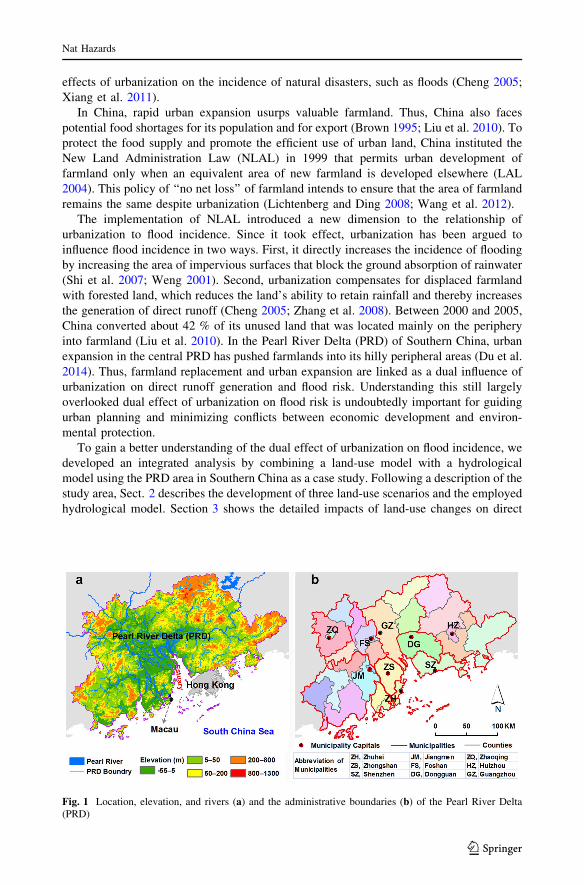
Fig. 1 Location, elevation, and rivers (a) and the administrative boundaries (b) of the Pearl River Delta(PRD)
Nat Hazards
123

runoff and flood incidence over the past 20 years and in predicted future scenarios. Dis-
cussion and conclusions in Sects. 4 and 5, respectively, follow those results.
2 Materials and methods
2.1 Study area
The PRD area was chosen for this case study because of its key characteristics of rapid
urbanization and a high incidence of floods (Hallegatte et al. 2013). The PRD is an
emerging coastal metropolitan area, bordering Hong Kong and Macau (two special
administrative districts of China). It covers approximately 45,000 km2 and consists of nine
municipalities (Fig. 1). Its elevation ranges from \5 m in the central alluvial plain to
1,300 m in the hills that surround the plain. The delta’s dominant soil types are red earth
and paddy soils, and it has a subtropical climate, with a mean annual temperature of 22 �C
and a mean annual precipitation of 1,700 mm. Because of the impact of the East Asian
monsoonal circulation, about 80 % of the rainfall occurs between April and September and
the delta is most prone to flooding during those months (Shi et al. 2007; Weng 2001; Zhou
et al. 2011).
The PRD had long been an important base of China’s food production. Since the late
1970s, however, the PRD has been one of China’s most rapidly industrializing regions
(Weng 2001). The area’s rapid industrialization and economic growth have led to an
unprecedented rate of urban expansion and farmland loss (Li 1998). Built-up lands
increased from 1,600 to 6,800 km2 between 1990 and 2010, with the ratio of built-up land
to total land use increasing from \4 to 15 % over that period (Du et al. 2014). The rapid
urbanization resulted in the seizing of large tracts of farmland (Li 1998) and the dis-
placement of this farmland to the hilly peripheral areas (Du et al. 2014; Zhang and Wang
2007) in accordance with NLAL policy (DLRGP 2008; LAL 2004).
The land-use changes in the PRD are substantially affecting the area’s hydrological
processes (Shi et al. 2007; Weng 2001; Zhang et al. 2008; Zhang and Wang 2007; Zheng
et al. 2009). Weng (2001) analyzed the impacts of urbanization on direct runoff in the
central low-lying alluvial plain of the PRD and found that the increase in annual direct
runoff was positively related to the urban growth rate. Shi et al. (2007) found that rapid
urbanization in Shenzhen between 1980 and 2000 was correlated with a distinct increase in
peak discharge and a decrease in runoff confluence time. Zhang and Wang (2007) and
Zhang et al. (2008) used historical hydrological and land-use data to analyze the impacts of
urbanization-related activities, such as dredging floodways and constructing water facili-
ties, on the flood risk in Foshan. The results suggested that human urbanization activities
had impaired the rivers’ abilities to buffer floods. Similarly, Zhou et al. (2011) found that
the rapid urbanization in Shenzhen had substantially changed the landscape geomorphol-
ogy and had caused the disappearance of many small rivers between 1980 and 2005. The
previous research has consistently found that urbanization affects flood risk. However, the
ways in which urbanization interacts with other land-use changes, particularly farmland
replacement, on flood risk are less clear.
2.2 Land-use data and land-use scenarios
Land-use scenarios have become popular tools for bridging scientific land modeling and
real-world planning (Brown et al. 2013; Reenberg 2011). They provide plausible
Nat Hazards
123

descriptions of possible future states of land systems and the associated consequences of
land-use changes for the sustainability of the relevant societies (Xiang and Clarke 2003).
This study applied land-use data and land-use model to investigate the impacts of farmland
displacement and urbanization on direct runoff. The land-use data for 1990, 2000, and
2010 were derived from Du et al. (2014), which were monitored with the classification tree
method using Landsat TM/ETM imagery. A land-use model was constructed to investigate
the possible future land-use conditions for 2020 and 2030. The modeling procedure con-
sisted of: (1) developing the scenarios of the sizes of new built-up lands and new farm-
lands, and (2) calculating the allocation of the new built-up lands and new farmlands.
Three scenarios of new built-up lands and new farmlands were developed (Table 1).
The first scenario is ‘‘business-as-usual’’ (BAU). It assumes that (1) built-up land will
increase linearly on the trajectory observed between 1990 and 2010, and (2) all farmland
that is displaced by new built-up land will be replaced from somewhere else (in compliance
with NLAL). The second scenario is ‘‘no farmland replacement’’ (NFR). It retains BAU’s
first assumption regarding new built-up land but it does not retain BAU’s second
assumption regarding farmland replacement. The third scenario is ‘‘compact development
and no farmland replacement’’ (CDNFR). It also has no assumptions about farmland
replacement. With respect to new built-up land, in the CDNFR scenario, it is 25 % less
than in the BAU scenario. The CDNFR scenario is reasonable because the Chinese central
government requires local officials to use urban lands efficiently (Bai et al. 2014).
The three scenarios were allocated at a spatial resolution of 30 m, which is the original
resolution of the land-use maps. The procedure is based primarily on logistic regression
and cellular automata rules (Fig. 2, Poelmans and Van Rompaey 2009; Wu 2002), which
were implemented via MATLAB. First, new built-up land was allocated on the possibility
that non-built-up lands will be built up (BU possibility). The BU possibility was assessed
using a binary logistic regression that considered the following variables: biophysical
environment, accessibility, regional differences, and neighborhood properties. According
to the assessed possibility, the requested built-up lands were iteratively assigned to the
pixels ranking the highest. In each iteration, 5,000 pixels of new built-up lands were
allocated. The values of the neighborhood variables were updated after each iteration to
generate a new BU possibility map for the next iteration. The second step in the BAU
scenario was computing farmland replacement. The amount of farmland replacement was
set as equal to the amount of farmlands lost in assigning lands for new built-up lands.
These farmlands were then allocated based on the farmland possibility map using the same
procedure that was implemented for allocating the built-up lands.
The allocation procedures for new built-up lands and farmlands were calibrated and
validated separately by simulating the observed land-use changes between 2000 and 2010.
The calibration for new built-up lands employed a random sample of 80,000 pixels. Half of
Table 1 Land-use scenarios
Scenario Assumption 1: built-up land growth Assumption 2: farmland replacement
BAU Linear trend Continue
NFR Linear trend Stop
CDNFR 25 % reduction compared with the linear trend Stop
BAU business as usual, NFR no farmland replacement, CDNFR compact development and no farmlandreplacement
Nat Hazards
123

the pixels changed from non-built-up land to built-up land, while the other half retained
non-built-up land between 2000 and 2010. The calibration for farmland reclamation also
employed a random sample, in which 40,000 pixels changed between 2000 and 2010 from
non-farmland and non-built-up land to farmland while 40,000 pixels retained non-farmland
and non-built-up land.
The allocation procedure was validated for the probability maps and the result maps.
First, the probability maps were validated using the total operating characteristic (TOC)
procedure, which compares the location of the multi-threshold probability of land-use
change to the observed land-use change (Pontius and Schneider 2001; Pontius and Par-
mentier 2014). Second, a three-map comparison was performed to validate the simulated
land-use map for 2010 (Pontius et al. 2011). This method compares the differences and
similarities among the observed 2000, observed 2010, and simulated 2010 land-use maps
and provides data on the sizes of hits, misses, false alarms, wrong hits, and correct
rejections (Brown et al. 2013; Pontius et al. 2011).
2.3 Assessing the impact of land-use changes on direct runoff and historical floods
A distributed hydrological model was used to assess the impacts of past and future
(simulated) land-use changes on direct runoff and the associated flood risk. This model was
developed by the USDA soil conservation service (SCS) (now known as the Natural
Resources Conservation Service) based on curve numbers and empirical equations (USDA
1972). The SCS model has been widely used to estimate storm runoff depth because of its
relatively low demand for input data and highly reliable simulation results (Du et al. 2012;
Weng 2001). In this model, the depth of direct runoff is mathematically expressed as
follows:
Q ¼ P� 0:2Sð Þ2
Pþ 0:8S; P� 0:2S
Q ¼ 0; P� 0:2S
8<
:ð1Þ
where Q (mm) is the depth of direct runoff, P (mm) is the precipitation, and S is the
potential maximum retention or infiltration. The value of S, which describes the capacity of
Fig. 2 Land-use model for urban expansion and farmland reclamation
Nat Hazards
123

a pixel to retain storm precipitation, can be estimated by a dimensionless runoff curve
number (CN) via S = (25,400/CN) - 254, whereby the CN is determined by the ante-
cedent moisture, soil, and land-use properties.
The inputted precipitation was that of a 2-year return storm of 24-h duration. The
precipitation volume was first calculated by the Pearson-III method (Liu et al. 2012) for
each of the 14 weather stations for which the daily rainfall data were available from 1951
to date. Those point data were subsequently interpolated to each pixel using a point
Kriging method via geographic information system (GIS) software. Soil properties at the
pixel level were derived from the soil maps produced by Liu (1993) and Shi et al. (2004).
The applied CN value was derived from Shi et al. (2007) in a case study of Shenzhen
(Table S1).
Historical flood data were applied to validate the relationship between land-use changes
and direct runoff. This dataset was derived from the China disaster database (CDD)
managed by Beijing Normal University (Wang et al. 2008). The Pearson correlation was
applied to the relationship of recorded flood frequency to changes in land use (i.e., built-up
land, forested land, and farmland) and to the relationship of recorded flood frequency to
simulated direct runoff. Changes to land use in the land-use dataset were calculated via
spatial analysis (Du et al. 2014). Before performing the Pearson correlation, flood fre-
quencies and changes in land use and direct runoff were normalized to 0–1 using the range
standardization method as follows:
Fig. 3 Observed land-use maps for 1990 (a), 2000 (b), and 2010 (c) and simulated land-use map for 2010(d)
Nat Hazards
123
Xi ¼xi �minðxiÞ
maxðxiÞ �minðxiÞð2Þ
where Xi refers to the normalized value of the specific variable x for county i, xi is the value
of variable x for county i, and min(xi) and max(xi) are the minimum and maximum values
of variable x for all counties.
3 Results
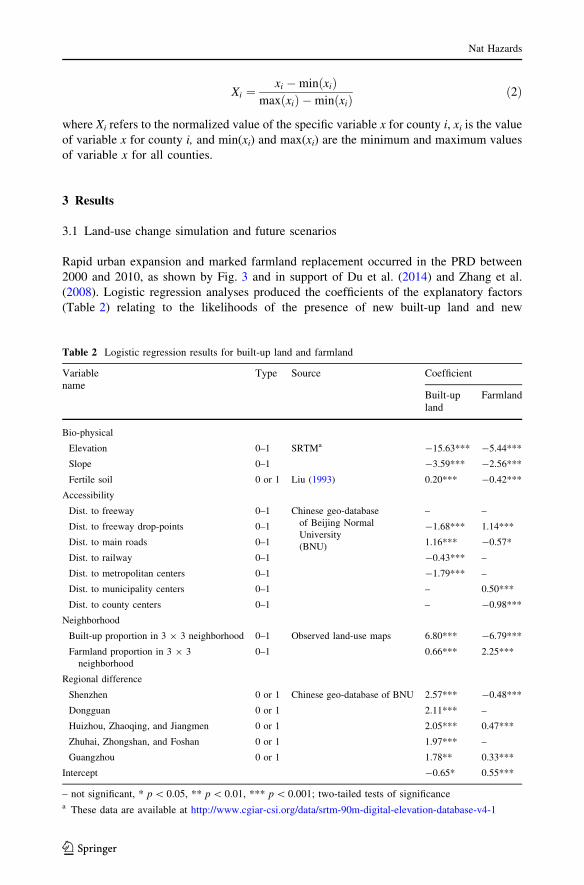
3.1 Land-use change simulation and future scenarios
Rapid urban expansion and marked farmland replacement occurred in the PRD between
2000 and 2010, as shown by Fig. 3 and in support of Du et al. (2014) and Zhang et al.
(2008). Logistic regression analyses produced the coefficients of the explanatory factors
(Table 2) relating to the likelihoods of the presence of new built-up land and new
Table 2 Logistic regression results for built-up land and farmland
Variablename
Type Source Coefficient
Built-upland
Farmland
Bio-physical
Elevation 0–1 SRTMa -15.63*** -5.44***
Slope 0–1 -3.59*** -2.56***
Fertile soil 0 or 1 Liu (1993) 0.20*** -0.42***
Accessibility
Dist. to freeway 0–1 Chinese geo-database
of Beijing Normal
University
(BNU)
– –
Dist. to freeway drop-points 0–1 -1.68*** 1.14***
Dist. to main roads 0–1 1.16*** -0.57*
Dist. to railway 0–1 -0.43*** –
Dist. to metropolitan centers 0–1 -1.79*** –
Dist. to municipality centers 0–1 – 0.50***
Dist. to county centers 0–1 – -0.98***
Neighborhood
Built-up proportion in 3 9 3 neighborhood 0–1 Observed land-use maps 6.80*** -6.79***
Farmland proportion in 3 9 3
neighborhood
0–1 0.66*** 2.25***
Regional difference
Shenzhen 0 or 1 Chinese geo-database of BNU 2.57*** -0.48***
Dongguan 0 or 1 2.11*** –
Huizhou, Zhaoqing, and Jiangmen 0 or 1 2.05*** 0.47***
Zhuhai, Zhongshan, and Foshan 0 or 1 1.97*** –
Guangzhou 0 or 1 1.78** 0.33***
Intercept -0.65* 0.55***
– not significant, * p \ 0.05, ** p \ 0.01, *** p \ 0.001; two-tailed tests of significancea These data are available at http://www.cgiar-csi.org/data/srtm-90m-digital-elevation-database-v4-1
Nat Hazards
123

farmland. Elevation and slope were particularly significant fitted variables of land-use
transformation because new built-up lands and farmlands both avoided the higher eleva-
tions and steeper slopes in the PRD. Their coefficients were much larger for built-up land
than for farmland. Built-up land appears to have pushed farmland outward from the central
plain to the less accessible areas. Moreover, built-up lands typically covered areas of
relatively greater fertility, whereas new farmlands were developed on relatively less fertile
land (Liu 1993). As shown by the accessibility variables, built-up lands appear to have
usurped the land with high accessibility scores. The coefficients for the effects of the
neighborhood variables indicate that built-up lands pushed the farmlands toward the
periphery of the PRD. Shenzhen and Dongguan experienced the most extensive urban
expansion, and the peripheral counties of Guangzhou, Huizhou, Zhaoqing, and Jiangmen
were relatively more likely to be transformed into new farmland (Table 2).
The calibrated coefficients produced probabilities that the available lands would become
either built-up land or farmland. Both probabilities were assessed using the TOC proce-
dure. The calculated probability curves for built-up land and farmland were much higher
than the random line (Fig. 4). They were much closer to the maximum boundary lines than
to the minimum boundary lines. Areas under the curve (AUC) were 88 and 80 % for built-
up land and farmland, respectively. The results show a positive association between the
probability of lands becoming new built-up land or new farmland (in other words, lands
that experience a change in type of use) and the observed presence of new built-up land or
farmland. The simulated land-use map for 2010 (Fig. 3d) was derived from these proba-
bilities. The three-map comparison produced the image shown in Fig. 5. The allocation and
quantity disagreements between the simulated 2010 and observed 2010 maps were 13 and
2 %, respectively. The allocation disagreement was mainly caused by false alarms and
misses.
The BAU land-use scenarios produced for 2020 and 2030 (Fig. 6a, b) suggest large
increases in built-up lands in the future. In this scenario, built-up lands are expected to
increase by 5,100 km2 between 2010 and 2030, representing a proportional increase in the
entire PRD from 15 to 26 %. Spatially, the built-up land in the central plain of the PRD is
Fig. 4 TOC curves for built-up land (a) and farmland (b) horizontal axis of Hits ? False alarms means thetotal area under a multi-threshold probability. Vertical axis of hits means the presence of new land use in thearea under a certain threshold probability. Hits ? Misses is the upper boundary of the TOC space.Maximum and minimum define the mathematically possible space where the TOC curve appears. Randomindicates the statistically expected result of a random allocation procedure
Nat Hazards
123

predicted to develop into a megacity by 2030, swallowing up counties in Shenzhen,
Dongguan, Guangzhou, Foshan, Zhongshan, and Zhuhai (Fig. 1). Under this scenario,
enormous farmlands of 2,800 km2 would disappear and, by 2030, new farmland replace-
ment would deforest about 700 km2 of the hills surrounding the flat plain.
In contrast, according to the CDNFR scenario, the PRD would experience 25 % less
urban growth than in the BAU scenario and there would be no replacement of farmland in
the hilly areas (Fig. 6c, d). As a result, the decrease in forests would be 91 % less than in
the BAU scenario. The results from the NFR scenario closely resembled the results of the
BAU scenario; however, the NFR scenario reduces the extent of BAU-estimated defor-
estation by 90 % (Fig. 6e, f).
3.2 Impacts of land-use change on direct runoff
Figure 7 shows the changes in direct runoff from 1990 to 2010 using observed land-use
data (Table S2). Direct runoff did not noticeably increase in the decade between 1990 and
2000 (Fig. 7a); in fact, it decreased by more than 5 % in the peripheral counties of
Zhaoqing, Jiangmen, and Huizhou. In contrast, in the 10 years between 2000 and 2010,
direct runoff increased remarkably across the entire area (Fig. 7b). In the PRD as a whole,
direct runoff decreased by 0.2 % between 1990 and 2000 but increased by more than 6 %
Fig. 5 Map of five-type agreement and disagreement based on a three-map comparison (2000 and 2010observed maps and 2010 simulated map)
Nat Hazards
123

between 2000 and 2010. The land-use changes appear to have had a marked influence on
direct runoff generation between 2000 and 2010.
The impact of urban expansion and farmland displacement on direct runoff and asso-
ciated flood incidence was also validated by the Pearson correlation analyses between (1)
flood frequency and changes in land use and between (2) flood frequency and direct runoff
generation. Recorded flood frequencies increased in all of the PRD counties from the 1980s
and the 1990s to the 2000s (Fig. 8). Figure 9 shows statistically significant correlations
between changes in land use and the frequency of flooding. Each sub-figure includes 54
data points, and each point represents a county record either from 1990 to 2000 or from
2000 to 2010. Flood frequency was significantly correlated with the changes in built-up
land and forested land at the county level (Fig. 9a, b; r = 0.55 and 0.44, respectively).
Fig. 6 Simulated land-use maps for 2020 and 2030 under three future scenarios
Nat Hazards
123

Flood frequency had a relatively small but still statistically significant correlation with the
change in farmland (Fig. 9c; r = 0.22). The normalized changes in simulated direct runoff
significantly correlated with the recorded flood frequency at the county level (Fig. 9d;
r = 0.52), verifying, to a certain extent, the usefulness of the direct runoff simulation.
If urban expansion were to grow linearly and farmland replacement continued (the BAU
scenario), the simulated increase in the volume of direct runoff between 2000 and 2010
would likely continue into the future unless compact development and land-use policy
adjustments were implemented (Fig. 10a, b; Table S2). In the BAU scenario, direct runoff
in the PRD would increase by 9 % between 2010 and 2030. All of the counties would
experience noticeable increases in direct runoff (see Fig. 1). Alternatively, under the
assumptions of the NFR (Fig. 10c, d) and CDNFR scenarios (Fig. 10e, f), the increase in
direct runoff would be modest. The NFR and CDNFR increases in direct runoff in the PRD
between 2010 and 2030 would be 31 and 34 % less, respectively, than the estimations of
the BAU scenario. Spatially, the increase in direct runoff would be modest in all of the
counties.
The largest difference in future outcomes among the three scenarios would occur in
Longmen, located in the northernmost county of Huizhou. The simulated direct runoff (in
Longmen) declined by 5 % from 1990 to 2000 (Fig. 7a) and then increased by 21 %
between 2000 and 2010 (Fig. 7b). Under the BAU assumptions, the direct runoff would
increase by more than 12 % between 2010 and 2030. By contrast, in the CDNFR scenario,
Fig. 7 Variation in direct runoff over the periods of 1990–2000 and 2000–2010
Fig. 8 Decadal number of flood incidences recorded in counties
Nat Hazards
123

the direct runoff would increase by only 0.3 % between 2010 and 2030, which is 98 %
lower than the 12 % increase in direct runoff in the BAU scenario. The NFR scenario
results for 2030 were very similar to the CDNFR results, producing only 0.02 % more
direct runoff than the CDNFR scenario. Taken together, these results suggest that farmland
replacement (simulated only in the BAU scenario) would play a crucial role in increasing
direct runoff, particularly in the counties outside of the central plain where farmland
replacement is expected to be concentrated.
4 Discussion
The results of this study suggest that urbanization has a dual effect on hydrological pro-
cesses. In the context of current land-use policy (NLAL), urban expansion and farmland
replacement are linked to increases in direct runoff generation. The farmland protection
policies oblige land developers to claim new land for farmland to compensate for the
farmland that is lost to urbanization (DLRGP 2008; LAL 2004). In the PRD, where the
economy and the population are rapidly growing, deforestation appears to be an
unavoidable consequence of new farmland creation (Du et al. 2014; Zhang et al. 2008).
The two land-use changes, from farmland to built-up land and from forest to farmland, can
individually increase the volume of direct runoff (Bosch and Hewlett 1982; DeFries and
Eshleman 2004). These two processes are found in this study to combine their effects to
influence direct runoff. Urbanization in the PRD influences direct runoff through its
expansion of built-up land that is resistant to rainwater absorption (i.e., impervious
Fig. 9 Relationships between flood frequency and changes in a built-up land, b forested land, c farmland,and d simulated runoff * two-tailed tests of significance, ** one-tailed tests of significance
Nat Hazards
123

surfaces) and by pushing farmland into the hilly areas, which causes deforestation. This
study’s integrated analysis of land-use scenarios and direct runoff generation clearly point
to this dual effect of urbanization on direct runoff.
One of this study’s strengths is its application of historical flood records to verify the
findings of the direct runoff simulations. Variation in flooding incidence is far more
complex than its link to direct runoff generation because flood risk is not determined only
by hydrological processes; it is also influenced by social factors such as exposure and
vulnerability to waterlogging and inundation (Balica et al. 2012; Hallegatte et al. 2013).
Fig. 10 Variation in future direct runoff for 2020 and 2030 under three land-use scenarios compared to2010 direct runoff
Nat Hazards
123

Therefore, the associations between direct runoff generation and flooding incidence found
by this study should be interpreted with caution, although they provide strong evidence that
urban expansion and farmland replacement combine to increase direct runoff generation.
This study employed historical flood records to verify the findings of the direct runoff
simulations. The results found that flood incidence is significantly correlated with changes
in direct runoff generation and in land use, strongly implying that direct runoff simulation
is a useful tool and that the combined effects of land-use changes in the PRD definitely
influence flood incidence.
The results also highlight the usefulness of employing land-use change scenarios to
predict the future outcomes of these impacts. This study did not aim to accurately predict
the future state of land use, and it did not consider changes in farmland and other non-
urban lands that were not related to farmland replacement. Rather, it simulated land-use
changes that were related only to urban expansion and farmland replacement. Not
accounting for other land-use changes contributed to the disagreement between the sim-
ulated and the observed land-use maps for 2010 (Fig. 5), in addition to model and data
uncertainty as argued by Pontius and Petrova (2010). However, the land-use change
probabilities that were applied to future land-use scenarios were relatively reliable (Fig. 4).
The three land-use scenarios indicated farmland replacement as a statistically significant
factor in the increase of direct runoff generation (Figs. 9, 10). The method of applying the
scenarios used in this study can be replicated in other locations around the world where
cities are rapidly growing at the expense of adjacent farmland. The within results can
provide a broad guide to decision makers who are struggling to find ways to expand their
cities efficiently without exacerbating urban flooding.
Future research can apply a wider range of plausible scenarios that include other factors.
For example, the array of scenarios can be expanded to include the plausible future states
of all land-use types using methods such as system dynamic analysis (He et al. 2005).
However, there may be critical uncertainty about the land-use quantity and allocation
because of the unreliability of the reference data and the problems related to land-use
models (Pontius et al. 2011). Land reclamation from the sea and changes to fishponds
(Fig. 3a–c) may also markedly influence flood incidence (Cheng 2005; Zhang and Wang
2007; Zhou et al. 2011). The SCS model employed in this study was unable to model the
extent of these impacts on flood incidence, which should be simulated by a hydraulic
model (Thompson et al. 2004). Additionally, precipitation with various return periods may
be important to variation in flood incidence. We used a constant precipitation scenario,
even though variation in precipitation may mediate the effects of different land-use sce-
narios on direct runoff (Mejı́a and Moglen 2010). The result was a direct and clear rep-
resentation of the effects of different land development scenarios. However, we encourage
researchers to investigate the impact of various rainfall scenarios on the relationship of
land use to direct runoff.
The results imply that the land-use policy of claiming new farmland to compensate for
the farmland displaced by urbanization (NLAL) is having harmful side effects and should
be radically adapted or abandoned. In the context of rapid urbanization in China, the
official ‘‘no net loss’’ policy of the past 10 years neither protects farmland nor increases the
efficiency of urban land use. It is estimated that approximately 10,000 km2 of extant urban
space can be developed in China without displacing farmland by using unused land in
cities and towns, adjusting the industrial structure, and heightening land-use intensity (Lu
and Huang 2010). It is likely that the displacement of farmlands would remarkably
decrease were urban lands used more efficiently. A revision of the NLAL should therefore
focus on stimulating more efficient urban land use. Policymakers should consider the
Nat Hazards
123

‘‘green way’’ and ‘‘green infrastructure’’ (Ahern 1995; Yu 2005) as possible ways to
control urban expansion and achieve a sustainable landscape.
5 Conclusions
Data on direct runoff simulations and historical floods were applied in this study to
investigate the relationship of land-use changes to flood occurrence in the PRD area. The
results strongly suggest that urbanization in the PRD area has a dual effect on direct runoff
and flood incidence by expanding impervious built-up land and reclaiming farmland in
forested hills. Compared with the period of 1990–2000, simulated direct runoff and
recorded floods remarkably increased between 2000 and 2010 at the county level. Increases
in simulated direct runoff, built-up land, and farmland were significantly and positively
correlated with recorded floods. However, a significant negative correlation was found
between flood incidence and increases in forested land.
These findings are likely linked to China’s ‘‘no net loss’’ policy that has been in place
since 1999 because it requires compensation for the farmland that has been lost to
urbanization. Rapid urbanization is continuing in the PRD, and urbanization’s dual effect
on flood incidence is expected to continue and increase in intensity in the coming years.
Abandoning farmland replacement as a remedy for the loss of agricultural land might
ameliorate the anticipated increases in direct runoff and, thus, decrease flood incidence.
Combined with innovative urban planning, more improvement might be realized.
Acknowledgments Editor Professor T.S. Murty and the anonymous referees who reviewed this paper aregreatly appreciated for their thoughtful comments and suggestions that ultimately improved its quality. Weare also grateful for the contributions made by Professor Jiahong Wen, Professor Guoyi Han, and theEditage Language Service for their efforts toward improving the language of the manuscript. This researchis supported by the National Basic Research Program of China (973 Program) (Grant No. 2012CB955404)and National Natural Science Foundation of China (Grant Nos. 41401603 and 41201548).
References
Ahern J (1995) Greenways as a planning strategy. Landsc Urban Plan 33(1–3):131–155Alberti M, Booth D, Hill K, Coburn B, Avolio C, Coe S, Spirandelli D (2007) The impact of urban patterns
on aquatic ecosystems: an empirical analysis in Puget lowland sub-basins. Landsc Urban Plan80(4):345–361. doi:10.1016/j.landurbplan.2006.08.001
Bai X, Chen J, Shi P (2012) Landscape urbanization and economic growth in China: positive feedbacks andsustainability dilemmas. Environ Sci Technol 46(1):132–139. doi:10.1021/es202329f
Bai X, Shi P, Liu Y (2014) Realizing China’s urban dream. Nature 509(7499):158–160Balica SF, Wright NG, Meulen F (2012) A flood vulnerability index for coastal cities and its use in assessing
climate change impacts. Nat Hazards 64(1):73–105. doi:10.1007/s11069-012-0234-1Battiata J, Collins K, Hirschman D, Hoffmann G (2010) The runoff reduction method. J Contemp Water Res
Educ 146(1):11–21. doi:10.1111/j.1936-704X.2010.00388.xBosch JM, Hewlett JD (1982) A Review of catchment experiments to determine the effect of vegetation
changes on water yield and evapo-transpiration. J Hydrol 55(1–4):3–23. doi:10.1016/0022-1694(82)90117-2
Brown LR (1995) Who will feed China? Wake-up call for a small planet. WW Norton and Company, NewYork
Brown DG, Band LE, Green KO, Irwin EG, Jain A, Lambin EF, Jr RGP, Seto KC, II BLT, Verburg PH(2013) Advancing Land change modeling: opportunities and research requirements. The NationalAcademies Press, Washington DC
Cheng XT (2005) Changes of flood control situations and adjustments of flood management strategies inChina. Water Int 30(1):108–113
Nat Hazards
123

DeFries R, Eshleman NK (2004) Land-use change and hydrologic processes: a major focus for the future.Hydrol Process 18(11):2183–2186. doi:10.1002/Hyp.5584
DLRGP (2008) The protection regulations on basic farmland of guangdong province. http://www.gdlr.gov.cn/newsAction.do?method=viewNews&classId=020010350000000614&newsId=020010040000011283Accessed 06 Aug 2012
Du J, Qian L, Rui H, Zuo T, Zheng D, Xu Y, Xu CY (2012) Assessing the effects of urbanization on annualrunoff and flood events using an integrated hydrological modeling system for Qinhuai River basinChina. J Hydrol 464–465:127–139. doi:10.1016/j.jhydrol.2012.06.057
Du S, Shi P, Van Rompaey A (2014) The Relationship between Urban Sprawl and Farmland Displacementin the Pearl River Delta, China. Land 3(1):34–51
European-Commission (2007) Towards better environmental options in flood management—natural floodmanagement and green infrastructure. http://ec.europa.eu/environment/water/flood_risk/better_options.htm. Accessed 16 Mar 2013
Gilroy KL, McCuen RH (2012) A nonstationary flood frequency analysis method to adjust forfuture climatechange and urbanization. J Hydrol 414:40–48. doi:10.1016/j.jhydrol.2011.10.009
Grimm NB, Faeth SH, Golubiewski NE, Redman CL, Wu JG, Bai XM, Briggs JM (2008) Global change andthe ecology of cities. Science 319(5864):756–760
Hallegatte S, Green C, Nicholls RJ, Corfee-Morlot J (2013) Future flood losses in major coastal cities.Nature Clim Change 3(9):802–806. doi:10.1038/nclimate1979
He CY, Shi PJ, Chen J, Li XB, Pan YZ, Li J, Li YC, Li JG (2005) Developing land use scenario dynamicsmodel by the integration of system dynamics model and cellular automata model. Sci China Ser D:Earth Sci 48(11):1979–1989. doi:10.1360/04yd0248
LAL (2004) Land administration law of the P.R. China. http://www.fdi.gov.cn/pub/FDI_EN/Laws/GeneralLawsandRegulations/BasicLaws/P020060620320252818532.pdf. Accessed 06 Aug 2012
Li X (1998) Measurement of rapid agricultural land loss in the Pearl River Delta with the integration ofremote sensing and GIS. Environ Plan B-Plan Des 25(3):447–461
Lichtenberg E, Ding CG (2008) Assessing farmland protection policy in China. Land Use Policy25(1):59–68. doi:10.1016/j.landusepol.2006.01.005
Liu A (1993) The soils of Guangdong. Science Press, BeijingLiu JY, Zhang ZX, Xu XL, Kuang WH, Zhou WC, Zhang SW, Li RD, Yan CZ, Yu DS, Wu SX, Jiang N
(2010) Spatial patterns and driving forces of land use change in China during the early 21st century.J Geogr Sci 20(4):483–494. doi:10.1007/s11442-010-0483-4
Liu YL, Chen ZL, Wang J, Hu BB, Ye MW, Xu SY (2012) Large-scale natural disaster risk scenarioanalysis: a case study of Wenzhou City China. Nat Hazards 60(3):1287–1298. doi:10.1007/s11069-011-9909-2
Lu X, Huang S (2010) Barriers and solutions to China’s cultivated land protection. Int J Environ Stud67(2):223–232. doi:10.1080/00207231003696343
MEA (2005) Ecosystems and human well-being: synthesis. Island Press, Washington DCMejı́a AI, Moglen GE (2010) Spatial distribution of imperviousness and the space-time variability of
rainfall, runoff generation, and routing. Water Resour Res 46:1–14. doi:10.1029/2009WR008568Mentens J, Raes D, Hermy M (2006) Green roofs as a tool for solving the rainwater runoff problem in the
urbanized 21st century? Landsc Urban Plan 77(3):217–226. doi:10.1016/j.landurbplan.2005.02.010Mileti DS (1999) Disasters by Design: A Reassessment of Natural Hazards in the United States. Joseph
Henry Press, Washington D. CNBSC (2012) China Statistical Yearbook 2011. Beiijing, ChinaPoelmans L, Van Rompaey A (2009) Detecting and modelling spatial patterns of urban sprawl in highly
fragmented areas: a case study in the Flanders-Brussels region. Landsc Urban Plan 93(1):10–19.doi:10.1016/j.landurbplan.2009.05.018
Pontius RG Jr, Parmentier B (2014) Recommendations for using the relative operating characteristic (ROC).Landsc Ecol 29(3):367–382. doi:10.1007/s10980-013-9984-8
Pontius RG Jr, Petrova SH (2010) Assessing a predictive model of land change using uncertain data.Environ Model Softw 25(3):299–309. doi:10.1016/j.envsoft.2009.09.005
Pontius RG Jr, Schneider LC (2001) Land-cover change model validation by an ROC method for theIpswich watershed, Massachusetts, USA. Agric Ecosyst Environ 85(1–3):239–248
Pontius RG Jr, Peethambaram S, Castella J-C (2011) Comparison of three maps at multiple resolutions: acase study of land change simulation in cho don district Vietnam. Ann As Am Geogr 101(1):45–62.doi:10.1080/00045608.2010.517742
Reenberg A (2011) Toolbox options for conceptualizing change in human environmental systems—Path-ways, path dependency, legacies, syndromes and scenarios. GLP Report No. 2. GLP-IPO, Copenhagen
Nat Hazards
123

Richert E, Bianchin S, Heilmeier H, Merta M, Seidler C (2011) A method for linking results from anevaluation of land use scenarios from the viewpoint of flood prevention and nature conservation.Landsc Urban Plan 103(2):118–128. doi:10.1016/j.landurbplan.07.001
Shi XZ, Yu DS, Warner ED, Pan XZ, Petersen GW, Gong ZG, Weindorf DC (2004) Soil Database of1:1,000,000 digital soil survey and reference system of the Chinese genetic soil classification system.Soil Surv Horiz 45(4):129–136
Shi PJ, Ge Y, Yuan Y, Guo WP (2005) Integrated risk management of flood disasters in metropolitan areasof China. Int J Water Resour Dev 21(4):613–627. doi:10.1080/07900620500258455
Shi PJ, Yuan Y, Zheng J, Wang JA, Ge Y, Qiu GY (2007) The effect of land use/cover change on surfacerunoff in Shenzhen region, China. Catena 69(1):31–35
Solin L, Feranec J, Novacek J (2011) Land cover changes in small catchments in Slovakia during1990–2006 and their effects on frequency of flood events. Nat Hazards 56(1):195–214. doi:10.1007/s11069-010-9562-1
Thompson JR, Sorenson HR, Gavin H, Refsgaard A (2004) Application of the coupled MIKE SHE/MIKE11 modelling system to a lowland wet grassland in southeast England. J Hydrol 293(1–4):151–179.doi:10.1016/j.jhydrol.2004.01.017
UN (2012) World urbanization prospects: the 2011 revision. Environment and urbanization vol 17. UnitedNations, Department of Economic and Social Affairs/Population Division, New York
USDA (1972) National engineering handbook, section 4, hydrology. USDA, Soil Conservation Service. USGovernment Printing Office, Washington
Vermeiren K, Van Rompaey A, Loopmans M, Serwajja E, Mukwaya P (2012) Urban growth of Kampala,Uganda: pattern analysis and scenario development. Landsc Urban Plan 106(2):199–206. doi:10.1016/j.landurbplan.2012.03.006
Wang JA, Shi PJ, Yi XS, Jia HC, Zhu LY (2008) The regionalization of urban natural disasters in China. NatHazards 44(2):169–179. doi:10.1007/s11069-006-9102-1
Wang J, Chen Y, Shao X, Zhang Y, Cao Y (2012) Land-use changes and policy dimension driving forces inChina: present, trend and future. Land Use Policy 29(4):737–749. doi:10.1016/j.landusepol.2011.11.010
Weng QH (2001) Modeling urban growth effects on surface runoff with the integration of remote sensingand GIS. Environ Manag 28(6):737–748. doi:10.1007/s002670010258
Wu FL (2002) Calibration of stochastic cellular automata: the application to rural-urban land conversions.Int J Geogr Inf Sci 16(8):795–818. doi:10.1080/13658810210157769
Xiang WN, Clarke KC (2003) The use of scenarios in land-use planning. Environ Plan 30(6):885–909Xiang WN, Stuber RMB, Meng XC (2011) Meeting critical challenges and striving for urban sustainability
in China. Landsc Urban Plan 100(4):418–420. doi:10.1016/j.landurbplan.2011.02.018Yu KJ (2005) Negative approach. China Architecture and Building Press, BeijingYusuf S, Saich T (2008) China urbanizes: consequences, strategies, and policies. The World Bank,
Washington DCZhang H, Wang XR (2007) Land-use dynamics and flood risk in the hinterland of the Pearl River Delta: the
case of Foshan City. Int J Sustain Dev World Ecol 14(5):485–492Zhang H, Ma WC, Wang XR (2008) Rapid urbanization and implications for flood risk management in
hinterland of the Pearl River Delta, China: the Foshan study. Sensors 8(4):2223–2239. doi:10.3390/s8042223
Zheng J, Fang WH, Shi PJ, Zhuo L (2009) Modeling the impacts of land use change on hydrologicalprocesses in fast urbanizing region—A case study of the Buji watershed in Shenzhen City. Chin J NatResour 09:1560–1572
Zhou HJ, Shi PJ, Wang JA, Yu DY, Gao L (2011) Rapid Urbanization and Implications for River EcologicalServices Restoration: case Study in Shenzhen, China. J Urban Plan Dev 137(2):121–132. doi:10.1061/(Asce)Up.1943-5444.0000051
Nat Hazards
123
Copyright © 2022 FDOKUMEN

