


Bahasa
Halaman
Hukum


A Comparison of Screening Methods for Sleep Disordersin Australian Community Pharmacies: A RandomizedControlled TrialJoanne M. Fuller1,2*, Keith K. Wong3,2,4, Ronald Grunstein3,2,4, Ines Krass1, Jayshree Patel1,
Bandana Saini1,2
1 Faculty of Pharmacy, The University of Sydney, Sydney, NSW, Australia, 2 The Centre for Integrated Research and Understanding of Sleep (CIRUS), The University of
Sydney, Sydney, NSW, Australia, 3 Royal Prince Alfred Hospital, Sydney, NSW, Australia, 4 The Woolcock Institute of Medical Research, The University of Sydney, Sydney,
NSW, Australia
Abstract
Background: Community pharmacies may potentially assist in screening for chronic conditions such as sleep disorders,which remain both under-diagnosed and untreated. We aimed to compare a subjective risk-assessment-only questionnaire(RAO) for common sleep disorder screening against the same risk-assessment questionnaire plus a nasal flow monitor as anobjective marker of possible underlying obstructive sleep apnea (OSA) (RA+) in a community pharmacy setting. The primaryoutcome was the number of participants identified in RAO or RA+ group who were likely to have and consequently bediagnosed with OSA. Further outcomes included the number of participants identified as being at risk for, referred for,taking-up referral for, and then diagnosed with OSA, insomnia, and/or restless legs syndrome (RLS) in either group.
Methods: In a cluster-randomized trial, participants were recruited through 23 community pharmacies. Using validatedinstruments, 325 (RAO = 152, RA+ = 173) participants were screened for OSA, insomnia, and RLS.
Findings: 218 (67%) participants were at risk of OSA, insomnia or RLS and these participants were referred to their primaryphysician. The proportion of screened participants identified as being at risk of OSA was significantly higher in the RA+group (36% in RAO vs. 66% in RA+, OR 3.4, 95% CI (1.8–6.5), p,0.001). A 12-month follow-up was completed in 125 RAOand 155 RA+ participants. Actual referral uptake was 34% RAO, 26% RA+, OR 4.4, 95% CI (1.4–19.2), p = 0.31. The OSAdiagnosis rate was higher in the RA+ arm (p = 0.01). To yield a single additional confirmed OSA diagnosis, 16 people wouldneed to be screened using the RA+ protocol.
Conclusions: These results demonstrate that utilising either screening method is feasible in identifying individuals in thecommunity pharmacy setting who are likely to have OSA, insomnia and/or RLS. Secondly, adding an objective marker ofOSA to a questionnaire-based prediction tool resulted in more confirmed OSA diagnoses.
Trial Registration: : ACTR.org.au ACTRN12608000628347
Citation: Fuller JM, Wong KK, Grunstein R, Krass I, Patel J, et al. (2014) A Comparison of Screening Methods for Sleep Disorders in Australian CommunityPharmacies: A Randomized Controlled Trial. PLoS ONE 9(6): e101003. doi:10.1371/journal.pone.0101003
Editor: Hamid Reza Baradaran, Iran University of Medical Sciences, Islamic Republic of Iran
Received February 20, 2013; Accepted May 27, 2014; Published June 30, 2014
Copyright: � 2014 Fuller et al. This is an open-access article distributed under the terms of the Creative Commons Attribution License, which permitsunrestricted use, distribution, and reproduction in any medium, provided the original author and source are credited.
Funding: This study was performed at the Faculty of Pharmacy, The University of Sydney, NSW, Australia, with the financial support of the AustralianGovernment Department of Health and Ageing through The Pharmacy Guild of Australia’s Fourth Community Pharmacy Agreement Research & Developmentscheme. The funded study was undertaken by independent researchers and, therefore, the views, hypotheses and subsequent findings of the research are notnecessarily those of the Pharmacy Guild of Australia. Prof. Grunstein is a recipient of the NHMRC Practitioner Fellowship. Dr. Wong, Dr. Saini and Prof. Grunsteinare investigators of CIRUS, the NHMRC Centre for Interdisciplinary Sleep Health (funding through NHMRC Grants 264598 and 571241). Ms. Fuller is a PhD Scholarsupported through the Faculty of Pharmacy and CIRUS. The funders had no role in study design, data collection and analysis, decision to publish, or preparationof the manuscript.
Competing Interests: Prof. Ron Grunstein has been a scientific advisor to DiagnoseIT, the manufacturer of the nasal flow monitor devices used in this study. Allother authors have declared that no competing interests exist. This does not alter the authors’ adherence to all the PLOS ONE policies on sharing data andmaterials.
* Email: [email protected]
Introduction
Sleep disorders remain both under-diagnosed and untreated
despite being highly prevalent and imposing substantial burden in
the developed world [1–2]. In Australia, published data indicates
that sleep disorders affect 1.5 million individuals (8.9%) and result
in a total estimated cost of $AUD36.4 billion [2]. Common sleep
disorders affecting Australians comprise obstructive sleep apnea
(OSA) (4.7%), primary insomnia (3%), and restless legs syndrome
(RLS) (1.2%) [2]. Furthermore, sleep disorders are commonly
associated with other major medical problems [3–4] and therefore
present more frequently in the primary health care population.
Sleep disturbances, such as those caused by obstructive sleep
apnea (OSA) and insomnia, are associated with increased
PLOS ONE | www.plosone.org 1 June 2014 | Volume 9 | Issue 6 | e101003

likelihood of cardiovascular disease, diminished quality of life, and
increased all-cause mortality risk, and are now considered one of
the top 10 potentially modifiable cardiovascular disease risk factors
[1,5–8]. Early recognition and treatment of common sleep
disorders could therefore help minimize significant health, social
and fiscal consequences [9]. With heightening public awareness of
sleep disorders, concern has been raised about inadequate
diagnostic and therapeutic capacity in the community [10]. This
supply-demand mismatch drives the need to explore alternative
approaches to facilitate earlier diagnosis including alternatives to
the standard diagnostic tests [1].
Research in alternative diagnostic pathways or screening
protocols for common sleep disorders has focused on specialist
sleep clinics, or more recently, in primary care [10]. However,
many people with sleep disorders do not seek help from a
physician, but choose to self-medicate [11]. Hence, other settings
accessed by those who do not engage with the medical system,
need to be considered. Community pharmacists represent a
primary healthcare resource with unrealized capacity to contribute
to health promotion and screening through collaboration with
physicians. In the United Kingdom, community pharmacy is
recognized as a ‘‘valuable and trusted public health resource’’ with
several preventative and public health programs delivered through
pharmacies [12]. Furthermore, pharmacy based screening pro-
grams for various chronic diseases have been shown to be effective
[13–15]. However, there are very few published studies on
pharmacy-based screening for sleep disorders. A Swiss question-
naire-based sleep disorder screening program identified 26% of
the screened population as being at risk of having a sleep disorder
[16]. Those identified at risk in the study were consequently
referred to a physician by trained community pharmacists [16].
Another questionnaire-based screening tool (Pharmacy Tool for
Assessment of Sleep Health (PTASH)) was recently piloted in five
Australian pharmacies and shown to be feasible in screening for
the most common sleep disorders [17]. This questionnaire
targeted three prevalent disorders (restless legs syndrome (RLS),
OSA, and insomnia), and utilized validated instruments i.e. the
Epworth Sleepiness Scale (ESS) [18], Insomnia Severity Index
(ISI) [19], Multivariable Apnea Prediction Index (MAPI) [20], and
the NIH Restless legs syndrome workshop diagnostic criteria [21].
Using this composite questionnaire, the study assessed sleep
disorder risk in a small sample of 85 patients recruited through
community pharmacies in Sydney, Australia. Results indicated
that 33.3%, 21.4%, and 27.4% of those screened were likely to
have insomnia, OSA, and RLS respectively [17].
Neither of these pharmacy-based screening programs explored
outcomes in terms of the proportion of screened population that
was subsequently diagnosed by medical practitioners. Moreover,
both previous studies only used a subjective assessment of sleep
disorder likelihood. Simplified measures for OSA risk screening
such as portable nasal flow monitors may offer community
pharmacists an accurate but low cost method of objective risk
assessment [22–23]. Objective measures for sleep disorders have
not been studied in community pharmacy to our knowledge,
however other objective measures have been employed in
pharmacy based screening studies for cardiovascular risk and
osteoporosis conducted in pharmacy populations [15,24]. Apart
from added accuracy [25], an objective measure may be more
likely to influence patients and health care professionals to act
upon the results of such a test [14]. However to date, simplified
and relatively inexpensive (when compared to PSG) objective
measures are only available for OSA assessment. Insomnia and
RLS are typically assessed in primary care with subjective
measures only.
In order to test the utility of adding an objective test to
community pharmacy screening for sleep disorders, we compared
two screening strategies: a subjective risk assessment only (RAO)
protocol (using the PTASH questionnaire cited above [17]) versus
a risk assessment plus objective marker of possible underlying OSA
(RA+). (For the purposes of this study, the term ‘at risk’ pertains to
those participants who are likely to have any of the sleep disorders
being screened for.) Since the objective marker in the RA+ arm
pertained to OSA only, we hypothesized that of the total patients
screened in both groups, the RA+ group would have a higher total
number of patients identified as being at risk of OSA and also
diagnosed with OSA. This was the primary outcome. In addition,
we expected that the RA+ group would report higher rates of
being referred and taking up their referral. Other outcomes of
interest included the number of patients identified as being at risk
for OSA, insomnia and/or RLS, as well as the number of patients
who were subsequently diagnosed with any of the three sleep
disorders.
Methods and Materials
Ethics statementAll procedures were approved by the Human Research Ethics
Committee at the University of Sydney (reference: 06-2008/
10765, see additional supporting information). Written informed
consent was obtained from all participants. The trial was listed on
the Australian and New Zealand Clinical Trials Register
(ACTRN12608000628347). See https://www.anzctr.org.au/Trial/
Registration/TrialReview.aspx?ACTRN = 12608000628347
Study designThe study was a cluster randomized controlled trial, with
individual pharmacists randomized to deliver one of two
interventions to their patients. The supporting CONSORT
checklist is available as supporting information; see Checklist S1.
The study was not set-up as a diagnosis accuracy study as diagnosis
does not fall within the pharmacy practitioner role.
Pharmacist recruitmentA purposively selected sample of community pharmacies
supplying sleep apnea devices was constructed from distributor
lists of continuous positive airway pressure (CPAP) manufacturers;
this comprised the total sampling frame. The pharmacies were
categorised as either urban or non-urban, based on the proximity
(i.e. being within a 100 km radius) of each pharmacy location to an
urban centre (defined as a centre with a population of greater than
200,000 inhabitants). After recruiting all pharmacists (pharmacies)
who were willing to participate in the project, a randomisation
sequence was generated using a block size of 2 (urban/non-urban
pharmacies), list length of 24, and an allocation ratio of 1:1 into
either RAO or RA+ groups. The participating pharmacies were
allocated to either the RAO or the RA+ group based on the
sequence. Over a two-day workshop run by the research team, all
recruited pharmacists were trained in basic sleep disorder issues,
identifying patients with risk factors for sleep disorders, providing
those at risk with appropriate referral/counselling, and in using
the research protocol. The RAO and RA+ groups were trained
separately in research protocol with the RA+ group receiving
additional training on procedures for the portable monitor testing.
This was in line with the cluster randomisation to preserve
treatment fidelity and to ensure a consistent intervention would be
applied to all recruited patients without any cross contamination.
Screening for Sleep Disorders in Pharmacies
PLOS ONE | www.plosone.org 2 June 2014 | Volume 9 | Issue 6 | e101003

Patient recruitmentPatients were recruited by pharmacists over a four-month
period, and were included if they were aged 18 years or above, not
undergoing treatment for any sleep disorder, physically able to
complete the screening in the pharmacist’s opinion, fluent in
English, and able to provide written consent. Patients were
recruited either when requesting non-prescription products for
sleep or information relating to sleep health, or when identified by
the trained pharmacists as having possible risk factors for a sleep
disorder, or in response to promotional materials.
Screening protocolThe development and pilot testing of the PTASH screening tool
has been described elsewhere [17]. The PTASH questionnaire
screens participants for being at risk of OSA, insomnia and/or
RLS. The PTASH questionnaire also collects lifestyle, medical
status, medication use and demographic information as these
factors have been shown to influence sleep health. All participants
were screened as described below, with the full study protocol
available as Protocol S1, and illustrated in Figure 1.
In the RAO group, following application of the screening
protocol (see Protocol S1), a ‘risk score’ for each of the three sleep
disorders targeted by the PTASH screening tool was calculated,
and the appropriate intervention (written information provision,
in-depth counselling and physician referral) was implemented by
the pharmacist. A participant that scored 17 or more on the ESS
would be counselled by the pharmacist and/or referred to their
physician as needed. All participants that scored 1 to 3 on question
8 of the ESS were referred to their physician. A participant that
scored 0.5 or more on the MAPI survey was referred to their
physician and counselled as needed by the pharmacist. A
participant that scored 3 on the NIH Restless legs syndrome
workshop diagnostic criteria was referred to their physician and
counselled as needed by the pharmacist. In the RA+ group,
patients were additionally asked to use a type 4 portable nasal flow
monitor (FlowWizard, DiagnoseIT, Sydney, Australia) at home for
three consecutive nights to provide an objective measure of OSA
risk [22–23]. The flow monitor has been validated as a home test
for OSA, in patients seen in the primary care setting. An Apnea-
Hypopnea Index (AHI) from the portable monitor of greater than
18 (for the RA+ group) or the risk scores calculated from the
PTASH screening tool, were used by the pharmacist to determine
need for referral to a physician.
A letter, based on a template including questionnaire scores and
their interpretation, was given to all referred patients by the
pharmacist, with a recommendation that it be taken to their
primary care physician for a medical evaluation.
Sample sizeThe sample size was based on the study by Hersberger et. al.
where 26% of the study population screened in community
pharmacy settings in Switzerland were ‘at risk’ for a sleep disorder
[16]. We assumed that in the RA+ group, the proportion of
patients identified and referred would be equivalent to the Swiss
study i.e. 26%, and that in the RAO group, with no objective
measure, the proportion of people identified with a sleep disorder
would be 50% lower, i.e. 13%. To detect a 13% point difference in
referral rate between the RAO, and RA+ screening groups, with
80% power and significance level of 0.05, 114 patients were
required in each group. Allowing for a 20% withdrawal rate, 143
patients per group were estimated to be required. We then applied
a design effect correction. Given our experience of negligible
design effect in other clustered trials within Australian community
pharmacies, 0.004 was arbitrarily used as an estimate of the Intra
Cluster Correlation coefficient (ICC) for our cluster based
protocol. This value of 0.004 was also the lower end of ICC
values observed in many clinical trials [26]. The correction factor
was then calculated using a cluster size of 10 (as all pharmacies
were requested to screen at least 10 patients), and the arbitrarily
estimated intra-cluster correlation coefficient of 0.004 (1+(102
1)*0.004 = 1.036) [26], resulting in a desired size of 148 patients
per group.
Data analysesStatistical analyses were conducted using SPSS TM version 18.0
and R (www.r-project.org) [27]. For continuous outcomes, linear
mixed models analyses were conducted with SPSS TM. Fixed
effects were entered as the group (RAO or RA+), and the model
included a random intercept, grouped by the cluster variable (each
individual pharmacy). The difference between the RAO and RA+,
adjusted for the effect of clustering, was thus derived from the
model, with 95% confidence limits and p-values. For binary
outcome variables, raw proportions are quoted for each group
(ignoring clustering), and then the differences between the two
interventions adjusted for clustering are analysed with generalised
linear mixed models with a logit link, using the lme4 function in R,
and presented as odds ratios for the RA+ group relative to RAO,
95% confidence limits and a p value. Statistical significance was
determined by a p,0.05.
Diagnostic characteristics of the screening tool:Polysomnography (PSG sub-study)
Furthermore, a subset of 20 randomly selected RA+ patients
underwent fully attended overnight PSG to assess diagnostic
characteristics of the questionnaire screening tool and portable
monitor in predicting OSA risk in the community pharmacy
setting. The PSG sub-study was intended as an internal check, to
evaluate if the screening procedure resulted in a large number of
false positives. The number of 20 patients to be studied was
determined by the limited funds and personnel resources available.
These 20 patients were selected from a sampling frame of the
overall study patients who were located in the metropolitan
Sydney area, so that all could attend PSG testing in a central
accredited facility. This sub-study was not sufficiently powered to
make comparisons in performance between the two screening
methods (questionnaire vs. portable monitoring). A sample size of
60–100 would have been required, for example, to detect
differences in sensitivity or specificity of 0.2, with 80% power
and significance level of 0.05, assuming the sensitivity or specificity
of the better test was between 0.6–0.9.
Results
Pharmacy recruitment and randomizationTwenty-three of 35 pharmacies approached consented to
participate; 12 were allocated to the ‘risk assessment only’
(RAO) group and 11 into the ‘risk assessment plus’ overnight
nasal flow-monitoring (RA+) group. Two pharmacies from the
RA+ group withdrew, and one from the RAO group withdrew (all
metropolitan) due to staffing problems. Sixty percent of the
completing pharmacies were non-metropolitan (RAO = 7, RA+= 5). As an indication of the activity level of the participating
pharmacies, dispensing levels were at par with national averages
[28]. Although exact comparison of pharmacy by group type were
not conducted, most pharmacies in Australia that supply CPAP
are usually larger in size and staff levels [29].
Screening for Sleep Disorders in Pharmacies
PLOS ONE | www.plosone.org 3 June 2014 | Volume 9 | Issue 6 | e101003

Participant characteristics & follow-upThe CONSORT ‘Participant Flow Diagram’ is shown in
Figure 2. Twelve pharmacies in the RAO group recruited 152
participants, while 11 pharmacies in the RA+ group recruited 173
patients. Patient recruitment rate in the RAO (46.7%, 152/325)
and the RA+ (51.9%, 173/333) were quite similar. The majority of
participants were identified by pharmacists based on risk factors
(n = 201) with a further 49 participants self-selecting (that is,
approaching pharmacy staff about the project after seeing project
promotional materials). The method of participant identification
was not recorded by 23% of pharmacists. Two hundred and eighty
patients overall (86%) completed follow-up at 12 months to assess
the rate of uptake of referrals and referral outcome. Table 1 shows
general demographic and sleep characteristics for the screened
population. We tested for any between group differences that may
have existed at baseline and found there were no significant
differences between the two groups in age, gender, employment,
percentage working shifts, diagnosis of hypertension, ethnicity,
alcohol or caffeine or tobacco consumption. There were no
significant differences in questionnaire-assessed risk of insomnia,
OSA or RLS. Mean ISI score was not significantly different
between the two intervention groups, nor was the proportion with
a score of 15 or more which indicates higher risk of insomnia,
(RA+ group 40.5% (69/173) vs. RAO group 27.3% (41/152), OR
2.2, 95% CI 0.89–6.0, p = 0.08).
Screening outcomes for sleep disorders riskAll patients identified as at risk were provided with referrals to
their primary care physician for further evaluation. The RA+group (79%, 136/173) had a significantly higher rate of being
identified as being ‘at risk’ of having any sleep disorder and being
referred as per protocol compared to the RAO group (54%, 82/
152, OR 3.22, 95% CI 1.7–6.3 p,0.0001). The proportion of
screened patients identified as being at risk of having OSA was also
Figure 1. Project protocol for recruitment, screening, and referral and/or counselling of participants according to risk scores. Riskscores were obtained from the PTASH screening questionnaire and the FlowWizard (as an objective marker of SDB). a Clinical cut-off [22–23] RA+ =Risk Assessment Plus, FW = FlowWizard (nasal flow monitor) ESS = Epworth Sleepiness Scale ISI = Insomnia Severity Index MAPI = Multivariate SleepApnea Prediction Index RLS = Restless Legs Syndrome Info = provision of sleep disorder specific written information AHI = Apnea Hypopnoea IndexPTASH = Pharmacy Tool for Assessment of Sleep Health SDB = sleep disordered breathing.doi:10.1371/journal.pone.0101003.g001
Screening for Sleep Disorders in Pharmacies
PLOS ONE | www.plosone.org 4 June 2014 | Volume 9 | Issue 6 | e101003

significantly higher in the RA+ group (36% (54/152) in RAO vs.
66% (114/173) in RA+, OR 3.4, 95% CI 1.8–6.5 p,0.0001).
While OSA risk was determined by questionnaire alone in the
RAO group, in the RA+ group, patients were classified as at risk of
OSA by either questionnaire or flow monitor, and consequently an
additional 38 patients were classified as at risk of OSA (see figure 2)
through testing with the flow monitor over what the questionnaire
identified. The number of patients identified at risk for insomnia
or RLS are shown in Figure 2. The mean time taken to complete
the screening was longer in the RAO arm (12.769.0 minutes)
compared to the RA+ arm (10.664.5 minutes). Using a linear
mixed model approach, the estimated difference between the
groups adjusting for the effect of clustering was 2.14 minutes (95%
CI 20.44–4.7), and was not significant (p = 0.099). The overall
mean time spent in questionnaire completion was 11.667.0
minutes.
Follow-up outcomesThere was a slightly higher proportion of those who completed
follow-up in the RA+ (90%, 155/173) compared with the RAO
Figure 2. CONSORT diagram showing participant flow throughout the study. a Participants may be classified as at risk of more than onecondition. b Comprises n = 76 identified by questionnaire and additional 38 identified by flow monitor AHI$18 alone in the RA+ group. Comparisonbetween groups: c number at risk of a sleep disorder as identified by pharmacist as a proportion of number screened, OR 3.2, 95% CI 1.7–6.3,
p = 0.0009. d follow-up completed as proportion of number screened OR 1.6, 95% CI 0.54–4.5, p = 0.39. e Participants who report being referred asproportion of number referred, in those completing follow-up, OR 1.3, 95% CI 0.69–2.7, p = 0.40. f Participants who report taking up referral (i.e.actually seeing their medical practitioner) as proportion of those referred and completing follow-up, OR 0.65, 95% CI 0.26–1.6, p = 0.31. g Participantsdiagnosed as proportion of numbers screened, OR 2.7, 95% CI 1.1–7.5, p = 0.03.doi:10.1371/journal.pone.0101003.g002
Screening for Sleep Disorders in Pharmacies
PLOS ONE | www.plosone.org 5 June 2014 | Volume 9 | Issue 6 | e101003

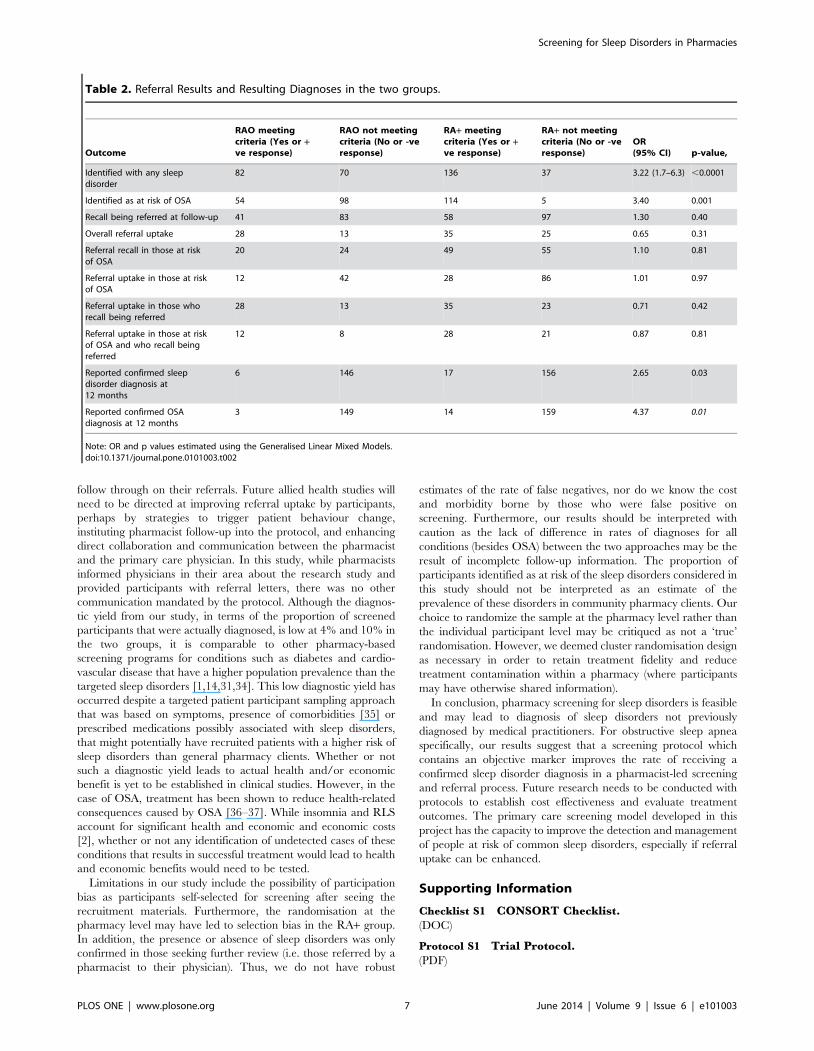
(82%, 125/152, OR 1.6, 95% CI 0.54–4.5, p = 0.39). Information
about referral uptake and final diagnosis rates at 12 months are
included in Table 2. Neither the referral recall nor uptake rates
were significantly different between groups. Both the overall
diagnoses and OSA diagnoses were significantly higher in the RA+group. Approximately 16 patients would need to be screened (95%
Confidence Interval (CI) for number needed to screen ranged
from 9.3–67.0) with the flow monitor as part of the RA+ protocol
to yield an additional confirmed diagnosis of OSA.
Diagnostic characteristics of the screening tool: PSG sub-study
The PSG sub-study results for 20 randomly selected RA+patients showed, with respect to a gold standard diagnosis of OSA
defined as an apnea-hypopnea indeed of 5 or greater, that for the
flow monitor (using the threshold of 18 events/hour), sensitivity
was 0.78% (95% CI 0.40–0.96), specificity 0.67% (0.31–0.91),
positive predictive value 0.70 (0.35–0.92), negative predictive value
0.75 (0.36–0.96) and the area under the receiver operating
characteristic curve was 0.82. Thus two out of 8 participants who
tested negative on the flow monitor were found to have OSA on
their PSG. Using a threshold of 0.5 on the MAP index, we found a
sensitivity of 0.22 (95% CI 0.04–0.60), specificity of 0.67 (0.31–
0.91), positive predictive value 0.40 (0.07–0.83), negative predic-
tive value 0.46 (0.20–0.74), and area under the ROC 0.37. Seven
out of 13 patients (53%) who were classified as low risk of OSA on
the MAPI were found to have OSA using their PSG. The study
was not adequately powered to test for diagnostic accuracy
differences between the two screening methods.
Discussion
We compared the outcomes of two screening protocols for sleep
disorders in the community pharmacy setting. As hypothesized, a
protocol that includes an objective marker in the form of simple
nasal flow monitoring, led to more patients being identified,
referred and ultimately diagnosed with OSA, compared with one
based on a questionnaire assessment only. A high proportion of
pharmacy screened participants were at risk of a sleep disorder.
Despite being given a written referral using a proforma referral
letter, subject recall of being provided with referral was limited to a
third of those referred irrespective of the method of screening.
Actual recalled referral uptake was reported by a quarter of those
who reported having been referred in either group. However of
those participants who were referred, and who followed-up on the
referral, a third were diagnosed with a sleep disorder. The results
demonstrate the potential of community pharmacy as a novel
primary healthcare venue where those ‘at risk of ’ and likely to
have a common sleep disorder can be identified although methods
of improvement in referral uptake need to be investigated.
Our hypothesis proposed a significant difference between the
RAO group and the RA+ group, in terms of actual OSA
diagnosis, as was the case. The rate at which participants identified
as being at risk of OSA in the RA+ group took up their referral (by
seeing their medical practitioner) was no higher than in the RAO
group. Hence, the significantly higher rate of diagnosis in the RA+group might be explained by a combination of a higher proportion
being classified as at-risk and referred in the RA+ arm. An
additional explanatory factor may be that the results from the
objective sleep apnea test were more likely to influence the
physician to initiate further investigations. Previous studies in other
diseases have shown that the addition of a specific objective
marker has enhanced the rate of diagnosis at the physician level
[30–33].
Participant recall of referral was low, despite participants being
provided computer generated referral letters which summarized
the results to take to their primary care physician. Poor referral
uptake has previously been shown in research conducted in the
pharmacy setting [33] proving that our study is also reflective of
‘real-life’ clinical practice in which not all referred participants
Table 1. General Demographics and Sleep Characteristics in the two groups.
CharacteristicRAO groupn = 152
RA+ groupn = 173
Cluster-adjusted difference betweengroups, Mean or Odds Ratio(95% CI value)
p value (betweengroup comparisons)
Mean Age 6 SD 55.5616.7 54.4 615.1 1.21(25.4 27.8) 0.71
% Male 46.7 47.9 0.05 0.82
Mean BMI6SD 29.765.4 29.967.0 0.06(22.8 22.9) 0.96
Sleepiness (ESS) % ESS.10 18.1 28.0 4.4 0.05
Mean ESS6SD ESS score range 0–24 5.664.2 7.064.8 21.4(22.8 20.09) 0.06
Insomnia (ISI) % ISI$15 27.3 40.5 6.2 0.01
Mean ISI Score 6 SD ISI Score range 0–28 10.766.9 12.166.9 22.0 (25.321.2) 0.21
Sleep apnea risk (MAPI) % MAPI $0.5 37.0 44.1 1.7 0.20
Mean MAPI 6 SD MAPI probability range 0–1 0.4160.3 0.4360.3 20.02(20.1020.06) 0.65
At risk of RLS (RLS minimum question set) %responding ‘Yes’ to questions 1–3
42.6 46.6 0.45 0.54
Mean RLS Score 6 SD, RLS Score Range 0–3 1.561.4 1.661.4 20.30(20.97 20.37) 0.36
% Sleeping alone 37.5 45.1 1.91 0.18
% Undertaking shift work 11.3 9.3 1.5 0.46
% Consuming caffeine after 1500 hours 67.8 64.0 0.49 0.54
% Consuming alcohol after 2000 hours 50 54.2 0.46 0.53
Self reported average hours of sleep 6.4661.7 6.3661.7 0.19(20.40–0.80) 0.51
doi:10.1371/journal.pone.0101003.t001
Screening for Sleep Disorders in Pharmacies
PLOS ONE | www.plosone.org 6 June 2014 | Volume 9 | Issue 6 | e101003
follow through on their referrals. Future allied health studies will
need to be directed at improving referral uptake by participants,
perhaps by strategies to trigger patient behaviour change,
instituting pharmacist follow-up into the protocol, and enhancing
direct collaboration and communication between the pharmacist
and the primary care physician. In this study, while pharmacists
informed physicians in their area about the research study and
provided participants with referral letters, there was no other
communication mandated by the protocol. Although the diagnos-
tic yield from our study, in terms of the proportion of screened
participants that were actually diagnosed, is low at 4% and 10% in
the two groups, it is comparable to other pharmacy-based
screening programs for conditions such as diabetes and cardio-
vascular disease that have a higher population prevalence than the
targeted sleep disorders [1,14,31,34]. This low diagnostic yield has
occurred despite a targeted patient participant sampling approach
that was based on symptoms, presence of comorbidities [35] or
prescribed medications possibly associated with sleep disorders,
that might potentially have recruited patients with a higher risk of
sleep disorders than general pharmacy clients. Whether or not
such a diagnostic yield leads to actual health and/or economic
benefit is yet to be established in clinical studies. However, in the
case of OSA, treatment has been shown to reduce health-related
consequences caused by OSA [36–37]. While insomnia and RLS
account for significant health and economic and economic costs
[2], whether or not any identification of undetected cases of these
conditions that results in successful treatment would lead to health
and economic benefits would need to be tested.
Limitations in our study include the possibility of participation
bias as participants self-selected for screening after seeing the
recruitment materials. Furthermore, the randomisation at the
pharmacy level may have led to selection bias in the RA+ group.
In addition, the presence or absence of sleep disorders was only
confirmed in those seeking further review (i.e. those referred by a
pharmacist to their physician). Thus, we do not have robust
estimates of the rate of false negatives, nor do we know the cost
and morbidity borne by those who were false positive on
screening. Furthermore, our results should be interpreted with
caution as the lack of difference in rates of diagnoses for all
conditions (besides OSA) between the two approaches may be the
result of incomplete follow-up information. The proportion of
participants identified as at risk of the sleep disorders considered in
this study should not be interpreted as an estimate of the
prevalence of these disorders in community pharmacy clients. Our
choice to randomize the sample at the pharmacy level rather than
the individual participant level may be critiqued as not a ‘true’
randomisation. However, we deemed cluster randomisation design
as necessary in order to retain treatment fidelity and reduce
treatment contamination within a pharmacy (where participants
may have otherwise shared information).
In conclusion, pharmacy screening for sleep disorders is feasible
and may lead to diagnosis of sleep disorders not previously
diagnosed by medical practitioners. For obstructive sleep apnea
specifically, our results suggest that a screening protocol which
contains an objective marker improves the rate of receiving a
confirmed sleep disorder diagnosis in a pharmacist-led screening
and referral process. Future research needs to be conducted with
protocols to establish cost effectiveness and evaluate treatment
outcomes. The primary care screening model developed in this
project has the capacity to improve the detection and management
of people at risk of common sleep disorders, especially if referral
uptake can be enhanced.
Supporting Information
Checklist S1 CONSORT Checklist.
(DOC)
Protocol S1 Trial Protocol.
(PDF)
Table 2. Referral Results and Resulting Diagnoses in the two groups.
Outcome
RAO meetingcriteria (Yes or +ve response)
RAO not meetingcriteria (No or -veresponse)
RA+ meetingcriteria (Yes or +ve response)
RA+ not meetingcriteria (No or -veresponse)
OR(95% CI) p-value,
Identified with any sleepdisorder
82 70 136 37 3.22 (1.7–6.3) ,0.0001
Identified as at risk of OSA 54 98 114 5 3.40 0.001
Recall being referred at follow-up 41 83 58 97 1.30 0.40
Overall referral uptake 28 13 35 25 0.65 0.31
Referral recall in those at riskof OSA
20 24 49 55 1.10 0.81
Referral uptake in those at riskof OSA
12 42 28 86 1.01 0.97
Referral uptake in those whorecall being referred
28 13 35 23 0.71 0.42
Referral uptake in those at riskof OSA and who recall beingreferred
12 8 28 21 0.87 0.81
Reported confirmed sleepdisorder diagnosis at12 months
6 146 17 156 2.65 0.03
Reported confirmed OSAdiagnosis at 12 months
3 149 14 159 4.37 0.01
Note: OR and p values estimated using the Generalised Linear Mixed Models.doi:10.1371/journal.pone.0101003.t002
Screening for Sleep Disorders in Pharmacies
PLOS ONE | www.plosone.org 7 June 2014 | Volume 9 | Issue 6 | e101003

Acknowledgments
The researchers would like to thank all the pharmacists and patients that
participated in this study. The researchers would also like to thank the
Australian Government Department of Health and Ageing for funding
provided through The Pharmacy Guild of Australia’s Fourth Community
Pharmacy Agreement Research & Development scheme. The funded study
was undertaken by independent researchers and therefore, the views,
hypotheses and subsequent findings of the research are not necessarily
those of the Pharmacy Guild.
Author Contributions
Conceived and designed the experiments: KW RG IK BS. Performed the
experiments: JF JP. Analyzed the data: JF KW BS. Wrote the paper: JF
KW IK RG BS.
References
1. Committee on Sleep Medicine and Research (2006) Sleep Disorders and SleepDeprivation: An Unmet Public Health Problem. Washington: Institute of
Medicine.2. Deloitte Access Economics (2011) Re-awakening Australia. The economic cost
of sleep disorders in Australia, 2010. Sleep Health Foundation
3. Dikeos D, Georgantopoulos G (2011) Medical comorbidity of sleep disorders.Curr Opin Psych 24:346–354.
4. Skaer TL, Sclar DA (2010) Economic implications of sleep disorders.Pharmacoeconomics 28(11):1015–1023.
5. Gottlieb DJ, Yenokyan G, Newman AB, O’Connor GT, Punjabi NM, et al.
(2010) Prospective study of obstructive sleep apnea and incident coronary heartdisease and heart failure: the sleep heart health study. Circulation 122:352–360.
6. Young T, Finn L, Peppard PE, Szklo-Coxe M, Austin D, et al. (2008) Sleepdisordered breathing and mortality: eighteen-year follow-up of the Wisconsin
sleep cohort. Sleep 31:1071–1078.7. Marshall NS, Wong KK, Liu PY, Cullen SRJ, Knuiman MW, et al. (2008) Sleep
apnea as an independent risk factor for all-cause mortality: the Busselton Health
Study. Sleep 31:1079–1085.8. Laugsand LE, Vatten LJ, Platou C, Janszky I (2011) Insomnia and the Risk of
Acute Myocardial Infarction: A Population Study. Circulation 124:2073–2081.9. AlGhanim N, Comondore VR, Fleetham J, Marra CA, Ayas NT (2008) The
Economic Impact of Obstructive Sleep Apnea. Lung 186:7–12.
10. Chai-Coetzer CL, Antic NA, Rowland LS, Catcheside PG, Esterman A, et al.(2011) A simplified model of screening questionnaire and home monitoring for
obshructive sleep apnoea in primary care. Thorax 66:213–219.11. Bartlett DJ, Marshall NS, Williams A, Grunstein RR (2008) Predictors of
primary medical care consultation for sleep disorders. Sleep Med 9:857–864.12. Australian Government Department of Health and Ageing: Primary Health
Care Reform in Australia - Report to support Australia’s First National Primary
Health Care Strategy. Element 3: More focussed on preventive care, includingsupport of healthy lifestyles. Available: www.yourhealth.gov.au. Accessed 2011
December 15.13. Baraitser P, Pearce V, Holmes J, Horne N, Boynton PM (2007) Chlamydia
testing in community pharmacies: evaluation of a feasibility pilot in south east
London. Qual Saf Health Care 16:303–307.14. Krass I, Mitchell B, Clarke P, Brillant M, Dienaar R, et al. (2007) Pharmacy
diabetes care program: Analysis of two screening methods for undiagnosed type2 diabetes in Australian community pharmacy. Diabetes Res Clin Pract 75:339–
347.
15. Mangum SA, Kraenow KR, Narducci WA (2003) Identifying at-risk patientsthrough community pharmacy-based hypertension and stroke prevention
screening projects. J Am Pharm 43:50–55.16. Hersberger KE, Renggli VP, Nirkko AC, Mathis J, Schwegler K, et al. (2006)
Screening for sleep disorders in community pharmacies - evaluation of a ccampaign in Switzerland. J Clin Pharm Ther 31:35–41.
17. Tran A, Fuller JM, Wong KK, Krass I, Grunstein R, et al. (2009) The
devleopment of a sleep disorder screening program in Australian communitypharmacies. Pharm World Sci 31:473–480.
18. Johns MW (1991) A new method for measuring daytime sleepiness: the EpworthSleepiness Scale. Sleep 14:540–545.
19. Bastein CH, Vallieres A, Morin CM (2001) Validation of the Insomnia Severity
Index as an outcome measure for insomnia research. Sleep Med 2:297–307.20. Maislin G, Pack AI, Kribbs NB, Smith PL, Schwartz AR, et al. (1995) A survey
screen for prediction of sleep apnea. Sleep 18:158–166.
21. Allen RP, Picchietti D, Hening WA, Trenkwalder C, Walters AS, et al. (2003)
Restless legs syndrome: diagnostic criteria, special considerations, and
epidemiology. A report from the restless legs syndrome diagnosis and
epidemiology workshop at the National Institutes of Health. Sleep Med
4:101–119.
22. Sharwood LN, Elkington J, Stevenson M, Grunstein RR, Meuleners L, et al.
(2012) Assessing sleepiness and sleep disorders in Australian long-distance
commercial vehicle drivers: self-report versus an ‘‘at home’’ monitoring device.
Sleep 35:469–475.
23. Rofail LM, Wong KKH, Unger G, Marks GB, Grunstein RR (2009) The utility
of single nasal airflow pressure transducer in the diagnosis of OSA at home.
Sleep 33:1097–1105.
24. Crockett JA, Taylor SJ, McLeod LJ (2008) Patient responses to an integrated
service, initiated by community pharmacists, for the prevention of osteoporosis.
Int J Pharm Pract 16:65–72.
25. Effective Health Care Program, Comparative Effectiveness Review Number 32
(2011) Diagnosis and treatment of obstructive sleep apnea in adults, 2011.
Agency for Healthcare Research and Quality, Dept of Health & Human
Services, USA.
26. Bland JM (2000) Sample size in guidelines trials. Fam Pract 17:S17–S20.
27. R Development Core Team (2011) R: A language and environment for statitical
computing. R Foundation for Statistical Computing, Vienna, Austria. ISBN 3-
900051-07-0. Available: http://www.R-project.org/.
28. The Pharmacy Guild of Australia (2009) Guild Digest.
29. Hanes CA, Wong KK, Saini B (2014) Clinical services for obstructive sleep
apnea patients in pharmacies: the Australian experience. Int J Clin Pharm.
[Epub ahead of print] PubMed PMID: 24562977.
30. Maiman LA, Hildreth NG, Cox C, Greenland P (1992) Improving referral
compliance after public cholesterol screening. Am J Public Health 82:804–809.
31. Snella KA, Canales AE, Irons BK, Sleeper-Irons RB, Villarreal MC, et al.
(2006) Pharmacy- and community-based screenings for diabetes and cardiovas-
cular conditions in high-risk individuals. J Am Pharm Assoc 46:370–377.
32. Verne JE, Aubrey R, Love SB, Talbot IC, Northover JMA (1998) Population
based randomized study of uptake and yield of screening by flexible
sigmoidoscopy compared with screening by faecal occult blood testing. BMJ
317:182–185.
33. Allen H, Diamandis S, Saini B, Marshall D, Gavagna G, et al. A Collaborative
Screening, Referral and Management Process to Improve Health Outcomes in
Chronic Obstructive Pulmonary Disease (COPD) report no. IIG052, The
Pharmacy Guild of Australia, Canberra. Available: www.pharmacyguild.org.au.
Accessed online 2012 August 23.
34. Australian Institute of Health and Welfare, Australia’s Health 2008. (2008)
Canberra Australia.
35. Alattar M, Harrington JJ, Mitchell MM, Sloane P (2007) Sleep Problems in
Primary Care: A North Carolina Family Practice Research Network (NC-FP-
RN) Study. J Am Board Fam Med 20:365–374.
36. Marin JM, Carrizo SJ, Vincente E, Agusti AGN (2005) Long-term cardiovas-
cular outcomes in men with obstructive sleep apnoea-hypopnea with or without
treatment with continuous positive airway pressure: an observational study.
Lancet 365:1046–1053.
37. George CF (2001) Reduction in motor vehicle collisions following treatment of
sleep apnoea with a nasal CPAP. Thorax 56:508–512.
Screening for Sleep Disorders in Pharmacies
PLOS ONE | www.plosone.org 8 June 2014 | Volume 9 | Issue 6 | e101003
Top Related
Copyright © 2022 FDOKUMEN

