Patient Satisfaction with Community Pharmacies Services
14
International Journal of Environmental Research and Public Health Article Patient Satisfaction with Community Pharmacies Services: A Cross-Sectional Survey from Punjab; Pakistan Muhammad Majid Aziz 1,2,3,4 , Wenjing Ji 1,2,3,4 , Imran Masood 5 , Muhammad Farooq 6 , Muhammad Zubair Malik 7 , Jie Chang 1,2,3,4 , Minghuan Jiang 1,2,3,4 , Naveel Atif 1,2,3,4,8 and Yu Fang 1,2,3,4, * 1 Department of Pharmacy Administration and Clinical Pharmacy, School of Pharmacy, Xi’an Jiaotong University, Xi’an 710061, China; [email protected] (M.M.A.); [email protected] (W.J.); [email protected] (J.C.); [email protected] (M.J.); [email protected] (N.A.) 2 The Center for Drug Safety and Policy Research, Xi’an Jiaotong University, Xi’an 710061, China 3 Global Health Institute, Xi’an Jiaotong University, Xi’an 710061, China 4 Shaanxi Center for Health Reform and Development Research, Xi’an 710061, China 5 Department of Pharmacy, Faculty of Pharmacy and Alternative Medicine, Railway Road Campus, Islamia University, Bahawalpur 63100, Pakistan; [email protected] 6 Faculty of pharmacy, University of Lahore, Lahore 54000, Pakistan; [email protected] 7 Department of Pharmacy, University of Sargodha, University Road Sargodha, Punjab 40100, Pakistan; [email protected] 8 University College of Pharmacy, University of the Punjab, Shahra-i-Quaid-e-Azam, Lahore 54000, Pakistan * Correspondence: [email protected]; Tel.: +86-29-8265-5132 Received: 2 October 2018; Accepted: 3 December 2018; Published: 19 December 2018 Abstract: Purpose: Patient satisfaction can identify specific areas of improvement in community pharmacy services. Currently in Pakistan, no evidence exists in this regard. This study was conducted to determine the needs of patients and the current standards of pharmacies. Methods: A cross-sectional study was conducted between October 2016 and June 2017. A pilot tested questionnaire was used to collected the data from 1088 patients of 544 community pharmacies. Likert scale and one way ANOVA was used to analyze the data. Results: The response rate of community pharmacies was 80% and that of purchasers was 68.1%. The mean age of participants was 35.2 years. The mean overall satisfaction score of participants was 2.78/5.00. Many patients were dissatisfied (1.65/5.00) with parking facilities provided by pharmacies. Pharmacy service time fulfilled the requirements of most patients (4.16/5.00). The counseling person’s good attitude (3.99/5.00) was credited by purchasers. Level of patient satisfaction with the availability of medicines (3.19/5.00), safe storage of medicines in pharmacy stores (3.66/5.00), and quality of medicines (3.41/5.00) were almost moderate. Many patients were very satisfied (4.35/5.00) with readable instructions for their medications. Approximately half of the patients were dissatisfied with the waiting time. Many patients were also dissatisfied (2.28/5.00) with the knowledge of the counseling person. Patients perceived that staff interest in patient recovery (2.24/5.00) was low. No significant difference in level of satisfaction with regard to participant’s characteristics was found. Conclusions: The current study demonstrated a low level of patient satisfaction with regard to community pharmacy services in Pakistan. These services need improvement. Keywords: patient satisfaction; counseling; community pharmacy; dispensing; medicine; services; Pakistan Int. J. Environ. Res. Public Health 2018, 15, 2914; doi:10.3390/ijerph15122914 www.mdpi.com/journal/ijerph
-
Upload
khangminh22 -
Category
Documents
-
view
0 -
download
0
Transcript of Patient Satisfaction with Community Pharmacies Services
International Journal of
Environmental Research
and Public Health
Article
Patient Satisfaction with Community PharmaciesServices: A Cross-Sectional Survey fromPunjab; Pakistan
Muhammad Majid Aziz 1,2,3,4, Wenjing Ji 1,2,3,4, Imran Masood 5, Muhammad Farooq 6,Muhammad Zubair Malik 7, Jie Chang 1,2,3,4, Minghuan Jiang 1,2,3,4, Naveel Atif 1,2,3,4,8 andYu Fang 1,2,3,4,*
1 Department of Pharmacy Administration and Clinical Pharmacy, School of Pharmacy, Xi’an JiaotongUniversity, Xi’an 710061, China; [email protected] (M.M.A.); [email protected] (W.J.);[email protected] (J.C.); [email protected] (M.J.); [email protected] (N.A.)
2 The Center for Drug Safety and Policy Research, Xi’an Jiaotong University, Xi’an 710061, China3 Global Health Institute, Xi’an Jiaotong University, Xi’an 710061, China4 Shaanxi Center for Health Reform and Development Research, Xi’an 710061, China5 Department of Pharmacy, Faculty of Pharmacy and Alternative Medicine, Railway Road Campus, Islamia
University, Bahawalpur 63100, Pakistan; [email protected] Faculty of pharmacy, University of Lahore, Lahore 54000, Pakistan; [email protected] Department of Pharmacy, University of Sargodha, University Road Sargodha, Punjab 40100, Pakistan;
[email protected] University College of Pharmacy, University of the Punjab, Shahra-i-Quaid-e-Azam, Lahore 54000, Pakistan* Correspondence: [email protected]; Tel.: +86-29-8265-5132
Received: 2 October 2018; Accepted: 3 December 2018; Published: 19 December 2018�����������������
Abstract: Purpose: Patient satisfaction can identify specific areas of improvement in communitypharmacy services. Currently in Pakistan, no evidence exists in this regard. This study was conductedto determine the needs of patients and the current standards of pharmacies. Methods: A cross-sectionalstudy was conducted between October 2016 and June 2017. A pilot tested questionnaire was used tocollected the data from 1088 patients of 544 community pharmacies. Likert scale and one way ANOVAwas used to analyze the data. Results: The response rate of community pharmacies was 80% and thatof purchasers was 68.1%. The mean age of participants was 35.2 years. The mean overall satisfactionscore of participants was 2.78/5.00. Many patients were dissatisfied (1.65/5.00) with parking facilitiesprovided by pharmacies. Pharmacy service time fulfilled the requirements of most patients (4.16/5.00).The counseling person’s good attitude (3.99/5.00) was credited by purchasers. Level of patientsatisfaction with the availability of medicines (3.19/5.00), safe storage of medicines in pharmacystores (3.66/5.00), and quality of medicines (3.41/5.00) were almost moderate. Many patientswere very satisfied (4.35/5.00) with readable instructions for their medications. Approximatelyhalf of the patients were dissatisfied with the waiting time. Many patients were also dissatisfied(2.28/5.00) with the knowledge of the counseling person. Patients perceived that staff interest inpatient recovery (2.24/5.00) was low. No significant difference in level of satisfaction with regardto participant’s characteristics was found. Conclusions: The current study demonstrated a low levelof patient satisfaction with regard to community pharmacy services in Pakistan. These servicesneed improvement.
Keywords: patient satisfaction; counseling; community pharmacy; dispensing; medicine;services; Pakistan
Int. J. Environ. Res. Public Health 2018, 15, 2914; doi:10.3390/ijerph15122914 www.mdpi.com/journal/ijerph
Int. J. Environ. Res. Public Health 2018, 15, 2914 2 of 14
1. Introduction
Patient satisfaction is an important humanistic testimony to determine the outcome, serves andsustainability of any health care system [1]. The evidences promulgate that satisfied patients upholdgood relations with their health care providers and adhere to treatment that ultimately lead to betterhealth outcomes. More satisfied patients are persistent in using health care services and values [2].
Patient satisfaction is also a key indicator to comparing the quality of services in different patientcare services, systems, and programs. These indicators are helpful for improving healthcare andfor ensuring higher compliance [3]. It is also a vital tool to monitor the advancement andqualityimprovement in health care delivery systems [4]. Patient satisfaction studies are useful for drawinga baseline when launching new strategies [5]. An appraisal of patients’ satisfaction is necessary tooptimize resource utilization [6]. Many studies have been conducted worldwide to evaluate patientsatisfaction toward community pharmacy services. As this indicator become pivotal marker indeveloped countries, interest in patient satisfaction assessment is growing in developing countries toanalyze the services of community pharmacies [2,6]. Due to difference in performance of communitypharmacies, the patients’ need, perception and satisfaction level also varied in developing countries [5,6].
Similarly, the structure and operating standards of community pharmacies are at an earlytransition state in Pakistan. About 80% of medicines are distributed to patients through thesechannels [7]. There is a shortage of community pharmacists [8]. In 2011, the InternationalPharmaceutical Federation (FIP) and World Health Organization (WHO) jointly recommended GoodPharmacy Practice (GPP) guidelines. Together, they advised all countries to endorse GPP in communitypharmacies for patients’ benefit by economical, rational, and quality use of medicines [9]. After therecommendations ofFIP and WHO, patient counseling services were started to some extent butGPP remained absolutely unnoticed; additionally, there was an urgent need for more patient-basedservices [10]. Doctors also have low regard for the quality of patient care in the pharmacies ofPakistan [11]. Patients are not aware about the role of pharmacists in the healthcare system [8]. Someinstitutional-based studies about the services of hospitals indicate that patients were not satisfiedwith their pharmacy services [12,13]. To the best of our knowledge, no evidence exists with regardto patient satisfaction with community pharmacy services in Pakistan. Moreover, no tool exists toanalyze the patient views according current domestic situation. We designed this study to assesspharmacies services with regard to patient’s need. This work signifies the first effort in the field toevaluate patient’s satisfaction with practices and services. In addition, the current study serves asbaseline data and evidence for the need to improve services and practices.
2. Methods
2.1. Study Setting
This study was conducted at selected licensed community pharmacies in Punjab, Pakistan. Punjabcovers 205,344 km2 and is the most populous province of the country. Its population is estimated to beover 91,379,615 individuals, representing 56% of the total national population [14].
2.2. Selection of Pharmacy
Stratified sample technique was applied for the selection of pharmacy. A total of nine strata wereformed on the basis of administrative division of government of Punjab. Each stratum was furtherdivided in to four sub-strata: divisional city, district city, tehsil city, and suburban and rural area.
For the selection of pharmacies, a list of pharmacies was obtained from department of health ormedicine supply companies. After the licensure confirmation of each pharmacy, these were arrangedgeographically with a serial number. Pharmacies were systematically selected from the list by numericselection. The sample size of pharmacies for total 22,319 pharmacies was calculated by keepingresponse distribution (70%), confidence interval (99%), margin of error (5%). Finally, total 544pharmacies were selected. The participation in the study was voluntarily. In the case of denial
Int. J. Environ. Res. Public Health 2018, 15, 2914 3 of 14
of any pharmacy, analternative pharmacy within 2 km was selected. Thisensured a homogeneous anduniform presentation of pharmacies from all areas of Punjab province.
2.3. Sampling and Study Population
From our pilot study, we found that number of patients per days varies in a pharmacy. Therefore,quota sampling method was applied to find equal participation of patients from every pharmacy. Eachpharmacy was focused for a single working day. Adult (aged >18 years) purchasers of medicine fromcommunity pharmacies were selected with their consent. Only the patients with a valid prescriptionby registered a medical practitioner, were included. The patients were approached randomly. Thusdata from 1088 patients was collected that ensures frame of sampling for response distribution (50%),confidence interval (99%), margin of error (4%) for estimatedpopulation of 14,991 patients with validprescription [14].
2.4. Questionnaire
The basic construct of this questionnaire was based on the key concepts of expectancy theory ofLinder-Pelz [2,15] and adaptation of measuring scale was based on discrepancy theory of patientssatisfaction by Fox [2,16]. To develop this tool, initially we worked to identify the domain of theconstructs and item generation. For this purpose, an extensive literature survey was completed betweenJanuary to April 2016. An initial pool of questions was obtained from previous studies [2,5,6,17–29]and available literature [30–32]. In addition, to determine the domains and further generation of items,a qualitative study was conducted from August to September 2016 [10]. Thus an initial version ofa questionnaire of total 51 questions was completed. To check the relevance to domain, clarity andconciseness, the questionnaire was sent to experts of social and administrative pharmacy for facevalidity and questionnaire was modified according to suggestions. Moreover, contents were validatedby a social pharmacy expert, two communitypharmacist and two general practitioners of private clinic.The ratings of each item was analyzed by an item-objective congruence (IOC) score method i.e., −1 =not representative, 0 = somewhat representative, 1 = clearly representative. The average score of IOC >0.5 were consider good for content validity [33].
Thus a questionnaire of 44 questions was finalized.The questionnaire was originally developed inEnglish, thentranslated into the national language (Urdu). Forward and backward translationalaccuracy was also ensured.The accuracy of translation was assessed by three language expertsandinter-rater reliability was applied to find a proper translation.
The further validity of instrument was assessed by a cognitive interviews method of 15randomly selected patients [34–36]. A few questions found redundant or unclear to interpret, weredeleted or modified. A questionnaire of 41 items was finalized.Each item was rated as relevant,understood, appropriate and not difficult and correctly interpreted by >80% of respondents of thecognitive interviews [37]. The questionnaire contained 41 questions related to patient satisfactionin four main domains: 12 questions related to the actual pharmacy store, its location, staff, andoperation; fivequestions regarding medicines; 21 questions about practices; and threequestions aboutadditional non-paid services. The patients’ demographic characteristics were also important parts ofthe questionnaire.
2.5. Pilot Study
To optimize the reliability and internal consistency of toll a pilot study of 25 patientswas conducted.The coefficient value of Cronbach’s alpha was calculated [38–40]. The Cronbach’s alpha of four main:domain 1 (premises and staff), domain 2 (medicines), domain 3 (dispensing and counseling practices)and domain 4 (additional non-paid services) was 0.71, 0.83, 0.75 and 0.72 respectively. Theoverallvalue of Cronbach’s alpha of the entire questionnaire was 0.76, giving a reasonable level of reliabilityand internal consistency. The data acquired for pilot study was not included in the final study results.
Int. J. Environ. Res. Public Health 2018, 15, 2914 4 of 14
2.6. Ethics Approval and Consent to Participate
The study design and protocol was approved by the center for drug safety and policy researchat the school of pharmacy after the formal approval of ethical review committee of Xi’an JiaotongUniversity (Ref # MR102-15/Phar)and Pharmacy Research Ethics Committee at The Islamia universityBahawalpur, Pakistan (Ref # 67-2015/PREC). The reference number (CDSP-16-PHD1-P4) was obtainedbefore conducting study. In addition, written and verbal consent was obtained from participants andpharmacy retailers. Participants’ identities and pharmacies were anonymized. Identification numberswere used in data collection and monitoring. All participants were informed of the study purpose.
2.7. Data Collection
For this cross-sectional study, data was collected by trained data collectors from October 2016to June 2017. The participation of patients in this study was voluntarily. The questionnaire wasself-administered in willing patients. However, face-to-face interviews were also conducted in thecase of willing patients with low education or shortage of time. To ensure appropriate responses andquality of data, all the interviews was conducted according to the feasibility of the patient regardinglocation and time. Data entry was completed weekly and assessed for accuracy twice.
2.8. Statistical Analyses and Data Interpretation
Statistical Packages for Social Sciences version 18 (SPSS Inc., Chicago IL, US) was used to analyzethe data. Specific parameters related to socio demographic characteristics and levels of satisfaction weredescribed by calculating the average with the standard error of mean, standard deviation frequency,and percentage. Likert scale was used to determine the exact level of patients’ satisfaction. A scoreof 1 indicated “Not at all satisfied’, 2 denoted “Not very satisfied”, 3 indicated “Fairly satisfied”, 4represented “Satisfied”, and 5 denoted “Very satisfied”. Then, the average mean rating of patientsatisfaction was calculated.To understand the significance of variation in satisfaction level with regardto socio-demographical characteristics of the patients, one-way ANOVA was applied.
3. Results
The response rate of the community pharmacies was 80.0%. To meet our sample target, 682community pharmacies were approached. Of 1597 patients, 1088 (68.1%) were ultimately available.
3.1. Characteristics of Participants
The mean age of the participants was 35.2 years, with most (62.1%) falling into the 26–40-year agegroup. The majority of participants (84.3%) were male. Many (33.8%) participants had matriculationin their formal education.
A large proportion of participants (26.3%) earned 15,001–30,000 PkR (approximately 145–290 USD)monthly. Approximately 21.7% (237) of participants visited a pharmacy to purchase gastrointestinalmedicines, as shown in Table 1, which shows the socio-demographic and financial status of participantsand the disease/s for which participants visited pharmacies.
3.2. Level of Patient Satisfaction
The mean overall satisfaction score of participants was 2.78/5.00. According to average patientssatisfaction score (3.34/5.00), the domain of medicine was ranked highest, while the domain ofnon-paid services was ranked lowest (2.26/5.00). The average score of domain 1 (premises and staff)and domain 3 (dispensing and counseling practices) was (2.97/5.00) and (2.87/5.00), respectively.
Int. J. Environ. Res. Public Health 2018, 15, 2914 5 of 14
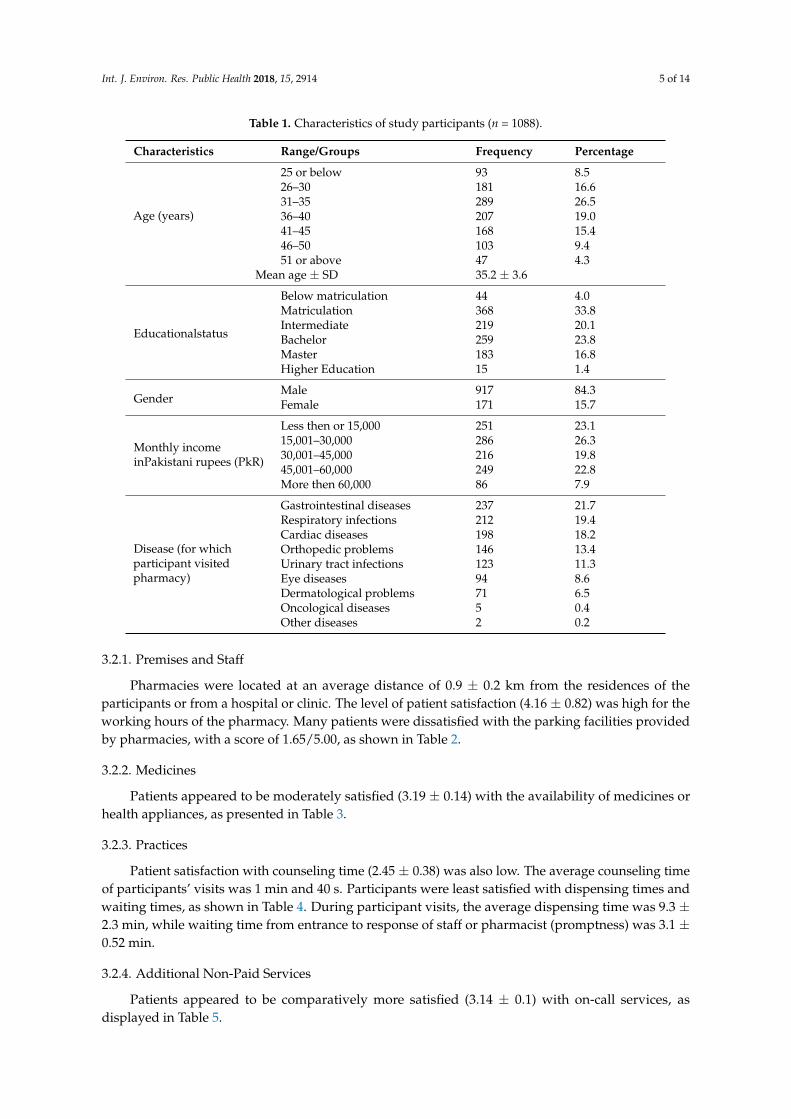
Table 1. Characteristics of study participants (n = 1088).
Characteristics Range/Groups Frequency Percentage
Age (years)
25 or below 93 8.526–30 181 16.631–35 289 26.536–40 207 19.041–45 168 15.446–50 103 9.451 or above 47 4.3
Mean age ± SD 35.2 ± 3.6
Educationalstatus
Below matriculation 44 4.0Matriculation 368 33.8Intermediate 219 20.1Bachelor 259 23.8Master 183 16.8Higher Education 15 1.4
GenderMale 917 84.3Female 171 15.7
Monthly incomeinPakistani rupees (PkR)
Less then or 15,000 251 23.115,001–30,000 286 26.330,001–45,000 216 19.845,001–60,000 249 22.8More then 60,000 86 7.9
Disease (for whichparticipant visitedpharmacy)
Gastrointestinal diseases 237 21.7Respiratory infections 212 19.4Cardiac diseases 198 18.2Orthopedic problems 146 13.4Urinary tract infections 123 11.3Eye diseases 94 8.6Dermatological problems 71 6.5Oncological diseases 5 0.4Other diseases 2 0.2
3.2.1. Premises and Staff
Pharmacies were located at an average distance of 0.9 ± 0.2 km from the residences of theparticipants or from a hospital or clinic. The level of patient satisfaction (4.16 ± 0.82) was high for theworking hours of the pharmacy. Many patients were dissatisfied with the parking facilities providedby pharmacies, with a score of 1.65/5.00, as shown in Table 2.
3.2.2. Medicines
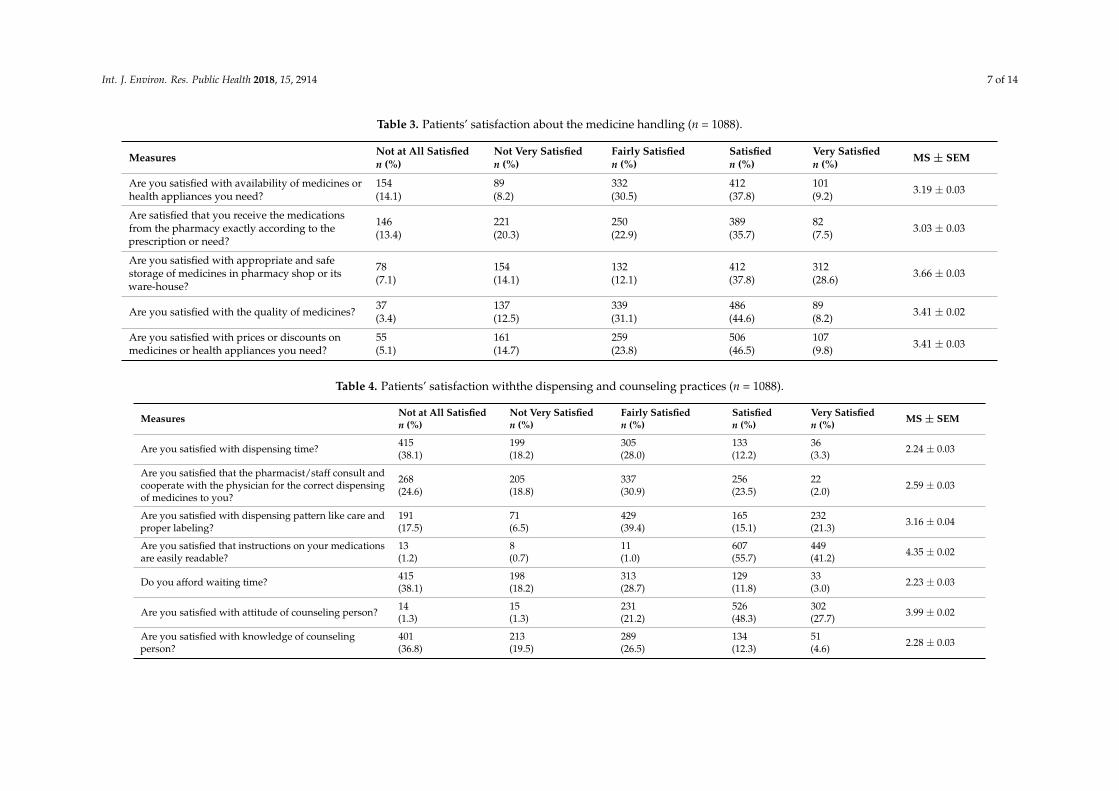
Patients appeared to be moderately satisfied (3.19 ± 0.14) with the availability of medicines orhealth appliances, as presented in Table 3.
3.2.3. Practices
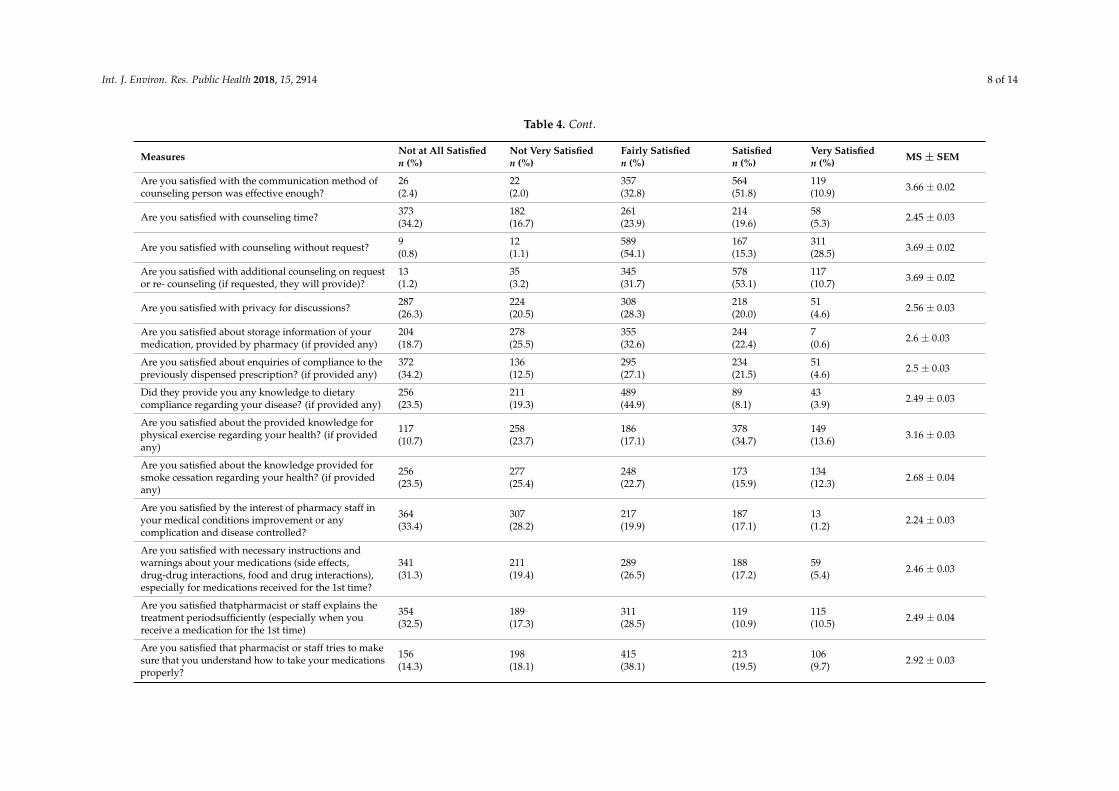
Patient satisfaction with counseling time (2.45 ± 0.38) was also low. The average counseling timeof participants’ visits was 1 min and 40 s. Participants were least satisfied with dispensing times andwaiting times, as shown in Table 4. During participant visits, the average dispensing time was 9.3 ±2.3 min, while waiting time from entrance to response of staff or pharmacist (promptness) was 3.1 ±0.52 min.
3.2.4. Additional Non-Paid Services
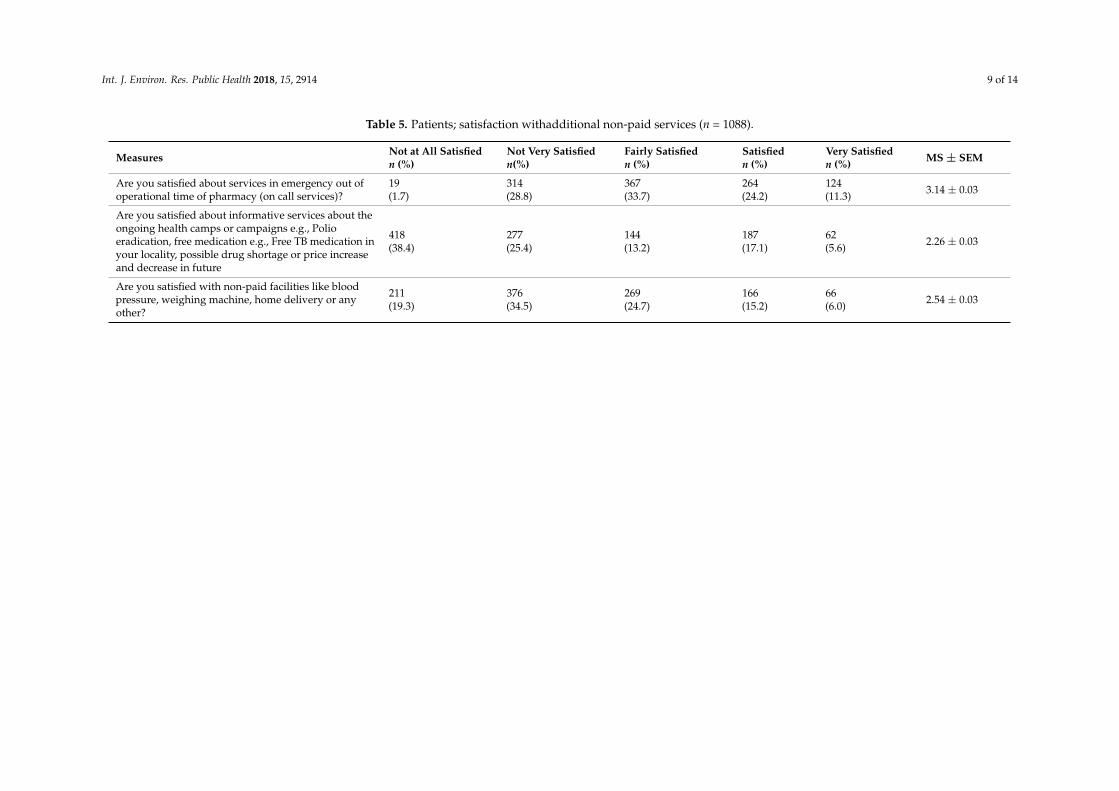
Patients appeared to be comparatively more satisfied (3.14 ± 0.1) with on-call services, asdisplayed in Table 5.
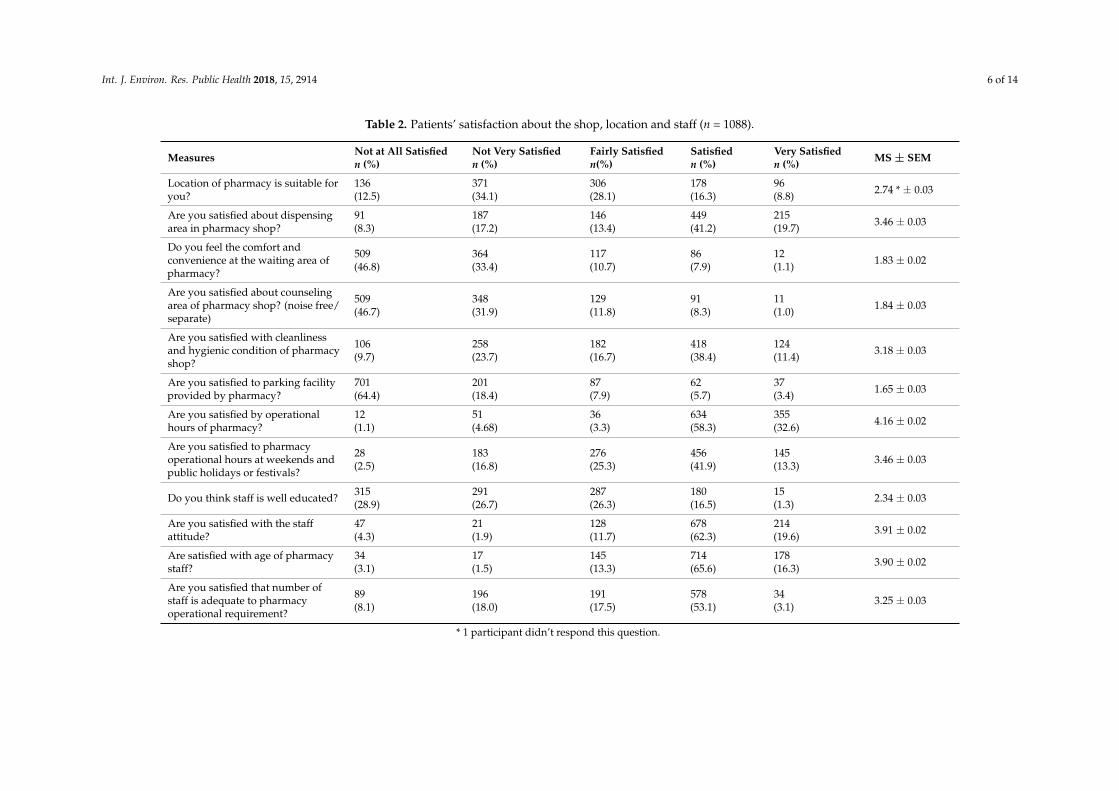
Int. J. Environ. Res. Public Health 2018, 15, 2914 6 of 14
Table 2. Patients’ satisfaction about the shop, location and staff (n = 1088).
Measures Not at All Satisfiedn (%)
Not Very Satisfiedn (%)
Fairly Satisfiedn(%)
Satisfiedn (%)
Very Satisfiedn (%) MS ± SEM
Location of pharmacy is suitable foryou?
136(12.5)
371(34.1)
306(28.1)
178(16.3)
96(8.8) 2.74 * ± 0.03
Are you satisfied about dispensingarea in pharmacy shop?
91(8.3)
187(17.2)
146(13.4)
449(41.2)
215(19.7) 3.46 ± 0.03
Do you feel the comfort andconvenience at the waiting area ofpharmacy?
509(46.8)
364(33.4)
117(10.7)
86(7.9)
12(1.1) 1.83 ± 0.02
Are you satisfied about counselingarea of pharmacy shop? (noise free/separate)
509(46.7)
348(31.9)
129(11.8)
91(8.3)
11(1.0) 1.84 ± 0.03
Are you satisfied with cleanlinessand hygienic condition of pharmacyshop?
106(9.7)
258(23.7)
182(16.7)
418(38.4)
124(11.4) 3.18 ± 0.03
Are you satisfied to parking facilityprovided by pharmacy?
701(64.4)
201(18.4)
87(7.9)
62(5.7)
37(3.4) 1.65 ± 0.03
Are you satisfied by operationalhours of pharmacy?
12(1.1)
51(4.68)
36(3.3)
634(58.3)
355(32.6) 4.16 ± 0.02
Are you satisfied to pharmacyoperational hours at weekends andpublic holidays or festivals?
28(2.5)
183(16.8)
276(25.3)
456(41.9)
145(13.3) 3.46 ± 0.03
Do you think staff is well educated? 315(28.9)
291(26.7)
287(26.3)
180(16.5)
15(1.3) 2.34 ± 0.03
Are you satisfied with the staffattitude?
47(4.3)
21(1.9)
128(11.7)
678(62.3)
214(19.6) 3.91 ± 0.02
Are satisfied with age of pharmacystaff?
34(3.1)
17(1.5)
145(13.3)
714(65.6)
178(16.3) 3.90 ± 0.02
Are you satisfied that number ofstaff is adequate to pharmacyoperational requirement?
89(8.1)
196(18.0)
191(17.5)
578(53.1)
34(3.1) 3.25 ± 0.03
* 1 participant didn’t respond this question.
Int. J. Environ. Res. Public Health 2018, 15, 2914 7 of 14
Table 3. Patients’ satisfaction about the medicine handling (n = 1088).
Measures Not at All Satisfiedn (%)
Not Very Satisfiedn (%)
Fairly Satisfiedn (%)
Satisfiedn (%)
Very Satisfiedn (%) MS ± SEM
Are you satisfied with availability of medicines orhealth appliances you need?
154(14.1)
89(8.2)
332(30.5)
412(37.8)
101(9.2) 3.19 ± 0.03
Are satisfied that you receive the medicationsfrom the pharmacy exactly according to theprescription or need?
146(13.4)
221(20.3)
250(22.9)
389(35.7)
82(7.5) 3.03 ± 0.03
Are you satisfied with appropriate and safestorage of medicines in pharmacy shop or itsware-house?
78(7.1)
154(14.1)
132(12.1)
412(37.8)
312(28.6) 3.66 ± 0.03
Are you satisfied with the quality of medicines? 37(3.4)
137(12.5)
339(31.1)
486(44.6)
89(8.2) 3.41 ± 0.02
Are you satisfied with prices or discounts onmedicines or health appliances you need?
55(5.1)
161(14.7)
259(23.8)
506(46.5)
107(9.8) 3.41 ± 0.03
Table 4. Patients’ satisfaction withthe dispensing and counseling practices (n = 1088).
Measures Not at All Satisfiedn (%)
Not Very Satisfiedn (%)
Fairly Satisfiedn (%)
Satisfiedn (%)
Very Satisfiedn (%) MS ± SEM
Are you satisfied with dispensing time? 415(38.1)
199(18.2)
305(28.0)
133(12.2)
36(3.3) 2.24 ± 0.03
Are you satisfied that the pharmacist/staff consult andcooperate with the physician for the correct dispensingof medicines to you?
268(24.6)
205(18.8)
337(30.9)
256(23.5)
22(2.0) 2.59 ± 0.03
Are you satisfied with dispensing pattern like care andproper labeling?
191(17.5)
71(6.5)
429(39.4)
165(15.1)
232(21.3) 3.16 ± 0.04
Are you satisfied that instructions on your medicationsare easily readable?
13(1.2)
8(0.7)
11(1.0)
607(55.7)
449(41.2) 4.35 ± 0.02
Do you afford waiting time? 415(38.1)
198(18.2)
313(28.7)
129(11.8)
33(3.0) 2.23 ± 0.03
Are you satisfied with attitude of counseling person? 14(1.3)
15(1.3)
231(21.2)
526(48.3)
302(27.7) 3.99 ± 0.02
Are you satisfied with knowledge of counselingperson?
401(36.8)
213(19.5)
289(26.5)
134(12.3)
51(4.6) 2.28 ± 0.03
Int. J. Environ. Res. Public Health 2018, 15, 2914 8 of 14
Table 4. Cont.
Measures Not at All Satisfiedn (%)
Not Very Satisfiedn (%)
Fairly Satisfiedn (%)
Satisfiedn (%)
Very Satisfiedn (%) MS ± SEM
Are you satisfied with the communication method ofcounseling person was effective enough?
26(2.4)
22(2.0)
357(32.8)
564(51.8)
119(10.9) 3.66 ± 0.02
Are you satisfied with counseling time? 373(34.2)
182(16.7)
261(23.9)
214(19.6)
58(5.3) 2.45 ± 0.03
Are you satisfied with counseling without request? 9(0.8)
12(1.1)
589(54.1)
167(15.3)
311(28.5) 3.69 ± 0.02
Are you satisfied with additional counseling on requestor re- counseling (if requested, they will provide)?
13(1.2)
35(3.2)
345(31.7)
578(53.1)
117(10.7) 3.69 ± 0.02
Are you satisfied with privacy for discussions? 287(26.3)
224(20.5)
308(28.3)
218(20.0)
51(4.6) 2.56 ± 0.03
Are you satisfied about storage information of yourmedication, provided by pharmacy (if provided any)
204(18.7)
278(25.5)
355(32.6)
244(22.4)
7(0.6) 2.6 ± 0.03
Are you satisfied about enquiries of compliance to thepreviously dispensed prescription? (if provided any)
372(34.2)
136(12.5)
295(27.1)
234(21.5)
51(4.6) 2.5 ± 0.03
Did they provide you any knowledge to dietarycompliance regarding your disease? (if provided any)
256(23.5)
211(19.3)
489(44.9)
89(8.1)
43(3.9) 2.49 ± 0.03
Are you satisfied about the provided knowledge forphysical exercise regarding your health? (if providedany)
117(10.7)
258(23.7)
186(17.1)
378(34.7)
149(13.6) 3.16 ± 0.03
Are you satisfied about the knowledge provided forsmoke cessation regarding your health? (if providedany)
256(23.5)
277(25.4)
248(22.7)
173(15.9)
134(12.3) 2.68 ± 0.04
Are you satisfied by the interest of pharmacy staff inyour medical conditions improvement or anycomplication and disease controlled?
364(33.4)
307(28.2)
217(19.9)
187(17.1)
13(1.2) 2.24 ± 0.03
Are you satisfied with necessary instructions andwarnings about your medications (side effects,drug-drug interactions, food and drug interactions),especially for medications received for the 1st time?
341(31.3)
211(19.4)
289(26.5)
188(17.2)
59(5.4) 2.46 ± 0.03
Are you satisfied thatpharmacist or staff explains thetreatment periodsufficiently (especially when youreceive a medication for the 1st time)
354(32.5)
189(17.3)
311(28.5)
119(10.9)
115(10.5) 2.49 ± 0.04
Are you satisfied that pharmacist or staff tries to makesure that you understand how to take your medicationsproperly?
156(14.3)
198(18.1)
415(38.1)
213(19.5)
106(9.7) 2.92 ± 0.03
Int. J. Environ. Res. Public Health 2018, 15, 2914 9 of 14
Table 5. Patients; satisfaction withadditional non-paid services (n = 1088).
Measures Not at All Satisfiedn (%)
Not Very Satisfiedn(%)
Fairly Satisfiedn (%)
Satisfiedn (%)
Very Satisfiedn (%) MS ± SEM
Are you satisfied about services in emergency out ofoperational time of pharmacy (on call services)?
19(1.7)
314(28.8)
367(33.7)
264(24.2)
124(11.3) 3.14 ± 0.03
Are you satisfied about informative services about theongoing health camps or campaigns e.g., Polioeradication, free medication e.g., Free TB medication inyour locality, possible drug shortage or price increaseand decrease in future
418(38.4)
277(25.4)
144(13.2)
187(17.1)
62(5.6) 2.26 ± 0.03
Are you satisfied with non-paid facilities like bloodpressure, weighing machine, home delivery or anyother?
211(19.3)
376(34.5)
269(24.7)
166(15.2)
66(6.0) 2.54 ± 0.03
Int. J. Environ. Res. Public Health 2018, 15, 2914 10 of 14
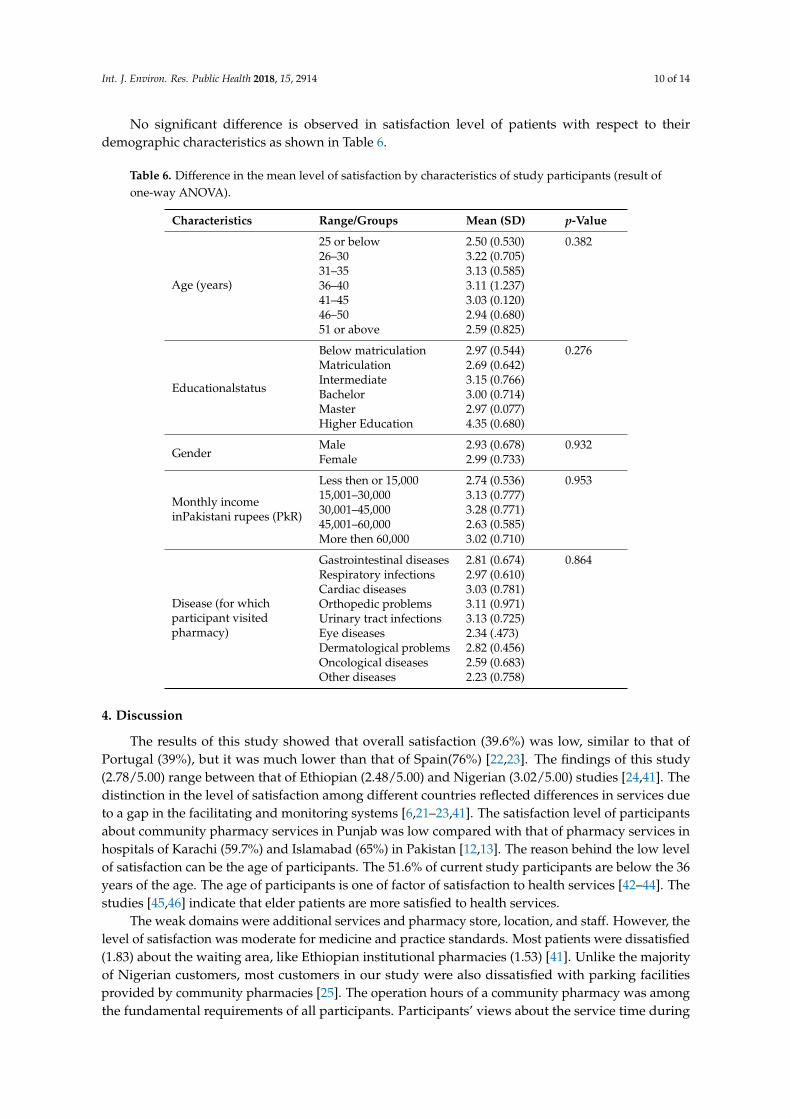
No significant difference is observed in satisfaction level of patients with respect to theirdemographic characteristics as shown in Table 6.
Table 6. Difference in the mean level of satisfaction by characteristics of study participants (result ofone-way ANOVA).
Characteristics Range/Groups Mean (SD) p-Value
Age (years)
25 or below 2.50 (0.530) 0.38226–30 3.22 (0.705)31–35 3.13 (0.585)36–40 3.11 (1.237)41–45 3.03 (0.120)46–50 2.94 (0.680)51 or above 2.59 (0.825)
Educationalstatus
Below matriculation 2.97 (0.544) 0.276Matriculation 2.69 (0.642)Intermediate 3.15 (0.766)Bachelor 3.00 (0.714)Master 2.97 (0.077)Higher Education 4.35 (0.680)
GenderMale 2.93 (0.678) 0.932Female 2.99 (0.733)
Monthly incomeinPakistani rupees (PkR)
Less then or 15,000 2.74 (0.536) 0.95315,001–30,000 3.13 (0.777)30,001–45,000 3.28 (0.771)45,001–60,000 2.63 (0.585)More then 60,000 3.02 (0.710)
Disease (for whichparticipant visitedpharmacy)
Gastrointestinal diseases 2.81 (0.674) 0.864Respiratory infections 2.97 (0.610)Cardiac diseases 3.03 (0.781)Orthopedic problems 3.11 (0.971)Urinary tract infections 3.13 (0.725)Eye diseases 2.34 (.473)Dermatological problems 2.82 (0.456)Oncological diseases 2.59 (0.683)Other diseases 2.23 (0.758)
4. Discussion
The results of this study showed that overall satisfaction (39.6%) was low, similar to that ofPortugal (39%), but it was much lower than that of Spain(76%) [22,23]. The findings of this study(2.78/5.00) range between that of Ethiopian (2.48/5.00) and Nigerian (3.02/5.00) studies [24,41]. Thedistinction in the level of satisfaction among different countries reflected differences in services dueto a gap in the facilitating and monitoring systems [6,21–23,41]. The satisfaction level of participantsabout community pharmacy services in Punjab was low compared with that of pharmacy services inhospitals of Karachi (59.7%) and Islamabad (65%) in Pakistan [12,13]. The reason behind the low levelof satisfaction can be the age of participants. The 51.6% of current study participants are below the 36years of the age. The age of participants is one of factor of satisfaction to health services [42–44]. Thestudies [45,46] indicate that elder patients are more satisfied to health services.
The weak domains were additional services and pharmacy store, location, and staff. However, thelevel of satisfaction was moderate for medicine and practice standards. Most patients were dissatisfied(1.83) about the waiting area, like Ethiopian institutional pharmacies (1.53) [41]. Unlike the majorityof Nigerian customers, most customers in our study were also dissatisfied with parking facilitiesprovided by community pharmacies [25]. The operation hours of a community pharmacy was amongthe fundamental requirements of all participants. Participants’ views about the service time during
Int. J. Environ. Res. Public Health 2018, 15, 2914 11 of 14
the day were excellent and was estimated to be 11.9 ± 2.4 h, which is similar to that of independentpharmacies in Thailand (11.5 ± 2.3) [47]. A moderate perception of purchasers was found regardingthe availability, quality, prices, and storage of medicines [5,24,47].
Pharmacy staff is the most important feature for execution of better services. Similar to Spanishpatients, many patients or purchasers were satisfied with the attitude of pharmacy staff [26]. Amoderate level of satisfaction was expressed by participants about the age of staff [21]. Many customerswere discontent with the qualification of pharmacy staff and the knowledge of the counselingperson [2,24,42]. Therefore, participants were not pleased with counseling services. Participants’views about counseling services at community pharmacies in Pakistan (45.6%), the Netherlands(42.0%), and South Korea (42.0%) are indistinct [27,28]. Optimal counseling can improve patientcompliance to medication [2,31], but like Saudi Arabians, approximately half of participants perceivedthat the necessary instructions and warnings for medications were not conveyed [5]. Thus, knowledgeof the counseling person and counseling services should be improved to fulfill patients’ needs. Thisstudy declares that medication information should be clearer and standardized. In addition, theaverage counseling time reported by purchasers was 1.4 min compared with the time reported bySouth Korean patients (<1 min). Increasing counseling duration would lead to imparting essentialinformation to patients, which would thereby significantly increase patient contentment [27].
Patients cannot afford to wait a long time to receive necessary services due to poor health orlife-threatening emergencies. Many purchasers, like Estonians, felt discomfort due to long waitingtimes [29]. Therefore, fulfillment of prescriptions was reported to be slow by participants [24,25].Patients reported that dispensing time was also excessive. However, patients have moderate viewsabout dispensing patterns, and the findings are indistinguishable from previous results from Thailandand Estonia [29,42].
Community pharmacies are ideally located to promote health awareness by providing informationabout ongoing health camps and campaigns [32]. However, identical to findings in Saudi Arabia,this study divulged that the least informative services were provided by pharmacies [5]. On thebasis of patient’s views, we perceived that additional or non-paid facilities that were offered to themwere better than that of Nigerian pharmacies but lower than those in Thailand [25,42]. Thus, theoverall performance of community pharmacies was good. Community pharmacy services need manyimprovements and modifications in their basic structure and function. The Ministry of Health, officials,and authorities can strengthen pharmacy care services by implementing appropriate policies andencouraging pharmacy staff training.
5. Limitations
Firstly, this report shows only the views of agreed and selected patients from selected pharmacies.Minor dissimilarities in the selection of different patients from different pharmacies in differentlocalities may possible. To overcome, such a type of exaggeration of respondent, we applied a5 pointLikert scale. Secondly, this study did not focus on the the reasonsforpatients’ refusal toparticipate in the study. Thirdly, this study did not provide any insight into participants’ severityof disease. Fourthly, patients having valid prescriptions were included in this study. The views ofpatients purchasing OTC medicines may differ. Fifthly, most study participants were male due to thesocio-cultural norms of the study setting.
6. Conclusions
The current study demonstrated low patient satisfaction with regard to community pharmacyservices in the Punjab region of Pakistan. This result showed that community pharmacy services arecomparatively poorer than the pharmacy services offered at hospitals due to inappropriate policies andweak execution. The low level of satisfaction may attribute to the young participation. Communitypharmacy services need to be improved. Continuous professional training programs for pharmacy staff
Int. J. Environ. Res. Public Health 2018, 15, 2914 12 of 14
are also needed. In addition, authorities should focus on and play a role in strengthening pharmacycare services.
Author Contributions: Conceptualization, M.M.A., W.J., J.C., M.J. and Y.F.; Methodology, M.M.A., M.J., W.J., J.C.and I.M.; Software, M.M.A., W.J., J.C. and M.J.; Validation, Y.F., I.M., M.F., M.J., J.C. and M.Z.M.; Formal Analysis,Y.F., M.M.A., W.J., I.M.; Investigation, M.M.A., M.Z.M., I.M., N.A. and M.F.; Resources, Y.F.; Data Curation,M.M.A., W.J., J.C. and N.A.; Writing-Original Draft Preparation, M.M.A., M.J., N.A.; Writing-Review & Editing,N.A., M.J., Y.F. and M.F.; Visualization, M.Z.M., I.M. and M.F.; Supervision, Y.F.; Project Administration, M.M.A.,M.Z.M., I.M., N.A. and M.F.; Funding Acquisition, Y.F.
Funding: We are grateful to Xi’an Jiaotong University, Xi’an, China for the provision of “Young Talent Award” toaccomplish this work.
Conflicts of Interest: All the authors declare no conflict of interest.
References
1. Johnson, J.A.; Coons, S.J.; Hays, R.D.; Sabers, D.; Jones, P.; Langley, P.C. A comparison of satisfaction withmail versus traditional pharmacy services. J. Manag. Care Pharm. 1997, 3, 327–337. [CrossRef]
2. Naik, P.P.; Saini, B.; Armour, C. Measurement of patient satisfaction with community pharmacy services: Areview. Pharm. World Sci. 2009, 31, 525–537. [CrossRef] [PubMed]
3. Aziz, M.M.; Wajid, M.; Fang, Y. A societal perception about community pharmacies in Pakistan: An outlineof prospective investigation. Res. Soc. Adm. Pharm. 2017, 13, e1–e15. [CrossRef]
4. Ford, R.C.; Bach, S.A.; Fottler, M.D. Methods of measuring patient satisfaction in health care organizations.Health Care Manag. 1997, 22, 74–89. [CrossRef]
5. Al-Arifi, M.N. Patients’ perception, views and satisfaction with pharmacists’ role as health care providerin community pharmacy setting at Riyadh, Saudi Arabia. Saudi Pharm. J. 2012, 20, 323–330. [CrossRef][PubMed]
6. Hasan, S.; Sulieman, H.; Stewart, K.; Chapman, C.B.; Hasan, M.Y.; Kong, D.C. Assessing patient satisfactionwith community pharmacy in the UAE using a newly-validated tool. Res. Soc. Adm. Pharm. 2013, 9, 841–850.[CrossRef] [PubMed]
7. Hussain, A.; Malik, M.; Toklu, H.Z. A literature review: Pharmaceutical care an evolving role at communitypharmacies in Pakistan. Pharmacol. Pharm. 2013, 4, 425–430. [CrossRef]
8. Khan, M.U.; Khan, A.N.; Ahmed, F.R.; Feroz, Z.; Rizvi, S.A.; Shah, S.; Hussain, R.; Adil, Z. Patients’ opinionof pharmacists and their roles in health care system in Pakistan. J. Young Pharm. 2013, 5, 90–94. [CrossRef]
9. Good Pharmacy Practice. Joint FIP/WHO Guidelines on GPP: Standards for Quality of Pharmacy Services.International Pharmaceutical Federation. 2012. Available online: http://apps.who.int/medicinedocs/documents/s18676en/s18676en.pdf (accessed on 29 July 2017).
10. Azhar, S.; Hassali, M.A.; Taha, A.; Khan, S.A.; Murtaza, G.; Hussain, I. Evaluation of the perception ofcommunity pharmacists regarding their role in Pakistan’s healthcare system: A qualitative approach. Trop. J.Pharm. Res. 2013, 12, 635–639. [CrossRef]
11. Azhar, S.; Hassali, M.A.; Ibrahim, M.I.M. Doctors’ perception and expectations of the role of the pharmacistin Punjab, Pakistan. Trop. J. Pharm. Res. 2010, 9, 215–222. [CrossRef]
12. Javed, A. Patient Satisfaction towards Outpatient Department Services in Pakistan Institute of MedicalSciences, Islamabad. Master’s Thesis, Islamabad: Faculty of Graduate Studies, Mahidol University,NakhonPathom, Thailand, 2005. Available online: http://www.li.mahidol.ac.the-thesis/4737959.pdf(accessed on 29 July 2017).
13. Raheem, A.R.; Nawaz, A.; Fouzia, N.; Imamuddin, K. Patients’ satisfaction and quality health services: Aninvestigation from private hospitals of Karachi, Pakistan. Res. J. Recent Sci. 2014, 3, 34–38.
14. Aziz, M.M.; Masood, I.; Yousaf, M.; Saleem, H.; Ye, D.; Fang, Y. Pattern of medication selling andself-medication practices: A study from Punjab, Pakistan. PLoS ONE 2018, 13, e0194240. [CrossRef][PubMed]
15. Linder-Pelz, S.U. Toward a theory of patient satisfaction. Soc. Sci. Med. 1982, 16, 577–582. [CrossRef]16. Fox, J.G.; Storms, D.M. A different approach to sociodemographic predictors of satisfaction with health care.
Soc. Sci. Med. 1981, 15, 557–564. [CrossRef]

Int. J. Environ. Res. Public Health 2018, 15, 2914 13 of 14
17. Oparah, A.C.; Arigbe-Osula, E.M. Evaluation of community pharmacists’ involvement in primary healthcare. Trop. J. Pharm. Res. 2002, 1, 67–74. [CrossRef]
18. Jones, E.J.; MacKinnon, N.J.; Tsuyuki, R.T. Pharmaceutical care in community pharmacies: Practice andresearch in Canada. Pharmacol. Pharm. 2005, 39, 1527–1533. [CrossRef] [PubMed]
19. Zhang, M.Y.; Chong, W.K.; Hu, H.; Wang, Y. Pharmacy-perceived consumer preferences: A survey ofcommunity pharmacies in Macau. J. Med. Mark. 2014, 14, 41–48. [CrossRef]
20. Smith, F. The quality of private pharmacy services in low and middle-income countries: A systematic review.Pharm. World Sci. 2009, 31, 351–361. [CrossRef]
21. Malewski, D.F.; Ream, A.; Gaither, C.A. Patient satisfaction with community pharmacy: Comparing urbanand suburban chain-pharmacy populations. Res. Soc. Adm. Pharm. 2015, 11, 121–128. [CrossRef]
22. Pinto, A.R.; Machado, A.; Gonçalves, E.; Salsas, L.; Vicente, T.; Ribeiro, M.I.B.; Pinto, I.C.J.F. Users satisfactionregarding the service provided in community pharmacies. Adv. Pharmacol. Pharm. 2014, 2, 18–29.
23. Marquez-Peiro, J.F.; Perez-Peiro, C. Evaluation of patient satisfaction in out-patient pharmacy. Farm. Hosp.2008, 32, 71–76. [PubMed]
24. Oparah, A.C.; Enato, E.F.O.; Akoria, O.A. Assessment of patient satisfaction with pharmaceutical services ina Nigerian teaching hospital. Int. J. Pharm. Pract. 2004, 12, 7–12. [CrossRef]
25. Oparah, A.C.; Kikanme, L.C. Consumer satisfaction with community pharmacies in Warri, Nigeria. Res. Soc.Adm. Pharm. 2006, 2, 499–511. [CrossRef] [PubMed]
26. Traverso, M.L.; Salamano, M.; Botta, C.; Colautti, M.; Palchik, V.; Pérez, B. Questionnaire to assess patientsatisfaction with pharmaceutical care in Spanish language. Int. J. Qual. Health Care 2007, 19, 217–224.[CrossRef]
27. Yang, S.; Kim, D.; Choi, H.J.; Chang, M.J. A comparison of patients’ and pharmacists’ satisfaction withmedication counseling provided by community pharmacies: A cross-sectional survey. BMC Health Serv. Res.2016, 16, 131. [CrossRef]
28. Van Geffen, E.C.; Philbert, D.; van Boheemen, C.; van Dijk, L.; Bos, M.B.; Bouvy, M.L. Patients’ satisfactionwith information and experiences with counseling on cardiovascular medication received at the pharmacy.Patient Educ. Couns. 2011, 83, 303–309. [CrossRef] [PubMed]
29. Volmer, D.; Bell, J.S.; Janno, R.; Raal, A.; Hamilton, D.D.; Airaksinen, M.S. Change in public satisfaction withcommunity pharmacy services in Tartu, Estonia, between 1993 and 2005. Res. Soc. Adm. Pharm. 2009, 5,337–346. [CrossRef] [PubMed]
30. Hepler, C.; Strand, L. Opportunities and responsibilities in pharmaceutical care. Am. J. Hosp. Pharm. 1990,47, 533–543.
31. Puspitasari, H.P.; Aslani, P.; Krass, I. A review of counseling practices on prescription medicines incommunity pharmacies. Res. Soc. Adm. Pharm. 2009, 5, 197–210. [CrossRef] [PubMed]
32. The Role of the Pharmacist in the Health Care System. Essential Medicine and Health Products InformationPortal. A World Health Organization Resource. 1994. Available online: http://apps.who.int/medicinedocs/en/d/Jh2995e/2.3.html (accessed on 29 July 2017).
33. Turner, R.C.; Carlson, L. Indexes of item-objective congruence for multidimensional items. Int. J. Test. 2003,3, 163–171. [CrossRef]
34. Knafl, K.; Deatrick, J.; Gallo, A. The analysis and interpretation of cognitive interviews for instrumentdevelopment. Res. Nurs. Health 2007, 30, 224–234. [CrossRef] [PubMed]
35. Schildmann, E.K.; Groeneveld, E.I.; Denzel, J. Discovering the hidden benefits of cognitive interviewing intwo languages: The first phase of a validation study of the integrated palliative care outcome scale. PalliatMed. 2016, 30, 599–610. [CrossRef] [PubMed]
36. Id, C.B.H.; Id, A.M.H.; Mcquitty SMcKinnon, A.M.; English, K.; Backman, C.L.; Azimi, T.; Khodarahmi, N.;Li, L.C. Development and pre-testing of the Patient Engagement In Research Scale (PEIRS) to assess thequality of engagement from a patient perspective. PLoS ONE 2018, 13, e0206588.
37. Lk, C.; Yk, N.; Mercer, S.W.; Wong, W. A pilot study on the validity and reliability of the Patient EnablementInstrument (PEI) in a Chinese population. Fam. Pract. 2010, 27, 395–403.
38. Ye, D.; Chang, J.; Yang, C.; Yan, K.; Ji, W.; Aziz, M.M.; Gillani, A.H.; Fang, Y. How does the general publicview antibiotic use in China? Result from a cross-sectional survey. Int. J. Clin. Pharm. 2017, 39, 927–934.[CrossRef] [PubMed]

Int. J. Environ. Res. Public Health 2018, 15, 2914 14 of 14
39. Perneger, T.V.; Courvoisier, D.S.; Ange, P.M.H.; Gayet-Ageron, A. Sample size for pre-tests of questionnaires.Qual. Life Res. 2014, 24, 7–10. [CrossRef] [PubMed]
40. Viechtbauer, W.; Smits, L.; Kotz, D.; Budé, L.; Spigt, M.; Serroyen, J.; Crutzen, R. A simple formula for thecalculation of sample size in pilot studies. J. Clin. Epidemiol. 2015, 68, 1375–1379. [CrossRef] [PubMed]
41. Surur, A.S.; Teni, F.S.; Girmay, G.; Moges, E.; Tesfa, M.; Abraha, M. Satisfaction of clients with the services ofan out-patient pharmacy at a university hospital in northwestern Ethiopia: A cross-sectional study. BMCHealth Serv. Res. 2015, 15, 229. [CrossRef] [PubMed]
42. Chumbler, N.R.; Otani, K.; Desai, S.P.; Herrmann, P.A.; Kurz, R.S. Hospitalized older adults’ patientsatisfaction: Inpatient care experiences. Sage Open 2016, 8, 1–7. [CrossRef]
43. Moret, L.; Nguyen, J.; Volteau, C.; Falissard, B.; Lombrail, P.; Gasquet, I. Evidence of a non-linear influence ofpatient age on satisfaction with hospital care. Int. J. Qual. Health Care 2007, 19, 382–389. [CrossRef]
44. Devoe, J.E.; Wallace, L.S.; Fryer, G.E. Patient age influences perceptions about health care communication.Fam. Med. 2016, 41, 126–133.
45. Jaipaul, C.K.; Rosenthal, G.E. Are older patients more satisfied with hospital care than younger patients? J.Gen. Intern. Med. 2001, 18, 23–30. [CrossRef]
46. Peck, B.M. Age-related differences in doctor-patient interaction and patient satisfaction. Curr. Gerontol.Geriatr. Res. 2011, 11, 1–9. [CrossRef] [PubMed]
47. Arkaravichien, W.; Wongpratat, A.; Lertsinudom, S. Quality indicators to compare accredited independentpharmacies and accredited chain pharmacies in Thailand. Int. J. Clin. Pharm. 2016, 38, 899–907. [CrossRef][PubMed]
© 2018 by the authors. Licensee MDPI, Basel, Switzerland. This article is an open accessarticle distributed under the terms and conditions of the Creative Commons Attribution(CC BY) license (http://creativecommons.org/licenses/by/4.0/).