


Bahasa
Halaman
Hukum

International Journal of Engineering and Management Research e-ISSN: 2250-0758 | p-ISSN: 2394-6962
Volume-11, Issue-5 (October 2021)
www.ijemr.net https://doi.org/10.31033/ijemr.11.5.10
80 This Work is under Creative Commons Attribution-NonCommercial-NoDerivatives 4.0 International License.
A Comparative Study on Working Capital Management of Tata Motors
Limited and Maruti Suzuki India Limited
Dr. Sudip Chakraborty1 and Shilpi Kumari
2
1Assistant Professor, Royal School of Commerce, The Assam Royal Global University, Guwahati, Assam, INDIA
2Post Graduate Student, Royal School of Commerce, The Assam Royal Global University, Guwahati, Assam, INDIA
2Corresponding Author: [email protected]
ABSTRACT The automobile industry in India is one of the
speedily growing industry. Working Capital Management
is important in this industry due to increasing demand and
huge investment in this sector requires proper
management. Working Capital Management perform a
vital role in the success and failure of a business due to its
effect on the performance and liquidity. Thereby this study
has been undertaken to Comparative analyse working
capital management of Tata Motors Limited and Maruti
Suzuki India Limited for the period of seven years from
2013-14 to 2019-20. In this study three objectives are set
for research. The first one was to assess the impact of
working capital on sales, second was to assess the impact of
working capital on profitability and third was to evaluate
the working capital performance of the companies under
study through the use of various financial ratios. The study
reflects that the efficiency of working capital management
of the companies is influenced by the Liquidity Ratios,
Debtor Turnover Ratio, Inventory Turnover Ratio and
profitability Ratio.
Keywords-- Working Capital Management, Automobile
Industry, Sales, Profitability, Performance
I. INTRODUCTION
Every business has certain sources of income
and its efficient management will help in smooth
functioning of the business. Finance is an essential part
of the business, without which the business cannot
operate. Generally, finance is required mainly for two
purposes i.e., for start-up and fixed assets which remain
for longer period of time, and for the day-to-day running
of business, for this purpose an efficient cash flow
structure is essential. Funds are needed for short-term
purposes for the purchase of raw materials, payment of
direct and indirect expense and other day-to-day
requirements are called working capital. Business firm
require proper management of finances for smooth
running and growth of firm, for this Working Capital
management practices are adopted by the firms. Working
Capital Management refers to the strategies companies
adopt to manage the relationship between its Current
assets and current liabilities with the objective to ensure
that it continues with its operations and meet its current
liabilities when they fall due. Working Capital
Management performs a vital role in the success and
failure of a business due to its effect on the performance
and liquidity. The management of working capital refers
to the management of inventories, accounts receivable
and payable, and cash.
The automobile industry in India is one of the
speedily growing industry due to increase in the demand
for cars, and other vehicles, powered by the increase in
the income is the key growth driver of the Indian
automobile industry. In 2020, Indian Automobile
industry is the Fifth largest commercial vehicle
manufacturer in the world. Working Capital
Management is important in this industry due to
increasing demand and huge investment in this sector
requires proper management. This study has been
undertaken to assess the impact of working capital on
sales and profitability and comparative analysis of
working capital components of companies.
II. OBJECTIVES OF THE STUDY
The present study aims at making a comparative
study of Working Capital Management in selected
automobile industries in India. The specific objectives of
the study are: -
To assess the impact of working capital on
sales.
To assess the impact of working capital on
profitability.
To evaluate the working capital performance of
the companies under study through the use of
various financial ratios.
III. REVIEW OF LITERATURE
Jafari and Rao (2015), The purpose of the
study was to analyse the practice of working capital
Management and Asset and liquidity ratios in six
selected Indian auto manufacturing companies. For this
aforementioned study a secondary data from the annual
reports of the six companies was solicited. Both
qualitative and quantitative paradigms were employed so
as to analyse the research. The result has shown
regarding the relationship between working capital and
turnover analysis, index of inventory turnover, debtor’s
turnover ratio, total assets turnover ratio and fixed assets
turnover ratio.
International Journal of Engineering and Management Research e-ISSN: 2250-0758 | p-ISSN: 2394-6962
Volume-11, Issue-5 (October 2021)
www.ijemr.net https://doi.org/10.31033/ijemr.11.5.10
81 This Work is under Creative Commons Attribution-NonCommercial-NoDerivatives 4.0 International License.
Manoharan and Paramasivam (2016), The
study has been undertaken with the objective to study
working capital management of selected automobile
companies in India. The results of the study shows that
Mahindra and Mahindra, Maruti and Bajaj Auto Ltd. had
positive working capital during all the years of the study
period, whereas Ashok Leyland and TVS had negative
working capital in four years and Tata Motors had
negative working capital in five years. Current ratio was
found to be good in case of Bajaj Auto Ltd. and Maruti
Suzuki India Ltd.
Kalaivani and Jothi (2017), The study has been
based on the secondary data collected from the period
2007 to 2016 by using dynamic panel data analysis with
an attempt to investigate the relationship between
working capital management components and
performance of the firms. For the analysis purpose Eight
Automobile Companies of India are taken for analysis.
The result has shown that the efficiency of working
capital management of the companies covered in the
study are influenced by the Debtor Turnover Ratio,
Inventory Turnover Ratio and Current Asset Turnover
Ratio.
Untwal (2020), This study was based on the
Principal Component Analysis on the several variables
expected to influence the working capital management
of Tata Motors. The principal component analyses have
identified the factors and are expected to assist to
identify areas where they might improve financial
performance of their operation. The variables CSR, CR
ROA, DTO, ITO are having communalities greater than
0.5 are incorporated and each variable was loaded on a
single component, thereby intensify the interpretability
of the factors.
Nobanee, Abdulla, Azim, and Ismaili (2021),
The report is about the working capital management of
the two renowned companies Tesla and NIO. In order to
do the analysis, ratio analysis has been done to compare
the performance of both Tesla and NIO. For the analysis
purpose the data was transformed into an understandable
form, use of graphs. The study showed that the profits of
the company has been noted to increase with time. NIO
has also been able to improve its profits but it’s low in
compare to Tesla. This shows that Tesla has been
successfully able to manage its liquidity and
profitability, however NIO has able to manage its profits.
IV. RESEARCH METHODOLOGY
Nature and Sources of the Data
The present study is analytical and descriptive
in nature, correlation and analytical research has
obtained to carry out the study. This study is based on
secondary data collected from Annual reports of selected
companies under, websites, journals, research paper and
books.
Hypothesis
The Null Hypothesis formulated for the study
are as follows:
1. H0: There is no significant impact of gross working
capital on sales of Tata Motors Limited.
2. H0: There is no significant impact of Net working
capital on sale of Tata Motors Limited.
3. H0: There is no significant impact of gross working
capital on sales of Maruti Suzuki India Limited.
4. H0: There is no significant impact of Net working
capital on sale of Maruti Suzuki India Limited.
V. IMPACT OF WORKING CAPITAL
ON SALES
It has been observed that there is a direct link
between the working capital and sales as the main
purpose of any business is making profit and for its main
activity is sales which requires working capital for
current assets and other day to day expenses. Due to
their link, working capital has impact on sales as a
company requires funds to purchase raw materials, to
produce any goods or service and to pay operating
expenses. Therefore, an attempt is made in consistence
with the objective of the study that is to assess the
impact of working capital on sales of Tata Motors
Limited and Maruti Suzuki India Limited are as follows:
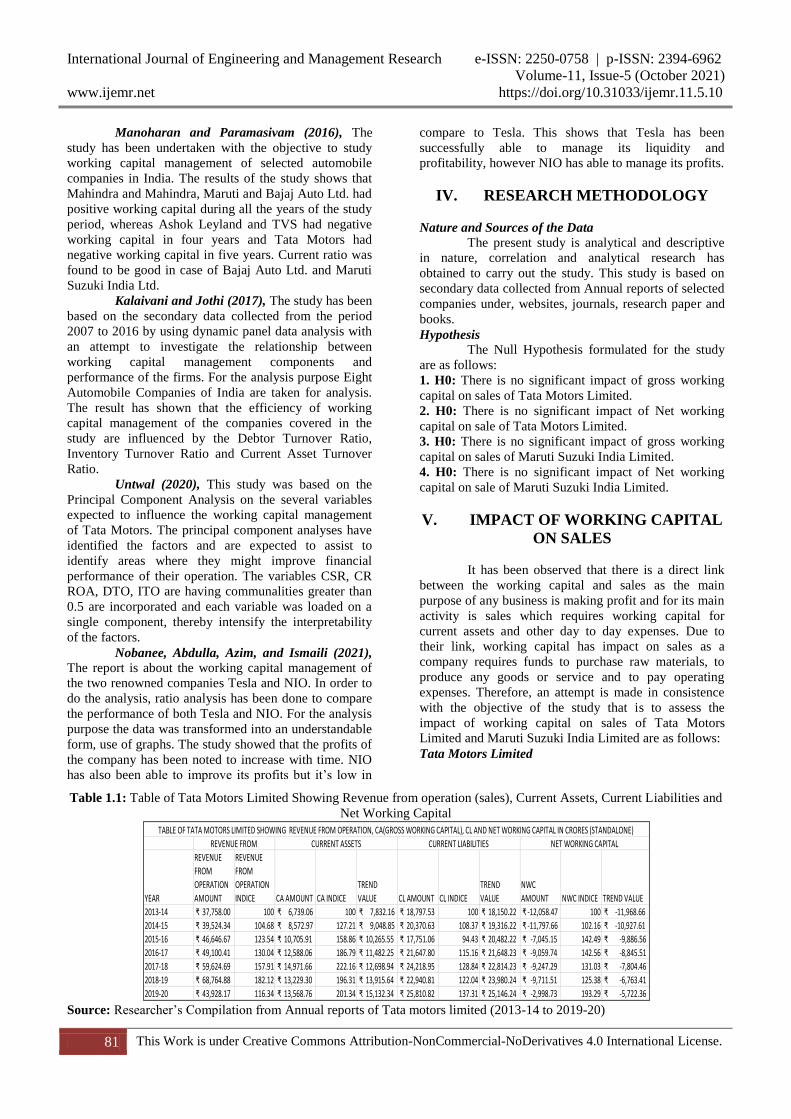
Tata Motors Limited
Table 1.1: Table of Tata Motors Limited Showing Revenue from operation (sales), Current Assets, Current Liabilities and
Net Working Capital
Source: Researcher’s Compilation from Annual reports of Tata motors limited (2013-14 to 2019-20)
YEAR
REVENUE
FROM
OPERATION
AMOUNT
REVENUE
FROM
OPERATION
INDICE CA AMOUNT CA INDICE
TREND
VALUE CL AMOUNT CL INDICE
TREND
VALUE
NWC
AMOUNT NWC INDICE TREND VALUE
2013-14 ₹ 37,758.00 100 ₹ 6,739.06 100 ₹ 7,832.16 ₹ 18,797.53 100 ₹ 18,150.22 ₹ -12,058.47 100 ₹ -11,968.66
2014-15 ₹ 39,524.34 104.68 ₹ 8,572.97 127.21 ₹ 9,048.85 ₹ 20,370.63 108.37 ₹ 19,316.22 ₹ -11,797.66 102.16 ₹ -10,927.61
2015-16 ₹ 46,646.67 123.54 ₹ 10,705.91 158.86 ₹ 10,265.55 ₹ 17,751.06 94.43 ₹ 20,482.22 ₹ -7,045.15 142.49 ₹ -9,886.56
2016-17 ₹ 49,100.41 130.04 ₹ 12,588.06 186.79 ₹ 11,482.25 ₹ 21,647.80 115.16 ₹ 21,648.23 ₹ -9,059.74 142.56 ₹ -8,845.51
2017-18 ₹ 59,624.69 157.91 ₹ 14,971.66 222.16 ₹ 12,698.94 ₹ 24,218.95 128.84 ₹ 22,814.23 ₹ -9,247.29 131.03 ₹ -7,804.46
2018-19 ₹ 68,764.88 182.12 ₹ 13,229.30 196.31 ₹ 13,915.64 ₹ 22,940.81 122.04 ₹ 23,980.24 ₹ -9,711.51 125.38 ₹ -6,763.41
2019-20 ₹ 43,928.17 116.34 ₹ 13,568.76 201.34 ₹ 15,132.34 ₹ 25,810.82 137.31 ₹ 25,146.24 ₹ -2,998.73 193.29 ₹ -5,722.36
TABLE OF TATA MOTORS LIMITED SHOWING REVENUE FROM OPERATION, CA(GROSS WORKING CAPITAL), CL AND NET WORKING CAPITAL IN CRORES (STANDALONE)
REVENUE FROM CURRENT ASSETS CURRENT LIABILITIES NET WORKING CAPITAL
International Journal of Engineering and Management Research e-ISSN: 2250-0758 | p-ISSN: 2394-6962
Volume-11, Issue-5 (October 2021)
www.ijemr.net https://doi.org/10.31033/ijemr.11.5.10
82 This Work is under Creative Commons Attribution-NonCommercial-NoDerivatives 4.0 International License.
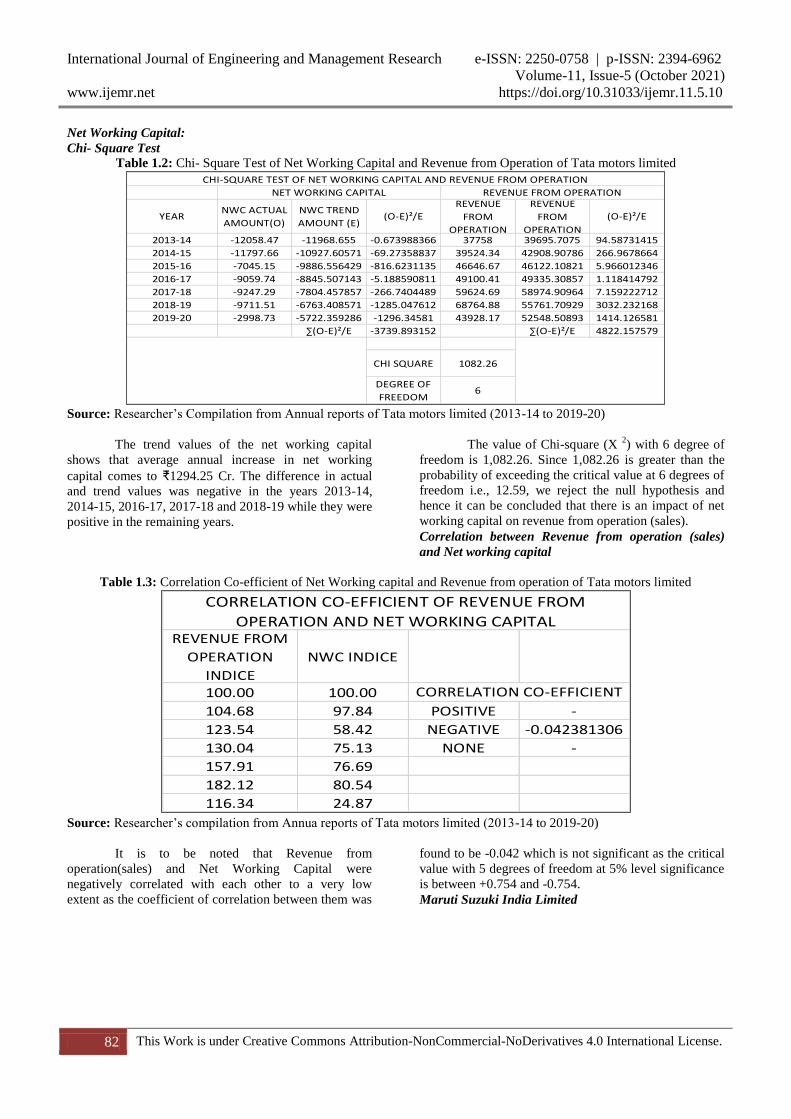
Net Working Capital:
Chi- Square Test
Table 1.2: Chi- Square Test of Net Working Capital and Revenue from Operation of Tata motors limited
Source: Researcher’s Compilation from Annual reports of Tata motors limited (2013-14 to 2019-20)
The trend values of the net working capital
shows that average annual increase in net working
capital comes to ₹1294.25 Cr. The difference in actual
and trend values was negative in the years 2013-14,
2014-15, 2016-17, 2017-18 and 2018-19 while they were
positive in the remaining years.
The value of Chi-square (X 2) with 6 degree of
freedom is 1,082.26. Since 1,082.26 is greater than the
probability of exceeding the critical value at 6 degrees of
freedom i.e., 12.59, we reject the null hypothesis and
hence it can be concluded that there is an impact of net
working capital on revenue from operation (sales).
Correlation between Revenue from operation (sales)
and Net working capital
Table 1.3: Correlation Co-efficient of Net Working capital and Revenue from operation of Tata motors limited
Source: Researcher’s compilation from Annua reports of Tata motors limited (2013-14 to 2019-20)
It is to be noted that Revenue from
operation(sales) and Net Working Capital were
negatively correlated with each other to a very low
extent as the coefficient of correlation between them was
found to be -0.042 which is not significant as the critical
value with 5 degrees of freedom at 5% level significance
is between +0.754 and -0.754.
Maruti Suzuki India Limited
YEARNWC ACTUAL
AMOUNT(O)
NWC TREND
AMOUNT (E)(O-E)²/E
REVENUE
FROM
OPERATION
REVENUE
FROM
OPERATION
(O-E)²/E
2013-14 -12058.47 -11968.655 -0.673988366 37758 39695.7075 94.58731415
2014-15 -11797.66 -10927.60571 -69.27358837 39524.34 42908.90786 266.9678664
2015-16 -7045.15 -9886.556429 -816.6231135 46646.67 46122.10821 5.966012346
2016-17 -9059.74 -8845.507143 -5.188590811 49100.41 49335.30857 1.118414792
2017-18 -9247.29 -7804.457857 -266.7404489 59624.69 58974.90964 7.159222712
2018-19 -9711.51 -6763.408571 -1285.047612 68764.88 55761.70929 3032.232168
2019-20 -2998.73 -5722.359286 -1296.34581 43928.17 52548.50893 1414.126581
∑(O-E)²/E -3739.893152 ∑(O-E)²/E 4822.157579
CHI SQUARE 1082.26
DEGREE OF
FREEDOM6
REVENUE FROM OPERATIONNET WORKING CAPITAL
CHI-SQUARE TEST OF NET WORKING CAPITAL AND REVENUE FROM OPERATION
REVENUE FROM
OPERATION
INDICE
NWC INDICE
100.00 100.00
104.68 97.84 POSITIVE -
123.54 58.42 NEGATIVE -0.042381306
130.04 75.13 NONE -
157.91 76.69
182.12 80.54
116.34 24.87
CORRELATION CO-EFFICIENT OF REVENUE FROM
OPERATION AND NET WORKING CAPITAL
CORRELATION CO-EFFICIENT
International Journal of Engineering and Management Research e-ISSN: 2250-0758 | p-ISSN: 2394-6962
Volume-11, Issue-5 (October 2021)
www.ijemr.net https://doi.org/10.31033/ijemr.11.5.10
83 This Work is under Creative Commons Attribution-NonCommercial-NoDerivatives 4.0 International License.
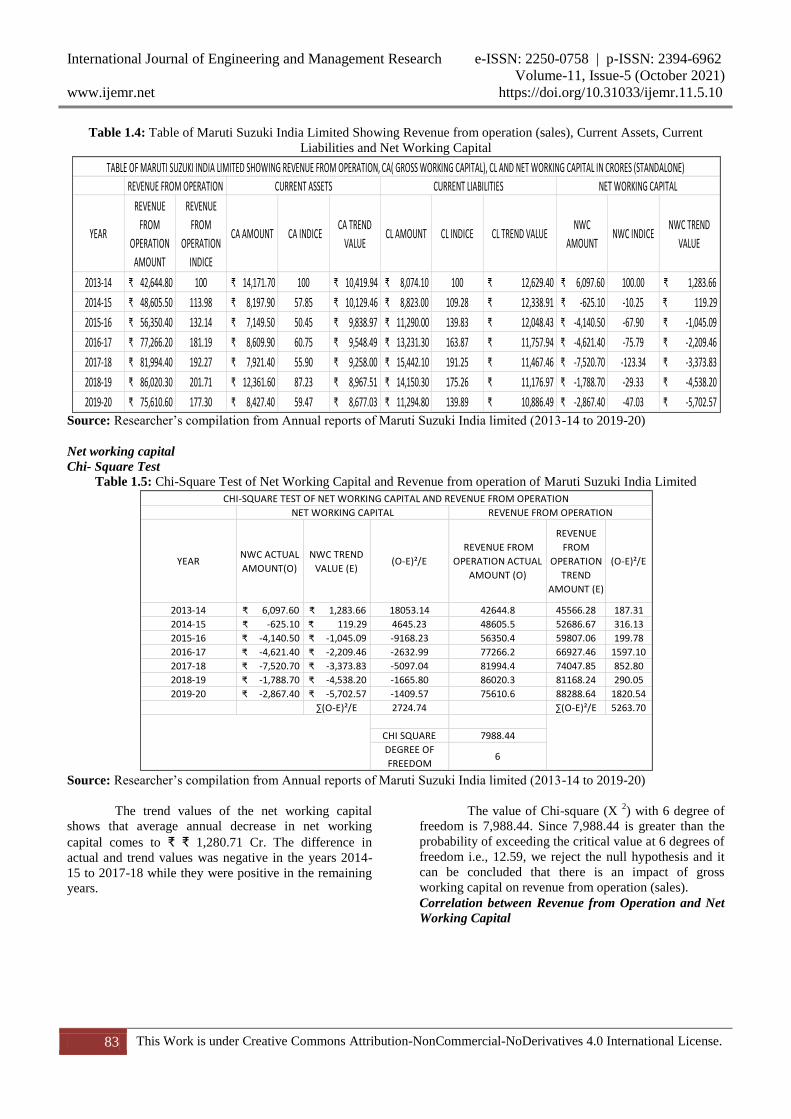
Table 1.4: Table of Maruti Suzuki India Limited Showing Revenue from operation (sales), Current Assets, Current
Liabilities and Net Working Capital
Source: Researcher’s compilation from Annual reports of Maruti Suzuki India limited (2013-14 to 2019-20)
Net working capital
Chi- Square Test
Table 1.5: Chi-Square Test of Net Working Capital and Revenue from operation of Maruti Suzuki India Limited
Source: Researcher’s compilation from Annual reports of Maruti Suzuki India limited (2013-14 to 2019-20)
The trend values of the net working capital
shows that average annual decrease in net working
capital comes to ₹ ₹ 1,280.71 Cr. The difference in
actual and trend values was negative in the years 2014-
15 to 2017-18 while they were positive in the remaining
years.
The value of Chi-square (X 2) with 6 degree of
freedom is 7,988.44. Since 7,988.44 is greater than the
probability of exceeding the critical value at 6 degrees of
freedom i.e., 12.59, we reject the null hypothesis and it
can be concluded that there is an impact of gross
working capital on revenue from operation (sales).
Correlation between Revenue from Operation and Net
Working Capital
YEAR
REVENUE
FROM
OPERATION
AMOUNT
REVENUE
FROM
OPERATION
INDICE
CA AMOUNT CA INDICECA TREND
VALUECL AMOUNT CL INDICE CL TREND VALUE
NWC
AMOUNTNWC INDICE
NWC TREND
VALUE
2013-14 ₹ 42,644.80 100 ₹ 14,171.70 100 ₹ 10,419.94 ₹ 8,074.10 100 ₹ 12,629.40 ₹ 6,097.60 100.00 ₹ 1,283.66
2014-15 ₹ 48,605.50 113.98 ₹ 8,197.90 57.85 ₹ 10,129.46 ₹ 8,823.00 109.28 ₹ 12,338.91 ₹ -625.10 -10.25 ₹ 119.29
2015-16 ₹ 56,350.40 132.14 ₹ 7,149.50 50.45 ₹ 9,838.97 ₹ 11,290.00 139.83 ₹ 12,048.43 ₹ -4,140.50 -67.90 ₹ -1,045.09
2016-17 ₹ 77,266.20 181.19 ₹ 8,609.90 60.75 ₹ 9,548.49 ₹ 13,231.30 163.87 ₹ 11,757.94 ₹ -4,621.40 -75.79 ₹ -2,209.46
2017-18 ₹ 81,994.40 192.27 ₹ 7,921.40 55.90 ₹ 9,258.00 ₹ 15,442.10 191.25 ₹ 11,467.46 ₹ -7,520.70 -123.34 ₹ -3,373.83
2018-19 ₹ 86,020.30 201.71 ₹ 12,361.60 87.23 ₹ 8,967.51 ₹ 14,150.30 175.26 ₹ 11,176.97 ₹ -1,788.70 -29.33 ₹ -4,538.20
2019-20 ₹ 75,610.60 177.30 ₹ 8,427.40 59.47 ₹ 8,677.03 ₹ 11,294.80 139.89 ₹ 10,886.49 ₹ -2,867.40 -47.03 ₹ -5,702.57
TABLE OF MARUTI SUZUKI INDIA LIMITED SHOWING REVENUE FROM OPERATION, CA( GROSS WORKING CAPITAL), CL AND NET WORKING CAPITAL IN CRORES (STANDALONE)
REVENUE FROM OPERATION CURRENT ASSETS CURRENT LIABILITIES NET WORKING CAPITAL
YEARNWC ACTUAL
AMOUNT(O)
NWC TREND
VALUE (E)(O-E)²/E
REVENUE FROM
OPERATION ACTUAL
AMOUNT (O)
REVENUE
FROM
OPERATION
TREND
AMOUNT (E)
(O-E)²/E
2013-14 ₹ 6,097.60 ₹ 1,283.66 18053.14 42644.8 45566.28 187.31
2014-15 ₹ -625.10 ₹ 119.29 4645.23 48605.5 52686.67 316.13
2015-16 ₹ -4,140.50 ₹ -1,045.09 -9168.23 56350.4 59807.06 199.78
2016-17 ₹ -4,621.40 ₹ -2,209.46 -2632.99 77266.2 66927.46 1597.10
2017-18 ₹ -7,520.70 ₹ -3,373.83 -5097.04 81994.4 74047.85 852.80
2018-19 ₹ -1,788.70 ₹ -4,538.20 -1665.80 86020.3 81168.24 290.05
2019-20 ₹ -2,867.40 ₹ -5,702.57 -1409.57 75610.6 88288.64 1820.54
∑(O-E)²/E 2724.74 ∑(O-E)²/E 5263.70
CHI SQUARE 7988.44
DEGREE OF
FREEDOM6
CHI-SQUARE TEST OF NET WORKING CAPITAL AND REVENUE FROM OPERATION
NET WORKING CAPITAL REVENUE FROM OPERATION
International Journal of Engineering and Management Research e-ISSN: 2250-0758 | p-ISSN: 2394-6962
Volume-11, Issue-5 (October 2021)
www.ijemr.net https://doi.org/10.31033/ijemr.11.5.10
84 This Work is under Creative Commons Attribution-NonCommercial-NoDerivatives 4.0 International License.
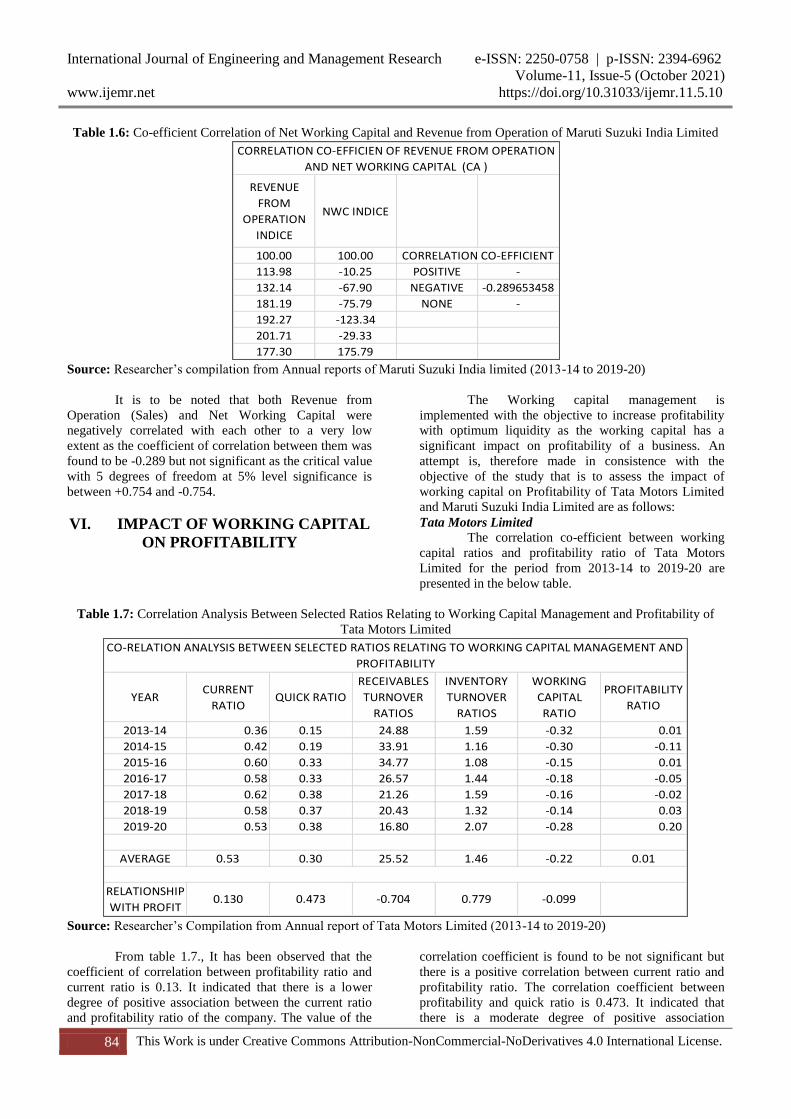
Table 1.6: Co-efficient Correlation of Net Working Capital and Revenue from Operation of Maruti Suzuki India Limited
Source: Researcher’s compilation from Annual reports of Maruti Suzuki India limited (2013-14 to 2019-20)
It is to be noted that both Revenue from
Operation (Sales) and Net Working Capital were
negatively correlated with each other to a very low
extent as the coefficient of correlation between them was
found to be -0.289 but not significant as the critical value
with 5 degrees of freedom at 5% level significance is
between +0.754 and -0.754.
VI. IMPACT OF WORKING CAPITAL
ON PROFITABILITY
The Working capital management is
implemented with the objective to increase profitability
with optimum liquidity as the working capital has a
significant impact on profitability of a business. An
attempt is, therefore made in consistence with the
objective of the study that is to assess the impact of
working capital on Profitability of Tata Motors Limited
and Maruti Suzuki India Limited are as follows:
Tata Motors Limited
The correlation co-efficient between working
capital ratios and profitability ratio of Tata Motors
Limited for the period from 2013-14 to 2019-20 are
presented in the below table.
Table 1.7: Correlation Analysis Between Selected Ratios Relating to Working Capital Management and Profitability of
Tata Motors Limited
Source: Researcher’s Compilation from Annual report of Tata Motors Limited (2013-14 to 2019-20)
From table 1.7., It has been observed that the
coefficient of correlation between profitability ratio and
current ratio is 0.13. It indicated that there is a lower
degree of positive association between the current ratio
and profitability ratio of the company. The value of the
correlation coefficient is found to be not significant but
there is a positive correlation between current ratio and
profitability ratio. The correlation coefficient between
profitability and quick ratio is 0.473. It indicated that
there is a moderate degree of positive association
REVENUE
FROM
OPERATION
INDICE
NWC INDICE
100.00 100.00
113.98 -10.25 POSITIVE -
132.14 -67.90 NEGATIVE -0.289653458
181.19 -75.79 NONE -
192.27 -123.34
201.71 -29.33
177.30 175.79
CORRELATION CO-EFFICIEN OF REVENUE FROM OPERATION
AND NET WORKING CAPITAL (CA )
CORRELATION CO-EFFICIENT
YEARCURRENT
RATIOQUICK RATIO
RECEIVABLES
TURNOVER
RATIOS
INVENTORY
TURNOVER
RATIOS
WORKING
CAPITAL
RATIO
PROFITABILITY
RATIO
2013-14 0.36 0.15 24.88 1.59 -0.32 0.01
2014-15 0.42 0.19 33.91 1.16 -0.30 -0.11
2015-16 0.60 0.33 34.77 1.08 -0.15 0.01
2016-17 0.58 0.33 26.57 1.44 -0.18 -0.05
2017-18 0.62 0.38 21.26 1.59 -0.16 -0.02
2018-19 0.58 0.37 20.43 1.32 -0.14 0.03
2019-20 0.53 0.38 16.80 2.07 -0.28 0.20
AVERAGE 0.53 0.30 25.52 1.46 -0.22 0.01
RELATIONSHIP
WITH PROFIT0.130 0.473 -0.704 0.779 -0.099
CO-RELATION ANALYSIS BETWEEN SELECTED RATIOS RELATING TO WORKING CAPITAL MANAGEMENT AND
PROFITABILITY
International Journal of Engineering and Management Research e-ISSN: 2250-0758 | p-ISSN: 2394-6962
Volume-11, Issue-5 (October 2021)
www.ijemr.net https://doi.org/10.31033/ijemr.11.5.10
85 This Work is under Creative Commons Attribution-NonCommercial-NoDerivatives 4.0 International License.
between the quick ratio and profitability ratio of the
company. The value of the correlation coefficient is
found to be not significant but there is a positive
correlation between quick ratio and profitability ratio.
The coefficient of correlation between profitability ratio
and Receivable’s turnover ratio indicates negative
association of -0.704. It shows high degree of negative
correlation which is found not to be significant at 5
percent of level. The coefficient of correlation between
profitability ratio and inventory turnover ratio is found to
be 0.779, which is found to be significant at 5 percent of
level. It shows high degree of positive correlation
between the variables.
The coefficient of correlation between
profitability and working capital turnover ratio is -0.099.
It shows low degree of negative correlation which is
found to be insignificant.
Maruti Suzuki India Limited
The co-efficient correlation between working
capital ratios and profitability ratio of Maruti Suzuki
India Limited for the period from 2013-14 to 2019-20
are presented in the below table.
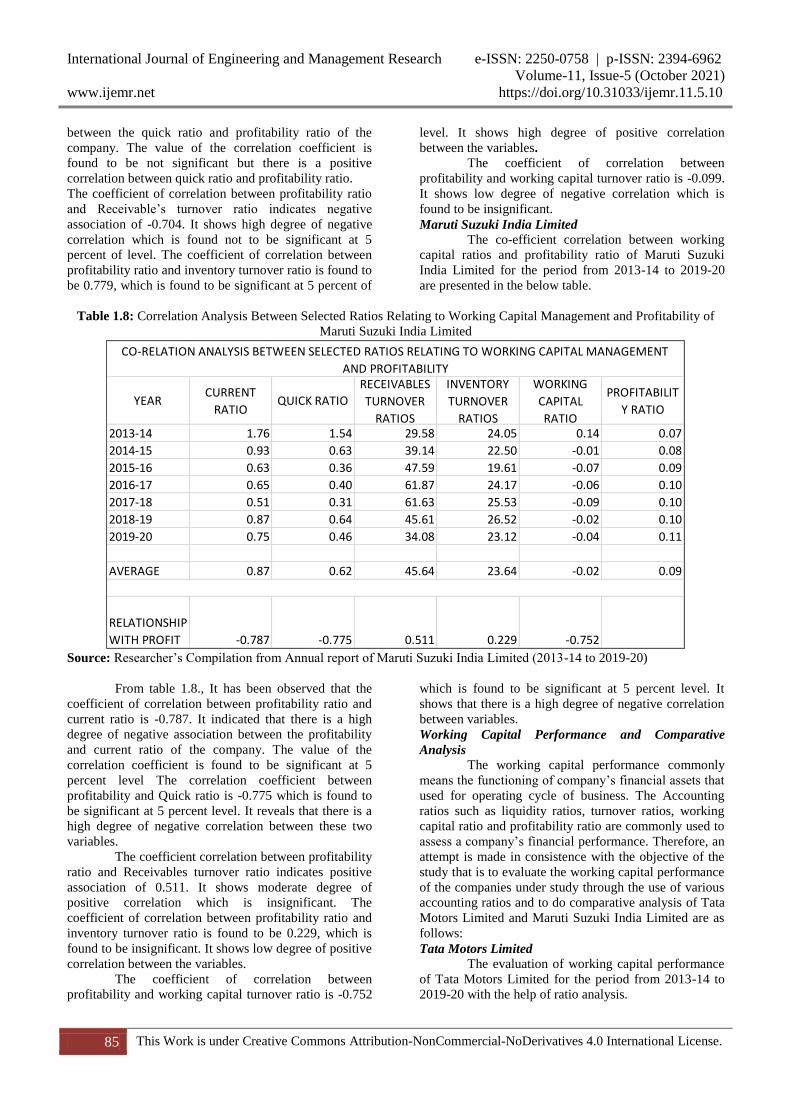
Table 1.8: Correlation Analysis Between Selected Ratios Relating to Working Capital Management and Profitability of
Maruti Suzuki India Limited
Source: Researcher’s Compilation from Annual report of Maruti Suzuki India Limited (2013-14 to 2019-20)
From table 1.8., It has been observed that the
coefficient of correlation between profitability ratio and
current ratio is -0.787. It indicated that there is a high
degree of negative association between the profitability
and current ratio of the company. The value of the
correlation coefficient is found to be significant at 5
percent level The correlation coefficient between
profitability and Quick ratio is -0.775 which is found to
be significant at 5 percent level. It reveals that there is a
high degree of negative correlation between these two
variables.
The coefficient correlation between profitability
ratio and Receivables turnover ratio indicates positive
association of 0.511. It shows moderate degree of
positive correlation which is insignificant. The
coefficient of correlation between profitability ratio and
inventory turnover ratio is found to be 0.229, which is
found to be insignificant. It shows low degree of positive
correlation between the variables.
The coefficient of correlation between
profitability and working capital turnover ratio is -0.752
which is found to be significant at 5 percent level. It
shows that there is a high degree of negative correlation
between variables.
Working Capital Performance and Comparative
Analysis
The working capital performance commonly
means the functioning of company’s financial assets that
used for operating cycle of business. The Accounting
ratios such as liquidity ratios, turnover ratios, working
capital ratio and profitability ratio are commonly used to
assess a company’s financial performance. Therefore, an
attempt is made in consistence with the objective of the
study that is to evaluate the working capital performance
of the companies under study through the use of various
accounting ratios and to do comparative analysis of Tata
Motors Limited and Maruti Suzuki India Limited are as
follows:
Tata Motors Limited
The evaluation of working capital performance
of Tata Motors Limited for the period from 2013-14 to
2019-20 with the help of ratio analysis.
YEARCURRENT
RATIOQUICK RATIO
RECEIVABLES
TURNOVER
RATIOS
INVENTORY
TURNOVER
RATIOS
WORKING
CAPITAL
RATIO
PROFITABILIT
Y RATIO
2013-14 1.76 1.54 29.58 24.05 0.14 0.07
2014-15 0.93 0.63 39.14 22.50 -0.01 0.08
2015-16 0.63 0.36 47.59 19.61 -0.07 0.09
2016-17 0.65 0.40 61.87 24.17 -0.06 0.10
2017-18 0.51 0.31 61.63 25.53 -0.09 0.10
2018-19 0.87 0.64 45.61 26.52 -0.02 0.10
2019-20 0.75 0.46 34.08 23.12 -0.04 0.11
AVERAGE 0.87 0.62 45.64 23.64 -0.02 0.09
RELATIONSHIP
WITH PROFIT -0.787 -0.775 0.511 0.229 -0.752
CO-RELATION ANALYSIS BETWEEN SELECTED RATIOS RELATING TO WORKING CAPITAL MANAGEMENT
AND PROFITABILITY
International Journal of Engineering and Management Research e-ISSN: 2250-0758 | p-ISSN: 2394-6962
Volume-11, Issue-5 (October 2021)
www.ijemr.net https://doi.org/10.31033/ijemr.11.5.10
86 This Work is under Creative Commons Attribution-NonCommercial-NoDerivatives 4.0 International License.
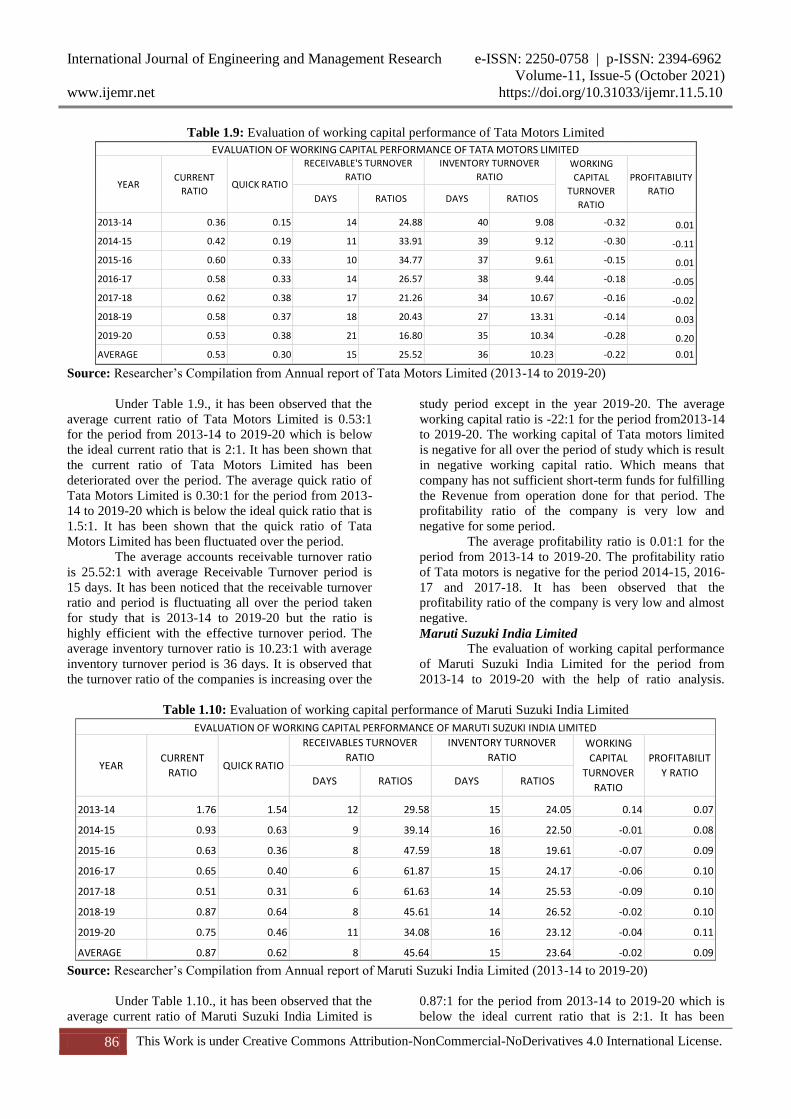
Table 1.9: Evaluation of working capital performance of Tata Motors Limited
Source: Researcher’s Compilation from Annual report of Tata Motors Limited (2013-14 to 2019-20)
Under Table 1.9., it has been observed that the
average current ratio of Tata Motors Limited is 0.53:1
for the period from 2013-14 to 2019-20 which is below
the ideal current ratio that is 2:1. It has been shown that
the current ratio of Tata Motors Limited has been
deteriorated over the period. The average quick ratio of
Tata Motors Limited is 0.30:1 for the period from 2013-
14 to 2019-20 which is below the ideal quick ratio that is
1.5:1. It has been shown that the quick ratio of Tata
Motors Limited has been fluctuated over the period.
The average accounts receivable turnover ratio
is 25.52:1 with average Receivable Turnover period is
15 days. It has been noticed that the receivable turnover
ratio and period is fluctuating all over the period taken
for study that is 2013-14 to 2019-20 but the ratio is
highly efficient with the effective turnover period. The
average inventory turnover ratio is 10.23:1 with average
inventory turnover period is 36 days. It is observed that
the turnover ratio of the companies is increasing over the
study period except in the year 2019-20. The average
working capital ratio is -22:1 for the period from2013-14
to 2019-20. The working capital of Tata motors limited
is negative for all over the period of study which is result
in negative working capital ratio. Which means that
company has not sufficient short-term funds for fulfilling
the Revenue from operation done for that period. The
profitability ratio of the company is very low and
negative for some period.
The average profitability ratio is 0.01:1 for the
period from 2013-14 to 2019-20. The profitability ratio
of Tata motors is negative for the period 2014-15, 2016-
17 and 2017-18. It has been observed that the
profitability ratio of the company is very low and almost
negative.
Maruti Suzuki India Limited
The evaluation of working capital performance
of Maruti Suzuki India Limited for the period from
2013-14 to 2019-20 with the help of ratio analysis.
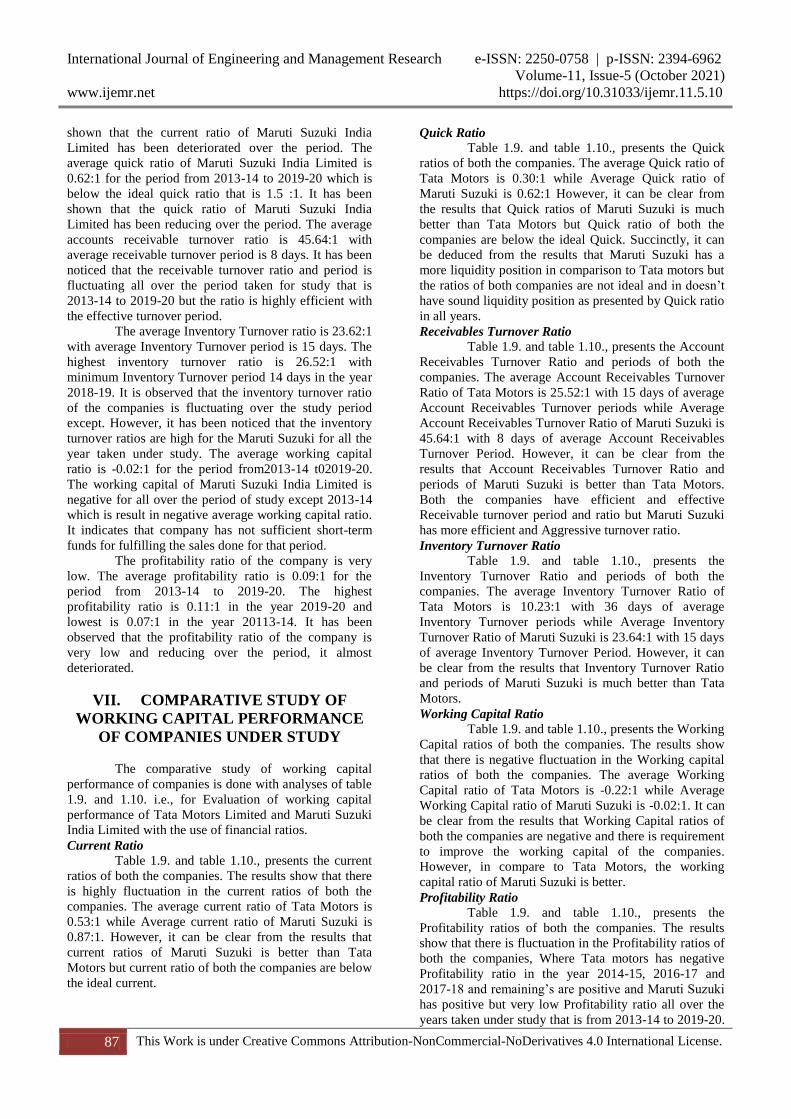
Table 1.10: Evaluation of working capital performance of Maruti Suzuki India Limited
Source: Researcher’s Compilation from Annual report of Maruti Suzuki India Limited (2013-14 to 2019-20)
Under Table 1.10., it has been observed that the
average current ratio of Maruti Suzuki India Limited is
0.87:1 for the period from 2013-14 to 2019-20 which is
below the ideal current ratio that is 2:1. It has been
DAYS RATIOS DAYS RATIOS
2013-14 0.36 0.15 14 24.88 40 9.08 -0.32 0.01
2014-15 0.42 0.19 11 33.91 39 9.12 -0.30 -0.11
2015-16 0.60 0.33 10 34.77 37 9.61 -0.15 0.01
2016-17 0.58 0.33 14 26.57 38 9.44 -0.18 -0.05
2017-18 0.62 0.38 17 21.26 34 10.67 -0.16 -0.02
2018-19 0.58 0.37 18 20.43 27 13.31 -0.14 0.03
2019-20 0.53 0.38 21 16.80 35 10.34 -0.28 0.20
AVERAGE 0.53 0.30 15 25.52 36 10.23 -0.22 0.01
PROFITABILITY
RATIO
EVALUATION OF WORKING CAPITAL PERFORMANCE OF TATA MOTORS LIMITEDRECEIVABLE'S TURNOVER
RATIO
INVENTORY TURNOVER
RATIOYEAR
CURRENT
RATIOQUICK RATIO
WORKING
CAPITAL
TURNOVER
RATIO
DAYS RATIOS DAYS RATIOS
2013-14 1.76 1.54 12 29.58 15 24.05 0.14 0.07
2014-15 0.93 0.63 9 39.14 16 22.50 -0.01 0.08
2015-16 0.63 0.36 8 47.59 18 19.61 -0.07 0.09
2016-17 0.65 0.40 6 61.87 15 24.17 -0.06 0.10
2017-18 0.51 0.31 6 61.63 14 25.53 -0.09 0.10
2018-19 0.87 0.64 8 45.61 14 26.52 -0.02 0.10
2019-20 0.75 0.46 11 34.08 16 23.12 -0.04 0.11
AVERAGE 0.87 0.62 8 45.64 15 23.64 -0.02 0.09
RECEIVABLES TURNOVER
RATIO
INVENTORY TURNOVER
RATIO
EVALUATION OF WORKING CAPITAL PERFORMANCE OF MARUTI SUZUKI INDIA LIMITED
CURRENT
RATIOQUICK RATIOYEAR
WORKING
CAPITAL
TURNOVER
RATIO
PROFITABILIT
Y RATIO
International Journal of Engineering and Management Research e-ISSN: 2250-0758 | p-ISSN: 2394-6962
Volume-11, Issue-5 (October 2021)
www.ijemr.net https://doi.org/10.31033/ijemr.11.5.10
87 This Work is under Creative Commons Attribution-NonCommercial-NoDerivatives 4.0 International License.
shown that the current ratio of Maruti Suzuki India
Limited has been deteriorated over the period. The
average quick ratio of Maruti Suzuki India Limited is
0.62:1 for the period from 2013-14 to 2019-20 which is
below the ideal quick ratio that is 1.5 :1. It has been
shown that the quick ratio of Maruti Suzuki India
Limited has been reducing over the period. The average
accounts receivable turnover ratio is 45.64:1 with
average receivable turnover period is 8 days. It has been
noticed that the receivable turnover ratio and period is
fluctuating all over the period taken for study that is
2013-14 to 2019-20 but the ratio is highly efficient with
the effective turnover period.
The average Inventory Turnover ratio is 23.62:1
with average Inventory Turnover period is 15 days. The
highest inventory turnover ratio is 26.52:1 with
minimum Inventory Turnover period 14 days in the year
2018-19. It is observed that the inventory turnover ratio
of the companies is fluctuating over the study period
except. However, it has been noticed that the inventory
turnover ratios are high for the Maruti Suzuki for all the
year taken under study. The average working capital
ratio is -0.02:1 for the period from2013-14 t02019-20.
The working capital of Maruti Suzuki India Limited is
negative for all over the period of study except 2013-14
which is result in negative average working capital ratio.
It indicates that company has not sufficient short-term
funds for fulfilling the sales done for that period.
The profitability ratio of the company is very
low. The average profitability ratio is 0.09:1 for the
period from 2013-14 to 2019-20. The highest
profitability ratio is 0.11:1 in the year 2019-20 and
lowest is 0.07:1 in the year 20113-14. It has been
observed that the profitability ratio of the company is
very low and reducing over the period, it almost
deteriorated.
VII. COMPARATIVE STUDY OF
WORKING CAPITAL PERFORMANCE
OF COMPANIES UNDER STUDY
The comparative study of working capital
performance of companies is done with analyses of table
1.9. and 1.10. i.e., for Evaluation of working capital
performance of Tata Motors Limited and Maruti Suzuki
India Limited with the use of financial ratios.
Current Ratio
Table 1.9. and table 1.10., presents the current
ratios of both the companies. The results show that there
is highly fluctuation in the current ratios of both the
companies. The average current ratio of Tata Motors is
0.53:1 while Average current ratio of Maruti Suzuki is
0.87:1. However, it can be clear from the results that
current ratios of Maruti Suzuki is better than Tata
Motors but current ratio of both the companies are below
the ideal current.
Quick Ratio Table 1.9. and table 1.10., presents the Quick
ratios of both the companies. The average Quick ratio of
Tata Motors is 0.30:1 while Average Quick ratio of
Maruti Suzuki is 0.62:1 However, it can be clear from
the results that Quick ratios of Maruti Suzuki is much
better than Tata Motors but Quick ratio of both the
companies are below the ideal Quick. Succinctly, it can
be deduced from the results that Maruti Suzuki has a
more liquidity position in comparison to Tata motors but
the ratios of both companies are not ideal and in doesn’t
have sound liquidity position as presented by Quick ratio
in all years.
Receivables Turnover Ratio Table 1.9. and table 1.10., presents the Account
Receivables Turnover Ratio and periods of both the
companies. The average Account Receivables Turnover
Ratio of Tata Motors is 25.52:1 with 15 days of average
Account Receivables Turnover periods while Average
Account Receivables Turnover Ratio of Maruti Suzuki is
45.64:1 with 8 days of average Account Receivables
Turnover Period. However, it can be clear from the
results that Account Receivables Turnover Ratio and
periods of Maruti Suzuki is better than Tata Motors.
Both the companies have efficient and effective
Receivable turnover period and ratio but Maruti Suzuki
has more efficient and Aggressive turnover ratio.
Inventory Turnover Ratio Table 1.9. and table 1.10., presents the
Inventory Turnover Ratio and periods of both the
companies. The average Inventory Turnover Ratio of
Tata Motors is 10.23:1 with 36 days of average
Inventory Turnover periods while Average Inventory
Turnover Ratio of Maruti Suzuki is 23.64:1 with 15 days
of average Inventory Turnover Period. However, it can
be clear from the results that Inventory Turnover Ratio
and periods of Maruti Suzuki is much better than Tata
Motors.
Working Capital Ratio Table 1.9. and table 1.10., presents the Working
Capital ratios of both the companies. The results show
that there is negative fluctuation in the Working capital
ratios of both the companies. The average Working
Capital ratio of Tata Motors is -0.22:1 while Average
Working Capital ratio of Maruti Suzuki is -0.02:1. It can
be clear from the results that Working Capital ratios of
both the companies are negative and there is requirement
to improve the working capital of the companies.
However, in compare to Tata Motors, the working
capital ratio of Maruti Suzuki is better.
Profitability Ratio Table 1.9. and table 1.10., presents the
Profitability ratios of both the companies. The results
show that there is fluctuation in the Profitability ratios of
both the companies, Where Tata motors has negative
Profitability ratio in the year 2014-15, 2016-17 and
2017-18 and remaining’s are positive and Maruti Suzuki
has positive but very low Profitability ratio all over the
years taken under study that is from 2013-14 to 2019-20.
International Journal of Engineering and Management Research e-ISSN: 2250-0758 | p-ISSN: 2394-6962
Volume-11, Issue-5 (October 2021)
www.ijemr.net https://doi.org/10.31033/ijemr.11.5.10
88 This Work is under Creative Commons Attribution-NonCommercial-NoDerivatives 4.0 International License.
The average Profitability ratio of Tata Motors is 0.01:1
while Average Profitability ratio of Maruti Suzuki is
0.09:1. It can be clear from the results that Profitability
ratios of both the companies are negative and low and
there is requirement to increase the profitability of the
companies. However, in compare to Tata Motors, the
Profitability ratio of Maruti Suzuki is better. It has been
observed that the profitability ratios of the companies are
very low and almost negative. It indicates that the
excessive direct or indirect cost, inadequate revenue or a
combination of both that the result of ineffective
working capital management which cause the
profitability ratio of the companies over the period of
study.
VIII. RECOMMENDATIONS
From the study numerous issues have been
identified with respect to the Working Capital
Management of the Tata motors limited & Maruti Suzuki
India Limited. In order to overcome these issues and
excel in their business following recommendations has
been suggested:
1. The chi-square test of both the companies has
shown there is an impact of net working capital
on revenue from operation but correlation co-
efficient between that has been found negative.
It has been recommended to the companies
under study to do proper analysis for the
investment in current assets and maintain their
current liabilities at optimum level.
2. The Current Ratio of both the companies is very
low. They may face a serious problem while
need to pay its current liabilities. So, both the
companies should try to maintain its Current
Ratio at ideal level so that they can pay its
liabilities when required to pay it.
3. Quick Ratio of both the companies is very low
than the standard ratio. They should try to
increase the investment in accounts receivables
and should make efficient use of cash balance.
4. The companies shall focus on the overall
management of the working capital as it has
been found that when the corelation between
the current ratio and profitability ratio is
positive, it also shows that the relationship is
insignificant and when the corelation between
the current ratio and profitability ratio is
negative, it shows that the relationship is
insignificant.
5. The companies shall implement the various
techniques of inventory management which
includes Economic order Quality, ABC
Analysis, Inventory Turnover Ratio and many
more as it has been shown that there is scope of
improvement in the inventory maintenance.
6. The companies shall focus on the cash
management to maintain the liquidity position
as the liquidity ratios of the companies has been
shown negative ratios and below the ideal
accepted ratios for the period of study.
7. The companies shall focus on the accounts
receivable management and maintain the
optimum level of accounts receivable.
8. The company shall evaluate credit policy by
using various term periods, sales during that
period and other factor to identify the credit
period which gives the maximum benefits.
9. Profitability of both the companies are found to
be low. Hence in order to increase their
profitability, the companies may produce and
sell wide range of products up to the
expectation of customers.
10. The companies should try to element the
unnecessary expenses as it affects the
profitability ratios of the companies.
IX. CONCLUSION
Working capital management refers to all the
strategies adopted by the company to manage the
relationship between its short-term assets and short-term
liabilities with the objective to ensure that it continues
with its operations and meet its debt obligations when
they fall due.From the present study of the working
capital management of Tata Motors limited and Maruti
Suzuki limited, it is observed that there is need of proper
working capital management and its tools and
techniques.
It has been found that there is a positive impact
of working capital on sales and profitability of the
companies. In the comparative study of working capital
management of Tata Motors and Maruti Suzuki India
limited has been found that the Maruti Suzuki has
performed better compare to the tata motors limited.
Hence it has been concluded the Maruti Suzuki is well
better in compare to Tata Motors. However, there is
wide scope for both the companies for the improvement
in the working capital management.
REFERENCES
Books:
[1] Bhalla v. k (2009), Working capital management
(Text and Cases). New Delhi, India: Anmol Publications
Pvt. Ltd.
[2] Bhattacharya Hrishikesh. (2008). Working capital
management (Strategies and techniques), New Delhi,
India: PHI Learning Private Limited.
Journals:
[3] Jafari Fatemeh & Rao D. Prabhakar. (2015). Study
the relation between working capital system and
profitability in auto manufacturing industry in India.
Journal of Resources Development and Management.
Available at:
https://core.ac.uk/download/pdf/234696046.pdf.
International Journal of Engineering and Management Research e-ISSN: 2250-0758 | p-ISSN: 2394-6962
Volume-11, Issue-5 (October 2021)
www.ijemr.net https://doi.org/10.31033/ijemr.11.5.10
89 This Work is under Creative Commons Attribution-NonCommercial-NoDerivatives 4.0 International License.
[4] Kalaivani P. & Jothi K. (2017). Impact of working
capital management on profitability of the select car
manufacturing companies in India. International
Journal of Pure and Applied Mathematics. Available at:
https://acadpubl.eu/jsi/2017-116-23-24/articles/24/2.pdf/.
[5] Manokaran P. & Paramasivam J. (2016). Working
capital management of indian automobile industry – with
special reference to selected automobile companies.
Scholars. Journal of Economics-Business and
Management. Available at: http://saspjournals.com/wp-
content/uploads/2017/01/SJEBM-312648-653.pdf.
[6] Nobanee, Alzaabi Haitham, Alremeithi Hamdan,
Abdulla Ateeq, Azim Mohamed, & Ismaili Dunia.
(2021). Working capital management ratios: A
comparative study between tesla and NIO. Available at:
https://papers.ssrn.com/sol3/papers.cfm?abstract=37634
82.
[7] Untwal Nitin. (2020). Variables affecting working
capital management of tata motors: factor analysis
approach using r programming. IJIRT, 6(10). Available
at: https://ssrn.com/abstract=3553948. (Accessed on 18-
03-21 at 2pm.
Websites:
[8]
https://business.mapsofindia.com/automobile/. (accessed
on 05-03-21 at 7pm).
[9]
https://corporatefinanceinstitute.com/resources/knowled
ge/finance/profitability-ratios/. (accessed on 02-05-21 at
6pm).
[10]
https://quickbooks.intuit.com/in/resources/finance-and-
accounting/understanding-liquidity-ratio-
analysis/.(accessed on 02-05-21 at 6pm).
[11]
https://www.ascgroup.in/industries/automobile-industry/.
(accessed on 05-03-21 at 6pm).
[12]
https://www.brainkart.com/article/Measurements-of-
Trends--Method-of-Least-Squares_39018/. (accessed on
18-06-21 at 2pm).
[13]
https://www.statisticshowto.com/probability-and-
statistics/correlation-coefficient-formula/. (accessed on
06-06-21 at 2pm).
[14]
https://www.symboinsurance.com/blogs/car-
insurance/evolution-automobile-industry-india/.
(accessed on 18-03-21 at 6pm).
[15]
https://www.upcounsel.com/average-working-capital.
(accessed on 18-03-21 at 6pm).
[16]
www.marutiSuzuki.com. (accessed on 18-03-21 at 2pm).
[17]
www.tatamotors.com. (accessed on 18-03-21 at 2pm).
Annual Returns
[18]
https://marutistorage.blob.core.windows.net/marutisuzuk
ipdf/Maruti%20AR%202014%20cover%20to%20cover
%20dt%2006-08-14%20Deluxe.pdf. (accessed on 21-03-
21 at 10 pm).
[19]
https://marutistoragenew.blob.core.windows.net/msilinti
webpdf/Maruti_AR_2014-
15_Cover_to_cover_for_website_06-08-15.pdf.
(accessed on 21-03-21 at 10 pm).
[20]
https://marutistoragenew.blob.core.windows.net/msilinti
webpdf/Maruti_Suzuki_Annual_Report_2015-16.pdf.
(accessed on 21-03-21 at 10 pm).
[21]
https://marutistoragenew.blob.core.windows.net/msilinti
webpdf/Maruti_AR2016-17_Dlx_Medium.pdf.
(accessed on 21-03-21 at 10 pm).
[22]
https://marutistoragenew.blob.core.windows.net/msilinti
webpdf/MSIL_AR_2017-18_HR.pdf. (accessed on 21-
03-21 at 10 pm).
[23]
https://marutistoragenew.blob.core.windows.net/msilinti
webpdf/Integrated_Report_2018_19_High.pdf.
(accessed on 21-03-21 at 10 pm).
[24]
https://marutistoragenew.blob.core.windows.net/msilinti
webpdf/Maruti-Suzuki-Annual-Integrated-Report-2019-
20-High-res.pdf. (accessed on 21-03-21 at 10 pm.)
[25]
https://www.tatamotors.com/investors/annual-
reports/?annual_report_search=annual_report_search&ar
eport_year=2014. (accessed on 18-03-21 at 2pm).
[26]
https://www.tatamotors.com/investors/annual-
reports/?annual_report_search=annual_report_search&ar
eport_year=2015. (accessed on 18-03-21 at 2pm).
[27]
https://www.tatamotors.com/investors/annual-
reports/?annual_report_search=annual_report_search&ar
eport_year=2016. (accessed on 18-03-21 at 2pm).
[28]
https://www.tatamotors.com/investors/annual-
reports/?annual_report_search=annual_report_search&ar
eport_year=2017. (accessed on 18-03-21 at 2pm).
[29]
https://www.tatamotors.com/investors/annual-
reports/?annual_report_search=annual_report_search&ar
eport_year=2018. (accessed on 18-03-21 at 2pm).
[30]
https://www.tatamotors.com/investors/annual-
reports/?annual_report_search=annual_report_search&ar
eport_year=2019. (accessed on 18-03-21 at 2pm).
[31]
https://www.tatamotors.com/investors/annual-
reports/?annual_report_search=annual_report_search&ar
eport_year=2020. (accessed on 18-03-21 at 2pm).
Top Related
Copyright © 2022 FDOKUMEN

