


Bahasa
Halaman
Hukum

arX
iv:c
ond-
mat
/051
1679
v3 [
cond
-mat
.mtr
l-sc
i] 1
2 D
ec 2
005
A comparative study of the energetics of CO on stepped and
kinked Cu surfaces using density functional theory
Faisal Mehmood1, Abdelkader Kara1, Talat S. Rahman1 and Klaus Peter Bohnen2
1116 Cardwell Hall, Department of Physics,
Kansas State University, Manhattan, Kansas 66506-2600, USA
2Forschungszentrum Karlsruhe, Institut fuer Festkoerperphysik, D-76021 Karlsruhe, Germany
(Dated: January 19, 2014)
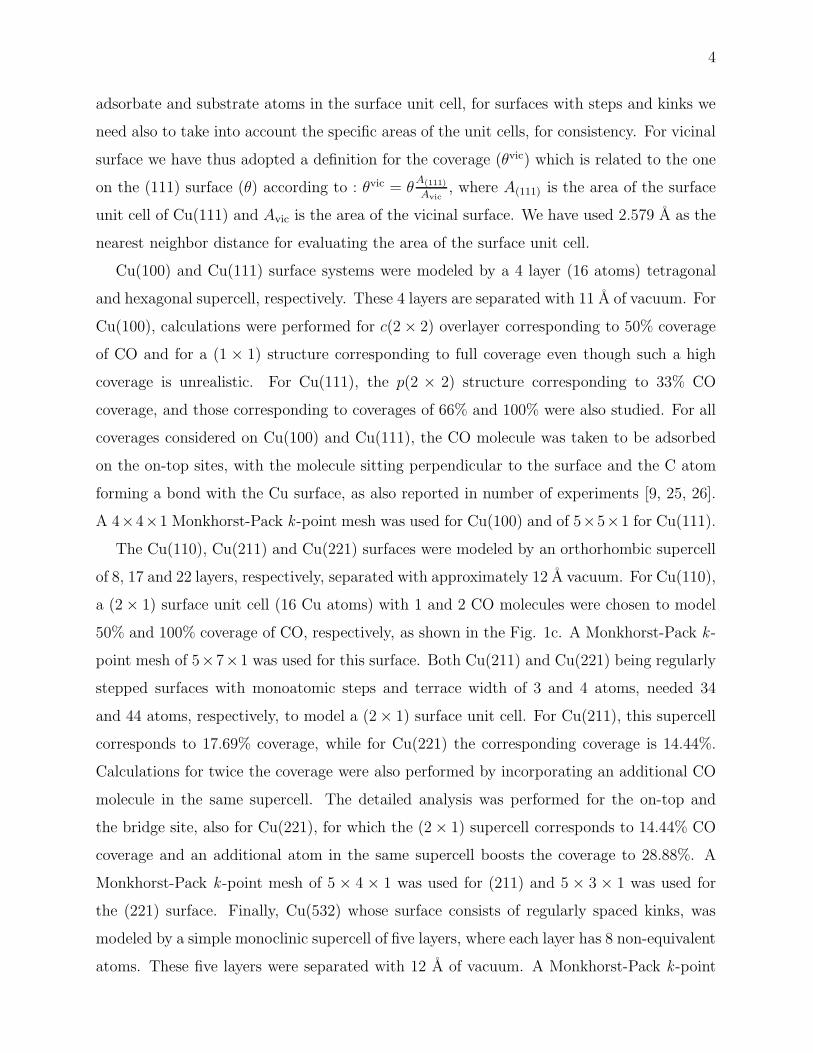
Our ab initio calculations of CO adsorption on several low and high Miller index
surfaces of Cu show that the adsorption energy increases as the coordination of the
adsorption site decreases from 9 to 6, in qualitative agreement with experimental
observations. On each surface the adsorption energy is also found to decrease with
increase in coverage, although the decrement is not uniform. Calculated vibrational
properties show an increase in the frequency of the metal-C mode with decrease in
coordination, whereas no such effect is found for the frequency of the CO stretch
mode. Examination of the surface electronic structure shows a strong local effect of
CO adsorption on the local density of state of the substrate atoms. We also provide
some energetics of CO diffusion on Cu(111) and Cu(211).
PACS numbers: 73.20.—r
I. INTRODUCTION
Investigation of CO adsorption on well-defined transition metal surfaces has been of great
academic interest for several decades [1, 2, 3, 4, 5, 6, 7] because of the molecule’s obvious
relevance to many industrial processes and as a prototype reactant in studies aiming to
provide an understanding of catalytic reactions [3, 4, 5]. These experimental and theoretical
[6, 7] studies have considered the importance of identifications of ’active sites’ based on
examination of adsorption and desorption energies and sticking coefficients [3, 4, 5]. Since
real catalysts consist of small metal clusters with microfacets of various orientations, the
catalyst surface is generally far from that of one with a low Miller index, rather it contains
defects like steps and kinks which may play specific roles in determining its reactivity [8]. A

2
plausible way to understand systematically the effect of steps and kinks on chemisorption is
to undertake the examination of CO adsorption on a set of vicinal surfaces, as has been done
in a recent thermal deposition spectroscopy (TDS) study on Cu surfaces. These experimental
studies find a dependence of the CO binding energy on the coordination of the adsorption
site, but surprisingly the effect does not extend to the least undercoordinated sites, namely
that of CO on the kink-sites on Cu(532). Vollmer et. al. [9] find hardly any difference in
the adsorption energy for CO on a step and a kink site atom implying that coordination
alone may not account for the adsorption energy on this vicinal surface. As proposed by
Bagus et. al. [10] in their study of CO adsorption on Cu(100), the repulsive interaction
between the O atom and the s states of the substrate can also play an important role in
determining the trends in the adsorption energy. Similarly in the extensive study of CO
adsorption on the (111) surface of several transition metals, Gajdos et. al. [11] argue that
the extent of the shift of the 4σ and 5σ orbital charge density from the C-O bond to the
region below the carbon (metal surface) may control the adsorption energetics. Of course,
an in-depth understanding of the effect of the local electronic and geometric structure on
CO adsorption may be obtained from the application of established theoretical methods
such as those based on density functional theory [12, 13] to the set of Cu surfaces studied
in these experiments. Such calculations may raise some concerns since on the low Miller
index surfaces of Cu they have been found to: a) show preference for the hollow site [14],
while the top site is preferred in the analysis of experimental data [9]; b) overestimates the
CO adsorption energy [11, 14]. Very recently several groups [14, 15, 16] have attempted to
supplement DFT functionals in various ways so as to remedy the two above shortcomings
of DFT for this system with some success. Our intention in this paper is, however, to carry
out a systematic, comparative study of CO chemisorption on the on-top sites of a set of low
and high Miller index surfaces of Cu to see the trends in adsorption energies as a function
of local coordination and CO coverage. While these calculations have been motivated by
experimental data [9], we are also aware of theoretical work [10, 11, 15] on CO adsorption
on a few of the surfaces that we are considering here. Naturally, we will compare our results
to all available information that exists to date. In addition to the trends in CO adsorption
energy on Cu surfaces, we are also interested in the diffusion barrier for CO, since this is a
necessary step in any chemical reaction on the surface. A comparative study of the diffusion
of CO on Cu(111) and Cu(211) is thus presented. Also, given the interest in reactions at and

3
near steps and kinks on surfaces we have carried out an examination of CO on several sites
near these defects. We are also including in this work the effect of CO adsorption on the
nature of atomic relaxations of the vicinal surface, to see how the trends in the relaxation
patterns correlate with those in the surface electronic structure.
After giving the computational details of our work in next section, we present a detailed
analysis of the calculated CO adsorption energies as a function of local coordination and
their comparison to experiments and other calculations. This is followed by investigations
of the implication of increasing CO coverage on adsorption energetics. Rest of the paper
is devoted to the characterization of the changes in the surface electronic structure (local
density of states, workfunctions) on CO adsorption. The vibrational frequencies of CO are
also presented on the set of surfaces.
II. COMPUTATIONAL METHODS
Ab initio calculations performed in this study are based on the well-known density func-
tional theory (DFT) [12, 13]. For purposes here, a systematic study of the energetics and
the electronic structure of a set of Cu surfaces of varying geometry was made by solving
Kohn-Sham equations in plane-wave basis set using the Vienna ab initio simulation pack-
age (VASP) [17, 18, 19]. The electron-ion interactions for C, O and Cu are described by
ultrasoft pseudopotentials proposed by Vanderbilt [20]. A plane-wave energy cut-off of 400
eV was used for all calculations and is found to be sufficient for these systems [11, 21]. In
all calculations reported in this article, the generalized gradient correction of Perdew and
Wang [22] (PW91) was used since it has been shown to give results for adsorption energetics
and structural parameters which are in better agreement with experiment as compared to
those obtained using the local density approximation (LDA) [14, 23]. The calculated bulk
lattice constant for Cu was found to be 3.6471 A and the Brillouin zone sampling of the
total energy was based on the technique devised by Monkhorst and Pack [24] for all bulk
calculations with a k -point mesh of 10 × 10 × 10.
The supercell approach with periodic boundaries is employed to model the surface sys-
tems. To calculate the total energies for several coverages of CO, we have used surface
unit cells consisting of 2 − 8 atoms per layer. While the definition of the coverage for the
low Miller index surfaces is conceptually easy and simply defined as the ratio of number of
4
adsorbate and substrate atoms in the surface unit cell, for surfaces with steps and kinks we
need also to take into account the specific areas of the unit cells, for consistency. For vicinal
surface we have thus adopted a definition for the coverage (θvic) which is related to the one
on the (111) surface (θ) according to : θvic = θA(111)
Avic, where A(111) is the area of the surface
unit cell of Cu(111) and Avic is the area of the vicinal surface. We have used 2.579 A as the
nearest neighbor distance for evaluating the area of the surface unit cell.
Cu(100) and Cu(111) surface systems were modeled by a 4 layer (16 atoms) tetragonal
and hexagonal supercell, respectively. These 4 layers are separated with 11 A of vacuum. For
Cu(100), calculations were performed for c(2 × 2) overlayer corresponding to 50% coverage
of CO and for a (1 × 1) structure corresponding to full coverage even though such a high
coverage is unrealistic. For Cu(111), the p(2 × 2) structure corresponding to 33% CO
coverage, and those corresponding to coverages of 66% and 100% were also studied. For all
coverages considered on Cu(100) and Cu(111), the CO molecule was taken to be adsorbed
on the on-top sites, with the molecule sitting perpendicular to the surface and the C atom
forming a bond with the Cu surface, as also reported in number of experiments [9, 25, 26].
A 4×4×1 Monkhorst-Pack k -point mesh was used for Cu(100) and of 5×5×1 for Cu(111).
The Cu(110), Cu(211) and Cu(221) surfaces were modeled by an orthorhombic supercell
of 8, 17 and 22 layers, respectively, separated with approximately 12 A vacuum. For Cu(110),
a (2 × 1) surface unit cell (16 Cu atoms) with 1 and 2 CO molecules were chosen to model
50% and 100% coverage of CO, respectively, as shown in the Fig. 1c. A Monkhorst-Pack k -
point mesh of 5×7×1 was used for this surface. Both Cu(211) and Cu(221) being regularly
stepped surfaces with monoatomic steps and terrace width of 3 and 4 atoms, needed 34
and 44 atoms, respectively, to model a (2 × 1) surface unit cell. For Cu(211), this supercell
corresponds to 17.69% coverage, while for Cu(221) the corresponding coverage is 14.44%.
Calculations for twice the coverage were also performed by incorporating an additional CO
molecule in the same supercell. The detailed analysis was performed for the on-top and
the bridge site, also for Cu(221), for which the (2 × 1) supercell corresponds to 14.44% CO
coverage and an additional atom in the same supercell boosts the coverage to 28.88%. A
Monkhorst-Pack k -point mesh of 5 × 4 × 1 was used for (211) and 5 × 3 × 1 was used for
the (221) surface. Finally, Cu(532) whose surface consists of regularly spaced kinks, was
modeled by a simple monoclinic supercell of five layers, where each layer has 8 non-equivalent
atoms. These five layers were separated with 12 A of vacuum. A Monkhorst-Pack k -point

5
mesh of 3 × 4 × 1 was used and CO was adsorbed on top of the Cu atom at the kink site
which is the experimentally proposed preferred site [9]. Two coverages (10.76% and 21.52%)
of CO on Cu(532) were modeled by adsorbing one and two molecules, respectively, on the
kink site (and on a site very next to kinked site).
Since vicinal surfaces provide local environments with a range of coordinations and a
hierarchy of adsorption sites may exist on them [27], we have carried out calculations for
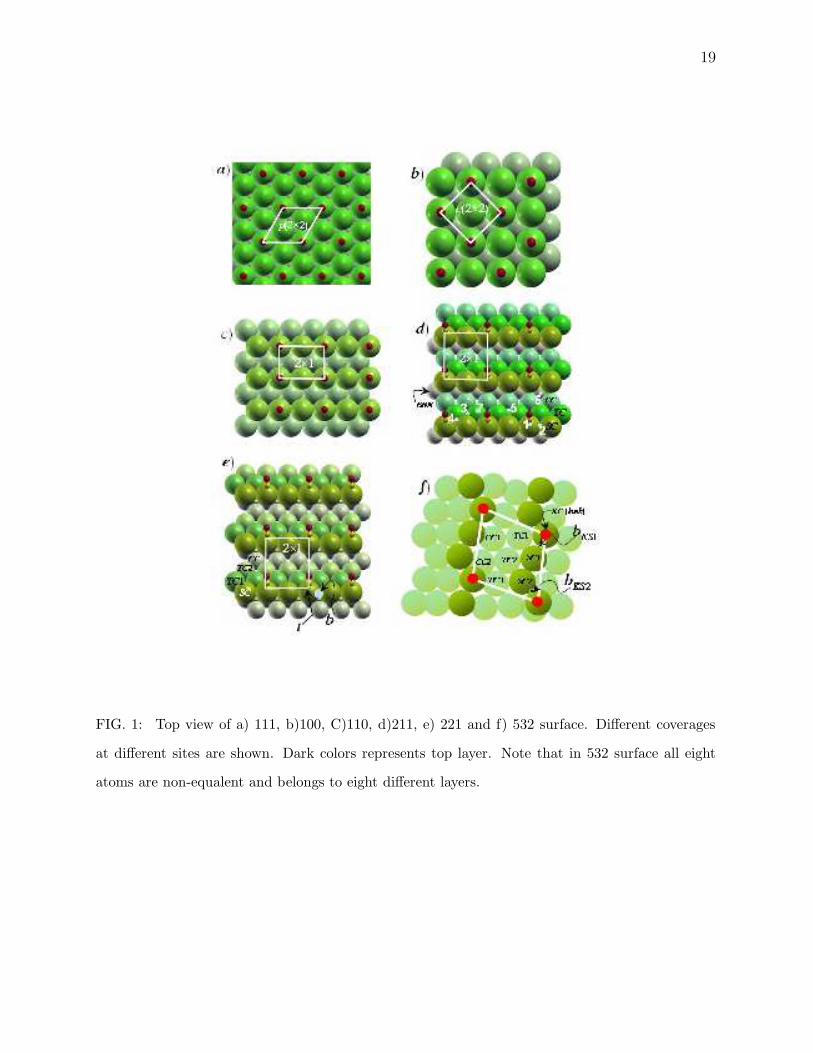
one of the stepped surfaces, Cu(211), for eight different sites as indicated in Fig. 1d. Since
these results point to a preference for the bridge site, for Cu(221) and Cu(532) we have
calculated adsorption energies for the bridge sites, in addition to the on-top site.
In order to calculate the total energy of the system for a relaxed configuration, atoms
on all surfaces considered were allowed to move in all three directions and the structures
were relaxed until the forces acting on each atom were converged to better that 0.02 eV/A.
The adsorption energies were calculated by subtracting the total energy of the CO-molecule
and that of the corresponding fully relaxed clean-Cu surface system from the total energy
of CO/Cu surface system Ead = ECO/Cu − ECO − ECu. Another quantity of interest, the
workfunction, was calculated by taking the difference of the average vacuum potential and
Fermi energy for each surface. Finite difference method was used to obtain vibrational
frequencies of the CO molecule in the gas phase and on the surfaces. CO internal stretching
and CO-metal stretch frequencies were calculated in the direction perpendicular to the
surface. To analyze the nature of the bonding between CO and the Cu-atoms, local density
of states were also obtained. A Gaussian function of 0.2 eV width was used to smoothen
the local density of states (LDOS).
III. RESULTS AND DISCUSSION
As already mentioned above, the collection of surfaces studied here provide variation of
adsorption sites with coordination ranging from 6 to 9. The kink sites with coordination
6 on Cu(532) are particularly interesting because of their unexpected results from TDS
measurements [9]. Also of significance is the fact that the step edges of Cu(211) and Cu(221)
represent the two different microfacets of monoatomic steps on fcc(111) surfaces. Cu(211)
has the (100)-microfacet while Cu(221) has the (111)-microfacet. It will be interesting to see
if such differences in their geometry affect the energetics of CO on these surfaces. In Table
6
I, we have compared our calculated CO bond length and the corresponding surface-carbon
distance for these three surfaces. While the C-O bond length remains insensitive to the local
geometry and coordination, C-Cu bond is much shorter for bridge (b) then ontop (t) site
adsorption. As for Cu(532) there are two non equivalent bridge sites labeled by bKS1 and
bKS2 in Table I and Fig. 1f. The C-O bond lengths are very close to the ones calculated
by others [25, 26]. When CO is adsorbed on the bridge site on the three vicinal surfaces,
the CO bond length slightly increases and the carbon-surface distance decreases. Earlier
DFT calculations for CO on Cu(211) also find the same trend [21]. The only available date
[28, 29, 30] of bond lengths is for the low Miller index surfaces and is in good agreement
with our calculated value of 1.16 A for the C-O bond length and 1.85 A and 1.86 A C-Cu
bond for Cu(111) and Cu(100), respectively. When compared to vicinal surfaces, we do not
see any difference for C-O bond length and a small variation within 0.02 A for C-Cu bonds.
A small increase of 0.02 A was seen in C-Cu bond when CO coverage was increased from
33% to 100% whereas when coverage is doubled from 50% in Cu(100) and Cu(110), we see
only 0.01 A increase in C-Cu bonds and no change was found in C-O bond lengths.
A. Adsorption Energies
Our calculated CO adsorption energies on various Cu surfaces and their surface atomic
coordination is summarized in Table II. The lowest coordinated and in turn the most favor-
able for CO adsorption is the kink atom on Cu(532) (Fig. 1f), with the highest adsorption
energy of 0.98 eV at a coverage of 10.75% CO (i.e. one CO molecule/per kink atom). The
calculated adsorption energy for this case is found to be particularly higher than what has
been seen experimentally. Although overestimation of adsorption energies is typical of DFT
based calculations, it is expected that the qualitative behavior would be similar. For CO
adsorption on the steps of Cu(110), Cu(211) and Cu(221) with atomic coordination 7, our
calculations find Ead to be about 0.86 ± 0.01 eV, while experimental values are around 0.6
eV. For adsorption on the kink site we predict an increase in Ead while experiments [9] find
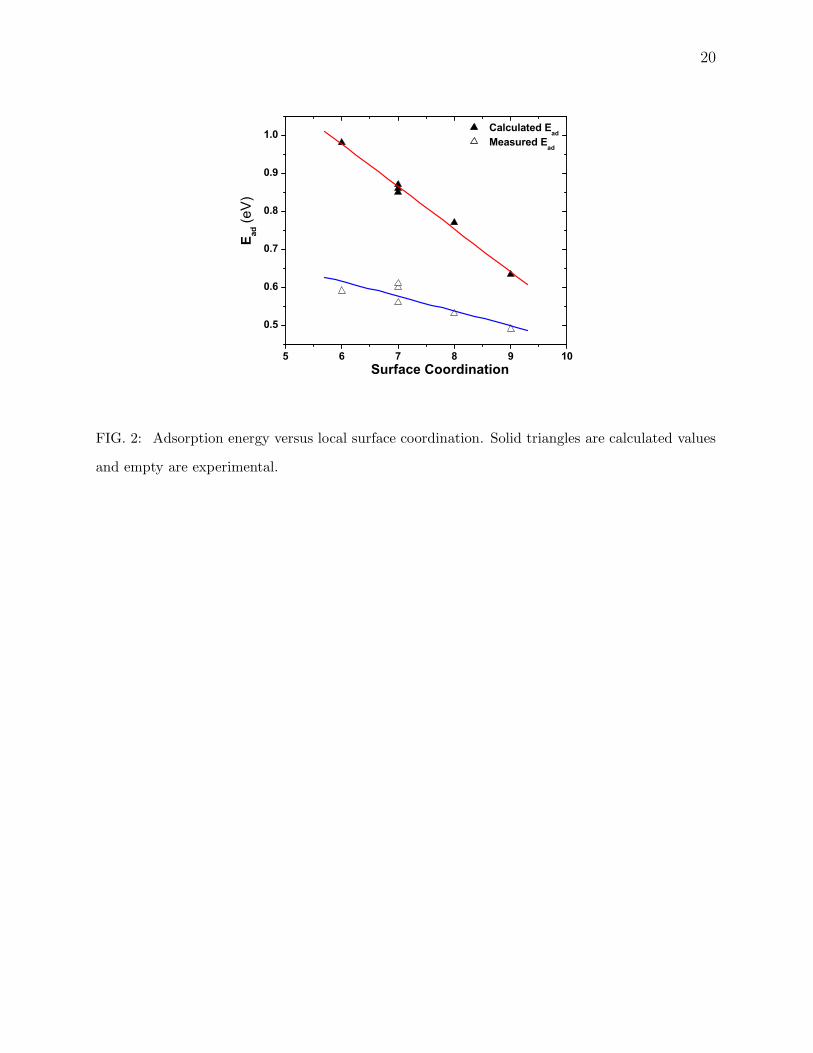
it to be same as for the steps. As is clear from Fig. 2 our calculated values scale nicely with
the surface coordination and the variation is larger than that extracted from experimental
data, which is plotted in Fig. 2 for comparison. The natural question is why this differ-
ence between theory and experiment. We offer here a few rationale. For example, there
7
is the possibility that site blocking by another CO could lead to smaller measured value
on an open surface like Cu(532). To test the viability of this proposition, we adsorbed an
additional CO molecule on a site next to the kink site (SC1 in Fig. 1f) which increased
the coverage to 21.5%. As we see in Table II, this leads to a decrease in the adsorption
energy to 0.85 eV which is very close to what we find for Cu stepped surfaces. The variation
of the adsorption energy with coverage is quite remarkable for all surfaces considered. For
Cu(221) Ead changes from 0.85 eV for 14.5% coverage to 0.65 for 29% coverage. Although
DFT studies of CO adsorption on Cu(110) and Cu(211) have already been reported in the
literature [11, 15, 21, 31], for consistency we have included them in Table II. Though we
have used the same (2× 1) cell for Cu(211), this leads to a different coverage (17.69%) from
that on Cu(221) because of the difference in the terrace width. The same (2 × 1) cell used
for Cu(110) (with [110] being x and [100] being y-directions), as shown in Fig. 1c, results
in a 50% coverage. The CO molecule is adsorbed on the top site on Cu(110) and Cu(211),
as shown in Fig. 1d and 1e. Our calculated adsorption energies are within 20 meV of each
other for all of cases involving atoms with coordination 7. For Cu(211) our calculated value
is somewhat smaller than in Ref. [11] which may be associated with the differences in cal-
culational details. For CO adsorption on Cu(110) Liem et. al. [31] obtained an adsorption
energy of 0.95 eV for the same coverage and on-top site. The discrepancy with our results
could be due to the usage of fewer layers and smaller k -point mesh and energy cut-off in
their calculations. For example, we find the adsorption energy to change from 0.87 eV to
0.89 eV when we reduce the number of layers in our supercell from 8 to 6 (note that a three
layer slab was used in Ref. [31]). Also, we have found an energy cut-off of 300 eV to be
not sufficient to provide converged results for the total energy for open surfaces such as the
(110). A cut-off of at least 400 eV (value used in all our calculations) is required for accurate
determination of adsorption energies.
For the next surface in this hierarchy Cu(100) whose surface atoms have coordination
8, we obtain an adsorption energy of 0.77 eV for a 50% CO coverage. This result is again
higher than the experimental value which ranges, between 0.5 and 0.57 eV [26, 32]. On the
other hand, our result is close agreement with the calculated value of 0.863 eV found for
a smaller coverage of 0.25 ML by Gajdos and Hafner [15], using the same DFT technique.
Finally, we turn to Cu(111) which has a surface atoms with coordination 9 and displays the
lowest adsorption energy of all surfaces discussed here. For this particular surface, we have

8
used the experimentally studied p(2 × 2) overlayer which corresponds to 33% CO coverage.
For 0.25 ML coverage an adsorption energy of 0.74 eV has already been reported [11]. The
small difference from our result of 0.634 eV may be assigned to the difference in coverage,
and is consistent with a decrease of adsorption energy with an increase of coverage. The
clear trend of increasing adsorption energy with decreasing local coordination can be seen
from the plot in Fig. 2 where solid triangles are our calculated values and empty triangles
are the one from the experiment [9].
As expected we find a hierarchy of adsorption sites on Cu(211). The bridge site (labeled
2 in Fig. 1d) was found to be slightly preferred over on-top by ∼ 0.06 eV. The sites labeled
3 (fcc-hollow) and 4 (hcp hollow near step edge), in Fig 1d were the next preferred with
adsorption energies of 0.78 and 0.89 eV, respectively. The least favorable site on this surface
was found to be the site labeled 6 which is between two step edges and two corner atoms
and has highest number of bonds with the carbon atom and an adsorption energy of 0.56
eV. On Site 5, 7 and 8 adsorption energies are very close to each other ranging from 0.6
- 0.65 eV. The adsorption site with the highest coordination is the corner atom (CC) on
Cu(211) with effective surface coordination of 10, and labeled as site # 8 in Fig. 1d for
which we find the adsorption energy to be the lowest of all (0.617 eV), consistent with the
above discussion. Note that we find the bridge site to be also preferred by about 0.08 eV
over the on-top site for CO adsorption on Cu(221). On the other hand, for Cu(532) which
has two non-equivalent bridge sites referred as bKS1 and bKS2 in Table II and Fig. 1f, we
find the adsorption energy to be 0.94 eV which is less than that on the kink site.
In all cases, adsorption energies drop by 130−250 meV when the coverage is doubled for
these high Miller index surfaces. Various experiments already show the strong dependence
of adsorption energy on CO coverage on Cu surface [33, 34, 35]. The electron energy loss
spectroscopy (EELS) experiment of Peterson et. al. [34] shows a 50% decrease in adsorption
energy for 0.3ML increase in CO coverage for Cu(100).
B. CO diffusion on metal surface
One of the experimental techniques to determine the adsorption energies is the tempera-
ture programmed desorption (TPD). It is hence desirable to develop a techniques by which
TPD spectra are calculated for a given system. For the case of low Miller index surfaces,

9
the task may be trivial as only a limited number of processes are involved. But for the case
of real surfaces with steps and kinks, the situation become more cumbersome. To achieve
a realistic description of TPD spectra from these surfaces, one needs to calculate not only
adsorption energies for sites with different local environments, but also activation energies
associated with different diffusion paths. As we have reported above, the CO molecules
adsorb preferably near kinks and steps, and it is hence rarely that CO molecules sit on the
down side of the terrace (sites 6 and 8 in Fig. 1d). The relevant energies are hence those
associated with diffusion on Cu(111) and near the step of a Cu vicinal surface. Here we have
in mind systems dominated by the presence of (111) facets and step edges. The knowledge
of these activation energies along with the different adsorption energies will constitute the
base for kinetic Monte Carlo simulations that will determine the TPD spectra. In order to
reach this goal, the energy landscape for the diffusion of CO on Cu(111) and Cu(211) sur-
faces were calculated. Since we were interested in describing the motion of the CO molecule
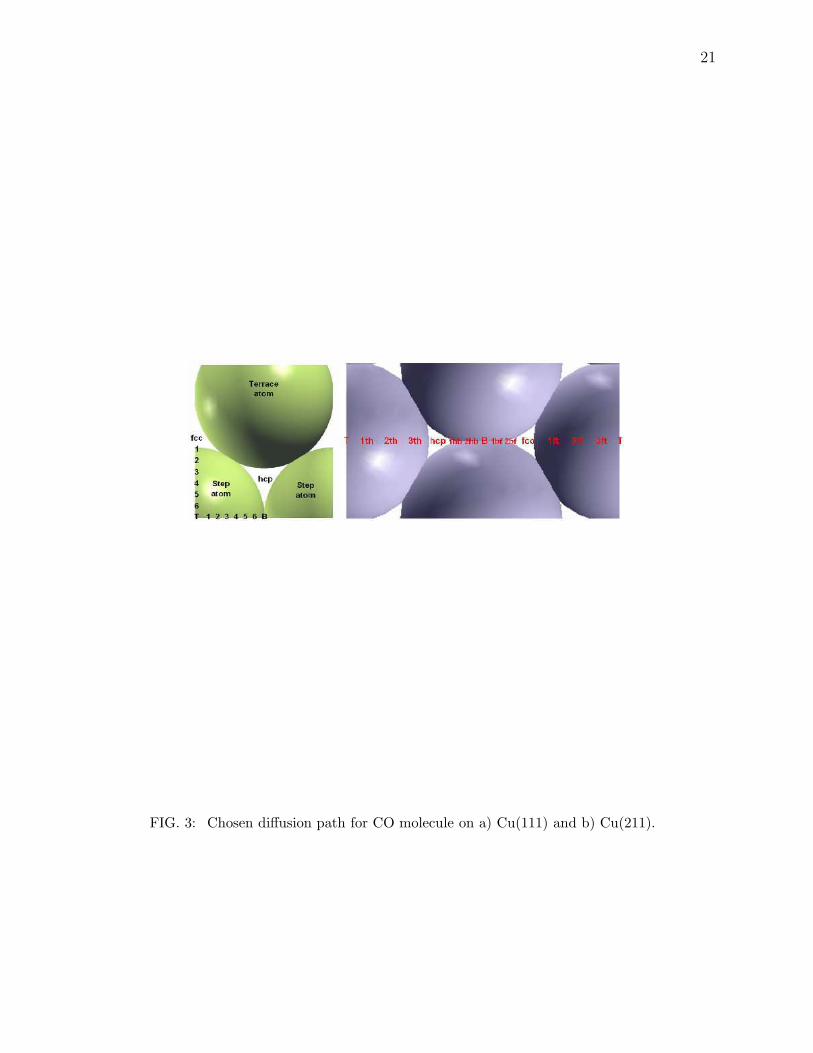
between the equilibrium sites, the path on Cu(111) was chosen to be from one top site to the
adjacent one, passing through fcc-hollow, bridge, and hcp hollow sites (Fig. 3). All layers of
the metal surface, and C and O atoms were allowed to relax fully in all three directions on
high symmetry sites. For the intermediate sites only carbon atom was fixed in one direction
and rest of the system was allowed to relax fully. Three intermediate points between the top
and the bridge site and two points for each bridge - fcc-hollow and bridge - hcp-hollow were
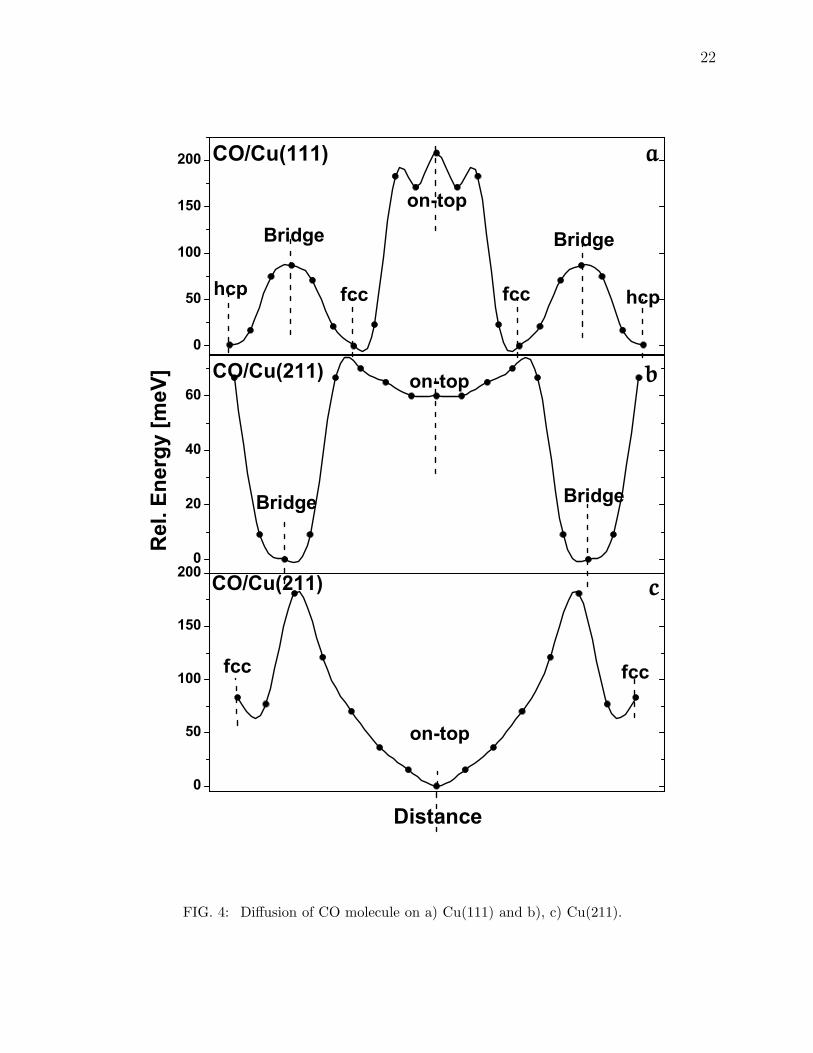
calculated, as shown in Fig.4a. The relative energy profile of the CO molecule on Cu(111) is
shown in Fig. 4a. As in previous studies, our calculations based on DFT with GGA indicate
that CO prefers to sit on fcc hollow site instead of the top site. However, our calculations
show a barrier of about 200 meV to go from the hollow to the top site and less than 100
meV to go from the hollow to the bridge site. Fig. 4b and 4c, show the one dimensional
energy landscape for the CO molecule on Cu(211). Two diffusion paths are chosen in this
case: a) top - bridge - top (along the step edge) and b) top - fcc-hollow (away from the
step). Fig. 4b indicates that diffusion from bridge to top is more favorable than from top to
hollow with diffusion barrier about 60 meV compared about 200 meV barrier for diffusion
from top to hollow site. These results indicate that CO molecules are more free to roam on
the step edge of Cu(211) than away from it.
10
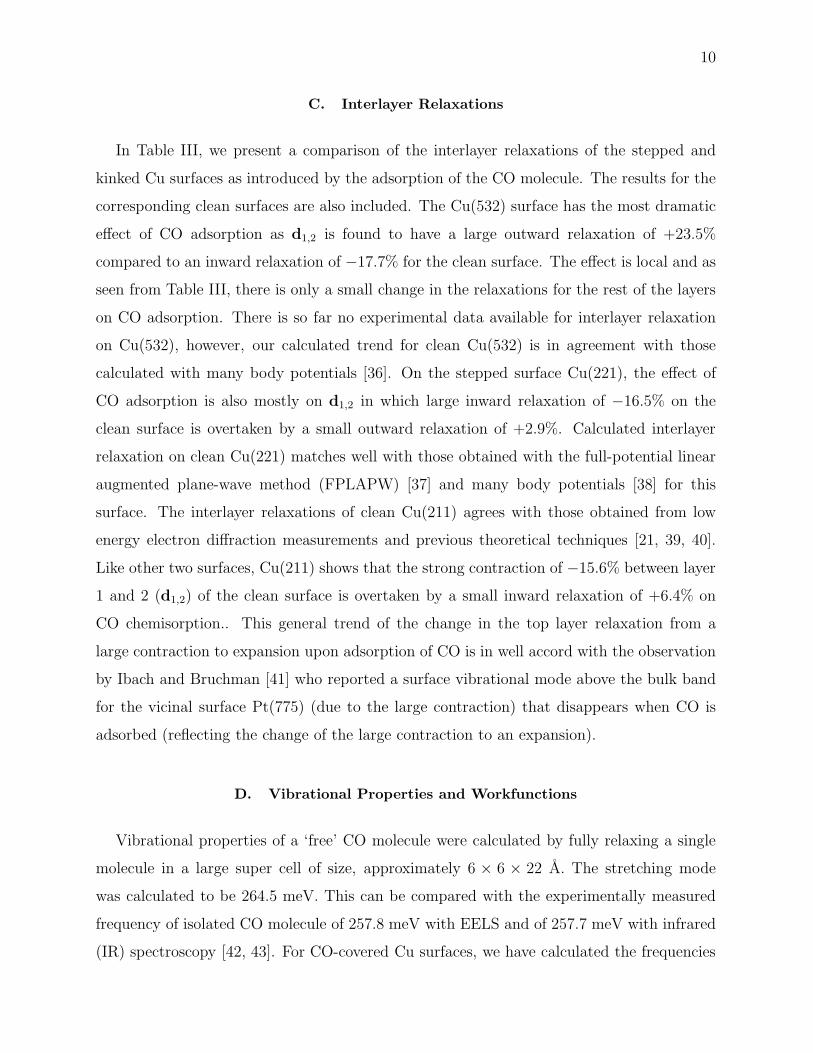
C. Interlayer Relaxations
In Table III, we present a comparison of the interlayer relaxations of the stepped and
kinked Cu surfaces as introduced by the adsorption of the CO molecule. The results for the
corresponding clean surfaces are also included. The Cu(532) surface has the most dramatic
effect of CO adsorption as d1,2 is found to have a large outward relaxation of +23.5%
compared to an inward relaxation of −17.7% for the clean surface. The effect is local and as
seen from Table III, there is only a small change in the relaxations for the rest of the layers
on CO adsorption. There is so far no experimental data available for interlayer relaxation
on Cu(532), however, our calculated trend for clean Cu(532) is in agreement with those
calculated with many body potentials [36]. On the stepped surface Cu(221), the effect of
CO adsorption is also mostly on d1,2 in which large inward relaxation of −16.5% on the
clean surface is overtaken by a small outward relaxation of +2.9%. Calculated interlayer
relaxation on clean Cu(221) matches well with those obtained with the full-potential linear
augmented plane-wave method (FPLAPW) [37] and many body potentials [38] for this
surface. The interlayer relaxations of clean Cu(211) agrees with those obtained from low
energy electron diffraction measurements and previous theoretical techniques [21, 39, 40].
Like other two surfaces, Cu(211) shows that the strong contraction of −15.6% between layer
1 and 2 (d1,2) of the clean surface is overtaken by a small inward relaxation of +6.4% on
CO chemisorption.. This general trend of the change in the top layer relaxation from a
large contraction to expansion upon adsorption of CO is in well accord with the observation
by Ibach and Bruchman [41] who reported a surface vibrational mode above the bulk band
for the vicinal surface Pt(775) (due to the large contraction) that disappears when CO is
adsorbed (reflecting the change of the large contraction to an expansion).
D. Vibrational Properties and Workfunctions
Vibrational properties of a ‘free’ CO molecule were calculated by fully relaxing a single
molecule in a large super cell of size, approximately 6 × 6 × 22 A. The stretching mode
was calculated to be 264.5 meV. This can be compared with the experimentally measured
frequency of isolated CO molecule of 257.8 meV with EELS and of 257.7 meV with infrared
(IR) spectroscopy [42, 43]. For CO-covered Cu surfaces, we have calculated the frequencies
11
of two modes: the metal - molecule (νC−Cu) stretch and the intra-molecular stretch (νC−O).
We find a small drop in the vibrational frequency as compared to that of the gas phase CO
due to the bonding on CO with the Cu surface atom. The frequencies of the CO vibrational
modes calculated for all surfaces are summarized in Table IV. For all cases in which CO
is adsorbed on the top site we see almost the same value of the CO stretching frequency
(νC−O), as expected. However, there is a small increase in (νC−Cu), with a decrease in the
coordination of the substrate atom. This is also to be expected since molecules adsorbed on
low coordinated sites will have stiffer bonds than those on highly coordinated sites. Whereas,
for the case of the bridge site, there is a decrease of approximately 14−16 meV in CO stretch
frequency, from that for top site, for all cases. In this case understood due to the molecule
strongly bonded with two surface atoms and being not as free to vibrate as on top site. The
drop in νC−Cu mode is also 2 − 4 meV greater than top site.
In Table V, we have summarized the calculated workfunctions for all Cu surfaces consid-
ered here, with and without the adsorbate along with available experimental values for clean
surfaces of Cu(100), Cu(111) and Cu(110). Our calculated workfunctions are smaller than
the experimental values of the known surfaces [44, 45, 46]. Our calculated values showed a
decrease in workfunctions for clean surfaces with decrease in coordination of substrate. A
similar kind of behavior can be seen in the experiments for (111), (100) and (110) surface
[44, 45, 46]. Our calculations also showed an increasing trend on workfunction when CO
is adsorbed on the surface. This effect is strongest for Cu(100) surface with workfunction
change of 0.57 eV for all other surfaces this change is less than 0.17 eV.
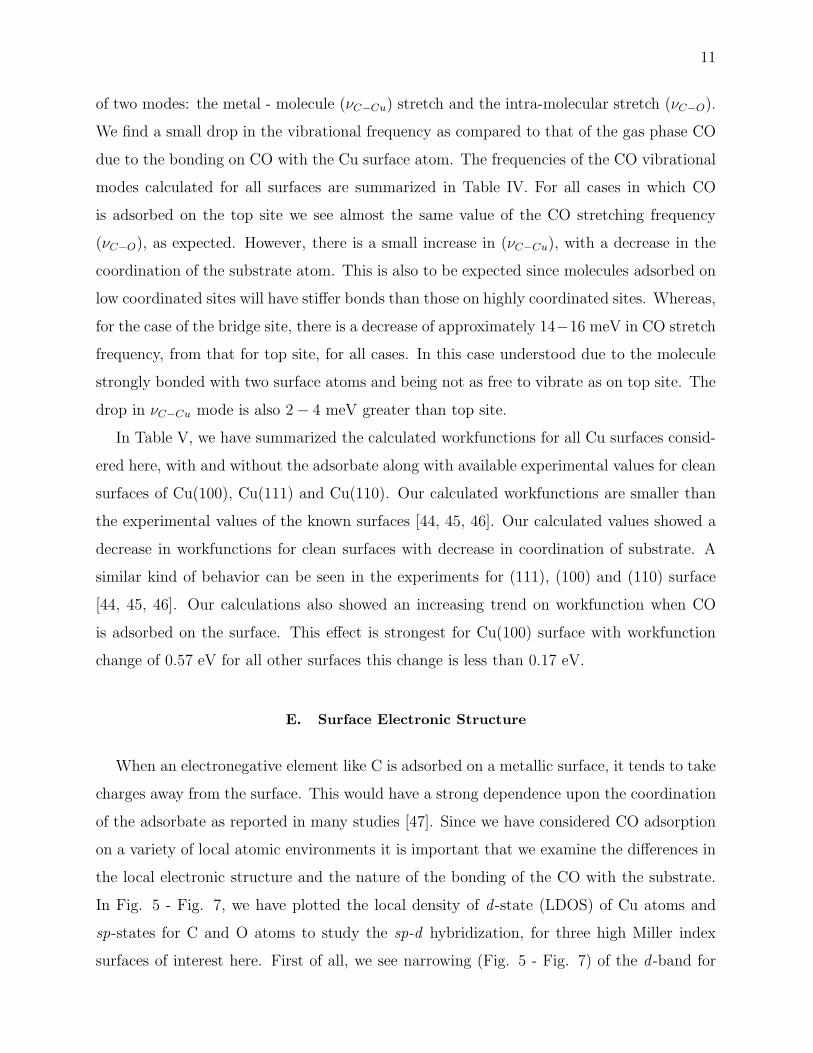
E. Surface Electronic Structure
When an electronegative element like C is adsorbed on a metallic surface, it tends to take
charges away from the surface. This would have a strong dependence upon the coordination
of the adsorbate as reported in many studies [47]. Since we have considered CO adsorption
on a variety of local atomic environments it is important that we examine the differences in
the local electronic structure and the nature of the bonding of the CO with the substrate.
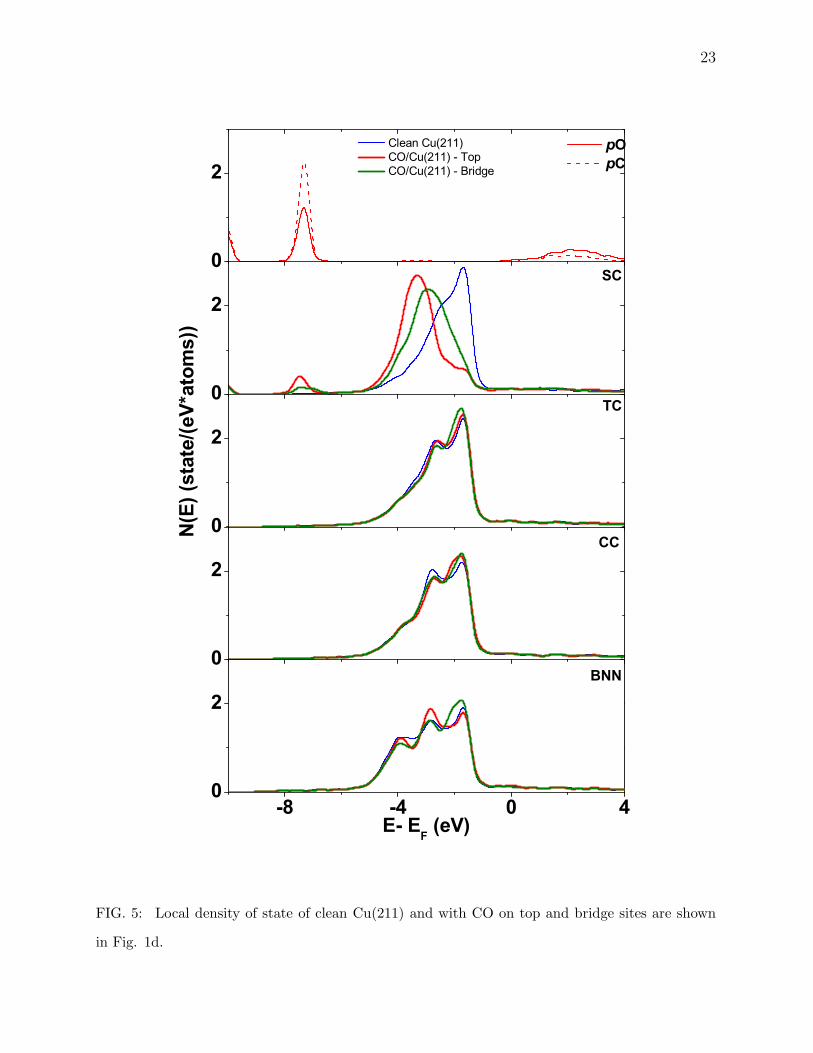
In Fig. 5 - Fig. 7, we have plotted the local density of d -state (LDOS) of Cu atoms and
sp-states for C and O atoms to study the sp-d hybridization, for three high Miller index
surfaces of interest here. First of all, we see narrowing (Fig. 5 - Fig. 7) of the d -band for
12
the lower coordinated surfaces, as seen by Tersoff et. al. [48] for their calculations of Ni and
Cu surfaces. The sp-state of C and O are split and have almost filled bonding band. These
states make sub-bands with d -state of Cu surface in all case which can be seen to appear
at the same low energies as for CO case. This affect is found to be more localized on flat
surfaces but on stepped surfaces, even though CO is adsorbed on top site we see a small
change in redistribution of LDOS for next layer atom, which can be caused due to the small
inter layer separation i.e. 0.296 A for (532) as compared to the biggest 2.1 A for (111) case.
The next layer atom being so close to CO also experiences some affect of the adsorbate.
This could well describe the different adsorption energies with different coordination. Along
with this electronic charge density distribution and LDOS for these atoms we can safely say
that this difference for flat (high coordinated sites) and stepped and kinked (low coordinated
sites) could serve as the basis of different adsorption energies.
IV. CONCLUSIONS
In this paper, we have presented the results of a detailed theoretical investigation of
CO adsorption on three low Miller index surfaces, namely, (111), (100), (110), two stepped
surfaces, (211) and (221), and a kinked (532) surface of Cu. The CO was adsorbed on exper-
imentally observed preferred sites to explain trends in adsorption energies due to different
geometrical and chemical structure. Our calculated values of adsorption energies show the
increasing trend with decrease in local coordination of surface atoms with Cu(532) being the
most favorable surface for CO adsorption with lowest coordination. However bridge sites of
Cu(211) and Cu(221) were found to be slightly preferred over top site which was not the
case for Cu(532). We also found a strong dependence of adsorption energy on coverage of
the adsorbate. Our calculations show a large decrease in adsorption energy with increase
in coverage. Our calculations of diffusion of CO molecule on metal surfaces indicate that
it diffuses much more easily along the step edge as compared to away from the step edge
(terrace). A very small drop in vibrational frequency of free molecule was noted when it was
adsorbed on the metal surface but difference within different surfaces was negligible due to
same on top adsorption site for all surfaces. Workfunction of adsorbate covered surface was
found to increase in all cases compared to the clean surface.
Acknowledgments
13
The authors would like to thank Dr. Sergey Stolbov and Dr. Claude R. Henry for
interesting and very helpful discussions. We also like to acknowledge financial support
from US Department of Energy under grant No. DE-FGO3-03ER15445 and computational
resources provided by National Science Foundation Cyberinfrastructure and TeraGrid grant
No. TG-DMR050018N.
[1] G. Blyholder, J. Phys. Chem. 68, 2772 (1964).
[2] P. S. Bagus, C. J. Nelin and C. W. Bauschlicher, Phys. Rev. B 28, 5423 (1983).
[3] S. M. Davis and G. A. Somorjai, in The Chemical Physics of Solid Surfaces, edited by D. A.
King and D. A. Woodruff (Elsevier, Amsterdam, 1982), Vol. 4.
[4] J. C. Campazona, in The Chemical Properties of Solid Surfaces and Heterogenous Catalysis,
edited by D. A. King and D. P. Woodruff (Elsevier, Amsterdam, 1990), Vol. 3, Part A.
[5] H. Wagner, in Springer Tracts in Modern Physics, edited by G. Hoehler (Springer, Berlin,
1987).
[6] H. Over, Prog. Surf. Sci. 58, 249 (2001).
[7] S. Sung and R. Hoffmann, J. Am. Chem. Soc. 107, 578 (1985).
[8] C. R. Henry, Surf. Sci. Rep. 31, 231 (1998).
[9] S. Vollmer, G. Witte, C. Woll, Cat. Lett., 77, 97 (2001).
[10] P. Bagus and C. Woll, Chem. Phys. Lett. 294, 599 (1999).
[11] M. Gajdos, A Eichler, and J. Hafner, J. Phys.: Condens. Matter. 16, 1141 (2004).
[12] P. Hohenberg and W. Kohn, Phys. Rev. 136, 864 (1964).
[13] W. Kohn and L. J. Sham, Phys. Rev. 140, A1133 (1965).
[14] F. Favot, A. D. Corso, and A. Baldereschi, J. Chem. Phys. 114, 483 (2001).
[15] M. Gajdos and J. Hafner, Surf. Sci., 590, 117 (2005).
[16] S. E. Mason, I. Grinberg, and A. M. Rappe, Phys. Rev. B 69, 161401 (2004).
[17] G. Kresse and J. Hafner, Phys. Rev. B 47, 558 (1993).
[18] G. Kresse and J. Furthmuller, Comput. Mater. Sci. 6, 15 (1996).
[19] G. Kresse and J. Furthmueller, Phys. Rev. B 54, 11169 (1996).
[20] D. Vanderbilt, Phys. Rev. B. 41, 7892 (1990).
[21] M. Gajdos, A. Eichler, J. Hafner, G. Meyer, and K-H Rieder, Phys. Rev. B. 71, 035402 (2005).

14
[22] J. P. Perdew, J. A. Chevary, S. H. Vosko et al., Phys. Rev. B 46, 6671 (1992).
[23] P. Fouquet, R. A. Olsen, and E. J. Baerends, J. Chem. Phys. 119, 509 (2003).
[24] H. J. Monkhorst and J. D. Pack, Phys. Rev. B 13, 5188 (1976).
[25] J. Braun, A. P. Graham, F. Hofmann, W. Silvestri, J. P. Toennies, and G. Witte, J. Chem.
Phys., 105, 3258 (1996).
[26] A. P. Graham, F. Hofmann, J. P. Toennies, G. P. Williams, C. J. Hirschmugl, and J. Ellis, J.
Chem. Phys. 108, 7825 (1998).
[27] S. Stolbov, F. Mehmood, T. S. Rahman, M. Alatalo, I. Makkonen, and P. Salo, Phys. Rev. B
70, 155410 (2004).
[28] E. J. Moler, S. A. Kellar, W. R. A. Huff, Z. Hussain, Y. Chen, and D. A. Shirley, Phys. Rev.
B 54, 10862 (1996).
[29] S. Andersson and J. B. Pendry, Phys. Rev. Lett. 43, 363366 (1979).
[30] C. F. McConville, D. P. Woodruff, K. C. Prince, G. Paolucci, V. Chab, M. Surman, and A.
M. Bradshaw, Surf. Sci. 166, 221 (1986).
[31] S. Y. Liem and J. H. R. Clarke, J. Chem. Phys. 121, 4339 (2004).
[32] A. Fohlisch, W. Wurth, M. Stichler, C. Keller, and A. Nilsson, J. Chem. Phys. 121, 4848
(2004).
[33] J. C. Tracy, J. Chem. Phys. 56, 2748 (1972).
[34] L. D. Peterson and S. D. Kevan, Surf. Sci. Lett. 235, L285 (1990).
[35] C. M. Truong, J. A. Rodriguez, and D. W. Goodman, Surf. Sci. Lett. 271, L385 (1992).
[36] F. Mehmood, A. Kara, T. S. Rahman, to be published.
[37] J. L. F. Da Silva, K. Schroeder, and S. Blugel, Phys. Rev. B 70, 245432 (2004).
[38] I. Y. Sklyadneva, G. G. Rusina, and E. V. Chulkov, Surf. Sci. 416, 17 (1998).
[39] S. Durukanoglu, A. Kara, and T. S. Rahman, Phys. Rev. B 55, 13894 (1997).
[40] T. Seyller, R. D. Diehl, and F. Jona, J. Vac. Sci. Technol. A 17, 1635 (1999).
[41] H. Ibach and D. Bruchmann, Phys. Rev. Lett. 41, 958 (1978).
[42] C. J. Hirschmugl, G. P. Williams, F. M. Hoffmann, and Y. J. Chabal, Phys. Rev. Lett. 65,
480 (1990).
[43] R. Raval, S.F. Parker, M.E. Pemble, P. Hollins, J. Pritchard, and M.A. Chesters, Surf. Sci.
203, 353 (1988).
[44] C. J. Fall, N. Binggeli, and A. Baldereschi, Phys. Rev. B 61, 8489 (2000).

15
[45] R. Arafune, K. Hayashi, S. Ueda, and S. Ushioda, Phys. Rev. Lett. 92, 247601 (2004).
[46] W. Mantz, James K. G. Watson, K. Narahari Rao, D. L. Albritton, A. L. Schmeltekopf, and
R. N. Zare, J. Mol. Spectrosc. 39, 180 (1971).
[47] A. Fohlisch, M. Nyberg, J. Hasselstrom, O. Karis, L. G. M. Pettersson, and A. Nilsson, Phys.
Rev. Lett. 85, 3309 (2000).
[48] J. Tersoff and L. M. Falicov, Phys. Rev. B 24, 754 (1981).
16
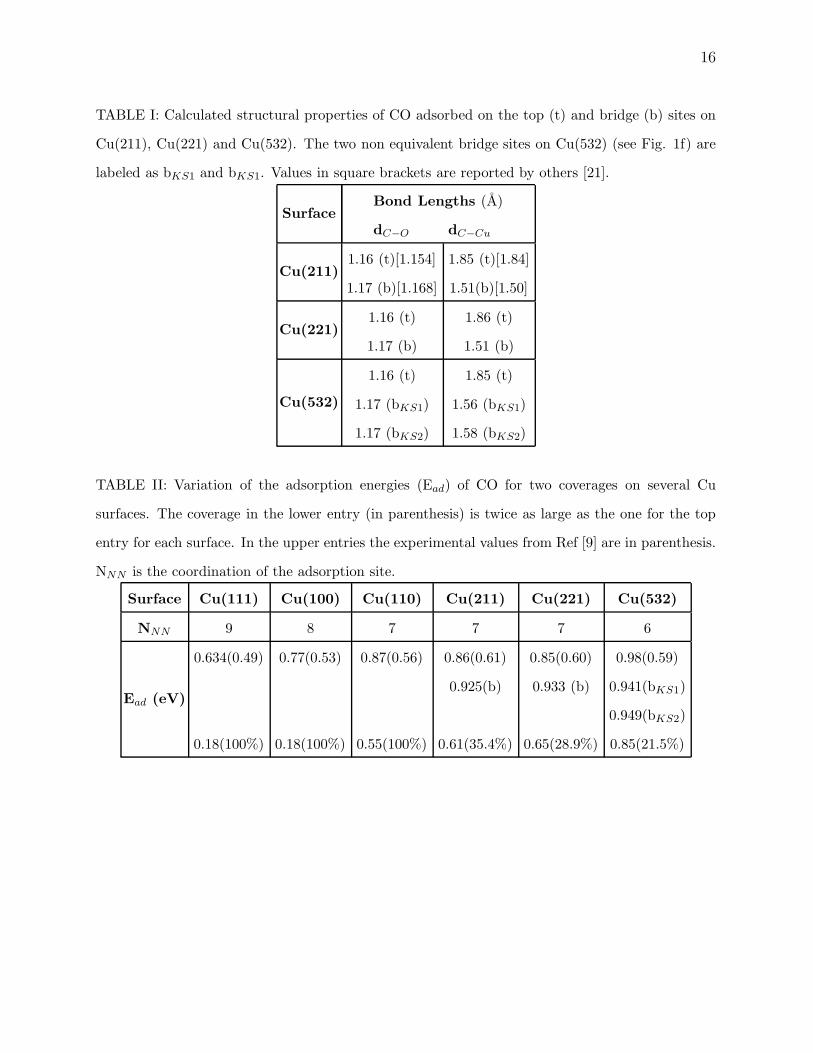
TABLE I: Calculated structural properties of CO adsorbed on the top (t) and bridge (b) sites on
Cu(211), Cu(221) and Cu(532). The two non equivalent bridge sites on Cu(532) (see Fig. 1f) are
labeled as bKS1 and bKS1. Values in square brackets are reported by others [21].
SurfaceBond Lengths (A)
dC−O dC−Cu
Cu(211)1.16 (t)[1.154]
1.17 (b)[1.168]
1.85 (t)[1.84]
1.51(b)[1.50]
Cu(221)1.16 (t)
1.17 (b)
1.86 (t)
1.51 (b)
Cu(532)
1.16 (t)
1.17 (bKS1)
1.17 (bKS2)
1.85 (t)
1.56 (bKS1)
1.58 (bKS2)
TABLE II: Variation of the adsorption energies (Ead) of CO for two coverages on several Cu
surfaces. The coverage in the lower entry (in parenthesis) is twice as large as the one for the top
entry for each surface. In the upper entries the experimental values from Ref [9] are in parenthesis.
NNN is the coordination of the adsorption site.
Surface Cu(111) Cu(100) Cu(110) Cu(211) Cu(221) Cu(532)
NNN 9 8 7 7 7 6
Ead (eV)
0.634(0.49)
0.18(100%)
0.77(0.53)
0.18(100%)
0.87(0.56)
0.55(100%)
0.86(0.61)
0.925(b)
0.61(35.4%)
0.85(0.60)
0.933 (b)
0.65(28.9%)
0.98(0.59)
0.941(bKS1)
0.949(bKS2)
0.85(21.5%)

17
TABLE III: Comparison of clean and CO covered % multilayer relaxations.
di,i+1 Cu(211) CO/Cu(211) Cu(221) CO/Cu(221) Cu(532) CO/Cu(532)
d1,2 −15.6 +6.4 −16.5 +2.9 −17.7 +23.5
d2,3 −11.4 −15.7 −1.9 −10.2 −18.9 −18.8
d3,4 +11.3 +0.2 −15.2 −9.5 −12.7 −16.2
d4,5 −4.1 +6.9 +18.8 +6.0 −15.0 −12.0
d5,6 −2.0 −3.9 −2.9 +3.8 −15.0 −16.6
d6,7 +2.0 −1.8 −6.1 −2.7 −1.4 −3.9
d7,8 −2.1 +1.8 +2.5 +2.0 +1.9 −5.2
d8,9 +0.1 −0.6 +2.3 −4.4 +25.0 +16.4
d9,10 −0.9 +2.2 −9.7 +9.6
d10,11 +2.0 +1.0 −2.9 −6.6
d11,12 +0.8 −1.1 −4.7 −5.4
d12,13 −0.1 −2.0 −0.6
d13,14 +0.2 −3.3
d14,15 −1.1 −2.9
d15,16 +0.1 +3.7
d17,18 +1.1 −4.2
d18,19 −1.8 +2.3
d19,20 −1.6 −4.8
d20,21 −0.7 +1.1

18
TABLE IV: Calculated CO frequencies. νC−O is for the streching mode of the CO molecule and
νC−Cu is between the surface and the CO-molecule. Here ’t’ and ’b’ represent the top and bridge
sites (see Fig. 1).
SurfaceVibrational Frequency (meV)
νC−O νC−Cu
Cu(211)251.2 (t)
236.2 (b)
40.3 (t)
38.4 (b)
Cu(221)251.0 (t)
235.5 (b)
40.1 (t)
36.7 (b)
Cu(532)
252.1 (t)
235.7 (bKS1)
233.9 (bKS2)
41.0 (t)
36.0 (bKS1)
36.4 (bKS2)
TABLE V: Calculated workfunctions (eV) for clean Cu surface and CO adsorbed surfaces along
with the available experimental values in parenthesis. The experimental values are taken from
[43, 44, 45].
Surface (111) (100) (110) (211) (221) (532)
Clean 4.89 (4.98) 4.63 (4.65) 4.49 (4.52) 4.57 4.58 4.48
With CO 4.93 4.67 4.68 4.72 4.75 4.64
19
FIG. 1: Top view of a) 111, b)100, C)110, d)211, e) 221 and f) 532 surface. Different coverages
at different sites are shown. Dark colors represents top layer. Note that in 532 surface all eight
atoms are non-equalent and belongs to eight different layers.
20
5 6 7 8 9 10
0.5
0.6
0.7
0.8
0.9
1.0
E ad (e
V)
Surface Coordination
Calculated Ead Measured Ead
FIG. 2: Adsorption energy versus local surface coordination. Solid triangles are calculated values
and empty are experimental.
21
FIG. 3: Chosen diffusion path for CO molecule on a) Cu(111) and b) Cu(211).
22
0
20
40
60b
fcc
on-top
hcp
on-top
Bridge Bridge
BridgeBridge
on-top
Rel
. Ene
rgy
[meV
] CO/Cu(211)0
50
100
150
200 a
hcpfccfcc
CO/Cu(111)
0
50
100
150
200c
fcc
Distance
CO/Cu(211)
FIG. 4: Diffusion of CO molecule on a) Cu(111) and b), c) Cu(211).
23
-8 -4 0 40
2
E- EF (eV)
BNN0
2
CC0
2
N(E
) (st
ate/
(eV*
atom
s))
TC0
2SC
Clean Cu(211) CO/Cu(211) - Top CO/Cu(211) - Bridge
0
2
pO pC
FIG. 5: Local density of state of clean Cu(211) and with CO on top and bridge sites are shown
in Fig. 1d.
24
-8 -4 0 40
2
E - EF (eV)
BNN0
2
CC0
2
N(E
) (st
ate/
(eV*
atom
s))
TC20
2
TC10
2SC
Clean Cu(221) CO/Cu(221)-Top CO/Cu(221)-Bridge
0
2
pO pC
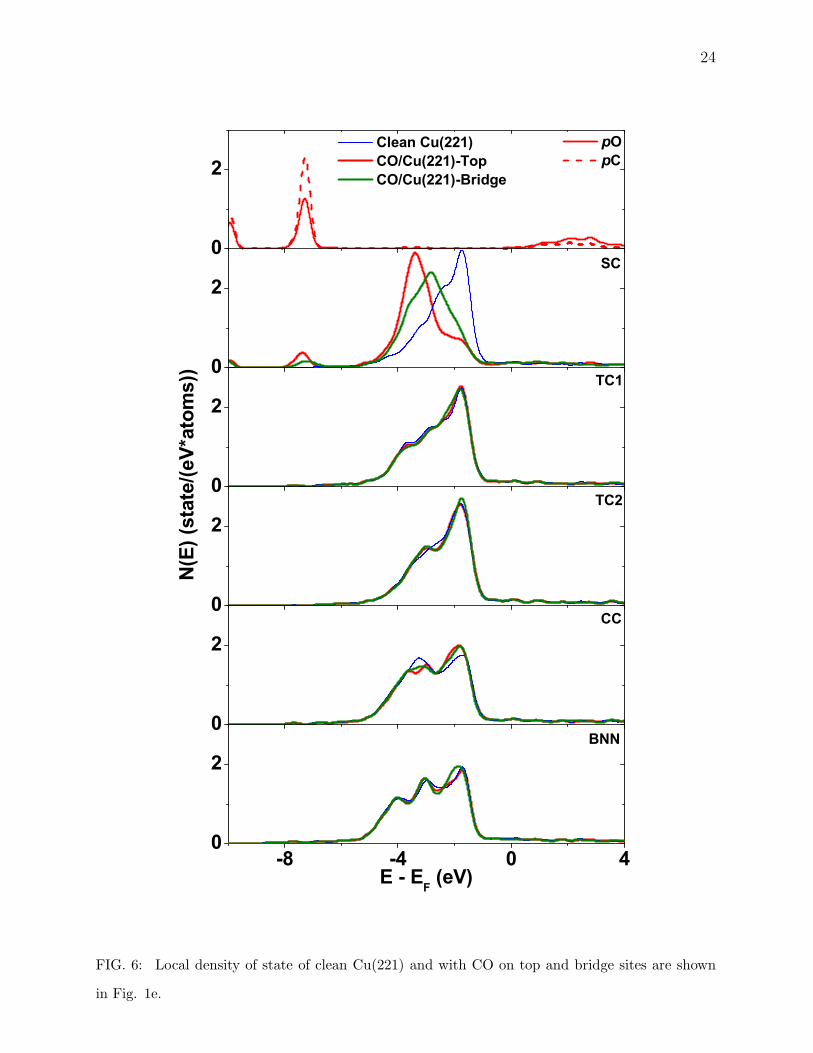
FIG. 6: Local density of state of clean Cu(221) and with CO on top and bridge sites are shown
in Fig. 1e.

25
-8 -4 0 40
2
E- EF (eV)
at40
2
at30
2
N(E
) (st
ate/
(eV*
atom
s))
at20
2
at1(kink atom)
Clean Cu(532) CO/Cu(532)-Top CO/Cu(532)-Bridge
12 CO/Cu(532)-Bridge
13
0
2
pC pO
FIG. 7: Local density of state of clean Cu(532) and with CO on top (kink) and two bridge sites
are shown in Fig. 1f.
Top Related
Copyright © 2022 FDOKUMEN

