


Bahasa
Halaman
Hukum


Hindawi Publishing Corporatione Scienti�c �orld �ournalVolume 2013, Article ID 685917, 14 pageshttp://dx.doi.org/10.1155/2013/685917
Research ArticleA Comparative Genomic Study in Schizophrenic and inBipolar Disorder Patients, Based onMicroarray ExpressionPro�lingMeta�Analysis
Marianthi Logotheti,1, 2, 3 Olga Papadodima,2 Nikolaos Venizelos,1
Aristotelis Chatziioannou,2 and Fragiskos Kolisis3
1 Neuropsychiatric Research Laboratory, Department of Clinical Medicine, Örebro University, 701 82 Örebro, Sweden2Metabolic Engineering and Bioinformatics Program, Institute of Biology, Medicinal Chemistry and Biotechnology,National Hellenic Research Foundation, 48 Vassileos Constantinou Avenue, 11635 Athens, Greece
3 Laboratory of Biotechnology, School of Chemical Engineering, National Technical University of Athens, 15780 Athens, Greece
Correspondence should be addressed toAristotelis Chatziioannou; [email protected] and Fragiskos Kolisis; [email protected]
Received 2 November 2012; Accepted 27 November 2012
Academic Editors: N. S. T. Hirata, M. A. Kon, and K. Najarian
Copyright © 2013 Marianthi Logotheti et al. is is an open access article distributed under the Creative Commons AttributionLicense, which permits unrestricted use, distribution, and reproduction in any medium, provided the original work is properlycited.
Schizophrenia affecting almost 1% and bipolar disorder affecting almost 3%–5% of the global population constitute two severemental disorders. e catecholaminergic and the serotonergic pathways have been proved to play an important role in thedevelopment of schizophrenia, bipolar disorder, and other related psychiatric disorders. e aim of the study was to perform andinterpret the results of a comparative genomic pro�ling study in schizophrenic patients as well as in healthy controls and in patientswith bipolar disorder and try to relate and integrate our results with an aberrant amino acid transport through cell membranes. Inparticularwe have focused on genes andmechanisms involved in amino acid transport through cellmembranes fromwhole genomeexpression pro�ling data. �e performed bioinformatic analysis on raw data derived from four different published studies. In twostudies postmortem samples from prefrontal cortices, derived from patients with bipolar disorder, schizophrenia, and controlsubjects, have been used. In another study we used samples from postmortem orbitofrontal cortex of bipolar subjects while the�nal study was performed based on raw data from a gene expression pro�ling dataset in the postmortem superior temporal cortexof schizophrenics. e data were downloaded from NCBI’s GEO datasets.
1. Introduction
Schizophrenia (SZ) and bipolar disorder (BD) are app-roached and studied as diseaseswith aberrant functions of theneurotransmitter systems, as neurodevelopmental diseasesor generally complex diseases caused by multiple geneticand environmental factors. Recently they have started to bestudied as systemic diseases; thus a combination of disturbedbiological systems and genes of small contribution is believedto cause their expression [1, 2].
Altered membrane composition of the cells, aberrantmembrane phospholipid metabolism [3, 4], dysfunctionaltyrosine, and other amino acid (AA) transport systems [5–11]
evidence the systemic nature of SZ disease. Moreover, failureof niacin skin test implying reduced arachidonic acid (ARA)in cell membranes of schizophrenics [12] and abnormalitiesin muscle �bers [13] constitute such indications. e sameholds for BD, which can also be considered a systemicdisease. Aberrant tyrosine, and other AA transport systems,in cells from BD disorder patients [14, 15], aberrant signaltransduction [16], and abnormal membrane compositionand metabolism support the notion of BD being a systemicdisease as well [17, 18].
Studying these disorders through this holistic approach,we presume themembrane phospholipid hypothesis, namely,that aberrant AA transport mechanisms and the disturbed

2 e Scienti�c �orld �ournal
cell membrane composition are highly correlated. AAs aretransported though cell membranes with speci�c trans-porter/protein transport systems, which perform activetransport of AAs from one side of the cell membrane to theother [19]. ese AA transporters are embedded in the cellmembranes; thus their structure and functionality interactwith the membrane composition and functionality, as wellas with membrane �uidity and enzymatic activity [9, 20].Particularly, a membrane defect would impact, for example,the functionality of the tyrosine transporters as well as thepermeability of the membranes [2, 5].
e Membrane eory. e membrane theory of mental dis-eases is related with two primary abnormalities: an increasedrate of removal of essential fatty acids (EFA) from themembrane phospholipids, combined with a reduced rate ofincorporation of fatty acids (FA) into membrane phospho-lipids [21]. Some SZ study �ndings that relate the expressionof the disease with the membrane hypothesis are studiesbased on postmortem and blood samples showing reductionof docosahexaenoic acid (DHA) and ARA in cell membranesindependently of the disease state and magnetic resonancespectroscopy (MRS) studies revealing decreased levels ofphosphomonoesters (phospholipid membrane synthesis pre-cursors) and higher levels of phosphodiesters (phospholipidmetabolism products) in SZ patients compared to controlpatients [22]. Also, the niacin skin �ush test is indicative ofa membrane dysfunction resulting in an in�ammatory dys-function [12]. In addition, phospholipase A2 (PLA) calcium(Ca) dependent type has been shown to have an increasedactivity and PLA Ca independent type a decreased activity.e latter is considered quite important �nding, as the A2enzyme catalyzes the breakdown of FA [23].
Similar �ndings suggest cell membrane dysfunction inBD. 31P-MRSmagnetic resonance spectroscopy (MRS) mea-sures phosphorus metabolites in the organs [24]. Phospho-monoester levels are measured in BD depressed patients withMRS. Phosphomonoesters are measured as being higher inthese patients compared to control subjects and lower inasymptomatic patients. Abnormal functionalities in signaltransduction pathways are also repeated in several studiesincluding overactivated phosphatidylinositol and G-proteinpathways, as well as altered membrane protein kinase C andadenyl cyclase enzyme pathways. PLA enzyme activity andCa release are involved in the membrane hypothesis of BD[17].
Amino Acid Transporters. e transport of AAs into the cellmembranes of the blood brain barrier (BBB) is mediated bymany transport systems.ree basic active transporters resultin the AA �ux from and into all types of cells (includingbrain cells). e primary active transport mechanism is anadenosine triphosphatase (ATPase) that exchanges sodium(Na) and potassium (K) ions, contributing in the mainte-nance of the ion gradients of the cells, known as sodium-potassium adenosine triphosphatase (Na,K-ATPase). eseion gradients in combination with other ions and gradientsare utilized by the secondary active transport mechanismsfor the in�ux of speci�c AAs into the cells. e secondary
active transport through these AA in�uxes sets also an AAconcentration gradient in the cells, which, in combinationwith Na+ exchange, is further utilized by the tertiary activetransport mechanisms for transport of another group ofAAs in and out of the cells. AAs may be transported viadifferent AA transport mechanisms. An alteration in any ofthe active transport mechanisms could result in an aberrantAA transport into the cells [10, 25].
Aim of the Study. e aim of our meta-analysis was tointerpret the results of comparative genomic pro�ling studiesin schizophrenic patients as compared to healthy controls andin patients with BD and try to relate and integrate our resultswith an aberrant AA transport through cell membranes.
2. Materials andMethods
2.1. Microarray Datasets. Four human datasets were used, bydownloading submitted rawdata (Cel �les) from correspond-ing studies, available at the Gene ExpressionOmnibus (GEO)database of National Center for Biotechnology Information(NCBI) [26].
(1) e �rst study has the GEO Accession numberGSE12654 and the microarrays preparation followedthe guidelines of MIAME in the way it is describedin [27]. RNA from postmortem brain tissues (Brod-mann’s Area 10) of 15 schizophrenic and 15 BDaffected patients and 15 control healthy subjectswas hybridized on Affymetrix HG-U95 Arrays. Aerquality control stage in this study, 11 schizophrenic,11 BD and 15 control subjects were used for furtherbioinformatic analysis.
(2) e second study has the GEO Accession numberGSE5389, and the microarrays preparation followedthe guidelines of MIAME in the way it is describedin [28]. RNA extracted from human postmortembrain tissue (Brodmann’s Area 11) from 15 adultsubjects with BD and 15 healthy control subjects washybridized to Affymetrix HG-U133A GeneChip toidentify differentially expressed (DE) genes in thedisease state. Aer quality control in this study, 10BD and 11 control subjects were used for furtherbioinformatic analysis.
(3) e third study has the GEO Accession numberGSE21935, and the microarrays preparation fol-lowed the guidelines of MIAME in the way it isdescribed in [29]. 60 postmortem RNA samplesderived from brain tissue (Brodmann’s Area 22) ofschizophrenic and control patients were hybridizedto the Affymetrix HG-U133 Plus 2.0 Array. Aerquality control stage samples from 19 control and 23SZ subjects were subjected to bioinformatic analysis.
(4) e fourth study has the GEO Accession numberGSE12649, and the microarrays preparation followedthe guidelines of MIAME in the way it is described in[30]. RNA samples were extracted from postmortembrain tissue (Brodmann’s Area 46) of 35 BD subjects,35 SZ subjects, and 35 healthy control subjects.
e Scienti�c �orld �ournal 3
e RNA was applied to the Affymetrix HG-U133AGeneChip. Aer quality control stage in this study,35 SZ, 33 BD samples, and 34 control samples were�nally subjected to bioinformatic analysis.
2.2. Analysis of Microarray Data. e raw signal intensitydata of each study were imported into the Gene Automatedand Robust MicroArray Data Analysis (Gene ARMADA)soware tool [31] for versatile, microarray data analysis.In order to extract the signal intensities from the rawdata, speci�c steps were followed: background correctionwas performed with the gcRMA method and was followedby Quantile normalization. e negative intensity valueswere treated with the minimum positive and noise methodand then summarization followed with the Median Polishmethod. e data were transformed in log2 values. In eachanalysis two experimental conditions were always selected:the disease condition and its corresponding control condi-tion. Genes that were characterized as absent in more than40% of the samples in each experimental condition wereexcluded from further analysis. e missing values wereimputed using the k-nearest neighbor (k-NN) algorithm. Allthe steps of the microarray analysis were common for all theextracted datasets.
2.3. Statistical Analysis. e probe sets that were differen-tially expressed in the disease samples compared to thecontrol healthy samples were selected by two-tailed Student’st-test. e lists of the DE probe sets were de�ned by applyingthe following criteria in each dataset: (i) 1.3 or greater-foldchange (FC) of the mean expression in all studies, except forthe fourth study of BD samples compared to controls withFC > 1.2 (small number of DE genes with stricter cutoff) and(ii) 𝑃𝑃 value threshold below 0.05.e 𝑃𝑃 value distribution foreach gene list was used to estimate the False Discovery Rate(FDR) levels. e �nal gene list corresponds to an FDR <0.05. e statistical analysis was also performed in the GeneARMADA soware.
2.4. Prioritized Pathway/Functional Analysis of DifferentiallyExpressed Genes. In order to derive better insight into thebiological processes related to the DE genes, the lists of sig-ni�cant genes from each microarray analysis were subjectedto statistical enrichment analysis using the Statistical Rank-ing Annotated Genomic Experimental Results (StRAnGER)web application [22]. is bioinformatic tool is using geneontology term (GOT) annotations and KEGG pathways aswell as statistical overrepresentation tests further corrected byresampling methods, aiming to select in a prioritized fashionthose GOTs and pathways related to the DE genes, that donot just have a high statistical enrichment score, but alsobear a high biological information, in terms of differentialexpression. Speci�cally gene ontology (GO) based analysisand KEGG-based analysis result in a list of GO terms andKEGG pathways, respectively, based on hypergeometric testswith values <0.05, which have been reordered according tobootstrapping to correct for statistical distribution-relatedbias.
2.5. Prioritizations of Putative Disease Genes. In order toprioritize the gene list of interest according to the functionalinvolvement of genes in various cellular processes, thusindicating candidate hubgenes, aer inferring the theoreticaltopology of the GOT-gene interaction network delineated,we used the online tool GOrevenge [32] with the followingsettings: Aspect: BP (Biological Process), Distance: Resnik,Algorithm: BubbleGene, and Relaxation: 0.15. By adoptingthese settings we are able to exclude from the interactionnetwork the bias relating to the presence of functionallyredundant terms, describing the same cellular phenotypictrait, and thus assessing the centrality, namely, the correlationof the speci�c genes to certain biological phenotypes in anobjective way.
Finally, BioGraph [33] is a data integration and data min-ing platform for the exploration and discovery of biomedicalinformation. e platform offers prioritizations of putativedisease genes, supported by functional hypotheses. BioGraphcan retrospectively con�rm recently discovered disease genesand identify potential susceptibility genes, without requiringprior domain knowledge, outperforming other text-miningapplications in the �eld of biomedicine.
3. Results and Discussion
3.1. Differentially Expressed Probesets. Aer the microarrayanalysis and the statistical selection, lists of DE probesetsfor each dataset occurred. From the �rst and fourth studies’analysis, four lists of signi�cantly differentiated probesetswere generated: two aer comparison of SZ and controlsubjects and two aer comparison of BD and control subjects.e second study (comparison of BD patients to controlsubjects) resulted also in a list of DE probesets and the thirdstudy in another list of DE probesets (SZ subjects comparedto control subjects). e differentiated probesets from eachcase are depicted in representative volcano plots (Figure 1).
3.1.1. Differentially Expressed Genes in Each Study. In post-mortem studies the alterations in the gene expression areusually lower than twofold [29]. For each study, transcripts ofinterest and of particular expression alterations are describedin the following paragraphs. e lists of DE genes for eachstudy are presented in Supplementary Tables 1–6 (availableonline at doi:10.1155/2013/685917). Information about theprotein products arising from the DE genes has been pro-videdmainly from the Reference Sequence (RefSeq) databaseof NCBI [34].
First Study. Statistical analysis of the gene expression pro�leof SZ and BD patients as compared to controls is summa-rized in Table 1. e number of DE genes is 196 and 134respectively.
In SZ patients, transcripts related to the membranehypothesis show altered expression. Lipases LPL and LIPA,downregulated phosphodiesterases ENPP2 and PDE8A,downregulated phosphoinositide PIK3R4, PNPLA4 phos-pholipase are related to membrane metabolic processes.ENPP2 and PDE8A dysregulation could also be related to

4 e Scienti�c �orld �ournal
0 1 2 30
0.5
1
1.5
2
2.5
3
3.5
4
Fold change (effect)
SZ versus control study 1
Data
UpregulatedDownregulated
Fold change cutoff value cutoff
− 2 − 1
−log10
(𝑃-v
alu
e)
(a)
0 1 2 30
0.5
1
1.5
2
2.5
3
3.5
4
Fold change (effect)
SZ versus control study 3
− 3− 2 − 1
Data
UpregulatedDownregulated
Fold change cutoff value cutoff
−log10
(𝑃-v
alu
e)
(b)
0 0.5 1 1.5 2 2.50
0.5
1
1.5
2
2.5
3
3.5
4
4.5
Fold change (effect)
SZ versus control study 4
− 1.5 − 1 − 0.5
Data
UpregulatedDownregulated
Fold change cutoffvalue cutoff
−log10
(𝑃-v
alu
e)
(c)
0 0.5 1 1.5
Fold change (effect)
BD versus control study 1
0
0.5
1
1.5
2
2.5
3
3.5
4
− 1 − 0.5
Data
UpregulatedDownregulated
Fold change cutoffvalue cutoff
−log10
(𝑃-v
alu
e)
(d)
0 1 2 30
1
2
3
4
5
6
7
Fold change (effect)
BD versus control study 2
− 2 − 1
Data
UpregulatedDownregulated
Fold change cutoffvalue cutoff
−log10
(𝑃-v
alu
e)
(e)
0 0.5 1 1.5
Fold change (effect)
BD versus control study 4
0
0.5
1
1.5
2
2.5
3
3.5
4
− 1.5 − 1 − 0.5
Data
UpregulatedDownregulated
Fold change cutoffvalue cutoff
−log10
(𝑃-v
alu
e)
(f)
F 1: Volcano plots of DE probesets, generated from two-tailed Student’s t-test. Upregulated genes in the disease state are depicted withred-colored spots and downregulated genes with green-colored spots. e �rst three plots (a, b, c) represent DE genes in SZ patients from�rst, third, and fourth studies, respectively, and the following three plots (d, e, f) represent DE genes in BD patients from �rst, second, andfourth studies, respectively. FC ratio between gene expression in disease state and healthy state is depicted in the horizontal axes for eachdataset in log2 scale, and 𝑃𝑃 values in −log10 scale are depicted in vertical axes. All plots are similar in most studies, except for plot (e), whichshows more green and red spots. is fact means that the number of DE genes is similar in most studies but in study 2 there is a greaternumber of statistically signi�cant genes in comparison to other plots.
previous MRS studies revealing different levels of phospho-diesters in SZ patients [23]. Some genes encoding proteins ofsignal transduction pathways, for example, downregulated Gprotein-coupled receptors GPR37 and GPRC5B, downregu-lated kinase activity encoding genes PIK3R4 and AATK, orSST somatostatin and CX3CR1 chemokine receptor can alsobe related to membrane dysfunctions [17]. Genes encodingion homeostasis seem to be dysregulated as well. NPY,GRIN2A, and CACNA1C all annotated to Ca ion transport(provided by Gene Ontology Annotation UniProt Database)are DE. Also expression of manganese ion binding genesand copper ion binding genes (provided by Gene Ontology
Annotation UniProt Database), such as MT1X, is affected.KCNQ2 encoding K voltage-gated channel is overexpressed.
In BD patients of the same study transcript ATP1A3,expressing Na,K-ATPase is downregulated. is ATPase isvery important for the normal regulation of the primaryactive transport mechanism of the cells [29]; thus it affectsindirectly the normal function of the AA active transport intothe cells. Other dysregulated genes contribute to abnormal Kbinding and transport (provided by Gene Ontology Anno-tation UniProt Database): SLC12A5, KCNK3, and KCNK1are downregulated. POLR2K encoding phosphodiesterase6D is upregulated. is fact complies with dysregulated

e Scienti�c �orld �ournal 5
T 1: Number of DE genes and probesets, in SZ and BDpatients as compared to healthy controls. Genes are characterized as overexpressedwhen they present positive FC > |0.37| in log2 scale and as downregulated when they present negative FC respectively. Out of 63000 probesetsand 10000 genes of the Affymetrix HG-U95 platform, we derived a much smaller number of probesets and genes.
Disease versus control Overexpressed genes Downregulated genes Total DE genes Total probesetsSZ versus control 103 93 196 203BD versus control 74 60 134 134
T 2: Number of DE genes and probesets, occurring from comparison of BD gene expression pro�le and control expression pro�le. Genesare characterized as overexpressed when they present positive FC > |0.37| in log2 scale and as downregulated when they present negative FC,respectively.Out of 45000 probesets and 33000 genes of theAffymetrixHG-U133AGeneChip,we derived amuch smaller number of probesetsand genes.
Disease versus control Overexpressed genes Downregulated genes Total DE genes Total probesetsBD versus control 303 732 1035 1162
membrane phospholipid metabolism, as phosphodiesters areproducts of this metabolic pathway [17]. SLC7A8 gene isoverexpressed. e importance of this gene relies on thefact that it is encoding transmembrane Na-independent AAtransport proteins of the L system. LAT1 protein complex,which is speci�cally expressed from SL7A8 gene, is a tertiaryactive transporter and mediates tyrosine, tryptophan, andother neutral AA transport systems through cell membranes[19].
Second Study. Statistical analysis of the gene expressionpro�le of BD patients as compared to controls is summarizedin Table 2. e number of DE genes is 1035.
Many transcripts regulating ion transport are shown tobe downregulated in this study: SCN1A, KCNK1, TRPC1,ATP6V1A, and ATP5G3. Many metallothionein encodinggenes (provided by Gene Ontology Annotation UniProtDatabase) (MT1X, MT2A, MT1E, MT1M, MT1H, MT3,MT1A, and MT1G) are overexpressed. e latter genescombined with downregulated genes COX11, PAM, andRNF7 seem to result in abnormal copper ion binding,because their protein products are involved in this path-way (provided by Gene Ontology Annotation UniProtDatabase). Genes, encoding ATPases related to Ca++(ATP2B1,ATP2B2) andH+ (ATP5G3,ATP6AP2,ATP6V1A,ATP6V1D, ATP6V1G2) transporting (provided by GeneOntologyAnnotationUniProtDatabase), are downregulated.e protein encoded by the overexpressed ATP1B1 gene isa member of the family of Na+/K+ and H+/K+ ATPases, aswell as a member of the subfamily of responsible proteins forestablishing andmaintaining the electrochemical gradients ofNa and K ions across the plasma membranes [29]. PLA2G5gene encodes an enzyme that belongs to PLA family. Itcatalyzes the membrane phospholipid hydrolysis to freeFA, and in this study it is overexpressed. OverexpressedPLA2G4A also encodes an enzyme of A2 family. It hydrolyzesphospholipids to ARA (provided by RefSeq). ARA is sub-sequently metabolized into eicosanoids. Prostaglandins andleukotrienes belong to the eicosanoids, and they are lipid-based cell hormones that regulate in�ammation pathwaysand cellular thermodynamics. e catalyzed hydrolysis also
results in lysophospholipids that are further utilized asplatelet-activating factors. High Ca++ levels and phos-phorylation activate the enzyme (provided by RefSeq).37 genes encoding proteins involved in magnesium ionbinding (provided by Gene Ontology Annotation UniProtDatabase) show altered expression. Phosphoinositide-3-kinases encoded by downregulated genes PIK3C3, PIK3CB,and PIK3R1 encode phosphoinositide 3-kinases (PI3K).ese kinases are involved in signaling pathways, and theirreceptors are located on the outer cell membranes [17].
ird Study. Statistical analysis of the gene expression pro�leof SZ patients as compared to controls is summarized in Table3. e number of DE genes is 122.
e membrane-related protein encoded by the overex-pressed ABCA1 gene is a member of ATP-binding cassette(ABC) transporter proteins superfamily. ABC proteins medi-ate transport of many molecules across extra- and intracel-lular membranes. ABC1 transporter subfamily’s substrate ischolesterol; thus its function is affecting the cellular lipidremoval pathway. is gene is related to Tangier’s diseaseand familial high-density lipoprotein de�ciency (provided byRefSeq). Apart from ABCA1 gene, also SLC27A3, HSD11B1,CHPT1, and GM2A genes encoding proteins associatedwith lipid metabolic processes (provided by Gene OntologyAnnotation UniProt Database) present a different expressionin SZ patients compared to controls. In the DE list CACNB2is present as an overexpressed gene. is gene encodes asubunit of a voltage-dependent Ca channel protein whichis a member of the voltage-gated Ca channel superfamily(provided by RefSeq). CACNA1B, encoding another Cachannel that regulates neuronal release of neurotransmitter,has been proved to be involved in BD and SZ (provided byRefSeq).
Fourth Study. Statistical analysis of the gene expressionpro�les of SZ and BD patients as compared to controls issummarized in Table 4. e number of DE genes is 216 and205, respectively.
In SZ patients of these study genes ATP2B2 and ATP2B4are downregulated and upregulated, respectively.ese genesencode proteins that belong to the family of P-type ATPases.

6 e Scienti�c �orld �ournal
T 3: Number of DE genes and probesets, occurring from comparison of SZ gene expression pro�le and control expression pro�le. Genesare characterized as overexpressed when they present positive FC > |0.37| in log2 scale and as downregulated when they present negative FC,respectively. Out of 54921 probesets and 38500 genes of Affymetrix HG-U133 Plus 2.0 Array, we derived amuch smaller number of probesetsand genes.
Disease versus control Overexpressed genes Downregulated genes Total DE genes Total probesetsSZ versus control 88 34 122 128
T 4: Number of DE genes and probesets, occurring from comparison of SZ or BD gene expression pro�le and control expression pro�le.In case of SZ vs control samples genes are characterized as overexpressed when they present positive FC > |0.37| in log2 scale and in caseof BD vs control when they present FC > |0.26| in log2 scale. Genes are characterized as downregulated when they present the negativeFCs respectively. Out of 45000 probesets and 33000 genes of the Affymetrix HG-U133A GeneChips, we derived a much smaller number ofprobesets and genes.
Disease versus control Overexpressed genes Downregulated genes Total DE genes Total probesetsSZ versus control 113 103 216 227BD versus control 69 136 205 210
ese enzymes regulate primary ion transport. ese twospeci�cATPases are very important for the homeostasis of Cain the cell, as they catalyze cellular efflux of bivalent Ca ionsfrom cells against great concentration gradients (provided byRefSeq). Ca ion homeostasis and Ca ion transport (providedby Gene Ontology Annotation UniProt Database) are alsodependent on some other genes dysregulated in this study,such as upregulated NPY, RYR3, and ITPR2 and downregu-lated CXCL12. Two metallothionein encoding genes MT1Xand MT1H are overexpressed. Aer pathway analysis, thesegenes, in concert with the differentiated expression of severalother genes, seem to affect zinc ion binding and copper ionbinding (provided by Gene Ontology Annotation UniProtDatabase).
In BD patients of the fourth study ATP1A2 is overex-pressed. e protein expressed by this gene is a memberof P-type cation transport ATPases and belongs to thesubfamily of Na,K-ATPases. It belongs to integral membraneproteins, responsible for establishing and maintaining theelectrochemical gradients of Na and K ions across theplasma membrane. ese gradients are very important forosmoregulation, for Na-coupled transport of many organicand inorganic molecules, and for nerve and muscle elec-trical excitability. e catalytic subunit of Na,K-ATPase isencoded by multiple genes (provided by RefSeq). PLA2G16is downregulated. e protein encoded by this gene belongsto a superfamily of PLA enzymes. PLA regulates adipocytelipolysis and release of FA through a G-protein coupledpathway involving prostaglandin and prostaglandin recep-tors. It belongs to the phospholipase C enzymes that areactivated by G-coupled regulatory pathways, such as sero-toninergic 5-HT2 pathways (provided by RefSeq). Finallyoverexpressed metallothioneins MT1X, MT1M, MT1H, andMT1Mmay result in copper ion binding dysfunctions, as theyare involved in this biological function (provided by GeneOntology Annotation UniProt Database).
3.1.2. Common Differentially Expressed Genes in the Exam-ined Studies. In the �rst and fourth study SZ gene expressionsand BD gene expressions are compared to the same control
182 12014
Study 1 DE genes from SZ patients
Study 1 DE genes from BD patients
F 2: Venn diagram drawn based on DE genes in SZ and BDpatients compared with controls of the �rst study from Brodmann�sArea 10 (cognitive functions, goal formation functions). e com-mon DE genes are represented by the intersection of the two circles.
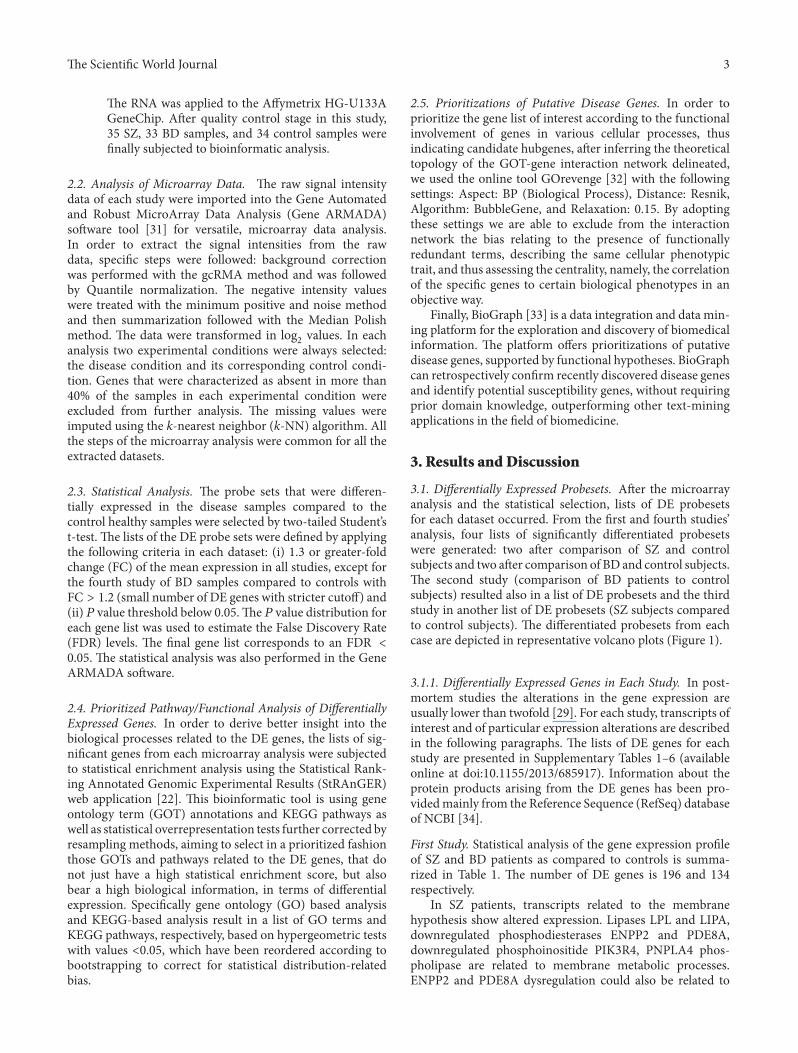
gene expressions. Common DE genes in SZ and BD patientscompared to the same control subjects, for example, in the�rst (Figure 2) and fourth (Figure 3) examined studies aredepicted in Tables 5 and 6, respectively. e genes present inlists of statistical signi�cant genes derived from SZ patients�expression pro�les are given in Table 8. e common genesin all DE genes of BD patients compared to control groupsfrom all related studies are presented in Table 7. MT1Xgene is overexpressed in all studies, in all gene expressioncomparisons, except for the second study, where it is notamong the statistical signi�cant genes as shown in Figure 4.
Among the common DE genes in BD and SZ patients ofthe �rst study HTR2C is an interesting gene. Serotonergicpathway is highly related to psychiatric disease expressions.e neurotransmitter serotonin (5-hydroxytryptamine,5-HT) causes many physiological functions aer bindingto receptor subtypes, such as 5-HT2 family of seven-transmembrane-spanning, G-protein-coupled receptors.ese receptors activate phospholipase C and D signalingpathways. is gene encodes the 2C subtype of serotoninreceptor, and its RNA editing is predicted to alter AAswithin the second intracellular loop of the 5-HT2C receptorand generate receptor isoforms that differ in their ability to

�e Scienti�c World Journal 7
T 5: �e fourteen common DE genes in schi�ophrenic and BD samples compared to control samples derived from the �rst study.
Gene symbol FC (log2) FC (log2) Gene titleSZ versus control BP versus control
SLC25A1 −0.624219 −0.627028 “Solute carrier family 25 (mitochondrial carrier; citratetransporter), member 1”
HTR2C −0.511652 −0.515884 5-hydroxytryptamine (serotonin) receptor 2CSYP −0.506666 −0.644315 SynaptophysinSERINC5 −0.476598 −0.564567 Serine incorporator 5CGRRF1 0.388505 0.443519 Cell growth regulator with ring �nger domain 1SF3B1 0.434178 0.435295 Splicing factor 3b, subunit 1, 155 kDaADD2 0.476098 0.529755 Adducin 2 (beta)GRK5 0.554659 −0.593328 G protein-coupled receptor kinase 5
UCHL3 0.587522 0.701958 ubiquitin carboxyl-terminal esterase L3 (ubiquitinthiolesterase)
DARC 0.642385 0.498777 Duffy blood group, chemokine receptorSEPT11 0.651131 −0.551204 septin 11MT1X 0.754667 0.966154 Metallothionein 1XCEBPD 0.774212 0.726239 CCAAT/enhancer binding protein (C/EBP), deltaLGALS3 0.892986 0.636527 Lectin, galactoside-binding, soluble, 3Downregulation of genes in each disease state compared with controls is represented with negative FC values (fold decrease) and upregulation with positiveFC values. Most statistically signi�cant genes, common in SZ and BD, are differentiated in similar way.
T 6: Common DE genes in SZ and BD patients as compared to control samples derived from the fourth study. Top twenty genes (BD)are shown.
Gene symbol FC (log2) SZversus control
FC (log2) BDversus control Gene title
DERL1 −0.9218 −0.59278 Der1-like domain family, member 1DDX27 −0.58735 −0.55081 DEAD (Asp-Glu-Ala-Asp) box polypeptide 27NELL1 −0.48395 −0.49181 NEL-like 1 (chicken)WDR41 −0.561422 −0.47103 WD repeat domain 41SST −0.56168 −0.47692 SomatostatinZYX −0.55832 −0.4319 ZyxinSSR1 −0.79829 −0.41544 Signal sequence receptor, alpha �bronectinFSD1 −0.4133 −0.39578 Type III and SPRY domain containing 1TRIM27 −0.51857 −0.39195 Tripartite motif-containingTESC −0.546183 −0.364501 27 TescalcinHES1 0.383441 0.32929 Hairy and enhancer of split 1MT1H 0.477326 0.329479 (Drosophila) metallothionein 1HGJA1 0.694821 0.332313 Gap junction protein, alpha 1, 43 kDaTRIL 0.405464 0.343382 TLR4 interactor with leucine-rich repeatsMT1X 0.60052 0.35402 Metallothionein 1XAGXT2L1 0.816962 0.375859 Alanine-glyoxylate aminotransferase 2-like 1
GREB1 0.623598 0.418634 Growth regulation by estrogen in breast cancer1
EMX2 0.975302 0.545582 Empty spiracles homeoboxGPC5 0.772653 0.591493 2 glypican 5ALDH1L1 1.0583 0.599394 Aldehyde dehydrogenase 1 family, member L1Downregulation of genes in each disease state is represented with negative FC values (fold decrease) and upregulation with positive FC values. Most statisticallysigni�cant genes, common in SZ and BD, are differentiated in similar way.
8 e Scienti�c �orld �ournal
T 7: Genes present in all gene lists from all studies including comparison of gene expression between BD samples and control samples.
Gene symbol FC BD versus control FC BD versus control FC BD versus control Gene title(Study 1) (Study 2) ( Study 4)
SDC4 0.403522 0.79702 0.323976 Syndecan 4MT1X 0.440635 1.1129 0.35402 Metallothionein 1X channel
KCNK1 −0.416116 −0.5935 −0.280259Potassium,SubfamilyK,Member 1
MT1H 𝟎𝟎𝟎𝟎𝟎𝟎𝟎𝟎𝟎𝟎𝟎𝟎𝟎𝟎𝟎 𝟏𝟏𝟎𝟎𝟎𝟏𝟏𝟎𝟎𝟏𝟏𝟎𝟎 𝟎𝟎𝟎𝟎𝟎𝟎𝟎𝟏𝟏𝟎𝟎𝟎𝟎𝟏𝟏 Metallothionein 1H
POLR3C 0.563585 1.28172 −0.335122
Polymerase (RNA)III (DNA directed)PolypeptideC(62 kDa)
Downregulation of genes in each disease state is represented with negative FC values (fold decrease) and upregulation with positive FC values. Most statisticalsigni�cant genes, common in all BD studies are differentiated in similar way.
T 8: Genes present in DE gene lists from all studies including comparison of gene expression between SZ samples with control samples.
Gene symbol FC SZ versus control FC SZ versus control FC SZ versus control Gene title(Study 1) (Study 3) (Study 4)
SRGN 0.777085 0.42152 — SerglycinPRPF4B 0.563723 — 𝟎𝟎𝟎𝟎𝟎𝟏𝟏𝟎𝟎𝟎𝟎𝟎𝟎𝟎𝟎 PRP4 pre-mRNA processing factor 4 homolog B (yeast)MT1X 0.754667 — 𝟎𝟎𝟎𝟎𝟎𝟎𝟎𝟎𝟎𝟎𝟎𝟎𝟎 Metallothionein 1XGYG2 0.754525 — 0.686934 Glycogenin 2NR4A2 −0.90769 — −0.550066 Nuclear receptor subfamily 4, group A, member 2NPY −0.568144 −0.406243 Neuropeptide YSST −0.83089 — −0.561683 SomatostatinPALLD — 0.509794 0.401231 Paladin, cytoskeletal
Associated proteinAQP4 — 0.449303 0.714565 Aquaporin 4ARPC1B — 0.392173 −0.597327 Actin-related protein 2/3 complex, subunit 1B, 41 kDaPVALB — −0.403296 −0.432033 ParvalbuminHSD11B1 — −0.413042 −0.538573 Hydroxysteroid(11-beta)dehydrogenase1PHLDA2 — −0.452704 −0.455578 Pleckstrin homology-like domain, family ADownregulation of genes in each disease state is represented with negative FC values (fold decrease) and upregulation with positive FC values. Most statisticalsigni�cant genes, common in SZ studies are differentiated in similar way.
interact with G proteins and the activation of phospholipaseC and D signaling cascades, thus modulating serotonergicneurotransmission in the central nervous system. Studiesin humans have reported abnormalities in patterns of 5-HT2C editing in depressed suicide victims. ree transcriptvariants encoding two different isoforms have been foundfor this gene. is gene is downregulated in both diseases[17]. Serotonin neurotransmitter has been proved toplay an important role in emotional, sexual, and eatingbehavior and in other symptoms of mental diseases, suchas hallucinations. Many drugs used for the treatment ofthese diseases are serotonin agonists. Upregulated ADD2,GGRRF1, and MT1X encode proteins related to metal ionbinding. HTR2C, DARC, and GRK5 products participate insignal transduction pathway.
e protein encoded by SDC4 gene is a transmembraneheparan sulfate proteoglycan that functions as a receptor inintracellular signaling. Downregulated KCNK1 gene encodes
one of the members of the superfamily of K channel proteins,and it has been previously reported as dysregulated in BDpatients [35]. e downregulation of this gene may affect thepassive transport of K into the cells.
NPY (neuropeptide) and GABA-system-related SST(somatostatin) are downregulated in two of our SZ studies.ese genes have been reported in many studies as candidatepsychosis genes [36]. ey have also been related to SZ.Earlier studies reveal also downregulation of these speci�cgenes. Neuropeptide genes are involved in working memoryfunctions [37]. In psychiatric diseases working memoryand neurodegeneration have been suggested as possibleabnormal functions of the prefrontal cortex. ese genesseem to be implicated in these functions [36]. PALLD gene,myocardial infarction-related gene, has also been reportedas dysregulated in SZ [38]. e protein encoded by AQP4gene is involved in the regulation of the water homeostasis.Upregulation of this gene has been already reported and has
e Scienti�c �orld �ournal 9
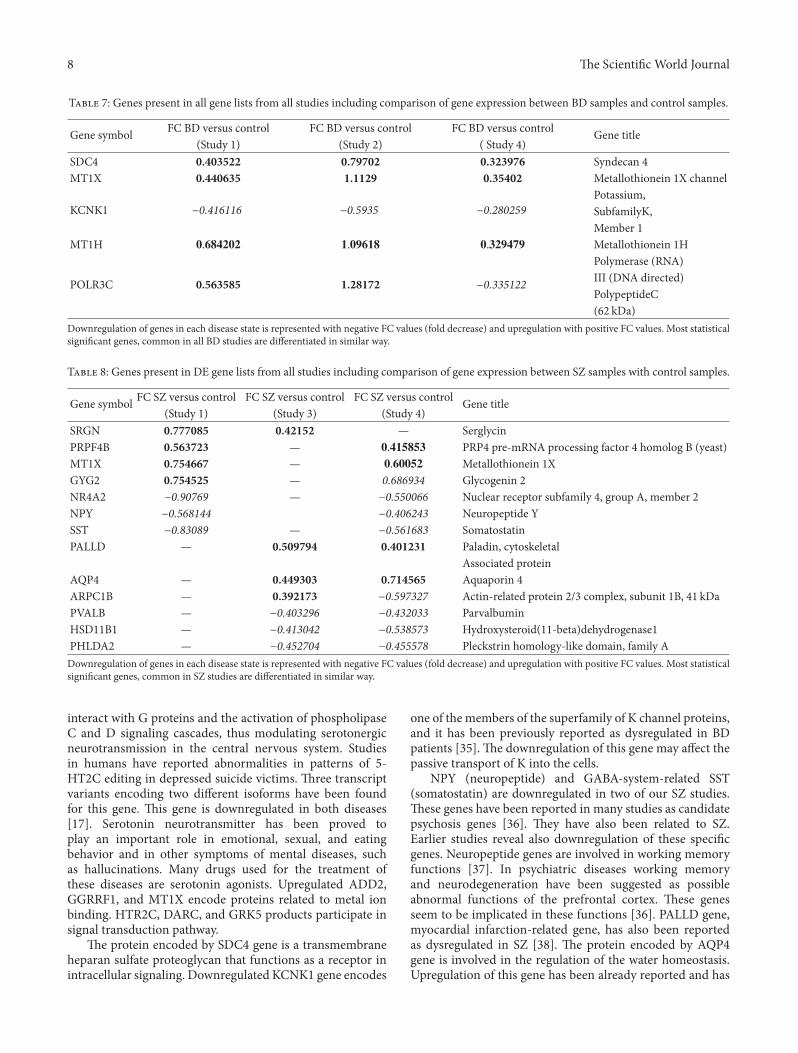
176 16540
Study 4 DE genes from SZ patients
Study 4 DE genes from BD patients
F 3: Venn diagram drawn based on DE genes in SZ andBD patients compared with controls of the fourth study fromBrodmann’s Area 46 (attention and working memory functions).e common DE genes are represented by the intersection of thetwo circles.
SZ study 1 SZ study 3
SZ study 4MT1X
BD study 1 BD study 2
BD study 4
115189
204
981111
167
1
1 5 32
66
17
F 4: Venn diagram drawn based on DE genes in SZ and BDpatients compared with controls. Red circles represent number ofDE genes of SZ samples and blue circles represent number of DEgenes of BD samples. MT1X is DE in all studies apart from study 3.All studies include samples from frontal cortices, apart from study3.
been related to white matter hyperintensity, observed inMRSstudies of BD patients [27]. Generally there are no commongenes in all three SZ datasets. is could be explained by thefact that there are region-speci�c alterations in SZ, and ourSZ raw data were extracted from different brain regions.
3.2. Pathway Analysis. e lists of statistical signi�cant genesof each study were submitted to StrAnGER web application
elucidating overrepresented GO terms. e results of GO-analysis for each dataset are presented in SupplementaryTables 7–12.
In the �rst study, StRAnGERanalysis in the SZ-relatedDEgene list indicated that K ion binding and transport are twoof the statistical signi�cant alteredGO terms.ese processesare very important for the maintenance of K ion gradients inthe cells. K ion transport regulates the �uxes of K ions fromand into the cells via some transport proteins or pores [19,25].
StRAnGER analysis in the BD-related DE gene list indi-cated altered synaptic pathways. Synaptic pathways and geneshave been reported earlier as possible dysfunction factors inBD [39]. G-protein pathways are also related to neurotrans-mitter receptors and particularly to serotonergic receptors,most studied in BD as part of serotonergic pathway [17].Ca transport, protein tyrosine kinase, and phosphoinositidebinding are involved in signal transduction pathways. Severalstudies of BD patients have shown abnormalities in the phos-phoinositol/protein kinase C (PKC) signaling system. Onesuch study has demonstrated signi�cantly higher concentra-tions of 4,5-bisphosphate (PIP2) in the platelet membranesof patients in the manic phase of BD; they also found thatthe levels of PIP2 increased when cycling from the euthymicstate into the manic state. Additionally, the activity of plateletPKC was found elevated in patients, during a manic episodeof BD. Additionally several independent studies have shownincreased concentrations of the stimulatory alpha subunit(Gas) of G-protein in the brains of BD patients, speci�callyin the frontal, temporal, and occipital cortices. Other studieshave suggested there is also increased presence/activity of G-proteins in the leukocytes of untreated manic patients andthe mononuclear leukocytes of bipolar, but not unipolar,patients. Currently, there is no evidence to indicate that theincreased concentration of Gas is caused by gene mutations;it has been suggested that they could be caused by a change inany of the biochemical pathways leading to the transcriptionand translation of the Gas gene [40]. Copper ion bindingbelongs to the signi�cant GOTs as well.
In the second study copper ion binding, magnesiumion binding, chloride channel activity, chloride transport,postsynaptic membrane, and inositol or phosphatidylinositolphosphatase activity represent signi�cantly differentiatedGOTs.
In study 3 and 4 defense response, immune response,and in�ammatory response GOTs are present in the over-represented GOTs. e in�ammatory system is stronglyrelated to thesemental disorders, and the immune underlyingmechanisms remain mainly obscure [41]. Lipid metabolicprocess is also a statistically signi�cant GOT altered instudy 3.
Dysregulated neurotransmitter systems in the centralnervous system of BD and SZ patients have been system-atically reported [2, 4]; thus central nervous system devel-opment is among the GO terms resulting from pathwayanalysis of study 3 BD DE list. Copper ion binding, chlorideion binding, and signal transduction pathways seem to beaffected.
10 e Scienti�c World �ournal
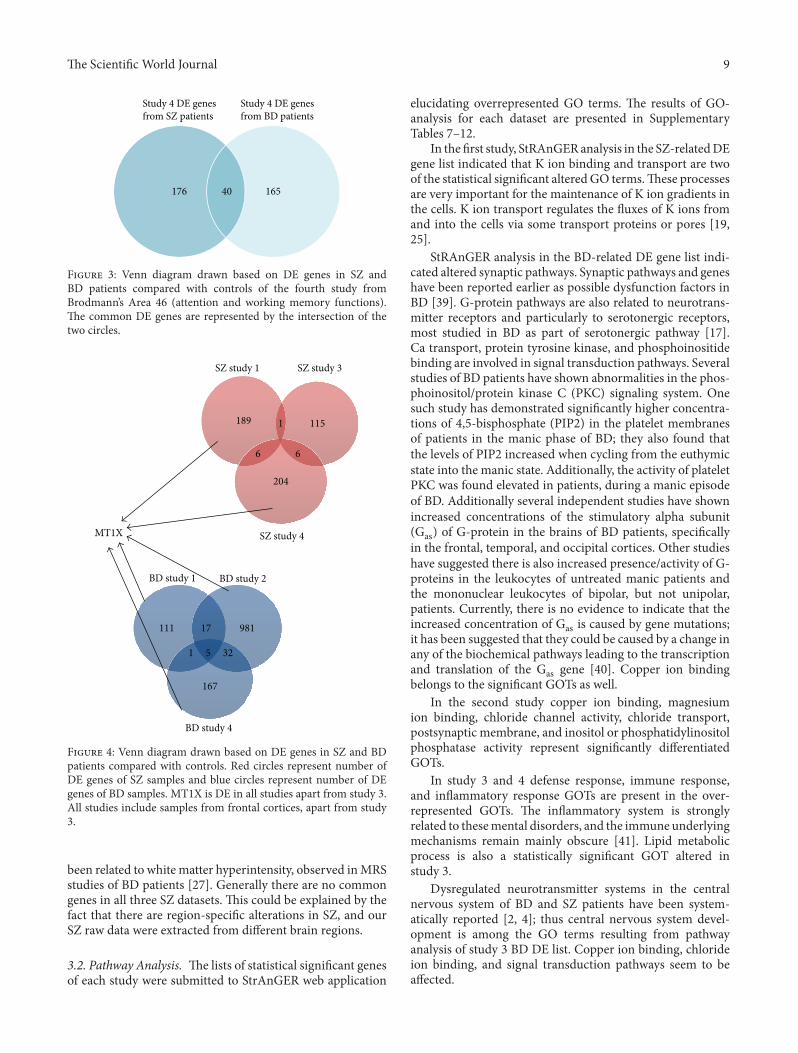
T 9: Overrepresented GO terms extracted from the union of 68common genes either of BD patients or of SZ patients.
GO annotation GOT 𝑃𝑃-value EnrichmentProtein amino acid phosphorylation 0.000254537 6/424ATP binding 0.000266417 10/1063Protein binding 0.000833654 19/3248Transferase activity 0.001557772 8/925Nucleotide binding 0.001893973 10/1348Cytoplasm 0.002264782 10/1379Extracellular region 0.005570074 5/547Metabolic process 0.0076371 4/414Multicellular organismal development 0.011932632 5/644Endoplasmic reticulum 0.018083004 4/514Zinc ion binding 0.024540778 8/1430Plasma membrane 0.034457754 4/610
Copper ion binding is present in almost all lists of signif-icantly altered GO terms. Signaling pathways are among theKEGGpathways that appearmore oen as overrepresentativepathways (Supplementary Table 13).
We also performed GO analysis in the 68 genes, shownschematically in Figure 4, that were present in at least twoof the BD or SZ DE lists. Table 9 summarizes the GOterms of this pathway analysis. ATP binding is essential forthe maintenance of the ion gradients in the cell. ATP isuniversally an important coenzyme and enzyme regulator[19].
3.3. ��enti��ation of �an�i�ate �u� Genes. In order to ex-pand our knowledge regarding which genes have critical roleamong the common DE genes in BD datasets, we used theonline tool GOrevenge [32], which performs prioritizationof the gene list taking into consideration the centrality ofeach gene, as described in the GO tree. e 68 genes founddifferentiated in at least two BD- or SZ-related studies weresubmitted to GOrevenge, and the analysis was performedbased on GO annotations for Homo sapiens as described inmaterials and methods section. A prioritized list of genes,containing candidate linker genes, that is, genes participatingin many different cellular processes, was derived (Table 10).Among them, three genes, namely, APOE, RELA, and NPY,have also been found as statistically signi�cantly differenti-ated in at least two of either SZ or BD DE gene lists.
3.4. Prioritizations of Putative Disease Genes. By setting SZand BD as concept, the relation of each gene with the BDand SZ was assessed, and the 68 genes found differentiatedin at least two BD- or SZ-related studies were prioritizedby BioGraph algorithm as shown in Tables 11 and 12,respectively.e genes are prioritized according to their scorewhich is a statistical enrichment measure of the relevance ofeach gene with the in�uired context (here speci�ed as eitherBD or SZ) to the total relations (references) of the gene inthe universe of terms. In this way, the user can derive whichof its genes are already associated and in what extent witha given disease or generally biological term and which of
T 10: GOrevenge prioritization. e second column refersto the number of GO terms remaining aer GOrevenge pruning,re�ecting the centrality of each gene, while the third column refersto the original number of biological process category GO terms ofeach gene. Top 20 genes are shown. Genes presented in italics areamong the statistically signi�cant differentiated genes in at least twoof either SZ or BD DE gene lists.
Gene symbol Remaining GO terms Original GO termsTGFB1 56 126CTNNB1 53 117BCL2 50 121SHH 45 142AKT1 44 73PSEN1 39 70WNT5A 38 98APOE 38 54BMP4 37 128TNF 37 88FGF10 36 102IL1B 35 75AGT 34 63P2RX7 33 68SFRP1 32 81RELA 32 50TGFB2 32 66BMP2 32 59PPARG 31 51EP300 31 46
them represent novel �ndings with respect to the investigatedpathological phenotype. APOE, RELA, and NPY have alsohigh scores and are among the ten top genes related eitherto the BD or SZ aer the prioritization of genes in BioGraph.ese three genes have been shown to play a major role inthe examined studies, aer different bioinformatic analyses.NPY has been reported as a candidate psychosis gene, asaforementioned.
APOE regulates cholesterol of the central nervous system;thus any alteration in APOE levels may result in abnormalbrain function. APOE has been mostly related to Alzheimer’sdisease [42].
Genotyping studies andWestern plot analysis have showndifferences of APOE in SZ patients. Abnormal cholesterolmetabolism has been associated with SZ as well. Highlevels of three different apolipoproteins in brains of patientswith psychiatric disorders may indicate aberrant centralnervous system lipid metabolism. Additionally, APOE hasbeen implicated in in�ammation pathways, aer studies onmice revealing possible action of APOE as in�ammatoryresponse inhibitor. In�ammation pathways are consideredcandidate mechanisms responsible for the pathogenesis ofseveral mental disorders and mainly of SZ [42].
RELA, v-rel reticuloendotheliosis viral oncogenehomolog A (avian), is also involved in immune and in�a-mmatory responses, as it encodes the main component of the

e Scienti�c World �ournal 11
T 11: Prioritization of the genes presented in table 11, by Bio-Graph exploiting unsupervised methodologies for the identi�cationof causative SZ-associated genes. Genes with the higher nineteenscores are shown.
Gene symbol ScorePVALB 0.172895SYN2 0.084975APOE 0.013519RELA 0.00034CRK 0.000246NTRK2 0.000219MAPT 0.000136TRIP13 0.000127NPY 7.39𝐸𝐸 𝐸 𝐸𝐸MT1X 6.19𝐸𝐸 𝐸 𝐸𝐸NR4A2 4.2𝐸𝐸𝐸 𝐸 𝐸𝐸SDC4 3.𝐸7𝐸𝐸 𝐸 𝐸𝐸PGK1 3.29𝐸𝐸 𝐸 𝐸𝐸PRPF4B 3.21𝐸𝐸 𝐸 𝐸𝐸SST 2.3𝐸𝐸𝐸 𝐸 𝐸𝐸TRPC1 2.28𝐸𝐸 𝐸 𝐸𝐸LGALS3 2.19𝐸𝐸 𝐸 𝐸𝐸DUSP6 1.96𝐸𝐸 𝐸 𝐸𝐸BGN 1.66𝐸𝐸 𝐸 𝐸𝐸
T 12: Prioritization of the genes presented in table 12, by Bio-Graph exploiting unsupervised methodologies for the identi�cationof causative BD-associated genes. Genes with the higher nineteenscores are shown.
Gene symbol ScorePVALB 1.930909595NTRK2 0.520432786MAPT 0.000852042RELA 0.000381239CRK 0.0002833NPY 0.000109408APOE 8.79𝐸36𝐸𝐸 𝐸 𝐸𝐸SYN2 6.𝐸7336𝐸𝐸 𝐸 𝐸𝐸NR4A2 𝐸.𝐸746𝐸𝐸𝐸 𝐸 𝐸𝐸TRPC1 4.28846𝐸𝐸 𝐸 𝐸𝐸SDC4 3.78467𝐸𝐸 𝐸 𝐸𝐸HSD11B1 3.34794𝐸𝐸 𝐸 𝐸𝐸TRIP13 2.26339𝐸𝐸 𝐸 𝐸𝐸SLC12A5 0.000021501LGALS3 0.000020488MT1X 1.88𝐸2𝐸𝐸𝐸 𝐸 𝐸𝐸SST 1.7𝐸93𝐸𝐸𝐸 𝐸 𝐸𝐸DUSP6 0.000015482AQP4 1.𝐸𝐸416𝐸𝐸 𝐸 𝐸𝐸
NF-𝜅𝜅B complex. NF-𝜅𝜅B has been related indirectly to SZ, as itis highly correlated to SZ involved cytokines: interleukin-1𝛽𝛽(IL-1𝛽𝛽), IL-1 receptor antagonist (IL-1RA), IL-6, and tumor
necrosis factor-𝛼𝛼 (TNF-𝛼𝛼). NF-𝜅𝜅B is a regulator of cytokines’expression, and proin�ammatory cytokines activate NF-𝜅𝜅B.NF-𝜅𝜅B is present in synaptic terminals and participates inregulation of neuronal plasticity. NF-𝜅𝜅B regulates genesthat encode subunits of N-methyl-D-aspartate receptors,voltage-dependent Ca channels and the Ca-binding proteincalbindin, cell survival factors, including Bcl-2, Mn-SOD,and inhibitor of apoptosis proteins (IAPs) and cell deathfactors, including Bcl-x(S) andBax. All these genes are relatedto neurotransmission, and altered expression of several ofthem has been reported in previous SZ postmortem brainstudies [43].
4. Conclusions
e aim of the study was to interpret the results of com-parative genomic pro�ling studies in schizophrenic patientsas compared to healthy controls and in patients with BDand try to relate and integrate our results with an aber-rant AA transport through cell membranes. Starting fromgenomewide expression data, the analysis focused on genesand mechanisms involved in AA transport through cellmembranes. We performed transcriptomic computationalanalysis on raw data derived from four different studies.Moreover, a multistage, translational bioinformatic compu-tational framework is employed, previously utilized for themolecular analysis of transcriptomic data of atheroscleroticmice models [44], exploiting different methods in order toidentify critical alteredmolecularmechanisms and importantcentral players. In this way, the results derived here donot rely solely on a single stage of signi�cance. ey arecomplying to a systematic screening of the results, exploitingvarious statistical measures, in a uni�ed analysis pipeline.ese measures either exploit the stringent FDR estimationsat the single gene level, further �ltered to keep those commonin between diseases or studies comparisons. Moreover, theconsensus gene lists thus derived are corrected through arigorous, bootstrapping framework, applied in the statisticalenrichment analysis of the signi�cant biological processes.Moreover, critical regulatory genes, prioritized by their totalnumber of GO annotations, to the resulting signi�cant GOTslist, are highlighted. It is also examined, whether these geneshave been associated with the disease phenotypes of SZ orBD in the broader biomedical literature. e results wereeventually analyzed, complying with a meta-analysis context,giving emphasis on common functional patternsmined amidthe various studies.
Our bioinformatic analyses of the downloaded datasetsdemonstrate genes and GOTs associated with ion transportdysregulation (K, Na, Ca, and other ion transports andbindings) resulting in a disturbed primary active transport,suggesting a de�cit in transmembrane Na+ and K+ gradientsmaintenance. Characteristic downregulation of Na+ and K+transporting ATPases, enzymes responsible for establishingand maintaining the electrochemical gradients of Na and Kions across the plasma membrane, is indicated in the DEgene lists of two of our datasets. ey are also upregulatedin one dataset (BD patients’ expression pro�les). Also down-regulation of P-type ATPases is reported in the datasets.

12 e Scienti�c �orld Journal
Altered distribution of speci�c ions in the cells may affectdistributions of other ion groups. A statistical integrationof many studies has previously related published data ofNa,K-ATPase activity in erythrocytes of BD patients withthe expression of the disease [45]. Decreased activity ofNa,K-ATPase has been also related to SZ in previous studies[38]. e disturbed primary active transport observed in ourstudy indicates difficulty in maintaining transmembrane iongradients. is fact should result in disrupted, secondary,active AA transporter Systems A, X-AG, N, and y+, as theycouple AA transport to the electrical and chemical gradientsinitiated by primary active transport. AA exchangers, systemsASC, y+L and L, that transport AAs by antiport mechanisms,may suffer from a de�cit of secondary, actively transportedAAs they need for the exchange, resulting in a disruptedtransport of AAs mainly transported through this thirdmechanism.
Genes and pathways related to Ca transport agree withabnormalities in Ca signaling, that have been implicated inBD� �ndings show elevated intracellular Ca concentrationsin the platelets, lymphocytes, and neutrophils of BD patients.Ca is very important in most intracellular signaling pathwaysand in the regulation of neurotransmitter synthesis andrelease [40].
Phospholipase activity may be dysregulated in BD andSZ diseases, as indicated by altered expression of the genesencoding this enzyme in this study. is alteration hasobvious impacts on the phospholipid metabolism of themembrane, as it is a crucial enzyme in thismetabolic pathway[23].
A consistent upregulation of MT1X and generally ofmetallothionein genes is consistent in different datasets. efunctional role of metallothioneins in the brain has notbeen very well characterized [36]. e main function ofmetallothioneins is to protect neurons from pathologicalstressing factors. Abnormal expression of genes encodingthese proteins may indicate an endogenous reaction toconstant oxidative stress [46]. Several studies have suggestedinvolvement of metallothioneins in functions of the centralnervous system, such as neuroprotection, regeneration, andcognitive function. Other studies reported that metalloth-ioneins are involved in cellular response, immunoregulation,cell survival, and brain functional restoration. Metalloth-ioneins are mainly produced in astrocytes. Metallothioneinoverexpression has been also reported as a contributing factorin brain pathologies, such as excitotoxic injury, amyotrophiclateral sclerosis, Alzheimer’s disease, and Parkinson’s disease.Animal studies have associated substance dependences andlearning procedures with metallothioneins. Other prefrontalcortex (PFC) studies have revealed overexpression of metal-lothioneins in SZ patients. All these studies indicate involve-ment of metallothioneins in neuroprotection and cognitivefunctions. A possible neurodegenerative function in thePFC may affect cognitive function in BD and SZ patients.Overexpression of these genes could then be a defensemechanism against these adverse processes.Metallothioneinshave also been proposed as possible medical treatment asthey have been tested in animalmodels and have been provednontoxic [36].
e observed small number of commonDE genes amongthe different studies re�ects heterogeneity among the datasetsanalyzed, which could be explained by both biological andtechnical reasons.e brain area under study, the microarrayplatform used, and the selection of patients and controlscould contribute to the heterogeneity and should be takeninto consideration and duly addressed, ideally at the stage ofthe experimental design, whenever analogous meta-analysistasks are envisioned.Highlighting genes that present differentexpression in different cases, but in the context of a mul-titiered systematic framework, like the one presented here,could result in molecular interactions, linked with causative,universal, and molecular pathways in mental disorders.
Abbreviations
ATPase: Adenosine triphosphataseAA: Amino acidARA: Arachidonic acidARMADA: Automate Robust Microarray Data
AnalysisBD: Bipolar disorderDHA: Docosahexaenoic acidEFA: Essential fatty acidsFA: Fatty acidsFC: Fold changeFDR: False discovery rateGEO: Gene expression omnibusGO: Gene ontologyGOT: Gene ontology term𝑘𝑘-NN: k-nearest neighborMRS: Magnetic resonance spectroscopyNCBI: National Center for Biotechnology
InformationPLA: Phospholipase A2Na,K-ATPase: Sodium-potassium adenosine
triphosphataseStRAnGER: Statistical Ranking Annotated Genomic
Experimental ResultsSZ: SchizophreniaCa: CalciumNa: SodiumK: PotassiumGas: alpha subunit of G proteinDE: Differentially expressedPFC: Prefrontal cortex.
References
[1] A. Sawa and S. H. Snyder, “Schizophrenia: diverse approachesto a complex disease,” Science, vol. 296, no. 5568, pp. 692–695,2002.
[2] M. L. Persson, J. Johansson, R. Vumma et al., “Aberrantamino acid transport in �broblasts from patients with bipolardisorder,” Neuroscience Letters, vol. 457, no. 1, pp. 49–52, 2009.
[3] D. F. Horrobin, “Schizophrenia as a membrane lipid disor-der which is expressed throughout the body,” ProstaglandinsLeukotrienes and Essential Fatty Acids, vol. 55, no. 1-2, pp. 3–7,1996.
e Scienti�c World Journal 13
[4] T. M. Du Bois, C. Deng, and X. F. Huang, “Membrane phos-pholipid composition, alterations in neurotransmitter systemsand schizophrenia,” Progress in Neuro-Psychopharmacology andBiological Psychiatry, vol. 29, no. 6, pp. 878–888, 2005.
[5] F. A. Wiesel, J. L. R. Andersson, G. Westerberg et al., “Tyrosinetransport is regulated differently in patients with schizophre-nia,” Schizophrenia Research, vol. 40, no. 1, pp. 37–42, 1999.
[6] F. A. Wiesel, G. Edman, L. Flyckt et al., “Kinetics of tyro-sine transport and cognitive functioning in schizophrenia,”Schizophrenia Research, vol. 74, no. 1, pp. 81–89, 2005.
[7] R. Vumma, F. A. Wiesel, L. Flyckt, L. Bjerkenstedt, and N.Venizelos, “Functional characterization of tyrosine transport in�broblast cells from healthy controls,” Neuroscience Letters, vol.434, no. 1, pp. 56–60, 2008.
[8] E. Olsson, F. A. Wiesel, L. Bjerkenstedt, and N. Venizelos,“Tyrosine transport in �broblasts from healthy volunteers andpatients with schizophrenia,” Neuroscience Letters, vol. 393, no.2-3, pp. 211–215, 2006.
[9] L. Flyckt, N. Venizelos, G. Edman, L. Bjerkenstedt, L. Hagen-feldt, and F. A. Wiesel, “Aberrant tyrosine transport acrossthe cell membrane in patients with schizophrenia,” Archives ofGeneral Psychiatry, vol. 58, no. 10, pp. 953–958, 2001.
[10] L. Flyckt, G. Edman, N. Venizelos, and K. Borg, “Aberrant tyro-sine transport across the �broblast membrane in patients withschizophrenia -indications of maternal inheritance,” Journal ofPsychiatric Research, vol. 45, no. 4, pp. 519–525, 2011.
[11] C. N. Ramchand, M. Peet, A. E. Clark, A. E. Gliddon, andG. P. Hemmings, “Decreased tyrosine transport in �broblastsfrom schizophrenics: implications for membrane pathology,”Prostaglandins Leukotrienes and Essential Fatty Acids, vol. 55,no. 1-2, pp. 59–64, 1996.
[12] P. E. Ward, J. Sutherland, E. M. T. Glen, and A. I. M. Glen,“Niacin skin �ush in schizophrenia: a preliminary report,”Schizophrenia Research, vol. 29, no. 3, pp. 269–274, 1998.
[13] L. Flyckt, J. Borg, K. Borg et al., “Muscle biopsy, macro EMG,and clinical characteristics in patients with schizophrenia,”Biological Psychiatry, vol. 47, no. 11, pp. 991–999, 2000.
[14] R. Vumma, J. Johansson, T. Lewander, and N. Venizelos,“Tryptophan Transport in human �broblast cells: a functionalcharacterization,” International Journal of Tryptophan Research,vol. 4, pp. 19–27, 2011.
[15] D. Raucoules, J. M. Azorin, A. Barre, and R. Tissot, “Plasmalevels and red blood cell membrane transports of L-tyrosineand L-tryptophan in depressions. Assessment at baseline andrecovery,” Encephale, vol. 17, no. 3, pp. 197–201, 1991.
[16] Y. Bezchlibnyk and L. T. Young, “e neurobiology of bipolardisorder: focus on signal transduction pathways and the regu-lation of gene expression,” Canadian Journal of Psychiatry, vol.47, no. 2, pp. 135–148, 2002.
[17] P. M. Kidd, “Bipolar disorder as cell membrane dysfunction.Progress toward integrative management,”Alternative MedicineReview, vol. 9, no. 2, pp. 107–135, 2004.
[18] D. F. Horrobin and C. N. Bennett, “Depression and bipolardisorder: relationships to impaired fatty acid and phospholipidmetabolism and to diabetes, cardiovascular disease, immuno-logical abnormalities, cancer, ageing and osteoporosis. Possiblecandidate genes,” Prostaglandins Leukotrienes and EssentialFatty Acids, vol. 60, no. 4, pp. 217–234, 1999.
[19] R. Hyde, P. M. Taylor, and H. S. Hundal, “Amino acid trans-porters: roles in amino acid sensing and signalling in animalcells,” Biochemical Journal, vol. 373, no. 1, pp. 1–18, 2003.
[20] L. Bjerkenstedt, L. Farde, L. Terenius, G. Edman, N. Venizelos,and F. A. Wiesel, “Support for limited brain availability oftyrosine in patients with schizophrenia,” International Journalof Neuropsychopharmacology, vol. 9, no. 2, pp. 247–255, 2006.
[21] D. F. Horrobin, “e membrane phospholipid hypothesis asa biochemical basis for the neurodevelopmental concept ofschizophrenia,” Schizophrenia Research, vol. 30, no. 3, pp.193–208, 1998.
[22] A. Chatziioannou and P. Moulos, “Exploiting statisticalmethodologies and controlled vocabularies for prioritized func-tional analysis of genomic experiments: the StRAnGER webapplication,” Frontiers in Neuroscience, vol. 5, pp. 1–14, 2011.
[23] D. L. Scott, S. P. White, Z. Otwinowski, W. Yuan, M. H.Gelb, and P. B. Sigler, “Interfacial catalysis: e mechanism ofphospholipase A2,” Science, vol. 250, pp. 1541–1546, 1990.
[24] A. Klemm, R. Rzanny, R. Fünfstück et al., “31P-Magneticresonance spectroscopy (31P-MRS) of human allogras aerrenal transplantation,”Nephrology Dialysis Transplantation, vol.13, no. 12, pp. 3147–3152, 1998.
[25] S. Bröer, “Adaptation of plasma membrane amino acid trans-port mechanisms to physiological demands,” P��gers Archiv�European Journal of Physiology, vol. 444, no. 4, pp. 457–466,2002.
[26] T. Barrett, D. B. Troup, S. E. Wilhite et al., “NCBI GEO: archivefor high-throughput functional genomic data,” Nucleic AcidsResearch, vol. 37, no. 1, pp. D885–D890, 2009.
[27] K. Iwamoto, C. Kakiuchi, M. Bundo, K. Ikeda, and T. Kato,“Molecular characterization of bipolar disorder by comparinggene expression pro�les of postmortem brains of major mentaldisorders,”Molecular Psychiatry, vol. 9, no. 4, pp. 406–416, 2004.
[28] M. M. Ryan, H. E. Lockstone, S. J. Huffaker, M. T. Wayland, M.J. Webster, and S. Bahn, “Gene expression analysis of bipolardisorder reveals downregulation of the ubiquitin cycle andalterations in synaptic genes,”Molecular Psychiatry, vol. 11, no.10, pp. 965–978, 2006.
[29] M. R. Barnes, J. Huxley-Jones, P. R. Maycox et al., “Tran-scription and pathway analysis of the superior temporal cortexand anterior prefrontal cortex in schizophrenia,” Journal ofNeuroscience Research, vol. 89, no. 8, pp. 1218–1227, 2011.
[30] K. Iwamoto, M. Bundo, and T. Kato, “Altered expression ofmitochondria-related genes in postmortem brains of patientswith bipolar disorder or schizophrenia, as revealed by large-scale DNA microarray analysis,” Human Molecular Genetics,vol. 14, no. 2, pp. 241–253, 2005.
[31] A. Chatziioannou, P. Moulos, and F. N. Kolisis, “GeneARMADA: an integrated multi-analysis platform for microar-ray data implemented in MATLAB,” BMC Bioinformatics, vol.10, article 1471, p. 354, 2009.
[32] K. Moutselos, I. Maglogiannis, and A. Chatziioannou, “GOre-venge: a novel generic reverse engineering method for theidenti�cation of critical molecular players, through the use ofontologies,” IEEE Transactions on Bio-Medical Engineering, vol.58, no. 12, pp. 3522–3527, 2011.
[33] A. M. L. Liekens, J. De Knijf, W. Daelemans, B. Goethals, P.De Rijk, and J. Del-Favero, “Biograph: unsupervised biomedicalknowledge discovery via automated hypothesis generation,”Genome Biology, p. R57, 2011.
[34] K. D. Pruitt, T. Tatusova, W. Klimke, and D. R. Maglott, “NCBIreference sequences: current status, policy and new initiatives,”Nucleic Acids Research, vol. 37, no. 1, pp. D32–D36, 2009.
[35] N. Matigian, L. Windus, H. Smith et al., “Expression pro�lingin monozygotic twins discordant for bipolar disorder reveals

14 e Scienti�c World Journal
dysregulation of the WNT signalling pathway,” Molecular Psy-chiatry, vol. 12, no. 9, pp. 815–825, 2007.
[36] K. H. Choi, M. Elashoff, B. W. Higgs et al., “Putative psychosisgenes in the prefrontal cortex: combined analysis of geneexpression microarrays,” BMC Psychiatry, vol. 8, article 87,2008.
[37] T. Hashimoto, D. Arion, T. Unger et al., “Alterations in GABA-related transcriptome in the dorsolateral prefrontal cortex ofsubjects with schizophrenia,” Molecular Psychiatry, vol. 13, no.2, pp. 147–161, 2008.
[38] N. Petronijević, D. Mićić, B. Duricić, D. Marinković, and V. R.Paunović, “Substrate kinetics of erythrocyte membrane Na, K-ATPase and lipid perosides in schizophrenia,”Progress inNeuro-Psychopharmacology & Biological Psychiatry, vol. 27, no. 3, pp.431–440, 2003.
[39] C. A. Ogden, M. E. Rich, N. J. Schork et al., “Candidate genes,pathways and mechanisms for bipolar (manic-depressive) andrelated disorders: an expanded convergent functional genomicsapproach,” Molecular Psychiatry, vol. 9, no. 11, pp. 1007–1029,2004.
[40] H. K. Manji and R. H. Lenox, “e nature of bipolar disorder,”Journal of Clinical Psychiatry, vol. 61, no. 13, pp. 42–57, 2000.
[41] S. Hope, I. Melle, P. Aukrust et al., “Similar immune pro�le inbipolar disorder and schizophrenia: selective increase in solubletumor necrosis factor receptor I and von Willebrand factor,”Bipolar Disorders, vol. 11, no. 7, pp. 726–734, 2009.
[42] E. A. omas and J. G. Sutcliffe, “e neurobiology ofapolipoproteins in psychiatric disorders,”Molecular Neurobiol-ogy, vol. 26, no. 2-3, pp. 369–388, 2002.
[43] R. Hashimoto, K. Ohi, Y. Yasuda et al., “Variants of theRELA gene are associated with schizophrenia and their star-tle responses,” Neuropsychopharmacology, vol. 36, no. 9, pp.1921–1931, 2011.
[44] O. Papadodima, A. Sirsjö, F. N. Kolisis, and A. Chatziioannou,“Application of an integrative computational framework intrancriptomic data of atherosclerotic mice suggests numerousmolecular players,” Advances in Bioinformatics, vol. 2012, Arti-cle ID 453513, 9 pages, 2012.
[45] S. W. Looney and R. S. Ei-Mallakh, “Meta-analysis of erythro-cyte Na, K-ATPase activity in bipolar illness,” Depression andAnxiety, vol. 5, no. 2, pp. 53–65, 1997.
[46] E. Mocchegiania, C. Bertoni-Freddarib, F. Marcellinic, and M.Malavolta, “Brain, aging and neurodegeneration: role of zincion availability,” Progress in Neurobiology, vol. 75, pp. 367–390,2005.
Top Related
Copyright © 2022 FDOKUMEN

