


Bahasa
Halaman
Hukum


Commission for Agricultural Costs and PricesÑf"k] lgdkfjrk ,oa fdlku dY;k.k foHkkx
Department of Agriculture, Cooperation and Farmers WelfareÑf"k ,oa fdlku dY;k.k ea=ky;
Ministry of Agriculture and Farmers WelfareHkkjr ljdkj
Government of IndiaubZ fnYyhNew DelhiekpZ] 2018
March, 2018
The Marketing Season 2018-19
Price Policyfor
Kharif Crops
Ñf"k ykxr ,oa ewY; vk;ksx
jch Qlyksa dh ewY; uhfr
foi.ku ekSle 2018&19
d`f”k] lgdkfjrk ,oa fdlku dY;k.k foHkkxd`f”k ,oa fdlku dY;k.k ea=ky;
Hkkjr ljdkjubZ fnYyh
tqykbZ] 2017

Vijay Paul Sharma Commission for Agricultural Costs and PricesChairman Department of Agriculture, Cooperation
and Farmers Welfare Ministry of Agriculture and Farmers Welfare Krishi Bhawan, New Delhi 110 001
Tel: 011-23385216Fax: 011-23383848
Preface and Acknowledgements
It is my great pleasure and privilege to present the report of “Price Policy for Kharif Crops: The Marketing Season 2018-19”. The report contains recommendations on Minimum Support Prices (MSP) for the mandated kharif crops and a set of non-price recommendations. I hope these recommendations will serve the interests of both producers and consumers, incentivise farmers to adopt new technologies and practices, lead to stability of prices, and improve competitiveness of Indian agriculture.
Summary of Recommendations is followed by overview of Indian agriculture in Chapter 1. Chapter 2 of the report provides a general overview of the demand-supply and procurement operations. Productivity of kharif crops is discussed in Chapter 3 and trade competitiveness of Indian agriculture is presented in Chapter 4. Costs and returns during 2013-14 to 2015-16 and cost projections for Kharif Marketing Season 2018-19 including issues like inter-crop price parity are analysed in Chapter 5. Non-price and price policy recommendations are given in the Chapter 6.
Preparation of this report required efforts of a number of individuals and institutions. First and foremost, I would like to express my sincere thanks and gratitude to farmers, farmers’ representatives/associations, senior officers from Central and State Governments, representatives of various agencies/organizations involved in post-harvest management and marketing of agricultural commodities, and other stakeholders for providing valuable insights and information during the meetings and preparation of this report. I would also like to express my special appreciation and thanks to Government of Maharashtra, Chhattisgarh, Assam and Andhra Pradesh. Special thanks to the Directorate of Economics and Statistics, Ministry of Agriculture & Farmers Welfare for providing key data on cost estimates for this report.
Last but not least, credit is due to the officers and staff of the commission, who contributed to this report. Sincere gratitude goes to Dr. Shailja Sharma, Member Secretary, who not only contributed greatly to the report but managed the process and timely completion of the report. The report would not have been possible without active support of Mr. K. M. M. Alimalmigothi, (Adviser), Mr. D. K. Pandey (Adviser), Ms. Nutan Raj (Adviser), Mr. Raj Kumar, Mr. Nikhil Kumar Agarwal, Dr. S. K. Gupta, Dr. Harish Kumar Kallega, Mr. Amit Sahu, Ms. Reeta Yadav, Mr. Ayush Punia, Mr. Sube Singh, Mr. Byasadev Naik, Dr. Surendra Singh, Mrs. Shilpa Taneja, Dr. Bhavik Lukka, Mr. Mohd Shoeb, Mr. S. K. Srivastava, Md. Abdul Aleem, Mr. Chandra Kumar, Mr. Vedprakash Meena, Mr. Deepdyuti Sarkar, Mr. A. K. Pandey, Ms. Meenakshi Choudhary who worked tirelessly in preparation of this report. I would like to thank them all for their contribution and support.
31st March 2018 (Vijay Paul Sharma)


The Marketing Season 2018-19 v
Contents
Cont
ents
ContentsSl. No. Description Page No.
Acronyms xiiiSummary of Recommendations 1Price Policy Recommendations 1Non-Price Recommendations 3
1. Overview 7Performance of Crop Sector 7Growth in Agriculture and Allied Sectors 7India’s Agriculture Trade Scenario 8Central Pool Stocks 8Pulses 9Oilseeds 10Maize 10Cotton 11Organic Farming 11Soil Health Management 12Water Availability 13Input Subsidy Directly to Farmers 13Agricultural Land Leasing Policy 14Investment in Agricultural Sector 14Agricultural Marketing 15Price Deficiency Payment Scheme 16Market Assurance Scheme (MAS) 17Crop Residue Management 18Promoting Agro-Industries for Processing and Value addition 19Pradhan Mantri Fasal Bima Yojana (PMFBY) 19Storage Facility for Crops 20MGNREGA and Farming 20Institutional Agricultural Credit 20Farm Mechanisation 21Cluster-Based Model of Development 22North-Eastern (NE) States – Issues and Concerns 22Structure of the Report 23

The Marketing Season 2018-19vi
Cont
ents
Sl. No. Description Page No.2. Demand-Supply Scenario and Procurement Operations 24
Wholesale Prices and MSP 24Paddy 24Maize 26Pulses 27Oilseeds 29Cotton 31Procurement Policy and Operations 32Rice 32Coarse Grains 34Pulses 35Oilseeds 36Economic Cost of Rice 36Awareness about MSP and FAQ 37Utilisation of Rainfed Rice Fallow Lands 37Bonus on MSP 38Recapitulation 38
3. Crop Productivity 39Decadal Productivity Growth Trends 39Labour Productivity 42Crop Productivity in the Major Producing States 42Yield Gap Analysis 50Pulses 51Oilseeds 53Cotton 55Drivers of Yield Growth 56Quality Seed Production and Distribution 56Irrigation 59Inter-Country Comparisons of Crop Productivity 64Linking MSP with Oil Content in Sunflower 65Recapitulation 66
4. Trade Competitiveness of Indian Agriculture 67Trade Performance 67Rice 68Maize 70Jowar 72Pulses 73Oilseeds and Edible Oils 76Soybean including Oil and Meal 77Groundnut 81

The Marketing Season 2018-19 vii
Cont
ents
Sl. No. Description Page No.Trade Policy of Oilseeds/Edible Oils 85Cotton 87Trade Outlook 89Recapitulation 91
5. Costs and Returns 92Costs and Returns of Kharif Crops during TE2015-16 93Agricultural Wages and Input Price Movement 95Cost Projections for Kharif Marketing Season, 2018-19 97Relative Returns 107Comparison of Projected Cost Estimates with State Estimates 107Recapitulation 108
6. Considerations and Recommendations for Price Policy 110Non-Price Policy Recommendations 110Promotion of Pulses Production 110Promotion of Oilseeds Sector 110Maize: Area Expansion and Diversified Products 111Quality Cotton Seeds 111Procurement of Rice 111Soil Health Management 112Input Subsidy to Farmers 112Agricultural Land Leasing Policy 112Investment in Agricultural Sector 113Price Deficiency Payment Scheme 113Awareness about MSP and FAQ 113Reduction of Yield Gap 114Crop Residue Management 114Promoting Agro-Industries for Processing and Value Addition 114Pradhan Mantri Fasal Bima Yojna (PMFBY) 115Fertilizer Use and Irrigation Management 115Local Level Storage 115Cluster-Based Model of Development 116North-Eastern States – Issues and Concerns 116Price Policy Recommendations 116
The Marketing Season 2018-19viii
List
of T
able
s
List of TablesTable No. Title Page No.
Table S.1 MSPs Recommended for KMS, 2018-19 1
Table 2.1 Distribution of Paddy Procurement in Odisha – Farmer’s Category-wise 34
Table 2.2 Procurement of Coarse grains 35
Table 2.3 Procurement of Pulses by Different Agencies in KMS 2015-16 and 2016-17 35
Table 2.4 Procurement of Kharif Oilseeds by NAFED 36
Table 3.1 Trends in CAGRs (percent) of Major Kharif Crops (1991-92 to 2017-18) 41
Table 3.2 State-wise Productivity Growth of Major Kharif Crops (2001-02 to 2017-18) 49
Table 3.3 Estimated Additional Production of Kharif Pulses by Bridging Yield Gaps 53
Table 3.4 Estimated Additional Production of Kharif Oilseeds by Bridging Yield Gaps 55
Table 3.5 Yield Comparisons for Major Crops (kg per hectare) 65
Table 4.1 India’s Trade Policy – Kharif Crops 86
Table 5.1 Average Gross Returns of Kharif Crops, TE2015-16 94
Table 5.2 Average Annual Growth in Wages of Agricultural Labour - States and All-India 96
Table 5.3 Projected CoP of Mandated Crops, KMS 2018-19 98
Table 5.4 All-India Kharif Crops Input Price Index (Base 2011-12=100) 99
Table 5.5 Crop-wise Average Relative Returns (Percent), TE2015-16 107
Table 6.1 MSPs Recommended for KMS, 2018-19 117

The Marketing Season 2018-19 ix
List
of C
hart
s
List of ChartsChart No. Title Page No.
Chart 1.1 Growth in GVA at Basic Constant Prices 7
Chart 1.2 India’s Exports and Imports of Agri-Commodities (2005-06 to 2016-17) 8
Chart 1.3 Central Pool Stocks with FCI, January 2016 to January 2018 9
Chart 1.4 GCF in Agriculture: Aggregate and Percent of Agri-GVA 15
Chart 1.5 Trends in Institutional Credit to Agricultural Sector and Share of Term Loans in Total Agricultural Credit 21
Chart 2.1 Wholesale Modal Prices vis-à-vis MSP of Paddy 25
Chart 2.2 Wholesale Modal Daily Prices vis-à-vis MSP of Paddy in Assam 25
Chart 2.3 Wholesale Modal Daily Price vis-à-vis MSP of Paddy in Uttar Pradesh 26
Chart 2.4 Wholesale Modal Prices vis-à-vis MSP of Maize 27
Chart 2.5a to c Wholesale Modal Prices vis-à-vis MSP of Pulses 28
Chart 2.6a & b Wholesale Prices vis-à-vis MSP of Oilseeds 30
Chart 2.7 Wholesale Prices vis-à-vis MSP of Cotton 31
Chart 2.8 Rice Procurement as Percent of Production and Marketed Surplus, 2001-02 to 2016-17 32
Chart 2.9 Shares of Major States in Marketed Surplus and Procurement of Rice, TE2016-17 33
Chart 2.10 Procurement of Rice in DCP & Non-DCP States 33
Chart 2.11 Economic Cost of Rice, 2008-09 to 2017-18 36
Chart 3.1a to g Crop Productivity of Kharif Crops in the Major Producing States 43

The Marketing Season 2018-19x
List
of C
hart
s
Chart No. Title Page No.
Chart 3.2a to c Yield Gap Analysis of Pulses in Major Producing States 52
Chart 3.3a to c Yield Gap Analysis of Oilseeds in Major Producing States 54 Chart 3.4 Yield Gap Analysis of Cotton in Major Producing States 56
Chart 3.5 Requirement and Availability of Certified/ Quality Seeds of Hybrids for Rice (2011-12 to 2015-16) 57
Chart 3.6 Requirement and Availability of Certified/ Quality Seeds of Hybrids for Maize (2011-12 to 2015-16) 58
Chart 3.7 Requirement and Availability of Certified/ Quality Seeds of Hybrids for Sunflower (2011-12 to 2015-16) 58
Chart 3.8 Requirement and Availability of Certified/ Quality Seeds of Hybrids for Cotton (2011-12 to 2015-16) 59
Chart 3.9 Actual Rainfall as a percentage of Normal Rainfall in the South West Monsoon Season (June 1 - September 30) 60
Chart 3.10 Gross Irrigated Area as percentage of Total Cropped Area 61
Chart 3.11 Percentage Area Irrigated by Different Sources of Irrigation 61
Chart 3.12 Physical Target/ Achievement under Micro-Irrigation 62
Chart 3.13 Consumption of Fertilizers 63Chart 3.14 MSP based on Oil Content of Sunflower 66
Chart 4.1 World’s leading Agri-Exporters and Importers -2016 68
Chart 4.2 India’s Export of Rice, 2006-07 to 2016-17 69
Chart 4.3 MSP, Domestic and International Prices of Paddy, 2013 to 2017 69
Chart 4.4 India’s Export of Maize, 2006-07 to 2016-17 71
Chart 4.5 MSP, Domestic and International Prices of Maize, 2013 to 2017 71
Chart 4.6 MSP, Domestic and International Prices of Jowar, 2013 to 2017 72
Chart 4.7 India’s Import of Pulses, 2006-07 to 2016-17 73
Chart 4.8 MSP, Domestic and International Prices of Arhar, 2013 to 2017 74
Chart 4.9 MSP, Domestic and International Prices of Urad, 2013 to 2017 75
Chart 4.10 MSP, Domestic and International Prices of Moong, 2013 to 2017 75
Chart 4.11 India’s Import of Edible Oils, 2006-07 to 2016-17 77
Chart 4.12 India’s Import of Soybean Oil, 2006-07 to 2016-17 78

The Marketing Season 2018-19 xi
List
of C
hart
s
Chart No. Title Page No.
Chart 4.13 MSP, Domestic and International Prices of Soybean, 2013 to 2017 79
Chart 4.14 Domestic and International Prices of Soybean Oil, 2013 to 2017 79
Chart 4.15 India’s Export of Soybean Meal, 2006-07 to 2016-17 80
Chart 4.16 Domestic and International Prices of Soybean Meal, 2013 to 2017 80
Chart 4.17 India’s Export of Groundnut, 2006-07 to 2016-17 81
Chart 4.18 MSP, Domestic and International Prices of Groundnut, 2013 to 2017 82
Chart 4.19 Domestic and International Prices of Groundnut Oil, 2013 to 2017 82
Chart 4.20 India’s import of Sunflower Oil, 2006-07 to 2016-17 83
Chart 4.21 MSP, Domestic and International Prices of Sunflower Seed, 2013 to 2017 84
Chart 4.22 Domestic and International Prices of Sunflower Oil, 2013 to 2017 84
Chart 4.23 MSP, Domestic and International Prices of Raw Cotton, 2013 to 2017 88
Chart 4.24 India’s Export of Cotton, 2006-07 to 2016-17 89
Chart 5.1 Average Gross Returns of Kharif Crops, TE2015-16 95
Chart 5.2 Average Annual Agricultural Wages and growth, 2016-17 96
Chart 5.3 Movements in Prices of Farm Inputs 97
Chart 5.4a to m Supply Curve and Projected CoP for KMS, 2018-19 100

The Marketing Season 2018-19xii
List of Annex Tables
List
of A
nnex
Tab
les
Table No. Title Page No.
Table 1.1 All India Estimates of Area of Agricultural Commodities 120
Table 1.2 All India Estimates of Production of Agricultural Commodities 122
Table 1.3 All India Estimates of Yield of Agricultural Commodities 124
Table 1.4 Share of Kharif Crops (under MSP) in Total Production, TE2017-18 126
Table 3.1 Simulation-Impact of Oil Content on MSP of Sunflower 127
Table 4.1 Leading Exporters and Importers in World Merchandise Trade, 2016 129
Table 4.2 Top 10 Exporters and Importers of Agricultural Products, 2016 131
Table 4.3 India’s Agricultural Exports of Major Commodities 132
Table 4.4 India’s Agricultural Imports of Major Commodities 133
Table 4.5 Quarterly Domestic and International Prices of Kharif Crops 134
Table 5.1 State-wise Average Gross Returns of Kharif Crops, during TE2015-16 136
Table 5.2 State-wise Average Monthly Wage Rates for Agricultural Labour (Man) 142
Table 5.3 Farm Inputs - Wholesale Price Index (Base 2011-12=100) 144
Table 5.4Projected Cost of Production (A2, a2+FL & C2 ) for Kharif crops during Marketing Season 2018-19 and Production Shares during TE2016-17
146
Table 5.5a to n Break-up of Cost of Cultivation 150
Table 5.6 Comparison of Cost Projections (C2) of Kharif Crops during Marketing Season 2018-19 166
Table 5.7 All-India Projected Costs of Production of Kharif Crops for Marketing Season 2018-19 over Marketing Season 2017-18 167

The Marketing Season 2018-19 xiii
Acro
nym
s
Acronymsa2 Actual paid out cost
a2+FL Actual paid out cost plus imputed value of family labour
AGMARKNET Agriculture Marketing Information System Network
APEDA Agricultural and Processed Food Products Export Development Authority
APMC Agricultural Produce Market Committee
ASP Average Sale Price
BBY Bhawantar Bhugtan Yojna
BG Bollgard
BGREI Bringing Green Revolution to Eastern India
BSP Basic Constant Prices
Bt Bacillus thuringiensis
C2
Comprehensive cost including imputed Rent on owned Land and interest on Capital
CACP Commission for Agricultural Costs and Prices
CAGR Compound Annual Growth Rates
CBEC Central Board of Excise and Customs
CCi Cotton Corporation of India
CHC Custom Hiring Centres
CHSC Custom Hiring Service Centres
CIP Central Issue Price
CIPI Composite Input Price Index
CLU Change of Land Use
CoC Cost of Cultivation
CoP Cost of Production
CPI Consumer Price Index

The Marketing Season 2018-19xiv
Acro
nym
s
CS Comprehensive Scheme of Studying Cost of Cultivation of Principal Crops in India
CSo Central Statistics Office
CT Conventional Tillage
CWC Central Warehousing Corporation
DBT Direct Benefit Transfer
DCP Decentralised Procurement
DES Directorate of Economics and Statistics
DFPD Department of Food and Public Distribution
DGCiS Directorate General of Commerce Intelligence & Statistics
DTa Domestic Tariff Area
ECA Essential Commodities Act
EDI Electronic Data Interchange
e-NaM Electronic National Agriculture Market
EU European Union
FAI Fertilizer Association of India
FAO Food and Agriculture Organization
FAQ Fair Average Quality
FCI Food Corporation of India
FLD Front Line Demonstration
FPO Farmer Producer Organisation
GCF Gross Capital Formation
GDP Gross Domestic Product
Gia Gross Irrigated Area
Gobar Dhan Galvanizing Organic Bio-Agro Resources Dhan
GSVA Gross State Value Added
GVA Gross Value Added
GVO Gross Value of output
HSD High Speed Diesel
iCaC International Cotton Advisory Committee
ICAR Indian Council of Agricultural Research

The Marketing Season 2018-19 xv
Acro
nym
s
ICRISAT International Crops Research Institute for the Semi-Arid Tropics
IIMR Indian Institute of Maize Research
KCC Kisan Credit Card
KMS Kharif Marketing Season
KVKs Krishi Vigyan Kendras
LCS Land Custom Stations
LPA Long Period Average
LTIF Long Term Irrigation Fund
MaS Market Assurance Scheme
MDM Mid-Day Meal
MEP Minimum Export Price
MGNREGA Mahatma Gandhi National Rural Employment Guarantee Act
MiS Market Intervention Scheme
MMTC Metals and Minerals Trading Corporation
MSP Minimum Support Price
MSR Marketed Surplus Ratio
N, P, K Nitrogen, Phosphorus, Potassium
NABARD National Bank For Agriculture and Rural Development
NAFED National Agricultural Cooperative Marketing Federation of India
NBS Nutrient Based Subsidy
NCAER National Council of Applied Economic Research
NCCF National Cooperative Consumers Federation of India Ltd.
NCT National Capital Territory
NMOOP National Mission on Oil Seeds and Oil Palm
NSSo National Sample Survey Office
oGL Open General License
OTR Out Turn Ratio
OWS Other Welfare Schemes
PACS Primary Agricultural Co-operative Society
PB Permanent Bed
PDPS Price Deficiency Payment Scheme

The Marketing Season 2018-19xvi
Acro
nym
s
PDS Public Distribution System
PMFBY Pradhan Mantri Fasal Bima Yojana
PMKSY Pradhan Mantri Krishi Sinchayee Yojana
PPP Public Private Partnership
PSS Price Support Scheme
R&D Research and Development
SAMPADA Scheme for Agro-Marine Processing and Development of Agro-Processing Clusters
SEZs Special Economic Zones
SFAC Small Farmers Agribusiness Consortium
SHC Soil Health Card
SOPA Soybean Processors Association of India
STL Soil Testing Labs
STR Stock-to-Use Ratio
TE Triennium Ending
TPDS Targeted Public Distribution System
UN United Nations
USDa United States Department of Agriculture
VPO Village Producer Organization
WPI Wholesale Price Index
WSP Wholesale Price
ZBNF Zero Budget Natural Farming
ZT Zero-Tillage
The Marketing Season 2018-19 1
Summary of Recommendations
Sum
mar
y of
Rec
omm
enda
tionsPrice Policy Recommendations
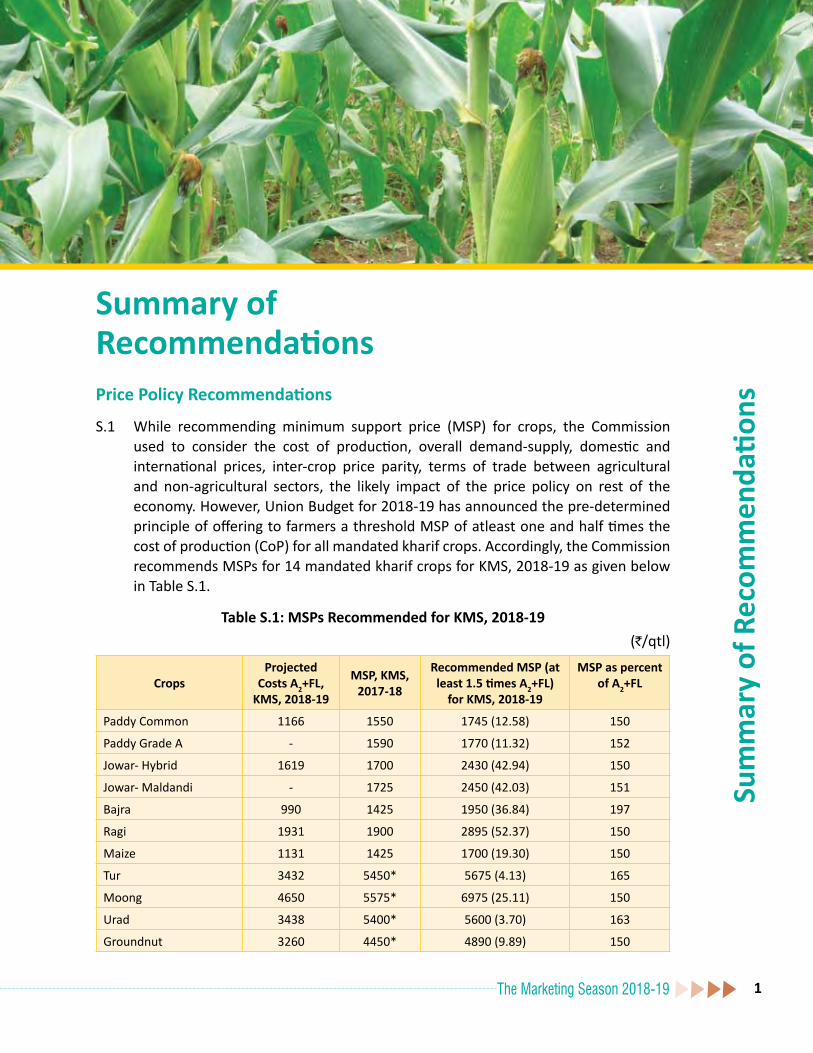
S.1 While recommending minimum support price (MSP) for crops, the Commission used to consider the cost of production, overall demand-supply, domestic and international prices, inter-crop price parity, terms of trade between agricultural and non-agricultural sectors, the likely impact of the price policy on rest of the economy. However, Union Budget for 2018-19 has announced the pre-determined principle of offering to farmers a threshold MSP of atleast one and half times the cost of production (CoP) for all mandated kharif crops. Accordingly, the Commission recommends MSPs for 14 mandated kharif crops for KMS, 2018-19 as given below in Table S.1.
Table S.1: MSPs Recommended for KMS, 2018-19(`/qtl)
CropsProjected
Costs A2+FL, KMS, 2018-19
MSP, KMS, 2017-18
Recommended MSP (at least 1.5 times A2+FL)
for KMS, 2018-19
MSP as percent of A2+FL
Paddy Common 1166 1550 1745 (12.58) 150
Paddy Grade A - 1590 1770 (11.32) 152
Jowar- Hybrid 1619 1700 2430 (42.94) 150
Jowar- Maldandi - 1725 2450 (42.03) 151
Bajra 990 1425 1950 (36.84) 197
Ragi 1931 1900 2895 (52.37) 150
Maize 1131 1425 1700 (19.30) 150
Tur 3432 5450* 5675 (4.13) 165
Moong 4650 5575* 6975 (25.11) 150
Urad 3438 5400* 5600 (3.70) 163
Groundnut 3260 4450* 4890 (9.89) 150

The Marketing Season 2018-192
Sum
mar
y of
Rec
omm
enda
tions
CropsProjected
Costs A2+FL, KMS, 2018-19
MSP, KMS, 2017-18
Recommended MSP (at least 1.5 times A2+FL)
for KMS, 2018-19
MSP as percent of A2+FL
Sunflower Seed 3592 4100@ 5385 (31.34) 150
Soyabean (Yellow) 2266 3050* 3390 (11.15) 150
Sesamum 4166 5300@ 6230 (17.55) 150
Nigerseed 3918 4050@ 5860 (44.69) 150
Cotton (Medium Staple) 3433 4020 5150 (28.11) 150
Cotton (Long Staple) - 4320 5450 (26.16) 159Note: Figures in parenthesis represent increase in MSP over the previous year.* Including bonus of `200 per quintal@Including bonus of `100 per quintal
S.2 Food Corporation of India (FCI) apprised that 85.90 percent of paddy procured is Grade A and rest is comman variety. Since, CACP traditionally has been recommending MSP of common paddy and some differential over and above for Grade A paddy, MSP recommended for Grade A paddy is 152 percent over A2+FL cost. MSP of bajra has been recommended at 197 percent of A2+FL to maintain parity with other two kharif coarse cereals, i.e., jowar and ragi. On the same lines, MSPs of tur and urad have been recommended at 165 percent and 163 percent respectively of A2+FL to maintain parity with moong. For tur, though market prices were lower (25-30 percent) than the MSP during KMS 2017-18 but due to weak supply outlook driven by reduction in area, production and imports during 2017-18, increase in wholesale prices of tur dal in recent months and lower profitability compared with other competing crops, the Commission has recommended this increase of `225 per quintal, from `5450 to `5675 for KMS 2018-19.
S.3 However, considering other factors like demand-supply situation, market prices, inter-crop price parity, etc. the Commission is of the view that recommended MSPs for many crops particularly water-intensive crop like paddy are higher. The main challenge would be to ensure that farmers receive at least the announced MSP and India is able to retain its competitiveness in world markets. Therefore, efforts are needed to create effective procurement system or alternative models like Bhavantar Bhugtan Yojana (BBY) in Madhya Pradesh and proposed Market Assurance Scheme. The role and participation of state governments and private sector is extremely important to make these interventions effective as well as ensure remunerative prices to farmers.

The Marketing Season 2018-19 3
Sum
mar
y of
Rec
omm
enda
tions
Non-Price RecommendationsIncreasing Production and Productivity of Oilseeds
S.4 India is heavily import dependent to meet the domestic demand of edible oils where 70 percent of demand is met through imports. Over dependence on imports due to lower international prices combined with lack of assured marketing has resulted in farmers losing their interest in oilseeds which can be seen in fall in acreage and production. Therefore, in long run, Government should push towards increasing domestic production through increasing productivity of oilseeds as the option of area expansion is very limited. This will reduce dependence on imports.
S.5 In this regard, National Mission on Oil Seeds and Oil Palm (NMOOP) should play a pivotal role in increasing the productivity and production of oilseeds. It should closely work with organisations like Soybean Processors Association of India (SOPA) for quality research & development in soybean sector for distribution of quality seeds and making India competitive in global market. Also, oil industry should push for better returns to farmers by organising farmers in FPOs and procuring from FPOs. Recently, Government has increased the import duty both for crude and refined oils which will reduce imports edible oils and will safeguard the interest of Indian farmers. To sustain the competitiveness of domestic produce, effective price monitoring mechanism has to be put in place and Government should step in to procure oilseeds whenever the market prices fall below MSP. The import duty needs to be changed as and when the domestic prices show fluctuation trends so as to make the domestic produce competitive in terms of price.
Price Deficiency Payment Scheme
S.6 To ensure MSPs to farmers, a system should be brought in place wherein difference between MSP and market price should be paid directly to farmer’s bank account. This will minimise Government intervention in procurement of crops and will also result in curbing loss of foodgrains incurred in terms of non-availability of storage as farmers will be able to sell their produce directly to traders and get the difference from the Government. This system has been successfully introduced in Madhya Pradesh named as Bhawantar Bhugtan Yojna (BBY) for pulses (Urad, Moong, Tur), oilseeds (Soybean, Groundnut, Sesamum, Nigerseed) and maize. Under the Scheme, direct payment of the difference between MSP and average sale price (ASP) to farmers selling his produce in APMC yards is done directly to
The Marketing Season 2018-194
their bank accounts. It has been observed by the Commission that under BBY, the cost incurred by the Government of Madhya Pradesh is significantly lower (17.85 percent of what was incurred on procurement at MSP last year) and therefore, Commission is of the view that the Government should explore the possibility of implementing the Scheme on pan India basis.
Farm Mechanisation
S.7 Declining agricultural workforce has resulted in higher wage rate of agricultural labour and in turn increase in cost of cultivation. Therefore, mechanisation of agricultural activities is necessary to take care of higher wage rate and bringing down the input costs. However, the mechanisation of agricultural activities has to be primarily driven by the state governments as some farmers, small and marginal in particular, may not find owning high valued farm implements economically viable. Custom Hiring Centres (CHCs) should be established through Public Private Partnership (PPP), private entrepreneurs, co-operative basis, farmer’s organizations and charitable trusts.
Agricultural Land Leasing Policy
S.8 Majority of agricultural land holdings in the country are held by small and marginal farmers. With ever increasing pressure of population on limited land size resulting in further fragmentation of land holdings, policymakers should keep special focus on small and marginal farmers who are often devoid of policy benefits. For this, legislation should be brought wherein leasing of agricultural land is legalized. This will result in improved access to land on lease by landless and marginal farmers which will help improve their economic condition.
Pradhan Mantri Fasal Bima Yojana (PMFBY)
S.9 Farmers often do not get receipts of the premium deducted towards the crop insurance and copy of policy documents. This results in farmers not getting due benefit of the Scheme in case of any unforeseen incidents. Also, farmers are provided loans based on the crop value due to which some farmers, contrary to the actual crop grown by them, tend to declare high value crops for availing higher loans. As a result, farmers find it difficult to claim insurance and repay their loans in case of crop failure since crop in bank records differs from the actual crop. The Commission is of the considered opinion that loan should be provided to farmers on land value and not on crop value to prevent them falling
Sum
mar
y of
Rec
omm
enda
tions

The Marketing Season 2018-19 5
into debt trap. Apart from this, issue of crop losses due to wild animals also need to be addressed.
Local Level StorageS.10 Small and marginal farmers owing to small land sizes do not have large outputs
and as a result have minimal surplus. Moreover, they are compelled to sell their produce owing to lack of storage facilities combined with immediate fund requirement. This leads to distress sale by small and marginal farmers. In this regard, a major push is required to build local storage system at gram panchayat level on cost sharing basis between farmers and state governments. The farmers can then deposit their produce in a local godown and obtain a receipt and can avail loan to an extent of 75 percent of the value of the crop deposited in the local godown against the receipt. This will allow farmers to take care of their immediate need of fund and also allows them to sell their produce at a later date when the market has recovered. This system will help in empowering small and marginal farmers in particular with the support of rural banks, cooperative banks and Primary Agricultural Co-operative Societies (PACS).
Publicity Campaign on MSP and FAQS.11 Farmers living in far flung/remote areas are generally unaware of FAQ norms
and, therefore, their produce often gets rejected in the mandis on the basis of quality. Hence, there is a need to launch large scale publicity campaigns to create awareness about MSP and FAQ among farmers and post-harvest handling of commodities so as to minimize post-harvest losses and better prices to farmers. For this, gram panchayats may be empowered with sufficient financial powers to educate farmers about the same.
Creating Markets for Assured Returns to FarmersS.12 It has been observed that often farmers of remote areas do not have sufficient
access to APMCs and their potential market is local haats where their produce is sold below MSP. Therefore, for such farmers, if procurement centres need be opened in remote areas at gram panchayat level. Furthermore, to instil confidence among farmers for procurement of their produce, a legislation conferring on farmers ‘The Right to Sell at MSP’ may be brought out.
Skewed Procurement S.13 The Commission had sought data on procurement of paddy from states,
disaggregated categories of farmers (i.e. marginal, small, semi-medium, medium
Sum
mar
y of
Rec
omm
enda
tions

The Marketing Season 2018-196
and large farmers). Government of Odisha has provided information on break up of paddy procurement by different category of farmers for kharif 2016-17. It was observed that more than 80 percent of total procurement of paddy in 2016-17 was made from large, medium and semi-medium farmers which shows that benefits of MSP are not reaching small and marginal farmers. The Commission is of the considered view that procurement data on category-wise (small, marginal, semi-medium, medium and large) farmers needs to be monitored for analysing the inclusiveness of procurement procedure as regards small and marginal farmers. All state governments should make efforts to computerize their procurement processes so as to maintain an exhaustive database on procurement.
Promoting Agro-Processing Units
S.14 Like dairy industry, a big leap should be taken to promote agro-processing units for agricultural produce to enhance farmer’s income. Crops having multiple uses apart from food consumption may be identified. For example, maize, apart from the uses of direct consumption can also be used for industrial purpose. For this, small and marginal farmers may be allowed to establish units for processing and value addition on his farm or catchment area with minimal formalities. The possibility of considering agricultural land as security for grant of loans should be explored by the banks. It should also be ensured that the rate of interest on small agro-processing units should be lower than big agro-processing units.
Issues in North-Eastern States
S.15 North-Eastern states have high humidity in atmosphere which results in higher moisture content in paddy than the FAQ norms prescribed by FCI thus leading to lower procurement. In this regard, state governments should create facilities at gram panchayat level for drying farmer’s produce so that it meets FAQ norms. In addition, state governments may also coordinate with the Ministry of Consumer Affairs, Food and Public Distribution for relaxation of FAQ norms for the region. Apart from this, local procurement infrastructure may be strengthened so as to minimise imports from other states, this will help in increasing income of local formers and will also save transportation costs.
*****
Sum
mar
y of
Rec
omm
enda
tions

The Marketing Season 2018-19 7
Chap
ter 1
Chapter 1Overview
Source: CSO
Performance of Crop Sector
1.1 After achieving the record foodgrain production of 275.11 million tonnes in 2016-17, the total foodgrain production is estimated to further increase by 2.38 million tonnes to 277.49 million tonnes in 2017-18. The estimated foodgrain production in 2017-18 has exceeded the target which was pegged below the actual production of 2016-17 because of the near normal monsoon witnessed in 2017. In 2017-18, total production of kharif rice is estimated at 96.48 million tonnes and of kharif coarse cereals at 33.15 million tonnes as compared to 32.44 million tonnes during 2016-17. Production of pulses and cotton is also expected to increase in 2017-18 while the production of oilseeds is expected to decline further.
Growth in Agriculture and Allied Sectors
1.2 As per Central Statistics Office (CSO’s) Second Advance Estimates, Agriculture, Forestry and Fishing Sector’s growth rate in Gross Value Added (GVA) at Basic Constant Prices (2011-12) during 2017-18 is expected to be 3.0 percent, a decrease of more than 50 percent of what the sector achieved in 2016-17 (6.3 percent) (Chart 1.1).
Chart 1.1: Growth in GVA at Basic Constant Prices
2012-13 2013-14 2014-15 2015-16 2016-17 2017-18
Agri., forestry and fishing 1.5 5.6 -0.2 0.6 6.3 3.0
Crops 0.2 5.4 -3.7 -3.2 6.9
Total GVA 5.4 6.1 7.2 8.1 7.1 6.1
-6
-4
-2
0
2
4
6
8
10
Percent

Ove
rvie
w
The Marketing Season 2018-198
India’s Agriculture Trade Scenario
1.3 After witnessing continuous decline in export of agri-commodities during 2013-14 to 2015-16, it increased marginally by 5 percent in 2016-17. However, this marginal increase in export is attributed mainly to the increase in export of non-kharif crops while the export of kharif crops continue to decline. Recent relaxation provided by the Government in export of pulses is expected to increase the acreage in pulses and further may improve the exports of kharif crops. The growth of imports (13 percent) of agricultural commodities outpaced the growth of exports which resulted in further decline of trade surplus which is an area of concern (Chart 1.2). The reason behind the increase in imports is because of higher import of vegetable oils (6.4 percent) and pulses (11.3 percent) both of which account for more than 50 percent of total imports in terms of value.
Chart 1.2: India’s Exports and Imports of Agri-Commodities (2005-06 to 2016-17)
Central Pool Stocks
1.4 Stock of rice with FCI for last decade has been at par or significantly higher against the established norm compared to wheat. There has been increase in procurement both for rice and wheat in 2017-18 compared to 2016-17 due to the higher procurement target fixed for 2017-18. The procurement of rice and wheat increased by more than 20 percent and 40 percent respectively in January, 2018 compared to same month last year (Chart 1.3).
Source: DGCIS
` ̀ '0
00 C
rore
s
Ove
rvie
w
The Marketing Season 2018-19 9
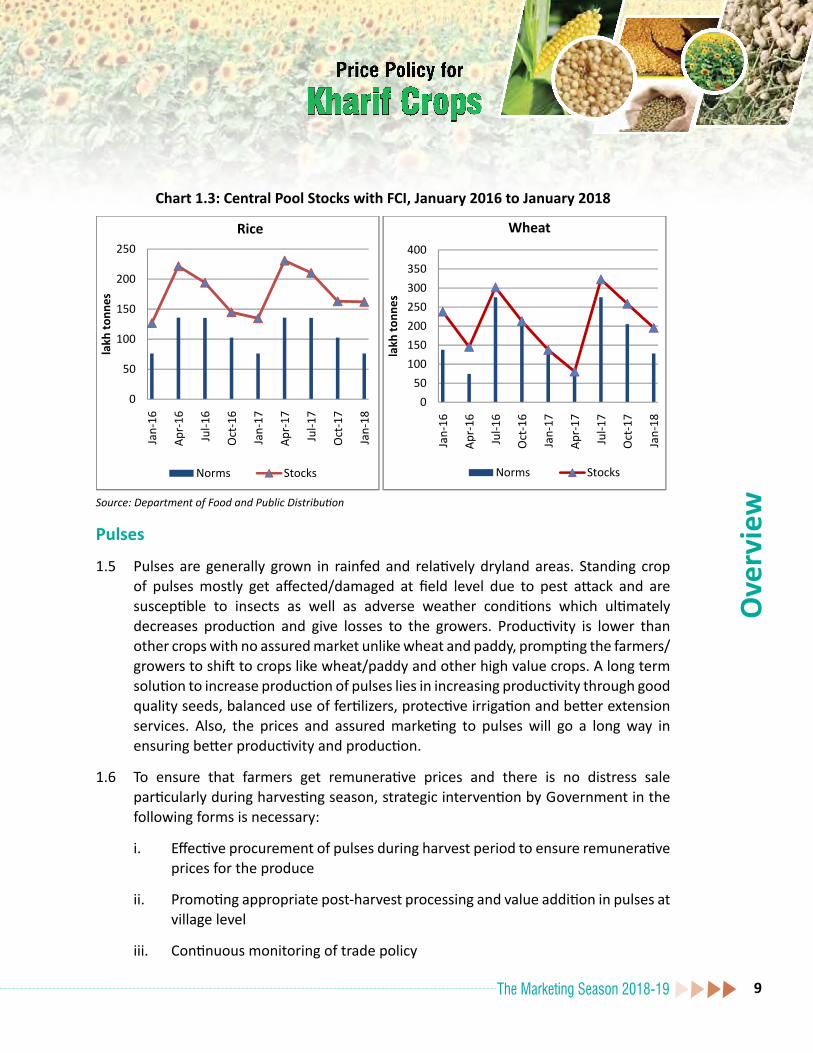
Chart 1.3: Central Pool Stocks with FCI, January 2016 to January 2018
Source: Department of Food and Public Distribution
Pulses
1.5 Pulses are generally grown in rainfed and relatively dryland areas. Standing crop of pulses mostly get affected/damaged at field level due to pest attack and are susceptible to insects as well as adverse weather conditions which ultimately decreases production and give losses to the growers. Productivity is lower than other crops with no assured market unlike wheat and paddy, prompting the farmers/growers to shift to crops like wheat/paddy and other high value crops. A long term solution to increase production of pulses lies in increasing productivity through good quality seeds, balanced use of fertilizers, protective irrigation and better extension services. Also, the prices and assured marketing to pulses will go a long way in ensuring better productivity and production.
1.6 To ensure that farmers get remunerative prices and there is no distress sale particularly during harvesting season, strategic intervention by Government in the following forms is necessary:
i. Effective procurement of pulses during harvest period to ensure remunerative prices for the produce
ii. Promoting appropriate post-harvest processing and value addition in pulses at village level
iii. Continuous monitoring of trade policy

Ove
rvie
w
The Marketing Season 2018-1910
Oilseeds
1.7 Oilseeds are grown in very small land holdings in the country under rainfed conditions and farmers are generally small and marginal. In 2017-18, the production of kharif oilseeds is estimated at 20.36 million tonnes, 5.4 percent lower than the production at 21.51 million tonnes in 2016-17. This is mainly due to fall in production of soybean by 13.4 percent, which is the major kharif oilseed accounting for almost 55 percent of production in 2017-18. The lower production of soybean is mainly due to fall in wholesale prices during sowing season in 2017. Government increased the duty structure of crude oils and refined oils wherein import duty on crude soybean oil increased by 12.5 percent (from 17.5 percent to 30 percent) while refined soybean oil increased by 15 percent (from 20 percent to 35 percent). This is a welcome move by the Government as this will curb overseas purchases of edible oils and reduce the dependence of the country on imported edible oils and will also safeguard the interest of Indian farmers. India imports about two-thirds of its edible oil demand and there is an urgent need to devise a policy to increase oilseed productivity as the option of area expansion is very limited. It may be noted that the productivity of oilseeds in India is half that of world average and there is an urgent need to address this issue collectively by Government and private sector. To increase productivity and reduce dependence on imported edible oils, special focus should be given in distribution of quality seeds to farmers before the sowing season. Also, National Mission on Oil Seeds and Oil Palm (NMOOP) should closely associate and work with Soybean Processors Association of India (SOPA) for quality research & development in the soybean sector for making India competitive in global market. Also, food use of soybean is very limited and Government should encourage soybean as a protein food to public so as to create market for the crop.
1.8 The Commission is of the view that the oil industry should consolidate farmers in groups as Farmers Producer Organisations (FPOs) and then process their produce. A provision has been made in Budget 2018-19 for exemption of FPOs from income tax which will go a long way for increasing the oilseed productivity and enhancing the income of farmers.
Maize
1.9 Water requirement of maize is much lower than that of other competing cereals like rice and wheat and having wider industrial uses. Thus expansion of area under maize will have a significant impact on sustainability in agriculture. As per Indian Institute of Maize Research (IIMR), Zero-Tillage (ZT) and Permanent Bed (PB) practices reduced the irrigation water requirement by 40–65 ha-mm and 60–98 ha-mm, respectively.

Ove
rvie
w
The Marketing Season 2018-19 11
Net profit from the maize-based systems under ZT was up to 31 percent higher with 72$/ha lower production cost compared to Conventional Tillage (CT). Thus, the study suggests that ZT/PB based crop management could be adopted for enhanced soil health and overall sustainability.
1.10 The adoption of the single cross maize hybrid seed production by farmers of West Bengal and Rajasthan in technical collaboration with ICAR and state departments of agriculture led to increased income and livelihood security of farmers. Adoption of cultivation of baby corn in Atterna and sweet corn in Manuli villages of Sonipat district of Haryana enhanced farm income enormously and led to establishment of processing plant. Such practices need to be emulated in other maize growing districts so as to increase the production and productivity.
Cotton1.11 India has world’s largest area under cotton cultivation that is about 35 percent of the
total world area under cotton. By improving the yield to match with the world yield of about 8 quintals per hectare, production of 9.9 million tonnes can be achieved under the present area coverage of 12.43 million hectares. With this abundance of availability of its own cotton, India has potential to increase local and global consumption of its cotton.
1.12 However, Indian cotton yield has been stagnant over last decade with a maximum yield reaching to 5.6 quintals per hectare. There have been no major improvements mainly because of the technology fatigue. It is well known that BT cotton seed, Bollgard-2, has developed resistance to pink bollworm which has led to stagnant growth despite 15 percent increase in area under cotton. Appearance of pink bollworm in Maharashtra, Telangana & Gujarat state and attack of white fly in the north zone (particularly Punjab and Haryana) in last couple of years, has affected the yield and quality of Indian cotton crop. Therefore, prices of BG-2 seeds have been reduced, so that the inputs costs of the farmers do not rise as they have to pay for pesticides to protect their crop.
1.13 Also, cotton farmers face huge risks since the cotton seed market is not regulated and poses higher risks to the farmers’ produce in terms of quantity and quality. Therefore, to increase the yield and compete in global market, there is an urgent need to regulate the cotton seed market in light of growing cotton industry and to safeguard our farmers.
Organic Farming
1.14 An increasing trend in indiscriminate use of fertilisers is of grave concern. It is noticed that lack of awareness among farmers and skewed subsidy policy towards

Ove
rvie
w
The Marketing Season 2018-1912
urea and higher cost of alternative fertilisers is the reason behind the imbalanced use of fertilisers. Based on the interaction of Commission with farmers of various associations, it was known that the use of new herbicides and pesticides that are being sold in the market suck the soil of all nutrients and it is not fit for growing any crop for some years thereafter. Therefore, it is necessary to steadily move towards organic farming. For instance, Andhra Pradesh has introduced Zero Budget Natural Farming (ZBNF) which is targeted at reducing the cost of cultivation. This was being done inter-alia by focussing on reduction in fertiliser consumption in farms. However, farmers following organic farming and not using chemical fertilizers are devoid of the subsidy benefit extended to farmers using chemical fertilisers. Use of livestock may also be integrated with farming activities as it will reduce the cost of cultivation. The animal wastes can be processed to be used as organic manure and herbs growing in the field can be used as a food source for the livestock. Moreover, the markets for organic produces are increasing day by day in domestic and international markets.
1.15 To boost the practice of Organic Farming, Government has launched Galvanizing Organic Bio-Agro Resources Dhan (Gobar Dhan) Scheme for farmers. This scheme will help in managing and reusing cattle dung as compost and fertilizer in agriculture. Thus, this agri-focused Scheme will improve the lives of farmers by focusing on managing cattle dung and use it as bio-fuel / bio-CNG which will assist in increasing farmer’s income.
Soil Health Management
1.16 In order to guide farmers on judicious and economic use of fertilizer nutrients, Government has implemented Soil Health Card (SHC) Scheme from February 2015. At all-India level, 253.49 lakh soil samples have been collected out of which 250.04 lakh samples have been tested (an increase of more than 250 percent from last year). A total of 1050.6 lakh SHCs have been distributed (an increase of about 470 percent from last year) as on 06.03.2018. This is a remarkable increase over the last year. The coverage of the Scheme in states like Andhra Pradesh, Gujarat, Maharashtra and Uttar Pradesh has been very encouraging whereas few northern states like Jammu & Kashmir, Himachal Pradesh, Uttarakhand, Punjab and Haryana are lagging far behind. The scheme lacks implementation in north-eastern region completely. Also, there is a wide gap in the number of samples collected vis-a-vis number of samples tested in some states, the difference being as large as 50 percent. Therefore, more number of Soil Testing Labs (STLs) needs to be opened

Ove
rvie
w
The Marketing Season 2018-19 13
to bridge this gap. Special efforts are needed to bring north-eastern region under the coverage of the Scheme.
Water Availability
1.17 Water is becoming scarce with passage of time. The increased use of ground water in farms has further aggravated the issue of water scarcity with water table going down year by year. Therefore, the Commission re-iterates its earlier recommendation of economy in water use in agriculture by fixing quantitative ceilings on per hectare use of both water and electricity. If any farmer is able to use water or electricity less than the ceilings fixed, compensation in the form of cash incentives equivalent to unused units of water/power should be provided. This would encourage farmers to use drip irrigation and would enhance production per drop of water. Also, measures like rain water harvesting should be made a priority in all villages to address the issue of water scarcity. State governments should provide suitable incentives to farmers for building pits for harvesting rain water. For instance, Balram Tal Yojana launched by the Government of Madhya Pradesh provides 50 percent subsidy to certain categories of farmers for adopting rain water harvesting model. Apart from the active role of state governments, there is also a need to make farmers aware of benefits of rain water harvesting. The village of Kadavanchi in Jalna district of Maharashtra is a classic example on how the village has made itself drought proof by adopted rain water harvesting system. Another example is of Jaisalmer, Rajasthan where the rain water harvesting system has worked wonders for the farmers. This system is less expensive compared to other water management policies of the Government. Therefore, the solution to water problem lies in the traditional way of conserving water along with focussing on advanced technological interventions. The role of state governments is important in propagating and replicating such water conservation measures in order to provide assured irrigation to farmers.
Input Subsidy Directly to Farmers
1.18 The Commission is of the opinion that input subsidies instead of providing to the companies, they may be given directly to farmers under Direct Benefit Transfer (DBT). It is known that farmers often take loans from money lenders to buy inputs for cultivation which leads to their exploitation in the hands of money lenders.

Ove
rvie
w
The Marketing Season 2018-1914
For successful implementation of this Scheme, proper computerisation of land records is essential, post which estimated input subsidy amount may be transferred directly to farmer’s bank account. Farmers can then use this subsidy to buy inputs as per their requirements. To extend the benefits to tenant farmers who do not have land records in their name, a loan eligibility card/ certificate of cultivation be provided.
Agricultural Land Leasing Policy
1.19 Legalisation and liberalisation of land leasing is needed as it would help promote agricultural efficiency, equity, occupational diversification, easy farm mechanisation and rapid rural transformation. Legalization of land leasing will result in availability of more land which the rural poor can lease in. Improved access to land on lease by the landless and marginal farmers will help improve their economic condition.
1.20 NITI Aayog has prepared a model land leasing law, which has been adopted by Government of Madhya Pradesh and Uttar Pradesh so far. According to NITI Aayog (2017), there is a need to ensure that by end March 2020, at least two thirds of the states would have liberal land-leasing laws that will protect the rights of both the owner and the tenant and allow them to conclude written, mutually agreeable lease agreements. The Commission is of the view that this needs to be monitored for early completion.
Investment in Agricultural Sector
1.21 Capital formation in agriculture is crucial for the development of agriculture and sustaining it in the long run considering the fact that labour shortage is a huge problem in agricultural activities. It is, therefore, of paramount importance to work towards bringing more investment in agriculture sector. After witnessing continuous decline in capital formation in agriculture for last three years, it saw a marginal increase from 6.3 percent of total capital formation in 2015-16 to 6.8 percent of total capital formation in 2016-17 (Chart 1.4).The private sector can play a significant role in enhancing investment in agriculture sector. In a few cases where corporates are taking innovation to farmers with inputs, wonderful results have been achieved. One such case is the banana revolution in Jalgaon district of Maharashtra where farmers are using tissue-cultured banana saplings supplied by a private tissue culture lab for disease-free banana cultivation and getting much higher yield and better quality fruit. The lab is now expanding the same technology to other states and fruits. If such practices are replicated in foodgrains, India can become a global hub for agricultural production.

Ove
rvie
w
The Marketing Season 2018-19 15
Chart 1.4: GCF in Agriculture: Aggregate and Percent of Agri-GVA `
Note: * The HH Investment in Agri.and Private Corp. Investment in Agri. for 2016-17 has been estimated based on the ratio for the year 2015-16 as the actual bifurcated data was not availableSource: CSO (2017)
Agricultural Marketing
1.22 Agriculture sector needs structured and functional markets, preferably in the vicinity of farmers, to drive growth, employment, remunerative prices and economic prosperity in rural areas of the country. Enabling mechanism are also required to be put in place for procurement of agricultural commodities directly from farmers’ field and to establish effective linkage between the farm production, the retail chain and food processing industries. Keeping in view the progressive reforms being advocated, Department of Agriculture, Cooperation & Farmers Welfare has formulated a new Model Agricultural Produce and Livestock Marketing (Promotion & Facilitation) Act, 2017 and released to States/UTs in April, 2017 for adoption. The new model Act provides the farmers options for markets beyond the existing APMC regulated market yards. The provisions include inter-alia private markets, direct marketing, farmer-consumer markets, special commodity market yards, declaring warehouses/silos/cold storages or such structures as market sub yards so as to reduce the number of intermediaries between producer and buyer and increase the share of the farmer in consumer’s rupee. As per Budget announcement for 2018-19, Government will
Ove
rvie
w
The Marketing Season 2018-1916
set up a fund of Rs 2,000 crore for developing agricultural markets. 470 APMCs have been connected to e-NAM network and rest will also be linked with e-NAM and will also develop 22,000 gramin agricultural markets. For developing gramin agricultural markets, it is necessary that certain works that qualify under MGNREGA should be used effectively for this work. Also, efforts should be made for free inter-state movement of commodities and harmonization of quality standards to make physical integration of all markets of the country. Provisions have also been made to expand the reach of all-weather road networks to connect rural habitations with agricultural and rural markets.
1.23 There is a need to improve the standardization of product grading norms according to the quality differences, as it is well known that there is a certain level of subjectivity in deciding the quality of foodgrains. Once the product is declared of sub-standard quality, it leads to distress sale by farmers. Therefore, CACP reiterates its earlier recommendation of sensitising the farmers on FAQ norms and post-harvest handling of agriculture produce so as to minimise losses. Efforts are also to be made towards motivating farmers to sell their produce by pooling as it will solve the problem of marketing for farmers.
Price Deficiency Payment Scheme
1.24 Government agencies like NAFED or FCI have to intervene in the market for certain crops like oilseeds, pulses, maize, etc. under Price Support Scheme (PSS) or Market Intervention Scheme (MIS) through state governments or on their own, whenever market prices of produce drop below MSP. Since, these crops are procured by Government and their disposal does not take place through PDS unlike wheat and paddy, it leads to high expenses because of costs involved in storage, handling, interest on capital and losses in disposal of the procured stock. To address this issue, the difference between MSP and market price should be paid directly to farmer’s bank account. This will minimise Government intervention in procurement of crops and also result in curbing loss of foodgrains incurred in terms of non-availability of storage as farmers will be able to sell their produce directly to traders and get the difference from the Government. For this, a system introduced by Government of Madhya Pradesh, Bhawantar Bhugtan Yojna (BBY) can be emulated. Under the Scheme, direct payment of the difference between MSP and average sale price (ASP) to farmers selling his produce in APMC yards for these crops is done directly to their bank accounts. It has been observed by the Commission that under BBY, the cost incurred by the Government of Madhya Pradesh is significantly lower compared to the present system of procurement of produce under MSP and therefore,

Ove
rvie
w
The Marketing Season 2018-19 17
Commission is of the view that the Government should explore the possibility of implementing the Scheme on pan India basis.
Bhawantar Bhugtan Yojna – a PDP schemeBhavantar Bhugtan Yojana was launched by Government of Madhya Pradesh during kharif 2017 season on pilot basis to safeguard the farmers from the fluctuations in the market prices of pulses (Urad, Moong, Tur), oilseeds (Soybean, Groundnut, Sesamum, Nigerseed) and maize. Under the Scheme, difference between the MSP and the Average Sale Price (ASP) of a produce in the APMC yard is paid directly to their bank accounts. With the advent of the Scheme, a total of 21.89 lakh farmers with around 50 percent of total cultivable area have been registered. Arrivals of all registered crops in mandis during October 2017 to December 2017 have increased by significant quantity compared to last procurement season. The major increase of 480 percent increase in tur, 228 percent in moong & urad and 129 percent increase in groundnut has been observed. The total cost incurred by the Government of Madhya Pradesh has also significantly reduced to 17.85 percent of what was incurred on procurement at MSP last year. Sentiment regarding the Scheme among farmers is also very good and they are of the opinion that the Scheme has provided them assured returns on their produce.
Commission is of the view that this Scheme should cover few more selected crops and all major producing states with production share of more than 80 percent. Farmers should be encouraged and incentivized to bring produce adhering to FAQ norms to the market for better price discovery by putting a ceiling on minimum average modal price (say not below 25-30 percent of MSP) as during the Commission’s visit to a Karond Mandi in MP, it was observed that quality of Urad brought to the market was much below FAQ and even not fit for human consumption. Farmers should be encouraged and incentivized to store their produce in accredited warehouses to avoid distress sale and allow farmers to sell when prices are most favourable. However, when farmers join the programme, they should receive a loan against their produce and be entitled to receive the benefit of Bhavantar Scheme if market prices in later months are below MSP. If market prices are higher, they can choose to sell in the open market and take advantage of high prices. Apart from these, transparent and efficient price discovery is essential for the success of PDPS. Therefore, there is a need to make e-NAM in these markets operational and create national market for the selected commodities on priority basis.
Market Assurance Scheme (MAS)
1.25 Under this Scheme, states would be free to procure any quantity of crops from farmers for which MSP is announced except rice and wheat as these are already being procured by the centre for public distribution system. Centre will compensate

Ove
rvie
w
The Marketing Season 2018-1918
states for any losses due to procurement, capped at 30 percent of the procurement cost. For hill states and those in the north-east, the ratio of compensation will be 40 percent. It will be the concerned states’ responsibility to dispose-off the procured crops. The proposed Scheme comes against the backdrop of a record harvest of cereals and pulses in 2016-17, which led to wholesale prices plunging below MSPs. The Scheme will thus strengthen procurement and ensure farmers do not suffer from marketing inefficiencies. However, there are few concerns for smooth implementation of MAS which need to be looked at:
a. Markets - Poorly functioning agriculture markets with lack of competition, cartelization and opaque price discovery is prevalent which causes price distortions and stand unaddressed.
b. Infrastructure - The scheme will require the deployment of huge manpower and creation of massive infrastructure for purchasing, transporting and storing.
Crop Residue Management
1.26 Crop residue management programme, if executed effectively with some modifications, can lead to enhanced farmer’s income in addition to it being used for many additional purposes, viz., input for power generation where the generated power can be used for rural electrification, feed for livestock, making of cardboard/packing material, mulch cover, etc. At present, under the crop residue management, farmers supplying the crop residues to biomass generation units get a meagre amount with labour and transportation charges to be borne by farmers. Therefore, farmers, small and marginal in particular, do not find it economically viable and thus resort to burning of residues which is a serious health hazard. Moreover, small time gap between harvesting of paddy and sowing of wheat, particularly in Punjab and Haryana, is another major reason behind burning of crop residues. Also, burning of crop residues robs the soil of micro-nutrients and bacteria that are useful to maintain soil health and fertility
1.27 To address this problem, a new Central Sector Scheme (100 percent central share), to address air pollution and to subsidize machinery required for in-situ management of crop residue, has been announced in the states of Punjab, Haryana, Uttar Pradesh and NCT of Delhi for the period 2018-19 to 2019-20 with a total outlay of `1151.80 crore. Under the Scheme, Farm Machinery Banks would be established for custom hiring of in-situ crop residue management machinery. Farmers would also be provided financial assistance of 50 percent for procurement of agriculture

Ove
rvie
w
The Marketing Season 2018-19 19
machinery and equipment for in-situ crop residue management. Along with this, a large scale awareness campaign will be undertaken through various print and visual media. The Commission feels that along with the financial support extended to farmers for custom hiring of machineries, farmers, small and marginal in particular, may also be provided lucrative cash incentives for transporting crop residues to biomass production units which can possibly open up a new market for rural entrepreneurship. The Scheme though announced for few selected states may be popularised in remaining parts of the country with a view to empowering small and marginal farmers. Also, cost of harvesting of stubble should be included in cost of cultivation for paddy.
Promoting Agro-Industries for Processing and Value Addition
1.28 Government of India is promoting Scheme for Agro-Marine Processing and Development of Agro-Processing Clusters (SAMPADA) with the objective of supplementing agriculture, modernizing processing and reducing agri-waste. However, there are certain road blocks which need to be removed so that the benefit reaches the farmers. The Commission was apprised that for setting up any agro-processing unit on farm in Haryana, there is a requirement of seeking Change of Land Use (CLU) certificate, which is not approved in areas close to Delhi. He can setup the processing unit only in industrial area which defeats the very purpose of linking the processing unit with the farm gate and saving on transportation and time.
1.29 To address this issue, small and marginal farmers may be allowed to establish units for processing and value addition on his farm without any CLU (where seeking of CLU is a problem). In addition, to promote agro industry and facilitate bank loans for them, the rate of interest on small agro-industries should be lower than large agro-industries. The possibility of considering agricultural land as security for grant of loans should be explored by the banks.
Pradhan Mantri Fasal Bima Yojana (PMFBY)
1.30 PMFBY envisaged addressing the increasing distress in farming due to crop losses. However, during discussions which the Commission had with the farmers during field visits, it was known that there are certain issues that need to be addressed for proper functioning of this very important Scheme, viz., i) farmers do not get receipts of the premium deducted towards the crop insurance and copy of policy documents. ii) loans are provided based on the crop value. Due to this, some farmers, contrary to the actual crop grown by them, tend to declare high value crops for availing higher

Ove
rvie
w
The Marketing Season 2018-1920
loans. This result in farmers not getting due benefit of the Scheme in case of any unforeseen incidents and farmers find it difficult to repay their loans and also claim insurance in case of crop failure since crop in bank records differs from the actual crop. The Commission discussed this issue with state representatives and many of them were of the view that loans under the Scheme should be provided on basis of land holding size and not on crop value.
Storage Facility for Crops
1.31 Small and marginal farmers have minimal surpluses and since they don’t have storage facilities at local level, they sell their produce at low prices soon after harvesting. Farmers can be provided financial incentives to build their own storage system at gram panchayat level on cost sharing basis. The farmer should be eligible for loan against godown receipt of the produce. In this system, the farmer with a valid receipt obtained after depositing his produce in a local godown should be allowed to avail loan to an extent of 75 percent of the value of produce deposited in the local godown. This system will help farmer to take care of his immediate need of fund and also to sell the produce at a later date when market prices are profitable enough. This system will help in empowering small and marginal farmers in particular with the support of rural banks, cooperative banks and primary agricultural co-operative society (PACS).
MGNREGA and Farming
1.32 Labour shortage is a huge problem in farming activities resulting in high labour costs and increased cost of cultivation. During meetings, state governments and other stakeholders suggested that MGNREGA may be integrated with the agricultural operations wherein agricultural labour partly to the extent permissible may be paid by MGNREGA funds and the rest by the farmers themselves. This dovetailing of MGNREGA and farm activities will help farmers to save on labour costs.
Institutional Agricultural Credit
1.33 Total agricultural credit has seen good growth from `2.29 lakh crores to `9.6 lakh crores during last decade (from 2006-07 to 2016-17). During the recent budget announcement, the target for total agricultural credit for the year 2018-19 has been fixed at `11 lakh crores (Chart 1.5). To enable farmers create more opportunities for enhancing their incomes, emphasis should be on increasing the volume of term loans. Although, term loans have started picking from 2015-16 but are still lower than the share of crop loans. Moreover, the share of cooperatives in total agricultural credit have been continuously declining since 2010-11 which is a matter of concern as the

Ove
rvie
w
The Marketing Season 2018-19 21
cooperatives particularly Primary Agricultural Credit Societies (PACS) are important source of short-term and medium-term agricultural credit, particularly for small and marginal farmers. The share of total refinance for eastern and north-eastern region has been continuously declining year after year with north-eastern region’s share falling below one percent. Therefore, special efforts are needed to extend institutional credit facilities to small and marginal farmers for these regions. Also, with the introduction of Kisan Credit Card (KCC) Scheme, banks have almost stopped financing other farm requirements such as dairy animals and farm machinery. This trend needs to be monitored and checked.
Chart 1.5: Trend in Institutional Credit to Agricultural Sector and Share of Term Loans in Total Agricultural Credit
`
Note: P-Provisional, T-Target (Inclusive of crop and term loans)Source: Annual Reports of NABARD (2015-16 and 2016-17)
1.34 Extension of credit facility is a big problem especially for tenant farmers. Since, they do not have ownership of land, they are often deprived of availing loans from the financial institutions as banks seek land as collateral. Moreover, fragmented land holdings are also a problem for availing loans as the small plot size may not fetch proper price to bank in case farmers are not in a position to repay their loans and hence banks do not accept small plot size as collateral. Efforts are, therefore, needed to step up loan facilities especially to these sections of farmers.
Farm Mechanisation
1.35 Higher share of labour with lesser contribution to GDP makes farming in India less remunerative and incidence of farmers’ poverty. With the projection of inverse trend in population and agricultural workforce growth, it will have an adverse effect on production. Agricultural mechanisation is one of the solutions to address

Ove
rvie
w
The Marketing Season 2018-1922
the issue of rising demand of foodgrains. However, inability of farmers to own high valued farm implements and unwillingness of commercial banks to finance farm equipment is one of the biggest impediments to the increase in mechanisation level in India which results in rise in input costs on account of labour charges. Therefore, developing low cost technologies along with the state support for small and marginal farmers has to be looked at and promoted at village level, particularly in close vicinity to where small and marginal farmers reside. Custom Hiring Centres (CHCs) should be established through Public Private Partnership (PPP), private entrepreneurs, co-operative basis, farmer’s organizations and charitable trusts which the Commission had recommended in its earlier reports also. Some state governments like Andhra Pradesh, Gujarat, Karnataka, Madhya Pradesh, Punjab, etc have promoted farm mechanization through CHCs and such efforts need to be stepped up.
Cluster-Based Model of Development
1.36 Since, majority of the farmers in the country are small and marginal, cluster-based model of development should be implemented in agricultural sector and farmers should be motivated to form Farmer Producer Organisations (FPOs) and Village Producer Organizations (VPOs) for their own betterment. To facilitate this, FPOs have been exempted from payment of income tax. This will also help in better marketing of the produce and enhanced incomes to them.
North-Eastern (NE) States – Issues and Concerns
1.37 North-Eastern states have immense potential for the production of paddy. However, small percentage of this potential has been utilised and NE states are still importing rice from other states for their domestic consumption. The Commission visited Guwahati to discuss the issues pertaining to kharif crops in NE states with all the stakeholders. Some of the problems which they brought to the notice of the Commission are (i) There are no market yards and other infrastructure in Guwahati for selling of produce. As a result, the presence of FCI in the state is very limited. There is hardly any procurement of paddy in Assam, the same being 13248 tonnes which is negligible as compared to the production of 5.16 million tonnes in 2017-18 (ii) Due to humid weather conditions prevailing in this region, the moisture content in paddy is higher than the FAQ norms prescribed by FCI. The moisture content is often as high as 17 percent. This leads to the rejection of farmers produce by the procurement centres and as a result farmers have to resort to distress selling (iii) The Out Turn Ratio (OTR) of paddy is as low as 61 percent to 62 percent against 67 percent in other states (iv) low rate of mechanization in the

Ove
rvie
w
The Marketing Season 2018-19 23
cultivation of crops in north-east states have also resulted in lower productivity.
1.38 To address these problems, various stakeholders suggested that for north-eastern states which are having high humidity, relaxation be made by the Government of India from 14 percent to at least 16 percent moisture content for procurement of paddy along with some mechanisation at gram mukhyalaya level for reducing the moisture content. Since the procurement in NE states is very low, state is importing rice from other states for their various food security programmes, incurring a lot of costs on transporting this rice. If the local procurement infrastructure is strengthened in NE states, farmers will get better price and cost of transportation will also be saved. This will incentivise farmers for increasing the productivity and production.
Structure of the Report
1.39 The report is organized as follows. Chapter 2 presents the demand-supply scenario and procurement operations of the Government. Chapter 3 discusses trends in crop productivity and related aspects. Chapter 4 presents trends in international trade and domestic prices in relation to international prices, as well as brief review of trade policies with a view to use international trade as an expanding opportunity for domestic producers. Chapter 5 presents the cost of production and returns of different kharif crops. Finally, a summary of the discussion along with non-price policy and MSP recommendations is presented in Chapter 6.
*****
The Marketing Season 2018-1924
Chapter 2Demand-Supply Scenario and
Procurement Operations2.1 As per FAO estimates, world rice production in 2017-18 is anticipated to reach 501.9
million tonnes, marginally up from 500.7 million tonnes in 2016-17. As per USDA projections for 2017-18, global production of coarse grains, oilseeds and cotton are around, 1321.96 million tonnes, 574.5 million tonnes and 121.94 million bales, respectively. These estimates show increase in production over 2016-17. Domestic production of cotton has increased from 325.27 lakh bales in 2016-17 to 339.15 lakh bales in 2017-18. World projection shows increase in production from 106.8 million bales in 2016-17 to 121.94 million bales in 2017-18. Increase in global production of cotton is mainly due to China’s increase in production.
Wholesale Prices and MSP 2.2 Wholesale price of a commodity is one of the main indicators to study the dynamics
of demand-supply situation in the country. Wholesale price data compiled by AGMARKNET is more appropriate for gauging the prices realized by farmers at different agricultural markets in the country. Hence, analysis of trends in domestic and international wholesale prices play crucial role in deciding the MSPs of crops. In this chapter, we analyze trends in weighted average monthly wholesale prices (production shares as weights) and corresponding MSPs of kharif crops. Charts 2.1 to 2.7 present the movement of wholesale prices vis-à-vis MSPs of paddy, maize, arhar, moong, urad, groundnut, soybean and cotton, respectively.
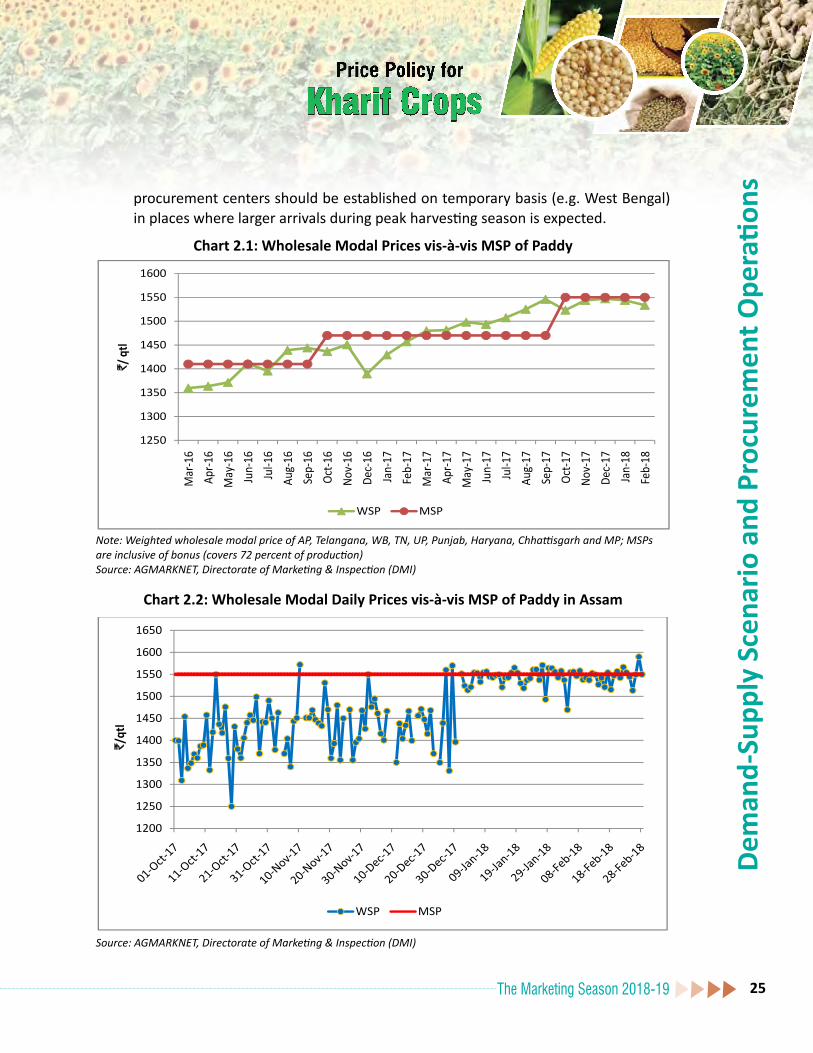
Paddy2.3 Chart 2.1 depicts wholesale prices of paddy in India from March 2016 to February
2018. States of Uttar Pradesh and Assam together contribute around 17 percent to paddy production. However, prices in these two states ruled below MSP during peak market arrival period of October to December 2017 (Charts 2.2 and 2.3). This trend to some extent is responsible for lower all-India weighted average prices. On the other hand, during the same period, prices in West Bengal, Punjab and Haryana were above the MSP, mainly due to good procurement system that is in place in these states. Therefore, to arrest falling prices, particularly in north-eastern states, procurement machinery needs to be strengthened and made more robust. For this,
Chap
ter 2
Dem
and-
Supp
ly S
cena
rio a
nd P
rocu
rem
ent O
pera
tions
The Marketing Season 2018-19 25
procurement centers should be established on temporary basis (e.g. West Bengal) in places where larger arrivals during peak harvesting season is expected.
Chart 2.1: Wholesale Modal Prices vis-à-vis MSP of Paddy
``
``
Note: Weighted wholesale modal price of AP, Telangana, WB, TN, UP, Punjab, Haryana, Chhattisgarh and MP; MSPs are inclusive of bonus (covers 72 percent of production)Source: AGMARKNET, Directorate of Marketing & Inspection (DMI)
Chart 2.2: Wholesale Modal Daily Prices vis-à-vis MSP of Paddy in Assam
Source: AGMARKNET, Directorate of Marketing & Inspection (DMI)

Dem
and-
Supp
ly S
cena
rio a
nd P
rocu
rem
ent O
pera
tions
The Marketing Season 2018-1926
Chart 2.3: Wholesale Modal Daily Prices vis-à-vis MSP of Paddy in Uttar Pradesh
`
Source: AGMARKNET, Directorate of Marketing & Inspection (DMI)
Maize
2.4 Maize farmers have been getting remunerative prices for last 18 months as the wholesale prices of maize have been ruling above MSP during March 2016 to August 2017. However, later it decreased continuously during the peak market arrival period, i.e. from September 2017 till February 2018, a fall of approximately 12-13 percent below MSP. Prices declined due to increase in production from 25.90 million tonnes in 2016-17 to 27.14 million tonnes in 2017-18. Hence, there is a need to create demand for maize diversified products in food processing industries. Indian Institute of Maize Research (IIMR) along with maize based industries should estimate the required consumption demand so that production can be efficiently utilized thus helping farmers in getting remunerative prices for their produce.
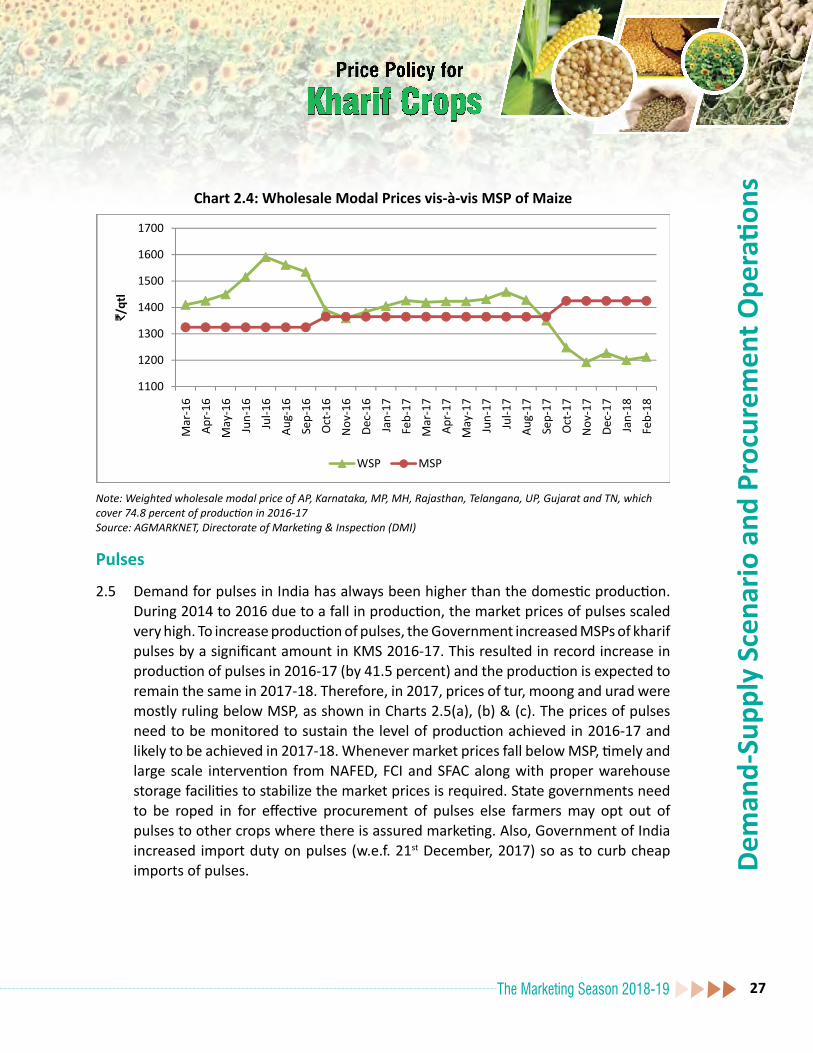
Dem
and-
Supp
ly S
cena
rio a
nd P
rocu
rem
ent O
pera
tions
The Marketing Season 2018-19 27
Chart 2.4: Wholesale Modal Prices vis-à-vis MSP of Maize
`
Note: Weighted wholesale modal price of AP, Karnataka, MP, MH, Rajasthan, Telangana, UP, Gujarat and TN, which cover 74.8 percent of production in 2016-17Source: AGMARKNET, Directorate of Marketing & Inspection (DMI)
Pulses
2.5 Demand for pulses in India has always been higher than the domestic production. During 2014 to 2016 due to a fall in production, the market prices of pulses scaled very high. To increase production of pulses, the Government increased MSPs of kharif pulses by a significant amount in KMS 2016-17. This resulted in record increase in production of pulses in 2016-17 (by 41.5 percent) and the production is expected to remain the same in 2017-18. Therefore, in 2017, prices of tur, moong and urad were mostly ruling below MSP, as shown in Charts 2.5(a), (b) & (c). The prices of pulses need to be monitored to sustain the level of production achieved in 2016-17 and likely to be achieved in 2017-18. Whenever market prices fall below MSP, timely and large scale intervention from NAFED, FCI and SFAC along with proper warehouse storage facilities to stabilize the market prices is required. State governments need to be roped in for effective procurement of pulses else farmers may opt out of pulses to other crops where there is assured marketing. Also, Government of India increased import duty on pulses (w.e.f. 21st December, 2017) so as to curb cheap imports of pulses.

Dem
and-
Supp
ly S
cena
rio a
nd P
rocu
rem
ent O
pera
tions
The Marketing Season 2018-1928
Chart 2.5: Wholesale Modal Prices vis-à-vis MSP of Pulses
``
``
Note: Weighted wholesale modal price of AP, Gujarat, Karnataka, Maharashtra, UP, MP and Telangana, which cover 83.9 percent of production in 2016-17, MSPs are inclusive of BonusSource: AGMARKNET, Directorate of Marketing & Inspection (DMI)
Note: Weighted wholesale price of AP, MP, MH, Odisha, Rajasthan, Gujarat, Karnataka, TN and Telangana, which cover 83.8 percent of production in 2016-17, MSPs are inclusive of BonusSource: AGMARKNET, Directorate of Marketing & Inspection (DMI)

Dem
and-
Supp
ly S
cena
rio a
nd P
rocu
rem
ent O
pera
tions
The Marketing Season 2018-19 29
Note: Weighted wholesale price of AP, MP, MH, Raj, UP, Gujarat and TN, which cover 85 percent of production in 2016-17, MSPs are inclusive of BonusSource: AGMARKNET, Directorate of Marketing & Inspection (DMI)
Oilseeds
2.6 India has been heavily dependent on imports to meet its domestic demand of edible oils (around 70 percent) as the production of oilseeds has been low. In 2017-18, out of the total production of kharif oilseeds, soybean alone accounts for around 56 percent of production followed by groundnut (around 32 percent). Also, the production of total oilseeds for 2017-18 is likely to fall by 5.4 percent which will further raise country’s dependence on imports. In the marketing season 2016-17, prices of groundnut showed a declining trend during peak market arrival time which picked up later. Same trend was observed during the marketing season 2017-18, however, this year the prices fell below MSP which was not the case during 2016-17 (Chart 2.6(a)). The continuous fall in prices necessitated procurement of groundnut by public agencies. For soybean, market prices followed closely in line with the MSP during 2016-17 but declined during the peak market arrival time of 2017-18 despite decline in the production of 13.4 percent (11.39 million tonnes in 2017-18 from 13.15 million tonnes in 2016-17). However, prices of soybean again picked up in January 2018 (Chart 2.6(b)) following rise in import duty in November, 2017 which made domestic produce more competitive.
`

Dem
and-
Supp
ly S
cena
rio a
nd P
rocu
rem
ent O
pera
tions
The Marketing Season 2018-1930
Chart 2.6: Wholesale Modal Prices vis-à-vis MSP of Oilseeds
``
``
Note: Weighted wholesale price of Karnataka, MP, Rajasthan, Telangana, UP, Gujarat, MH, AP, Chhattisgarh, TN and Odisha, which cover 96 percent of production in 2016-17, MSPs are inclusive of bonusSource: AGMARKNET, Directorate of Marketing & Inspection (DMI)
Note: Weighted wholesale price of Gujarat, MP, MH, Rajasthan, Telangana, Chhattisgarh, Karnataka and UP, which cover 99.4 percent of production in 2016-17, MSPs are inclusive of BonusSource: AGMARKNET, Directorate of Marketing & Inspection (DMI)

Dem
and-
Supp
ly S
cena
rio a
nd P
rocu
rem
ent O
pera
tions
The Marketing Season 2018-19 31
Cotton
2.7 Wholesale prices of cotton from March 2016 to February 2018 have been ruling above MSP (Chart 2.7). There is a marginal increase in estimated cotton production from 32.6 million bales in 2016-17 to 33.9 million bales in 2017-18. As per USDA report, World’s cotton production has increased due to increase in China’s production in 2017-18. According to International Cotton Advisory Committee (ICAC), China is the largest cotton producing country, projected to increase its consumption by 1.5 percent. Consumption is also expected to grow in Pakistan, Turkey, Bangladesh, Vietnam and Brazil. Also, import of cotton by China is expected to increase in 2017-18, whereas export by USA is projected to decrease slightly.
Chart 2.7: Wholesale Modal Prices vis-à-vis MSP of Cotton
Note: Weighted wholesale price of AP, Gujarat, MH and Telangana, which cover 71.7 percent of production in 2016-17Source: AGMARKNET, Directorate of Marketing & Inspection (DMI)
2.8 The issue regarding MSP for Kala Cotton raised by the Government of Gujarat was discussed by the Commission with Cotton Corporation of India (CCI). Kala cotton is grown in some states with approximate production of 10 percent of total cotton production. Farmers bring Kala cotton with ball. However there is no guideline to purchase this variety under MSP. Some cotton growing states have declared MSP for Kala cotton except Gujarat due to which farmers of Gujarat are facing the problem of marketing of Kala cotton. The Commission is of the view that the state governments where Kala cotton is produced, in consultation with CCI should put a robust system in place for post-harvest operations and purchase of Kala cotton from farmers.
`

Dem
and-
Supp
ly S
cena
rio a
nd P
rocu
rem
ent O
pera
tions
The Marketing Season 2018-1932
Procurement Policy and OperationsRice2.9 Procurement of rice has increased continuously during last three consecutive
years. It has increased from 34.2 million tonnes in 2015-16 to 38.1 million tonnes in 2016-17. Similarly, procurement as percentage of production and marketed surplus has increased to 34.7 percent and 41.2 percent, respectively in 2016-17 from the corresponding figure of 32.7 percent and 38.8 percent, respectively in 2015-16. This year’s procurement of rice as on 01.03.2018, has touched 30.12 million tonnes, which is almost same (30.5 million tonnes) as on date, last year. The overall position regarding rice procurement over the years in the country as percentage of the production and marketed surplus is presented in Chart 2.8.
Chart 2.8: Rice Procurement as Percent of Production and Marketed Surplus, 2001-02 to 2016-17
Source: DES, DAC&FW and DFPD
2.10 Punjab is the largest contributor to the central pool of rice procurement with an estimated share of about 27 percent (Chart 2.9) followed by Chhattisgarh (10 percent), Odisha (10 percent), Andhra Pradesh (9 percent) and Haryana (8 percent). It is interesting to note that rice procurement has become more diversified and share of DCP states has increased from 30.6 percent in KMS 2010-11 to 55 percent in KMS 2016-17. However, there are still some major rice producing states, where procurement operations are either absent or very limited. For example, there was

Dem
and-
Supp
ly S
cena
rio a
nd P
rocu
rem
ent O
pera
tions
The Marketing Season 2018-19 33
almost negligible procurement of rice in Assam during TE2016-17, even though rice is a major crop in the state and in the absence of effective procurement by the Government, prices remained below MSP in Assam.
Chart 2.9: Shares of Major States in Marketed Surplus and Procurement of Rice, TE2016-17
Source: DES, DAC&FW and FCI
Chart 2.10: Procurement of Rice in DCP & Non-DCP States
Source: FCI
2.11 The Commission had sought data on procurement of paddy from states, disaggregated categories of farmers (i.e. marginal, small, semi-medium, medium and large farmers). Government of Odisha has provided information on break up of paddy procurement
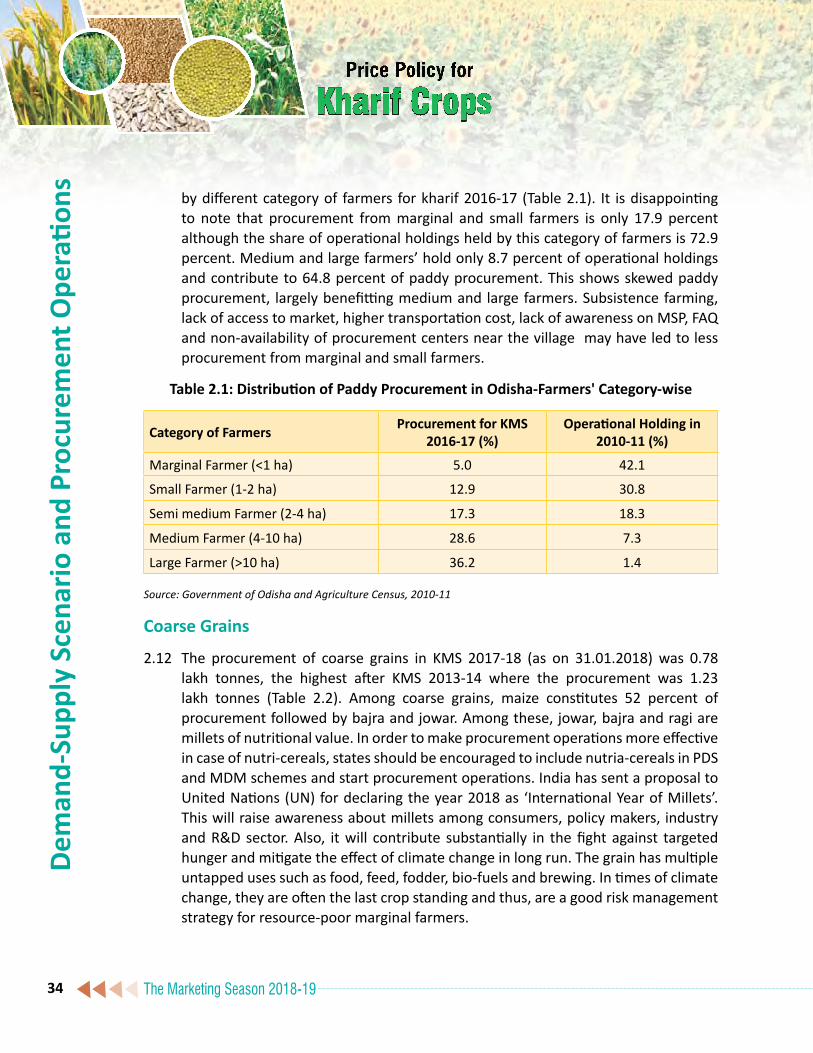
Dem
and-
Supp
ly S
cena
rio a
nd P
rocu
rem
ent O
pera
tions
The Marketing Season 2018-1934
by different category of farmers for kharif 2016-17 (Table 2.1). It is disappointing to note that procurement from marginal and small farmers is only 17.9 percent although the share of operational holdings held by this category of farmers is 72.9 percent. Medium and large farmers’ hold only 8.7 percent of operational holdings and contribute to 64.8 percent of paddy procurement. This shows skewed paddy procurement, largely benefitting medium and large farmers. Subsistence farming, lack of access to market, higher transportation cost, lack of awareness on MSP, FAQ and non-availability of procurement centers near the village may have led to less procurement from marginal and small farmers.
Table 2.1: Distribution of Paddy Procurement in Odisha-Farmers' Category-wise
Category of Farmers Procurement for KMS 2016-17 (%)
Operational Holding in 2010-11 (%)
Marginal Farmer (<1 ha) 5.0 42.1
Small Farmer (1-2 ha) 12.9 30.8
Semi medium Farmer (2-4 ha) 17.3 18.3
Medium Farmer (4-10 ha) 28.6 7.3
Large Farmer (>10 ha) 36.2 1.4
Source: Government of Odisha and Agriculture Census, 2010-11
Coarse Grains
2.12 The procurement of coarse grains in KMS 2017-18 (as on 31.01.2018) was 0.78 lakh tonnes, the highest after KMS 2013-14 where the procurement was 1.23 lakh tonnes (Table 2.2). Among coarse grains, maize constitutes 52 percent of procurement followed by bajra and jowar. Among these, jowar, bajra and ragi are millets of nutritional value. In order to make procurement operations more effective in case of nutri-cereals, states should be encouraged to include nutria-cereals in PDS and MDM schemes and start procurement operations. India has sent a proposal to United Nations (UN) for declaring the year 2018 as ‘International Year of Millets’. This will raise awareness about millets among consumers, policy makers, industry and R&D sector. Also, it will contribute substantially in the fight against targeted hunger and mitigate the effect of climate change in long run. The grain has multiple untapped uses such as food, feed, fodder, bio-fuels and brewing. In times of climate change, they are often the last crop standing and thus, are a good risk management strategy for resource-poor marginal farmers.

Dem
and-
Supp
ly S
cena
rio a
nd P
rocu
rem
ent O
pera
tions
The Marketing Season 2018-19 35
Table 2.2: Procurement of Coarse grains (MT)
Crops KMS 2013-14 KMS 2014-15 KMS 2015-16 KMS 2016-17 KMS 2017-18
Maize 121607 31484 2297 62181 40428Jowar 0.9 1435 2865 3733 2873Bajra 0 0 505 6341 35136Ragi 1479 13596 20377 0 0Total 123086 46515 26044 72255 78437
Source: FCI
Pulses2.13 The country has achieved a record production of pulses during 2016-17, which has
led to fall in its market prices. Hence, FCI in addition to NAFED and SFAC intervened in many markets where prices fell below MSP. Procurement of pulses increased from 0.5 lakh tonnes in KMS 2015-16 to 2.19 lakh tonnes in KMS 2016-17 (Table 2.3). There is an increase in procurement of pulses by NAFED, FCI and SFAC mainly due to record production of pulses in 2016-17. It is reported that in the absence of assurance of reimbursement of losses from Central Government, state government agencies do not come forward for procurement of pulses. Therefore, in order to sustain the production of pulses at current level, Government of India has doubled the credit limit for procurement from `9500 crore to `19000 crore. Some states like Gujarat and Madhya Pradesh have expressed the need to extend procurement of kharif pulses upto April as harvesting season extends till then. Since pulses have relatively shorter shelf life, there is also a need to evolve a suitable mechanism for disposal of these stocks and the disposal time should not coincide with the marketing season so as to maintain the balance in prices.
Table 2.3: Procurement of Pulses by Different Agencies in KMS 2015-16 and 2016-17(MT)
Season Commodity FCI NAFED SFAC TOTAL
KMS 2015-16
Tur 20257 20001 5258 45532
Urad 5 1764 3123 4892
Total 20262 21765 8381 50424
KMS 2016-17
Moong 64737 128886 26225 219848
Urad 18235 59602 10746 88582
Tur 175299 919667 71079 1166045
Total 258271 1108155 108049 308430
Source: FCI

Dem
and-
Supp
ly S
cena
rio a
nd P
rocu
rem
ent O
pera
tions
The Marketing Season 2018-1936
Oilseeds
2.14 In 2017-18 kharif oilseeds production is estimated at 20.36 million tonnes, a decline by 5.4 percent from 21.51 million tonnes during 2016-17. However, procurement of groundnut has decreased in 2017-18, while there is a marginal increase in sunflower procurement (Table 2.4). Despite prices of both groundnut and soybean ruling below MSP during peak arrival period of KMS 2017-18, procurement still remained very low.
Table 2.4: Procurement of Kharif Oilseeds by NAFED(MT)
Commodity 2014-15 2015-16 2016-17 2017-18Groundnut 6230 - 210731 948Sunflower 4153 4242 4949 6539Soybean - 162
Source: NAFED
Economic Cost of Rice
2.15 Economic cost of rice has increased significantly over the years (Chart 2.11). This is mainly attributed to the rising trend of procurement incidentals and distribution costs. In 2009-10, share of MSP in total economic cost was 82 percent, which declined to 68 percent in 2016-17 and again increased to 71 percent in 2017-18.
Chart 2.11: Economic Cost of Rice, 2008-09 to 2017-18
`
Source: FCI
Dem
and-
Supp
ly S
cena
rio a
nd P
rocu
rem
ent O
pera
tions
The Marketing Season 2018-19 37
Awareness about MSP and FAQ
2.16 In order to strengthen MSP operations, awareness about MSP and FAQ norms need to be created as many times farmer’s produce is rejected on the basis of quality norms. Strong procurement operations need to be expanded to neglected regions, particularly eastern and north eastern regions. As per NSSO data for 2012-13, states where awareness of MSP is high are also the states where there is more procurement of wheat and paddy. This calls for giving wide publicity about MSP and procurement agencies by the state governments in regional/vernacular electronic and print media and also through pamphlets, announcements in the villages regarding MSPs and FAQ parameters of important commodities at least 15 days before the procurement starts so as to reach out to farmers in far off areas. Commission is, therefore, of the view that there is a need to empower gram panchayats with sufficient financial powers to educate the farmers about the same. It has also been observed that often farmers of remote areas do not have sufficient access to APMC and their potential market is local haats and their produce is sold below MSP. Therefore, it will be beneficial for those farmers if procurement centers can be opened up in remote areas at gram panchayat level. In addition, farmers need to be trained on FAQ norms and post-harvest handling of commodities so as to minimize post-harvest losses and better prices to farmers. Furthermore to instil confidence among farmers for procurement of their produce, a legislation conferring on farmers ‘The Right to Sell at MSP’ may be brought out.
Utilisation of Rainfed Rice Fallow Lands2.17 It is a common practice for farmers in the eastern region to leave the area fallow in
the rabi season after harvest of kharif rice. According to baseline survey conducted by ICRISAT, approximately 12 million hectare, out of the 40 million hectare rice area during the kharif season, remains uncultivated in rabi season. Of the total rice fallow area, about 73 percent (8.6 million hectare) lies in the states of Chhattisgarh, Bihar, West Bengal and Madhya Pradesh. Hence, there is a tremendous opportunity for cultivation of a second crop on available soil moisture after harvest of rice. The residual moisture left in the soil at the time of rice harvest is often sufficient to raise short-duration pulses and oilseed crops and rice fallows can be converted into productive lands. Introduction of pulses such as lentil, moong, urad and oilseeds like mustard, groundnut, linseed, nigerseed, safflower and sesamum in rice fallows can augment domestic availability of pulses and oilseeds, which are in short supply and will also help in restoring soil health. The states of Odisha and Chhattisgarh have targeted rice fallows for growing moong, urad and tur.

Dem
and-
Supp
ly S
cena
rio a
nd P
rocu
rem
ent O
pera
tions
The Marketing Season 2018-1938
Bonus on MSP
2.18 Certain state governments have been providing bonus over and above MSP during past few years, which were distorting market and also affecting inter-crop price parity. It is encouraging to note that many states after taking cognizance of the market distortion have stopped giving bonus. During 2017-18, Kerala, Tamil Nadu, Chhattisgarh and Jharkhand declared bonus ranging from `50 per quintal in case of Tamil Nadu to `780 per quintal in Kerala. Such bonuses do not help the farmers to diversify to other crops in the surplus states like Chhattisgarh which lead to overproduction and increase in food subsidy bill. The Commission re-iterates its earlier recommendation that such bonuses/incentives should be discouraged, particularly in surplus states.
Recapitulation2.19 Wholesale prices of Paddy in Uttar Pradesh and Assam ruled below MSP during
peak market arrival period of October to December 2017. On the other hand, prices in West Bengal, Punjab and Haryana were above the MSP, mainly due to good procurement system that is in place in these states. Therefore, to arrest falling prices, particularly in north-eastern states, procurement machinery needs to be strengthened and made more robust. For this, procurement centers should be established on temporary basis (e.g. West Bengal) in places where larger arrivals during peak harvesting season is expected.
2.20 In order to help maize farmers in getting remunerative prices, Indian Institute of Maize Research along with maize based industries should estimate the required consumption demand so that production can be efficiently utilized.
2.21 The prices of pulses need to be monitored to sustain the level of production achieved in 2016-17 and likely to be achieved in 2017-18. Whenever market prices fall below MSP, timely and large scale intervention from NAFED, FCI and SFAC along with proper warehouse storage facilities to stabilize the market price is required. State governments need to be roped in for effective procurement of pulses else farmers may opt out of pulses to other crops where there is assured marketing.
2.22 There is a need to empower gram panchayats with sufficient financial powers to educate the farmers to create awareness about MSP and FAQ norms. Farmers of remote areas do not have sufficient access to APMC yards and they sell their produce in local haats and their produce is sold below MSP due to the produce not meeting FAQ norms. Therefore, it will be beneficial for those farmers if procurement centers can be opened up in remote areas at gram panchayat level.
*****

The Marketing Season 2018-19 39
Chapter 3Crop Productivity
Chap
ter 3
3.1 In order to ensure long term food security for citizens, it is important to improve productivity in Indian agriculture and bring it at par with the world average. Although productivity has increased over the years but there are still significant gaps to be covered. Some of the major reasons for low productivity in Indian agriculture are: lack of modern farm equipment, low penetration of irrigation facilities, poor nutrient management, short growing season, varied agro-climatic conditions, weather extremities and lack of a robust extension system. As India makes transition towards being a high middle income country it is important that in future, increases in food demand are met through higher productivity as scope for area expansion in agriculture is limited. Further, improvements in agricultural yields will play a key role in enhancing farmers’ income. Judicious use of inputs, better management practices, remunerative prices and optimum use of natural resources are some of the key focus areas for increasing productivity. In this chapter, we analyze productivity trends and major growth drivers of productivity.
Decadal Productivity Growth Trends 3.2 The Compound Annual Growth Rates (CAGR) in the area, production and productivity
of major kharif crops during the decades of 1990s (1991-92 to 2000-2001), 2000s (2001-02 to 2010-11) and 2010s (2011-12 to 2017-18) are analyzed and given in Table 3.1. The growth rates are based on the final estimates for 2016-17 and 2nd advanced estimates for 2017-18.
3.3 Cereals: CAGR of total cereals production slowed down in 2010s after a period of sustained acceleration in the previous two decades. This slowdown mainly resulted from a combination of slowdown in growth rate of area (0.02 percent) and yield (0.28 percent). A similar trend was observed in kharif cereals, growth rate in yields fell to 1.24 percent in 2010s compared to 1.81 percent in the previous decade. This led to a decline in growth of production to 0.66 percent. Further, an absolute fall in area under kharif cereals was observed in 2010s. CAGR for area under kharif cereals was -0.57 percent. Therefore, in view of the continued decline/ stagnation in acreage for cereals in general and kharif cereals in particular, it is important to enhance productivity levels in cereals to achieve sustainable increases in production. In addition, there has also been a reduction in area under paddy cultivation during 2010s (-0.11 percent).

Crop
Pro
ducti
vity
The Marketing Season 2018-1940
Coupled with slowdown in growth of yield during 2010s (0.90 percent), it has resulted in a reduction in production growth rate to 0.79 percent. In case of maize, after an impressive increase in area, production and yields during 2000s, growth rates slowed down in 2010s. CAGR for production reduced from 6.0 percent in 2000s to 3.24 percent in 2010s. This was contributed by both reduction in CAGR for area (from 2.91 percent to 1.27 percent) and yield (3.01 percent to 1.94 percent). Production of jowar has been falling continuously since 1990s. However, decline in production has accelerated in 2010s (-4.56 percent). This has been contributed by a fall in both area and yields. In case of ragi, CAGR was negative for production (-1.04 percent) and yield (-0.35 percent) in 2010s. This trend is in sharp contrast to the positive growth rates in production (0.70 percent) and yields (3.5 percent) seen for ragi in 2000s. From the above, it can be concluded that overall performance of cereal production has not been satisfactory in 2010s. This is in line with the poor overall agricultural growth in the past few years mainly due to successive droughts in 2014-15 and 2015-16. In view of this, efforts are needed to step up R&D to develop drought resistant varieties for Indian agriculture to protect farmers from the vagaries of irregular rainfall.
3.4 Pulses: The growth rate of area, production and yield for pulses has shown a rapidly increasing trend during 2000s and 2010s. Growth in production for kharif pulses was particularly high in 2010s (7.47 percent). Growth rate of yields in kharif pulses was 2.09 percent in 2010s while growth rate in area was 5.27 percent. This shows that increase in area has contributed more to rise in production than increase in yields. It is important to ensure that future increases in production of pulses are driven more by increase in yields as compared to increase in area. Even for individual pulses, growth rates in production have improved in 2010s as compared to 2000s. Growth rates in production for tur, moong and urad were 7.36 percent, 5.04 percent and 10.1 percent, respectively which are in line with the overall growth trend for pulses.
3.5 Oilseeds: Performance of oilseeds has not been very encouraging during the present decade. After two consecutive decades of positive growth, production of oilseeds declined by 1.54 percent in 2010s. This decline was led by fall in growth rate of area (-0.46 percent) and yield (-1.08 percent). However, growth in productivity of groundnut has remained positive during all three decades. In addition, productivity growth rate has accelerated in each subsequent decade. In 2010s, growth in productivity has been 4.39 percent. This has led to a sustained increase in groundnut production despite continuous fall in area. In case of soybean, growth rate in production became negative (-2.65 percent) during 2010s after an impressive growth of 9.85 percent and 9.39 percent in 1990s and 2000s, respectively. Soybean yield registered negative growth rate (-3.17 percent) during 2010s, which needs to be addressed. The two other oilseeds, sunflower and nigerseed registered a significant decline in area as well as production during the period 1991-92 to 2016-17. However, yield of nigerseed has increased in

Crop
Pro
ducti
vity
The Marketing Season 2018-19 41
2010s (1.90 percent). For sesamum, production has declined marginally in 2010s. This can mainly be attributed to a reduction in area by 1.84 percent in 2010s.
3.6 Cotton: Cotton production increased at a very fast rate (14.2 percent) in the decade spanning from 2001-02 to 2010-11. Most of this production was driven by increase in productivity since the growth in area during this period was only 3.17 percent. This turnaround occurred mainly due to the introduction of Bt Cotton during this time period. However, growth has turned negative (-1.38 percent) during the present decade. Both area (-0.39 percent) and yield (-0.98 percent) have registered negative growth rates during 2010s. This fall can be mainly attributed to drought conditions and incidence of pests mainly whitefly and pink bollworm. Therefore, it is important to address these issues to improve productivity of cotton.
Table 3.1: Trends in CAGRs (percent) of Major Kharif Crops (1991-92 to 2017-18)
CropsArea Production Yield
1990s 2000s 2010s 1990s 2000s 2010s 1990s 2000s 2010sA-Cereals* 0.18 0.27 0.02 2.03 2.25 0.30 1.85 1.96 0.28
Kharif Cereals** -0.51 -0.35 -0.57 0.92 1.46 0.66 1.43 1.81 1.24Paddy** 0.78 0.11 -0.11 1.86 1.71 0.79 1.07 1.60 0.90Bajra** -1.06 0.12 -2.35 1.58 2.14 -0.84 2.67 2.02 1.55Maize** 1.17 2.91 1.27 3.74 6.00 3.24 2.55 3.01 1.94Jowar** -3.11 -3.19 -3.15 -3.14 -0.27 -4.56 -0.03 3.02 -1.45Ragi** -1.99 -2.71 -0.70 -0.35 0.70 -1.04 1.67 3.50 -0.35
B-Pulses* -0.64 1.45 3.09 0.15 3.09 3.05 0.68 1.62 -0.04Kharif Pulses** -1.05 0.52 5.27 -6.67 1.90 7.47 1.52 1.37 2.09Tur** -0.22 1.61 3.44 0.73 2.09 7.36 0.95 0.47 3.80Moong** -0.66 0.32 5.17 -2.56 0.94 5.04 -1.92 0.61 -0.13Urad** -0.74 -1.55 8.26 -1.21 -0.24 10.10 -0.48 1.33 1.70Food Grains* 0.03 0.50 0.53 1.90 2.31 0.55 1.87 1.58 0.02
C-Oilseeds* -0.87 2.21 -0.46 0.56 5.37 -1.54 1.45 3.09 -1.08Kharif Oilseeds** 0.23 2.71 -0.71 2.63 6.10 -1.00 2.39 3.30 -0.28Groundnut** -2.75 -0.80 -0.52 -2.27 1.94 3.85 0.50 2.77 4.39Soybean** 8.08 5.87 0.54 9.85 9.39 -2.65 1.64 3.32 -3.17Sesamun** -4.74 2.63 -1.84 -3.71 2.17 -0.09 1.09 -0.45 1.78Sunflower** -6.94 -2.29 -14.00 -7.00 -0.41 -14.84 -0.06 1.92 -0.97Nigerseed** -3.25 -2.08 -6.91 -4.47 -0.15 -5.15 -1.26 1.97 1.90
D-Cotton** 2.18 3.17 -0.39 0.24 14.20 -1.38 -2.08 10.70 -0.98
Note: *Calculations based on Final Estimates, 2016-17**Calculations based on 2nd Advanced Estimates, 2017-18Source: CACP using DES, Department of Agriculture, Co-operation and Farmers Welfare data

Crop
Pro
ducti
vity
The Marketing Season 2018-1942
Labour Productivity
3.7 The share of agricultural work force in total workforce is continuously declining since 1999-2000. It was about 60 percent during 1999-2000 and declined to 48.8 percent during 2011-12. Further, the NSSO data indicate higher productivity in secondary and tertiary sectors in comparison to agricultural sector. The growth potential of agriculture is much lower compared to industry or service sector, and it results in increasing disparity between agricultural and non-agricultural labour. Thus, shortage of labour coupled with low productivity can become an insurmountable problem in near future as migration of labour from farm to non-farm sector picks up further. The lesser supply of labour also creates a pressure on rural wages, which further increases cost of cultivation. For example, in states like Kerala, Haryana, Punjab and Tamil Nadu wage rate was well above the all-India average for the year 2015-16. Therefore to overcome the twin problems of low productivity and shortage in agricultural labour, renewed focus on customized and low cost farm mechanization is necessary. Considering the fragmented nature of agricultural land in India, it is important to address the problem of farm mechanization on a collective rather than individual basis to ensure economic viability. In this regard, the example of Andhra Pradesh is worth mentioning wherein Custom Hiring Service Centres (CHSCs) have been established in PPP mode. Through CHSCs farm machinery is made available to small and marginal farmers on a rental basis on concessional rates. Other states like Karnataka, Gujarat and a few more have also set up Custom Hiring Centres. Similarly, remaining states should also explore such innovative ideas to overcome the problem of unaffordable farm equipment.
Crop Productivity in the Major Producing States
3.8 Crop productivity in India varies across states to a great extent inter-alia due to variations in agro-climatic conditions and use of farm inputs. In order to study state-wise productivity trends, 5-year Olympic average yield per hectare (The Olympic average is calculated by dropping the highest and lowest yield from the most-recent 5-years and calculating the average based on remaining 3 yields) in major producing states has been compared during 2008-2012 and 2013-2017 and results are presented in Charts 3.1 (a) to (g).
3.9 Rice: Amongst the major producing states, Bihar recorded the highest increase in productivity in the last 10 years (30.2 percent). Further, increase in productivity was greater than 15 percent for 3 other major states namely; Odisha (23.1 percent), Chhattisgarh (18.3 percent), Jharkhand (17.7 percent). Further, Assam also witnessed an impressive increase in productivity (14.8 percent). As can be observed

Crop
Pro
ducti
vity
The Marketing Season 2018-19 43
from the above statistics, eastern region states have witnessed high increases in productivity levels in the recent years. Government’s programme, “Bringing Green Revolution to Eastern India (BGREI)” has played a key role in this turnaround. BGREI is a sub-scheme of Rashtriya Krishi Vikas Yojana which has been formulated to address constraints limiting the productivity of rice based cropping systems. Under the Scheme, activities like cluster demonstrations of improved practices, asset building, site specific activities and marketing support are undertaken. However, it may be noted that, despite showing impressive productivity growth, yield levels in the above mentioned states remain significantly lower than the all-India average (24.6 quintals per hectare). Therefore, it is important that continued focus on BGREI may be maintained. Apart from the above mentioned states, productivity growth in Gujarat (13.6 percent) and Tamil Nadu (10.6 percent) stayed above the all-India average (8.2 percent). An area of concern is the stagnating yields of rice in Punjab which has traditionally been the most productive state for rice. Rice productivity in Punjab has only increased by 0.2 quintals per hectare in the last 10 years. It is important that immediate steps may be taken to address this situation. Also, low productivity growth in Uttar Pradesh (1.1 percent) is a matter of concern as Uttar Pradesh is the largest producer of rice in the country due to its large area under rice. It is important to address this issue immediately.
Chart 3.1: Crop Productivity of Kharif Crops in the Major Producing States
Source: DES, DAC & FW
10045(a) Rice
70
80
90
30
35
40
%)
)
40
50
60
20
25
Rel
ativ
e Yi
eld
( %
Yiel
d (q
tl/h
a
10
20
30
5
10
15
Pun AP TN Har WB Ker Kar Ind UP Jhar Guj Bih Asm Odi CG
2008-12 39.5 31.4 29.4 29.5 26.2 25.5 26.2 22.7 22.2 19.0 19.7 16.2 17.9 15.8 14.8
2013-17 39.7 33.4 32.5 31.4 28.1 27.3 26.8 24.6 22.4 22.4 22.3 21.2 20.5 19.4 17.5
00
Relative Yield 100.0 84.1 81.8 78.9 70.7 68.6 67.4 61.8 56.4 56.3 56.2 53.2 51.6 48.8 44.0
(a) Rice

Crop
Pro
ducti
vity
The Marketing Season 2018-1944
3.10 Maize: All- India Maize yields increased at the rate of 7.6 percent from the period 2008-12 to the period 2013-17. This increase was largely driven by Madhya Pradesh (65.5 percent), Tamil Nadu (31.2 percent), Bihar (31.9 percent) and Uttar Pradesh (21.6 percent). However, decline in yields in the 2 major producing states i.e. Karnataka (-4.4 percent) and Rajasthan (-4.8 percent) exerted a downward pressure on growth in yield at the all-India level. It may also be noted that after Tamil Nadu, which recorded the maximum yield (59.2 quintals per hectare) in the period 2013-17 the yield in the next best performing state i.e. Andhra Pradesh and Telangana (AP+TG) is only 43.9 quintals per hectare. This is just 74.1 percent of Tamil Nadu’s yield. Further, yield level in Gujarat is only 26.4 percent of the yield level in Tamil Nadu for the period 2013-17. The above analysis highlights large scale variations in maize yields across Indian states. Active intervention is necessary to reduce such inter-state variations.
Source: DES, DAC & FW
3.11 Pulses: Productivity of kharif pulses has increased significantly in all the major producing states except Maharashtra where productivity reduced by 5.9 percent. Productivity increase at all-India level was 12.5 percent. Particularly, yields in Tamil Nadu and Madhya Pradesh increased by 54.4 percent and 44.1 percent, respectively and stayed above the all-India average. Yield in 3 major states namely, Karnataka, Odisha and Rajasthan remained below all-India level (6 quintals per hectare). However, Karnataka has shown a high productivity growth of 24.2 percent.
90
100
60
70
(b) Maize
50
60
70
80
40
50
60
ield
(%)
Qtl
/ha)
10
20
30
40
10
20
30
Rel
ativ
e Y
Yiel
d (Q
TN AP+TG Bih Kar Ind MH HP MP UP Raj Guj
2008-12 45.1 38.6 24.7 28.3 24.8 24.8 22.6 13.7 15.5 17.0 15.5
2013-17 59.2 43.9 32.6 27.1 26.7 25.9 23.8 22.7 18.8 16.2 15.6
00
Relative Yield 100.0 74.1 55.0 45.7 45.0 43.8 40.2 38.4 31.8 27.4 26.4
(b) Maize

Crop
Pro
ducti
vity
The Marketing Season 2018-19 45
Source: DES, DAC & FW
3.12 All-India percentage productivity increase in Tur was 19.9 percent. However, productivity increases vary to a great extent across states. While, the highest increase in productivity was shown by Madhya Pradesh (52.7 percent), productivity increase for Karnataka and Jharkhand was 36.3 percent and 24.5 percent, respectively. Odisha (2.5 percent) and Maharashtra (1.4 percent) registered extremely low growths in productivity levels. On the other hand, productivity in Uttar Pradesh fell by 6.7 percent during the same period.
Source: DES, DAC & FW
(c) Kharif Pulses
Guj MP Jhar Odi UP Ind MH Kar AP+TG
2008 12 10.1 7.0 8.2 8.7 9.5 6.8 7.6 5.2 4.4
2013 17 11.3 10.6 10.2 8.9 8.9 8.2 7.7 7.0 5.3
Relative Yield 100.0 94.5 90.7 79.3 78.9 72.5 68.3 62.5 46.8
0
10
20
30
40
50
60
70
80
90
100
0
2
4
6
8
10
12
Relativ
eYield(%
)
Yield(qtl/
ha)
(d) Tur(d) Tur

Crop
Pro
ducti
vity
The Marketing Season 2018-1946
3.13 Oilseeds: There was not much variation in soybean yields among major producing states. While Madhya Pradesh registered maximum yield for Soybean (10.2 quintals per hectare), it was closely followed by Maharashtra and Rajasthan (9.8 quintals per hectare for both). This shows inter-state variations are minimal in case of soybean. However, it may be noted that soybean yields have declined across all major producing states in the period 2013-17. This is mainly because soybean is a rainfed crop, therefore, its yields have suffered greatly due to less than normal rainfall in the years 2014-15 and 2015-16. There is an urgent need to reverse this trend as demand for protein rich foods like soybean is expected to increase with a rise in disposable incomes. Efforts need to be stepped up to increase seed replacement ratios and extend irrigation coverage through innovative irrigation systems like drip and sprinkler under “National Mission on Oilseeds and Oil Palm (NMOOP)” to raise productivity levels for soybean. Also, new methods of cultivation like ridge and furrow may be encouraged and supported to increase soybean yields.
Source: DES, DAC & FW
3.14 For groundnut, productivity increase was 34.8 percent at all-India level. However, inter-state differences in terms of productivity levels are quite large for groundnut. In Gujarat, productivity increased by 49.9 percent. In Tamil Nadu and Rajasthan productivity increases were 18.5 percent and 16.6 percent, respectively. Maharashtra and Karnataka were the states with low productivity increases (less than 10 percent).
(e) Soybean

Crop
Pro
ducti
vity
The Marketing Season 2018-19 47
Source: DES, DAC & FW
3.15 Cotton: In cotton, productivity increases were seen only in a few states namely; Madhya Pradesh (11.1 percent), Rajasthan (10.2 percent), Karnataka (9.4 percent) and Punjab (1.1 percent). However, productivity of cotton has fallen at all-India level over the past 10 years from 5.0 quintals per hectare to 4.8 quintals per hectare. Among the major states that have led to this fall are: Tamil Nadu (-35.9 percent) and Andhra Pradesh + Telangana (-19.1 percent) and Haryana (-4.8 percent). It is interesting to note that Tamil Nadu, which had the highest cotton yield in the period 2008-12 (6.9 quintals per hectare), witnessed a substantial reduction in yields in 2013-17 (4.4 quintals per hectare). This occured due to a significant decline in yields in 2017-18. This fall in all- India yield for cotton is due to several reasons. Firstly, long duration of flowering and boll formation phase leads to prolonged vulnerability of the crop to pests and diseases especially the pink bollworm that occurs as a late season pest. Secondly, there has been a gradual increase in bollworm resistance to insecticides and Bt toxins which has impacted yields negatively. Thirdly, due to frequent incidences of pest infestation farmers have resorted to excessive use of pesticides which has depressed yields further.
(f) Groundnut

Crop
Pro
ducti
vity
The Marketing Season 2018-1948
Source: DES, DAC & FW
3.16 Table 3.2 analyses the variations in growth performance of productivity of kharif crops at the state level. As discussed in the earlier section, at all-India level, the growth rate of yield decelerated in most crops (except tur, urad, sesamum and groundnut) during 2010s compared with 2000s. For paddy, number of states having negative yield growth increased from one in 2000s to three in 2010s. In Bihar, which showed negative yield growth during 2000s (-1.4 percent) the situation reversed in 2010s as the yield growth turned positive (1.2 percent). Yield growth in states like Chhattisgarh and Jharkhand stayed above the national average in 2010s but showed a declining trend in comparison to 2000s. Most of the states recorded a deceleration in yield growth rates in all oilseed crops during last one and a half decade. In groundnut, although the growth rate in yield improved at the all-India level in 2010s, four states recorded negative growth in yields. This highlights the large inter-state variations in growth rate of yields for groundnut. Except for Madhya Pradesh, growth rate in soybean yields was negative for all the major producing states in 2010s. This is in sharp contrast to the 2000s when Madhya Pradesh, Chhattisgarh and Rajasthan registered impressive increase in yields. In case of cotton, all states witnessed deceleration in yield growth. In fact there was a decline in yields for Punjab (-2.0 percent), Gujarat (-4.6 percent) and Tamil Nadu (-4.6 percent). Since, yield growth has to be a predominant source of growth in agricultural output, a steep deceleration in the growth rates of yields in many crops and most of the states in the recent years is a matter of great concern for the researchers and policymakers
Pun Guj Har MP Raj Ind TN AP+TG Kar MH
2008-12 6.5 6.5 6.1 5.0 4.7 5.0 6.9 5.4 4.0 3.2
2013-17 6.5 6.5 5.8 5.5 5.1 4.8 4.4 4.4 4.3 3.2
Relative Yield 100.0 99.1 88.5 84.8 78.8 73.3 67.8 67.3 66.5 48.3
0
10
20
30
40
50
60
70
80
90
100
0
1
2
3
4
5
6
7
8
Re
lati
ve
Yie
ld (
%)
Yie
ld (
qtl
/ha
)
(g) Cotton(g) Cotton

Crop
Pro
ducti
vity
The Marketing Season 2018-19 49
Table 3.2: State-wise Productivity Growth of Major Kharif Crops (2001-02 to 2017-18)
Crop
CAGR (2001-02 to 2010-
11)
2001-02 to 2010-11 CAGR (2011-12 to 2017-
18)
2011-12 to 2017-18
>National Average
<National Average
>National Average
<National Average
Paddy 1.60 Jhar (5.0) Odi (3.6)CG (3.0), Ker (2.0), Asm (1.8)
Kar (1.6), TN (1.6), Pun (1.3), AP (1.2), Har (1.0), UP (0.7), WB (0.5), Bih (-1.4)
0.90 Odi (4.0), CG(2.9), Jhar (2.1), Kar (1.4), AP (1.3), Asm (1.2), Bih (1.2), Pun(1.2),
WB (0.2), Har(-0.1) TN (-1.0), UP(-1.8),
Bajra 2.02 TN (5.1), UP (3.9), Raj (2.7)
AP (-5.7), Guj (-11.4)
1.6 MP(7.4), TN (4.1), Guj(3.2)
AP (1.1),Raj (0.7), UP(0.7), Kar (-0.7), Mah (-3.8)
Maize 3.01 TN (16.8), WB (7.2), AP+TG (4.7) MH(4.5), Kar (3.6)
Raj (2.4),UP (0.6), Bih (0.0)Har (-1.0), Guj (-3.0), MP (-5.3)
1.9 MP (10.7), UP (2.6), TN (2.4)
Guj(1.8), Har (1.8), Bih (1.1), MH (-0.5), Raj(-1.4), Kar (-3.4), AP+TG(-6.1)
Jowar 3.02 Kar (7.88), MP (4.13), Raj (3.76), AP (3.13),
MH (2.21),Bihar (1.7),UP (-0.13), TN (-7.16)
-1.4 MP (3.9), MH (3.1), TN (1.2), Bih (0.0),Kar (-1.0)
UP(-1.6), Raj (-1.9), AP(-3.6)
Tur 0.47 Guj (5.21), Kar (5.09), Bih (1.61) AP (1.24), CG (1.12), MH (1.01)
Jhar (-3.04),UP(-3.77), MP (-3.79)
3.8 MP (13.6), Kar(4.5), AP (4.1),
CG(2.5), Guj (1.8), MH (0.9), Jhar (0.1), UP (-0.5), Bih (-1.4)
Moong 0.61 UP (4.07), Raj (2.89), Guj (2.82), Kar (2.59), Odi (2.87), MP(1.16), AP (0.85), Bih (0.73)
MH(-0.49), CG (-0.65) TN (-3.72)
-0.1 MP (16.9), CG (10.6), Bih (1.3), TN (0.6), Kar (0.3)
Guj (-1.1), AP (-2.3), Odi (-3.0), UP (-8.5)

Crop
Pro
ducti
vity
The Marketing Season 2018-1950
Crop
CAGR (2001-02 to 2010-
11)
2001-02 to 2010-11 CAGR (2011-12 to 2017-
18)
2011-12 to 2017-18
>National Average
<National Average
>National Average
<National Average
Groundnut 2.77 Raj (4.9), AP (4.1)TN (4.1), MP (3.7), Guj (3.3)
CG (2.6), Kar (1.5), MH (0.7)
4.4 Guj (9.0), AP (2.6), Raj (2.1), CG (1.8), Mah (-0.2), MP (-0.6), TN (-3.0), Kar (-4.9)
Soybean 3.32 MP (5.3), CG (5.0), Raj (4.1)
Guj (-0.3), MH (-1.9)
-3.2 MP(2.5) CG(-5.3), Raj (-5.8), Guj (-8.0), MH (-8.0)
Sesamum -0.45 MP (5.7), Raj (5.1)Kar (3.4), TN (0.9), WB(-0.1)
Guj (-2.9), UP (-4.8)
1.8 MP (7.4), TN (4.1), Guj (3.2)
AP (1.1), Raj (0.7), UP (0.7), Kar (-0.7), MH (-3.8)
Sunflower 2.96 MH (3.4), Kar (2.8), AP (1.2)
-1.0 AP (1.4) Kar (-1.6), MH (-4.9)
Cotton 10.70 Raj (15.6), Guj (14.7), Kar (12.0), Har (11.1)
MH (10.5), TN (8.9), AP (6.4), Pun (6.4)
-1.0 MH (5.3), Kar (4.0), AP (1.9), Raj (0.4)
Pun (-2.0), Guj (-4.6), TN (-4.7)
Source: Computed from DES, DAC & FW
Yield Gap Analysis3.17 Yield gap analysis basically involves measurement of yield potential and realized
yield. This helps in identification of constraints and management options to reduce the gaps with feasible and implementable policies that encourage adoption of gap-bridging technologies and practices. In Charts 3.2 to 3.4, we calculated three types of yields for major pulses for TE2016-17 namely; (i) yields achieved under Front Line Demonstration (FLD), where best scientific and management practices are followed, (ii) realized farm yield of improved technology under farmer’s practices and (iii) state average yields. Based on the above, estimated increases in production by bridging the yield gap have been calculated in Table 3.3. In the Table, resultant increase in production from 25 percent, 50 percent, 75 percent and 100 percent reduction in yield gaps has been calculated. Two types of yield gaps have been considered for the above calculation, viz, (i) Yield

Crop
Pro
ducti
vity
The Marketing Season 2018-19 51
Gap (A): difference between realized yields and state average yields, (ii) Yield Gap (B): difference between FLD yields i.e. potential yields and state average yields. Yield Gap (A) is mainly due to non-availability of technology. On the other hand, Yield Gap (B) is due to combination of both biological and socio-economic constraints.
Pulses
3.18 In all kharif pulses, there are significant gaps between the realized yields and state average yields (yield gap (A)) (Chart 3.2 (a) to (c)). Gap between potential and state average yields (yield gap (B)) are also significant in most of the states. This points to major shortfalls in technology and economic means as far as pulses farming is concerned.
3.19 For tur, yield gap (B) was high in all the major producing states. It exceeded 50 percent in Andhra Pradesh (66.3 percent), Telangana (63.1 percent) and Uttar Pradesh (51.3 percent). Lowest yield gap (B) was observed in Madhya Pradesh i.e. 24.4 percent. However, for yield gap (A) inter-state variations were much larger. While, Yield Gap (A) was 50.8 percent and 50.3 percent for Telangana and Andhra Pradesh, respectively, it was only 2.0 percent in Madhya Pradesh. Lower Yield Gap (A) in Madhya Pradesh was mainly due to increased incidents of water stress at the time of maturity, poor soil conditions and unseasonal rains in areas from where realized yields were calculated.
3.20 For urad, state average yield was 49.6 percent lower than potential yield in Rajasthan and 49.2 percent lower in Maharashtra. In case of difference between realized yield and state average yield, the gap was negative for Madhya Pradesh i.e. -11.4 percent whereas, for Rajasthan it was 36.6 percent. However, on account of larger area under cultivation of urad in Madhya Pradesh yield gap (A) at all- India level was only 1.7 percent.
3.21 In case of moong, the potential yield exceeds the state average yield by 72.2 percent in Karnataka, 46.6 percent in Rajasthan, 42.9 percent in Tamil Nadu and 36.7 percent in Gujarat. This has led to a large overall gap between potential yields and state average yields at all-India level (42.9 percent). Similarly yield gap (A) for moong at all-India level was 27.5 percent which was largely due to high yield gap (A) in Karnataka (66.5 percent). Lowest Yield Gap (A) was observed in Maharashtra (14.6 percent).

Crop
Pro
ducti
vity
The Marketing Season 2018-1952
Chart 3.2: Yield Gap Analysis of Pulses in Major Producing States
Source: Indian Institute of Pulses Research, Kanpur
Source: Indian Institute of Pulses Research, Kanpur
Source: Indian Institute of Pulses Research, Kanpur

Crop
Pro
ducti
vity
The Marketing Season 2018-19 53
3.22 Based on calculations made by CACP using the yield gap analysis, it is possible to increase production of kharif pulses by about 2.0 to 5.0 million tonnes even with the existing technologies if biological and socio-economic constraints are addressed and farmers follow best practices (Table 3.3).
Table 3.3: Estimated Additional Production of Kharif Pulses by Bridging Yield Gap
Crop
Likely impact of reduction in crop yield gaps on Total Production (‘000 tonnes)Yield Gap A Yield Gap B
25% 50% 75% 100% 25% 50% 75% 100%Tur 321 643 964 1285 664 1328 1992 2656Urad 10 19 29 38 243 486 720 972Moong 166 332 499 665 330 659 989 1318Total 499 994 1492 1988 1237 2473 3701 4946
Oilseeds
3.23 Yield gaps in oilseeds are quite large and show a great deal of variation across states. Yield gap (A) i.e. difference between realized yield and state average yield ranges from -2.9 percent for groundnut (Madhya Pradesh) to 74.0 percent in Sunflower (Karnataka). Similar variations can be seen for yield gap (B) i.e. difference between potential yield and state average yield for oilseeds. Yield gap (B) was minimum in Gujarat for groundnut (15.2 percent) and maximum in Karnataka for sunflower (77.6 percent). The yield gaps for 3 oilseeds viz., groundnut, soybean and sunflower are analysed in Charts 3.3 (a) to (c).
3.24 In case of groundnut, among the major producing states, yield gap (A) was highest in Karnataka (50.0 percent) followed by Maharashtra (36.7 percent) and Andhra Pradesh (31.9 percent). Madhya Pradesh was an outlier since yield gap (A) was negative in the state (-2.9 percent) which shows that state average yields exceeded realized yields in Madhya Pradesh. This mainly resulted from the fact that in Madhya Pradesh data on realized yields was calculated from resource poor marginal farmers in rainfall deficit districts. Further, potential yields exceeded state average yields in all groundnut producing states. This is depicted by yield gap (B) which was as high as 60.0 percent in Karnataka and minimum of 15.2 percent in Gujarat.
3.25 For soybean, there was a large gap between potential yields and state average yields (yield gap (B)) in Karnataka (64.6 percent) and Maharashtra (60.8 percent) while the all-India gap between potential yields and state average was 44.1 percent. Further, there were large inter-state variations in yield gap (A) as well. Yield gap (A) remained

Crop
Pro
ducti
vity
The Marketing Season 2018-1954
above 50 percent in Karnataka (58.1 percent) and Maharashtra (54.1 percent). In, Madhya Pradesh and Rajasthan the gap was relatively lower i.e. 6.5 percent and 5.4 percent, respectively.
3.26 For sunflower, all-India yield gaps were very high. While yield gap (A) was 61.9 percent, yield gap (B) was 67.6 percent for all-India. This was due to high level of yield gaps in Karnataka (yield gap (A): 74.0 percent, yield gap (B): 77.6 percent) and Maharashtra (yield gap (A): 58.9 percent, yield gap (B): 67.7 percent). This shows that there is a large potential to increase soybean production by using innovative farming methods.
Chart 3.3: Yield Gap Analysis of Oilseeds in Major Producing States
Source: Directorate of Groundnut Research, Junagarh
Source: Indian Institute of Oilseeds Research, Hyderabad

Crop
Pro
ducti
vity
The Marketing Season 2018-19 55
Source: Indian Council of Agricultural Research, Delhi
3.27 If state average yields can be further improved and reach a level of potential yield, about 11.7 million tonnes of additional oilseeds, particularly soybean can be produced (Table 3.4). Therefore, efforts are needed to improve availability of quality seeds along with other inputs and services like extension and credit. Low seed replacement rates and lack of even protective irrigation in pulses and oilseeds are other reasons for low productivity. In view of this, we need to improve seed replacement rate and particularly promote protective irrigation.
Table 3.4: Estimated Additional Production of Kharif Oilseeds by Bridging Yield Gaps
CropLikely Impact of Reduction in Yield Gaps on Total Production (‘000 tonnes)
Yield Gap A Yield Gap B25% 50% 75% 100% 25% 50% 75% 100%
Soybean 1127 2253 3380 4506 2112 4224 6336 8448Groundnut 274 548 822 1097 649 1298 1948 2597Sunflower 133 266 399 532 171 342 513 684Total 1534 3067 4601 6135 2932 5864 8797 11729
Cotton
3.28 In case of cotton also, state average yields fall well short of both potential and realized yields (Chart 3.4). In all the states, realized yields exceeded the state average by more than 50 percent. Highest gap was observed in Karnataka (76.1 percent) while, lowest was observed in Punjab (64.2 percent). Yield gap (B) was also very high across India. Yield gap (B) was highest in Karnataka (79.9 percent) followed by Maharashtra (77.3 percent). High yield gap in Individual states has manifested itself in the form of high yield gaps at all-India level as well. At the all-India level yield gap (A) and yield gap (B)
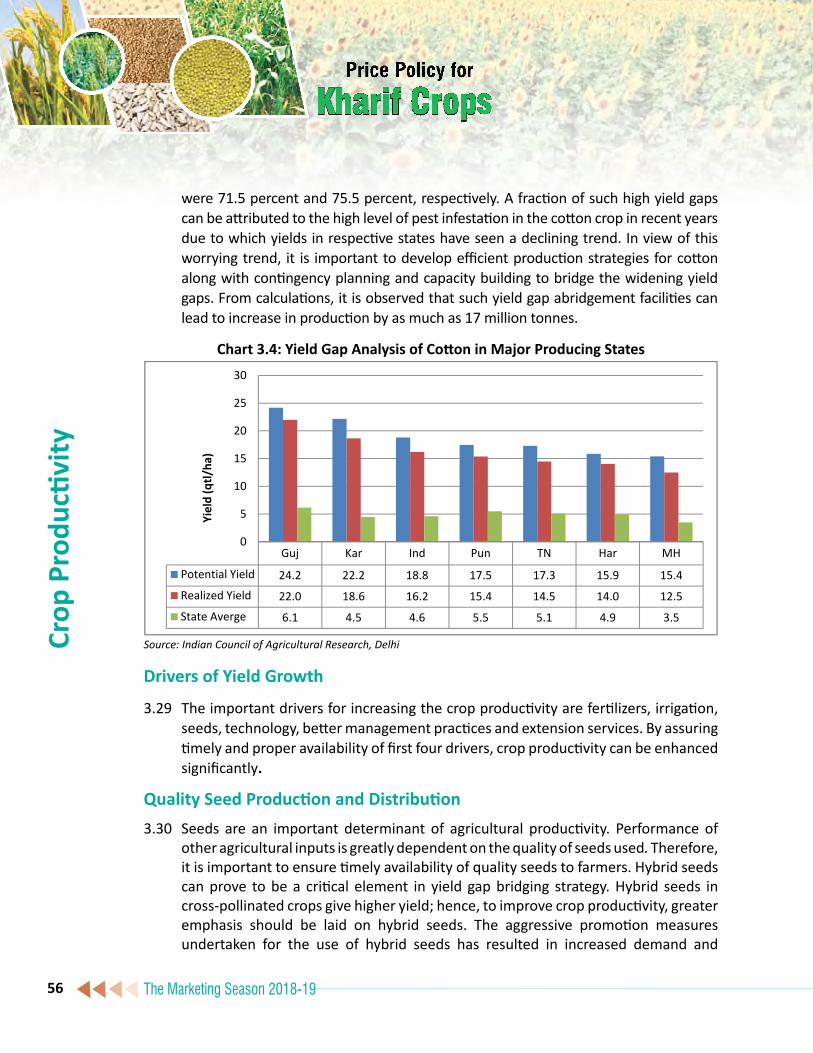
Crop
Pro
ducti
vity
The Marketing Season 2018-1956
were 71.5 percent and 75.5 percent, respectively. A fraction of such high yield gaps can be attributed to the high level of pest infestation in the cotton crop in recent years due to which yields in respective states have seen a declining trend. In view of this worrying trend, it is important to develop efficient production strategies for cotton along with contingency planning and capacity building to bridge the widening yield gaps. From calculations, it is observed that such yield gap abridgement facilities can lead to increase in production by as much as 17 million tonnes.
Chart 3.4: Yield Gap Analysis of Cotton in Major Producing States
Source: Indian Council of Agricultural Research, Delhi
Drivers of Yield Growth
3.29 The important drivers for increasing the crop productivity are fertilizers, irrigation, seeds, technology, better management practices and extension services. By assuring timely and proper availability of first four drivers, crop productivity can be enhanced significantly.
Quality Seed Production and Distribution3.30 Seeds are an important determinant of agricultural productivity. Performance of
other agricultural inputs is greatly dependent on the quality of seeds used. Therefore, it is important to ensure timely availability of quality seeds to farmers. Hybrid seeds can prove to be a critical element in yield gap bridging strategy. Hybrid seeds in cross-pollinated crops give higher yield; hence, to improve crop productivity, greater emphasis should be laid on hybrid seeds. The aggressive promotion measures undertaken for the use of hybrid seeds has resulted in increased demand and

Crop
Pro
ducti
vity
The Marketing Season 2018-19 57
production of hybrid seeds in the country as a whole. All-India availability of hybrid seeds has increased from 210.1 thousand tonnes in 2011-12 to 259.1 thousand tonnes in 2015-16. Similarly, during the same period, requirement has increased from 179.1 thousand tonnes to 211.2 thousand tonnes. However, despite the overall increase, inter-temporal and inter-crop variations in requirement/ availability of seeds remain significant. Crop-wise requirement and availability of hybrid seeds during the period 2011-12 to 2015-16 is shown in Charts 3.5 to 3.8.
3.31 For rice, requirement and availability of certified/ quality hybrids has shown large fluctuations during the period. As can be observed in Chart 3.5, there was a massive jump in requirement (219.2 percent) and availability (241.3 percent) in 2012-13 for certified/ quality hybrids for rice in comparison to 2011-12. However, requirement and availability fell by 64.7 percent and 43 percent, respectively in 2014-15 over the previous year (2013-14). This period of decline was again followed by an impressive jump in 2015-16. For 2015-16, requirement and availability of certified/ quality hybrids was 38.5 thousand tonnes and 61.4 thousand tonnes, respectively.
Chart: 3.5: Requirement and Availability of Certified/ Quality Seeds of Hybrids for Rice (2011-12 to 2015-16)
Source: DAC & FW
3.32 For Maize, requirement and availability figures stayed relatively stable during the period. From Chart 3.6 it can be observed that, while requirement was nearly the same in 2015-16 (101.6 thousand tonnes) as in 2011-12 (101.7 thousand tonnes), there was a marginal dip in availability from 122 thousand tonnes in 2011-12 to 120.5 thousand tonnes in 2015-16.

Crop
Pro
ducti
vity
The Marketing Season 2018-1958
Chart: 3.6: Requirement and Availability of Certified/ Quality Seeds of Hybrids for Maize (2011-12 to 2015-16)
Source: DAC & FW
3.33 In case of sunflower, requirement and availability of certified/ quality seeds increased for the first time in 2015-16 after a period of sustained decline from 2011-12 to 2014-15 (Chart 3.7). However, despite increase, the requirement (4.4 thousand tonnes) and availability (4.6 thousand tonnes) figures in 2015-16 have stayed below 2011-12 figures (Requirement: 6.9 thousand tonnes, Availability: 9.6 thousand tonnes).
Chart: 3.7: Requirement and Availability of Certified/ Quality Seeds of Hybrids for Sunflower (2011-12 to 2015-16)

Crop
Pro
ducti
vity
The Marketing Season 2018-19 59
3.34 In case of cotton, requirement and availability statistics for certified/ quality hybrids are not very encouraging. Requirement has fallen by 4.1 percent over the 2011-12 figures whereas fall in availability has been 12 percent over the same period (Chart 3.8).
Chart: 3.8: Requirement and Availability of Certified/ Quality Seeds of Hybrids for Cotton (2011-12 to 2015-16)
Source: DAC & FW
3.35 Although, as shown by above analysis requirement and availability of certified/ quality hybrid seeds has increased in the recent years yet significant ground needs to be covered. When we consider the percentage use of improved as well as hybrid seeds combined, it is observed that while their usage is nearly 100 percent in case of paddy, for other major kharif cereals it is relatively lower. For example, in maize use of improved as well as hybrid seeds is below 80 percent. Further, it is observed that although most of paddy is being grown using either improved or hybrid seeds but within this reach of hybrids in particular still remains very low. Usage of hybrid seeds within the category of “improved and hybrid seeds” is very miniscule i.e. around 2 percent for paddy whereas for maize it is around 30 percent. Among pulses, tur offers significant scope to adopt hybrid and improved seeds as the usage at present is only around 60 percent. Within this, usage of hybrid seeds is only around 5 percent. Similarly, for groundnut and soybean as well usage of hybrid seeds stayed low (below 5 percent). This shows that if policies are directed towards shift from local needs to improved and hybrid seeds significant production gains can be achieved.1
Irrigation 3.36 Productivity of kharif crops to a great extent is dependent on the performance of
the south west monsoon. However, the extent of rainfall during the south west
1 ICAR, “Draft Background Paper on Agricultural Policy and Reforms for Higher and Sustained Farmers’ Income"

Crop
Pro
ducti
vity
The Marketing Season 2018-1960
monsoon season often falls below its long period average affecting productivity negatively. Further, there is also a significant variation in geographical distribution of rainfall across India. As can be viewed in Chart 3.9, in five years beginning from 2013, rainfall during the South West Monsoon season remained below its Long Period Average (LPA) in four years In this regard, there is a need to accelerate the coverage of gross irrigated area to mitigate the impact of extreme weather events on agricultural yields. For the year 2014-15, gross irrigated area as a percentage of total cropped area stood at 48.6 percent at all-India level. Therefore, more than half of total cropped area still remains unirrigated. It shows that there is significant ground to be covered in terms of expanding irrigation coverage in Indian agriculture. Further, Chart 3.10 brings out the large inter-state variations in irrigation coverage. As seen in the chart, for the year 2014-15, irrigation coverage in northern states, especially Punjab (98.7 percent) and Haryana (89.1 percent) was extremely high. However, for other states there exists a wide scope for expansion of irrigation facilities. Specifically in states like, Maharashtra (18.2 percent), Kerala (17.9 percent), Jharkhand (14.3 percent) and Assam (9.2 percent) irrigation coverage falls well below the all-India average. There is an urgent need to plug this gap to improve yields in agriculture and improve farm incomes.
Chart 3.9: Actual Rainfall as a percentage of Normal Rainfall in the South West Monsoon Season (June 1 - September 30)
Source: DES, DAC & FW

Crop
Pro
ducti
vity
The Marketing Season 2018-19 61
Chart 3.10: Gross Irrigated Area as percentage of Total Cropped Area
Source: DES, DAC & FW
3.37 However, it is important to ensure that a major chunk of future extension in irrigation is achieved through modern techniques like drip and sprinkler irrigation. This is because, micro irrigation techniques i.e. drip and sprinkler ensure economy of water use. Efficient use of water assumes particular significance in view of increasing instances of river water sharing disputes across states, depleting levels of ground water and increasing frequency of droughts. Chart 3.11 shows the percentage distribution of area irrigated by different sources of irrigation as per the Agricultural Census 2010-11. As can be inferred, the area under irrigation from sources other than tubewells, canals, wells and tanks was just 7 percent. In absolute terms, other sources (which include drip and sprinkler) only covered 4329 hectares.
Chart 3.11: Percentage Area Irrigated by Different Sources of Irrigation
Source: CACP using DAC & FW data (Agriculture Census 2010-11)

Crop
Pro
ducti
vity
The Marketing Season 2018-1962
3.38 Considering the above scenario, to expand area under irrigation and consequently reduce dependence of Indian agriculture on rainfall, Pradhan Mantri Krishi Sinchayee Yojana (PMKSY) is being implemented with the objective of developing a long term solution for mitigating the effect of drought and increasing the area under irrigation with the motto: Har Khet Ko Pani. The scheme has been envisaged with an outlay of ₹ 50,000 crore for a period of 5 years (2015-16 to 2019-20). The scheme particularly lays special emphasis on micro irrigation with the motto “Per Drop More Crop”. The renewed thrust provided to Micro irrigation under PMKSY is evident from Chart 3.12 which presents the all- India figures for Physical target/ achievements for area under micro irrigation. As can be seen from the chart, physical achievements fell short of the targets for the years 2013-14 and 2014-15. However, after the introduction of micro irrigation under PMKSY, physical achievements have exceeded the targets in two consecutive years viz. 2015-16 and 2016-17. Further, as on 25th December, 2016 all-India coverage under micro irrigation stood at 8626.8 thousand hectares. Therefore, the area under micro irrigation has nearly doubled since the Agricultural Census 2010-11. It is important that the present thrust on micro irrigation under PMKSY be maintained to achieve more effective utilization of a scarce resource like water.
Chart 3.12: Physical Target/ Achievement under Micro-Irrigation
Source: DAC & FW
3.39 Fertilizers: Chart 3.13 shows fertilizer consumption over the period: 2010-11 to 2016-17. As can be observed from the chart, total consumption of fertilizers has reduced in 2016-17 when compared to consumption in the previous year (2015-16). There

Crop
Pro
ducti
vity
The Marketing Season 2018-19 63
has been a reduction in usage of N and P nutrients in 2016-17 over the previous year. While consumption of N fell by 3.7 percent, fall in consumption of P was 3.9 percent. It may be noted that the recent fall in consumption of N can be linked to the steps taken by the Government to check diversion of highly subsidized urea towards non-agricultural purposes. One such step was the introduction of the policy of 100 percent neem coating of indigenously produced urea and imported urea w.e.f 1st September, 2015 and 1st December, 2015, respectively. However, consumption of K nutrient has marginally increased in 2016-17 (4.4 percent) over the previous year. Due to the above changes the N,P,K ratio has improved to 6.7:2.7:1 on account of reduction in N and P usage after touching a high of 8.1:3.2:1 in 2012-13. Despite slight improvement in ratio, excessive use of fertilizers still remains a serious problem. This has also led to a decline in soil fertility. To find a long term solution to the problem of excessive and imbalanced use of fertilizers, it is essential to link the distribution of fertilizers to the recommendations in Soil Health Cards at the earliest, across India. Further, the idea of providing cash transfers instead of fertilizer subsidies may be explored as it has the potential to allow farmers to choose fertilisers in the combination best suited to their needs thereby correcting fertilizer imbalances. In view of this, introduction of DBT in fertilizer distribution is a welcome step.
Chart 3.13: Consumption of Fertilizers
Source: Fertilizers Association of India

Crop
Pro
ducti
vity
The Marketing Season 2018-1964
Inter-Country Comparisons of Crop Productivity
3.40 India is among the top producers of several important crops such as wheat, rice, pulses, sugarcane and cotton. For all the major crops, there has been a long term increasing trend in production. However, despite increasing production agricultural yields are found to be lower in case of most crops in comparison to other major producing countries. The problem of low yields has made it difficult to free up agricultural land for other income generating activities without compromising on production. Table 3.5 shows a comparison of Indian agricultural yields with world agricultural yields for the year 2015. As can be observed from the table, all-India yields for major kharif cereals i.e. rice and maize fell well below the world average. For rice, all-India yields (2400.2 kg per hectare) are only 51.7 percent of the world average (4636.6 kg per hectare). In fact, yield in even the most productive state i.e. Punjab (3974.1 kg per hectare) fell below the world average. Further, all-India yield for rice is roughly one-third of the China (6932.4 kg per hectare) which has the highest yield among the major rice producing countries. For maize also the gap between world average and all- India yield is very large. All-India yield for maize is less than half (45.4 percent) of world average. In view of this, India must make efforts to increase yields of rice and maize to reach world average through effective policy interventions.
3.41 In case of pulses, yield gap between world average (731.2 kg per hectare) and all- India average (656.2 kg per hectare) was relatively smaller. Introduction of higher MSPs for pulses in the recent years has played a significant role in bridging the yield gap. However, it is pertinent to keep up the efforts to increase yields of pulses even further and bring them at par or higher than the world average.
3.42 For oilseeds, difference in world average yield and all-India yield was not much in case of groundnut (7.9 percent). However, all-India yield for soybean (738.4 kg per hectare) is significantly lower than world average (2675.7 kg per hectare). This is mainly due to damage suffered by soybean crop in the agricultural year: 2015-16 on account of low rainfall. Therefore, to increase soybean yields, investment in irrigation must be enhanced under the programme National Mission on Oil Seeds and Oil Palm (NMOOP).

Crop
Pro
ducti
vity
The Marketing Season 2018-19 65
Linking MSP with Oil Content in Sunflower
3.43 Area under sunflower has declined from 3.81 lakh hectare in 2016-17 to 3.35 lakh hectare in 2017-18. This decline has implications for sunflower oil production. In order to increase area under sunflower, farmers should be incentivized through linking MSP of sunflower seed with its oil content. There are variations in oil content of different varieties of sunflower and therefore a uniform MSP may not be desirable. Therefore, the Commission is of the opinion that farmers be incentivized for higher ‘oil content’. As recommended in previous reports, Commission reiterates that the MSP of sunflower be linked to the basic ‘oil content’ of 35 percent in sunflower seeds and farmers be incentivized for every 0.25 percent point increase in its ‘oil content’ beyond this level.
3.44 To determine the incentive for higher ‘oil content’, one quintal of sunflower seed will give 35 kg of oil and 65 kg of oil cake. Adjusting the value of cake, the cost of sunflower seed (oil without cake) would be `4053 (`5385 – `1333) which will contain 35 kg of oil. Thus, the MSP will increase by `25.39 for every 0.25 percent point increase in oil content (Chart 3.14). Cost per unit of oil content slowly decreases with increase in ‘oil content’ (Annex Table 3.1). Taking average oil content between 35 percent and 48 percent, the average cost for every 0.25 percent point works out to `25.39 per quintal. Hence Commission recommends that MSP of sunflower seeds should be increased by `25.39 per quintal for every 0.25 percent point increase in ‘oil content’ over and above the base oil content of 35 percent in sunflower seed.
Table 3.5: Yield Comparisons for Major Crops (kg per hectare)
Crop World Average* World Highest* All-India Average# State Highest#
Rice (Paddy) 4636.6 6932.4 (China) 2400.2 3974.1 (Pun)
Maize 5640.1 10960.4 (USA) 2562.7 7010 (TN)Pulses (Total) 731.2 5540.3(Australia) 656.2 931 (Guj)Tur 829.9 1612.3 (Kenya) 646.1 1124.8 (Guj)Soybean 2755.6 3500.6 (USA) 738.4 831 (MP)Groundnut 1590.1 4118.6 (USA) 1464.9 2574.3 (TN)
Note:* FAOSTAT for World Average and World Highest#DES, Department of Agriculture, Co-operation and Farmers Welfare for All-India Average and State Highest.

Crop
Pro
ducti
vity
The Marketing Season 2018-1966
Recapitulation
3.45 Production growth rates decelerated in 2010s for all kharif cereals. Further, it is a matter of concern that in oilseeds production growth has become negative with the exception of groundnut wherein growth in production remained positive and showed an increasing trend. Similarly, cotton has also witnessed negative production growth rates. Production growth rate for total pulses has been constant over the last two decades. However, within pulses tur, moong and urad have shown impressive growth rates in the present decade. Since productivity improvement is a predominant source of growth of agricultural output as area under cultivation is facing competition from other sectors due to the ever increasing demands, a steep deceleration in the growth rates of yields in most crops is a matter of great concern for the policymakers. The yield gap analysis reveals that there are wide gap between potential yield and actual yields in both pulses and oilseeds. Therefore, production can be increased significantly even with the existing technologies if timely availability of seed and other inputs is assured and farmers are trained to follow the best practices.
3.46 Fertilizer consumption has reduced in 2016-17. This has been led by a reduction in consumption of Nitrogen (N) based fertilisers which has resulted in a slight improvement in N, P, K ratio. This is an encouraging sign. Also, significant expansion in micro-irrigation has been achieved since the launch of PMKSY in 2015. But, to overcome the challenges posed by a possible water crisis in the future, it is essential to continue the efforts made under PMKSY.
*****
` ` `
`
`
`

The Marketing Season 2018-19 67
Chap
ter 4
Chapter 4Trade Competitiveness of Indian AgricultureTrade Performance4.1 Balance of Trade (BoT) in agri-sector has been better than the overall BoT for India. It
is evident from the fact that India’s share in total world export is 1.7 percent in 2016, while the share in world agri-exports is higher at 2.1 percent during the same year. Similarly, India’s share in total world imports in the year 2016 is 2.2 percent whereas the share in agri-imports is lower at 1.8 percent for the same period (Annex Tables 4.1 & 4.2). As per DGCIS data, the share of India’s agri-exports in total exports, declined by 0.4 percent, from 13 percent in 2015-16 to 12.6 percent in 2016-17. Whereas the share of agri-imports in total imports, increased by 0.6 percent, from 6.6 percent to 7.2 percent in the corresponding period. It may be relevant to underscore here, that if the objective of farmer’s welfare is to be realized, improving terms of trade of agri-sector is going to be a crucial factor. World’s major agri-exporters and importers are given in Chart 4.1. As regards agri-exports, India remains at 9th position whereas for agri- imports, it stands at 7th position. India’s agri-trade performance in 2016 was not very comfortable as agri-exports registered a decline of 5 percent and agri-imports increased by 5 percent in that year. A look at the four years exports data from 2013-14 to 2016-17 shows that the share of India’s agri-exports in its total exports registered a negative annual growth rate of 3.2 percent whereas the share of agri-imports in total imports registered a steep increase of 21.5 percent in the same period. Due to this our net agri-trade surplus decreased substantially from the level of ` 159 thousand crore in 2013-14 to ` 48.3 thousand crore in 2016-17. Major agri-export commodities are rice, marine products, meat, spices, cotton and sugar, whereas the major import-commodities are edible oils, pulses, wood & wood products, fresh fruits, cashew, spices and sugar (Annex Tables 4.3 & 4.4). In the overall import bill of India, share of vegetable oil is largest at 44.1 percent of total bill during 2017, followed by pulses (13.1 percent) (Annex Table 4.4). Major kharif

Trad
e Co
mpe
titive
ness
of I
ndia
n Ag
ricul
ture
The Marketing Season 2018-1968
crops of India being traded and crucial for enhancing welfare of India’s farmers are discussed in paragraphs below.
Chart: 4.1 World’s leading Agri-Exporters and Importers -2016
Source: WTO
Rice
4.2 Rice is one of the most prominent export commodities from India. As per USDA, global production of rice was 479.8 million tonnes in triennium ending (TE) 2016-17 and about 9 percent of the production was traded. China is the largest producer with a share of 29.8 percent, followed by India (22.6 percent). Other major producers of rice are Vietnam (5.6 percent), Indonesia (7.6 percent) and Bangladesh (7.1 percent). India is the largest exporter of rice with a share of 25.6 percent closely followed by Thailand (24 percent). Other major exporters are Vietnam (13.7 percent), Pakistan (7.7 percent) and Myanmar (6.6 percent). China is also the largest importer of rice with a share of 11.3 percent. Nigeria, Bangladesh, EU, Saudi Arabia, Iran and Philippines are other major importers of rice, accounting for about 22.7 percent of global rice imports.
4.3 Ban on export of non-basmati rice in India was lifted in September 2011. India has emerged as the largest exporter of rice since 2012-13, and this includes both basmati and non-basmati. Export of rice (Basmati + non-Basmati) was about 72 lakh tonnes in 2011-12 and increased to 120 lakh tonnes in 2014-15 but declined to 108 lakh tonnes in 2016-17, due to fall in non-basmati exports. Basmati rice recorded a notable increase in export during 2015-16 from 37 lakh tonnes in 2014-15 to 40.5 lakh tonnes in 2015-16 and is about 40 lakh tonnes in 2016-17. The country’s export of rice (Basmati + non-Basmati) from 2006-07 to 2016-17 is shown in Chart 4.2.

Trad
e Co
mpe
titive
ness
of I
ndia
n Ag
ricul
ture
The Marketing Season 2018-19 69
Chart 4.2: India’s Export of Rice, 2006-07 to 2016-17
Source: DGCISSource: DGCIS
Note: * 1 lakh =100000 **1 crore =10000000Source: DGCIS
4.4 Chart 4.3 below reveals that domestic wholesale prices of rice were generally lower than its international prices during 2013-2017, barring the second quarter of 2014 and 2017. This is a clear proof that Indian rice has remained export competitive barring a few occasions between period 2013 and 2017. Also, the domestic whole sale price of paddy, converted into rice, has been generally higher than MSP [except 2015 (Q3)]. MSP has been continuously lower than international prices during this period.
Chart 4.3: MSP, Domestic and International Prices of Paddy, 2013 to 2017
Note: 1. Rice (Thailand), 25 percent broken, WR, milled indicative survey price, government standard, f.o.b. Bangkok 2. International Prices of rice converted into paddy at the ratio of 0.67. 3. Weighted wholesale price of Andhra Pradesh (AP), Assam, Chhattisgarh, Gujarat, Haryana, Kerala, Karnataka,
Madhya Pradesh (MP), Maharashtra, Punjab, Tamil Nadu (TN), Uttar Pradesh (UP) and West Bengal (WB), which covered 77 percent of production in 2016-17.
Source: DES, DAC&FW for domestic wholesale prices and World Bank for International prices
`/qt
l
`

Trad
e Co
mpe
titive
ness
of I
ndia
n Ag
ricul
ture
The Marketing Season 2018-1970
4.5 Export of non-basmati rice from India was banned on 15th October, 2007. However, the ban on export of rice was replaced with Minimum Export Price (MEP) of US $425 per tonne on 31st October, 2007 which has been revised from time to time. Export of non-basmati rice was prohibited from Central Pool in March 2008 and also on private account in April, 2008 in view of tight position of rice in the domestic market. This ban continued till July 2011 when export of 10 lakh tonnes of non-basmati rice on private account was allowed with a Minimum Export Price (MEP) of $425 per tonne. In September 2011, export of non-basmati rice was allowed under the Open General License (OGL) by private parties out of privately held stocks and this has continued thereafter. Import duty of 80 percent on husked (brown) rice and broken rice and 70 percent on milled and semi-milled rice was imposed in April 2000. In view of tight position of rice in domestic market, import of milled and semi-milled rice was allowed at zero percent import duty from 01.03.2008 to 01.04.2009. With some intermittent relaxations, import duty on rice remains at 70-80 percent. Such a high level of import duty on a water guzzling crop like rice may not be desirable and if import duty on rice is rationalized, it may support crop diversification into much needed crops like oilseeds and pulses.
Maize
4.6 As per USDA, the global production of maize was 1024.3 million tonnes in TE2016-17, out of which about 13 percent was traded. USA is the largest producer of maize (corn) with a share of 35.8 percent followed by China (20.4 percent), Brazil (9.1 percent), EU (5.7 percent), Argentina (3.8 percent) and India (2.4 percent). USA is also the largest exporter with a share of 39.2 percent followed by Argentina (16.2 percent), Ukraine (15.1 percent) and Brazil (14 percent). EU (10.8 percent), Japan (10.7 percent), Mexico (10.3 percent), South Korea (6.5 percent) and Egypt (6.2 percent) are the major importers of maize, accounting for about 44.4 percent of the global imports.
4.7 Export of maize from India has increased substantially since 2006-07 till 2012-13 (Chart 4.4) which was made possible through increase in productivity as a result of introduction of single cross hybrid (SCH) variety in 2005. India’s exports increased from 6.4 lakh tonnes in 2006-07 to about 48 lakh tonnes in 2012-13 and thereafter it started falling gradually for next two years and it plunged to 7 lakh tonnes in 2015-16 and further fell to 5.7 lakh tonnes mainly due to low world prices and fall in domestic production. It can be seen from chart 4.5 that domestic wholesale prices of maize have been lower than the international price till 2013 (Q3) but from 2013 (Q4), the domestic prices moderately moved higher than the international price and

Trad
e Co
mpe
titive
ness
of I
ndia
n Ag
ricul
ture
The Marketing Season 2018-19 71
have continued the trend with the gap between two prices increasing thereafter till 2017. Currently, Indian maize is not export competitive, therefore, there is a need to find alternative uses of maize, within the country for consumption and for industrial purposes such as thickener of gravies, sauces, food fillers, baking & various uses in ice creams and in pharmaceuticals, textiles & paper industries, etc. MSP of maize is currently lower than the domestic wholesale price, but it is considerably higher than the international prices.
Chart 4.4: India’s Export of Maize, 2006-07 to 2016-17
Source: DGCIS
Note: 1.Maize (US), No. 2, yellow, f.o.b. US Gulf ports2. Weighted wholesale price of AP, Bihar, Gujarat, Karnataka, MP, Maharashtra, Punjab, Rajasthan, TN and UP, which cover 78 percent of production in 2016-17 Source: for domestic wholesale prices and World Bank for International prices
Source: DGCIS
Chart 4.5: MSP, Domestic and International Prices of Maize, 2013 to 2017
Note: 1.Maize (US), No. 2, yellow, f.o.b. US Gulf ports2. Weighted wholesale price of AP, Bihar, Gujarat, Karnataka, MP, Maharashtra, Punjab, Rajasthan, TN and UP, which cover 78 percent of production in 2016-17Source: DES, DAC&FW for domestic wholesale prices and World Bank for International prices.
`/qt
l
Source: DGCIS
Note: 1.Maize (US), No. 2, yellow, f.o.b. US Gulf ports2. Weighted wholesale price of AP, Bihar, Gujarat, Karnataka, MP, Maharashtra, Punjab, Rajasthan, TN and UP, which cover 78 percent of production in 2016-17 Source: for domestic wholesale prices and World Bank for International prices
`

Trad
e Co
mpe
titive
ness
of I
ndia
n Ag
ricul
ture
The Marketing Season 2018-1972
Jowar
4.8 As per USDA, the global production of jowar has increased from 61.4 million tonnes in 2015-16 to 63.2 million tonnes in 2016-17. The global production of jowar was 63.6 million tonnes in TE2016-17 out of which 15.7 percent was traded. USA is the largest producer with a share of 19.3 percent followed by Nigeria (10.9 percent), Sudan (9.28 percent), Mexico (7.44 percent) and India (7.23 percent). USA is also the largest exporter with a share of 79.4 percent followed by Australia (7.1 percent) and Argentina (6 percent). China is the largest importer with a share of 68 percent followed by Japan (7.3 percent).
4.9 Import duty of 50 percent on jowar was levied in April 2000 and that has been raised to 80 percent. Quantitative ceiling on export of jowar was removed in March 2002 and its export continues to be free. During the period from 2006-07 to 2016-17, India’s exports of sorghum & jowar combined have fluctuated between a low of 59.13 thousand tonnes in 2006-07 to a high of 286.82 thousand tonnes in 2012-13. Exports of sorghum & jowar combined have declined to 66.13 thousand tonnes in 2016-17. The domestic wholesale prices of jowar have been continuously higher than international prices during 2013 to 2017 (Chart 4.6). Freight advantage compared to USA allows India to export small quantities to countries like Pakistan, Saudi Arabia, UAE and Kenya. MSP of jowar has been continuously lower than the domestic wholesale prices but higher than the international prices from 2013 (Q2) onwards.
Chart 4.6: MSP, Domestic and International Prices of Jowar, 2013 to 2017
Source: DES, DAC&FW for domestic wholesale prices and World Bank for International prices.
`/qt
l

Trad
e Co
mpe
titive
ness
of I
ndia
n Ag
ricul
ture
The Marketing Season 2018-19 73
Pulses
4.10 Pulses such as lentils, beans, peas and chickpeas forms critical part of the general food basket in India. Promoting cultivation of pulses can help India overcome nutrition insecurity, improve soil fertility by nitrogen fixation and provide income support to farmers. Here we need to underline that instead of promoting exports of water intensive crops like paddy and sugarcane, considering the size of import bill of pulses, it would make better sense to encourage further production of pulses to curtail India’s import bill by offering incentives to farmers to grow more pulses by rotating crops and bringing in high-yielding seeds and also with appropriate support price.
4.11 India is the largest producer, consumer and importer of pulses in the world. As per DGCIS, imports of pulses have increased from 22.7 lakh tonnes valued at `3900 crore in 2006-07 to 66 lakh tonnes valued at `28300 crore in 2016-17 (Chart 4.7). Peas constitute the largest share (48 percent) in pulses imports followed by chickpea (16.4 percent), lentils (12.5 percent) and Pigeon peas (10.6 percent) in 2016-17. As per FAO, the global production of pulses was 83.3 million tonnes in TE2016. India was the largest producer of pulses with a share of 20.4 percent followed by Canada (9.5 percent), Myanmar (7.63 percent), China (4.9 percent), Nigeria (3.5 percent), Russian Federation (3.4 percent) and Ethiopia (3.2 percent). Canada (lentils and peas), Myanmar (moong/urad) and Australia (chickpeas) are major exporters of pulses to India and account for about three-fourth of total imports in the country. Other importers are Russia, Mozambique, Kenya and USA.
Chart 4.7: India’s Import of Pulses, 2006-07 to 2016-17
Source: DGCIS
`

Trad
e Co
mpe
titive
ness
of I
ndia
n Ag
ricul
ture
The Marketing Season 2018-1974
4.12 Import duty on pulses was brought down from 10 percent to zero percent in June 2006 but vide government notification dated 30.6.2017, 10 percent import duty was imposed on Tur (Arhar) due to steep decline in domestic prices as a result of increased domestic production, with a view to save domestic farmers. In August 2017, three pulses were brought under quantitative restrictions for imports. First, on 05.08.2017, 2 lakh MT annual (fiscal year) quota was imposed on tur dal, and on 21.08.2017, 3 lakh MT annual quota imposed on Urad and Moong due to increased production and domestic price falling below MSP. On 21.12.2017, Government imposed 30 percent import duty on Chickpeas and Lentils which was further increased to 60 percent on chickpeas in March 2018, due to oversupply and depressed prices in domestic market. Exports of pulses were banned in June 2006 initially for a period of six months which has now been freed for exports of all varieties of pulses including organic pulses without any quantitative ceiling, vide government notification dated 22.11.2017, subject to export shall be through Customs Electronic Data Interchange (EDI) Ports only. However, exports through Land Custom Stations (LCS) Indo-Bangladesh and Indo-Nepal border shall also be allowed subject to registration of quantity with DGFT.
4.13 The domestic wholesale prices of kharif pulses have been compared with international prices (C&F) during the period from 2013 to 2017 in the following charts. It may be observed from Charts 4.8 to 4.10 that the domestic wholesale prices of kharif pulses, viz., arhar, urad and moong have generally followed the trend of the international prices during 2013 to 2017 except last two quarters of 2017 for Moong. These trends clearly show impact of Indian imports on world markets. MSP of Arhar, Urad and Moong are currently higher than the domestic wholesale prices and also higher than the international prices.
Chart 4.8: MSP, Domestic and International Prices of Arhar, 2013 to 2017
Source: DES, DAC&FW for domestic wholesale prices. DAC& FW and NAFED for International prices
``

Trad
e Co
mpe
titive
ness
of I
ndia
n Ag
ricul
ture
The Marketing Season 2018-19 75
Chart 4.9: MSP, Domestic and International Prices of Urad, 2013 to 2017
Source: DES, DAC&FW for domestic wholesale prices. DAC&FW and NAFED for International prices
Chart 4.10: MSP, Domestic and International Prices of Moong, 2013 to 2017
Source: DES, DAC&FW for domestic wholesale prices. DAC&FW & NAFED for International prices
`
Source: for domestic wholesale prices. DAC&FW & NAFED for International prices
`/qt
l
Trad
e Co
mpe
titive
ness
of I
ndia
n Ag
ricul
ture
The Marketing Season 2018-1976
Oilseeds and Edible Oils4.14 As per USDA, the global production of major oilseeds was 544 million tonnes in
TE2016-17, out of which about 28.4 percent was traded. Soybean has the largest share in total oilseeds production with a share of 61.2 percent followed by rapeseed (12.2 percent), sunflower seed (8.3 percent), Peanuts (7.5 percent) and cottonseed (6.8 percent). USA is the largest producer with a share of 22.1 percent followed by Brazil (20.4 percent). Other major producers are Argentina (10.9 percent), China (9.6 percent) and India (6.6 percent). Brazil and USA export about 72.5 percent of global exports, with a share of 37.1 percent and 35.4 percent respectively. China and European Union account for 70.3 percent of global imports, with a share of 59.2 percent and 11.5 percent, respectively.
4.15 As per USDA, the global production of major edible oils was 181 million tonnes in TE 2016-17, out of which about 42.5 percent was traded. Palm oil has the largest share (34.3 percent) in total edible oils production followed by soybean oil (28.6 percent), rapeseed oil (14.8 percent) and sunflower seed oil (9.6 percent). Indonesia is the largest producer with a share of 21.8 percent followed by China (14.3 percent), Malaysia (11.2 percent) and EU (9.6 percent). Indonesia and Malaysia together account for nearly 58.7 percent of global exports with a share of 37 percent and 21.7 percent, respectively. India was the largest importer of edible oils with a share of 20.8 percent followed by EU (13.8 percent) and China (10.8 percent) in 2016-17. Demand for edible oils is going up in India, while domestic production is stagnant due to which dependence on imports to meet India’s edible oil requirements is increasing year on year. Effective measures to increase domestic production are essential to reduce import dependency on edible oils. However, for the short or medium term, appropriate tariff levels on edible oils could be considered as a useful instrument.
4.16 As per DGCIS data, India’s imports of edible oils have increased from 43.7 lakh tonnes valued at ` 9900 crore in 2006-07 to 140.1 lakh tonnes valued at ` 73000 crore in 2016-17 (Chart 4.11). Import of edible oils have significantly increased during 2014-15 and 2015-16 due to fall in domestic production coupled with decline in international prices of edible oils, particularly palm oil. Import of edible oils in India was about 44.4 lakh tonnes in TE2006-07 that has increased to about 141.2 lakh tonnes in TE2016-17. Thus, there is an overall increase of 218 percent in import of edible oils in last decade. At present, India relies on imports for 70 percent of its edible oil consumption and increase in import duty in November 2017 is with a view to discourage imports and to lift domestic Oilseed prices and their availability for crushing in the domestic markets.

Trad
e Co
mpe
titive
ness
of I
ndia
n Ag
ricul
ture
The Marketing Season 2018-19 77
Chart 4.11: India’s Import of Edible Oils, 2006-07 to 2016-17
Source: DGCIS, Kolkata
Soybean including Oil and Meal
4.17 As per USDA, the global production of soybean was 328.3 million tonnes during TE2016-17, out of which about 42 percent was traded. Global production of soybean has increased from 313.8 million tonnes in 2015-16 to 351.3 million tonnes in 2016-17. USA is the largest producer of soybean with a share of 33.3 percent, followed by Brazil (32.5 percent) and Argentina (16.5 percent). India’s share in global production of soybean is only 3.3 percent. Brazil and USA contribute 83 percent of total world exports with a share of 43 percent and 40 percent respectively. China and EU import about three-fourth of total world imports of soybean with a share of 65 percent and 9.3 percent respectively. World production of soybean is increasing every year, leading to significant drop in global soybean and soybean oil prices which are much lower than domestic prices.
4.18 The global production of soybean oil was 51.6 million tonnes in TE2016-17, out of which 21 percent was traded. China is the largest producer with a share of 29.3 percent followed by USA (18.6 percent), Argentina (15.6 percent) and Brazil (14.6 percent). These top four producers account for about 78 percent of total world production of soybean oil. India’s share in global production of soybean oil is only 3.1 percent. Argentina, Brazil and USA account for nearly 68 percent of total world exports with a share of 47.5 percent, 10.9 percent and 10.2 percent, respectively. India is the largest importer with a share of 32.3 percent followed by Bangladesh (7.6 percent). Import of soybean oil has increased at the highest rate among all other oils in last five years.
4.19 The global production of soybean meal was 217 million tonnes in TE2016-17, out of which 28.5 percent was traded. China is the largest producer of soybean meal with
`

Trad
e Co
mpe
titive
ness
of I
ndia
n Ag
ricul
ture
The Marketing Season 2018-1978
a share of 31 percent followed by USA (18 percent), Argentina (14.7 percent) and Brazil (14 percent). India’s share in global production of soybean meal is 3.3 percent. Argentina, Brazil and USA export nearly 86 percent of total world exports with a share of 48.5 percent, 21.3 percent and 16.3 percent, respectively. EU is the largest importer of soybean meal with a share of 31.5 percent followed by Vietnam (7.7 percent) and Indonesia (7.1 percent). Export of soybean meal picked up in 2016-17 because of low soybean prices in India.
4.20 India exports small quantities of soybean. However, the country imports soybean oil to meet domestic demand. Import of soybean oil has increased from 12.1 lakh tonnes in 2006-07 to 34.6 lakh tonnes in 2016-17 (Chart 4.12). Import of soybean oil have significantly increased in 2014-15 and 2015-16 due to decline in domestic production and international price of soybean oil during this period. Import of soybean oil has declined in 2016-17 to 34.6 lakh tonnes, in comparison to 39.6 lakh tonnes in 2015-16 which is likely to decline further due to increase in import duty in November 2017.
Chart 4.12: India’s Import of Soybean Oil, 2006-07 to 2016-17
Source: DGCIS
4.21 Domestic wholesale prices of soybean have been continuously higher than the international prices from 2013 to 2017 (Q3) (Chart 4.13). MSP of soybean has been continuously lower than domestic wholesale prices, whereas it is currently higher than the international prices since 2016 (Q4). Domestic wholesale prices of soybean dropped from 2016 (Q3) onwards and now are stable slightly above MSP since 2017 (Q1). Due to increase in world production of soybean, there is significant decline in international prices of soybean and are constantly lower than India’s domestic wholesale prices.
`

Trad
e Co
mpe
titive
ness
of I
ndia
n Ag
ricul
ture
The Marketing Season 2018-19 79
Chart 4.13: MSP, Domestic and International Prices of Soybean, 2013 to 2017
Note: 1. Argentina Up River, FOB Crude: IGC 2. Weighted wholesale price of MP, Maharashtra, and Rajasthan, which cover 93 percent of production in 2016-17. Source: DES, DAC&FW for domestic wholesale prices and USDA for international prices.
4.22 Domestic wholesale price of soybean oil has been continuously higher than international price during 2013 to 2017 and the gap has widened since 2013 (Chart 4.14), thereby increasing imports. Since 2017(Q2), both domestic and international prices of soybean are moving upward. However, there is a broad consistency in the trends of domestic and international prices.
Chart 4.14: Domestic and International Prices of Soybean Oil, 2013 to 2017
Note: Argentina Up River, FOB Crude: IGCSource: The Solvent Extractors Association of India for domestic wholesale prices and USDA for International Prices
`/qt
l`/
qtl

Trad
e Co
mpe
titive
ness
of I
ndia
n Ag
ricul
ture
The Marketing Season 2018-1980
4.23 As per DGCIS, India’s exports of soybean meal have increased from 46 lakh tonnes in 2006-07 to a high of 52.5 lakh tonnes in 2011-12 but it declined to only 4.1 lakh tonnes in 2015-16 before rising again to 12.8 lakh tonnes in 2016-17 (Chart 4.15). Bangladesh, Japan, France, Nepal and Myanmar were major destinations for India’s export during 2016-17. Domestic wholesale prices of soybean meal have been continuously higher than international prices from 2013 (Q4) to 2017 except 2017 (Q1) (Chart 4.16), indicating that Indian exports are not competitive in the global market.
Chart 4.15: India’s Export of Soybean Meal, 2006-07 to 2016-17
Source: DGCIS
Chart 4.16: Domestic and International Prices of Soybean Meal, 2013 to 2017
Source: The Solvent Extractors Association of India for domestic prices and USDA for international prices
`/qt
l
`

Trad
e Co
mpe
titive
ness
of I
ndia
n Ag
ricul
ture
The Marketing Season 2018-19 81
Groundnut
4.24 As per USDA, global production of groundnut was 41.21 million tonnes in TE2016-17, out of which 8.5 percent was traded. China, India, Nigeria and USA produce more than two-thirds of total world production with a share of 40 percent, 15.7 percent, 7 percent and 5.9 percent respectively. India’s exports of groundnut have increased from 2.5 lakh tonnes in 2006-07 to 8.3 lakh tonnes in 2011-12 (Chart 4.17). However, export of groundnut declined subsequently to 5.4 lakh tonnes in 2015-16 before rising again to 7.3 lakh tonnes in 2016-17.
Chart 4.17: India’s Export of Groundnut, 2006-07 to 2016-17
Source: DGCIS
4.25 Global production of groundnut oil was 5.6 million tonnes in TE2016-17 out of which only about 4.2 percent was traded. It shows that most of groundnut oil is produced for self- consumption. China and India produce more than two-thirds of the total world production with a share of 48.8 percent and 21.1 percent respectively. China, EU and USA are the main importers of groundnut oil, whereas India, China, EU and USA export it in small quantities.
4.26 During 2013 to 2017, domestic prices of groundnut have been higher than international prices, except 2013 (Q4) (Chart 4.18). India’s exports of groundnut are mainly to South-East Asian countries, Gulf countries and to neighbouring countries like Nepal, Pakistan and Sri Lanka, where India has freight advantage in comparison to other competitors like Argentina and USA. MSP of groundnut which was lower than domestic prices during first two quarters of 2013 and during 2015 (Q2) to 2016 (Q3), except 2015 (Q4), has become higher than domestic as well as international prices since then. Domestic price of groundnut oil has been continuously higher
`

Trad
e Co
mpe
titive
ness
of I
ndia
n Ag
ricul
ture
The Marketing Season 2018-1982
than international price since 2014 (Q4) onwards till 2017 (Q1) and thereafter it fell below the international price (Chart 4.19).
Chart 4.18: MSP, Domestic and International Prices of Groundnut, 2013 to 2017
Note: 1. US Farm Price, in Shell 2. Weighted wholesale price of AP, Gujarat, Karnataka, Rajasthan and TN, which cover 89 percent of production
in 2016-17.Source: DES for domestic wholesale prices and USDA for international prices.
Chart 4.19: Domestic and International Prices of Groundnut Oil, 2013 to 2017
Note: South East Mills FOB; Tank Cars Crude; USDASource: The Solvent Extractors Association of India for domestic wholesale prices and USDA for International Prices.
4.27 Global production of sunflower seed, as per USDA, was 43.9 million tonnes in TE2016-17, out of which only 5.1 percent was traded. Ukraine and Russia produce
`/qt
l`/
qtl

Trad
e Co
mpe
titive
ness
of I
ndia
n Ag
ricul
ture
The Marketing Season 2018-19 83
more than half of total world production with a share of 32 percent and 22.8 percent respectively. Other major producers are EU (18 percent) and Argentina (7.1 percent). Russia is the largest exporter with a share of 14.8 percent followed by EU (14.2 percent) and Ukraine (7.7 percent). EU is the largest importer with a share of 31.8 percent followed by Turkey (27.8 percent) and Russia (5 percent). Global production of sunflower oil was 16.8 million tonnes in TE2016-17, out of which 55 percent was traded. Ukraine, Russia and EU produce about three fourths of total world production with a share of 34.9 percent, 23 percent and 18.3 percent respectively. Ukraine and Russia export about three-fourths of the global exports with a share of 56.2 percent and 20.9 percent respectively. EU is the largest importer with a share of 20.3 percent followed by Turkey (8.8 percent).
4.28 As per DGCIS, India exports small quantities of sunflower seed, whereas its imports are nil. Import of sunflower oil have increased from a small quantity of 1.4 lakh tonnes in 2006-07 to 17.1 lakh tonnes in 2014-15 (Chart 4.20), before declining to 14.9 lakh tonnes in 2015-16 and again rising to 17.3 lakh tonnes in 2016-17.
Chart 4.20: India’s Import of Sunflower Oil, 2006-07 to 2016-17
Source: DGCIS
4.29 Domestic wholesale price of sunflower seed has been continuously higher than the international prices from 2013 (Q2) onwards and following the trend more or less similar to the international prices (Chart 4.21). However, MSP of sunflower seed is higher than the domestic as well as international prices and has been increasing gradually especially from 2016 (Q3) onwards whereas the domestic wholesale prices and international prices are declining since 2016 (Q1). Also, domestic wholesale prices of sunflower oil have been continuously higher than the international prices from 2013 (Q2) to 2017 (Chart 4.22). Production of sunflower seed/oil increased mainly in the major producing countries, viz., Ukraine, Russia and EU countries due
`

Trad
e Co
mpe
titive
ness
of I
ndia
n Ag
ricul
ture
The Marketing Season 2018-1984
to favourable weather conditions which led to decline in prices of these commodities during this period.
Chart 4.21: MSP, Domestic and International Prices of Sunflower Seed, 2013 to 2017
Note: 1. Rotterdam/ Amsterdam CIF; EU; Oil World. 2. Weighted wholesale price of AP, Karnataka, Maharashtra and TN, which cover 60 percent of production in
2016-17.Source: DES for domestic wholesale prices and USDA for international prices.
Chart 4.22: Domestic and International Prices of Sunflower Oil, 2013 to 2017
Note: EU FOB NW Euro; Oil World.Source: The Solvent Extractors Association of India for domestic wholesale prices and USDA for International Prices.
`/qt
l`/
qtl

Trad
e Co
mpe
titive
ness
of I
ndia
n Ag
ricul
ture
The Marketing Season 2018-19 85
Trade Policy of Oilseeds/Edible Oils
4.30 Exports of oilseeds are free while imports of oilseeds are under OGL with an import duty of 30 percent since January, 2003 but on 17.11.2017, Government increased import duty to 45 percent only on soybean, subjects to quarantine condition. Edible oils were under negative list of imports till April, 1994 when import of palm olein was placed under OGL subject to 65 percent import duty. Subsequently, imports of other edible oils were also placed under OGL and import duty was as high as 80 percent on crude oil and 90 percent on refined edible oils during early 2000s but was reduced to zero percent on crude and 7.5 percent on refined edible oils in April, 2008. Import duty on crude edible oils was increased to 2.5 percent in January, 2013 which was further increased to 7.5 percent in December, 2014 and to 12.5 percent in September, 2015. Import duty on refined edible oils was also increased to 10 percent in January, 2014 which was further increased to 15 percent in December, 2014 and to 20 percent in September, 2015. However, import duty was reduced on crude palm oil to 7.5 percent and on refined palm oil to 15 percent from September, 2016 vide notification dated 30.06.2017, Government increased import duty on crude soybean oil from 12.5 percent to 17.5 percent and on crude and refined palm oil from 7.5 percent to 15 percent and from 15 percent to 25 percent respectively. On 11.08.2017, government further increased import duty on crude edible oils soybean to 30 percent, palm oil to 30 percent, sunflower and rapeseed/mustard to 25 percent while on edible refined oils soybean to 35 percent, palm oil to 40 percent, sunflower and rapeseed/mustard to 35 percent in order to defend the falling domestic oil prices.
4.31 In order to improve self-sufficiency in edible oils, holistic changes in the import duty structure of edible oils have been introduced since November 2017 onwards wherein the import duty of crude palm oil of edible grade has been raised from 15 percent to 30 percent and on refined palm oil of edible grade from 25 percent to 40 percent. Import duty on crude soybean oil has been increased to 30 percent from 17.5 percent, while refined soybean oil has been raised to 35 percent from the current 20 percent. Similarly, the import duty on crude sunflower oil has been increased to 25 percent from 12.5 percent, while that on refined sunflower oil has been increased to 35 percent from 20 percent. Also, the import duty on soybean oilseeds has been increased to 45 percent from 30 percent.
4.32 Export of edible oils was initially prohibited for a period of one year in March, 2008 which was extended from time to time. However, there are certain exemptions, namely (a) castor oil, (b) coconut oil from all Electronic Data Interchange (EDI)

Trad
e Co
mpe
titive
ness
of I
ndia
n Ag
ricul
ture
The Marketing Season 2018-1986
Ports and through all Land Custom Stations (LCS), (c) Deemed export of edible oils (as input raw material) from Domestic Tariff Area (DTA) to 100 percent Export Oriented Units (EOUs) for production of non-edible goods to be exported, (d) Edible oils from DTA to Special Economic Zones (SEZs) to be consumed by SEZ Units for manufacture of processed food products, subject to applicable value addition norms, (e) Edible oils produced out of minor forest produce, (f) Organic edible oils subject to export contracts being registered and certified as ‘Organic’ by APEDA, and (g) rice bran oil in bulk (irrespective of any pack size). In addition, export of edible oils in branded consumer packs of up to 5 kg is permitted with a Minimum Export Price (MEP) of US $ 900 per MT. India’s trade policy for major kharif crops, is summarized in Table 4.1.
Table 4.1: India’s Trade Policy – Kharif Crops
Sl. No.
Crop/ Commodity
Trade Policy Import Policy Export Policy
OGL/ Import ban
Import duty (%)
Bound Duty (%)
OGL/ Export ban
Export duty (%)
A-Cereals
1 Rice OGL
(rice in husk,
Husked brown rice;
Broken rice) - 80
80
OGL Zero(Semi-
milled or Wholly
milled rice) - 70
70
2 Maize OGL 50 70 OGL Zero3 Jowar OGL 80 80 OGL Zero
B-Pulses4 Tur OGL 10 100 OGL Zero5 Urad OGL Zero 100 OGL Zero6 Moong OGL Zero 100 OGL Zero
C-Oilseeds/Edible Oils7 Soybeans OGL 45 100 OGL Zero8 Groundnut OGL 30 100 OGL Zero

Trad
e Co
mpe
titive
ness
of I
ndia
n Ag
ricul
ture
The Marketing Season 2018-19 87
Sl. No.
Crop/ Commodity
Trade Policy Import Policy Export Policy
OGL/ Import ban
Import duty (%)
Bound Duty (%)
OGL/ Export ban
Export duty (%)
9 Sunflower seed OGL 30 100 OGL Zero
10 Soybean oil (crude)
OGL (Tariff value –US$
831 per metric
tonne)**
30 45 Export ban*
11 Groundnut oil (crude) OGL 12.5 300 Export ban*
12 Sunflower oil (crude) OGL 25 300 Export ban*
13 Soybean Oil (refined) OGL 35 45 Export ban*
14 Groundnut oil (refined) OGL 20 300 Export ban*
15 Sunflower oil (refined) OGL 35 300 Export ban*
16 Soybean meal OGL Zero 100 OGL ZeroD- Commercial Crops17 Cotton OGL Zero 100 OGL Zero
Note: * Export of edible oils in branded consumer packs up to 5 kg is permitted with MEP of US$ 900 per MT. ** As on 15/02/2018Source: CBEC and DGFT
Cotton
4.33 Global production of cotton has increased from 21 million tonnes in 2015-16 to 23 million tonnes in 2016-17. As per USDA, global production of cotton was 23.4 million tonnes in TE2016-17, out of which about 33 percent was traded. India and China produce more than half of total world production of cotton with a share of 25.3 percent and 21.3 percent, respectively. Other major producers are USA (16.1 percent), Pakistan (7.2 percent) and Brazil (6.5 percent). USA is the largest exporter with a share of 40 percent followed by India (12.2 percent), Australia (10 percent) and Brazil (7.5 percent). Bangladesh is the largest importer with a share of 17.8 percent followed by Vietnam (14.6 percent), China (13.4 percent) and Turkey (9.8 percent).

Trad
e Co
mpe
titive
ness
of I
ndia
n Ag
ricul
ture
The Marketing Season 2018-1988
Chart 4.23: MSP, Domestic and International Prices of Raw Cotton, 2013 to 2017
Note: 1.Cotton (Cotton Outlook “Cotlook A index”), middling 1-3/32 inch, traded in Far East, C/F beginning 2006; previously Northern Europe, c.i.f.2. Weighted wholesale price of AP, Gujarat, Haryana and Karnataka, which cover 50 percent of production in 2016-17.Source: DES, DAC&FW for domestic wholesale prices and World Bank for international prices.
4.34 Domestic wholesale and international prices of raw cotton have been continuously higher than the MSPs from 2013 (Q1) onwards (Chart 4.23). International prices were higher than domestic wholesale prices till 2014(Q2) and remained below till 2016 (Q2) except for 2015 (Q2, Q3) and kept on crossing each other till 2017(Q3). In 2017 (Q4), international price was once again above domestic prices.
4.35 Quantitative restrictions (QRs) on export of cotton were removed by the Government in July, 2001 and its exports were placed under OGL. To curb the rising price trend in the domestic market, government imposed export duty of ` 2500 per tonne on raw cotton in April, 2010 to avoid disruption in supply chain of cotton in the country till the end of cotton season 2009-10. Cotton export was placed on restricted category in May, 2010 but export was allowed at zero export duty in August, 2010 with the restrictions that the contracts for exports are registered with DGFT prior to shipment. Cotton export is currently free and the registration requirement for export of cotton has been dispensed with vide notification dated 08.12.2014. Import of cotton was placed under OGL in April 1994. Import duty of 5 percent was levied on import of cotton in March 1999 which was increased to 10 percent in January 2002 in order to avoid import of cheaper cotton. However, import duty was reduced to zero in July 2008, and it continues to be at the same level. India is the second largest exporter of cotton in the world. During the period from 2006-07 to 2016-17, India’s export
`/qt
l

Trad
e Co
mpe
titive
ness
of I
ndia
n Ag
ricul
ture
The Marketing Season 2018-19 89
of cotton fluctuated between a low of 4.4 lakh tonnes in 2008-09 to a high of 19.9 lakh tonnes in 2012 -13 (Chart 4.24). Exports of cotton declined to 18.6 lakh tonnes in 2013-14 and 10.9 lakh tonnes in 2014-15 but increased to 13 lakh tonnes in 2015-16 and again declined in 2016-17 to 9.1 lakh tonnes. The main reason for decline in exports of cotton in 2014-15 was steep decline in import demand from China due to slowdown in Chinese economy and their consequent intend to reduce cotton reserve stocks.
Chart 4.24: India’s Export of Cotton, 2006-07 to 2016-17
Source: DGCIS
Trade Outlook
4.36 According to the February 2018 report of Agricultural Marketing Information System’s (AMIS) Market Monitor and Food Outlook November 2017, world trade in all cereals is predicted to be 404 million tonnes in 2017-18, which is only 1.8 million tonnes (0.4 percent) below the previous season’s record volume . Trade in rice in 2018 is expected to decline by 2 percent to 46 million tonnes. Rice inventories in 2018 are expected to exceed by 1 percent due to higher than anticipated inventories in China. Trade in all the major cereals is expected to contract except maize. World trade in oils/fats and meals/cakes are anticipated to keep expanding in 2017/18 though the pace of expansion may be slow. Cotton trade is expected to be in the range of previous year’s level despite more production, subdued demand from China and a shift to trading cotton yarn and fabrics rather than raw cotton, which emerged over the past few years, is expected to continue but in longer run it is expected to rise. According to the FAO, Food Price Index (FPI) which was 174.6 points in 2017, up 8.2 percent from the previous year represented the highest annual average since 2014.
` '0
00 C
rore

Trad
e Co
mpe
titive
ness
of I
ndia
n Ag
ricul
ture
The Marketing Season 2018-1990
The annual average price index of cereals and oils registered a modest increase of 3.3 percent and 3.1 percent respectively over 2016 annual average prices. However, in the month of February 2018, significant increase occurred only in cereal prices index (2.9 percent) while oil prices declined by (3.1 percent) over previous month. Currently, cotton prices are ruling strong but are expected to get softened in medium term due to increased supply and subdued demand.
4.37 India’s agri-exports have increased from 168.1 thousand crore in 2016-17 (April-December) to 190.6 thousand crore in 2017-18 (April-December) at a growth rate of 13.4 percent. Agri-imports have increased from 135.2 thousand crore to 139.2 thousand crore with a growth rate of 2.9 percent during the corresponding period. If we compare the data of 2014-15 and 2015-16 (April to December), this is a good sign for agri-trade segment, as our exports registered a significant increase and imports increased substantially at a lower level. This happened mainly due to increased exports of oil meals (63.4 percent), castor oil (56.9 percent), marine products (23.3 percent) and cashew (25.3 percent) while slow growth in imports due to lower import in pulses and lower prices of vegetable oils. Major exports that declined during 2017-18 (April-December) are sugar (33.7 percent) and fresh vegetables (18.6 percent). However, no significant increase occurred in any imported commodities. India’s agri-exports in 2017-18 are likely to increase compared with 2016-17 mainly due to demand for agricultural commodities in global economy. The export of sugar is expected to decrease due to lower international prices and export duty on sugar in India. Agri-imports in 2017-18 are likely to increase moderately by about 5 percent due to widening of gap between production and consumption of edible oils, and low imports of pulses. There has been increase in domestic demand for better quality of wheat and long staple cotton, therefore, imports of these commodities may increase.
4.38 International prices of maize, soybean, soybean oil, groundnut, sunflower seed, sunflower oil for 2017 (Q4) are far lower than domestic prices and therefore export of these commodities seems to be bleak. However, rather than taking trade outlook as given, India needs to take steps to alter the outlook in its favour by utilising modern technology and increasing capacities to tap economies of scales.
4.39 Considering 60 to 70 percent dependency of India, on edible oil import and weightage of edible oils, in India’s import bill, it is high time to consider turn-around to encourage large scale cultivation of oilseeds in the future for import substitution with better support-price-incentives over rest of the commodities and their earnest implementation. Ambitious increment in share of cropped area under oil seeds through utilisation of fallow lands and also through diversion of cropped area under

Trad
e Co
mpe
titive
ness
of I
ndia
n Ag
ricul
ture
The Marketing Season 2018-19 91
water intensive crops like paddy and sugarcane may also considered a felt need in India. Better price incentives offered to desirable crops are likely to emanate right signals required for crop change and may encourage farmers to switch over to crops like oil seeds and pulses which are actually in demanded in the domestic market. This will save the markets getting glutting with commodities which are not demanded by the consumers. Import substitution-incentive policy may be extended to pulses as well in equal vigour to minimise imports. With a view to improve India’s trade advantage and diversify food basket, with a view to accommodate varied demand for different grains produced and consumed in different regions of India, better incentives for cultivation of high yielding varieties of millets like jowar/sorghum, bajra etc, could also be considered.
Recapitulation
4.40 It is observed that India’s Balance of Trade (BoT) in agri-sector has been better than the overall BoT. However, it is also observed that this advantage has decelerated during the recent past. Four years exports data from 2013-14 to 2016-17 shows that the share of India’s agri-exports in its total exports registered a negative annual growth rate of 3.2 percent whereas the share of agri-imports in total imports registered a steep increase of 21.5 percent in the same period. Major agri-export commodities are rice, marine products, meat, spices, cotton and sugar, whereas the major import-commodities are edible oils, pulses, wood & wood products, fresh fruits, cashew, spices and sugar. Prominent crops of kharif season which are traded by India and that which could make significant change in farmers’ welfare have been discussed in the pages above. As cereal trade except maize is likely to shrink a bit as per the trade outlook, India’s export of rice may take a hit. Oil complex trade is likely to expand slowly. Cotton trade is likely to have no change. Rise in food price index is likely to be at an all time high since 2014. International demand for India’s agricultural commodities is likely to help our exports and moderate increase in agri-imports are likely as a result of widening of gap between production and consumption of edible oils, and low imports of pulses. Considering India’s excessive import dependence on oils and oil seeds and their ballooning import bills, India needs to take concrete steps to scale up import substitution cultivation. Possibilities for expanding production and domestic consumption of coarse grains and scope for their trade could also be an available instrument to enhance farmers’ welfare.
*****

The Marketing Season 2018-1992
Chapter 5
Costs and Returns
Chap
ter 5
Chapter 5
5.1 The Commission used to consider the cost of production (CoP) and other important factors such as demand and supply situation, trends in domestic and international prices, inter-crop price parity, terms of trade between agricultural and non-agricultural sectors and the likely impact of MSP on consumers and overall economy along with rational utilization of scarce natural resources like land and water while recommending MSPs of mandated agricultural crops.
5.2 The Commission uses crop-wise, state-wise cost estimates provided by the Directorate of Economics & Statistics (DES), Ministry of Agriculture and Farmers Welfare compiled under ‘Comprehensive Scheme (CS) for studying the Costs of Cultivation (CoC) of Principal Crops in India’. Since CS data is generally available with a time lag of three years in case of kharif crops, this need to be projected for kharif crop season 2018-19. Based on CS data, crop-wise, state-wise projections of CoC are made for the ensuing season.
5.3 The projected CoC estimates of 14 mandated crops for kharif season 2018-19 are based on actual estimates for latest three years, viz., 2013-14 to 2015-16 for each state. However, CoC estimates are not projected for states where share in all-India production for a particular crop is negligible or where number of sample holdings under CS for that crop is very thin. The CoC estimates’ projections capture movement in overall input cost separately for the crop season 2018-19 over each of the past three years, viz., 2013-14, 2014-15 and 2015-16. An assessment of likely changes in input costs for the crop year 2018-19 with reference to each of the above mentioned three consecutive years ending with 2015-16 is made by constructing the Composite Input Price Index (CIPI) (base 2011-12=100) based on latest prices of different inputs like human labour, bullock labour, machine labour,

Cost
s and
Ret
urns
The Marketing Season 2018-19 93
manures, fertilisers, seeds, pesticides and irrigation charges as per data available from Labour Bureau, Ministry of Labour and Employment, State Governments and Office of Economic Adviser, Ministry of Commerce & Industry. Based on CIPI thus constructed, the Commission projects crop-wise, state-wise CoC A2, A2+FL and subsequently C2.
5.4 Crop-wise, state-wise CoP are then derived from these projected CoCs using projected yields. Subsequently, all-India estimates of CoPs are derived based on crop-wise, state-wise estimates. These projected estimates of CoPs are considered into formulation of price policy recommendations by the Commission.
5.5 The Commission undertakes cost projection exercise on the basis of latest three years’ cost estimates for each state under certain implicit assumptions. One, since projections for each crop in a state are made three years ahead, it is assumed that fixed cost components would not, in all likelihood, undergo any significant change in the intervening period. Two, since yield varies from year to year due to multiplicity of factors, projections of costs for last three years, latest being 2015-16, have been undertaken for each state to smoothen out fluctuations in yield and hence in CoP. However, in cases where there is wide fluctuation in yields, olympic average yield has been used.
Costs and Returns of Kharif Crops during TE2015-16
5.6 The Commission examines actual costs and returns of crops for which latest CS data is available from DES. It is pertinent to mention that gross value of output (GVO) is estimated at prevailing market prices during harvest season in village/cluster of villages where the crop is grown and harvested. With this stipulation, an analysis of rate of return over costs A2 and A2+FL for mandated crops during TE2015-16 is presented in Table 5.1.
5.7 To estimate profitability of a crop, gross returns over cost A2 (GVO less cost A2) and gross returns over A2+FL (GVO less cost A2+FL) are calculated. The average costs and average gross returns during 2013-14 to 2015-16 for various kharif crops are presented in Table 5.1 and Chart 5.1. It is evident from Table 5.1 that the average gross returns over average cost A2 and A2+FL are positive for all kharif crops. The average gross returns over A2 vary from 35 percent in sunflower to 191 percent in sesamum while average gross returns over A2+FL range from 2 percent in nigerseed to 95 percent in sesamum. The state-wise details of average returns are given in Annex Table 5.1.

Cost
s and
Ret
urns
The Marketing Season 2018-1994
Table 5.1: Average Gross Returns of Kharif Crops, TE2015-16
Crop
Cost A2 Cost A2+FL GVO Gross Returns over A2
Gross Returns over A2+FL
`/ha`/ha
(Col.4-Col.2)
Percent (Col.5/
Col.2*100)
`/ha (Col.4-Col.3)
Percent (Col.7/
Col.3* 100)
(1) (2) (3) (4) (5) (6) (7) (8)
A. Cereals
Paddy 30,247 40,716 59,144 28,897 96 18,428 45
Maize 24,854 34,490 44,543 19,689 79 10,053 29
Jowar 18,669 24,272 30,363 11,694 63 6,091 25
Bajra 14,858 24,039 30,130 15,273 103 6,091 25
Ragi 18,691 30,404 33,860 15,169 81 3,456 11
B. Pulses
Arhar (Tur) 23,946 32,573 63,081 39,135 163 30,508 94
Moong 12,630 18,248 25,131 12,500 99 6,882 38
Urad 12,627 17,633 33,717 21,090 167 16,084 91
C. Oilseeds
Groundnut 39,168 48,271 70,015 30,847 79 21,744 45
Soybean 21,798 26,193 30,259 8,461 39 4,066 16
Sunflower 19,339 24,510 26,182 6,843 35 1,672 7
Sesamum 12,122 18,095 35,266 23,144 191 17,170 95
Nigerseed 7,619 14,029 14,270 6,651 87 241 2
D. Commercial Crop
Cotton 43,014 53,704 73,616 30,602 71 19,912 37
Source: CACP using CS data.

Cost
s and
Ret
urns
The Marketing Season 2018-19 95
Chart 5.1: Average Gross Returns of Kharif Crops, TE2015-16
Source: CACP calculations.
Agricultural Wages and Input Price Movement
5.8 Table 5.2 presents average annual growth in wage rates of agricultural labour in major states and at all-India level at current prices and constant prices (2016-17=100) during TE2016-17. At all-India level, agricultural wage rate has increased by 12.8 percent in 2014-15, 3.8 percent in 2015-16 and 5.3 percent in 2016-17 at current prices; while it has increased by 6.9 percent in 2014-15, (-) 1.5 percent in 2015-16 and 1.7 percent in 2016-17 at constant prices. Further, Chart 5.2 reflects state-wise average annual wages of agricultural labour in 2016-17 and growth in average annual wages during 2016-17 over 2015-16. The wage rate is highest (`673 per day) in Kerala and lowest in Madhya Pradesh (`202 per day). Rajasthan witnessed a decline in average annual wage rate while Maharashtra recorded highest growth. State-wise and all-India details of monthly average wage rates for agricultural labour at current prices are given in Annex Table 5.2.
` pe
r Ha.
`
`
`
(`/ha) (`/ha)

Cost
s and
Ret
urns
The Marketing Season 2018-1996
Table 5.2: Average Annual Growth in Wages of Agricultural Labour - States and All-India
StateGrowth (percent) at Current Prices
Growth (percent) at Constant Prices(2016-17=100)
2014-15 2015-16 2016-17 2014-15 2015-16 2016-17Andhra Pradesh 7.3 6.5 7.9 0.7 -0.02 4.8Assam 22.2 4.8 7.1 14.6 2.9 6.2Bihar 16.2 9.7 1.5 11.8 8.5 1.3Gujarat 21.6 6.9 7.8 14.9 0.3 5.0Haryana 7.3 3.6 2.0 0.4 0.03 -2.5Himachal Pradesh 9.0 5.9 6.0 2.3 1.2 1.6Karnataka 9.1 12.6 6.0 2.7 4.0 -1.2Kerala 11.4 6.4 1.6 2.4 1.9 -4.3Madhya Pradesh 18.1 4.7 8.8 15.7 0.1 5.7Maharashtra 5.9 3.6 10.2 -1.1 -2.2 5.5Odisha 18.8 -0.1 7.9 11.0 3.0 7.5Punjab 3.7 1.7 3.4 -1.1 -2.1 -1.8Rajasthan 17.8 -3.8 -1.2 11.3 -8.5 -5.9Tamil Nadu 23.9 -4.0 4.4 14.7 -11.6 -1.6Uttar Pradesh 6.9 7.4 6.0 3.5 0.8 7.2West Bengal 9.1 4.2 4.7 5.5 3.4 2.3All-India 12.8 3.8 5.3 6.9 -1.5 1.7
Note: Average - July to June.Source: Labour Bureau, Ministry of Labour & Employment, Government of India
Chart 5.2: Average Annual Agricultural Wages and Growth, 2016-17
Note: Average-July to June.Source: Labour Bureau, Ministry of Labour & Employment, Government of India
6
8
10
12
14
300
400
500
600
700
Perc
ent)
Wag
es (`)
Ker TN HP Har Pun Kar Raj APAll-India
WB MH Asm Bih UP Guj Odi MP
Avg Annual Daily Wages 673 411 394 365 314 298 281 276 270 259 258 256 249 230 223 217 202
Growth in wages 2016-17 1.6 4.4 6.0 2.0 3.4 6.0 -1.2 7.9 5.3 4.7 10.2 7.1 1.5 6.0 7.8 7.9 8.8
-2
0
2
4
6
-100
0
100
200
300
Gro
wth
(P
Ave
rage
Ann
ual D
aily
W

Cost
s and
Ret
urns
The Marketing Season 2018-19 97
5.9 Chart 5.3 presents trends in prices of farm inputs (based on WPI 2011-12=100) during October to December 2017 over October to December 2016. The chart shows that prices of high speed diesel (HSD), electricity and agricultural tractors have increased in the range of 0.5 percent to 13.5 percent, while prices of fertilizers & nitrogen compounds, lube oils, cattle feed, fodder and pesticides and other agrochemical products have declined in the range of 0.7 percent to 12.4 percent (Annex Table 5.3).
Chart 5.3: Movements in Prices of Farm Inputs
Cost Projections for Kharif Marketing Season, 2018-19
5.10 Based on CIPI, state-wise CoCs are projected for each crop. However, in case of wide fluctuations in yield of a crop in a state during three years, olympic average yield was used to project CoC estimates. Based on this, state-wise CoPs are obtained by using respective three years average yield. Subsequently, all-India weighted average projected CoPs with weights being shares of states in all-India production during TE2016-17 has been worked out for kharif crops for the marketing season 2018-19 (Table 5.3). State-wise and all-India projected costs for mandated kharif crops for marketing season 2018-19 are given in Annex Table 5.4. The actual CoCs for different states for 2014-15 and 2015-16 are given in Annex Tables 5.5a to 5.5n.
Source: DIPP, Ministry of Commerce and Industries.

Cost
s and
Ret
urns
The Marketing Season 2018-1998
Table 5.3: Projected CoP of Mandated Crops, KMS 2018-19
CropsCost of Production (` per qtl)
A2 A2+FL C2
Paddy 865 1166 1560
Jowar 1241 1619 2183
Bajra 583 990 1324
Maize 806 1131 1480
Ragi 1446 1931 2370
Arhar (Tur) 2488 3432 4981
Moong 2958 4650 6161
Urad 2420 3438 4989
Groundnut 2615 3260 4186
Soybean 1879 2266 2972
Sunflower 3056 3592 4501
Sesamum 2682 4166 6053
Nigerseed 1744 3918 5135
Cotton 2700 3433 4514
Source: CACP Calculations.
5.11 The Commission computes all-India weighted average composite price index for years 2015-16 to 2018-19 with base 2011-12=100. For this, on the basis of state-wise CIPIs, an all-India crop-wise weighted average input price index for all inputs; with weights being relative shares of states in all-India area under the crop during TE2016-17 has been calculated. These indices are used to compute all-India weighted average composite input price index for kharif crops, with weights being relative shares of crops in total production at all-India level during TE2016-17. It may be observed from Table 5.4 that all-India kharif crops CIPI for all crops shows an increase of 4.1 percent in 2018-19 over 2017-18.

Cost
s and
Ret
urns
The Marketing Season 2018-19 99
Table 5.4: All-India Kharif Crops Input Price Index (Base 2011-12=100)
Inputs Weights (2015-16)
Kharif Crops Input Price Index Percentage Change in Input Price Index
2018-19 over 2017-18
2015-16 2016-17 2017-18 2018-19
Human Labour (HL) 0.53 157.26 165.12 172.46 179.45 4.1
Bullock Labour (BL) 0.06 179.88 186.13 192.53 199.03 3.4
Machine Labour (ML) 0.13 113.21 118.57 124.33 130.53 5.0
Seeds 0.08 145.80 154.79 164.89 176.19 6.9
Fertilizers 0.09 149.51 153.93 158.49 163.28 3.0
Manures 0.03 149.41 153.65 158.04 162.58 2.9
Insecticides 0.03 119.95 125.29 131.00 137.04 4.6
Irrigation Charges 0.05 105.94 107.60 109.34 111.14 1.7
Composite Input Price Index (CIPI) 147.44 154.15 160.76 167.38 4.1
Percentage Change (year on year) - 4.6 4.3 4.1 -
Source: CACP Calculations.
5.12 Charts 5.4 (a) to (m) show crop-wise supply curves for CoP (A2+FL) by states in ascending order with their corresponding relative shares in all-India production. Supply curves for different crops are graphical representation of CoP, which represent the quantum of production of kharif crops produced at different CoP in various states.
5.13 As per the supply curves presented in charts 5.4 (a) to (m), CoP (A2+FL) for paddy, is lowest at `702 per qtl in Punjab while highest at `2102 in Maharashtra. In case of jowar, CoP (A2+FL) at `1147 per qtl is lowest in Rajasthan while highest at `1936 per qtl in Karnataka. For bajra, CoP (A2+FL) at `811 per qtl is lowest in Uttar Pradesh while highest at `2119 per qtl in Maharashtra. Supply curve for maize shows CoP (A2+FL) at `803 per qtl is lowest in Andhra Pradesh while highest at `1819 per qtl in Gujarat. As regards tur, CoP (A2+FL) at `2704 per qtl is lowest in Madhya Pradesh while highest at ̀ 4552 per qtl in Andhra Pradesh whereas in case of moong and urad, CoP (A2+FL) of `3411 per qtl and `1860 per qtl is lowest in Andhra Pradesh while highest at `6688 per qtl and `5697 per qtl in Maharashtra. In case of groundnut, CoP (A2+FL) of `1554 per qtl is lowest in Rajasthan while highest at `4767 per qtl in Karnataka; whereas soybean shows that CoP (A2+FL) of `1984 per qtl is lowest in Madhya Pradesh while highest at ̀ 2777 per qtl in Maharashtra. The supply curve for

Cost
s and
Ret
urns
The Marketing Season 2018-19100
cotton reveals lowest CoP (A2+FL) `2656 per qtl in Rajasthan while highest at `4342 per qtl in Tamil Nadu.
5.14 All India weighted CoP A2+FL covers 56 percent of production in case of paddy, 33 percent in jowar, 79 percent in bajra, 65 percent in maize, 24 percent in ragi, 49 percent in arhar (tur), 82 percent in moong, 51 percent in urad, 27 percent in groundnut, 59 percent in soybean, 13 percent in sunflower, 53 percent in sesamum and 54 percent in cotton. Union Budget for 2018-19 has announced the pre-determined principle of offering to farmers a threshold MSP of atleast one and half times the cost of production of all mandated kharif crops. Accordingly, after recommending MSPs on the basis of atleast 1.5 times of CoP A2+FL (Chart 5.4), share of production covered at MSP is 100 percent in case of jowar, ragi, tur, moong, groundnut, soybean, sunflower, seasamum and cotton, 97 percent in paddy and maize, 94 percent in urad and 93 percent in bajra. It may be noted that recommended MSPs (Which is atleast 1.5 times the projected CoP A2+FL in all mandated crops) in case of paddy, bajra and urad do not cover projected CoP A2+FL of Maharastra.
Chart 5.4: Supply Curve and Projected CoP for KMS, 2018-19
`
`
`
`
`

Cost
s and
Ret
urns
The Marketing Season 2018-19 101
`
`
`
`
`
`
`
`
Cos
t of P
rodu
ction
(`/q
tl)

Cost
s and
Ret
urns
The Marketing Season 2018-19102
``
`
`
`
`
`
`
`

Cost
s and
Ret
urns
The Marketing Season 2018-19 103
``
`
`
`
`
`
`
`

Cost
s and
Ret
urns
The Marketing Season 2018-19104
`
`
`
`
`
`
`
`

Cost
s and
Ret
urns
The Marketing Season 2018-19 105
`
`
`
`
`
`
`
`
`

Cost
s and
Ret
urns
The Marketing Season 2018-19106
`
`
`
`
`
`
`
`
`
`
`
`
`
`
`

Cost
s and
Ret
urns
The Marketing Season 2018-19 107
Relative Returns
5.15 Relative returns being one of the factors for determining MSP of different competing crops is computed with reference to paddy. Table 5.5 outlines average relative returns measured in percentage terms over average CoCs A2+FL for mandated kharif crops during TE2015-16. It is observed that average relative gross returns over A2+FL for all kharif crops vary from 1 percent in nigerseed to 166 percent in tur.
Table 5.5: Crop-wise Average Relative Returns (Percent), TE2015-16
Crops Relative Gross Returns over A2+FL with respect to paddy
A. Cereals
Paddy 100 Maize 55 Jowar 33 Bajra 33 Ragi 19 B. PulsesArhar (Tur) 166Moong 37Urad 87C. OilseedsGroundnut 118Soybean 22Sunflower 9Sesamum 93Nigerseed 1C. Commercial CropCotton 108
Source: CACP Calculations.
Comparison of Projected Cost Estimates with State Estimates
5.16 The projected cost estimates of states and CACP for mandated kharif crops for marketing season 2018-19 are given in Annex Table 5.6. The estimated CoC for recommending MSP for KMS, 2018-19 is provided by Bihar for paddy, maize; Chhattisgarh for paddy, maize, arhar (tur), groundnut, soybean; Odisha for paddy;

Cost
s and
Ret
urns
The Marketing Season 2018-19108
Punjab for paddy, cotton; Rajasthan for bajra, maize, moong, urad, soybean, sesamum, cotton; and Tamil Nadu for moong. Reasons for variations in two sets of estimates, i.e., State Government’s projections and CACP’s projections are due to methodological differences. For Bihar, projections of state yield & CoP for paddy, and CoP for maize are higher than respective CACP projections. Bihar has included interest on land @ 5 percent, land development cost, 10 percent risk cost and storage & transportation cost; which is not a part of net cost in CS estimates. For Odisha, discrepancies between two sets of data in projected CoC of paddy are labour charges including human, bullock and machine labour and the expenditure on manure. Punjab has used the CoC data and then projected it for KMS, 2018-19. The projected CoP for paddy, and yield & CoP for cotton of Punjab State are higher than CACP projections. The main reasons for higher CoP projections of Punjab than CACP projections are that state government has included various other charges, viz., 25 percent farmers’ profit margin, 10 percent weather risk, 25 percent profit and marketing & management charges. For Tamil Nadu, yield and CoP for moong are higher than CACP projections. Tamil Nadu has included transportation cost and 10 percent managerial costs in its projections. However, state estimates are lower than Commission's estimates in respect of paddy and soybean for Chhattisgarh; and maize, moong, soybean, sesamum & cotton for Rajasthan. The state estimates and Commission's estimates in respect of bajra for Rajasthan are almost the same. Other states have not provided cost estimates for KMS, 2018-19.
Recapitulation
5.17 Given the time lag of three years in availability of data, the Commission projects the cost estimates A2, A2+FL and C2 per quintal for mandated kharif crops for the ensuing season 2018-19. The Commission uses CIPI to capture changes in input prices over the years and subsequently, CoP is projected using average/olympic average yield. The all-India projected CoP for KMS, 2018-19 and KMS, 2017-18, and percentage change in projected cost during KMS, 2018-19 over KMS, 2017-18 are at Annex Table 5.7. As Andhra Pradesh’s share in production of soybean is very low during TE2016-17, the Commission is of the view that soybean in Andhra Pradesh may not be included under the Comprehensive Scheme. Besides, the share of production of nigerseed in Chhattisgarh, Madhya Pradesh and Odisha in all-India production are about 20 percent, 39 percent and 41 percent respectively, whereas, out of all-India sample size of 15 under CS of nigerseed, the allocation of sampling units among Chhattisgarh, Madhya Pradesh and Odisha are 1 (6.7 percent of all-India sample), 4 (26.7 percent of all-India sample) and 10 (66.6 percent of

Cost
s and
Ret
urns
The Marketing Season 2018-19 109
all-India sample) respectively. The Commission recommends that all-India sample of nigerseed under CS should be allocated among Chhattisgarh, Madhya Pradesh and Odisha according to their production shares. The projected all-India A2+FL costs per quintal are `1166 for paddy, `1619 for jowar, `990 for bajra, `1131 for maize, `1931 for ragi, `3432 for tur, `4650 for moong, `3438 for urad, `3260 for groundnut, `2266 for soybean, `3592 for sunflower seed, `4166 for sesamum, `3918 for nigerseed and `3433 for cotton. These projected cost estimates have been considered into formulation of price policy recommendations, as the Union Budget for 2018-19 has announced the pre-determined principle of offering to farmers a threshold MSP of atleast one and half times the cost of production of all Kharif mandated crops.
*****

The Marketing Season 2018-19110
Chap
ter 6
Chapter 6
Considerations and Recommendations for Price Policy
Non-Price Policy RecommendationsPromotion of Pulses Production
6.1 Prices and assured marketing for pulses will go a long way in ensuring better productivity and production. To ensure that farmers get remunerative prices and there is no distress sale particularly during harvesting season, strategic intervention by Government is necessary. Firstly, there is a need for effective procurement of pulses during harvest period to ensure remunerative prices for the produce and secondly, to promote appropriate post-harvest processing and value addition in pulses at village level. Also, trade policy and prices of pulses should be monitored on continuous basis.
Promotion of Oilseeds Sector
6.2 India imports about two-thirds of its edible oil demand and there is an urgent need to devise a policy to increase oilseed productivity as the option of area expansion is very limited. Productivity of oilseeds in India is half that of world average and there is an urgent need to address this issue collectively by Government and private sector. To increase productivity and reduce dependence on imported edible oils, special focus should be given in distribution of quality seeds to farmers before the sowing season. In this regard, National Mission on Oil Seeds and Oil Palm (NMOOP) should play a pivotal role in increasing the productivity and production of oilseeds. It should closely work with organisations like Soybean Processors Association of India (SOPA) for quality research & development in soybean sector for distribution of quality seeds and making India competitive in global market.

Cons
ider
ation
s and
Rec
omm
enda
tions
for P
rice
Polic
y
The Marketing Season 2018-19 111
6.3 Also, oil industry should push for better returns to farmers by organising farmers in FPOs and procuring from FPOs. A provision has been made in Union Budget 2018-19 for exemption of FPOs from income tax which will go a long way for increasing the oilseed productivity and enhancing the income of farmers.
Maize: Area Expansion and Diversified Products
6.4 Water requirement of maize is much lower than that of other competing cereals like rice and wheat and having wider industrial uses. Thus, expansion of area under maize will have a significant impact on sustainability in agriculture. As per Indian Institute of Maize Research (IIMR), Zero Tillage (ZT) and Permanent Bed (PB) practices reduced the irrigation water requirement by 40–65 ha-mm and 60–98 ha-mm, respectively. Thus, the study suggests that ZT/PB based crop management could be adopted for enhanced soil health and overall sustainability.
6.5 Recently, wholesale prices of maize decreased continuously during the peak market arrival period and ruled below MSP (September 2017 to February 2018) mainly due to increase in production in 2017-18. Hence, there is a need to create demand for maize diversified products in food processing industries. IIMR along with maize based industries should estimate the required consumption demand so that production can be efficiently utilized, thus helping farmers in getting remunerative prices for their produce.
Quality Cotton Seeds
6.6 Cotton farmers face huge risks since the cotton seed market is not regulated and poses higher risks to the farmers’ produce in terms of quantity and quality. Therefore, to increase the yield and compete in global market, there is an urgent need to regulate the cotton seed market in light of growing cotton industry and to safeguard our farmers.
Procurement of Rice
6.7 Rice procurement has become more diversified and share of decentralised procurement (DCP) states has increased over the years. However, there are still some major rice producing states, where procurement operations are either absent or very limited e.g. Assam. In the absence of effective procurement by the Government, prices remained below MSP. Hence, strong procurement operations need to be expanded to neglected regions, particularly eastern and north eastern regions.

Cons
ider
ation
s and
Rec
omm
enda
tions
for P
rice
Polic
y
The Marketing Season 2018-19112
6.8 The Commission had sought data on procurement of paddy from states, disaggregated categories of farmers (i.e. marginal, small, semi-medium, medium and large farmers). Government of Odisha has provided information on break up of paddy procurement by different category of farmers for kharif 2016-17. It was observed that more than 80 percent of total procurement of paddy in 2016-17 was made from large, medium and semi-medium farmers which show that benefits of MSP are not reaching small and marginal farmers. The Commission is of the considered view that data on category-wise (small, marginal, semi-medium, medium and large) farmers needs to be monitored for analysing the inclusiveness of procurement procedure as regards small and marginal farmers. All state governments should make efforts towards computerising their procurement processes so as to maintain an exhaustive database on procurement.
Soil Health Management
6.9 In order to guide farmers on judicious and economic use of fertilizer nutrients, Government has implemented SHC Scheme in 2015. However, the Scheme lacks implementation in north-eastern region completely. Also, there is a wide gap in the number of samples collected vis-a-vis number of samples tested in some states. Therefore, more number of soil testing labs (STLs) needs to be opened to bridge this gap. Also, special efforts are needed to bring north-eastern region under the coverage of the Scheme.
Input Subsidy to Farmers
6.10 The Commission is of the opinion that instead of providing input subsidies to the companies, they may be given directly to farmers under DBT. It is known that farmers often take loans from money lenders to buy inputs for cultivation which leads to their exploitation in the hands of money lenders. For successful implementation of this Scheme, proper computerisation of land records is essential, post which estimated input subsidy amount may be transferred directly to farmer’s bank account. Farmers can then use this subsidy to buy inputs as per their requirements. To extend the benefits to tenant farmers who do not have land records in their name, a loan eligibility card/ certificate of cultivation be provided.
Agricultural Land Leasing Policy
6.11 Legalization of land leasing will result in availability of more land which the rural poor can lease in. Improved access to land on lease by the landless and marginal farmers will help improve their economic condition. NITI Aayog has prepared a model land leasing law, which has been adopted by the Government of Madhya Pradesh and

Cons
ider
ation
s and
Rec
omm
enda
tions
for P
rice
Polic
y
The Marketing Season 2018-19 113
Uttar Pradesh so far. According to NITI Aayog (2017) there is a need to ensure that by end March 2020, at least two thirds of the states would have liberal land-leasing laws that will protect the rights of both the owner and the tenant and allow them to conclude written, mutually agreeable lease agreements. The Commission is of the view that this needs to be monitored for early completion.
Investment in Agricultural Sector
6.12 Capital formation in agriculture is crucial for the development of agriculture and should be sustained in the long run considering the fact that labour shortage is a huge problem in agricultural activities. The private sector can play a significant role in enhancing investment in agriculture sector. In a few cases where corporates are taking innovation to farmers with inputs, wonderful results have been achieved. It is, therefore, of paramount importance to work towards bringing more investment in agriculture sector.
Price Deficiency Payment Scheme
6.13 Government of Madhya Pradesh introduced the Scheme called Bhawantar Bhugtan Yojna (BBY). Under the Scheme, direct payment of the difference between MSP and average sale price (ASP) to farmers selling his produce in the APMC yard for notified crops is done directly in their bank accounts. It has been observed by the Commission that under BBY, the cost incurred by the Government of Madhya Pradesh is significantly lower compared to the present system of procurement of crops under MSP and therefore, Commission is of the view that the Government should explore the possibility of implementing the Scheme on pan India basis.
Awareness about MSP and FAQ
6.14 Awareness about MSP and FAQ norms need to be created, as often farmer’s produce is rejected on the basis of quality norms. There is a need to give wide publicity about MSP and procurement agencies by the state governments in regional/vernacular electronic and print media, announcements in villages regarding MSPs and FAQ parameters of important commodities at least 15 days before the procurement starts so as to reach out to farmers in far off areas. Commission is, therefore, of the view that there is a need to empower gram panchayats with sufficient financial powers to educate farmers about the same.
6.15 It has also been observed that often farmers of remote areas do not have sufficient access to APMC and their potential market is local haats and their produce is sold below MSP. Therefore, it will be beneficial for those farmers if procurement centres

Cons
ider
ation
s and
Rec
omm
enda
tions
for P
rice
Polic
y
The Marketing Season 2018-19114
be opened up in remote areas at gram panchayat level. In addition, farmers need to be trained on FAQ norms and post-harvest handling of commodities so as to minimize post-harvest losses and better prices to farmers. Furthermore, to instil confidence among farmers for procurement of their produce, a legislation conferring on farmers ‘The Right to Sell at MSP’ may be brought out.
Reduction of Yield Gap
6.16 Since productivity improvement is the main driver of growth of agricultural output as area under cultivation is facing competition from other sectors due to ever increasing demands, a steep deceleration in growth rates of yields in most crops is a matter of great concern for policymakers. The yield gap analysis reveals that there are wide gaps between potential yield and actual yield in both pulses and oilseeds. Therefore, production can be increased significantly even with the existing technologies, if timely availability of seeds and other inputs is assured and farmers are trained to follow the best practices.
Crop Residue Management
6.17 Central Sector Scheme, to address air pollution and to subsidize machinery required for in-situ management of crop residue, has been announced in the states of Punjab, Haryana, Uttar Pradesh and NCT of Delhi for the period 2018-19 to 2019-20 with a total outlay of `1151.80 crore. Under the Scheme, Farm Machinery Banks would be established for custom hiring of in-situ crop residue management machinery. Farmers would also be provided financial assistance of 50 percent for procurement of agriculture machinery and equipment for in-situ crop residue management. The Commission feels that along with the financial support extended to farmers for custom hiring of machineries, farmers, small and marginal in particular, may also be provided appropriate cash incentives for transporting crop residues to biomass production units which can possibly open up a new market for rural entrepreneurship. Also, cost of harvesting of stubble should be included in cost of cultivation for paddy.
Promoting Agro-Industries for Processing and Value Addition
6.18 Government of India is promoting SAMPADA with the objective of supplementing agriculture, modernizing processing and reducing agri-waste. The Commission was apprised that for setting up any agro-processing unit on farm in Haryana, there is a requirement of seeking Change of Land Use (CLU) certificate, which is not approved in areas close to Delhi. Farmer can setup the processing unit only in industrial area, which defeats the very purpose of linking the processing unit with

Cons
ider
ation
s and
Rec
omm
enda
tions
for P
rice
Polic
y
The Marketing Season 2018-19 115
the farm gate and saving on transportation and time. To address this issue, small and marginal farmers may be allowed to establish units for processing and value addition on his farm without any CLU. In addition, to promote agro- industry, the rate of interest on small agro-industries should be lower than large agro-industries. The possibility of considering agricultural land as security for grant of loans should be explored by the banks.
Pradhan Mantri Fasal Bima Yojna (PMFBY)
6.19 Farmers often do not get receipts of the premium deducted towards the crop insurance and copy of policy documents. This results in farmers not getting due benefit of the Scheme in case of any unforeseen incidents. Also, farmers are provided loans based on the crop value due to which some farmers, contrary to the actual crop grown by them, tend to declare high value crops for availing higher loans. As a result, farmers find it difficult to claim insurance and repay their loans in case of crop failure since crop in bank records differs from the actual crop. The Commission is of the considered opinion that loan should be provided to farmers on land value and not on crop value to prevent them from falling into debt trap. Apart from this, issue of crop losses due to wild animals also needs to be addressed.
Fertilizer Use and Irrigation Management
6.20 Fertilizer consumption has reduced in 2016-17. This is led by a reduction in consumption of Nitrogen (N) based fertilisers which has resulted in a slight improvement in N, P, K ratio, which is an encouraging sign. Also, significant expansion in micro irrigation has been achieved since the launch of PMKSY in 2015. But, to overcome the challenges posed by a possible water crisis in future, it is essential to continue the efforts made under PMKSY along with adopting traditional methods for water harvesting.
Local Level Storage
6.21 Small and marginal farmers owing to small land sizes do not have large outputs and as a result have minimal surplus. Moreover, they are compelled to sell their produce immediately after harvest owing to lack of storage facilities combined with immediate fund requirement. This leads to distress sale by small and marginal farmers. In this regard, a major push is required to build local storage system at gram panchayat level on cost sharing basis between farmers and state governments. Farmers can then deposit their produce in a local godown and obtain a receipt and can avail loan to an extent of 75 percent of the value of the crop deposited in the local godown against the receipt. This will allow farmers to take care of their immediate need of fund and also to sell their produce at a later

Cons
ider
ation
s and
Rec
omm
enda
tions
for P
rice
Polic
y
The Marketing Season 2018-19116
date when the market recovers. This system will help in empowering small and marginal farmers in particular with the support of rural banks, cooperative banks and Primary Agricultural Co-operative Societies (PACS).
Cluster-Based Model of Development
6.22 Since, majority of the farmers in the country are small and marginal, the cluster-based model of development should be implemented in agricultural sector and farmers should be motivated to form Farmer Producer Organisations (FPOs) and Village Producers Organisations (VPOs) for their own betterment. To facilitate this, FPOs have been exempted from payment of income tax in Union Budget 2018-19. This will also help in better marketing of produce and enhanced incomes to farmers.
North-Eastern States – Issues and Concerns
6.23 North-Eastern states have high humidity in atmosphere which results in higher moisture content in paddy than the FAQ norms prescribed by FCI thus leading to lower procurement. In this regard, state governments should create facilities at gram panchayat level for drying farmer’s produce so that it meets FAQ norms. In addition, state governments may also coordinate with the Ministry of Consumer Affairs, Food and Public Distribution for relaxation of FAQ norms for the region. Apart from this, local procurement may be strengthened so as to minimise imports from other states and save on transportation costs.
Price Policy Recommendations
6.24 FCI apprised CACP that only 12 percent to 13 percent of paddy procured is of common variety and the rest is Grade A. In case of tur and urad, MSP in 2017-18 inclusive of bonus is 64 percent and 65 percent more than A2+FL. All India weighted CoP A2+FL covers 56 percent of production in case of paddy 33 percent in jowar, 79 percent in bajra, 65 percent in maize, 24 percent in ragi, 49 percent in arhar (tur), 82 percent in moong, 51 percent in urad, 27 percent in groundnut, 59 percent in soybean, 13 percent in sunflower, 53 percent in sesamum and 54 percent in cotton. Union Budget for 2018-19 has announced the pre-determined principle of offering to farmers a threshold MSP of at least one and half times the cost of production of all mandated kharif crops. Accordingly, after recommending MSPs at least 1.5 times of CoP A2+FL (Table 6.1), share of production covered at MSP is 100 percent in case of jowar, ragi, tur, moong, groundnut, soybean, sunflower, seasamum and cotton, 97 percent in paddy and maize, 94 percent in urad and 93 percent in bajra.

Cons
ider
ation
s and
Rec
omm
enda
tions
for P
rice
Polic
y
The Marketing Season 2018-19 117
Table 6.1: MSPs Recommended for KMS, 2018-19(`/qtl)
Crops Projected Costs for KMS, 2018-19
MSP, KMS
2017-18
Recommended MSP (atleast 1.5 times A2+FL) for
KMS 2018-19
MSP as percent of
A2+FL
A2 A2+FL
Paddy Common 865 1166 1550 1745 (12.58) 150
Paddy Grade A - - 1590 1770 (11.32) 152
Jowar- Hybrid 1241 1619 1700 2430 (42.94) 150
Jowar- Maldandi - - 1725 2450 (42.03) 151
Bajra 583 990 1425 1950 (36.84) 197
Ragi 1446 1931 1900 2895 (52.37) 150
Maize 806 1131 1425 1700 (19.30) 150
Tur 2488 3432 5450* 5675 (4.13) 165
Moong 2958 4650 5575* 6975 (25.11) 150
Urad 2420 3438 5400* 5600 (3.70) 163
Groundnut 2615 3260 4450* 4890 (9.89) 150
Sunflower Seed 3056 3592 4100@ 5385 (31.34) 150
Soyabean (Yellow) 1879 2266 3050* 3390 (11.15) 150
Sesamum 2682 4166 5300@ 6230 (17.55) 150
Nigerseed 1744 3918 4050@ 5860 (44.69) 150
Cotton (Medium Staple) 2700 3433 4020 5150 (28.11) 150
Cotton (Long Staple) - - 4320 5450 (26.16) 159
Note: Figures in parenthesis represent increase in MSP over the previous year.* Including bonus of `200 per quintal@Including bonus of `100 per quintal
6.25 However, considering other factors like demand-supply situation, market prices, inter-crop price parity, etc. the Commission is of the view that recommended MSPs for many crops particularly water-intensive crop like paddy are higher. The main challenge would be to ensure that farmers receive at least the announced

Cons
ider
ation
s and
Rec
omm
enda
tions
for P
rice
Polic
y
The Marketing Season 2018-19118
MSP and India is able to retain its competitiveness in world markets. Therefore, efforts are needed to create effective procurement system or alternative models like Bhavantar Bhugtan Yojana (BBY) in Madhya Pradesh and proposed Market Assurance Scheme. The role and participation of state governments and private sector is extremely important to make these interventions effective as well as ensure remunerative prices to farmers.
(Vijay Paul Sharma)Chairman
(Shailja Sharma)Member Secretary
31st March, 2018

The Marketing Season 2018-19 119
Annex Tables

The Marketing Season 2018-19120
SI. No. Crops 2010-11 2011-12 2012-13 2013-14 2014-15 2015-16 2016-17 2017-18
1 Rice
Kharif 38.05 40.14 38.91 39.45 39.83 39.66 39.85 38.81
Rabi 4.81 3.87 3.84 4.69 4.28 3.84 4.15 4.14
Total 42.86 44.01 42.75 44.14 44.11 43.50 43.99 42.95
2 Wheat Rabi 29.07 29.86 30.00 30.47 31.47 30.42 30.79 30.05
3 Barley Rabi 0.71 0.64 0.70 0.67 0.71 0.59 0.66 0.74
4 Jowar
Kharif 3.07 2.62 2.43 2.28 2.27 2.14 2.06 1.89
Rabi 4.31 3.63 3.79 3.52 3.89 3.94 3.57 2.98
Total 7.38 6.25 6.21 5.79 6.16 6.08 5.62 4.87
5 Bajra Kharif 9.61 8.78 7.30 7.81 7.32 7.13 7.46 7.14
6 Maize
Kharif 7.28 7.38 7.21 7.31 7.56 7.18 7.84 7.67
Rabi 1.27 1.40 1.46 1.76 1.62 1.63 1.79 1.63
Total 8.55 8.78 8.67 9.07 9.19 8.81 9.63 9.30
7 Ragi Kharif 1.29 1.18 1.13 1.19 1.21 1.14 1.02 1.20
Coarse Cereals
Kharif 22.05 20.75 18.82 19.27 18.95 18.23 18.99 18.43
Rabi 6.29 5.67 5.94 5.95 6.22 6.15 6.01 5.35
Total 28.34 26.42 24.76 25.22 25.17 24.39 25.01 23.78
Cereals
Kharif 60.10 60.89 57.73 58.72 58.78 57.89 58.84 57.24
Rabi 40.17 39.40 39.78 41.11 41.97 40.42 40.95 39.54
Total 100.27 100.29 97.52 99.83 100.75 98.31 99.79 96.78
8 Tur (Arhar) Kharif 4.37 4.01 3.89 3.90 3.85 3.96 5.34 4.43
9 Moong
Kharif 2.85 2.61 1.97 2.34 2.03 2.76 3.37 3.24
Rabi 0.76 0.78 0.74 1.04 0.99 1.07 0.96 0.58
Total 3.51 3.39 2.72 3.38 3.02 3.83 4.33 3.82
10 Urad
Kharif 2.51 2.36 2.44 2.35 2.49 2.72 3.48 4.18
Rabi 0.74 0.86 0.69 0.72 0.76 0.90 1.00 0.85
Total 3.25 3.22 3.13 3.06 3.25 3.62 4.48 5.03
11 Gram Rabi 9.19 8.30 8.52 9.93 8.25 8.40 9.63 10.43
12 Lentil (Masur) Rabi 1.60 1.56 1.42 1.34 -
Annex Table 1.1 : All India Estimates of Area of Agricultural Commodities(Million hectares)
(Contd.)

The Marketing Season 2018-19 121
SI. No. Crops 2010-11 2011-12 2012-13 2013-14 2014-15 2015-16 2016-17 2017-18
Pulses
Kharif 12.32 11.19 9.95 10.33 9.99 11.31 14.36 13.73
Rabi 14.08 13.27 13.30 14.88 13.56 13.60 15.08 15.10
Total 26.40 24.46 23.26 25.21 23.55 24.91 29.45 28.83
Foodgrains
Kharif 72.42 72.08 67.69 69.05 68.77 69.21 73.20 70.97
Rabi 54.25 52.67 53.09 55.99 55.53 54.01 56.03 54.64
Total 126.67 124.75 120.78 125.04 124.30 123.22 129.23 125.61
13 Groundnut
Kharif 4.98 4.32 3.93 4.65 4.01 3.84 4.58 4.07
Rabi 0.88 0.95 0.79 0.86 0.76 0.76 0.76 0.84
Total 5.86 5.26 4.72 5.51 4.77 4.60 5.34 4.91
14 Soybean Kharif 9.60 10.11 10.84 11.72 10.91 11.60 11.18 10.45
15 Sunflower
Kharif 0.32 0.26 0.30 0.25 0.22 0.16 0.17 0.13
Rabi 0.61 0.47 0.53 0.42 0.37 0.33 0.21 0.21
Total 0.93 0.73 0.83 0.67 0.59 0.49 0.38 0.33
16 Sesamum Kharif 2.08 1.90 1.71 1.68 1.75 1.95 1.67 1.54
17 Nigerseed Kharif 0.37 0.36 0.31 0.30 0.23 0.25 0.26 0.22
18 Rapeseed/ Mustard Rabi 6.90 5.89 6.36 6.65 5.80 5.75 6.07 5.85
19 Safflower Rabi 0.24 0.25 0.18 0.18 0.17 0.13 0.17 0.13
Nine Oilseeds
Kharif 18.23 18.42 18.32 19.65 18.21 18.86 18.67 17.23
Rabi 9.00 7.89 8.16 8.40 7.39 7.22 7.51 7.30
Total 27.22 26.31 26.48 28.05 25.60 26.09 26.18 24.54
20 Cotton 11.24 12.18 11.98 11.96 12.82 12.29 10.83 12.43
Jute 0.77 0.81 0.78 0.76 0.75 0.73 0.71 0.71
Mesta 0.10 0.10 0.09 0.08 0.06 0.05 0.06 0.05
21 Jute & Mesta 0.87 0.90 0.86 0.84 0.81 0.78 0.76 0.76
22 Sugarcane 4.88 5.04 5.00 4.99 5.07 4.93 4.44 4.81
Source : DES, DAC&FW
Annex Table 1.1 : All India Estimates of Area of Agricultural Commodities(Million hectares)

The Marketing Season 2018-19122
S. No. Crops 2010-11 2011-12 2012-13 2013-14 2014-15 2015-16 2016-17 2017-18
1 Rice
Kharif 80.65 92.78 92.37 91.50 91.39 91.41 96.30 96.48
Rabi 15.33 12.52 12.87 15.15 14.09 13.00 13.40 14.53
Total 95.98 105.30 105.24 106.65 105.48 104.41 109.70 111.01
2 Wheat Rabi 86.87 94.88 93.51 95.85 86.53 92.29 98.51 97.11
3 Barley Rabi 1.66 1.62 1.75 1.83 1.61 1.44 1.75 1.99
4 Jowar
Kharif 3.44 3.29 2.84 2.39 2.30 1.82 1.96 2.01
Rabi 3.56 2.69 2.44 3.15 3.15 2.42 2.60 2.65
Total 7.00 5.98 5.28 5.54 5.45 4.24 4.57 4.66
5 Bajra Kharif 10.37 10.28 8.74 9.25 9.18 8.07 9.73 9.26
6 Maize
Kharif 16.64 16.49 16.20 17.14 17.01 16.05 18.92 19.51
Rabi 5.09 5.27 6.05 7.11 7.16 6.51 6.98 7.63
Total 21.73 21.76 22.26 24.26 24.17 22.57 25.90 27.14
7 Ragi Kharif 2.19 1.93 1.57 1.98 2.06 1.82 1.39 1.96
Coarse Cereals
Kharif 33.08 32.44 29.80 31.20 30.94 28.15 32.44 33.15
Rabi 10.32 9.58 10.25 12.09 11.92 10.37 11.33 12.27
Total 43.40 42.01 40.04 43.29 42.86 38.52 43.77 45.42
Cereals
Kharif 113.77 125.22 122.16 122.70 122.34 119.56 128.74 129.63
Rabi 112.48 116.98 116.63 123.09 112.53 115.66 123.24 123.91
Total 226.24 242.20 238.78 245.79 234.87 235.22 251.98 253.54
8 Tur (Arhar) Kharif 2.86 2.65 3.02 3.17 2.81 2.56 4.87 4.02
9 Moong
Kharif 1.53 1.24 0.79 0.96 0.87 1.00 1.64 1.42
Rabi 0.27 0.40 0.40 0.65 0.64 0.59 0.52 0.32
Total 1.80 1.63 1.19 1.61 1.50 1.59 2.17 1.74
10 Urad
Kharif 1.40 1.23 1.43 1.15 1.28 1.25 2.18 2.60
Rabi 0.36 0.53 0.47 0.55 0.68 0.70 0.66 0.63
Total 1.76 1.77 1.90 1.70 1.96 1.95 2.83 3.23
11 Gram Rabi 8.22 7.70 8.83 9.53 7.33 7.06 9.38 11.10
12 Lentil (Masur) Rabi 0.94 1.06 1.13 1.02 - - -
Annex Table 1.2 : All India Estimates of Production of Agricultural Commodities(Million tonnes)
(Contd.)

The Marketing Season 2018-19 123
S. No. Crops 2010-11 2011-12 2012-13 2013-14 2014-15 2015-16 2016-17 2017-18
Pulses
Kharif 7.12 6.06 5.92 5.99 5.73 5.53 9.58 8.83
Rabi 11.12 11.03 12.43 13.25 11.42 10.82 13.55 15.11
Total 18.24 17.09 18.34 19.25 17.15 16.35 23.13 23.95
Foodgrains
Kharif 120.85 131.27 128.07 128.69 128.06 125.09 138.33 138.46
Rabi 123.64 128.01 129.06 136.35 123.96 126.47 136.78 139.02
Total 244.49 259.29 257.13 265.04 252.02 251.57 275.11 277.49
13 Groundnut
Kharif 6.64 5.13 3.19 8.06 5.93 5.37 6.05 6.62
Rabi 1.62 1.84 1.51 1.66 1.47 1.37 1.41 1.60
Total 8.26 6.96 4.69 9.71 7.40 6.73 7.46 8.22
14 Soybean Kharif 12.74 12.21 14.67 11.86 10.37 8.57 13.16 11.39
15 Sunflower
Kharif 0.19 0.15 0.19 0.15 0.11 0.07 0.10 0.07
Rabi 0.46 0.37 0.36 0.35 0.32 0.23 0.15 0.16
Total 0.65 0.52 0.54 0.50 0.43 0.30 0.25 0.23
16 Sesamum Kharif 0.89 0.81 0.69 0.71 0.83 0.85 0.75 0.72
17 Nigerseed Kharif 0.11 0.10 0.10 0.10 0.08 0.07 0.09 0.07
18 Rapeseed/ Mustard Rabi 8.18 6.60 8.03 7.88 6.28 6.80 7.92 7.54
19 Safflower Rabi 0.15 0.15 0.11 0.11 0.09 0.05 0.09 0.04
Nine Oilseeds
Kharif 21.92 20.69 20.79 22.61 19.19 16.68 21.51 20.36
Rabi 10.56 9.11 10.15 10.14 8.32 8.57 9.76 9.52
Total 32.48 29.80 30.94 32.75 27.51 25.25 31.28 29.88
20Cotton$ 33.90 35.50 37.00 39.80 38.00 30.01 32.58 33.92
Cotton$$ 33.00 35.20 34.22 35.90 34.81
Jute# 10.01 10.74 10.34 11.08 10.62 9.94 10.43 9.98
Mesta# 0.61 0.66 0.59 0.61 0.51 0.58 0.53 0.53
21 Jute & Mesta# 10.62 11.40 10.93 11.69 11.13 10.52 10.96 10.51
22 Sugarcane 342.38 361.04 341.20 352.14 362.33 348.45 306.07 353.23
Note: $ : CAB estimates of million bales of 170 kgs each$$ : E&S estimates of Million bales of 170 kgs each # : Million bales of 180 kgs each Source : DES, DAC&FW, Cotton Advisory Board.
Annex Table 1.2 : All India Estimates of Production of Agricultural Commodities(Million tonnes)

The Marketing Season 2018-19124
S. No. Crops 2010-11 2011-12 2012-13 2013-14 2014-15 2015-16 2016-17 2017-18
1 Rice
Kharif 2120 2311 2374 2319 2295 2305 2417 2486
Rabi 3185 3238 3353 3232 3291 3382 3230 3513
Total 2239 2393 2462 2416 2391 2400 2494 2585
2 Wheat Rabi 2989 3177 3117 3145 2750 3034 3200 3232
3 Barley Rabi 2357 2516 2521 2718 2280 2439 2663 2695
4 Jowar
Kharif 1119 1257 1171 1050 1014 849 954 1062
Rabi 827 741 644 896 808 615 730 890
Total 949 957 850 957 884 697 812 956
5 Bajra Kharif 1079 1171 1198 1184 1255 1132 1305 1297
6 Maize
Kharif 2285 2234 2246 2346 2249 2236 2413 2543
Rabi 4003 3765 4152 4050 4414 4006 3896 4674
Total 2540 2478 2566 2676 2632 2563 2689 2917
7 Ragi Kharif 1705 1641 1396 1661 1706 1601 1363 1630
Coarse Cereals
Kharif 1500 1563 1583 1619 1633 1544 1708 1799
Rabi 1641 1689 1725 2034 1915 1686 1885 2293
Total 1531 1590 1617 1717 1703 1579 1750 1910
Cereals
Kharif 1893 2056 2116 2089 2081 2065 2188 2265
Rabi 2800 2969 2931 2995 2681 2862 3010 3134
Total 2256 2415 2449 2462 2331 2393 2525 2620
8 Tur (Arhar) Kharif 655 662 776 813 729 646 913 909
9 Moong
Kharif 538 475 398 410 428 363 488 438
Rabi 354 508 539 620 640 554 546 551
Total 514 483 436 475 498 416 500 455
10 Urad
Kharif 557 523 586 490 516 459 626 622
Rabi 489 621 679 768 891 773 656 742
Total 542 549 606 555 604 537 632 643
11 Gram Rabi 895 928 1036 960 889 840 974 1064
12 Lentil (Masur) Rabi 591 678 797 758 -
Pulses
Kharif 578 541 594 580 573 489 667 644
Rabi 790 831 934 891 842 796 898 1001
Total 691 699 789 763 728 656 786 831
Annex Table 1.3 : All India Estimates of Yield of Agricultural Commodities(Kgs per hectare)
(Contd.)

The Marketing Season 2018-19 125
S. No. Crops 2010-11 2011-12 2012-13 2013-14 2014-15 2015-16 2016-17 2017-18
Foodgrains
Kharif 1669 1821 1892 1864 1862 1808 1890 1951
Rabi 2279 2430 2431 2435 2232 2342 2441 2544
Total 1930 2078 2129 2120 2028 2042 2129 2209
13 Groundnut
Kharif 1335 1188 811 1735 1478 1399 1321 1626
Rabi 1846 1938 1908 1926 1948 1801 1861 1909
Total 1411 1323 994 1764 1552 1465 1398 1674
14 Soybean Kharif 1327 1208 1353 1012 951 738 1177 1090
15 Sunflower
Kharif 608 566 622 621 512 420 567 543
Rabi 748 783 674 826 866 698 737 778
Total 701 706 655 750 736 608 660 688
16 Sesamum Kharif 429 426 402 426 474 436 448 463
17 Nigerseed Kharif 290 269 325 328 328 295 332 327
18 Rapeseed/ Mustard Rabi 1185 1121 1262 1185 1083 1183 1304 1288
19 Safflower Rabi 617 580 591 638 515 416 567 543
Nine Oilseeds
Kharif 1203 1123 1135 1151 1054 884 1153 1181
Rabi 1174 1155 1244 1207 1126 1186 1300 1303
Total 1193 1133 1168 1168 1075 968 1195 1218
20Cotton $ 513 496 525 566 504 415 512 464
Cotton$$ 499 491 486 510 462
Jute 2329 2389 2396 2639 2549 2457 2660 2543
Mesta 1115 1248 1237 1338 1525 1945 1664 1866
21 Jute & Mesta 2192 2268 2281 2512 2473 2421 2585 2498
22 Sugarcane 70091 71667 68254 70520 71512 70720 69001 73394Note: $ : CAB estimates$$ : E&S estimates Source : DES, DAC&FW, Cotton Advisory Board.
Annex Table 1.3 : All India Estimates of Yield of Agricultural Commodities(Kgs per hectare)

The Marketing Season 2018-19126
Anne
x Tab
le 1
.4 :
Shar
e of
Kha
rif C
rops
(und
er M
SP) i
n To
tal P
rodu
ction
, TE
2017
-18
(Per
cent
)
S.
No.
Crop
sAP
TGAP
+TG
ASM
Bih
CGGu
jHa
rHP
JKJh
arKa
rKe
rM
PM
HOd
iPu
nRa
jTN
UPUK
WB
Othe
rsTo
tal
1Ri
ce7.
13.
910
.94.
66.
96.
41.
73.
90.
10.
63.
22.
50.
43.
62.
66.
711
.00.
45.
012
.20.
614
.32.
210
0
2Jo
war
6.1
1.7
7.8
0.0
0.0
0.1
2.8
0.7
0.0
0.0
0.0
21.4
0.0
9.8
38.0
0.1
0.0
7.3
8.4
3.5
0.0
0.0
0.1
100
3Ba
jra0.
80.
10.
90.
00.
00.
07.
39.
10.
00.
10.
02.
40.
07.
66.
40.
00.
045
.11.
519
.60.
00.
00.
110
0
4M
aize
6.9
9.0
15.8
0.4
10.8
1.1
2.7
0.1
2.9
2.1
2.0
13.0
0.0
12.3
11.5
0.6
1.7
5.4
7.3
5.6
0.2
2.9
1.7
100
5Ra
gi2.
00.
12.
10.
00.
40.
11.
00.
00.
10.
10.
964
.40.
00.
05.
81.
80.
00.
013
.60.
08.
70.
70.
210
0
6Tu
r3.
54.
58.
60.
10.
91.
18.
50.
20.
00.
05.
516
.40.
019
.326
.53.
20.
10.
31.
37.
40.
10.
10.
310
0
7Ur
ad11
.80.
912
.81.
30.
41.
12.
70.
00.
10.
03.
91.
20.
029
.24.
71.
10.
08.
39.
110
.10.
41.
911
.710
0
8M
oong
5.4
3.5
9.2
0.4
4.1
0.4
3.9
0.9
0.0
0.0
1.2
4.4
0.0
10.3
9.0
5.6
1.0
39.7
5.2
2.8
0.0
1.5
0.2
100
9Gr
ound
nut
10.8
3.8
14.6
0.0
0.0
0.5
39.7
0.1
0.0
0.0
0.4
5.5
0.0
4.6
5.0
0.7
0.0
14.8
10.5
1.1
0.0
2.4
0.2
100
10Se
sam
um1.
81.
12.
81.
10.
30.
98.
50.
10.
10.
30.
52.
80.
022
.70.
70.
60.
212
.12.
814
.10.
128
.21.
210
0
11Ni
gers
eed
3.0
0.0
3.0
4.8
0.0
14.0
3.4
0.0
0.0
0.4
5.0
1.7
0.0
29.6
3.8
30.0
0.0
0.0
0.0
0.0
0.0
4.0
0.2
100
12So
ybea
n0.
02.
42.
50.
00.
00.
70.
70.
00.
00.
00.
01.
70.
051
.432
.80.
00.
09.
60.
00.
10.
10.
00.
410
0
13Su
nflow
er6.
75.
310
.50.
04.
90.
10.
04.
00.
00.
00.
448
.70.
00.
97.
210
.12.
70.
02.
31.
50.
05.
90.
710
0
14Co
tton
5.6
8.5
13.0
0.0
0.0
0.0
31.8
5.2
0.0
0.0
0.0
4.2
0.0
5.9
25.0
1.1
3.1
4.5
1.2
0.0
0.0
0.0
4.8
100
Sour
ce: D
irect
orat
e of
Eco
nom
ics &
Sta
tistic
s, M
inist
ry o
f Agr
icul
ture
and
Far
mer
s Wel
fare

The Marketing Season 2018-19 127
Annex Table 3.1 : Simulation-Impact of Oil Content on MSP of Sunflower
SI. No. Oil Content (%)
Oil Cake(%)
{100-col(2)}
Realisation from oil cake on process-
ing of 1 quintal of oilseeds, assuming price of cake/qtl=
`2050{col (3)*Price of Oilcake}/100
Cost of Oil Content i.e. oilseeds without cake
(`/qtl.), assuming MSP/qtl.=5385 MSP-
Col (4)
Cost of Oil Content i.e. oilseeds without cake for each 0.25 percent point of oil content
(`/qtl.) {col(5)/col(2)}*0.25
MSP at Oil Content (`) Given in col.(2)
[MSP+{Average of col.(6)* percent points of oil content that is over & above 35%}]/(0.25)
(1) (2) (3) (4) (5) (6) (7)
1 35.00 65.00 1333 4053 28.95 5385
2 35.25 64.75 1327 4058 28.78 5410
3 35.50 64.50 1322 4063 28.61 5436
4 35.75 64.25 1317 4068 28.45 5461
5 36.00 64.00 1312 4073 28.28 5487
6 36.25 63.75 1307 4078 28.13 5512
7 36.50 63.50 1302 4083 27.97 5537
8 36.75 63.25 1297 4088 27.81 5563
9 37.00 63.00 1292 4094 27.66 5588
10 37.25 62.75 1286 4099 27.51 5613
11 37.50 62.50 1281 4104 27.36 5639
12 37.75 62.25 1276 4109 27.21 5664
13 38.00 62.00 1271 4114 27.07 5690
14 38.25 61.75 1266 4119 26.92 5715
15 38.50 61.50 1261 4124 26.78 5740
16 38.75 61.25 1256 4129 26.64 5766
17 39.00 61.00 1251 4135 26.50 5791
18 39.25 60.75 1245 4140 26.37 5817
19 39.50 60.50 1240 4145 26.23 5842
20 39.75 60.25 1235 4150 26.10 5867
21 40.00 60.00 1230 4155 25.97 5893
22 40.25 59.75 1225 4160 25.84 5918
23 40.50 59.50 1220 4165 25.71 5944
24 40.75 59.25 1215 4170 25.59 5969
25 41.00 59.00 1210 4176 25.46 5994
26 41.25 58.75 1204 4181 25.34 6020
27 41.50 58.50 1199 4186 25.22 6045
28 41.75 58.25 1194 4191 25.10 6070
29 42.00 58.00 1189 4196 24.98 6096
30 42.25 57.75 1184 4201 24.86 6121
(Contd.)

The Marketing Season 2018-19128
Annex Table 3.1 : Simulation-Impact of Oil Content on MSP of Sunflower
SI. No. Oil Content (%)
Oil Cake(%)
{100-col(2)}
Realisation from oil cake on process-
ing of 1 quintal of oilseeds, assuming price of cake/qtl=
`2050{col (3)*Price of Oilcake}/100
Cost of Oil Content i.e. oilseeds without cake
(`/qtl.), assuming MSP/qtl.=5385 MSP-
Col (4)
Cost of Oil Content i.e. oilseeds without cake for each 0.25 percent point of oil content
(`/qtl.) {col(5)/col(2)}*0.25
MSP at Oil Content (`) Given in col.(2)
[MSP+{Average of col.(6)* percent points of oil content that is over & above 35%}]/(0.25)
(1) (2) (3) (4) (5) (6) (7)
31 42.50 57.50 1179 4206 24.74 6147
32 42.75 57.25 1174 4211 24.63 6172
33 43.00 57.00 1169 4217 24.51 6197
34 43.25 56.75 1163 4222 24.40 6223
35 43.50 56.50 1158 4227 24.29 6248
36 43.75 56.25 1153 4232 24.18 6274
37 44.00 56.00 1148 4237 24.07 6299
38 44.25 55.75 1143 4242 23.97 6324
39 44.50 55.50 1138 4247 23.86 6350
40 44.75 55.25 1133 4252 23.76 6375
41 45.00 55.00 1128 4258 23.65 6401
42 45.25 54.75 1122 4263 23.55 6426
43 45.50 54.50 1117 4268 23.45 6451
44 45.75 54.25 1112 4273 23.35 6477
45 46.00 54.00 1107 4278 23.25 6502
46 46.25 53.75 1102 4283 23.15 6527
47 46.50 53.50 1097 4288 23.06 6553
48 46.75 53.25 1092 4293 22.96 6578
49 47.00 53.00 1087 4299 22.86 6604
50 47.25 52.75 1081 4304 22.77 6629
51 47.50 52.50 1076 4309 22.68 6654
52 47.75 52.25 1071 4314 22.59 6680
53 48.00 52.00 1066 4319 22.49 6705
Average increase in MSP with 0.25 percent increase in oil content 25.39

The Marketing Season 2018-19 129
Tabl
e 4.
1: L
eadi
ng E
xpor
ters
and
Impo
rter
s in
Wor
ld M
erch
andi
se T
rade
, 201
6 (Bill
ion
dolla
rs a
nd p
erce
ntag
e)
Rank
Ex
port
ers
Valu
e Sh
are
Annu
al p
erce
ntag
e ch
ange
from
201
5Ra
nk
Impo
rter
s Va
lue
Shar
e An
nual
per
cent
age
chan
ge fr
om 2
015
1Ch
ina
20
9813
.2-8
1U
SA22
5113
.9-3
2U
SA14
559.
1-3
2Ch
ina
15
879.
8-5
3Ge
rman
y
1340
8.4
13
Germ
any
10
556.
50
4Ja
pan
64
54.
03
4U
nite
d Ki
ngdo
m
636
3.9
1
5N
ethe
rland
s 57
03.
6-0
5Ja
pan
60
73.
7-6
6Ho
ng K
ong,
Chi
na
517
3.2
16
Fran
ce
573
3.5
-0
dom
estic
exp
orts
26
0.2
95
re-e
xpor
ts
491
3.1
-1
7Fr
ance
50
13.
1-1
7Ho
ng K
ong,
Chi
na
547
3.4
-2
re
tain
ed im
port
s a12
10.
7-1
0
8Ko
rea,
Rep
ublic
of
495
3.1
-68
Net
herla
nds
503
3.1
-2
9Ita
ly
462
2.9
19
Cana
da b
417
2.6
-5
10U
nite
d Ki
ngdo
m
409
2.6
-11
10Ko
rea,
Rep
ublic
of
406
2.5
-7
11Be
lgiu
m
396
2.5
-011
Italy
40
42.
5-2
12Ca
nada
39
02.
4-5
12M
exic
o
398
2.5
-2
13M
exic
o
374
2.3
-213
Belg
ium
36
72.
3-2
14Si
ngap
ore
33
02.
1-5
14In
dia
35
92.
2-9
dom
estic
exp
orts
15
41.
0-5
re-e
xpor
ts
176
1.1
-5
15Sw
itzer
land
30
31.
95
15Sp
ain
30
91.
9-1
16Sp
ain
28
71.
82
16Si
ngap
ore
28
31.
7-5
re
tain
ed im
port
s 10
70.
7-4
17Ru
ssia
n Fe
dera
tion
28
21.
8-1
717
Switz
erla
nd
269
1.7
6
18Ch
ines
e Ta
ipei
28
01.
8-2
18Ch
ines
e Ta
ipei
23
11.
4-3
19U
nite
d Ar
ab E
mira
tes
a26
61.
7-2
19U
nite
d Ar
ab E
mira
tes
a22
51.
4-2
20In
dia
26
41.
7-1
20Tu
rkey
19
91.
2-4
21Th
aila
nd
215
1.3
021
Pola
nd
197
1.2
0
22Po
land
20
31.
32
22Au
stra
lia a
196
1.2
-6
23Au
stra
lia
190
1.2
123
Thai
land
19
51.
2-4
24M
alay
sia
189
1.2
-524
Russ
ian
Fede
ratio
n b
191
1.2
-1(C
ontd
.)

The Marketing Season 2018-19130
Tabl
e 4.
1: L
eadi
ng E
xpor
ters
and
Impo
rter
s in
Wor
ld M
erch
andi
se T
rade
, 201
6 (Bill
ion
dolla
rs a
nd p
erce
ntag
e)
Rank
Ex
port
ers
Valu
e Sh
are
Annu
al p
erce
ntag
e ch
ange
from
201
5Ra
nk
Impo
rter
s Va
lue
Shar
e An
nual
per
cent
age
chan
ge fr
om 2
015
25Br
azil
18
51.
2-3
25Vi
et N
am
174
1.1
5
26Vi
et N
am
177
1.1
926
Mal
aysia
16
81.
0-4
27Sa
udi A
rabi
a, K
ingd
om o
f a
175
1.1
-14
27Au
stria
15
71.
01
28Cz
ech
Repu
blic
16
31.
03
28Br
azil
14
30.
9-2
0
29Au
stria
15
21.
0-0
29Cz
ech
Repu
blic
14
20.
91
30In
done
sia
144
0.9
-430
Swed
en
140
0.9
1
31Tu
rkey
14
30.
9-1
31Sa
udi A
rabi
a, K
ingd
om o
f a
139
0.9
-20
32Sw
eden
14
00.
9-0
32In
done
sia
136
0.8
-5
33Ire
land
12
80.
83
33Hu
ngar
y
940.
62
34Hu
ngar
y
102
0.6
334
Sout
h Af
rica
a92
0.6
-13
35De
nmar
k
950.
6-0
35Ph
ilipp
ines
a86
0.5
23
36N
orw
ay
890.
6-1
436
Denm
ark
86
0.5
-0
37Sl
ovak
Rep
ublic
78
0.5
337
Slov
ak R
epub
lic
750.
53
38So
uth
Afric
a
750.
5-8
38Ire
land
75
0.5
-2
39Ira
n a
660.
45
39Ro
man
ia
750.
57
40Ro
man
ia
640.
45
40N
orw
ay
720.
4-5
41Is
rael
a60
0.4
-641
Isra
el a
690.
46
42Ch
ile
600.
4-4
42Po
rtug
al
680.
41
43Ar
genti
na
580.
42
43Fi
nlan
d
600.
4-0
44Fi
nlan
d
580.
4-4
44Ch
ile
590.
4-6
45Q
atar
58
0.4
-25
45Eg
ypt
560.
3-1
2
46Ph
ilipp
ines
56
0.4
-446
Arge
ntina
56
0.3
-7
47Po
rtug
al
560.
31
47Gr
eece
49
0.3
1
48Ku
wai
t, th
e St
ate
of a
460.
3-1
548
Iraq
a48
0.3
-8
49Ira
q a
440.
3-1
149
Paki
stan
47
0.3
8
50Pe
ru
370.
28
50Al
geria
47
0.3
-10
Tota
l of a
bove
c14
968
93.8
-To
tal o
f abo
ve c
1481
991
.3-
Wor
ld c
1595
510
0.0
-3W
orld
c16
225
100.
0-3
Not
e: a
: Se
cret
aria
t esti
mat
eb:
Impo
rts a
re v
alue
d f.o
.b.
c: In
clud
es si
gnifi
cant
re-e
xpor
ts o
r re-
impo
rts f
or re
-exp
ort.
Sour
ce: W
TO

The Marketing Season 2018-19 131
Table 4.2: Top 10 Exporters and Importers of Agricultural Products, 2016(Billion dollars and percentage)
Value Share in world exports/imports Annual percentage change in value
2016 2000 2005 2010 2016 2010-16 2014 2015 2016
Exporters
European Union (28) 598 41.9 44.2 39.3 37.7 2 1 -13 3
United States of America 165 13.0 9.7 10.5 10.4 2 4 -12 3
Brazil 77 2.8 4.1 5.0 4.9 2 -3 -9 -4
China 76 3.0 3.4 3.8 4.8 7 6 -3 5
Canada 63 6.3 4.8 3.8 4.0 3 4 -7
Indonesia a 38 1.4 1.6 2.6 2.4 1 3 -10 -4
Argentina 37 2.2 2.2 2.5 2.3 1 10 -9 7
Thailand 37 2.2 2.1 2.6 2.3 1 -2 -8 1
Australia 34 3.0 2.5 2.0 2.1 4 3 -7 -6
India 34 1.1 1.2 1.7 2.1 6 -3 -19 -5
Above 10 1159 76.9 75.9 73.9 73.0 - - - -
Importers
Eurepean Union (28) 602 42.7 45.3 40.3 36.8 1 1 -12 2
United States of America 160 11.6 10.6 8.4 9.8 5 7 0 2
China 155 3.3 5 7.8 9.5 6 3 -6 -3
Japan 75 10.4 7.3 5.6 4.6 -5 -10 2
Canada b 38 2.6 2.4 2.3 2.3 3 4 -5
Korea, republic of 32 2.2 1.9 1.9 2 3 5 -6 -3
India 29 0.7 0.8 1.3 1.8 8 12 1 5
Hong Kong, China 28 5 5 -6 3
retained imports a 18 1.1 0.8 1 1.1 5 6 -9 1
Mexico b 28 1.8 1.8 1.7 1.7 3 3 -8 1
Russian Federation b 26 1.3 1.9 2.6 1.6 -5 8 -33 -6
Above 10 1162 77.5 77.9 72.8 71.1 - - - -
Note: European Union 28 (countries) are EU countries. The EU countries are: Austria, Belgium, Bulgaria, Croatia, Republic of Cyprus, Czech Republic, Denmark, Estonia, Finland, France, Germany, Greece, Hungary, Ireland, Italy, Latvia, Lithuania, Luxembourg, Malta, Netherlands, Poland, Portugal, Romania, Slovakia, Slovenia, Spain, Sweden and the UK.a: Secretariat estimateb: Imports are valued f.o.b.Source: WTO

The Marketing Season 2018-19132
Table 4.3: India’s Agricultural Exports of Major Commodities (` ‘000 Crore)
Sl. No. Commodity Apr-Dec, 2016 Apr-Dec, 2017(P) Percent change over previous year
Share in Total Export
1 Marine products 30.8 38.0 23.3 21.6
2 Rice 26.9 35.6 32.1 20.2
3 Meat & Processed Meat 20.4 21.4 4.9 12.2
4 Spices 13.8 14.6 6.1 8.3
5 Cotton (raw) 5.6 6.7 18.8 3.8
6 Oilseeds 6.3 5.8 -8.8 3.3
7 Oil Meals 3.2 5.3 63.4 3.0
8 Cashew 3.8 4.8 25.3 2.7
9 Sugar 6.5 4.3 -33.7 2.5
10 Fresh Vegetables 4.6 3.7 -18.6 2.1
11 Guargum Meal 2.0 3.0 48.8 1.7
12 Others 30.6 32.6 6.5 18.6
Total 154.6 175.7 13.6 100.0
Source: DGCIS
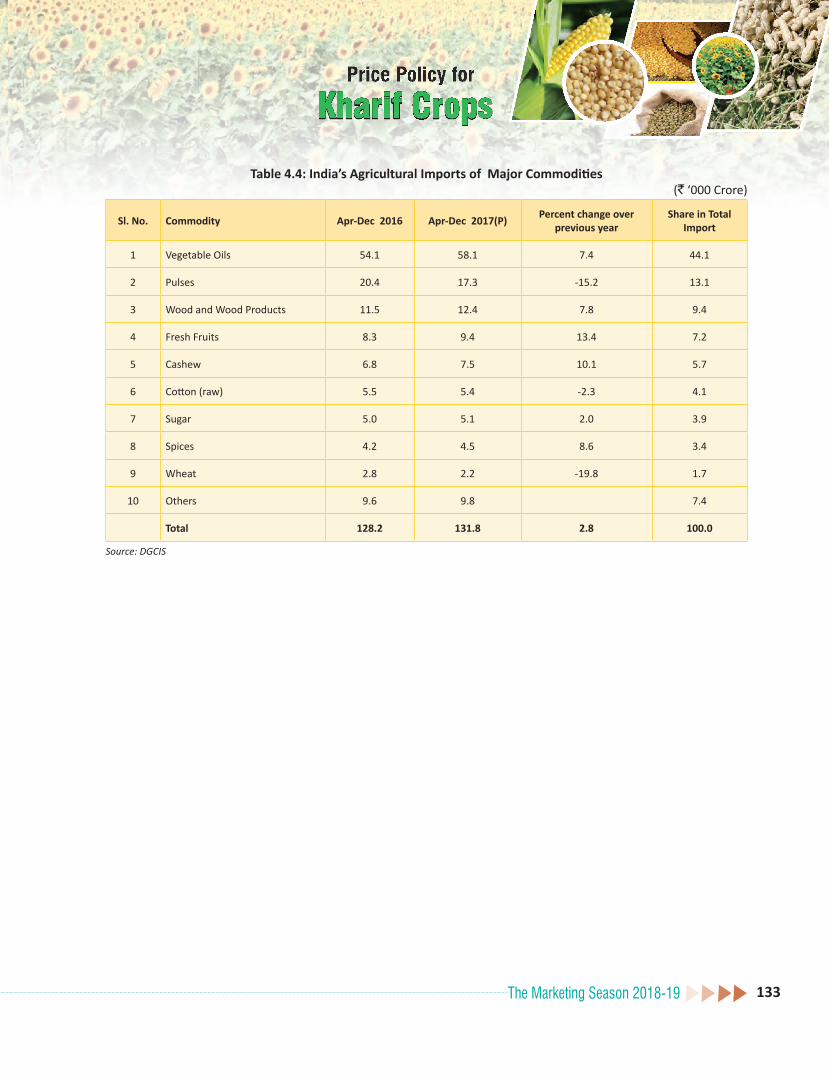
The Marketing Season 2018-19 133
Table 4.4: India’s Agricultural Imports of Major Commodities(` ‘000 Crore)
Sl. No. Commodity Apr-Dec 2016 Apr-Dec 2017(P) Percent change over previous year
Share in Total Import
1 Vegetable Oils 54.1 58.1 7.4 44.1
2 Pulses 20.4 17.3 -15.2 13.1
3 Wood and Wood Products 11.5 12.4 7.8 9.4
4 Fresh Fruits 8.3 9.4 13.4 7.2
5 Cashew 6.8 7.5 10.1 5.7
6 Cotton (raw) 5.5 5.4 -2.3 4.1
7 Sugar 5.0 5.1 2.0 3.9
8 Spices 4.2 4.5 8.6 3.4
9 Wheat 2.8 2.2 -19.8 1.7
10 Others 9.6 9.8 7.4
Total 128.2 131.8 2.8 100.0
Source: DGCIS

The Marketing Season 2018-19134
Tabl
e 4.
5: Q
uart
erly
Dom
estic
and
Inte
rnati
onal
Pric
es o
f Kha
rif C
rops
(`/q
tl)
SI. N
o.Q
uart
erPa
ddy*
Mai
zeJo
war
Arha
rU
rad
Moo
ngCo
tton
**
DI
DI
DI
DI
DI
DI
DI
120
13 Q
113
0019
5213
7716
5219
6015
8135
9337
8739
3434
3955
1155
4343
0545
22
220
13 Q
213
7519
0613
9616
2920
5914
5438
0939
8539
2236
4554
6455
4643
2548
15
320
13 Q
314
4218
1514
9615
0620
3813
6537
2038
2839
9434
8652
3348
9747
6553
07
420
13 Q
414
6717
0013
3212
3720
5312
9440
4638
3743
6636
6153
5557
5545
6850
23
520
14 Q
114
8215
5213
1112
9721
1013
8539
2939
6446
7942
8861
4168
4150
3353
92
620
14 Q
215
1714
0813
3012
8021
5613
1241
4042
7749
9254
3062
7768
0148
8651
44
720
14 Q
314
9716
2513
6910
5521
8511
1747
6145
9658
0260
0064
2369
0847
9643
37
820
14 Q
414
5916
6912
6410
7420
8312
4544
3246
7152
0854
7171
8273
8041
3939
53
920
15 Q
114
2416
5713
3210
8421
6714
7849
5564
5254
9956
7572
8870
9540
9039
80
1020
15 Q
213
9815
8313
5910
6820
8713
6660
0671
8465
0176
0772
8576
1540
6642
63
1120
15 Q
313
5215
7413
8210
9920
2012
3376
9690
0773
9776
1470
5776
0841
5042
82
1220
15 Q
414
4715
8614
4111
0220
3111
6287
9898
0294
9911
828
7855
7442
4491
4259
1320
16 Q
114
3216
7314
4710
8021
3611
7475
9180
3785
2190
5670
0968
8745
6941
96
1420
16 Q
214
4318
2715
0411
4521
2311
6379
9992
8599
2510
691
6623
6421
4509
4425
1520
16 Q
315
3918
0215
4610
2822
8910
1868
1675
6688
5589
0554
6352
4647
8849
63
1620
16 Q
414
5116
3514
6810
2622
8393
455
7058
1870
0973
0851
3049
1148
8748
37
1720
17 Q
115
7216
3715
7210
7622
7494
243
3043
7660
4957
0249
4450
2054
9351
65
1820
17 Q
215
9515
3515
9510
1621
7810
1939
6037
8553
6152
3350
3656
0849
4050
85
1920
17 Q
316
0416
9416
0497
223
6710
7738
4236
7049
2543
4047
7653
4050
0747
57
2020
17 Q
416
3316
8616
3396
321
9911
0737
0036
9344
3139
1743
1954
2544
9547
91
(Con
td.)

The Marketing Season 2018-19 135
Tabl
e 4.
5: Q
uart
erly
Dom
estic
and
Inte
rnati
onal
Pric
es o
f Kha
rif C
rops
(`/q
tl)
S.N
o.Q
uart
erSo
ybea
nSo
ybea
n O
ilSo
ybea
n M
eal
Gro
undn
utG
roun
dnut
Oil
Sunfl
ower
See
dSu
nflow
er O
il
DI
DI
DI
DI
DI
DI
DI
120
13 Q
132
6329
0368
5759
4031
2427
4445
6334
6812
468
1042
132
8136
2370
8267
97
220
13 Q
236
4329
9467
0554
8931
8830
8943
4033
2611
169
9883
3276
3100
6984
6817
320
13 Q
333
8633
1865
2454
8031
4233
0336
7533
4992
5911
388
3215
2681
7384
6412
420
13 Q
435
4233
4968
4656
5833
1432
7835
0835
1885
5810
720
3136
2981
6810
6138
520
14 Q
136
9933
0966
4254
1734
7831
4734
8133
9277
0784
8332
1330
7462
9658
25
620
14 Q
240
3331
3766
1352
2340
0426
9736
2829
8475
4376
1030
6328
5159
7756
06
720
14 Q
335
5128
2862
1849
5934
6726
6037
2629
0778
6981
6129
3424
8256
9951
26
820
14 Q
431
2527
6760
5347
7728
2626
8037
2428
6185
3682
2728
5227
3857
4854
52
920
15 Q
132
8526
7861
5245
0128
5924
7139
7730
7997
1876
1230
6727
1659
0250
68
1020
15 Q
235
6923
1459
4243
8933
6822
6242
1030
9796
5877
3128
8026
4962
1356
30
1120
15 Q
332
3523
6257
6741
1429
8023
3345
1131
0010
387
8380
3104
2800
6387
5325
1220
15 Q
436
1623
2261
4244
3933
5421
4640
6126
2893
0084
4333
4831
1067
1757
06
1320
16 Q
135
9022
4861
5345
3033
4820
4140
7128
8596
1682
7333
4530
7267
5957
54
1420
16 Q
238
9527
1563
8247
9436
3926
5047
8628
7011
912
8784
3200
2863
6753
5744
1520
16 Q
334
5627
5064
4648
8131
6825
0349
5428
1013
474
9089
3068
2708
6623
5478
1620
16 Q
428
8726
0269
2454
3824
5522
5041
7627
8910
141
9866
3012
2823
6679
5628
1720
17 Q
128
6625
9868
4751
1023
2523
3541
6329
3797
7094
4429
8127
7264
1453
80
1820
17 Q
229
0522
9362
5146
7124
1420
0240
4127
9199
7110
261
2740
2576
5878
5073
1920
17 Q
328
8824
1065
2848
9225
1720
1036
6629
9287
6810
021
2723
2563
6160
5166
2020
17 Q
428
4724
1069
0450
0422
4621
2137
5933
5689
5093
0628
4425
4165
1651
13
Not
e : *
Inte
rnati
onal
Pric
es o
f Ric
e co
nver
ted
into
pad
dy a
t the
ratio
of 0
.67.
*
* In
tern
ation
al P
rices
of C
otton
(lin
t) c
onve
rted
into
Kap
as a
t the
ratio
of 0
.41.
D
: Dom
estic
; I: I
nter
natio
nal
Sour
ce: 1
. DES
for d
omes
tic w
hole
sale
pric
es fo
r Pad
dy, M
aize
, Jow
ar, A
rhar
, Ura
d, M
oong
, Cott
on, S
oybe
an, G
roun
dnut
and
Sun
flow
er S
eed.
2.
The
Solv
ent E
xtra
ctor
s Ass
ocia
tion
of In
dia
for d
omes
tic p
rices
for S
oybe
an O
il, S
oybe
an M
eal,
Grou
ndnu
t Oil
and
Sunfl
ower
Oil.
3.
Wor
ld B
ank
for I
nter
natio
nal P
rices
of P
addy
*, M
aize
, Jow
ar, C
otton
**, S
oybe
an, S
oybe
an O
il, S
oybe
an M
eal,
Grou
ndnu
t, Gr
ound
nut O
il, S
unflo
wer
seed
and
Sun
flow
er O
il 4.
NAF
ED fo
r Int
erna
tiona
l Pric
es o
f Pul
ses v
iz. A
rhar
, Ura
d &
Moo
ng.

The Marketing Season 2018-19136
Annex Table 5.1: State-wise Average Gross Returns of Kharif Crops during TE2015-16
Crop/State
Cost A2 Cost A2+FL GVO Gross Returns over A2 Gross Returns over A2+FL
`/ha `/ha (Col.4-Col.2)
Percent (Col.5/
Col.2*100)
`/ha (Col.4-Col.3)
Percent (Col.7/
Col.3*100)
(1) (2) (3) (4) (5) (6) (7) (8)
Paddy
Andhra Pradesh 42061 50661 84539 42478 101 33878 67
Assam 20360 35276 36138 15778 77 861 2
Bihar 20907 27416 37766 16859 81 10351 38
Chhatisgarh 23925 31250 44365 20440 85 13115 42
Gujarat 35352 40369 73113 37761 107 32744 81
Haryana 33942 44009 111456 77514 228 67447 153
Himachal Pradesh 9042 25733 40556 31514 349 14823 58
Jharkhand 17988 24047 33332 15343 85 9285 39
Kerala 50294 54128 93161 42866 85 39033 72
Karnataka 37153 46368 84854 47700 128 38486 83
Madhya Pradesh 20558 28534 41835 21277 103 13302 47
Maharashtra 41261 52320 54884 13623 33 2564 5
Odisha 25312 41144 42557 17245 68 1413 3
Punjab 34242 40152 103688 69446 203 63536 158
Tamilnadu 46272 55570 77142 30871 67 21573 39
Uttarakhand 21553 32053 61397 39844 185 29344 92
Uttar Pradesh 27757 37912 53131 25374 91 15218 40
West Bengal 35992 52415 59273 23281 65 6858 13
ALL-INDIA 30247 40716 59144 28897 96 18428 45
(Contd.)

The Marketing Season 2018-19 137
Annex Table 5.1: State-wise Average Gross Returns of Kharif Crops during TE2015-16
Crop/State
Cost A2 Cost A2+FL GVO Gross Returns over A2 Gross Returns over A2+FL
`/ha `/ha (Col.4-Col.2)
Percent (Col.5/
Col.2*100)
`/ha (Col.4-Col.3)
Percent (Col.7/
Col.3*100)
(1) (2) (3) (4) (5) (6) (7) (8)
Maize
Andhra Pradesh 34396 41607 74507 40112 117 32900 79
Bihar 21029 28202 44103 23075 110 15902 56
Chhatisgarh 6088 16927 17923 11835 194 996 6
Gujarat 22783 34413 30267 7483 33 -4146 -12
Himachal Pradesh 9695 23518 23458 13763 142 -60 -0
Jharkhand 21195 31031 47706 26511 125 16674 54
Karnataka 26274 31222 42171 15897 61 10949 35
Madhya Pradesh 17989 24553 30619 12630 70 6065 25
Maharashtra 44821 58038 58563 13742 31 525 1
Odisha 23605 40023 41530 17925 76 1507 4
Punjab 31248 39091 49672 18423 59 10580 27
Rajasthan 16512 34710 38567 22055 134 3857 11
Tamilnadu 46228 56572 72534 26306 57 15962 28
Uttar Pradesh 13701 24463 28410 14709 107 3947 16
ALL-INDIA 24854 34490 44543 19689 79 10053 29
Jowar
Andhra Pradesh 17608 23666 43421 25813 147 19755 83
Karnataka 13328 16642 25869 12541 94 9226 55
Madhya Pradesh 14853 20496 23813 8960 60 3317 16
Maharashtra 21468 27453 31247 9778 46 3794 14
Rajasthan 10207 17855 33619 23412 229 15764 88
Tamilnadu 15758 20608 37696 21938 139 17089 83
ALL-INDIA 18669 24272 30363 11694 63 6091 25
(Contd.)

The Marketing Season 2018-19138
Annex Table 5.1: State-wise Average Gross Returns of Kharif Crops during TE2015-16
Crop/State
Cost A2 Cost A2+FL GVO Gross Returns over A2 Gross Returns over A2+FL
`/ha `/ha (Col.4-Col.2)
Percent (Col.5/
Col.2*100)
`/ha (Col.4-Col.3)
Percent (Col.7/
Col.3*100)
(1) (2) (3) (4) (5) (6) (7) (8)
Bajra
Gujarat 25845 33688 54352 28507 110 20664 61
Haryana 14279 26096 29028 14750 103 2932 11
Karnataka 10785 13376 15971 5186 48 2595 19
Maharashtra 25314 35136 27667 2353 9 -7469 -21
Rajasthan 7664 16651 22118 14453 189 5466 33
Tamilnadu 24222 29011 62019 37796 156 33008 114
Uttar Pradesh 13945 21808 32991 19046 137 11183 51
ALL-INDIA 14858 24039 30130 15273 103 6091 25
Ragi
Andhra Pradesh 15733 39485 59556 43822 279 20071 51
Karnataka 28684 37248 34883 6199 22 -2365 -6
Maharashtra 24744 36471 26736 1993 8 -9734 -27
Tamilnadu 23163 29636 43441 20278 88 13805 47
Uttrakhand 5165 17851 31935 26769 518 14083 79
ALL-INDIA 18691 30404 33860 15169 81 3456 11
Arhar (Tur)
Andhra Pradesh 20914 26618 39237 18324 88 12619 47
Bihar 8552 9156 42300 33748 395 33144 362
Gujarat 21479 29640 53820 32341 151 24180 82
Karnataka 18251 21768 46533 28282 155 24765 114
Madhya Pradesh 14393 21490 46083 31691 220 24594 114
Maharashtra 36220 47922 90749 54528 151 42827 89
Odisha 6266 13341 21545 15278 244 8203 61
Uttar Pradesh 12711 23263 49851 37140 292 26588 114
ALL-INDIA 23946 32573 63081 39135 163 30508 94
(Contd.)

The Marketing Season 2018-19 139
Annex Table 5.1: State-wise Average Gross Returns of Kharif Crops during TE2015-16
Crop/State
Cost A2 Cost A2+FL GVO Gross Returns over A2 Gross Returns over A2+FL
`/ha `/ha (Col.4-Col.2)
Percent (Col.5/
Col.2*100)
`/ha (Col.4-Col.3)
Percent (Col.7/
Col.3*100)
(1) (2) (3) (4) (5) (6) (7) (8)
Moong
Andhra Pradesh 14200 16913 29846 15646 110 12933 76
Gujarat 16809 21521 32306 15496 92 10785 50
Karnataka 13293 15997 28860 15567 117 12863 80
Maharashtra 20121 26041 23061 2940 15 -2980 -11
Odisha 6133 12945 18563 12430 203 5618 43
Rajasthan 7072 14243 23680 16608 235 9437 66
Tamilnadu 15702 18679 34899 19198 122 16220 87
ALL-INDIA 12630 18248 25131 12500 99 6882 38
Urad
Andhra Pradesh 15231 16867 66510 51279 337 49643 294
Chhatisgarh 9366 19778 21301 11934 127 1523 8
Madhya Pradesh 12946 17716 31858 18912 146 14142 80
Maharashtra 16570 23553 25624 9054 55 2071 9
Odisha 5854 13518 21640 15785 270 8122 60
Rajasthan 7782 16412 14231 6449 83 -2181 -13
Tamilnadu 16448 19985 34519 18071 110 14534 73
Uttar Pradesh 8608 13537 20851 12242 142 7314 54
ALL-INDIA 12627 17633 33717 21090 167 16084 91
(Contd.)

The Marketing Season 2018-19140
Annex Table 5.1: State-wise Average Gross Returns of Kharif Crops during TE2015-16
Crop/State
Cost A2 Cost A2+FL GVO Gross Returns over A2 Gross Returns over A2+FL
`/ha `/ha (Col.4-Col.2)
Percent (Col.5/
Col.2*100)
`/ha (Col.4-Col.3)
Percent (Col.7/
Col.3*100)
(1) (2) (3) (4) (5) (6) (7) (8)
Groundnut
Andhra Pradesh 36778 43658 59485 22707 62 15827 36
Gujarat 42783 52875 84600 41817 98 31724 60
Karnataka 28698 33423 42410 13712 48 8987 27
Maharashtra 40848 53243 56029 15181 37 2786 5
Odisha 23148 38632 51190 28042 121 12558 33
Rajasthan 26198 36109 101642 75443 288 65533 181
Tamilnadu 45541 58193 70063 24523 54 11871 20
ALL-INDIA 39168 48271 70015 30847 79 21744 45
Soybean
Andhra Pradesh 25259 30542 28466 3207 13 -2076 -7
Chhatisgarh 13840 17667 20918 7078 51 3251 18
Madhya Pradesh 18459 22760 28173 9714 53 5413 24
Maharashtra 28924 33258 36144 7219 25 2886 9
Rajasthan 15792 20910 24123 8331 53 3213 15
ALL-INDIA 21798 26193 30259 8461 39 4066 16
Sunflower
Andhra Pradesh 20446 27926 25769 5324 26 -2156 -8
Karnataka 14740 17145 22957 8216 56 5811 34
Maharashtra 18297 20079 14594 -3703 -20 -5485 -27
ALL-INDIA 19339 24510 26182 6843 35 1672 7
Sesamum
Andhra Pradesh 16030 20147 27905 11876 74 7758 39
Gujarat 19037 26077 56603 37565 197 30526 117
Madhya Pradesh 10788 17013 42381 31593 293 25368 149
Odisha 8135 15033 25311 17176 211 10279 68
Rajasthan 4657 10557 20369 15712 337 9812 93
Tamilnadu 16158 23560 43146 26987 167 19586 83
Uttar Pradesh 8127 12611 24310 16183 199 11699 93
West Bengal 19878 27147 41933 22055 111 14786 54
ALL-INDIA 12122 18095 35266 23144 191 17170 95
(Contd.)

The Marketing Season 2018-19 141
Annex Table 5.1: State-wise Average Gross Returns of Kharif Crops during TE2015-16
Crop/State
Cost A2 Cost A2+FL GVO Gross Returns over A2 Gross Returns over A2+FL
`/ha `/ha (Col.4-Col.2)
Percent (Col.5/
Col.2*100)
`/ha (Col.4-Col.3)
Percent (Col.7/
Col.3*100)
(1) (2) (3) (4) (5) (6) (7) (8)
Nigerseed
Chhattisgarh 14052 20485 12800 -1252 -9 -7685 -38
Madhya Pradesh 10005 15295 17097 7091 71 1802 12
Odisha 5666 12805 13297 7632 135 493 4
ALL-INDIA 7619 14029 14270 6651 87 241 2
Cotton
Andhra Pradesh 46914 55458 69335 22421 48 13877 25
Gujarat 42949 54273 88981 46032 107 34708 64
Haryana 28742 45270 56456 27714 96 11186 25
Karnataka 33307 39529 69809 36502 110 30280 77
Madhya Pradesh 34723 49692 55636 20912 60 5944 12
Maharashtra 46554 55927 70842 24289 52 14916 27
Odisha 24568 39864 42681 18112 74 2817 7
Punjab 40819 48819 69379 28560 70 20560 42
Rajasthan 27205 51358 96486 69281 255 45128 88
Tamilnadu 47608 68651 89950 42341 89 21298 31
ALL-INDIA 43014 53704 73616 30602 71 19912 37
Source: CACP, using CS data.

The Marketing Season 2018-19142
Anne
x Ta
ble
5.2:
Sta
te-w
ise
Aver
age
Mon
thly
Wag
e Ra
tes f
or A
gric
ultu
ral L
abou
r (M
an)
(`/D
ay)
Year
/Mon
thAP
Asm
Bih
Guj
Har
HPKa
rKe
rM
PM
HO
diPu
nRa
jTN
UP
WB
All-I
ndia
2014
Janu
ary
229
182
194
172
320
336
237
580
155
215
178
276
262
355
191
229
225
Febr
uary
226
188
200
172
329
336
240
629
158
214
180
275
251
362
191
230
226
Mar
ch
222
189
202
175
333
341
243
594
161
219
164
279
270
356
195
223
229
April
222
199
204
179
335
352
240
594
163
223
160
306
291
361
201
226
235
May
225
203
206
179
346
335
242
594
165
223
173
307
283
364
202
225
235
June
217
204
207
179
347
341
241
594
164
230
191
304
280
362
199
227
235
July
230
208
218
185
345
345
241
599
173
225
201
302
320
372
200
226
244
Augu
st22
622
022
019
034
834
324
159
917
322
620
830
430
537
120
223
024
3
Sept
embe
r23
922
522
019
035
034
324
258
618
022
220
431
029
641
719
823
424
6
Oct
ober
241
226
222
198
354
339
242
586
171
222
202
310
297
412
201
237
246
Nov
embe
r24
723
822
019
835
733
024
459
717
022
320
031
230
542
119
923
624
8
Dece
mbe
r23
623
422
019
234
434
925
260
417
622
219
430
730
741
719
923
724
7
2015
Janu
ary
246
235
219
194
338
363
254
643
178
225
201
286
298
430
200
241
249
Febr
uary
250
234
221
194
335
363
252
643
179
225
202
290
287
440
202
241
249
Mar
ch
245
226
228
194
341
363
253
642
179
226
202
281
284
429
205
242
248
April
245
225
230
195
340
363
253
652
182
231
201
277
291
403
209
242
249
May
235
231
231
196
345
362
260
652
183
232
200
292
279
405
208
242
249
June
239
239
237
196
346
351
260
664
188
228
203
311
282
399
207
240
250
July
229
236
242
203
350
361
269
664
186
234
206
311
295
393
211
240
253
Augu
st24
123
824
620
335
536
627
765
318
823
320
230
430
040
421
423
925
7
Sept
embe
r24
123
924
620
335
437
227
865
619
022
819
630
330
439
421
424
125
6
Oct
ober
240
236
244
203
354
367
279
656
189
233
200
298
298
392
215
237
256
Nov
embe
r27
624
324
320
335
137
428
565
718
222
820
430
130
338
221
623
725
9
Dece
mbe
r27
824
124
520
336
137
928
665
718
022
920
030
130
238
321
924
826
0
(Con
td.)

The Marketing Season 2018-19 143
Anne
x Ta
ble
5.2:
Sta
te-w
ise
Aver
age
Mon
thly
Wag
e Ra
tes f
or A
gric
ultu
ral L
abou
r (M
an)
(`/D
ay)
Year
/Mon
thAP
Asm
Bih
Guj
Har
HPKa
rKe
rM
PM
HO
diPu
nRa
jTN
UP
WB
All-I
ndia
2016
Janu
ary
276
235
248
206
354
371
285
664
183
231
199
288
276
381
218
251
256
Febr
uary
254
233
248
206
359
371
281
666
182
229
195
300
270
383
217
252
253
Mar
ch25
023
424
621
335
937
128
067
018
623
120
629
227
740
621
725
425
6
April
272
240
246
214
362
395
278
670
188
232
198
310
260
406
223
254
257
May
256
241
248
214
368
369
283
665
186
247
199
312
266
400
223
256
258
June
254
255
249
214
368
370
288
665
190
249
210
321
265
396
222
259
260
July
257
255
251
219
368
373
295
665
189
238
207
313
289
408
225
259
264
Augu
st26
225
325
221
936
837
929
366
518
824
621
329
628
341
122
525
826
4
Sept
embe
r26
325
424
721
936
837
929
366
519
224
820
928
828
441
222
125
426
3
Oct
ober
263
254
247
219
368
391
290
665
199
249
203
306
284
409
221
257
265
Nov
embe
r27
125
424
721
936
838
729
766
519
925
520
730
728
140
622
726
026
7
Dece
mbe
r28
425
924
721
936
838
729
866
520
125
521
730
527
940
622
526
326
9
2017
Janu
ary
286
259
249
225
362
417
303
675
204
255
222
321
272
412
226
265
271
Febr
uary
286
261
251
227
363
387
302
675
207
259
220
318
281
413
229
264
273
Mar
ch29
025
625
022
736
341
730
067
520
826
222
331
829
341
323
126
427
6
April
291
257
251
229
361
408
300
682
210
269
227
326
283
413
270
232
280
May
288
256
251
229
363
406
301
687
214
275
229
335
266
413
232
265
275
June
269
256
251
229
363
404
300
687
215
280
227
335
281
410
233
264
276
July
281
252
255
230
373
425
301
687
217
277
235
327
288
415
241
268
280
Augu
st27
625
825
823
036
542
330
568
721
627
123
132
729
041
224
726
828
0
Sept
embe
r28
027
226
023
436
542
930
668
721
526
522
734
528
741
624
827
028
1
Oct
ober
277
282
259
234
367
399
306
687
211
265
226
348
279
416
246
275
279
Nov
embe
r28
228
126
123
436
742
331
068
720
826
922
234
228
941
724
427
728
1
Not
e: D
aily
Wag
e ra
te -
Aver
age
of fi
ve o
pera
tions
i.e.
Plo
ughi
ng, S
owin
g, W
eedi
ng, T
rans
plan
ting
and
Harv
estin
gSo
urce
: Lab
our B
urea
u, M
inist
ry o
f Lab
our &
Em
ploy
men
t, Go
vt. o
f Ind
ia

The Marketing Season 2018-19144
Annex Table 5.3: Farm Inputs - Wholesale Price Index (Base 2011-12=100)
Year/Month High Speed Diesel (HSD)
Fertilizers and
nitrogen compounds
Electricity Agricultural tractors Lube Oils Cattle Feed Fodder
Pesticides and other
agrochemical products
Annual Average (July - June)2012-13 113 115 101 105 111 131 123 1082013-14 130 117 104 105 115 143 143 1142014-15 105 120 106 108 120 141 148 1212015-16 68 121 104 112 121 152 168 1212016-17 78 118 104 114 115 158 163 1172012April 112 108 97 104 106 107 108 106May 112 110 101 104 106 110 105 106June 110 112 103 104 110 113 102 106July 109 114 102 104 110 118 107 107August 111 114 99 104 110 123 111 108September 114 115 97 104 110 129 119 109October 108 115 101 105 110 131 123 108November 108 115 102 105 110 132 125 109December 108 115 101 105 110 131 125 1082013January 112 115 105 105 110 130 122 108February 118 115 101 105 110 131 127 107March 118 116 98 105 110 134 129 108April 115 115 101 106 112 138 126 109May 112 115 101 104 112 140 125 105June 117 116 102 104 112 140 132 107July 123 117 102 104 112 140 136 110August 126 117 103 104 115 140 137 111September 133 117 105 104 115 142 138 112October 130 116 103 105 115 143 139 113November 130 117 103 105 115 143 140 113December 133 117 106 104 115 142 142 1142014January 132 117 106 104 115 141 144 113February 132 117 106 104 115 141 150 111March 133 118 106 105 115 142 156 115April 130 117 106 106 117 144 148 119May 131 118 103 107 117 148 139 119June 129 119 102 106 117 147 142 121July 132 119 103 107 117 146 142 120August 131 119 106 107 117 144 146 118September 130 119 105 107 120 142 154 124October 126 119 104 107 120 139 155 122November 113 119 107 107 120 137 156 122December 104 120 108 108 120 137 157 119
(Contd.)

The Marketing Season 2018-19 145
Annex Table 5.3: Farm Inputs - Wholesale Price Index (Base 2011-12=100)
Year/Month High Speed Diesel (HSD)
Fertilizers and
nitrogen compounds
Electricity Agricultural tractors Lube Oils Cattle Feed Fodder
Pesticides and other
agrochemical products
2015January 88 119 109 108 120 138 156 123February 79 120 108 108 120 139 151 123March 87 120 108 108 120 139 143 120April 83 121 108 111 121 141 140 122May 92 121 106 111 121 144 138 123June 93 121 106 111 121 145 143 123July 87 121 107 111 121 145 151 125August 73 122 105 111 121 147 166 123September 71 122 106 111 121 149 167 124October 74 122 103 112 121 151 169 124November 74 121 105 112 121 150 173 123December 72 121 105 112 121 150 176 1222016January 57 122 106 112 121 151 173 123February 50 122 104 112 121 154 170 122March 55 121 103 112 121 154 172 120April 59 121 101 114 121 155 167 117May 67 121 102 113 121 156 161 119June 75 121 103 113 121 159 170 118July 75 120 103 113 121 161 170 117August 67 119 103 114 115 162 163 116September 71 118 104 114 115 161 163 117October 73 118 104 114 115 159 165 115November 77 118 106 114 115 159 164 115December 77 117 106 114 115 158 164 116
2017January 83 117 108 114 115 157 163 118February 85 117 107 114 115 158 166 117March 85 117 103 113 115 155 160 117April 82 117 103 114 115 156 160 117May 81 117 103 114 114 156 157 117June 80 116 102 114 113 155 157 117July 79 116 102 114 113 155 162 115August 81 117 101 114 113 155 163 115September 83 117 106 115 113 155 160 114October 85 117 106 114 113 154 155 113November 85 117 106 114 113 153 144 114December 87 117 106 114 113 152 133 115% change of Oct.-Dec., 2017 over Oct.-Dec.,2016
13.5 -0.7 0.7 0.5 -1.7 -3.4 -12.4 -1.3
Source : Office of the Economic Adviser, Ministry of Commerce and Industry

The Marketing Season 2018-19146
Annex Table 5.4: Projected Cost of Production (A2, A2+FL & C2) for Kharif Crops during Marketing Season 2018-19 and Production Shares during TE2016-17
StatesCost of Production (`/qtl.) Shares in
Production(%)A2 A2+FL C2
Paddy
Andhra Pradesh 887 1067 1512 0.07
Assam 731 1259 1589 0.05
Bihar 816 1065 1398 0.07
Chhattisgarh 773 1002 1381 0.07
Gujarat 954 1080 1362 0.02
Haryana 825 1068 1720 0.04
Himachal Pradesh 381 1071 1424 0.00
Jharkhand 1029 1369 1824 0.03
Karnataka 880 1095 1457 0.03
Kerala 1251 1342 1732 0.01
Madhya Pradesh 944 1306 1711 0.04
Maharashtra 1663 2102 2481 0.03
Odisha 857 1382 1713 0.08
Punjab 599 702 1174 0.12
Tamil Nadu 977 1174 1507 0.05
Uttar Pradesh 824 1119 1530 0.13
Uttarakhand 671 1012 1325 0.01
West Bengal 954 1379 1720 0.15
All India Wtd. Avg. 865 1166 1560
Jowar
Andhra Pradesh 970 1302 1988 0.07
Karnataka 1554 1936 2611 0.23
Madhya Pradesh 1029 1412 1830 0.09
Maharashtra 1318 1685 2215 0.44
Rajasthan 655 1147 1570 0.09
Tamil Nadu 1078 1410 2051 0.09
All India Wtd. Avg. 1241 1619 2183
Bajra
Gujarat 756 982 1258 0.10
Haryana 594 1085 1534 0.09
Karnataka 1254 1555 1942 0.03
Maharashtra 1524 2119 2562 0.07
Rajasthan 400 867 1159 0.49(Contd.)

The Marketing Season 2018-19 147
Annex Table 5.4: Projected Cost of Production (A2, A2+FL & C2) for Kharif Crops during Marketing Season 2018-19 and Production Shares during TE2016-17
StatesCost of Production (`/qtl.) Shares in
Production(%)A2 A2+FL C2
Uttar Pradesh 519 811 1177 0.21
TamilNadu 830 995 1333 0.02
All India Wtd. Avg. 583 990 1324
Maize
Andhra Pradesh 664 803 1257 0.08
Bihar 610 814 1117 0.13
Gujarat 1207 1819 2160 0.03
Himachal Pradesh 637 1526 1972 0.04
Jharkhand 624 915 1146 0.02
Karnataka 849 1010 1319 0.18
Madhya Pradesh 743 1011 1341 0.13
Maharashtra 1093 1415 1777 0.12
Odisha 684 1159 1474 0.01
Punjab 768 961 1289 0.02
Rajasthan 764 1612 1977 0.07
Tamil Nadu 910 1111 1406 0.09
Uttar Pradesh 717 1279 1769 0.07
All India Wtd. Avg. 806 1131 1480
Ragi
Karnataka 1673 2139 2643 0.69
Maharashtra 1422 2097 2455 0.07
Tamil Nadu 1150 1471 1797 0.15
Uttarakhand 306 1050 1262 0.10
All India Wtd. Avg. 1446 1931 2370
Arhar (Tur)
Andhra Pradesh 3569 4552 6470 0.04
Gujarat 2772 3772 4883 0.10
Karnataka 2747 3276 4531 0.19
Madhya Pradesh 1819 2704 4380 0.22
Maharashtra 2807 3693 5211 0.32
Odisha 2035 4304 6293 0.04
Uttar Pradesh 1818 3320 5463 0.08
All India Wtd. Avg. 2488 3432 4981 (Contd.)

The Marketing Season 2018-19148
Annex Table 5.4: Projected Cost of Production (A2, A2+FL & C2) for Kharif Crops during Marketing Season 2018-19 and Production Shares during TE2016-17
StatesCost of Production (`/qtl.) Shares in
Production(%)A2 A2+FL C2
Moong
Andhra Pradesh 2881 3411 5219 0.10
Karnataka 3920 4724 6544 0.06
Maharashtra 5174 6688 8257 0.12
Odisha 2147 4497 6209 0.09
Rajasthan 2448 4587 6025 0.53
TamilNadu 3295 3921 5101 0.10
All India Wtd. Avg. 2958 4650 6161
Urad
Andhra Pradesh 1693 1860 3865 0.18
Chhatisgarh 1238 2567 3271 0.02
Madhya Pradesh 2073 2812 4090 0.31
Maharashtra 4027 5697 7008 0.06
Odisha 2056 4700 6691 0.02
Rajasthan 2335 4927 5714 0.09
Tamil Nadu 3416 4152 5631 0.16
Uttar Pradesh 2564 4004 6222 0.16
All India Wtd. Avg. 2420 3438 4989
Groundnut
Andhra Pradesh 2332 2757 3863 0.10
Gujarat 2727 3364 4201 0.46
Karnataka 4129 4767 6063 0.07
Maharashtra 3279 4253 5245 0.06
Odisha 2140 3543 4733 0.01
Rajasthan 1127 1554 2389 0.17
Tamil Nadu 3317 4240 5213 0.13
All India Wtd. Avg. 2615 3260 4186
Soybean
Chhattisgarh 2108 2679 3476 0.01
Madhya Pradesh 1616 1984 2690 0.59
Maharashtra 2419 2777 3521 0.30
Rajasthan 1809 2378 2963 0.10
All India Wtd. Avg. 1879 2266 2972(Contd.)

The Marketing Season 2018-19 149
Annex Table 5.4: Projected Cost of Production (A2, A2+FL & C2) for Kharif Crops during Marketing Season 2018-19 and Production Shares during TE2016-17
StatesCost of Production (`/qtl.) Shares in
Production(%)A2 A2+FL C2
Sunflower
Andhra Pradesh 2738 3667 4654 0.14
Karnataka 3171 3682 4664 0.74
Maharashtra 2721 2988 3386 0.13
All India Wtd. Avg. 3056 3592 4501
Sesamum
A.P. 4577 5752 8319 0.03
Gujarat 4338 5912 7756 0.11
M.P. 2340 3685 5888 0.24
Odisha 3008 5427 7720 0.01
Rajasthan 2293 5205 7174 0.15
Tamil Nadu 3993 5825 7592 0.04
West Bengal 2070 2823 3789 0.29
Uttar Pradesh 2908 4516 7610 0.14
All India Wtd. Avg. 2682 4166 6053
Nigerseed
Odisha 1744 3918 5135 1.00
All India Wtd. Avg. 1744 3918 5135
Cotton
Andhra Pradesh 3007 3562 4927 0.07
Gujarat 2392 3018 3894 0.33
Haryana 1975 3114 4863 0.06
Karnataka 2765 3272 4461 0.06
Madhya Pradesh 2636 3653 4908 0.07
Maharashtra 3321 3990 5063 0.29
Odisha 2535 4056 5066 0.01
Punjab 2763 3304 4419 0.04
Rajasthan 1403 2656 3574 0.05
Tamil Nadu 3033 4342 5271 0.02
All India Wtd. Avg. 2700 3433 4514
Note: Production Shares are related to production of projected states onlySource: CACP, using CS data

The Marketing Season 2018-19150
Anne
x Ta
ble
5.5a
: Pa
ddy
- Bre
ak-u
p of
Cos
t of C
ultiv
ation
(`
/ha)
Cost
Item
sAn
dhra
Pra
desh
Assa
mBi
har
Chha
ttisg
arh
Guj
arat
Hary
ana
Him
acha
l Pra
desh
Jhar
khan
d
2015
-16
2014
-15
2015
-16
2014
-15
2015
-16
2014
-15
2015
-16
2014
-15
2015
-16
2014
-15
2015
-16
2014
-15
2015
-16
2014
-15
2015
-16
2014
-15
Ope
ratio
nal C
ost
5267
8.42
5182
0.70
3619
5.91
3600
0.00
2920
5.41
2630
7.57
3405
6.80
3084
8.13
4108
3.72
4144
7.35
4709
2.31
4571
6.71
2754
9.81
2632
3.44
2484
3.31
2387
5.23
Hum
an L
abou
r
Cas
ual
1600
1.31
1620
0.16
4793
.25
4808
.76
9285
.03
8606
.71
6697
.89
6060
.27
1455
3.97
1410
1.57
1170
4.63
1180
0.25
1159
.56
1594
.00
6923
.56
6655
.86
Atta
ched
599.
1830
1.84
167.
1612
8.80
40.5
632
.03
16.1
510
.47
108.
4111
4.09
401.
1449
2.07
0.00
13.0
21.
180.
00
Fam
ily10
047.
0592
77.8
515
777.
4915
639.
7467
26.2
166
42.7
883
31.8
071
11.2
249
71.9
652
91.6
411
938.
6810
850.
0318
275.
3217
441.
6472
26.5
866
86.7
8
Tot
al26
647.
5425
779.
8520
737.
9020
577.
3016
051.
8015
281.
5215
045.
8413
181.
9619
634.
3419
507.
3024
044.
4523
142.
3519
434.
8819
048.
6614
151.
3213
342.
64
Bullo
ck L
abou
r
Hire
d19
1.14
160.
2012
0.82
130.
040.
0019
.35
303.
8633
5.70
27.1
137
.13
0.00
0.00
351.
3153
8.00
31.2
669
.50
Ow
ned
308.
3239
7.36
8246
.89
7975
.67
80.8
522
2.63
2999
.10
2197
.32
229.
2821
6.25
11.6
434
.39
1991
.48
1415
.54
1696
.34
2285
.07
Tot
al49
9.46
557.
5683
67.7
181
05.7
180
.85
241.
9833
02.9
625
33.0
225
6.39
253.
3811
.64
34.3
923
42.7
919
53.5
417
27.6
023
54.5
7
Mac
hine
Lab
our
Hire
d93
99.2
293
01.0
627
88.7
026
60.5
637
76.5
635
37.5
759
48.4
559
49.4
344
95.1
943
38.0
345
72.8
143
41.9
418
11.2
417
81.3
729
96.0
924
42.2
6
Ow
ned
106.
1510
1.17
655.
3579
7.47
24.4
752
.04
187.
2911
1.32
841.
0311
66.1
198
8.46
1424
.47
53.3
938
.66
42.8
167
.01
Tot
al95
05.3
794
02.2
334
44.0
534
58.0
338
01.0
335
89.6
161
35.7
460
60.7
553
36.2
255
04.1
455
61.2
757
66.4
118
64.6
318
20.0
330
38.9
025
09.2
7
Seed
2004
.99
2265
.17
1096
.93
1086
.88
1802
.55
1783
.69
1809
.04
1800
.08
4651
.27
5403
.88
1207
.57
1208
.09
2066
.39
1682
.03
2094
.84
1992
.20
Ferti
liser
s and
Man
ure
Fer
tilise
rs72
89.7
573
99.4
774
0.93
807.
9928
20.6
928
92.8
234
53.3
734
51.5
551
88.2
949
02.0
445
79.2
445
83.3
739
0.43
411.
7527
28.6
424
58.0
9
Man
ure
928.
4097
0.44
685.
0167
0.75
304.
4820
0.54
1407
.62
1255
.25
598.
9588
1.99
2.64
0.00
582.
7848
8.74
483.
3069
2.14
Tot
al82
18.1
583
69.9
114
25.9
414
78.7
431
25.1
730
93.3
648
60.9
947
06.8
057
87.2
457
84.0
345
81.8
845
83.3
797
3.21
900.
4932
11.9
431
50.2
3
Oth
er In
puts
Inse
ctici
des
3102
.19
2708
.08
36.3
825
.26
38.0
018
.93
1008
.24
1031
.30
772.
7380
3.87
2564
.32
2420
.21
403.
5052
2.29
0.00
0.00
Irrig
ation
cha
rges
1312
.95
1432
.22
468.
2665
1.09
3624
.82
1702
.58
723.
7648
5.82
3543
.43
3082
.63
8050
.50
7505
.32
183.
3712
7.25
84.8
75.
46
Inte
rest
on
wor
king
cap
ital
1291
.86
1289
.18
618.
7461
6.99
681.
1959
5.90
779.
5571
9.30
1094
.30
1095
.63
1065
.26
1056
.57
281.
0426
9.15
533.
8452
0.86
Misc
ella
neou
s95
.91
16.5
00.
000.
000.
000.
0039
0.68
329.
107.
8012
.49
5.42
0.00
0.00
0.00
0.00
0.00
Fixe
d Co
st29
132.
9827
147.
6313
601.
3213
886.
9113
480.
4413
789.
1615
258.
5414
926.
9415
137.
0414
350.
7135
334.
6433
230.
8711
838.
0510
747.
0712
174.
5314
972.
30
Rent
al v
alue
of o
wne
d la
nd26
348.
6225
118.
4587
64.6
085
39.5
810
484.
5210
994.
1311
131.
3611
325.
7910
626.
3810
493.
1029
079.
0528
844.
7690
96.8
582
01.9
093
89.6
812
016.
61
Rent
pai
d fo
r lea
sed-
in la
nd12
1.23
59.3
634
8.08
462.
910.
000.
000.
000.
0018
49.3
016
79.0
80.
000.
0023
1.03
98.4
121
0.22
97.8
6
Land
reve
nue,
ces
ses &
taxe
s2.
351.
0049
.74
49.9
165
.03
48.0
22.
643.
758.
378.
230.
000.
007.
366.
5755
.55
54.9
0
Depr
ecia
tion
on im
plem
ents
&
Far
m b
uild
ings
306.
2821
1.39
836.
5890
1.89
520.
7350
6.75
1100
.12
829.
1018
7.07
168.
8661
8.44
316.
2552
0.48
465.
0183
9.02
969.
58
Inte
rest
on
fixed
cap
ital
2354
.50
1757
.43
3602
.32
3932
.62
2410
.16
2240
.26
3024
.42
2768
.30
2465
.92
2001
.44
5637
.15
4069
.86
1982
.33
1975
.18
1680
.06
1833
.35
Tota
l Cos
t81
811.
4078
968.
3349
797.
2349
886.
9142
685.
8540
096.
7349
315.
3445
775.
0756
220.
7655
798.
0682
426.
9578
947.
5839
387.
8637
070.
5137
017.
8438
847.
53
(Con
td.)

The Marketing Season 2018-19 151
Anne
x Ta
ble
5.5a
: Pa
ddy
- Bre
ak-u
p of
Cos
t of C
ultiv
ation
(`
/ha)
Cost
Item
sKe
rala
Mad
hya
Prad
esh
Mah
aras
htra
Odi
sha
Punj
abTa
mil
Nad
uU
ttar
Pra
desh
Utt
arak
hand
Wes
t Ben
gal
2015
-16
2014
-15
2015
-16
2014
-15
2015
-16
2014
-15
2015
-16
2014
-15
2015
-16
2014
-15
2015
-16
2014
-15
2015
-16
2014
-15
2015
-16
2014
-15
2015
-16
2014
-15
Ope
ratio
nal C
ost
5876
7.16
5290
4.87
3062
0.93
2841
5.16
5768
1.26
5441
7.34
4386
3.39
4230
1.82
3480
7.69
3404
1.18
5494
4.90
5525
1.95
4009
5.90
3948
1.03
3148
5.63
3039
6.29
5412
2.24
5425
9.48
Hum
an L
abou
r
Cas
ual
2920
9.19
2585
1.33
3509
.03
4079
.49
2052
6.09
1834
8.30
1157
2.62
1134
6.29
7255
.78
7127
.39
1474
0.30
1445
0.53
8463
.63
8861
.94
3228
.30
3574
.40
1691
7.97
1757
0.95
Atta
ched
0.00
0.00
77.9
351
.54
134.
4726
6.72
39.1
010
7.94
1754
.20
1728
.01
116.
2826
4.02
13.2
124
.71
22.3
730
.58
0.82
1.10
Fam
ily48
26.6
434
80.4
996
10.9
983
18.5
111
011.
9811
840.
6417
635.
5516
891.
7565
18.7
958
63.1
779
19.0
293
74.4
811
415.
7911
243.
6211
878.
1210
670.
2817
469.
2217
842.
29
Tot
al34
035.
8329
331.
8213
197.
9512
449.
5431
672.
5430
455.
6629
247.
2728
345.
9815
528.
7714
718.
5722
775.
6024
089.
0319
892.
6320
130.
2715
128.
7914
275.
2634
388.
0135
414.
34
Bullo
ck L
abou
r
Hire
d70
.94
163.
4917
8.75
385.
9533
81.9
338
13.7
353
8.49
352.
880.
450.
2310
4.50
99.9
510
0.23
63.3
10.
0010
4.92
291.
1735
5.02
Ow
ned
0.00
0.00
3961
.38
3637
.56
3802
.21
5016
.37
2617
.85
2855
.26
41.3
740
.64
58.2
296
.28
893.
8729
6.80
3015
.45
3110
.07
1486
.87
1285
.82
Tot
al70
.94
163.
4941
40.1
340
23.5
171
84.1
488
30.1
031
56.3
432
08.1
441
.82
40.8
716
2.72
196.
2399
4.10
360.
1130
15.4
532
14.9
917
78.0
416
40.8
4
Mac
hine
Lab
our
Hire
d10
534.
2810
331.
2245
66.3
935
10.1
542
41.5
732
78.9
944
12.1
635
39.5
937
77.2
340
81.2
696
35.5
497
00.2
340
81.2
643
07.3
332
67.6
931
28.8
242
05.4
938
78.3
9
Ow
ned
77.7
739
.79
183.
6926
7.53
609.
4717
6.14
66.3
312
8.25
2242
.81
2290
.18
981.
7145
6.02
232.
8630
0.03
1097
.55
774.
0414
.41
25.1
7
Tot
al10
612.
0510
371.
0147
50.0
837
77.6
848
51.0
434
55.1
344
78.4
936
67.8
460
20.0
463
71.4
410
617.
2510
156.
2543
14.1
246
07.3
643
65.2
439
02.8
642
19.9
039
03.5
6
Seed
3342
.47
3118
.49
2051
.77
2014
.48
2777
.47
2270
.70
1195
.62
1144
.50
1838
.03
1771
.16
6968
.77
6751
.07
3919
.33
3592
.87
3040
.14
3290
.56
2055
.04
1810
.01
Ferti
liser
s and
Man
ure
Fer
tilise
rs54
64.2
956
12.5
327
15.3
425
66.8
423
04.9
324
31.7
829
53.3
732
58.6
332
23.4
233
49.0
360
23.7
363
19.9
946
36.3
142
65.8
032
59.4
929
06.5
648
31.0
249
63.3
9
Man
ure
2236
.63
1590
.02
1154
.00
1636
.91
3945
.06
3235
.15
1449
.50
1509
.03
424.
9735
5.77
2428
.05
2645
.20
109.
0259
.52
539.
7072
6.31
1271
.55
1070
.26
Tot
al77
00.9
272
02.5
538
69.3
442
03.7
562
49.9
956
66.9
344
02.8
747
67.6
636
48.3
937
04.8
084
51.7
889
65.1
947
45.3
343
25.3
237
99.1
936
32.8
761
02.5
760
33.6
5
Oth
er In
puts
Inse
ctici
des
1279
.43
1214
.90
745.
1591
7.22
392.
1631
2.33
298.
8026
8.86
4458
.79
3928
.25
1558
.70
1490
.79
300.
3818
3.79
849.
3089
6.70
1500
.40
1385
.89
Irrig
ation
cha
rges
88.7
14.
9010
62.3
632
9.97
2230
.55
1706
.63
164.
4512
8.84
2399
.72
2623
.08
2977
.63
2181
.09
5060
.65
5424
.35
693.
3558
5.29
2941
.82
2912
.35
Inte
rest
on
wor
king
ca
pita
l16
34.5
614
97.7
163
6.67
608.
9914
14.2
212
90.2
079
4.78
770.
0085
7.24
853.
8814
25.0
313
90.2
386
9.09
855.
6859
4.17
597.
7611
10.7
011
03.5
5
Misc
ella
neou
s2.
250.
0016
7.48
90.0
290
9.15
429.
6612
4.77
0.00
14.8
929
.13
7.42
32.0
70.
271.
280.
000.
0025
.76
55.2
9
Fixe
d Co
st20
178.
6619
066.
7312
318.
1112
965.
6115
217.
1213
845.
1113
580.
2914
612.
1739
814.
0139
213.
3019
727.
1218
824.
9619
320.
5419
501.
3015
818.
1315
238.
1018
113.
2017
580.
94
Rent
al v
alue
of o
wne
d la
nd19
144.
5817
985.
3984
72.2
993
72.9
891
84.9
881
27.9
410
823.
4911
669.
6629
900.
6730
200.
6014
564.
9613
646.
7512
408.
2012
742.
7313
926.
3113
569.
5614
692.
4514
130.
98
Rent
pai
d fo
r lea
sed-
in
land
0.00
0.00
0.00
0.00
0.00
0.00
155.
9413
8.50
5993
.03
5283
.62
151.
5819
1.63
681.
9359
5.92
0.00
0.00
554.
0858
2.76
Land
reve
nue,
ces
ses
& ta
xes
218.
0016
2.63
3.40
4.10
22.8
624
.23
21.0
923
.96
0.00
0.00
7.00
7.15
2.84
3.34
3.41
3.04
65.6
959
.83
Depr
ecia
tion
on im
ple-
men
ts &
Far
m b
uild
ings
341.
7532
4.49
1063
.90
861.
8174
5.36
820.
5766
9.78
687.
6633
6.66
306.
2334
7.44
327.
8399
6.42
897.
0922
8.87
335.
7897
1.48
844.
64
Inte
rest
on
fixed
cap
ital
474.
3359
4.22
2778
.52
2726
.72
5263
.92
4872
.37
1909
.99
2092
.39
3583
.65
3422
.85
4656
.14
4651
.60
5231
.15
5262
.22
1659
.54
1329
.72
1829
.50
1962
.73
Tota
l Cos
t78
945.
8271
971.
6042
939.
0441
380.
7772
898.
3868
262.
4557
443.
6856
913.
9974
621.
7073
254.
4874
672.
0274
076.
9159
416.
4458
982.
3347
303.
7645
634.
3972
235.
4471
840.
42
Sour
ce: D
ES, D
AC &
FW

The Marketing Season 2018-19152
Annex Table 5.5b : Jowar - Break-up of Cost of Cultivation (`/ha)
Cost Items Andhra Pradesh Madhya Pradesh Maharashtra
2015-16 2014-15 2015-16 2014-15 2015-16 2014-15
Operational Cost 19908.79 22887.68 19685.82 22821.53 23499.28 31944.81
Human Labour
Casual 3631.23 5633.38 4218.96 2911.29 5994.38 9847.93
Attached 0.00 414.64 0.00 0.00 344.52 268.63
Family 3187.54 8184.94 7094.06 5839.47 6388.52 6926.94
Total 6818.77 14232.96 11313.02 8750.76 12727.42 17043.50
Bullock Labour
Hired 470.47 609.05 16.57 1071.26 1671.52 762.62
Owned 836.40 1525.71 0.00 0.00 1878.01 2690.63
Total 1306.87 2134.76 16.57 1071.26 3549.53 3453.25
Machine Labour
Hired 6506.64 2762.00 3276.24 5027.76 3227.21 5178.53
Owned 78.68 50.95 174.80 30.21 442.31 389.21
Total 6585.32 2812.95 3451.04 5057.97 3669.52 5567.74
Seed 765.92 783.10 1360.99 1466.75 518.22 711.55
Fertilisers and Manure
Fertilisers 2144.96 2161.46 1628.91 1950.79 1766.86 2077.61
Manure 574.21 0.00 507.17 3556.92 77.83 646.38
Total 2719.17 2161.46 2136.08 5507.71 1844.69 2723.99
Other Inputs
Insecticides 1149.88 9.05 0.00 439.49 1.92 41.40
Irrigation charges 56.16 307.86 928.59 0.00 641.79 1551.90
Interest on working capital 506.70 445.54 381.57 514.61 518.51 755.20
Miscellaneous 0.00 0.00 97.96 12.98 27.68 0.00
Fixed Cost 15376.88 14289.62 13848.70 5719.72 9385.55 12916.26
Rental value of owned land 12237.28 11987.08 9382.58 3843.01 4090.88 6060.58
Rent paid for leased-in land 0.00 177.17 0.00 0.00 0.00 0.00
Land revenue, cesses & taxes 0.47 2.33 3.35 0.71 22.97 26.37
Depreciation on implements & Farm buildings 762.26 242.59 280.37 978.00 653.52 859.65
Interest on fixed capital 2376.87 1880.45 4182.40 898.00 4618.18 5969.66
Total Cost 35285.67 37177.30 33534.52 28541.25 32884.83 44861.07
Source: DES, DAC & FW

The Marketing Season 2018-19 153
Annex Table 5.5c : Bajra - Break-up of Cost of Cultivation (`/ha)
Cost ItemsGujarat Haryana Maharashtra
2015-16 2014-15 2015-16 2014-15 2015-16 2014-15
Operational Cost 36750.78 35545.20 27035.60 25832.25 32625.16 34892.16
Human Labour
Casual 8312.73 9515.64 3893.55 3951.59 4873.65 6668.23
Attached 77.39 33.36 57.12 18.61 120.59 156.56
Family 9063.13 7951.94 12593.63 12264.65 12538.07 11007.56
Total 17453.25 17500.94 16544.30 16234.85 17532.31 17832.35
Bullock Labour
Hired 368.06 351.90 68.43 1.53 1062.63 908.42
Owned 348.22 450.73 26.09 36.03 2383.98 3332.92
Total 716.28 802.63 94.52 37.56 3446.61 4241.34
Machine Labour
Hired 3914.97 4031.81 5133.29 5211.02 5704.93 5398.00
Owned 1035.57 768.65 765.38 668.99 538.29 294.15
Total 4950.54 4800.46 5898.67 5880.01 6243.22 5692.15
Seed 1944.69 1897.91 911.97 798.49 998.77 965.65
Fertilisers and Manure
Fertilisers 3317.13 3673.48 1646.12 1207.43 1493.08 1795.04
Manure 1801.51 638.56 0.00 0.00 239.19 2640.46
Total 5118.64 4312.04 1646.12 1207.43 1732.27 4435.50
Other Inputs
Insecticides 18.15 23.32 16.59 72.86 0.00 0.00
Irrigation charges 5710.20 5371.73 1485.79 1189.91 2057.22 1001.39
Interest on working capital 839.03 836.17 437.64 411.14 608.70 723.78
Miscellaneous 0.00 0.00 0.00 0.00 6.06 0.00
Fixed Cost 11731.03 11267.50 11885.32 11783.30 9177.23 8481.10
Rental value of owned land 9322.80 9065.58 8082.38 8644.73 4185.50 4157.40
Rent paid for leased-in land 563.71 261.24 0.00 0.00 0.00 0.00
Land revenue, cesses & taxes 2.13 3.64 0.00 0.00 23.00 18.61
Depreciation on implements & Farm buildings 108.98 110.55 521.30 375.93 730.89 712.17
Interest on fixed capital 1733.41 1826.49 3281.64 2762.64 4237.84 3592.92
Total Cost 48481.81 46812.70 38920.92 37615.55 41802.39 43373.26
Source: DES, DAC & FW

The Marketing Season 2018-19154
Anne
x Ta
ble
5.5d
: M
aize
- Br
eak-
up o
f Cos
t of C
ultiv
ation
(`
/ha)
Cost
Item
sAn
dhra
Pra
desh
Biha
rG
ujar
at
Hi
mac
hal P
rade
shJh
arkh
and
2015
-16
2014
-15
2015
-16
2014
-15
2015
-16
2014
-15
2015
-16
2014
-15
2015
-16
2014
-15
Ope
ratio
nal C
ost
4263
4.46
4117
5.25
2956
3.31
2953
7.69
3617
1.74
3558
1.64
2675
9.06
2191
3.20
2880
3.46
3127
3.60
Hum
an L
abou
r
Cas
ual
1048
2.21
9564
.02
4821
.62
5139
.23
7980
.12
7719
.13
424.
4235
7.10
5118
.18
6694
.40
Atta
ched
741.
0744
3.91
43.0
844
.30
0.00
0.00
161.
4719
6.88
521.
580.
00
Fam
ily71
81.0
692
54.8
185
55.7
479
00.3
511
808.
6212
510.
5715
766.
5512
998.
4787
34.4
410
938.
15
Tot
al18
404.
3419
262.
7413
420.
4413
083.
8819
788.
7420
229.
7016
352.
4413
552.
4514
374.
2017
632.
55
Bullo
ck L
abou
r
Hire
d11
02.6
964
8.30
0.00
0.00
1273
.33
1335
.57
451.
9415
4.05
0.00
0.00
Ow
ned
2782
.74
1606
.45
0.00
0.00
3014
.86
2123
.70
1318
.912
07.2
224
23.2
038
04.6
0
Tot
al38
85.4
322
54.7
50.
000.
0042
88.1
934
59.2
717
70.8
413
61.2
724
23.2
038
04.6
0
Mac
hine
Lab
our
Hire
d57
83.8
153
68.3
738
48.4
139
75.4
030
84.6
432
23.4
822
94.4
218
85.8
938
8.64
434.
75
Ow
ned
179.
8452
.00
9.26
14.8
930
5.71
364.
2115
8.26
96.2
312
80.5
60.
00
Tot
al59
63.6
554
20.3
738
57.6
739
90.2
933
90.3
535
87.6
924
52.6
819
82.1
216
69.2
043
4.75
Seed
4387
.04
5099
.21
2195
.27
3100
.02
1874
.60
1646
.43
1296
.17
1016
.99
5636
.98
5582
.58
Ferti
liser
s and
Man
ure
Fer
tilise
rs71
74.5
063
21.7
739
96.1
547
15.1
423
66.1
028
16.4
181
0.94
577.
6025
33.3
217
75.5
7
Man
ure
353.
1356
1.75
857.
6842
6.52
1216
.37
1096
.83
3524
.52
3020
.84
0.00
0.00
Tot
al75
27.6
368
83.5
248
53.8
351
41.6
635
82.4
739
13.2
443
35.4
635
98.4
425
33.3
217
75.5
7
Oth
er In
puts
Inse
ctici
des
789.
0570
0.07
0.00
0.00
108.
1097
.68
218.
3613
1.79
0.00
0.00
Irrig
ation
cha
rges
574.
7558
7.30
4599
.51
3566
.16
2401
.02
1948
.51
0.00
0.00
1558
.41
1427
.32
Inte
rest
on
wor
king
cap
ital
1074
.35
967.
2963
6.59
655.
6873
8.27
699.
1233
3.11
270.
1460
8.15
616.
23
Misc
ella
neou
s28
.22
0.00
0.00
0.00
0.00
0.00
0.00
0.00
0.00
0.00
Fixe
d Co
st26
970.
7424
741.
0713
382.
1413
940.
6068
04.3
477
08.1
799
82.8
085
44.6
311
402.
3686
13.3
2
Rent
al v
alue
of o
wne
d la
nd23
644.
6422
498.
7910
867.
3410
640.
0445
29.8
660
58.6
459
52.0
653
28.8
488
48.7
249
34.4
3
Rent
pai
d fo
r lea
sed-
in la
nd0.
0014
.86
0.00
0.00
5.90
0.00
19.2
435
.60
0.00
0.00
Land
reve
nue,
ces
ses &
taxe
s1.
065.
9250
.84
52.4
05.
8210
.93
6.30
6.00
42.0
824
.79
Depr
ecia
tion
on im
plem
ents
& F
arm
bu
ildin
gs38
9.82
313.
5763
8.54
823.
7126
7.95
267.
3953
6.23
470.
6861
4.88
1303
.72
Inte
rest
on
fixed
cap
ital
2935
.22
1907
.93
1825
.42
2424
.45
1994
.81
1371
.21
3468
.97
2703
.51
1896
.68
2350
.38
Tota
l Cos
t69
605.
2065
916.
3242
945.
4543
478.
2942
976.
0843
289.
8136
741.
8630
457.
8340
205.
8239
886.
92(C
ontd
.)

The Marketing Season 2018-19 155
Anne
x Ta
ble
5.5d
: M
aize
- Br
eak-
up o
f Cos
t of C
ultiv
ation
(`
/ha)
Cost
Item
sM
adhy
a Pr
ades
hM
ahar
asht
raO
dish
aPu
njab
Utt
ar P
rade
sh20
15-1
620
14-1
520
15-1
620
14-1
520
15-1
620
14-1
520
15-1
620
14-1
520
15-1
620
14-1
5O
pera
tiona
l Cos
t27
044.
3924
518.
8256
378.
0858
654.
3239
671.
4739
245.
6336
738.
9835
225.
1827
848.
4719
648.
12Hu
man
Lab
our
Cas
ual
4050
.99
4834
.10
1002
4.94
1157
1.75
5269
.64
7933
.81
7136
.67
6211
.70
3563
.46
2034
.18
Atta
ched
260.
0447
0.48
1034
.09
96.1
424
.92
19.0
645
4.42
2108
.14
0.00
0.00
Fam
ily80
25.1
261
00.5
611
173.
7615
260.
3017
634.
8015
201.
5883
27.2
973
58.7
711
978.
9293
29.9
2 T
otal
1233
6.15
1140
5.14
2223
2.79
2692
8.19
2292
9.36
2315
4.45
1591
8.38
1567
8.61
1554
2.38
1136
4.10
Bullo
ck L
abou
r H
ired
421.
7034
2.34
504.
8589
0.71
355.
2133
4.42
271.
9515
6.33
227.
4032
.97
Ow
ned
2432
.92
1731
.79
8594
.79
3651
.68
3580
.63
2486
.34
65.2
233
.01
875.
3754
9.63
Tot
al28
54.6
220
74.1
390
99.6
445
42.3
939
35.8
428
20.7
633
7.17
189.
3411
02.7
758
2.60
Mac
hine
Lab
our
Hire
d39
90.8
239
33.5
249
69.9
491
55.7
019
93.0
933
68.6
548
59.3
257
83.1
139
28.4
433
23.5
0 O
wne
d22
1.11
453.
0911
98.0
6 13
72.3
50.
000.
0017
69.8
413
18.3
773
.89
79.0
8 T
otal
4211
.93
4386
.61
6168
.00
1052
8.05
1993
.09
3368
.65
6629
.16
7101
.48
4002
.33
3402
.58
Seed
2757
.91
2571
.43
4479
.76
4557
.66
3696
.90
2691
.41
4014
.98
3232
.58
2400
.47
1430
.86
Ferti
liser
s and
Man
ure
Fer
tilise
rs18
89.7
021
55.1
776
26.0
759
90.4
140
30.1
636
91.4
745
03.0
446
12.7
319
08.4
119
09.1
0 M
anur
e20
35.4
594
3.50
612.
3123
1.74
1928
.29
1879
.41
2218
.84
1555
.18
373.
550.
00 T
otal
3925
.15
3098
.67
8238
.38
6222
.15
5958
.45
5570
.88
6721
.88
6167
.91
2281
.96
1909
.10
Oth
er In
puts
Inse
ctici
des
145.
6218
7.90
294.
8354
7.27
307.
9842
1.22
1449
.13
1178
.88
74.2
267
.79
Irrig
ation
cha
rges
194.
0715
4.85
4494
.85
4013
.64
182.
0748
9.65
807.
3278
7.18
1963
.44
578.
42In
tere
st o
n w
orki
ng c
apita
l57
6.34
558.
1313
69.8
313
14.9
766
7.78
728.
6186
0.96
844.
4448
0.90
312.
67M
iscel
lane
ous
42.6
081
.96
0.00
0.00
0.00
0.00
0.00
44.7
60.
000.
00Fi
xed
Cost
9198
.02
1027
2.95
1596
9.04
1550
2.36
1344
7.83
1205
6.87
1713
9.86
1652
4.02
1175
4.02
9122
.34
Rent
al v
alue
of o
wne
d la
nd73
68.3
687
16.7
498
20.2
797
04.7
111
124.
1796
40.9
410
999.
7310
623.
2591
43.1
762
13.3
7Re
nt p
aid
for l
ease
d-in
land
0.00
0.00
0.00
0.00
0.00
0.00
2546
.85
2722
.90
128.
840.
00La
nd re
venu
e, c
esse
s & ta
xes
2.69
3.04
27.7
511
.49
24.3
425
.56
0.00
0.00
4.14
4.20
Depr
ecia
tion
on im
plem
ents
& F
arm
bu
ildin
gs46
2.84
281.
3743
9.64
565.
1455
8.33
521.
0747
0.13
478.
6757
1.72
830.
09
Inte
rest
on
fixed
cap
ital
1364
.13
1271
.80
5681
.38
5221
.02
1740
.99
1869
.30
3123
.15
2699
.20
1906
.15
2074
.68
Tota
l Cos
t36
242.
4134
791.
7772
347.
1274
156.
6853
119.
3051
302.
5053
878.
8451
749.
2039
602.
4928
770.
46
Sour
ce: D
ES, D
AC &
FW
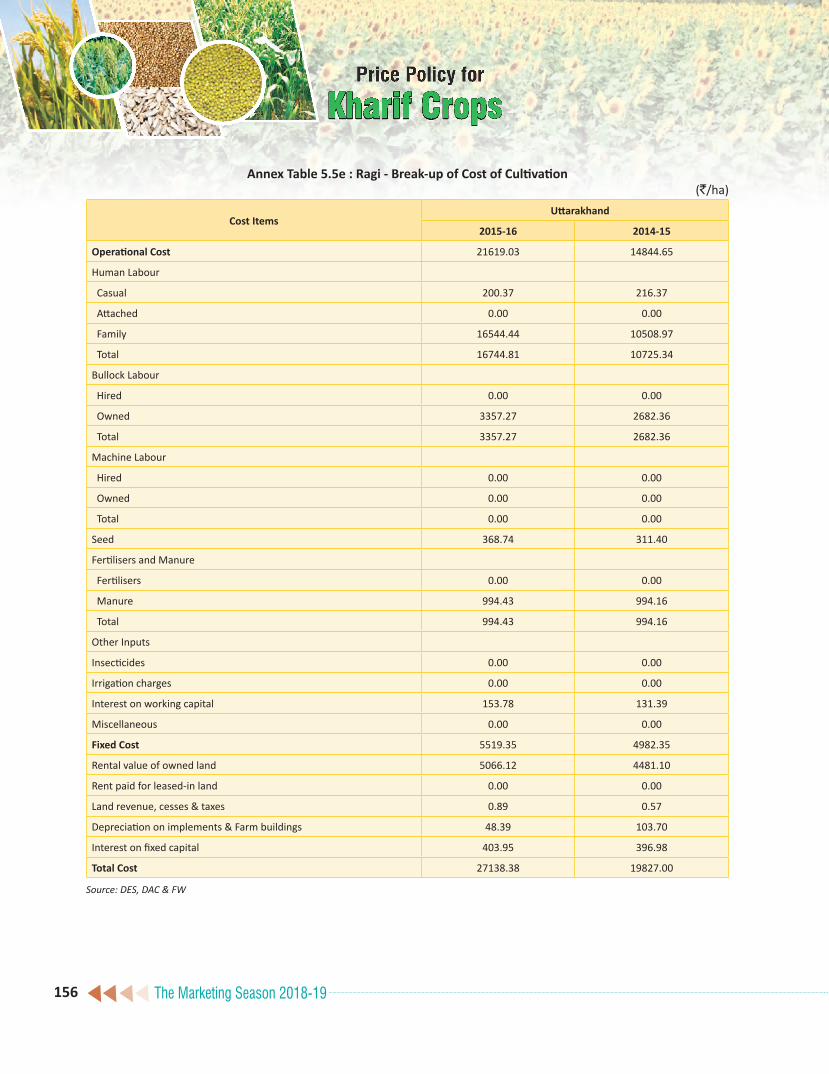
The Marketing Season 2018-19156
Annex Table 5.5e : Ragi - Break-up of Cost of Cultivation (`/ha)
Cost Items Uttarakhand
2015-16 2014-15
Operational Cost 21619.03 14844.65
Human Labour
Casual 200.37 216.37
Attached 0.00 0.00
Family 16544.44 10508.97
Total 16744.81 10725.34
Bullock Labour
Hired 0.00 0.00
Owned 3357.27 2682.36
Total 3357.27 2682.36
Machine Labour
Hired 0.00 0.00
Owned 0.00 0.00
Total 0.00 0.00
Seed 368.74 311.40
Fertilisers and Manure
Fertilisers 0.00 0.00
Manure 994.43 994.16
Total 994.43 994.16
Other Inputs
Insecticides 0.00 0.00
Irrigation charges 0.00 0.00
Interest on working capital 153.78 131.39
Miscellaneous 0.00 0.00
Fixed Cost 5519.35 4982.35
Rental value of owned land 5066.12 4481.10
Rent paid for leased-in land 0.00 0.00
Land revenue, cesses & taxes 0.89 0.57
Depreciation on implements & Farm buildings 48.39 103.70
Interest on fixed capital 403.95 396.98
Total Cost 27138.38 19827.00
Source: DES, DAC & FW

The Marketing Season 2018-19 157
Anne
x Ta
ble
5.5f
: Ar
har (
Tur)
- Br
eak-
up
of C
ost o
f Cul
tivati
on
(`/h
a)
Cost
Item
sAn
dhra
Pra
desh
Guj
arat
Mad
hya
Prad
esh
Mah
aras
htra
Odi
sha
Utt
ar P
rade
sh20
15-1
620
14-1
520
15-1
620
14-1
520
15-1
620
14-1
520
15-1
620
14-1
520
15-1
620
14-1
520
15-1
620
14-1
5O
pera
tiona
l Cos
t25
786.
1025
152.
4431
925.
4531
328.
8924
012.
7818
896.
5555
949.
0340
912.
8013
772.
1812
422.
5523
565.
8220
942.
88Hu
man
Lab
our
Cas
ual
6328
.20
5075
.21
6602
.34
7016
.10
3404
.76
2393
.89
9411
.88
8205
.30
1310
.46
1437
.76
4921
.93
4918
.67
Atta
ched
620.
0052
4.12
0.00
0.00
229.
0938
7.08
659.
3653
6.56
0.00
0.00
44.5
026
.82
Fam
ily49
92.7
048
60.8
510
500.
1884
22.8
980
74.4
274
01.3
816
313.
0889
72.0
879
62.5
871
51.8
792
07.0
210
905.
96 T
otal
1194
0.90
1046
0.18
1710
2.52
1543
8.99
1170
8.27
1018
2.35
2638
4.32
1771
3.94
9273
.04
8589
.63
1417
3.45
1585
1.45
Bullo
ck L
abou
r H
ired
1283
.38
780.
2435
1.75
125.
7824
.22
78.9
516
26.9
413
26.0
549
.79
0.00
0.00
0.00
Ow
ned
2570
.86
2875
.99
2372
.63
2005
.89
4191
.57
2734
.62
4712
.92
3679
.67
2025
.56
1904
.75
2225
.07
338.
98 T
otal
3854
.24
3656
.23
2724
.38
2131
.67
4215
.79
2813
.57
6339
.86
5005
.72
2075
.35
1904
.75
2225
.07
338.
98M
achi
ne L
abou
r H
ired
3703
.41
3241
.70
3795
.65
4468
.28
1358
.10
1682
.90
7032
.81
6266
.42
860.
1357
8.91
2767
.50
2340
.71
Ow
ned
71.4
019
7.66
940.
8165
6.87
275.
7050
3.66
362.
7724
9.59
0.00
0.00
709.
5955
.48
Tot
al37
74.8
134
39.3
647
36.4
651
25.1
516
33.8
021
86.5
673
95.5
865
16.0
186
0.13
578.
9134
77.0
923
96.1
9Se
ed13
34.7
411
25.0
882
5.35
594.
9428
50.1
316
94.6
522
62.6
911
71.2
413
87.6
111
89.5
422
14.3
615
43.3
7Fe
rtilis
ers a
nd M
anur
e F
ertil
isers
2051
.08
3134
.02
2052
.24
2502
.25
1081
.64
773.
4639
39.9
341
75.3
50.
000.
0015
.18
184.
11 M
anur
e33
1.96
1080
.85
537.
7215
89.7
575
3.44
134.
3972
7.52
505.
620.
000.
000.
000.
00 T
otal
2383
.04
4214
.87
2589
.96
4092
.00
1835
.08
907.
8546
67.4
546
80.9
70.
000.
0015
.18
184.
11O
ther
Inpu
tsIn
secti
cide
s16
30.2
116
22.0
518
64.9
017
04.8
810
67.7
672
7.34
5166
.65
3887
.62
0.00
0.00
0.00
0.84
Irrig
ation
cha
rges
158.
263.
7013
16.7
215
47.1
421
6.68
35.5
023
84.5
273
3.64
0.00
0.00
1025
.55
323.
79In
tere
st o
n w
orki
ng c
apita
l63
0.10
614.
9064
9.25
694.
1248
2.98
348.
3412
01.0
996
7.90
176.
0515
9.72
435.
1230
4.15
Misc
ella
neou
s79
.80
16.0
711
5.91
0.00
2.29
0.39
146.
8723
5.76
0.00
0.00
0.00
0.00
Fixe
d Co
st19
234.
9411
306.
1116
039.
8710
562.
6318
443.
9214
536.
9030
294.
1618
488.
7090
53.2
884
75.4
028
816.
6819
769.
71Re
ntal
val
ue o
f ow
ned
land
1597
7.34
9297
.14
1066
7.32
7029
.66
1416
6.70
9057
.68
2191
2.45
9380
.44
5833
.87
5692
.83
2127
4.30
1450
4.57
Rent
pai
d fo
r lea
sed-
in la
nd0.
000.
0019
91.0
277
2.22
0.00
0.00
0.00
0.00
0.00
0.00
604.
920.
00La
nd re
venu
e, c
esse
s & ta
xes
0.12
0.49
53.6
652
.66
7.09
7.80
43.4
442
.70
15.8
716
.84
21.5
49.
97De
prec
iatio
n on
impl
emen
ts &
Fa
rm b
uild
ings
450.
3638
6.10
263.
7335
3.95
1085
.98
1398
.47
978.
6213
57.6
475
9.61
569.
4312
48.0
199
7.77
Inte
rest
on
fixed
cap
ital
2807
.12
1622
.38
3064
.14
2354
.14
3184
.15
4072
.95
7359
.65
7707
.92
2443
.93
2196
.30
5667
.91
4257
.40
Tota
l Cos
t45
021.
0436
458.
5547
965.
3241
891.
5242
456.
7033
433.
4586
243.
1959
401.
5022
825.
4620
897.
9552
382.
5040
712.
59
Sour
ce: D
ES, D
AC &
FW

The Marketing Season 2018-19158
Annex Table 5.5g : Moong - Break-up of Cost of Cultivation (`/ha)
Cost ItemsAndhra Pradesh Gujarat Maharashtra Odisha
2015-16 2014-15 2015-16 2014-15 2015-16 2014-15 2015-16 2014-15
Operational Cost 20138.31 14999.74 21791.59 17451.68 26897.22 23988.22 13499.51 12849.41
Human Labour
Casual 5374.33 3142.79 5807.24 4199.19 5996.04 5708.99 671.47 1732.11
Attached 28.38 937.67 20.61 0.00 192.41 567.22 8.92 18.95
Family 2214.59 3033.39 5659.03 3763.88 7255.79 5585.38 7799.29 6912.14
Total 7617.30 7113.85 11486.88 7963.07 13444.24 11861.59 8479.68 8663.20
Bullock Labour
Hired 1673.55 254.82 608.36 170.10 721.20 672.86 179.61 137.54
Owned 286.68 515.88 260.47 382.43 2874.02 3940.40 1358.09 1007.22
Total 1960.23 770.70 868.83 552.53 3595.22 4613.26 1537.70 1144.76
Machine Labour
Hired 4154.20 2147.04 3699.40 2845.41 4107.87 2044.79 1513.19 1322.51
Owned 0.00 32.05 775.31 1100.61 233.09 125.52 8.98 9.91
Total 4154.20 2179.09 4474.71 3946.02 4340.96 2170.31 1522.17 1332.42
Seed 2382.44 1982.28 2014.75 1602.48 2146.06 1381.52 1704.76 1504.44
Fertilisers and Manure
Fertilisers 2162.80 1782.89 762.67 1012.96 1940.50 1993.91 3.62 3.87
Manure 0.00 471.76 204.98 11.18 205.77 1149.58 0.00 3.83
Total 2162.80 2254.65 967.65 1024.14 2146.27 3143.49 3.62 7.70
Other Inputs
Insecticides 1318.20 90.06 698.51 416.68 422.62 185.37 0.93 0.00
Irrigation charges 0.00 246.49 791.39 1531.98 206.65 75.02 77.92 16.97
Interest on working capital 543.14 362.62 488.87 414.78 595.20 557.66 172.73 179.92
Miscellaneous 0.00 0.00 0.00 0.00 0.00 0.00 0.00 0.00
Fixed Cost 7948.16 10132.83 8661.02 6326.50 8659.62 8013.65 6318.69 6407.66
Rental value of owned land 7631.81 9135.38 7456.52 1803.27 4093.13 4056.45 4702.01 4997.43
Rent paid for leased-in land 0.00 0.00 290.90 3194.07 0.00 0.00 45.35 75.77
Land revenue, cesses & taxes 0.00 39.85 6.67 6.02 26.34 18.67 8.89 12.76
Depreciation on implements & Farm buildings 99.15 145.54 128.88 171.96 600.66 594.50 436.78 336.47
Interest on fixed capital 217.20 812.06 778.05 1151.18 3939.49 3344.03 1125.66 985.23
Total Cost 28086.47 25132.57 30452.61 23778.18 35556.84 32001.87 19818.20 19257.07
Source: DES, DAC & FW

The Marketing Season 2018-19 159
Anne
x Ta
ble
5.5h
: U
rad
- Br
eak-
up
of C
ost o
f Cul
tivati
on
(`/h
a)
Cost
Item
sAn
dhra
Pra
desh
Chha
ttisg
arh
M
adhy
a Pr
ades
hM
ahar
asht
raO
dish
aU
ttar
Pra
desh
2015
-16
2014
-15
2015
-16
2014
-15
2015
-16
2014
-15
2015
-16
2014
-15
2015
-16
2014
-15
2015
-16
2014
-15
Ope
ratio
nal C
ost
1755
0.56
1438
3.28
1999
7.84
2310
9.49
2084
5.23
1689
8.17
2672
8.05
2071
5.66
1357
7.83
1446
8.57
1380
9.27
1412
2.06
Hum
an L
abou
r C
asua
l 76
86.1
868
30.1
367
.84
55.8
831
43.0
526
89.4
435
99.6
328
13.8
454
3.06
1227
.84
2124
.88
1614
.30
Atta
ched
372.
6936
8.64
0.00
0.00
57.7
585
.58
111.
8498
.62
47.4
029
1.04
0.00
0.00
Fam
ily14
96.3
215
34.6
887
72.2
913
312.
9857
59.3
749
38.5
910
256.
1072
16.7
882
03.1
683
66.8
849
91.6
460
24.7
2 T
otal
9555
.19
8733
.45
8840
.13
1336
8.86
8960
.17
7713
.61
1396
7.57
1012
9.24
8793
.62
9885
.76
7116
.52
7639
.02
Bullo
ck L
abou
r H
ired
91.3
029
.16
0.00
0.00
8.27
27.0
435
7.92
427.
2017
1.55
261.
908.
561.
88 O
wne
d18
6.69
255.
0874
02.7
677
87.9
210
52.4
358
3.42
3699
.50
3504
.73
1711
.67
1698
.35
90.5
77.
63 T
otal
277.
9928
4.24
7402
.76
7787
.92
1060
.70
610.
4640
57.4
239
31.9
318
83.2
219
60.2
599
.13
9.51
Mac
hine
Lab
our
Hire
d13
78.8
782
6.46
0.00
0.00
4045
.61
3970
.16
3530
.53
2236
.38
472.
4571
6.39
2897
.27
3520
.72
Ow
ned
37.6
544
.24
0.00
0.00
102.
9617
4.58
344.
9911
24.6
815
.76
0.00
435.
7617
6.99
Tot
al14
16.5
287
0.70
0.00
0.00
4148
.57
4144
.74
3875
.52
3361
.06
488.
2171
6.39
3333
.03
3697
.71
Seed
4638
.96
2880
.01
3414
.78
1061
.47
2683
.30
1633
.10
1884
.80
1394
.16
2249
.91
1721
.27
1899
.10
1299
.14
Ferti
liser
s and
Man
ure
Fer
tilise
rs37
6.21
252.
590.
0059
4.38
1520
.00
1443
.33
1680
.73
1194
.82
0.00
0.00
0.00
18.9
0 M
anur
e25
.41
15.3
50.
000.
0011
27.0
430
1.79
0.00
0.00
0.00
0.00
0.00
0.00
Tot
al40
1.62
267.
940.
0059
4.38
2647
.04
1745
.12
1680
.73
1194
.82
0.00
0.00
0.00
18.9
0O
ther
Inpu
tsIn
secti
cide
s74
8.42
904.
990.
000.
0088
0.49
681.
9762
4.55
295.
400.
000.
0051
5.03
361.
99Irr
igati
on c
harg
es0.
0052
.60
0.00
0.00
0.00
0.00
73.9
90.
000.
000.
0056
9.55
850.
42In
tere
st o
n w
orki
ng c
apita
l48
6.49
389.
3534
0.17
296.
8645
7.15
362.
4149
9.15
409.
0516
2.87
184.
9026
7.20
245.
37M
iscel
lane
ous
25.3
70.
000.
000.
007.
816.
7664
.32
0.00
0.00
0.00
9.71
0.00
Fixe
d Co
st28
863.
3419
143.
8348
67.9
085
40.9
412
877.
8287
40.5
879
18.9
874
08.0
090
65.2
374
89.0
410
911.
7586
19.9
2Re
ntal
val
ue o
f ow
ned
land
2832
5.21
1774
7.31
3644
.38
6588
.92
1145
7.21
7427
.27
5249
.51
3692
.12
7018
.06
5792
.00
8048
.50
6619
.29
Rent
pai
d fo
r lea
sed-
in la
nd15
2.80
137.
150.
000.
000.
000.
000.
000.
0023
.58
0.00
0.00
0.00
Land
reve
nue,
ces
ses &
ta
xes
0.21
1.54
2.72
9.26
3.03
2.81
22.1
720
.97
10.4
014
.30
4.37
2.61
Depr
ecia
tion
on im
plem
ents
&
Far
m b
uild
ings
93.0
586
.68
365.
0053
6.68
473.
5128
4.28
452.
5745
5.93
454.
3437
4.43
341.
0131
4.05
Inte
rest
on
fixed
cap
ital
292.
0711
71.1
585
5.80
1406
.08
944.
0710
26.2
221
94.7
332
38.9
815
58.8
513
08.3
125
17.8
716
83.9
7To
tal C
ost
4641
3.90
3352
7.11
2486
5.74
3165
0.43
3372
3.05
2563
8.75
3464
7.03
2812
3.66
2264
3.06
2195
7.61
2472
1.02
2274
1.98
Sour
ce: D
ES, D
AC &
FW
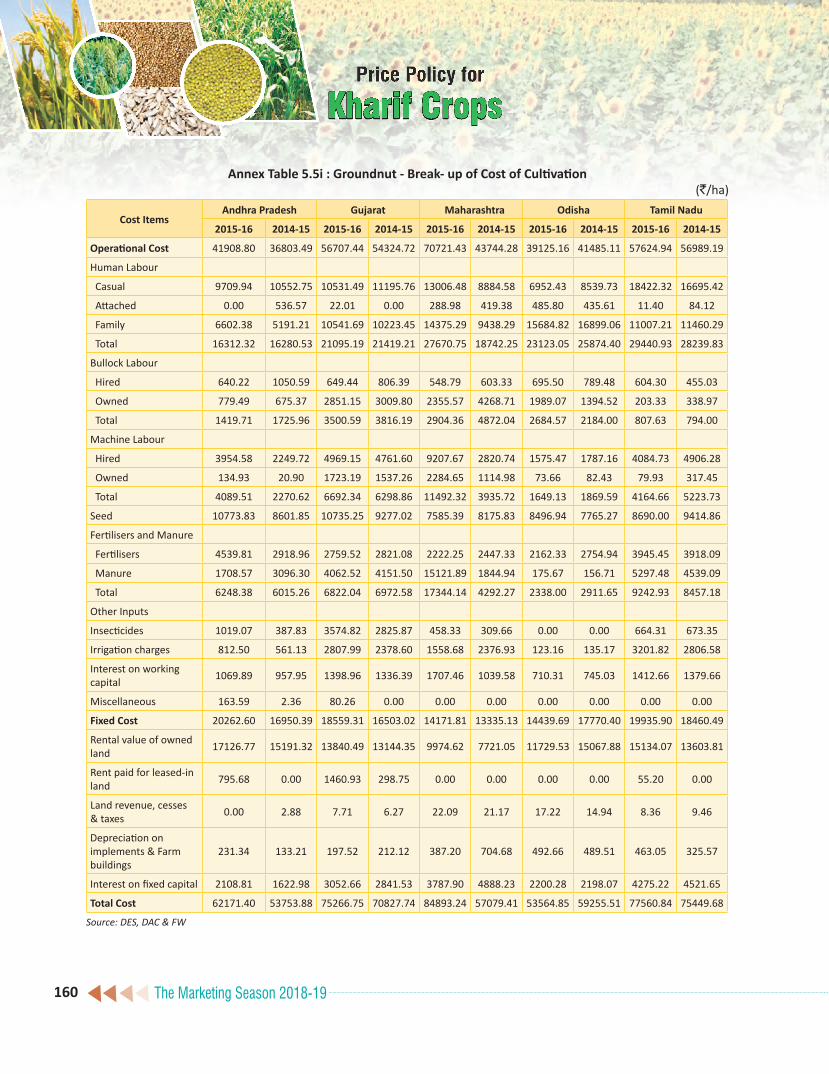
The Marketing Season 2018-19160
Annex Table 5.5i : Groundnut - Break- up of Cost of Cultivation(`/ha)
Cost ItemsAndhra Pradesh Gujarat Maharashtra Odisha Tamil Nadu
2015-16 2014-15 2015-16 2014-15 2015-16 2014-15 2015-16 2014-15 2015-16 2014-15
Operational Cost 41908.80 36803.49 56707.44 54324.72 70721.43 43744.28 39125.16 41485.11 57624.94 56989.19
Human Labour
Casual 9709.94 10552.75 10531.49 11195.76 13006.48 8884.58 6952.43 8539.73 18422.32 16695.42
Attached 0.00 536.57 22.01 0.00 288.98 419.38 485.80 435.61 11.40 84.12
Family 6602.38 5191.21 10541.69 10223.45 14375.29 9438.29 15684.82 16899.06 11007.21 11460.29
Total 16312.32 16280.53 21095.19 21419.21 27670.75 18742.25 23123.05 25874.40 29440.93 28239.83
Bullock Labour
Hired 640.22 1050.59 649.44 806.39 548.79 603.33 695.50 789.48 604.30 455.03
Owned 779.49 675.37 2851.15 3009.80 2355.57 4268.71 1989.07 1394.52 203.33 338.97
Total 1419.71 1725.96 3500.59 3816.19 2904.36 4872.04 2684.57 2184.00 807.63 794.00
Machine Labour
Hired 3954.58 2249.72 4969.15 4761.60 9207.67 2820.74 1575.47 1787.16 4084.73 4906.28
Owned 134.93 20.90 1723.19 1537.26 2284.65 1114.98 73.66 82.43 79.93 317.45
Total 4089.51 2270.62 6692.34 6298.86 11492.32 3935.72 1649.13 1869.59 4164.66 5223.73
Seed 10773.83 8601.85 10735.25 9277.02 7585.39 8175.83 8496.94 7765.27 8690.00 9414.86
Fertilisers and Manure
Fertilisers 4539.81 2918.96 2759.52 2821.08 2222.25 2447.33 2162.33 2754.94 3945.45 3918.09
Manure 1708.57 3096.30 4062.52 4151.50 15121.89 1844.94 175.67 156.71 5297.48 4539.09
Total 6248.38 6015.26 6822.04 6972.58 17344.14 4292.27 2338.00 2911.65 9242.93 8457.18
Other Inputs
Insecticides 1019.07 387.83 3574.82 2825.87 458.33 309.66 0.00 0.00 664.31 673.35
Irrigation charges 812.50 561.13 2807.99 2378.60 1558.68 2376.93 123.16 135.17 3201.82 2806.58
Interest on working capital 1069.89 957.95 1398.96 1336.39 1707.46 1039.58 710.31 745.03 1412.66 1379.66
Miscellaneous 163.59 2.36 80.26 0.00 0.00 0.00 0.00 0.00 0.00 0.00
Fixed Cost 20262.60 16950.39 18559.31 16503.02 14171.81 13335.13 14439.69 17770.40 19935.90 18460.49
Rental value of owned land 17126.77 15191.32 13840.49 13144.35 9974.62 7721.05 11729.53 15067.88 15134.07 13603.81
Rent paid for leased-in land 795.68 0.00 1460.93 298.75 0.00 0.00 0.00 0.00 55.20 0.00
Land revenue, cesses & taxes 0.00 2.88 7.71 6.27 22.09 21.17 17.22 14.94 8.36 9.46
Depreciation on implements & Farm buildings
231.34 133.21 197.52 212.12 387.20 704.68 492.66 489.51 463.05 325.57
Interest on fixed capital 2108.81 1622.98 3052.66 2841.53 3787.90 4888.23 2200.28 2198.07 4275.22 4521.65
Total Cost 62171.40 53753.88 75266.75 70827.74 84893.24 57079.41 53564.85 59255.51 77560.84 75449.68
Source: DES, DAC & FW

The Marketing Season 2018-19 161
Annex Table 5.5j : Soybean - Break-up of Cost of Cultivation(`/ha)
Cost ItemsAndhra Pradesh Chhattisgarh Madhya Pradesh Maharashtra
2015-16 2014-15 2015-16 2014-15 2015-16 2014-15 2015-16 2014-15
Operational Cost 32559.47 27650.92 20388.21 15593.14 24119.25 23545.09 31677.48 35324.19
Human Labour
Casual 3519.87 3779.12 3256.25 2530.87 2818.06 2850.95 6308.45 6999.31
Attached 1063.03 1241.67 0.00 0.00 79.96 90.93 402.09 345.66
Family 6515.66 4049.74 5988.07 3524.68 4907.61 4407.28 5150.35 4333.31
Total 11098.56 9070.53 9244.32 6055.55 7805.63 7349.16 11860.89 11678.28
Bullock Labour
Hired 112.73 118.59 71.19 0.00 66.01 78.54 1045.22 1183.84
Owned 2849.38 1750.66 1001.84 200.67 621.03 614.56 2668.12 2970.56
Total 2962.11 1869.25 1073.03 200.67 687.04 693.10 3713.34 4154.40
Machine Labour
Hired 3906.11 4257.14 3830.27 3964.46 4528.22 4321.91 4535.80 5652.01
Owned 398.49 81.72 0.00 308.70 337.89 486.06 682.35 277.37
Total 4304.60 4338.86 3830.27 4273.16 4866.11 4807.97 5218.15 5929.38
Seed 3853.61 3550.80 4319.51 4247.38 4425.95 4991.50 4636.33 6230.86
Fertilisers and Manure
Fertilisers 6565.00 3560.92 573.06 315.94 1922.99 1745.97 2713.43 2943.42
Manure 374.66 2546.51 0.00 0.00 1490.85 1213.10 1259.72 1976.32
Total 6939.66 6107.43 573.06 315.94 3413.84 2959.07 3973.15 4919.74
Other Inputs
Insecticides 2565.21 1956.10 911.65 134.73 1772.87 1741.18 825.35 1265.73
Irrigation charges 46.51 41.26 0.00 0.00 85.13 0.22 527.88 202.78
Interest on working capital 789.21 715.19 436.37 365.71 582.17 579.93 803.85 939.12
Miscellaneous 0.00 1.50 0.00 0.00 480.51 422.96 118.54 3.90
Fixed Cost 9722.41 12670.36 5818.20 8353.27 6818.31 11440.29 11564.08 9836.04
Rental value of owned land 6934.63 10144.82 4443.58 6854.53 4439.29 9548.75 5520.54 5356.65
Rent paid for leased-in land 0.00 0.00 0.00 0.00 0.00 0.00 0.00 0.00
Land revenue, cesses & taxes 1.18 0.06 2.26 2.12 3.40 3.50 26.76 21.91
Depreciation on implements & Farm buildings 498.43 373.30 407.61 345.04 552.69 423.05 623.36 708.73
Interest on fixed capital 2288.17 2152.18 964.75 1151.58 1822.93 1464.99 5393.42 3748.75
Total Cost 42281.88 40321.28 26206.41 23946.41 30937.56 34985.38 43241.56 45160.23
Source: DES, DAC & FW

The Marketing Season 2018-19162
Annex Table 5.5k : Sunflower - Break-up of Cost of Cultivation (`/ha)
Cost ItemsAndhra Pradesh
2015-16 2014-15
Operational Cost 32886.34 23462.97
Human Labour
Casual 6820.77 5345.92
Attached 0.00 0.00
Family 8908.34 2215.35
Total 15729.11 7561.27
Bullock Labour
Hired 333.60 784.50
Owned 3230.82 1862.20
Total 3564.42 2646.70
Machine Labour
Hired 3216.80 4120.15
Owned 23.79 131.77
Total 3240.59 4251.92
Seed 3665.99 2572.80
Fertilisers and Manure
Fertilisers 4644.39 3907.29
Manure 602.61 1142.99
Total 5247.00 5050.28
Other Inputs
Insecticides 388.40 624.40
Irrigation charges 252.48 0.00
Interest on working capital 726.61 643.87
Miscellaneous 71.74 111.73
Fixed Cost 12844.17 8907.98
Rental value of owned land 6824.09 6188.79
Rent paid for leased-in land 2760.81 0.00
Land revenue, cesses & taxes 0.00 0.00
Depreciation on implements & Farm buildings 102.35 384.44
Interest on fixed capital 3156.92 2334.75
Total Cost 45730.51 32370.95
Source: DES, DAC & FW

The Marketing Season 2018-19 163
Anne
x Ta
ble
5.5l
: Se
sam
um -
Brea
k-up
of C
ost o
f Cul
tivati
on(`
/ha)
Cost
Item
sAn
dhra
Pra
desh
Guj
arat
Mad
hya
Prad
esh
Odi
sha
Utt
ar P
rade
shW
est B
enga
l20
15-1
620
14-1
520
15-1
620
14-1
520
15-1
620
14-1
520
15-1
620
14-1
520
15-1
620
14-1
520
15-1
620
14-1
5O
pera
tiona
l Cos
t23
211.
3619
146.
4025
441.
3028
683.
5418
653.
0916
594.
5418
146.
4816
221.
9690
56.9
913
290.
5626
274.
5828
704.
69Hu
man
Lab
our
Cas
ual
8206
.08
5124
.67
5866
.98
8884
.53
5070
.12
3308
.06
4301
.59
2567
.03
2494
.11
3904
.13
8850
.53
1061
8.11
Atta
ched
0.00
10.4
80.
000.
0012
.10
0.00
0.00
0.00
0.00
44.5
04.
520.
00 F
amily
3150
.08
4210
.73
7838
.12
6567
.32
5073
.59
6989
.98
7919
.03
9144
.57
3447
.06
5520
.89
7942
.82
7854
.25
Tot
al11
356.
1693
45.8
813
705.
1015
451.
8510
155.
8110
298.
0412
220.
6211
711.
6059
41.1
794
69.5
216
797.
8718
472.
36Bu
llock
Lab
our
Hire
d35
3.47
782.
2012
1.75
169.
6222
.89
16.0
20.
0013
.23
0.00
0.00
350.
0061
1.08
Ow
ned
169.
5812
18.5
549
4.21
294.
6461
.41
54.0
818
59.8
094
6.64
0.78
76.7
329
8.37
873.
20 T
otal
523.
0520
00.7
561
5.96
464.
2684
.30
70.1
018
59.8
095
9.87
0.78
76.7
364
8.37
1484
.28
Mac
hine
Lab
our
Hire
d39
31.5
632
71.1
214
19.9
320
37.6
040
85.8
130
18.2
015
21.8
517
47.7
118
75.8
926
95.3
036
70.8
719
58.0
3 O
wne
d10
7.35
95.9
315
78.8
997
9.58
122.
5316
4.55
0.00
0.00
361.
7215
7.13
23.0
610
6.38
Tot
al40
38.9
133
67.0
529
98.8
230
17.1
842
08.3
431
82.7
515
21.8
517
47.7
122
37.6
128
52.4
336
93.9
320
64.4
1Se
ed11
65.0
810
19.8
110
87.4
711
79.2
9 13
75.1
110
41.6
877
9.68
789.
9235
6.90
488.
7945
7.72
499.
18Fe
rtilis
ers a
nd M
anur
e F
ertil
isers
3420
.15
1386
.24
2611
.67
2949
.30
1772
.47
1431
.52
220.
6221
3.38
43.1
574
.39
2922
.85
3786
.56
Man
ure
587.
9742
8.69
1107
.32
834.
0341
7.00
0.00
0.00
0.00
0.00
0.00
358.
9937
.50
Tot
al40
08.1
218
14.9
337
18.9
937
83.3
321
89.4
714
31.5
222
0.62
213.
3843
.15
74.3
932
81.8
438
24.0
6O
ther
Inpu
tsIn
secti
cide
s11
50.4
410
11.7
010
77.9
016
13.4
272
.90
0.00
0.00
0.00
37.0
273
.53
190.
6323
4.93
Irrig
ation
cha
rges
291.
5813
3.68
1703
.62
2504
.03
0.00
0.00
1233
.99
585.
0226
8.97
19.7
364
8.71
1493
.64
Inte
rest
on
wor
king
cap
ital
607.
9245
2.60
533.
4467
0.18
411.
5029
1.05
309.
9221
4.46
170.
0023
5.44
555.
5163
1.83
Misc
ella
neou
s70
.10
0.00
0.00
0.00
155.
6627
9.40
0.00
0.00
1.39
0.00
0.00
0.00
Fixe
d Co
st80
51.8
510
492.
5512
343.
4410
675.
7284
59.0
512
547.
0391
01.2
784
72.3
392
10.4
213
056.
4110
319.
5812
796.
41Re
ntal
val
ue o
f ow
ned
land
7386
.48
9884
.50
9177
.78
8765
.05
7215
.87
1181
6.12
7185
.81
6802
.44
5147
.27
9239
.25
8577
.99
1075
0.61
Rent
pai
d fo
r lea
sed-
in la
nd0.
000.
0012
86.3
125
0.55
0.00
0.00
136.
550.
0019
71.7
20.
000.
000.
00La
nd re
venu
e, c
esse
s & ta
xes
0.00
0.00
3.42
3.96
7.36
3.84
8.66
13.1
03.
744.
4742
.51
55.8
7De
prec
iatio
n on
impl
emen
ts &
Fa
rm b
uild
ings
152.
8713
5.60
93.7
111
7.85
243.
2212
7.30
332.
8932
5.35
340.
7355
3.42
539.
3850
8.63
Inte
rest
on
fixed
cap
ital
512.
5047
2.45
1782
.22
1538
.31
992.
6059
9.77
1437
.36
1331
.44
1746
.96
3259
.27
1159
.70
1481
.30
Tota
l Cos
t31
263.
2129
638.
9537
784.
7439
359.
2627
112.
1429
141.
5727
247.
7524
694.
2918
267.
4126
346.
9736
594.
1641
501.
10
Sour
ce: D
ES, D
AC &
FW

The Marketing Season 2018-19164
Annex Table 5.5m : Nigerseed - Break-up of Cost of Cultivation(`/ha)
Cost ItemsChhattisgarh Madhya Pradesh Odisha
2015-16 2015-16 2014-15 2015-16 2014-15
Operational Cost 19891.39 16494.07 13129.13 13720.67 11662.53
Human Labour
Casual 0.00 1851.31 1164.00 0.00 0.00
Attached 0.00 577.83 0.00 0.00 0.00
Family 6433.58 5623.96 4955.14 8052.05 6661.54
Total 6433.58 8053.10 6119.14 8052.05 6661.54
Bullock Labour
Hired 0.00 449.54 768.00 0.00 0.00
Owned 11250.00 2713.52 3936.69 4896.84 4349.44
Total 11250.00 3163.06 4704.69 4896.84 4349.44
Machine Labour
Hired 0.00 2752.04 400.00 0.00 0.00
Owned 0.00 0.00 0.00 0.00 0.00
Total 0.00 2752.04 400.00 0.00 0.00
Seed 1800.00 551.16 268.80 600.00 500.00
Fertilisers and Manure
Fertilisers 0.00 397.67 268.80 0.00 0.00
Manure 0.00 1247.64 1120.00 0.00 0.00
Total 0.00 1645.31 1388.80 0.00 0.00
Other Inputs
Insecticides 0.00 0.00 0.00 0.00 0.00
Irrigation charges 0.00 0.00 0.00 0.00 0.00
Interest on working capital 407.81 329.40 247.70 171.78 151.55
Miscellaneous 0.00 0.00 0.00 0.00 0.00
Fixed Cost 5401.11 6661.02 4849.02 5860.15 4361.24
Rental value of owned land 3200.00 5932.34 2616.00 3543.62 2542.61
Rent paid for leased-in land 0.00 0.00 0.00 0.00 0.00
Land revenue, cesses & taxes 0.00 1.23 1.54 10.00 10.00
Depreciation on implements & Farm buildings 593.83 270.23 693.64 422.82 669.30
Interest on fixed capital 1607.28 457.22 1537.84 1883.71 1139.33
Total Cost 25292.50 23155.09 17978.15 19580.82 16023.77
Source: DES, DAC & FW

The Marketing Season 2018-19 165
Anne
x Ta
ble
5.5n
: Co
tton
-- B
reak
-up
of C
ost o
f Cul
tivati
on(`
/ha)
Cost
Item
sAn
dhra
Pra
desh
Guj
arat
Hary
ana
Mad
hya
Prad
esh
Mah
aras
htra
Odi
sha
Punj
abTa
mil
Nad
u
2015
-16
2014
-15
2015
-16
2014
-15
2015
-16
2014
-15
2015
-16
2014
-15
2015
-16
2014
-15
2015
-16
2014
-15
2015
-16
2014
-15
2015
-16
2014
-15
Ope
ratio
nal C
ost
5227
9.97
5603
8.71
5347
2.88
5532
3.05
4239
2.66
4478
3.67
6139
8.05
5829
8.76
5686
3.51
5389
6.51
4687
4.77
3498
6.34
4269
1.03
4524
2.55
7723
3.58
6944
3.06
Hum
an L
abou
r
Cas
ual
1815
7.96
1901
5.94
1548
8.84
1553
2.50
5256
.79
8351
.49
9121
.26
8502
.08
1449
2.86
1399
5.05
8045
.56
5862
.24
7593
.87
1266
8.07
3107
3.93
2427
9.80
Atta
ched
516.
2437
2.71
142.
3513
9.83
538.
8242
2.08
793.
6479
5.65
688.
4572
4.23
0.00
1129
.35
1691
.73
1760
.15
7.35
11.3
8
Fam
ily73
25.8
811
081.
4411
059.
9111
518.
2117
019.
0615
252.
5819
843.
9216
642.
7810
783.
9289
45.2
021
555.
5413
552.
9985
50.1
188
63.2
219
827.
6721
646.
56
Tot
al26
000.
0830
470.
0926
691.
1027
190.
5422
814.
6724
026.
1529
758.
8225
940.
5125
965.
2323
664.
4829
601.
1020
544.
5817
835.
7123
291.
4450
908.
9545
937.
74
Bullo
ck L
abou
r
Hire
d19
38.9
116
25.8
957
2.84
600.
5528
.63
22.7
631
4.38
449.
9014
31.7
414
79.1
914
3.04
82.4
70.
001.
8411
0.50
104.
60
Ow
ned
4839
.98
2429
.12
1154
.14
1147
.29
878.
9249
1.51
7371
.16
6352
.25
5396
.58
5829
.48
3302
.02
2022
.41
218.
6819
7.29
933.
2937
.22
Tot
al67
78.8
940
55.0
117
26.9
817
47.8
490
7.55
514.
2776
85.5
468
02.1
568
28.3
273
08.6
734
45.0
621
04.8
821
8.68
199.
1310
43.7
914
1.82
Mac
hine
Lab
our
Hire
d39
19.0
243
03.3
541
35.0
741
92.7
316
33.2
721
99.0
518
87.3
322
37.3
636
58.4
536
04.4
121
71.5
718
91.5
812
73.0
816
40.3
040
77.7
440
48.5
2
Ow
ned
157.
8044
2.07
1626
.29
1904
.96
2386
.55
2581
.26
168.
3618
8.81
718.
7741
2.35
0.00
140.
2343
58.1
641
03.1
050
.90
93.1
9
Tot
al40
76.8
247
45.4
257
61.3
660
97.6
940
19.8
247
80.3
120
55.6
924
26.1
743
77.2
240
16.7
621
71.5
720
31.8
156
31.2
457
43.4
041
28.6
441
41.7
1
Seed
4193
.44
4106
.40
3365
.75
3375
.28
4221
.40
4626
.60
2424
.44
2388
.31
3982
.20
3789
.36
3096
.56
2853
.82
5754
.13
5692
.80
4040
.12
3616
.80
Ferti
liser
s and
Man
ure
Fer
tilise
rs62
51.8
367
01.8
851
37.4
153
19.6
632
46.8
632
06.4
838
18.4
744
59.9
363
01.3
766
61.5
753
22.8
055
03.7
136
59.4
530
59.1
184
08.6
978
76.3
8
Man
ure
608.
6264
3.05
2681
.63
3365
.17
0.00
0.00
4681
.87
6065
.35
2302
.19
2588
.03
1479
.86
1092
.43
104.
4331
.29
3073
.33
2627
.17
Tot
al68
60.4
573
44.9
378
19.0
486
84.8
332
46.8
632
06.4
885
00.3
410
525.
2886
03.5
692
49.6
068
02.6
665
96.1
437
63.8
830
90.4
011
482.
0210
503.
55
Oth
er In
puts
Inse
ctici
des
2806
.99
3451
.85
3428
.20
3541
.82
2763
.31
2360
.10
5943
.60
4828
.61
2455
.87
2152
.27
990.
5720
5.61
7696
.37
5122
.63
3118
.13
2733
.68
Irrig
ation
cha
rges
187.
10
501.
03
3367
.76
3357
.62
3637
.59
4273
.53
1518
.99
1656
.81
2801
.58
2318
.86
0.00
0.
0061
0.75
61
5.46
622.
33
850.
69
Inte
rest
on
wor
king
ca
pita
l13
62.2
5 13
62.3
4 12
85.2
4 13
27.4
376
8.90
89
4.88
1259
.22
1262
.30
1396
.35
1362
.16
767.
25
649.
5010
34.5
7 11
02.4
017
39.5
7 14
48.3
8
Misc
ella
neou
s13
.95
1.64
27
.45
0.00
12.5
6 10
1.35
2251
.41
2468
.62
453.
18
34.3
50.
00
0.00
145.
70
384.
8915
0.03
68
.69
Fixe
d Co
st21
381.
7523
798.
9117
775.
4617
948.
6720
641.
7020
121.
2420
415.
2918
533.
2618
998.
1918
494.
6715
152.
1693
60.9
815
599.
2331
535.
0620
520.
5719
549.
64
Rent
al v
alue
of o
wne
d la
nd18
023.
7119
513.
8412
072.
8112
008.
96 1
1697
.56
1535
8.71
140
81.6
312
733.
59 1
1341
.08
1023
8.60
128
25.4
771
22.6
0 96
00.1
421
124.
76 1
4892
.05
1435
4.03
Rent
pai
d fo
r lea
sed-
in
land
38.3
317
9.66
1343
.35
1464
.28
0.00
0.00
0.
000.
00
0.00
0.00
0.
000.
00
3120
.04
7452
.86
0.00
0.00
Land
reve
nue,
ces
ses
& ta
xes
0.05
0.31
15.5
212
.66
0.00
0.00
2.
582.
7930
.43
31.6
7 17
.24
17.0
2 0.
000.
00
7.09
8.86
Depr
ecia
tion
on
impl
emen
ts &
Far
m
build
ings
470.
0451
2.29
250.
0127
0.15
784.
5831
1.68
1397
.03
973.
1175
5.90
959.
3973
1.03
651.
4223
7.51
227.
6677
7.85
460.
71
Inte
rest
on
fixed
cap
ital
2849
.62
3592
.81
4093
.77
4192
.62
8159
.56
4450
.85
4934
.05
4823
.77
6870
.78
7265
.01
1578
.42
1569
.94
2641
.54
2729
.78
4843
.58
4726
.04
Tota
l Cos
t73
661.
7279
837.
6271
248.
3473
271.
7263
034.
3664
904.
9181
813.
3476
832.
0275
861.
7072
391.
1862
026.
9344
347.
3258
290.
2676
777.
6197
754.
1588
992.
70
Sour
ce: D
ES, D
AC &
FW

The Marketing Season 2018-19166
Annex Table 5.6 : Comparision of Cost Projections (C2) of Kharif Crops during Marketing Season 2018-19
Crop/StateState Projections* CACP Projections on the basis of CS data
Yield (qtl/ha) Cost of Production (`/qtl) Yield (qtl/ha) Cost of Production (`/qtl)
Paddy
Bihar 38 1605 28 1398
Chattisgarh 36 1110 32 1381
Odisha 36 2344 34 1713
Punjab 59 2490 67 1174
Bajra
Rajasthan - 1188 11 1159
Maize
Bihar 32 1568 32 1117
Rajasthan - 1558 20 1977
Chattisgarh 30 715 NP NP
Tur
Chattisgarh 8 3078 NP NP
Moong
Rajasthan - 5316 4 6025
Tamil Nadu 8 5928 6 5101
Urad
Rajasthan - 2875 NP NP
Groundmut
Chattisgarh 15 2061 NP NP
Soyabean
Rajasthan - 2219 9 2963
Chattisgarh 1010
2155 7 3476
Sesamum
Rajasthan - 6101 2 7174
Cotton
Punjab 19 6745 17 4419
Rajasthan - 3173 20 3574
NP: Not Projected due to non-availability of CS estimates.*Data compiled from state replies

The Marketing Season 2018-19 167
Annex Table 5.7: All-India Projected Costs of Production of Kharif Crops for Marketing Season 2018-19 over Marketing Season 2017-18
Crops
Cost of Production (`/qtl) Percentage Change in Projected Cost (2018-19 over 2017-18)
2017-18 2018-19
A2+FL C2 A2+FL C2 A2+FL C2
Paddy 1117 1484 1166 1560 4.4 5.1
Jowar 1556 2089 1619 2183 4.0 4.5
Bajra 949 1278 990 1324 4.3 3.6
Maize 1044 1396 1131 1480 8.3 6.0
Ragi 1861 2351 1931 2370 3.8 0.8
Arhar (Tur) 3318 4612 3432 4981 3.4 8.0
Moong 4286 5700 4650 6161 8.5 8.1
Urad 3265 4517 3438 4989 5.3 10.4
Groundnut 3159 4089 3260 4186 3.2 2.4
Soybean 2121 2921 2266 2972 6.8 1.8
Sunflower 3481 4526 3592 4501 3.2 -0.6
Sesamum 4067 5706 4166 6053 2.4 6.1
Nigerseed 3912 5108 3918 5135 0.2 0.5
Cotton 3276 4376 3433 4514 4.8 3.1
Source: CACP calculations using CS data
The Marketing Season 2018-19168

Top Related
Copyright © 2022 FDOKUMEN

