


Bahasa
Halaman
Hukum


This journal is c The Royal Society of Chemistry and the Centre National de la Recherche Scientifique 2012 New J. Chem.
Cite this: DOI: 10.1039/c2nj40151g
a-Fe2O3 nanoparticles anchored on graphene with 3D quasi-laminated
architecture: in situ wet chemistry synthesis and enhanced
electrochemical performance for lithium ion batteriesw
Dezhi Chen,ab Wei Wei,a Ruining Wang,a Jingchao Zhua and Lin Guo*a
Received (in Victoria, Australia) 1st March 2012, Accepted 3rd May 2012
DOI: 10.1039/c2nj40151g
A novel a-Fe2O3/graphene composite is prepared by a simple in situ wet chemistry approach.
The a-Fe2O3 particles with diameter around 130 nm are homogeneously anchored on graphene
nanosheets to form a 3D quasi-laminated architecture. Such a well-organized flexible structure
can offer sufficient void space to facilitate the electrolyte penetration, alleviate the effect of the
volume change of a-Fe2O3 particles and avoid particle–particle aggregation during lithium
insertion/desertion. In addition, graphene not only improves the electric conductivity of the
composite electrode but also maintains the structural integrity of the composite electrode during
long-term cycling. As anode material for Li-ion batteries, the a-Fe2O3/graphene composite
electrode exhibits a stable capacity of 742 mAh g�1 up to 50 cycles. The synthesis technique is
suitable for practical large-scale production of graphene-based metal oxide composites as
advanced electrode materials for rechargeable Li-ion batteries.
1. Introduction
Lithium-ion batteries (LIBs) are some of the most popular
types of rechargeable batteries for portable electronics. In
addition, LIBs are also growing in popularity for military,
electric vehicle and aerospace applications. In order to meet
the ever-growing need for high capacity and high power, it
urgently demands numerous efforts to develop new high-
performance electrode materials for next-generation LIBs.1–4
As a new class of promising anodematerial for high energy density
LIBs, transition-metal oxides have been widely investigated
since 2000.5 In comparison with the conventional graphite
anodes (372 mAh g�1), these oxide electrodes have shown
higher theoretical Li-ion storage capacity (4500 mAh g�1).6
Among these potential anode materials, hematite (a-Fe2O3),
the most stable form of iron oxides, has attracted considerable
attention due to its low-cost, environmental-friendliness, natural
abundance and high theoretical capacity of 1007 mAh g�1 (6 mol
of Li per mole of a-Fe2O3).7–11 However, similar to most of the
transition-metal oxides, a-Fe2O3 also suffers from low reversible
capacity and poor cycling performance in practical cells
because a-Fe2O3 typically breaks into small metal clusters,
leading to a large volume change, the crumbling of active
materials and conduction network breakage during repeated
lithium uptake and removal reactions.10,12,13 The strategy of
preparing composites with nanostructure carbon-based materials
had been proposed to circumvent these obstacles and achieve
good cyclic performance as well as to maintain high specific
capacity.7,9,14–16 Herein, these carbon materials can effectively
buffer the strain from the volume change, improve the structural
stability of the electrode, increase the electrical conductivity, and
enhance electrochemical Li-ion storage performance.16 As the
new star in nanostructure carbon materials, graphene, a single
atomic layer of carbon connected by sp2 hybridized bonds, has
received intense attention for its unique properties such as
superior electrical conductivity, excellent mechanical flexibility,
large surface area and high thermal stability.17–22 Graphene-
based composites with transition-metal oxides, such as
Co3O4,23 Mn3O4,
24 NiO,25 CuO,26 Fe3O4,27 and TiO2,
28 have
been fabricated to prepare anode materials for rechargeable
LIBs. These composites showed high reversible capacity, long
cycle life, and good rate performance owing to their spectacular
electrochemical and physical properties along with the combined
virtues between the heterogeneous components.
Recently, the design and fabrication of three-dimensional
multifunctional architectures from the appropriate nanoscale
building blocks have been attracting increasing attention and
enriching ‘‘bottom-up’’ approaches toward future electrode
materials.29 Braun and co-authors30 reported that cathodes
made from a self-assembled three-dimensional bicontinuous
nanoarchitecture consisting of an electrolytically active material
sandwiched between rapid ion and electron transport pathways
have very large battery charge and discharge rates with minimal
a School of Chemistry and Environment, Beihang University, Beijing100191, People’s Republic of China. E-mail: [email protected];Fax: +86-10-82338162; Tel: +86-10-82338162
b School of Environmental and Chemical Engineering, NanchangHangkong University, Nanchang 330063, People’s Republic of China
w Electronic supplementary information (ESI) available. See DOI:10.1039/c2nj40151g
NJC Dynamic Article Links
www.rsc.org/njc PAPER
Dow
nloa
ded
on 1
4 Ju
ne 2
012
Publ
ishe
d on
11
May
201
2 on
http
://pu
bs.r
sc.o
rg |
doi:1
0.10
39/C
2NJ4
0151
GView Online / Journal Homepage
New J. Chem. This journal is c The Royal Society of Chemistry and the Centre National de la Recherche Scientifique 2012
capacity loss. Mullen et al.31 reported that graphene-based nano-
sheets with a sandwich structure can significantly improve the
electrochemical performance due to their favorable structures.
Graphene-encapsulated Fe3O4 nanoparticles with 3D laminated
structure exhibited a stable capacity of 650 mAh g�1 with no
noticeable fading for up to 100 cycles.32 However, the composite of
graphene-based nanosheets and a-Fe2O3 with 3D hierarchical
structure has not been reported via a simple in situ wet
chemistry method up to now. Although the excellent electro-
chemical performance of graphene-based a-Fe2O3 composites
has been achieved by the hydrothermal/solvothermal methods
and the microwave irradiation synthesis,33–39 other simple
synthetic methods of graphene-based composite are still worth
developing. Furthermore, although the graphene-based 2D
templates have provided a well-defined functionalized surface
for good distribution of nanoparticles, the graphene-based
composites are randomly stacked to make electrodes, inevitably
leading to the particle–particle aggregation40 and reducing the
reversible capacity after multiple cycles.35,38,41 Hence, in the present
work, we demonstrate a simple strategy to achieve optimum
electrochemical properties by constructing a 3D quasi-laminated
architecture from self-assembly of a-Fe2O3 and graphene nano-
sheets by the aid of surfactant under atmospheric pressure. In
comparison with the bare a-Fe2O3, the novel a-Fe2O3/graphene
composite electrode delivers a stable reversible capacity of
742mAh g�1 up to 50 cycles as anodematerial for LIBs. The simple
in situ wet chemistry approach presents operational simplicity and
capability for a large-scale production of graphene-based metal
oxide composites as electrode materials for LIBs.
2. Experimental section
2.1 Preparation of a-Fe2O3/graphene composite
All of the reagents were of analytical grade and were used
without further purification. Deionized (DI) water was used in
all experiments. Graphite oxide was synthesized from natural
graphite powder (499.8%, Alfa Aesar) by a modified Hummers
method.42–44 In a typical synthesis of the composite, 50mg graphite
oxide was first dispersed in 50 mL of deionized water at room
temperature by ultrasonication (500 W) for 1 hour. Then other
50 mL of deionized water containing 0.555 g polyvinylpyrrolidone
(PVP, K30, Fluka) and 0.005 mol iron chloride hexahydrate
(FeCl3�6H2O) was added to the graphene oxide suspension with
constant stirring. Following this, the hybrid solution was gradually
heated to 100 1C from room temperature (about 10 min) in an oil
bath under magnetic stirring by open reflux condensation mode.
Afterward, 0.5 mL of hydrazine monohydrate liquid (N2H4�H2O,
80%) was added into the mixture dropwise. The reaction was
continued for 24 h at 100 1C. Finally, the black mixture was
collected by centrifugation. After washing with adequate deionized
water and ethanol to remove the PVP and residual N2H4�H2O, the
a-Fe2O3/graphene composite was obtained by drying at 80 1C for
24 h. The bare a-Fe2O3 (ESIw, Fig. S1) nanoparticles were preparedusing the same procedure in the absence of graphene oxide.
2.2 Characterization
XRD analyses were carried out on an X-ray diffractometer
(D/MAX-1200, Rigaku Denki Co. Ltd., Japan). The XRD
patterns with Cu Ka radiation (l= 1.5406 A) at 40 kV and
40 mA were recorded in the range of 2y =151–651. The XRD
specimens were prepared by means of flattening the powder on
the small slides. Scanning electron microscope images were
achieved by a FEI Quanta 250 field-emission gun environ-
mental scanning electron microscope at 10 kV with the
samples obtained from the thick suspension dropping on the
silicon slice. Transmission Electron Microscopy images were
obtained using a JEM-2100F transmission electron micro-
scope (JEOL Ltd., Japan) operated at 200 kV. Raman spectra
were recorded from 200 to 1900 cm�1 on a LabRAM HR800
Laser Raman spectroscope (HORIBA Jobin Yvon CO. Ltd.,
France) using a 632.5 nm argon ion laser. All samples were
deposited on silicon wafers in powder form without using any
solvent. Thermogravimetric analysis was performed in air
using a Pyris Diamond TG analyzer (PerkinElemer Inc.,
U.S.A.). The samples were heated from 50 1C to 700 1C at
10 1C min�1. Fourier transform infrared (FT-IR) spectra of the
samples were recorded on an Avatar 360 spectrophotometer
(Thermo Nicolet, U.S.A.). The test specimens were prepared by
the KBr disk method.
2.3 Electrochemical measurements
The electrochemical properties of the bare a-Fe2O3 particle
and the a-Fe2O3/graphene composite as anode materials in
lithium ion cells were evaluated by a galvanostatic charge/
discharge technique. The test electrodes were prepared by
mixing 80 wt% active material with 10 wt% carbon black
and 10 wt% polyvinylidene fluoride (PVDF) dissolved in
N-methyl-2-pyrrolidone (NMP) to form a slurry, which was
then coated onto copper foil (current collector), dried at 80 1C
for 10 h. Then, the copper foil was punched into small disks
with diameter of 14 mm. The mass loading is around 2.0 mg.
CR2016 type coin cells were finally assembled in a highly-pure
argon-filled glovebox using the test electrodes and the metallic
lithium counter/reference electrode, a polypropylene separator
(Celgard 2400) and an electrolyte of 1 mol L�1 LiPF6 in ethylene
carbonate and diethyl carbonate (EC/DMC, 1/1 vol) (Tianjin
Jinniu Power Sources Material Co., Ltd. China). Charge–
discharge measurements were carried out galvanostatically at a
current density of 100 mA g�1 in the voltage range from 0.005 V
to 3.0 V using a battery test system (LAND CT2001A model,
Wuhan Jinnuo Electronics. Ltd., China). Note that the mass of
graphene was included when calculating the specific reversible
capacity of the a-Fe2O3/graphene composite. The electrochemical
impedance measurements were performed on a CHI660D
electrochemical workstation (Shanghai Chenhua Co. Ltd.,
China) at an AC voltage of 5 mV amplitude in the range of
100 kHz to 0.01 Hz.
3. Results and discussion
The fabrication process of the a-Fe2O3/graphene composite is
schematically illustrated in Fig. 1. Firstly, an aqueous solution
of a certain amount of FeCl3 and PVP was mixed with
graphene oxide dispersion to prepare reaction solution. When
the solution was gradually heated to 100 1C under magnetic
stirring, hydrazine monohydrate was added into the mixture
dropwise. The hydrazine monohydrate can not only reduce the
Dow
nloa
ded
on 1
4 Ju
ne 2
012
Publ
ishe
d on
11
May
201
2 on
http
://pu
bs.r
sc.o
rg |
doi:1
0.10
39/C
2NJ4
0151
G
View Online

This journal is c The Royal Society of Chemistry and the Centre National de la Recherche Scientifique 2012 New J. Chem.
graphene oxide nanosheets but also promote the hydrolysis of
FeCl3. After reaction at 100 1C for 24 h, the a-Fe2O3/graphene
composite was collected.
Fig. 2a presents the powder XRD pattern of the a-Fe2O3/
graphene composite and bare a-Fe2O3. All the peaks match
well with that of hematite (JCPDS File Card No. 33–0664).
A diffraction hump appears between 201 and 301 in the powder
XRD pattern of the composite, which may be originated from
graphene nanosheets. Raman spectroscopy is an important
tool to identify the crystal phase and determine the quality of
crystalline or amorphous materials. The Raman spectra of the
a-Fe2O3/graphene composite and free a-Fe2O3 particle are
presented in Fig. 2b. The fundamental Raman scattering
peaks for pure a-Fe2O3 particle are observed at 223, 242,
290, 408, 497 and 608 cm�1, which can be assigned to the 2A1g
and 4Eg Raman modes for the typical hematite phase.45 The
peak observed at 1303 cm�1 is attributed to two-magnon
scattering of hematite.45 No other iron oxides, such as magnetite
or maghemite, were detected, indicating the high purity of the
product. The Raman spectrum of the a-Fe2O3/graphene composite
is actually that of a combination of bare a-Fe2O3 and graphene,
and shows typical peaks of hematite and characteristic peaks of the
D and G bands from graphene at around 1348 and 1588 cm�1.
The intensity ratio of the D band and the G band is consistent with
a previous report on GO reduction.46
Fig. 3a presents the FT-IR spectra of free a-Fe2O3 particles,
the a-Fe2O3/graphene composite and pristine PVP. Three
intense absorption bands are observed at 3440, 2923 and
1633 cm–1 in Fig. 2a, which are assigned to the asymmetrical
stretching vibration, symmetrical stretching vibration and
deformation vibration of physically adsorbed H2O molecules
in the sample, respectively. For bare a-Fe2O3 (Fig. 3a(1)) and
a-Fe2O3/graphene composite (Fig. 3a(2)) samples, the sharp
Fig. 1 Scheme of preparation of a-Fe2O3/graphene composite.
Fig. 2 XRD pattern (a) and Raman spectra (b) of a-Fe2O3 particle
(1) and a-Fe2O3/graphene composite (2).
Fig. 3 (a) FT-IR spectrum of (1) a-Fe2O3 particle, (2) a-Fe2O3/
graphene composite and (3) pristine PVP K30; (b) TGA curves of
a-Fe2O3 particle, a-Fe2O3/graphene composite.
Dow
nloa
ded
on 1
4 Ju
ne 2
012
Publ
ishe
d on
11
May
201
2 on
http
://pu
bs.r
sc.o
rg |
doi:1
0.10
39/C
2NJ4
0151
G
View Online

New J. Chem. This journal is c The Royal Society of Chemistry and the Centre National de la Recherche Scientifique 2012
bands at 576 and 478 cm–1 can be assigned to the stretching
vibrations of the Fe3+�O2� bond in the FeO6 octahedron and
FeO4 tetrahedron, respectively.47 However, different from the
spectrum of pristine PVP in Fig. 2b(3), no significant absorption
band was observed at 2946, 1675, 1429 and 1284 cm�1 for bare
a-Fe2O3 particle and a-Fe2O3/graphene composite samples. It
shows that the PVP in bare a-Fe2O3 and a-Fe2O3/graphene
composite samples were removed almost completely. TGA curves
of bare a-Fe2O3 and a-Fe2O3/graphene composite samples, as
shown in Fig. 3b, were used to quantify the amount of graphene
in the composite. From the TGA curves, we can see that the bare
a-Fe2O3 sample remains stable over the entire temperature range,
however, the a-Fe2O3/graphene composite shows rapid mass loss
between 300 and 550 1C due to the oxidation of carbon.
According to the change of weight, it is estimated that the mass
percentage of a-Fe2O3 particles in the composite is 75%.
Typical SEM images of the a-Fe2O3/graphene composite
are shown in Fig. 4. Because of the natural 2D sheet morphology,
graphene decorated with nanoparticles is prone to stack each
other to construct 3D layer-by-layer architecture under control
of a surfactant.48 As shown in Fig. 4a, it can be clearly observed
that graphene nanosheets are hybridized with a-Fe2O3 particles
to preserve a 3D quasi-laminated structure, and the nanosized
a-Fe2O3 particles anchored on graphene uniformly (Fig. 4b).
From the digital photo of the product dried at 80 1C for 24 h
(ESIw, Fig. S2), we can clearly observe that the dried composite
shows the morphology of curly film, which is also a better proof
to support the 3D structure claimed previously. The typical
a-Fe2O3 particles are sphere in shape and around 130 nm in
diameter, which can be further confirmed by the TEM image in
Fig. 5. Fig. 5a clearly shows the a-Fe2O3 particles embedded in
graphene layers. TEM image in Fig. 5b exhibits the interface
between graphene and a-Fe2O3 particles. As presented in
Fig. 5c, the lattice fringes having an interlayer distance of
0.252 nm agree well with the spacing between (110) planes of
a-Fe2O3 crystals.
In our experiments, PVP is very important to control the
interfacial interactions between graphene and the metal oxide
materials during the formation of a-Fe2O3/graphene composite
architecture. On the one hand, the PVPmolecules can attach onto
graphene oxide/graphene through the hydrophobic interactions
to improve the dispersion of graphene oxide/grapheme.49
Actually, Shan et al. had reported that graphene protected
by PVP could be stably dispersed in water, and exhibited good
electronic properties.50 On the other hand, they also interact
with the metal oxide precursor through the hydrophilic head
groups to control nucleation and growth of the metal oxide.51
Fig. 4 FESEM images of a-Fe2O3/graphene composite with different
magnifications.
Fig. 5 TEM images of a-Fe2O3/graphene composite with different
magnifications. (c) Corresponding high-resolution TEM image from
the marked region.
Dow
nloa
ded
on 1
4 Ju
ne 2
012
Publ
ishe
d on
11
May
201
2 on
http
://pu
bs.r
sc.o
rg |
doi:1
0.10
39/C
2NJ4
0151
G
View Online

This journal is c The Royal Society of Chemistry and the Centre National de la Recherche Scientifique 2012 New J. Chem.
The cooperative interactions between the surfactant, the GO,
and the precursors lead to the homogeneous mixing of the
components. After the addition of hydrazine monohydrate,
the as-grown a-Fe2O3 particles are then coated on graphene
surfaces and form a 3D quasi-laminated architecture with the
aid of PVP. Contrarily, because the dispersion of graphene
oxide in water depends on the charge stabilization in solution,
the addition of FeCl3 in solution can affect the diffusion of
double layer formation and leads to agglomeration of graphene
oxide.33 It is difficult to prepare a uniform a-Fe2O3/graphene
composite without PVP (ESIw, Fig. S3).To investigate the electrochemical performance of the
a-Fe2O3/graphene composite as an anode for LIBs, discharge/
charge cycling was carried out in the voltage range of
0.005–3.0 V (vs. Li+/Li) at a current density of 100 mA g�1
and room temperature. The initial, second, tenth and fiftieth
charge–discharge curves of pristine a-Fe2O3 particles and
a-Fe2O3/graphene composite electrodes are shown in Fig. 6a
and b. In the initial discharge curve, an extended potential
plateau at about 0.8 V vs. Li+/Li is observed for the a-Fe2O3
particle and a-Fe2O3/graphene composite electrodes, similar to
the literature results.52,53 As shown in Fig. 6a, the bare a-Fe2O3
electrode shows an initial discharge capacity of 1719 mAh g�1
and a charge capacity of 809 mAh g�1 in the first cycle. The
irreversible capacity loss is 53%. From the length of the lithium
intercalation plateau observed in the first discharge curve, we
can see that the pure a-Fe2O3 particle electrode is close to a
theoretical capacity of 1007 mAh g�1 from the reduction
reaction of Fe3+ to Fe0, corresponding to a maximum lithium
uptake of 6 Li per a-Fe2O3. The equation of electrochemical
reversible reaction is as follows: a-Fe2O3 + 6e� + 6Li+ 3
2Fe0 + 3Li2O.52,53 Furthermore, the excessive plateau capacity
of the nanosized a-Fe2O3 electrode over the theoretical capacity
may be ascribed to the severe side reaction of the enlarged
surface area with the electrolyte54 and the formation of the solid
electrolyte interphase (SEI).55 The following sloping region
might be attributed to the formation of a surface polymeric
layer, which in general contributes to additional capacity and
results in a large irreversible capacity.56 Furthermore, the
interfacial reaction due to the charge separation at the
Fe/Li2O phase boundary and the inherent poor electrical/ionic
conductivity of the a-Fe2O3/Fe/Li2O matrix formed during the
charge/discharge process may also cause irreversible capacity.57,58
During the second cycle, the discharge capacity and the corres-
ponding charge capacity decreased to 783 and 462 mAh g�1.
Then, it quickly fades to 98 and 97 mAh g�1 in the fiftieth cycle,
respectively.
Compared with the pristine a-Fe2O3, in the initial cycle,
the a-Fe2O3/graphene composite electrode has a discharge
capacity of 990 mAh g�1 with the corresponding charge
capacity of 719 mAh g�1 (Fig. 6b), and the Coulombic
efficiency was rose to 72.6%. The lower initial capacity than
the bare a-Fe2O3 electrode may be attributed to that the
electrochemically active material for Li-ion storage is mainly
the a-Fe2O3, not the graphene. This result is different from
other reports where graphene is also the active phase for
energy storage.38 Furthermore, the discharge voltage plateau
is not as flat as for the a-Fe2O3/graphene composite compared
to the pure a-Fe2O3, probably because of reduction in crystallinity
and/or change in surface site energetics during the formation
process of the composite.59–61 An increased Coulombic efficiency
of 85.5% was achieved in the second cycle with a discharge
capacity of 827 mAh g�1 and a charge capacity of 708 mAh g�1.
During the tenth and fiftieth cycle, the Coulombic efficiency
further increased to 95.8% and 97.8%, respectively.
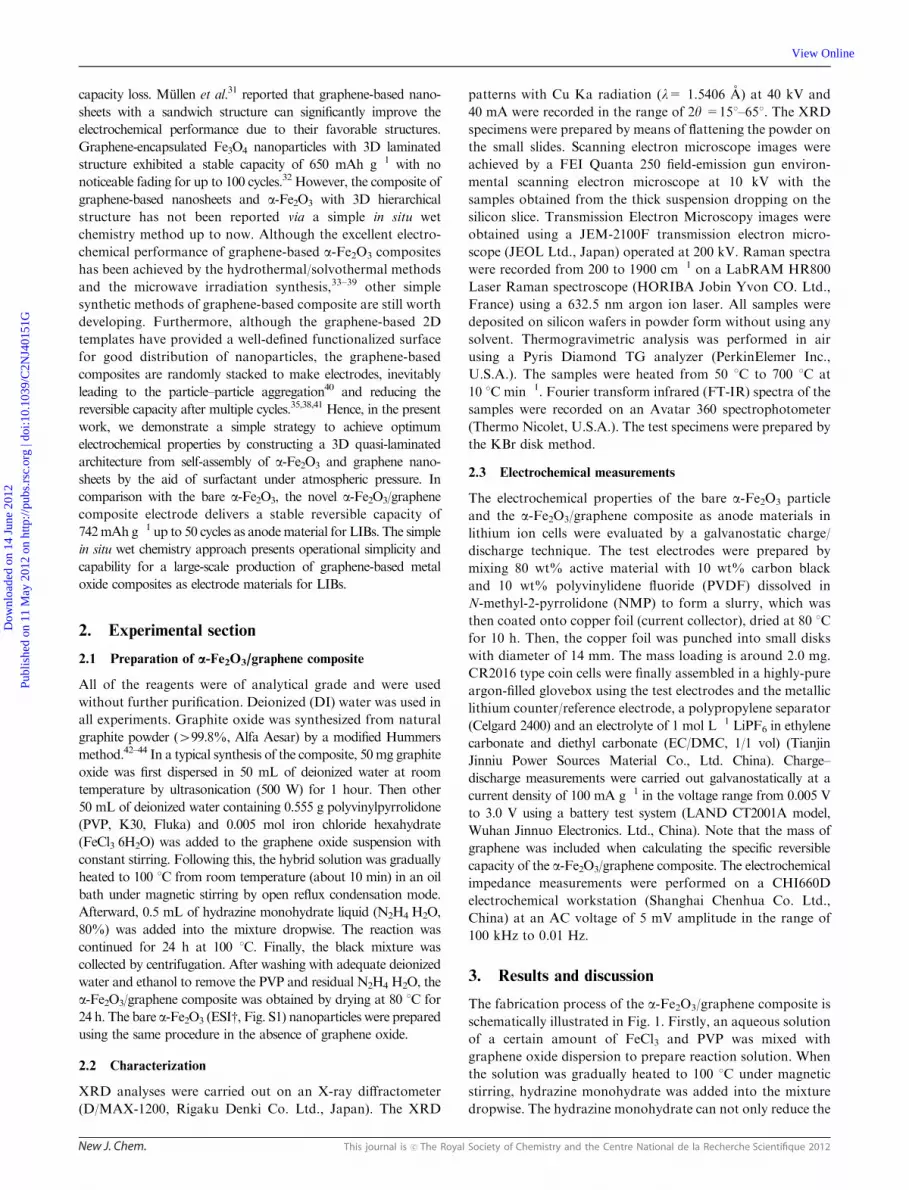
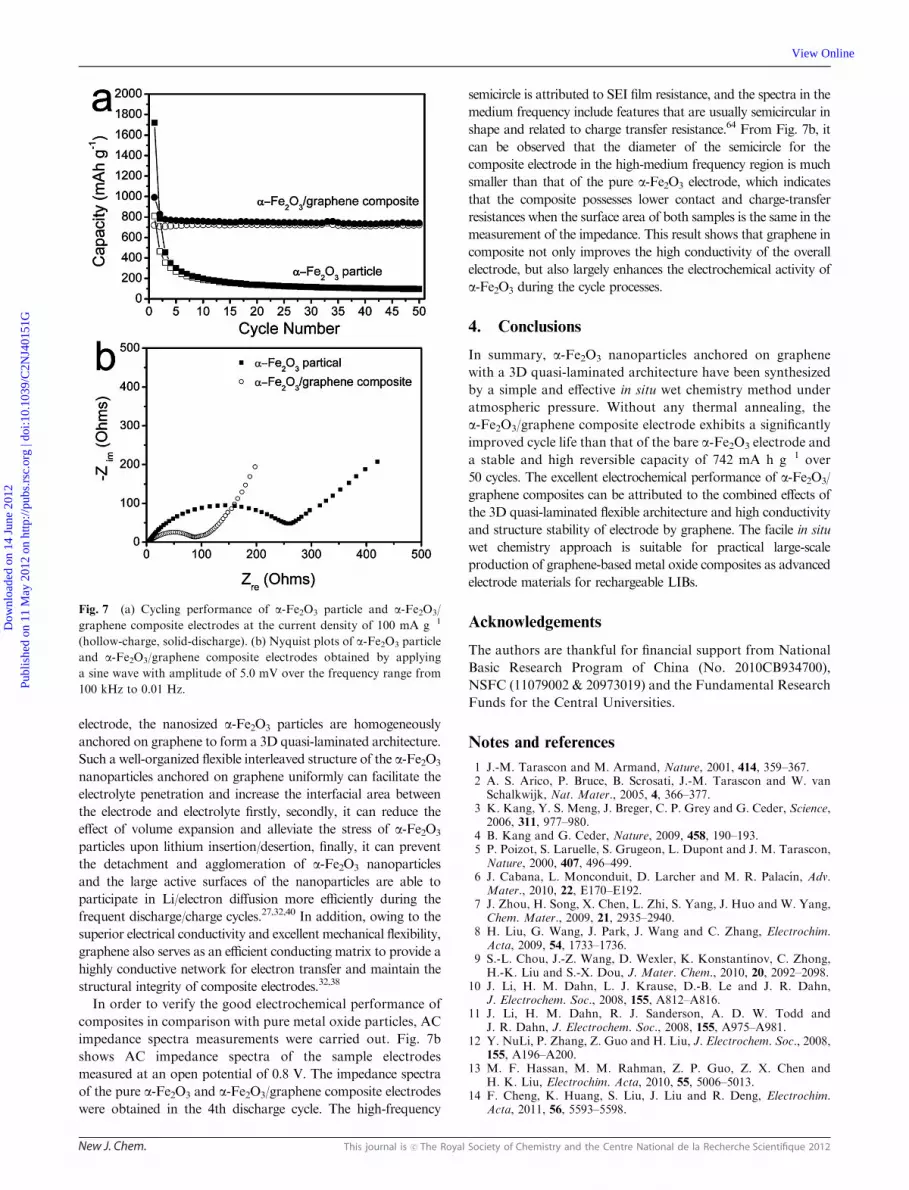
Fig. 7a shows the cycling performance of the pure a-Fe2O3
particle and a-Fe2O3/graphene composite electrodes at a
current density of 100 mA g�1 for 50 cycles. The discharge capacity
of the bare a-Fe2O3 electrode decreases from 809 mAh g�1 to
97 mAh g�1, which is only about 6% of the initial capacity,
showing poor capacity retention. On the contrary, the
a-Fe2O3/graphene composite electrode has a high discharge
capacity of 827 mAh g�1 in the second cycle. Subsequently, the
capacity dropped slowly to 742 mAh g�1 during the initial
30 cycles, and then maintained stably at 742 mAh g�1 without
any capacity loss up to the 50th cycle.
As we know, rapid decay of the capacity of the bare
transition metal oxide electrode is mainly attributed to the
large volume charge, which causes structural damage of the
metal oxide particles and the breakage of the electronic
conducting network during Li ion insertion and extraction
processes.62,63 However, in the a-Fe2O3/graphene composite
Fig. 6 Electrochemical performance of bare a-Fe2O3 particle and
a-Fe2O3/graphene composite electrodes under room temperature.
Discharge-charge profiles of (a) a-Fe2O3 particle and (b) a-Fe2O3/
graphene composite electrodes at the current density of 100 mA g�1.
Dow
nloa
ded
on 1
4 Ju
ne 2
012
Publ
ishe
d on
11
May
201
2 on
http
://pu
bs.r
sc.o
rg |
doi:1
0.10
39/C
2NJ4
0151
G
View Online
New J. Chem. This journal is c The Royal Society of Chemistry and the Centre National de la Recherche Scientifique 2012
electrode, the nanosized a-Fe2O3 particles are homogeneously
anchored on graphene to form a 3D quasi-laminated architecture.
Such a well-organized flexible interleaved structure of the a-Fe2O3
nanoparticles anchored on graphene uniformly can facilitate the
electrolyte penetration and increase the interfacial area between
the electrode and electrolyte firstly, secondly, it can reduce the
effect of volume expansion and alleviate the stress of a-Fe2O3
particles upon lithium insertion/desertion, finally, it can prevent
the detachment and agglomeration of a-Fe2O3 nanoparticles
and the large active surfaces of the nanoparticles are able to
participate in Li/electron diffusion more efficiently during the
frequent discharge/charge cycles.27,32,40 In addition, owing to the
superior electrical conductivity and excellent mechanical flexibility,
graphene also serves as an efficient conducting matrix to provide a
highly conductive network for electron transfer and maintain the
structural integrity of composite electrodes.32,38
In order to verify the good electrochemical performance of
composites in comparison with pure metal oxide particles, AC
impedance spectra measurements were carried out. Fig. 7b
shows AC impedance spectra of the sample electrodes
measured at an open potential of 0.8 V. The impedance spectra
of the pure a-Fe2O3 and a-Fe2O3/graphene composite electrodes
were obtained in the 4th discharge cycle. The high-frequency
semicircle is attributed to SEI film resistance, and the spectra in the
medium frequency include features that are usually semicircular in
shape and related to charge transfer resistance.64 From Fig. 7b, it
can be observed that the diameter of the semicircle for the
composite electrode in the high-medium frequency region is much
smaller than that of the pure a-Fe2O3 electrode, which indicates
that the composite possesses lower contact and charge-transfer
resistances when the surface area of both samples is the same in the
measurement of the impedance. This result shows that graphene in
composite not only improves the high conductivity of the overall
electrode, but also largely enhances the electrochemical activity of
a-Fe2O3 during the cycle processes.
4. Conclusions
In summary, a-Fe2O3 nanoparticles anchored on graphene
with a 3D quasi-laminated architecture have been synthesized
by a simple and effective in situ wet chemistry method under
atmospheric pressure. Without any thermal annealing, the
a-Fe2O3/graphene composite electrode exhibits a significantly
improved cycle life than that of the bare a-Fe2O3 electrode and
a stable and high reversible capacity of 742 mA h g�1 over
50 cycles. The excellent electrochemical performance of a-Fe2O3/
graphene composites can be attributed to the combined effects of
the 3D quasi-laminated flexible architecture and high conductivity
and structure stability of electrode by graphene. The facile in situ
wet chemistry approach is suitable for practical large-scale
production of graphene-based metal oxide composites as advanced
electrode materials for rechargeable LIBs.
Acknowledgements
The authors are thankful for financial support from National
Basic Research Program of China (No. 2010CB934700),
NSFC (11079002 & 20973019) and the Fundamental Research
Funds for the Central Universities.
Notes and references
1 J.-M. Tarascon and M. Armand, Nature, 2001, 414, 359–367.2 A. S. Arico, P. Bruce, B. Scrosati, J.-M. Tarascon and W. vanSchalkwijk, Nat. Mater., 2005, 4, 366–377.
3 K. Kang, Y. S. Meng, J. Breger, C. P. Grey and G. Ceder, Science,2006, 311, 977–980.
4 B. Kang and G. Ceder, Nature, 2009, 458, 190–193.5 P. Poizot, S. Laruelle, S. Grugeon, L. Dupont and J. M. Tarascon,Nature, 2000, 407, 496–499.
6 J. Cabana, L. Monconduit, D. Larcher and M. R. Palacın, Adv.Mater., 2010, 22, E170–E192.
7 J. Zhou, H. Song, X. Chen, L. Zhi, S. Yang, J. Huo and W. Yang,Chem. Mater., 2009, 21, 2935–2940.
8 H. Liu, G. Wang, J. Park, J. Wang and C. Zhang, Electrochim.Acta, 2009, 54, 1733–1736.
9 S.-L. Chou, J.-Z. Wang, D. Wexler, K. Konstantinov, C. Zhong,H.-K. Liu and S.-X. Dou, J. Mater. Chem., 2010, 20, 2092–2098.
10 J. Li, H. M. Dahn, L. J. Krause, D.-B. Le and J. R. Dahn,J. Electrochem. Soc., 2008, 155, A812–A816.
11 J. Li, H. M. Dahn, R. J. Sanderson, A. D. W. Todd andJ. R. Dahn, J. Electrochem. Soc., 2008, 155, A975–A981.
12 Y. NuLi, P. Zhang, Z. Guo and H. Liu, J. Electrochem. Soc., 2008,155, A196–A200.
13 M. F. Hassan, M. M. Rahman, Z. P. Guo, Z. X. Chen andH. K. Liu, Electrochim. Acta, 2010, 55, 5006–5013.
14 F. Cheng, K. Huang, S. Liu, J. Liu and R. Deng, Electrochim.Acta, 2011, 56, 5593–5598.
Fig. 7 (a) Cycling performance of a-Fe2O3 particle and a-Fe2O3/
graphene composite electrodes at the current density of 100 mA g�1
(hollow-charge, solid-discharge). (b) Nyquist plots of a-Fe2O3 particle
and a-Fe2O3/graphene composite electrodes obtained by applying
a sine wave with amplitude of 5.0 mV over the frequency range from
100 kHz to 0.01 Hz.
Dow
nloa
ded
on 1
4 Ju
ne 2
012
Publ
ishe
d on
11
May
201
2 on
http
://pu
bs.r
sc.o
rg |
doi:1
0.10
39/C
2NJ4
0151
G
View Online
This journal is c The Royal Society of Chemistry and the Centre National de la Recherche Scientifique 2012 New J. Chem.
15 M.-S. Wu, Y.-H. Ou and Y.-P. Lin, Electrochim. Acta, 2010, 55,3240–3244.
16 L. Ji, Z. Tan, T. R. Kuykendall, S. Aloni, S. Xun, E. Lin, V. Battagliaand Y. Zhang, Phys. Chem. Chem. Phys., 2011, 13, 7170–7177.
17 A. K. Geim and K. S. Novoselov, Nat. Mater., 2007, 6, 183–191.18 S. Stankovich, D. A. Dikin, G. H. B. Dommett, K. M. Kohlhaas,
E. J. Zimney, E. A. Stach, R. D. Piner, S. T. Nguyen andR. S. Ruoff, Nature, 2006, 442, 282–286.
19 D. R. Dreyer, S. Park, C. W. Bielawski and R. S. Ruoff, Chem.Soc. Rev., 2010, 39, 228.
20 S. Park and R. S. Ruoff, Nat. Nanotechnol., 2009, 4, 217–224.21 M. J. Allen, V. C. Tung and R. B. Kaner, Chem. Rev., 2009, 110,
132–145.22 D. Chen, L. Tang and J. Li, Chem. Soc. Rev., 2010, 39, 3157.23 Z.-S. Wu, W. Ren, L. Wen, L. Gao, J. Zhao, Z. Chen, G. Zhou,
F. Li and H.-M. Cheng, ACS Nano, 2010, 4, 3187–3194.24 H. Wang, L.-F. Cui, Y. Yang, H. Sanchez Casalongue,
J. T. Robinson, Y. Liang, Y. Cui and H. Dai, J. Am. Chem.Soc., 2010, 132, 13978–13980.
25 Y. Zou and Y. Wang, Nanoscale, 2011, 3, 2615–2620.26 B. Wang, X.-L. Wu, C.-Y. Shu, Y.-G. Guo and C.-R. Wang,
J. Mater. Chem., 2010, 20, 10661–10664.27 G. Zhou, D.-W. Wang, F. Li, L. Zhang, N. Li, Z.-S. Wu, L. Wen,
G. Q. Lu and H.-M. Cheng, Chem. Mater., 2010, 22, 5306–5313.28 D. Wang, D. Choi, J. Li, Z. Yang, Z. Nie, R. Kou, D. Hu,
C. Wang, L. V. Saraf, J. Zhang, I. A. Aksay and J. Liu, ACSNano, 2009, 3, 907–914.
29 D. R. Rolison, J. W. Long, J. C. Lytle, A. E. Fischer, C. P. Rhodes,T. M. McEvoy, M. E. Bourg and A. M. Lubers, Chem. Soc. Rev.,2009, 38, 226.
30 H. Zhang, X. Yu and P. V. Braun,Nat. Nanotechnol., 2011, 6, 277–281.31 S. Yang, X. Feng, L. Wang, K. Tang, J. Maier and K. Mullen,
Angew. Chem., Int. Ed., 2010, 49, 4795–4799.32 J.-Z. Wang, C. Zhong, D. Wexler, N. H. Idris, Z.-X. Wang,
L.-Q. Chen and H.-K. Liu, Chem.–Eur. J., 2011, 17, 661–667.33 J. Zhu, T. Zhu, X. Zhou, Y. Zhang, X. W. Lou, X. Chen,
H. Zhang, H. H. Hng and Q. Yan, Nanoscale, 2011, 3, 1084–1089.34 X.-Y. Xue, C.-H. Ma, C.-X. Cui and L.-L. Xing, Solid State Sci.,
2011, 13, 1526–1530.35 S.-Y. Liu, J. Xie, Q. Pan, C.-Y. Wu, G.-S. Cao, T.-J. Zhu and
X.-B. Zhao, Int. J. Electrochem. Sci., 2012, 7, 354–362.36 G. Wang, T. Liu, Y. Luo, Y. Zhao, Z. Ren, J. Bai and H. Wang,
J. Alloys Compd., 2011, 509, L216–L220.37 Q. Zou, J.-T. Zai, P. Liu and X.-F. Qian, Chem. Res. Chin. Univ.,
2011, 32, 630–634.38 X. Zhu, Y. Zhu, S. Murali, M. D. Stoller and R. S. Ruoff, ACS
Nano, 2011, 5, 3333–3338.39 M. Zhang, B. Qu, D. Lei, Y. Chen, X. Yu, L. Chen, Q. Li,
Y. Wang and T. Wang, J. Mater. Chem., 2012, 22, 3868–3874.40 X. Huang, X. Qi, F. Boey and H. Zhang, Chem. Soc. Rev., 2012,
41, 666–686.
41 Y. Zou, J. Kan and Y. Wang, J. Phys. Chem. C, 2011, 115,20747–20753.
42 W. S. Hummers and R. E. Offeman, J. Am. Chem. Soc., 1958,80, 1339.
43 N. I. Kovtyukhova, P. J. Ollivier, B. R. Martin, T. E. Mallouk,S. A. Chizhik, E. V. Buzaneva and A. D. Gorchinskiy, Chem.Mater., 1999, 11, 771–778.
44 D. Chen, L. Li and L. Guo, Nanotechnology, 2011, 22, 325601.45 D. L. A. de Faria, S. Venancio Silva and M. T. de Oliveira,
J. Raman Spectrosc., 1997, 28, 873–878.46 S. Stankovich, D. A. Dikin, R. D. Piner, K. A. Kohlhaas,
A. Kleinhammes, Y. Jia, Y. Wu, S. T. Nguyen and R. S. Ruoff,Carbon, 2007, 45, 1558–1565.
47 H. D. Ruan, R. L. Frost, J. T. Kloprogge and L. Duong, Spectrochim.Acta, Part A, 2002, 58, 967–981.
48 D. Wang, R. Kou, D. Choi, Z. Yang, Z. Nie, J. Li, L. V. Saraf,D. Hu, J. Zhang, G. L. Graff, J. Liu, M. A. Pope and I. A. Aksay,ACS Nano, 2010, 4, 1587–1595.
49 S. Yoon and I. In, J. Mater. Sci., 2010, 46, 1316–1321.50 C. Shan, H. Yang, J. Song, D. Han, A. Ivaska and L. Niu, Anal.
Chem., 2009, 81, 2378–2382.51 Y. Zheng, Y. Cheng, Y. Wang, F. Bao, L. Zhou, X. Wei, Y. Zhang
and Q. Zheng, J. Phys. Chem. B, 2006, 110, 3093–3097.52 D. Larcher, C. Masquelier, D. Bonnin, Y. Chabre, V. Masson,
J. B. Leriche and J. M. Tarascon, J. Electrochem. Soc., 2003, 150,A133–A139.
53 X.-L. Wu, Y.-G. Guo, L.-J. Wan and C.-W. Hu, J. Phys. Chem. C,2008, 112, 16824–16829.
54 D. Aurbach, A. Nimberger, B. Markovsky, E. Levi, E. Sominskiand A. Gedanken, Chem. Mater., 2002, 14, 4155–4163.
55 J. Zhang, R. Wang, X. Yang, W. Lu, X. Wu, X. Wang, H. Li andL. Chen, Nano Lett., 2012, 12, 2153–2157.
56 J. Ma, J. Lian, X. Duan, X. Liu and W. Zheng, J. Phys. Chem. C,2010, 114, 10671–10676.
57 H. Liu, G. Wang, J. Wang and D. Wexler, Electrochem. Commun.,2008, 10, 1879–1882.
58 S. A. Needham, G. X. Wang, K. Konstantinov, Y. Tournayre,Z. Lao and H. K. Liu, Electrochem. Solid-State Lett., 2006, 9,A315–A319.
59 W.-M. Zhang, X.-L. Wu, J.-S. Hu, Y.-G. Guo and L.-J. Wan, Adv.Funct. Mater., 2008, 18, 3941–3946.
60 M. Zhang, D. Lei, X. Yin, L. Chen, Q. Li, Y. Wang and T. Wang,J. Mater. Chem., 2010, 20, 5538–5543.
61 Z. Yang, J. Shen and L. A. Archer, J. Mater. Chem., 2011, 21,11092–11097.
62 Y. Wang, I. Djerdj, B. Smarsly and M. Antonietti, Chem. Mater.,2009, 21, 3202–3209.
63 Y. He, L. Huang, J.-S. Cai, X.-M. Zheng and S.-G. Sun, Electrochim.Acta, 2010, 55, 1140–1144.
64 Y.-B. He, Z.-Y. Tang, Q.-S. Song, H. Xie, Y.-G. Liu and Q. Xu,J. Electrochem. Soc., 2008, 155, A481–A487.
Dow
nloa
ded
on 1
4 Ju
ne 2
012
Publ
ishe
d on
11
May
201
2 on
http
://pu
bs.r
sc.o
rg |
doi:1
0.10
39/C
2NJ4
0151
G
View Online
Top Related
Copyright © 2022 FDOKUMEN

