
Bahasa
Halaman
Hukum

39
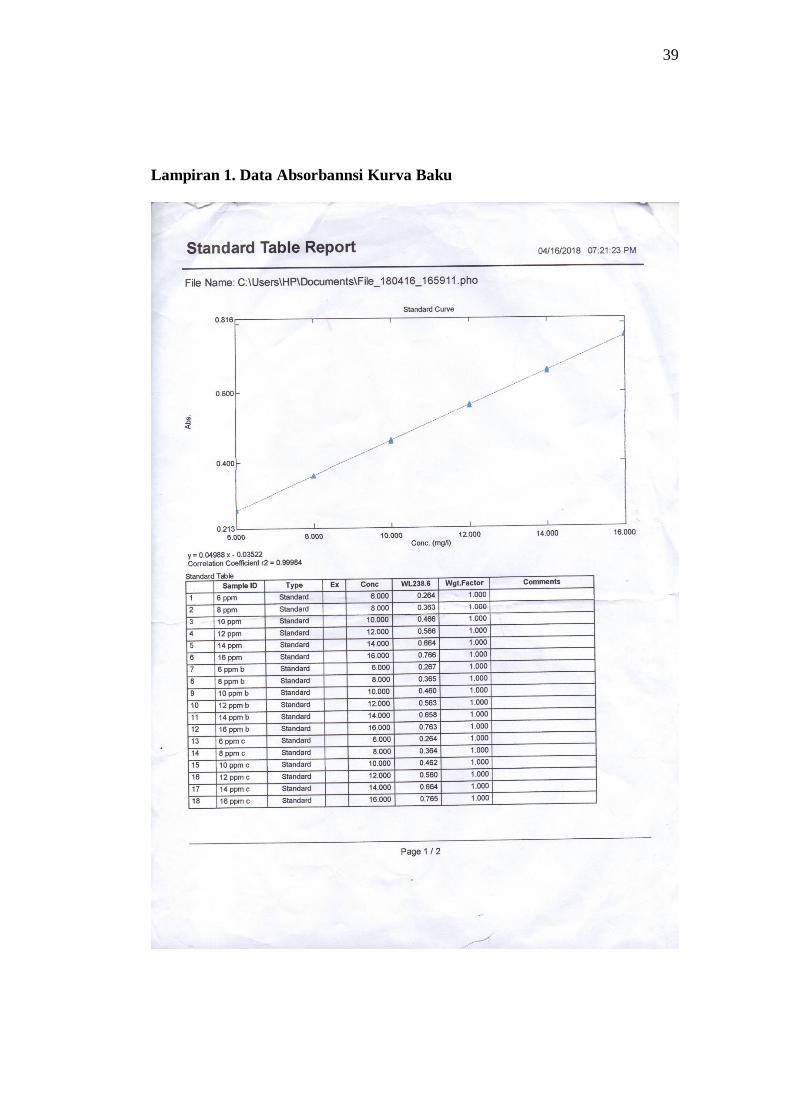
Lampiran 1. Data Absorbannsi Kurva Baku

40
Lampiran 2. Panjang Gelombang Maksimal
41
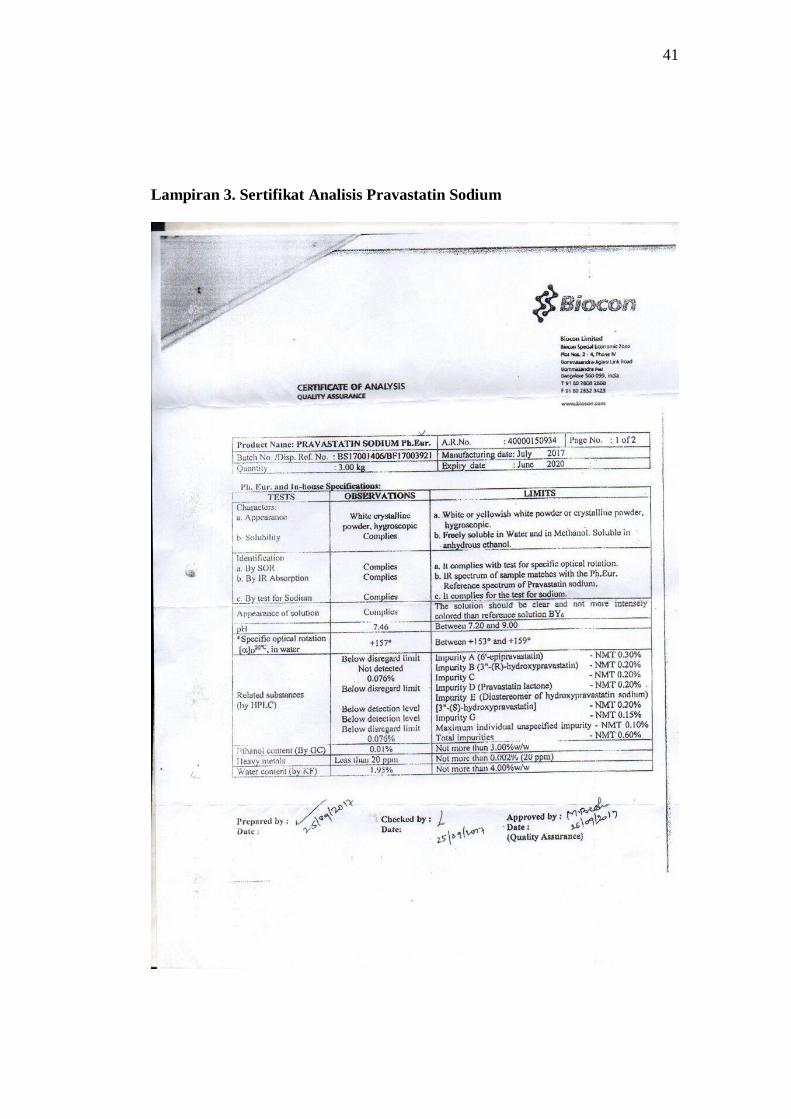
Lampiran 3. Sertifikat Analisis Pravastatin Sodium

42
Lampiran 4. Uji Keseragaman Bobot
Replikasi Formula I
(mg)
Formula
II (mg)
Formula III
(mg)
1 426 399 368,4
2 441 377,9 368,2
3 453,5 385 365,6
4 435,1 377 368
5 446 380,4 369
6 428,9 378,7 363
7 431 409,4 354,8
8 427,7 391,2 372,3
9 426 390,9 373,6
10 452,8 393,6 354
SD 10,81 10,56
6,65
Rata-rata 436,8 388,31 365,69
RSD 2,47 2,72 1,82

43
Lampiran 5. Uji Penyerapan Lembab
Formula Bobot
Awal
(mg)
Bobot
Akhir
(mg)
%
Penyerapan
Lembab
Rata-
Rata
SD RSD
FI
1
2
3
431,0
441,0
435,1
548
571,1
570
27,15
29,50
31,00
29,21
1,94
6,66
FII
1
2
3
391,2
390,0
393,6
509,9
492,7
505,6
30,34
26,33
28,46
28,38
2,00
7,07
FIII
1
2
3
368,4
368,2
356,0
468,1
462
460,2
27,06
25,47
29,27
27,27
1,90
6,99
44
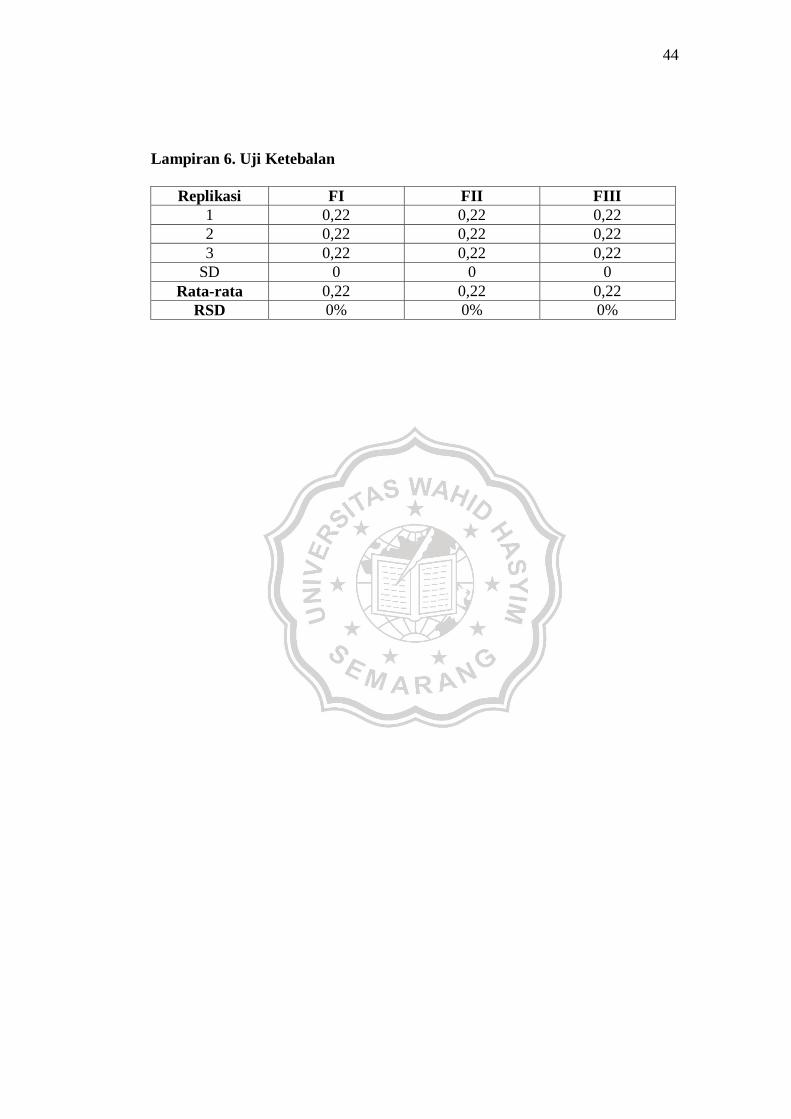
Lampiran 6. Uji Ketebalan
Replikasi FI FII FIII
1 0,22 0,22 0,22
2 0,22 0,22 0,22
3 0,22 0,22 0,22
SD 0 0 0
Rata-rata 0,22 0,22 0,22
RSD 0% 0% 0%
45
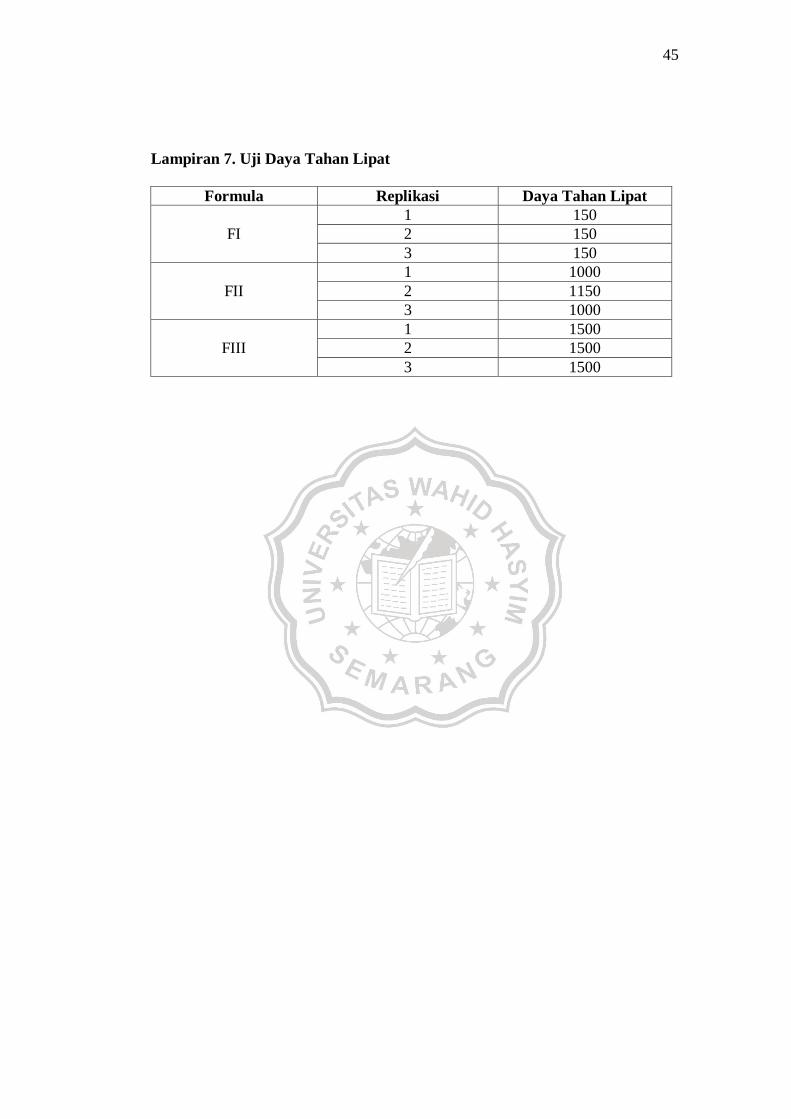
Lampiran 7. Uji Daya Tahan Lipat
Formula Replikasi Daya Tahan Lipat
FI
1 150
2 150
3 150
FII
1 1000
2 1150
3 1000
FIII
1 1500
2 1500
3 1500
46
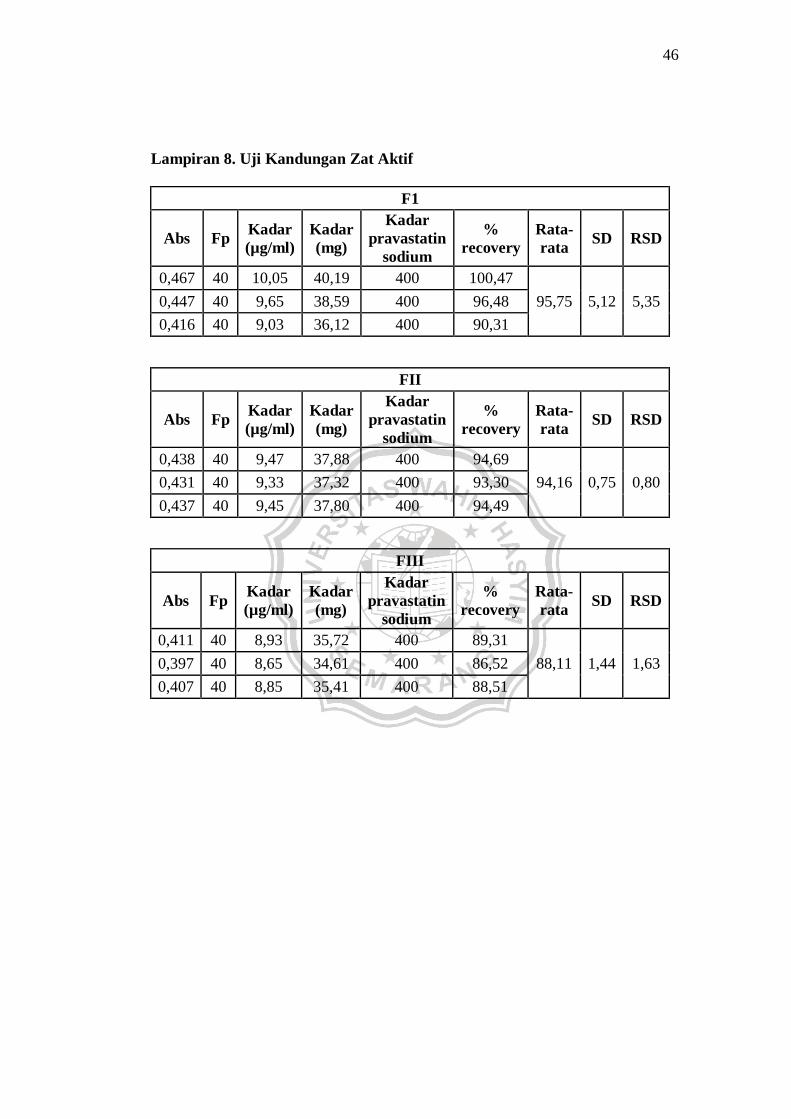
Lampiran 8. Uji Kandungan Zat Aktif
F1
Abs Fp Kadar
(µg/ml)
Kadar
(mg)
Kadar
pravastatin
sodium
%
recovery
Rata-
rata SD RSD
0,467 40 10,05 40,19 400 100,47
95,75 5,12 5,35 0,447 40 9,65 38,59 400 96,48
0,416 40 9,03 36,12 400 90,31
FII
Abs Fp Kadar
(µg/ml)
Kadar
(mg)
Kadar
pravastatin
sodium
%
recovery
Rata-
rata SD RSD
0,438 40 9,47 37,88 400 94,69
94,16 0,75 0,80 0,431 40 9,33 37,32 400 93,30
0,437 40 9,45 37,80 400 94,49
FIII
Abs Fp Kadar
(µg/ml)
Kadar
(mg)
Kadar
pravastatin
sodium
%
recovery
Rata-
rata SD RSD
0,411 40 8,93 35,72 400 89,31
88,11 1,44 1,63 0,397 40 8,65 34,61 400 86,52
0,407 40 8,85 35,41 400 88,51

47
Lampiran 9. Uji Disolusi
Formula I PVP replikasi 1
Jam Abs Kadar
(µg/ml)
Jumlah
Terlarut
(µg)
Koreksi
(µg)
Jumlah terlarut
setelah dikoreksi
(mg)
%
terlarut
1 0,259 5,90 5312,03 0 5,31 14,17
2 0,3 6,72 6047,30 29,51 6,08 16,20
3 0,363 7,97 7177,11 63,11 7,24 19,31
4 0,399 8,69 7822,71 102,98 7,93 21,14
5 0,472 10,15 9131,85 146,44 9,28 24,74
6 0,514 10,98 9885,05 197,17 10,08 26,89
Formula I PVP replikasi 2
Jam Abs Kadar
(µg/ml)
Jumlah
Terlarut
(µg)
Koreksi
(µg)
Jumlah terlarut
setelah dikoreksi
(mg)
%
terlarut
1 0,205 4,83 4343,63 0 4,34 11,49
2 0,238 5,48 4935,43 24,13 4,96 13,12
3 0,259 5,90 5312,03 51,55 5,36 14,19
4 0,303 6,78 6101,10 81,06 6,18 16,36
5 0,343 7,58 6818,44 114,96 6,93 18,35
6 0,407 8,86 7966,18 152,84 8,12 21,48
Formula I PVP replikasi 3
Jam Abs Kadar
(µg/ml)
Jumlah
Terlarut
(µg)
Koreksi
(µg)
Jumlah terlarut
setelah dikoreksi
(mg)
%
terlarut
1 0,203 4,79 4307,76 0 4,31 11,29
2 0,246 5,64 5078,90 23,93 5,10 13,38
3 0,269 6,10 5491,37 52,15 5,54 14,53
4 0,317 7,06 6352,17 82,66 6,43 16,87
5 0,348 7,68 6908,10 117,95 7,03 18,42
6 0,401 8,73 7858,58 156,32 8,01 21,01
48
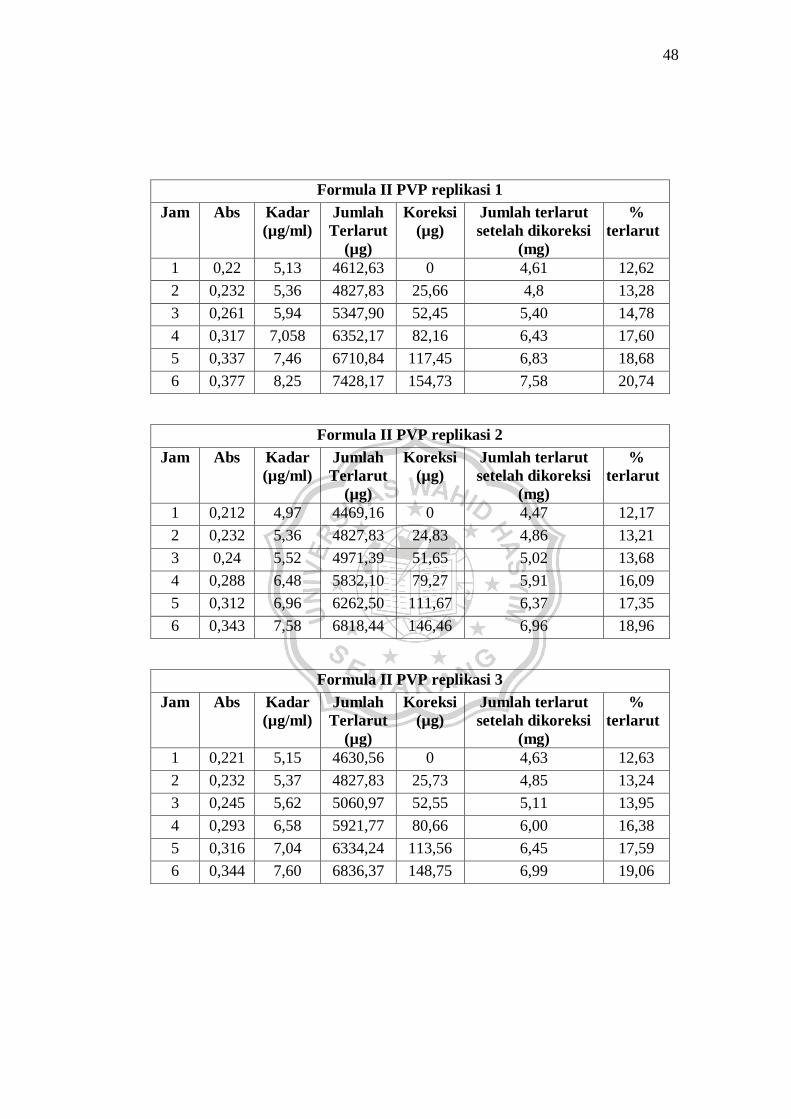
Formula II PVP replikasi 1
Jam Abs Kadar
(µg/ml)
Jumlah
Terlarut
(µg)
Koreksi
(µg)
Jumlah terlarut
setelah dikoreksi
(mg)
%
terlarut
1 0,22 5,13 4612,63 0 4,61 12,62
2 0,232 5,36 4827,83 25,66 4,8 13,28
3 0,261 5,94 5347,90 52,45 5,40 14,78
4 0,317 7,058 6352,17 82,16 6,43 17,60
5 0,337 7,46 6710,84 117,45 6,83 18,68
6 0,377 8,25 7428,17 154,73 7,58 20,74
Formula II PVP replikasi 2
Jam Abs Kadar
(µg/ml)
Jumlah
Terlarut
(µg)
Koreksi
(µg)
Jumlah terlarut
setelah dikoreksi
(mg)
%
terlarut
1 0,212 4,97 4469,16 0 4,47 12,17
2 0,232 5,36 4827,83 24,83 4,86 13,21
3 0,24 5,52 4971,39 51,65 5,02 13,68
4 0,288 6,48 5832,10 79,27 5,91 16,09
5 0,312 6,96 6262,50 111,67 6,37 17,35
6 0,343 7,58 6818,44 146,46 6,96 18,96
Formula II PVP replikasi 3
Jam Abs Kadar
(µg/ml)
Jumlah
Terlarut
(µg)
Koreksi
(µg)
Jumlah terlarut
setelah dikoreksi
(mg)
%
terlarut
1 0,221 5,15 4630,56 0 4,63 12,63
2 0,232 5,37 4827,83 25,73 4,85 13,24
3 0,245 5,62 5060,97 52,55 5,11 13,95
4 0,293 6,58 5921,77 80,66 6,00 16,38
5 0,316 7,04 6334,24 113,56 6,45 17,59
6 0,344 7,60 6836,37 148,75 6,99 19,06
49
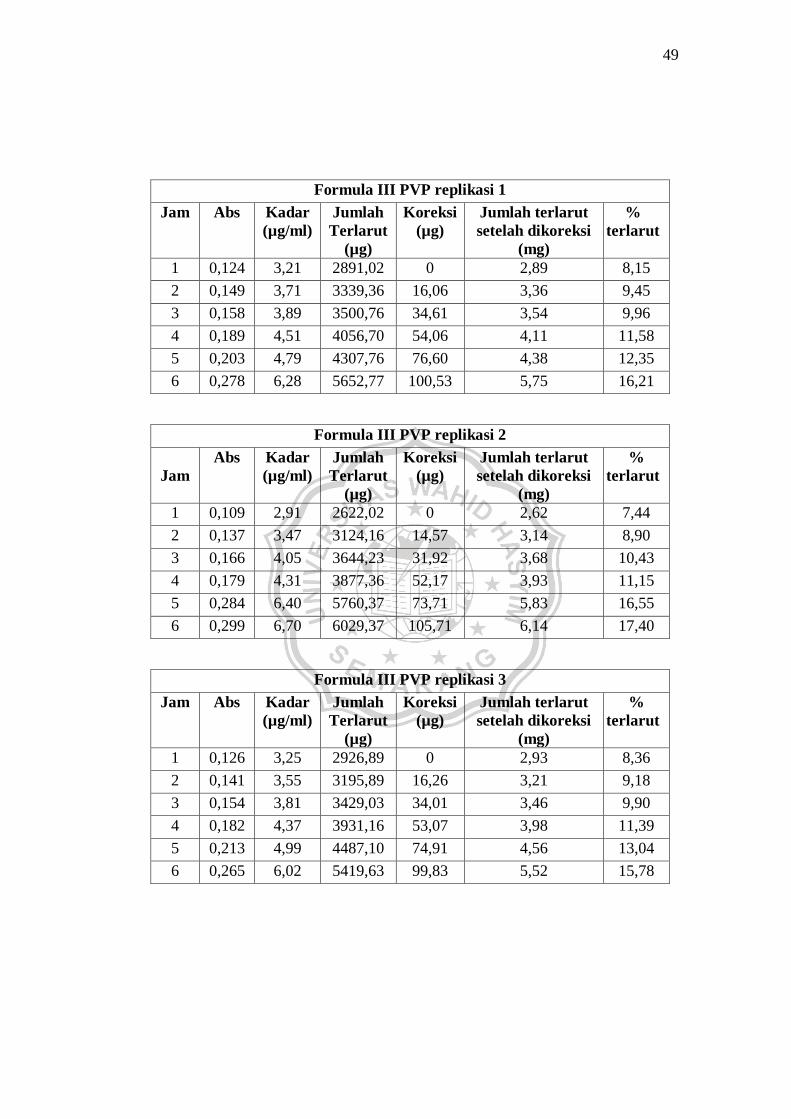
Formula III PVP replikasi 1
Jam Abs Kadar
(µg/ml)
Jumlah
Terlarut
(µg)
Koreksi
(µg)
Jumlah terlarut
setelah dikoreksi
(mg)
%
terlarut
1 0,124 3,21 2891,02 0 2,89 8,15
2 0,149 3,71 3339,36 16,06 3,36 9,45
3 0,158 3,89 3500,76 34,61 3,54 9,96
4 0,189 4,51 4056,70 54,06 4,11 11,58
5 0,203 4,79 4307,76 76,60 4,38 12,35
6 0,278 6,28 5652,77 100,53 5,75 16,21
Formula III PVP replikasi 2
Jam
Abs Kadar
(µg/ml)
Jumlah
Terlarut
(µg)
Koreksi
(µg)
Jumlah terlarut
setelah dikoreksi
(mg)
%
terlarut
1 0,109 2,91 2622,02 0 2,62 7,44
2 0,137 3,47 3124,16 14,57 3,14 8,90
3 0,166 4,05 3644,23 31,92 3,68 10,43
4 0,179 4,31 3877,36 52,17 3,93 11,15
5 0,284 6,40 5760,37 73,71 5,83 16,55
6 0,299 6,70 6029,37 105,71 6,14 17,40
Formula III PVP replikasi 3
Jam Abs Kadar
(µg/ml)
Jumlah
Terlarut
(µg)
Koreksi
(µg)
Jumlah terlarut
setelah dikoreksi
(mg)
%
terlarut
1 0,126 3,25 2926,89 0 2,93 8,36
2 0,141 3,55 3195,89 16,26 3,21 9,18
3 0,154 3,81 3429,03 34,01 3,46 9,90
4 0,182 4,37 3931,16 53,07 3,98 11,39
5 0,213 4,99 4487,10 74,91 4,56 13,04
6 0,265 6,02 5419,63 99,83 5,52 15,78
50
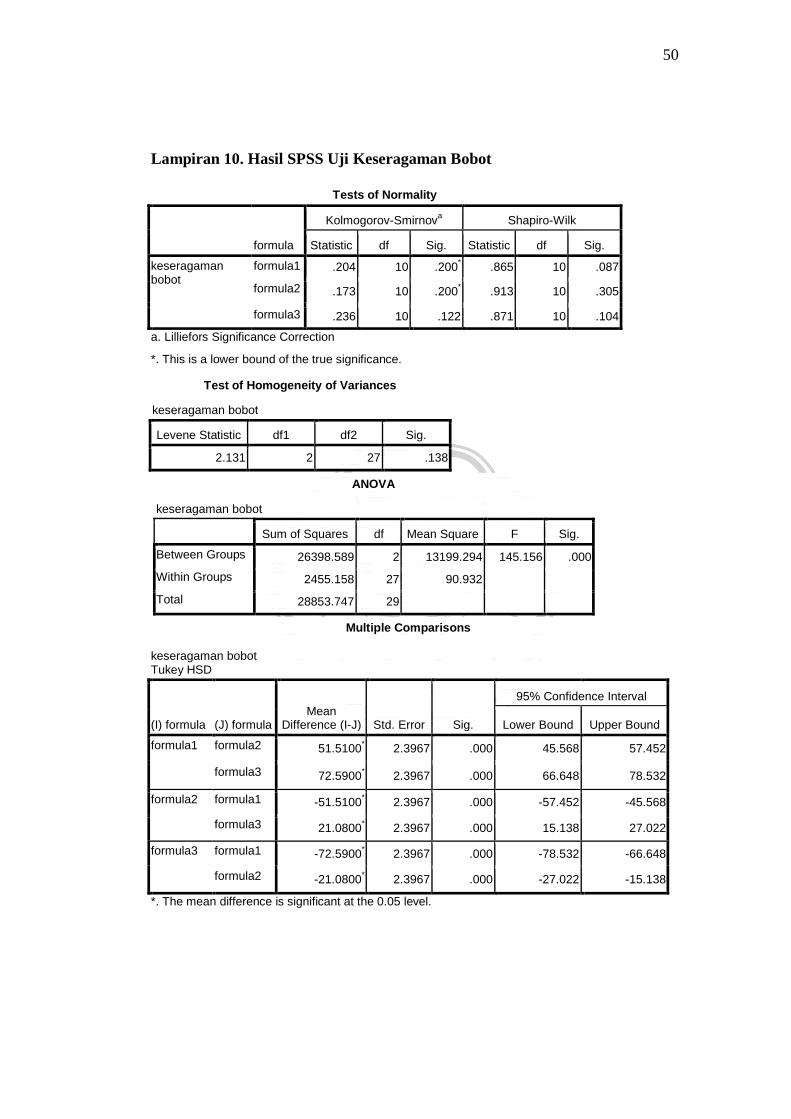
Lampiran 10. Hasil SPSS Uji Keseragaman Bobot
Tests of Normality
formula
Kolmogorov-Smirnova Shapiro-Wilk
Statistic df Sig. Statistic df Sig.
keseragaman bobot
formula1 .204 10 .200* .865 10 .087
formula2 .173 10 .200* .913 10 .305
formula3 .236 10 .122 .871 10 .104
a. Lilliefors Significance Correction
*. This is a lower bound of the true significance.
Test of Homogeneity of Variances
keseragaman bobot
Levene Statistic df1 df2 Sig.
2.131 2 27 .138
ANOVA
keseragaman bobot
Sum of Squares df Mean Square F Sig.
Between Groups 26398.589 2 13199.294 145.156 .000
Within Groups 2455.158 27 90.932
Total 28853.747 29
Multiple Comparisons
keseragaman bobot Tukey HSD
(I) formula (J) formula Mean
Difference (I-J) Std. Error Sig.
95% Confidence Interval
Lower Bound Upper Bound
formula1 formula2 51.5100* 2.3967 .000 45.568 57.452
formula3 72.5900* 2.3967 .000 66.648 78.532
formula2 formula1 -51.5100* 2.3967 .000 -57.452 -45.568
formula3 21.0800* 2.3967 .000 15.138 27.022
formula3 formula1 -72.5900* 2.3967 .000 -78.532 -66.648
formula2 -21.0800* 2.3967 .000 -27.022 -15.138
*. The mean difference is significant at the 0.05 level.
51
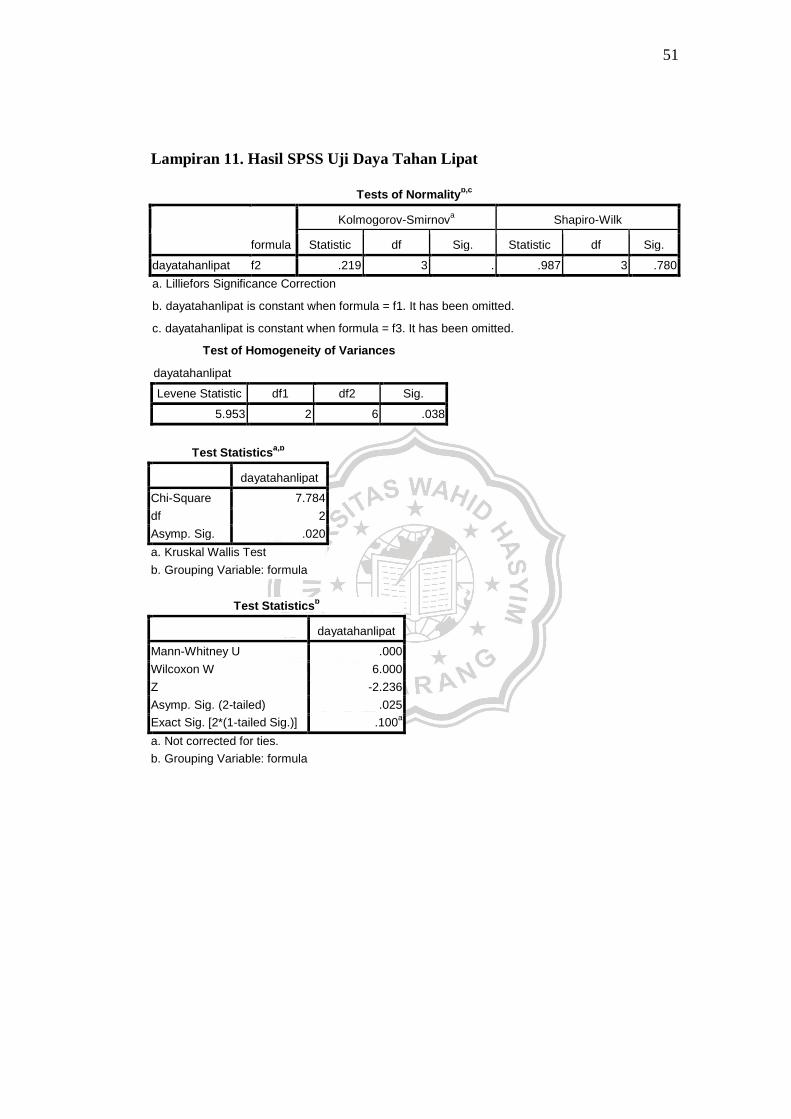
Lampiran 11. Hasil SPSS Uji Daya Tahan Lipat
Tests of Normalityb,c
formula
Kolmogorov-Smirnova Shapiro-Wilk
Statistic df Sig. Statistic df Sig.
dayatahanlipat f2 .219 3 . .987 3 .780
a. Lilliefors Significance Correction
b. dayatahanlipat is constant when formula = f1. It has been omitted.
c. dayatahanlipat is constant when formula = f3. It has been omitted.
Test of Homogeneity of Variances
dayatahanlipat
Levene Statistic df1 df2 Sig.
5.953 2 6 .038
Test Statistics
a,b
dayatahanlipat
Chi-Square 7.784
df 2
Asymp. Sig. .020
a. Kruskal Wallis Test
b. Grouping Variable: formula
Test Statistics
b
dayatahanlipat
Mann-Whitney U .000
Wilcoxon W 6.000
Z -2.236
Asymp. Sig. (2-tailed) .025
Exact Sig. [2*(1-tailed Sig.)] .100a
a. Not corrected for ties.
b. Grouping Variable: formula
52
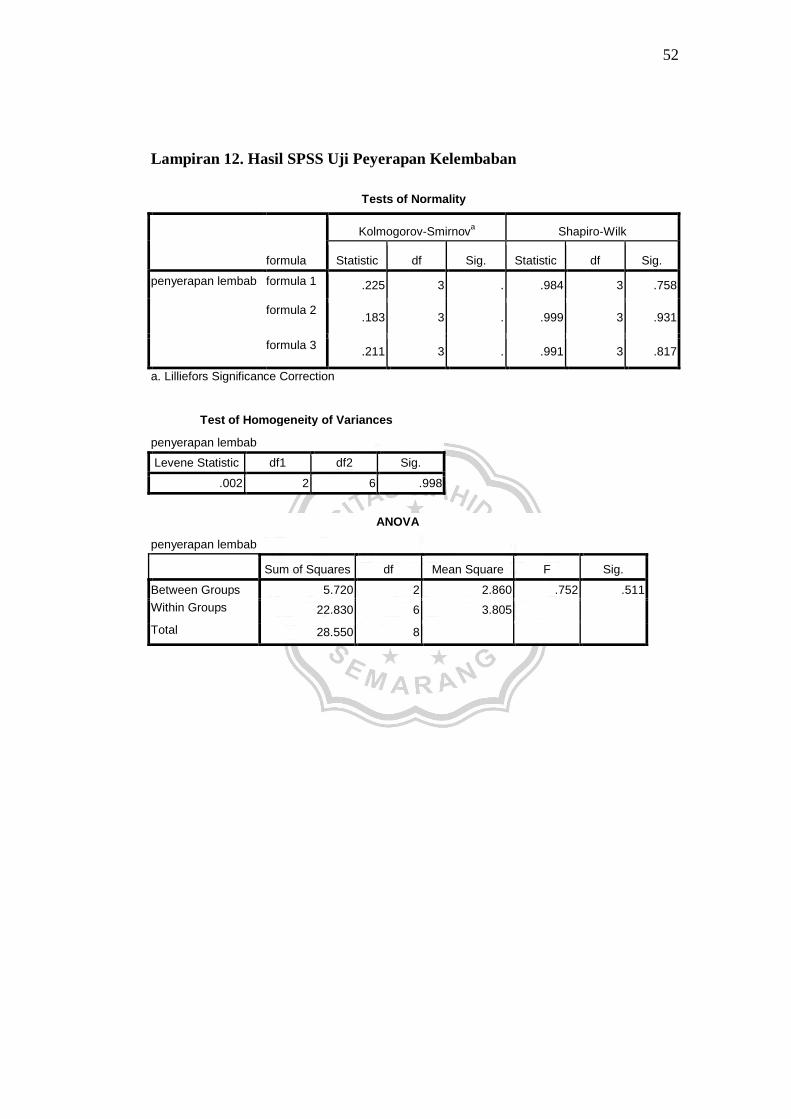
Lampiran 12. Hasil SPSS Uji Peyerapan Kelembaban
Tests of Normality
formula
Kolmogorov-Smirnova Shapiro-Wilk
Statistic df Sig. Statistic df Sig.
penyerapan lembab formula 1 .225 3 . .984 3 .758
formula 2 .183 3 . .999 3 .931
formula 3 .211 3 . .991 3 .817
a. Lilliefors Significance Correction
Test of Homogeneity of Variances
penyerapan lembab
Levene Statistic df1 df2 Sig.
.002 2 6 .998
ANOVA
penyerapan lembab
Sum of Squares df Mean Square F Sig.
Between Groups 5.720 2 2.860 .752 .511
Within Groups 22.830 6 3.805
Total 28.550 8
53
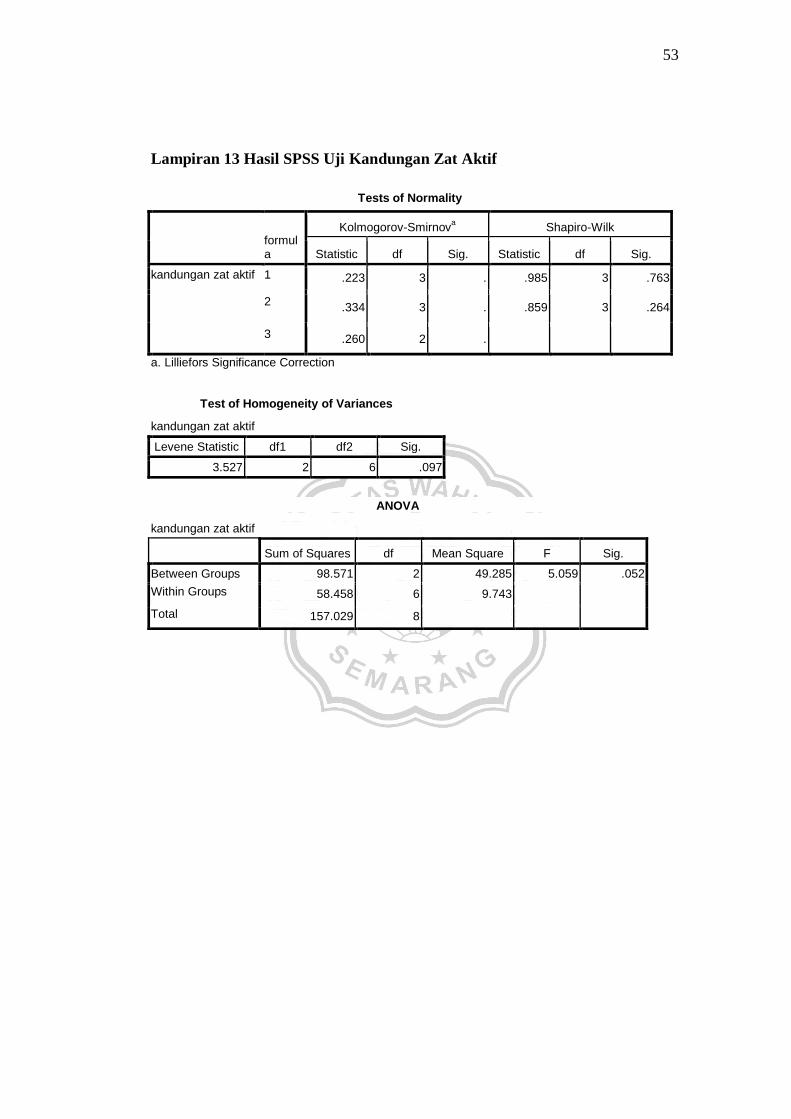
Lampiran 13 Hasil SPSS Uji Kandungan Zat Aktif
Tests of Normality
formula
Kolmogorov-Smirnova Shapiro-Wilk
Statistic df Sig. Statistic df Sig.
kandungan zat aktif 1 .223 3 . .985 3 .763
2 .334 3 . .859 3 .264
3 .260 2 .
a. Lilliefors Significance Correction
Test of Homogeneity of Variances
kandungan zat aktif
Levene Statistic df1 df2 Sig.
3.527 2 6 .097
ANOVA
kandungan zat aktif
Sum of Squares df Mean Square F Sig.
Between Groups 98.571 2 49.285 5.059 .052
Within Groups 58.458 6 9.743
Total 157.029 8

54
Lampiran 14. Hasil SPSS Uji Disolusi Obat secara In Vitro
ANOVA
persenterlarut
Sum of Squares df Mean Square F Sig.
Between Groups 111.503 2 55.752 5.008 .022
Within Groups 166.998 15 11.133
Total 278.502 17
Tests of Normality
formula
Kolmogorov-Smirnova Shapiro-Wilk
Statistic df Sig. Statistic df Sig.
persenterlarut formula 1 .144 6 .200* .971 6 .901
formula 2 .207 6 .200* .937 6 .634
formula 3 .184 6 .200* .946 6 .708
a. Lilliefors Significance Correction
*. This is a lower bound of the true significance.
Test of Homogeneity of Variance
Levene Statistic df1 df2 Sig.
persenterlarut Based on Mean .399 2 15 .678
Based on Median .362 2 15 .703
Based on Median and with adjusted df
.362 2 12.798 .704
Based on trimmed mean .403 2 15 .676
Multiple Comparisons
persenterlarut Tukey HSD
(I) formula (J) formula Mean Difference
(I-J) Std. Error Sig.
95% Confidence Interval
Lower Bound Upper Bound
formula 1 formula 2 1.78833 1.92641 .631 -3.2155 6.7921
formula 3 5.94167* 1.92641 .019 .9379 10.9455
formula 2 formula 1 -1.78833 1.92641 .631 -6.7921 3.2155
formula 3 4.15333 1.92641 .112 -.8505 9.1571
formula 3 formula 1 -5.94167* 1.92641 .019 -10.9455 -.9379
formula 2 -4.15333 1.92641 .112 -9.1571 .8505
*. The mean difference is significant at the 0.05 level.
Copyright © 2022 FDOKUMEN

