Zornitza Ganeva and Valentyna Pavlenko - Conception of the transition to adulthood: Ukrainian case
17
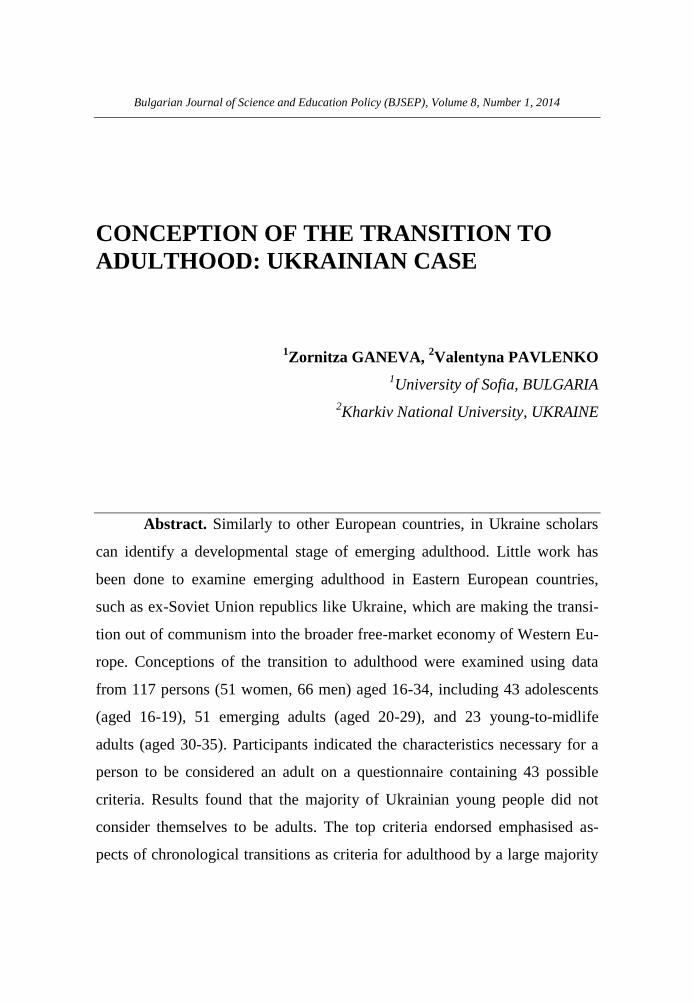
Bulgarian Journal of Science and Education Policy (BJSEP), Volume 8, Number 1, 2014 CONCEPTION OF THE TRANSITION TO ADULTHOOD: UKRAINIAN CASE 1 Zornitza GANEVA, 2 Valentyna PAVLENKO 1 University of Sofia, BULGARIA 2 Kharkiv National University, UKRAINE Abstract. Similarly to other European countries, in Ukraine scholars can identify a developmental stage of emerging adulthood. Little work has been done to examine emerging adulthood in Eastern European countries, such as ex-Soviet Union republics like Ukraine, which are making the transi- tion out of communism into the broader free-market economy of Western Eu- rope. Conceptions of the transition to adulthood were examined using data from 117 persons (51 women, 66 men) aged 16-34, including 43 adolescents (aged 16-19), 51 emerging adults (aged 20-29), and 23 young-to-midlife adults (aged 30-35). Participants indicated the characteristics necessary for a person to be considered an adult on a questionnaire containing 43 possible criteria. Results found that the majority of Ukrainian young people did not consider themselves to be adults. The top criteria endorsed emphasised as- pects of chronological transitions as criteria for adulthood by a large majority
Transcript of Zornitza Ganeva and Valentyna Pavlenko - Conception of the transition to adulthood: Ukrainian case
Bulgarian Journal of Science and Education Policy (BJSEP), Volume 8, Number 1, 2014
CONCEPTION OF THE TRANSITION TO
ADULTHOOD: UKRAINIAN CASE
1Zornitza GANEVA,
2Valentyna PAVLENKO
1University of Sofia, BULGARIA
2Kharkiv National University, UKRAINE
Abstract. Similarly to other European countries, in Ukraine scholars
can identify a developmental stage of emerging adulthood. Little work has
been done to examine emerging adulthood in Eastern European countries,
such as ex-Soviet Union republics like Ukraine, which are making the transi-
tion out of communism into the broader free-market economy of Western Eu-
rope. Conceptions of the transition to adulthood were examined using data
from 117 persons (51 women, 66 men) aged 16-34, including 43 adolescents
(aged 16-19), 51 emerging adults (aged 20-29), and 23 young-to-midlife
adults (aged 30-35). Participants indicated the characteristics necessary for a
person to be considered an adult on a questionnaire containing 43 possible
criteria. Results found that the majority of Ukrainian young people did not
consider themselves to be adults. The top criteria endorsed emphasised as-
pects of chronological transitions as criteria for adulthood by a large majority

130
in the study. Among the criteria indicated with least influence are family ca-
pacities.
Keywords: criteria for adulthood, emerging adulthood, identity,
Ukraine
Introduction
It is an indisputable fact that, since mid-19 century on world-wide
scale in all post-industrial societies, the time of transition from adolescence
before entering the world of adults has increased for young people (Arnett,
1998). They remain in school longer, marry and have their first child at in-
creasingly late age in comparison to the generation of their parents (White,
2003). Arnett (1998), after performed investigations in various countries with
young people who officially had ended the period of adolescence but still
didn`t feel completely adults, introduces the term “emerging adulthood” for
the period examined, which encompasses the age between 18 and 28 years.
In most societies, the life transition to adulthood is a significant stage
of human development (Goossens, 2001). During it, important life events,
such as finishing the compulsory education, leaving the parents’ home, find-
ing a job, contracting a marriage or entering the role of a parent, take place.
Young people in this period increasingly ponder on how to solve their life
tasks they face, determine their future goals and make efforts to realise them.
Their distinguishing feature is the willingness to take risks, to experiment and
to be free. More and more researchers direct their efforts to an in-depth study,
analysis and understanding of the prerequisites and consequences of the peri-
od of emerging adulthood, to which the present study belongs.
Young people in the period of emerging adulthood perceive them-
selves as older than adolescents, but having not yet entered the world of

131
adults. According to Arnett (2000), “Having left the dependency of childhood
and adolescence, and having not yet entered the enduring responsibilities that
are normative in adulthood, emerging adults often explore a variety of possi-
ble life directions in love, work, and worldviews”. In the development of the
theoretical point of view offered by him, he based himself on authors who
have created before him, such as (Erickson, 1968) and (Keniston, 1970). Ac-
cording to Erickson (1968), the formation of the identity is a main life task in
the period examined, which is positioned between the 5th
and 6th
stage in the
classification he makes. When building his theory, Arnett bore in mind the
demographic and social changes that have taken place in the post-industrial
societies, whereas Keniston (1970) directed his attention mainly to young
people who have participated in the protests at the end of the 60s, i.e., empha-
sis is placed rather on the historic moment than on the main features of young
people of this period.
Arnett (2004) defined the distinguishing features of the period exam-
ined; the feeling in-between, between adolescence and adulthood, the active
exploration of the own identity, more specifically in fields such as employ-
ment, intimate life and views of the world, self-focus not in the sense of ego-
centrism, but for lack of obligations towards the others, instability caused by
intensive changes in the social status, in the relationships with the intimate
partner, in the labour positions occupied, in the choice of a speciality for edu-
cation, and many possibilities provided or an optimism to arrange the own life
in the direction desired.
The context of the study
The Republic of Ukraine is a country in Eastern Europe with a capital
Kiev and population of 45.5 million people. On 24 August 1991, independ-
ence from the USSR was declared. Administratively, it is divided into one
autonomous republic (Crimea), 24 oblasts (provinces) and 2 cities of special
132
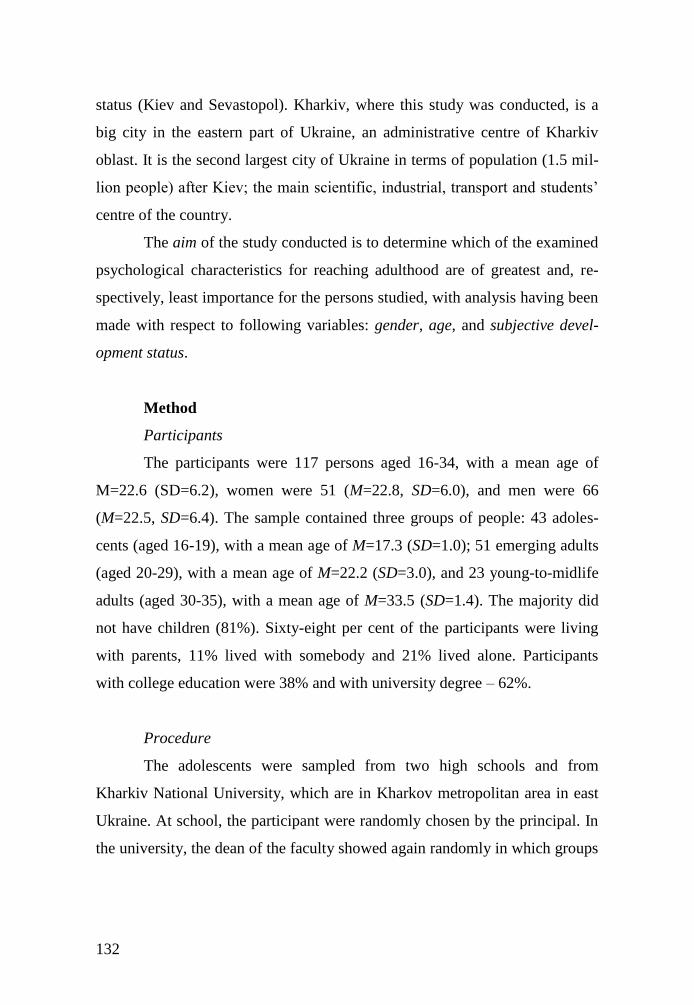
status (Kiev and Sevastopol). Kharkiv, where this study was conducted, is a
big city in the eastern part of Ukraine, an administrative centre of Kharkiv
oblast. It is the second largest city of Ukraine in terms of population (1.5 mil-
lion people) after Kiev; the main scientific, industrial, transport and students’
centre of the country.
The aim of the study conducted is to determine which of the examined
psychological characteristics for reaching adulthood are of greatest and, re-
spectively, least importance for the persons studied, with analysis having been
made with respect to following variables: gender, age, and subjective devel-
opment status.
Method
Participants
The participants were 117 persons aged 16-34, with a mean age of
M=22.6 (SD=6.2), women were 51 (M=22.8, SD=6.0), and men were 66
(M=22.5, SD=6.4). The sample contained three groups of people: 43 adoles-
cents (aged 16-19), with a mean age of M=17.3 (SD=1.0); 51 emerging adults
(aged 20-29), with a mean age of M=22.2 (SD=3.0), and 23 young-to-midlife
adults (aged 30-35), with a mean age of M=33.5 (SD=1.4). The majority did
not have children (81%). Sixty-eight per cent of the participants were living
with parents, 11% lived with somebody and 21% lived alone. Participants
with college education were 38% and with university degree – 62%.
Procedure
The adolescents were sampled from two high schools and from
Kharkiv National University, which are in Kharkov metropolitan area in east
Ukraine. At school, the participant were randomly chosen by the principal. In
the university, the dean of the faculty showed again randomly in which groups

133
to conduct the survey. Over 95% of the asked persons agreed to participate.
The questionnaire took about 18-20 minutes to complete.
Measures
The participants were asked to fill in a 52-item questionnaire on the
transition to adulthood. There were 43 items on the questionnaire participants
were asked to “indicate whether you think the following must be achieved
before a person can be considered to be an adult” (Arnett, 2004). They could
indicate one of 4-graded Likert rating scale from: 1 – “very important”, 2 –
“quite important”, 3 – “slightly important” and 4 – “not at all important”.
These 43 items form 7 emerging adulthood markers (subscales):
Independence (6 items, an example of a questions is: “No longer living in
parents’ household”.), Interdependence (5 items, an example of an item is:
“Committed to long-term love relationship”.), Role Transitions (6 items, an
example: “Have at least one child”.), Norm Compliance (8 items, for example:
“Avoid becoming drunk”.), Biological Transitions (4 items, of which 3 are for
men and 3 for women, an example of an item is: “Have had sexual
intercourse”.), Chronological Transitions (5 items if a man and 6 items if a
woman, an example of a questions is: “Have obtained driver’s licence and can
drive a car.”) and Family Capacities (8 items, of which 4 are for women and 3
for men, for example: “If a woman, become capable of running a household”
and “Become capable of keeping family physically safe (men).”). No items
are reversed.
The participants were asked on the questionnaire: (i) “What are the
three most important things for a person to be considered an adult? You may
answer by writing in the numbers of any of the 43 items above, or by writing
in your own response”; (ii) In addition, a variety of questions concerning
background and demographic information were included.
134
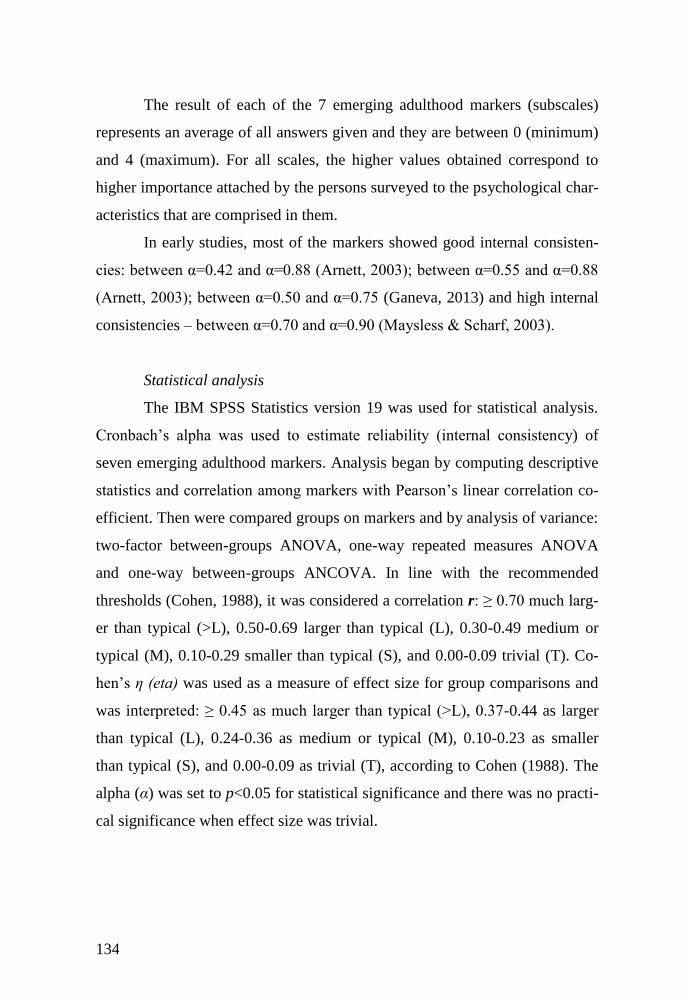
The result of each of the 7 emerging adulthood markers (subscales)
represents an average of all answers given and they are between 0 (minimum)
and 4 (maximum). For all scales, the higher values obtained correspond to
higher importance attached by the persons surveyed to the psychological char-
acteristics that are comprised in them.
In early studies, most of the markers showed good internal consisten-
cies: between α=0.42 and α=0.88 (Arnett, 2003); between α=0.55 and α=0.88
(Arnett, 2003); between α=0.50 and α=0.75 (Ganeva, 2013) and high internal
consistencies – between α=0.70 and α=0.90 (Maysless & Scharf, 2003).
Statistical analysis
The IBM SPSS Statistics version 19 was used for statistical analysis.
Cronbach’s alpha was used to estimate reliability (internal consistency) of
seven emerging adulthood markers. Analysis began by computing descriptive
statistics and correlation among markers with Pearson’s linear correlation co-
efficient. Then were compared groups on markers and by analysis of variance:
two-factor between-groups ANOVA, one-way repeated measures ANOVA
and one-way between-groups ANCOVA. In line with the recommended
thresholds (Cohen, 1988), it was considered a correlation r: ≥ 0.70 much larg-
er than typical (>L), 0.50-0.69 larger than typical (L), 0.30-0.49 medium or
typical (M), 0.10-0.29 smaller than typical (S), and 0.00-0.09 trivial (T). Co-
hen’s η (eta) was used as a measure of effect size for group comparisons and
was interpreted: ≥ 0.45 as much larger than typical (>L), 0.37-0.44 as larger
than typical (L), 0.24-0.36 as medium or typical (M), 0.10-0.23 as smaller
than typical (S), and 0.00-0.09 as trivial (T), according to Cohen (1988). The
alpha (α) was set to p<0.05 for statistical significance and there was no practi-
cal significance when effect size was trivial.

135
Results
Descriptive statistics and correlation analysis
The descriptive statistics and the results of the correlation analysis of 7
adulthood markers are presented in Table 1.
Table 1. Sample correlation matrix, means (M), standard deviations (SD),
observed and maximum range for seven emerging adulthood markers
correlation between and markers for transition to adulthood
1. 2. 3. 4. 5. 6. 7.
1. Independence 1 2. Interdependence 0.46
*** 1 3. Role Transitions 0.35
*** 0.43*** 1
4. Norm Compliance 0.22 0.32*** 0.45
*** 1 5. Biological Transi-
tions 0.27
** 0.10 0.22** 0.34
*** 1
6. Chronological
Transitions 0.22
** 0.18* 0.35
*** 0.30** 0.75
*** 1
7. Family Capacities 0.47*** 0.54
*** 0.55*** 0.41
*** 0.09 0.07 1 age
-0.02 -0.12 -0.17 0.14 -
0.24**
-0.22* -0.05
gender 0.19
-
0.03**
-0.01 0.16* 0.24
* 0.05* 0.21
*
children -0.11 -0.14 0.07
-
0.24**
-0.09 -0.18 -0.10
education -
0.06**
-0.07 0.18 0.14 0.23** 0.49
*** -0.06
development status -
0.28**
-
0.15**
-0.02 -0.19 -
0.21**
-
0.26**
-0.07
living with parents -0.11* -0.23 0.14 0.07 0.10 0.24 -0.04
M 2.09 2.08 2.34 2.16 2.21 2.68 1.93 SD 0.56 0.62 0.68 0.69 0.92 0.89 0.67 Observed range 1.0,
3.67 1.0,
4.0 1.0,
3.83 1.0,
4.0 1.0,
4.0 1.0,
4.0 1.0,
4.0 Maximum range 1.0,
4.00 1.0,
4.0 1.0,
4.00 1.0,
4.0 1.0,
4.0 1.0,
4.0 1.0,
4.0 Note: seven markers and variables age, education (1-college, 2-university), development sta-
tus (1-adolescent, 2-emerging adult, 3-fully adult) were analysed using Pearson’s linear corre-
lation coefficients; dichotomous variables gender (1-men, 2-women), children (0-no, 1-yes),
living with parents (1-yes, 2-no) were analysed using point-biserial correlation; * p<0.05;
**
p<0.01; ***
p<0.001.
136
Except for the marker Chronological Transitions, their mean values M
are lower than the mean value for the maximum range of variation M=2.50.
This shows that the respondents as a whole feel less adult with respect to each
of the markers shown. The standard deviation SD is also approximately equal,
which shows homogeneity in the answers of the respondents. Most homoge-
neous are their answers for Independence SD=0.56, and most heterogeneous
are their answers for Biological Transitions SD=0.92. The range examined for
five of the seven markers coincides with the maximum possible range, which
shows that the respondents have had the maximum possible different opinion.
Reliability and validity
The interval consistency (Cronbach’s alpha) for 7 adulthood markers
was between α=0.61 and α=0.83. The internal reliability of the Independence
marker that consist of 6 items is α=0.61 for the whole sample; of the Interde-
pendence marker that consist of 5 items is α=0.66; of the Role Transitions
marker that consist of 6 items is α=0.71; of the Norm Compliance marker that
consist of 8 items is α=0.80; of the Biological Transitions marker that consist
of 4 items is α=0.73; of the Chronological Transitions marker that consist of 6
items is α=0.83 and of the Family Capacities marker that consist of 8 items is
α=0.66.
Organisation of the markers (subscales) was guided by theoretical cri-
teria rather than by a quantitative statistical approach such as factor analysis
(Arnett, 2004). That is why in order to explore construct validity of the scale,
instead of confirmatory factor analysis (43 items and 7 subscales) Pearson’s
linear correlation coefficients between the markers were analysed (Table 1).
The correlations between markers were generally low and middle and that is
why they could be interpreted rather as independent markers than as subscales
of one total scale. That is way all 7 markers will be analysed only separately
(Arnett, 2004).

137
Marker comparisons by gender and age
Seven two-factor between-groups ANOVAs were conducted to ex-
plore the impact of gender and age (independent variables) on mean of mark-
ers (dependent variable). Subjects were divided into three age groups accord-
ing to their age (adolescents: 16-19, emerging adults: 20-29 and young-to-
midlife adults: 30-35) and two gender groups – male and female. The interac-
tion effect between gender and age groups was significant for Biological
Transitions marker: F(2,111)=2.86, p=0.05 with a small effect size,
η(eta)=0.12, however, it was not statistically and practically significant for the
rest of the markers: Independence F(2,111)=0.36, p=0.70, η(eta)=0.08; Inter-
dependence marker F(2,111)=0.06, p=0.94, η(eta)=0.01; Role Transitions
marker F(2,111)=0.66, p=0.52, η(eta)=0.02; Norm Compliance marker
F(2,111)=0.48, p=0.62, η(eta)=0.03; Chronological Transitions marker
F(2,111)=1.19, p=0.16, η(eta)=0.06 and Family Capacities marker
F(2,111)=1.13, p=0.33, η(eta)=0.04. The results show that the combined, sim-
ultaneous effect of gender and age only affects the Biological Transitions
marker.
Gender and marker comparison
The average of markers for the whole sample and for men and women
is shown in Table 2. Analyses were conducted on the markers to examine re-
spondents’ overall evaluations of the importance of each of the seven areas
included in the markers. To compare markers, a repeated measures ANOVA
with Wilks’ Lambda multivariate test was conducted for the whole sample
and for men and women. Post hoc constructs using Bonferroni adjustment
revealed all the differences. In all three cases, most significant is the Chrono-
logical Transitions marker, and least significant – the Family Capacities
marker.

138
Table 2. Average of markers, for a whole sample and for men and women
markers for transition to adulthood All gender statistics
men women p η(eta) Independence 2.09
ab 1.95a 2.19
a 0.02 0.22,S Interdependence 2.08
ab 2.10ab 2.07
a 0.75 0.03,T Role Transitions 2.34
b 2.35bc 2.34
ab 0.58 0.01,T Norm Compliance 2.16
ab 2.05ab 2.24
a 0.05 0.14,S Biological Transitions 2.21
b 1.97ab 2.40
ab 0.02 0.24,M Chronological Transitions 2.68
c 2.63c 2.72
b 0.61 0.04,T Family Capacities 1.93
a 1.77a 2.05
a 0.03 0.21,S
p <0.001 <0.001 <0.001 η(eta) 0.70,>L 0.83, >L 0.62, >L Note: low scores represent low relevant importance of the marker, and high score represent
high relevant importance; (1-minimum, 4-maximum); p-values in bold typeface are signifi-
cant at the p<0.05 level; means with separate letters differ significantly at the p<0.05 level.
The letters (a, b, c, d) indicate which values per column (variable) differ from each other; data
analyses using one-way repeated measures ANOVA with Wilks’ Lambda multivariate test
and Bonferroni pairwise comparison (by columns) and one-way between-groups ANCOVA
(by rows).
In order to find if there is a difference between men’s and women’s
mean for every marker, one-way between-groups ANCOVA with age as a
covariate was conducted for every marker. Age was used as a covariate be-
cause of a high age difference of respondents – between 16 and 34 years. The
results of the analysis of covariate show that there is a statistically significant
effect of the covariate age on the independent variable gender in the case of
the following markers: Norm Compliance: F(1,114)=8.01, p=0.01,
eta(η)=0.26; Biological Transitions: F(1,114)=5.60, p=0.02, eta(η)=0.22, and
independent variable gender is significant (Table 2); and Chronological Tran-
sitions: F(1,114)=6.22, p=0.01, eta(η)=0.23. The covariate age is not statisti-
cally significant for markers Independence: F(1,114)=1.81, p=0.18,
eta(η)=0.09, gender is significant; Interdependence: F(1,114)=3.20, p=0.08,
eta(η)=0.16; Role Transitions: F(1,114)=2.19, p=0.14, eta(η)=0.16; Family
Capacities: F(1,114)=0.18, p=0.67, eta(η)=0.04, gender is significant. Gender
differences are only observed for three of the seven markers: Independence,

139
Biological Transitions and Family Capacities, with women in all the three
cases attaching greater importance to the respective marker in comparison to
men. For the Norm Compliance marker, there is only a practical significance,
with women also in this case attaching greater importance to the marker.
The results presented in Table 2 show that all persons surveyed attach
greatest importance to Chronological Transitions and least one to Family Ca-
pacities followed by Biological Transitions and Role Transitions.
The group of women attaches equally great importance to the Inde-
pendence, Interdependence, Norm Compliance and Family Capacities mark-
ers. To men, of greatest importance is the criterion Chronological Transitions,
and of least one – Independence and Family Capacities.
Age group and marker comparison
In order to find the difference between adolescents, emerging adults
and midlife adults (Table 3), one-way between-groups ANCOVA with gender
as a covariate was conducted for every marker. Gender was a covariate be-
cause some of the items on the questionary were gender-specific. The results
of the analysis of covariate show that there is a statistically significant effect
of the covariate gender on the independent variable age group in the case of
the following markers: Independence: F(1,113)=5.62, p=0.02, eta(η)=0.22;
Biological Transitions: F(1,113)=9.38, p=0.01, eta(η)=0.28, and Family Ca-
pacities: F(1,113)=4.88, p=0.03, eta(η)=0.20. The covariate gender is not sta-
tistically significant for markers Interdependence: F(1,113)=0.10, p=0.76,
eta(η)=0.03; Role Transitions: F(1,113)=0.01, p=0.98, eta(η)=0.01; Norm
Compliance: F(1,113)=2.55, p=0.11, eta(η)=0.15 and Chronological Transi-
tions: F(1,113)=0.99, p=0.32, eta(η)=0.09. In the case of three of the seven
markers, a difference between the age groups is observed, with the oldest
group (midlife adults) in all the three cases feeling least adult.

140
To compare markers for every age group, a repeated measures ANO-
VA with Wilks’ Lambda multivariate test was conducted. Post hoc constructs
using Bonferroni adjustment revealed all the differences. Chronological Tran-
sitions and Family capacities were the most and the least important for adoles-
cents and for emerging adults, but for a midlife adults, Chronological Transi-
tions was one of the most important areas.
With the increase of the age of the persons surveyed, however, their
opinion changes and to the midlife adults surveyed of greatest importance is
Role Transitions. The three age groups attach different importance to the Bio-
logical Transitions and Chronological Transitions markers. To emerging
adults, it is of greater importance in comparison to midlife adults.
Table 3. Average of markers for age groups (adolescents: 16-19, emerging
adults: 20-29 and midlife adults: 30-35)
markers for transition to
adulthood
age groups statistics
adolescents emerging
adults midlife
adults p η(eta) Independence 2.10
ab 2.13ab 1.97
ab 0.46 0.09,S Interdependence 2.16
ab 2.09ab 1.90
a 0.27 0.07,S Role Transitions 2.23
ab 2.36bc 2.51
b 0.28 0.05,S Norm Compliance 2.19
ab 2.26abc 1.88
a (0.05) 0.21,S Biological Transitions 2.18
ab2 2.56c2 1.51
a1 <0.001 0.47,>L Chronological Transitions 2.51
b2 3.19d3 1.87
a1 <0.001 0.67,>L Family Capacities 1.97
a 1.88a 1.97
ab 0.85 0.05,T
p <0.001 <0.001 <0.001 η(eta) 0.65,>L 0.90,>L 0.86,>L Note: low scores represent low relevant importance, and high score represent high relevant
importance; (1-minimum, 4-maximum); p-values in bold typeface are significant at the
p<0.05 level; means with separate letters (numbers) differ significantly at the p<0.05 level.
The letters (a, b, c, d) or numbers (1, 2, 3, 4) indicate which values per column (row) differ
from each other; where a p-value appears in parenthesis (), the significant effect could not be
located by the post hoc tests; data analyses using one-way repeated measures ANOVA with
Wilks’ Lambda multivariate test and Bonferroni pairwise comparison (by columns) and one-
way between-groups ANCOVA (by rows).

141
Development status (reached adulthood) analysis
To compare markers for every reached adulthood’s group, a repeated
measures ANOVA with Wilks’ Lambda multivariate test was conducted. Post
hoc constructs using Bonferroni adjustment revealed all the differences. In all
the three cases, most important is the Chronological Transitions marker, and
least important – the Family Capacities marker.
Table 4. Average of scales by Development status (Reached adulthood),
three groups: “no”, “in some ways yes, in some ways no” and “yes”
markers for transition to
adulthood
Reached adulthood (development status)
statistics
no yes/no yes p η(eta) Independence 2.33
ab2 2.16ab12 1.90
ab1 0.01 0.28,M Interdependence 2.25
ab 2.12ab 1.96
ab 0.19 0.17,S Role Transitions 2.44
ab 2.30ab 2.36
ab 0.74 0.07,T Norm Compliance 2.24
ab 2.32ab 1.93
ab (0.02) 0.27,M Biological Transitions 2.35
ab 2.41b 1.90
ab (0.02) 0.25,M Chronological Transitions 2.88
b2 2.89c2 2.35
b1 0.01 0.31,M Family Capacities 2.00
a 1.95a 1.88
a 0.84 0.05,T
p <0.001 <0.001 <0.001 η(eta) 0.84,>L 0.79,>L 0.73,>L Note: see notes to Table 3.
In order to find the difference between the three groups of reached
adulthood: yes, no and between (yes/no) (Table 4), a one-way between-groups
ANCOVA with gender as a covariate was conducted for every marker. The
results of the analysis of covariate show that there is a statistically significant
effect of the covariate Reached adulthood on the independent variable age
group in the case of the following markers: Independence: F(1,113)=4.78,
p=0.01, eta(η)=0.22; Biological Transitions: F(1,113)=6.28, p=0.01,
eta(η)=0.23 and Family Capacities: F(1,113)=4.83, p=0.03, eta(η)=0.20. The
covariate gender is not statistically significant for markers Interdependence:
F(1,113)=0.17, p=0.68, eta(η)=0.04; Role Transitions: F(1,113)=0.01, p=0.91,
eta(η)=0.00; Norm Compliance: F(1,113)=1.99, p=0.16, eta(η)=0.13 and

142
Chronological Transitions: F(1,113)=0.14, p=0.71, eta(η)=0.03. For four of
the seven markers, a difference between the three groups of development sta-
tus is observed, with the values of all the four markers being minimum for the
reached adulthood group.
The results presented in Table 4 show that all persons surveyed attach
least importance to the Family Capacities marker, and greatest one to the
Chronological Transitions. The Independence marker is of least importance to
the persons surveyed, who have not entered the world of adults. To young
people who feel adult, of least importance is the Chronological Transitions
marker.
Discussion
The aim of the study is to determine which of the examined psycho-
logical characteristics for reaching adulthood are of greatest and, respectively,
least importance to the persons studied. The analysis were conducted in re-
spect to the following variables: gender, age, and subjective development sta-
tus. All persons surveyed attach greatest importance to Chronological Transi-
tions, such as being 18 and coming of age, which allows obtaining a driving
licence, permission to smoke cigarettes and drink alcohol, and least one to
Family Capacities followed by Biological Transitions and Role Transitions.
Striking is the difference importance attached to the Independence, Biological
Transitions and Family Capacities markers, such as founding own family and
taking care of its members, keeping house, etc., by the men and women sur-
veyed. To the group of women, those markers are of greater importance in
comparison to men.
Logically, the results obtained show that young people in Ukraine,
probably because of financial difficulties and standard in the country, are
hardly allowed to take independent decisions and feel independent to a low
extent both of their parents and the society as a whole. They are similar to the

143
results of the study conducted (Schlegel & Barry III, 1991) on development of
adolescents from 186 cultures different from the West European one, which
show that the transition and entry into the adults’ world are not characterised
by individualistic criteria, such as financial and emotional independence of the
parents, leaving their home and establishing equal relations with them, charac-
teristic of the American society. In respect to those studied in the USA
(Arnett, 2004), most important is the financial and emotional independence of
the parents, leaving their home and living independently. This trend could find
its explanation in the fact that the Ukrainian society is more collectivist in
comparison to the American one.
Another trend that is observed in the persons studied from Ukraine,
who are not an exception from the same generation in Western Europe, is that
young people do not wish to found a family and to have children up to the age
of 35, they postpone in time the commitment to a matrimonial partner, and
when this happens, they are assisted in the bringing-up of the offspring by
their parents. It is an indisputable fact that the birth of a child also provokes
the increased attention of grandmothers and grandfathers to everything in the
life of the young parents who do not feel independent and self-dependent.
Although in the modern world the role of grandmothers and grandfathers in
the life of their heirs changes over the years, they devote their labour, support,
time, worldly knowledge accumulated and assistance, staying invariably next
to their children and grandchildren. No matter what changes in the relations
between the generations, the grandmother and the grandfather in Ukraine con-
tinue to be a symbol of stability, tradition, customs, collective memory, of
tranquillity and security. Their images personify the traditions in the penum-
bra of the newly formed familial nucleus.
The future of each nation depends to a great extent on what conditions
for its young generation are created, what the attitude towards it is and how it
is realised. A recommendation from the study conducted to the political elite

144
in Ukraine is to direct its efforts to pursuance of an active, constant, purpose-
ful and flexible policy for support to and development of young people in the
country. A good idea is to develop and to offer to them participation in na-
tional and international programmes for hourly or half-day employment in
order to increase their “independence of the pocket”.
REFERENCES
Arnett, J.J. (1998). Learning to stand alone: the contemporary American tran-
sition to adulthood in cultural and historical context. Human Develop-
ment, 41, 295-315.
Arnett, J.J. (2000). High hopes in a grim world: emerging adults’ views of
their futures and of “Generation X”, Youth & Society, 31, 267–286.
Arnett, J.J. (2003). Conceptions of the transition to adulthood among emerg-
ing adults in American ethnic groups. New Directions for Child & Ad-
olescences Development, 2003(100), 63-75.
Arnett, J.J. (2004). Emerging adulthood: the winding road from the late teens
through the twenties. New York: Oxford University Press.
Cohen, J. (1988). Statistical power analysis for the behavioral sciences.
Mahwah: Lawrence Erlbaum Associates.
Erikson, E.H. (1968). Identity, youth and crisis. New York: Norton.
Ganeva, Z. (2013). Conception of the transition to adulthood: Bulgaria case
(pp. 124-143). In: Rašticová, M., Putnová, A., Konečny, S., Schüller,
D., Musilová, H., Kolarova, I., Covarrubias Venegas, B., Groblschegg,
S., Genkova, P., Okonek, R., Rafnsdottir, L., Heijstra, T. & Ganeva, Z.
(Eds.). Age management: actual challenges and promising solutions
regarding the ageing European population. Brno: CERM.
Goossens, L. (2001). Global versus domain-specific statuses in identity re-
search: a comparison of two self-report measures. J. Adolesc., 24, 681-
699.

145
Keniston, K. (1970). Youth: a “new” stage of life. American Scholar, 39, 631-
654.
Maysless, O. & Scharf, M. (2003). What does it mean to be an adult: the Is-
raeli experience. New Directions for Child and Adolescences Devel-
opment, 2003(100), 5-20.
Schlegel, A. & Barry III, H. (1991). Adolescence: an anthropological inquiry.
New York: Free Press.
White, N.R. (2003). Changing conceptions: young people’s views of partner-
ing and parenting. J. Sociology, 39, 149-164.
Dr. Zornitza Ganeva
Faculty of Education,
University of Sofia
15, Tzar Osvoboditel Blvd.
1504 Sofia, BULGARIA
E-Mail: [email protected]
Prof. Valentyna Pavlenko
Department of Psychology,
Kharkiv National University,
Svobody Sq. 4, 61022, Kharkiv, Ukraine
E-Mail: [email protected]
© 2014 BJSEP: Authors