Zinc Market Overview - Nexa Resources - Investor Relations
32
October, 2018 Vazante Mine Zinc Market Overview Nexa Investor Meeting
-
Upload
khangminh22 -
Category
Documents
-
view
0 -
download
0
Transcript of Zinc Market Overview - Nexa Resources - Investor Relations

October, 2018
Vazante Mine
Zinc Market OverviewNexa Investor Meeting

DEMAND AND ZINC APPLICATIONS
SUPPLY
HOW WE GOT HERE?
PRESENTATION CONTENT
OTHER SUPPLY SOURCES
SUBSTITUTION TREATS AND NEW APPLICATIONS
DEMAND AND ZINC APPLICATIONS
SUPPLY
PRESENTATION CONTENT
OTHER SUPPLY SOURCES
SUBSTITUTION TREATS AND NEW APPLICATIONS

Glencore
China
Mines
MODEST SUPPLY INCREASES IN THE LAST CYCLE AND PRODUCTION CURTAILMENTS IN 2015, DRASTICALLY REDUCED CONCENTRATE STOCKS, TAKING IT TO CRITICAL LOW LEVELS IN DAYS OF CONSUMPTION
ZINC CONCENTRATE STOCKS (Mt)
The consequent constraints on concentrate supplies has depleted stocks of zinc concentrate.
4757 60 53
28 26
0
20
40
60
2
0
1
3
2,0
2012 2013
1,5 2,1
2014
1,9
2015
1,0
2016
0,9
2017
8,2
2017
12,912,8
2012 2013 2014
4,9
20162015
4,7
13,0 13,112,1 13,0
8,48,2
4,6 4,7
8,1
4,9 4,8
7,4 8,2
-8%
ROWChina
Zn Conc stocks - days of requirement Zn Conc stocks (Mt)
GLOBAL ZINC CONCENTRATE OUTPUT (Mt)
Sources: Wood Mackenzie Long Term Outlook Q2
Century and Lesheen (two of the world’s biggest mines) closed its operations as their reserves depleted
Chinese environmental protection program started in 2014, forcing out-of-specifications operations to shut down
In the end of 2015, Glencore announced the reduction of 500kt in its mine operations due to poor price conditions
4

A LACK OF ZINC CONCENTRATE AND METAL LED TO LOW LEVEL OF STOCKS AND A RAPID INCREASE OF METAL PRICES SINCE END OF 2015
1.946 1.909
2.164
1.928
2.095
2.703
2012 2013 2014 2015 2016 2017
GLOBAL REFINED ZINC MARKET BALANCE (Mt) ZINC LME PRICES (USD/t)
20132012 20172015
13,713,2
20162014
12,5 12,912,7 13,2 13,7 13,8 13,6 13,514,1 14,4
-0,3 -0,2 -0,4 -0,1 -0,5 -0,9
Supply Demand
GLOBAL ZINC STOCKS (Mt)
113103
88 8570
46
2.13
2.71
2014
2.42
0.691.22
0.31 0.43
2012
2.56
0.930.24
2013
2.52
1.54
0.08
2.55
0.460.20
2015
0.15
2016
0.180.07
2017
3.95 3.733.30 3.21
1.79
Zn stocks - days of requirement
SHFEZn implied stocks (Mt)
LME
Sources: Wood Mackenzie Long Term Outlook Q2; Bloomberg 5

FOR THE SECOND TIME SINCE 80´S ZINC MARKET IS FACING TIGHTNESS BOTH IN CONCENTRATE AND METAL
0
1.000
2.000
3.000
4.000
0
5.000
10.000
15.000
2007 2012 201620142011 20132009 2018e1998 200520041994 200820031999 20101997 20011996 200019951984 199319921990 2002 200619871985 1988 20171989 19911986 2015
+13 +106 -181 -125 -2 +19 +76 +270 +406 +584 +87 -337 -218 +10 -25 +26-23 +353 +394 +280 -112 -480
-659-258 +320
+1.103
+1.088
+513-254
-219 -434-90 -494 -915 -710
SUPPLY
DEMAND
FORECAST
LME $2017
980 1.086905 780 778 797 872
1.1431.549
2.133 2.2201.883
1.665 1.675 1.6522.005
2.3992.680 2.568
2.088
1.4291.171
1.491
2.595
3.683
4.1963.942
3.723
3.289 3.199
2.705
1.790
1.080
56 62 50 42 42 43 48 63 86 117 115 90 79 78 74 73 67 82 94 102 91 72 47 37 49 94 116 123 113 103 88 85 70 46 27
199019871984 2018e19971985 19911986 20171988 1992 1993 1994
1.675
20071995 200019961989 1999 2001 2002 2003 2004 20122005 20162006 2008 2009 2010 2011 2013 2014 2015
1.649
1998
Stock impliedLME $ 2017 Days of consumptionForecast
FLY UP
1989 vs 1987 = +97%
FLY UP
2006 vs 2004 = +193%
FLY UP
2018 as of March vs 2016 = +60%
LOW LEVEL OF METAL STOCKS CRITICAL LEVEL OF METAL STOCKSCRITICAL LEVEL OF CONCENTRATE STOCKS ( ~30 DAYS OF REQUIREMENT)
2008/2009 CRISIS
CRITICAL LEVEL OF METAL STOCKSCRITICAL LEVEL OF CONCENTRATE STOCKS ( ~29 DAYS OF REQUIREMENT)
SYNCHRONIZED GLOBAL GROWTHSources: Wood Mackenzie Long Term Outlook Q2; Nexa Forecast 6

GIVEN THE HISTORICAL PRICE BEHAVIOR, CRITICAL LEVEL OF STOCKS IN DAYS OF CONSUMPTION SHOULD SUPPORT HIGH LME PRICES, HOWEVER…
14.713.5
2017 2018
14.4 14.0
-0.9 -0.7
46Stocks in days of consumption 27
272
jan
325
fev mar abr mai jun jul ago set
254 249
364345
331
288
251
+114-113
Stocks LME
Stocks SHFE
Supply
Demand
Global Refined Zinc Balance (Mt) Zinc total metal stocks (kt)
2018 - Forecast
1.8Implied stocks (Mt) 1.1
7Sources: Wood Mackenzie Long Term Outlook Q2; Nexa Forecast; LME
Inflow of metal in LME and SHFE warehouses
Even with the metal influx in March, the official stocks drawdown trend continued during the year

…AFTER REACHING 10-YEAR HIGH IN THE BEGINNING OF THE YEAR, ZINC LME PRICE PLUMMED REACHING 2-YEAR LOW IN SEPTEMBER
1,000
0
2,000
3,000
4,000
3,618
2012
LME
(USD
/t) 2,095
1,946
2,164
1,909
2013 2014
1,928
2015 2016
2,703
2,287
2017
3,007
2018*
1,331YTD
Source: Bloomberg 8
February 16th
September 17th
* As of October 9th
Low
High
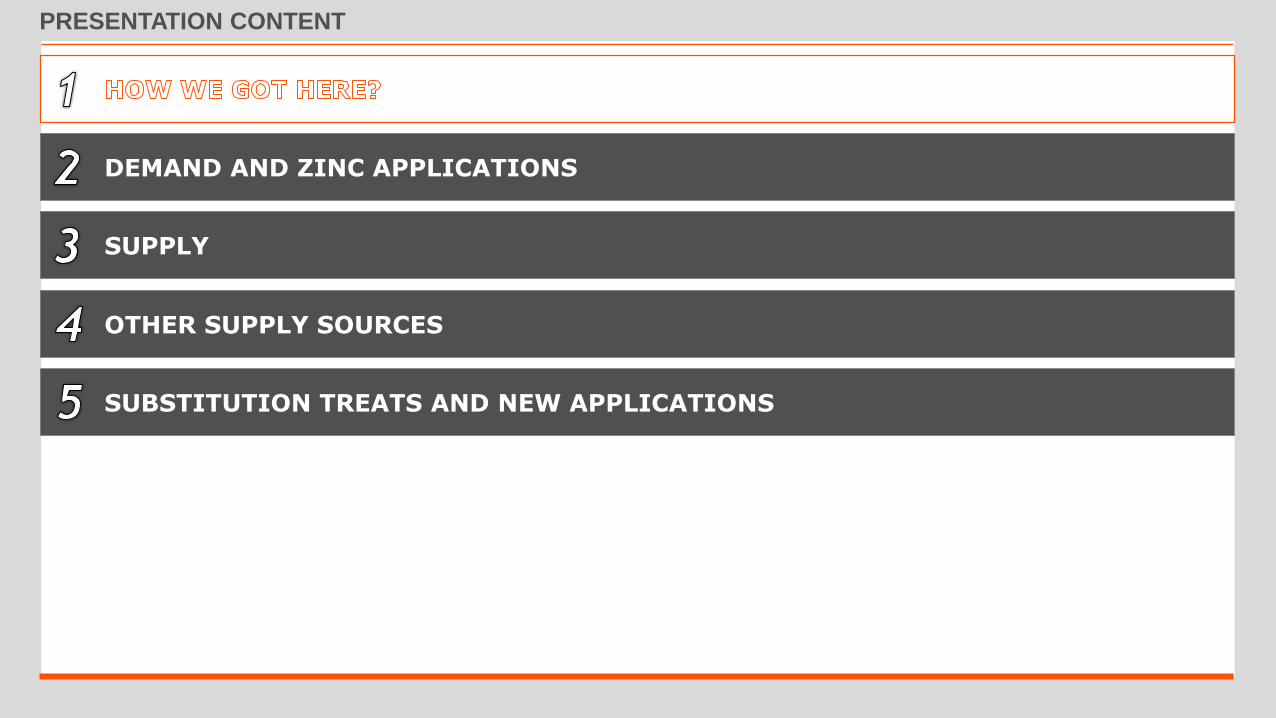
Price, jan 2016 = 100
Zn
TRUMP'S GLOBAL TRADE WAR: A TIMELINE
Trump announces an investigation into steel tariffs, to find out if imports from China and other countries could be a threat to national security.
1
Trump announces tariffs on imported solar panels, most of which come from China, and washing machines.
2
Trump announces a global tax on steel imports at 25% and aluminium imports at 10% and finalizes his tariffs on China, sending world markets into a slump
3
China announces tariffs on US imports, 15% duty on 120 products such as fruits, nuts, wine and steel pipes. and a 25% tariff on US pork.
4
Source: Bloomberg 9
100
150
200
250ja
n/1
6
set/
17
mar
/16
jul/
16
ago
/16
fev/
16
abr/
16
ago
/18
set/
18
*
mai
/16
jul/
17
jun
/16
set/
16
no
v/1
7
mai
/17
ou
t/1
6
mar
/18
mar
/17
dez
/17
ou
t/1
7
dez
/16
abr/
17
jan
/18
fev/
17
jun
/17
no
v/1
6
mai
/18
jan
/17
fev/
18
abr/
18
jun
/18
jul/
18
ou
t/1
8
ago
/17
1
23
45 6
78
*As of 9/19/18
BMI
Trump agrees to less aggressive option to limit Chinese investment in U.S.
5
US Tariffs on $34 billion in Chinese imports begin and China retaliates $34 billion on American products.
6
China announces a list of $60 billion worth of U.S. imports it plans to apply tariffs on. Trump administration follow through with higher tariffs on $200 billion of Chinese goods. .
7
US announces 10% tariff on $200 billion of Chinese exports effective Sept. 24 until the end of 2018, to rise to 25% afterward. China announces retaliation on $60 billion of U.S. goods to become effective simultaneously with the US duties.
8

SUPPLY
HOW WE GOT HERE?
PRESENTATION CONTENT
OTHER SUPPLY SOURCES
SUBSTITUTION TREATS AND NEW APPLICATIONS

ZINC HAS MANY FINAL USES, BUT THE MAJOR PART OF ITS END-USE IS CONSTRUCTION AND INFRASTRUCTURE
CONSTRUCTION &
INFRASTRUCTURE
9,5 Mt
(66%)
AUTOMOTIVE &
INDUSTRIAL MACHINERY
4.0 Mt
(28%)
AGRIBUSINESS
& OTHERS
0.07 Mt
(0.5%)
CONSUMER GOODS
0.8 Mt
(5.5%)
Sources: Wood Mackenzie Long Term Outlook Q2 11

IN RECENT YEARS, GLOBAL SYNCRONIZED GROWTH IS FOSTERING STABLE DEMAND INCREASE
Sources: FMI, LCA, Wood Mackenzie Long Term Outlook Q2
SYNCHRONIZED GLOBAL ECONOMY GROWTH HISTORICAL DEMAND GROWTH
EmergingDevelopedChina
15%
48.2%(6.92Mt)
60%
25.3%(3.63Mt)
25%
26.5%(3.8Mt)
% of Zn
Demand
% of Global
GDP
Global Growth (% YoY)
3,7
5,6
3,6
2011
5,2
3,7
3,53,8
6,8
3,4
2012
13,7
3,8
6,0
3,6
12,7
3,5
2013
6,3
3,6
2014
6,5
3,7
2015
3,7
2016
6,9
3,6
2017
3,6
12,5 13,2 13,8 14,1 14,4
2,4%
China EmergingDevelopedRefined zinc demand (Mt)
+ 1,900 kt
CHINA
DEVELOPED
EMERGING
+ 1,709 kt
-169 kt
+372 kt
12

GLOBAL DEMAND - REFINED ZINC
Developed economies demand is still expected to grow ~200kt in the 19-23
cycle
India is growing above 7% a year, with good potential zinc demand. On the
other hand, Brazil and Russia are underperforming among the EMs.
Metal demand in China should come from initiatives championed by the
president such as povertyalleviation which will result in slum clearance and open up new land for
residential construction in rural areas.
6.924 7.166 7.399 7.589 7.783 8.021 8.261
3.634 3.650 3.702 3.734 3.746 3.780 3.8063.804 3.866 3.896 3.946 4.032 4.149 4.270
20222019 202120182017 2020 2023
14.362 14.682 14.997 15.268 15.561 15.950 16.338+2,2%
Emerging Advanced China
+ 1,656 kt
CHINA
DEVELOPED
EMERGING
+ 1,095 kt
+156 kt
+404 kt
GLOBAL(kt)
Sources: Wood Mackenzie Long Term Outlook Q2; Nexa Forecast 13

DEMAND AND ZINC APPLICATION
HOW WE GOT HERE?
PRESENTATION CONTENT
OTHER SUPPLY SOURCES
SUBSTITUTION TREATS AND NEW APPLICATIONS

USA
• 10th in reserves: 6Mt
• 9th in production: 351kt
PERU
• 4rd in reserves: 16Mt
• 2nd in production: 1,387kt
• 7th in reserves: 12Mt
• 5th in production: 746kt
CANADA
• 3th in reserves: 20Mt
• 6th in production: 730kt
MEXICO
• 11th in reserves: 4.8Mt
• 7th in production: 485kt
BOLIVIA
• 13th in reserves: 3.6Mt
• 11th in production: 252kt
SWEDEN
• 5th in reserves: 13Mt
• 8th in production: 383kt
KAZAKHSTAN
• 8th in reserves: 9Mt
• 4th in production: 844kt
INDIA
• 6th in reserves: 12.6Mt
• 1st in production: 5,052kt
CHINA
• 1st in reserves: 28Mt
• 3rd in production: 848kt
AUSTRALIA
ZINC
World Total Reserves: 195Mt
TOP 10: 148Mt (76%)
ROW: 47Mt
TOP 10 COUNTRIES OF ZINC PRODUCTION AND RESERVES
Sources: Wood Mackenzie Long Term Outlook Q2; SNL
• 18th in reserves: 2.2Mt
• 12th in production: 158kt
BRAZIL
• 2nd in reserves: 24Mt
• 10th in production: 276kt
RUSSIA
15

MINE SUPPLY IS FORECAST TO GROW BY CLOSE TO 3.3% PER YEAR OVER THE PERIOD 2018-2023, CONCENTRATE STOCKS ARE FORECAST TO REMAIN AT LOW LEVELS UNTIL 2019-20
MINE PRODUCTION EVOLUTION (kt)
14.009
16.477
1.451 1.830
1.558
Production 2023Brownfield/Increases
Closures/Reduction
Production 2018 Greenfield
531
China
+3%
Sources: Wood Mackenzie Long Term Outlook Q2; Nexa Forecast 16

CHINA HAS ITS OWN STANDARD TO CLASSIFY ZINC MINES AND COMPARED TO ROW, MOST OF OUTPUT COMES FROM SMALL/MEDIUM MINES
TINY / SMALL>1 <10 ktpy of Zinc
MEDIUM>10 <50 ktpy of Zinc
LARGE>50 ktpy of Zinc
> 1000 ktpa ore mined300-1,000 ktpa ore minedSmall 30-300 / Tiny <30 ktpa ore mined
~700 mines 78 mines 13 mines
• Owners of mines are appointed by government• No tailing dam• Milling: some mine use same concentrator• Inadequate safety and environmental standard• Production is very price sensitive
• Medium and big companies• Some mines have tailing dam others
share/rent from big mines• More integrated with smelters• Short/medium term mining plan
• Bigger and listed companies• Tailing dam• Medium/long term mining plan• Higher level of automation • Concern regarding safety and environmental
standards
2,246 kt46%MINE production
1,581 kt32% 1,062 kt22%
Sources: Wood Mackenzie Long Term Outlook Q2; SMM 17

THE FIRST ROUND OF DEEP DIVE ANALYSIS OF CHINESE ZINC MINING LED US TO TO BE ABLE TO CRITICIZE/ANALYZE DATA AND INFORMATION
CHINA CONCENTRATE PRODUCTION (Zn kt)
? ?
CHINA MINING - 1st ROUND
?
1
CRITICIZE/ANALYZE DATA AND INFORMATION – CONSIDERED IN OUR
PRICE MODEL 2
Sources: Wood Mackenzie Long Term Outlook Q2; Nexa Analysis 18

4.1205.463
6.1245.051 676931
Concentrate Metal Demand
Imported
Domestic Production
6.139
4.8545.936
6.924
Imported 1.121
MetalConcentrate Demand
Domestic Production
6755.9756.611
CHINA MARKET BALANCE (kt) CHINA MARKET BALANCE (kt)
20172017
4.3005.850
6.630
Domestic Production
1.210
Concentrate
5.510 750
Metal Demand
Imported
6.600
CHINA MARKET BALANCE (kt)
2017
4.2005.900
6.800
Concentrate
6756.575
Metal Demand
Imported
Domestic Production
CHINA MARKET BALANCE (kt)
2017
?
CONSULTANCY COMPANIES HAVE DIFFERENT NUMBERS REGARDING CHINESE MINE PRODUCTION
Sources: Wood Mackenzie Long Term Outlook Q2; Antaike, CRU, SMM 19

AFTER TWO ROUNDS OF CHINA MINING DEEP DIVE, NEXA’S BASE CASE SCENARIO FOR NEXT CYCLE CONSIDERS THAT CHINA WILL ADD ~100Kt PER YEAR
2.932 3.139 3.163 3.1883.702
4.2454.588 4.738 4.901 4.768 4.695 4.854 5.053 5.159 5.250 5.378 5.481 5.584
-1.000
0
1.000
2.000
3.000
4.000
5.000
6.000
7.000
20132006 200920082007 2010 20122011 2014 2015 20202016 2017 2018 2019 2021 2022 2023
6%
7%0% 2%
Increm. Prod. (kt)
Y/Y (%)
343 208 24 25 514 543 343 150 163 -133 -73 159 199 106 92 128 130 103
13.2% 7.1% 0.8% 0.8% 16.1% 14.7% 8.1% 3.3% 3.4% -2.7% -1.5% 3.4% 4.1% 2.1% 1.8% 2.4% 1.9% 1.9%
BASE CASE
Sources: Wood Mackenzie Long Term Outlook Q2; Nexa Forecast 20

REACHING THE 8TH YEAR OF DEFICIT IN 2019, THE ZINC MARKET WILL NEED TO RESUPPLY ITS LOW STOCKS LEVELS
16,338
13,972
15,56115,891
14,93514,682
2023
15,48215,268
2022
15,95016,381 16,616
14,997
20212018 2019 2020
-710-62
+214+330
+431 +278Supply
Demand
REFINED ZINC BALANCE FORECAST (kt)
IMPLIED
STOCKS (kt) 1,083 1,021 1,235 1,565 1,996 2,274
STOCKS IN DAYS OF CONSUMPTION WILL REACH
CRITICAL LEVEL IN 2019
AFTER A LONG PERIOD OF DEFICIT, ZINC MARKET BALANCE WILL TURN TO SURPLUS, HOWEVER, THAT WON’T BE
ENOUGH TO RISE THE STOCKS TO HIGH LEVELS
STOCKS IN DAYS OF
CONSUMPTION (kt)27 25 30 37 45 51
Sources: Wood Mackenzie Long Term Outlook Q2; Nexa Forecast 21

DEMAND AND ZINC APPLICATIONS
SUPPLY
HOW WE GOT HERE?
PRESENTATION CONTENT
SUBSTITUTION TREATS AND NEW APPLICATIONS

Zn Concentrate~ 50-55% Zn
Other Sources
Secondary~ 15 – 25% zn
(EAF dust, oxides, low Zn content, etc)
Worldwide, the zinc production from secondary is around10% from total production.
In Juiz de Fora smelter, Nexa has about 20-24%of total production of metallic zinc fromsecondary sources.
Tailings~4-8% Zn*
Utilization of residue from zinc tailings in the beneficiation plantto produce Zn concentrate• New Century Resources has started the tailings flotation activities required
to produce zinc concentrate at its mine in Queensland, Australia.• Woodlawn Project - Blend of underground ore and reclaimed tailings
Main Source 90% 10%
MINERAL EXTRACTION FROM MINES IS NOT THE ONLY SOURCE FOR ZINC METAL PRODUCTION
Mining from underground or/and open pit mines
LME (-) TC
Sources: Wood Mackenzie Long Term Outlook Q2 23

5,5
6,0
6,5
7,0
7,5
8,0
8,5
9,0
9,5
10,0
10,5
11,0
11,5
12,0
12,5
13,0
2000 2005 2010 2015
GLOBAL USAGE OF SECONDARY FEED (% of TOTAL FEED)
ZINC CONTENT IN E.A.F. DUST (KTON)GLOBAL CAPACITY
1.257 kton.
Steel Prod.
364.000
7.100
1.400
Zinc Content
1.583.000
EAF Dust
EAF Steel
EAF technology represents 19% of global
steel production…
87%
…that generates 2% of EAF Dust as
residue……with 22% of Zinc
content.
SINCE 2000 THE ROLE OF SECONDARIES IN FEEDING THE WORLD’S PRIMARY ZINC SMELTERS IS GROWING, HOWEVER IS LIMITED BY AVAILABILITY
Sources: Wood Mackenzie Long Term Outlook Q2; Nexa Forecast 24
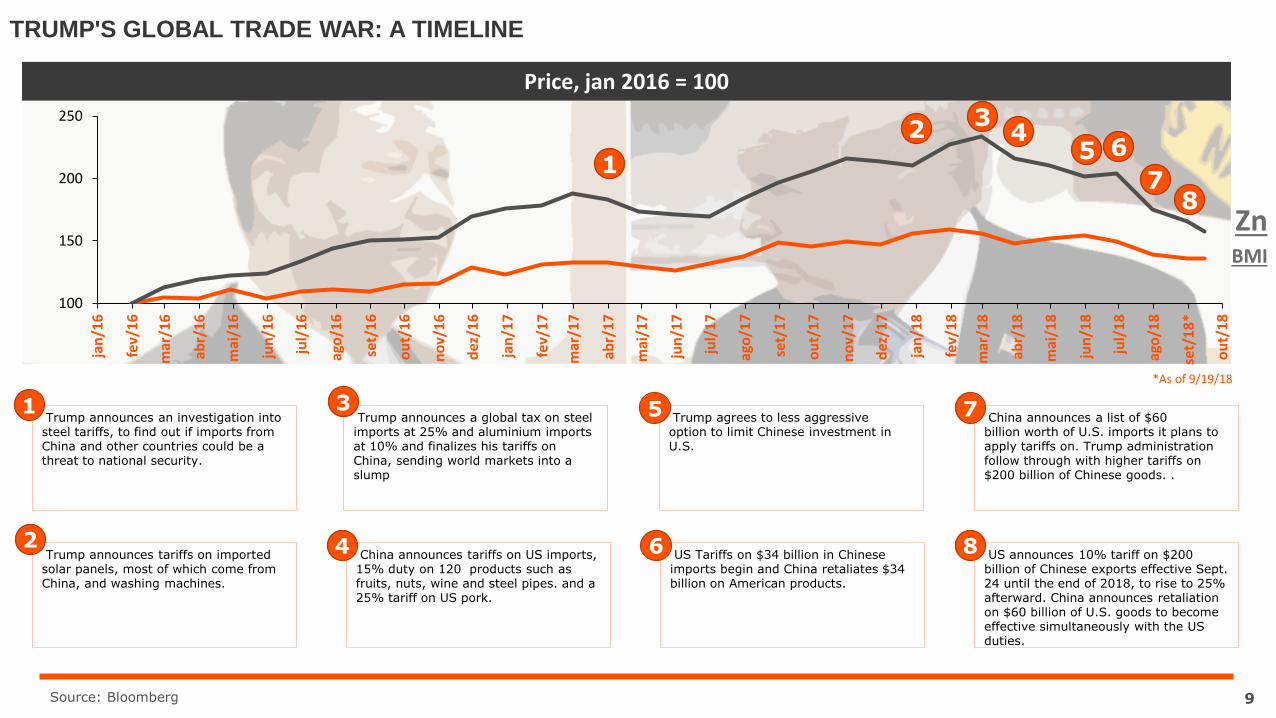
WHAT IS ALREADY BEING DONE…
With the progress in technology and the more environmentally friendly
vision, companies are starting to care more about mining waste
management and reprocessing tailings, re-mining them, is a good option
to reduce the waste increasing their value.
There are currently approximately 75 major tailings re-mining projects
globally, for minerals such as gold, silver, diamonds, copper and zinc.
Any tailings deposit can be considered a potential mineral asset as long
as it contains economic quantities of the mineral or metal of interest.
De Beers Group are extracting overlooked diamonds
from 360Mt of old tailings in South Africa recovering
800.000 carats of diamonds a year
South Africa - Through a combination of tailings storage
facilities, the company Sibanye-Stillwater estimates
there to be 6.2 Moz of gold and 97.2 Mlb of uranium.
New Century raises $53M for the zinc operation. The
tailings deposit is estimated to host a measured resource
of 78.9Mt, at 3.02% zinc, 0.47% lead and 12.4 g/t silver
WHY CONSIDER TAILINGS DEPOSITS REPROCESSING?
In the last years mining industry has seen a gradual decrease in ore
grades for many mineral commodities.
Over the same period, the mining industry has incorporated the concepts
of sustainable development and sustainable mining practice across the life
cycle of mineral operations
Joint this two points, some of these materials can be resources for
the future that potentially have value and so can positively
contribute to sustainable development.
0%
2%
4%
6%
1990 20202000 203020100%
1%
2%
3%
1990 2000 20202010 20300%
1%
2%
1990 2030202020102000
ZINC LEAD COPPER
0,0%
0,5%
1,0%
1,5%
2,0%
2,5%
1990 203020102000 20200%1%2%3%4%5%6%7%8%
1990 2000 2010 2020 2030
GOLD SILVER
As a result, in order to keep the production level, a large volumes of
tailings and mine waste rock are being produced around the world.
NEW FEED SOURCE – REPROCESSING TAILINGS
25

DEMAND AND ZINC APPLICATIONS
SUPPLY
HOW WE GOT HERE?
PRESENTATION CONTENT
OTHER SUPPLY SOURCES
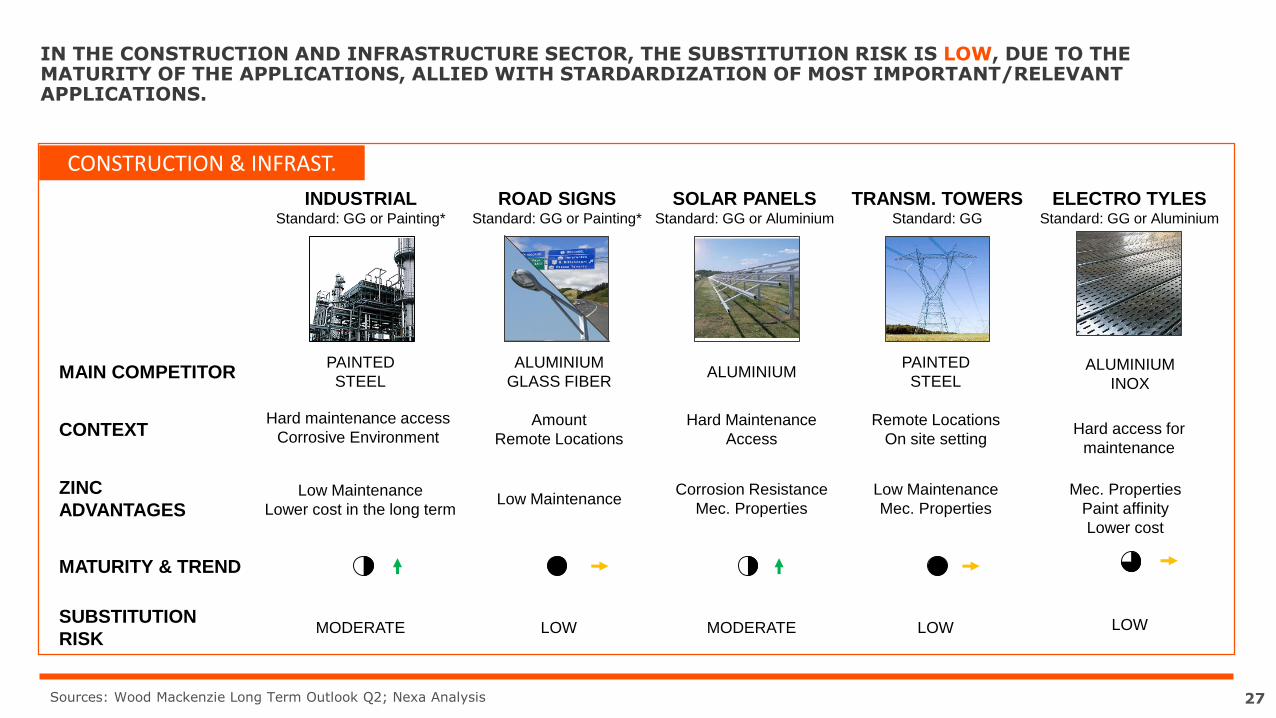
IN THE CONSTRUCTION AND INFRASTRUCTURE SECTOR, THE SUBSTITUTION RISK IS LOW, DUE TO THE MATURITY OF THE APPLICATIONS, ALLIED WITH STARDARDIZATION OF MOST IMPORTANT/RELEVANT APPLICATIONS.
MAIN COMPETITOR
SUBSTITUTION
RISK
ZINC
ADVANTAGES
CONTEXT
INDUSTRIALStandard: GG or Painting*
MODERATE
PAINTED
STEEL
Low Maintenance
Lower cost in the long term
Hard maintenance access
Corrosive Environment
ROAD SIGNSStandard: GG or Painting*
TRANSM. TOWERSStandard: GG
SOLAR PANELSStandard: GG or Aluminium
ALUMINIUM
GLASS FIBERALUMINIUM
PAINTED
STEEL
LOW MODERATE LOW
Corrosion Resistance
Mec. Properties
Low Maintenance
Mec. Properties
Amount
Remote Locations
Hard Maintenance
Access
Remote Locations
On site setting
MATURITY & TREND
Low Maintenance
CONSTRUCTION & INFRAST.
ELECTRO TYLESStandard: GG or Aluminium
ALUMINIUM
INOX
LOW
Hard access for
maintenance
Mec. Properties
Paint affinity
Lower cost
Sources: Wood Mackenzie Long Term Outlook Q2; Nexa Analysis 27

FOR NON STANDARDIZED APPLICATIONS, THE RISKS OF SUBSTITUTION ARE MODERATE TO LOW, DUE TO ZINC’S ADVANTAGES IN THE LONG TERM AND LOW IMPACT IN TOTAL CONSTRUCTION COST.
GALVANIZING THE STEEL STRUCTURE REPRESENTS ONLY ABOUT 1% OF TOTAL CONSTRUCTION COST
ROOF TILES STORAGE BUILDING FACADES
CONCRETE
Al
Corten
Inox
Al
Low Cost
Fast Setting
Aesthetics
Mec. Resistance
Thermal Comfort
Low Cost
LOW MODERATE MODERATE
Construction time
Sustainability
Recyclability
Galvalume
(45% Zn)
Mec. Proprieties
Paint affinity
Lower cost
SILOS LSF
Al
Inox
Hard access for
maintenance
MODERATE
Mec. Properties
Lower Cost
Al
Wood Frame
Sustainability
No waste
LOW
Mec. Properties
Corrosion Resist.
MAIN COMPETITOR
SUBSTITUTION
RISK
ZINC
ADVANTAGES
CONTEXT
MATURITY & TREND
CONSTRUCTION & INFRAST.
DOOR HANDLE
LOW
Al
Inox
Mec. Properties
Lower Cost
Cost
Sources: Wood Mackenzie Long Term Outlook Q2; Nexa Analysis 28

FOR THE AUTOMOTIVE MARKET, THE SUBSTITUTION RISK IN AUTO BODY PARTS IS LOW, DUE TO STEEL INDUSTRY EFFORTS TO REDUCE WEIGHT AND THE SUBSTITUTION COSTS IN THE INDUSTRY AND SUPPLY CHAIN.
FOR THE DIE CASTING INTERNAL PARTS, MOST OF THE SUBSTITUTION HAS ALREADY HAPPENED.
AUTO BODY PARTS INTERNAL PARTS
ALUMINIUMALUMINIUM
Weight
Reduction
LOW LOW
Injection Cost
Mec. PropertiesMec. Properties
Weight
Reduction
MAIN COMPETITOR
SUBSTITUTION
RISK
ZINC
ADVANTAGES
CONTEXT
USAGE / MATURITY
Zinc and Aluminium Die-Castings in Automobiles (# parts per auto)
AUTOMOTIVE864
857
845837 833 831
820815
807
789
750
775
800
825
850
875
20
14
20
16
20
11
20
10
20
13
20
17
20
12
20
15
20
18
20
19
20
22
20
20
20
21
20
23
20
24
20
25
-33 kg per vehicle
Steel consumption in Light Commercial Vehicles
(kg/year)
Sources: Wood Mackenzie Long Term Outlook Q2; Nexa Analysis 29

THE GALVANIZING MARKET MATURITY IS DIFFERENT IN EACH PART OF THE WORLD. EMERGING COUNTRIES STILL HAVE A LOT OF BASIC APPLICATIONS TO DEVELOP, INCREASING ZINC DEMAND.
GALVANIZING DIFFERENT DEVELOPMENT STAGES: GROWING MARKETS PERFORMING MARKETS DEVELOPED MARKETS
1 2 3Start up
Simple products
Start serial production
Industry Products
Mass Production
Products Standard
Architecture
Advanced products
Developed serial products
GROWING PERFORMANCE DEVELOPED
Per Capita Zn Consumption: LATAM 1,3 kg/hab, Asia 2,2 kg/hab, US 3,4 kg/hab and Europe 3,4 kg/hab.
PERU COLOMBIA BRAZIL MEXICO CHILEMALAYSIA, INDONESIA
AND VIETNAM INDIA CHINA JAPAN USA EU
Sources: IZA; Nexa Analysis 30
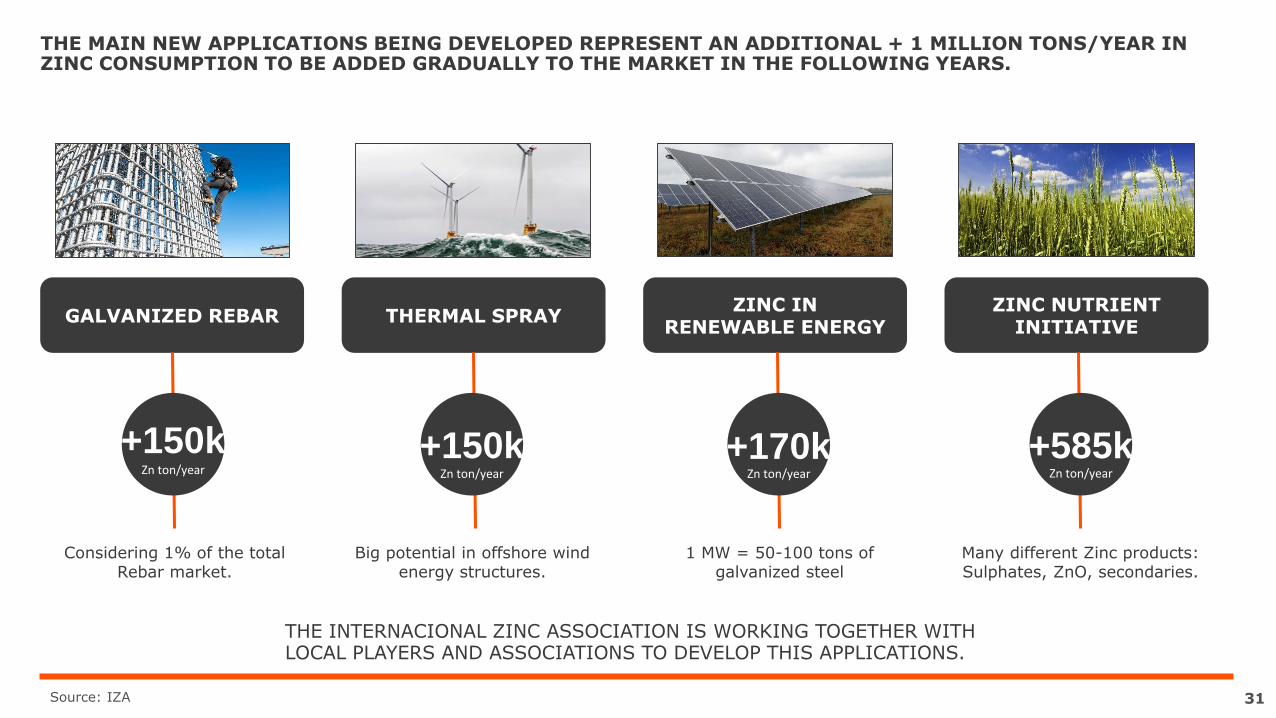
THE MAIN NEW APPLICATIONS BEING DEVELOPED REPRESENT AN ADDITIONAL + 1 MILLION TONS/YEAR IN ZINC CONSUMPTION TO BE ADDED GRADUALLY TO THE MARKET IN THE FOLLOWING YEARS.
GALVANIZED REBAR THERMAL SPRAYZINC IN
RENEWABLE ENERGYZINC NUTRIENT
INITIATIVE
+150kZn ton/year
Big potential in offshore wind energy structures.
Considering 1% of the total Rebar market.
1 MW = 50-100 tons of galvanized steel
Many different Zinc products: Sulphates, ZnO, secondaries.
Zn ton/year
+150k +10kZn ton/year
+170kZn ton/year
+585k
THE INTERNACIONAL ZINC ASSOCIATION IS WORKING TOGETHER WITH LOCAL PLAYERS AND ASSOCIATIONS TO DEVELOP THIS APPLICATIONS.
Source: IZA 31

October, 2018
Vazante Mine
Zinc Market OverviewNexa Investor Meeting