ZIGBEE Based Wireless Weather Monitoring System Using ...
7
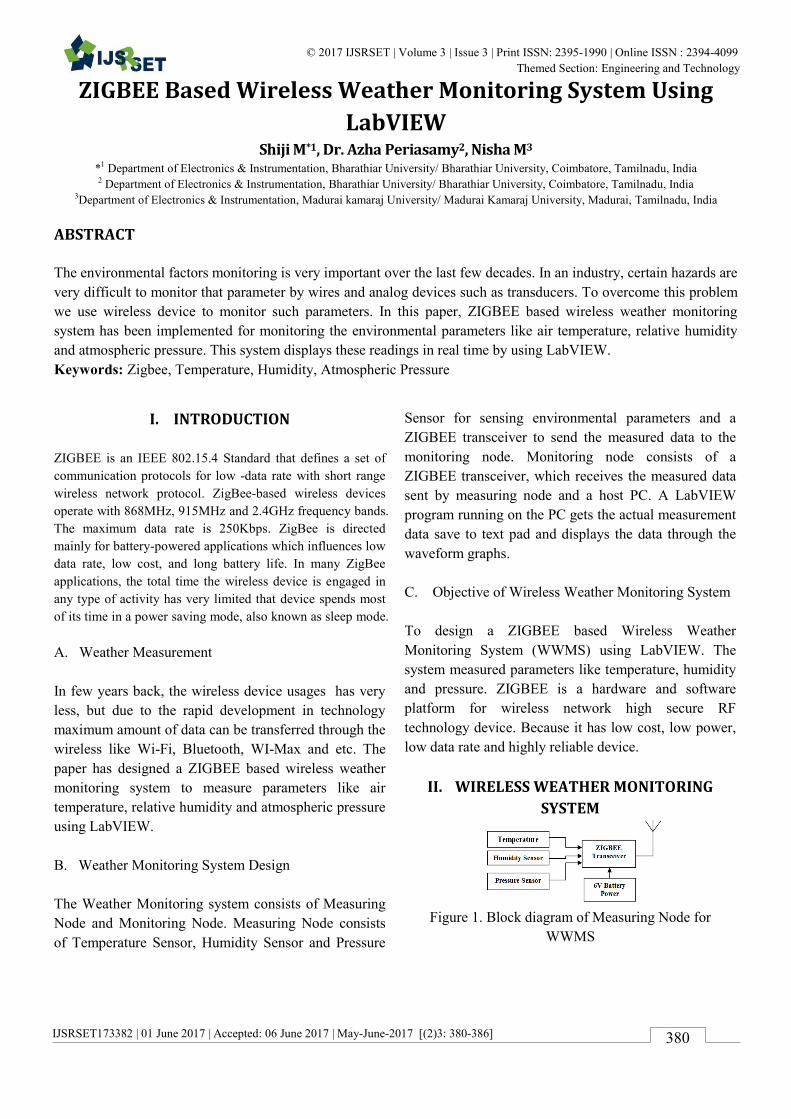
IJSRSET173382 | 01 June 2017 | Accepted: 06 June 2017 | May-June-2017 [(2)3: 380-386] © 2017 IJSRSET | Volume 3 | Issue 3 | Print ISSN: 2395-1990 | Online ISSN : 2394-4099 Themed Section: Engineering and Technology 380 ZIGBEE Based Wireless Weather Monitoring System Using LabVIEW Shiji M *1 , Dr. Azha Periasamy 2 , Nisha M 3 * 1 Department of Electronics & Instrumentation, Bharathiar University/ Bharathiar University, Coimbatore, Tamilnadu, India 2 Department of Electronics & Instrumentation, Bharathiar University/ Bharathiar University, Coimbatore, Tamilnadu, India 3 Department of Electronics & Instrumentation, Madurai kamaraj University/ Madurai Kamaraj University, Madurai, Tamilnadu, India ABSTRACT The environmental factors monitoring is very important over the last few decades. In an industry, certain hazards are very difficult to monitor that parameter by wires and analog devices such as transducers. To overcome this problem we use wireless device to monitor such parameters. In this paper, ZIGBEE based wireless weather monitoring system has been implemented for monitoring the environmental parameters like air temperature, relative humidity and atmospheric pressure. This system displays these readings in real time by using LabVIEW. Keywords: Zigbee, Temperature, Humidity, Atmospheric Pressure I. INTRODUCTION ZIGBEE is an IEEE 802.15.4 Standard that defines a set of communication protocols for low -data rate with short range wireless network protocol. ZigBee-based wireless devices operate with 868MHz, 915MHz and 2.4GHz frequency bands. The maximum data rate is 250Kbps. ZigBee is directed mainly for battery-powered applications which influences low data rate, low cost, and long battery life. In many ZigBee applications, the total time the wireless device is engaged in any type of activity has very limited that device spends most of its time in a power saving mode, also known as sleep mode. A. Weather Measurement In few years back, the wireless device usages has very less, but due to the rapid development in technology maximum amount of data can be transferred through the wireless like Wi-Fi, Bluetooth, WI-Max and etc. The paper has designed a ZIGBEE based wireless weather monitoring system to measure parameters like air temperature, relative humidity and atmospheric pressure using LabVIEW. B. Weather Monitoring System Design The Weather Monitoring system consists of Measuring Node and Monitoring Node. Measuring Node consists of Temperature Sensor, Humidity Sensor and Pressure Sensor for sensing environmental parameters and a ZIGBEE transceiver to send the measured data to the monitoring node. Monitoring node consists of a ZIGBEE transceiver, which receives the measured data sent by measuring node and a host PC. A LabVIEW program running on the PC gets the actual measurement data save to text pad and displays the data through the waveform graphs. C. Objective of Wireless Weather Monitoring System To design a ZIGBEE based Wireless Weather Monitoring System (WWMS) using LabVIEW. The system measured parameters like temperature, humidity and pressure. ZIGBEE is a hardware and software platform for wireless network high secure RF technology device. Because it has low cost, low power, low data rate and highly reliable device. II. WIRELESS WEATHER MONITORING SYSTEM Figure 1. Block diagram of Measuring Node for WWMS
-
Upload
khangminh22 -
Category
Documents
-
view
1 -
download
0
Transcript of ZIGBEE Based Wireless Weather Monitoring System Using ...
IJSRSET173382 | 01 June 2017 | Accepted: 06 June 2017 | May-June-2017 [(2)3: 380-386]
© 2017 IJSRSET | Volume 3 | Issue 3 | Print ISSN: 2395-1990 | Online ISSN : 2394-4099 Themed Section: Engineering and Technology
380
ZIGBEE Based Wireless Weather Monitoring System Using
LabVIEW Shiji M*1, Dr. Azha Periasamy2, Nisha M3
*1 Department of Electronics & Instrumentation, Bharathiar University/ Bharathiar University, Coimbatore, Tamilnadu, India 2 Department of Electronics & Instrumentation, Bharathiar University/ Bharathiar University, Coimbatore, Tamilnadu, India
3Department of Electronics & Instrumentation, Madurai kamaraj University/ Madurai Kamaraj University, Madurai, Tamilnadu, India
ABSTRACT
The environmental factors monitoring is very important over the last few decades. In an industry, certain hazards are
very difficult to monitor that parameter by wires and analog devices such as transducers. To overcome this problem
we use wireless device to monitor such parameters. In this paper, ZIGBEE based wireless weather monitoring
system has been implemented for monitoring the environmental parameters like air temperature, relative humidity
and atmospheric pressure. This system displays these readings in real time by using LabVIEW.
Keywords: Zigbee, Temperature, Humidity, Atmospheric Pressure
I. INTRODUCTION
ZIGBEE is an IEEE 802.15.4 Standard that defines a set of
communication protocols for low -data rate with short range
wireless network protocol. ZigBee-based wireless devices
operate with 868MHz, 915MHz and 2.4GHz frequency bands.
The maximum data rate is 250Kbps. ZigBee is directed
mainly for battery-powered applications which influences low
data rate, low cost, and long battery life. In many ZigBee
applications, the total time the wireless device is engaged in
any type of activity has very limited that device spends most
of its time in a power saving mode, also known as sleep mode.
A. Weather Measurement
In few years back, the wireless device usages has very
less, but due to the rapid development in technology
maximum amount of data can be transferred through the
wireless like Wi-Fi, Bluetooth, WI-Max and etc. The
paper has designed a ZIGBEE based wireless weather
monitoring system to measure parameters like air
temperature, relative humidity and atmospheric pressure
using LabVIEW.
B. Weather Monitoring System Design
The Weather Monitoring system consists of Measuring
Node and Monitoring Node. Measuring Node consists
of Temperature Sensor, Humidity Sensor and Pressure
Sensor for sensing environmental parameters and a
ZIGBEE transceiver to send the measured data to the
monitoring node. Monitoring node consists of a
ZIGBEE transceiver, which receives the measured data
sent by measuring node and a host PC. A LabVIEW
program running on the PC gets the actual measurement
data save to text pad and displays the data through the
waveform graphs.
C. Objective of Wireless Weather Monitoring System
To design a ZIGBEE based Wireless Weather
Monitoring System (WWMS) using LabVIEW. The
system measured parameters like temperature, humidity
and pressure. ZIGBEE is a hardware and software
platform for wireless network high secure RF
technology device. Because it has low cost, low power,
low data rate and highly reliable device.
II. WIRELESS WEATHER MONITORING
SYSTEM
Figure 1. Block diagram of Measuring Node for
WWMS

International Journal of Scientific Research in Science, Engineering and Technology (ijsrset.com) 381
In Figure 1 shows the block diagram of the Measuring
Node of Wireless Weather Monitoring System
(WWMS), it consists of sensors and digi ZIBEE
modules for detecting input signals and it sends to the
receiving node.
Figure 2. Monitoring Node for WWMS
In Figure 2 shows the block diagram of Monitoring
Node of WWMS and it receives the measuring signal
from monitoring node then displays the measured signal
in the given platform automatically.
III. HARDWARE DESCRIPTION FOR WWMS
A. Prototype Model for WWMS
Figure 3 shows the prototype model for the monitoring
node of wireless weather monitoring system. It consists
of digi ZIGBEE transreceiver and RS232 cable which is
for serial interfacing with LabVIEW Platform.
Figure 3. Prototype Model for Monitoring Node of
WWMS
IV SOFTWARE DESCRIPTION FOR WWMS
A. X_CTU (Configuration & Test Utility Software)
X-CTU is Windows-based application software
provided by Digi. This program was designed to interact
with the firmware that files found on Digi's RF products
then it‟s provide a simple to user interface to them.
B. Application Programming Interface (API)
API (Application Programming Interface) is an
alternative to the default Transparent Operation. The
frame-based API extends based on that level of a host
application should interact with the networking
capabilities of the module. An RF module contains the
following firmware versions which will support API
operation: 1.1xx (coordinator) and 1.3xx (router/end
device). In API mode, all entering and leaving data
contain the frames that define operations or events
within the module.
Transmitted Data Frames has been received through the
DIN pin (pin 3) includes:
RF Transmit Data Frame
Command Frame has equivalent to AT
commands.
Received Data Frames has sent to the DOUT pin (pin 2)
includes:
RF-received data frame
Command response
Event notifications as reset, associate,
disassociate, etc.
The API provides the configuring modules and routing
data at the host application layer. A host application
sends the data frames to the module that contain address
and payload information instead of using command
mode to modify addresses. The configuring module will
send data frames to the application containing status
packets as well as source, and payload information from
received data packets.
C. To configure an I/O pin as an analog input on a
remote radio
7E 00 10 17 05 00 13 A2 00 40 A2 42 97 FF FE 02 44
30
Figure 4. Structure of a typical API command for XBEE.
Fig 4 shows the general structure of API commands for
the design and figure 4.1.2 shows the structure for
detecting node of Zigbee based wireless weather
monitoring system.
Start of API command – Every API begins with 0x7E.
Command length – The next two bytes contain the
length of the rest of the command with
excluding the checksum.
International Journal of Scientific Research in Science, Engineering and Technology (ijsrset.com) 382
Command body – Rest of the bytes contain a specific
API command with excluding the checksum
Checksum – The sum of all the bytes after the
command length, including the checksum, should be
0xFF. The checksum bytes can be calculated by sum all
of the bytes after the command length, keep only the
least significant 8 bits has subtract from 0xFF. And the
diagram shows the structure of the “Remote AT
command request” below the command begin with
0x17.
Frame ID – Frame ID in an API command has non-
zero, then the response will contain the ID.
64-bit address – XBee module address
16-bit address – XBee module address. By default
address is not used, but it can be set using the MY
command.
Apply changes flag – If this byte is 0x02, then changes
take effect immediately on the remote XBEE module
and for the byte is 0x00, then you must send an AC
command for changes to take effect.
AT command – This is the AT command you are
sending to the remote XBee module.
To Detect Node
7E 00 04 08 52 4E 44 13
Figure 5. Structure for detecting node
D. How to configure an I/O pin as an analog input
on a remote radio
The XBee RF module has 7 pins it can be used for
analog inputs. To configure DIO0 as an analog input on
the remote RF module from the base RF module using
an API command and its shown in the Figure 5 and
Figures 6,7,8 shows input command format of to
configure DI1,DI2,DI3 as a analog input.
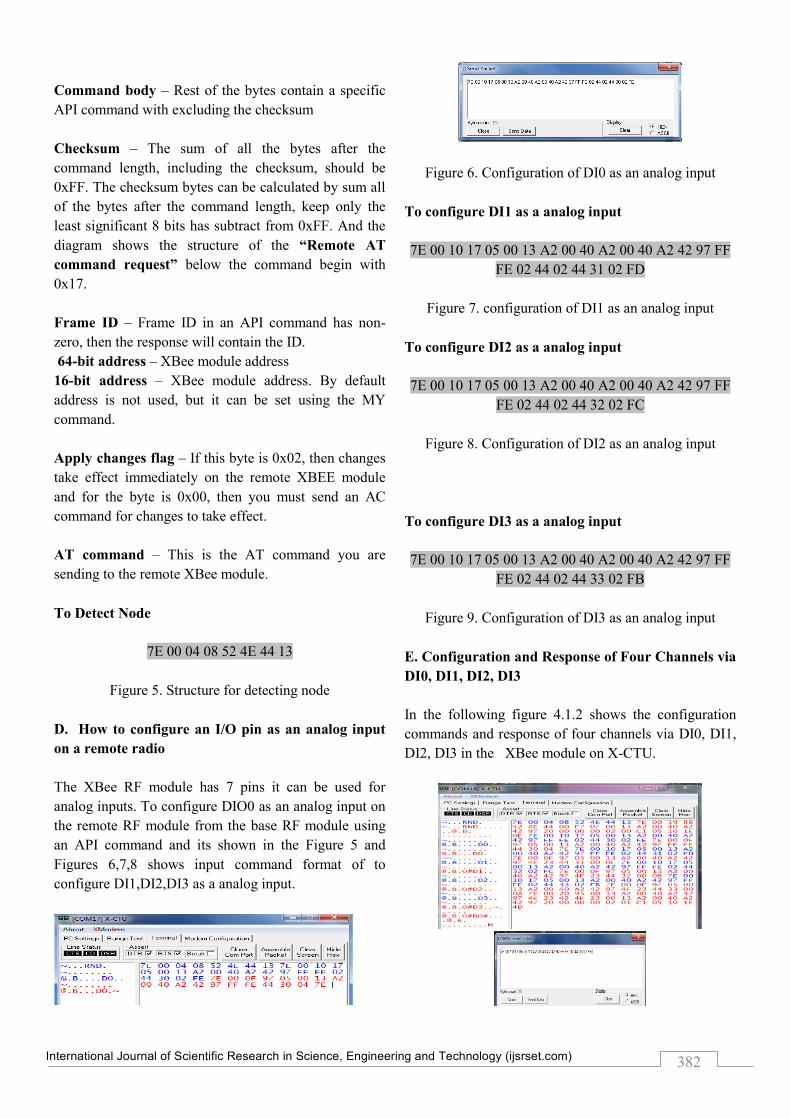
Figure 6. Configuration of DI0 as an analog input
To configure DI1 as a analog input
7E 00 10 17 05 00 13 A2 00 40 A2 00 40 A2 42 97 FF
FE 02 44 02 44 31 02 FD
Figure 7. configuration of DI1 as an analog input
To configure DI2 as a analog input
7E 00 10 17 05 00 13 A2 00 40 A2 00 40 A2 42 97 FF
FE 02 44 02 44 32 02 FC
Figure 8. Configuration of DI2 as an analog input
To configure DI3 as a analog input
7E 00 10 17 05 00 13 A2 00 40 A2 00 40 A2 42 97 FF
FE 02 44 02 44 33 02 FB
Figure 9. Configuration of DI3 as an analog input
E. Configuration and Response of Four Channels via
DI0, DI1, DI2, DI3
In the following figure 4.1.2 shows the configuration
commands and response of four channels via DI0, DI1,
DI2, DI3 in the XBee module on X-CTU.

International Journal of Scientific Research in Science, Engineering and Technology (ijsrset.com) 383
Figure 10. Configuration and response of four channels
V LABVIEW BASED WWMS
To establish the communication between the XBee
modules the API commands has been provided by Digi.
An application program (VI) developed by National
Instruments, LabVIEW platform to send the API
commands to the wireless sensor node to gets response.
A SubVI „SerWr&Rd.vi‟ has developed to send and
receive strings through the virtual COM port and then
SubVI converts API commands into strings, then it
writes the string of characters to the virtual COM port, it
waits a second and reads the response data from the
virtual COM port.
A. Configuration of wireless sensor node
The VI selects the 64-bit address in the wireless sensor
node to enable the four analog channels, AIN0-AIN3,
by sending API commands „D0‟ to „D3‟ in sequence
with its. The VI sends the „Apply Changes‟ (AC)
command each time the channel has configured, the
wireless sensor node has reinitialized for the changes
has been made. Figure 4.2.1.1 shows the configuration
operation of the VI which for interfacing the XBEE
modules.
Figure 11. Configuration Response of SubVI for
Wireless Data Acquasition System
B. Data acquisition
The „Force Sample‟ API command has send it to read
all the enabled analog channels. The corresponding
conversion formula are applied to the received data and
computes the measurement parameter values. The VI
plots the parameter values on a waveform chart.
C. Time stamping
The parameter values has converted by using in-built
function in LabVIEW „array to spread sheet string1.vi‟
and adds the timestamp to the string by reading the
system time using the in-built function „Get Date and
Time String.vi‟. The data acquisition and time stamping
operations are repeated at a regular interval of 1 minute
for 130 times. Figure 11 shows the data acquisition and
time stamping operations of the VI.
Figure 11. Data acquisition and time stamping
operations of the VI.
D. File save
The appended string writes a data file using in-built
functions „open/create/replace file.vi‟ and „write to
file.vi‟. Figure 12 shows the file save operation of the
VI.
Figure 12. File Save Operation of the VI
E. Block Diagram and Front Panel of Wireless Data
Acquisition system based WWMS
Figure 13 and 14 shows the block diagram and front
panel of the given system of wireless data acquisition
system for environmental weather monitoring system
using LABVIEW.
Figure 13. Block diagram of Wireless Data Acquisition
System based Weather Monitoring System
Figure 14. Front Panel of Wireless Data Acquisition
System based Weather Monitoring System
International Journal of Scientific Research in Science, Engineering and Technology (ijsrset.com) 384
VI RESULTS AND DISCUSSION
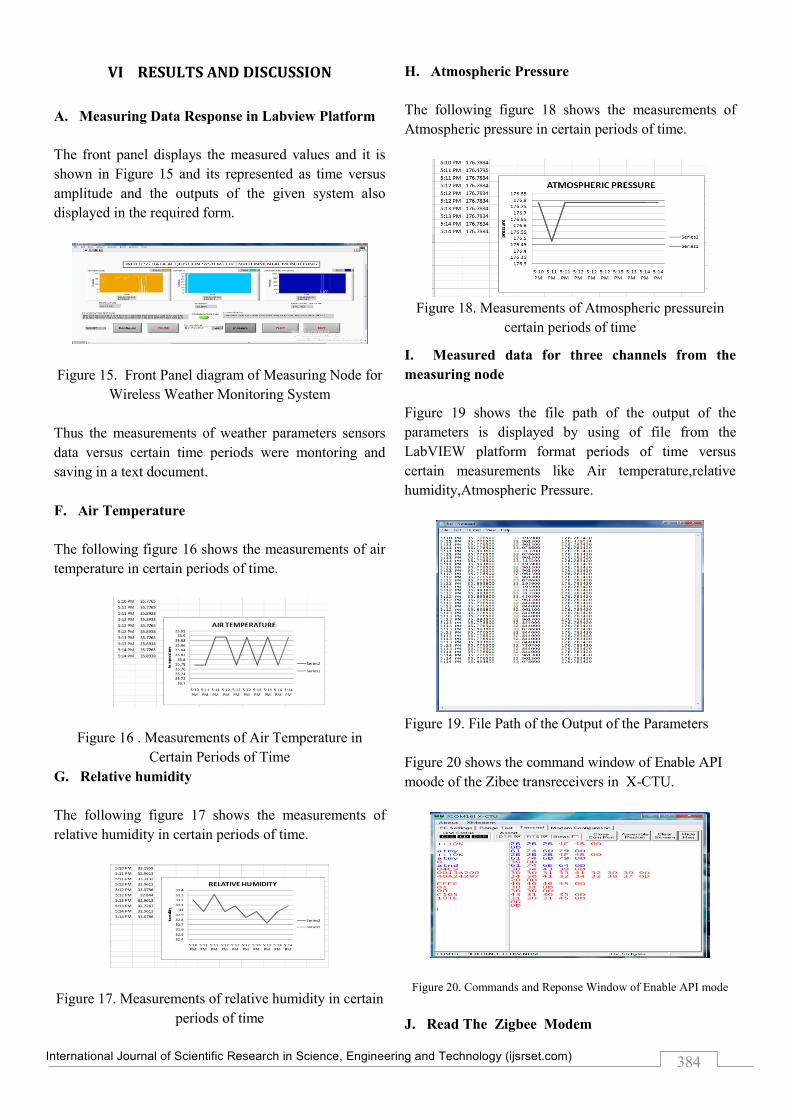
A. Measuring Data Response in Labview Platform
The front panel displays the measured values and it is
shown in Figure 15 and its represented as time versus
amplitude and the outputs of the given system also
displayed in the required form.
Figure 15. Front Panel diagram of Measuring Node for
Wireless Weather Monitoring System
Thus the measurements of weather parameters sensors
data versus certain time periods were montoring and
saving in a text document.
F. Air Temperature
The following figure 16 shows the measurements of air
temperature in certain periods of time.
Figure 16 . Measurements of Air Temperature in
Certain Periods of Time
G. Relative humidity
The following figure 17 shows the measurements of
relative humidity in certain periods of time.
Figure 17. Measurements of relative humidity in certain
periods of time
H. Atmospheric Pressure
The following figure 18 shows the measurements of
Atmospheric pressure in certain periods of time.
Figure 18. Measurements of Atmospheric pressurein
certain periods of time
I. Measured data for three channels from the
measuring node
Figure 19 shows the file path of the output of the
parameters is displayed by using of file from the
LabVIEW platform format periods of time versus
certain measurements like Air temperature,relative
humidity,Atmospheric Pressure.
Figure 19. File Path of the Output of the Parameters
Figure 20 shows the command window of Enable API
moode of the Zibee transreceivers in X-CTU.
Figure 20. Commands and Reponse Window of Enable API mode
J. Read The Zigbee Modem

International Journal of Scientific Research in Science, Engineering and Technology (ijsrset.com) 385
Figure 21 shows Communication Response of
XBEE MODEM Read using of given specifications.It
has some configurations for communicate the given
MODEM like, setting baud rate,databits,port
selection,etc.
Figure 21. Communication Response of XBEE
MODEM Read
J. Channel Configuration
The configuration of channels is important part of the
XBee modules for wireless communication. Figure 22
shows the real setup of the system when configuration
has been done.
Figure 22. Configuration of Channels
The figure 23 shows the screen shot of configuration
response of the MODEM and figure 24 also shows the
configuration responses of the four channels via DI0,
DI1, DI2, DI3 in the XBee module on X-CTU.
Figure 23. Configuration Response of XBEE Modules
of WWMS
Figure 24. Configuration Response of Four Channels in
X-CTU
VII CONCLUSION
ZigBee is leading global standard for implementing
low-cost, low-data-rate, short-range wireless networks.
The IEEE 802.15 is a WPAN Working Group are the
has implemented based on IEEE 802.15.4 wireless
networks. However, these lengthy documents can be
very great in amount of people with time constraints
that are more product-focused. Therefore, there is a
need for a wide-ranging resource that not only contains
the in-depth technical information but also provides the
high-level overviews of fundamental ZigBee wireless
networking.
The flat plat collector efficiency has calculated with
acquired data which matches the obtained value from
the conventional method. The WSN based system is
easy to setup,configure and get measurement values. It
consumes less power. The WSN based system has better
than the conventional measurement method with cost
effective, reliability, and portability. The developed
ZigBee and LabVIEW based Wireless Wether
Monitoring system(WWMS) which eliminates the need
for lengthy communication wires and provides
networking capabilities. LabVIEW provides the
excellent graphical user interface(GUI) and advanced
signal processing functions for research and analysis.

International Journal of Scientific Research in Science, Engineering and Technology (ijsrset.com) 386
VIII.REFERENCES
[1] K.Vairamani, K.Arun Venkatesh and N.
Mathivanan “Design and Development of ZigBee
Based Instantaneous Flat-plate Collector
Efficiency Measurement System”,.
[2] Wang, Z., Chen, T., Yu, Ch. (2009). “ZigBee
based environmental temperature monitoring
system”. In International symposium on
Intelligent Information Systems and Applications
(IISA’09), October 28-30, 2009, 285-289.
Tavares, J., Velez, F.J., Ferro, J.M. (2008).
“Application of wireless sensor networks to
automobiles”, Measurement Science Review, 8
(3), 65-70.
[3] Watthanawisuth, N., Lomas, T., Wisitsoraat, A.,
Tuantranont, A. “Wireless wearable pulse
oximeter for health monitoring using ZigBee
wireless sensor network” In ECTI-CON-2010
International Conference, May 19-21, 2010, 575-
579.
[4] H.S., Kim, D.K. (2006). Development of ZigBee
based street light control system. In Power
Systems Conference and Exposition (PSCE 2006),
2236-2240.
[5] Tavares, J., Velez, F.J., Ferro, J.M. (2008).
“Application of wireless sensor networks to
automobiles” Measurement Science Review, 8
(3), 65-70 2008.
[6] ZHANG Qian et al., “A wireless solution for
greenhouse monitoring and control system based
on ZigBee Technology”, Journal of Zhejiang
University SCIENCE A, 2007 8(10):1584-1587.
[7] Prof.Pravin Lakhe, “WIRELESS SENSOR
NETWORK USING ZIGBEE”,International
Journal of Engineering Research and Applications
(IJERA) ISSN: 2248-9622, PP:292-301,2012.
[8] E.S. Nadimi,H.T. Søgaard, T. Bak, “ZigBee-
based wireless sensor networks for classifying the
behaviour of a herd of animals using classification
trees”.
[9] J. S. Lee and Y. C. Huang, “ITRI ZBnode: A
ZigBee/IEEE 802.15.4 platform for wireless
sensor networks,” in Proc. IEEE Int. Conf.
Systems, Man & Cybernetics, Taipei, Taiwan,
Oct. 2006, pp. 1462-1467. Jennic, “Welcome to
Jennic‟s ZigBee learing Course,” 2007.
[10] Khanh Tuan Le ,”Designing a ZigBee-ready IEEE
802.15.4- compliant radio transceiver”, Next
Generation Wireless,November 2004.