zenitel - annual report 2019 - Euronext live
88
ANNUAL REPORT 2019
-
Upload
khangminh22 -
Category
Documents
-
view
1 -
download
0
Transcript of zenitel - annual report 2019 - Euronext live

ANNUAL REPORT 2019

THE ZENITEL GROUP
Zenitel is a leading provider of Intelligent Communication solutions that allow people to hear, be heard and be understood, in every situation. Because communication is critical in all areas of business, Zenitel systems interface with other security systems including CCTV, access control and alarm systems for a comprehensive security solution.
70 YEARS OF HISTORY ANDA BRIGHT FUTURE AHEAD
Building on over 70 years of breakthrough innovations, Zenitel systems are at the forefront of today’s technology landscape, well positioned to drive the future of Intelligent Communications. Fueled by technology trends like the Internet of Things (IoT), connected cloud systems, big data and machine learning, Intelligent Communications will soon become pervasive, reaching unprecedented levels of intelligence and convenience.
With a full range of IP products and solutions, built-in intelligence and security, the Zenitel portfolio is already providing organizations with maximum fl exibility in scale and performance and is ready to reach unparalleled levels of deployment and usage.
INTEGRATED AND INTELLIGIBLE COMMUNICATIONSZenitel effectively bridges the traditional gaps between 2-way Intercom and Public Address and General Alarm solutions, making it the best alternative on the market, even for the world’s most demanding secure communication environments. Zenitel also sells and integrates world-class third-party products that complement and seamlessly integrate with the Zenitel suite of products and solutions.
As a leading provider of Critical Communications over IP, Zenitel is also the proven and preferred audio- and data-communication choice for environments that require crystal-clear communication to ensure the protection of human life, property, assets and/or the management of critical activities.
Zenitel has a strong presence in both the onshore and offshore secure communications market through its global brands, Vingtor-Stentofon and Phontech, which are recognized worldwide for offering advanced offshore and onshore communication systems. Zenitel is listed on the Euronext stock exchange in Brussels, with statutory headquarter situated in Belgium. Zenitel’s operational headquarter is in Norway.
OUR CORE VALUES
PRIDEWe are proud of who we are and what we do.
ACCOUNTABILITYWe follow through on our commitments.
RESULTSWe create value for our customers, suppliers,
employees and shareholders.
TEAM WORKWe work as a team.
INNOVATIONOur company culture fosters creativity,
continuous improvement and innovation.
2 ZENITEL - ANNUAL REPORT 2019

For more information, visit: www.zenitel.com
BRANDS
MISSIONAs a company and individuals, we aim to
provide the highest quality communication
solutions available in the market, with the
lowest possible impact on the environment.
We are committed to continuously
improving our operations and enhancing our
partners’ and customers’ experiences.
VISIONThe world leading provider of intelligent
communication solutions.
4 CONSOLIDATED KEY FIGURES
6 LETTER TO THE SHAREHOLDERS
8 OUR WORLDWIDE PRESENCE
10 OUR BUSINESS
11 OUR MARKETS
12 OUR CORPORATE SOCIAL RESPONSIBILITY
14 HIGHLIGHTS 2019
16 REPORT OF THE BOARD OF DIRECTORS(1)
22 STOCK AND SHAREHOLDER INFORMATION(1)
26 DECLARATION WITH REGARDS TO CORPORATE GOVERNANCE(1)
39 FINANCIAL REPORT 2019
86 CONTACT INFORMATION
86 PERSONS RESPONSIBLE
(1) These chapters form an integral part of the Report of the Board of Directors and contain the information required by the Belgian Company Code.
CONTENTS
ZENITEL - ANNUAL REPORT 2019 3

CONSOLIDATEDKEY FIGURES
2019 REVENUE WAS € 76.3 MILLION COMPARED TO € 61.8 MILLION IN 2018
2015 2016 2017 2018 2019
80
70
60
50
40
30
20
10
0
EBITDA (*) OF € 6.5 MILLION IN 2019 AGAINST€ 4.2 MILLION IN 2018
2015 2016 2017 2018 2019
7 000
6 000
5 000
0
EBIT OF € 3.9 MILLION IN 2019 AGAINST€ 3.2 MILLION IN 2018
2015 2016 2017 2018 2019
4 000
3 500
3 000
2 500
2 000
1 500
1 000
500
0
NET RESULT CONTINUING OPERATIONS OF € 3.0 MILLION IN 2019 AGAINST € 2.7 MILLION IN 2018
2015 2016 2017 2018 2019
3 000
2 500
2 000
1 500
1 000
500
0
NET DEBT (*) AND PROVISIONS REDUCED COMPARED TO LAST YEAR
2015 2016 2017 2018 20190
-3 000
-6 000
-9 000
-12 000
-15 000
(*) Impacted due to the adoption of IFRS 16.
4 ZENITEL - ANNUAL REPORT 2019
(thousands of euro) 2019 2018 2017 2016 2015
FROM CONSOLIDATED STATEMENT OF PROFIT OR LOSS
Revenue 76 257 61 831 59 915 63 473 66 498
Profi t before tax 3 765 3 383 3 068 2 617 2 295
Profi t of the year 3 022 2 653 2 265 2 561 7 329
FROM STATEMENT OF FINANCIAL POSITION
Total assets (*) 59 114 50 138 44 763 47 494 54 652
Shareholders' equity 32 578 29 327 26 730 26 718 27 889
Working capital 7 781 5 967 2 474 1 535 2 475
Total fi nancial debt (2) (*) 5 612 2 120 1 606 2 511 1 889
Total provisions (3) 4 807 4 789 5 514 5 215 4 081
Cash and cash equivalents 21 331 20 371 18 950 19 249 17 551
ALTERNATIVE PERFORMANCE MEASURES
EBITDA (1) (*) (**) 6 509 4 240 5 223 4 313 4 033
Operating profi t (EBIT) 3 923 3 164 3 557 2 483 2 649
Net result continuing operations 3 022 2 653 2 265 2 561 2 200
RATIOS
Shareholder's equity ratio (*) 55.1% 58.5% 59.7% 56.3% 51.0%
Net debt (4) / EBITDA (*) (**) -2.4 -4.3 -3.3 -3.9 -3.9
Net debt (4) and provisions (3) / EBITDA (*) (**) -1.7 -3.2 -2.3 -2.7 -2.9
Weighted average number of shares (in thousands) 3 308 3 311 3 305 3 306 3 311
Shareholder's equity/share (EUR) 9.85 8.86 8.09 8.08 8.42
Earnings/share (EUR) 0.91 0.80 0.69 0.77 2.21
ROCE(5) (*) 24.8% 30.5% 43.0% 30.9% 25.8%
OTHER KEY FIGURES
FTE (***) 303 300 264 266 283
(1) EBITDA: earnings before interest & taxes, depreciation and amortization
(2) Total fi nancial debt: long term and short term interest bearing loans and borrowings
(3) Total provisions: Retirement benefi t obligations plus provisions (both current and non current)
(4) Net debt: Total debt minus cash and cash equivalents
(5) ROCE: EBIT / (tangible assets + intangible assets + working capital)
(*) Impacted due to the adoption of IFRS 16
(**) Impairment on current assets are included in raw materials and consumables used which has an impact on EBITDA
(***) The reported group FTE’s include both employees and contractors
ZENITEL - ANNUAL REPORT 2019 5

In 2019 we have realized a strong top-line growth of 23.3% thanks to a successful Phontech integration and healthy organic growth in all geographical regions. Zenitel has continued to invest in product development and talent to enable further growth in the coming years.
DEAR SHAREHOLDERS
SOME FINANCIAL HIGHLIGHTS
•� • Total revenue amounted to 76.3 million euro compared to 61.8 million euro in 2018 which represents a growth of 23.3%.
•� • EBITDA amounted to 6.5 million euro, an increase of 2.3 million euro of which 1.8 million euro as a result of the adoption of IFRS 16.
•� • EBIT amounted to 3.9 million euro,compared to 3.2 million euro in 2018.
•� • Net profi t from operations was 3.0 million euro, compared to 2.7 million euro in 2018.
•� • Financial cash position of 21.3 million euro at the end of 2019, compared to 20.4 million euro in 2018.
Zenitel’s success is based on high-quality products and a customer-centric approach by passioned and dedicated people. That is why we continue investing in new product development and new talent to further strengthen our organization. New colleagues, mainly in the fi eld of marketing & sales, R&D and management, have joined and strengthened our global team. The Zenitel transparent company culture together with Zenitel’s position as a technology leader is a solid base for attracting new talent and for further developing team members within the company. We are tremendously grateful for the efforts, the dedication and the passion of all Zenitel employees worldwide.
In the building security and safety business, new sales channels have been opened and are further developed. This initiative, together with the strengthening of strategic alliances, mainly in the fi eld of complementary technology partners, have increased our reach in the market. These complementary technologies, such as access control and CCTV, enable our customers to seamlessly integrate the Zenitel solutions in a full-fl edged security platform.
6 ZENITEL - ANNUAL REPORT 2019

Koen ClaerboutCEO
Jo Van GorpChair
In the maritime and energy industry, our market position has been strengthened by the acquisition of Phontech and further organic growth. In this market, Zenitel has broadened its product offering to enable profi table growth.
In 2019, our ambitious R&D team has developed new products and solutions with a focus on seamless integration, enhanced audio quality and ease of installation. The market launch of IC-EDGE and ICX, two key product ranges, enhanced the Zenitel product range. These developments enable Zenitel to further deliver to our partners and customers high performing products and solutions for the security market. We strongly appreciate the participation and input of our partners and customers in providing suggestions for future successful product and business development.
For our shareholders, we continue to create value by further developing our business in a sustainable and profi table way. The further increase of revenue, EBITDA and EBIT provides a solid basis for future value creation.
By marketing high performing and unique products and services, Zenitel is well positioned and intends to stay ahead of the competition in a price sensitive and challenging market.
By strengthening our technology leadership,
Zenitel continues creating shareholder value.ANOTHER EXCITING YEAR
From the left: Koen Claerbout, Jo Van Gorp.
ZENITEL - ANNUAL REPORT 2019 7

OUR WORLDWIDE PRESENCE
USAKansas City
USANew Orleans
BELGIUMZellik
FRANCENanterre
ITALYMilan
UNITED(1)KINGDOM(1)
Crawley
SINGAPORESingapore
BRAZIL(2)
Rio de Janeiro
DENMARKAlbertslundSvendborg
NORWAYTrondheim
Kristiansund
FINLANDEspoo
GERMANY(2)
AurichTHE NETHERLANDSVeenendaal
CROATIAOpatija
UAEDubai
INDIA(2)
Bangalore
CHINA(1)
Beijing
OsloHortenSTATUTORY HEADQUARTER
OUR GLOBAL PRESENCE ENABLES US TO PROVIDE SUPPORT AROUND THE WORLD, ENSURING OPTIMAL PERFORMANCE OF OUR COMMUNICATION SYSTEMS AT ALL TIMES.
Through our extensive network, we can coordinate and handle service assistance, combining our in-house expertise with skilled technical personnel and service engineers located around the world.
8 ZENITEL - ANNUAL REPORT 2019

COUNTRIES WITH LOCAL OFFICES
303FTE WORLDWIDE
Nordics
Norway 147
Denmark 24
Finland 13
Europe
Croatia 33
Germany(2) 3
The Netherlands 1
Belgium 3
Italy 2
France 21
United Kingdom(1) 2
16Americas
Brazil(2) 3
United States 20
Asia
Singapore 22
India(2) 4
United Arab Emirates 3
China(1) 2
Total 303
FTE BY COUNTRY(3)
(1) Related offi ces(2) Zenitel Agents(3) The reported Group FTEs include both employees and contractors.
ZENITEL - ANNUAL REPORT 2019 9
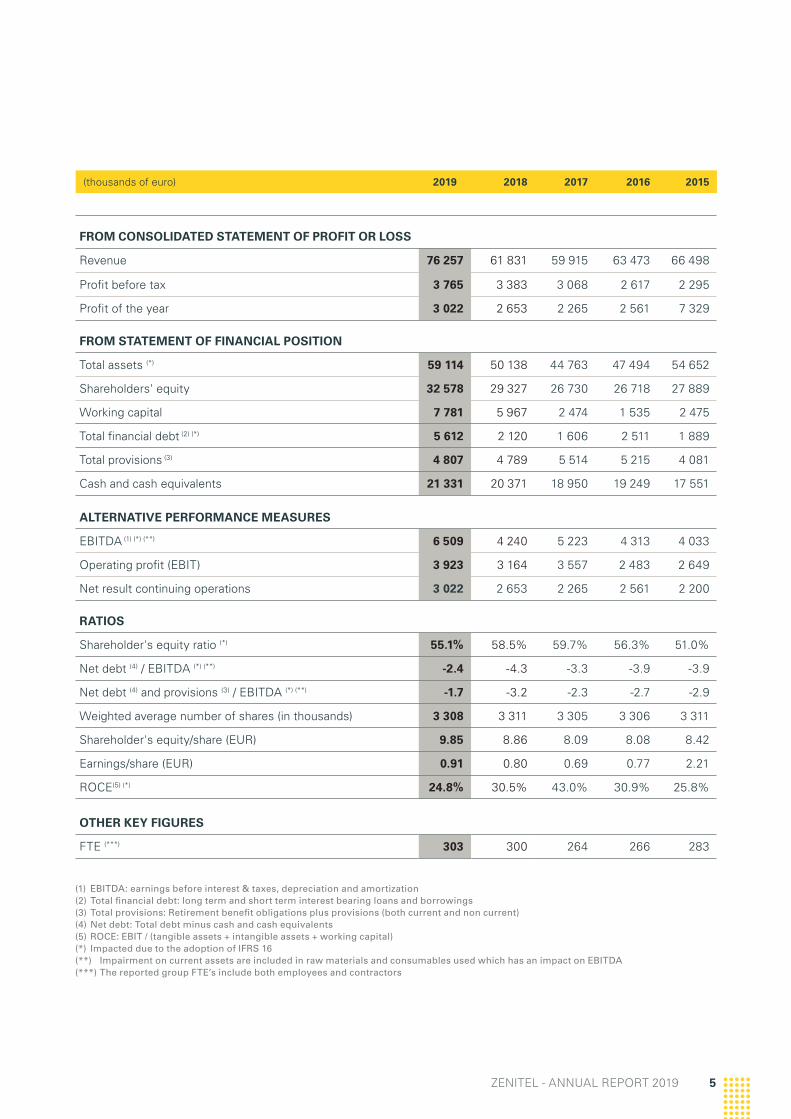
OUR BUSINESS
OVERVIEW
Zenitel is recognized globally for offering advanced offshore and onshore communications, through our product brands Vingtor-Stentofon and Phontech. Our primary system offerings are Public Address, Intercom and Two-Way Radio. Markets include Building Security & Public Safety, Transportation, Industrial, Energy, and Maritime. Our systems interface with other security devices, enabling end users and integrators to build interconnected solutions with access control, video surveillance, digital messaging and more for a comprehensive security solution.
OUR PERSONNEL
We foster our company culture through the continuous enhancement of our workforce through innovation, technology and personal development. We value teamwork and promote ongoing training programs and career-path development. With a dynamic mix of new and experienced personnel, we have a working environment that stimulates the growth of our company and brings out the best in every individual. Our market-leading position is a key asset in our efforts to attract the most qualifi ed people in the industry.
OUR RESPONSIBILITY
OUR CUSTOMERS
Customer satisfaction and professionalism are extremely important in providing good customer service. Consistent quality control, investments in type approvals and certifi cations, as well as surveys measuring customer satisfaction underpin our strategy to build strong, sustainable customer relationships. A global Customer Service Center takes our responsibility towards customers a major step further.
OUR SUPPLIERS
Zenitel has well established partnerships with global suppliers in order to secure timely deliveries and the highest quality products.
OUR ENVIRONMENT
Zenitel products are produced according to environmental standards such as RoHS and other European Directives, as well as Waste Electrical and Electronic Equipment Directives. Zenitel complies with the IMO resolution (A.962 Clean Design/Green Passport) by documenting all materials in a marine vessel’s construction that may be hazardous to humans or the environment.
OUR SHAREHOLDERS
We take pride in maintaining Zenitel’s market value as a long-term and safe investment for our shareholders, while sustaining a healthy and controlled company growth.
OUR BRANDS
ZENITEL is a corporate brand, under which our subsidiaries conduct their business.
Vingtor-Stentofon is recognized globally for offering advanced offshore and onshore communication platforms. The brand provides integrated security communications for environments where life, property and assets are at stake. Vingtor-Stentofon’s primary system offering is within Public Address, Intercom and Two-Way Radio.
Phontech specializes in Intercom and Public Address & General Alarm solutions for the global Maritime and Energy markets, with a worldwide market presence. Phontech was established in 1987. On 1 November 2018, Zenitel Group acquired the Phontech business and products from Jotron AS.
Zenitel is a company with solid foundations and an eye to the future. We continue to invest in product development and innovative technology so that our proud legacy of intelligent communication can continue for decades to come. At Zenitel, we recognize the importance of people to our development and growth. We closely monitor our employees’ satisfaction, with a focus on training and personal development.
10 ZENITEL - ANNUAL REPORT 2019

OUR MARKETS
Zenitel has revolutionary IP Audio and VoIP Solutions for emergency communications, IP Video Door Intercom, Public Address, and Mass Notifi cation. We base all our solutions on the single most important criteria: Intelligibility - the ability to hear, be heard and be understood, in every situation.
Zenitel has gained a reputation as a supplier of fl exible, reliable and advanced systems for Critical Communication, Data, Safety and Entertainment for over 70 years. Over 30,000 ships sailing around the world have our type-approved and certifi ed equipment installed onboard.
Zenitel offers Integrated audio communication solutions for a wide range of projects, such as toll booths, airports, roadside & tunnel assistance, trains & metros, and harbor docks & ports. Through our SIP capabilities, we also offer communication points in a pre-existing or new VoIP system.
Using high-quality voice and audio integration, city-protection services can cover wider areas and use their security forces more effi ciently. By introducing durable and rugged communication points, an additional level of security and comfort to the public can be reliably provided.
Our products and solutions are made for use in advanced operations executed in demanding environments. We work closely with highly skilled professionals in the Energy industry, maintaining a constant focus on operational safety and security.
Zenitel solutions are designed to meet the needs of plant owners, managers, employees and visitors. Operations in hazardous areas, clean rooms and control rooms all benefi t from our ability to ensure people can always hear, be heard and be understood.
Our strategy for investing in new products and solutions relies on our knowledge of, and operational focus on targeted markets. We provide specifi c communication solutions and products to the following markets:
MARITIME
ENERGY
INDUSTRIAL
TRANSPORTATION
BUILDING SECURITY
PUBLIC SAFETY
ZENITEL - ANNUAL REPORT 2019 11

ENVIRONMENTAL POLICY, CERTIFICATIONS AND STANDARDS.
OUR CORPORATE SOCIAL RESPONSIBILITY
To ensure that we continually run our company to the highest possible standard, we are committed to meeting stringent, internationally recognized quality, environmental and safety standards.
THREE STEPS OF INNOVATION FOR THE ENVIRONMENT
Because we care about the planet and its inhabitants, we continually strive toward setting and maintaining sustainable processes throughout the value chain.
1. REDUCE PRODUCTION WASTE:
Zenitel complies with the European WEEE (Waste Electrical and Electronic Equipment) directive for environmental conservation, ensuring that discarded equipment is recycled appropriately.
2. GREEN PASSPORT:
Zenitel complies with the IMO resolution A.962 Clean Design/Green Passport by documenting all materials in a vessel’s construction that may be hazardous to humans or the environment.
3. LEAN LOGISTICS:
We avoid wasteful activities in our supply chain to reduce environmental impacts. We optimize our stock levels and source components locally where possible, to minimize
our carbon footprint from transport and storage. Globally, we encourage our suppliers, distributors and customers to conduct business in an environmentally responsible manner.
Zenitel uses DHL GoGreen Solutions, which optimizes transport routes, alternative drive vehicles and energy-effi cient warehouses to reduce CO2 emissions and other potentially harmful environmental impacts stemming from the transportation and storage of goods.
SAFETY
Zenitel, including our contract manufacturers, is certifi ed for the ISO 9001 Quality Management Standard, the ISO 14001 Environmental Management Standard and the ISO 45001 Health and Safety Management Standard. Zenitel complies with the REACH European Directive N 1907/2006 related to the registration, evaluation and authorization of chemicals to protect human life and the environment.
12 ZENITEL - ANNUAL REPORT 2019

We continuously focus on our processes that
affect the environment and strive towards new solutions to reduce the effect on the outer environment.
QUALITY STANDARDS
TYPE APPROVALS
GREENPASSPORTIMO RESOLUTION
A.962(23)
ENVIRONMENTAL STANDARDS
CERTIFICATES
ATEX directive
2014/34/EU
IECEx IEC 80079-
34:2011
EN 54-16:2008 UL 60950-1
Zenitel products conform to RoHS 3 Directive 2015/863. This restricts the use of certain hazardous materials (lead, mercury, cadmium, hexavalent chromium, polybrominated biphenyls, polybrominated diphenyl ethers) in electrical and electronic equipment.
THE COMMUNITIES WE LIVE IN (SOCIAL RESPONSIBILITY PROGRAMS/INITIATIVES)
Proven, reliable communication systems are vital to a safe and secure community. When standard communication systems fail during emergencies or at critical moments, Zenitel’s Intelligent Communications solutions and systems come through. Apart from Zenitel’s green focus across the organization, we view ensuring clear, critical communication as our most signifi cant contribution to a wide, diverse set of communities, worldwide.
We also care about the people at the other end of our production chain. Zenitel uses SA8000® as our guideline and requirement for our Contract Manufacturer during production of our in-house designed products.The SA8000® Standard is the leading social certifi cation standard for factories and organizations across the globe. Established by Social Accountability International in 1997 as a multi-stakeholder initiative, the Standard has evolved over the years into an overall framework that helps certifi ed organizations demonstrate their dedication to the fair treatment of workers across industries and in any country.
COMPLIANT
E
UDirectiv
e
RoHS 2
COMPLIANT
N
1907/2006
REACH
ZENITEL - ANNUAL REPORT 2019 13

HIGHLIGHTS OF 2019
In 2019 we continued to invest in new product development, business development and in the strengthening of our organization. Additional talent in the fi eld of management, R&D and Marketing & Sales has joined our global Zenitel team. Zenitel is further strengthening its market position in the global security market by building on the technology leadership in superior audio communication products enabling seamless integration in security solutions.
ZENITEL RECEIVES NEW FRAME AGREEMENT WITH EQUINOR
In 2019 Zenitel was awarded another frame agreement with Equinor ASA. The new frame agreement is for the delivery of UHF Radio Systems and Services. The agreement comprises UHF radio terminals based upon DMR and TETRA technology, radio accessories, as well as services for commissioning and maintenance of radio installations. The agreement is both for Equinor facilities in operation as well as new development projects.
ZENITEL ONBOARD WORK BOAT OF THE YEAR 2019
MV Taino, an LNG Powered ConRo (combination container roll-on/roll-off) vessel operated by Crowley Maritime (USA) was awarded the WorkBoat of the Year during the International WorkBoat Show in New Orleans in December 2019. Zenitel has delivered state-of-the-art critical and integrated communication systems together with our partner, Mackay Marine. The design employs Zenitel equipment for PAGA systems, IP Telephony, CCTV, Sound Powered phones, LAN and UHF radio systems.
ZENITEL APPOINTS NEW CEO IN 2019
In August 2019, the board of directors announced the appointment of Mr. Koen Claerbout as the new CEO of the company.
14 ZENITEL - ANNUAL REPORT 2019

ZENITEL GLOBAL PARTNER MEETING, TØNSBERG, NORWAY 2019
June 2nd - 4th 2019, Zenitel kicked off the Global Partner Meeting in beautiful and maritime surroundings in Tønsberg, Norway.
Around 200 partners and Zenitellers from the Maritime & Energy and Safety & Security sectors attended the event.
Our Partners had their showcases in the lobby for participants to visit during the breaks. This event was also the arena for the world premiere of the new and advanced Intelligent Communication Platform – ICX Alphacom and also the IC-EDGE family.
The theme of the Global Partner meeting centered around 5 key ingredients for success: Growth, Strategy, Market Opportunities, Products and Partners.
With differentiated tracks in the agenda for both Maritime & Energy and Safety & Security we were able to create an interesting and good agenda for all participants.
LAUNCH OF IC-EDGE AT ISC WEST – LAS VEGAS
Zenitel Americas continues to advance its strategic alliance program of key technology vendors who have tightly integrated with Zenitel’s intelligent Communications platform. An example of the business model impact in our market includes adopting our language around the intelligent platform, integrating powerful use cases to create real-world solutions for our customers, and, fi nally, integrating our organizations in a powerful go-to-market model at events like ISC West, GSX, and The Great Conversation in Security. Zenitel was also integrated into alliances road shows, and marketing literature. As a result, the alliance program had a record year.
MEXICO CITY SMART CITY PROJECT
Smart Buildings and Smart Cities are the wave of the future. Zenitel Americas advanced our market share by integrating our intelligent communication platform into the smart city project in Mexico city where approximately 4,000 Turbine stations were deployed in SIP mode.
ZENITEL - ANNUAL REPORT 2019 15

REPORT OF THE BOARDOF DIRECTORS
THE BOARD OF DIRECTORS: From the left: Hans Swinnen, Liesbet Van der Perre, Wenche Holen, Jo Van Gorp, Koen Claerbout, Gail Smith and Yves De Backer.
Zenitel (‘the Company’) realized a growth of 23.3% thanks to a combination of organic growth and the Phontech acquisition. The net result from operations was 3.0 million euro in 2019 compared to 2.7 million euro last year.
Zenitel is fi nancially debt free and had 21.3 million euro net cash at the end of the year.
STRATEGY
The focus of Zenitel is on the area of critical communications in applications such as for example health care, education, smart cities, transportation, maritime and energy. In the security business, Zenitel brings solutions which are extremely reliable, always available and meeting high standards on cyber security for applications in critical communication, but also useful for daily operations. The uniqueness of Zenitel is the combination of:
• Being the sound specialist in the security landscape (hear, be heard and be understood always)
• Delivering solutions with seamless integration capabilities (Integration with building management systems, video surveillance, access control and other technologies in the same ecosystem)
Zenitel wants to further strengthen its technology leadership through product innovation.
Zenitel will continue to have a strong worldwide presence in both the onshore and offshore markets through its global brands, Vingtor-Stentofon and Phontech. Zenitel is committed to invest in the quality and innovation of its product portfolio. In 2019 the operations of Phontech have been fully integrated. The anticipated synergies have been realized.
The focus of Zenitel remains both on the offshore activities (maritime & energy) as well as on the onshore activities.
For offshore, Zenitel developed its business to act as an integrator of the internal communication system in the maritime and energy market. Whereas for the onshore activities, Zenitel focus is on the product development, manufacturing and marketing & sales worldwide of our products and solutions through own sales channels and partners.
In 2019, Zenitel continued investing in the development of new products and solutions which resulted in, among others, the launch of the new EDGE and ICX-500 technology. We have also continued to launch new software-based solutions. The products have been very well received in the market, providing a solid basis for further product and market solutions in the coming years.
Zenitel will continue to focus on profi table growth in its core markets.
16 ZENITEL - ANNUAL REPORT 2019

IFRS
The consolidated fi nancial statements have been prepared in accordance with the International Financial Reporting Standards (IFRS) as endorsed by the European Union. These consolidated fi nancial statements are prepared under the historical cost convention, except for certain fi nancial instruments, which are measured at fair value. In the current year, the Group has adopted all of the new and revised Standard and Interpretations issued by the International Accounting Standards Board (IASB) and the International Financial Reporting Interpretations Committee (IFRIC) of the IASB that are relevant to its operations and effective for annual reporting periods beginning on 1 January 2019, all of which were endorsed by the European Union.
An overview of the new standards that became applicable for 2019, and the standards and interpretations that will become applicable after 2019, is included in the Accounting Policies section in the Financial Report chapter. The company did not early adopt or determine the effect of the new standards applicable after 2019.
FINANCIAL YEAR 2019
The Board of Directors is pleased to present its report for the fi nancial year 2019. The report covers both the consolidated (Group) and the unconsolidated (parent company) accounts in accordance with Article 3:32, § 1, second clause of the Belgian Code of Companies and Associations.
CONSOLIDATED STATEMENT OF PROFIT OR LOSS
Revenue amounted to 76.3 million euro in 2019. This represents an increase of 14.4 million euro or 23.3% compared to 2018.
Due to the continuous focus on operational effi ciency and a well-managed integration of the Phontech business, EBITDA (Earnings Before Interests, Taxes, Depreciation and Amortization) was 6.5 million euro in 2019, compared to 4.2 million euro in 2018, an increase of 2.3 million euro of which 1.8 million euro as a result of the adoption of IFRS 16.
(thousands of euro) 31 December
2019* 2018
Revenue 76 257 61 831
EBITDA*** 6 509 4 240
Depreciation/amortization* -2 586 -1 076
Operating profi t (EBIT)** 3 923 3 164
* Impacted due to the adoption of IFRS 16** EBIT is a non-IFRS measure and is defi ned as operating profi t
or earnings before interests and taxes.*** EBITDA is a non-IFRS measure and is defi ned as operating
profi t + depreciation + amortization
Operating profi t or EBIT (Earnings Before Interest and Taxes) amounted to 3.9 million euro, compared to 3.2 million euro in 2018. R&D expenses were all expensed in 2018 and 2019.
Net fi nancial expense was 0.2 million euro, compared to net fi nancial income of 0.2 million euro in 2018.
The total consolidated net result for the Zenitel Group shows a profi t of 3.0 million euro in 2019, against a net result of 2.7 million euro in 2018. Earnings per share are 0.91 euro versus a 0.80 euro in 2018.
SEGMENT REPORTING
The Group is no longer organized into separate segments. The activities of the Group consist of operations in Norway, Belgium, Denmark, Singapore, China, France, Finland, Italy, Germany, The Netherlands, Croatia, Brazil, India, UK, USA, United Arab Emirates and a worldwide distributor network.
ZENITEL - ANNUAL REPORT 2019 17

CONSOLIDATED STATEMENT OF FINANCIAL POSITION
Total assets amounted to 59.1 million euro in 2019, compared to restated 50.1 million euro in 2018, an increase of 9.0 million euro compared to 2018, mainly due to the result of the year and the adoption of IFRS 16. Property, plant and equipment amounted to 4.6 million euro, 3.8 million euro higher than the previous year. Goodwill increased to 3.3 million euro, due to the foreign currency translation impact.
Other intangible assets decreased to 0.2 million euro and are mainly due to the no longer activated R&D expenses in 2018 and 2019. Deferred taxes amounted to 1.2 million euro, an increase of 0.4 million euro. Long-term fi nancial assets amounted to 0.2 million euro, which is in line with last year.
Inventories amount to 12.6 million euro, an increase of 1.9 million euro from the previous year.
Trade and other receivables amount to 14.4 million euro, an increase of 2.4 million euro compared to the previous year.
Equity totals 32.6 million euro, an increase of 3.3 million euro, which can be mainly explained by the impact of the foreign currency translation and the positive result for the year. The equity ratio is 55.1% compared to 58.5% in the previous year, mainly due to the adoption of IFRS 16.
Total non-current liabilities amount to 2.4 million euro, an increase of 1.9 million euro compared to the previous year as a result of the adoption of IFRS 16.
Total current liabilities increased by 3.8 million euro to 24.2 million euro in 2019. Trade and other payables amount to 15.1 million euro, an increase of 1.2 million euro. Short-term borrowings increased by 1.6 million euro to 3.7 million euro. Total long-term and short-term borrowings increased by 3.5 million euro to 5.6 million euro due to the adoption of IFRS 16.Short-term provisions amounted to 4.4 million euro,which is in line with last year.
The Board of Directors has evaluated the positive consolidation differences, the deferred tax assets, the contracts in progress and the restructuring and other provisions and is of the opinion that the amortizations and provisions are suffi cient.
As of 2016, the Board of Directors has decided to no longer capitalize the development costs.
SOURCES AND APPLICATIONS OF FUNDS
Net cash fl ow of the Zenitel Group amounted to 0.8 million euro in 2019, compared to 1.5 million euro in 2018. The outfl ow from investment activities amounted to 1.0 million euro in 2019, and the cash fl ow generated from operations before changes in working capital amounted to 8.1 million euro in 2019, which is 3.7 million euro higher than in 2018. At the end of 2019, Zenitel’s net cash and cash equivalents amounted to 21.3 million euro.
HUMAN RESOURCES
The number of full-time equivalents (FTEs) on 31 December 2019 is 303, compared to 300 on 31 December 2018.
IMPORTANT SUBSEQUENT EVENTS
There are no important subsequent events to report that took place after the end of the fi nancial year 2019, other than those described hereafter.
The outbreak of the coronavirus in early 2020 and the results of the measures taken to contain the virus are non-adjusting subsequent events in accordance with IFRS and with Belgian GAAP and hence have no effect on the fi nancial statements of 2019. Based on the facts known as of today, the potential effects do not impact our long-term budget used for the goodwill impairment test. It is expected that the consequences of the Coronavirus will impact our fi nancial performance of 2020 and potentially the measurement of certain assets and liabilities in 2020.
Finally, until the date of this report, we did notice some effects during the beginning of 2020 that could affect the fi nancial performance. Mid-March 2020, the Zenitel operations and supply chain is still in on-going.The Zenitel team is doing all efforts to further supplyour customers.
INFORMATION ON RESEARCH AND DEVELOPMENT
The company continued to invest in the development of new products and services, which resulted in several new product launches.
CONFLICTS OF INTEREST
There were transactions and operations in 2019 that created a confl ict of interest or that required the application of articles 523 or 524 of the Belgian Company Code (Articles 7:96 or 7:97 of the Belgian Code of Companies and Associations — see pages 31-32).
STATEMENT ON AUDIT COMMITTEE
The Board of Directors confi rms the independence and know-how of at least one member of the audit committee regarding accounting and audit. Also, collectively, the audit committee has suffi cient expertise in accounting and audit, given the careers and education of each of the members of the audit committee.
18 ZENITEL - ANNUAL REPORT 2019
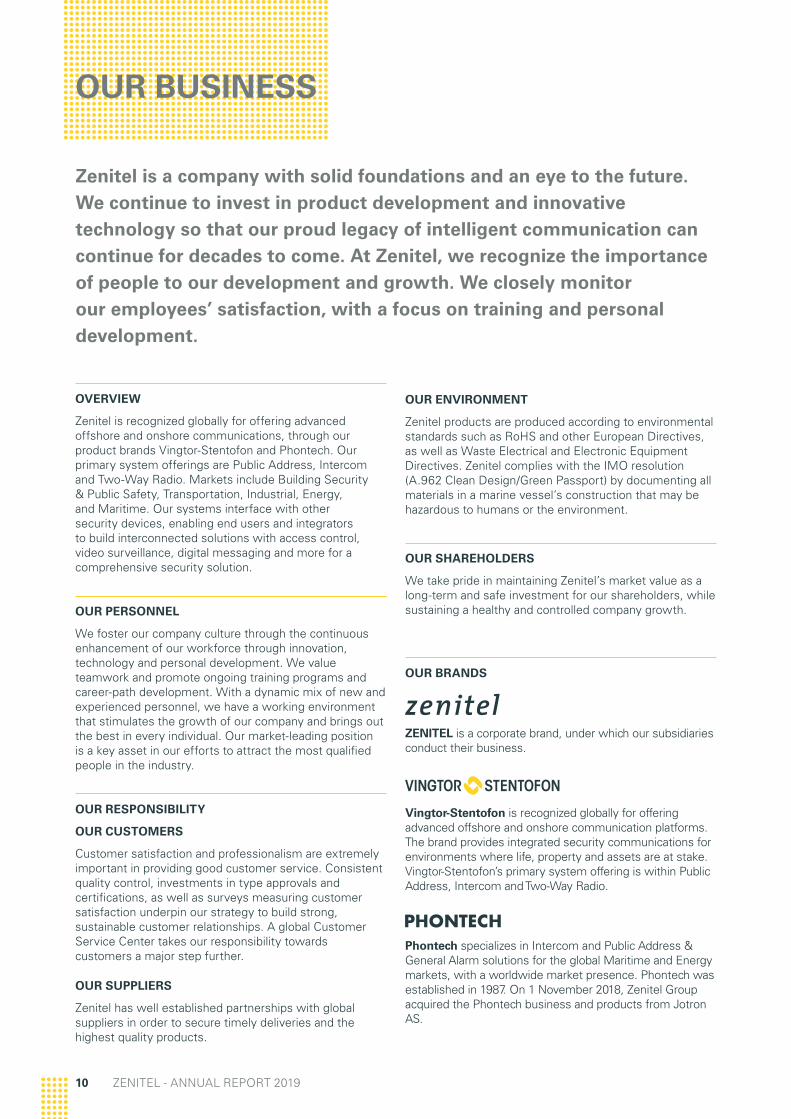
RISK FACTORS AND UNCERTAINTIES
The Board of Directors considers the following risk factors to be important and takes them into consideration when performing risk assessments, since these risk factors could impair the Group’s business operation or have an adverse effect on the Group’s cash fl ows, profi tability, fi nancial condition and the price of its shares.
Technology risk: The Group is active in selected professional markets for communication technologies and must defi ne the right products to introduce into each market. The Group faces among others, the risk of (i) not being the fi rst to market a new product, (ii) using third- party components that do not meet the expected quality levels, (iii) not achieving the expected sales volume or profi tability, (iv) introducing new products that are not yet ready to be marketed, (v) new technology replacing current technology marketed by the Group, (vi) non-availability of third-party components (temporarily or permanently).
Macro-economic risks: An overall negative economic climate, a lack of liquidity in the fi nancial markets, or a global stock-market collapse, impair the Group’s customers and partners or render them unable to secure the funds for planned investments.
Force majeure risks: Events of an exceptional nature (such as a fi re) or events on a larger scale (such as pandemic, fl ooding, earthquake or extreme weather conditions) and human-related force majeure (such as terrorist attacks and disease epidemics) may affect the Group itself and/or its components suppliers. Especially in the case of an R&D and/or a manufacturing site, those events may seriously affect the Group’s competitive position, as they may disrupt deliveries to customers or delay new product releases.
Acquisition risks: Part of the Group’s long-term growth strategy is based on acquisitions. Therefore, there are risks associated with the acquisition itself, as well as risks related to the integration of the acquired company into the Group, which may result in impaired goodwill.
IT risks: The Group makes extensive use of IT systems and platforms to support its operations which may be adversely affected by a Cyber-attack or by a failure in confi guration, hardware or software. Changes in IT technology may cause the Group’s information systems to become obsolete and thus, inadequate to handle its growth, resulting in a loss of customers and sales.
Inability to attract and retain personnel: The Group might be unable to attract and retain competent personnel for key roles in the future. Potential impacts might include: loss of knowledge of key systems and possession of specialized skills resulting in a skills and competency gap, loss of corporate knowledge, high staff turnover, customer dissatisfaction, failure to meet business objectives, increased rehiring costs, loss of customers because of customer-employee relationships.
Litigations: The Group has certain pending fi les that can be qualifi ed as contingent liabilities according to the IFRS defi nition. The outcome of these litigations is uncertain. The Group believes that it has, in agreement with its Auditor, suffi ciently provisioned for these potential liabilities. However, no guarantee can be given that this will be the case and there is a risk that the Group will need to pay some or all of these contingent liabilities in the near future.
Besides these risk factors, the Board of Directors also considers currency exchange rate risks (see next paragraph), risks of tax disputes, uncertainties relating to changing regulations, dependence on major customers, uncertainties relating to the outlooks, and the risks relating to the long Group history.
USE OF FINANCIAL INSTRUMENTS
Financial risk management
Zenitel uses bank forward exchange contracts in order to secure Zenitel’s commercial transactions in foreign currencies. Since most of the Norwegian business is exported in the euro currency, Zenitel Norway AS has a NOK defi cit and a EUR surplus. The company has put in place hedging systems that secure the needed exchange between EUR/NOK on a rolling basis. Per 31 December 2019, Zenitel has secured its need of Norwegian kroner by monthly forward exchange contracts from euro until December 2020. No other hedging mechanisms are used.
Incurred price risk, credit risk, liquidity risk and cash fl ow risk
The Group has countered the price risk and the risk for infl ation by fi xing local credit facilities in local currencies on a non-recourse basis. This implies that both revenues and the repayment of credit facilities are in the local currency. The same is valid for Norway, since the Group concluded credit facilities in NOK to fi nance the trade receivables and inventory in Norway.
Fees paid to the statutory auditor or associates offi ces:
Audit fees:
Zenitel NV 21 288 euro
Zenitel Group: 98 729 euro
Non audit fees:
Tax compliance 12 190 euro
Other services: 0 euro
Other audit related fees:
Zenitel NV: 3 725 euro
Zenitel Group: 7 430 euro
ZENITEL - ANNUAL REPORT 2019 19

OUTLOOK 2020
The recent events related to the Corona virus increased the uncertainty in the business. The future investments of our customers in critical communication solutions will be evaluated and it is expected that this will have an impact on our 2020 results.
Despite the diffi cult market circumstances, Zenitel has the intention to further strengthen its market position in the global security market by building on the technology leadership in superior audio communication products enabling seamless integration in security solutions.
For the onshore safety and security business, an increased market share is expected based on new product development and the strengthened global partner network. The Zenitel solutions realize superior audio communication integrated in security platforms with technologies such as access control, video surveillance and fi re alarm. The R&D activities combined with the increased market reach are the basis for this expected stronger market position.
In the maritime and energy market, Zenitel will further strengthen its market position based on the integration activities realizing unique and high performing communication solutions for our customers worldwide.
DECLARATION WITH REGARDS TO CORPORATE GOVERNANCE
Rules and regulations regarding corporate governance have changed signifi cantly during the past few years. Besides the existing prescriptions of the Belgian Corporate Governance Code 2009 (CG-Code 2009) with its “comply or explain” approach and the Act of 6 April 2010 to reinforce corporate governance (CG-Law 2010), the Act of 20 December 2010 on the exercise of certain rights of shareholders in listed companies has been published in 2011.
The Company has adopted the Belgian Corporate Governance Code 2009 as the reference code. The Belgian Corporate Governance Code 2009 is available at the following website: www.corporategovernancecommittee.be. No other corporate governance practices are applied by Zenitel NV.
The Corporate Governance Charter of the Company was updated in February 2019 in order to be in line with the new Belgian rules and regulations with respect to Corporate Governance. A copy of this Corporate Governance Charter is available on the Zenitel website. Zenitel will amend and adapt to the 2020 Corporate Governance code.
We refer to the separate chapter ‘Declaration with regards to Corporate Governance’ in this annual report for further information with respect to Zenitel’s corporate governance, which should be provided in accordance with Article 3:6, §2 of the Belgian Code of Companies and Associations and the 2020 Belgian Code on Corporate Governance. In the cases where Zenitel does not follow the 2020 Belgian Code on Corporate Governance, you will fi nd an explanation for this in the chapter ‘Declaration with regards to Corporate Governance’ included elsewhere in this annual report.
The chapter ‘Declaration with regards to Corporate Governance’ forms an integral part of this report of the Board of Directors.
STATUTORY ACCOUNTS OF ZENITEL NV (UNCONSOLIDATED)
BALANCE SHEET
Financial assets amount to 39.0 million euro and consist of the participations in Zenitel Group companies.
Receivables within one year amount to 0.3 million euro, which is mainly receivables from or loans given to other Zenitel Group entities.
Cash and deferred charges amount to 4.5 million euro which is in line with previous year. The change in equity from 39.5 million euro to 40.7 million euro is entirely related to the result of the year.
Provisions for risk and other liabilities amounted to 2.4 million euro, compared to 3.9 million euro in 2018.
There were no fi nancial debts outstanding at the end of 2019.
INCOME STATEMENT
Other operating income increased from 1.3 million euro to 1.5 million euro in 2019. The reported other operating income consists mainly of management and license fees charged to other Zenitel Group companies. The total amount of management and license fees charged amounted to 1.5 million euro in 2019.
Operating expenses in 2019 amounted to 0.4 million euro compared to 0.8 million euro last year.
The above-mentioned changes resulted in an operating profi t of 1.2 million euro in 2019 against an operating profi t of 0.5 million euro in 2018.
Financial expenses amounted to 0.03 million euro in 2019 and are at the same level as in 2018. In 2018 and 2019, there were no extraordinary results reported.
RESEARCH AND DEVELOPMENT
There were no research and development activities at the level of the holding company during the year under review.
20 ZENITEL - ANNUAL REPORT 2019

APPROPRIATION OF RESULT
Considering the profi t of 1,176,339.24 euro, the Board of Directors proposes to appropriate the result as follows:
Result carried forward prior year: 2 682 865.89 euro
Result of the year: 1 176 339.24 euro
Appropriation to legal reserve -58 816.96 euro
Result carried forward: 3 800 388.17 euro
After appropriation, the equity of Zenitel NV can be detailed as follows:
Share capital: 20 000 000.00 euro
Share premium: 5 623 849.48 euro
Reserves: 11 248 774.86 euro
Result carried forward: 3 800 388.17 euro
Total: 40 673 012.51 euro
ADDITIONAL HONORARIA PAID TO STATUTORY AUDITOR
Audit fee: 21,288 euro
Other audit related fees: 3,725 euro
Non audit fees:
Tax compliance: 4,250 euro
Other services: 0,00 euro
INFORMATION REGARDING CIRCUMSTANCES THAT CAN SIGNIFICANTLY INFLUENCE THE DEVELOPMENT OF THE COMPANY
Please refer to the paragraph on risk factors and uncertainties where information is provided on the main risks and uncertainties that could negatively impact the development, fi nancial results or market position of the Company.
RISK FACTORS AND UNCERTAINTIES
We refer to the section on risks and uncertainties earlier in this report of the Board of Directors, which apply mutatis mutandis to Zenitel NV.
EXISTENCE OF BRANCH OFFICES
The company has no branch offi ces.
USE OF FINANCIAL INSTRUMENTS
We refer to the section on the use of fi nancial instruments set out earlier in this report of the Board of Directors, which applies, mutatis mutandis, to Zenitel NV.
ZENITEL - ANNUAL REPORT 2019 21

STOCK & SHAREHOLDER INFORMATION
SHARE QUOTATION
Per 31 December 2019, the subscribed capital amounted to 20,000,000.00 euro. It is represented by 3,310,884 shares without nominal value and is fully paid up. The par value of a share is 6.041 euro. The shares are quoted on Euronext Brussels (double fi xing) with the symbol ZENT.
TRANSPARENCY
Zenitel NV has not received any notifi cations in accordance with Article 2 of the Act of 2 May 2007 on the publication of important participations in issuers whereof shares are admitted for trading on a regulated market in 2019.
SHAREHOLDERS AND CAPITAL STRUCTURE
The shareholder structure per 31 December 2019 is the following, as it appears from the notifi cations Zenitel NV received.
Shareholders Number of shares
% of total
3D NV* 1 584 776 47.87%
QuaeroQ CVBA 496 230 14.99%
De Wilg GCV* 400 000 12.08%
Zenitel Norway AS 2 500 0.07%
Freefl oat 827 378 24.99%
Total 3 310 884 100%
*Acting in concert
All shares have the same rights and obligations. There are no different kinds of shares. At the end of 2019, there were no warrants outstanding. The Company has not issued any non-voting shares. The Company has implemented a long-term incentive plan for senior managers. Further information thereon is provided in the section on ‘Declaration with regards to Corporate Governance’.
No special control rights have been granted to certain securities, which could have an impact in the event of a public takeover bid.
VOTING RIGHTS
There are no limitations in the articles of association of Zenitel NV with respect to the exercise of the voting rights which could have an impact in the event of a public takeover bid.
TRANSFER OF SECURITIES
There are no legal limitations or limitations in the articles of association with respect to the transfer of securities of Zenitel NV which could have an impact in the event of a public takeover bid.
SHAREHOLDERS’ AGREEMENTS
Zenitel NV is not aware of any shareholders’ agreement that may lead to a limitation of the transfer of securities and/or the exercise of voting rights, which could have an impact in the event of a public takeover bid. Zenitel NV does not know the content of the shareholders’ agreement concluded between De Wilg GCV and 3D NV acting in concert.
RULES FOR THE APPOINTMENT AND REPLACEMENT OF DIRECTORS AND MODIFICATIONS TO THE ARTICLES OF ASSOCIATION
There are no specifi c rules applicable to the appointment and replacement of directors and modifi cations to the articles of association other than those provided for by law, which could have an impact in the event of a public takeover bid.
DIVIDEND
No dividend payments are planned.
22 ZENITEL - ANNUAL REPORT 2019

ACQUISITION AND DIVESTMENT OF OWN SHARES
The Company has been authorized by means of a decision of the general meeting of 28 April 2017 to acquire its own shares or bonus shares or certifi cates that relate thereto, or to divest them in accordance with Article 7:215 and following of the Belgian Code of Companies and Associations.
The general meeting of 28 April 2017 has explicitly granted the authority to the Board of Directors, in accordance with the provisions of Article 7:215 and following of the Belgian Code of Companies and Associations, to acquire by sale or exchange its own shares, bonus shares or certifi cates that relate thereto or to divest those, without the requirement of a prior decision of the general meeting, either directly or through a person who acts in its own name but on behalf of the company, or through a direct subsidiary in the meaning of Article 7:221 of the Belgian Code of Companies and Associations, if the acquisition or divestment is necessary to avoid a threatening serious disadvantage for the company. This power is valid for a period of three years as from the publication of this decision in the Annexes to the Belgian State Gazette, i.e., until 16 May 2020, and can be renewed.
The general meeting of 28 April 2017 has moreover granted the Board of Directors the power to acquire by sale or exchange the maximum number of shares, bonus shares or certifi cates that relate thereto as set forth in Article 7:215, §1 and 7:218, §1 of the Belgian Code of Companies and Associations, and to divest those, either directly or through a person who acts in its own name but on behalf of the company, or through a direct subsidiary in the meaning of Article 7:221 of the Belgian Code of Companies and Associations, against a consideration that cannot be more than 20% lower and cannot be more than 20% higher than the average stock exchange rate of the relevant security on Euronext during the fi ve trading days preceding the acquisition or exchange or divestment. This power is valid for a period of 5 years as from the resolution of the general meeting of 28 April 2017, i.e., until 28 April 2022.
The Board of Directors is furthermore also empowered in accordance with Article 7:226, §1 of the Belgian Code of Companies and Associations, to take a pledge, directly or indirectly through a subsidiary or a person who acts in its own name but on behalf of that subsidiary or the company, as stipulated in Article 7:226, §1 of the Belgian Code of Companies and Associations, on its own shares, bonus shares or certifi cates that relate thereto and this in accordance with the conditions and duration for acquisition and divestment of own shares set forth above. In accordance with Article 7:215, §2 of the Belgian Code of Companies and Associations the company should, for as long as it is listed or as long as its securities are admitted to an MTF as defi ned in Article 2, 4° of the Law of 2 August 2002 on the supervision of the fi nancial sector and the fi nancial services, to the extent that it works with at least one daily trading and with a central order book, inform the Financial Services and Markets Authority of acquisitions that it is considering by application of Article 7:215, §1 of the Belgian Code of Companies and Associations. The Board of Directors is furthermore empowered to divest shares or certifi cates of the company in accordance with Article 7:218, §1, 4° of the Belgian Code on Companies and Associations.
In the course of 2019, Zenitel Norway AS, a direct subsidiary of Zenitel NV, acquired 2,500 shares in Zenitel NV, having a par value of 6.041 euro each and representing 0.07% of the current share capital of Zenitel NV. Consequently, as per 31 December 2019, Zenitel Norway AS held 2,500 shares in Zenitel NV, having a par value of 6.041 euro each and representing 0.07% of the current share capital of Zenitel NV. This acquisition took place within the scope of the authority granted by the extraordinary general meeting of shareholders of Zenitel NV of 28 April 2017 and within the framework of Zenitel NV’s long-term share incentive plan, at a purchase price of 13.3421 euro per share, corresponding to a total purchase price of 33,355.25 euro.
AUTHORIZED CAPITAL
The Board of Directors received the authority to increase the share capital in one or more transactions, during a period of fi ve years as from the publication of the decision of the general meeting dated 28 April 2017, in the Annexes to the Belgian State Gazette, i.e., until 16 May 2022, with a maximum amount of 20,000,000 euro. Within the framework of the authorized capital, the Board of Directors is authorized to cancel or limit the existing shareholders’ preferential right, also to the benefi t of one or more determined persons, other than members of the company’s or its subsidiaries’ personnel, as set out in Article 7:190 and following of the Belgian Code of Companies and Associations.
The general meeting of 28 April 2017 has moreover, in accordance with Article 7:202, second paragraph, 2° of the Belgian Code of Companies and Associations, granted the Board of Directors the power to increase the share capital in one or more transactions, as of the date the company receives a notifi cation from the Financial Services and Markets Authority that the latter has been notifi ed of a public takeover bid on the shares of Zenitel NV, by contribution in cash with cancellation or limitation of the existing shareholders’ preferential right or by contributions in kind, and/or by the issue of securities carrying voting rights, whether or not representing the share capital, or the issue of securities which give right to subscribe to or acquire such securities, also if such securities are not preferentially offered to the shareholders in proportion to the share capital represented by their shares. In such case, the transaction needs to meet the criteria set out in Article 7:202, second paragraph, 2°, a) to c) of the Belgian Code of Companies and Associations. This power is valid for a period of 3 years as from 28 April 2017, i.e., until 28 April 2020.
AGREEMENTS AFFECTED BY A CHANGE OF CONTROL OF THE COMPANY
Zenitel NV is not aware of any important agreements to which it is a party that enter into force, experience amendments or are terminated in the event of a change of control of the Company following a public takeover bid. In addition, the Company is not aware of any agreements between it and its Directors or employees for the provision of compensation in the event that, as a consequence of a public takeover bid, the Directors resign or are dismissed without valid reason or the employment of employees is terminated.
ZENITEL - ANNUAL REPORT 2019 23

STOCK PRICE EVOLUTION
The graph above shows the development of the closing share price of Zenitel shares from 1 January 2019 until 31 December 2019 (see also Euronext website: www.euronext.com).
FINANCIAL CALENDAR
14/02/2020 Press Release Results 2019 (8:00 AM)
27/03/2020 Publication Annual Report 2019 (8:00 AM)
28/04/2020 Annual General Shareholders’ Meeting (11:00 AM)
12/08/2020 Press Release Half-Year Results 2020 (8:00 AM)
ABOLISHMENT OF BEARER SHARES
In accordance with the Act of 14 December 2005 on the annulment of bearer securities, any bearer securities which were not yet converted on 31 December 2013 into registered or dematerialized securities were automatically dematerialized and registered by the Company in its own name on a securities account.
In accordance with the aforementioned Act, the Company proceeded with selling those shares that had not yet been claimed by their rightful owner on the regulated market on 30 November 2015. The number of shares that was offered for sale on the regulated market on 30 November 2015, amounted to 9,070. All shares have been sold at euro 1.05 per share. The proceeds of the sale have been deposited with the Deposito- en Consignatiekas/Caisse des Dépôts et Consignations. Since 1 February 2016, the rightful owner can claim the proceeds relating to its shares by submitting its bearer shares with the Deposito- en Consignatiekas/Caisse des Dépôts et Consignations, taking into account a fi ne, which amounts to 10% per year of the proceeds of such shares (as from 1 January 2016).
The statutory auditor of the Company has confi rmed in accordance with Article 11§5 of the Act that the provisions of Article 11 of the Act have been complied with.
24 ZENITEL - ANNUAL REPORT 2019

With a full range of IP products and solutions, built-in intelligence and
security, the Zenitel portfolio is providing organizations with maximum fl exibility in scale and performance and is ready to reach unparalleled levels of deployment and usage.

DECLARATION WITH REGARDS TO CORPORATE GOVERNANCE
This section summarizes the rules and principles by which the corporate governance of Zenitel is organized pursuant to Belgian company law and the Zenitel articles of association. It is based on Zenitel’s articles of association and Zenitel’s Corporate Governance Charter.
The Zenitel Corporate Governance Charter has been construed in accordance with the recommendations set out in the Belgian Corporate Governance Code issued on 12 March 2009 (hereinafter, the “Belgian Corporate Governance Code 2009”), as well as in accordance with any applicable Belgian legislation.
Zenitel has adopted the Belgian Corporate Governance Code 2009 as the reference code. The Belgian Corporate Governance Code 2009 is available at the following website: www.corporategovernancecommittee.be. No other corporate governance practices were applied by Zenitel in 2019. As of 1 January 2020, Zenitel is subject to the Belgian Corporate Governance Code issued on 12 May 2019 (hereinafter, the “Belgian Corporate Governance Code 2020”), available at the following website: www.corporategovernancecommittee.be
The Board of Directors of Zenitel intends to comply with the Belgian Corporate Governance Code 2009, but it believes that certain deviations from the provisions and principles of the Belgian Corporate Governance Code 2009 are justifi ed in view of Zenitel’s particular situation and size. These deviations are further explained at the end of this declaration with regards to corporate governance.
The Board of Directors of Zenitel reviews its corporate governance charter from time to time and makes such changes as it deems necessary and appropriate. The charter is available free of charge on Zenitel’s website (www.zenitel. com) and at the registered offi ce of Zenitel NV. The corporate governance charter will be amended to bring it in line with the Belgian Corporate Governance Code 2020.
SHAREHOLDERS AND SHARES
The information as referred to in Article 3:6, §2, 4° of the Belgian Code of Companies and Associations can be found at the end of the chapter ‘Stock and Shareholder Information’ of this Annual Report 2019.
BOARD OF DIRECTORS
The Board of Directors of the Company may perform all acts necessary or useful for achieving the Company’s corporate purpose, with the exception of those acts that are by law or the Company’s articles of association expressly reserved to the shareholders’ meeting. The Board of Directors can transfer its competencies for special and specifi c activities to an authorized representative, even if this person is not a shareholder or a Director.
The Board of Directors of the Company is composed of a minimum of three and a maximum of twelve members. Currently, there are seven Board members, of whom six members are non-executive Directors. Four Directors are independent Directors within the meaning of Article 7:87, §1 of the Belgian Code of Companies and Associations juncto Provision 3.5 of the 2020 Belgian Code on Corporate Governance. The articles of association state that Directors are elected for a renewable term of six years maximum, which term ends at the relevant annual shareholders’ meeting. However, all current Directors are appointed for three years. Directors may be dismissed by resolution at the shareholders’ meeting at all times. Resigning Directors may be reappointed.
If a directorship position becomes vacant before the expiry of its term, the remaining Directors will have the right to temporarily appoint a new Director to fi ll the vacancy until the shareholders resolve at a shareholders’ meeting to appoint a new Director. This item must be put on the agenda of the next shareholders’ meeting.
A meeting of the Board of Directors is validly constituted if there is a quorum, consisting of at least half of the members present in person or represented at the meeting. If such a quorum is not met, a new board meeting must be convened to deliberate and decide on the matters on the agenda of the Board meeting for which a quorum was not present. In any event, the Board of Directors may only validly proceed if at least two Directors are present or represented. Meetings of the Board of Directors are convened by the Chair of the Board or by at least two Directors whenever the interests of the Company so require.
26 ZENITEL - ANNUAL REPORT 2019

The Board of Directors met six times during 2019. The following signifi cant matters were discussed at the meetings of the Board of Directors during 2019:
• Approval of year-end fi gures, annual report, agenda of the general shareholders’ meeting.
• Verifi cation of the trading updates.
• Status discussions and decisions on ongoing litigation cases.
• The Zenitel Group’s fi nancial performance and outlook.
• Status discussion on ongoing reorganization processes.
• Information and decisions on important projects.
• Strategy of the company and of the various business segments.
• Approval of 2020 budget.
• HR topics.
• Reporting of Audit Committee and Nomination and Remuneration Committee.
• Discussion of acquisition opportunities.
• Discussions on fi nancing of the business.
• Functioning of the Board.
CHAIR OF THE BOARD OF DIRECTORS
The Chair is elected from among the members of the Board of Directors for a period which in principle corresponds to his term as a Director.
The Chair is responsible for ensuring that the Board of Directors operates in accordance with the Corporate Governance Charter. Where necessary, he is assisted with this task by the committees.
The Chair is responsible for leading the board. He plans the meetings of the Board of Directors and, in cooperation with the CEO and the Company Secretary, draws up the schedule of meetings of the Board of Directors and the committees. He prepares, together with the CEO and Company Secretary, the general agenda for meetings of the Board of Directors, covering the topics that have to be discussed during the year, as well as the agenda for each meeting, indicating for each item on the agenda whether this is for information, discussion or decision.
The Chair promotes regular interaction and dialogue among the Board of Directors. The Chair ensures that the Board of Directors receives up-to-date and relevant information about important aspects of the strategy, business activities and fi nancial situation of Zenitel, including developments regarding competition. He takes initiatives to help establish a climate of respect, trust and openness within the Board of Directors in general and between the non-executive members of the Board of Directors and the senior or executive management in particular.
INDEPENDENT DIRECTORS
A Director is considered to be an independent Director if he or she meets the criteria set out in Article 7:87, §1 of the Belgian Code of Companies and Associations juncto Provision 3.5 of the 2020 Belgian Code on Corporate Governance.
The Corporate Governance Charter contains further explanations on this matter, under the chapter ‘Composition of the Board of Directors’, and can be found on the ‘Investor Relations’ pages of the company website, www.zenitel.com.
COMPOSITION OF THE BOARD OF DIRECTORS
As per 31 December 2019, the Board of Directors consists of seven members.
The Board of Directors convened six times during 2019. On these occasions, either all or a large majority of the Directors at that point in time were present or attended through conference calls.
There is no familial relationship between any of these persons.
The general meeting of shareholders held on 29 April 2019 decided to appoint Cascade Dynamics BVBA, represented by Gail Smith as an independent Director of the Company with immediate effect until the general meeting of 2022 and to re-appoint Kenneth Dastol as executive Director and Blanco Blad BVBA, represented by Johan Van Gorp as an independent Director of the Company with immediate effect until the general meeting of 2022. Mr Kenneth Dåstøl resigned from his position as Director of the Company on 6 August 2019. He was replaced as person in charge of the Company’s daily management (CEO) by K-CL BVBA, permanently represented by Koen Claerbout, on 6 August 2019.
The biographies and the principal activities outside Zenitel of the members of the Board of Directors or their representatives (in the event the Director is a legal person), are set out below.
■ Jo Van Gorp (representing Blanco Blad BVBA) (°1964) – Mr. Van Gorp is the Chair of Zenitel. He has been a member of Zenitel’s Board of Directors since 2010. He is currently Managing Director at Gritt Projects nv and advises companies in areas of general management, marketing, strategy, change management, organizational repositioning, legal and regulatory affairs and public policy. Since 2009, he acted as CEO or COO for several smaller and larger national and international companies. Mr. Van Gorp was a member of the Telenet executive team consecutively in his role of EVP & General Counsel (2004-2006) and Executive Vice President Residential Markets (2006-2009). Before joining Telenet in 2004, Mr. Van Gorp had been CEO at Level 3 Communications NV (1998-2004), Vice President Legal & Regulatory Affairs/Business Development at Verizon Business (1994-1998) and Senior Advisor European Regulation at BT Global Services (1992-1994). Mr. Van Gorp obtained Master’s
ZENITEL - ANNUAL REPORT 2019 27

degrees in both Law at the KU Leuven and European Law at the Europa Institute of the University of Saarland.
■ Koen Claerbout (representing K-CL BVBA) – (°1972) – Mr. Claerbout is the CEO of Zenitel since 2019. Between 1995 and 2008, he held several management functions in multinationals such as BASF, Suez and Bekaert. He was active in R&D, production, marketing & sales and general management. Since 2008 he has been active as CEO or General Manager of several international companies such as Altachem, JORI and Audioprof. He obtained a Civil Engineering degree from the University of Ghent and has an MBA from the Vlerick Business School.
■ Yves De Backer (representing Yves De Backer BVBA) – (°1979) – Yves De Backer BVBA, represented by Mr Yves De Backer, became a member of Zenitel’s Board of Directors in 2017. Mr. De Backer is a director at 3D NV, engaged in the development of the Private Equity activities of the family-owned investment group 3D NV. Previously, he was a director at Deloitte Corporate Finance, where he advised clients on mergers and acquisitions and corporate strategy. Before that, he was corporate development manager at Enfi nity NV, a renewable project developer. He also worked at Bekaert NV, where he focused on assessing strategic investment opportunities for the Bekaert Group. He holds a Master’s degree in Business Engineering and a Corporate Finance master class degree from the Catholic University of Leuven.
■ Wenche Holen (°1964) – Ms. Holen was appointed as an independent Director of Zenitel NV in April 2012. She currently holds the position as COO of Bama Gruppen. Before joining Bama Gruppen in 2010, she has held several executive functions at companies within the Telenor Group, primarily in the areas of products, services and media. Ms. Holen has a profound knowledge of marketing and media in particular. Ms. Holen has an extensive experience from board positions of several other Norwegian companies in the past. Ms. Holen obtained an Engineering degree at Gjøvik School of Engineering and post-graduate degrees in Business Economics and Strategic Leadership at the Norwegian Business School and at the London Business School.
■ Gail Smith (representing Cascade Dynamics BVBA) (°1959) – Ms. Gail Smith founded the Cavell Group, a convergence and cloud consulting and professional services fi rm that has delivered projects in over 45 countries. She is also currently an independent director of RigNet, a Nasdaq traded company that serves the oil and gas industry. Ms. Smith was Corporate Group Vice President and President, Europe of Level 3 Communications, LLC (CenturyLink) and prior to that she was VP and General Manager, International Networks for MFS International (Verizon Business). Ms. Smith has worked and managed operations in both the U.S. and Europe. She holds a Master’s degree in International Business from Tufts University, a Licence d’État from the Université de Metz in échanges internationaux, and a Bachelor’s degree in Economics and Political Science from Claremont McKenna College. Ms Smith also holds certifi cations in cybersecurity and data privacy.
■ Liesbet Van der Perre (°1969) – Ms. Van der Perre is a professor at KU Leuven, Belgium, and guest Professor at Lund University, Sweden. She performs research on low-power and secure wireless communication solutions. Until 2015 she was a Director at imec. She has a profound knowledge of communications technologies and was on the advisory board of a few technology companies. She is an author and co-author of over 300 scientifi c publications. She received an honorary Doctorate degree in technology from Lund University (Sweden) in 2015. Ms. Van der Perre received an M.Sc. degree in Electrical Engineering from K.U.Leuven, accomplishing her Master’s thesis at the Ecole nationale supérieure de télécommunications in Paris, and graduated with a Ph.D. degree from KU Leuven.
■ Hans Swinnen (representing Equity @ Work BVBA) (°1966) – Mr. Swinnen is Partner of 3D-Investors and as such engaged in the development of the Private Equity activities of the family-owned investment group 3D NV. As Chairman of Pauwels Consulting, Plastifl ex and Aspel and Director of 3P, he is actively involved in the development and internationalization of these companies. Until 2006, Hans Swinnen was CEO of the Thomas Cook Group in Belgium and, in that role, responsible for the airline, tour operating and retail activities of the group. Mr. Swinnen holds a Master’s degree in Applied Economic Sciences (TEW) from the University of Leuven (KUL).
Name and position Independent/Dependent Executive/Non-Executive Term*
Blanco Blad BVBA, represented by Johan Van Gorp, Chair Independent Non-executive 2022
K-CL BVBA, represented by Koen Claerbout Dependent Executive 2021
Yves De Backer BVBA, represented by Yves De Backer Dependent Non-executive 2020
Wenche Holen Independent Non-executive 2021
Cascade Dynamics BVBA, represented by Gail Smith Independent Non-executive 2022
Liesbet Van der Perre Independent Non-executive 2021
Equity @ Work BVBA, represented by Hans Swinnen Dependent Non-executive 2021
28 ZENITEL - ANNUAL REPORT 2019

DIVERSITY OF THE BOARD OF DIRECTORS AND ITS COMMITTEES
The Group strives actively towards diversity at the highest governance bodies. When considering candidates for vacancies, the Remuneration and Nomination Committee takes account of diversity criteria.
The general meeting of shareholders held on 29 April 2019 appointed one additional female Director (Cascade Dynamics BVBA, represented by Ms. Gail Smith). The said Director is a member of the Audit Committee and the Nomination and Remuneration Committee. As a result, the Company believes that it is compliant with the Belgian legislation and the recommendations of the Belgian Commission for Corporate Governance regarding this matter.
The Board of Directors consists of 3 female and 4 male Directors. The age of the Board Members and its Committees Members varies between 35-45 years (1 Director), 45-50 years (2 Directors) and 50-65 years (4 Directors). All members of the Board and Committees have an extensive experience on management, technology and international executive-level positions.
AUDIT COMMITTEE
The Board of Directors has appointed an Audit Committee (AC), which must consist of at least three members, all of whom are non-executive Directors, at least one of whom should be independent. Currently the Audit Committee is composed of four non-executive Directors of whom three are independent. The Audit Committee assists the Board of Directors in fulfi lling its monitoring responsibilities with respect to control in the broadest sense.
The Audit Committee reports regularly to the Board of Directors on the exercise of its duties and on any matters in respect of which the Audit Committee considers that action or improvement is required. It also makes recommendations as to the necessary steps to be taken.
The role of the Audit Committee is to supervise fi nancial reporting, administrative, legal and tax procedures and follow up on fi nancial and operational audits, as well as to recommend the choice and remuneration of the statutory auditor. The Committee should report regularly to the Board of Directors on its fi ndings and conclusions. Furthermore, it should inform the Board of Directors regarding all areas in which, in its opinion, action or improvement is necessary. The Audit Committee should produce recommendations on the necessary steps that need to be taken. The audit review and the reporting on that review should cover the Company and its subsidiaries as a whole.
The Committee has specifi c tasks, including the Company’s fi nancial reporting, internal controls and risk management, and the internal and external audit process. These are further described in the terms of reference of the Audit Committee, as set out in the Company’s Corporate Governance Charter. In principle, there should be at least four Audit Committee meetings per year. The Committee also meets at least once a year with the statutory and internal auditors to discuss the auditing process.
The members of the Committee shall at all times have full and free access to the Chief Financial Offi cer, as well as to any employee to whom they may require access in order to fulfi ll their responsibilities.
As of 31 December 2019, the Audit Committee consists of:
Name and position Term*
Yves De Backer BVBA,represented by Yves De Backer, Chair 2020
Blanco Blad BVBA, represented byJo Van Gorp, Independent Director 2022
Cascade Dynamics BVBA, represented byGail Smith, Independent Director 2022
Wenche Holen, Independent Director 2021
*The term of the mandates of the Directors will end immediatelyafter the annual shareholders’ meeting.
The Audit Committee met four times during 2019. The following signifi cant matters were discussed at the meetings of the Audit Committee in 2019.
• Presentation of the external auditor and fi nancial statements of 2018.
• Discussion and proposal of the new Company external auditor to the general assembly.
• Financial statements per 30 June 2019, and forecast.
• Impacts of the pending litigations.
• The fi nancial performance including cash fl ows and outlooks for the year and beyond.
• Discussion and evaluation of internal controls and risk management.
• Discussions regarding fraud prevention.
• Discussion and evaluation of acquisitions.
• Tax risk assessment of the Zenitel Group.
• Internal audit report regarding the audits carried out at Zenitel Norway.
• Discussion with the statutory auditor in the absence of management.
ZENITEL - ANNUAL REPORT 2019 29

NOMINATION AND REMUNERATION COMMITTEE
The Board of Directors decided to merge the Remuneration Committee and the Nomination Committee into one Committee. The Nomination and Remuneration Committee is responsible for the selection of suitable candidates for the appointment to the Board and may make recommendations to the Board of Directors with regards to the appointment of Directors and the members of the executive management. The Nomination and Remuneration Committee also makes recommendations to the Board of Directors on the remuneration policy of Zenitel and the remuneration of board members and the members of the executive management, and where appropriate, on the resulting proposal to be submitted by the Board of Directors to the general meeting of shareholders. It also prepares the remuneration report as set out further in this declaration with regards to corporate governance and provides explanations to this report at the annual general meeting of shareholders.
The Nomination and Remuneration Committee ensures that the procedure for appointing and reappointing Directors, Committee members, CEO, and senior managers of Zenitel and its subsidiaries is as objective as possible. The Committee ensures that the remuneration policy is applied objectively.
The Nomination and Remuneration Committee consists of three non-executive Directors, with two of them being independent. The CEO participates in the Nomination and Remuneration Committee meetings but leaves the meeting whenever he and/or his remuneration are being discussed. Furthermore, the Chairman of the Board of Directors has an open invitation to attend the Nomination and Remuneration Committee meetings.
The Nomination and Remuneration Committee advises the Board of Directors on applications for and the appointment of Directors, Committee members, CEO and senior managers; the scope and composition of the Board of Directors, the Committees and senior management; and the remuneration policy for the Directors, Committee members, CEO, and senior managers. More information on the tasks of the Nomination and Remuneration Committee can be found in Zenitel’s Corporate Governance Charter, which is available on the website: www.zenitel.com.
When carrying out its duties with regards to remuneration, the Nomination and Remuneration Committee takes account of what is customary in Belgium, Norway and abroad in the sector in which Zenitel operates and in companies of a similar scope to Zenitel.
Once a year, the Nomination and Remuneration Committee discusses the work performance of key staff. The parameters in this respect are clearly specifi ed by the Nomination and Remuneration Committee.
The Nomination and Remuneration Committee meets at least twice a year and, in any cases where changes have to be made to the composition of the Board of Directors, the Committees or senior management.
Name and position Term*
Yves De Backer BVBA, represented by Yves De Backer, Chair 2020
Cascade Dynamics BVBA, represented byGail Smith, Independent Director 2022
Wenche Holen, Independent Director 2021
*The term of the mandates of the Directors will end immediately after the annual shareholders’ meeting held in the year corresponding to the Director’s name.
The Nomination and Remuneration Committee met four times in 2019.
The following signifi cant matters were discussed at the meetings of the Nomination and Remuneration Committee in 2019.
• Proposal of appointment of a new Director.
• Evaluation of functioning of the Board of Directors
• Discussion and approval of the remuneration report 2018.
• Decision on 2018 bonus payments and timing of these payments.
• Decision on the 2019 bonus schedules and salary packages for the executive team and the senior management team.
• Approval of the motivation and the contents of the “Explain” paragraphs in the Declaration with regards to the corporate governance chapter of the Annual Report 2019.
• The dismissal of the CEO and appointment of a new CEO.
REPORT OF ATTENDANCE AT BOARD AND COMMITTEE MEETINGS
In the table below, an overview is given of the attendance of each Director at the various meetings in 2019:
NameBOD
(Total 6)
AC
(Total 4)
NRC
(Total 4)
Blanco Blad BVBA, represented by Jo Van Gorp 6/6 4/4 -
K-CL BVBA, represented by Koen Claerbout, CEO 3/3 - -
Wenche Holen 6/6 4/4 4/4
Liesbet Van der Perre 6/6 - -
Yves De Backer BVBA, represented by Yves De Backer
6/6 4/4 4/4
Equity@Work BVBA represented by Hans Swinnen
5/6 - -
Cascade Dynamics BVBA, represented by Gail Smith 3/3 2/2 2/2
K-CL BVBA, represented by Koen Claerbout 3/3 - -
Kenneth Dåstøl, former CEO 3/3 - -
30 ZENITEL - ANNUAL REPORT 2019

CHIEF EXECUTIVE OFFICER
The Board of Directors appoints and dismisses the Managing Director, also referred to as the Chief Executive Offi cer or CEO. The Board of Directors appointed Mr. Koen Claerbout (representing K-CL BVBA) as CEO of the Zenitel Group as of 6 August 2019, to replace Mr Kenneth Dåstøl.
The Managing Director (CEO) is authorized to decide on all matters of daily management (‘dagelijks beleid’) to the extent permitted by law and as defi ned in the articles of association. He is responsible and accountable for the complete, timely, reliable and accurate preparation of Zenitel’s fi nancial statements, in accordance with the accounting standards and policies of Zenitel, and the presentation to the Board of Directors of a balanced and understandable assessment of Zenitel’s fi nancial situation.
The Managing Director (CEO) has the power to resolve any issue of daily management and reports to the Board of Directors. He cannot be the Chair of the Board. He works in close cooperation with the Board of Directors and its Committees to enable the Board, the Chair and the Committees to exercise their responsibilities. The Managing Director and the Chair of the Board meet regularly to discuss strategic initiatives and all relevant matters of daily management and to determine in dialogue the agenda for the Board of Directors.
EXECUTIVE TEAM
The Executive Team is appointed by the Board of Directors. The team consists of the Chief Executive Offi cer (K-CL BVBA, represented by Koen Claerbout) and the Chief Financial Offi cer (Mark Küpers), and reports to the Board of Directors.
The role of the Executive Team is, among others, to review envisaged acquisitions, mergers and divestments, review corporate restructuring programs, update and develop alternative long-term strategies, and present this to the Board of Directors and to execute actions based on decisions of the Board of Directors. The team is established to ensure the fast and effi cient management and control of the activities and to enable adequate reporting and exchange of information with the Board of Directors and within the Leadership Team. The Executive Team does not act as a management committee in the meaning of Article 524bis of the Belgian Company Code.
LEADERSHIP TEAM
The operations of the Company are managed by a Leadership Team. As of 31 December 2019, the Leadership Team consisted of the following members: K-CL BVBA represented by Koen Claerbout, Mark Küpers, Thomas Hægh, Svein Damre, Lars Paulsson and Ingrid Glad Bratvold.
The Leadership Team does not act as a management committee in the meaning of article 524bis of the Belgian Company Code.
The Leadership Team has monthly meetings and discusses the operations of the Zenitel Group.
DIVERSITY OF THE LEADERSHIP TEAM
At Zenitel, diversity is a priority on all levels and in all aspects. The Group strives for a healthy gender balance and geographical spread in addition to providing local employment in all communities in which we operate. We continually monitor, assess and evaluate gaps and areas for improvement in the composition of our senior management team, in terms of gender, age, capabilities, and expertise, as well as geography.
In 2019, the Leadership Team consisted of 1 woman and 5 men. 2 members of the team are between 40 to 50 years and 4 members are older than 50 years. The Leadership Team’s wide expertise focuses on management, technology, research & development and services. The geographical diversity in the Leadership Team contributes to a more international experience and local representation.
DIRECTOR AND EXECUTIVE MANAGEMENT CONFLICTS OF INTERESTS
Articles 523 and 524 of the Belgian Company Code (Articles 7:96 and 7:97 of the Belgian Code of Companies and Associations) contain special provisions, which must be complied with whenever a Director has a direct or indirect confl icting interest of a patrimonial nature in a decision or transaction within the authority of the Board of Directors.
In 2018, there were no transactions and operations that required the application of articles 523 and 524 of the Belgian Company Code (Articles 7:96 and 7:97 of the Belgian Code of Companies and Associations).
In 2019, there were transactions and operations that required the application of article 523 of the Belgian Company Code (Article 7:96 of the Belgian Code of Companies and Associations).
ZENITEL - ANNUAL REPORT 2019 31

1.1 Dismissal of the managing director and approval of the termination agreement concluded between the Company and the managing director with respect to the termination of the managing director’s employment agreement;
After a reading of the agenda and before deliberations and voting:
• Kenneth Dåstøl states that he has a direct confl ict of interest with the resolutions to be adopted by the board of directors at this meeting, within the meaning of Article 523 of the Company Code (Article 7:96 of the Belgian Code of Companies and Associations).
Item 1.1 on the agenda concerns the termination of Mr Dåstøl’s employment agreement and his dismissal as managing director of the Company, pursuant to his employment agreement Mr Dåstøl receives a compensation from the Company for the exercise of his mandate of managing director. The decision of the board of directors regarding this item on the agenda will therefore have an impact on the fi nancial situation of Mr Dåstøl. As this gives rise to a confl ict of interest, Mr Dåstøl’s will not take part in the deliberation and the vote regarding this item on the agenda in accordance to article 523 of the Belgian Company Code (Article 7:96 of the Belgian Code of Companies and Associations).
• K-CL BVBA, permanently represented by Mr Koen Claerbout, states that it has a direct confl ict of interest with the resolutions to be adopted by the board of directors at this meeting, within the meaning of Article 523 of the Company Code (Article 7:96 of the Belgian Code of Companies and Associations).
Item 1.1 and 1.2 on the agenda regards the termination of Mr Dåstøl’s employment agreement and his dismissal as managing director of the Company, as well as the appointment of K-CL BVBA as managing director and the approval of the management agreement to be concluded between the Company and K-CL BVBA. The decision of the board of directors with regards to the termination of Mr Dåstøl’s employment agreement and his dismissal as managing director of the Company will have a direct impact on the decision with regards to the appointment of K-CL BVBA as managing director and the approval of the management agreement to be concluded between the Company and K-CL BVBA. Pursuant to this management agreement K-CL BVBA will receive a compensation from the Company for the exercise of its mandate of managing director. The decision of the board of directors regarding both items on the agenda will therefore have an impact on the fi nancial situation of K-CL BVBA. As this gives rise to a confl ict of interest, K-CL BVBA will not take part in the deliberation and the vote regarding both items on the agenda in accordance to article 523 of the Belgian Company Code (Article 7:96 of the Belgian Code of Companies and Associations).
Each of the remaining members of the board of directors states that (s)he has no direct or indirect confl ict of interest, within the meaning of Article 523 of the Company Code (Article 7:96 of the Belgian Code of Companies and Associations), of a fi nancial nature with the resolutions to be adopted by the board of directors at this meeting.
Mr Dåstøl and Mr Claerbout as permanent representative of K-CL BVBA leave the meeting.
The board of directors discusses the proposal made by the nomination and remuneration and decides to dismiss Mr Dåstøl, as managing director of the Company.
The chair reminds that the Company and Zenitel Norway AS concluded an employment agreement with Mr Dåstøl, for the exercise of his mandate as managing director.
Pursuant to article 7.1 of the employment agreement, the Company, Zenitel Norway AS and the managing director are entitled to terminate the agreement with a notice period of six or three months, respectively.
The board of directors decides to terminate Mr Dåstøl employment agreement and approves the draft termination agreement with Mr Dåstøl.
Mr Dåstøl submits his resignation as a director of the Company. The board of directors acknowledges the resignation of Mr Dåstøl as director of the Company.
1.2 Appointment of a managing director and approval of the managing director’s management agreement
The board of directors discusses the advice of the Nomination and Remuneration Committee with respect to the appointment of a new managing director of the Company and resolves to appoint K-CL BVBA, a company organised under the laws of Belgium, having its registered offi ce in Avennesdreef 4, 9031 Gent, and registered with the Crossroads Bank for Enterprises under the number: 0806.354.070, permanently represented by Mr Koen Claerbout, as managing director entrusted with the day-to-day management of the Company.
The board of directors discusses the terms and conditions of the draft management agreement.
This management agreement provides for conditions which are in line with common market practice. Since the mandate of Mr Dåstøl was terminated, a new managing director has to be appointed.
The board of directors resolves to approve the draft management agreement and to appoint K-CL BVBA, permanently represented by Mr Koen Claerbout, as managing director of the Company.
Mr Claerbout as permanent representative of K-CL BVBA and Mr Dåstøl join the meeting and are informed of the decision.
32 ZENITEL - ANNUAL REPORT 2019

REMUNERATION REPORTTHE PROCEDURES APPLIED
It is the Remuneration and Nomination Committee’s responsibility to determine the remuneration policy for non-executive board members and executive management.
Based on benchmark analysis, input from external advisers, input from executive management and the Company’s strategy, the Remuneration and Nomination Committee determined a remuneration policy and remuneration levels for executive management.
The Remuneration and Nomination Committee on 13 February 2019, evaluated the 2018 variable remuneration, the 2019 salary increases and the 2019 bonus schemes for executive management and proposed its conclusions to the Board of Directors for their approval. The Board of Directors on 13 February 2019, approved the Remuneration and Nomination committee’s proposals of 13 February 2019.
The remuneration of non-executive Directors comprises fi xed amounts, and they did not change in 2019, compared to 2018.
THE APPLIED 2019 REMUNERATION POLICY
The Company’s remuneration policy has been consistent with the remuneration policy in previous years. The executive management’s remuneration is based on a fi xed and a variable remuneration in cash. The variable part of the remuneration is, on the one hand, based on the realization of the budgeted group results, and on the other hand, of specifi cally defi ned quantitative and qualitative fi nancial and operational targets in the relevant fi eld of responsibility. In 2019, no remuneration was given based on shares, warrants or any other rights to acquire shares. The Directors’ remuneration policy is based on a fi xed remuneration in cash. No performance-based variable remuneration or remuneration based on shares, warrants or any other rights to acquire shares have been granted. Members of the Remuneration and Nomination Committee are not specifi cally remunerated for their tasks. The members of the Audit Committee receive an extra fi xed remuneration in cash.
The Company intends to continue its current remuneration policy in the coming years.
DIRECTORS’ REMUNERATION
The annual remuneration for a non-executive Director is a fi xed fee of 20,000 euro. The Chairman receives double that amount. Similarly, the members of the Audit Committee receive a fi xed fee of 7,500 euro and the Chairman of the Audit Committee 15,000 euro on an annual basis, for their specifi c tasks in the Audit Committee. No benefi ts in kind nor variable remuneration are granted to the non-executive members of the Board of Directors. No amounts have been set
aside or accrued by Zenitel or its subsidiaries to provide pension, retirement or similar benefi ts to the non-executive Directors. The CEO, as the only executive director, is not remunerated for his work in the Board of Directors. No benefi ts in kind nor variable remuneration are granted to the members of the Board of Directors. A summary of the remuneration of the Board members in 2019 is shown in the table below.
Name and position Remuneration in euro
Blanco Blad BVBA, represented by Jo Van Gorp, Chair
Non-executive
47 500
K-CL BVBA, represented byKoen Claerbout, CEO
Executive NA
Liesbet Van der Perre Non-
executive 20 000
Wenche Holen Non-
executive 27 500
K-CL BVBA,represented by Koen Claerbout
Non-executive
10 000
Yves De Backer BVBA, represented by Yves De Backer
Non-executive
35 000
Cascade Dynamics BVBA, represented by Gail Smith
Non-executive
13 750
Equity @ Work BVBA,represented by Hans Swinnen
Non-executive
20 000
Remunerationin euro CEO Executive Team
excluding the CEO
2019 2018 2019 2018
Basic Remuneration
247 508 216 457 117 025 112 183
Variable Remuneration*
94 222 56 650 44 372 20 866
Group insurance premiums
23 996 39 499 8 840 8 424
Other Benefi ts 19 725 28 458 4 033 7 290
Total 385 451 341 064 174 270 148 763
* Variable remuneration relating to the bonus agreements for the Executive Team. The amounts shown relate to remuneration earned in the relevant year and paid in cash the year after.
MOTIVATION AND DECISIONS OF THE BOARD OF DIRECTORS ON SEVERANCE PACKAGES
Due to the dismissal of the former CEO an amount of 0.163 million euro as severance package has been paid in 2019. The normal salary package of the former CEO was included in the above table up until the date of his dismissal.
A severance amount of 0.188 million euro will be paid in 2020. The settlement agreement with the former CEO provided in a put and call option which will both expire on 31 March 2020.
ZENITEL - ANNUAL REPORT 2019 33

SIGNIFICANT CHARACTERISTICS OF EVALUATION PROCESS OF THE BOARD OF DIRECTORS, THE COMMITTEES AND THE INDIVIDUAL MEMBERS OF THE BOARD OF DIRECTORS
When the mandate of a member of the Board of Directors is up for renewal, the individual contribution of the board member will be evaluated. The Chair of the Board of Directors has also, on a regular basis, discussions with each individual board member in order to evaluate both the functioning of the members of the Board of Directors individually and as a whole. When doing so, the following aspects are taken into account: the quality of the interaction between management and the Board of Directors and the information and documents submitted to the Board, the preparation of the board meetings, the quality of the discussions and decision-making of the Board, the extent to which all relevant strategic, organizational and managerial issues are addressed by the Board and the contribution of all board members to the decision-making process of the Board. The Board of Directors also does a self-evaluation on a regular basis.
The Nomination and Remuneration Committee evaluates the candidates for the nomination or renewal of the mandates of the Board of Directors. The Nomination and Remuneration Committee advises the Board of Directors, which will then propose the nominated candidates to the general shareholders’ meeting.
INSIDER TRADING POLICY
The Company has drawn up a policy with respect to insider trading, which has been signed by all key employees and directors. This policy is a part of Zenitel’s Corporate Governance Charter.
THE STATUTORY AUDITOR
The statutory auditor of ZENITEL NV is EY Bedrijfsrevisoren BV, having its registered offi ce at De Kleetlaan 2, 1831 Diegem, represented by its permanent representative Mr Marnix Van Dooren. EY Bedrijfsrevisoren was appointed for a period of three years at the general shareholders’ meeting of 29 April 2019. The statutory auditor is a member of the Institute for Company Auditors (‘Instituut der bedrijfsrevisoren’). The remuneration amounted to 21,288 euro in 2019. The total fee for EY for the Group audit amounted to 120,017 euro per year. The other audit related services amounted to 11,155 euro. EY invoiced an amount of 12,190 euro for tax compliance services.
INTERNAL CONTROL AND RISK MANAGEMENT SYSTEM
This chapter contains a description of the most important characteristics of Zenitel’s internal control and risk management systems. These internal control and risk management systems fulfi ll a crucial role when steering activities and managing risks, and enable the Company to achieve the goals it has set, both from an operational and from a fi nancial reporting point of view. Below you will fi nd a description of the following components of internal control: control environment, risk management process, control activities, information and communication, and monitoring. When preparing this description, the Company has taken into account the relevant statutory provisions, the provisions of the 2020 Belgian Code on Corporate Governance and guidelines of the international COSO framework on internal controls.
CONTROL ENVIRONMENT
The Board of Directors is responsible for the defi nition and creation of the Zenitel company culture. In order to do so, it sets the tone with respect to integrity and ethics. One of the instruments in setting the tone at the top is the Corporate Governance Charter, which defi nes clearly the responsibilities of the governing bodies of the company and the code of conduct with respect to transactions in Zenitel shares. This Corporate Governance Code is under continuous review and updated to conform with the requirements of the stakeholders of the Company. A clear governance structure is in place in which the roles and responsibilities of each level of management are fulfi lled with respect to the company structure. In order to achieve this, clear and detailed company guidelines exist with respect to proxy rules and the hiring and fi ring of personnel. These guidelines are available to all Zenitel employees via the Company’s intranet. The Board of Directors carefully monitors that employees in key management positions have the right qualifi cations to take on their responsibilities and that the Company rules are complied with. The Board of Directors has already proven in the past that appropriate action was taken in case one of these two conditions was not fulfi lled. Some members of the Board of Directors are closely coaching the Group’s executive management. This management philosophy of proximity is extended further in the group structure, which results in a limited number of hierarchical levels in the Company and a strong hands-on involvement of executive management in the day-to-day operations of the group companies.
Also with respect to accounting and fi nancial reporting, clear roles and responsibilities are defi ned. A Zenitel accounting manual exists in order to ensure the consistency and compliance of the reported fi gures for consolidation purposes. In order to enable accurate and timely reporting, guidelines and reporting deadlines are communicated through the organization.
The appropriateness of the control environment is regularly subject to the evaluation of the Audit Committee, the Board of Directors and the executive management.
34 ZENITEL - ANNUAL REPORT 2019

RISK MANAGEMENT
At least once per year, the Audit Committee evaluates the effectiveness of the risk management systems of the Company. These risk management systems, are put in place by the Company’s management and it is the Audit Committee, which ensures that the main risks are appropriately addressed by management. In order to be able to identify the key risks, the main company goals from a strategic, an operational, a fi nancial reporting, and a legal compliance point of view are defi ned. Risks are then identifi ed by analyzing which internal or external factors might prevent the attainment of the goals set by the Company. For each risk, an analysis is performed that evaluates the importance, the probability and the possible control measures that are or could be put in place (taking also into account their costs). Also the Company’s ability to identify and react to changing external and internal conditions that might cause risks to increase, are subject to an evaluation process. Finally, the Audit Committee is informed on the status of additional measures taken by management when responding to risk changes.
The above-mentioned risk management process is less formalized within the Company, given its small size. The cornerstone of this process is, however, the annual evaluation of the effectiveness of the risk management systems by the Audit Committee.
With respect to the fi nancial reporting process, the goals, responsibilities, external communications on risks and deadlines are clearly known by all involved personnel of the Company.
Changing regulations or conditions that might cause the external reporting to be impacted are identifi ed in a timely manner and discussed at management and – if signifi cant – at board level. The identifi cation of these changing conditions and regulations are both based on the skills and continuous learning of the Zenitel employees involved and on advice received from external consultants.
CONTROL ACTIVITIES
Different control activities are put in place in order to ensure that the Group rules are complied with at all levels of the organization.
Based on weekly, monthly, quarterly and annual reports of each of the reporting entities, Group management performs analyses and a close follow-up of the operational and fi nancial results of each Group entity. The Group results are consolidated and further analyzed by the Group controllers and by Group management on a monthly basis. Based on these analyses, further discussions are held with the local managers and controllers of the reporting entities. The fi nancial results are closely tracked against well-defi ned and agreed targets on a monthly basis. Each quarter, a new forecast is established. Correct and consistent data gathering is ensured by the use of customized reporting software, which is managed centrally.
Besides all controls based on the local entities’ reporting, Group management makes sure that regular review meetings with local management and local controllers are held. During these meetings, all issues with respect to operations and fi nancial reporting are discussed, and because of the involvement of Group management in the local operations, Group management can ensure that operational and fi nancial reporting issues are dealt with in a consistent and effective manner, in line with the goals set by the Company.
The Audit Committee has installed an internal audit function whereby the local entities are subject to an internal audit. These internal audits focus on risks from both an operational and a fi nancial reporting point of view. Furthermore, internal audits focus on compliance with the Group rules, local rules and regulations and adequate internal controls. The fi ndings of these internal audits are communicated to the Audit Committee and follow up is carried out on the specifi c remedial actions taken as a result of these internal audits. Changes in rules and regulations that affect the consolidated fi nancial statements are monitored centrally and appropriate instructions and guidance are sent to the local reporting entities in order to be able to manage and comply with these changes in an effective manner. Finally, all important reporting units are subject to external audits.
Based on its evaluation of the above-mentioned control activities and taking into account the size of the Company, it is the executive management’s opinion that these control activities are suffi cient to guarantee an effective implementation of the Company guidelines as issued by executive management.
INFORMATION AND COMMUNICATION
The Company has set up an internal reporting system that enables it to comply in a timely and effective manner with the legal requirements in terms of information that the Group has to provide to the market. On the one hand, fi nancial information is gathered monthly through a customized and centrally managed web-based reporting tool. On the other hand, management of the local entities has to report on an ad hoc and a monthly basis on well-defi ned and communicated items to Group management. Currently there are different information processing systems in the different reporting entities of the Group. Through the use of this web-based and customized reporting tool, it is possible to gather and consolidate all fi nancial information of the individual reporting entities in a consistent manner.
ZENITEL - ANNUAL REPORT 2019 35

The Company has to issue periodic fi nancial information to the market on a half-year basis. All press releases are approved by the Board of Directors before they are issued. In case information is to be issued on an ad hoc basis, the approval of at least two board members is also required. The Company’s relations and communications with regulators, analysts and shareholders are the responsibility of the executive management team. Internal communications are mainly conveyed via the Company’s intranet, which has been specifi cally developed for these purposes. Via this communication tool, all Group guidelines, instructions, product information and market information are made available to all Zenitel employees. All information based on data information gathering and communication systems are subject to security measures protecting the confi dentiality of, the restricted access to, and the consistency of the gathered and communicated information. Taking into account the size of the Company and the existing systems and procedures in place, executive management is of the opinion that these are suffi cient in order to be able to comply with all legal information and communication requirements.
MONITORING
It is mainly the Audit Committee’s responsibility to monitor the effectiveness of the internal control and risk management system. Based on its annual review of the internal controls and risk management system, the Audit Committee makes recommendations to the Board of Directors. Given the constantly changing environment, the internal control and risk management system is subject to a constant process of reevaluation. For instance, when based on fi ndings of an internal or external audit, defi ciencies in the internal control system are identifi ed, an action plan will be proposed to the Audit Committee, and, thereafter, feedback on the status of the actions is to be conveyed to the Audit Committee. This process of identifi cation, remediation and follow-up on the remediation is considered key in the continuous improvement process of the internal control and risk management system. The practice is in place whereby the internal control procedures are periodically challenged and the necessary actions implemented in order to adapt it to the changing internal and external conditions. Based on this practice and the above-mentioned descriptions of the components of the internal control and risk management system, and taking into account the limited size of the Company and the means available, the Company is of the opinion that the internal control and risk management system of the Company is suffi cient to meet the expectations of the stakeholders of the Company.
COMPLY OR EXPLAIN
Zenitel complies with most of the nine principles of the 2020 Belgian Code on Corporate Governance, as well as with the majority of the provisions. Some of the provisions are not complied with, but their objectives are reached through other measures.
Below is an overview of the provisions that are not complied with, with an explanation, and the measures that Zenitel has taken in order to reach their objectives.
Principle 5 of the 2020 Belgian Code on Corporate Governance stipulates that the Company should have a rigorous and transparent procedure for the nomination and evaluation of its Board of Directors and its members. The Company is confi dent that it fulfi lls the individual requirements stipulated in this principle, however not as formalized as indicated in Principle 5 of the 2020 Belgian Code on Corporate Governance. Through the regular discussions carried out by the Chair with the individual members of the Board of Directors and through an evaluation of each board member at the moment or at the nomination of the renewal of the mandate, the Board of Directors is confi dent that it meets the objectives of Principle 5 of the 2020 Belgian Code on Corporate Governance. A self-evaluation is also undertaken by the Board of Directors on a regular basis.
36 ZENITEL - ANNUAL REPORT 2019

ZENITEL - ANNUAL REPORT 2019 37

38 ZENITEL - ANNUAL REPORT 2019
Building on over 70 years of breakthrough innovations, Zenitel systems are at the forefront of today’s
technology landscape, well positioned to drive the future of Intelligent Communications.
40 CONSOLIDATED FINANCIAL STATEMENTS
45 ACCOUNTING POLICIES AND FINANCIAL RISK FACTORS
58 NOTES TO THE CONSOLIDATED FINANCIAL STATEMENTS
78INDEPENDENT AUDITOR’S REPORT TO THE GENERAL MEETING OFZENITEL NV FOR THE YEAR ENDED 31 DECEMBER 2019
84EXTRACT FROM THE BELGIAN GAAP NON-CONSOLIDATEDFINANCIAL STATEMENTS OF ZENITEL NV
85 DIVIDEND POLICY
85 LEGAL & ARBITRATION PROCEEDINGS
FINANCIALREPORT
ZENITEL - ANNUAL REPORT 2019 39

CONSOLIDATED STATEMENT OF PROFIT OR LOSS OF THE ZENITEL GROUPFOR THE YEAR ENDED 31 DECEMBER 2019
(thousands of euro) 31 December
Notes 2019 2018
CONTINUING OPERATIONS
Revenue 1 76 257 61 831
Raw materials and consumables used (**) 4 -35 160 -26 728
Employee benefi ts expense 5 -27 516 -21 566
Depreciation and amortization expenses (*) 15,16,17 -2 586 -1 076
Consulting expense -1 809 -1 930
Facility expense (*) 6 -2 894 -4 143
Other expenses 7 -2 369 -3 224
Operating Profi t/(Loss) 3 923 3 164
Finance income 9 145 413
Finance costs 10 -443 -337
Net foreign exchange gains/(losses) 11 140 143
PROFIT BEFORE TAX 3 765 3 383
Income tax expense 12 -743 -730
Profi t for the year 3 022 2 653
Attributable to:
Owners of the Company 3 022 2 653
EARNINGS PER SHARE
Weighted average number of ordinary shares in issue (‘000) 3 308 3 311
FROM CONTINUING OPERATIONS
Basic earnings per share 14,1 0.91 0.80
Diluted earnings per share 14,2 0.91 0.80(*) Impacted upon the adoption of IFRS 16.(**) Impairment on current assets are included in raw materials and consumables used.
CONSOLIDATED STATEMENT OF PROFIT AND LOSS AND OTHER COMPREHENSIVE INCOME OFTHE ZENITEL GROUP FOR THE YEAR ENDED 31 DECEMBER 2019
(thousands of euro) 31 December
Notes 2019 2018
PROFIT FOR THE YEAR 3 022 2 653
Other comprehensive income
Items that may be reclassifi ed subsequently to profi t or loss:
Exchange differences arising on translation of foreign operations (*) 309 -134
Items that will not be reclassifi ed subsequently to profi t or loss:
OCI actuarial gains & losses -43 13
Other comprehensive income for the period (net of income tax) 266 -121
TOTAL COMPREHENSIVE INCOME FOR THE PERIOD 3 288 2 532
Attributable to:
Owners of the Company 3 288 2 532
The accounting policies and notes form an integral part of these consolidated fi nancial statements.(*) In 2019 and 2018, the positive/negative exchange differences in the other comprehensive income line were mainly booked on foreign operations held in Norwegian Krone, US Dollar and Singaporean Dollar.
CONSOLIDATED FINANCIAL STATEMENTS
40 ZENITEL - ANNUAL REPORT 2019

CONSOLIDATED STATEMENT OF FINANCIAL POSITION OF THE ZENITEL GROUP AT 31 DECEMBER 2019
(thousands of euro) 31 December
ASSETS Notes 2019 2018
Non-current assets
Property, plant and equipment(1) 15 4 593 806
Goodwill 16 3 272 3 246
Other intangible assets 17 195 360
Deferred tax assets 13 1 173 822
Financial assets 19 240 238
Total non-current assets 9 474 5 472
Current assets
Inventories 20 12 648 10 705
Contracts in progress 21 - 83
Trade and other receivables 22 14 374 12 016
Deferred charges and accrued income 1 287 1 491
Cash and cash equivalents 23 21 331 20 371
Total current assets 49 640 44 666
TOTAL ASSETS 59 114 50 138
EQUITY AND LIABILITIES
Capital and reserves
Capital 20 000 20 000
Share premium account 5 340 5 340
Reserves -342 -651
Retained earnings 7 617 4 638
Treasury shares -37 -
Equity attributable to equity holders of the parent 32 578 29 327
Total equity 32 578 29 327
Non-current liabilities
Borrowings and lease liabilities(2) 25 1 934 61
Retirement benefi t obligations 26 418 357
Deferred tax liabilities 13 - 28
Total non-current liabilities 2 352 446
Current liabilities
Trade and other payables 24 15 091 13 874
Borrowings and lease liabilities(2) 25 3 678 2 059
Current tax liabilities 1 026 -
Provisions 27 4 389 4 432
Total current liabilities 24 184 20 365
TOTAL EQUITY AND LIABILITIES 59 114 50 138
The accounting policies and notes form an integral part of these consolidated fi nancial statements.(1) Including right-of-use assets due to the adoption of IFRS 16.(2) Including lease liabilities due to the adoption of IFRS 16.
ZENITEL - ANNUAL REPORT 2019 41

CONSOLIDATED STATEMENT OF CHANGES IN EQUITY OF THE ZENITEL GROUP FOR THE YEAR ENDED 31 DECEMBER 2019
(thousands of euro) 31 December
Share capital
Sharepremium
Treasuryshares
y
Foreigncurrency
translation y
reserveRetained earnings
Attributableto equityholders of
q y
the parent Total
BALANCE ON 1 JANUARY 2018
As previously reported 20 000 5 340 -65 -517 1 972 26 730 26 730
Profi t for the year - - - - 2 653 2 653 2 653
OCI actuarial gain and losses - - - - 13 13 13
Other comprehensive income forthe year, net of income tax
- - - -134 - -134 -134
Total comprehensive income forthe year
- - - -134 2 666 2 532 2 532
(Acquisition)/sale of treasury shares - - 65 - - 65 65
BALANCE AT 31 DECEMBER 2018 20 000 5 340 - -651 4 638 29 327 29 327
(thousands of euro) 31 December
Share capital
Share premium
Treasury shares
y
Foreign currency
translationy
reserveRetained earnings
Attributableto equity holders of
q y
the parent Total
BALANCE ON 1 JANUARY 2019 20 000 5 340 - -651 4 638 29 327 29 327
Profi t for the year - - - - 3 022 3 022 3 022
OCI actuarial gains & losses - - - - -43 -43 -43
Other comprehensive income forthe year, net of income tax
- - - 309 - 309 309
Total comprehensive income forthe year
- 309 2 979 3 288 3 288
(Acquisition)/sale of treasury shares - -37 - - -37 -37
BALANCE AT 31 DECEMBER 2019 20 000 5 340 -37 -342 7 617 32 578 32 578
The accounting policies and notes form an integral part of these consolidated fi nancial statements.
42 ZENITEL - ANNUAL REPORT 2019

CONSOLIDATED STATEMENT OF CASH FLOWS OF THE ZENITEL GROUP FOR THE YEAR ENDED 31 DECEMBER 2018
(thousands of euro) 31 December
Notes 2019 2018
CASH FLOWS FROM OPERATING ACTIVITIES
Net profi t/(Loss) for the year 3 022 2 653
Income tax expense recognized in profi t or loss 12 743 730Finance cost recognized in profi t or loss 10 443 337Finance income recognized in profi t or loss 9 -145 -413Impairment loss recognized on trade receivables 22 84 -101Impairment loss recognized on inventory 20 1 401 128Depreciation and amortization of non-current assets(*) 15,16,17 2 586 1 076Cash generated from operating activities before changes in working capital 8 134 4 410
Changes in working capital 32 -4 255 -1 268Interest paid -291 -238Income taxes paid -54 -177Net cash generated from operating activities 3 535 2 728
CASH FLOWS FROM INVESTING ACTIVITIESInterest received 18 18Proceeds received from available for sale investments 121 -Net Cash outfl ow on acquisitions - -1 275Payments for property, plant and equipment 15 -1 036 -314Proceed from disposal of tangible assets 2 1Payments for intangible assets 17 -120 -179Net cash (used in)/generated by investing activities -1 015 -1 749
CASH FLOWS FROM FINANCING ACTIVITIES
(Acquisition)/sale of treasury shares -37 65Movement in used factoring facility 212 512Repayment of borrowings and lease liabilities(*) 25 -1 870 -19Net cash received/(used) in fi nancing activities -1 695 558
Net (decrease)/increase in cash and cash equivalents 823 1 535
MOVEMENT IN CASH AND CASH EQUIVALENTSAt start of the year 20 371 18 950Increase/(decrease) 823 1 535Effect of exchange rate changes on the balance of cash held in foreign currencies 137 -114At the end of the year 21 331 20 371
Total cash and cash equivalents 23 21 331 20 371Net cash and cash equivalents at the end of the year 21 331 20 371
The accounting policies and notes form an integral part of these consolidated fi nancial statements.(*)Impacted due to the adoption of IFRS 16
ZENITEL - ANNUAL REPORT 2019 43

Zenitel is a company with solid foundations and an eye to the future. We continue to invest in
product development and innovative technology so that our proud legacy of intelligent communication can continue for decades to come.
44 ZENITEL - ANNUAL REPORT 2019

Zenitel (the ‘Company’) is a limited liability company registered in Belgium. The consolidated fi nancial statements of the company for the year ended 31 December 2019 comprise the Company and its subsidiaries (together referred to as the ‘Group’) and the Group’s interest in associates and jointly controlled entities. The addresses of its registered offi ce and principal place of business are disclosed in the introduction to the annual report. The principal activities of the Group are described in this annual report.
The fi nancial statements were authorized for issue by the Board of Directors for publication on 24 March 2020.
BASIS OF PREPARATION
The consolidated fi nancial statements have been prepared in accordance with the International Financial Reporting Standards (IFRS) as adopted by the EU. These consolidated statements have been prepared under the historical cost convention except for certain fi nancial instruments (including derivatives), which are measured at fair value. The consolidated fi nancial statements are presented in euro and all values are rounded to the nearest thousand (€000), except when otherwise indicated.
APPLICATION OF NEW AND REVISED INTERNATIONAL FINANCIAL REPORTING STANDARDS
AMENDMENTS TO IFRS AFFECTING AMOUNTS REPORTED IN THE FINANCIAL STATEMENTS
During the current fi nancial year, the Group has adopted all the new and revised Standards and Interpretations issued by the International Accounting Standards Board (IASB) and the International Financial Reporting Interpretations Committee (IFRIC) of the IASB, that are relevant to its operations and effective for the accounting year starting on 1 January 2019. The Group has not applied any new IFRS requirements that are not yet effective as per 31 December 2019.
The Group applied for the fi rst time certain standards and amendments, which are effective for annual periods beginning on or after 1 January 2019. The Group has not early adopted any other standard, interpretation or amendment that has been issued but is not yet effective.
The nature and the effect of these changes are disclosed below. Although these new standards and amendments are applied for the fi rst time in 2019, they did not have a material impact on the annual consolidated fi nancial statements of the Group/the interim condensed consolidated fi nancial statements of the Group(except for IFRS 16).
The nature and the impact of each of the following new standards, amendments and/or interpretations are described below:
• Amendments to IFRS 9 Financial Instruments - Prepayment Features with Negative Compensation
• IFRS 16 Leases
• Amendments to IAS 19 Employee Benefi ts - Plan Amendments, Curtailment or Settlement
• Amendments to IAS 28 Investments in Associates and Joint Ventures - Long-term Interests on Associates and Joint Ventures
• IFRIC 23 Uncertainty over Income Tax Treatments
• Annual Improvements Cycle – 2015-2017.
The adoption of these new standards and amendments has not led to major changes in the Group’s accounting policies, except for IFRS 16 (see below).
Standards issued but not yet effective
The standards and interpretations that are issued, but not yet effective, up to the date of issuance of the Group’s fi nancial statements are disclosed below. The Group intends to adopt these standards and interpretations, if applicable, when they become effective.
• Amendments to References to the Conceptual Framework in IFRS Standards, effective 1 January 20204
• Amendments to IFRS 3 Business Combinations – Defi nition of a business, effective 1 January 2020
• Amendments to IFRS 9 Financial Instruments and IFRS 7 Financial Instruments: Disclosures - Interest Rate Benchmark Reform4
• Amendments to IAS 39 Financial Instruments: Recognition and measurement and IFRS 7 Financial Instruments: Disclosures - Interest Rate Benchmark Reform4
• IFRS 17 Insurance Contracts, effective 1 January 20214
• Amendments to IAS 1 Presentation of Financial Statements and IAS 8 Accounting Policies, Changes in Accounting Estimates and Errors – Defi nition of material, effective 1 January 20204
4 Not yet endorsed by the EU as at 16 October 2019
First adoption of IFRS 16
IFRS 16 Leases (effective 1 January 2019) sets out the principles for the recognition, measurement, presentation and disclosure of leases and requires lessees to account for all leases under a single on balance-sheet model. It replaces IAS 17 Leases, IFRIC 4 Determining whether an Arrangement contains a Lease, SIC-15 Operating Leases incentives and SIC 27 Evaluating Substance
ACCOUNTING POLICIES AND FINANCIAL RISK FACTORS
ZENITEL - ANNUAL REPORT 2019 45

of Transactions involving the Legal Form of a Lease. A lessee recognizes a right-of-use asset representing its right to use the underlying asset and a lease liability representing its obligation to make lease payments. There are optional exemptions for short-term leases and leases of low-value items. Lessor accounting remains similar to the current standard.
Transition to IFRS 16
The Group applied in 2019 the adoption of IFRS16 on its consolidated fi nancial statements. As a result of this adoption, the group determined following operating lease contracts that are in scope of IFRS 16: (i) offi ce and site premises, (ii) cars and (i) IT equipment.
The Group adopted IFRS 16 using the modifi ed retrospective transition method.
The Group elected to apply the standard to contracts that were previously identifi ed as leases applying IAS 17 and IFRIC 4. The Group elected to use the exemptions proposed by the standard on lease contracts for which the lease terms ends within 12 months as of the date of initial application, and lease contracts for which the underlying asset is of low value.
The most important judgements and assumptions in determining the lease asset and liability are:
• use of the practical expedients. e.g. use of a single discount rate per group of contracts, summarized per their duration. Those leases were assumed to have similar characteristics. No hindsight was used. The Group did not reassess if a contract is, or contains, a lease at the date of initial application.
• The Group assessed the non-cancellable period of each of the contracts in scope of IFRS 16. This includes the period covered by an option to extend the lease, if the lessee is reasonably certain to exercise that option.
In summary the impact of IFRS 16 adoption as at 1 January 2019 is as follows:
Impact of IFRS 16 on 1 January 2019(thousands of euro)
Property, plant and equipment(right-of-use assets)
3 941
Lease Liability 3 941
As the Group’s assets are equal to the liabilities at the date of transition, there is no impact on the Group’s equity or profi t or loss statement (including deferred taxes). The Group presents right-of-use assets in a separate line item within “property, plant and equipment” and lease liabilities within “Borrowings and lease liabilities” in the statement of fi nancial position.
The following is an analysis of the impact of the adoption of IFRS 16 as at 1 January 2019 and the existing off-balance lease obligation as of 31 December 2018:
Reconciliation IAS 17 to IFRS 16(thousands of euro)
Minimum lease payments under operating leases IAS 17 as of 31 December 2018
4 033
Effect from discounting at the incremental borrowing rate
-583
Effect from lease term assumptions as of 1 January 2019
491
Lease liabilities under IFRS 16 as of 1 January 2019
3 941
Accounting policies
Under IFRS 16, a contract is, or contains, a lease if the contract conveys a right to control the use of an identifi ed asset for a period in exchange for consideration.
The Group recognizes a right-of-use asset and a lease liability at the lease commencement date. Assets and liabilities arising from a lease are initially measured on a present value basis, discounted using the Group’s best estimation for the weighted average incremental borrowing rate. The right-of-use asset is subsequently depreciated and/or impaired when deemed necessary. The right-of-use asset is also adjusted for certain re-measurements of the lease liability.
The lease liability is subsequently increased by the interest cost on the lease liability and reduced by lease payment made. It is re-measured when there is a change in future lease payments arising from a change in an index or rate, a change in the estimate of the amount expected to be payable, or a change in the reassessment of whether a purchase or extension option is reasonably certain to be exercised or a termination option curtained not to be exercised.
The Group has applied judgement to determine the lease term for lease contracts containing renewal options.
Impact for the period
As a result of the application of IFRS 16, the Group recognized 3.9 million euro of right-of-use assets and 3.9 million euro of lease liabilities as at 1 January 2019.
Due to the adoption of IFRS 16, an amount of 1.8 million euro that was previously classifi ed as OPEX expenses (booked in facility- and other expenses) is now presented as depreciations (1.8 million euro) and interest expense (0.05 million euro). This is due to the change in the accounting for expenses of leases that were classifi ed as operating leases under IAS 17.
46 ZENITEL - ANNUAL REPORT 2019

The recognized right-of-use assets relate to the following types of assets:
RoU assets (thousands of euro)
RoU 31 December
2019
RoU 1 January
2019
Rent of buildings/offi ces 2 538 3 254
Cars 546 397
IT equipment 186 290
Total 3 270 3 941
The expenses of short-term lease contracts and low value contracts are considered immaterial.
SUMMARY OF PRINCIPAL ACCOUNTING POLICIES
BASIS OF CONSOLIDATIONSubsidiaries
The consolidated fi nancial statements include all the subsidiaries that are controlled by the Group.
Control is achieved when the Group is exposed, or has rights, to variable returns from its involvement with the investee and has the ability to affect those returns through its power over the investee. Specifi cally, the Group controls an investee if, and only if, the Group has:
• Power over the investee (i.e., existing rights that give it the current ability to direct the relevant activities of the investee)
• Exposure, or rights, to variable returns from its involvement with the investee
• The ability to use its power over the investee to affect its returns
The results of subsidiaries acquired or disposed of during the year are included in the consolidated statement of profi t or loss and other comprehensive income from the effective date of acquisition or up to the effective date of disposal, as appropriate.
Where necessary, adjustments are made to the fi nancial statements of subsidiaries to bring their accounting policies in line with those used by other members of the Group.
All intra-Group transactions, balances, income, and expenses are eliminated in full on consolidation.
Acquisitions of businesses are accounted for using the acquisition method. The consideration transferred in a business combination is measured at fair value. This is calculated as the sum of the acquisition-date fair values of the assets transferred by the Group and liabilities incurred by the Group to the former owners of the acquisition and the equity interests issued by the Group in exchange for control of the acquisition. Acquisition-related costs are generally expensed.
Non-controlling interests that are present ownership interests and entitle their holders to a proportionate share of the entity’s net assets in the event of liquidation may be initially measured at fair value or at the non-controlling interests’ proportionate share of the recognized amounts of the acquirer’s identifi able net assets. The choice of measurement is made on a transaction-by-transaction basis.
The reporting entity attributes profi t or loss and each component of other comprehensive income to the owners of the parent and to the non-controlling interest based on the present ownership interests, even if the results in the non-controlling interest has a defi cit balance.
INVESTMENTS IN ASSOCIATES ANDJOINT VENTURES
An associate is an entity over which the Group has signifi cant infl uence. Signifi cant infl uence is the power to participate in the fi nancial and operating policy decisions of the investee, but is not control or joint control over those policies.
A joint venture is a type of joint arrangement whereby the parties that have joint control of the arrangement have rights to the net assets of the joint venture. Joint control is the contractually agreed sharing of control of an arrangement, which exists only when decisions about the relevant activities require the unanimous consent of the parties sharing control.
The considerations made in determining signifi cant infl uence or joint control are similar to those necessary to determine control over subsidiaries.
The Group’s investments in its associate and joint venture are accounted for using the equity method.
Under the equity method, the investment in an associate or a joint venture is initially recognized at cost. The carrying amount of the investment is adjusted to recognize changes in the Group’s share of net assets of the associate or joint venture since the acquisition date. Goodwill relating to the associate or joint venture is included in the carrying amount of the investment and is not tested for impairment separately.
ZENITEL - ANNUAL REPORT 2019 47

The statement of profi t or loss refl ects the Group’s share of the results of operations of the associate or joint venture. Any change in OCI of those investees is presented as part of the Group’s OCI. In addition, when there has been a change recognized directly in the equity of the associate or joint venture, the Group recognizes its share of any changes, when applicable, in the statement of changes in equity. Unrealized gains and losses resulting from transactions between the Group and the associate or joint venture are eliminated to the extent of the interest in the associate or joint venture.
The aggregate of the Group’s share of profi t or loss of an associate and a joint venture is shown on the face of the statement of profi t or loss outside operating profi t and represents profi t or loss after tax and non-controlling interests in the subsidiaries of the associate or joint venture.
The fi nancial statements of the associate or joint venture are prepared for the same reporting period as the Group. When necessary, adjustments are made to bring the accounting policies in line with those of the Group.
After application of the equity method, the Group determines whether it is necessary to recognize an impairment loss on its investment in its associate or joint venture. At each reporting date, the Group determines whether there is objective evidence that the investment in the associate or joint venture is impaired. If there is such evidence, the Group calculates the amount of impairment as the difference between the recoverable amount of the associate or joint venture and its carrying value, and then recognizes the loss as ‘Share of profi t of an associate and a joint venture’ in the statement of profi t or loss.
Upon loss of signifi cant infl uence over the associate or joint control over the joint venture, the Group measures and recognizes any retained investment at its fair value. Any difference between the carrying amount of the associate or joint venture upon loss of signifi cant infl uence or joint control and the fair value of the retained investment and proceeds from disposal is recognized in profi t or loss.
FOREIGN CURRENCIES
The individual fi nancial statements of each Group entity are presented in the currency of the primary economic environment in which the entity operates (its functional currency). For the purpose of the consolidated fi nancial statements, the results and fi nancial position of each entity are expressed in euro, which is the functional currency of the company, and the presentation currency for the consolidated fi nancial statements.
In preparing the fi nancial statements of the individual entities, transactions in currencies other than the entity’s functional currency are recorded at the exchange rates prevailing at the dates of the transactions. At each reporting date, monetary assets and liabilities denominated in foreign currencies are translated at the statement of position currency rate. Non-monetary items carried at fair value that are denominated in foreign currencies are retranslated at the rates prevailing at the
date when the fair value was determined. Non-monetary items that are measured in terms of historical cost in a foreign currency are not retranslated.
Gains and losses resulting from the settlement of foreign currency transactions and from the translation of monetary assets and liabilities denominated in foreign currencies are included in the consolidated statement of profi t or loss as a fi nancial result. Exchange differences arising on the retranslation of non-monetary items carried at fair value are included in profi t or loss for the period except for differences arising on the retranslation of non-monetary items in respect of which gains and losses are recognized directly in equity. For such non-monetary items, any exchange component of that gain or loss is also recognized directly in other comprehensive income (OCI).
For the purpose of presenting consolidated fi nancial statements, the assets and liabilities of the Group companies, using a different functional currency than the euro, are expressed in euro using exchange rates prevailing at the statement of position date. Income and expense items are translated at the average exchange rates for the period. Exchange differences arising, if any, are classifi ed in equity and transferred to the Group’s ‘Cumulative translation reserve’. Such exchange differences are recognized in profi t or loss in the period in which the entity is disposed of.
Goodwill and fair value adjustments arising on the acquisition of a foreign operation are treated as assets and liabilities of the foreign operation and translated at the closing date.
INTANGIBLE ASSETS
ACQUIRED INTANGIBLE ASSETS
Licenses, patents, trademarks, similar rights and software are measured initially at cost. In process Research & Development obtained in a business combination is initially measured at fair value. After initial recognition, intangible assets are carried at cost less accumulated amortization and impairment losses. They are amortized on a straight-line basis over their estimated useful life, which is not considered to exceed 20 years. At the end of each annual reporting period, the amortization method and period are reviewed with the effect of any changes in estimate being accounted for on a prospective basis.
COMPUTER SOFTWARE DEVELOPMENT COSTS
Generally, costs associated with developing or maintaining computer software programs are recognized as an expense as incurred. However, costs that are directly associated with identifi able and unique software products controlled by the Group that have probable economic benefi ts exceeding the cost beyond one year, are recognized as assets. Direct costs include staff costs of the software development team and an appropriate portion of relevant overheads that are necessary to generate the asset and that can be allocated on a reasonable and consistent basis to the asset.
48 ZENITEL - ANNUAL REPORT 2019
Computer software costs that have been capitalized are amortized on a straight-line basis over the period of their expected useful lives, not exceeding a period of fi ve years.
INTERNALLY GENERATED INTANGIBLE ASSETS - RESEARCH AND DEVELOPMENT EXPENDITURE
Expenditure on research activities, undertaken with the prospect of gaining new scientifi c or technical knowledge, is recognized in the consolidated statement of profi t or loss as an expense as incurred.
Until 31 December 2015, costs incurred on development projects (relating to the design and testing of new or improved products) are recognized as intangible assets when the asset can be clearly identifi ed, when the development costs can be measured reliably and to the extent that it is probable that the asset created will generate future economic benefi ts. Other development expenditures are recognized as an expense as incurred. Development costs previously recognized as an expense are not recognized as an asset in a subsequent period. Development costs that have been capitalized are amortized from the commencement of the commercial production of the product on a straight-line basis over the period of its expected benefi t. The amortization periods adopted do not exceed fi ve years.
Due to short life cycles, the unpredictability of which development projects will become successful, the volatility of technologies and the markets Zenitel operates in, the Board of Directors concluded that Zenitel’s development expenses in 2018 and 2019 no longer meet the criteria of IAS38.57. As the criteria of IAS38.57 are no longer fulfi lled, capitalization of development expenses in 2018 and 2019 was not allowed. The remaining capitalized development costs are amortized on a systematic basis over their expected useful lives, being 3 years.
GOODWILL
Goodwill arises when the cost of a business combination at the date of acquisition is in excess of the Group’s interest in the fair value of the identifi able assets, liabilities and contingent liabilities recognized. Goodwill is initially recognized as an asset at cost and is subsequently measured at cost less any accumulated impairment losses.
For the purpose of impairment testing, goodwill is allocated to each of the Group’s cash-generating units that are expected to benefi t from the synergies of the combination. The cash-generating unit(s) to which the goodwill has been allocated is tested for impairment annually, and whenever there is an indication that it may be impaired, by comparing its carrying amount with its recoverable amount. If the recoverable amount of the cash-generating unit is less than the carrying amount of the unit, the impairment loss is allocated fi rst to reduce the carrying amount of any goodwill allocated to the unit and then to the other assets of the unit pro-rata on the basis of the carrying amount of each asset in the unit. An impairment loss recognized for goodwill is not reversed in a subsequent period.
The Group’s policy for goodwill arising on the acquisition of an associate is described under ‘Investments in associates’ above.
On disposal of a subsidiary or a jointly controlled entity, the attributed amount of goodwill is included in the determination of the profi t or loss on disposal.
In case the fair value of the identifi able assets, liabilities and contingent liabilities exceeds the consideration transferred, the excess remaining after reassessment is recognized immediately into profi t and loss.
TANGIBLE ASSETS
PROPERTY, PLANT AND EQUIPMENT
Land is carried at cost less accumulated impairment losses. All other property, plant and equipment are carried at cost less accumulated depreciation and impairment losses except for property, plant and equipment under construction, which is carried at cost less accumulated impairment losses. Cost includes all directly attributable costs of bringing the asset to working condition for its intended use.
Depreciation is charged so as to write off the cost or valuation of assets, other than land and properties under construction, over their estimated useful lives, using the straight-line method to their estimated residual value. The depreciation is computed from the date the asset is ready to be used.
The estimated useful life, residual value and depreciation method of an asset is reviewed at least at each fi nancial year-end and, if expectations differ from previous estimates, with the effect of any changes in estimate accounted for on a prospective basis.
The following useful lives are applicable to the main property, plant and equipment categories:
Industrial buildings: 40 years
Offi ce buildings: 50 years
Machine tools and heavy equipment: 10 years
Network infrastructure: 7-10 years
Electronic measuring appliances: 5 years
Quality control appliances: 10 years
Workshop and laboratory equipment: 4 years
Furniture in industrial buildings: 10 years
Vehicles - cars: 4-5 years
Vehicles - trucks: 4 years
Offi ce furniture: 10 years
Subsequent costs are included in the asset’s carrying amount or recognized as a separate asset, as appropriate, only when it is probable that future economic benefi t associated with the item will fl ow to the Group and the cost of the item can be measured reliably. All other repairs and maintenance are charged to the consolidated statement of profi t or loss during the fi nancial period in which they are incurred.
ZENITEL - ANNUAL REPORT 2019 49

The gain or loss arising on the disposal or retirement of an item of property, plant and equipment is determined as the difference between the sales proceeds and the carrying amount of the asset and is recognized in profi t or loss.
LEASING AND SIMILAR RIGHTS
Under IFRS 16, a contract is, or contains, a lease if the contract conveys a right to control the use of an identifi ed asset for a period in exchange for consideration.
The Group recognizes a right-of-use asset and a lease liability at the lease commencement date. Assets and liabilities arising from a lease are initially measured on a present value basis, discounted using the Group’s best estimation for the weighted average incremental borrowing rate. The right-of-use asset is subsequently depreciated and/or impaired when deemed necessary. The right-of-use asset is also adjusted for certain re-measurements of the lease liability.
The lease liability is subsequently increased by the interest cost on the lease liability and reduced by lease payment made. It is re-measured when there is a change in future lease payments arising from a change in an index or rate, a change in the estimate of the amount expected to be payable, or a change in the reassessment of whether a purchase or extension option is reasonably certain to be exercised or a termination option curtained not to be exercised.
The Group applies judgement to determine the lease term for lease contracts containing renewal options.
CAPITAL MANAGEMENT
The Group manages its capital to ensure that entities in the Group will be able to continue as a going concern while maximizing the return to stakeholders through the optimization of the debt and equity balance. The capital structure of the Group consists of debt, which includes the borrowings disclosed in Note 25, cash and cash equivalents, and equity attributable to equity holders of the parent, comprising issued capital, reserves and retained earnings. The Group’s policy is to borrow centrally, using a mixture of long-term and short-term capital market issues and borrowing facilities, to meet the anticipated funding requirements. These borrowings together with cash generated from operations, are on-lent or contributed as equity to certain subsidiaries.
The Board of Directors reviews the capital structure on a quarterly basis. As a part of this review, the Board of Directors considers the cost of capital and the risk associated with each class of capital. Based on the recommendations of the Board of Directors, the Group balances its overall capital structure through new share issues and the issue of new debt or the redemption of existing debt. When analyzing the capital structure of the Group, the same debt/equity classifi cations are used as that of the classifi cations applied in our IFRS reporting. Besides the statutory minimum equity funding requirements that apply to our subsidiaries in the different countries, Zenitel is not subject to any externally imposed capital requirements.
IMPAIRMENT OF TANGIBLE AND INTANGIBLE ASSETS EXCLUDING GOODWILL
At each statement of fi nancial position date, the Group reviews the carrying amounts of its tangible and intangible assets to determine whether there is any indication that those assets have suffered an impairment loss. If any such indication exists, the recoverable amount of the asset is estimated in order to determine the extent of the impairment loss (if any). Where it is not possible to estimate the recoverable amount of an individual asset, the Group estimates the recoverable amount of the cash- generating unit to which the asset belongs.
Recoverable amount is the higher of fair value less costs to sell and value in use. In assessing value in use, the estimated future cash fl ows are discounted to their present value using a pre-tax discount rate that refl ects current market assessments of the time value of money and the risks specifi c to the asset.
If the recoverable amount of an asset (or cash-generating unit) is estimated to be less than its carrying amount, the carrying amount of the asset (cash-generating unit) is reduced to its recoverable amount. An impairment loss is recognized immediately in profi t or loss, unless the relevant asset is carried at a revalued amount, in which case the impairment loss is treated as a revaluation decrease.
Where an impairment loss subsequently reverses, the carrying amount of the asset (cash-generating unit) is increased to the revised estimate of its recoverable amount, but only to the extent that the increased carrying amount does not exceed the carrying amount that would have been determined had no impairment loss been recognized for the asset (cash-generating unit) in prior years. A reversal of an impairment loss is recognized immediately in profi t or loss, unless the relevant asset is carried at a revaluated amount, in which case the reversal of the impairment loss is treated as a revaluation increase.
50 ZENITEL - ANNUAL REPORT 2019
INVENTORIES
Inventories are stated at the lower of cost and net realizable value.
Raw materials, consumables and goods purchased for resale are valued at the lower of their cost or their net realizable value. Cost is determined using the weighted average cost method. The cost of work in process and fi nished goods comprise all the costs of conversion and other costs incurred in bringing the inventories to their present location and condition. The conversion costs include the cost of production and the related fi xed and variable production overhead costs (including depreciation). Net realizable value represents the estimated sale price less all estimated costs of completion and costs to be incurred in marketing, sales and distribution.
FINANCIAL INSTRUMENTS
Trade Receivables and Other Receivables
Trade receivables and other receivables are measured at initial recognition at fair value, and are subsequently measured at amortized cost using the effective interest rate method. Interest income is recognized by applying the effective interest rate, except for short-term receivables when the recognition of interest would be immaterial. The Group recognizes an allowance for expected credit losses (ECLs) for all debt instruments not held at fair value through profi t or loss. ECLs are based on the difference between the contractual cash fl ows due in accordance with the contract and all the cash fl ows that the Group expects to receive, discounted at an approximation of the original effective interest rate.
Cash & Cash Equivalents
Cash and cash equivalents comprise cash-on-hand and demandable deposits.
Available-for-sale fi nancial assets
Available-for-sale fi nancial assets are non-derivative fi nancial assets that are designated as available-for-sale or are not classifi ed in any of the above categories of fi nancial assets. Available-for-sale are recognized initially at fair value plus any directly attributable transactions costs. Subsequent to initial recognition, they are measured at fair value and changes thereon, and other than impairment losses and foreign currency differences on available-for-sale debt instruments, they are recognized in other comprehensive income and presented in the fair value reserve in equity. When an investment is derecognized, the gain or loss accumulated in equity is reclassifi ed to profi t or loss. Available-for-sale fi nancial assets comprise equity securities and debt securities.
Financial Liabilities and Equity
Financial liabilities and equity instruments issued by the Group are classifi ed according to the substance of the contractual arrangements entered into and the defi nitions of a fi nancial liability and an equity instrument. An equity instrument is any contract that evidences a residual interest in the assets of the Group after deducting all of its liabilities. The accounting policies adopted for specifi c fi nancial liabilities and equity instruments are set out below.
Bank Borrowings
Interest-bearing bank loans and overdrafts are initially measured at fair value and are subsequently measured at amortized cost, using the effective interest rate method.
Trade Payables
Trade payables are initially measured at fair value and are subsequently measured at amortized cost, using the effective interest rate method. Interest expense is recognized by applying the effective interest rate, except for short-term payables when the recognition of interest would be immaterial.
Equity Instruments
Equity instruments issued by the company are recorded at the proceeds received, net of direct issue costs.
Derivative Financial Instruments
The Group uses derivative fi nancial instruments to hedge its exposure to foreign exchange and interest rate risks arising from operational, fi nancing and investment activities. The Group does not engage in speculative transactions nor does it issue or hold fi nancial instruments for trading purposes.
Derivatives are initially recorded at fair value and re-measured at the subsequent reporting dates.
Derivatives that do not qualify for hedge accounting
Certain forward exchange rate transactions, while providing effective economic hedges under the Group’s risk management policies, do not qualify for hedge accounting under the specifi c rules in IAS 39. Changes in the fair value of forward exchange rate contracts that do not qualify for hedge accounting under IAS 39 are recognized immediately in the consolidated income statement.
Treasury Shares
When the Group purchases its own shares, the amount paid, including attributed direct costs is accounted for as a deduction of equity. The proceeds from sales of shares are directly included in net equity with no impact on net income.
ZENITEL - ANNUAL REPORT 2019 51

Derecognition (including factoring)
A fi nancial asset (or, where applicable, a part of a fi nancial asset or part of a group of similar fi nancial assets) is primarily derecognized (i.e., removed from the Group’s consolidated statement of fi nancial position) when:
• The rights to receive cash fl ows from the asset have expired, or
• The Group has transferred its rights to receive cash fl ows from the asset or has assumed an obligation to pay the received cash fl ows in full without material delay to a third party under a ‘pass-through’ arrangement; and either (a) the Group has transferred substantially all the risks and rewards of the asset, or (b) the Group has neither transferred nor retained substantially all the risks and rewards of the asset, but has transferred control of the asset
When the Group has transferred its rights to receive cash fl ows from an asset or has entered into a pass-through arrangement, it evaluates if and to what extent it has retained the risks and rewards of ownership. When it has neither transferred nor retained substantially all of the risks and rewards of the asset, nor transferred control of the asset, the Group continues to recognize the transferred asset to the extent of the Group’s continuing involvement. In that case, the Group also recognizes an associated liability. The transferred asset and the associated liability are measured on a basis that refl ects the rights and obligations that the Group has retained.
In the framework of the factoring agreement that the Group holds in Norway, not all risks related to these factoring receivables have been transferred. Hence the receivables have not been derecognized and the associated factored amounts have been recognized in the short-term fi nancial liabilities.
NON-CURRENT ASSETS HELD FOR SALE
Non-current assets and disposal groups are classifi ed as held for sale if their carrying amount will be recovered through a sale transaction rather than through continuing use. This condition is regarded as met only when the sale is highly probable and the asset (or disposal group) is available for immediate sale in its present condition. Management must be committed to the sale, which should be expected to qualify for recognition as a completed sale within one year from the date of classifi cation.
Non-current assets (and disposal groups) classifi ed as held for sale are measured at the lower of the assets’ previous carrying amount and fair value less costs to sell.
GOVERNMENT GRANTS
Government grants are recognized when there is a reasonable assurance that:
• the Group will comply with the conditions attached to them
• the grants will be received
Government grants are recognized as income over the periods necessary to match them with the related costs which they are intended to compensate, on a systematic basis. Government grants that are receivable as compensation for expenses or losses already incurred or for the purpose of providing immediate fi nancial support to the Group with no future related costs are recognized as income of the period in which they become receivable.
Government grants related to assets are deducted from the carrying amount of the asset.
PROVISIONS
Provisions are recognized in the consolidated statement of position when:
(a) there is a present obligation (legal or constructive) as a result of a past event; and
(b) it is probable that an outfl ow of resources embodying economic benefi ts will be required to settle the obligation; and
(c) a reliable estimate can be made of the amount of the obligation.
Provisions are determined by discounting the expected future cash fl ows at a pre-tax rate that refl ects current market assessments of the time value of money and the risks specifi c to the liability. The unwinding of the discount is recognized as fi nance cost.
Restructurings
A restructuring provision is recognized when the Group has developed a detailed formal plan for the restructuring and has raised a valid expectation in those affected that it will carry out the restructuring by starting to implement that plan or announcing its main features to those affected by it. The measurement of a restructuring provision includes only the direct expenditures arising from the restructuring, which are those amounts that are both necessarily entailed by the restructuring and not associated with the on-going activities of the entity.
Warranty
The Group recognizes the estimated liability to repair or replace its products still under warranty at the date of sale of the relevant products or services. This provision is estimated based on the past history of the level of repairs and replacements.
Onerous Contracts
The Group recognizes a provision for onerous contracts when the expected benefi ts to be derived from a contract are less than the unavoidable costs of meeting the obligations under the contract.
52 ZENITEL - ANNUAL REPORT 2019

REVENUE RECOGNITION
Revenue is recognized when it is probable that future economic benefi ts associated with the transaction will fl ow to the entity and that these benefi ts can be measured reliably.
Turnover is reported net of sales taxes, rebates and other similar allowances.
Sale of Goods
The Group is in the business of providing communication systems. The Group’s contracts with customers for the sale of goods generally include one performance obligation. Revenue from contracts with customers is recognised when control of the goods or services are transferred to the customer at an amount that refl ects the consideration to which the Group expects to be entitled in exchange for those goods or services. The Group has generally concluded that it is the principal in its revenue arrangements, because it typically controls the goods or services before transferring them to the customer. The Group also has concluded that revenue from sale of goods should be recognized at the point in time when control of the asset is transferred to the customer, generally on delivery of the product.
The Group considers whether there are other promises in the contract that are separate performance obligations to which a portion of the transaction price needs to be allocated (e.g., warranties, customer loyalty points). As no variable consideration, signifi cant fi nancing components, noncash consideration or consideration payable to customers are included in the contracts, the transaction price is fully allocated to the sale of equipment.
Rendering of services/Contracts in progress
The Group’s contracts in progress relate to the installation of communication systems on ships. The Group considers whether there are promises in the contract that are separate performance obligations to which separate transaction prices are allocated. The Group is responsible for the overall management of the project and identifi es various separate performance obligations to be provided, including design work, procurement of materials, test phases, installation and fi nishing work. The Group accounts each of these performance obligations separately because each of these provide a service to the group’s customers. Each performance obligation has an individual transaction price in the contract. The key performance obligation in a project relates to the commissioning of the communication system on the ship.
The considerations in the Group’s contracts do not include variable amounts, do not contain signifi cant fi nancing components and fi nally there are no non-cash considerations or considerations payable to customers.
Royalties
Royalty revenue is recognized on an accrual basis in accordance with the substance of the relevant agreement. Royalties determined on a time basis are recognized on a straight-line basis over the period of the agreement. Royalty arrangements that are based on production, sales and other measures are recognized by reference to the underlying arrangement.
Interest Income
Interest revenue is accrued on a time basis, by reference to the principal outstanding and at the effective interest rate applicable, which is the rate that exactly discounts estimated future cash receipts through the expected life of the fi nancial asset to that asset’s net carrying amount.
Dividends
Dividends are recognized when the shareholder’s right to receive the payment is established.
INCOME TAXES
The income tax charge is based on the results for the year and includes current and deferred taxation.
Current tax is the amount of tax to pay based on the taxable profi t of the period, as well as any adjustments relating to previous years. It is calculated using local tax rates adopted (or substantially enacted) at the closing date.
Deferred tax is recognized on differences between the carrying amounts of assets and liabilities in the fi nancial statements and the corresponding tax bases used in the computation of taxable profi t and are accounted for using the balance sheet liability method. Deferred tax liabilities are generally recognized for all taxable temporary differences and deferred tax assets are recognized to the extent that it is probable that taxable profi ts will be available against which deductible temporary differences can be utilized. Such assets and liabilities are not recognized if the temporary difference arises from goodwill or from the initial recognition (other than in a business combination) of other assets and liabilities in a transaction that affects neither the taxable profi t nor the accounting profi t.
Deferred tax liabilities are recognized for taxable temporary differences arising on investments in subsidiaries and associates, and interests in joint ventures, except where the Group is able to control the reversal of the temporary difference, and it is probable that the temporary difference will not reverse in the foreseeable future. Deferred tax assets arising from deductible temporary differences associated with such investments and interests are only recognized to the extent that it is probable that there will be suffi cient taxable profi ts against which to utilize the benefi ts of the temporary differences, and they are expected to reverse in the foreseeable future.
The carrying amount of deferred tax assets is reviewed at each statement of position date and reduced to the extent that it is no longer probable that suffi cient taxable profi ts will be available to allow all or part of the asset to be recovered.
ZENITEL - ANNUAL REPORT 2019 53

Deferred tax assets and liabilities are measured at the tax rates that are expected to apply in the period in which the liability is settled or the asset realized, based on tax rates (and tax laws) that have been enacted or substantively enacted by the statement of position date. The measurement of deferred tax liabilities and assets refl ects the tax consequences that would follow from the manner in which the Group expects, at the reporting date, to recover or settle the carrying amount of its assets and liabilities.
Deferred tax assets and liabilities are offset when there is a legally enforceable right to set off current tax assets against current tax liabilities and when they relate to income taxes levied by the same taxation authority and the Group intends to settle its current tax assets and liabilities on a net basis.
Current and deferred tax are recognized as an expense or income in profi t or loss, except when they relate to items credited or debited directly to equity, in which case the tax is also recognized directly in equity, or where they arise from the initial accounting for a business combination. In the case of a business combination, the tax effect is taken into account in calculating goodwill or determining the excess of the acquirer’s interest in the net fair value of the acquirer’s identifi able assets, liabilities and contingent liabilities over cost.
EMPLOYEE BENEFITS
Pension Obligations
The Group operates a number of defi ned benefi t and contribution retirement plans, the assets of which are held in separate trustee- administered funds or Group insurances. Payments to defi ned contribution benefi t plans are charged as an expense as they fall due.
The Group’s commitments under defi ned benefi ts plans, and the related costs, are valued using the ‘projected unit credit method’ with actuarial valuations being carried out at each statement of position date. Actuarial gains and losses of the Group’s defi ned benefi t obligation are recognized immediately as an item in OCI.
Other Long-Term Employee Benefi ts
These benefi ts are accounted for on the same basis as post-employment benefi ts.
Termination Benefi ts
Termination benefi ts are payable when employment is terminated before the normal retirement date, or when an employee accepts voluntary redundancy in exchange for these benefi ts. The Group recognizes termination benefi ts when it is demonstrably committed to either terminating the employment of current employees according to a detailed formal plan without possibility of withdrawal, or providing termination benefi ts as a result of an offer made to encourage voluntary redundancy. Benefi ts falling due more than 12 months after statement of position date are discounted to present value.
Profi t-Sharing & Bonus Plans
The Group recognizes a liability and an expense for bonuses and profi t-sharing, based on a formula that takes into consideration the profi t attributable to the company’s shareholders after certain adjustments. The Group recognizes a provision where contractually obliged or where there is a past practice that has created a constructive obligation.
FINANCIAL RISK FACTORS
Fluctuations in foreign currency exchange rates on sales and purchases, inter-company loans and interest rate variances are inherent risks in the performance of the business. The Group entities seek to minimize potential adverse effects of these fi nancial risks on the fi nancial performance of their local businesses
FINANCIAL RISK MANAGEMENT OBJECTIVES
The Group’s Corporate Treasury function provides services to the business, coordinates access to domestic and international fi nancial markets, and monitors the fi nancial risks relating to the operations. These risks include market risk (including currency risk, fair value interest rate risk and price risk), credit risk, liquidity risk and cash fl ow interest rate risk.
The Group seeks to minimize the effects of these risks by using derivative fi nancial instruments to hedge these risk exposures. The use of fi nancial derivatives is governed by the Group’s policies approved by the Board of Directors, which provide written principles on foreign exchange risk, interest rate risk, credit risk, the use of fi nancial derivatives and non-derivative fi nancial instruments, and the investment of excess liquidity.
Compliance with policies and exposure limits is reviewed by the internal auditors on a continuous basis. The Group does not enter into or trade fi nancial instruments, including derivative fi nancial instruments, for speculative purposes.
FOREIGN EXCHANGE RISKS
Zenitel is exposed to fl uctuations in exchange rates, which may lead to profi t or loss in currency transactions. As Zenitel has substantial activities in the United States, Norway and Asia, changes in the exchange rate of the USD, the NOK and the SGD against the euro may affect the Company’s consolidated accounts. Moreover, the Group operates internationally and is exposed to foreign exchange risks as a result of the foreign currency transactions entered into by its different subsidiaries in currencies other than their functional currency, primarily with respect to NOK, DKK, USD and SGD.
Since most of the Norwegian business is export in the euro currency, Zenitel Norway AS has a NOK defi cit and a euro surplus. The company has put in place hedging systems that secure the needed exchange between euro/NOK on a rolling basis.
Further information on these Hedges is given in Note 28.
54 ZENITEL - ANNUAL REPORT 2019

TRANSACTIONAL FOREIGN CURRENCY RISK
As far as foreign currency risk on borrowing is concerned, it is the Company’s policy to have debt in the subsidiaries as much as possible in the functional currency of the subsidiary. The transactional currency risk mainly arises from the open foreign currency positions outstanding of group companies against, respectively, the NOK, DKK,
USD and SGD. On the basis of the average volatility during the last 5 years of these currencies against the euro, we estimated the reasonably possible changes of exchange rate of these currencies against the euro for respectively 2019 and 2018 as follows:
1 euro equalsClosing Rate 31 Dec 2019
Possible volatility of rates in %
Rates used for the sensitivity analysis
Closing rate 31 Dec 2018
Possible volatility of rates in %
Rates used for sensitivity analysis
NOK 9.86 3.2% 9.55 - 10.17 9.94 4.6% 9.49 - 10.39DKK 7.47 0.1% 7.46 - 7.48 7.47 0.1% 7.46 - 7.48USD 1.12 2.9% 1.09 - 1.15 1.14 6.2% 1.07 - 1.21SGD 1.51 2.1% 1.48 - 1.54 1.56 3.4% 1.51 - 1.61
TRANSLATIONAL FOREIGN CURRENCY RISK
100 percent of Zenitel’s revenue is generated by its subsidiaries. 87 percent (2018: 85 percent) of revenue is coming from subsidiaries located in a non-euro currency country. A currency translation risk arises when the fi nancial data of these foreign operations are converted into Zenitel’s presentation currency, the euro.
The foreign currencies in which the main Zenitel subsidiaries operate are the NOK, DKK, USD and SGD. On the basis of the average volatility during the last 5 years of these currencies against the euro, we estimated the reasonably possible change of the exchange rate of these currencies against the euro for respectively 2019 and 2018 as follows:
1 euro equals
Closing rate 31
Dec 2019Ave. Rate
2019
Possible volatility
of rates in 2019
Rates as used in the sensitivity analysis for 2019
Closing rate
31 Dec 2018
Ave. rate 2018
Possible volatility
of rates in 2018
Rates as used for the sensitivity analysis for 2018
Possible closing rate
Possible average rate
Possible closing rate
Possible average rate
NOK 9.86 9.85 3.16% 9.55 - 10.17 9.54 - 10.16 9.94 9.63 4.57% 9.49 - 10.39 9.19 - 10.07DKK 7.47 7.47 0.14% 7.46 - 7.48 7.46 - 7.48 7.47 7.45 0.13% 7.46 - 7.48 7.44 - 7.46USD 1.12 1.12 2.86% 1.09 - 1.15 1.09 - 1.15 1.14 1.18 6.21% 1.07 - 1.21 1.11 - 1.25SGD 1.51 1.53 2.12% 1.48 - 1.54 1.50 - 1.56 1.56 1.59 3.41% 1.51 - 1.61 1.54 - 1.64
If the euro had weakened/strengthened during 2019 and 2018 by the above estimated possible changes against the above listed currencies with all other variables held constant, the 2019 profi t would have been 0.1 million euro or 2.6% of net income higher/lower (2018: 0.1 million euro or 0.6% of net income) while the translation reserves in equity would have been 1.0 million euro or 3.0% of total equity higher/lower (2018: 0.1 million euro or 0.5% of total equity).
CREDIT RISKS
Credit risk encompasses all forms of counter-party exposure, i.e., where counter-parties may default on their obligations to Zenitel in relation to lending, hedging and other fi nancial activities. The Company has policies in place to monitor and control counter-party credit risk.
Zenitel mitigates its exposure to counter-party credit risk through counter-party credit guidelines, diversifi cation of counter- parties, working within agreed counter-party limits and through setting limits on the maturity of fi nancial assets. For major projects the intervention
of credit insurance companies or similar organizations is requested. The credit risk on liquid funds is limited, because the counter-parties are banks with high credit-ratings assigned by international credit-rating agencies.
The Group has no signifi cant concentration of credit risk. An aging analysis of the current trade and other receivables is included in Note 22.
The Group considers its maximum exposure to credit risk to be as follows:
(millions of euro) 31 December
2019 2018
Other fi nancial assets 0.2 0.2Trade & other receivables 14.4 12.0Bank deposits 0.8 0.8Total 15.4 13.0
The majority of the Group’s receivables is due within 90 days and largely comprises receivables from consumers and business customers.
If the above-indicated currencies had weakened/strengthened during 2019 and 2018 by the above estimated changes against the euro, with all of the other variables held constant, the 2019 and 2018 net result would not have been signifi cantly affected in 2019 (less than 0.1 million euro) and 2018 (less than 0.1 million euro). Neither would there have been a material impact on other components of equity both in 2019 and 2018.
ZENITEL - ANNUAL REPORT 2019 55

LIQUIDITY RISKS
Liquidity risk is linked to the evolution of our current assets and current liabilities. The Group monitors the changes in these current assets and liabilities through regular monitoring and ratio-calculation. Further information on the existing credit lines is given in Note 25.
The following table sets forth details of the remaining contractual maturities of fi nancial liabilities as of 31 December 2019 and 2018.
(millions of euro) 31 December 31 December
2019 2018
Total
Payment due within 1 year or
less
Payment due later than 1 year but
not later than 5 years
Payment due later
than 5 years Total
Payment due within 1 year or
less
Payment due later than 1 year but
not later than 5 years
Payment due later
than 5 years
Used factoring credit facility 2.2 2.2 - - 2.0 2.0 - -
Trade and other payables 15.1 15.1 - - 13.9 13.9 - -
Leasing and similar rights 3.4 1.4 2.0 0.0 0.1 - 0.1 0.0
Total 20.7 18.7 2.0 0.0 16.0 15.9 0.1 0.0
INTEREST RATE RISKS
The Group is exposed to interest rate risk as entities in the Group borrow funds at both fi xed and fl oating interest rates. The Group manages the risk by maintaining an appropriate mix between fi xed and fl oating rate borrowings. As per year-end 2019 and 2018, the Group
has no interest rate swap contracts or forward interest rate contracts. The following table sets forth details of the remaining outstanding debt as per year-end, with their corresponding average interest rates:
Outstanding debt 31 Dec
2019
Interest charge 2019
Ave. interest
rate 2019
Possible volatility of rate in 2019
Outstanding debt 31 Dec
2018
Interest charge 2018
Ave. interest
rate 2018
Possible volatility of rate in 2018
Used factoring facility 2.2 0.1 2.89% 1.9% 2.0 0.1 2.89% 1.9%
Leasing andsimilar rights
3.4 - 1.60% Fixed Rate 0.1 - 5.26% Fixed Rate
Total 5.6 0.1 2.1 0.1
INTEREST RATE SENSITIVITY
The Group’s sensitivity to interest rate is mainly determined by the fl oating rate on short-term bank borrowings on which variable interest rates are applicable.
When we apply the reasonably possible increase/decrease in the market interest rate (volatilities as indicated in the table above), with all other variables held constant, the 2019 net result would have been 0.01 million euro lower/higher (2018: 0.01 million euro lower/higher). The impact on interest income on interest bearing fi nancial assets (such as fi nance lease receivables and cash deposits) was not included in this calculation, as this impact is only limited.
The estimated volatilities in 2019 and 2018, as indicated in the table above, are based on average deviations of the interest rate during the respective years.
EQUITY RISK
The company holds investments in Beijing Nera Stentofon Communication Equipment in China (10%) and Zenitel UK (15%). Refer to Note 19 of these fi nancial statements.
56 ZENITEL - ANNUAL REPORT 2019

CRITICAL JUDGMENTS IN APPLYING THE ENTITY’S ACCOUNTING POLICIES AND KEY SOURCES OF ESTIMATION UNCERTAINTY
In the application of the Group’s accounting policies, which are described in this section, management is required to make judgments, estimates and assumptions about the carrying amounts of assets and liabilities that are not readily apparent from other sources. The estimates and associated assumptions are based on historical experience and other factors that are considered to be relevant. Actual results may differ from these estimates.
The estimates and underlying assumptions are reviewed on an on-going basis, especially given the current economic and fi nancial market crisis, and given the Group’s fi nancial position. Revisions to accounting estimates are recognized in the period in which the estimate is revised if the revision affects only that period or in the period of the revision and future periods if the revision affects both current and future periods.
The following are the critical judgments that management has made in the process of applying the entity’s accounting policies and that have the most signifi cant effects on the amounts recognized in the fi nancial statements.
IMPAIRMENT OF GOODWILL
Goodwill arising from acquisitions represents the excess of the cost of the acquisition over the fair value of the identifi ed assets and liabilities assumed of the acquired subsidiary at the date of acquisition. In accordance with IAS 36, goodwill arising on consolidation is tested annually for impairment or more frequently if there are indications that the goodwill might be impaired, in accordance with IAS 36 Impairment of Assets. This standard also requires that the goodwill should, from the acquisition date, be allocated to each of the cash generating units (CGUs) or groups of cash generating units that are expected to benefi t from the synergies of the business combination. The CGUs to which goodwill has been allocated were tested for impairment at the balance sheet date by comparing the carrying amount of the unit with the recoverable amount (higher of its fair value less cost to sell and its value in use). Zenitel only has one CGU to which goodwill is allocated, the SCS business.
In application of the value-in-use method, Zenitel management prepared cash fl ow forecasts for the CGU or group of CGUs, where the CGUs are considered to be the Company’s legal entities or business units. The key assumptions included in the value in use calculation comprise the discount factor and the projected future net cash fl ows on products and services.
The (pre-tax) discount rate applied to cash fl ow projections is the weighted average cost of capital (WACC) of 10.8% (pre-tax discount rate 2018: 11.6%). The components for the determination of the WACC are based on sector-specifi c parameters received from various banks and analysts and taking into account the fi nancial position of Zenitel and historical performance of the individual CGU. The cash fl ow forecast is calculated over a 5-year time frame including a terminal value at the end of 2024. The cash fl ow is based on actual performance and estimated development of key drivers. The following assumptions are made:
• Growth rate of 2.0% for 2020 (2019: 23.0%) applied on revenues.
• Growth rate of 2.0% (2018: 2.0%) applied on terminal value.
• Infl ation rate of 1.43% (2018: 2.71%) applied on operating expenses (weighted average infl ation rate of each country included in the CGU).
• Cost of Goods as a % of revenue sold kept stable for the following years.
Management determined these assumptions based on past performance and its expectations with respect to market development.
The calculation shows a cushion (difference between value in use and carrying value) of 46.2 million euro, and the sensitivity analysis shows that 2.6% (2018: 3.6%) is to be subtracted from the growth rate before goodwill is impaired. CGU SCS requires a WACC exceeding 19.9% before goodwill is impaired (2018: 28.7%).
The Company cannot predict whether an event that triggers impairment will occur, when it will occur or how it will affect the asset values reported. Zenitel believes that all of its estimates are reasonable: they are consistent with the internal reporting and refl ect management’s best estimates. However, inherent uncertainties exist that management may not be able to control. While a change in estimates used could have a material impact on the calculation of the fair values and trigger an impairment charge, the Company is not aware of any reasonably possible change in key assumptions used that would cause a business unit’s carrying amount to exceed its recoverable amount.
CONTINGENCIES
Critical judgment was applied in evaluating and determining the contingent liabilities as further disclosed in Note 27 & 29.
ZENITEL - ANNUAL REPORT 2019 57

NOTES TO THE CONSOLIDATED FINANCIAL STATEMENTS
1. REVENUE
The following is an analysis of the Group’s revenue for the year.
(thousands of euro) 31 December
2019 2018
Revenue from the sale of goods 70 146 61 756
Revenue from the rendering of services 6 111 75
Total revenue 76 257 61 831
In the tables above, the goods that are part of an entire system integration project have been included as service revenues as these goods are part of an entire solution sold by the Company.
2. SEGMENT INFORMATION
Due to the sale in 2015 of Zenitel’s Caribbean company, the Zenitel Group is no longer organized in different business segments.
ENTITY-WIDE DISCLOSURES
Information about geographical areas:
(thousands of euro) 31 December
2019 2018
Revenues
Belgium (Country of domicile) - -
Norway 46 717 38 741
Singapore 5 351 3 585
Finland 4 475 3 701
France 5 706 4 925
USA 11 562 8 021
Other foreign countries 2 446 2 858
Total 76 257 61 831
(thousands of euro) 31 December
2019 2018
Non current assets*, located in
Belgium (Country of domicile) 66 -
Norway 5 708 4 055
Other foreign countries 2 287 356
Total 8 061 4 411
*Excluding fi nancial assets and deferred tax assets.
58 ZENITEL - ANNUAL REPORT 2019

3. BUSINESS COMBINATION
In November 2018, Zenitel acquired the Phontech operations from Jotron AS. Phontech is specialized in Intercom and Public Address & General Alarm solutions for the Maritime and Oil & Gas markets with worldwide market presence. This strategic acquisition will strengthen Zenitel its position as a worldwide market leader for intelligent critical communication solutions in the Maritime industry. The purchase price was fully paid by own funds.
The transaction costs in the amount of 0.2 million euro were booked as consulting expenses and the gain on bargain purchase of 0.4 million euro was booked in the line Finance income of the consolidated statement of profi t or loss for the year ended 31 December 2018.
The initial purchase price allocation was fi nalized per 31 December 2018 and no adjustments were identifi ed.
The long-term growth strategy of Zenitel remains focused on presence in multiple markets as well as possible acquisitions.
4. RAW MATERIALS AND CONSUMABLES USED
(thousands of euro) 31 December
2019 2018Supplies 33 297 29 481Subcontractors 2 132 235Changes in inventories of fi nished goods and work in progress -459 -3 152Other 190 164Total raw materials and consumables used 35 160 26 728
Impairment on current assets are included in total raw materials and consumables used.
5. EMPLOYEE BENEFITS EXPENSES
(thousands of euro) 31 December
2019 2018Wages and salaries 22 635 17 645Social security costs 2 798 2 371Other employee benefi ts 1 034 814Short-term employee benefi ts 26 467 20 830
Pension costs – defi ned contribution plans 1 038 736Pension costs – defi ned benefi t plans 11 -Pension costs 1 049 736TOTAL EMPLOYEE BENEFITS EXPENSES 27 516 21 566Average number of employees 303 300
Employees 297 286Management 6 14
The increase in short-term employee benefi ts in 2019 is mainly due to the acquisition of the Phontech operations(27 FTE’s) in November 2018.
ZENITEL - ANNUAL REPORT 2019 59

6. FACILITY EXPENSES
(thousands of euro) 31 December
2019 2018Housing costs 1 052 2 237Telecom expenses 302 307Insurances 55 66Utilities 352 384Other facility costs 1 132 1 149Total facility expenses 2 894 4 143
7. OTHER EXPENSES
(thousands of euro) 31 December
2019 2018Advertising, publicity and trade fairs 874 677Travel & related costs 1 793 1 632Car expenses and allowances 219 600Other -517 315Total other expenses 2 369 3 224
8. RESEARCH & DEVELOPMENT COSTS
(thousands of euro) 31 December
2019 2018
Research and development costs 3 206 2 941
Whereof 2.3 million euro (2.2 million in 2018) was included in the Employee benefi ts expense (Wages and salaries).In 2019 and 2018, development costs were no longer capitalized.
9. FINANCE INCOME
(thousands of euro) 31 December
2019 2018
Gain and bargain purpose (note 3) - 378
Other (aggregate of immaterial items) 145 35
Total fi nance income 145 413
10. FINANCE COSTS
(thousands of euro) 31 December
2019 2018Interest on bank overdrafts, used factoring facility and loans 38 59Interest on obligations under leases 63 -6Other fi nancial charges 342 284Total fi nance costs 443 337
The weighted average interest rate on funds borrowed generally is 0.8% per annum (2018: 1.9% per annum).
60 ZENITEL - ANNUAL REPORT 2019

11. NET FOREIGN EXCHANGE GAINS / (LOSSES)
(thousands of euro) 31 December
2019 2018Foreign exchange rate losses -1 122 -662
Foreign exchange rate gains 1 262 805
Net foreign exchange gains / (losses) 140 143
12. INCOME TAXES
(thousands of euro) 31 December
Notes 2019 2018
Current tax expense / (income) 1 095 174
Adjustments recognized in the current year in relation to current tax of prior years
12 176
Deferred tax expenses 13 -364 380
Total income tax expense/(income) relating to continuing operations 743 730
The tax on the Group’s profi t before tax differs from the theoretical amount that would arise using the tax rate of the home country as follows:
(thousands of euro) 31 December
2019 2018
Profi t before tax 3 765 3 383
Tax calculated at tax rate of 29.58% (2018 and 2019) 1 114 1 001
Effects of:
- Different tax rates in other countries -123 -175
- Adjustments recognized in the current year in relation to current tax of prior years 12 176
- Income not subject to tax -220 -427
- Expenses not deductible for tax purposes 270 330
- Utilization of previously unrecognized tax losses -82 -159
- Other 108 124
-Recognition of tax losses 20 -159
- Unrecognized tax losses of the current year -356 19
Total income tax expense/(income) 743 730
The tax rate used for the 2019 and 2018 reconciliation is the corporate tax rate of 29.58 % payable by corporate entities in Belgium on taxable profi ts under tax law in that jurisdiction.
No income tax has been recognized directly in equity or in other comprehensive income in 2019 nor in 2018.
ZENITEL - ANNUAL REPORT 2019 61

13. DEFERRED INCOME TAXES
Deferred income taxes are calculated in full on temporary differences under the liability method using a principal tax rate of 22.0% (2018: 23.0 %). This percentage is the weighted average rate of the countries in which deferred taxes were recognized.
Deferred income tax assets are recognized for tax loss as carried forward to the extent that the realization of the related tax benefi t through future taxable profi ts is probable. The long-term business plan has served as input to determine the basis on which the amounts of deferred tax assets have been recognized.
The deferred income tax assets relate to the tax losses carried forward of Zenitel Norway AS and a part of Zenitel NV.
(thousands of euro) 31 December
2019 2018
At the beginning of the year
- deferred tax liability -28 -25
- deferred tax asset 822 1 194
Income statement income/(charge) 364 -380
Other changes 15 5
At the end of the year 1 173 794
Recognized in the balance sheet as
- deferred tax liability - -28
- deferred tax asset 1 173 822
The other changes mainly relate to exchange differences.
Deferred tax assets/(liabilities) Impairments Tax losses Provisions Depreciation Other Total
At 31 December 2017 279 808 75 85 -78 1 169
(Charged)/credited to P/L -52 -280 -77 -22 51 -380
Other changes -1 6 2 -1 -1 5
At 31 December 2018 226 534 - 62 -28 794
(Charged)/credited to P/L 210 -6 188 -6 -18 368
Other changes 12 - -1 11 -1 11
At 31 December 2019 448 528 187 57 -47 1 173
Deferred income tax assets and liabilities are offset when there is a legally enforceable right to set off current tax assets against current tax liabilities and when the deferred income tax relate to the same fi scal authority.The following amounts, determined after appropriate offsetting, are shown in the consolidated balance sheet:
(thousands of euro) 31 December
2019 2018
Deferred tax assets 1 173 822
Deferred tax liabilities - -28
Total 1 173 794
For companies in the Group with tax losses carried forward, we examined the probability that future taxable profi ts would be available against which the unused tax loss credits would be utilized. Listed hereafter are the companies of the Group, with specifi cation of the available losses carried forward, for which no deferred tax assets were set up.
The following companies have unrecognized tax losses (and credits):
(thousands of euro) 31 December
Company 2019 2018 Expiry date
Zenitel NV 48 846 49 508 None
Zenitel Finance Netherlands BV 7 819 7 846 10 years
Zenitel France S.A. - - None
Zenitel Finland Oy 1 057 1 074 10 years
Zenitel Denmark A/S 4 542 4 437 None
Zenitel Italy SRL 945 910 None
Some tax losses carried forward as per year-end 2019 indicated in the table above do have an expiry date. Tax losses carried forward as per year-end 2018 also had an expiry date.
62 ZENITEL - ANNUAL REPORT 2019
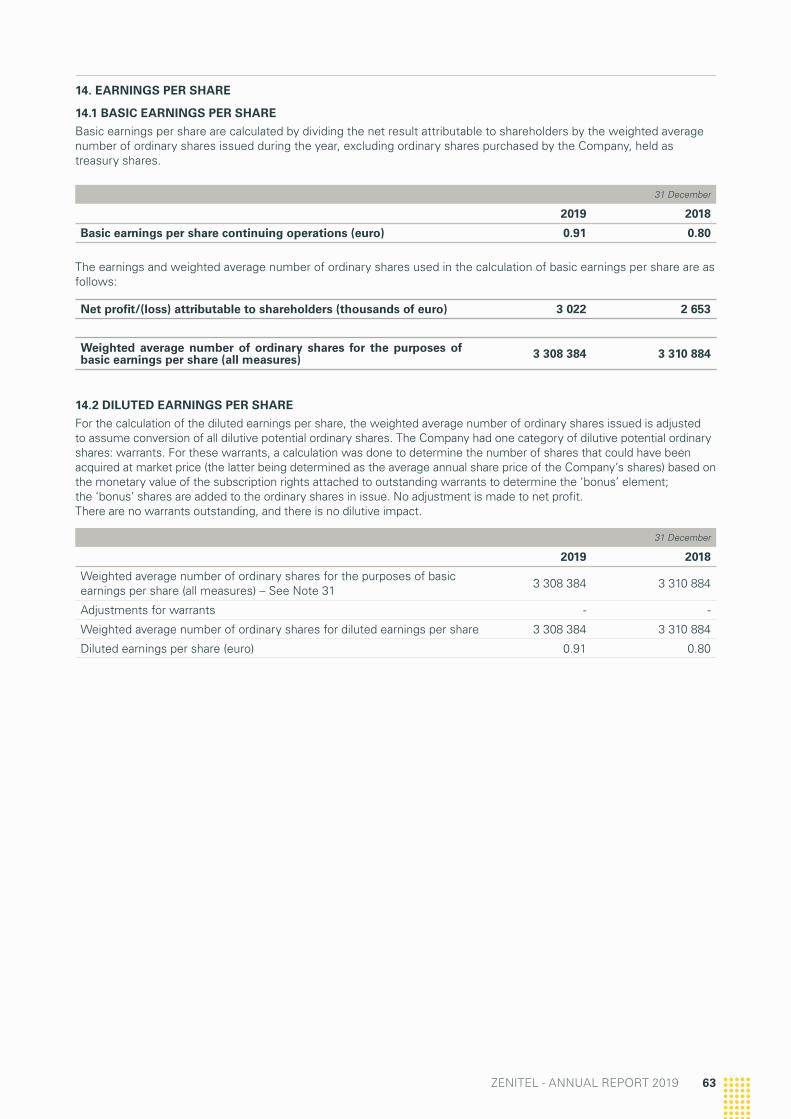
14. EARNINGS PER SHARE
14.1 BASIC EARNINGS PER SHARE
Basic earnings per share are calculated by dividing the net result attributable to shareholders by the weighted average number of ordinary shares issued during the year, excluding ordinary shares purchased by the Company, held as treasury shares.
31 December
2019 2018
Basic earnings per share continuing operations (euro) 0.91 0.80
The earnings and weighted average number of ordinary shares used in the calculation of basic earnings per share are as follows:
Net profi t/(loss) attributable to shareholders (thousands of euro) 3 022 2 653
Weighted average number of ordinary shares for the purposes of basic earnings per share (all measures) 3 308 384 3 310 884
14.2 DILUTED EARNINGS PER SHARE
For the calculation of the diluted earnings per share, the weighted average number of ordinary shares issued is adjusted to assume conversion of all dilutive potential ordinary shares. The Company had one category of dilutive potential ordinary shares: warrants. For these warrants, a calculation was done to determine the number of shares that could have been acquired at market price (the latter being determined as the average annual share price of the Company’s shares) based on the monetary value of the subscription rights attached to outstanding warrants to determine the ‘bonus’ element;the ‘bonus’ shares are added to the ordinary shares in issue. No adjustment is made to net profi t.There are no warrants outstanding, and there is no dilutive impact.
31 December
2019 2018
Weighted average number of ordinary shares for the purposes of basic earnings per share (all measures) – See Note 31
3 308 384 3 310 884
Adjustments for warrants - -
Weighted average number of ordinary shares for diluted earnings per share 3 308 384 3 310 884
Diluted earnings per share (euro) 0.91 0.80
ZENITEL - ANNUAL REPORT 2019 63

15. PROPERTY, PLANT & EQUIPMENT
(thousands of euro)Land &
buildingsInstallations
& machinery
Furniture, fi xtures &
vehicles
Leasing & similar rights
(*)
Other tangible
assets Total
Cost or valuation
Balance as at 1 January 2018 - 3 424 2 593 - 1 579 7 596
Additions - 86 37 - 192 314
Additions acquired through business combinations 178 86 - 46 310
Disposals - -1 -1 - -1 -3
Net foreign currency exchange differences - 13 1 - 14 28
Balance as at 1 January 2019(*) - 3 700 2 716 3 941 1 829 12 186
Additions - 206 290 1 168 485 2 149
Disposals - -2 -23 - -48 -73
Others - -132 - - - -132
Net foreign currency exchange differences - 33 31 - 16 78
Balance as at 31 December 2019 - 3 804 3 012 5 109 2 468 14 207
Accumulated depreciation and impairment
Balance as at 1 January 2018 - -3 239 -2 496 - -1 415 -7 150
Depreciation expense - -102 -49 - -107 -257
Eliminated on disposals of assets - 1 1 - 1 3
Net foreign currency exchange differences - -17 -3 - -16 -36
Balance as at 1 January 2019 - -3 357 -2 547 - -1 536 -7 440
Depreciation expense - -171 -101 -1 839 -187 -2 298
Eliminated on disposals of assets - 2 22 - 48 71
Others - 120 - - - 120
Net foreign currency exchange differences - -30 -27 - -11 -68
Balance as at 31 December 2019 - -3 436 -2 653 -1 839 -1 686 -9 614
Carrying amount
As at 31 December 2018 - 343 170 - 293 806
As at 31 December 2019 - 368 359 3 270 596 4 593
(*) Impacted due to the adoption of IFRS 16
64 ZENITEL - ANNUAL REPORT 2019

16. GOODWILL
(thousands of euro) 31 December
Cost 2019 2018
Balance at beginning of year 54 296 54 682
Effect of foreign currency exchange differences 308 -386
Balance at end of year 54 604 54 296
Accumulated impairment losses
Balance at beginning of year -51 050 -51 403
Effect of foreign currency exchange differences -282 353
Balance at end of year -51 332 -51 050
Carrying amount
At the beginning of the year 3 246 3 279
At the end of the year 3 272 3 246
Of which all is related to the SCS Business
Goodwill arising from acquisitions represents the excess of the cost of the acquisition over the fair value of the identifi able assets and liabilities assumed of the acquired subsidiary at the date of acquisition. In accordance with IAS 36, goodwill arising on consolidation is tested annually for impairment or more frequent if there are indications that the goodwill might be impaired, in accordance with IAS 36, Impairment of Assets. This standard also requires that the goodwill should, from the acquisition date, be allocated to each of the cash generating units (CGU’s) or groups of cash generating units that are expected to benefi t from the synergies of the business combination. The CGU’s to which goodwill has been allocated were tested for impairment at the balance-sheet date by comparing the carrying amount of the unit with the recoverable amount (higher of its fair value less cost to sell and its value in use).
In application of the value-in-use method, Zenitel management prepared cash fl ow forecasts for the CGU or group of CGU’s, where the CGU’s are considered to be the Company’s legal entities or business unit. The key assumptions included in the value in use calculation comprise the discount factor and the projected future net cash fl ows on products and services.
The (pre-tax) discount rate applied to cash fl ow projections is the weighted average cost of capital (WACC) of 10.8% (pre-tax 2018: 11.6%). The components for the determination of the WACC are based on sector-specifi c parameters received from various banks and analysts and taking into account the fi nancial position of Zenitel and historical performance of the individual CGU.
A growth rate of 2.0% for 2020 (2019: 23.0%) has been used and the assumed infl ation rate is 1.43% (2019: 2.71%).
Sensitivity analysis shows that 2.6% (2018: 3.6%) is to be subtracted from the growth rate before goodwill is impaired. CGU SCS requires a WACC exceeding 19.9% (2018: 28.7%) before goodwill is impaired.
Management determined these assumptions based on past performance and its expectations with respect to the market development.
The Company cannot predict whether an event that triggers impairment will occur, when it will occur or how it will affect the asset values reported. Zenitel believes that all of its estimates are reasonable: they are consistent with the internal reporting and refl ect management’s best estimates. However, inherent uncertainties exist that management may not be able to control. While a change in estimates used could have a material impact on the calculation of the fair values and trigger an impairment charge, the Company is not aware of any reasonably possible change in key assumptions used that would cause a business unit’s carrying amount to exceed its recoverable amount.
ZENITEL - ANNUAL REPORT 2019 65

17. OTHER INTANGIBLE ASSETS
(thousands of euro) 31 December
CostCapitalized
development, others
Software, licenses Total
Balance at 1 January 2018 6 849 1 074 7 922
- of which internally generated 5 968 - 5 968
- of which externally acquired 881 1 074 1 955
Additions (including internally generated) - 179 179
Net foreign currency exchange differences -64 -6 -70
Balance at 1 January 2019 6 785 1 248 8 031
- of which internally generated 5 909 - 5 909
- of which externally acquired 876 1 248 2 123
Additions (including internally generated) - 120 120
Net foreign currency exchange differences 50 14 64
Balance at 31 December 2019 6 835 1 382 8 215
- of which internally generated 5 952 - 5 952
- of which externally acquired 882 1 382 2 264
Accumulated amortization and impairment
Balance at 1 January 2018 -6 004 -932 -6 935
Amortization expense -684 -134 -818
Net foreign currency exchange differences 77 5 82
Balance at 1 January 2019 -6 611 -1 061 -7 672
Amortization expense -175 -113 -289
Net foreign currency exchange differences -48 -12 -60
Balance at 31 December 2019 -6 835 -1 186 -8 020
Carrying amount
As at 31 December 2018 173 186 360
As at 31 December 2019 - 195 195
Capitalized development costs principally comprise internally generated expenditure on major projects where it is reasonably anticipated that the costs will generate future economic benefi ts.
The amortization expense has been included in the line item ‘Depreciation and amortization expenses’ in the statement of comprehensive income.
Development costs are no longer capitalized since 1 January 2016 – we refer to the Accounting Policies.
66 ZENITEL - ANNUAL REPORT 2019

18. NET IMPAIRMENT ON CURRENT ASSETS
(thousands of euro) 31 December
Continuing operations Notes 2019 2018
Net impairment on inventories 20 -1 401 128
Net impairment on receivables 22 -84 -101
Total impairment on current assets -1 484 27
* In 2018, the net impairment includes the recovery of an amount of 0.1 million euro related to the settlement of a bankruptcy.
19. FINANCIAL ASSETS
(thousands of euro) 31 December
2019 2018Available for sale investments 240 238Total 240 238of which current - -of which non-current 240 238
(thousands of euro) 31 December
Available for sale investments 2019 2018At the beginning of the year 238 240Acquisition - -Disposals - -Impairments - -Net foreign currency exchange differences 2 -2At the end of the year 240 238
(thousands of euro) 31 December
The breakdown of the outstanding balance is as follows: 2019 2018- BNSC - Beijing Nera Stentofon Comm. Equipment (China): 240 238Total 240 238
The available-for-sale investments are accounted at fair value. Fair values are assessed on a regular basis and at the end of 2019, no objective evidence indicates that available-for-sale investments are impaired.
20. INVENTORIES
(thousands of euro) 31 December
2019 2018
Raw materials 1 014 904
Goods purchased for resale 11 634 9 801
Total inventories 12 648 10 705
Total inventory write offs amounted to 1.4 million euro in 2019 (0.1 million euro in 2018). Inventory expenses and impairments are included in the ‘Raw materials and consumables used’ line of the income statement.
ZENITEL - ANNUAL REPORT 2019 67

21. CONTRACTS IN PROGRESS
(thousands of euro) 31 December
2019 2018
Contracts in progress - 83
Total contracts in progress - 83
22. TRADE & OTHER RECEIVABLES
(thousands of euro) 31 December
2019 2018
Trade receivables 14 326 11 916
Allowance for doubtful debts -607 -520
Total 13 719 11 396
OTHER RECEIVABLES
Tax receivables other than income tax 288 256
Income tax receivable - 90
Other receivables 367 274
Total other receivables 655 620
Total trade and other receivables 14 374 12 016
The total amount of trade receivables is presented after deduction of a bad debt allowance of 0.6 million euro(2018: 0.5 million euro). The aging of our current trade and other receivables can be detailed as follows:
(thousands of euro)
Gross amount as
of 31December
2019
Of which: not past
due on the reporting
date
Of which:Net
carrying amount as at 31
December 2019
Past due less than 30 days
Past due between 30 and 59
days
Past due between 60 and 89
days
Past due between
90 and 179 days
Past due between 180 and 359 days
Past due more than 360 days
Valuation allowance
for doubtful debtors
Trade receivables 14 326 7 941 3 662 935 266 893 240 389 -607 13 719
Tax receivables, other than income tax
287 287 - - - - - - - 287
Income tax receivable - - - - - - - - - -
Other receivables 367 367 - - - - - - - 367
Total 14 980 8 595 3 662 935 266 893 240 389 -607 14 374
(thousands of euro)
Gross amount as of 31
December 2018
Of which: not past
due on the reporting
date
Of which:Net
carrying amount as at 31
December 2018
Past due less than 30 days
Past due between 30 and 59 days
Past due between 60 and 89
days
Past due between
90 and 179 days
Past due between 180 and 359 days
Past due more than 360 days
Valuation allowance
for doubtful debtors
Trade receivables 11 916 5 908 3 548 1 189 482 413 225 152 -520 11 397
Tax receivables, other than income tax
256 256 - - - - - - - 256
Income tax receivable 90 90 - - - - - - - 90
Other receivables 274 274 - - - - - - - 274
Total 12 536 6 527 3 548 1 189 482 413 225 152 -520 12 016
The average credit period on sales of goods and services is 67.6 days (2018: 69.4 days). No interest is charged on trade receivables for the fi rst 60 days from the date of the invoice. Thereafter, the interest charged is charged at 2% per annum on the outstanding balance. An estimate is made for doubtful receivables based on a review of all outstanding amounts at the balance sheet date. An allowance is recognized when there is objective evidence that the individual asset is impaired.
68 ZENITEL - ANNUAL REPORT 2019

(thousands of euro) 31 December
Movement of the allowance for doubtful debtors 2019 2018
Balance at beginning of the year -520 -509
Amounts written off during the year -7 53
Amounts recovered during the year 137 17
Decrease / (Increase) in allowance recognized in profi t or loss -209 -81
Translation difference -8 1
Balance at end of year -607 -520
In determining the recoverability of a trade receivable, the Group considers periodically any change in the credit quality of the trade receivable from the date credit was originally granted up to the reporting date. Concentration of credit risk with respect to trade receivables is limited due to the Group’s large number of customers who are internationally dispersed. The two largest customers account for approximately 5.1% and 3.9% respectively of Group net sales. There is no other signifi cant concentration of credit risk. Therefore, management is of the opinion that inherent credit risk in the group’s receivables is limited.
23. CASH AND CASH EQUIVALENTS
(thousands of euro) 31 December
2019 2018
Cash at bank and in hand 20 511 19 576
Short-term bank deposit 820 795
Total cash and cash equivalents 21 331 20 371
The weighted average effective interest rate on short-term bank deposits amounts to -0.215 % (2018: -0.173%).
24. TRADE AND OTHER PAYABLES
(thousands of euro) 31 December
2019 2018
Trade payables 7 396 7 415
Remuneration & staff related liabilities 4 718 3 581
Accrued expenses 1 133 1 367
Advances received on contracts 481 23
Other 1 362 1 487
Other payables 7 695 6 458
Total trade and other payables 15 091 13 873
The fair value of the derivative fi nancial instrument amounted to 0.1 million euro (2018: 0.3 million euro) are included in the line ‘other’. Further information on these fi nancial instruments is given in note 28.
ZENITEL - ANNUAL REPORT 2019 69

25. BORROWINGS
(thousands of euro) 31 December
2019 2018
Non-current
Leasing and similar rights 1 934 61
1 934 61
Current
Used factoring facility 2 231 2 037
Leasing and similar rights 1 447 22
3 678 2 059
Total borrowings 5 612 2 120
31 December
The weighted average interest rate per year amounts to (%): 2019 2018
Leasing and similar rights 1.60 5.26
Used factoring facility 1.30 2.89
Bank borrowings and lease liabilities (originally > 1 year) are payable as follows:
(thousands of euro) 31 December 2019 31 December 2018
Total future payments
Unexpired interest
expenses Present valueTotal future
payments
Unexpired interest
expenses Present value
Not later than one year 3 678 5 3 673 2 059 5 2 054
Between one and fi ve years 1 934 10 1 924 61 13 48
Total 5 612 15 5 597 2 120 18 2 102
NON-CURRENT BORROWINGS
Lease agreements in which Group companies are the lessee, give rise to fi nancial liabilities on the balance sheet.A lessee recognises a right-of-use asset representing its right to use the underlying asset and a lease liability representing its obligation to make lease payments.
CURRENT BORROWINGS
Zenitel Norway AS has a factoring agreement of NOK 35 million (equaling 3.5 million euro). This factoring agreement allows for borrowing up to 80% of the value of customer invoices. As per 31 December 2019, 2.2 million euro of this credit facility was used against 2.0 million euro as per 31 December 2018. The interest rate on this facility on average amounted to 1.3% in 2019 (2.9% in 2018). At the same time, a credit line up to a maximum of 1.9 million euro is available. As per year end of 2019 and 2018, this credit line was not used.
Included in the amount, the company holds lines for bank guarantees at different credit institutions for in total almost 2.8 million euro (2018: 3.1 million euro) of which 1.4 million euro are used to secure the completion of customer contracts.
70 ZENITEL - ANNUAL REPORT 2019

26. RETIREMENT BENEFIT OBLIGATIONS
Some group companies provide pension plans that under IFRS are considered as defi ned benefi t plans for their employees. Provisions for pension obligations are established for benefi ts payable in the form of retirement, disability and surviving dependents’ pensions. The benefi ts offered vary according to legal, fi scal and economic conditions of each country. Benefi ts are dependent on years of service and respective employee’s compensation and contribution.
The obligation resulting from defi ned benefi t pension plans is determined using the projected unit credit method. Gains and losses arising from changes in actuarial assumptions are recognized in other comprehensive income.
Changes in the present value of the defi ned benefi t obligation are as follows:
Assets have been subject to the recoverability test as described by the IAS 19 statement. The assets have only been recognized to the lower sum of the unrecognized actuarial losses and past service costs and the present value of future economic benefi ts available in the form of refunds from the plan or reduction in future contributions of the plan (see adjustments for limit on net asset).
The amounts recognized in the balance sheet are determined as follows:
(thousands of euro) 31 December
2019 2018Present value of funded obligations 1 330 1 276Fair value of plan assets -1 177 -1 153Funded status 153 123Present value of unfunded obligations 265 234Net liability 418 357
Amounts recognized in the balance sheet
Recognized as non current liability / retirement benefi t obligations 418 357Recognized as current liability / retirement benefi t obligations - -Net liability 418 357
The amounts recognized in the income statements are as follows:
(thousands of euro) 31 December
2019 2018Current service cost 18 21Interest costs 14 15Expected return on plan assets -10 -11Total pension costs 22 25
Actual return on plan assets 34 46
The total pension cost as indicated in the table above is included in the Employee benefi ts expense-line of the statement of profi t and loss.
(thousands of euro) 31 December
2019 2018Opening defi ned benefi t obligation as previously reported 1 510 1 645Service cost 18 21Interest cost 14 15Plan participants' contributions 1 1
Actuarial losses (gains) 66 22
Net transfer in/(out) - -
Exchange differences on foreign plans 3 -2
Benefi ts paid -17 -192
Closing defi ned benefi t obligation 1 595 1 510
ZENITEL - ANNUAL REPORT 2019 71

Changes in the fair value of the plan assets are as follows:
(thousands of euro) 31 December
2018 2018
Opening fair value of plan assets 1 153 1 274
Expected return 10 11
Actuarial gains and (losses) 23 35
Contributions by employer 5 26
Plan participants' contributions 1 1
Net transfer in/(out) - -
Exchange differences on foreign plans 2 -2
Benefi ts paid -17 -192
Closing fair value of plans assets 1 177 1 153
The group expects to contribute less than 0.1 million euro to its defi ned benefi t pension plans in 2020.
(thousands of euro) 31 December
2019 2018Defi ned benefi t obligation 1 595 1 510Plan assets 1 177 1 153Surplus/(defi cit) 418 357
The major categories of plan assets, and the expected rate of return at the balance sheet date for each category, is as follows:
(thousands of euro) 31 December
2019 2018
Fair value of plan assets
Debt instruments 656 643
Other 521 510
Weighted average expected return 1 177 1 153
The overall expected rate of return is a weighted average of the expected returns of the various categories of plan assets held. The Directors’ assessment of the expected returns is based on historical return trends and analysts’ predictions of the market for the asset in the next twelve months.
The principal weighted average actuarial assumptions for all plans used were as follows:
31 December
2019 2018
Assumptions to determine benefi t obligations % %
Discount rate 0.42 0.92
Rate of compensation increase 2.37 2.35
Rate of price infl ation 2.00 2.00
72 ZENITEL - ANNUAL REPORT 2019

27. PROVISIONS
(thousands of euro) Technical Guarantees Other Total
On 1 January 2018 785 4 358 5 143
Additions to provisions 18 29 47
Utilization -296 -445 -741
Reversal of provisions -21 - -21
Exchange differences 4 - 4
On 31 December 2018 490 3 942 4 432
Non-current - - -
Current 490 3 942 4 432
Total 490 3 942 4 432
On 1 January 2019 490 3 942 4 432
Additions to provisions 430 1 155 1 586
Utilization - -1 037 -1 037
Reversal of provisions -1 -593 -594
Exchange differences 2 - 2
On 31 December 2019 922 3 467 4 389
Non-current - - -
Current 922 3 467 4 389
Total 922 3 467 4 389
Technical Guarantees
The Group recognizes the estimated liability to repair or replace its products still under warranty at the balance sheet date. This provision is calculated based on the past history of the level of repairs and replacements.
Other
The other provisions cover principally a risk related to legal claims.
Provisions were set up based on the current situation of the different fi les, in order to cover risks linked to some of these litigations.
28. FINANCIAL INSTRUMENTS
The directors consider that the carrying amounts of fi nancial assets and fi nancial liabilities recognized at amortized costs in the fi nancial statements approximate their fair values.
Valuation techniques and assumptions applied for the purposes of measuring fair value
The fair values of fi nancial assets and fi nancial liabilities are determined as follows:
• The fair values of fi nancial assets and fi nancial liabilities are determined as follows.
• The fair values of fi nancial assets and fi nancial liabilities with standard terms and conditions and traded on active liquid markets are determined with reference to quoted market prices (includes listed redeemable notes, bills of exchange, debentures and perpetual notes).
• The fair values of other fi nancial assets and fi nancial liabilities (excluding derivative instruments) are determined in accordance with generally accepted pricing models based on discounted cash-fl ow analysis using prices from observable current market transactions and dealer quotes for similar instruments.
• The fair values of derivative instruments are calculated using quoted prices. Where such prices are not available, a discounted cash-fl ow analysis is performed using the applicable yield curve for the duration of the instruments for non-optional derivatives, and option pricing models for optional derivatives. Foreign currency forward contracts are measured using quoted forward exchange rates and yield curves derived from quoted interest rates matching maturities of the contracts. Interest rate swaps are measured at the present value of future cash fl ows estimated and discounted based on the applicable yield curves derived from quoted interest rates.
ZENITEL - ANNUAL REPORT 2019 73

The following table provides an overview of the carrying values and classes of fi nancial instruments that are measured subsequent to initial recognition at fair value, grouped into Levels 1 to 3, based on the degree to which the fair value is observable:
• Level 1 fair value measurements are those derived from quoted prices (unadjusted) in active markets for identical assets or liabilities;
• Level 2 fair value measurements are those derived from inputs other than quoted prices included within Level 1 that are observable for the asset or liability, either directly (i.e., as prices) or indirectly (i.e., derived from prices); and
• Level 3 fair value measurements are those derived from valuation techniques that include inputs for the asset or liability that are not based on observable market data (unobservable inputs).
(thousands of euro) 31 December 2019 31 December 2018
Carrying value
Fair value
Carrying value
Fair value Level Balance sheet caption
Financial assets available for sale 240 240 238 238 Financial assets
Available for sale investments 240 240 238 238 3 Financial assets
Loans and receivables 14 374 14 374 12 016 12 016
Trade receivables 13 719 13 719 11 396 11 396 3Trade and
other receivables
Other receivables 655 655 620 620 3Trade and
other receivables
Financial liabilities at amortized cost 20 703 20 703 15 993 15 993
Borrowings and lease liabilities 5 612 5 612 2 120 2 120 3Borrowings and lease
liabilities LT and ST
Trade payables 7 396 7 396 7 415 7 415 3 Trade and other payables
Other payables 7 695 7 695 6 458 6 458 3 Trade and other payables
NET FAIR VALUES OF DERIVATIVE FINANCIAL INSTRUMENTS
The derivatives are not part of a hedging relationship that qualifi es for hedge accounting. Consequently, changes in fair value are recognized in the income statement.
Since most of the Norwegian business is export in the euro currency, Zenitel Norway AS has a NOK defi cit and a euro surplus. The company has put in place short-term FX forward contracts that secure the needed exchange between EUR/NOK on a rolling 12-month basis. The fair value of these contracts amounts to 0.1 million euro (2018: 0.3 million euro) at 31 December 2019.
29. CONTINGENCIES
During the normal course of business, the Company and its subsidiaries are party to various legal claims and complaints resulting in contingent liabilities with uncertainty on timing and/or amount. The contingent liabilities relate to possible obligations with respect to old projects, soil contamination, warranties given and redundancies. No further overview or quantifi cation of the contingencies is being disclosed, since it is not practicable to do so.
74 ZENITEL - ANNUAL REPORT 2019

30. COMMITMENTS
LEASE COMMITMENTS – WHERE A GROUP COMPANY IS THE LESSEE.
The future aggregate minimum lease payments under non-cancelable operating lease are as follows:
(thousands of euro) 31 December
2019 2018
Not later than 1 year 1 559 1 738
Later than 1 year and not later than 5 years 2 257 2 295
Later than 5 years 18 -
Total Lease Commitments 3 834 4 033
Effect from discounting and low value assets -564 -92
Total Lease liabilities under IFRS 16 3 270 3 941
Operating lease agreements relate to offi ce premises, site rents, car lease and IT equipment.
COMMITMENTS FOR EXPENDITURE BY GROUP COMPANIES
The Group has no signifi cant purchase commitments, apart from the lease commitments indicated above.
31. ORDINARY SHARES, TREASURY SHARES & WARRANTS
The total number of Zenitel shares on 31 December 2019 amounted to 3,310,884.
Ordinary shares & treasury shares:
Number of ordinary shares Treasury shares Total
On 31 December 2017* 3 305 063 5 821 3 310 884
On 31 December 2018 3 310 884 - 3 310 884
On 31 December 2019 3 308 384 2 500 3 310 884
Weighted average number of ordinary shares for the purposes of basic earnings per share (all measures)
3 308 384
(*) Restated due to the 1-for-10 Reverse share split in May 2017.
All issued shares are fully paid. Shares have no par value.The total authorized capital is per 31 December 2019 euro 20,000,000.
Warrants were granted in the past to directors and to employees.However there are no warrants outstanding anymore as at year end 2019.
32. MOVEMENT IN WORKING CAPITAL
(thousands of euro) 31 December
Notes Notes 2019 2018
Movements in working capital:
(Increase) / decrease in trade and other receivables -2 442 - 1 265
(Increase) / decrease in inventories -3 344 -1 790
(Increase) / decrease contract work in progress 83 97
(Increase) / decrease in other assets 204 -281
Increase / (decrease) in trade and other payables 1 217 2 901
Increase / (decrease) in provisions and retirement benefi t obligations -43 -770
Effect of exchange rate changes on working capital components* 70 -159
Total movement in working capital -4 255 -1 267
* The components of working capital were mainly impacted by currency translation effect due to the NOK/EUR conversion in 2019 and 2018.
ZENITEL - ANNUAL REPORT 2019 75

33. RELATED-PARTY TRANSACTIONS
Transactions between the Company and its subsidiaries, which are related parties of the Company, have been eliminated on consolidation and are not disclosed in this note. Details of transactions between the Group and other related parties are disclosed below.
A) Landlord of offi ce building in Zellik
3D NV is one of the reference shareholders of the Zenitel Group and is the landlord of the building in which Zenitel NV has its offi ces in Zellik (Belgium) . The rent charged by 3D NV to Zenitel NV is determined on an at arms’ length basis and amounts to 22 K euro per year.
B) BNSC and Zenitel UK
In 2019, the group sold goods to the related parties BNSC and Zenitel UK for a total of 1.8 million euro (2018: 1.8 million euro). The receivables related to these sales amounted to 0.3 million euro at 31 December 2019 (2018: 0.3 million euro).
C) Directors’ remuneration
(thousands of euro) 31 December
2019 2018
Directors’ remuneration 174 163
D) Key management remuneration
(thousands of euro) 31 December
KEY MANAGEMENT REMUNERATION* 2019 2018
Short term employee benefi ts 536 453
Post-employment benefi ts 24 37
Other long-term benefi ts - -
Share-based payments (see warrants above) - -
Termination benefi ts - -
TOTAL KEY MANAGEMENT REMUNERATION(cost to the Company)**
560 490
KEY MANAGEMENT - AVERAGE FTE 2.0 2.0
The CEO’s total remuneration package for 2019 amounted to 0.2 million euro fi xed remuneration and 0.1 million euro variable remuneration. Remuneration of directors and key executives is determined by the remuneration committee in having regard to the performance of individuals and market trends. Remuneration to the Key Management is made in NOK. Amounts for both years are converted to euro with a NOK/EUR rate of 9.85.* The presented amounts include social charges, car expenses, pension costs and fi xed representation allowances paid by the Company.
** See also the Remuneration Report included in the chapter ‘Declaration with regards to Corporate Governance’ in this Annual Report.
76 ZENITEL - ANNUAL REPORT 2019

34. PRINCIPAL SUBSIDIARY UNDERTAKINGS
Europe Ownership Country of incorporation
Zenitel Norway AS 100 % Norway
Nor Electronics AS 100 % Norway
Zenitel Denmark A/S 100 % Denmark
Zenitel Etronic ApS 100 % Denmark
Zenitel Finland Oy 100 % Finland
Zenitel France S.A. 100 % France
Zenitel Italy SRL 100 % Italy
Zenitel Finance Netherlands B.V. 100 % Netherlands
Zenitel Mediterranean d.o.o. 100% Croatia
Zenitel UK Ltd. 15 % United Kingdom
North America Country of incorporation
Zenitel USA Inc 100 % United States
Zenitel USA Marine Inc 100 % United States
Rest of World Country of incorporation
Zenitel Marine Asia Pte. Ltd. 100 % Singapore
BNSC (China) 10 % China
35. POST BALANCE-SHEET EVENTS
The Company has no events to report after the balance-sheet date.
ZENITEL - ANNUAL REPORT 2019 77

Besloten vennootschapSociété à responsabilité limitéeRPR Brussel – RPM Bruxelles - B.T.W. – T.V.A. BE 0446.334.711 – IBAN N° BE71 2100 9059 0069*handelend in naam van een vennootschap/agissant au nom d’une société
A member firm of Ernst & Young Global Limited
’
78 ZENITEL - ANNUAL REPORT 2019

ZENITEL - ANNUAL REPORT 2019 79

80 ZENITEL - ANNUAL REPORT 2019

ZENITEL - ANNUAL REPORT 2019 81

82 ZENITEL - ANNUAL REPORT 2019

ZENITEL - ANNUAL REPORT 2019 83

EXTRACT FROM THE BELGIAN GAAP NON-CONSOLIDATED FINANCIAL STATEMENTS OF ZENITEL NV
BALANCE SHEET AFTER APPROPRIATION
(thousands of euro) 31 December
ASSETS 2019 2018
Fixed assets 38 979 38 979
Formation expenses - -
Intangible assets - -
Tangible assets - -
Financial assets 38 979 38 979
Current assets 4 962 5 094
Amounts receivable more than one year - -
Amounts receivable within one year 445 627
Cash at bank and in hand 4 509 4 454
Deferred charges and accrued income 8 13
TOTAL ASSETS 43 941 44 073
(thousands of euro) 31 December
EQUITY AND LIABILITIES 2019 2018
Capital and reserves 40 673 39 497
Issued capital 20 000 20 000
Share premium account 5 624 5 624
Reserves 11 249 11 190
Result carried forward 3 800 2 683
Provisions and deferred taxation 2 580 4 090
Pensions and similar obligations 152 149
Other liabilities and charges 2 428 3 941
Creditors 688 486
Amounts payable after one year - -
Amounts payable within one year 486 486
Current portion of amounts payable after one year - -
Financial debt - -
Suppliers 388 361
Taxes, remuneration and social security 300 125
Other amounts payable - -
Accrued charges and deferred income - -
TOTAL EQUITY AND LIABILITIES 43 941 44 073
84 ZENITEL - ANNUAL REPORT 2019

INCOME STATEMENT AND RESULT APPROPRIATION
(thousands of euro) 31 December
2019 2018
Operating income 1 553 1 330
Turnover - -
Other operating income 1 553 1 330
Operating Charges -378 -780
Services and other goods -872 -775
Remuneration, social security costs and pension costs -1 017 -494
Depreciation of and other amounts written off formation expenses, intangible and tangible fi xed assets
- -
Decrease in provisions for obsolete inventory and doubtful customer receivables - -
Decrease/(increase) in provisions for liabilities and charges 1 511 493
Other operating charges - -4
Operating profi t / (loss) 1 175 550
Financial income 4 2
Income from fi nancial fi xed assets 4 2
Income from current assets - -
Other fi nancial income - -
Financial charges -3 -3
Interest and other debt charges - -
Write offs of current assets excluding inventory and customer receivables: addition (-); reversal (+) - -
Other fi nancial charges -3 -3
Profi t / (loss) on ordinary activities before taxes 1 176 549
Extraordinary income - -
Reversal of provisions for exceptional risks and charges - -
Other extraordinary income - -
Extraordinary charges - -
Provisions for extraordinary liabilities and charges (increase: -, decrease: +) - -
Other extraordinary charges - -
Profi t / (loss) for the period before taxes 1 176 549
Income taxes - -
Income taxes (-) - -
Adjustment of income taxes & write-back of tax provisions - -
Profi t / (loss) for the period 1 176 549
Profi t / (loss) for the period available for appropriation 1 176 549
Profi t / (loss) to be appropriated 1 176 549
Profi t / (loss) for the period available for appropriation 1 176 549
Profi t / (loss) brought forward - -
Profi t / (loss) to be carried forward 1 176 549
The fi nancial information presented in this caption is an extract of the non-consolidated fi nancial statements of Zenitel NV. The complete version of the statutory non-consolidated fi nancial statements, together with the report of the Board of Directors and the report of the statutory auditor will be deposited at the National Bank of Belgium in Dutch in the month following the General Assembly.
These fi nancial statements were prepared in conformance with the accounting and reporting laws and regulations applicable in Belgium (“Belgian GAAP”).
DIVIDEND POLICY
No dividend payments are planned.
LEGAL AND ARBITRATION PROCEEDINGS
We refer to the section on contingencies in the consolidated fi nancial statements.
ZENITEL - ANNUAL REPORT 2019 85

CONTACT INFORMATION
This Annual Report 2019 will be made available to investors at no cost at the registered offi ce of Zenitel NV,Z.1 Research Park 110, 1731 Zellik, Belgium. This Annual Report is also available via the internet on the following website: www.zenitel.com under ‘Investor Relations’.
Zenitel has arranged for an electronic Dutch translation of this Annual Report 2019 and takes responsibility for consistency between the texts in these two language versions. Should there be any difference of interpretation between the English and the Dutch language versions, then the English language version alone is legally binding.
COMPANY DOCUMENTS
The articles of association of Zenitel, the Annual Report, the interim reports, the press releases and the annual information can be found on the Company’s website referred to above. A copy of these and of any document referred to in this Annual Report, that is available for public consultation, can be obtained at no cost at the registered offi ce of the Company. The historical consolidated fi nancial information of Zenitel and its subsidiary undertakings for each of the four fi nancial years preceding the publication of this Annual Report can be found on the website referred to above or can be obtained at no cost at the registered offi ce of Zenitel NV.
To obtain information on Zenitel, please contact:
Johan Meersman Mark Küpers, CFO Koen Claerbout, CEO+ 32 2 895 22 22 + 47 40 00 25 00 + 32 2 895 22 22
Zenitel NV, Z.1. Research Park 110, B-1731, Zellik, Belgium, VAT BE 0403 150 608 - RPR [email protected] – www.zenitel.com
The Annual Report 2019 is also available on www.zenitel.com (investor relations > fi nancial reports)as from 27 March 2020.Het jaarverslag 2019 is ook verkrijgbaar in het Nederlands op www.zenitel.com (investor relations > fi nancial reports) vanaf 27 maart 2020.
RESPONSIBILITY FOR AUDITING THE ACCOUNTS
The consolidated and statutory annual accounts of the Company as at and for the period ended on 31 December 2019, prepared respectively in accordance with the International Financial Reporting Standards (IFRS) andthe Belgian Generally Accepted Accounting Principles, have been audited by EY Bedrijfsrevisoren BV,De Kleetlaan 2, 1831 Diegem, represented by Mr. Marnix Van Dooren.
RESPONSIBILITY FOR THE CONTENTS OF THE ANNUAL REPORT
To the best of our knowledge, the fi nancial statements have been prepared in accordance with the applicable set of accounting standards and give a true and fair view of the assets, liabilities, fi nancial position and profi t and loss. The report of the Board of Directors includes a fair review of the development and performance of the business and the position of the Company and the undertakings included in the consolidation taken as a whole, together with a description of the principal risks and uncertainties the Company faces.
Koen Claerbout Mark KüpersCEO CFO
86 ZENITEL - ANNUAL REPORT 2019

ZENITEL - ANNUAL REPORT 2019 87

BELGIUMZenitel NV (Head Offi ce)Z.1 Research Park Zellik 110 BE-1731 Zellik S +32 2 895 22 22 T +32 2 370 51 19 [email protected]
BRAZILRua Florianopolis1360 Bloco 1 Apt. 207Praça Seca - Rio de Janeiro Cep 21321-050, BRS +55 21 8440 [email protected]
CROATIAZenitel Mediterranean d.o.o.Put Brace Honovica 6HR-51414 Icici/OpatijaS +385 51 29 19 10T +385 51 29 25 [email protected]
DENMARKZenitel Denmark A/SHerstedøstervej 27-29ADK-2620 AlbertslundS +45 43 43 74 11T +45 43 43 75 [email protected]
Zenitel Etronic ApSRødeledsvej 95DK-5700 SvendborgS +45 62 21 38 50T +45 62 22 45 [email protected]
FINLANDZenitel Finland OyOlarinluoma 14 FI-02200 EspooS +358 20 7792270 T +358 20 7792271info.fi [email protected]
FRANCEZenitel France SAParc d’activité du Petit Nanterre6 rue des MargueritesFR-92737 Nanterre cedexS +33 1 47 88 50 00T +33 1 43 34 50 [email protected]
GERMANYLangeoogstraße 6DE-26603 AurichS +49 4941 6976 720T +49 4941 6976 [email protected]
INDIA#6, Lottegolla HalliRMV II StageBangalore 560 094S +91-80-2341 1629S ++91-80-2351 1897
ITALYZenitel Italia SRLViale Brianza 181IT-20092 Cinisello Balsamo MIS +39 02 3860 82 37T +39 02 61 24 71 [email protected]
THE NETHERLANDSZenitel Finance Netherlands BVVendelier 35NL-3905PB VeenendaalS +31 36 54 62 600Fax. +31 36 54 62 [email protected]
NORWAYOsloZenitel Norway ASSandakerveien 24C NO-0473 OsloP.O. Box 1068 BekkajordetNO-3194 HortenS +47 40 00 25 00Fax. +47 22 37 85 [email protected]
HortenZenitel Norway ASBromsveien 17 3183 HortenP.O. Box 1068 BekkajordetNO-3194 Horten S +47 40 00 25 00 T +47 33 03 16 [email protected]
TrondheimZenitel Norway ASIngvald Ystgaards vei 3A NO-7047 TrondheimS +47 40 00 25 00 T +47 73 90 53 [email protected]
Nor Electronics ASP.O. Box 2151Verkstedveien 2BNO-6517 KristiansundS +47 715 88070T +47 715 [email protected]
SINGAPOREZenitel Marine Asia Pte. Ltd.69 Ubi Crescent #05-cSG-408561 SingaporeS +65 63 83 0200T +65 63 83 [email protected]
UNITED ARAB EMIRATESZenitel Norway AS DMCC BranchUnit 4503 -18 & 19, 45th Floor BB2 Mazaya Business AvenueJumeirah Lakes TowersP.O Box – 111587Dubai, UAES +971 4 567 0715/0716T +971 4 432 [email protected]
USAZenitel USA Inc.6119 Connecticut Ave.Kansas City, MO 64 120S +1 816 231 7200T +1 816 231 [email protected]
Zenitel USA Marine Inc.5621 Salmen StNew OrleansLA [email protected]
www.zenitel.com