zbornik veleučilišta u rijeci – journal of the polytechnic of rijeka
510
-
Upload
khangminh22 -
Category
Documents
-
view
6 -
download
0
Transcript of zbornik veleučilišta u rijeci – journal of the polytechnic of rijeka


ZBORNIK VELEUČILIŠTA U RIJECI – JOURNAL OF THE POLYTECHNIC OF RIJEKA

Izdavač – Published byVELEUČILIŠTE U RIJECI - POLYTECHNIC OF RIJEKA
Trpimirova 2/V, 51000 RijekaHrvatska - Croatia
Za izdavača – For the PublisherDr. sc. SAŠA HIRNIG, prof. v. š.
Urednički odbor – Editorial Board
Glavni i odgovorni urednik – Editor-in-ChiefDr. sc. SAŠA HIRNIG, prof. v. š.
Izvršni urednici – Executive EditorsDr. sc. EDA RIBARIĆ ČUČKOVIĆ, v. pred.
Mr. sc. MAJA GLIGORA MARKOVIĆ, v. pred.
Autori snose odgovornost za jezičnu ispravnost teksta. Uredništvo časopisa odbacuje odgovornost za jezične i tiskarske pogreške.The authors are responsible for language editing. Editorial Board disclaims responsibility for language and printing errors.
Časopis izlazi jedanput godišnje – Journal is issued once a yearPretplata - The annual subscription: 120,00 kn (16 €)
Radovi objavljeni u časopisu dostupni su na Portalu hrvatskih znanstvenih i stručnih časopisa – HRČAK Papers published in the Journal are available through Portal of scientific journals of Croatia - HRČAK
http://hrcak.srce.hr/zbornik-veleriČasopis je indeksiran u bibliografskoj bazi Emerging Sources Citation Index (ESCI) - Web of Science Core Collection i bazi ERIH
PLUS (European Reference Index for the Humanities and Social Sciences) te je uključen u Norwegian Register for Scientific Journals, Series and Publishers (the Nordic List)
The Journal is indexed by the Emerging Sources Citation Index (ESCI) - Web of Science Core Collection and ERIH PLUS (European Reference Index for the Humanities and Social Sciences) and it is included in the Norwegian Register for Scientific Journals, Series and
Publishers (the Nordic List)
Oblikovanje naslovnice – Cover Design: SLAVIŠA SRDIĆTisak – Printed by: Chamango, obrt za dizajn
Naklada – Edition: 150 primjeraka – copies
Adresa Uredništva – Editorial Board AddressVeleučilište u Rijeci – Zbornik Veleučilišta u Rijeci,Vukovarska 58, 51000 Rijeka, Hrvatska, tel.: ++385 51 321 300;
faks.: ++385 51 211 270; e-mail: [email protected]; https://student.veleri.hr/zbornik/
ISSN 1848-1299 eISSN 1849-1723
Dijelovi objavljenih radova smiju se koristiti za osobnu ili edukacijsku svrhu uz poštovanje autorskih prava autora i izdavača
Dr. sc. SAŠA HIRNIG, Veleučilište u Rijeci, Rijeka, Hrvatska; Dr. sc. DUŠAN RUDIĆ, Veleučilište u Rijeci, Rijeka, Hrvatska; Dr. sc. EDA RIBARIĆ ČUČKOVIĆ, Veleučilište u Rijeci, Rijeka, Hrvatska; Dr. sc. SANJA RASPOR JANKOVIĆ, Veleučilište u Rijeci, Rijeka, Hrvatska; Dr. sc. LJERKA TOMLJENOVIĆ, Veleučilište u Rijeci, Rijeka, Hrvatska; Mr. sc. ANITA STILIN, Veleučilište u Rijeci, Rijeka, Hrvatska; Dr. sc. DAVOR ŠIROLA, Veleučilište u Rijeci, Rijeka, Hrvatska; Doc. dr. sc. IVAN POGARČIĆ, Veleučilište u Rijeci, Rijeka, Hrvatska; Izv. prof. dr. sc. ALEN JAKUPOVIĆ, Veleučilište u Rijeci, Rijeka, Hrvatska; Dr. sc. IVICA BARIŠIĆ, Veleučilište u Rijeci, Rijeka, Hrvatska; Prof. dr. sc. BOJAN HLAČA, Veleučilište u Rijeci, Rijeka, Hrvatska;ERIKA GRŽIN, Veleučilište u Rijeci, Rijeka, Hrvatska; IVAN GRAKALIĆ, Rijeka, Hrvatska; Dr. sc. MARIO STAVER, Veleučilište u Rijeci, Rijeka, Hrvatska;Dr. sc. DAMIR ŠEKULJA, Veleučilište u Rijeci, Rijeka, Hrvatska; Dr. sc. SINIŠA PETROVIĆ, Veleučilište u Rijeci, Rijeka, Hrvatska; Mr. sc. MAJA GLIGORA MARKOVIĆ, Medicinski fakultet, Sveučilište u Rijeci, Rijeka, Hrvatska; Dr. sc. NATAŠA ZRILIĆ, Grad Rijeka, Rijeka, Hrvatska;
Prof. dr. sc. ALEKSANDRA DELUKA TIBLJAŠ, Građevinski fakultet, Sveučilište u Rijeci, Rijeka, Hrvatska;PhD NATAŠA BOŠKIĆ, Faculty of Education, Learning & Technology Services, The University of British Columbia, Vancouver, Canada; Prof. Dr. Ing. HERBERT SONNTAG, Technical University of Applied Sciences, Wildau, Germany; PhD RAMIZ KIKANOVIĆ, Full Prof., University „Vitez“, Vitez, Bosnia and Herzegovina; PhD MAJA MEŠKO, Full Prof., Faculty of Management Koper, University of Primorska, Koper , Slovenia;PhD ŽIGA ČEPAR, Assoc. Prof., Faculty of Management Koper, University of Primorska, Koper , Slovenia;PhD TOMAŽ TOLLAZI, Full Prof., Faculty of Civil Engineering, Transportation Engineering and Architecture, University of Maribor, Maribor, Slovenia;PhD MARKO RENČELJ, Assoc. Prof., Faculty of Civil Engineering, Transportation Engineering and Architecture, University of Maribor, Maribor, Slovenia;PhD MICHAEL HENRY BÖHME, Department of Horticultural Plant Systems, Faculty of Life Sciences, Humboldt Universität zu Berlin, Berlin, GermanyPhD MUHAMMAD AKRAM, Mary MacKillop Institute for Health Research, Faculty of Health Sciences, Australian Catholic University, Melbourne, Australia
Creative Commons Attribution – NonCommercial 4.0 International License
UDK 378.4(497.5 Rijeka)(05) ISSN 1848-1299 (tisak) ISSN 1849-1723 (online)
ZBORNIK VELEUČILIŠTA U RIJECI
Vol. 8 (2020), No. 1
RIJEKA, 2020.


Zbornik Veleučilišta u Rijeci – Journal of the Polytechnic of RijekaVol. 8 (2020), No. 1, Rijeka, 2020. ISSN 1848-1299 (tisak) ISSN 1849-1723 (online)
SADRŽAJ
DRUŠTVENE ZNANOSTI
Željko MateljakUTJECAJ SPOLNE ZASTUPLJENOSTI U UPRAVLJAČKIM POZICIJAMA NA PROFITABILNOST VELIKIH PODUZEĆA U REPUBLICI HRVATSKOJ (Izvorni znanstveni rad) . . . . . . . . . . . . . . . . . . . . . . . . . . . . . . . . . . . . . . . . . . . . . . . . . . . . . . . . . . . . . . . . . . . . . . . . . . . 1-17
Maja Gregorić, Tea Baldigara ARTIFICIAL NEURAL NETWORKS IN MODELLING SEASONAL TOURISM DEMAND – CASE STUDY OF CROATIA (Izvorni znanstveni rad) . . . . . . . . . . . . . . . . . . . . . . . . . . . . . . . . . . . . . . . . . . . . . . . . . . . . . . . . . . . . . . . . . . . . . . . . . .19-39
Igor Banović, Helena Blažić, Saša Drezgić UTJECAJ POREZA NA DOBIT NA KRETANJE IZRAVNIH STRANIH ULAGANJA UZEMLJAMA ČLANICAMA EUROPSKE UNIJE (Izvorni znanstveni rad) . . . . . . . . . . . . . . . . . . . . . . . . . . . . . . . . . . . . . . . . . . . . . . . . . . . . . . . . . . . . . . . . . . . . . . . . . .41-58
Sandra Pepur, Dujam Kovač, Marijana Ćurak FACTORS BEHIND TRADE CREDIT FINANCING OF SMEs IN CROATIA (Izvorni znanstveni rad) . . . . . . . . . . . . . . . . . . . . . . . . . . . . . . . . . . . . . . . . . . . . . . . . . . . . . . . . . . . . . . . . . . . . . . . . . .59-76
Jelena Mušanović MODELIRANJE UTJECAJA UGLEDA TURISTIČKE DESTINACIJE PRISUTNOG U DRUŠTVENIM MEDIJIMA NA ZADOVOLJSTVO TURISTA(Izvorni znanstveni rad) . . . . . . . . . . . . . . . . . . . . . . . . . . . . . . . . . . . . . . . . . . . . . . . . . . . . . . . . . . . . . . . . . . . . . . . . .77-101
Marija Martinović, Katija Vojvodić, Ana Pušić KULTURULOŠKI ASPEKTI POSLOVNOG PREGOVARANJA MENADŽERA HRVATSKIH PODUZEĆA (Izvorni znanstveni rad) . . . . . . . . . . . . . . . . . . . . . . . . . . . . . . . . . . . . . . . . . . . . . . . . . . . . . . . . . . . . . . . . . . . . . . . 103-119
Jelena Jardas Antonić, Kristina Kregar, Nenad Vretenar DATA ENVELOPMENT ANALYSIS IN MEASURING THE EFFICIENCY OF VOLLEYBALL TEAMS IN PRIMORSKO-GORANSKA COUNTY (Izvorni znanstveni rad) . . . . . . . . . . . . . . . . . . . . . . . . . . . . . . . . . . . . . . . . . . . . . . . . . . . . . . . . . . . . . . . . . . . . . . . 121-134

Zbornik Veleučilišta u Rijeci – Journal of the Polytechnic of RijekaVol. 8 (2020), No. 1, Rijeka, 2020. ISSN 1848-1299 (tisak) ISSN 1849-1723 (online)
Sanela Ravlić, Jerko Glavaš, Mislav ŠimunićTHE IMPACT OF THE IPA CROSS-BORDER CO-OPERATION HUNGARY - CROATIA 2007 – 2013 PROGRAMME - INFRASTRUCTURE, TOURISM AND HUMAN CAPITAL(Izvorni znanstveni rad) . . . . . . . . . . . . . . . . . . . . . . . . . . . . . . . . . . . . . . . . . . . . . . . . . . . . . . . . . . . . . . . . . . . . . . . 135-149
Robert Rusielik, Beata SzczecińskaTECHNICAL EFFICIENCY OF AGRICULTURE IN EU COUNTRIES (Izvorni znanstveni rad) . . . . . . . . . . . . . . . . . . . . . . . . . . . . . . . . . . . . . . . . . . . . . . . . . . . . . . . . . . . . . . . . . . . . . . . 151-168
Davor ŠirolaDETERMINANTS OF ENTREPRENEURIAL INTENTIONS: EMPIRICAL EVIDENCE FROM CROATIAN PERSPECTIVE (Izvorni znanstveni rad) . . . . . . . . . . . . . . . . . . . . . . . . . . . . . . . . . . . . . . . . . . . . . . . . . . . . . . . . . . . . . . . . . . . . . . . 169-187
Ana-Marija Vrtodušić Hrgović, Kristina Črnjar, Ivana Škarica EMPLOYEE ENGAGEMENT AND IMPROVEMENT AS IMPORTANT PRINCIPLES OF TQM IN PUBLIC HEALTH INSTITUTES(Izvorni znanstveni rad) . . . . . . . . . . . . . . . . . . . . . . . . . . . . . . . . . . . . . . . . . . . . . . . . . . . . . . . . . . . . . . . . . . . . . . . 189-201
Valentina Đurek, Claudia Sedda PRIMJENA METODA ODLUČIVANJA U LOKALNOJ SAMOUPRAVI (Prethodno priopćenje). . . . . . . . . . . . . . . . . . . . . . . . . . . . . . . . . . . . . . . . . . . . . . . . . . . . . . . . . . . . . . . . . . . . . . . . 203-226
Goran Karanović, Ana Štambuk, Davor Jagodić PROFITABILITY PERFORMANCE UNDER CAPITAL STRUCTURE AND OTHER COMPANY CHARACTERISTICS: AN EMPIRICAL STUDY OF CROATIAN HOTEL INDUSTRY(Prethodno priopćenje). . . . . . . . . . . . . . . . . . . . . . . . . . . . . . . . . . . . . . . . . . . . . . . . . . . . . . . . . . . . . . . . . . . . . . . . 227-242
Rejhan Sulejman THE INFLUENCE OF ENTREPRENEURSHIP IN YOUTH UNEMPLOYMENT IN TRANSITION AND MENA COUNTRIES(Prethodno priopćenje). . . . . . . . . . . . . . . . . . . . . . . . . . . . . . . . . . . . . . . . . . . . . . . . . . . . . . . . . . . . . . . . . . . . . . . . 243-251
Vlatka Bilas WHAT IS THE RELATIONSHIP BETWEEN FDI AND ECONOMIC GROWTH? EVIDENCE FROM EU15 COUNTRIES(Prethodno priopćenje). . . . . . . . . . . . . . . . . . . . . . . . . . . . . . . . . . . . . . . . . . . . . . . . . . . . . . . . . . . . . . . . . . . . . . . . 253-281
Vedran Šarlija, Vesna Buterin, Denis Buterin UTJECAJ SEZONSKIH OSCILACIJA NA KRETANJA CIJENE DIONICA U SEKTORU TURIZMA(Prethodno priopćenje). . . . . . . . . . . . . . . . . . . . . . . . . . . . . . . . . . . . . . . . . . . . . . . . . . . . . . . . . . . . . . . . . . . . . . . . 283-293

Zbornik Veleučilišta u Rijeci – Journal of the Polytechnic of RijekaVol. 8 (2020), No. 1, Rijeka, 2020. ISSN 1848-1299 (tisak) ISSN 1849-1723 (online)
Dejan Miljenović, Goran Kutnjak, Pavle Jakovac DETERMINIRANJE OBILJEŽJA DJELOTVORNOSTI JAVNOG SEKTORA I JAVNOG MENADŽMENTA (Pregledni rad) . . . . . . . . . . . . . . . . . . . . . . . . . . . . . . . . . . . . . . . . . . . . . . . . . . . . . . . . . . . . . . . . . . . . . . . . . . . . . . . . 295-311
Nikolina Ljubičić, Danijela Jakšić, Patrizia Poščić NAPADI UBACIVANJEM SQL IZRAZA – PREVENCIJA I OBRANA(Pregledni rad) . . . . . . . . . . . . . . . . . . . . . . . . . . . . . . . . . . . . . . . . . . . . . . . . . . . . . . . . . . . . . . . . . . . . . . . . . . . . . . . . 313-330
Dora Naletina, Mate Damić, Luka Meštrović ZADOVOLJSTVO MLADIH KORISNIKA USLUGAMA PAKETNIH DOSTAVLJAČA U REPUBLICI HRVATSKOJ (Pregledni rad) . . . . . . . . . . . . . . . . . . . . . . . . . . . . . . . . . . . . . . . . . . . . . . . . . . . . . . . . . . . . . . . . . . . . . . . . . . . . . . . . 331-351
Sandra Bailoa, Pedro Cravo STRATEGIC TOURISM PLANNING IN PORTUGAL: CHALLENGES FOR THE NATIONAL TOURISM DEVELOPMENT(Pregledni rad) . . . . . . . . . . . . . . . . . . . . . . . . . . . . . . . . . . . . . . . . . . . . . . . . . . . . . . . . . . . . . . . . . . . . . . . . . . . . . . . . 353-374
Domagoj Šantek, Sandra Debeljak, Rui Isidoro OCCUPATIONAL HEALTH AND SAFETY SPECIALIST IN CROATIAN AND PORTUGUESE LEGISLATION(Pregledni rad) . . . . . . . . . . . . . . . . . . . . . . . . . . . . . . . . . . . . . . . . . . . . . . . . . . . . . . . . . . . . . . . . . . . . . . . . . . . . . . . . 375-391
TEHNIČKE ZNANOSTI
Kristina Dundović, Stela Stašić RAD NA SIGURAN NAČIN U SKUČENIM PROSTORIMA(Pregledni rad) . . . . . . . . . . . . . . . . . . . . . . . . . . . . . . . . . . . . . . . . . . . . . . . . . . . . . . . . . . . . . . . . . . . . . . . . . . . . . . . . 395-412
Robert Obajdin, Goranka Štimac Rončević, Sanjin Braut UTJECAJ DODATNOG TERETA NA DINAMIKU POLOVINSKOG MODELA VOZILA PRI PRELASKU PREKO UMJETNE IZBOČINE(Stručni rad) . . . . . . . . . . . . . . . . . . . . . . . . . . . . . . . . . . . . . . . . . . . . . . . . . . . . . . . . . . . . . . . . . . . . . . . . . . . . . . . . . . 413-426
Barbara Rudić, Erika Gržin RAZVOJ KONTEJNERIZACIJE U SVIJETU I ANALIZA KONTEJNERSKOG PROMETA U LUCI RIJEKA (Stručni rad) . . . . . . . . . . . . . . . . . . . . . . . . . . . . . . . . . . . . . . . . . . . . . . . . . . . . . . . . . . . . . . . . . . . . . . . . . . . . . . . . . . 427-442

Zbornik Veleučilišta u Rijeci – Journal of the Polytechnic of RijekaVol. 8 (2020), No. 1, Rijeka, 2020. ISSN 1848-1299 (tisak) ISSN 1849-1723 (online)
BIOTEHNIČKE ZNANOSTI
Edita Štefanić, Đorđe Maletić, Dinko Zima, Ivan Štefanić ECONOMIC EVALUATION OF DIFFERENT STRATEGY FOR WEED MANAGEMENT IN GARLIC PRODUCTION(Pregledni rad) . . . . . . . . . . . . . . . . . . . . . . . . . . . . . . . . . . . . . . . . . . . . . . . . . . . . . . . . . . . . . . . . . . . . . . . . . . . . . . . . 445-454
Tina Šugar, Kristina Brščić, Tanja Kocković Zaborski MIŠLJENJE PROIZVOĐAČA EKOLOŠKIH PREHRAMBENIH PROIZVODA O MOGUĆNOSTIMA RAZVOJA EKOLOŠKE POLJOPRIVREDE U HRVATSKOJ(Stručni rad) . . . . . . . . . . . . . . . . . . . . . . . . . . . . . . . . . . . . . . . . . . . . . . . . . . . . . . . . . . . . . . . . . . . . . . . . . . . . . . . . . . 455-469
POLITIKA ČASOPISA I UPUTE AUTORIMA . . . . . . . . . . . . . . . . . . . . . . . . . . . . . . . . . . . . . . . . . . . . . . . 471-480
JOURNAL POLICY AND GUIDELINES FOR AUTHORS . . . . . . . . . . . . . . . . . . . . . . . . . . . . . . . . . . . . . 481-491
RECENZENTI - REVIEWERS . . . . . . . . . . . . . . . . . . . . . . . . . . . . . . . . . . . . . . . . . . . . . . . . . . . . . . . . . . . . . . . . . . 493-495


DRUŠTVENE ZNANOSTI


Ž. Mateljak: Utjecaj spolne zastupljenosti u upravljačkim pozicijama na profitabilnost velikih…Zbornik Veleučilišta u Rijeci, Vol. 8 (2020), No. 1, pp. 1-17
1
Izvorni znanstveni rad https://doi.org/10.31784/zvr.8.1.1 Datum primitka: 16. 9. 2019. Datum prihvaćanja: 18. 10. 2019.
UTJECAJ SPOLNE ZASTUPLJENOSTI U UPRAVLJAČKIM POZICIJAMA NA PROFITABILNOST
VELIKIH PODUZEĆA U REPUBLICI HRVATSKOJŽeljko Mateljak
Dr. sc., docent, Ekonomski fakultet, Sveučilište u Splitu, Cvite Fiskovića 5, 21 000 Split, Hrvatska; e-mail: [email protected]
SAŽETAKSvako poduzeće nastoji organizirati svoje poslovanje primjerenim upravljačkim modelom koji se provodi kroz upravne organe u odnosu na trenutno poslovno okruženje. Temeljni upravni organi u mnogim poduzećima su skupština društva, upravni odbor i nadzorni odbor. Naglasak u ovom radu bio je na analizi spolne zastupljenosti u upravljačkim pozicijama odnosno postoji li razlika u ostvarivanju profitabilnosti kod velikih poduzeća u Republici Hrvatskoj u odnosu na zastupljenost žena i muškaraca u upravljačkim pozicijama. Predmet ovog rada je prepoznati važnost spolne zastupljenosti u upravljačkim pozicijama kod velikih poduzeća u Republici Hrvatskoj. Problem ovog rada je utvrditi na koji način spolna zastupljenost u upravljačkim pozicijama doprinosi postizanju veće profitabilnosti kod velikih poduzeća u Republici Hrvatskoj. Temeljna hipoteza rada je da postoji statistički značajna razlika između spolne zastupljenosti u upravljačkim pozicijama i profitabilnosti velikih poduzeća u Republici Hrvatskoj. Istraživanje se provodi na 148 velikih poduzeća iznad 600 zaposlenika u Republici Hrvatskoj. Rezultati istraživanja pokazali su da ne postoji statistički značajna razlika između profitabilnosti i spolne zastupljenosti u upravljačkim pozicijama kod velikih poduzeća iznad 600 zaposlenika u Republici Hrvatskoj. Ovo je istraživanje osnova za daljnja istraživanja na ovu temu u Republici Hrvatskoj.
Ključne riječi: spolna zastupljenost, upravljačke pozicije, velika poduzeća, profitabilnost
1. UVOD
Ravnopravnost spolova u svakoj državi je temelj demokratskih načela, ali i ustavnog poretka koji se temelji na sustavnoj primjeni rodne zastupljenosti u svim profitnim i/ili neprofitnim organizacijama. Osim demokratskih načela i ustavnog poretka, težnja ka uspostavljanju ravnopravne rodne zastupljenosti na svim razinama u društvu je pokazatelj zrelosti svakog društva. U posljednje vrijeme, ravnopravnost spolova je uvelike naglašena u upravljačkim pozicijama profitnih i/ili neprofitnih organizacija. Kod upravljačkih pozicija profitnih organizacija podrazumijevaju se
Creative Commons Attribution – NonCommercial 4.0 International License

Ž. Mateljak: Utjecaj spolne zastupljenosti u upravljačkim pozicijama na profitabilnost velikih…Zbornik Veleučilišta u Rijeci, Vol. 8 (2020), No. 1, pp. 1-17
2
organi društva poput uprave društva, nadzornog odbora, upravnog odbora i skupštine društva, dok se kod neprofitnih organizacija isto prvenstveno odnosi na rukovodstvo institucija, upravna i ostala vijeća.
U Republici Hrvatskoj je ravnopravnost spolova regulirano Zakonom o ravnopravnosti spolova kojeg donosi Vlada Republike Hrvatske preko Ureda za ravnopravnost spolova. Prvi Zakon o ravnopravnosti spolova donesen je 14. srpnja 2003. godine. Novi Zakon o ravnopravnosti spolova donesen je 2008. godine koji je objavljen u Narodnim novinama po brojem 82/08 čime je prestao važiti Zakon o ravnopravnosti spolova iz 2003. godine objavljen u Narodnim novinama pod brojem 116/03. Zakonom o ravnopravnosti spolova utvrđuju se opće osnove za zaštitu i promicanje ravnopravnosti spolova kao temeljne vrednote ustavnog poretka Republike Hrvatske, te se definira i uređuje način zaštite od diskriminacije na temelju spola i stvaranje jednakih mogućnosti za žene i muškarce (Narodne Novine, 82/08).
Pročišćeni tekst Zakona iz 2008. godine koji je donesen u 2017. godini također je objavljen u Narodnim novinama pod brojem 69/17. Prema ovoj verziji Zakona, ravnopravnost spolova znači da su žene i muškarci jednako prisutni u svim područjima javnog i privatnog života, da imaju jednak status, jednake mogućnosti za ostvarivanje svih prava, kao i jednaku korist od ostvarenih rezultata. Nadalje, prema Glavi IV, članku 13. definirana je zabrana diskriminacije na područjima zapošljavanja rada, i to u javnom i privatnom sektoru (Narodne Novine, 69/17).
U svom članku Veštić (2017) navodi razloge donošenja i institucionalne mehanizme osiguranja provedbe Zakona o ravnopravnosti spolova. Razlozi donošenja novog Zakona o ravnopravnosti spolova iz 2008. godine bila je Odluka Ustavnog suda kojom je Zakon o ravnopravnosti spolova iz 2003. ukinut, a kao datum njegova prestanka važenja je određen 15. srpnja 2008. Kako bi postojao kontinuitet u zakonskoj regulaciji ravnopravnosti spolova, pripremljen je novi Zakon o ravnopravnosti spolova, koji je donesen po hitnom postupku. Isti je donesen, objavljen i stupio je na snagu na dan prestanka važenja ranijeg Zakon o ravnopravnosti spolova. U Nacionalnoj politici za ravnopravnost spolova, za razdoblje od 2011. do 2015., u odnosu na Zakon o ravnopravnosti spolova iz 2008. navedeno je kako je isti dodatno usklađen s odredbama međunarodnih standarda kao i s pravom Europske unije te kako je njegovo donošenje bilo jedno od važnih mjerila za zatvaranje pregovaračkog poglavlja 19. Socijalne politike i zapošljavanja. U odnosu na pomake koji su ostvareni donošenjem Zakona o ravnopravnosti spolova iz 2008. navodi se kako je Zakon proširio osnove zabrane diskriminacije u području zapošljavanja i rada, uveo sustav kvota za izbore na svim razinama, unaprijedio područje sudske zaštite od diskriminacije i ustanovio nezavisno tijelo za suzbijanje diskriminacije u području ravnopravnosti spolova čime su se redefinirale i proširile ovlasti i djelokrug rada pravobraniteljice za ravnopravnost spolova sukladno obvezama u preuzimanju pravne stečevine Europske unije. Zakonski je prvi put pravno definirana uloga i status županijskih povjerenstava za ravnopravnost spolova kao tijela zaduženih za provedbu Zakona o ravnopravnosti spolova uz pravobraniteljstvo, Ured za ravnopravnost spolova Vlade Republike Hrvatske i koordinatore i koordinatorice u tijelima državne uprave. Uz razloge donošenja, u radu su navedeni također i institucionalni mehanizmi osiguranja provedbe u koje spada Ured za ravnopravnost poslova, Pravobranitelj/ica za ravnopravnost spolova, Koordinatori/ice u tijelima državne uprave te Povjerenstva za ravnopravnost spolova.
Ž. Mateljak: Utjecaj spolne zastupljenosti u upravljačkim pozicijama na profitabilnost velikih…Zbornik Veleučilišta u Rijeci, Vol. 8 (2020), No. 1, pp. 1-17
3
Na temelju prethodno iznesenih činjenica, sa sigurnošću se može potvrditi da su donošenjem Zakona o ravnopravnosti spolova, uz Ustav Republike Hrvatske, stvorene pretpostavke za postizanja uravnoteženosti muškaraca i žena na svim društvenim razinama, a za potrebe ovog rada posebno važnih upravljačkih pozicija. Stoga je naglasak u ovom radu na analizi spolne zastupljenosti u upravnim organima odnosno postoji li razlika u ostvarivanju profitabilnosti u velikim poduzećima u Republici Hrvatskoj u odnosu na zastupljenost žena i muškaraca u upravljačkim pozicijama. Predmet ovog rada je prepoznati važnost spolne zastupljenosti u upravljačkim pozicijama kod velikih poduzeća u Republici Hrvatskoj. Problem ovog rada je na koji način spolna zastupljenost u upravljačkim pozicijama doprinosi postizanju profitabilnosti kod velikih poduzeća u Republici Hrvatskoj. Temeljna hipoteza rada je da postoji statistički značajna razlika između profitabilnosti poduzeća i spolne zastupljenosti u upravljačkim pozicijama kod velikih poduzeća u Republici Hrvatskoj. Također je bitno naglasiti da će se zastupljenost spola u upravljačkim pozicijama utvrditi analizom nad 148 velikih poduzeća1 iznad 600 zaposlenika iz sudskog registra i financijskog portala Prima Bon u Republici Hrvatskoj, dok će se profitabilnost istih poduzeća mjeriti pokazateljima EBITDA marže2 (engl. Earnings before interest, taxes, depreciation and amortization) i neto profitne marže3. Izvorni podaci za utvrđivanje profitabilnosti poslovanja putem prethodno navedenih pokazatelja koristit će se iz objavljenih temeljnih financijskih izvještaja za 2018. godinu.
2. PRETHODNA ISTRAŽIVANJA
Nakon navođenja pojma i pravne regulative područja ravnopravnosti spolova te temeljnih smjernica rada u nastavku rada dat će se pregled od sada provedenih relevantnih istraživanja. Tako Buble (Buble, 2006) u svojoj knjizi prilikom objašnjavanja suvremenih stilova vodstva navodi da interaktivni stil vodstva smatra da žene imaju drugačiji stil vodstva od muškaraca, točnije stil vođenja koji je efikasniji u suvremenoj turbulentnoj okolini poduzeća. Iako žene često imaju iste osobine, sklonije su interaktivnom ponašanju. Interaktivni vođa je sklon konsenzusu i participaciji. Međutim, interaktivni stil vođenja nije karakterističan samo za žene, mnogi muškarci su isto tako skloni interaktivnom ponašanju.
Nadalje, Pravobraniteljica za ravnopravnost spolova Republike Hrvatske u 2011. godini provela je istraživanje o podzastupljenosti žena na rukovodećim pozicijama nad 500 najvećih i najuspješnijih trgovačkih društava u Republici Hrvatskoj. Istraživanje je provedeno anketnim upitnikom. Stopa povrata je bila 85,6 %. Rezultati istraživanja su pokazali da su žene značajno, a često i izrazito, podzastupljene na rukovodećim pozicijama koje su uključivale vrhovni, srednji i niži menadžment. Ova tvrdnja nalazi potvrdu i u podacima o podzastupljenosti žena u upravljačkim tijelima (uprava, nadzorni odbor, upravni odbor). Osim na rukovodećim pozicijama, ovo istraživanje također pokazuje i podzastupljenost žena u upravljačkim i nadzornim tijelima. Od ukupno 928 članova uprava poslovnih subjekata koji su sudjelovali u istraživanju njih 751 je muškog spola što čini čak
1 Prema članku 5., stavka 5. Zakona o računovodstvu, velika poduzeća su ona poduzeća koja prelaze najmanje dva od tri sljedeća uvjeta, i to: ako imaju ukupnu aktivu veću od 150.000.000,00 kuna i prihod veći od 300.000.000,00 kuna te ako im je prosječan broj radnika tijekom poslovne godine veći od 250.
2 EBITDA– dobit prije kamata, poreza, deprecijacije i amortizacije. EBITDA marža se izračunava: (dobit prije kamata, poreza i amortizacije/poslovni prihodi)*100.
3 Neto profitna marža – (dobiti nakon oporezivanja/prihodi od prodaje)*100

Ž. Mateljak: Utjecaj spolne zastupljenosti u upravljačkim pozicijama na profitabilnost velikih…Zbornik Veleučilišta u Rijeci, Vol. 8 (2020), No. 1, pp. 1-17
4
81 % svih članova uprava, dok žene čine tek 19 % članica uprava (177 žena). Gotovo isto je u članstvu nadzornih odbora. Od ukupno 1.202 člana nadzornih odbora, muškarci drže 80 % (963 člana nadzornog odbora), a žene tek 20 % (239 članica nadzornih odbora). Nadalje, muškarci predstavljaju većinu svih članova/ica uprave u 83 % poslovnih subjekata koji su sudjelovali u istraživanju, u 9 % svih uprava postignuta je uravnotežena zastupljenost, dok su u 8 % uprava žene u većini. Slično je i kod nadzornih odbora. U 89 % svih nadzornih odbora većinu članova čine muškarci, žene čine većinu u 10 % svih nadzornih odbora, a u samo 1 % nadzornih odbora je postignuta uravnotežena zastupljenost. Podaci su još više poražavajući što se tiče sudjelovanja žena na čelnim pozicijama. U 91 % svih uprava na čelu uprave se nalazi muškarac, dok je u 9 % njih na čelu uprave žena. U 89 % nadzornih odbora na čelu se nalazi muškarac, a u tek 11 % njih je na čelu žena (Izvještaj o radu Pravobraniteljice za ravnopravnost spolova Republike Hrvatske, 2011).
Pravobraniteljica za ravnopravnost poslova Republike Hrvatske je također u okviru Progress projekta „Uklanjanje staklenog labirinta – jednakost prilika u pristupu pozicijama ekonomskog odlučivanja“ provela kvantitativno istraživanje o zastupljenost žena i muškaraca u upravljačkim pozicijama u poslovnim subjektima na hrvatskom tržištu. Istraživanje je provedeno nad 500 trgovačkih društava prema prihodima s rang liste Fine iz 2012. godine primjenom elektronskog upitnika. Stopa povrata je bila 36,20 %. Rezultati istraživanja su pokazali da su žene izuzetno podzastupljene u upravljačkim tijelima istraživanih trgovačkih društava na hrvatskom tržištu, i to u tijelima upravljačke razine (uprava, upravni odbor i nadzorni odbor) u 2014. godini udio žena je bio 24,25 %, a udio muškaraca 75,75 %. Nadalje, u upravnim tijelima (uprava ili upravni odbor) društava koja su sudjelovala u istraživanju žene čine 25,40 %, a muškarci 74,60 % svih članova uprave. U nadzornim odborima društava koja su sudjelovala u istraživanju, žene čine 22,66 %, a muškarci 77,34 % svih članova. Uz prethodno navedene rezultate istraživanja, isto istraživanje je pokazalo da sudjelovanje žena u tijelima upravljačke razine vezano uz pravni oblik (zastupljenost žena u upravnim i nadzornim odborima je bolja u društvima s ograničenom odgovornošću nego u dioničkim društvima) i da zastupljenost žena i muškaraca na najvišim mjestima upravljanja ovisi o važnosti pozicije (žene su izuzetno podzastupljene na najvišim pozicijama ekonomskog upravljanja kao što su predsjednik uprave i nadzornih odbora) (Izvještaj o radu Pravobraniteljice za ravnopravnost spolova Republike Hrvatske, 2014).
Pravobraniteljica za ravnopravnost spolova je u svojem Izvješću za 2015. godinu provela analizu o zastupljenosti žena i muškaraca na upravljačkim pozicijama u sustavu državne uprave.4 Istraživanje je provela pregledom internetskih stanica tijela državne uprave gdje je utvrđeno da se spolno razlučeni podaci o dužnosnicima i dužnosnicama te rukovodećim državnim službenicima i službenicama ne vode na način da su statistički, odnosno brojčano izraženi, već da u pravilu sva tijela državne uprave
4 Prema čl. 4. Zakona o sustavu državne uprave tijela državne uprave su ministarstva i državne upravne organizacije. Prema članku 45. Zakonu o sustavu državne uprave i prema članku 74a. Zakonu o državnim službenicima državni dužnosnici/e u tijelima državne uprave su ministri/ce, zamjenici/e ministra/ica, pomoćnici/ce ministra, predstojnici/ce državnih ureda i ravnatelji/ce državnih upravnih organizacija. Rukovodeći državni službenici/e su zamjenici/e predstojnika/ce državnog ureda, glavni tajnici/e ministarstva i državnog ureda, zamjenici/e ravnatelja/ca državnih upravnih organizacija, ravnatelji/ce ureda Vlade Republike Hrvatske, predstojnik/ca Ureda potpredsjednika/ce Vlade Republike Hrvatske, ravnatelji/ce ureda, agencija, direkcija i drugih stručnih službi koje Vlada Republike Hrvatske osniva uredbom te predstojnici/e ureda državne uprave u jedinicama područne (regionalne) samouprave. Rukovodeće državne službenike/ce imenuje i razrješava Vlada Republike Hrvatske, na temelju javnoga natječaja, ako zakonom nije drugačije određeno.

Ž. Mateljak: Utjecaj spolne zastupljenosti u upravljačkim pozicijama na profitabilnost velikih…Zbornik Veleučilišta u Rijeci, Vol. 8 (2020), No. 1, pp. 1-17
5
na svojim stranicama imaju istaknute osobe koje se trenutno nalaze u vrhu upravljačke hijerarhije. Rezultati istraživanja su pokazali da unatoč ukupnom omjeru 40 % - 60 %, u skladu s općim trendom na tržištu rada uočljiva je vertikalna segregacija po spolu: što je veća hijerarhijska razina, udio žena opada. U usporedbi s 40 % žena u ukupnom broju državnih dužnosnika/ca u tijelima državne uprave, samo 21 % žena se nalazi na poziciji čelnice tijela državne uprave (Izvještaj o radu Pravobraniteljice za ravnopravnost spolova Republike Hrvatske, 2015).
U svom Izvješću o radu Pravobraniteljica za ravnopravnost spolova je također istraživala zastupljenost žena u upravljačkim strukturama u sportu. Rezultati su pokazali da jedan od vidova neravnopravnosti žena u području sporta je njihova osjetna podzastupljenost u upravljačkim tijelima, odnosno tijelima odlučivanja. Taj problem je prisutan u sportskim ustanovama na svim razinama: lokalnoj, državnoj, europskoj i svjetskoj, a proizlazi iz strukturalne diskriminacije uvjetovane tradicionalnom rodnom ulogom žene za koju nije „prikladno“ da iskazuje interes za sportom ili se bavi njime u istim obimu kao muškarci (Izvještaj o radu Pravobraniteljice za ravnopravnost spolova Republike Hrvatske, 2017).
Prema objavljenom stručnom članku u poslovnom tjedniku Lider (https://lider.media/lider-trend/samo-202-godine-su-potrebne-da-se-izjednaci-ekonomski-jaz-izmedu-zena-imuskaraca/, 4. 7. 2019. godine), Svjetski ekonomski forum je, prema trenutačnim stopama gospodarskog razvoja država, procijenio kako će trebati najmanje još 202 godine da se ekonomski jaz između muškaraca i žena, utemeljen isključivo na spolnoj razlici, izjednači na globalnoj razini. I dok postoji pretpostavka da su najrazvijenije svjetske ekonomije ujedno i najnaprednije u poticanju ravnopravnosti spolova, napose u poduzetništvu, rezultati istraživanja Vijeća za inozemne odnose, američke nevladine organizacije sa sjedištem u New Yorku, stavilo je države kao što su Meksiko, Salvador, ali i Hrvatsku kao one koje danas nude ženama u odnosu na muškarce, veću jednakost u gospodarskim odnosima nego što je slučaj u ekonomskim najjačim globalnim silama kao što su SAD, Njemačka ili Norveška.
U svom istraživanju Posarić, Kokot i Klačmer Čalopa (Posarić, Kokot i Klačmer Čalopa, 2017) analiziraju zastupljenost žena na upravljačkim pozicijama u hrvatskim poduzećima i njihov utjecaj na uspješnost poslovanja. Istraživanje je provedeno među 383 najveća hrvatska poduzeća iz 2013. godine prema kriteriju najvećih ostvarenih prihoda. Bitno je naglasiti da od 383 istraživana poduzeća, njih 379 koristi dvorazinski model korporativnog upravljanja. Rezultati istraživanja su pokazali da je u 379 promatranih poduzeća 829 članova uprave te 1152 članova nadzornog odbora. Od ukupno 829 članova uprave, 128 je članica što čini tek 15 % žena u upravama promatranih poduzeća. Udio žena u nadzornim odborima iznosi 21 %, točnije od 1152 člana nadzornih odbora promatranih poduzeća, 240 je članica. Ova analiza pokazuje da je udio žena na upravljačkim pozicijama kod 400 najvećih hrvatskih poduzeća manji od 40 %, a 40 % žena u upravnim odborima je preporuka Europske komisije na temelju koje je izražen i prijedlog direktive u 2013. godini. Od ukupno promatranih 379 poduzeća, njih 128 (15 %) u upravi ima jednu ili više žena. Nadalje, istraživanje je pokazalo da poduzeća koja imaju barem jednu ženu u upravi imaju veću prosječnu dobit nakon oporezivanja u odnosu na poduzeća koja nemaju niti jednu ženu u upravi te kako poduzeća koja imaju barem jednu ženu u nadzornom odboru imaju veću prosječnu dobit nakon oporezivanja u odnosu na poduzeća koja nemaju u nadzornom odboru ženu. U ova dva rezultata istraživanja primijenjen je Pearsonov koeficijent korelacije i ispitana je statistička značajnost t-testom. Rezultati su pokazali da je u oba slučaja dobivena slaba pozitivna veza (0,065027 i 0,078599). Što se tiče statističke značajnosti

Ž. Mateljak: Utjecaj spolne zastupljenosti u upravljačkim pozicijama na profitabilnost velikih…Zbornik Veleučilišta u Rijeci, Vol. 8 (2020), No. 1, pp. 1-17
6
utvrđeno je da ne postoji statistički značajna razlika (p = 0,244; p > 0,05) između uprava sa samo članovima muškog spola i uprava s članovima muškog i ženskog spola s obzirom na dobit nakon oporezivanja te da postoji statistički značajna razlika (p = 0,000; p < 0,05) između nadzornih odbora sa samo članovima muškog spola i nadzornih odbora s članovima muškog i ženskog spola s obzirom na dobit nakon oporezivanja. Detaljnije, prethodno znači da se ne može sa sigurnošću tvrditi da spolna raznolikost u upravi i nadzornom odboru doprinosi uspješnosti promatranih poduzeća.
Nidogon Višnjić i ostali (Nidogon Višnić i ostali, 2018), su proveli istraživanje o stavovima i percepcijama žena na rukovodećim pozicijama o njihovom položaju na radnom mjestu nad 112 ispitanica koristeći elektroničko slanje anketnog upitnika ispitanicama koje su zaposlene na rukovodećim pozicijama u poslovnim organizacijama u Republici Hrvatskoj. Rezultati istraživanja su pokazali da je zastupljenost žena u Republici Hrvatskoj na upravljačkim pozicijama 19 %, a prosjek u Europskoj uniji je 20,2 %, da poslovne organizacije koje imaju veći udio žena u menadžmentu ostvaruju 35 % veći povrat kapitala, 26 % više cijene dionica, i imaju rast neto profita od 14 % u odnosu na one organizacije bez žena u upravi koje ostvaruju 10 % rast neto profita.
Soldat (Soldat, 2018) u svom radu analizira odnos broja rukovoditelja žena i muškaraca u Europskoj uniji gdje naglašava da je udio muškaraca rukovoditelja 67 %, a žena 33 %. Što se tiče Republike Hrvatske, udio žena menadžera je na razini 30 %.
Nadalje, Credit Suisse Research institut je 2014. godine proveo istraživanja na temu spolne raznolikosti na uzorku od 27.000 direktora među 42 zemlje i njihov utjecaj na uspješnost istraživanih poduzeća. Rezultati istraživanja su pokazali da broj žena na rukovodećim pozicijama raste. Točnije, među istraživanim zemljama prosječna zastupljenost žena 2010. godine u odborima je iznosila 9,6 %, a u 2013. godini 12,7 %. Rezultati istraživanja su također pokazali da poduzeća kod kojih se žena nalazi na funkciji izvršnog direktora ostvaruju 28 % veću stopu povrata na kapital, 6 % veći odnos duga i glavnice i 11 % veći odnos isplate dividendi od poduzeća koja imaju muškarce na funkciji izvršenog direktora. Poduzeća koja imaju više od 10 % žena na funkciji izvršnog direktora i operativnog menadžera ostvaruju 27 % veću stopu povrata na kapital, 26 % veći odnos duga i glavnice i 42 % veći odnos isplate dividendi od poduzeća koja imaju manje od 5 % žena na funkciji izvršnog direktora i operativnog menadžera. Poduzeća koja imaju više od 15 % žena na funkciji višeg menadžmenta ostvaruju 52 % veću stopu povrata na kapital, 61 % veći odnos duga i glavnice i 22 % veći odnos isplate dividendi od poduzeća koja imaju manje od 10 % žena na funkciji višeg menadžmenta (https://www.credit-suisse.com/about-us-news/en/articles/media-releases/csri-gender-3000-201609.html?t=183_0.5562689241064736, 21. 7. 2019.).
Tvrtka McKinsey & Company, (McKinsey & Company, 2007), je provela istraživanje pod nazivom „Žene su bitne“ (engl. Women Matters) nad 89 europskih poduzeća na temu udjela žena u odboru direktora te njihova funkcija u poduzeću. Rezultati istraživanja su pokazali da poduzeća s većim raznolikošću žena na rukovodećim pozicijama ostvaruju veću stopu povrata na vlastiti kapital od prosjeka industrije (11,40 % naspram 10,30 %), da ostvaruju veću operativnu dobit od prosjeka industrije (11,10 % naspram 5,80 %) i ostvaruju rast cijena dionica od prosjeka industrije (64 % naspram 47 %).

Ž. Mateljak: Utjecaj spolne zastupljenosti u upravljačkim pozicijama na profitabilnost velikih…Zbornik Veleučilišta u Rijeci, Vol. 8 (2020), No. 1, pp. 1-17
7
Europska komisija je 2014. godine, (https://ec.europa.eu/info/policies/justice-and-fundamental-rights/gender-equality, 21. 7. 2019.) provela istraživanje među 28 zemalja članica Europske unije nad 613 poduzeća koje su prisutne na burzama među kojima je naravno i Republika Hrvatska. Analiza rezultata istraživanja je obuhvatila spolnu zastupljenost kod funkcije predsjednika upravnog odbora ili nadzornog odbora u dvorazinskom modelu i članova upravnog odbora ili nadzornog odbora u dvorazinskom modelu. Rezultati istraživanja su pokazali da je na nivou cijele Europske unije prosječni udio od 7 % žena i 93 % muškaraca odnosi na funkciju predsjednika upravnog odbora ili nadzornog odbora u dvorazinskom modelu te da se prosječni udio od 20 % žena i 80 % muškaraca odnosi na članstvo upravnog odbora ili nadzornog odbora u dvorazinskom modelu. Što se tiče podataka za Republiku Hrvatsku rezultati istraživanja, nad 25 poduzeća, su pokazali da je prosječni udio od 12 % žena i 88 % muškaraca odnosi na funkciju predsjednika upravnog odbora ili nadzornog odbora u dvorazinskom modelu te da se prosječni udio od 19 % žena i 81 % muškaraca odnosi na članstvo u upravnom odboru ili nadzornom odboru u dvorazinskom modelu.
Joy i ostali su proveli istraživanje 500 poduzeća s Fortune liste unutar kojeg su istraživali zastupljenost žena i njihova povezanost s uspješnosti poduzeća mjerene povratom na prodaju, povratom na vlastiti kapital i povratom na investirani kapital. Rezultati istraživanja su pokazali da poduzeća s većom zastupljenosti žena u odborima ostvaruju 42 % veći povrat na prodaju, 53 % veći povrat uloženog vlastitog kapitala i 66 % veći povrat investiranog kapitala. (https://www.catalyst.org/wpcontent/uploads/2019/01/The_Bottom_Line_Corporate_Performance_and_Womens_Representation_on_Boards.pdf, 21. 7. 2019.).
Suprotno prethodno navedenim istraživanjima, autori Tacheva i Huse (Tacheva, Huse, 2006) su proveli istraživanje nad 249 norveških poduzeća na temu povezanosti zastupljenosti žena i efektivnosti poduzeća. Rezultati istraživanja su pokazali da postoji negativna povezanost između zastupljenosti žena u nadzornim odborima i uspješnosti financijske kontrole odbora nad poduzećima. Uz to, postoji pozitivan odnos između zastupljenosti žena u nadzornim odborima i djelotvornosti istih odbora u obavljanju kvalitetne funkcije kontrole nad poduzećem. Točnije, istraživanjem se zaključilo da zastupljenost žena u nadzornim odborima može imati pozitivan i negativan utjecaj na poduzeće te da imaju bolje rezultate kontrole nad zadacima kvalitativne prirode, dok imaju niže sposobnosti kontrole nad uslužnim zadacima. Provedeno istraživanje pokazuje da zastupljenost žene neće uvijek doprinijeti povećanju uspješnosti poduzeća ukoliko se nalaze u nadzornim odboru. Ovom istraživanju se može dodati i istraživanje provedeno od strane Mkhize i Mswelija (Mkhize, Mswelija 2010) koje je provedeno u Južnoafričkoj Republici u kojem je utvrđeno da poduzeća kojima upravljaju žene ne nadmašuju rezultate poduzeća kojima upravljaju muškarci te istraživanje Strelcove (Strelcova, 2004) koje pokazuje da nema značajne statističke razlike između cijena dionica i performansi poduzeća koja imaju na poziciji glavnog izvršnog direktora ženu i onih gdje ulogu glavnog izvršnog direktora obavlja muškarac.
Nakon prethodno prikazanih provedenih rezultata istraživanja iz područja zastupljenosti žena i muškaraca u upravljačkim pozicijama, u nastavku rada prikazat će se rezultati provedenog istraživanja.

Ž. Mateljak: Utjecaj spolne zastupljenosti u upravljačkim pozicijama na profitabilnost velikih…Zbornik Veleučilišta u Rijeci, Vol. 8 (2020), No. 1, pp. 1-17
8
3. REZULATI ISTRAŽIVANJA
3. 1 Metodologija istraživanja
Istraživanje utjecaja spolne zastupljenosti u upravljačkim pozicijama na profitabilnost poduzeća u Republici Hrvatskoj provedeno je među velikim poduzećima prema kriteriju broja zaposlenih. U uzorak su izabrana velika poduzeća iznad 600 zaposlenika. Istraživanje je provedeno nad 148 velikih poduzeća temeljem popisa iz 2018. godine dobivenog od financijskog portala Prima Bon u razdoblju od 15. 7. 2019. do 15. 8. 2019. godine, i to 71 veliko poduzeće iznad 1000 zaposlenika i 77 velikih poduzeća između 600 i 1000 zaposlenika.
Obrada podataka je napravljena metodom prikupljanja podataka o spolnoj zastupljenosti u upravljačkim pozicijama pojedinačno za svako istraživano poduzeće analizom podataka iz Sudskog registra Ministarstva pravosuđa i s financijskog portala Prima bon. Uz navedenu metodu, u radu je korištena deskriptivna statistika za potrebe prikazivanja rezultata istraživanja za osnovne karakteristike uzorka te Mann Whitney-ev test za ispitivanje statističke značajnosti testa.
Obrađeni podaci koristili su se za prihvaćanje ili odbijanje temeljne hipoteze rada. Kako je već navedeno, istraživanje je obuhvatilo spolnu zastupljenost u upravnim odborima kod jednorazinskog modela upravljanja i/ili upravi društva i nadzornim odborima u dvorazinskom modelu upravljanja. S druge strane, za mjerenje profitabilnosti korišteni su pokazatelji EBITDA marža (engl. Earnings before interest, taxes, depreciation and amortization) i neto profitna marža. Za izračun prethodno navedenih pokazatelja korišteni su obvezni financijski izvještaji, račun dobiti i gubitka te bilanca, objavljeni na internet stranici FINE te na financijskom portalu Prima Bon za 2018. godinu.
3. 2 Osnovne karakteristike uzorka
Prije prikazivanja rezultata temeljne hipoteze istraživanja, dat će se pregled pravnih oblika istraživanih poduzeća. Poduzeća obuhvaćena ovim istraživanjem analizirana su prema dva pravna oblika, i to dioničko društvo te društvo s ograničenom odgovornošću. Rezultati istraživanja analiziranih poduzeća prema pravnim oblicima prikazani su u tablici 1.
Tablica 1. Velika poduzeća iznad 600 zaposlenika
PRAVNI OBLICI BROJ UDIO (%)
Dioničko društvo 50 33,78
Društvo s ograničenom odgovornošću 92 62,16
Ostali oblici 6 4,06
UKUPNO 148 100,00Izvor: izrada autora
Tablica 1 prikazuje da od ukupno 148 velikih poduzeća iznad 600 zaposlenika analiziranih u ovom istraživanju postoji 50 poduzeća ili 33,78 % koja su dionička društva, dok 92 poduzeća ili 62,16 % su društva s ograničenom odgovornošću. U ostale oblike društva spada 6 poduzeća (4,06 %) koja

Ž. Mateljak: Utjecaj spolne zastupljenosti u upravljačkim pozicijama na profitabilnost velikih…Zbornik Veleučilišta u Rijeci, Vol. 8 (2020), No. 1, pp. 1-17
9
pripadaju ostalim pravnim oblicima društva, kao što su 3 komanditna društva, 2 pravne osobe za koju je upis propisan zakonom i 1 javna ustanova.
3. 3 Analiza utjecaja spolne zastupljenosti u upravljačkim pozicijama na profitabilnost poduzeća u Republici Hrvatskoj
Kao što je prethodno naglašeno, u ovom radu provelo se istraživanje u svrhu analize spolne zastupljenosti u upravljačkim pozicijama i njenog utjecaja na profitabilnost 148 velikih poduzeća iznad 600 zaposlenika u Republici Hrvatskoj. Prilikom provođenja analize spolne zastupljenosti u upravljačkim pozicijama korišten je jednorazinski i dvorazinski model upravljanja. Kod jednorazinskog modela upravljanja ispitana je spolna zastupljenost u upravnim odborima poduzeća, a kod dvorazinskog modela upravljanja ispitana je spolna zastupljenost u upravama poduzeća i nadzornim odborima. Kod oba modela je također utvrđena spolna zastupljenost kroz članstvo u navedenim upravljačkim organima, kao i kroz funkciju predsjednice i zamjenice predsjednika/predsjednice navedenih upravljačkih organa. Bitno je naglasiti da su rezultati istraživanja spolne zastupljenosti u upravljačkim pozicijama kod 148 poduzeća provedena nad 8 članica/članova upravnih odbora, 370 članica/članova uprava te 552 članice/člana nadzornog odbora. Dobiveni rezultati istraživanja o spolnoj zastupljenosti u upravljačkim pozicijama istraživanih poduzeća prikazani su u tablici 2.
Tablica 2. Spolna zastupljenost u upravljačkim pozicijama kod 148 istraživanih velikih poduzeća iznad (poduzeća iznad 600 zaposlenika)
UPRAVNI ODBOR
UKUPNO
UPRAVA DRUŠTVA
UKUPNO
NADZORNI ODBOR
UKUPNOMuško Žensko Muško Žensko Muško Žensko
7 1 8 319 51 370 423 129 552
87,50 % 12,50 % 100,00 % 86,22 % 13,78 % 100,00 % 76,63 % 23,37 % 100,00 %Izvor: izrada autora
Kao što je vidljivo iz tablice 2, kod poduzeća koja imaju jednorazinski model upravljanja kroz upravni odbor zastupljenost žena je na razini 12,5 %, dok je zastupljenost muškaraca od 87,5 %. Bitno je naglasiti da je zastupljenost žena u ovom modelu upravljanja isključivo samo kroz članstvo. Kod velikih poduzeća jednorazinski model upravljanja poduzeća putem upravnog odbora imaju 2 poduzeća. S druge strane, rezultati istraživanja su potvrdili da ipak najveći broj poduzeća (146) primjenjuje dvorazinski model upravljanja koristeći upravljačke organe poput uprave društva i nadzornog odbora. Kao što je prethodno navedeno, rezultati istraživanja kod ovog modela upravljanja su pokazali da u upravama društva ima ukupno 370 članova/članica. Zastupljenost žena u upravama tih poduzeća je na razini 13,78 % (51), a muškaraca 86,22 % (319). Ovdje je bitno napomenuti da od 51 žene u upravi samo njih 7 ili 13,72 % se nalaze na funkciji predsjednice uprave, dok se preostali broj odnosi na članstvo u upravama društava. Nadalje, što se tiče zastupljenosti u nadzornim odborima, rezultati istraživanja su pokazali da ima ukupno 552 člana/članice. Zastupljenost žena je na razini 23,37 % (129), a muškaraca 76,63 % (423). Detaljnije, od ukupnog

Ž. Mateljak: Utjecaj spolne zastupljenosti u upravljačkim pozicijama na profitabilnost velikih…Zbornik Veleučilišta u Rijeci, Vol. 8 (2020), No. 1, pp. 1-17
10
broja žena u nadzornim odborima (129), njih 14 ili 10,85 % imaju funkciju predsjednice nadzornog odbora, dok 27 ili 20,93 % se nalaze na funkciji zamjenice predsjednice/predsjednika nadzornog odbora. Kod ukupno analiziranih 148 poduzeća zaposleno je 224 024 zaposlenika.
Nakon detaljne analize spolne zastupljenosti u upravljačkim pozicijama nad istraživanim poduzećima, u nastavku rada prikazat će se rezultati istraživanja u svrhu opovrgavanja ili dokazivanja temeljne hipoteze rada. Primjenom Mann Whitney-eva testa utvrdit će se postoji li statistički značajna razlika na razini od 5 % između profitabilnosti i spolne zastupljenosti u upravljačkim pozicijama kod velikih poduzeća u Republici Hrvatskoj. Obradom prikupljenih podataka utvrdit će se:
• postoji li statistički značajna razlika između zastupljenosti i nezastupljenosti žena u upravama istraživanih poduzeća u odnosu na profitabilnost poslovanja,
• postoji li statistički značajna razlika između zastupljenosti i nezastupljenosti žena u nadzornim odborima istraživanih poduzeća u odnosu na profitabilnost poslovanja,
• postoji li statistički značajna razlika između zastupljenosti jedne žene i više od jedne žene u upravama istraživanih poduzeća u odnosu na profitabilnost poslovanja, te
• postoji li statistički značajna razlika između zastupljenosti jedne žene i više od jedne žene u nadzornim odborima istraživanih poduzeća u odnosu na profitabilnost poslovanja.
Istraživanje je provedeno u poduzećima koja primjenjuju dvorazinski model upravljanja jer je obradom podataka utvrđeno da od 148 istraživanih poduzeća samo 2 poduzeća primjenjuju jednorazinski model upravljanja putem upravnog odbora što nije dovoljno za provođenje statističke značajnosti rezultata istraživanja. U ovom radu najprije će se ispitati postojanost statistički značajne razlike između uprava društava u kojima su žene zastupljene i u kojima žene nisu zastupljene u odnosu na profitabilnost poslovanja poduzeća. Dobiveni rezultati istraživanja prikazani su u tablici 3.
Tablica 3. Ispitivanje statističke značajnosti između zastupljenosti i nezastupljenosti žena u upravama istraživanih poduzeća u odnosu na profitabilnost poslovanja
SPOLNA ZASTUPLJENOST
PROSJEČNA PROFITABILNOSTBROJ
PODUZEĆA
UDIO
(%)EBITDANETO PROFITNA
MARŽA
BEZ ŽENA 10,15 % 2,80 % 112 75,67
SA ŽENAMA 11,46 % 3,14 % 36 24,33
UKUPNO - - 148 100
Statistička značajnost (p) 0,69 0,74 - -Izvor: obrada autora
Iz tablice 3 vidljivo je postoji 112 (75,67 %) poduzeća u kojima žene nisu zastupljene u upravama društava, dok je kod 36 (24,33 %) poduzeća postoji zastupljenost žena u upravama društava. Poduzeća su prosječnu profitabilnost mjerenu pokazateljem EBITDA bez zastupljenost žena u upravama ostvarila na razini od 10,15 %, a poduzeća s zastupljenosti žena u upravama na razini

Ž. Mateljak: Utjecaj spolne zastupljenosti u upravljačkim pozicijama na profitabilnost velikih…Zbornik Veleučilišta u Rijeci, Vol. 8 (2020), No. 1, pp. 1-17
11
od 11,46 %. Budući da se prema dobivenoj vrijednosti pokazatelja EBITDA može zaključiti da su poduzeća s zastupljenosti žena u upravama društava ostvarila veću prosječnu profitabilnost od poduzeća bez zastupljenosti žena u upravama, ovaj rezultat se ne može statistički potvrditi na razni od 5 % (p = 0,69; p > 0,05). S druge strane, poduzeća s zastupljenosti žena u upravama društava su ostvarila prosječnu profitabilnost mjerenu neto profitnom maržom na razini od 3,14 %, a poduzeća bez zastupljenosti žena u upravama na razini od 2,80 %. Iako se prema dobivenoj vrijednosti neto profitne marže može zaključiti da su poduzeća s zastupljenosti žena u upravama društava ostvarila veću prosječnu profitabilnost od poduzeća bez zastupljenosti žena, ovaj rezultat se ne može statistički potvrditi na razni od 5 % (p = 0,74; p > 0,05).
U nastavku ovog rada ispitat će se postojanost statistički značajne razlike između zastupljenosti i nezastupljenosti žena u nadzornim odborima istraživanih poduzeća u odnosu na profitabilnost poslovanja. Rezultati takvog istraživanja prikazani su u tablici 4.
Tablica 4. Ispitivanje statističke značajnosti između zastupljenosti i nezastupljenosti žena u nadzornim odborima istraživanih poduzeća u odnosu na profitabilnost poslovanja
SPOLNA ZASTUPLJENOST
PROSJEČNA PROFITABILNOSTBROJ
PODUZEĆA
UDIO
(%)EBITDANETO PROFITNA
MARŽA
BEZ ŽENA 9,67 % 2,80 % 72 48,65
SA ŽENAMA 11,07 % 2,96 % 76 51,35
UKUPNO - - 148 100
Statistička značajnost (p) 0,31 0,62 -Izvor: obrada autora
Iz tablice 4 može se zaključiti da postoji 72 (48,65 %) poduzeća kod kojih žene nisu zastupljene u nadzornim odborima, dok je kod 76 (51,35 %) poduzeća postoji zastupljenost žena u nadzornim odborima. Poduzeća su prosječnu profitabilnost mjerenu pokazateljem EBITDA bez zastupljenosti žena u nadzornim odborima ostvarila na razini od 9,67 %, a poduzeća s zastupljenosti žena u nadzornim odborima na razini od 11,07 %. Prema dobivenoj vrijednosti pokazatelja EBITDA može se zaključiti da su poduzeća s zastupljenosti žena u nadzornim odborima ostvarila veću prosječnu profitabilnost od poduzeća bez zastupljenosti žena u nadzornim odborima, ali se rezultat ne može statistički potvrditi na razni od 5 % (p = 0,31; p > 0,05). S druge strane, poduzeća s zastupljenosti žena u nadzornim odborima su ostvarila prosječnu profitabilnost mjerenu neto profitnom maržom na razini od 2,96 %, a poduzeća bez zastupljenosti žena na razini od 2,80 %. Temeljem prethodno dobivenih rezultata istraživanja može zaključiti da su poduzeća s zastupljenosti žena u nadzornim odborima ostvarila veću prosječnu profitabilnost od poduzeća bez zastupljenosti žena u nadzornim odborima. Ovaj rezultat se ne može statistički potvrditi na razni od 5 % (p = 0,62; p > 0,05).
Nakon ispitivanja statističke značajnosti između poduzeća koja nemaju zastupljene žene u odnosu na poduzeća koja imaju zastupljene žene u upravama društava i nadzornim odborima uzimajući

Ž. Mateljak: Utjecaj spolne zastupljenosti u upravljačkim pozicijama na profitabilnost velikih…Zbornik Veleučilišta u Rijeci, Vol. 8 (2020), No. 1, pp. 1-17
12
u obzir profitabilnost poslovanja poduzeća, u nastavku rada ispitat će se statistička značajnost između zastupljenosti jedne žene i više od jedne žene u upravama društava i nadzornim odborima u odnosu na profitabilnost poduzeća. Stoga su u tablici 5 najprije prikazani rezultati istraživanja statističke značajnosti između zastupljenosti jedne žene i više od jedne žene u upravama istraživanih poduzeća u odnosu na profitabilnost poslovanja.
Iz tablice 5 vidi se da postoji 25 (69,44 %) istraživanih poduzeća u kojima je zastupljena jedna žena u upravama, dok je kod 11 (30,56 %) poduzeća postoji zastupljenost više od jedne žena u upravama. Poduzeća u kojima je zastupljena jedna žena u upravama su ostvarila prosječnu profitabilnost putem EBITDA od 11,03 %, a poduzeća s zastupljenosti više od jedne žene u upravama društava na razini od 11,40 %. S obzirom na dobivene vrijednosti pokazatelja EBITDA i statističku značajnost testa može se zaključiti da su poduzeća s zastupljenosti više od jedne žene u upravama društava ostvarila veću prosječnu profitabilnost od poduzeća s zastupljenosti samo jedne žene u upravama društava čime se ovaj rezultat ne može statistički potvrditi na razni od 5 % (p = 0,77; p > 0,05).
Tablica 5. Ispitivanje statističke značajnosti između zastupljenosti jedne žene i više od jedne žene u upravama istraživanih poduzeća u odnosu na profitabilnost poslovanja
SPOLNA ZASTUPLJENOST
PROSJEČNA PROFITABILNOSTBROJ
PODUZEĆA
UDIO
(%)EBITDANETO PROFITNA
MARŽA
1 ŽENA 11,03 % 3,04 % 25 69,44
> 1 ŽENA 11,40 % 3,37 % 11 30,56
UKUPNO - - 36 100
Statistička značajnost (p) 0,77 0,79 -Izvor: obrada autora
S druge strane, poduzeća s zastupljenosti više od jedne žene u upravama društava su ostvarila prosječnu profitabilnost mjerenu neto profitnom maržom od 3,37 %, a poduzeća s zastupljenosti jedne žene u upravama na razini od 3,04 %. Budući da se prema dobivenoj vrijednosti neto profitne marže može zaključiti da su poduzeća s zastupljenosti više od jedne žene u upravama ostvarila veću prosječnu profitabilnost od poduzeća s zastupljenosti samo jedne žene u upravama društava, dobiveni rezultat se ne može statistički potvrditi na razni od 5 % (p = 0,79; p > 0,05).
Nadalje, nakon ispitivanja statističke značajnosti između zastupljenosti jedne žene i više od jedne žene u upravama istraživanih poduzeća u odnosu na profitabilnost poslovanja, u tablici 6 prikazani su rezultati ispitivanja statističke značajnosti između zastupljenosti jedne žene i više od jedne žene u nadzornim odborima istraživanih poduzeća u odnosu na profitabilnost poslovanja.

Ž. Mateljak: Utjecaj spolne zastupljenosti u upravljačkim pozicijama na profitabilnost velikih…Zbornik Veleučilišta u Rijeci, Vol. 8 (2020), No. 1, pp. 1-17
13
Tablica 6. Ispitivanje statističke značajnosti između zastupljenosti jedne žene i više od jedne žene u nadzornim odborima istraživanih poduzeća u odnosu na profitabilnost poslovanja
SPOLNA ZASTUPLJENOST
PROSJEČNA PROFITABILNOSTBROJ
PODUZEĆA
UDIO
(%)EBITDANETO PROFITNA
MARŽA
1 ŽENA 9,91 % 1,90 % 39 51,32
> 1 ŽENA 12,29 % 4,52 % 37 48,68
UKUPNO - - 76 100
Statistička značajnost (p) 0,66 0,42 -Izvor: obrada autora
Tablica 6 pokazuje da postoji 39 (51,32 %) istraživanih poduzeća u kojima je zastupljena jedna žena u nadzornim odborima, dok je kod 37 (48,68 %) poduzeća postoji zastupljenost više od jedne žena u nadzornim odborima. Poduzeća u kojima je zastupljena jedna žena u nadzornim odborima su ostvarila prosječnu profitabilnost putem EBITDA od 12,29 %, a poduzeća s zastupljenosti više od jedne žene u nadzornim odborima na razini od 9,91 %. Prema dobivenoj vrijednosti pokazatelja EBITDA može se zaključiti da su poduzeća s zastupljenosti više od jedne žene u nadzornim odborima ostvarila veću prosječnu profitabilnost od poduzeća s zastupljenosti samo jedne žene u nadzornim odborima. Ovako dobiveni rezultat istraživanja se ne može statistički potvrditi na razni od 5 % (p = 0,66; p > 0,05). S druge strane, poduzeća s zastupljenosti više od jedne žene u nadzornim odborima su ostvarila prosječnu profitabilnost mjerenu neto profitnom maržom od 4,52 %, a poduzeća s zastupljenosti jedne žene u nadzornim odborima na razini od 1,90 %. Dobivene vrijednosti neto profitne marže pokazuju da su poduzeća s zastupljenosti više od jedne žene u nadzornim odborima ostvarila veću prosječnu profitabilnost od poduzeća s zastupljenosti samo jedne žene u nadzornim odborima. Ovaj rezultat se ne može statistički potvrditi na razni od 5 % (p = 0,42; p > 0,05).
Budući da su rezultati istraživanja potvrdili da su istraživana poduzeća u čijim su upravama i nadzornim odborima zastupljene žene ostvarila veću prosječnu profitabilnost od poduzeća gdje u upravama i nadzornim odborima nisu zastupljene žene, ovako dobiveni rezultati se ne mogu statistički potvrditi jer je dobivena statistička značajnost testa veća od 5 % (p > 0,05). S druge strane, dobiveni rezultati istraživanja su također pokazali da su istraživana poduzeća u čijim je upravama i nadzornim odborima zastupljeno više od jedne žene ostvarila veću prosječnu profitabilnost od poduzeća gdje je upravama i nadzornim odborima zastupljena samo jedna žena. Međutim, ovako dobiveni rezultat se ne može statistički potvrditi jer je, i u ovom slučaju, dobivena statistička značajnost testa veća od 5 % (p > 0,05). Slijedom prethodno analiziranih rezultata istraživanja može se zaključiti da temeljna hipoteza rada nije potvrđena. Razlog statističkog neprihvaćanja temeljne hipoteze rada je u približno dobivenim vrijednostima prosječne profitabilnosti u odnosu na spolnu zastupljenost u upravljačkim pozicijama kod istraživanih poduzeća u primijenjenim modalitetima istraživanja ovog rada.

Ž. Mateljak: Utjecaj spolne zastupljenosti u upravljačkim pozicijama na profitabilnost velikih…Zbornik Veleučilišta u Rijeci, Vol. 8 (2020), No. 1, pp. 1-17
14
4. PREPORUKE ZA BUDUĆA ISTRAŽIVANJA
Utjecaj spolne zastupljenosti u upravljačkim pozicijama na profitabilnost velikih poduzeća u Republici Hrvatskoj je veoma aktualna tema koja sve više potiče raspravu o ravnopravnosti spolova. Istraživanja na ovu temu su brojna u drugim državama svijeta, dok u Republici Hrvatskoj postoje određena istraživanja koja su uvelike manja nego u drugim zemljama Europske unije. Najintenzivnije ovu temu objašnjava Pravobraniteljica za ravnopravnost spolova u svojim godišnjim izvješćima koja su prikazana u ovom radu. Budući da su istraživanja na ovu temu u Republici Hrvatskoj na samom početku razvoja, postoji sve veća potreba za provedbu ovog tipa istraživanja u budućnosti.
Najprije, utjecaj spolne zastupljenosti u upravljačkim pozicijama na rezultate poslovanja poduzeća u Republici Hrvatskoj moguće je dodatno provesti u privatnom sektoru. Budući da je u ovom radu napravljeno istraživanja nad 148 velikih poduzeća iznad 600 zaposlenika, sljedeće istraživanje moguće je provesti nad ostatak 300 velikih poduzeća koji ukupno zapošljavaju 109 110 zaposlenika. Istraživanje može ići u smjeru ispitivanje utjecaja spolne zastupljenosti u upravljačkim pozicijama na profitabilnost, likvidnost, zaduženosti i tržišnu poziciju na pozicioniranim tržištima. U ovom istraživanju se može ići s pretpostavkom da veća zastupljenost žena u upravljačkim pozicijama uzroku veću profitabilnost, manju zaduženost i bolju tržišnu poziciju na pozicioniranim tržištima.
S druge strane, utjecaj spolne zastupljenosti u upravljačkim pozicijama na rezultate poslovanja poduzeća u Republici Hrvatskoj također je moguće provesti i u javnoj upravi. Ovo istraživanje se može primijeniti na institucije u javnoj upravi analizirajući spolnu zastupljenost na čelnim pozicijama i u upravnim vijećima na efikasnost poslovanja. Tu spadaju ministarstva, tijela državne uprave, državni uredi, agencije, županije, općine i gradovi te institucije u kojima su isti osnivači. Uspješnost poslovanja kod javnih institucija je moguće utvrditi putem vremenske efikasnosti obrade zahtjeva zaprimljenog od strane stranke i postotnog izvršenja postavljenih ciljeva u jednoj proračunskoj godini. U ovom istraživanju se može ići s pretpostavkom da veća zastupljenost žena u upravljačkim pozicijama u javnoj upravi uzrokuje kraće vrijeme obrade zahtjeva zaprimljenog od strane stranke i većem postotku izvršenja postavljenih ciljeva u proračunskoj godini.
5. ZAKLJUČAK
Spolna zastupljenost u upravljačkim pozicijama poduzeća je veoma zanimljiva tema u posljednje vrijeme. Na ovu temu su napravljena brojna istraživanja u svijetu, a prvi pomaci su se dogodili i u Republici Hrvatskoj. Stoga je svaka provedba istraživanja na ovu temu važan napredak u znanstvenoj i stručnoj literaturi u Republici Hrvatskoj čime se doprinosi stalnom upoznavanju stanja spolne zastupljenosti u upravljačkim pozicijama poduzeća i stvaranju percepcije da je nužno da se na upravljačke pozicije imenuju sposobne i stručne osobe bez obzira na spol.
Upravo zbog veoma manjeg broja provedenih istraživanja na temu spolne zastupljenosti u upravljačkim pozicijama, javila se potreba za provođenjem ovog istraživanja. Prilikom provedbe istraživanja analizirana su velika poduzeća u Republici Hrvatskoj prema kriteriju broja zaposlenika. Točnije, istraživanje utjecaja spolne zastupljenosti u upravljačkim pozicijama na profitabilnost provedeno je nad 148 velikih poduzeća iznad 600 zaposlenika. Budući da su samo dva poduzeća imala upravljanje putem jednorazinskog modela primjenom upravnog odbora, istraživanje nije

Ž. Mateljak: Utjecaj spolne zastupljenosti u upravljačkim pozicijama na profitabilnost velikih…Zbornik Veleučilišta u Rijeci, Vol. 8 (2020), No. 1, pp. 1-17
15
provedeno kod ove skupine poduzeća već samo kod poduzeća koja su imala dvorazinski model upravljanja putem uprave društva i nadzornog odbora
Dobiveni rezultati istraživanja pokazali su da su istraživana poduzeća u čijim su upravama i nadzornim odborima zastupljene žene ostvarila veću prosječnu profitabilnost od poduzeća gdje u upravama i nadzornim odborima nisu zastupljene žene. S druge strane, rezultati istraživanja su također pokazali da su istraživana poduzeća u čijim je upravama i nadzornim odborima zastupljeno više od jedne žene ostvarila veću prosječnu profitabilnost od poduzeća gdje u upravama i nadzornim odborima zastupljena jedna žena. Budući da su se u obje grupe istraživanja dobiveni rezultati koji odgovaraju temeljnoj hipotezi rada, vrijednosti dobivenih statističkih značajnosti potvrđuju ne postojanje statistički značajne razlike između dobivenih rezultata temeljem čega se zaključuje da temeljna hipoteza rada nije potvrđena.
LITERATURA
Buble, M., Osnove menadžmenta, Sinergija nakladništvo d. o. o., Zagreb, 2006.
Izvještaj o radu Pravobraniteljice za ravnopravnost spolova za 2017. godinu (https://www.prs.hr/index.php/izvjesca/2017, 21. 7. 2019.)
Izvještaj o radu Pravobraniteljice za ravnopravnost spolova za 2015. godinu (https://www.prs.hr/index.php/izvjesca/2015, 21. 7. 2019.)
Izvještaj o radu Pravobraniteljice za ravnopravnost spolova za 2014. godinu (https://www.prs.hr/index.php/izvjesca/2014, 10. 7. 2019.)
Izvještaj o radu Pravobraniteljice za ravnopravnost spolova za 2011. godinu (https://www.prs.hr/index.php/izvjesca/izvjesce-2011, 15. 7. 2019.)
McKinsey & Company (2007) Women Matter: Gender diversity, a corporate performance driver, 2007. (https://www.mckinsey.com/business-functions/organization/our-insights/gender-diversity-a-corporate-performance-driver, 30. 7. 2019.)
Mkhize, M., Msweli, P., The impact of female business leaders on the performance of listed companies in South Africa, Journal of Economic and Management Sciences, 14 (1), 2011., p. 1-7. (http://www.scielo.org.za/scielo.php?script=sci_arttext&pid=S2222-34362011000100001, 14. 8. 2019.)
Nidegon Višnjić, S., et. al., Stavovi i percepcije žena na rukovodećim pozicijama o njihovom položaju na radnom mjestu, Ekonomska misao i praksa, 27 (1), 2018., p-287-313. (https://hrcak.srce.hr/index.php?show=clanak&id_clanak_jezik=297770, 13. 7. 2019.)
Posarić, N., et. al., Analiza zastupljenosti žena na upravljačkim pozicijama u hrvatskim poduzećima i njihov utjecaj na uspješnost poslovanja, Ekonomski pregled, 70 (2), 2019., p. 259-275. (https://hrcak.srce.hr/index.php?show=clanak&id_clanak_jezik=319386, 12. 7. 2019.)
Soldat, M., Žene u menadžmentu s osvrtom na primjere, Završni rad, Međimursko veleučilište u Čakovcu, Čakovec, 2018. (https://repozitorij.mev.hr/islandora/object/mev%3A802/datastream/PDF/view, 22. 7. 2019.)
Strelcova, J., Does Gender Matter? A Comparative Study of Performance of American CEOs, The Leonard N. Stern School of Business Glucksman Institute for Research in Securities Markets, 2014. (https://archive.nyu.edu/bitstream/2451/26400/2/FIN-05-001.pdf, 1. 8. 2019.)
Tacheva, S., Huse, M., Women directors and board task performance: mediating and moderating effects of board working style, EURAM meeting, 2006. (https://www.boeckler.de/pdf/v_2006_03_30_huse2_f5.pdf, 3. 8. 2019.)

Ž. Mateljak: Utjecaj spolne zastupljenosti u upravljačkim pozicijama na profitabilnost velikih…Zbornik Veleučilišta u Rijeci, Vol. 8 (2020), No. 1, pp. 1-17
16
Veštić, S., Zakon o ravnopravnosti spolova – razlozi donošenja i institucionalni mehanizmi osiguranja provedbe, Zbornik radova Veleučilišta u Šibeniku, 3 (4), 2017. (https://hrcak.srce.hr/184560, 13. 8. 2019.)
Zakon o ravnopravnosti spolova (NN, 82/08)
Zakon o ravnopravnosti spolova (NN, 69/17)
Zakon o ravnopravnosti spolova (NN, 116/03)
Zakon o računovodstvu (NN, 116/18)
Zakon o sustavu državne uprave (NN, 66/19)
Zakon o državnim službenicima (NN, 61/17)
https://lider.media/lider-trend/samo-202-godine-su-potrebne-da-se-izjednaciekonomski-jaz-izmedu-zena-i muskaraca/, (4. 7. 2019.)
https://www.credit-suisse.com/about-us-news/en/articles/media-releases/csri-gender3000-201609.html?t=183_0.5562689241064736, (21. 7. 2019.)
https://ec.europa.eu/info/policies/justice-and-fundamental-rights/gender equality, (21. 7. 2019.)
https://www.catalyst.org/wpcontent/uploads/2019/01/The_Bottom_Line_Corporate_Performance_and_Womens_Representation_on_Boards.pdf, (21. 7. 2019.)

Ž. Mateljak: Utjecaj spolne zastupljenosti u upravljačkim pozicijama na profitabilnost velikih…Zbornik Veleučilišta u Rijeci, Vol. 8 (2020), No. 1, pp. 1-17
17
Original scientific paper https://doi.org/10.31784/zvr.8.1.1 Received: 16. 9. 2019. Accepted: 18. 10. 2019.
IMPACT OF GENDER REPRESENTATION IN MANAGEMENT POSITIONS ON THE PROFITABILITY
OF LARGE ENTERPRISES IN THE REPUBLIC OF CROATIAŽeljko Mateljak
PhD, Assistant Professor, Faculty of Economics, Business and Tourism, University of Split, Cvite Fiskovića 5, 21 000 Split, Croatia; e-mail: [email protected]
ABSTRACTEach company endeavors to organize its operations with an appropriate management model implemented through governing bodies in relation to the current business environment. The basic governing bodies of many companies are the General Board, the Board of Directors and the Supervisory Board. The emphasis in this paper was on the analysis of gender representation in managerial positions, that is, whether there is a difference in the profitability of large enterprises in the Republic of Croatia compared to the representation of women and men in managerial positions. The subject of this paper is to recognize the importance of gender representation in management positions in large enterprises in the Republic of Croatia. The problem of this paper is determine how gender representation in management positions contributes to greater profitability in large enterprises in the Republic of Croatia. The basic hypothesis of the paper is that there is a statistically significant difference between gender representation in management positions and the profitability of large enterprises in the Republic of Croatia. The survey is conducted on 148 large companies with over 600 employees in the Republic of Croatia. The results of the research showed that there is no statistically significant difference between profitability and gender representation in management positions in large enterprises with more than 600 employees in the Republic of Croatia. This research is the basis for further research on this topic in the Republic of Croatia.
Key words: gender representation, management positions, large enterprises, profitability
Creative Commons Attribution – NonCommercial 4.0 International License


M. Gregorić, T. Baldigara: Artificial neural networks in modelling seasonal tourism demand…Zbornik Veleučilišta u Rijeci, Vol. 8 (2020), No. 1, pp. 19-39
19
Original scientific paper https://doi.org/10.31784/zvr.8.1.2 Received: 25. 9. 2019. Accepted: 27. 12. 2019.
ARTIFICIAL NEURAL NETWORKS IN MODELLING SEASONAL TOURISM DEMAND – CASE STUDY OF
CROATIAMaja Gregorić
PhD, Assistant Professor, University of Rijeka, Faculty of Tourism and Hospitality Management, Primorska 42, 51 410 Opatija, Croatia; e-mail: [email protected]
Tea Baldigara PhD, Full Professor, University of Rijeka, Faculty of Tourism and Hospitality Management,
Primorska 42, 51 410 Opatija, Croatia; e-mail: [email protected]
ABSTRACTThe purpose of this paper is to design an artificial neural network in the attempt to define the data generating process of the number of German tourist arrivals in Croatia considering the strong seasonal character of empirical data. The presence of seasonal unit roots in tourism demand determinants is analysed using the approach developed by Hylleberg, Engle, Granger and Yoo – Hegy test. The study is based on seasonality analysis and Artificial Neural Networks approach in building a model which intend to describe the behaviour of the German tourist flows to Croatia. Different neural network architectures were trained and tested, and after the modelling phase, the forecasting accuracy and model performances were analysed. Model performance and forecasting accuracy evaluation was tested using the mean absolute percentage error. Based on the augmented HEGY test procedure it can be concluded the German tourist arrivals to the Republic of Croatia have nonstationary behaviour associated with the zero frequency and seasonal frequency. Taking this into consideration, in the analysis of the phenomenon it is necessary to consider its seasonal character. Given the importance of the tourism for Croatian economic development, the research results could be useful, for both, researchers and practitioners, in the process of planning and routing the future Croatian hotel industry development and improvement of business performances.
Key words: Croatian tourism, seasonality, Hegy seasonal unit root test, artificial neural network model, MAPE
Creative Commons Attribution – NonCommercial 4.0 International License

M. Gregorić, T. Baldigara: Artificial neural networks in modelling seasonal tourism demand…Zbornik Veleučilišta u Rijeci, Vol. 8 (2020), No. 1, pp. 19-39
20
1. INTRODUCTION
The seasonality of tourism has been subject of many researches for many years worldwide, as well in Croatia, where tourism is the main driver of economic development. In general, tourism demand shows an increase, but various fluctuations influenced by numerous factors and external influences also. It is no surprise that in a numerous studies of tourism demand attention has been devoted to international tourist flows, due to their significance, but also due the fact that international tourism is statistically better captured than domestic tourism. According to data of Ministry of Tourism (2018), the highest number of foreign tourist arrivals in 2017 was realized by German tourists, followed by tourists from Italy, Slovenia and Austria. Considering the fact that the largest number of international tourist arrivals is realized by German tourists, in this paper German tourist arrivals and basic variables affecting those arrivals were analysed. This kind of analysis should be an integral part of decision making processes regarding tourism policy in the Republic of Croatia.
2. LITERATURE REVIEW
Considering the great importance of tourism for national economy, and the complexity and variability of tourism market, researchers and practitioners as well have to pay great attention to tourism demand modelling and forecasting. The most recent paper by Song, Qui and Park (2019) reviewed 211 key paper with the main topic of tourism demand modelling and forecasting. The authors concluded that tourism demand forecasting methods have been evolving over past five decades, forecasting models have grown more diversified and there is no single method that performs well for all situations…The development of AI-based models is notable in the most recent tourism demand forecasting studies, despite the theoretical and technological limitations of these methods. In the paper by Wu et.al. (2017) the review of new developments in tourism demand forecasting that consider numerous data measurements of tourism demand and their determinants have also been made. Before this research, a more complex literature review was elaborated by Goh and Law (2011), in time when the adoption of the AI- based models in tourism demand studies were just recent and limited. In the mentioned study 15 AI- based tourism demand forecast papers were identified, and divided into two major categories; AI- based causal methods and AI- based time series models. Still, researchers are pointing out that time series models, econometric approach and artificial intelligence models are the three main categories of quantitative forecasting models (Peng et al. 2014, 182).
Since more researchers show their interest for the issue of more accurate forecasting results, this methodology has been considered interesting in economics and business areas since it is viewed as a valid alternative to the classical forecast approaches event in complex situations (Fernandes et al. 2011).
In Cang’s paper (Cang, 2011) the complexity of tourism demand as social phenomenon was modelled by non-linear tourism demand forecast combination model. In the paper nine individual models were proposed; three linear combination models and one non-linear to model UK inbound tourism quarterly arrivals. Comparing mentioned models, the author concluded that the non-linear combination forecasting model, multilayer perceptron neural network showed the best performance compared to individual forecasting models and to all linear combination models.

M. Gregorić, T. Baldigara: Artificial neural networks in modelling seasonal tourism demand…Zbornik Veleučilišta u Rijeci, Vol. 8 (2020), No. 1, pp. 19-39
21
Lin et al. (2011) modelled the data set of monthly visitors to Taiwan using ARIMA, ANN and MARS. According to this research, ARIMA showed the best forecasting performance. Taking into account a stochastic trend in data on the tourist arrivals to Catalonia (Spain) from 2001 to 2012 from different markets, Claveria and Torra (2014) applied a multivariate neural networks (MLP, RBF and Elman neural network) to obtain its forecasts. The modelling procedure was as usual in neural network modelling; training, validation and testing. In comparison of each neural network, it was concluded that MLP and RBF networks showed better forecasting performance than Elman network. The most significant contribution of those research is the innovative approach to tourism demand modelling and forecasting. Neural networks, as an artificial intelligence methodology for tourism demand modelling have been regarded by many theoretical and practitioners as promising technology, and consequently, in the last few decades more than 2000 articles on neural networks forecasting have been published covering a wide range of application (Yu et al., 2017).” Uysal and El Roubi (1999) demonstrated the usefulness of artificial neural networks as an alternative approach to the use of multiple regression in tourism demand using Canadian tourism expenditures in US as a measure of demand. Those authors identified that the application of ANN in tourism demand studied is useful in identifying existing patterns that may not be relieved by some other forecasting method, and in some cases their implementation result in better estimates in terms of prediction.
When considering studies dealing with implementation of artificial neural in Croatian tourism, the interest of researchers has been growing lately. In the study of Krešić et al. (2013) the particular advantages and shortcomings of ANN-based applications using an empirical case example were demonstrated. The authors used the data from a survey on attitudes and expenditures of tourists in Sarajevo, Bosnia and Herzegovina, and performed a multilayer perceptron-based key-driver analysis to obtain insight into those destination attributes that have a predominant influence on the overall tourist experience in Sarajevo. The results from the ANN-based analysis are compared to results from a regression-based key-driver analysis in order to identify possible significant differences between the approaches. Folgieri et al. (2017) modelled a backpropagation Artificial Neural Network to forecast tourist arrivals in Croatia and compared the results with those obtained with the linear regression methods. The results showed that using the neural network model to predict tourists’ arrivals outperforms linear regression techniques. In the second step of their research, the same authors modelled and applied a backpropagation artificial neural network (ANN) to forecast tourists’ arrivals in Croatia (Folgieri et al., 2018). Applying a machine learning method for decision support and pattern discovery such as ANN, represents an occasion to achieve a greater accuracy if compared to results usually obtained by other methods, such as linear regression. The authors extended the model of the previously used backpropagation Artificial Neural Network, with the data from sentiment analysis collected through social networks on the Internet. The accuracy of the neural network has been measured by the Mean Squared Error (MSE) and compared to results obtained applying the ANN without data coming from the sentiment analysis. The results showed that including data from sentiment analysis, outperforms the previous obtained results.
Since the seasonality is a one of a prominent feature of tourism, there is a large number of papers dealing with seasonality research and determination. Although numerous studies on seasonality in tourism have been conducted, formal tests of seasonality can be found in relatively few papers. Chang

M. Gregorić, T. Baldigara: Artificial neural networks in modelling seasonal tourism demand…Zbornik Veleučilišta u Rijeci, Vol. 8 (2020), No. 1, pp. 19-39
22
and Liao (2010) presented the HEGY for the seasonal unit root that was used for the departures of destinations from Taiwan to Hong Kong, Japan and the USA in order to make an accurate inference about data seasonality. Vergori (2012) suggests that it is important to test the stochastic nature of the underlying process by using unit root tests. In order to test for seasonal unit roots, it is necessary to factorize the seasonal difference polynomial that for monthly data is defined as ∆_12=(1-L^12) where L is the backshift operator that is L^j X_t=X_(t-j). The research results showed that the seasonal backshift operator should be applied to the sample of monthly arrivals in the Province of Lecce in order to achieve a stationary time series. Chaitipa and Chaiboonsri (2014) provided a non-linear forecasting models for prediction of the international tourist arrival to Thailand by using data from period 1998-2014, and the extent version of seasonal unit root test was performed out to test the data. The main conclusion was that the movement of international tourist arrivals to Thailand was affected by seasonal unit root process during observed period.
As the literature review indicates, the topic of tourism seasonality is analysed in more detail in the foreign literature, while in the domestic literature it is somewhat less. The authors of this paper, therefore, attempted to examine the character of international tourist arrivals in Croatia and to generate an artificial neural network model that represents the observed data. Given the importance of accurate forecasts for the dynamic and complex tourism market, the aim of this research is to identify the possibilities of applying an artificial neural network approach in analysing phenomena that a strong seasonal component.
3. DATA AND METHODOLOGY
In the chapters below the selection of variables and methodology will be presented.
3. 1 The selection of variables
The selection of tourism demand measure, as dependent variable, and independent variables as its determinants, was established and confirmed by relevant literature on tourism demand studies (Uysal and El Roubi, 1999; Fretchling, 2001; Song, et.al., 2012; Shafiullah et.al., 2019). In this study the following variables were used:
- the total German tourism arrivals in Croatia
- the German gross domestic product at market prices
- the tourism price variable for German tourists, which is calculated from the following equation:
This variable takes into account the effect of both relative inflation and the exchange rate on the demand for tourism to Croatia.

M. Gregorić, T. Baldigara: Artificial neural networks in modelling seasonal tourism demand…Zbornik Veleučilišta u Rijeci, Vol. 8 (2020), No. 1, pp. 19-39
23
- set of dummy variables for each month
t - some period time
At any time of period t, one of the seasonal dummies D1,t, D2,t, D3,t,…, Ds,t will equal 1, while all the others will equal 0. The rule is to use one fewer dummy variables than categories. So, for monthly data, in this research eleven dummy variables were used.
The main hypothesis is that the German tourist arrivals can be explained as a function of the variables selected in the study. Monthly data, from January 2001 to December 2018 (216 observations), were collected from Croatian Bureau of Statistics (First Releases) and Eurostat databases. Since gross domestic product measures the total output of an entire economy by adding up total consumption, investment, government expenditure, and net exports, in this research German gross domestic product at market prices is considered a quality approximation of income for an entire economy in the observed period. Due to the lack of monthly data on gross domestic product, in the research data for this variable were collected on a quarterly basis and were converted to monthly data using linear-match last low to high frequency method. This method inserts the low observation value into the last period of the high frequency data, then performs linear interpolation on the missing values.
The analysis was performed using Eviews 10.0., SPSS 22.0., and Stata 14.0. data analysis software packages.
3. 2 Methodology
An investigation of seasonal unit roots presence in this paper is conducted by the approach developed by Hylleberg et al. (1990); general procedure which allows tests for unit root at some seasonal frequencies without maintaining that unit roots are present at all seasonal frequencies. The augmentation lag selection was suggested by Rodriques and Taylor (2007). After seasonality identification, an artificial neural network model was established and evaluated using the mean absolute percentage error.
3. 2. 1 Testing for seasonal unit roots in monthly data – HEGY test
Univariate seasonal time series data generating process is assumed to be as follows:
Where:
- number of seasons- deterministic part of time series- stochastic part of time series

M. Gregorić, T. Baldigara: Artificial neural networks in modelling seasonal tourism demand…Zbornik Veleučilišta u Rijeci, Vol. 8 (2020), No. 1, pp. 19-39
24
- an AR(S) polynomial α(L)=(1-α_1^* L-α_2^* L^2-…-α_S^* L^S)
- lag operatorGeneral HEGY procedure explains how to test for seasonal unit roots in processes that may also exhibit deterministic or stationary stochastic seasonality. HEGY procedure, simplified by Beaulieu and Miron (1993) is presented below.
The approach of Hylleberg et. al. (1990) is based on expanding α(L) around zero and seasonal frequency unit roots {exp (±i2πj/S); j=0,…,S/2}. Generally, the testing equation of the Hegy approach can be written as:
where:
As this study considers monthly data, equations (2) and (3) become:
Where:

M. Gregorić, T. Baldigara: Artificial neural networks in modelling seasonal tourism demand…Zbornik Veleučilišta u Rijeci, Vol. 8 (2020), No. 1, pp. 19-39
25
Hegy procedure testing reported the following tests:
Roots Frequncy test Test tail
One real root t[0] left tail
One real root 2 t[pi] left tail
Two complex conjugate roots
12 t[pi/6] upper tail
Two complex conjugate roots
6 t[pi/3] upper tail
Two complex conjugate roots
4 t[pi/2] upper tail
Two complex conjugate roots
3 t[2pi/3] upper tail
Two complex conjugate roots
t[5pi/6] upper tail
*number of periods to complete a full cycle
The following testes are reported also:
Roots Frequencies Test Test tail
All seasonal roots
F[seas] upper tail

M. Gregorić, T. Baldigara: Artificial neural networks in modelling seasonal tourism demand…Zbornik Veleučilišta u Rijeci, Vol. 8 (2020), No. 1, pp. 19-39
26
All roots inF[All] upper tail
3. 2. 2 Lag – length selection
According to literature (Hall, 1994; Ng and Perron, 1995) different methods can be used in order to determine the order of augmentation for the Hegy regression (e.g. criteria such as AIC, BIC or MAIC, or sequential method). In this paper the sequential method has been used. The maximum lag length (kmax) was determined using following equation:
Where Int[.] is the integer part and T is total sample size. In the case when sequential method is used, the lag selection procedure starts by fitting the model with and tests sequentially for the significance of the coefficient associated with until the null is rejected. Following the suggestion of Ng and Perron (1995), to determine the individual significance of the lags of
, the researcher have to use the standard normal distribution critical values and select a 10% level of significance the default value.
3. 2. 3 Artificial neural networks
Due to the importance of tourism, complexity and variability of the numerous elements that should be considered in the implementation of an effective model, tourism demand modelling and forecasting is one of the most challenging fields in tourism research. In this context, the implementation of artificial neural networks has proved to be particularly advisable, thanks to their ability to approximate any kind of function within a desirable range (Thiesing and Vornberger, 1997; Crone, 2002).
The artificial neural network models consist of set of nodes (neurons) for processing input data and a set of connections for “memorizing” information. Through an activation transfer function, each node processes the input signal received from other nodes and produces a transformed output signal to other nodes (Claveira et al., 2015, 493).
Figure 1. A neural network model
Source: Authors adoption according to Fernandes and Texeira (1999)

M. Gregorić, T. Baldigara: Artificial neural networks in modelling seasonal tourism demand…Zbornik Veleučilišta u Rijeci, Vol. 8 (2020), No. 1, pp. 19-39
27
The inputs in a multilayer artificial neural network are connected to the output via a middle layer. Generally, the network model can be specified as:
where:
- dependent variable (regressand variable)
- a vector of regressors which include eleven monthly dummy variables- the number of units in the middle layer- Sigmoid transfer function- a vector of coefficients (or weights) from the middle to output layer unit- a matrix of coefficients from the input to middle-layer units at time t
- some period time Depending on the connecting patterns of different layers, two major types of architecture can be distinguished; feed-forward networks and recurrent (back propagation) network. Main difference between them is that in feed-forward networks the information runs only in one direction, since recurrent networks are feedback connections from outer layers of neuron to lower layer of neurons, which takes into account the temporal structure of the data. The data-driven nature of artificial neural networks makes those models overcome the limitation of traditional forecasting methods, including misspecification, biased outliers, assumption of linearity, and re-estimation. The modelling approach used in this paper consists of four main phases, as follow: data pre-processing, architecture selecting, training process and model performance evaluating. Data pre-processing implies that data were inspected and selected so there were no missing values. Also, all data were normalised by subtracting the minimum and dividing by the range, (x-min)/(max-min), so all normalized values were in [0,1] interval. Since the range of values of observed data varies widely, in some machine learning algorithms, objective functions will not work properly without normalization.
Constructing an efficient neural network involves choosing an appropriate architecture – the number of layers, units in each layer and the connections among units – selecting the transfer function of the middle and output units, designing a training algorithm, choosing initial weights and specifying rule. For this research, a common artificial neural network architecture is used, which can be described as: Continuous-valued input layer containing thirteen nodes (processing units) corresponding to the number of variables proposed to estimate the number of German tourist arrivals to Croatia, one hidden layer containing eight nodes to handle nonlinearities inherent in data set, and one output layer containing one node corresponding to the one dependent variable subject to the analysis.
After architecture selection it is very important to select which parts of the data set will be used in training, validation and holdout. The training set is the subsection of an observed data from which

M. Gregorić, T. Baldigara: Artificial neural networks in modelling seasonal tourism demand…Zbornik Veleučilišta u Rijeci, Vol. 8 (2020), No. 1, pp. 19-39
28
the machine learning algorithm “learns,” relationships between the input and the target variable. The validation set is another subset of the input data to which the machine learning algorithm has to be applied in order to see how accurately it identifies relationships between the known outcomes for the target variable and the dataset’s other features. The holdout subset, called also “testing” set, provides a final estimate of the machine learning model’s performance after it has been trained and validated.
In this paper the standard three-layer feedback artificial neural network model is used. One output node is employed. The activation function for hidden nodes is sigmoid function:
The sigmoid function takes real-valued arguments and transforms them to the range 0 to 1. The activation function for the output node is the identity function (pure linear function):
This function takes real-valued arguments and returns them unchanged. Bias terms were used in both hidden and output nodes.
After selecting the activation functions, the batch type of training was selected. This kind of training updates synaptic weights only after passing all training data records which means that this kind of training uses information from all records in training data set. The advantage of this kind of training is that it directly minimizes the total error, but for that purpose it need to update weights many times until one of stopping rules is met. Hence, the batch training may need many data passes.
3. 2. 4 Mean Absolute Percentage Error
After modelling German tourist arrivals to Croatia, it was necessary to examine the forecast accuracy of the chosen artificial neural network. Due to its advantages of scale-independency, and interpretability as well, in this research as a measure of modelling accuracy mean absolute percentage error (MAPE) has been used.
The Mean Absolute Percentage Error is expressed in generic percentage terms and it is computed by the following formula:
Where:
- the actual value
- the forecasted value
- the number of observation
- some period time

M. Gregorić, T. Baldigara: Artificial neural networks in modelling seasonal tourism demand…Zbornik Veleučilišta u Rijeci, Vol. 8 (2020), No. 1, pp. 19-39
29
MAPE is measure which permits the comparison of different models, with different time periods and number of observations. Measures based on percentage errors, such this, have the disadvantage of being infinite or undefined if yt=0 for any observation in the test set, and having extreme values when any yt is close to zero.
4. EMPIRICAL RESULTS AND DISCUSSION
In this section, the results obtained from empirical research are presented and discussed in detail. As previously mentioned, the results are based on a sample size that covers the period from January 2001 to December 2018, which includes 216 observations.
Figures 2 to 4 depict the evaluation of the analysed series in total [figure (a)] and in natural logarithm [figure (b)]. Primary goal is to determine whether the seasonality observed in time series show only a determinist nature or whether it is caused by the presence of unit roots.
Figure 2. Total and natural logarithm of German tourist arrivals to Croatia
0.00
2000
00.0
040
0000
.00
6000
00.0
080
0000
.00
Y_G
er
2000m1 2005m1 2010m1 2015m1 2020m1time
810
1214
lnY
_Ger
2000m1 2005m1 2010m1 2015m1 2020m1time
a) total b) natural logarithm
Source: Authors
Figure 3. Total and natural logarithm of gross domestic product at market prices
5000
0060
0000
7000
0080
0000
9000
00G
DP_
Ger
2000m1 2005m1 2010m1 2015m1 2020m1time
13.2
13.3
13.4
13.5
13.6
13.7
lnG
DP_
GER
2000m1 2005m1 2010m1 2015m1 2020m1time
a) total b) natural logarithm
Source: Authors

M. Gregorić, T. Baldigara: Artificial neural networks in modelling seasonal tourism demand…Zbornik Veleučilišta u Rijeci, Vol. 8 (2020), No. 1, pp. 19-39
30
Figure 4. Total and natural logarithm of tourism price variable
.115
.12
.125
.13
.135
.14
RC
PI_G
er
2000m1 2005m1 2010m1 2015m1 2020m1time
-2
.15
-2.1
-2.0
5-2
-1.9
5ln
RC
PI_G
er
2000m1 2005m1 2010m1 2015m1 2020m1time
a) total b) natural logarithm
Source: Authors
Based on the figures 2 - 4 it is decided to perform the further analysis on natural logarithm values of the data. Namely, to avoid the negative effects on the results of the seasonal unit-root testing which can be caused by changing variance (which is case in observed sample), it is advisable to analyse natural logs of the observed data.
The results of the performed seasonal unit-root testing by HEGY approach are shown in tables 1 – to 3. The results will be interpreted at the 5% level significance.
Table 1. HEGY seasonal unit root test for lnY_Ger
F[All] 16.827 8.332 7.274 6.755F[All seas] 18.316 8.393 7.304 6.771F[5*Pi/6] 14.706 11.422 8.969 7.832F[2*Pi/3] 11.473 11.422 8.969 7.832F[Pi/2] 10.511 11.422 8.969 7.832F[Pi/3] 7.444 11.422 8.969 7.832F[Pi/6] 4.680 11.422 8.969 7.832 t[Pi] -3.891 -3.843 -3.284 -3.001t[0] 0.752 -3.843 -3.284 -3.001------------------------------------------------------------------------------ Stat 1% critical 5% critical 10% critical Augmented by lags : 11Lags tested: 14Optimal lag selection method: Sequential at 10% levelDeterministic variables : Seasonal dummies and seasonal trendsNumber of observations : 193 HEGY Monthly seasonal unit root test for lnY_Ger
Source: Authors

M. Gregorić, T. Baldigara: Artificial neural networks in modelling seasonal tourism demand…Zbornik Veleučilišta u Rijeci, Vol. 8 (2020), No. 1, pp. 19-39
31
Based on table 1, the null hypothesis of the presence of a unit root at frequency zero cannot be rejected. Note that t[0] statistics is a left-tail test; the reported statistics is less negative than the critical value associated with 5%l level. Therefore, the statistics do not fall in the rejection region of the null hypothesis. In the case of t[Pi] test (the other left-tail test), situation is opposite. Since the test statistic is smaller than the critical value, the null hypothesis of the presence of a unit root at the frequency π can be rejected. All the remaining tests (F[Pi/6] to F[All]) are upper-tail test, and as such, the null hypothesis can be rejected when the test statistics is bigger than the critical value. In this case, the null hypothesis is rejected in all tests, except in the case of the two complex roots associated with frequency π/6 (test F[Pi/6]) and π/3 (test F[Pi/3]). It can be concluded that one unit root at the frequency zero is found, as well as the two complex conjugate unit roots at π/6 and π/3 frequency. Based on HEGY test, when the lag length is determined by sequential method, the German tourist arrivals to Croatia have nonstationary behaviour associated with the zero frequency and the frequency associated with seasonal oscillations that complete a full cycle after 6 or 12 months.
Table 2. HEGY seasonal unit root test for lnGDP_Ger
F[All] 15.296 8.316 7.267 6.752F[All seas] 15.805 8.379 7.298 6.770F[5*Pi/6] 14.411 11.442 8.991 7.853F[2*Pi/3] 26.563 11.442 8.991 7.853F[Pi/2] 14.167 11.442 8.991 7.853F[Pi/3] 4.024 11.442 8.991 7.853F[Pi/6] 13.208 11.442 8.991 7.853 t[Pi] -2.058 -3.846 -3.288 -3.005t[0] -2.292 -3.846 -3.288 -3.005------------------------------------------------------------------------------ Stat 1% critical 5% critical 10% critical Augmented by lags : 5Lags tested: 14Optimal lag selection method: Sequential at 10% levelDeterministic variables : Seasonal dummies and seasonal trendsNumber of observations : 199 HEGY Monthly seasonal unit root test for lnGDP_GER_MON
Source: Authors
According to data in table 2, it can be concluded that logarithm of German gross domestic product has one unit root at frequency zero and π, but also two complex conjugate unit roots at the frequency π/3. That means that logarithm of German gross domestic product at market prices has nonstationary behaviour associated with the zero frequency, and with the frequency associated with seasonal oscillations that complete a full cycle after six months also.

M. Gregorić, T. Baldigara: Artificial neural networks in modelling seasonal tourism demand…Zbornik Veleučilišta u Rijeci, Vol. 8 (2020), No. 1, pp. 19-39
32
Table 3. HEGY seasonal unit root test for lnRCPI_Ger
F[All] 14.242 8.335 7.275 6.756F[All seas] 15.416 8.396 7.305 6.772F[5*Pi/6] 15.565 11.418 8.966 7.828F[2*Pi/3] 8.497 11.418 8.966 7.828F[Pi/2] 7.476 11.418 8.966 7.828F[Pi/3] 5.920 11.418 8.966 7.828F[Pi/6] 8.283 11.418 8.966 7.828 t[Pi] -4.075 -3.842 -3.284 -3.000t[0] -0.941 -3.842 -3.284 -3.000------------------------------------------------------------------------------ Stat 1% critical 5% critical 10% critical Augmented by lags : 12Lags tested: 14Optimal lag selection method: Sequential at 10% levelDeterministic variables : Seasonal dummies and seasonal trendsNumber of observations : 192 HEGY Monthly seasonal unit root test for lnRCPI_Ger
Source: Authors
Based on the table 3, it can be concluded that the logarithm of the tourism price variable has nonstationary behaviour also. This series have one unit root at the frequency zero, and two complex conjugate roots at all other frequencies, except π and 5π/6. Since the dummy variables are seasonal categorical variables, the seasonal unit root test does not need to be performed on those variables.
After the presence of seasonal nonstationary behaviour has been confirmed, the creation of an artificial neural network was initiated. It should be stressed that a pre-processing was undertaken on the input and output data, corresponding only to a normalization in the range –1 to 1, for all the variables.
Table 4. Case Processing Summary
N Percent
Sample
Training 125 57,9%
Testing 68 31,5%
Holdout 23 10,6%
Valid 216 100,0%
Excluded 0
Total 216
Source: Authors

M. Gregorić, T. Baldigara: Artificial neural networks in modelling seasonal tourism demand…Zbornik Veleučilišta u Rijeci, Vol. 8 (2020), No. 1, pp. 19-39
33
As shown in table 4, the analysed time series data were divided into three sets: the training set (125 observations), validation set (68 observations) and holdout set (23 observations).
As already said, the selected artificial neural network model is a multilayer backpropagation model type 13:8:1. As activation function in hidden layers the sigmoid function was used, and for the output node the identity (linear).
The final artificial neural network is depicted in figure 5.
Figure 5. The artificial neural network model
The information from software output shows a couple of positive signs, which are shown below.

M. Gregorić, T. Baldigara: Artificial neural networks in modelling seasonal tourism demand…Zbornik Veleučilišta u Rijeci, Vol. 8 (2020), No. 1, pp. 19-39
34
Figure 6. Residual by predicted chart
Source: Authors
The figure 6 presents a residual-by-predicted-value chart for scale-dependent variable. As evident, there are no visible patterns between residuals and predicted values of dependent variable.
The importance of an independent variable is a measure of how much the network’s model-predicted value changes for different values of the independent variable. The normalized importance is the importance values divided by the largest importance values and expressed as percentages.
Figure 7. Independent variable importance chart
Source: Authors

M. Gregorić, T. Baldigara: Artificial neural networks in modelling seasonal tourism demand…Zbornik Veleučilišta u Rijeci, Vol. 8 (2020), No. 1, pp. 19-39
35
The figure 7 shows a bar chart of the values of importance, sorted in descending value of importance. As expected, the seasonal dummy variables for August and July have the greatest importance. Those variables have the greatest effect on the German tourist arrivals to Croatia, which was one of the assumptions of this research. As shown in figure, the weakest effect on the dependent variable is the effect of dummy variable for November. The following table presents the calculated values of independent variable importance.
Table 5. Independent variable importance
Importance Normalized Importance
d1 ,027 16,6%
d2 ,018 10,9%
d3 ,043 26,7%
d4 ,082 51,1%
d5 ,122 75,7%
d6 ,132 82,0%
d7 ,145 90,1%
d8 ,161 100,0%
d9 ,135 83,8%
d10 ,094 58,4%
d11 ,005 3,4%
lnRCPI_Ger ,008 4,8%lnGDP_GER_MON ,028 17,2%
Source: Authors
The table above confirms the interpretation of the figure 7. The most important variables are dummy variables for August (a contribution of 100% to the outputs) and July (a contribution of 90,1% to the outputs). The price variable has surprisingly low importance (4,8%), while the gross domestic product variable has more importance (17,2%) to the target variable. Such results can be explained by the assumption that the German tourists are primary motivated for traveling to Croatia not because of the service price or their purchasing power. They are probably motivated by some other variables, which are, in this research, included in the dummy variables.
The obtained artificial neural network model has been evaluated according to some accuracy criteria. According to Baggio and Klobas (2011,151) a MAPE value of 1,601% indicates a high model forecasting accuracy.

M. Gregorić, T. Baldigara: Artificial neural networks in modelling seasonal tourism demand…Zbornik Veleučilišta u Rijeci, Vol. 8 (2020), No. 1, pp. 19-39
36
Figure 8. Total and natural logarithm of actual and fitted values of German tourist arrivals
020
0000
4000
0060
0000
8000
00
2000m1 2005m1 2010m1 2015m1 2020m1time
Y_Ger Y_Ger_forecast
8
1012
14
2000m1 2005m1 2010m1 2015m1 2020m1time
lnY_Ger lnY_Ger_forecast
a) total b) natural logarithm
Source: Authors
The figure above confirms that backpropagation artificial neural model fits well the actual data through the sample period. Selected model shows that forecasted values of analysed series follow the behaviour of the empirical data set. The assumption that German tourist arrivals to Croatia are, besides tourism price variable and gross domestic product at market prices variable, strongly affected by seasonal impact is confirmed, which confirms credibility of Hegy seasonal unit root test conducted in the first part of the research.
5. CONCLUSION
Due to the importance of tourism for the Croatian economy, and the fact that tourists from German markets make the main number of international tourist arrivals to Croatia, the main purpose of this research was to examine the seasonality of the number of German tourist arrivals in the Republic of Croatia. The presence of seasonal unit roots is analysed using the approach developed by Hylleberg, Engle, Granger and Yoo – Hegy test. Based on the augmented HEGY test procedure the main conclusion is made; the German tourist arrivals to the Republic of Croatia have nonstationary behaviour associated with the zero frequency and seasonal frequency. After testing the seasonality occurrence, different neural network architectures were trained and tested. The proposed artificial neural network model confirmed the main assumption of this research - the German tourists are not primary motivated for traveling to Croatia because of the service price or their purchasing power. Analysis showed that the price and gross domestic product variables has much lower importance to the target variable in comparison to seasonal dummy variables. The calculated mean absolute percentage error – MAPE value of 1,601% indicates a high model forecasting accuracy. This kind of analysis forms an integral part of tourism policy and decision making regarding investment in public and private sector, as well as in marketing decisions in the Republic of Croatia. Therefore, this research is considered to be a good starting point for future research of the possibility of applying artificial intelligence methods in analysing
M. Gregorić, T. Baldigara: Artificial neural networks in modelling seasonal tourism demand…Zbornik Veleučilišta u Rijeci, Vol. 8 (2020), No. 1, pp. 19-39
37
tourism phenomenon. Future tourism research should be certainly addressed in investigating the possibility of using some other concepts of artificial intelligence. The ability of artificial intelligence to perform tasks which, traditionally, require human cognitive function, has made those methods useful for research in the tourism industry. As some previous research showed, as well as this one, the implementation of artificial intelligence approach primarily can save time and money and, at the same time, potentially eliminate human error and allow tasks to be performed quickly.
* This paper has been financially supported by the University of Rijeka, for the project ZP UNIRI 4/17.
REFERENCES
Baggio, R. & Klobas, J. (2011) ˝Quantitative Methods in Tourism˝, Bristol: Channel View Publications
Beaulieu, J.J., Miron, J.A. (1993) “Seasonal unit roots in aggregate U.S. data”, Journal of Econometrics, 55(1-2). pp. 305-328. https://doi.org/10.1016/0304-4076(93)90018-Z
Del Barrio Castro, T., Osborn, D.R., Taylor, A.M.R. (2016) “The Performance of Lag Selection and Detrending Methods for HEGY Seasonal Unit Root Tests”, Econometric Reviews, 35(1), pp. 122-168. https://doi.org/10.1080/07474938.2013.807710
Del Barrio Castro, T., Osborn, D.R. i Taylor, A.M.R. (2011) “On Augmented HEGY Tests for Seasonal Unit Roots”, The School of Economics Discussion Paper Series EDP 1121, https://doi.org/10.1017/S0266466612000060
Cang, S. (2011) “A Non- Linear Tourism Demand Forecast Combination Model”, Tourism Economics, 17(1), pp. 5- 20. 10.5367/te.2011.0031
Chang, Y.W. and Liao, M.Y. (2010) “A Seasonal ARIMA Model of Tourism Forecasting: The Case of Taiwan”, Journal Asia Pacific Journal of Tourism Research, 15(2), pp. 215-221.https://doi.org/10.1080/10941661003630001
Chaitipa, P. and Chaiboonsrib, Ch. (2014) “International Tourists Arrival to Thailand: Forecasting by Non-linear Model”, Procedia Economics and Finance, 14, pp. 100-109. https://doi.org/10.1016/S2212-5671(14)00691-1
Claveria, O., Torra, S. (2014) “Forecasting tourism demand to Catalonia: Neural networks vs. time series models”, Economic Modelling, 36, pp. 220- 228. doi:10.1016/j.econmod.2013.09.024
Crone, S. F. (2002) “Training artificial neural networks for time series prediction using asymmetric cost functions” In: Proceedings of the 9th International Conference on Neural Information Processing, 18-22 November, Singapore, pp. 2374-2380. doi:10.1109/iconip.2002.1201919
Fernandes, P.O, Texeira, J. (2008) “Applying the artificial neural netwoek methodology for forecasting the tourism time seris”, In: Proceeding of 5th International Scintific Conference Business and Management 2008, 16-17 May 2008, Vilnius, Latvia: Faculty of Business Management, pp. 653-658.
Fernandes, P.O., et.al. (2011) “Forecasting Tourism Demand with the Artificial Neural Networks”, In: Book of proceedings Vol. II– International conference on tourism & management studies, 26-29 October, Algarve, pp. 1017-1019.
Folgieri, R., Baldigara, T., Mamula M. (2018) “Sentiment analysis and artificial neural networks-based econometric models for tourism demand forecasting”, In: Proceedings of the 25th International Congress Tourism and Hospitality Industry 2018, April 26 – 27, Opatija, Hrvatska: Fakultet za menadžment u turizmu i ugostiteljstvu, pp. 88-97.
Folgieri, R., Baldigara, T., Mamula M. (2017) “Artificial neural networks-based econometric models for tourism demand forecasting” In: Proceedings of the 4th International Scientific Conference Tourism and Creative Industries: Trends and Challenges, May 4 – 6, 2017, Opatija, Hrvatska: Fakultet za menadžment u turizmu i ugostiteljstvu, pp. 169-182.

M. Gregorić, T. Baldigara: Artificial neural networks in modelling seasonal tourism demand…Zbornik Veleučilišta u Rijeci, Vol. 8 (2020), No. 1, pp. 19-39
38
Frechtling, D. C. (2001) Forecasting tourism demand: methods and strategies, Oxford: Elsevier Ltd.
Goh, C., Law, R. (2011) “The Methodological Progress of Tourism Demand Forecasting: A Review of Related Literature”, Journal of Travel & Tourism Marketing, 28(3), pp. 296- 317. https://doi.org/10.1080/10548408.2011.562856
Hall, A. (1994) “Testing for a unit root in time series with pretest data-based model selection”, Journal of Business and Economic Statistics, 12(4), pp. 461–470. 10.2307/1392214
Hylleberg R. F. et al. (1990) “Seasonal integration and cointegration”, Journal of Econometrics, 4(1-2), pp.215-238. https://doi.org/10.1016/0304-4076(90)90080-D
Krešić, D., Mikulić, J., Kožić, I. (2013) “Artificial Neural Network-Based Applications in Travel and Tourism Research: A Review and Case Study” In: International critical tourism studies conference, Sarajevo, BIH, http://cts.som.surrey.ac.uk/publication/artificial-neural-network-based-applications-in-travel-and-tourism-research-a-review-and-case-study/wppa_open/ (15.6.2019.)
Lin, C.J., Chen, H.F., Lee, T.S.. (2011) “Forecasting Tourism Demand Using Time Series, Artificial Neural Networks and Multivariate Adaptive Regression Splines: Evidence from Taiwan”, International Journal of Business Administration, Vol. 2, No. 2, pp. 14- 25. doi: 10.5430/ijba.v2n2p14
Ministry of Tourism (2018.), Turizam u brojkama, 1-43. https://mint.gov.hr/UserDocsImages//AA_2018_cdokumenti//190614_HTZ%20TUB_2018_hrv.pdf
Ng, S., P. Perron. (1995) “Unit root tests in ARMA models with data-dependent methods for the selection of the truncation lag”, Journal of the American Statistical Association 90: 268–281. 10.2307/2291151
Peng, B., Song, H., Crouch, G.I. (2014) “A meta-analysis of international tourism demand forecasting and implications for practice”, Tourism Management, 45, pp. 181-193. https://doi.org/10.1016/j.tourman.2014.04.005
Rodrigues, P. M. M., Taylor A.M.R. (2004) “Asymptotic distributions for regressionbased seasonal unit root test statistics in a near-integrated model“, Econometric Theory, 20(4), pp. 645–670. https://doi.org/10.1017/S0266466604204029
Song, H., Witt, S. F., Li, G. (2012) “The Advanced Econometrics of Tourism Demand”, New York: Taylor & Francis Ltd
Song, H., Qui, R. T. R., Park, J. (2019) “A review of research on tourism demand forecasting”, Annals of Tourism Research, 75: 338-362. https://doi.org/10.1016/j.annals.2018.12.001
Shafiullah, M., Okafor, L. E., & Khalid, U. (2019) “Determinants of international tourism demand: Evidence from Australian states and territories”, Tourism Economics 25(2), pp. 274-296. 135481661880064.doi:10.1177/1354816618800642
Thiesing, F. M., Vornberger, O. (1997) “Forecasting sales using neural networks”, Lecture Notes in Computer Science, pp.321–328, 10.1007/3-540-62868-1_125
Uysal, M. El Roubi, S. (1999) “Artificial Neural Networks versus Multiple Regression in Tourism Demand Analysis”, Journal of Travel Research, pp. 111-118, https://doi.org/10.1177/004728759903800203
Yu, Y., Wang, Y., Gao, S., Tang, Z. (2017) “Modelling inbound tourism data”, Computational Intelligence and Neuroscience, 2017. pp.1-9. https://doi.org/10.1155/2017/7436948
Vergori, A. S. (2012) “Forecasting tourism demand: the role of seasonality”, Tourism Economics, 8(5), pp. 915–930. 10.5367/te.2012.0153
Wu C. D., Song, H., Shen, S. (2017) “New developments in tourism and hotel demand modeling and forecasting”, International Journal of Contemporary Hospitality Management”, 29(1), pp. 507-529. https://doi.org/10.1108/IJCHM-05-2015-0249

M. Gregorić, T. Baldigara: Artificial neural networks in modelling seasonal tourism demand…Zbornik Veleučilišta u Rijeci, Vol. 8 (2020), No. 1, pp. 19-39
39
Izvorni znanstveni rad https://doi.org/10.31784/zvr.8.1. 2 Datum primitka rada: 25. 9. 2019. Datum prihvaćanja rada: 27. 12. 2019.
UMJETNE NEURONSKE MREŽE U MODELIRANJU SEZONSKE TURISTIČKE POTRAŽNJE – STUDIJA
SLUČAJA HRVATSKEMaja Gregorić
Dr. sc., docentica, Sveučilište u Rijeci, Fakultet za menadžment u turizmu i ugostiteljstvu, Primorska 42, 51 410 Opatija, Hrvatska. e-mail: [email protected]
Tea Baldigara Dr. sc., redovita profesorica, Sveučilište u Rijeci, Fakultet za menadžment u turizmu i ugostiteljstvu,
Primorska 42, 51 410 Opatija, Hrvatska. e-mail: [email protected]
SAŽETAKSvrha je ovog rada dizajnirati umjetnu neuronsku mrežu sa ciljem definiranja procesa generiranja podataka o broju dolazaka njemačkih turista u Hrvatsku, uzimajući u obzir sezonski karakter empirijskih podataka. Prisutnost sezonskoga jediničnog korijena u odrednicama turističke potražnje analizirana je pristupom koji su razvili Hylleberg, Engle, Granger and Yoo – Hegyijevim testom. Istraživanje je temeljeno na analizi sezonalnosti i umjetnim neuronskim mrežama u stvaranju modela koji za cilj ima opisati ponašanje njemačkih turističkih tokova u Hrvatskoj. Trenirane su i testirane različite arhitekture neuronskih mreža, te je nakon faze modeliranja ocijenjena pouzdanost i analizirane su performanse modela. Prognostička pouzdanost modela testirana je srednje apsolutnom postotnom pogreškom. Temeljem rezultata Hegyijevog testa može se zaključiti kako je serija broja dolazaka njemačkih turista nestacionarna, na razini nulte i sezonske frekvencije. Uzimajući to u obzir, u analizi navedene pojave potrebno je uvažiti njezin sezonski karakter. S obzirom na važnost turizma za ekonomski razvoj Hrvatske, ovo bi istraživanje trebalo koristiti, kako istraživačima tako i praktičarima, u procesu planiranja razvoja hrvatske turističke industrije i u poboljšanja poslovnih performansi.
Ključne riječi: hrvatski turizam, sezonalnost, Hegy-jev test sezonskog jediničnog korijena, model umjetne neuronske mreže, MAPE
Creative Commons Attribution – NonCommercial 4.0 International License


I. Banović, H. Blažić, S. Drezgić: Utjecaj poreza na dobit na kretanje izravnih stranih ulaganja u…Zbornik Veleučilišta u Rijeci, Vol. 8 (2020), No. 1, pp. 41-58
41
Izvorni znanstveni rad https://doi.org/10.31784/zvr.8.1.3 Datum primitka rada: 15. 10. 2019. Datum prihvaćanja rada: 20. 1. 2020.
UTJECAJ POREZA NA DOBIT NA KRETANJE IZRAVNIH STRANIH ULAGANJA U ZEMLJAMA ČLANICAMA
EUROPSKE UNIJEIgor Banović
Univ. spec. oec., asistent u reviziji, Medicom d. o. o., Meštrovićeva 16, 51 000 Rijeka, Hrvatska; e-mail: [email protected]
Helena Blažić Dr. sc., redoviti professor u trajnom zvanju, Sveučilište u Rijeci, Ekonomski fakultet, Ivana Filipovića 13,
51 000 Rijeka, Hrvatska; e-mail: [email protected]
Saša Drezgić Dr. sc., izvanredni profesor, Sveučilište u Rijeci, Ekonomski fakultet, Ivana Filipovića 13, 51 000 Rijeka,
Hrvatska; e-mail: [email protected]
SAŽETAKVećina raspoloživog kapitala nalazi se u posjedu pravnih osoba, odnosno poduzeća (najčešće multinacionalnih kompanija) sklonih ulaganju u širenje vlastitog poslovanja, što ne donosi samo dodatno uvećanje profita poduzeća, već indirektno utječe i na povećanje zaposlenosti, rast gospodarstva, razvoj domaćeg financijskog tržišta te općeniti napredak države. Zato države širom svijeta aktivno utječu na formiranje povoljnog poslovnog okruženja koje će imati učinak na povećan priliv izravnih stranih ulaganja (Foreign Direct Investments – FDI). Cilj ovog rada je utvrditi utjecaj oporezivanja dobiti na privlačenje izravnih stranih ulaganja u zemljama članicama Europske unije. Statička panel analiza provedena je za razdoblje od 1998. do 2017. godine na 28 zemalja članica u cjelini, te posebno na starim članicama (EU 15) i novim članicama (EU13). Uz različite kontrolne varijable, kao nezavisna varijabla analizirane su različite stope poreza na dobit – zakonska (službena, nominalna) stopa poreza na dobit i efektivne (prosječna i granična) porezne stope u cilju ispitivanja stvarnog poreznog opterećenja trgovačkih društava i njihovog utjecaja na kretanje izravnih stranih ulaganja. Zaključeno je kako porez na dobit značajno utječe na kretanje izravnih stranih ulaganja trgovačkih društava u novim zemljama članicama Europske unije (koje karakterizira niže porezno opterećenje), ali ne kao primarni čimbenik, pri čemu se ističe društveni proizvod. U tom kontekstu najveći utjecaj ima efektivna prosječna porezna stopa.
Ključne riječi: porez na dobit, izravna strana ulaganja, EU 15, EU 13
Creative Commons Attribution – NonCommercial 4.0 International License

I. Banović, H. Blažić, S. Drezgić: Utjecaj poreza na dobit na kretanje izravnih stranih ulaganja u…Zbornik Veleučilišta u Rijeci, Vol. 8 (2020), No. 1, pp. 41-58
42
1. UVOD
Globalizacija je značajno doprinijela širenju poslovanja poduzeća izvan granica matičnih država, većoj mobilnosti kapitala te ekspanziji multinacionalnih kompanija u potrazi za novim tržištima i dodatnim uštedama. S obzirom da su investicije pokretač gospodarskog rasta i razvoja, države u želji pridobivanja većeg udjela stranog kapitala nastoje povećati svoju atraktivnost, između ostalog i nižim zakonskim stopama te raznim poreznim poticajima i olakšicama poreza na dobit.
Predmet istraživanja u ovom radu je porezna politika (na primjeru poreza na dobit) i njen utjecaj na privlačenje izravnih stranih ulaganja u zemljama Europske unije. Posebno je istaknuta uloga ne samo zakonskih poreznih stopa, već i poreznih olakšica i poticaja (čiji efekt dolazi do izražaja kroz tzv. efektivne porezne stope) u svrhu poticanja investicija.
Cilj rada je istražiti utjecaj oporezivanja dobiti poduzeća na privlačenje izravnih stranih ulaganja u zemljama članicama Europske unije u cjelini te posebno starim i novim članicama.
Temeljem navedenog, postavlja se hipoteza ovog rada - smanjenje poreznog opterećenja dobiti poduzeća predstavlja jedan od čimbenika odluke investitora u odabiru lokacije ulaganja kapitala. Smatra se da manja razina poreznog opterećenja dobiti predstavlja dodatni poticaj investitorima na odabir lokacije ulaganja, kada u uži izbor ulazi više zemalja sa sličnim pokazateljima poslovnog okruženja. S obzirom da smanjenjem poreznog opterećenja dobiti poduzeća zemlje najčešće nastoje nadoknaditi određene nedostatke na svom području i time povećati svoju konkurentnost, očekuje se kako porezna politika ima značajniju ulogu u privlačenju stranih investicija kod novih članica Europske unije. Navedeno se posebno očituje smanjenjem efektivnih poreznih stopa, iz kojih je vidljiva uloga poreznih olakšica i poticaja, što potvrđuje postojanje porezne konkurencije među zemljama članicama Europske unije.
2. PREGLED LITERATURE
Dosadašnja istraživanja uglavnom zastupaju tvrdnju kako porezna politika nije primarni činitelj pri donošenju odluka stranih investitora o ulaganju u određeno geografsko područje. Navedeno uglavnom vrijedi za istraživanja prošloga stoljeća, posebice do devedesetih godina (sinteza u npr. OECD, 2001:49-54; OECD, 2003:34)1, dok već literatura s početka ovoga stoljeća
1 Navodimo najznačajnija pojedinačna starija istraživanja. Hartman (1984) je prvi analizirao utjecaj oporezivanja dobiti na kretanje izravnih stranih ulaganja u razdoblju od 1965. do 1979. godine, na prostoru SAD-a. Analiza je provedena sa stajališta ulaganja iz zadržane dobiti i novčanih transfera, a utvrđeno je kako postoji vrlo nizak, ali značajan utjecaj poreza na dobit na razinu priljeva stranih ulaganja. Boskin i Gale (1986) u svom su radu preispitali Hartmanove izračune, uz proširenje vremenske serije na razdoblje od 1956. do 1984. godine, te potvrdili njegov zaključak; uz naglasak o postojanju elastičnosti između izravnih stranih ulaganja i poreznih varijabli, koja je blago niža u odnosu na rezultate iz Hartmanovog istraživanja. Billington (1999) je ispitao faktore koji utječu na lociranje investicija u odabranim zemljama OECD-a, kroz priljev stranih ulaganja, u razdoblju od 1986. do 1993. godine. Djelovanje oporezivanja dobiti predstavljeno je zakonskom poreznom stopom, dok njeno smanjenje prikazuje nizak, ali pozitivan utjecaj na povećanje izravnih stranih ulaganja. Od ostalih, pomoćnih varijabli, posebno se ističe visok utjecaj pokazatelja veličine tržišta, odnosno bruto domaćeg proizvoda. Gropp i Kostial (2000) svoju su analizu usredotočili na razdoblje od 1988. do 1997. godine, u odabranim zemljama OECD-a, te također potvrdili postojanje niske i negativne veze između poreza na dobit i izravnih stranih ulaganja. Njihovo istraživanje je specifično s obzirom da osim utjecaja zakonske porezne stope uzima u obzir i utjecaj razine prihoda od poreza na dobit, uz isticanje postojanje porezne konkurencije među analiziranim zemljama.

I. Banović, H. Blažić, S. Drezgić: Utjecaj poreza na dobit na kretanje izravnih stranih ulaganja u…Zbornik Veleučilišta u Rijeci, Vol. 8 (2020), No. 1, pp. 41-58
43
ukazuje da porezi (stope i poticaji poreza na dobit) postaju sve značajniji (npr. OECD, 2001:55-60; OECD, 2003:34; de Mooij, Ederveen, 2003; Morisset, 2003:1, Gorter, Parikh, 2003).
Novija istraživanja također uglavnom ističu kako porezna politika (izražena najčešće kroz porez na dobit) ima veće značenje kod privlačenja stranih ulagača, posebno u novim zemljama članicama Europske unije. U nastavku su prikazana i neka istraživanja koja se odnose samo na Hrvatsku.
Carnstensen (2003) u svojoj dinamičkoj panel analizi za zemlje Srednje i Istočne Europe u razdoblju od 1993. do 1999. ističe statistički značajan utjecaj tradicionalnih lokacijskih varijabli na izravne strane investicije, među kojima i negativan utjecaj zakonske stope poreza na dobit na izravne strane investicije, kako kratkoročno, tako i dugoročno.
Jovančević (2003) istražuje izravna strana ulaganja u Hrvatskoj s aspekta percepcije menadžera, pri čemu se uzimaju u obzir razni elementi, uključivo i porezne. Menadžeri manjih poduzeća koja posluju u Hrvatskoj smatraju da bi daljnje sniženje stope poreza na dobit pomoglo u privlačenju izravnih stranih ulaganja.2 Slična kasnija istraživanja u Hrvatskoj provode Pavlović et al. (2013) anketirajući manje skupine menadžera. Tako u trinaest velikih hrvatskih poduzeća traže od njihovih menadžera da izaberu „tri najvažnija čimbenika, od mogućih deset koja smatraju bitnim za donošenje odluke o izravnom ulaganju u neku inozemnu lokaciju.“ Idućim istraživanjem anketiraju jedanaest vodećih inozemnih poduzeća u Hrvatskoj tj. njihove menadžere na isti način kako bi utvrdili njihove motive ulaganja u Hrvatsku. Umjesto poreza na dobit koristi se šira varijabla - „visina poreza“, koja je rangirana na četvrtom mjestu u oba istraživanja.3
Wijeweera, Dollery i Clark (2007) ispitali su utjecaj oporezivanja dobiti na izravna strana ulaganja u SAD-u, koja proizlaze od strane zemalja predstavljenih kao najvećih trgovinskih partnera SAD-a, u razdoblju od 1982. do 2000. godine. Osim zakonske stope, ovo istraživanje je obuhvatilo efektivnu prosječnu stopu poreza na dobit i efektivnu graničnu stopu poreza na dobit kao pokazatelje djelovanja poreznih olakšica i poticaja, ali se statistički značajnom prikazala samo zakonska porezna stopa, čije povećanje doprinosi smanjenju izravnih stranih ulaganja.
Pavlović (2007) analizira utjecaj zakonske stope poreza na dobit na priljev izravnih stranih ulaganja u Hrvatskoj, u razdoblju od 1995. do 2005. godine, te dolazi do zaključka kako smanjenje zakonske stope poreza na dobit 2001. godine nije doprinijelo povećanju izravnih stranih ulaganja4. Isto tako, ističe kako smanjenje porezne stope i u ostalim zemljama u tranziciji i europskom području općenito, nije utjecalo bitno na donošenje investicijskih odluka.
Istraživanje Bezića i Pavlovića (2009) o utjecaju zakonske stope poreza na dobit za zemlje Srednje i Istočne Europe odnosno nove članice EU5 ne ukazuje na značajan utjecaj ove varijable na priljev izravnih stranih ulaganja. Naime, ova varijabla sama po sebi nije dovoljna za donošenje adekvatne lokacijske odluke, već je važnije makroekonomsko i društveno okruženje. 2 No, autorica vjeruje da ovakav stav i pod utjecajem osobnih motiva. 3 Navedeno je napredak ove varijable u odnosu na ranije globalno istraživanje u kojem je njen ran bio devet (MIGA,
202; prema Pavlović et al, 2011) , što je u skladu s već iznesenim rezultatima ranijih istraživanja.4 Razlog navedenoga može se, međutim, tražiti u ukidanju zaštitne kamate (opće olakšice u obliku neoporezivanja
dobiti na razini zaštitne kamate).5 Osim Cipra i Malte

I. Banović, H. Blažić, S. Drezgić: Utjecaj poreza na dobit na kretanje izravnih stranih ulaganja u…Zbornik Veleučilišta u Rijeci, Vol. 8 (2020), No. 1, pp. 41-58
44
Prema panel analizi Bellaka i Leibrechta (2009), provedenoj u razdoblju od 1995. do 2003. godine na području Srednje i Istočne Europe, postoji negativna elastičnost izravnih stranih ulaganja u odnosu na efektivno porezno opterećenje poduzeća. Porezna politika, dakle, ima značajan utjecaj na odabir lokacije poslovanja kod investitora. Osim porezne politike, provedeno istraživanje naglašava ostale lokacijske prednosti države poput niskih troškova proizvodnje i veličine tržišta.
Olofsdotter i Hansson (2010) zaključuju da su nove članice Europske unije sklonije privlačenju izravnih stranih ulaganja snižavanjem stope poreza na dobit, što posebno dolazi do izražaja kada se promatraju izravna strana ulaganja u kapital povezanih društava, dok starije zemlje članice uspijevaju privući strani kapital bez obzira na primjenu viših poreznih stopa. Kao razlog navedenog posebno se ističe značaj pripadnosti ekonomskim integracijama. Analiza je provedena u razdoblju od 1995. do 2006. godine, a kao porezne varijable korištene su zakonska porezna stopa i efektivna granična porezna stopa.
Beck i Chaves (2011) u svom istraživanju uzimaju u obzir i dodatne porezne oblike, odnosno rad i potrošnju, u funkciji odljeva izravnih ulaganja. Istraživanje je provedeno na odabranim zemljama OECD-a, u razdoblju od 1975. do 2006. godine, a prikazuje kako povećanje stope poreza na dobit ima značajan i pozitivan utjecaj na odljev izravnih ulaganja, dok povećanje poreza na dohodak na rad negativno utječe na smanjenje odljeva stranih ulaganja. Porezi na potrošnju, koji se sagledavaju s pozicije dodatnog opterećenja rada, imaju nizak utjecaj na međunarodne investicijske tijekove.
Raudonen i Freytag (2013) provode analizu za područje Baltičkih zemalja u razdoblju od 2000. do 2008. godine, te zaključuju kako postoji značajan utjecaj zakonske i efektivne stope poreza na dobit na kretanje izravnih stranih ulaganja. Međutim, porezno opterećenje smatraju sekundarnim čimbenikom kojeg investitori uzimaju u obzir pri donošenju odluke o lokaciji poslovanja, dajući prednost veličini tržišta i stupnju ekonomske slobode.
Mateev i Tsekov (2014) provode panel analizu u razdoblju od 1994. do 2012. godine za 26 zemalja EU, dijeleći ih na EU 15 i nove članice (zemlje Srednje i Istočne Europe). I oni ističu značajan utjecaj tradicionalnih lokacijskih varijabli, među kojima i negativan utjecaj zakonske stope poreza na dobit u obje skupine zemalja.
3. METODOLOGIJA ZNANSTVENOG ISTRAŽIVANJA
Ekonometrijska analiza temelji se na provedbi statičke panel analize za razdoblje od 1998. do 2017. godine. Sastoji se od statičke panel analize koja se provodi na 28 zemalja članica Europske unije kao cjelini, analizi koja obuhvaća samo stare članice (EU 15) i analizi koja obuhvaća isključivo nove članice Europske unije, odnosno zemlje koje su pristupile članstvu od 2003. godine nadalje (EU 13).
Podaci su prikupljeni iz baze podataka Ujedinjenih naroda (UNCTADSTAT, 2018), Centra za europska ekonomska istraživanja (ZEW) (Spengel, 2018), Svjetske banke (World Bank, 2018.) i Eurostata (Eurostat, 2018).
U svrhu procjene ekonometrijskog modela koriste se slijedeće varijable:

I. Banović, H. Blažić, S. Drezgić: Utjecaj poreza na dobit na kretanje izravnih stranih ulaganja u…Zbornik Veleučilišta u Rijeci, Vol. 8 (2020), No. 1, pp. 41-58
45
• FDI_STOCK: vrijednost izravnih stranih ulaganja kao udio u kapitalu i rezervama (uključujući zadržane dobitke) povezanog poduzeća, uvećan za neto vrijednost zaduživanja iz transakcija između povezanih društava; podaci se iskazuju u milijunima američkih dolara;
• CIT: najviša zakonska stopa poreza na dobit; podaci se iskazuju u postocima;
• EATR: efektivna prosječna stopa poreza na dobit; podaci se iskazuju u postocima;
• EMTR: efektivna granična stopa poreza na dobit; podaci se iskazuju u postocima;
• GDP: vrijednost bruto domaćeg proizvoda; podaci se iskazuju u milijunima američkih dolara;
• ULC: indeks vrijednosti jediničnog troška rada, kao odnos između troškova rada i efektivnih sati rada; podaci se iskazuju kao bazni indeks u odnosu na vrijednost iz 2010. godine;
• PDEBT: udio javnog duga u BDP-u; podaci se iskazuju u postotku;
• RD_EXP: udio državnih izdataka za istraživanje i razvoj u odnosu na ukupne proračunske izdatke; podaci se iskazuju u postotku;
• LOANS: udio domaćih kredita plasiranih u privatni sektor od strane financijskih institucija u odnosu na vrijednost BDP-a; Osim novčanih kredita, u navedenu kategoriju se ubraja i prodaja financijskih instrumenata koji nemaju obilježje kapitala te poslovi otkupa potraživanja; podaci se iskazuju u postotku;
• UNEMP: udio nezaposlene radne snage u odnosu na ukupno radno sposobno stanovništvo; podaci se iskazuju u postotku.
Izravna strana ulaganja u udjele kapitala povezanih društava, uvećane za neto vrijednost duga iz međusobnih transakcija (FDI_STOCK), predstavljaju zavisnu varijablu, dok su najviša zakonska stopa poreza na dobit (CIT), efektivna prosječna porezna stopa (EATR) i efektivna granična porezna stopa (EMTR) nezavisne varijable porezne politike.
Efektivna prosječna porezna stopa (Effective Average Tax Rate - EATR) i efektivna granična porezna stopa (Effective Marginal Tax Rate – EMTR) su mjere koje sintetiziraju zakonsku poreznu stopu, ali i ostale relevantne elemente poreza na dobit. Prvobitno su razvijene od strane Kinga i Fulertona (1984), da bi naknadno bile dorađene od strane Devereuxa i Griffitha (1999).
Iako postoje različite varijante izračuna, u ovom radu se koriste izračuni prema modelu efektivne prosječne porezne stope (EATR) i modelu efektivne granične porezne stope (EMTR) po metodologiji Devereuxa i Griffitha (1999) (Centre for European Economic Research 2018). S obzirom da se njihov izračun temelji na budućem kretanju projiciranih novčanih tokova od potencijalnih investicija nakon oporezivanja, diskontiranih po stopi koja odražava oportunitetni trošak investitora, smatraju se boljim izborom u svrhu donošenja odluka o investicijama (OECD, 2000:47).6
6 Prvi pojedinačni izračuni za samu Hrvatsku uslijedili su nakon nekoliko godina (Švaljek, 2006; Šimović, 2008).

I. Banović, H. Blažić, S. Drezgić: Utjecaj poreza na dobit na kretanje izravnih stranih ulaganja u…Zbornik Veleučilišta u Rijeci, Vol. 8 (2020), No. 1, pp. 41-58
46
Porez na dobit te novčani tokovi projekta prije i nakon oporezivanja projiciraju se za cjelokupno predviđeni vijek efektuiranja investicije na način da se svode na sadašnju vrijednost kako bi investitori mogli realno procijeniti porezno opterećenje ulaganja. Pri tome se kao diskontna stopa uzima trošak kapitala kao ponderirana vrijednost kamatne stope na tuđe izvore financiranja i očekivani prinos investitora na uloženi vlastiti kapital.
U svrhu donošenja investicijskih odluka jednako su bitne obje efektivne stope, s time da je efektivna prosječna porezna stopa orijentirana na određivanje lokacije ulaganja, a efektivna granična porezna stopa na obujam ulaganja kapitala (Devereux et al., 2002:461).
Prema modelu Devereuxa i Griffitha efektivna se prosječna porezna stopa (EATR) računa na slijedeći način:
pri čemu je:
• R* neto sadašnja vrijednost investicije prije poreza
• R neto sadašnja vrijednost investicije nakon poreza7
• p očekivana stopa povrata prije poreza
• δ stopa ekonomske amortizacije dugotrajne imovine
• τ stopa poreza na dobit
• r diskontna stopa • A neto sadašnja vrijednost amortizacijskih odbitaka
Iz navedenih jednadžbi moguće je definirati efektivnu prosječnu stopu poreza na dobit (EATR) kao odnos između razlike neto sadašnje vrijednosti investicije prije i nakon oporezivanja te sadašnje vrijednosti očekivane stope povrata prije oporezivanja.
Za razliku od efektivne prosječne porezne stope (EATR), koja prikazuje utjecaj kretanja poreza na dobit na trošak kapitala kao minimalne stope povrata na ulaganje, efektivna granična porezna stopa (EMTR) prikazuje utjecaj porezne politike na dodatnu novčanu jedinicu ulaganja, odnosno mjeri djelovanje poreznih poticaja na dodatno ulaganje.
Efektivna se granična stopa poreza na dobit (EMTR) računa na slijedeći način: 7 Osim isticanja zakonske stope poreza na dobit i ostalih elemenata poreza na dobit, određeni autori u izračun neto
sadašnje vrijednosti investicije nakon poreza uključuju i ostale oblike direktnih poreza manjeg značaja, kao npr. porez na imovinu kod investiranja u određenu dugotrajnu imovinu (Spengel, 2018). Navedeno rezultira smanjenjem neto sadašnje vrijednosti investicije nakon poreza, odnosno većom efektivnom prosječnom poreznom stopom.

I. Banović, H. Blažić, S. Drezgić: Utjecaj poreza na dobit na kretanje izravnih stranih ulaganja u…Zbornik Veleučilišta u Rijeci, Vol. 8 (2020), No. 1, pp. 41-58
47
pri čemu je:
• c trošak kapitala8
• pi trošak kapitala na graničnu investiciju
Iz navedenog slijedi kako je efektivna granična porezna stopa odnos razlike troška kapitala na dodatnu jedinicu investicije i diskontne stope i troška kapitala na dodatnu jedinicu ulaganja.
Investitori su spremni ulagati do trenutka u kojem je granična stopa povrata na ulaganje jednaka trošku kapitala. Stoga restriktivna fiskalna politika utječe na stvaranje visokog troška kapitala (Pirvu, 2012:86).
U slučaju kada efektivna granična porezna stopa poprima negativnu vrijednost (EMTR < 0), porezni sustav djeluje stimulirajuće na kapitalne investicije, s obzirom da u tom slučaju sadašnja vrijednost poreznih poticaja premašuje sadašnju vrijednost ulaganja. Ukoliko je efektivna granična porezna stopa jednaka nuli (EMTR = 0) porezni sustav je neutralan, a ukoliko je veća od nule porezni sustav ne djeluje poticajno. Što je veće odstupanje efektivne granične porezne stope u odnosu na nultu vrijednost, veći je utjecaj porezne politike na donošenje investicijskih odluka (OECD, 2000:49).
U kontrolne nezavisne varijable ubrajaju se:
• Bruto domaći proizvod (GDP), kao pokazatelj veličine tržišta i stupnja razvijenosti gospodarstva;
• Indeks jediničnog troška rada (ULC) kao pokazatelj efikasnosti rada;
• Udio javnog duga u BDP-u (PDEBT) kao pokazatelj rizičnosti;
• Udio državnih izdataka za istraživanje i razvoj u odnosu na ukupne proračunske izdatke (RD_EXP) kao pokazatelj odnosa države prema inovacijama;
• Udio domaćih kredita plasiranih u privatni sektor od strane financijskih institucija u BDP-u (LOANS) kao pokazatelj dostupnosti financijskih izvora;
• Udio nezaposlene radne snage u ukupno aktivnom stanovništvu (UNEMP) kao pokazatelji dostupnosti radne snage i stupnja razvijenosti gospodarstva.
Tablica 1 prikazuje očekivane predznake utjecaja nezavisnih varijabli unutar ekonometrijskih modela.
8 Kao u slučaju neto sadašnje vrijednosti investicije nakon poreza (pri izračunu efektivne prosječne porezne stope) i u okviru troška kapitala mogu biti uključeni i ostali direktni porezi (npr. porez na imovinu). Navedeno ima za posljedicu isticanje većeg troška kapitala, a time i veću efektivnu graničnu poreznu stopu.

I. Banović, H. Blažić, S. Drezgić: Utjecaj poreza na dobit na kretanje izravnih stranih ulaganja u…Zbornik Veleučilišta u Rijeci, Vol. 8 (2020), No. 1, pp. 41-58
48
Tablica 1. Očekivani predznaci nezavisnih varijabli unutar ekonometrijskih modela
VARIJABLAOČEKIVANI PREDZNAK
OBJAŠNJENJE
CIT –Očekuje se da porast najviše zakonske porezne stope utječe na smanjenje izravnih stranih ulaganja, s obzirom da investitorima
predstavlja veće novčane izdatke.
EATR –Očekuje se da porast efektivne prosječne porezne stope utječe na
smanjenje izravnih stranih ulaganja, s obzirom da investitorima predstavlja veće novčane izdatke.
EMTR –Očekuje se da porast efektivne granične porezne stope utječe na smanjenje izravnih stranih ulaganja, s obzirom da investitorima
predstavlja veće novčane izdatke.
GDP +Očekuje se da porast bruto domaćeg proizvoda, kao pokazatelja
ekonomske aktivnosti i veličine tržišta, utječe na povećanje izravnih stranih ulaganja.
ULC –Očekuje se da porast jediničnih troškova radne snage djeluje negativno na izravna strana ulaganja, s obzirom da investitorima predstavlja veće
novčane izdatke.
PDEBT –Očekuje se da povećanje razine javnog duga utječe na smanjenje
izravnih stranih ulaganja, s obzirom da predstavlja povećanu izloženost financijskom riziku zemlje.
RD_EXP +Očekuje se da povećanje državnih izdataka u istraživanje i razvoj
doprinosi povećanju izravnih stranih ulaganja, s obzirom da je riječ o varijabli koja predstavlja stav države prema ekonomiji inovacija.
LOANS +
Očekuje se da povećanje raspoloživih kredita u gospodarstvu utječe na povećanje izravnih stranih ulaganja, budući da navedena varijabla predstavlja pokazatelj dostupnosti financijskih izvora na tržištu novca
određene zemlje.
UNEMP +Očekuje se da povećanje stope nezaposlenosti utječe pozitivno
na povećanje izravnih stranih ulaganja, s obzirom da investitorima predstavlja veću dostupnost radne snage na tržištu rada.
Izvor: izrada autora
Iz prikaza u tablici 1 može se uočiti kako eventualno povećanje varijabli poreznih stopa ima negativan utjecaj na kretanje izravnih stranih ulaganja, što je također prisutno i za varijablu indeksa jediničnog troška rada te udjela javnog duga u BDP-u.
Može se očekivati da rast bruto domaćeg proizvoda, udjela državnih izdataka u istraživanje i razvoj, dostupnosti kredita i nezaposlenosti a imaju pozitivan utjecaj na kretanje izravnih stranih ulaganja.
Ekonometrijska analiza temelji se na provedbi statičke panel analize, odnosno odabiru najprikladnijeg modela između združenog modela (Pooled regression model), modela s fiksnim efektom (Fixed effects model) i modela sa slučajnim efektom (Random effects model).

I. Banović, H. Blažić, S. Drezgić: Utjecaj poreza na dobit na kretanje izravnih stranih ulaganja u…Zbornik Veleučilišta u Rijeci, Vol. 8 (2020), No. 1, pp. 41-58
49
Provedba F-testa upućuje na to da se model s fiksnim efektom smatra prikladnijim za provedbu u odnosu na združeni model, dok je prema Breusch-Pagan LM testu model sa slučajnim efektom prikladniji u odnosu na združeni model.
Kako bi se procijenilo je li za navedenu analizu prikladniji model s fiksnim efektom ili model sa slučajnim efektom, pomoću Hausmanovog testa procijenjeno je kako se model s fiksnim efektom može smatrati adekvatnim, a čiji je opći oblik:
Prilikom postavljanja ekonomskih ciljeva povezanih s investicijama, pretpostavlja se da je potreban određeni vremenski pomak kako bi sadašnje izmjene porezne politike postale efektivne, pa se u navedenim istraživanjima preporuča korištenje lagiranih nezavisnih varijabli (Mudenda, 2015:23).
Iz navedenog slijedi analitički zapis jednadžbe ekonometrijske procjene:
pri čemu je:
• lnFDI_STOCKit logaritmirana vrijednost izravnih stranih ulaganja u udjele povezanih društava, uvećanih za vrijednost neto duga iz međusobnih transakcija, zemlje i u razdoblju t;
• lnXi,t-1 logaritmirana vrijednost varijable porezne stope, pri čemu je:
− lnCITi,t-1 najviša zakonska stopa poreza na dobit zemlje i u razdoblju
t-1, u prvom modelu
− lnEATRi,t-1 efektivna prosječna stopa poreza na dobit zemlje i u razdoblju t-1, u drugom modelu
− lnEMTRi,t-1 efektivna granična stopa poreza na dobit zemlje i u razdoblju t-1, u trećem modelu;
• lnGDPi,t-1 logaritmirana vrijednost bruto domaćeg proizvoda zemlje i u razdoblju t-1;
• lnULCi,t-1 logaritmirana vrijednost indeksa jediničnog troška rada zemlje i u razdoblju t-1;
• lnPDEBTi,t-1 logaritmirana vrijednost udjela javnog duga u BDP-u zemlje i u razdoblju t-1;
• lnRD_EXPi,t-1 logaritmirana vrijednost udjela izdataka za istraživanje i razvoj u ukupnim proračunskim izdacima zemlje i u razdoblju t-1;
• lnLOANSi,t-1 logaritmirana vrijednost udjela domaćih kredita, plasiranih privatnom sektoru od strane financijskih institucija, u BDP-u zemlje i u razdoblju t-1;

I. Banović, H. Blažić, S. Drezgić: Utjecaj poreza na dobit na kretanje izravnih stranih ulaganja u…Zbornik Veleučilišta u Rijeci, Vol. 8 (2020), No. 1, pp. 41-58
50
• lnUNEMPi,t-1 logaritmirana vrijednost udjela nezaposlenih osoba u ukupno radno aktivnom stanovništvu zemlje i u razdoblju t-1;
• µ konstantni član;
• greška relacije zemlje i u razdoblju t;
• β1 β2 β3 β4 β5 β6 β7 parametri koje je potrebno procijeniti.
4. EMPIRIJSKA ANALIZA I REZULTATI ISTRAŽIVANJA
Panel analiza provedena je putem tri različite skupine modela. Rezultati su strukturirani na način da obuhvaćaju analizu cijele Europske unije (EU28), analizu koja se temelji isključivo na starim zemljama članicama Europske unije (EU15) i analizu koja obuhvaća isključivo nove članice Europske unije (EU13).
Tablica 2 prikazuje rezultate provedene ekonometrijske analize na području Europske unije kao cjeline (EU28).
Tablica 2. Rezultati provedene ekonometrijske panel analize u zemljama članicama Europske unije (EU 28)
VARIJABLA MODEL 1 MODEL 2 MODEL 3
lnCITi,t-1
-0.183** (0.0897)
- -
lnEATRi,t-1 --0.380*** (0.0911)
-
lnEMTRi,t-1 - --0.221*** (0.0520)
lnGDPi,t-1
0.830*** (0.0671)
0.911*** (0.0650)
0.767*** (0.0618)
lnULCi,t-1
0.0878 (0.136)
0.0282 (0.134)
0.256 (0.165)
lnPDEBTi,t-1
0.107 (0.0655)
0.113* (0.0643)
0.119* (0.0638)
lnRD_EXPi,t-1
0.109 (0.0853)
0.0980 (0.0839)
0.122 (0.0835)
lnLOANSi,t-1
0.107 (0.0910)
0.0662 (0.0888)
0.0812 (0.0879)
lnUNEMPi,t-1
0.0530 (0.0599)
0.0779 (0.0591)
0.0264 (0.0581)
Konstanta0.746*** (0.145)
0.704*** (0.143)
0.878*** (0.152)
N 393 393 388Napomena: u zagradama su prikazane standardne greške; * statistička signifikantnost na razini od 10 %, ** statistička signifikantnost na razini od 5 %, *** statistička signifikantnost na razini od 1 %
Izvor: Izračun autora

I. Banović, H. Blažić, S. Drezgić: Utjecaj poreza na dobit na kretanje izravnih stranih ulaganja u…Zbornik Veleučilišta u Rijeci, Vol. 8 (2020), No. 1, pp. 41-58
51
Na temelju provedene panel analize u Europskoj uniji kao cjelini (EU28), može se primijetiti kako su statistički značajne varijable koje predstavljaju poreznu politiku, bruto domaći proizvod i udio javnog duga u BDP-u.
Prvi model je predstavljen nezavisnom varijablom najviše zakonske porezne stope (lnCITi,t-1), koja je statistički signifikantna na razini od 5 %, a iz njene vrijednosti je moguće zaključiti kako postotno povećanje zakonske porezne stope utječe na smanjenje razine izravnih stranih ulaganja u kapital povezanih društava (lnFDI_STOCK) za 0,18 %.
Drugi model je predstavljen nezavisnom varijablom efektivne prosječne stope poreza na dobit (lnEATRi,t-1), koja je statistički signifikantna na razini od 1 %, a prikazuje kako postotno povećanje njene vrijednosti utječe na smanjenje izravnih stranih ulaganja u kapital povezanih društava (lnFDI_STOCK) za 0,38 %. Iz navedenog proizlazi kako je riječ o poreznoj varijabli koja ima najznačajniji utjecaj na kretanje zavisne varijable (lnFDI_STOCK) u promatranim modelima.
Treći model je predstavljen nezavisnom varijablom efektivne granične stope poreza na dobit (lnEMTRi,t-1), koja također poprima statističku značajnost na razini od 1 %, a prikazuje kako postotno povećanje njene vrijednosti uzrokuje smanjenje izravnih stranih ulaganja u kapital povezanih društava (lnFDI_STOCK) za 0,22 %.
Analizom pomoćnih nezavisnih varijabli moguće je primijetiti kako u sva tri modela prevladava značajnost bruto domaćeg proizvoda (lnGDPi,t-1). Riječ je o nezavisnoj varijabli koja ima najveći utjecaj na kretanje zavisne varijable u analiziranoj strukturi, odnosno promatranjem vrijednosti u sva tri modela, može se primijetiti kako postotno povećanje bruto domaćeg proizvoda utječe na povećanje izravnih stranih ulaganja u kapital povezanih društava (lnFDI_STOCK) u rasponu od 0,77 % do 0,91 %.
Od ostalih nezavisnih varijabli, statistički značajna se prikazuje samo varijabla udjela javnog duga u BDP-u (lnPDEBTi,t-1), ali samo u okviru drugog i trećeg modela, na razini signifikantnosti od 10 %. S obzirom da navedena varijabla ne poprima pozitivni predznak, proizlazi kako povećanje javnog duga u analizi Europske unije kao cjeline ne djeluje destimulirajuće na investitore pri donošenju odluke o ulaganju.
Tablica 3 prikazuje rezultate provedene ekonometrijske panel analize na području starih članica Europske unije (EU15).

I. Banović, H. Blažić, S. Drezgić: Utjecaj poreza na dobit na kretanje izravnih stranih ulaganja u…Zbornik Veleučilišta u Rijeci, Vol. 8 (2020), No. 1, pp. 41-58
52
Tablica 3. Rezultati provedene ekonometrijske panel analize u starim zemljama članicama Europske unije (EU 15)
VARIJABLA MODEL 1 MODEL 2 MODEL 3
lnCITi,t-1
0.140 (0.116)
- -
lnEATRi,t-1 --0.140 (0.118)
-
lnEMTRi,t-1 - --0.107** (0.0493)
lnGDPi,t-1
0.611*** (0.0779)
0.711*** (0.0778)
0.679*** (0.0657)
lnULCi,t-1
0.396* (0.227)
0.401* (0.227)
0.442** (0.222)
lnPDEBTi,t-1
0.482*** (0.0865)
0.446*** (0.0862)
0.465*** (0.0818)
lnRD_EXPi,t-1
-0.0532 (0.102)
-0.0531 (0.101)
-0.0720 (0.0979)
lnLOANSi,t-1
-0.144 (0.117)
-0.165 (0.116)
-0.173 (0.113)
lnUNEMPi,t-1
-0.170** (0.0756)
-0.150* (0.0762)
-0.170** (0.0727)
Konstanta1.189*** (0.182)
0.958*** (0.181)
1.042*** (0.161)
N 233 233 228Napomena: u zagradama su prikazane standardne greške; * statistička signifikantnost na razini od 10 %,** statistička signifikantnost na razini od 5 %, *** statistička signifikantnost na razini od 1 %.
Izvor: Izračun autora
Temeljem prikaza izračunatih koeficijenata u tablici 2 može se primijetiti kako u prvom i drugom modelu varijable porezne politike nisu značajne, dok se u trećem modelu varijabla efektivne granične porezne stope (lnEMTRi,t-1) prikazuje statistički signifikantnom na razini od 5 %. Promatranjem koeficijenta navedene varijable, moguće je primijetiti kako njeno postotno povećanje utječe na smanjenje izravnih stranih ulaganja u kapital povezanih društava (lnFDI_STOCK) za 0,11 %.
Od ostalih nezavisnih pomoćnih varijabli kod starih zemalja članica, do izražaja dolazi razina bruto domaćeg proizvoda (lnGDPi,t-1), koja je statistički signifikantna na razini od 1% , a njeno postotno povećanje utječe na rast zavisne varijable (lnFDI_STOCK) u rasponu od 0,61 % do 0,71 %, ovisno o promatranom modelu.
Varijabla indeksa jediničnog troška rada (lnULCi,t-1) značajna je na razini signifikantnosti od 10% u prvom i drugom modelu, dok u trećem modelu poprima vrijednost od 5 %. Njen predznak je pozitivan, što upućuje na to da njeno povećanje na području starih zemalja članica (EU15) ne djeluje destimulirajuće na povećanje izravnih stranih ulaganja, odnosno postotno povećanje navedene varijable utječe na rast izravnih stranih ulaganja u kapital povezanih društava (lnFDI_STOCK) u rasponu od 0,40 % do 0,44 %, ovisno o promatranom modelu.

I. Banović, H. Blažić, S. Drezgić: Utjecaj poreza na dobit na kretanje izravnih stranih ulaganja u…Zbornik Veleučilišta u Rijeci, Vol. 8 (2020), No. 1, pp. 41-58
53
Povećanje varijable javnog duga (lnPDEBTi,t-1) statistički je značajno na razini od 1 % u svim prikazanim modelima, a upućuje na to kako njeno postotno povećanje uzrokuje rast izravnih stranih ulaganja u kapital povezanih društava (lnFDI_STOCK) u rasponu od 0,45 % do 0,48 %, ovisno promatranom modelu. Navedeno kretanje također upućuje na to da rast javnog duga djeluje stimulirajuće na povećanje izravnih stranih ulaganja u starim zemljama članicama Europske unije.
Varijabla koja predstavlja udio nezaposlenih u aktivnom stanovništvu (lnUNEMPi,t-1) statistički je značajna na razini od 5 % u prvom i trećem modelu, dok je u drugom modelu značajna na razini od 10 %. Njeno postotno povećanje djeluje destimulirajuće na kretanje izravnih stranih ulaganja u kapital povezanih društava (lnFDI_STOCK) u rasponu od 0,15 % do 0,17 % u ovisnosti o promatranom modelu.
Tablica 4 prikazuje rezultate provedene ekonometrijske panel analize na području novih članica Europske unije.
Tablica 4. Rezultati provedene ekonometrijske panel analize u novim zemljama članicama Europske unije (EU13)
VARIJABLA MODEL 1 MODEL 2 MODEL 3
lnCITi,t-1
-0.245 (0.153)
- -
lnEATRi,t-1 --0.355** (0.156)
-
lnEMTRi,t-1 - --0.301** (0.113)
lnGDPi,t-1
0.830*** (0.136)
0.880*** (0.134)
0.855*** (0.121)
lnULCi,t-1
-0.0288 (0.213)
-0.0751 (0.210)
-0.00641 (0.196)
lnPDEBTi,t-1
-0.0876 (0.109)
-0.0703 (0.108)
-0.0774 (0.107)
lnRD_EXPi,t-1
0.259* (0.139)
0.252* (0.138)
0.292** (0.137)
lnLOANSi,t-1
0.240 (0.146)
0.213 (0.144)
0.162 (0.148)
lnUNEMPi,t-1
0.287** (0.104)
0.284** (0.104)
0.230** (0.0971)
Konstanta1.299*** (0.292)
1.289*** (0.294)
1.332*** (0.295)
N 159 159 159Napomena: u zagradama su prikazane standardne greške; * statistička signifikantnost na razini od 10 %, ** statistička signifikantnost na razini od 5 %,
*** statistička signifikantnost na razini od 1 %
Izvor: Izračun autora

I. Banović, H. Blažić, S. Drezgić: Utjecaj poreza na dobit na kretanje izravnih stranih ulaganja u…Zbornik Veleučilišta u Rijeci, Vol. 8 (2020), No. 1, pp. 41-58
54
Na temelju prikazanih koeficijenata u tablici 4 može se uočiti kako u novim zemljama članicama Europske unije efektivne porezne stope imaju značajniji utjecaj na kretanje izravnih stranih ulaganja u kapital povezanih društava (lnFDI_STOCK).
U prvom se modelu može uočiti kako je utjecaj najviše zakonske porezne stope (lnCITi,t-1) na zavisnu varijablu (lnFDI_STOCK) negativan, ali i kako nezavisna varijabla sama po sebi ne zadovoljava uvjet statističke značajnosti.
Varijabla efektivne prosječne porezne stope (lnEATRi,t-1) statistički je značajna na razini signifikantnosti od 5 % te prikazuje kako njeno postotno povećanje utječe na smanjenje izravnih stranih ulaganja u kapital povezanih društava (lnFDI_STOCK) za 0,36 %. Iz navedenog se uočava ista pojava kao i u slučaju analize koja promatra Europsku uniju kao cjelinu, odnosno da je riječ o poreznoj varijabli koja i kod novih zemalja članica ima najznačajniji utjecaj na kretanje zavisne varijable.
U trećem je modelu varijabla efektivne granične porezne stope (lnEMTRi,t-1) također statistički značajna na razini od 5% signifikantnosti, a njeno postotno povećanje utjecat će na smanjenje izravnih stranih ulaganja u kapital povezanih društava (lnFDI_STOCK) za 0,30 %.
Promatranjem ostalih, pomoćnih nezavisnih varijabli, može se uočiti kako utjecaj bruto domaćeg proizvoda (lnGDPi,t-1) također pozitivno utječe na rast izravnih stranih ulaganja u kapital povezanih društava (lnFDI_STOCK), kao i kod analize starih zemalja članica, odnosno njegovo postotno povećanje doprinosi rastu zavisne varijable u rasponu od 0,83 % do 0,86%. Riječ je o varijabli koja ima najveći utjecaj na kretanje izravnih stranih ulaganja u kapital povezanih društava (lnFDI_STOCK), a njena statistička signifikantnost je na razini od 5 %.9
Udio državnih izdataka za istraživanje i razvoj (lnRD_EXPi,t-1) statistički je značajna varijabla na razini od 10 % u prvom i drugom modelu te na razini od 5 % u trećem modelu. Njeno povećanje utječe pozitivno na zavisnu varijablu u novim zemljama članicama, odnosno postotno povećanje udjela državnih izdataka za istraživanje i razvoj (lnRD_EXPi,t-1) uzrokuje rast kretanje izravnih stranih ulaganja u kapital povezanih društava (lnFDI_STOCK) u rasponu od 0,25 % do 0,29 %, ovisno o promatranom modelu.
Varijabla udjela nezaposlenosti u radno aktivnom stanovništvu (lnUNEMPi,t-1) značajna je za sva tri promatrana modela na razini signifikantnosti od 5 %, a njeno postotno povećanje utjecat će pozitivno na kretanje zavisne varijable (lnFDI_STOCK), odnosno povećat će se u rasponu od 0,23 % do 0,29 % ovisno o promatranom modelu.
9 Daljnja analiza utjecaja same porezne i općenito fiskalne politike na BDP, posebice novih zemalja članica EU odnosno bivših socijalističkih zemalja, je izvan dometa ovoga rada, no ukazujemo na različitost rezultata najrecentnijih istraživanja koja dovode i u pitanje neke tradicionalne postavke (npr. Grdinić et al., 2017; Deskar-Škrbić, 2018; Došenović Bonča, Tajnikar, 2018; Donath, Mura, 2019; Ko, 2019 ).

I. Banović, H. Blažić, S. Drezgić: Utjecaj poreza na dobit na kretanje izravnih stranih ulaganja u…Zbornik Veleučilišta u Rijeci, Vol. 8 (2020), No. 1, pp. 41-58
55
5. ZAKLJUČAK
U svrhu povećanja priljeva izravnih stranih ulaganja, države su potencijalnim investitorima spremne ponuditi privlačne porezne uvjete; posebice u okviru poreza na dobit. Osim niže zakonske stope/stopa, uključuju se razne porezne olakšice i poticaji, što među državama utječe na stvaranje porezne konkurencije, a na strani multinacionalnih kompanija razvojem složenih tehnika poreznog planiranja. Kretanje zakonske porezne stope i efektivnih stopa poreza na dobit, u posljednja dva desetljeća u zemljama Europske unije ukazuje na smanjenje poreznog opterećenja i jačanje porezne konkurencije, posebice u novim zemljama članicama u odnosu na stare zemlje članice.
Panel analiza na razini Europske unije ukazuje kako porezna politika utječe na privlačenje izravnih stranih ulaganja, ali kao sekundarni čimbenik, ističući pri tom prednost varijable bruto domaćeg proizvoda.
Među analiziranim poreznim varijablama, efektivna prosječna porezna stopa se ističe kao najznačajnija u donošenju investicijskih odluka pri odabiru lokacije ulaganja.
Usporedna analiza između starih i novih zemalja članica prikazuje kako značajnost efektivnih poreznih stopa dolazi do izražaja u novim zemljama članicama, što potvrđuje aktivno korištenje porezne politike u svrhu privlačenja izravnih stranih ulaganja.
Ovim radom nije obuhvaćen utjecaj oporezivanja dobiti na odljev stranih ulaganja u analiziranim zemljama, kao ni djelovanje efektivnih poreznih stopa na prekogranične investicije u Hrvatskoj od strane zemalja iz kojih pritječe većina stranih investicija, što predstavlja preporuku za buduća znanstvena istraživanja. Isto tako, buduća bi se istraživanja mogla proširiti u smjeru izravnog obuhvata i drugih različitih poreznih i neporeznih opterećenja.
*Ovaj rad je financiran sredstvima Sveučilišta u Rijeci za projekt ZP UNIRI 3/19
LITERATURA
Bellak, C., Leibrechta, M. (2009) “Do low corporate income tax rates attract FDI? – Evidence from Central- and East European countries“, Applied Economics, 41 (21), str. 2691-2703. https://doi.org/10.1080/00036840701320217
Beck, S., Chaves, A. (2011) The impact of various taxes on foreign direct investment, Newark: University of Delaware, Department of Economics
Bezić, H., Pavlović, D. (2009) “Corporate Tax Rate and Inflow of FDI“, In: Kandžija, V., Kumar, A. (ed.)., 50 Years of European Union, Rijeka: University of Rijeka, Facultiy of Economics
Billington, N. (1999) “The location of foreign direct investment: an empirical analysis”, Applied Economics, 31:1, pp. 65-76. https://doi.org/10.1080/00036846.2019.12067087
Boskin, M. J., Gale, W. G. (1987) “New Results on the Effects of Tax Policy on the International Location of Investment”, In: Feldstein, M. (ed.), The Effects of Taxation on Capital Accumulation, Chicago: UCP.
Carstensen, K., Toubal, F., 2004. “Foreign direct investment in Central and Eastern European countries: a dynamic panel analysis”. Journal of Comparative Economics, 32(1), pp. 3-22. https://doi.org/10.1016/j.jce.2003.11.001

I. Banović, H. Blažić, S. Drezgić: Utjecaj poreza na dobit na kretanje izravnih stranih ulaganja u…Zbornik Veleučilišta u Rijeci, Vol. 8 (2020), No. 1, pp. 41-58
56
Deskar-Škrbić, M. (2018) ”Dynamic effects of fiscal policy in Croatia: confronting New-Keynesian SOE theory with empirics” Zbornik radova Ekonomskog fakulteta u Rijeci: časopis za ekonomsku teoriju i praksu/Proceedings of Rijeka Faculty of Economics: Journal of Economics and Business, 36 (1), pp. 83-102. https://doi.org/10.18045/zbefri.2018.1.83
Devereux, M., Griffith, R. (1999) The Taxation of Discrete Investment Choices, IFS Working Paper Series, No. W98/16. https://doi.org/10.1920/wp.ifs.1998.9816
Devereux, M. P., Griffith, R., Klemm, A. (2002) “Corporate Income Tax Reforms and International Tax Competition“, Economic Policy, 17 (35), pp. 449-495. https://doi.org/10.1111/1468-0327.00094
Donath, L. E. and Mura, P.O. (2019) „The Looming Central and Eastern European Real Convergence Club: Do Implicit Tax Rates Play a Part?“ Danube: Law and Economics Review, 10 (1), pp. 67-89. https://doi.org/10.2478/danb-2019-0004
Došenović Bonča, P. and Tajnikar M. (2018) “Austerity policies, economic growth and fiscal balance: lessons from Slovenia”, Zbornik radova Ekonomskog fakulteta u Rijeci: časopis za ekonomsku teoriju i praksu/Proceedings of Rijeka Faculty of Economics: Journal of Economics and Business, 36 (1), pp. 287-308. https://doi.org/10.18045/zbefri.2018.1.287
Eurostat (2019) Total GBAORD as a % of total general government expenditure, http://appsso.eurostat.ec.europa.eu/nui/show.do?dataset=gba_nabste&lang=en (10. 01. 2019.)
Eurostat (2019) Labour productivity and unit labour costs, http://appsso.eurostat.ec.europa.eu/nui/submitViewTableAction.do (10.01.2019.)
Eurostat (2019) Government deficit/surplus, debt and associated data, http://appsso.eurostat.ec.europa.eu/nui/submitViewTableAction.do (10.01.2019.)
Gorter, J., Parikh, A. (2003) “How Sensitive Is FDI to Differences in Corporate Income Taxation within the EU?“, De Economist 151 (2), pp. 193-204. https://doi.org/10.1023/A:1023913618978
Grdinić, M., Drezgić, S., Blažić, H. (2017) „An Empirical Analysis of the Relationship between Tax Structures and Economic Growth in CEE Countries“, Ekonomicky Casopis/Journal of Economics 65 (5), pp. 426-447.
Hartman, D. G. (1984) “Tax Policy and Foreign Direct Investment in the United States”, National Tax Journal, 37 (4), pp. 475-487. https://doi.org/10.3386/w0967
Jovančević, R. (2003) „FDIs in Croatia: Implication of the Liberalised Policy From Manager’s Perspective“, Naše gospodarstvo Revija za aktualna gospodarska vprašanja, 49 (5-6), pp. 465-480.
Kate, F., Milionis, P. (2019) „Is capital taxation always harmful for economic growth?” International Tax and Public Finance, 26(4), pp. 758 – 805. https://doi.org/10.1007/s10797-019-09530-3
King, M. A., Fullerton, D. (1984) The Taxation of Income from Capital: A Comparative Study of the U.S., U.K., Sweden, and West Germany—The Theoretical Framework, NBER Working Paper, No. 1058.
Ko, M.-C. (2019) “Fiscal Policy, Government Debt, and Economic Growth in the Kaleckian Model of Growth and Distribution“, Journal of Post Keynesian Economics, 42 (2), pp. 215-231. https://doi.org/10.1080/01603477.2018.1503056
Kostial, K., Gropp, R., (2000) The disappearing tax base: is foreign direct investment eroding corporate income taxes?, Frankfurt am Main: European Central Bank
Mateev, M., Tsekov, I. (2014) “Are there any top FDI performers among EU-15 and CEE countries? A comparative panel data analysis“, Financial theory and practice, 38 (3), pp. 337-374. https://doi.org/10.3326/fintp.38.3.4
de Mooij, R. A., Ederveen, S. (2003) “Taxation and Foreign Direct Investment: A Synthesis of Empirical Research“, International Tax and Public Finance, 10 (6), pp. 673-693. https://doi.org/10.1023/A:1026329920854
Morisset, J. (2003) “Tax Incentives: Using Tax Incentives to Attract Foreign Direct Investment“, Viewpoint: Public Policy for the Private Sector, February 2003, Note No. 253. World Bank, pp. 1-4. https://openknowledge.worldbank.org/bitstream/handle/10986/11325/255210NEWS0REP10Box345634B01PUBLIC1.pdf (16.07.2019.)
Mudenda, L. (2015) Corporate Income Tax Rate and Foreign Direct Investment, Umea: Umea University

I. Banović, H. Blažić, S. Drezgić: Utjecaj poreza na dobit na kretanje izravnih stranih ulaganja u…Zbornik Veleučilišta u Rijeci, Vol. 8 (2020), No. 1, pp. 41-58
57
OECD (2000) Tax Burdens - Alternative Measures, OECD Tax Policy Studies, No. 2, Paris: OECD Publishing
OECD (2001) Corporate Tax Incentives for Foreign Direct Investment. OECD Tax Policy Studies, No.4. Paris: OECD Publishing
OECD (2003) Tax Policy Assessment and Design in Support of Direct Investment: A Study of Countries in South East Europe, Paris: OECD Publishing
Olofsdotter, K., Hansson, A. (2010) Tax Differences and Foreign Direct Investment in the EU27, Lund: Department of Economics, Lund University
Pavlovic, D. (2007) “Utjecaj visine poreza na dobit na priljev inozemnih stranih ulaganja“, Ekonomski pregled, 58 (11), pp. 732-748.
Pavlović, D., Ćosić, D., Stojsavljević, S. (2011) “Razlike u vrednovanju inozemne lokacije za izravna ulaganja“, Ekonomski vjesnik : časopis Ekonomskog fakulteta u Osijeku, 1 (2011), pp. 61-71
Pirvu, D. (2012) Corporate Income Tax Harmonization in the European Union, London: Palgrave Macmillan
Raudonen, S., Freytag, A. (2013) “Determinants of FDI inflows into the Baltic Countries: Empirical Evidence from a Gravity Model“, Journal of Business and Economics, 4 (2), pp. 180-194
Spengel, C. et al. (2018) Effective Tax Levels Using the Devereux/Griffith Methodology - Update 2017, Project for the EU Commission TAXUD/2013/CC/120 Final Report 2017, Mannheim: ZEW, https://ec.europa.eu/taxation_customs/sites/taxation/files/final_report_2017_effective_tax_levels_revised_en.pdf (07. 10. 2018.)
Šimović, H, (2009) “Effective Corporate Income Tax Burden in Croatia“, International Review of Economics & Business, 12(2) pp. 107-121.
Švaljek, S. (ed.) (2006) Efektivno porezno opterećenje trgovačkih društava u Republici Hrvatskoj, Zagreb: Ekonomski institut
UNCTADSTAT (2019) Foreign direct investment: Inward and outward flows and stock, http://unctadstat.unctad.org/wds/TableViewer/tableView.aspx?ReportId=96740 (10. 01.2019.)
UNCTADSTAT (2019) Gross domestic product, https://unctadstat.unctad.org/wds/TableViewer/tableView.aspx?ReportId=96 (10. 01.2019.)
Wijeweera, A., Dollery, B. and Clark, D. (2007) “Corporate tax rates and foreign direct investment in the United States“, Applied Economics, 39(1), pp. 109-117. https://doi.org/10.1080/00036840500447872
World Bank (2019) Domestic credit to private sector by banks (% of GDP), https://data.worldbank.org/indicator/FD.AST.PRVT.GD.ZS (10. 01.2019.)
World Bank (2019) Unemployment, total (% of total labor force), https://data.worldbank.org/indicator/SL.UEM.TOTL.ZS (10. 01.2019.)

I. Banović, H. Blažić, S. Drezgić: Utjecaj poreza na dobit na kretanje izravnih stranih ulaganja u…Zbornik Veleučilišta u Rijeci, Vol. 8 (2020), No. 1, pp. 41-58
58
Original scientific paper https://doi.org/10.31784/zvr.8.1.3 Received: 15. 10. 2019. Accepted: 20. 1. 2020.
THE IMPACT OF THE CORPORATE INCOME TAX ON THE FDI FLOWS IN THE EU MEMBER COUNTRIES
Igor Banović Specialist in Finance (MBA), Audit Assistant, Medicom d. o. o., Meštrovićeva 16, 51 000 Rijeka, Croatia;
e-mail: [email protected]
Helena Blažić PhD, Full Professor – Tenured Professor, University of Rijeka, Faculty of Economics and Business, Ivana
Filipovića 4, 51 000 Rijeka, Croatia; e-mail: [email protected]
Saša Drezgić PhD, Associate Professor, University of Rijeka, Faculty of Economics and Business, Ivana Filipovića 4,
51 000 Rijeka, Croatia; e-mail: [email protected]
ABSTRACTThe most part of available capital owns private entities (usually multinational companies), inclined to expand their business. The impact of that is not only the maximization of their profits, but also positive effects on employment, economic growth, development of domestic financial markets and general prosperity of one country. Those are some reasons why most countries of the world actively strive to form favorable business environment, that will have positive impact to attract foreign direct investments (FDI). The aim of this paper is to examine the impact of corporate income taxation on attracting FDI flows in the EU member countries. The statistical panel analysis is conducted in the period from 1998 to 2017 for 28 EU member countries, separately for old (EU 15) and new member countries (EU13). Besides different control variables, different corporate income tax rates – statutory corporate income tax rate and effective (average and marginal) corporate income tax rates are analyzed as the independent variables in order to investigate the real tax burden of corporations and its impact on the FDI flows. It is concluded that the tax policy influences significantly the FDI flows of the corporations in the new EU member countries (that are characterized by the lower tax burden), but not as the primary factor (unlike GDP). Among the tax rates, there is the strongest influence of the effective average tax rate.
Key words: corporate income tax, FDI, EU 15, EU 13
Creative Commons Attribution – NonCommercial 4.0 International License

S. Pepur, D. Kovač, M. Ćurak: Factors Behind Trade Credit Financing of SMEs in CroatiaZbornik Veleučilišta u Rijeci, Vol. 8 (2020), No. 1, pp. 59-76
59
Original scientific paper https://doi.org/10.31784/zvr.8.1.11 Received: 25. 10. 2019. Accepted: 16. 12. 2019.
FACTORS BEHIND TRADE CREDIT FINANCING OF SMEs IN CROATIA
Sandra Pepur PhD, Assistant Professor, University of Split, Faculty of Economics, Business and Tourism, Cvite Fiskovića 5,
21 000 Split, Croatia; e-mail: [email protected]
Dujam Kovač Mag. oec., Assistant Lecturer, University of Split, Faculty of Economics, Business and Tourism,
Cvite Fiskovića 5, 21 000 Split, Croatia; e-mail: [email protected]
Marijana Ćurak PhD, Full Professor, University of Split, Faculty of Economics, Business and Tourism, Cvite Fiskovića 5,
21 000 Split, Croatia; e-mail: [email protected]
ABSTRACTSmall and medium enterprises (SMEs) contribute to the national economy in terms of employment, added value, knowledge generation, and innovation. However, their potential and in the case of economic downturns even their survival is affected by the difficulties in their access to external financing under acceptable terms and adequate timing and amount. In the case of asymmetric information problems, which make SMEs more sensitive to financial market imperfections, trade credit can be a valuable source of financing. In the European Union, trade credit is among the most relevant external funding sources and it is among the most important alternatives to financial intermediaries’ financing. However, there are substantial differences between the countries with respect to availability and use of trade credit. Therefore, this research examines determining (company-specific and country-specific) factors behind the use of trade credit as a financing source in Croatia. The empirical analysis is based on the data for 1,225 SMEs operating in Croatia in the period from 2008 to 2017 and is done using the panel data methodology. The findings confirm that firms’ characteristics, as well as the characteristics of financial, macroeconomic and legal environment in which the firms operate, influence the use of trade credit in SMEs in Croatia. The paper contributes to relatively scarce empirical evidence on the determinants of trade credit use by SMEs in South-East European countries.
Key words: Supplier financing, Croatian companies, panel methodology
Creative Commons Attribution – NonCommercial 4.0 International License

S. Pepur, D. Kovač, M. Ćurak: Factors Behind Trade Credit Financing of SMEs in CroatiaZbornik Veleučilišta u Rijeci, Vol. 8 (2020), No. 1, pp. 59-76
60
1. INTRODUCTION
Small and medium sized enterprises (SMEs) are an important part of every national economy1. In 2017, in the EU-28 non-financial business sector, SMEs accounted for over 99 % of enterprises, over 66% of employment and generated almost 57 % of total value added (European Commission, 2018:13). With regard to Croatia, in 2017 SMEs accounted for 99.7 % of total enterprises, employed 73.2 % of the workforce and contributed with a share of 59.6 % to the total income generated (Alpeza et al., 2018; FINA, 2018). Additionally, SMEs are important in terms of knowledge generation and research as well as their innovation potential (Leitner, Stehrer, 2015:1).
However, their own investments and development as well as their contribution to the economic growth can be limited by the obstacles SMEs face in their business. According to different surveys, one of the most relevant barriers for SMEs is access to finance which includes external financing under acceptable terms and in adequate amount (Vidučić et al., 2018:487). In a bank-oriented financial system such as the Croatian one, SMEs are more directed to traditional financing through financial intermediaries. Although the range of bank credits has broaden in recent years, many financial institutions consider lending to SMEs to be highly risky, primarily due to poor collateral, high failure rate and/or lack of information (Vidučić et al., 2018). This consequently results in inadequate financing in different phases of SMEs’ development, especially in the risky start-up phase or during the phase of intensive growth (Alpeza et al., 2018). It becomes even more pronounced in turbulent times.
In such circumstances, when SMEs cannot obtain a credit from a bank or can obtain it but only at high costs and after very complex procedures, trade credit or supplier financing becomes the valuable alternative. Recent evidence confirms the importance of trade credit financing for SMEs in the European Union - trade credit is one of the largest sources of financing, amounting to around 30 % of the GDP. It is the most important alternative to bank loans as it is the principal source of financing after sources through financial intermediaries, and it is present at all stages of a firm’s lifecycle (Canto-Cuevas et al., 2019:1).
Trade credit is an attractive financing source and it allows a customer (buyer) to obtain a product (or service) up front while the payment to supplier is deferred and will take place in the future, on a scheduled day, with no interest charged2. The theoretical literature suggests various approaches and motives3,4 to explain the firms’ involvement in trade credit (“supply-side view” which focuses on trade
1 The criteria for classifying companies in the SME sector in Croatia are defined by the Accounting Act (Zakon o računovodstvu) and the Small Business Incentives Act (Zakon o poticanju malog gospodarstva). The latest amendment to the Accounting Act in 2017 introduced the category of micro-enterprises. The criteria for the classification are annual number of employees, the annual income or the balance sheet total.
2 One type of costs connected to trade credit financing is an implicit cost that the company-buyer bears in a situation when it forgoes a discount for early payment offered from the supplier. Apart from these, trade credit can expose company-buyer to refinancing risk, potential costs such as late payment penalties, lowering the firm’s credit reputation etc., which can ultimately lead to worsening the relationship with suppliers (Martinez-Sola et al., 2017).
3 The motives are described as operational, commercial and financial. For literature review, see for example Emery (1984) and Petersen, Rajan (1997).
4 Another strand of empirical literature, such as the recent study by Mättö and Niskanen (2019), investigate trade credit use through the prism of cultural dimensions. Their findings indicate that religion and national culture can determine trade credit management and, to a certain extent, explain previously observed cross-country variations in trade credit (Mättö, Niskanen, 2019).

S. Pepur, D. Kovač, M. Ćurak: Factors Behind Trade Credit Financing of SMEs in CroatiaZbornik Veleučilišta u Rijeci, Vol. 8 (2020), No. 1, pp. 59-76
61
credit granted to customers and is evident in the level of accounts receivable) and the advantages of the use of trade credit as a financing source (“demand-side view” shown in the buyer’s balance sheet level of accounts payable). Trade credit allows companies to reduce the transaction costs related to cash management and the process of paying invoices (Ferris, 1981; Emery, 1987) and to evaluate the product quality before payment (Lee, Stowe, 1993; Deloof, Jegers, 1996). In this way, it supports the sales policy, enables flexibility with respect to the variability in demand (Emery, 1984) and can strengthen the long-term relationship with customers (Wilson, Summers, 2002). Financial approach observes trade credit as an alternative to bank credit and other sources of financing, emphasizing market imperfections, such as transaction costs and information asymmetry. Market imperfections may result in credit rationing and, to overcome this problem, SMEs can choose trade credit as an important short-term financing instrument (Yazdanfar, Öhman, 2017), especially when credit from financial institutions is constrained (Elliehausen, Wolken, 1993; Petersen, Rajan, 1997) or when financial markets are less developed (Fisman, Love, 2003). In comparison to bank loans, trade credit provides a higher degree of financial flexibility (Huyghebaert et al., 2001).
However, if the discount for early payments is not used (Vidučić et al., 2018; Hill et al, 2017)5 suppliers’ financing can be a very expensive source of financing with high opportunity costs. Although some studies suggest the opposite6, the findings of a recent international study by Hill et al. (2017) suggest that trade credit is used relatively less by larger, more liquid firms and firms with less volatile earnings, or, more generally, by firms with easier access to financial credit. These results, which are more pronounced in firms operating in emerging economies, support the position of trade credit as an expensive source of financing (Hill et al., 2017:2319). The aforementioned additionally justifies the investigation of the key factors that determine the use of expensive trade credit by SMEs in South-East European countries such as Croatia.
In recent years, the number of researches on different aspects of trade credit use and/or its implications on company performance (profitability, value, survival, etc.) have increased (Yazdanfar, Öhman, 2017:11). Additionally, after the last financial crisis, several studies examined whether trade credit is an alternative or a complement to other financing sources (and bank credit). Generally, the results support the role of trade credit as a complement to (short-term) bank financing (Andrieu et al., 2018; Yazdanfar, Öhman, 2017) but also as a substitute for long-term debt (Yazdanfar, Öhman, 2017). In other words, the results indicate a redistribution effect of trade credit during financial crisis denoting that as the SME’s access to finance from financial institutions was restricted, SMEs relied more on trade credit, which then increased the possibility of their survival during and after the crisis period (McGuinness et al., 2018). Thus, trade credit proved to be an important mechanism that helped SMEs to cope with the credit crisis (McGuinness, Hogan, 2014; McGuiness et al., 2018; Bussoli, Marino, 2018) as suppliers served as lenders of last resort (Carbo-Valverde et al., 2016).
All the above mentioned supports a deeper investigation of trade credit as an SME funding source, apart from solely bank financing. Therefore, the aim of this research is to empirically investigate the
5 However, the decision on forgoing the discount is not completely voluntary made and can be closely related to the firm’s inadequate liquidity and inability to take the discount offered.
6 For the review of these studies, see for example Hill et al. (2017)

S. Pepur, D. Kovač, M. Ćurak: Factors Behind Trade Credit Financing of SMEs in CroatiaZbornik Veleučilišta u Rijeci, Vol. 8 (2020), No. 1, pp. 59-76
62
determinants of trade credit financing of SMEs in Croatia. The role of trade credit and the factors behind it, can be especially pronounced in the bank-oriented financial system like the Croatian one, where firms depend on limited and expensive bank financing. Additionally, financing through capital markets is unreachable and is therefore rarely used.
Firms’ access to finance depends not only on the characteristics of the firm itself, but also on the environment in which it operates. Beck et al. (2008) show in a research on a large set of developed and developing countries that the use of external sources strongly depends on the country’s level of financial and legal development. In developing countries where formal lenders are limited, financial markets are less developed and creditor protection is weak, trade credit plays an even more significant role in funding firm’s activities (Fishman, Love, 2003). With respect to the EU countries, despite economic and financial integration of new member states, both macroeconomic context and the structure of the banking sector still differ significantly between the member states (Leitner, Stehrer, 2015). According to SAFE survey, the financing patterns of SMEs differ substantially in EU-28 and Croatia due to differences in the financing resource availability and the SMEs’ needs (Harc et al., 2017). Furthermore, firms from Croatia have rarely been included7 in the cross-country examination on trade credit use. To the authors’ knowledge, the only single-country research on trade credit determinants performed on a sample of Croatian companies is a study by Deari and Barbuta-Misu (2018). Their sample consisted of 26 non-financial firms listed on the Zagreb Stock Exchange during the observed period from 2007 to 2013. Our research differs from the mentioned study as it focuses on a larger sample of small and medium enterprises and for a longer and more recent period from 2008 to 2017. Apart from the firm-level determinants used in the study by Deari and Barbuta-Misu (2018), our analysis will be expanded to include institutional and macroeconomic characteristics that may affect firm’s financial decisions, such as the features of the financial system, legal environment and general macroeconomic circumstances. Additionally, our analysis is performed using dynamic panel methodology and the GMM estimator.
All the above mentioned raises the question of whether the trade credit use and its determinants, confirmed in other comparable studies, differ in the case of small and medium enterprises in a specific Croatian environment. Thus, the main hypothesis of the research is: firm-specific factors (internal) as well as institutional and macroeconomic (external) factors influence the use of trade credit as a financing source of SMEs in Croatia.
The paper is structured as follows: after the introduction, the second section briefly outlines the literature review on various factors that explain the use of trade credit financing. The third section describes the data, methodology and the research model. Empirical results and their discussion are presented in the fourth section, followed by the concluding remarks.
7 Croatia has been included only in a few cross-country analysis: in a study by Bussoli and Marino (2018) but contributed only with nine small and medium companies in the final sample; then in an international study by Hill et al. (2017) but with only 129 observations (0.075% in total observations) in eighteen-year period; and in the Mättö and Niskanen’s (2019) cross-country study on the relationship between religion and nation culture and trade credit (6,603 observations in a five-year period or 1.29%).
S. Pepur, D. Kovač, M. Ćurak: Factors Behind Trade Credit Financing of SMEs in CroatiaZbornik Veleučilišta u Rijeci, Vol. 8 (2020), No. 1, pp. 59-76
63
2. DETERMINANTS OF TRADE CREDIT - LITERATURE REVIEW
Many empirical investigations on trade credit use, its importance and influential factors have been carried out lately. Evidence is obtained using different approaches (microeconomic or macroeconomic), different variables and their measures, different methods, sources of data (survey results or firm-level accounting data), and different time spans.
Firm’s characteristics, such as creditworthiness, profitability, current asset investment, growth opportunities as well as access and availability of alternative financing sources, can influence the use of trade credit.
According to the Pecking order theory (Myers, Majluf, 1984; Myers 1984), which is based on the asymmetric information between the firm’s insiders and outsiders and results in adverse selection problem, firms prefer internal to external financing and debt over equity. Comparing internal financing and trade credit, it is concluded that internal financing is preferred because it is the cheapest source and it avoids all information asymmetry problems. Thus, firms with a better ability to generate funds internally have more resources available and need less funding from other sources, including suppliers. This negative relationship is confirmed in most previous studies conducted on SMEs (i.e. García-Teruel, Martínez Solano, 2010; Martinez-Sola et al., 2017; Canto-Cuevas et al., 2019).
Growth opportunities put pressure on the amount of working capital the firm needs to support sales growth. Thus, companies with a larger increase in sales demand more finance in general and trade credit in particular because of its flexibility to adjust to the customer’s operation dynamics. As Cuñat (2007) points out, high growth firms get a higher proportion of trade credit from their suppliers. Therefore, a positive relationship is expected between SMEs’ sales growth and trade credit financing, as confirmed by Palacin-Sánchez et al. (2018), Mättö and Niskanen (2019), and Canto-Cuevas et al. (2019).
In assessing a firm’s ability to obtain credit, its creditworthiness is of the highest importance. The size of the firm is one of the credit quality indicators and it can affect the demand for trade credit financing adversely. Firm size reflects the degree of information asymmetry and the ability to establish relationships with both banks and other credit suppliers (Yazdanfar, Öhman, 2017). Larger firms are considered more creditworthy and can therefore receive more credit from their suppliers (Petersen, Rajan, 1997). This positive relationship is supported by the results reported in studies conducted by Yazdanfar and Öhman (2017), Barbuta-Misu (2018) and Canto Cuevas et al. (2019), who found that larger firms, with greater growth opportunities and greater investments in current assets, receive more financing from their suppliers. However, due to their better credit capacity and reputation, larger firms have easier access to financing through other credit channels and consequently need less trade credit (i.e. Niskanen, Niskanen, 2006; Bussoli, 2017).
The level of inventory and its management is a part of the firm’s working capital management. Firms that invest more in inventories, similarly to firms with a greater increase in sales, need more short-term financing. On the assumption that firms tend to match the maturity of assets and liabilities, in order to finance investments in working capital and satisfy the mentioned financing

S. Pepur, D. Kovač, M. Ćurak: Factors Behind Trade Credit Financing of SMEs in CroatiaZbornik Veleučilišta u Rijeci, Vol. 8 (2020), No. 1, pp. 59-76
64
rule, it can be expected that the trade credit financing increases with the growth in inventories. Empirical results confirm this positive relationship (i.e. Garcia-Teruel, Martinez-Solano, 2010; Deari, Barbuta-Misu, 2018). However, inventories can serve as collateral for bank loans, thus reducing firm’s credit constraints (Atanasova, 2007) and decreasing the need for supplier financing. Moreover, a composition of inventories can also affect firm’s decision to use trade credit (i.e. Mateut et al., 2015) because different inventory categories8 have different values from the liquidation perspective.
In line with the Pecking order theory, internal funds are the cheapest source of financing and are therefore preferred. Firms with higher profitability tend to have more internally generated funds that consequently reduce their need for more expensive trade credit financing. In most empirical studies, this negative relationship is evident (i.e. Canto-Cuevas et al. 2016, Yazdanfar, Öhman, 2016; Andrieu et al. 2018).
The financing motive behind the involvement in trade credit emphasises the advantages of supplier financing in the context of availability of other sources of financing, particularly bank credit. This implies a potential influence of, not only firm’s characteristics, but also of institutional features, such as the characteristics of a country’s financial system. Financial system has an important role in reducing market imperfections related to transaction costs, information asymmetry and conflict of interest and in providing external financing for companies. When considering banks as the main providers of firms’ financing, the relationship between bank credit and trade credit is explained by two opposing views. The first one sees trade credit as an alternative to bank loan9. According to Pagano (1993), in the process of funnelling savings from savers to borrowers, a part of the funds is lost due to covering the costs of financial intermediation. When banks are considered, these funds cover the spread between the lending and borrowing interest rates. It is a compensation for banking services. Although the spread is determined by various factors (e.g. market terms, taxation, regulation), it also reflects the bank’s efficiency. If banks are less efficient, the cost of financial intermediation is higher. From the firms’ perspective, this means higher cost of borrowing which results in higher trade credit financing. Additionally, due to limited amount of collateral, access to bank credit is especially limited for SMEs. Moreover, these companies have only a partial access to the financial markets. Thus, as it was stated in the seminal work by Meltzer (1960) and confirmed by numerous studies (e.g. McGuinness, Hogan, 2014; Carbó-Valverde et al., 2016; Palacín-Sánchez et al., 2018), with restricted banks’ financing sources, firms resort to trade credits. The tightening in banks’ lending, especially to SMEs, was evident in times of financial crises when firms used more trade credits (Casey, O’Toole 2014; McGuinness et al., 2017). However, there is the opposite evidence, too. More precisely, empirical studies confirm that during financial crises bank credit and trade credit move in the same direction (Taketa, Udell 2007; Psillaki, Eleftheriou, 2015). This is in line with the opposite view10, which implies that the relationship between trade credit and bank credit is positive (Biais, Gollier, 1997). Banks are readier to lend if suppliers provide trade credits to their customers. In other words, trade credits by suppliers reduce information
8 To test the impact of inventory composition on firm’s incentive to use trade credit, separate accounting information on inventories according to their stage of fabrication is needed. These disaggregated data are not available in dataset used in this study.
9 In the literature known as substitution hypothesis. 10 In the literature known as hypothesis of complementarity.

S. Pepur, D. Kovač, M. Ćurak: Factors Behind Trade Credit Financing of SMEs in CroatiaZbornik Veleučilišta u Rijeci, Vol. 8 (2020), No. 1, pp. 59-76
65
asymmetry for banks. In this way, as trade credits are increasing, bank lending is increasing, too. Additionally, with more access to bank financing, suppliers of trade credit are more able to provide financing to their customers. In this way, “non-financial corporations act as ‘agents’ for financial intermediaries” (Demirgüç-Kunt, Maksimovic, 2001:6). This is the case when suppliers are more efficient in gathering information and monitoring firms in comparison to financial institutions. Thus, these two types of financing are not alternative but are complementary to one another. Beside the above stated papers, there are additional studies that empirically confirm the second hypothesis (e.g. Agostino, Trivieri, 2014; Deloof, La Rocca, 2015; Andrieu et al., 2018; Hill et al., 2019).
Beside the above explained influences of company-level factors and the characteristics of the financial system, the use of trade credit can also be determined by the macroeconomic factors and the legal environment.
Macroeconomic conditions influence external financing (Demirgüç-Kunt, Maksimovic, 1998; Demirgüç-Kunt, Maksimovic, 2001). Among them, two main ones are GDP growth and inflation. When the economy is growing, firms need more financial resources. Thus, it is expected that economic growth positively affects trade credit. Since inflation reflects monetary instability, long-term financing is limited in times of high inflation implying that firms have access only to short-term financing, and consequently to trade credit. Demirgüç-Kunt and Maksimovic (1998) found that long-term debt is negatively related to inflation. Therefore, a positive relationship between inflation and trade credit is anticipated.
A country’s legal system influences the availability of external sources of financing (Demirgüç-Kunt, Maksimovic, 1998). In countries with low level of creditor rights protection, lenders refrain from providing financial resources to firms. On the other hand, a more efficient legal system that protects creditor rights encourages repayment of both banks and trade credits. This could imply that a positive impact of the legal system on trade credit is expected. However, the legal system is likely to be more important for credits of financial intermediaries than for trade credits (Demirgüç-Kunt, Maksimovic, 2001). In the environment of an inefficient legal system, the suppliers of trade credit are more able to cope with the problem of credit repayment in comparison to banks. According to Fishman and Love (2003:357) the advantages of trade creditors in comparison to financial institutions in countries with inefficient legal systems are information acquisition, the renegotiation/liquidation process and enforcement. For example, suppliers could suspend deliveries to their customers in the future and thus encourage the repayment of trade credit. This suggests that a negative relationship between the efficiency of the legal system and trade credit is expected (Demirgüç-Kunt, Maksimovic, 2001). The efficiency of the legal system as a determinant of trade credit is evidenced by Demirgüç-Kunt and Maksimovic (2001), Hill et al. (2017) and Palacín-Sánchez et al. (2018).
3. DATA AND METHODOLOGY
Data for the variables used in this analysis are collected for the 2008-2017 period from the Amadeus - Bureau van Dijk database. The analysed period represents the most recent available data that refer to small and medium enterprises in Croatia. Size classification is based on the Amadeus -

S. Pepur, D. Kovač, M. Ćurak: Factors Behind Trade Credit Financing of SMEs in CroatiaZbornik Veleučilišta u Rijeci, Vol. 8 (2020), No. 1, pp. 59-76
66
Bureau van Dijk database criteria. Medium-sized enterprises are those that satisfy at least one of the following criteria: operating income ≥1 million EUR, total assets ≥2 million EUR, number of employees ≥15. When the indicators are lower than the previously stated ones, then the data refers to a small business. After excluding SMEs with missing data and applying the criteria that for each variable there should be data available for a minimum of 3 consecutive years, the final number of active companies represented in the analysis is 1,225, which represents 1.02% of the SME population in 2017.
The advantage of panel data is based on the fact that they contain inter-individual differences and intra-individual dynamics which impose an advantage over cross-sectional or time-series data (Hsiao, 2005). The advantage is a more precise model parameters estimation. According to Hsiao (1985) panel data reduce estimator bias, while simultaneously reducing problems of data multicollinearity. Due to the dynamic nature of economic relations, the following dynamic model is formed:
creditpay𝑖, = 𝜇 + 𝛾 creditpayi,t-1 + ∑𝛽j Xj,t + 𝜀𝑖,𝑡
Where creditpay𝑖, is the measure of the size of trade credit use of an SME i at time t, with i=1,…,1225, t=1,…,10; 𝜇 is the constant term, creditpayi,t-1 is the one-period lagged size of trade credit use, 𝛾 is the lagged dependent variable parameter, the vector of j explanatory variables accounts for the firm’s specific financial system, macroeconomic and institutional variables, 𝜀𝑖,𝑡 is the disturbance, which summarizes unobserved firm-specific effect and idiosyncratic error.
In order to estimate the impact of various factors that may have an important role in explaining trade credit financing, the authors created two groups of determinants; the first relates to firm-level determinants and the other to country-level determinants. A detailed insight into determinants, their measures and their expected effect on trade credit use is presented in Table 1.

S. Pepur, D. Kovač, M. Ćurak: Factors Behind Trade Credit Financing of SMEs in CroatiaZbornik Veleučilišta u Rijeci, Vol. 8 (2020), No. 1, pp. 59-76
67
Table 1. Definition, measure and expected impact of the variables
Variable Variable measure SourceVariable
codeExpected impact
Trade credit Credit payables / Total assetsAmadeus - Bureau van Dijk database
creditpay
Firm-level data
Internal financing(P/L for period [= Net
Income] + depreciation) / TA
Amad
eus -
Bur
eau
van
Dijk
dat
abas
e
cashf –
Short term debt Short term debt / Total assets shortd +/–
Long term debt Long term debt / Total Assets longd +/–
Creditworthiness Ln_total assets size +/–
ProfitabilityEBITDA Margin % (EBITDA /
Operating revenue)profit +/–
Growth opportunities
(Sales t - Sales t-1) / Total assets t-1)
growth +
Inventory Ln_inventory invent +
Country-level data
Bank efficiencyBank overhead costs to total
assets (%)
World Bank, International
Monetary Fund, International
Financial Statistics and data files
gfddei +
GDP growth
Growth rate of GDP per capita,
PPP (constant 2011 international $)
World Bank, national accounts data and OECD
National Accounts data files
g_gdp +
InflationInflation, consumer prices
(annual %)
World Bank, International
Monetary Fund, International
Financial Statistics and data files
infln +
Legal system Property rights indexProperty Rights
Allianceproprights –
Source: Created by authors

S. Pepur, D. Kovač, M. Ćurak: Factors Behind Trade Credit Financing of SMEs in CroatiaZbornik Veleučilišta u Rijeci, Vol. 8 (2020), No. 1, pp. 59-76
68
Table 2 provides an insight into descriptive statistics of the analysed variables. The average share of trade credit financing in the total assets for SMEs in Croatia in the observed 2008-2017 period amounted to 19.4%. Interesting to note, some SMEs in the sample used trade credits to an extent twice the recorded total assets.
Table 2. Descriptive statistics
Variable Obs MeanStd. Dev.
Min Max
creditpay 12,050 0.194 0.183 3.73E-06 2.221
shortd 4,366 0.088 0.095 3.25E-06 0.963
longd 7,793 0.221 0.218 1.86E-06 6.986
size 12,128 15.095 1.448 7.090 19.307
growth 10,800 0.650 43.911 -1.000 4,476.600
invent 9,700 12.977 2.086 2.303 18.038
cashf 11,947 0.129 0.211 -14.303 1.708
profit 11,894 0.113 0.148 -0.986 0.925
gfddei 11,025 2.245 0.210 1.998 2.757
g_gdp 12,250 1.006 0.033 0.927 1.040
infln 12,250 1.666 2.010 -1.125 6.077
proprights 12,250 59.210 2.460 54.100 61.500
Source: Authors
According to Baltagi (2008), panel analysis does not presuppose the multicollinearity test, hence the possible multicollinearity problem is analysed. Table 3 summarizes the pair-wise correlation coefficient for all the variables that have been included in the model. There is no pronounced correlation between the explanatory variables, which indicates that there is no problem of multicollinearity.

S. Pepur, D. Kovač, M. Ćurak: Factors Behind Trade Credit Financing of SMEs in CroatiaZbornik Veleučilišta u Rijeci, Vol. 8 (2020), No. 1, pp. 59-76
69
Table 3. Correlation matrix
creditpay cashf shortd longd size profit
creditpay 1
cashf -0.148 1
shortd 0.038 -0.08 1
longd -0.187 -0.027 -0.154 1
size -0.053 -0.11 -0.157 -0.03 1
profit -0.253 0.552 -0.115 0.101 0.055 1
growth -0.003 -0.002 0.036 -0.011 0.001 0.029
invent 0.095 -0.183 -0.015 -0.078 0.546 -0.121
gfddei -0.019 0.012 -0.019 -0.01 0 0.023
g_gdp -0.068 -0.023 -0.034 -0.003 0.017 0.01
infln 0.08 0.044 0.084 0.019 -0.011 0.023
proprights -0.057 -0.047 -0.053 -0.012 0.013 -0.048
growth invent gfddei g_gdp infln proprights
growth 1
invent -0.027 1
gfddei -0.008 -0.003 1
g_gdp 0.011 -0.003 0.221 1
infln 0.002 0.017 -0.036 -0.267 1
proprights -0.001 -0.007 -0.071 0.352 -0.551 1
Source: Authors
4. RESULTS AND DISCUSSION
In this section, the empirical results and discussion are presented. Two models are estimated: the first underlying model contains firm-level variables while country-level variables are added in the second one. The models are estimated with the Blundell-Bond estimator. The estimation results are shown in Table 4. Based on the assumption of the relationship between the dependent and some of the explanatory variables in both directions, a part of the explanatory variables is assumed to be endogenous. They include: short-term debt, long-term debt, size, growth of sales, and inventories. The validity of each model is tested using the Sargan test. The performed Sargan test does not show the presence of endogenous problems. According to Roodman (2009), Sargan test is valid in the case when the number of instruments does not exceed the number of groups. This condition is also met.

S. Pepur, D. Kovač, M. Ćurak: Factors Behind Trade Credit Financing of SMEs in CroatiaZbornik Veleučilišta u Rijeci, Vol. 8 (2020), No. 1, pp. 59-76
70
Another diagnostic test refers to the autocorrelation of residuals (first-order serial correlation and second-order serial correlation). The autocorrelation tests confirm the consistency of the estimator.
Table 4. Estimation results
BB Two-step BB Two-step (country-level data included)
creditpay creditpay
L.creditpay 0.504*** 0.533***
-0.0307 -0.0387
shortd -0.113* -0.133**
-0.0631 -0.0607
longd -0.0427 -0.0265
-0.0294 -0.0257
size -0.0157** -0.0189***
-0.00616 -0.00704
growth 0.00374 0.00305
-0.00297 -0.00277
invent 0.00197 0.00952**
-0.00384 -0.00419
cashf -0.107*** -0.0948***
-0.0375 -0.0349
profit -0.0466** -0.0365*
-0.0217 -0.0198
gfddei 0.00952**
-0.00481
g_gdp 0.168**
-0.0704
infln 0.00314***
-0.00109
proprights -0.00334***
-0.00102
_cons 0.344*** 0.293***
-0.0813 -0.0989
N 2640 2349
Sargan test (p-value) 0.0634 0.0782
First-order correlation (p-value) 0 0
Second-order correlation (p-value) 0.5588 0.6987
* p< 0,05, *** p< 0,01
Source: Created by authors

S. Pepur, D. Kovač, M. Ćurak: Factors Behind Trade Credit Financing of SMEs in CroatiaZbornik Veleučilišta u Rijeci, Vol. 8 (2020), No. 1, pp. 59-76
71
The impact of the analysed explanatory variables is in line with theoretical expectations. The results confirm that SMEs that generate more internal finance demand less trade credit. This negative relationship is confirmed in most previous studies conducted on SMEs (i.e. García-Teruel, Martínez Solano, 2010; Martinez-Sola et al., 2017; Canto-Cuevas et al. 2019). The negative coefficients with regard to short-term and long term-debt indicate a substitutive relation between trade credit and these alternative sources of financing. The availability of short-term debt reduces the need for trade credit which is more costly and thus less preferable. Although the same negative relationship holds for long-term debt as well, it is not statistically significant. Similar results are confirmed in other studies on SMEs, i.e. Garcia-Teruel and Martinez-Solano (2010), Yazdanfar and Öhman (2017) (substitution effect is evident only for the long-term debt) and Canto-Cuevas (2019). With respect to firm size, the results confirm that larger SMEs, which are observed as more creditworthy, tend to use less trade credit. With regard to firm profitability, it is concluded that profitable firms, due to their ability to generate internal funds, use less financing from suppliers. Firms with growth opportunities and larger inventories use trade credit more in order to finance their investments in working capital. The statistical significance of the latter is confirmed. Our results regarding the impact of firm profitability and sales growth correspond to the results of the aforementioned studies (i.e. Garcia-Teruel, Martinez-Solano, 2010; Yazdanfar, Öhman, 2017; Canto-Cuevas, 2019).
The coefficient of bank efficiency variable has a positive sign. Taking into consideration the measure of the bank efficiency variable, this implies that as banks are becoming less efficient, trade credits are increasing. In other words, the obtained results confirm the role of trade credit as a substitution for bank financing and are in line with the results of the following country-level studies: Nilsen (2002), McGuinness and Hogan (2014) and Carbó-Valverde et al. (2016).
Considering macro-economic conditions, there is a significant positive sign of the coefficient of the GDP growth variable, as it was hypothesized. Inflation positively affects the use of trade credit. This is consistent with a research on determinants of trade credit by Demirgüç-Kunt and Maksimovic (2001) as well as with a part of the research by Hill et al. (2017).
The legal system is confirmed as a significant determinant of trade credit for Croatian SMEs. As it was expected, the coefficient has a negative sign. This implies that improvements in the legal system result in the reduction of trade credit. The findings are in line with previous research by Demirgüç-Kunt and Maksimovic (2001), Hill et al. (2017) and Palacín-Sánchez et al. (2018).
The results obtained from the dynamic panel analysis confirm our hypothesis that firm-specific (internal) factors as well as institutional and macroeconomic (external) factors affect the use of trade credit as a financing source of SMEs.
5. CONCLUSION
The paper examines the determinants of trade credit as a financing source among SMEs in Croatia. This topic is of importance for SME performance, especially considering difficulties they face in obtaining financing through financial intermediaries. However, similar empirical analyses are relatively rarely performed in the context of South-East European countries that face different conditions and have different institutional characteristics than the usually investigated countries.

S. Pepur, D. Kovač, M. Ćurak: Factors Behind Trade Credit Financing of SMEs in CroatiaZbornik Veleučilišta u Rijeci, Vol. 8 (2020), No. 1, pp. 59-76
72
Thus, the aim of the paper was to reveal the influential factors – both firm-specific and country-specific, that affect the use of trade credit, and to detect whether they differ in comparison to the factors observed in developed countries. Additionally, we were also interested in analysing whether trade credit substitute or complement other financing sources. The research sample included 1,225 SMEs operating in the 2008-2017 period and a dynamic panel methodology was applied.
The impact of analysed explanatory variables is in line with theoretical expectations. The results confirm that more profitable SMEs and those that generate more internal finance demand less trade credit. This confirms the hierarchy of preferences in financing (“pecking order”) due to which costly trade credit financing is a less desirable source. Firms with larger inventories and growth opportunities use trade credit more to finance their investments in working capital. However, the coefficient for the latter, although positive, is not statistically significant. With regard to firm size, it can be concluded that larger and thus more creditworthy firms, that have better access to other financing sources, use less trade credit. Smaller firms, on the other hand, tend to rely more on trade credit due to their higher degree of information asymmetry and their inability to satisfy restrictive criteria requested from the financial institutions.
Distinguishing between short-term and long-term debt, the analysis aims at disclosing the relationship between trade credit and the availability of other financing sources. The negative coefficients with regard to short-term and long term-debt indicate a substitutive relation between trade credit and financing alternatives. The availability of short-term debt may reduce the need for trade credit, which is more costly and thus less preferable. This means that alternative external financing options affect the use of trade credit. The explanation is also valid for the long-term debt. However, this relationship is not statistically significant. Thus, this issue needs to be further examined.
As this substitution relation may be affected by the external conditions in the country, the analysis was extended to include country-level factors that control these external conditions and capture the changes in bank loans supply side. Among country-level factors, the efficiency of the banking sector, GDP growth, inflation and legal system determine the trade credit of Croatian SMEs. Higher efficiency of the banking system reduces the cost of borrowing from banks, resulting in a reduction of trade credit. Economic growth encourages firms to use trade credits. In a situation of a short-term monetary instability in comparison to the long-term one, the sources of financing are more available, implying an increase of trade credit financing. As suppliers are more able to cope with problems in repaying loans from their customers in comparison to banks in a situation of a less efficient legal system, the importance of trade credit increases.
It can be concluded that trade credit use among SMEs in Croatia is determined by both firm-specific and country-specific factors. The observed results are similar to those confirmed in other comparable studies conducted in other European countries. The research results should contribute to a better understanding of the relevance that trade credit use has as a financing tool, especially considering the obstacles SMEs face with regard to the availability of alternative financing sources evident in the specific Croatian environment.

S. Pepur, D. Kovač, M. Ćurak: Factors Behind Trade Credit Financing of SMEs in CroatiaZbornik Veleučilišta u Rijeci, Vol. 8 (2020), No. 1, pp. 59-76
73
For future research, it would be interesting to investigate more deeply the relationship between trade credit and alternative financing, especially long-term debt, as well as the rationale behind the decision to offer trade credit to customers. The research sample should be extended to include other South-East European countries in order to investigate and compare the influential trade credit factors in different institutional contexts. The effect of trade credit financing on the value of the company as well as on the probability of its survival could also be researched in the future.
REFERENCES
Agostino, M. and Trivieri, F. (2014) “Does trade credit play a signaling role? Some evidence from SMEs microdata”, Small Business Economics, 42(1), pp. 131–151. https://doi.org/10.1007/s11187-013-9478-8
Alpeza, M., Oberman, M. and Has, M. (2018) Small and Medium Enterprises Report −Croatia 2018, SMEs and Entrepreneurship Policy Center (CEPOR), http://www.cepor.hr/wp-content/uploads/2015/04/EN-SME-Report-2018-za-web.pdf [Accessed 8.12.2019.]
Andrieu, G., Staglianò, R. and van der Zwan, P. (2018) “Bank debt and trade credit for SMEs in Europe: firm, industry-, and country-level determinants”, Small Business Economics, 51(1), pp. 245–264. https://doi.org/10.1007/s11187-017-9926-y
Atanasova, C. (2007) “Access to institutional finance and the use of trade credit”, Financial management, 36(1), pp. 49-67. https://doi.org/10.1111/j.1755-053X.2007.tb00164.x
Baltagi, B.H. (2008) Econometric Analysis of Panel Data, 4th ed., Chester: John Wiley and Sons.
Bărbuţă-Mişu, N. (2018) “Analysis of factors influencing managerial decision to use trade credit in construction sector”, Economic research-Ekonomska istraživanja, 31(1), pp. 1903-1922. https://doi.org/10.1080/1331677X.2018.1504690
Beck, T., Demirguc-Kunt, A. and Maksimovic,V. (2008) “Financing patterns around the world: The role of institutions”, Journal of Financial Economics, 89(3), pp. 467-487. https://doi.org/10.1016/j.jfineco.2007.10.005
Biais, B. and Gollier, C. (1997) “Trade credit and credit rationing”, Review of Financial Studies, 10(4), pp. 903–957. https://doi.org/10.1093/rfs/10.4.903
Blundell, R. and Bond, S. (1998) “Initial conditions and moment restrictions in dynamic panel data models”, Journal of Econometrics, 87,(1), pp. 115-143. https://doi.org/10.1920/wp.ifs.1995.9517
Bussoli, C. (2017) “Trade Credit Financing: Substitution and Matching Effect for Italian SMEs”, European Journal of Economics, Finance, and Administrative Sciences, 93, http://www.europeanjournalofeconomics financeandadministrativesciences.com/issues/PDF/EJEFAS_93_10.pdf [Accessed 13.09.2019.]
Bussoli, C. and Marino, F. (2018) “Trade Credit in Times of Crisis: Evidence from European SMEs”, Journal of Small Business and Enterprise Development, 25(2), pp. 277-293, https://doi.org/10.1108/JSBED-08-2017-0249
Canto-Cuevas, F., Palacin-Sancez, M. and Di Pietro, F. (2019) “Trade Credit as a Sustainable Resource during an SME’s Life Cycle”, Sustainability, 11(3), pp. 670-685, https://doi.org/10.3390/su11030670
Carbó-Valverde, S., Rodríguez-Fernández, F. and Udell, G. F. (2016) “Trade credit, the financial crisis, and firm access to finance”, Journal of Money, Credit and Banking, 48(1), pp. 113–143. https://doi.org/10.1111/jmcb.1229
Casey, E. and O’Toole, C. M. (2014) “Bank lending constraints, trade credit and alternative financing during the financial crisis: evidence from European SMEs”, Journal of Corporate Finance, 27(C), pp. 173–193. https://doi.org/10.1016/j.jcorpfin.2014.05.001
Cuñat, V. (2007) „Trade Credit: Suppliers as Debt Collectors and Insurance Providers“, The Review of Financial Studies, 20(2), pp. 491-527, https:// doi:10.1093/rfs/hhl015
Deari, N. and Bărbuţă-Mişu, N. (2018) “The Determinants of Trade Credit for Firms Listed on the Zagreb Stock Exchange: An Empirical Analysis“. ICTERI Workshops, http://ceur-ws.org/Vol-2104/paper_207.pdf [Accessed 01.10.2019.]

S. Pepur, D. Kovač, M. Ćurak: Factors Behind Trade Credit Financing of SMEs in CroatiaZbornik Veleučilišta u Rijeci, Vol. 8 (2020), No. 1, pp. 59-76
74
Deloof, M. and La Rocca, M. (2015) “Local financial development and the trade credit policy of Italian SMEs “, Small Business Economics”, 44(4), pp. 905–924. https://doi.org/10.1007/s11187-014-9617-x
Deloof, M. and Jegers, M. (1996) “Trade Credit, Product Quality and Intragroup Trade: Some European Evidence”, Financial Management, 25 (3), pp. 33-43. https://doi.org/10.2307/3665806
Demirgüç-Kunt, A. and Maksimovic, V. (1998) “Law, Finance, and Firm Growth”, The Journal of Finance, 53(6), pp. 2107-2137. https://doi.org/10.1111/0022-1082.00084
Demirgüç-Kunt, A. and Maksimovic, V. (2001) “Firms as financial intermediaries: evidence from trade credit data”, World Bank Working Paper. https://doi.org/10.1596/1813-9450-2696
Elliehausen, G. E. and Wolken, J.D. (2003), The Demand for Trade Credit: An Investigation of Motives of Trade Credit Use by Small Businesses, Board of Governors of the Federal Reserve Study
Emery, G. (1984) “A pure financial explanation of trade credit”, Journal of Financial and Quantitative Analysis, 19, pp. 271-285. https://doi.org/10.2307/2331090
Emery, G. (1987) “An optimal financial response to variable demand”, Journal of Financial and Quantitative Analysis, 22, pp. 209-225. https://doi.org/10.2307/2330713
European Commission (2018) Annual report on European SMEs 2017/2018: SME Growing Beyond Borders, https://ec.europa.eu/growth/smes/business-friendly-environment/performance-review_en [Accessed 23.09.2019.]
Ferris, J. S. (1981) “A transaction theory of trade credit use”, Quarterly Journal of Economics, 96, pp. 243-270
Financijska agencija (2017). Analiza financijskih rezultata poslovanja poduzetnika Republike Hrvatske po županijama u 2017. godini, https://www.fina.hr/documents/52450/130232/Analiza+financijskih+rezultata+poslovanja+poduzetnika+po+zupanijama+u+2017.+godini.pdf/14052190-596f-1937-203a-9b1806c4aa05?t=1573203186429 [Accessed 10.12.2019.]
Fisman, R. and Love, I. (2003) “Trade credit, financial intermediary development and industry growth”, Journal of Finance, 58(1), pp. 353–374. https://doi.org/10.1111/1540-6261.00527
García-Teruel, PJ. and Martínez-Solano, P. (2010) “Determinants of trade credit: A comparative study of European SMEs”, International Small Business Journal, 28(3), pp. 215-233. https://doi.org/10.1177/0266242609360603
García-Teruel, P. J. and Martínez-Solano, P. (2010) “A dynamic perspective on the determinants of accounts payable”, Review of Quantitative Finance and Accounting, 34(4), pp. 439-457. https://doi.org/10.1007/s11156-009-0124-0
Harc, M., Basarac Sertić, M., Andabaka, A. (2017) “Financial Resource Availability and Financing Needs of SMEs in EU28 and Croatia“ In: Tipurić, D., Galetić, F. (ed.), The Paradoxes of Leadership and Governance in the Postmodern Society, Zagreb: CIRU - Governance Research and Development Centre
Hill, M. D. et al. (2017) “Trade Credit or Financial Credit? An International Study of the Choice and Its Influences”, Emerging Markets Finance and Trade, 53(10), pp. 2318-2332. https://doi.org/10.1080/1540496X.2017.1319355
Hill, M. et al. (2019), «International evidence on the determinants of trade credit provision», Managerial Finance, 45(4), pp. 484-498. https://doi.org/10.1108/MF-07-2018-0295
Hsiao, C. (1985) “Benefits and limitations of panel data”, Econometric Reviews, 4(1), pp. 121-174. https://doi.org/10.1080/07474938508800078
Hsiao, C. (2005) “Why panel data?”, The Singapore Economic Review, 50(2), pp. 143-154. http://dx.doi.org/10.2139/ssrn.820204
Huyghebaert, N., Van de Gucht, L. M. and Van Hulle, C. (2001), “The Demand for Debt Finance by Entrepreneurial Firms”, K.U. Lueven Department of Applied Economics, Working Paper No. 0110
Kling, G., Paul, S., and Gonis, E. (2014) “Cash holding, trade credit and access to short-term bank finance”, International Review of Financial Analysis, 32, pp. 123–131. https://doi.org/10.1016/j.irfa.2014.01.013
Lee, Y. W., Stowe, J. D. (1993) “Product Risk, Asymmetric Information, and Trade Credit”, Journal of Financial and Quantitative Analysis, 28, pp. 285-300. https://doi.org/10.2307/2331291
Leitner, S. M., Stehrer, R. (2015), “What Determines SMEs’ Funding Obstacles to Bank Loans and Trade Credits”, The Vienna Institute for International Economic Studies, Working Paper, No. 114.

S. Pepur, D. Kovač, M. Ćurak: Factors Behind Trade Credit Financing of SMEs in CroatiaZbornik Veleučilišta u Rijeci, Vol. 8 (2020), No. 1, pp. 59-76
75
Mateut, S., Mizen, P., Ziane, Y. (2015) „Inventory composition and trade credit“, International Review of Financial Analysis, 42, pp. 434-446. https://doi.org/10.1016/j.irfa.2015.09.008
Myers, S. C., Myluf, N.S. (1984) „Corporate financing and investment decisions when firms have information investors do not have“, Journal of Financial Economics, 13, pp. 575-592. https://doi.org/10.1016/0304-405X(84)90023-0
Myers, S. C. (1984). „The capital structure puzzle“, Journal of Finance, 39, pp. 575-592. https://doi.org/10.1111/j.1540-6261.1984.tb03646.x
Martinez-Sola, C., Garcia-Teruel, P. J., Martinez-Solano, P. (2014) “Trade Credit and SME profitability”, Small Business Economics, 42 (3), pp. 561-577. https://doi.org/10.1007/s11187-013-9491-y
Martinez-Sola, C., Garcia-Teruel, P.J. and Martinez-Solano, P. (2017) “SMEs Access to finance and the value of supplier financing”, Spanish Journal of Finance and Accounting, 46(4), pp. 455-483. https://doi.org/10.1080/02102412.2017.1345196
Mättö, M., Niskanen, M. (2019) “Religion, national culture and cross-country differences in the use of trade credit”, International Journal of Managerial Finance, 15 ( 3), pp. 350-370. https://doi.org/10.1108/IJMF-06-2018-0172
McGuinness, G., Hogan, T. (2014) “Bank credit and trade credit: evidence from SMEs over the financial crisis”, International Small Business Journal, 34(4), pp. 1-34. https://doi.org/10.1177/0266242614558314
McGuinness, G., Hogan, T., Powell, R. (2018) “European trade credit use and SME survival”, Journal of Corporate Finance, 49(C), pp. 81-103. https://doi.org/10.1016/j.jcorpfin.2017.12.005
Meltzer, A. H. (1960) “Mercantile credit, monetary policy, and size of firms”, Review of Economics and Statistics, 42, pp. 429–443. https://doi.org/10.2307/1925692
Nilsen, J. (2002) “Trade credit and the bank lending channel”, Journal of Money, Credit and Banking, 34(1), pp. 227–253. http://dx.doi.org/10.2139/ssrn.762468
Niskanen, J., Niskanen, M. (2006) “The determinants of corporate trade credit policies in bank-dominated financial environment: the case of Finnish small firms”, European Financial Management, 12(1), pp. 81-102. https://doi.org/10.1111/j.1354-7798.2006.00311.x
Pagano, M. (1993) “Financial markets and growth – An overview”, European Economic Review, 37(2-3), pp. 613-622. https://doi.org/10.1016/0014-2921(93)90051-B
Palacín-Sánchez, M. J., Canto-Cuevas, F. J., di-Pietro, F. (2018) “Trade credit versus bank credit: a simultaneous analysis in European SMEs”, Small Business Economics, pp. 1-18. https://doi.org/10.1007/s11187-018-0101-x
Petersen, M.A., Rajan, R. G. (1997) „Trade credit: theories and evidence“, The Review of Financial Studies, 10(3), pp. 661-691, https://doi.org/10.1093/rfs/10.3.661.
Psillaki, M., Eleftheriou, K. (2015) “Trade credit, bank credit, and flight to quality: evidence from French SMEs”, Journal of Small Business Management, 53(4), pp. 1219–1240. https://doi.org/10.1111/jsbm.12106
Roodman, D. (2009) “A note on the theme of too many instruments”, Oxford Bulletin of Economics and statistics, 71(1), pp. 135-158. https://doi.org/10.1111/j.1468-0084.2008.00542.x
Taketa, K., Udell, G. F. (2007) “Lending channels and financial shocks: the case of small and medium-sized enterprise trade credit and the Japanese banking crisis”, Monetary and Economic Studies, Bank of Japan.
Vidučić, Lj., Pepur, S., Šimić Šarić, M., (2018) Financijski menadžment, Zagreb:RRIF
Wilson, N., Summers, B. (2002) “Trade Credit Terms Offered by Small Firms: Survey Evidence and Empirical Analysis”, Journal of Business Finance & Accounting, 29(3), pp. 317–351. https://doi.org/10.1111/1468-5957.00434
Yazdanfar, D., Öhman, P. (2016) “The Impact of Trade Credit Use on Firm Profitability: Empirical Evidence From Sweden”, Journal of Advances in Management Research, 13(2), pp. 116-129. https://doi.org/10.1108/JAMR-09-2015-0067
Yazdanfar, D., Öhman, P. (2017) “Substitute or Complement? The Use of Trade Credit as a Financing Source among SMEs”, Management Research Review, 40(1), pp. 10-27. https://doi.org/10.1108/MRR-06-2015-0153

S. Pepur, D. Kovač, M. Ćurak: Factors Behind Trade Credit Financing of SMEs in CroatiaZbornik Veleučilišta u Rijeci, Vol. 8 (2020), No. 1, pp. 59-76
76
Izvorni znanstveni rad https://doi.org/10.31784/zvr.8.1.11 Datum primitka rada: 25. 10. 2019. Datum prihvaćanja rada: 16. 12. 2019.
ČIMBENICI KORIŠTENJA TRGOVAČKOG KREDITA U SME U HRVATSKOJ
Sandra Pepur Dr. sc., docent, Sveučilište u Splitu, Ekonomski fakultet, Cvite Fiskovića 5, 21 000 Split, Hrvatska;
e-mail: [email protected]
Dujam Kovač Dr. sc., asistent, Sveučilište u Splitu, Ekonomski fakultet, Cvite Fiskovića 5, 21 000 Split, Hrvatska;
e-mail: [email protected]
Marijana Ćurak Dr. sc., redoviti profesor, Sveučilište u Splitu, Ekonomski fakultet, Cvite Fiskovića 5, 21 000 Split, Hrvatska;
e-mail: [email protected]
SAŽETAKMala i srednja poduzeća (SME) doprinose nacionalnom gospodarstvu u smislu zaposlenosti, dodane vrijednosti, znanja i inovacija. Međutim, poteškoće u pristupu vanjskim financijama pod prihvatljivim uvjetima, odgovarajućim rokovima i dovoljnim iznosima utječu na njihove potencijale, a u slučaju ekonomskih nestabilnosti čak i na njihov opstanak. U situaciji informacijske asimetrije, uslijed koje su SME-i osjetljiviji na tržišne nesavršenosti, trgovački kredit može biti vrijedan izvor financiranja. U Europskoj uniji trgovački kredit je jedan on najznačajnijih vanjskih izvora financiranja i jedan je od najvažnijih alternativa financiranju putem financijskih posrednika. Međutim, među zemljama postoje značajne razlike u dostupnosti i korištenju trgovačkog kredita. Stoga ovo istraživanje ispituje čimbenike (specifične za poduzeća i specifične za zemlju) koji utječu na korištenje trgovačkog kredita kao izvora financiranja u Hrvatskoj. Empirijska analiza temelji se na podacima za 1225 malih i srednjih poduzeća koja su poslovala u Hrvatskoj u razdoblju od 2008. do 2017. te na korištenju panel metodologije. Rezultati potvrđuju da obilježja poduzeća, kao i značajke financijskog, makroekonomskog i institucionalnog okruženja u kojemu tvrtke djeluju, utječu na korištenje trgovačkog kredita kao izvora financiranja SME-a u Hrvatskoj. Rad doprinosi relativno oskudnom broju empirijskih potvrda odrednica trgovačkog kredita od strane SME-a u zemljama Srednjoistočne Europe.
Ključne riječi: financiranje od dobavljača, poduzeća u Hrvatskoj, panel metodologija
Creative Commons Attribution – NonCommercial 4.0 International License
J. Mušanović: Modeliranje utjecaja ugleda turističke destinacije prisutnog u društvenim medijima na...Zbornik Veleučilišta u Rijeci, Vol. 8 (2020), No. 1, pp. 77-101
77
Izvorni znanstveni rad https://doi.org/10.31784/zvr.8.1.12 Datum primitka rada: 30. 11 2019. Datum prihvaćanja rada: 21. 1. 2020.
MODELIRANJE UTJECAJA UGLEDA TURISTIČKE DESTINACIJE PRISUTNOG U DRUŠTVENIM MEDIJIMA
NA ZADOVOLJSTVO TURISTAJelena Mušanović
Dr. sc., poslijedoktorandica, Fakultet za menadžment u turizmu i ugostiteljstvu, Sveučilište u Rijeci, Primorska 42, 51410 Opatija, Hrvatska. e-mail: [email protected]
SAŽETAKPrije pojave korisnički generiranih sadržaja dijeljenje osobnog iskustva i doživljaja turističke ponude u destinaciji bilo je ograničeno na uži krug prijatelja i obitelji. Danas, turisti (korisnici društvenih medija) razmjenjuju mišljenja putem suvremenih medija na mreži na način da oblikuju ugled turističke destinacije i utječu na odluku o putovanju potencijalnih turista. Svrha ovog istraživanja je ispitati ugled turističke destinacije prisutan u društvenim medijima i njegov utjecaj na zadovoljstvo turista. Empirijsko istraživanje provedeno je na zapadnoj obali Istre (Hrvatska) primjenom upitnika na uzorku od 305 turista koji su se prije putovanja na društvenim medijima informirali o destinaciji. Primjenom metode parcijalnih najmanjih kvadrata modeliranja strukturnim jednadžbama (PLS-SEM) izvršena je analiza procjene strukturnog modela i utjecaja ugleda turističke destinacije prisutnog u društvenim medijima na zadovoljstvo turista. Testirani strukturni model ocjenjuje se važnim i pouzdanim instrumentom za mjerenje utjecaja ugleda turističke destinacije prisutnog u društvenim medijima na zadovoljstvo turista te pruža osnovu za buduća istraživanja i za kontinuirano praćenje poboljšanja ugleda turističke destinacije na društvenim medijima i zadovoljstva turista elementima turističke ponude.
Ključne riječi: ugled turističke destinacije, zadovoljstvo turista, društveni mediji, modeliranje, multivarijatna statistička analiza
1. UVOD
Turistička destinacija predstavlja mjesto susreta turističke ponude i potražnje te njezin uspjeh između ostaloga ovisi i o njezinom ugledu. Potencijalni turisti koji nemaju prethodnog iskustva s destinacijom u koju putu, svojom percepcijom ugleda turističke destinacije nastoje smanjiti rizik od krivog odabira turističke destinacije (Spence, 1973). Pozitivan ugled, s gledišta ponude, povećava zadovoljstvo turista (Su et al., 2018), utječe na konkurentsku prednost destinacije te
Creative Commons Attribution – NonCommercial 4.0 International License

J. Mušanović: Modeliranje utjecaja ugleda turističke destinacije prisutnog u društvenim medijima na...Zbornik Veleučilišta u Rijeci, Vol. 8 (2020), No. 1, pp. 77-101
78
pomaže u pridobivanju potencijalnih turista, investitora, kvalificirane radne snage (Darwish, Burns, 2019), povećava profit porastom prihoda od prodaje, povećava cijene usluga, smanjuje operativne troškove (Darwish, Burns, 2019) te utječe na percipiranu vrijednost i lojalnost turista (Vengesayi, 2003; Morgan et al., 2011; Minghetti, Celotto, 2015).
Od samih početaka, od kada ljudi putuju, sektor turizma prilagođavao se tehnološkom razvoju i izazovu. U eri digitalizacije se te promjene događaju rapidno. Prema UNWTO (2019), godišnje putuje oko 1,4 milijardi ljudi na svijetu što ukazuje na podatak da međunarodni turizam nastavlja nadmašivati globalnu ekonomiju, ali isto tako pokazuje kako mala promjena u sektoru ima veliki utjecaj na cijelo društvo (Urška Starc et al., 2019).
Prije pojave korisnički generiranih sadržaja dijeljenje osobnog iskustva i doživljaja turističke ponude u destinaciji bilo je ograničeno na uži krug prijatelja i obitelji. Rast Web 2.0 tehnologija i društvenih medija omogućio je razvoj korisnički generiranih sadržaja (engl. user-generated content – UGC) te objavu komentara, recenzija i mišljenja na mrežnim sjedištima kao što su Tripadvisor, Facebook, Youtube, Instragram i Twitter. S obzirom na to da se turističke usluge u destinaciji ne mogu unaprijed konzumirati, važno je naglasiti da gosti imaju povjerenja u recenzije objavljene na društvenim medijima (Ip et al., 2010; Filieri, 2015; Gretze, Yoo, 2008).
Prema podacima We Are Social, u 2019. godini oko 45 % ljudi svjetske populacije su aktivni korisnici društvenih medija. Prema podacima Digital Report-a (Kemp, 2019), procjenjuje se da je broj aktivnih korisnika Facebooka dosegao 2,1 milijardi ljudi diljem svijeta. Prema istraživanju TOMAS ljeto – Stavovi i potrošnja turista u Hrvatskoj za 2017. godinu, internetom se kao izvorom informacija koristilo gotovo 44 % ispitanika, a gosti su najčešće prikupljali informacije putem interneta (44 %); slijede mediji (25 %), preporuke rodbine i prijatelja (24 %) te prijašnji boravak (18 %). Promatrajući internet kao izvor informacija, 67 % ispitanika pretraživalo je informacije na društvenim medijima, 50 % na online turističkim agencijama, 45 % na stranicama hrvatskih turističkih zajednica/ureda te 44,4 % na stranicama smještajnih objekata (Institut za turizam, 2018).
U literaturi se navodi da je zadovoljstvo turista pokazatelj namjere povratka u destinaciju (Chen, Tsai, 2007; Triantafillidou, Petala, 2016). Također, zadovoljstvo turista pozitivno utječe na destinaciju na način da joj pomaže u ostvarivanju ekonomskih ciljeva poput povećanja ukupnog broja turista, prihoda i konkurentnosti turističke destinacije, što pogoduje destinaciji i nositeljima turističke ponude da budu održivi i profitabilniji (Akama, Kieti, 2003; Hapenciuc, Condratov, 2007; Wu, Ko, 2013; Saayman et al., 2018).
Slijedom navedenoga, postavlja se sljedeće istraživačko pitanje: utječe li ugled turističke destinacije prisutan u društvenim medijima, temeljen na korisnički generiranim sadržajima, na zadovoljstvo turista? Svrha ovog rada je: a) ispitati profil turista koji su se prije putovanja informirali o destinaciji u koju putuju na društvenim medijima; b) ispitati ugled turističke destinacije na društvenim medijima; c) ispitati zadovoljstvo turista elementima ponude turističke destinacije; d) ispitati valjanost i pouzdanost strukturnog modela; e) ispitati postojanost utjecaja ugleda turističke destinacije prisutnog u društvenim medijima na zadovoljstvo turista.

J. Mušanović: Modeliranje utjecaja ugleda turističke destinacije prisutnog u društvenim medijima na...Zbornik Veleučilišta u Rijeci, Vol. 8 (2020), No. 1, pp. 77-101
79
Rad je podijeljen u četiri cjeline. U uvodnom dijelu naglašava se problematika istraživanja. Nakon uvoda slijedi analiza prethodnih istraživanja vezanih uz ugled turističke destinacije na društvenim medijima i zadovoljstva turista te postavljanje hipoteza. Zatim se elaboriraju rezultati deskriptivne i multivarijatne statističke analize koja se temelji na analizi strukturnog modeliranja jednadžbama primjenom metode najmanjih kvadrata. Na kraju se rezimiraju rezultati i uspoređuju s prethodnim sličnim istraživanjima, navode ograničenja u istraživanju te daje doprinos istraživanja.
2. KORISNIČKI GENERIRANI SADRŽAJI NA DRUŠTVENIM MEDIJIMA
Trend dijeljena iskustva, preporuke, mišljenja, fotografije i videozapise s drugim korisnicima društvenih medija na mrežnim stranicama započeo je razvojem elektroničkih aplikacija Web 2.0 i Travel 2.0. koje se omogućile kreiranje korisnički generiranog sadržaja (engl. user generated content – UGC). Potencijalni turisti, između ostaloga, koriste korisničke generirane sadržaje kako bi se informirali o kvaliteti proizvoda i usluga, smanjili rizika i povećali percepciju o sigurnosti u destinaciji, izbjegli mogući nesklad informacija i rizik krivog odabira turističke destinacije (Kim, Mattila, 2011). Iz teorije signala (Spence, 1973) proizašla je pretpostavka da neke vidljive osobine ljudi mogu poslužiti kao znak ili upozorenje o kvaliteti i neskladu informacija. Ako poruke na društvenim medijima odašilju znak o kvaliteti turističkih sadržaja te ako se većina drugih turista složi da je vrijedno posjetiti turističku destinaciju, informacija će se percipirati kao istinita (Marchiori, 2012). Potrebno je naglasiti da se sadržaji objavljeni na društvenim medijima smatraju vrlo pouzdanim izvorom informacija (Xiang, Gretzel, 2010). Svaki bi pojedinac svojim stavom prema komentarima na društvenim medijima, pa u konačnici i ugleda turističke destinacije, trebao moći prepoznati i protumačiti sadržaje komentara u smislu pozitivne ili negativne jednostranosti poruke te sveukupne dosljednosti mišljenja podijeljenih na društvenim medijima. Prema rezultatima istraživanja nekolicine autora, korisnički generirani sadržaji znatno utječu na proces donošenja odluka o putovanju i to u fazi prije, tijekom i nakon putovanja (De Souza, Costa Machado, 2017; Fotis et al., 2012; Kim, Mattila, 2011).
Korisnički generirani sadržaj se u ovom radu razmatra kroz poslanu poruku, odnosno snagu argumenta, jednostranost poruke i dosljednost poruke. Snaga argumenta odnosi se na kvalitetu primljenih informacija, odnosno to je mjera u kojoj primatelj poruke prihvaća argument kao uvjerljiv ili valjan u podržavanju njegova mišljenja (Cheung et al., 2009). Jednostranost poruke sačinjavaju pozitivni ili negativni čimbenici ponude turističke destinacije, a ne oboje (Hastak, Park, 1990). Međutim, primanje informacije o pozitivnim i negativnim značajkama upotpunjuje informaciju i smatraju se vjerodostojnijima (Kamins, Marks, 1988). Naposljetku, dosljednost poruke ogleda se u kojoj mjeri je elektronička preporuka (eWoM) u skladu s iskustvima drugih turista koji ocjenjuju isti turistički proizvod ili uslugu.
3. UGLED TURISTIČKE DESTINACIJE NA DRUŠTVENIM MEDIJIMA
Pojam ugled je teško definirati zbog raznih pristupa, perspektiva i disciplina, a posebice ako se primjenjuje na mrežnim sjedištima ili ako se u obzir uzme da svaki promatrač različito percipira ugled. U vidu ovog istraživanja ugled se promatra sa online aspekta. Einwiller (2003) ugled na

J. Mušanović: Modeliranje utjecaja ugleda turističke destinacije prisutnog u društvenim medijima na...Zbornik Veleučilišta u Rijeci, Vol. 8 (2020), No. 1, pp. 77-101
80
mreži definira kao komunikacijske i interaktivne postupke koji služe za dijeljenje informacija koje razmjenjuju korisnici društvenim medijima. Marchiori et al. (2011) definiraju ugled na mreži kao mišljenja interesno-utjecajnih skupina izražena korisnički generiranim sadržajima.
Ugled nastaje kao posljedica verbalizacije imidža i predstavlja neopipljivu vrijednost destinacije i nositelja turističke ponude. Shvaćanje značenja ugleda turističke destinacije kao neopipljive vrijednosti postalo je tema znanstvenih istraživanja (Díaz, Rodríguez, 2017; Marchiori et al., 2013; Marinao Artigas, 2017; Su et al., 2018) otkada je ustanovljeno da je pozitivni ugled neopipljivo dobro turističke destinacije koje može utjecati na imidž destinacije (LeBlanc, Nguyen, 1996; Marinao et al., 2012), percepciju vrijednosti i lojalnosti turista prema destinaciji (Christou, 2007), zadovoljstvo (Loureiro, Kastenholz, 2011) te je, naposljetku, jamstvo održivog razvoja (Mingchuan, 2015).
Različiti su pristupi analizi ugleda turističke destinacije. Autori Marchiori et al. (2010) razvili su valjan model za razumijevanje ugleda turističke destinacije na mreži. Tri godine kasnije, Marchiori et al. (2013) dolaze do spoznaje da postoji statistička značajna povezanost između konstrukata (stav prema ugledu na društvenim medijima, snaga argumenta, jednostranost poruke, dosljednost poruke, stav povjerenja u društvene medije, percipirani ugled na društvenim medijima), dok je najslabija povezanost dokazana između percepcije prevladavajućih mišljenja i povjerenja u konverzacije na mreži. Autori Marinao Artigas et al. (2015) koristili su strukturno modeliranje jednadžbama (SEM) u svrhu mjerenja medijacijske uloge prisnosti između kognitivne percepcije i afektivne procjene ugleda. Autori Micera i Crispino (2017) su kvantitativno-kvalitativnim metodama istraživanje spoznali da su najčešće raspravljane teme na društvenim medijima bile umjetnost, kultura i događaj, catering i kupovina, usluge, prijevoz i promet, dok su sigurnost i urbana kvaliteta najmanje diskutirane teme na društvenim medijima. Autori Inversini i Cantoni (2011) istraživali su turističku destinaciju na mreži i opisali tržište na Google i Yahoo! tražilicama u svrhu dobivanja spoznaja o razumijevanju uloge korisnički generiranih sadržaja pri stvaranju ugleda turističke destinacije na mreži. Autori su zaključili da turističke destinacije trebaju u potpunosti upravljati ugledom na mreži tako da prate rasprave i koriste se njima u marketinške i druge svrhe. Naposljetku, Su et al. (2018) su primjenom strukturnog modeliranja direktan potvrdili direktan utjecaj ugleda turističke destinacije na zadovoljstvo turista.
Na temelju prikaza istraživanja može se zaključiti da se proučavanjem ugleda turističke destinacije na mreži i njezinih čimbenika bavili nedovoljno istraživača te da postoji mnogo prostora za modifikaciju modela ugleda destinacije, njezinih čimbenika i prethodnica.
4. ZADOVOLJSTVO TURISTA
Od 1960-ih godina prošloga stoljeća, znanstvenici su proveli mnoga istraživanja na temu zadovoljstva turista, i to iz perspektive menadžmenta kvalitete i namjere ponovne kupnje (Chen et al., 2013). Pizam et al. (1978) primijenili su koncept zadovoljstva klijenta u istraživanju turizma, što je dovelo do iznimne popularnosti teme u znanstvenim istraživanjima turizma, jer zadovoljstvo predstavlja snažan pokazatelj namjere ponovnog odlaska u destinaciju i spremnost da se destinacija preporuči drugima.
J. Mušanović: Modeliranje utjecaja ugleda turističke destinacije prisutnog u društvenim medijima na...Zbornik Veleučilišta u Rijeci, Vol. 8 (2020), No. 1, pp. 77-101
81
Mnogo se pozornost pridavalo istraživanju zadovoljstvu turista u uslužnim djelatnostima kao jednom od glavnih ciljeva poslovanja koji utječe na: odabir destinacije, potrošnju turističkih proizvoda i usluga, na odluku o ponovnoj posjeti destinaciji, ali i na uspješnost poslovanja na konkurentnom tržištu (Kozak, Rimmington, 2000). Istraživanja zadovoljstva turista usredotočena su na različite proizvode i usluge, kao što su usluge smještaja (Ammissah, 2013; Udit, Kalyan, 2017), restorana (Chadee, Mattsson, 1996), turističkih atrakcija (Agyeiwaah et al., 2016; Jensen et al., 2017), turističkih tura (Lee, 2015), ali i na zadovoljstvo turističkom destinacijom (Alegre, Cladera, 2006; Kozak, 2001; Yu, Goulden, 2006; Puh, 2014; Soldić Frleta, Smolčić Jurdana, 2018).
Koncept zadovoljstvo turista određuju prethodnice i posljedice zadovoljstva turista. U prethodnice zadovoljstva turista ubrajaju se najčešće kvaliteta usluge, očekivana i percipirana vrijednost, imidž i ugled (Yap et al., 2018; Jiang et al., 2018; Su et al., 2018; Wang et al., 2009). Posljedice zadovoljstva turista rezultat su zadovoljstva turista, a sagledavaju se kao namjere u ponašanju turista, što najčešće uključuje lojalnost i pritužbe (Yap et al., 2018; Saayman et al., 2018).
Zadovoljstvo turista mjeri se pomoću dimenzija. Autori Kozak i Rimmington (2000) ispitivali su zadovoljstvo turista te su izlučene četiri dimenzije koje opisuju zadovoljstvo turista: privlačnost destinacije, turističke znamenitosti i sadržaji, poznavanje (korištenje) engleskog jezika, sadržaji i usluge u zračnoj luci. Golob et al. (2014) istraživali su kvalitetu i razinu zadovoljstva turističkom ponudom grada Umaga na uzorku od 200 ispitanika. Izlučene dimenzije su: prostor, klima, okoliš, stanovništvo i zaposleni, organiziranost destinacije, sadržaji usko su povezane s destinacijom, a ispitani turisti pokazali su visoku razinu zadovoljstva klimom i vremenskim prilikama, ponudom smještaja, gostoljubivošću stanovništva i ljubaznošću zaposlenika. Autori Soldić Frleta i Smolčić Jurdana (2018) istraživali su razlike u razini zadovoljstva turista različitim elementima urbanih turističkih destinacija i čimbenike koji određuju zadovoljstvo turista u glavnoj sezoni i izvan sezone. Metodom analize glavnih komponenata izlučeni su sljedeći faktori: prijevoz i informacije, sadržaji i vrijednost za novac, okruženje, kvaliteta, sigurnost i gostoljubivost. Analizom sadržaja dimenzija može se zaključiti kako su dimenzije dostupnost destinacije, atrakcije, aktivnosti, cijena, smještaj, sigurnost, okoliš znamenitosti, sadržaji u destinaciji, dostupnost i cijena najčešće upotrebljavane dimenzije u mjerenju i opisivanju zadovoljstva turista turističkom destinacijom.
Nadalje, Gnoth (1997) je u istraživanju zadovoljstva turista istaknuo da turisti mogu negativno procijeniti svoj boravak u destinaciji ako postoji razlika između oglašavanja godišnjeg odmora i stvarnog iskustva i doživljaja. Kako bi se postigao pozitivan ugled na mreži, turističke destinacije i nositelji turističke ponude moraju pružiti ono što je obećano jer je svaki pojedinac potencijalno slobodan izraziti svoje mišljenje objavom komentara na društvenim ili drugim medijima te se tako stvara pozitivni ili negativni ugled turističke destinacije na društvenim medijima. Među ostalim, pozitivni ugled najvažniji je resurs u razvijanju neopipljivih vrijednosti turističke destinacije i predstavlja presudan čimbenik uspjeha turističke destinacije, što rezultira zadovoljstvom turista (Su et al., 2018) i konkurentskom prednošću turističke destinacije (Dolphin, 2004; Pruzan, 2001).
Slijedom navedenoga postavljene su tri istraživačke hipoteze:
H1: Postoji statistički značajan utjecaj sadržaja poruka na ugled turističke destinacije prisutnih u društvenim medijima.

J. Mušanović: Modeliranje utjecaja ugleda turističke destinacije prisutnog u društvenim medijima na...Zbornik Veleučilišta u Rijeci, Vol. 8 (2020), No. 1, pp. 77-101
82
H2: Postoji statistički značajan utjecaj stava prema komentarima na ugled turističke destinacije prisutnih u društvenim medijima.
H3: Postoji statistički značajan utjecaj ugleda turističke destinacije prisutnog u društvenim medijima na zadovoljstva turista.
U nastavku ovog rada detaljno se opisuje metodologija empirijskog istraživanja koja obuhvaća operacionalizaciju upitnika i mjernih konstrukata strukturnog modela te se iznose rezultati istraživanja.
5. METODOLOGIJA EMPIRIJSKOG ISTRAŽIVANJA
5. 1 Instrument istraživanja i operacionalizacija konstrukata
Upitnik je definiran na temelju prethodno razvijenih i testiranih mjernih instrumenata i ljestvica kako bi zadovoljio potrebne metrijske karakteristike (valjanost, pouzdanost, objektivnost, osjetljivost, primjenjivost i sl.). Mjerne ljestvice originalno su razvijene na engleskome jeziku, što je zahtijevalo ponovnu provjeru njihove valjanosti na hrvatskome, njemačkome i talijanskome jeziku. Latentne varijable reflektivnog i formativnog su karaktera te su mjerene na Likertovoj ljestvici slaganja i zadovoljstva s pet ocjena.
Reflektivna latentna varijabla sadržaj poruka na društvenim medijima mjerena je pomoću osam čestica preuzetih od autora Marchiori et al. (2013). Latentna varijabla stav prema komentarima na društvenim medijima mjerena je sa šest čestica preuzetih od Marchiori et al. (2013). Ugled turističke destinacije na društvenim medijima središnja je i reflektivna latentna varijabla konceptualnog modela te se mjerila s pet čestica sadržanih u instrumentu istraživanja koju su razvili Marinao Artigas et al. (2015). Zadovoljstvo turista elementima turističke ponude formativna je latentna varijabla koja se temelji na istraživanju Instituta za turizam (2015) – Tomas ljeto 2014 – Stavovi i potrošnja turista u Hrvatskoj. Ljestvica je mjerena s 23 elementa turističke ponude.
5. 2 Odabir ciljne skupine
Skup jedinica populacije čine turisti koji su se prije putovanja na društvenim medijima informirali o turističkoj destinaciji (plavoj Istri). Ispitanici u uzorku izabrani su po načelu prigodnog uzorka te je prilikom ispitivanja postavljeno eliminacijsko pitanje „Jeste li se prije putovanja na društvenim medijima informirali o turističkoj destinaciji?“. Istraživanje je provedeno od početka srpnja do kraja rujna 2016. i 2017. godine kako bi se primarno ispitivalo za vrijeme glavne turističke sezone i prikupio što veći uzorak. Gruba procjena minimalne veličine uzorka treba biti deset puta veća od broja formativnih manifestnih varijabli latentnog konstrukta (Hair et al., 2014by Hair, Hult, Ringle, and Sarstedt, provides a concise yet very practical guide to understanding and using PLS structural equation modeling (PLS-SEM). Prema tome, minimalna veličina uzorka iznosi 230, a veličina prikupljenog uzorka 305.

J. Mušanović: Modeliranje utjecaja ugleda turističke destinacije prisutnog u društvenim medijima na...Zbornik Veleučilišta u Rijeci, Vol. 8 (2020), No. 1, pp. 77-101
83
5. 3 Metode statističke analize podataka
Kako bi se što kvalitetnije analizirali i interpretirali rezultati te testirale znanstvene hipoteze istraživanja primijenjene su univarijatna i multivarijatna statistička analiza. Metodom deskriptivne statističke analize sistematiziran je i opisan uzorak istraživanja te su izračunati osnovni parametri statističke analize. Modeliranjem strukturnim jednadžbama primjenom parcijalnih najmanjih kvadrata ispituje se strukturni odnos između latentnih i manifestnih varijabli. Složenost metode očituje se kroz objedinjavanje faktorske i regresijske analize i drugih statističkih metoda. Primjena PLS-SEM-a u analizi primarnih podataka ovog rada smatra se opravadnim iz sljedećih razloga: a) podržava ciljeve i problem istraživanja; b) testira novije teorije istraživanja (Henseler et al., 2009); c) daje stabilne izračune parametara kada se vanjski model sastoji od formativnih i reflektivnih manifestnih varijabli (Ringle et al., 2012); d) podržava mali uzorak prikupljenih podataka (Hair et al., 2017). Prema navodima autora, PLS-SEM je robustan model, jer tranformira podatke u skladu s neutralnim graničnim teoremom kada su narušene parametrijske pretpostavke normalno raspodjeljenih podataka i kada nije osigurana neovisnost opažanja (Hair et al., 2011; Ringle et al., 2009; Orehovački, 2013).
6. REZULTATI EMPIRIJSKOG ISTRAŽIVANJA
6. 1 Rezultati deskriptivne statističke analize
Analiza obilježja ispitanika prema rodu pokazuje da je u ukupnom uzorku bilo 57,4 % muškaraca i 42,6 % manje žena. Prosječna starosna dob ispitanika iznosi 40,6 godina (s = 11,6. Struktura ispitanika visoko je obrazovana, od čega 31,8 % ispitanika ima završen fakultet i 38,0 % višu školu. Uzorak obuhvaća 96,7 % stranih ispitanika (turista). Većina ispitanika dolazi iz Njemačke (37,4 %), Italije (22,3 %) i Austrije (13,1 %), koji su i tradicionalno najbrojniji gosti u Istarskoj županiji.
Pri planiranju putovanja, ukupno 72,8 % ispitanika redovito ili povremeno traži informacije o destinaciji na društvenim medijima i na mreži. Ukupno 49,8 % ispitanika čita recenzije drugih korisnika putem turističkih mrežnih portala, dok 46,2 % upotrebljava društvene medije kao izvor informacija. Ispitanici najpouzdanijim izvorom informacija smatraju one koje pružaju aktualne informacije (52,5 %) i one koji imaju potvrde drugih korisnika izraženih s brojem lajkova (42,6 %). Na pitanje mogu li sadržaji generirani od strane drugih turista (komentari, slike i video objave) utjecati na promjenu njihove odluke o odabiru destinacije, 46,6 % ispitanika je odgovorilo s da, dok je 41,6 % ispitanika odgovorilo s ne.
U Tablici 1 prikazani su osnovni parametri deskriptivne statističke analize latentnih i manifestnih varijabli. Sadržaj poruka na društvenim medijima ocijenjen je prosječnom ocjenom 3,41. Ispitanici se slažu da komentari uključuju prednosti i mane destinacije (
J. Mušanović: Modeliranje utjecaja ugleda turističke destinacije prisutnog u društvenim medijima na zadovoljstvo turista Zbornik Veleučilišta u Rijeci, Vol. 8 (2020), No.1, pp. 1-8
destinaciji (�̅�𝑥𝑥𝑥 = 3,10) i destinacija u usporedbi s drugim sličnim destinacijama ima bolji ugled na društvenim medijima (�̅�𝑥𝑥𝑥 = 3,29).
Prema rezultatima iz Tablice 2 može se zaključiti da je vrlo dobre rezultate za zapadni dio Istre dao pokazatelj zadovoljstva elementima turističke ponude (�̅�𝑥𝑥𝑥 = 3,80). Da su ispitanici vrlo zadovoljni, potvrdilo je 39,0 % ispitanika koji su označili da se u potpunosti slažu s navedenim tvrdnjama. Ispitanici su posebice zadovoljni ljepotom prirode i krajolika (�̅�𝑥𝑥𝑥 = 4,45), gostoljubivošću lokalnog stanovništva (�̅�𝑥𝑥𝑥 = 4,17) i čistoćom mora (�̅�𝑥𝑥𝑥 = 4,14), dok su manje zadovoljni kvalitetom lokalnog prijevoza (�̅�𝑥𝑥𝑥 = 3,27) te opremljenošću i uređenošću lokalnog prijevoza (�̅�𝑥𝑥𝑥 = 3,53). Zaključno, prosječne ocjene kreću se u rasponu od 3,14 do 3,80, što ukazuje na slaganje s postavljanim česticama ili tvrdnjama i da u prosjeku ne postoje značajnija odstupanja od prosječnih vrijednosti iz uzorka.
= 3,67) te da komentari naglašavaju pozitivne strane destinacije (
J. Mušanović: Modeliranje utjecaja ugleda turističke destinacije prisutnog u društvenim medijima na zadovoljstvo turista Zbornik Veleučilišta u Rijeci, Vol. 8 (2020), No.1, pp. 1-8
destinaciji (�̅�𝑥𝑥𝑥 = 3,10) i destinacija u usporedbi s drugim sličnim destinacijama ima bolji ugled na društvenim medijima (�̅�𝑥𝑥𝑥 = 3,29).
Prema rezultatima iz Tablice 2 može se zaključiti da je vrlo dobre rezultate za zapadni dio Istre dao pokazatelj zadovoljstva elementima turističke ponude (�̅�𝑥𝑥𝑥 = 3,80). Da su ispitanici vrlo zadovoljni, potvrdilo je 39,0 % ispitanika koji su označili da se u potpunosti slažu s navedenim tvrdnjama. Ispitanici su posebice zadovoljni ljepotom prirode i krajolika (�̅�𝑥𝑥𝑥 = 4,45), gostoljubivošću lokalnog stanovništva (�̅�𝑥𝑥𝑥 = 4,17) i čistoćom mora (�̅�𝑥𝑥𝑥 = 4,14), dok su manje zadovoljni kvalitetom lokalnog prijevoza (�̅�𝑥𝑥𝑥 = 3,27) te opremljenošću i uređenošću lokalnog prijevoza (�̅�𝑥𝑥𝑥 = 3,53). Zaključno, prosječne ocjene kreću se u rasponu od 3,14 do 3,80, što ukazuje na slaganje s postavljanim česticama ili tvrdnjama i da u prosjeku ne postoje značajnija odstupanja od prosječnih vrijednosti iz uzorka.
= 3,60), dok se najmanje slažu s izjavom da su autori komentara imali slična iskustva u destinaciji (
J. Mušanović: Modeliranje utjecaja ugleda turističke destinacije prisutnog u društvenim medijima na zadovoljstvo turista Zbornik Veleučilišta u Rijeci, Vol. 8 (2020), No.1, pp. 1-8
destinaciji (�̅�𝑥𝑥𝑥 = 3,10) i destinacija u usporedbi s drugim sličnim destinacijama ima bolji ugled na društvenim medijima (�̅�𝑥𝑥𝑥 = 3,29).
Prema rezultatima iz Tablice 2 može se zaključiti da je vrlo dobre rezultate za zapadni dio Istre dao pokazatelj zadovoljstva elementima turističke ponude (�̅�𝑥𝑥𝑥 = 3,80). Da su ispitanici vrlo zadovoljni, potvrdilo je 39,0 % ispitanika koji su označili da se u potpunosti slažu s navedenim tvrdnjama. Ispitanici su posebice zadovoljni ljepotom prirode i krajolika (�̅�𝑥𝑥𝑥 = 4,45), gostoljubivošću lokalnog stanovništva (�̅�𝑥𝑥𝑥 = 4,17) i čistoćom mora (�̅�𝑥𝑥𝑥 = 4,14), dok su manje zadovoljni kvalitetom lokalnog prijevoza (�̅�𝑥𝑥𝑥 = 3,27) te opremljenošću i uređenošću lokalnog prijevoza (�̅�𝑥𝑥𝑥 = 3,53). Zaključno, prosječne ocjene kreću se u rasponu od 3,14 do 3,80, što ukazuje na slaganje s postavljanim česticama ili tvrdnjama i da u prosjeku ne postoje značajnija odstupanja od prosječnih vrijednosti iz uzorka.
= 3,24) i da komentari imaju snažnu poruku (
J. Mušanović: Modeliranje utjecaja ugleda turističke destinacije prisutnog u društvenim medijima na zadovoljstvo turista Zbornik Veleučilišta u Rijeci, Vol. 8 (2020), No.1, pp. 1-8
destinaciji (�̅�𝑥𝑥𝑥 = 3,10) i destinacija u usporedbi s drugim sličnim destinacijama ima bolji ugled na društvenim medijima (�̅�𝑥𝑥𝑥 = 3,29).
Prema rezultatima iz Tablice 2 može se zaključiti da je vrlo dobre rezultate za zapadni dio Istre dao pokazatelj zadovoljstva elementima turističke ponude (�̅�𝑥𝑥𝑥 = 3,80). Da su ispitanici vrlo zadovoljni, potvrdilo je 39,0 % ispitanika koji su označili da se u potpunosti slažu s navedenim tvrdnjama. Ispitanici su posebice zadovoljni ljepotom prirode i krajolika (�̅�𝑥𝑥𝑥 = 4,45), gostoljubivošću lokalnog stanovništva (�̅�𝑥𝑥𝑥 = 4,17) i čistoćom mora (�̅�𝑥𝑥𝑥 = 4,14), dok su manje zadovoljni kvalitetom lokalnog prijevoza (�̅�𝑥𝑥𝑥 = 3,27) te opremljenošću i uređenošću lokalnog prijevoza (�̅�𝑥𝑥𝑥 = 3,53). Zaključno, prosječne ocjene kreću se u rasponu od 3,14 do 3,80, što ukazuje na slaganje s postavljanim česticama ili tvrdnjama i da u prosjeku ne postoje značajnija odstupanja od prosječnih vrijednosti iz uzorka.
= 3,25).
Ukupna ocjena stava prema komentarima na društvenim medijima ocijenjena je prosječnom ocjenom 3,48. Ispitanici su najviše okupirani pokušajem da doznaju jesu li drugi korisnici doživjeli iskustvo koje bi oni željeli doživjeti (
J. Mušanović: Modeliranje utjecaja ugleda turističke destinacije prisutnog u društvenim medijima na zadovoljstvo turista Zbornik Veleučilišta u Rijeci, Vol. 8 (2020), No.1, pp. 1-8
destinaciji (�̅�𝑥𝑥𝑥 = 3,10) i destinacija u usporedbi s drugim sličnim destinacijama ima bolji ugled na društvenim medijima (�̅�𝑥𝑥𝑥 = 3,29).
Prema rezultatima iz Tablice 2 može se zaključiti da je vrlo dobre rezultate za zapadni dio Istre dao pokazatelj zadovoljstva elementima turističke ponude (�̅�𝑥𝑥𝑥 = 3,80). Da su ispitanici vrlo zadovoljni, potvrdilo je 39,0 % ispitanika koji su označili da se u potpunosti slažu s navedenim tvrdnjama. Ispitanici su posebice zadovoljni ljepotom prirode i krajolika (�̅�𝑥𝑥𝑥 = 4,45), gostoljubivošću lokalnog stanovništva (�̅�𝑥𝑥𝑥 = 4,17) i čistoćom mora (�̅�𝑥𝑥𝑥 = 4,14), dok su manje zadovoljni kvalitetom lokalnog prijevoza (�̅�𝑥𝑥𝑥 = 3,27) te opremljenošću i uređenošću lokalnog prijevoza (�̅�𝑥𝑥𝑥 = 3,53). Zaključno, prosječne ocjene kreću se u rasponu od 3,14 do 3,80, što ukazuje na slaganje s postavljanim česticama ili tvrdnjama i da u prosjeku ne postoje značajnija odstupanja od prosječnih vrijednosti iz uzorka.
= 3,80). Najmanje pozornosti posvećuju prepoznavanju

J. Mušanović: Modeliranje utjecaja ugleda turističke destinacije prisutnog u društvenim medijima na...Zbornik Veleučilišta u Rijeci, Vol. 8 (2020), No. 1, pp. 77-101
84
komentara koji se razlikuju od većine objavljenih komentara o destinaciji (
J. Mušanović: Modeliranje utjecaja ugleda turističke destinacije prisutnog u društvenim medijima na zadovoljstvo turista Zbornik Veleučilišta u Rijeci, Vol. 8 (2020), No.1, pp. 1-8
destinaciji (�̅�𝑥𝑥𝑥 = 3,10) i destinacija u usporedbi s drugim sličnim destinacijama ima bolji ugled na društvenim medijima (�̅�𝑥𝑥𝑥 = 3,29).
Prema rezultatima iz Tablice 2 može se zaključiti da je vrlo dobre rezultate za zapadni dio Istre dao pokazatelj zadovoljstva elementima turističke ponude (�̅�𝑥𝑥𝑥 = 3,80). Da su ispitanici vrlo zadovoljni, potvrdilo je 39,0 % ispitanika koji su označili da se u potpunosti slažu s navedenim tvrdnjama. Ispitanici su posebice zadovoljni ljepotom prirode i krajolika (�̅�𝑥𝑥𝑥 = 4,45), gostoljubivošću lokalnog stanovništva (�̅�𝑥𝑥𝑥 = 4,17) i čistoćom mora (�̅�𝑥𝑥𝑥 = 4,14), dok su manje zadovoljni kvalitetom lokalnog prijevoza (�̅�𝑥𝑥𝑥 = 3,27) te opremljenošću i uređenošću lokalnog prijevoza (�̅�𝑥𝑥𝑥 = 3,53). Zaključno, prosječne ocjene kreću se u rasponu od 3,14 do 3,80, što ukazuje na slaganje s postavljanim česticama ili tvrdnjama i da u prosjeku ne postoje značajnija odstupanja od prosječnih vrijednosti iz uzorka.
= 3,31) te koji aspekti destinacije imaju lošiji ugled na društvenim medijima (
J. Mušanović: Modeliranje utjecaja ugleda turističke destinacije prisutnog u društvenim medijima na zadovoljstvo turista Zbornik Veleučilišta u Rijeci, Vol. 8 (2020), No.1, pp. 1-8
destinaciji (�̅�𝑥𝑥𝑥 = 3,10) i destinacija u usporedbi s drugim sličnim destinacijama ima bolji ugled na društvenim medijima (�̅�𝑥𝑥𝑥 = 3,29).
Prema rezultatima iz Tablice 2 može se zaključiti da je vrlo dobre rezultate za zapadni dio Istre dao pokazatelj zadovoljstva elementima turističke ponude (�̅�𝑥𝑥𝑥 = 3,80). Da su ispitanici vrlo zadovoljni, potvrdilo je 39,0 % ispitanika koji su označili da se u potpunosti slažu s navedenim tvrdnjama. Ispitanici su posebice zadovoljni ljepotom prirode i krajolika (�̅�𝑥𝑥𝑥 = 4,45), gostoljubivošću lokalnog stanovništva (�̅�𝑥𝑥𝑥 = 4,17) i čistoćom mora (�̅�𝑥𝑥𝑥 = 4,14), dok su manje zadovoljni kvalitetom lokalnog prijevoza (�̅�𝑥𝑥𝑥 = 3,27) te opremljenošću i uređenošću lokalnog prijevoza (�̅�𝑥𝑥𝑥 = 3,53). Zaključno, prosječne ocjene kreću se u rasponu od 3,14 do 3,80, što ukazuje na slaganje s postavljanim česticama ili tvrdnjama i da u prosjeku ne postoje značajnija odstupanja od prosječnih vrijednosti iz uzorka.
= 3,32).
Ugled turističke destinacije na društvenim medijima ocijenjen je prosječnom ocjenom 3,76. Ispitanici se najviše slažu s izjavom da korisnici na društvenim medijima pozitivno pričaju o destinaciji (
J. Mušanović: Modeliranje utjecaja ugleda turističke destinacije prisutnog u društvenim medijima na zadovoljstvo turista Zbornik Veleučilišta u Rijeci, Vol. 8 (2020), No.1, pp. 1-8
destinaciji (�̅�𝑥𝑥𝑥 = 3,10) i destinacija u usporedbi s drugim sličnim destinacijama ima bolji ugled na društvenim medijima (�̅�𝑥𝑥𝑥 = 3,29).
Prema rezultatima iz Tablice 2 može se zaključiti da je vrlo dobre rezultate za zapadni dio Istre dao pokazatelj zadovoljstva elementima turističke ponude (�̅�𝑥𝑥𝑥 = 3,80). Da su ispitanici vrlo zadovoljni, potvrdilo je 39,0 % ispitanika koji su označili da se u potpunosti slažu s navedenim tvrdnjama. Ispitanici su posebice zadovoljni ljepotom prirode i krajolika (�̅�𝑥𝑥𝑥 = 4,45), gostoljubivošću lokalnog stanovništva (�̅�𝑥𝑥𝑥 = 4,17) i čistoćom mora (�̅�𝑥𝑥𝑥 = 4,14), dok su manje zadovoljni kvalitetom lokalnog prijevoza (�̅�𝑥𝑥𝑥 = 3,27) te opremljenošću i uređenošću lokalnog prijevoza (�̅�𝑥𝑥𝑥 = 3,53). Zaključno, prosječne ocjene kreću se u rasponu od 3,14 do 3,80, što ukazuje na slaganje s postavljanim česticama ili tvrdnjama i da u prosjeku ne postoje značajnija odstupanja od prosječnih vrijednosti iz uzorka.
= 3,97) i da je destinacija visoko cijenjena (
J. Mušanović: Modeliranje utjecaja ugleda turističke destinacije prisutnog u društvenim medijima na zadovoljstvo turista Zbornik Veleučilišta u Rijeci, Vol. 8 (2020), No.1, pp. 1-8
destinaciji (�̅�𝑥𝑥𝑥 = 3,10) i destinacija u usporedbi s drugim sličnim destinacijama ima bolji ugled na društvenim medijima (�̅�𝑥𝑥𝑥 = 3,29).
Prema rezultatima iz Tablice 2 može se zaključiti da je vrlo dobre rezultate za zapadni dio Istre dao pokazatelj zadovoljstva elementima turističke ponude (�̅�𝑥𝑥𝑥 = 3,80). Da su ispitanici vrlo zadovoljni, potvrdilo je 39,0 % ispitanika koji su označili da se u potpunosti slažu s navedenim tvrdnjama. Ispitanici su posebice zadovoljni ljepotom prirode i krajolika (�̅�𝑥𝑥𝑥 = 4,45), gostoljubivošću lokalnog stanovništva (�̅�𝑥𝑥𝑥 = 4,17) i čistoćom mora (�̅�𝑥𝑥𝑥 = 4,14), dok su manje zadovoljni kvalitetom lokalnog prijevoza (�̅�𝑥𝑥𝑥 = 3,27) te opremljenošću i uređenošću lokalnog prijevoza (�̅�𝑥𝑥𝑥 = 3,53). Zaključno, prosječne ocjene kreću se u rasponu od 3,14 do 3,80, što ukazuje na slaganje s postavljanim česticama ili tvrdnjama i da u prosjeku ne postoje značajnija odstupanja od prosječnih vrijednosti iz uzorka.
= 3,92). Najnižom prosječnom ocjenom ocijenili su izjavu mislim da korisnici na društvenim medijima imaju zajednički stav o destinaciji (
J. Mušanović: Modeliranje utjecaja ugleda turističke destinacije prisutnog u društvenim medijima na zadovoljstvo turista Zbornik Veleučilišta u Rijeci, Vol. 8 (2020), No.1, pp. 1-8
destinaciji (�̅�𝑥𝑥𝑥 = 3,10) i destinacija u usporedbi s drugim sličnim destinacijama ima bolji ugled na društvenim medijima (�̅�𝑥𝑥𝑥 = 3,29).
Prema rezultatima iz Tablice 2 može se zaključiti da je vrlo dobre rezultate za zapadni dio Istre dao pokazatelj zadovoljstva elementima turističke ponude (�̅�𝑥𝑥𝑥 = 3,80). Da su ispitanici vrlo zadovoljni, potvrdilo je 39,0 % ispitanika koji su označili da se u potpunosti slažu s navedenim tvrdnjama. Ispitanici su posebice zadovoljni ljepotom prirode i krajolika (�̅�𝑥𝑥𝑥 = 4,45), gostoljubivošću lokalnog stanovništva (�̅�𝑥𝑥𝑥 = 4,17) i čistoćom mora (�̅�𝑥𝑥𝑥 = 4,14), dok su manje zadovoljni kvalitetom lokalnog prijevoza (�̅�𝑥𝑥𝑥 = 3,27) te opremljenošću i uređenošću lokalnog prijevoza (�̅�𝑥𝑥𝑥 = 3,53). Zaključno, prosječne ocjene kreću se u rasponu od 3,14 do 3,80, što ukazuje na slaganje s postavljanim česticama ili tvrdnjama i da u prosjeku ne postoje značajnija odstupanja od prosječnih vrijednosti iz uzorka.
= 3,10) i destinacija u usporedbi s drugim sličnim destinacijama ima bolji ugled na društvenim medijima (
J. Mušanović: Modeliranje utjecaja ugleda turističke destinacije prisutnog u društvenim medijima na zadovoljstvo turista Zbornik Veleučilišta u Rijeci, Vol. 8 (2020), No.1, pp. 1-8
destinaciji (�̅�𝑥𝑥𝑥 = 3,10) i destinacija u usporedbi s drugim sličnim destinacijama ima bolji ugled na društvenim medijima (�̅�𝑥𝑥𝑥 = 3,29).
Prema rezultatima iz Tablice 2 može se zaključiti da je vrlo dobre rezultate za zapadni dio Istre dao pokazatelj zadovoljstva elementima turističke ponude (�̅�𝑥𝑥𝑥 = 3,80). Da su ispitanici vrlo zadovoljni, potvrdilo je 39,0 % ispitanika koji su označili da se u potpunosti slažu s navedenim tvrdnjama. Ispitanici su posebice zadovoljni ljepotom prirode i krajolika (�̅�𝑥𝑥𝑥 = 4,45), gostoljubivošću lokalnog stanovništva (�̅�𝑥𝑥𝑥 = 4,17) i čistoćom mora (�̅�𝑥𝑥𝑥 = 4,14), dok su manje zadovoljni kvalitetom lokalnog prijevoza (�̅�𝑥𝑥𝑥 = 3,27) te opremljenošću i uređenošću lokalnog prijevoza (�̅�𝑥𝑥𝑥 = 3,53). Zaključno, prosječne ocjene kreću se u rasponu od 3,14 do 3,80, što ukazuje na slaganje s postavljanim česticama ili tvrdnjama i da u prosjeku ne postoje značajnija odstupanja od prosječnih vrijednosti iz uzorka.
= 3,29).
Prema rezultatima iz Tablice 2 može se zaključiti da je vrlo dobre rezultate za zapadni dio Istre dao pokazatelj zadovoljstva elementima turističke ponude (
J. Mušanović: Modeliranje utjecaja ugleda turističke destinacije prisutnog u društvenim medijima na zadovoljstvo turista Zbornik Veleučilišta u Rijeci, Vol. 8 (2020), No.1, pp. 1-8
destinaciji (�̅�𝑥𝑥𝑥 = 3,10) i destinacija u usporedbi s drugim sličnim destinacijama ima bolji ugled na društvenim medijima (�̅�𝑥𝑥𝑥 = 3,29).
Prema rezultatima iz Tablice 2 može se zaključiti da je vrlo dobre rezultate za zapadni dio Istre dao pokazatelj zadovoljstva elementima turističke ponude (�̅�𝑥𝑥𝑥 = 3,80). Da su ispitanici vrlo zadovoljni, potvrdilo je 39,0 % ispitanika koji su označili da se u potpunosti slažu s navedenim tvrdnjama. Ispitanici su posebice zadovoljni ljepotom prirode i krajolika (�̅�𝑥𝑥𝑥 = 4,45), gostoljubivošću lokalnog stanovništva (�̅�𝑥𝑥𝑥 = 4,17) i čistoćom mora (�̅�𝑥𝑥𝑥 = 4,14), dok su manje zadovoljni kvalitetom lokalnog prijevoza (�̅�𝑥𝑥𝑥 = 3,27) te opremljenošću i uređenošću lokalnog prijevoza (�̅�𝑥𝑥𝑥 = 3,53). Zaključno, prosječne ocjene kreću se u rasponu od 3,14 do 3,80, što ukazuje na slaganje s postavljanim česticama ili tvrdnjama i da u prosjeku ne postoje značajnija odstupanja od prosječnih vrijednosti iz uzorka.
= 3,80). Da su ispitanici vrlo zadovoljni, potvrdilo je 39,0 % ispitanika koji su označili da se u potpunosti slažu s navedenim tvrdnjama. Ispitanici su posebice zadovoljni ljepotom prirode i krajolika (
J. Mušanović: Modeliranje utjecaja ugleda turističke destinacije prisutnog u društvenim medijima na zadovoljstvo turista Zbornik Veleučilišta u Rijeci, Vol. 8 (2020), No.1, pp. 1-8
destinaciji (�̅�𝑥𝑥𝑥 = 3,10) i destinacija u usporedbi s drugim sličnim destinacijama ima bolji ugled na društvenim medijima (�̅�𝑥𝑥𝑥 = 3,29).
Prema rezultatima iz Tablice 2 može se zaključiti da je vrlo dobre rezultate za zapadni dio Istre dao pokazatelj zadovoljstva elementima turističke ponude (�̅�𝑥𝑥𝑥 = 3,80). Da su ispitanici vrlo zadovoljni, potvrdilo je 39,0 % ispitanika koji su označili da se u potpunosti slažu s navedenim tvrdnjama. Ispitanici su posebice zadovoljni ljepotom prirode i krajolika (�̅�𝑥𝑥𝑥 = 4,45), gostoljubivošću lokalnog stanovništva (�̅�𝑥𝑥𝑥 = 4,17) i čistoćom mora (�̅�𝑥𝑥𝑥 = 4,14), dok su manje zadovoljni kvalitetom lokalnog prijevoza (�̅�𝑥𝑥𝑥 = 3,27) te opremljenošću i uređenošću lokalnog prijevoza (�̅�𝑥𝑥𝑥 = 3,53). Zaključno, prosječne ocjene kreću se u rasponu od 3,14 do 3,80, što ukazuje na slaganje s postavljanim česticama ili tvrdnjama i da u prosjeku ne postoje značajnija odstupanja od prosječnih vrijednosti iz uzorka.
= 4,45), gostoljubivošću lokalnog stanovništva (
J. Mušanović: Modeliranje utjecaja ugleda turističke destinacije prisutnog u društvenim medijima na zadovoljstvo turista Zbornik Veleučilišta u Rijeci, Vol. 8 (2020), No.1, pp. 1-8
destinaciji (�̅�𝑥𝑥𝑥 = 3,10) i destinacija u usporedbi s drugim sličnim destinacijama ima bolji ugled na društvenim medijima (�̅�𝑥𝑥𝑥 = 3,29).
Prema rezultatima iz Tablice 2 može se zaključiti da je vrlo dobre rezultate za zapadni dio Istre dao pokazatelj zadovoljstva elementima turističke ponude (�̅�𝑥𝑥𝑥 = 3,80). Da su ispitanici vrlo zadovoljni, potvrdilo je 39,0 % ispitanika koji su označili da se u potpunosti slažu s navedenim tvrdnjama. Ispitanici su posebice zadovoljni ljepotom prirode i krajolika (�̅�𝑥𝑥𝑥 = 4,45), gostoljubivošću lokalnog stanovništva (�̅�𝑥𝑥𝑥 = 4,17) i čistoćom mora (�̅�𝑥𝑥𝑥 = 4,14), dok su manje zadovoljni kvalitetom lokalnog prijevoza (�̅�𝑥𝑥𝑥 = 3,27) te opremljenošću i uređenošću lokalnog prijevoza (�̅�𝑥𝑥𝑥 = 3,53). Zaključno, prosječne ocjene kreću se u rasponu od 3,14 do 3,80, što ukazuje na slaganje s postavljanim česticama ili tvrdnjama i da u prosjeku ne postoje značajnija odstupanja od prosječnih vrijednosti iz uzorka.
= 4,17) i čistoćom mora (
J. Mušanović: Modeliranje utjecaja ugleda turističke destinacije prisutnog u društvenim medijima na zadovoljstvo turista Zbornik Veleučilišta u Rijeci, Vol. 8 (2020), No.1, pp. 1-8
destinaciji (�̅�𝑥𝑥𝑥 = 3,10) i destinacija u usporedbi s drugim sličnim destinacijama ima bolji ugled na društvenim medijima (�̅�𝑥𝑥𝑥 = 3,29).
Prema rezultatima iz Tablice 2 može se zaključiti da je vrlo dobre rezultate za zapadni dio Istre dao pokazatelj zadovoljstva elementima turističke ponude (�̅�𝑥𝑥𝑥 = 3,80). Da su ispitanici vrlo zadovoljni, potvrdilo je 39,0 % ispitanika koji su označili da se u potpunosti slažu s navedenim tvrdnjama. Ispitanici su posebice zadovoljni ljepotom prirode i krajolika (�̅�𝑥𝑥𝑥 = 4,45), gostoljubivošću lokalnog stanovništva (�̅�𝑥𝑥𝑥 = 4,17) i čistoćom mora (�̅�𝑥𝑥𝑥 = 4,14), dok su manje zadovoljni kvalitetom lokalnog prijevoza (�̅�𝑥𝑥𝑥 = 3,27) te opremljenošću i uređenošću lokalnog prijevoza (�̅�𝑥𝑥𝑥 = 3,53). Zaključno, prosječne ocjene kreću se u rasponu od 3,14 do 3,80, što ukazuje na slaganje s postavljanim česticama ili tvrdnjama i da u prosjeku ne postoje značajnija odstupanja od prosječnih vrijednosti iz uzorka.
= 4,14), dok su manje zadovoljni kvalitetom lokalnog prijevoza (
J. Mušanović: Modeliranje utjecaja ugleda turističke destinacije prisutnog u društvenim medijima na zadovoljstvo turista Zbornik Veleučilišta u Rijeci, Vol. 8 (2020), No.1, pp. 1-8
destinaciji (�̅�𝑥𝑥𝑥 = 3,10) i destinacija u usporedbi s drugim sličnim destinacijama ima bolji ugled na društvenim medijima (�̅�𝑥𝑥𝑥 = 3,29).
Prema rezultatima iz Tablice 2 može se zaključiti da je vrlo dobre rezultate za zapadni dio Istre dao pokazatelj zadovoljstva elementima turističke ponude (�̅�𝑥𝑥𝑥 = 3,80). Da su ispitanici vrlo zadovoljni, potvrdilo je 39,0 % ispitanika koji su označili da se u potpunosti slažu s navedenim tvrdnjama. Ispitanici su posebice zadovoljni ljepotom prirode i krajolika (�̅�𝑥𝑥𝑥 = 4,45), gostoljubivošću lokalnog stanovništva (�̅�𝑥𝑥𝑥 = 4,17) i čistoćom mora (�̅�𝑥𝑥𝑥 = 4,14), dok su manje zadovoljni kvalitetom lokalnog prijevoza (�̅�𝑥𝑥𝑥 = 3,27) te opremljenošću i uređenošću lokalnog prijevoza (�̅�𝑥𝑥𝑥 = 3,53). Zaključno, prosječne ocjene kreću se u rasponu od 3,14 do 3,80, što ukazuje na slaganje s postavljanim česticama ili tvrdnjama i da u prosjeku ne postoje značajnija odstupanja od prosječnih vrijednosti iz uzorka.
= 3,27) te opremljenošću i uređenošću lokalnog prijevoza (
J. Mušanović: Modeliranje utjecaja ugleda turističke destinacije prisutnog u društvenim medijima na zadovoljstvo turista Zbornik Veleučilišta u Rijeci, Vol. 8 (2020), No.1, pp. 1-8
destinaciji (�̅�𝑥𝑥𝑥 = 3,10) i destinacija u usporedbi s drugim sličnim destinacijama ima bolji ugled na društvenim medijima (�̅�𝑥𝑥𝑥 = 3,29).
Prema rezultatima iz Tablice 2 može se zaključiti da je vrlo dobre rezultate za zapadni dio Istre dao pokazatelj zadovoljstva elementima turističke ponude (�̅�𝑥𝑥𝑥 = 3,80). Da su ispitanici vrlo zadovoljni, potvrdilo je 39,0 % ispitanika koji su označili da se u potpunosti slažu s navedenim tvrdnjama. Ispitanici su posebice zadovoljni ljepotom prirode i krajolika (�̅�𝑥𝑥𝑥 = 4,45), gostoljubivošću lokalnog stanovništva (�̅�𝑥𝑥𝑥 = 4,17) i čistoćom mora (�̅�𝑥𝑥𝑥 = 4,14), dok su manje zadovoljni kvalitetom lokalnog prijevoza (�̅�𝑥𝑥𝑥 = 3,27) te opremljenošću i uređenošću lokalnog prijevoza (�̅�𝑥𝑥𝑥 = 3,53). Zaključno, prosječne ocjene kreću se u rasponu od 3,14 do 3,80, što ukazuje na slaganje s postavljanim česticama ili tvrdnjama i da u prosjeku ne postoje značajnija odstupanja od prosječnih vrijednosti iz uzorka.
= 3,53).
Zaključno, prosječne ocjene kreću se u rasponu od 3,14 do 3,80, što ukazuje na slaganje s postavljanim česticama ili tvrdnjama i da u prosjeku ne postoje značajnija odstupanja od prosječnih vrijednosti iz uzorka.
Tablica 1. Deskriptivna statistička analiza čestica (n = 305)
Kôd ČesticeAritmetička
sredinaStandardna
devijacijaKoeficijent asimetrije
Koeficijent zaobljenosti
Sadržaj poruka na društvenim medijima
3,41 0,636 -0,494 -0,040
Sadržaj_6Komentari uključuju
prednosti i mane destinacije.
3,67 0,960 -0,614 0,244
Sadržaj_4Komentari
naglašavaju pozitivne strane destinacije.
3,60 0,845 -0,855 1,062
Sadržaj_7
Objavljeni komentari o destinaciji
međusobno su usklađeni.
3,50 1,033 -0,329 -0,294
Sadržaj_1Komentari su
uvjerljivi.3,49 0,953 -0,472 -0,164
Sadržaj_3 Komentari su dobri. 3,45 0,906 -0,432 0,197
Sadržaj_5Komentari
naglašavaju pozitivna mišljenja o destinaciji.
3,43 0,926 -0,020 -0,208

J. Mušanović: Modeliranje utjecaja ugleda turističke destinacije prisutnog u društvenim medijima na...Zbornik Veleučilišta u Rijeci, Vol. 8 (2020), No. 1, pp. 77-101
85
Kôd ČesticeAritmetička
sredinaStandardna
devijacijaKoeficijent asimetrije
Koeficijent zaobljenosti
Sadržaj_2Komentari imaju snažnu poruku.
3,25 1,011 -0,085 -0,325
Sadržaj_8Autori komentara
imali su slična iskustva u destinaciji.
3,24 1,099 -0,539 -0,304
Stav prema komentarima na društvenim medijima
3,48 0,782 -0,386 0,631
Stav_4
Pokušavam doznati jesu li drugi korisnici
doživjeli iskustvo koje bih ja želio doživjeti.
3,80 1,155 -0,822 -0,143
Stav_3
Pokušavam doznati imaju li drugi
korisnici slične komentare o
destinaciji.
3,69 1,000 -0,589 -0,091
Stav_1
Pokušavam doznati kakav je ugled destinacije na društvenim
medijima.
3,53 0,977 -0,397 -0,145
Stav_5
Pokušavam prepoznati koji su
ključni komentari o destinaciji objavljeni
u društvenim medijima.
3,49 1,042 -0,189 -0,633
Stav_2
Pokušavam doznati koji aspekti destinacije imaju loš ugled na društvenim
medijima.
3,32 1,102 -0,447 -0,343

J. Mušanović: Modeliranje utjecaja ugleda turističke destinacije prisutnog u društvenim medijima na...Zbornik Veleučilišta u Rijeci, Vol. 8 (2020), No. 1, pp. 77-101
86
Kôd ČesticeAritmetička
sredinaStandardna
devijacijaKoeficijent asimetrije
Koeficijent zaobljenosti
Stav_6
Pokušavam prepoznati
komentare koji se razlikuju od
većine objavljenih komentara o
destinaciji.
3,31 1,152 -0,254 -0,665
Ugled turističke destinacije na društvenim medijima
3,76 0,690 -0,076 -0,323
Ugled_4
Korisnici na društvenim medijima
pozitivno pričaju o destinaciji.
3,97 0,673 -0,099 -0,409
Ugled _3Destinacija je visoko
cijenjena.3,92 0,984 -0,509 -0,453
Ugled _5
Dobar ugled destinacije na
društvenim medijima zasnovan je na
povijesno-kulturnim znamenitostima
destinacije.
3,81 0,972 -0,434 -0,410
Ugled _1Destinacija ima dobar ugled na društvenim
medijima.3,78 1,097 -1,008 0,645
Ugled _2
Destinacija u usporedbi s drugim
sličnim destinacijama ima bolji ugled na društvenim
medijima.
3,29 0,965 -0,436 -0,195
Zadovoljstvo turista elementima turističke ponude
3,80 0,618 -0,420 0,417
Zadovoljstvo_1Ljepota prirode
i krajolika4,45 0,759 -1,403 1,667
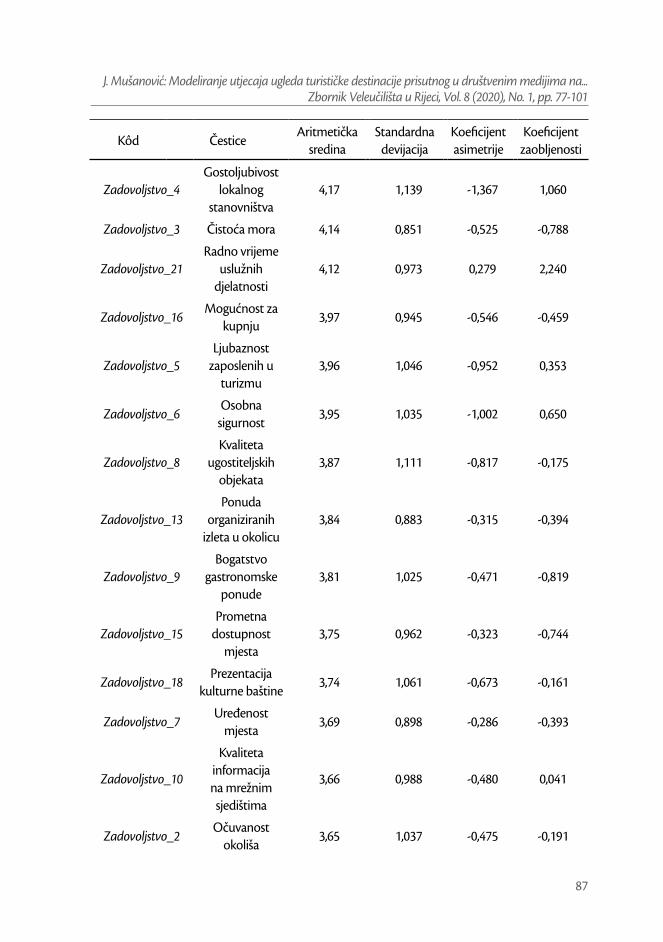
J. Mušanović: Modeliranje utjecaja ugleda turističke destinacije prisutnog u društvenim medijima na...Zbornik Veleučilišta u Rijeci, Vol. 8 (2020), No. 1, pp. 77-101
87
Kôd ČesticeAritmetička
sredinaStandardna
devijacijaKoeficijent asimetrije
Koeficijent zaobljenosti
Zadovoljstvo_4Gostoljubivost
lokalnog stanovništva
4,17 1,139 -1,367 1,060
Zadovoljstvo_3 Čistoća mora 4,14 0,851 -0,525 -0,788
Zadovoljstvo_21Radno vrijeme
uslužnih djelatnosti
4,12 0,973 0,279 2,240
Zadovoljstvo_16Mogućnost za
kupnju3,97 0,945 -0,546 -0,459
Zadovoljstvo_5Ljubaznost
zaposlenih u turizmu
3,96 1,046 -0,952 0,353
Zadovoljstvo_6Osobna
sigurnost3,95 1,035 -1,002 0,650
Zadovoljstvo_8Kvaliteta
ugostiteljskih objekata
3,87 1,111 -0,817 -0,175
Zadovoljstvo_13Ponuda
organiziranih izleta u okolicu
3,84 0,883 -0,315 -0,394
Zadovoljstvo_9Bogatstvo
gastronomske ponude
3,81 1,025 -0,471 -0,819
Zadovoljstvo_15Prometna
dostupnost mjesta
3,75 0,962 -0,323 -0,744
Zadovoljstvo_18Prezentacija
kulturne baštine3,74 1,061 -0,673 -0,161
Zadovoljstvo_7Uređenost
mjesta3,69 0,898 -0,286 -0,393
Zadovoljstvo_10
Kvaliteta informacija na mrežnim sjedištima
3,66 0,988 -0,480 0,041
Zadovoljstvo_2Očuvanost
okoliša3,65 1,037 -0,475 -0,191

J. Mušanović: Modeliranje utjecaja ugleda turističke destinacije prisutnog u društvenim medijima na...Zbornik Veleučilišta u Rijeci, Vol. 8 (2020), No. 1, pp. 77-101
88
Kôd ČesticeAritmetička
sredinaStandardna
devijacijaKoeficijent asimetrije
Koeficijent zaobljenosti
Zadovoljstvo_11Kvaliteta
informacija u destinaciji
3,63 1,024 -0,547 -0,092
Zadovoljstvo_17Bogatstvo sportskih sadržaja
3,63 0,992 -0,272 -0,370
Zadovoljstvo_12Turistička
signalizacija u destinaciji
3,58 1,030 -0,582 -0,044
Zadovoljstvo_22Raznolikost kulturnih
manifestacija3,58 0,862 0,018 -0,674
Zadovoljstvo_23Ukupni odnos
cijene i kvalitete3,55 0,989 -0,430 -0,025
Zadovoljstvo_19Bogatstvo sadržaja za
zabavu3,54 1,085 -0,425 -0,521
Zadovoljstvo_14Opremljenost i uređenost plaža
3,53 1,085 -0,446 -0,476
Zadovoljstvo_20Kvaliteta lokalnog prijevoza
3,27 1,019 -0,202 -0,368
Izvor: rezultati istraživanja

J. Mušanović: Modeliranje utjecaja ugleda turističke destinacije prisutnog u društvenim medijima na...Zbornik Veleučilišta u Rijeci, Vol. 8 (2020), No. 1, pp. 77-101
89
6. 2 Rezultati multivarijatne statističke analize
Rezultati procjene strukturnog modeliranja jednadžbama primjenom metode parcijalnih najmanjih kvadrata (PLS-SEM) prikazat će se u dva koraka. Prvo će se prikazati rezultati analize vanjskog mjernog strukturnog modela, a potom unutarnjeg mjernog strukturnog modela.
6. 2. 1 Rezultati vanjskog reflektivnog i formativnog mjernog modela
Procjena dosljednosti mjernog reflektivnog modela ispitana je analizom pouzdanosti i valjanosti manifestnih varijabli te egzogenih i endogenih latentnih konstrukata. Manifestne varijable s vanjskim faktorskim opterećenjem između 0,60 i 0,70 smatraju se prikladnima u eksploratornim istraživanjima (Nunnally, Bernstein, 1994). Standardizirana faktorska opterećenja manifestnih varijabli nalaze se u intervalu od 0,313 i 0,848. Četiri manifestne varijable imaju vrijednost manju od 0,60 te su eliminirane iz daljnje analize.
U Tablici 2 prikazani se rezultati analize pouzdanosti reflektivnih latentnih konstrukata i varijable mjernih konstrukata pomoću izračuna vrijednosti koeficijenata unutarnje dosljednosti primjenom Cronbach alpha koeficijenta.
Tablica 2. Zbirni rezultati analize mjernog reflektivnog modela
Konvergentna valjanostUnutarnja
dosljednostiDiskriminantna
valjanost
Latentne varijable
Manifestne varijable
Standardizirano faktorsko
opterećenjeAVE
Cronbach α CR
Fornell-Larcker; Cross loadings;
HTMT
Sadržaj poruka na
društvenim medijima
Sadržaj_1 0,695
0,525 0,776 0,846 da
Sadržaj_2 0,664
Sadržaj_3 0,848
Sadržaj_4 0,688
Sadržaj_5 0,713
Stav prema ugledu na
društvenim medijima
Stav_1 0,747
0,518 0,770 0,842 da
Stav_2 0,680
Stav_3 0,653
Stav_5 0,669
Stav_6 0,835

J. Mušanović: Modeliranje utjecaja ugleda turističke destinacije prisutnog u društvenim medijima na...Zbornik Veleučilišta u Rijeci, Vol. 8 (2020), No. 1, pp. 77-101
90
Konvergentna valjanostUnutarnja
dosljednostiDiskriminantna
valjanost
Latentne varijable
Manifestne varijable
Standardizirano faktorsko
opterećenjeAVE
Cronbach α CR
Fornell-Larcker; Cross loadings;
HTMT
Ugled turističke
destinacije na
društvenim medijima
Ugled_1 0,705
0,541 0,789 0,855 da
Ugled _2 0,740
Ugled _3 0,716
Ugled _4 0,773
Ugled _5 0,741
* AVE – prosječna izlučena varijanca; CR – kompozitna pouzdanost; Cross loadings - unakrsna standardizirana faktorska opterećenja; HTMT - Heterotrait-Monotrait omjer korelacije.
Izvor: rezultati istraživanja
Razmotre li se vrijednosti Cronbach alpha koeficijenata latentnih konstrukata, može se zaključiti da se vrijednosti nalaze se u intervalu od 0,770 do 0,789 što zadovoljava granice prihvatljivosti i pokazuju dobru pouzdanost, tj. visoki stupanj unutarnje stabilnosti i dosljednosti mjernih latentnih konstrukata. Kompozitna pouzdanost – CR – za sve latentne konstrukte vanjskog reflektivnog modela premašuje potrebni minimum od 0,708, što znači da varijable dobro predstavljaju latentne konstrukte.
Provjeri diskriminantne valjanosti pristupilo se ispitivanjem Fornell-Larcker kriterija, unakrsnim standardiziranim faktorskim opterećenjima (Cross loadings) te Heterotrait-Monotrait omjerom korelacije (HTMT) čiji su rezultati prikazani u nastavku.
Tablica 3. Diskriminantna valjanost (Fornell-Larcker kriterij)
Sadržaj poruka na društvenim
medijima
Stav prema ugledu na
društvenim medijima
Ugled turističke destinacije na društvenim medijima
Sadržaj poruka na društvenim medijima
0,724
Stav prema ugledu na društvenim medijima
0,357 0,720
Ugled turističke destinacije na društvenim medijima
0,544 0,367 0,735
Izvor: rezultati istraživanja

J. Mušanović: Modeliranje utjecaja ugleda turističke destinacije prisutnog u društvenim medijima na...Zbornik Veleučilišta u Rijeci, Vol. 8 (2020), No. 1, pp. 77-101
91
Iz Tablice 3 vidljivo je da se vrijednosti svih unakrsnih standardizirana faktorskih opterećenja po varijablama latentnih konstrukata nalaze u rasponu od 0,720 do 0,735 čime je potvrđeno da su vrijednosti prosječne izlučene varijance (AVE) svakog latentnog konstrukta veće od najvećih kvadrata korelacije drugih konstrukata.
Tablica 4. Diskriminantna valjanost (unakrsna standardizirana faktorska opterećenja – Cross Loadings)
Sadržaj poruka na društvenim medijima
Stav prema ugledu na društvenim medijima
Ugled turističke destinacije na društvenim medijima
Sadržaj_1 0,695 0,294 0,249
Sadržaj_2 0,664 0,173 0,356
Sadržaj_3 0,848 0,370 0,500
Sadržaj_4 0,688 0,310 0,343
Sadržaj_5 0,713 0,156 0,447
Stav_1 0,200 0,747 0,342
Stav_2 0,158 0,680 0,248
Stav_3 0,303 0,653 0,165
Stav_5 0,296 0,669 0,218
Stav_6 0,366 0,835 0,292
Ugled_1 0,454 0,212 0,705
Ugled_2 0,466 0,197 0,740
Ugled_3 0,228 0,343 0,716
Ugled_4 0,421 0,286 0,773
Ugled_5 0,414 0,307 0,741
Izvor: rezultati istraživanja
Analizom unakrsnih standardiziranih faktorskih opterećenja (Tablica 4) može se utvrditi da svaki reflektivni latentni konstrukt dijeli više varijance sa pridruženim manifestnim varijablama nego s preostalim reflektivnim latentnim konstruktima u model čime se također utvrđuje diskriminantna valjanost latentnih konstrukata.

J. Mušanović: Modeliranje utjecaja ugleda turističke destinacije prisutnog u društvenim medijima na...Zbornik Veleučilišta u Rijeci, Vol. 8 (2020), No. 1, pp. 77-101
92
Tablica 5. Diskriminantna valjanost (Heterotrait-Monotrait omjer korelacije – HTMT)
Sadržaj poruka na društvenim
medijima
Stav prema ugledu na društvenim
medijima
Ugled turističke destinacije na
društvenim medijima
Sadržaj poruka na društvenim medijima
Stav prema ugledu na društvenim medijima
0,487 [0,375;0,626]
Ugled turističke destinacije na društvenim medijima
0,657 [0,569;0,749]
0,458 [0,352;0,583]
Izvor: rezultati istraživanja
Vrijednosti Heterotrait-Monotrait omjera korelacije manje su od referentne vrijednosti 0,9, a gornje vrijednosti intervala pouzdanosti manje od 1 (Tablica 5). Može zaključiti da je prema svim prethodno navedenim kriterijima zadovoljena diskriminantna valjanost reflektivnih latentnih konstrukata.
U nastavku prikazani su pokazatelji kolinearnosti, signifikantnosti i relevantnosti mjernog vanjskog formativnog modela (Tablica 6).

J. Mušanović: Modeliranje utjecaja ugleda turističke destinacije prisutnog u društvenim medijima na...Zbornik Veleučilišta u Rijeci, Vol. 8 (2020), No. 1, pp. 77-101
93
Tabl
ica 6
. Kol
inea
rnos
t, sig
nifik
antn
ost i
rele
vant
nost
mje
rnog
van
jskog
form
ativ
nog
mod
ela
Kons
truk
tVa
rijab
laVI
FTe
žišna
vr
ijedn
ost
Stan
dard
izira
no
fakt
orsk
o op
tere
ćenj
e
Stan
dard
na
devi
jacij
at-v
rijed
nost
p-vr
ijedn
ost
Sign
ifika
ntno
stZadovoljstvo turista elementima turističke ponude u destinaciji
Zado
voljs
tvo_
11,2
85-0
,029
0,149
0,082
0,351
0,725
–
Zado
voljs
tvo_
102,8
43-0
,230
0,544
0,125
1,845
0,065
–
Zado
voljs
tvo_
113,0
050,5
060,8
220,1
463,4
560,0
01
J. M
ušan
ović:
Mod
elira
nje
utje
caja
ugl
eda
turis
tičke
des
tinac
ije p
risut
nog
u dr
uštv
enim
med
ijima
na z
adov
oljst
vo tu
rista
Zb
orni
k Ve
leuč
ilišta
u R
ijeci,
Vol
. 8 (2
020)
, No.
1, p
p. 1
-8
Ta
blic
a 6.
Kol
inea
rnos
t, si
gnifi
kant
nost
i re
leva
ntno
st m
jern
og v
anjs
kog
form
ativ
nog
mod
ela
Kons
trukt
Va
rijab
la
VIF
Teži
šna
vrije
dnos
t St
anda
rdiz
irano
fa
ktor
sko
opte
reće
nje
Stan
dard
na
devi
jaci
ja
t-vr
ijedn
ost
p-vr
ijedn
ost
Sign
ifika
ntno
st
Zadovoljstvo turista elementima turističke ponude u destinaciji
Zadovoljstvo_1
1,28
5 -0
,029
0,
149
0,08
2 0,
351
0,72
5 ―
Zadovoljstvo_10
2,
843
-0,2
30
0,54
4 0,
125
1,84
5 0,
065
―
Zadovoljstvo_11
3,
005
0,50
6 0,
822
0,14
6 3,
456
0,00
1
Zadovoljstvo_12
2,
131
0,17
1 0,
632
0,10
9 1,
571
0,11
6 *
Zadovoljstvo_13
1,
773
0,09
8 0,
399
0,13
5 0,
722
0,47
0 N
.S.
Zadovoljstvo_14
1,
881
-0,0
39
0,37
4 0,
111
0,35
7 0,
721
N.S
. Zadovoljstvo_15
1,
596
0,22
9 0,
581
0,10
0 2,
298
0,02
2
Zadovoljstvo_16
1,
454
0,20
0 0,
472
0,09
4 2,
135
0,03
3
Zadovoljstvo_17
1,
523
-0,3
26
0,21
2 0,
095
3,42
4 0,
001
―
Zadovoljstvo_18
1,
757
0,21
7 0,
656
0,10
1 2,
138
0,03
3
Zadovoljstvo_19
2,
003
0,05
5 0,
520
0,10
4 0,
534
0,59
3 *
Zadovoljstvo_2
1,86
0 -0
,111
0,
324
0,10
3 1,
085
0,27
8 ―
Zadovoljstvo_20
1,
875
-0,0
86
0,42
7 0,
114
0,75
6 0,
450
―
Zadovoljstvo_21
1,
516
0,03
2 0,
323
0,07
8 0,
403
0,68
7 N
.S.
Zadovoljstvo_22
1,
982
0,14
2 0,
459
0,10
8 1,
311
0,19
0 N
.S.
Zadovoljstvo_23
1,
606
0,12
3 0,
430
0,09
3 1,
324
0,18
5 N
.S.
Zadovoljstvo_3
1,64
6 0,
162
0,35
4 0,
093
1,74
5 0,
081
N.S
. Zadovoljstvo_4
2,50
6 -0
,122
0,
316
0,13
2 0,
924
0,35
6 ―
Zadovoljstvo_5
2,09
7 0,
083
0,51
3 0,
128
0,65
1 0,
515
* Zadovoljstvo_6
1,78
8 0,
059
0,52
6 0,
113
0,52
4 0,
600
* Zadovoljstvo_7
1,51
6 -0
,008
0,
307
0,08
9 0,
090
0,92
9 ―
Zadovoljstvo_8
2,07
3 0,
142
0,61
5 0,
101
1,41
6 0,
157
* Zadovoljstvo_9
1,78
4 0,
038
0,49
4 0,
090
0,42
2 0,
673
N.S
. N
apom
ena:
st
atis
tički
zna
čajn
o; N
.S.
nije
sta
tistič
ki z
nača
jno;
* iz
nim
no v
ažno
; ― n
egat
ivna
teži
nska
vrij
edno
st.
Iz
vor:
rezu
ltati
istra
živa
nja.
Zado
voljs
tvo_
122,1
310,1
710,6
320,1
091,5
710,1
16*
Zado
voljs
tvo_
131,7
730,0
980,3
990,1
350,7
220,4
70N
.S.
Zado
voljs
tvo_
141,8
81-0
,039
0,374
0,111
0,357
0,721
N.S.
Zado
voljs
tvo_
151,5
960,2
290,5
810,1
002,2
980,0
22
J. M
ušan
ović:
Mod
elira
nje
utje
caja
ugl
eda
turis
tičke
des
tinac
ije p
risut
nog
u dr
uštv
enim
med
ijima
na z
adov
oljst
vo tu
rista
Zb
orni
k Ve
leuč
ilišta
u R
ijeci,
Vol
. 8 (2
020)
, No.
1, p
p. 1
-8
Ta
blic
a 6.
Kol
inea
rnos
t, si
gnifi
kant
nost
i re
leva
ntno
st m
jern
og v
anjs
kog
form
ativ
nog
mod
ela
Kons
trukt
Va
rijab
la
VIF
Teži
šna
vrije
dnos
t St
anda
rdiz
irano
fa
ktor
sko
opte
reće
nje
Stan
dard
na
devi
jaci
ja
t-vr
ijedn
ost
p-vr
ijedn
ost
Sign
ifika
ntno
st
Zadovoljstvo turista elementima turističke ponude u destinaciji
Zadovoljstvo_1
1,28
5 -0
,029
0,
149
0,08
2 0,
351
0,72
5 ―
Zadovoljstvo_10
2,
843
-0,2
30
0,54
4 0,
125
1,84
5 0,
065
―
Zadovoljstvo_11
3,
005
0,50
6 0,
822
0,14
6 3,
456
0,00
1
Zadovoljstvo_12
2,
131
0,17
1 0,
632
0,10
9 1,
571
0,11
6 *
Zadovoljstvo_13
1,
773
0,09
8 0,
399
0,13
5 0,
722
0,47
0 N
.S.
Zadovoljstvo_14
1,
881
-0,0
39
0,37
4 0,
111
0,35
7 0,
721
N.S
. Zadovoljstvo_15
1,
596
0,22
9 0,
581
0,10
0 2,
298
0,02
2
Zadovoljstvo_16
1,
454
0,20
0 0,
472
0,09
4 2,
135
0,03
3
Zadovoljstvo_17
1,
523
-0,3
26
0,21
2 0,
095
3,42
4 0,
001
―
Zadovoljstvo_18
1,
757
0,21
7 0,
656
0,10
1 2,
138
0,03
3
Zadovoljstvo_19
2,
003
0,05
5 0,
520
0,10
4 0,
534
0,59
3 *
Zadovoljstvo_2
1,86
0 -0
,111
0,
324
0,10
3 1,
085
0,27
8 ―
Zadovoljstvo_20
1,
875
-0,0
86
0,42
7 0,
114
0,75
6 0,
450
―
Zadovoljstvo_21
1,
516
0,03
2 0,
323
0,07
8 0,
403
0,68
7 N
.S.
Zadovoljstvo_22
1,
982
0,14
2 0,
459
0,10
8 1,
311
0,19
0 N
.S.
Zadovoljstvo_23
1,
606
0,12
3 0,
430
0,09
3 1,
324
0,18
5 N
.S.
Zadovoljstvo_3
1,64
6 0,
162
0,35
4 0,
093
1,74
5 0,
081
N.S
. Zadovoljstvo_4
2,50
6 -0
,122
0,
316
0,13
2 0,
924
0,35
6 ―
Zadovoljstvo_5
2,09
7 0,
083
0,51
3 0,
128
0,65
1 0,
515
* Zadovoljstvo_6
1,78
8 0,
059
0,52
6 0,
113
0,52
4 0,
600
* Zadovoljstvo_7
1,51
6 -0
,008
0,
307
0,08
9 0,
090
0,92
9 ―
Zadovoljstvo_8
2,07
3 0,
142
0,61
5 0,
101
1,41
6 0,
157
* Zadovoljstvo_9
1,78
4 0,
038
0,49
4 0,
090
0,42
2 0,
673
N.S
. N
apom
ena:
st
atis
tički
zna
čajn
o; N
.S.
nije
sta
tistič
ki z
nača
jno;
* iz
nim
no v
ažno
; ― n
egat
ivna
teži
nska
vrij
edno
st.
Iz
vor:
rezu
ltati
istra
živa
nja.
Zado
voljs
tvo_
161,4
540,2
000,4
720,0
942,1
350,0
33
J. M
ušan
ović:
Mod
elira
nje
utje
caja
ugl
eda
turis
tičke
des
tinac
ije p
risut
nog
u dr
uštv
enim
med
ijima
na z
adov
oljst
vo tu
rista
Zb
orni
k Ve
leuč
ilišta
u R
ijeci,
Vol
. 8 (2
020)
, No.
1, p
p. 1
-8
Ta
blic
a 6.
Kol
inea
rnos
t, si
gnifi
kant
nost
i re
leva
ntno
st m
jern
og v
anjs
kog
form
ativ
nog
mod
ela
Kons
trukt
Va
rijab
la
VIF
Teži
šna
vrije
dnos
t St
anda
rdiz
irano
fa
ktor
sko
opte
reće
nje
Stan
dard
na
devi
jaci
ja
t-vr
ijedn
ost
p-vr
ijedn
ost
Sign
ifika
ntno
st
Zadovoljstvo turista elementima turističke ponude u destinaciji
Zadovoljstvo_1
1,28
5 -0
,029
0,
149
0,08
2 0,
351
0,72
5 ―
Zadovoljstvo_10
2,
843
-0,2
30
0,54
4 0,
125
1,84
5 0,
065
―
Zadovoljstvo_11
3,
005
0,50
6 0,
822
0,14
6 3,
456
0,00
1
Zadovoljstvo_12
2,
131
0,17
1 0,
632
0,10
9 1,
571
0,11
6 *
Zadovoljstvo_13
1,
773
0,09
8 0,
399
0,13
5 0,
722
0,47
0 N
.S.
Zadovoljstvo_14
1,
881
-0,0
39
0,37
4 0,
111
0,35
7 0,
721
N.S
. Zadovoljstvo_15
1,
596
0,22
9 0,
581
0,10
0 2,
298
0,02
2
Zadovoljstvo_16
1,
454
0,20
0 0,
472
0,09
4 2,
135
0,03
3
Zadovoljstvo_17
1,
523
-0,3
26
0,21
2 0,
095
3,42
4 0,
001
―
Zadovoljstvo_18
1,
757
0,21
7 0,
656
0,10
1 2,
138
0,03
3
Zadovoljstvo_19
2,
003
0,05
5 0,
520
0,10
4 0,
534
0,59
3 *
Zadovoljstvo_2
1,86
0 -0
,111
0,
324
0,10
3 1,
085
0,27
8 ―
Zadovoljstvo_20
1,
875
-0,0
86
0,42
7 0,
114
0,75
6 0,
450
―
Zadovoljstvo_21
1,
516
0,03
2 0,
323
0,07
8 0,
403
0,68
7 N
.S.
Zadovoljstvo_22
1,
982
0,14
2 0,
459
0,10
8 1,
311
0,19
0 N
.S.
Zadovoljstvo_23
1,
606
0,12
3 0,
430
0,09
3 1,
324
0,18
5 N
.S.
Zadovoljstvo_3
1,64
6 0,
162
0,35
4 0,
093
1,74
5 0,
081
N.S
. Zadovoljstvo_4
2,50
6 -0
,122
0,
316
0,13
2 0,
924
0,35
6 ―
Zadovoljstvo_5
2,09
7 0,
083
0,51
3 0,
128
0,65
1 0,
515
* Zadovoljstvo_6
1,78
8 0,
059
0,52
6 0,
113
0,52
4 0,
600
* Zadovoljstvo_7
1,51
6 -0
,008
0,
307
0,08
9 0,
090
0,92
9 ―
Zadovoljstvo_8
2,07
3 0,
142
0,61
5 0,
101
1,41
6 0,
157
* Zadovoljstvo_9
1,78
4 0,
038
0,49
4 0,
090
0,42
2 0,
673
N.S
. N
apom
ena:
st
atis
tički
zna
čajn
o; N
.S.
nije
sta
tistič
ki z
nača
jno;
* iz
nim
no v
ažno
; ― n
egat
ivna
teži
nska
vrij
edno
st.
Iz
vor:
rezu
ltati
istra
živa
nja.
Zado
voljs
tvo_
171,5
23-0
,326
0,212
0,095
3,424
0,001
-
Zado
voljs
tvo_
181,7
570,2
170,6
560,1
012,1
380,0
33
J. M
ušan
ović:
Mod
elira
nje
utje
caja
ugl
eda
turis
tičke
des
tinac
ije p
risut
nog
u dr
uštv
enim
med
ijima
na z
adov
oljst
vo tu
rista
Zb
orni
k Ve
leuč
ilišta
u R
ijeci,
Vol
. 8 (2
020)
, No.
1, p
p. 1
-8
Ta
blic
a 6.
Kol
inea
rnos
t, si
gnifi
kant
nost
i re
leva
ntno
st m
jern
og v
anjs
kog
form
ativ
nog
mod
ela
Kons
trukt
Va
rijab
la
VIF
Teži
šna
vrije
dnos
t St
anda
rdiz
irano
fa
ktor
sko
opte
reće
nje
Stan
dard
na
devi
jaci
ja
t-vr
ijedn
ost
p-vr
ijedn
ost
Sign
ifika
ntno
st
Zadovoljstvo turista elementima turističke ponude u destinaciji
Zadovoljstvo_1
1,28
5 -0
,029
0,
149
0,08
2 0,
351
0,72
5 ―
Zadovoljstvo_10
2,
843
-0,2
30
0,54
4 0,
125
1,84
5 0,
065
―
Zadovoljstvo_11
3,
005
0,50
6 0,
822
0,14
6 3,
456
0,00
1
Zadovoljstvo_12
2,
131
0,17
1 0,
632
0,10
9 1,
571
0,11
6 *
Zadovoljstvo_13
1,
773
0,09
8 0,
399
0,13
5 0,
722
0,47
0 N
.S.
Zadovoljstvo_14
1,
881
-0,0
39
0,37
4 0,
111
0,35
7 0,
721
N.S
. Zadovoljstvo_15
1,
596
0,22
9 0,
581
0,10
0 2,
298
0,02
2
Zadovoljstvo_16
1,
454
0,20
0 0,
472
0,09
4 2,
135
0,03
3
Zadovoljstvo_17
1,
523
-0,3
26
0,21
2 0,
095
3,42
4 0,
001
―
Zadovoljstvo_18
1,
757
0,21
7 0,
656
0,10
1 2,
138
0,03
3
Zadovoljstvo_19
2,
003
0,05
5 0,
520
0,10
4 0,
534
0,59
3 *
Zadovoljstvo_2
1,86
0 -0
,111
0,
324
0,10
3 1,
085
0,27
8 ―
Zadovoljstvo_20
1,
875
-0,0
86
0,42
7 0,
114
0,75
6 0,
450
―
Zadovoljstvo_21
1,
516
0,03
2 0,
323
0,07
8 0,
403
0,68
7 N
.S.
Zadovoljstvo_22
1,
982
0,14
2 0,
459
0,10
8 1,
311
0,19
0 N
.S.
Zadovoljstvo_23
1,
606
0,12
3 0,
430
0,09
3 1,
324
0,18
5 N
.S.
Zadovoljstvo_3
1,64
6 0,
162
0,35
4 0,
093
1,74
5 0,
081
N.S
. Zadovoljstvo_4
2,50
6 -0
,122
0,
316
0,13
2 0,
924
0,35
6 ―
Zadovoljstvo_5
2,09
7 0,
083
0,51
3 0,
128
0,65
1 0,
515
* Zadovoljstvo_6
1,78
8 0,
059
0,52
6 0,
113
0,52
4 0,
600
* Zadovoljstvo_7
1,51
6 -0
,008
0,
307
0,08
9 0,
090
0,92
9 ―
Zadovoljstvo_8
2,07
3 0,
142
0,61
5 0,
101
1,41
6 0,
157
* Zadovoljstvo_9
1,78
4 0,
038
0,49
4 0,
090
0,42
2 0,
673
N.S
. N
apom
ena:
st
atis
tički
zna
čajn
o; N
.S.
nije
sta
tistič
ki z
nača
jno;
* iz
nim
no v
ažno
; ― n
egat
ivna
teži
nska
vrij
edno
st.
Iz
vor:
rezu
ltati
istra
živa
nja.
Zado
voljs
tvo_
192,0
030,0
550,5
200,1
040,5
340,5
93*
Zado
voljs
tvo_
21,8
60-0
,111
0,324
0,103
1,085
0,278
–
Zado
voljs
tvo_
201,8
75-0
,086
0,427
0,114
0,756
0,450
–
Zado
voljs
tvo_
211,5
160,0
320,3
230,0
780,4
030,6
87N
.S.
Zado
voljs
tvo_
221,9
820,1
420,4
590,1
081,3
110,1
90N
.S.
Zado
voljs
tvo_
231,6
060,1
230,4
300,0
931,3
240,1
85N
.S.
Zado
voljs
tvo_
31,6
460,1
620,3
540,0
931,7
450,0
81N
.S.
Zado
voljs
tvo_
42,5
06-0
,122
0,316
0,132
0,924
0,356
–
Zado
voljs
tvo_
52,0
970,0
830,5
130,1
280,6
510,5
15*
Zado
voljs
tvo_
61,7
880,0
590,5
260,1
130,5
240,6
00*
Zado
voljs
tvo_
71,5
16-0
,008
0,307
0,089
0,090
0,929
–
Zado
voljs
tvo_
82,0
730,1
420,6
150,1
011,4
160,1
57*
Zado
voljs
tvo_
91,7
840,0
380,4
940,0
900,4
220,6
73N
.S.
Nap
omen
a:
J. M
ušan
ović:
Mod
elira
nje
utje
caja
ugl
eda
turis
tičke
des
tinac
ije p
risut
nog
u dr
uštv
enim
med
ijima
na z
adov
oljst
vo tu
rista
Zb
orni
k Ve
leuč
ilišta
u R
ijeci,
Vol
. 8 (2
020)
, No.
1, p
p. 1
-8
Ta
blic
a 6.
Kol
inea
rnos
t, si
gnifi
kant
nost
i re
leva
ntno
st m
jern
og v
anjs
kog
form
ativ
nog
mod
ela
Kons
trukt
Va
rijab
la
VIF
Teži
šna
vrije
dnos
t St
anda
rdiz
irano
fa
ktor
sko
opte
reće
nje
Stan
dard
na
devi
jaci
ja
t-vr
ijedn
ost
p-vr
ijedn
ost
Sign
ifika
ntno
st
Zadovoljstvo turista elementima turističke ponude u destinaciji
Zadovoljstvo_1
1,28
5 -0
,029
0,
149
0,08
2 0,
351
0,72
5 ―
Zadovoljstvo_10
2,
843
-0,2
30
0,54
4 0,
125
1,84
5 0,
065
―
Zadovoljstvo_11
3,
005
0,50
6 0,
822
0,14
6 3,
456
0,00
1
Zadovoljstvo_12
2,
131
0,17
1 0,
632
0,10
9 1,
571
0,11
6 *
Zadovoljstvo_13
1,
773
0,09
8 0,
399
0,13
5 0,
722
0,47
0 N
.S.
Zadovoljstvo_14
1,
881
-0,0
39
0,37
4 0,
111
0,35
7 0,
721
N.S
. Zadovoljstvo_15
1,
596
0,22
9 0,
581
0,10
0 2,
298
0,02
2
Zadovoljstvo_16
1,
454
0,20
0 0,
472
0,09
4 2,
135
0,03
3
Zadovoljstvo_17
1,
523
-0,3
26
0,21
2 0,
095
3,42
4 0,
001
―
Zadovoljstvo_18
1,
757
0,21
7 0,
656
0,10
1 2,
138
0,03
3
Zadovoljstvo_19
2,
003
0,05
5 0,
520
0,10
4 0,
534
0,59
3 *
Zadovoljstvo_2
1,86
0 -0
,111
0,
324
0,10
3 1,
085
0,27
8 ―
Zadovoljstvo_20
1,
875
-0,0
86
0,42
7 0,
114
0,75
6 0,
450
―
Zadovoljstvo_21
1,
516
0,03
2 0,
323
0,07
8 0,
403
0,68
7 N
.S.
Zadovoljstvo_22
1,
982
0,14
2 0,
459
0,10
8 1,
311
0,19
0 N
.S.
Zadovoljstvo_23
1,
606
0,12
3 0,
430
0,09
3 1,
324
0,18
5 N
.S.
Zadovoljstvo_3
1,64
6 0,
162
0,35
4 0,
093
1,74
5 0,
081
N.S
. Zadovoljstvo_4
2,50
6 -0
,122
0,
316
0,13
2 0,
924
0,35
6 ―
Zadovoljstvo_5
2,09
7 0,
083
0,51
3 0,
128
0,65
1 0,
515
* Zadovoljstvo_6
1,78
8 0,
059
0,52
6 0,
113
0,52
4 0,
600
* Zadovoljstvo_7
1,51
6 -0
,008
0,
307
0,08
9 0,
090
0,92
9 ―
Zadovoljstvo_8
2,07
3 0,
142
0,61
5 0,
101
1,41
6 0,
157
* Zadovoljstvo_9
1,78
4 0,
038
0,49
4 0,
090
0,42
2 0,
673
N.S
. N
apom
ena:
st
atis
tički
zna
čajn
o; N
.S.
nije
sta
tistič
ki z
nača
jno;
* iz
nim
no v
ažno
; ― n
egat
ivna
teži
nska
vrij
edno
st.
Iz
vor:
rezu
ltati
istra
živa
nja.
stat
ističk
i zna
čajn
o; N
.S. n
ije st
atist
ički z
nača
jno;
* izn
imno
važ
no; –
neg
ativ
na te
žinsk
a vrij
edno
st.
Izvor
: rez
ulta
ti ist
raživ
anja

J. Mušanović: Modeliranje utjecaja ugleda turističke destinacije prisutnog u društvenim medijima na...Zbornik Veleučilišta u Rijeci, Vol. 8 (2020), No. 1, pp. 77-101
94
Pouzdanost formativnog latentnog konstrukta je ispitana testiranjem kolinearnosti između manifestnih varijabla latentnog konstrukta primjenom koeficijenta inflacije varijance (VIF). Na temelju rezultata može se zaključiti da se sve vrijednosti koeficijenata nalaze u referentnom intervalu između 0,02 i 5, što znači da pretpostavka o kolinearnosti vanjskih koeficijenata nije narušena (Tablica 6). Također, statistička signifikantnost faktorskih opterećenja utvrđena je primjenom Bootstraping procedure na temelju 5 000 poduzoraka i značajnosti na razini p < 0,05. Iz Tablice 6 vidljivo je da su samo manifestne varijable Zadovoljstvo_11, Zadovoljstvo_15, Zadovoljstvo_16 i Zadovoljstvo_18 statistički značajne na razini od 0,05. Manifestne varijable koje imaju statistički značajnu negativnu težinsku vrijednost i pozitivno faktorsko opterećenje, interpretiraju u kontekstu negativnog utjecaja na temeljni latentni konstrukt (Orehovački, 2013) i eliminirat će se iz daljnje analize. Manifestne varijable koje imaju negativne težinske vrijednosti i faktorsko opterećenje manje od 0,500 također će se eliminirati iz daljnje analize. Manifestne varijable koje nisu statistički značajne i imaju faktorsko opterećenje veće od 0,500 zadržati će se i tumačit će se kao iznimno važne (Hair et al., 2017). Zaključno, u testiranje strukturnog modela ukupno će biti uključeno devet manifestnih varijabli.
6. 2. 2 Rezultati unutarnjeg mjernog strukturnog modela
Prije testiranja utjecaja latentnih konstrukata strukturnog modela ispitana je kolinearnost između latentnih konstrukata. Prema rezultatima, kolinearnost i vrijednost unutarnjih koeficijenata inflacije varijacije latentnih konstrukata iznose u oba slučaja 1,147, te se nalaze u granicama referentnih vrijednosti (od 0,2 do 5), što znači da ne postoji kolinearnost između egzogenih i endogenih latentnih konstrukata.
Dijagram puta strukturnog modela (Slika 1) prikazuje statistički značajne korelacije ključne za potvrđivanje hipoteza. Prema Cohenu (1988) uočavaju se snažne, umjerene i slabe povezanosti latentnih konstrukata.
Slika 1. Strukturni mjerni model
Izvor: rezultati istraživanja.
J. Mušanović: Modeliranje utjecaja ugleda turističke destinacije prisutnog u društvenim medijima na...Zbornik Veleučilišta u Rijeci, Vol. 8 (2020), No. 1, pp. 77-101
95
Najsnažniji utjecaj uočava se između latentnih konstrukata ugled turističke destinacije na društvenim medijima i zadovoljstvo turista elementima turističke ponude (0,585). Umjereni utjecaj uočava se između latentnih konstrukata sadržaj poruka na društvenim medijima i ugled turističke destinacije na društvenim medijima (0,474), a slabi utjecaj uočen je između latentnih konstrukata stav prema komentarima na društvenim medijima i ugled turističke destinacije na društvenim medijima (0,198).
Korigirani koeficijent determinacije R2 zavisnih latentnih varijabli iznosi 0,331 i 0,342. Reflektivna zavisna latentna varijabla ugled turističke destinacije na društvenim medijima objašnjena je s 33,1 % varijance nezavisnim latentnim varijablama. Formativna zavisna latentna varijabla zadovoljstvo turista objašnjena je s 34,2 % varijance nezavisnim latentnim varijablama. S obzirom na to da su endogene varijable objašnjene malim brojem egzogenih latentnih varijabli, vrijednosti korigiranog koeficijenata determinacije R2 ukazuju na umjerenu i dostatnu povezanost latentnih varijabli i reprezentativnost modela.
Prediktivna relevantnosti utvrđena je Blindfolding procedurom primjenom unakrsno validirane redudance izračunom Stone-Geisserov Q2 pokazatelja. Vrijednosti Q2 iznose 0,171 i 0,130 te su veće od nule i ukazuju na zadovoljavajuću razinu prediktivnog značaja modela puta.
Nadalje, uočava se veliki utjecaj učinka (f 2 = 0,519) egzogenog latentnog konstrukta ugled turističke destinacije prisutan na društvenim medijima na zadovoljstvo turista. Srednji utjecaj uočava se između egzogenog latentnog konstrukta sadržaj poruka na društvenim medijima i endogenog latentnog konstrukta ugled turističke destinacije na društvenim medijima (f 2 = 0,293). Slab utjecaj uočava se između egzogenog latentnog konstrukta stav prema komentarima na društvenim medijima i endogenog latentnog konstrukta ugled turističke destinacije na društvenim medijima (f 2 = 0,051).
7. ZAKLJUČAK
Istraživanje korisnički generiranih sadržaja i recenzija na društvenim medijima u turizmu još uvijek je poprilično nov pristup. S obzirom na važnost recenzija na društvenim medijima pri donošenju odluka, praćenje ugleda na društvenim medijima, poboljšanje usluga i zadovoljstva turista na temelju povratnih informacija turista i korisnika nije više opcija već nužnost. Stoga je održavanje pozitivnog ugleda na društvenim medijima iznimno važno jer utječe na zadovoljstvo turista.
Prema rezultatima, prva hipoteza, Postoji statistički značajan utjecaj sadržaja poruka na ugleda turističke destinacije prisutnih u društvenim medijima, potvrđuje se zbog empirijske veze (β = 0,474; t = 10,335) koja je statistički značajna na razini p < 0,01. Populacija se s 99 % vjerojatnosti nalazi u intervalu pouzdanosti od 0,368 do 0,553. Druga hipoteza, Postoji statistički značajan utjecaj stava prema komentarima na ugled turističke destinacije prisutnih u društvenim medijima, potvrđuje se. Empirijska je veza slaba, ali postojana (β = 0,198; t = 4,404). Populacija se s 99 % vjerojatnosti nalazi u intervalu od 0,099 do 0,279. Treća hipoteza, Postoji statistički značajan utjecaj ugleda turističke destinacije prisutnog u društvenim medijima na zadovoljstva turista, potvrđuje se. Empirijska veza statistički je značajna na razini p < 0,01 te se opisuje kao je snažna veza (β = 0,585, t = 13,335). Interval procjene populacije nalazi se s 99 % vjerojatnosti u intervalu od 0,471 do 0,651.

J. Mušanović: Modeliranje utjecaja ugleda turističke destinacije prisutnog u društvenim medijima na...Zbornik Veleučilišta u Rijeci, Vol. 8 (2020), No. 1, pp. 77-101
96
Na temelju rezultata istraživanja može se zaključiti kako testirani strukturni model daje slične rezultate testiranja strukturnih odnosa među konceptima (Marchiori et al., 2013), iako se uspoređuju rezultati parametrijske i neparametrijske statistike. Prema pokazateljima valjanosti, navedeni modeli mogu se smatrati valjanima i pouzdanima u mjerenju utjecaja ugleda turističke destinacije prisutnog u društvenim medijima i kao prethodnice zadovoljstva turista elementima turističke ponude. Usporede li se rezultati istraživanja TOMAS ljeto 2017. na primjeru Istarske županije i rezultata istraživanja rada, može se zaključiti da su rezultati pokazali vrlo slične razine zadovoljstva elementima turističke ponude. Turisti u oba istraživanja izrazili vrlo visok i visok stupanj zadovoljstva elementima turističke ponude. Također, usporedba utjecaja ugleda turističke destinacije na zadovoljstvo turista moguća je takozvanim online i offline ugledom turističke destinacije. Recentno istraživanje autora Su et al. (2018) potvrdilo je direktnu, značajnu i jaku vezu ugleda turističke destinacije sa zadovoljstvom turista (0,603).
Unatoč nastojanju da se osigura kvalitetno empirijsko istraživanje, ono ima nekoliko ograničenja koje treba uzeti u obzir pri interpretaciji i generalizaciji rezultata, a odnose se na odabir turističke destinacije, vremensko razdoblje provedenog empirijskog istraživanja, uzorak ispitanika i generalizaciju rezultata. Navedenih ograničenja treba biti svjestan, ali ona ne bi trebala umanjiti značaj dobivenih rezultata i kvalitetu donesenih zaključaka. Štoviše, njihova detaljna elaboracija trebala bi dodatno potkrijepiti prednosti i nedostatke donesenih metodoloških izbora.
Doprinos rada ogleda se u razvoju i povezivanju znanstvene misli koncepta ugleda turističke destinacije na društvenim medijima i zadovoljstva turista. Rezultati istraživanja od koristi su svim dionicima u turizmu koji nastoje zadržati i stvoriti lojalne turiste, privući nove turiste, povećati konkurentnost turističke destinacije. Destinacijska marketing organizacija (DMO) trebala bi se koristiti prednostima društvenih medija za suradnju s destinacijskim menadžmentom, uzimajući u obzir iskustva i napore svih članova zajednice destinacije. Platforme elektroničkog učenja, namijenjene osposobljavanju i obrazovanju interesno-utjecajnim skupinama turizma, trebale bi razmotriti ulaganje u programe obuke koji uzimaju u obzir reputaciju turističke destinacije na društvenim medijima i mrežnim sjedištima, kao ključ saznanja potencijalnih očekivanja turista (klijenata) u svrhu povećanja zadovoljstva turista, prodaje, profitabilnost i konkurentnosti.
LITERATURA
Agyeiwaah, E. et al. (2016) ‘Make a customer, not a sale: Tourist satisfaction in Hong Kong’, Tourism Management. Pergamon, 57, pp. 68–79. doi: 10.1016/J.TOURMAN.2016.05.014.
Akama, J. S., Kieti, D. M. (2003) ‘Measuring tourist satisfaction with Kenya’s wildlife safari: a case study of Tsavo West National Park’, Tourism Management. Pergamon, 24(1), pp. 73–81. doi: 10.1016/S0261-5177(02)00044-4.
Alegre, J., Cladera, M. (2006) ‘Repeat Visitation in Mature Sun and Sand Holiday Destinations’, Journal of Travel Research. Sage PublicationsSage CA: Thousand Oaks, CA, 44(3), pp. 288–297. doi: 10.1177/0047287505279005.
Ammissah, E. F. (2013) ‘Tourist Satisfaction with Hotel Services in Cape Coast and Elmina, Ghana’, American Journal of Tourism Management. Available at: http://article.sapub.org/10.5923.s.tourism.201304.03.html (Accessed: 24 July 2018).

J. Mušanović: Modeliranje utjecaja ugleda turističke destinacije prisutnog u društvenim medijima na...Zbornik Veleučilišta u Rijeci, Vol. 8 (2020), No. 1, pp. 77-101
97
Cacioppo, J. T., Petty, R. E. and Morris, K. J. (1983) ‘Effects of need for cognition on message evaluation, recall, and persuasion.’, Journal of Personality and Social Psychology, 45(4), pp. 805–818. doi: 10.1037/0022-3514.45.4.805.
Cenfetelli, R. T., Bassellier, G. (2009) ‘Interpretation of Formative Measurement in Information Systems Research’, MIS quarerly, 33(4), pp. 689–707.
Chadee, D. D., Mattsson, J. (1996) ‘An Empirical Assessment of Customer Satisfaction in Tourism’, The Service Industries Journal. Frank Cass , 16(3), pp. 305–320. doi: 10.1080/02642069600000030.
Chen, C.-F., Tsai, D. (2007) ‘How destination image and evaluative factors affect behavioral intentions?’, Tourism Management. Pergamon, 28(4), pp. 1115–1122. doi: 10.1016/J.TOURMAN.2006.07.007.
Chen, Y., Zhang, H., Qiu, L. (2013) ‘A Review on Tourist Satisfaction of Tourism Destinations’, in Zhang, R. and Zhang, J. (eds) LISS 2012. Berlin, Heidelberg: Springer Berlin Heidelberg, pp. 593–604. doi: 10.1007/978-3-642-32054-5_83.
Cheung, M. Y. et al. (2009) ‘Credibility of Electronic Word-of-Mouth: Informational and Normative Determinants of On-line Consumer Recommendations’, International Journal of Electronic Commerce, 13(4), pp. 9–38. doi: 10.2753/JEC1086-4415130402.
Christou, E. (2007) Productivity in Tourism: Fundamentals and Concepts for Achieving Growth and competitiveness. Berlin: Erich Schmidt Verlag & Co KG.
Cohen, J. (1988) Statistical power analysis for the Behavioral Sciences. 2nd ed. New York.
Darwish, A., Burns, P. (2019) ‘Tourist destination reputation: an empirical definition’, Tourism Recreation Research. doi: 10.1080/02508281.2018.1558754.
Deutsch, M., Gerard, H. B. (1955) ‘A study of normative and informational social influences upon individual judgment.’, The Journal of Abnormal and Social Psychology, 51(3), pp. 629–636. doi: 10.1037/h0046408.
Díaz, M. R., Rodríguez, T. F. E. (2017) ‘Determining the reliability and validity of online reputation databases for lodging’, Journal of Vacation Marketing. doi: 10.1177/1356766717706103.
Dolphin, R. R. (2004) ‘Corporate reputation – a value creating strategy’, Corporate Governance: The international journal of business in society, 4(3), pp. 77–92. doi: 10.1108/14720700410547521.
Einwiller, S. (2003) Vertrauen durch Reputation im elektronschen Handel. Wiesbaden: Deutscher Universitätsverlag.
Fornell, C., Bookstein, F. L. (1982) ‘Two Structural Equation Models: LISREL and PLS Applied to Consumer Exit-Voice Theory’, Journal of Marketing Research. American Marketing Association, 19(4), pp. 440–452. doi: 10.2307/3151718.
Foster, D. (2000) ‘Measuring customer satisfaction in the tourism industry’, in Third International & Sixth National Research Conference on Quality Management, The Center for Management Quality Research at RMIT University, Australia, pp. 1–9.
Fotis, J., Buhalis, D., Rossides, N. (2012) ‘Social Media Use and Impact during the Holiday Travel Planning Process’, in Fuchs, M., Ricci, F., and Cantoni, L. (eds) Information and Communication Technologies in Tourism 2012. Vienna: Springer Vienna, pp. 13–24.
Golob, Marino, Sirotić, T., Golob, Martin (2014) ‘Istraživanje kvalitete i razine zadovoljstva turista turističkom ponudom’, Zbornik Veleučilišta u Rijeci, 2(1), pp. 27–40.
Haber, S., Lerner, M. (1999) ‘Correlates of Tourist Satisfaction’, Annals of Tourism Research. Pergamon, 26(1), pp. 197–201. doi: 10.1016/S0160-7383(98)00060-7.
Hair, J. F. et al. (2012) ‘The Use of Partial Least Squares Structural Equation Modeling in Strategic Management Research: A Review of Past Practices and Recommendations for Future Applications’, Long Range Planning, 45(5–6), pp. 320–340. doi: 10.1016/j.lrp.2012.09.008.
Hair, J. F. J. et al. (2017) A Primer on Partial Least Squares Structural Equation Modeling (PLS-SEM). Second. Los Angeles: Sage Publications.
Hair, J. F., Ringle, C. M. and Sarstedt, M. (2011) ‘PLS-SEM: Indeed a silver bullet’, Journal of Marketing Theory and Practice, 19(2), pp. 139–151. doi: 10.2753/MTP1069-6679190202.

J. Mušanović: Modeliranje utjecaja ugleda turističke destinacije prisutnog u društvenim medijima na...Zbornik Veleučilišta u Rijeci, Vol. 8 (2020), No. 1, pp. 77-101
98
Hapenciuc, C. V., Condratov, I. (2007) ‘Theoretical framework for quality evaluation of tourism-related websites services’, Economy Informatics, 1(4), pp. 52–58.
Hastak, M., Park, J.-W. (1990) ‘Mediators of Message Sidedness Effects on Cognitive Structure For Involved and Uninvolved Audiences’, Advances in Consumer Research, 17(17), pp. 329–336. Available at: https://www.acrwebsite.org/search/view-conference-proceedings.aspx?Id=9832 (Accessed: 1 May 2018).
Henseler, J., Ringle, C. M., Sinkovics, R. R. (2009) ‘The Use of Partial Least Squares Path Modeling in International Marketing’, New Challenges to International Marketin Advances in International Marketing, 20, pp. 277–319. doi: 10.1108/S1474-7979(2009)0000020014.
Jensen, Ø., Li, Y., Uysal, M. (2017) ‘Visitors’ satisfaction at managed tourist attractions in Northern Norway: Do on-site factors matter?’, Tourism Management, 63, pp. 277–286. doi: 10.1016/j.tourman.2017.06.025.
Kamins, M. A., Marks, L. J. (1988) ‘An Examination into the Effectiveness of Two-Sided Comparative Price Appeals’, Journal of the Academy of Marketing Science. Sage PublicationsSage CA: Thousand Oaks, CA, 16(2), pp. 64–71. doi: 10.1177/009207038801600210.
Kemp, S. (2019) Digital 2019: GLobal Digital Overview, Datareportal. Available at: https://datareportal.com/reports/digital-2019-global-digital-overview .
Kim, S., Mattila, A. S. (2011) ‘An examination of electronic video clips in the context of hotel Websites’, International Journal of Hospitality Management, 30(3), pp. 612–618. doi: https://doi.org/10.1016/j.ijhm.2010.11.005.
Kozak, M. (2001) ‘Comparative assessment of tourist satisfaction with destinations across two nationalities’, Tourism Management. Pergamon, 22(4), pp. 391–401. doi: 10.1016/S0261-5177(00)00064-9.
Kozak, M., Rimmington, M. (2000) ‘Tourist satisfaction with Mallorca, Spain, as an off-season holiday destination’, Journal of Travel Research, 38(3), pp. 260–269. doi: 10.1177/004728750003800308.
Leblanc, G. (1992) ‘Factors Affecting Customer Evaluation of Service Quality in Travel Agencies: An Investigation of Customer Perceptions’, Journal of Travel Research. Sage PublicationsSage CA: Thousand Oaks, CA, 30(4), pp. 10–16. doi: 10.1177/004728759203000402.
LeBlanc, G., Nguyen, N. (1996) ‘Cues used by customers evaluating corporate image in service firms: An empirical study in financial institutions’, International Journal of Service Industry Management, 7(2), pp. 44–56.
Lee, C.-F. (2015) ‘Tourist satisfaction with factory tour experience’, International Journal of Culture, Tourism and Hospitality Research, 9(3), pp. 261–277. doi: 10.1108/IJCTHR-02-2015-0005.
Loureiro, S. M. C., Kastenholz, E. (2011) ‘Corporate reputation, satisfaction, delight, and loyalty towards rural lodging units in Portugal’, International Journal of Hospitality Management. Elsevier Ltd, 30(3), pp. 575–583. doi: 10.1016/j.ijhm.2010.10.007.
Macintosh, G. (2002) ‘Building Trust and Satisfaction in Travel Counselor/Client Relationships’, Journal of Travel & Tourism Marketing. Taylor & Francis Group , 12(4), pp. 59–74. doi: 10.1300/J073v12n04_04.
Marchiori, E. et al. (2010) ‘Towards a tourism destination reputation model. A first step’, in Proceedings of the 6th International Conference - Thought Leaders in Brand Management. Lugano - Switzerland, pp. 921–930.
Marchiori, E., Cantoni, L. (2012) ‘The Online Reputation Construct: Does it Matter for the Tourism Domain? A Literature Review on Destinations’ Online Reputation’, Information Technology & Tourism, 13(3), pp. 139–159. doi: 10.3727/109830512X13283928066715.
Marchiori, E., Cantoni, L., Fesenmaier, D. R. (2013) ‘What did they say about us? Message Cues and Destination Reputation in Social Media’, in Cantoni, L. and Xiang, Z. (eds) Information and Communication Technologies in Tourism 2013. Springer Berlin Heidelberg, pp. 170–182. doi: 10.1007/978-3-642-36309-2.
Marchiori, E., Inversini, A., Cantoni, L. (2011) ‘Classifying online conversations about Tourism Destinations. A tourist perspective.’, in Proceedings of the 7th international conference: Thought leaders in brand management. Lugan - Switzerland, pp. 165–175.

J. Mušanović: Modeliranje utjecaja ugleda turističke destinacije prisutnog u društvenim medijima na...Zbornik Veleučilišta u Rijeci, Vol. 8 (2020), No. 1, pp. 77-101
99
Marinao Artigas, E., Vilches-Montero, S. and Chasco Yrigoyen, C. (2015) ‘Antecedents of tourism destination reputation: The mediating role of familiarity’, Journal of Retailing and Consumer Services, 26, pp. 147–152. doi: 10.1016/j.jretconser.2015.06.005.
Marinao, E., Chasco, C., Torres, E. (2012) ‘Trust in Tourist Destinations. The Role of Local Inhabitants and Institutions Confianza Hacia Los Destinos Turísticos’, Academia, Revista Latinoamericana de Administración, 51, pp. 27–47.
Micera, R., Crispino, R. (2017) ‘Destination web reputation as “smart tool” for image building: the case analysis of Naples city-destination’, International Journal of Tourism Cities, 3(4), pp. 406–423. doi: https://doi.org/10.1108/IJTC-11-2016-0048.
Mingchuan, Z. (2015) ‘The Reputation Crisis at the Tourism Destination: Connotation, Types and Management Strategies’, International Journal of Liberal Arts and Social Science, 3(6), pp. 35–40.
Minghetti, V., Celotto, E. (2015) ‘Destination Web reputation: Combining explicit and implicit popularity to build an integrated monitoring system’, E-review of Tourism Research, 6, pp. 1–5.
Morgan, N., Pritchard, A. and Pride, R. (2011) Destination brands: Managing place reputation. 3rd Editio. Amsterdam: Elsevier.
Nunnally, J. C., Bernstein, I. H. (1994) Psychometic Theory. 3rd Editio. New York: McGRAW-HILL.
Okello, M. M., Yerian, S. (2009) ‘Tourist satisfaction in relation to attractions and implications for conservation in the protected areas of the Northern Circuit, Tanzania’, Journal of Sustainable Tourism. Taylor & Francis Group , 17(5), pp. 605–625. doi: 10.1080/09669580902928450.
Orehovački, T. (2013) Metodologija vrjednovanja kvalitete u korištenju aplikacijama WEB 2.0. Sveučilište u Zagrebu.
Pizam, A., Neumann, Y., Reichel, A. (1978) ‘Dimentions of tourist satisfaction with a destination area’, Annals of Tourism Research. Pergamon, 5(3), pp. 314–322. doi: 10.1016/0160-7383(78)90115-9.
Pruzan, P. (2001) ‘Corporate Reputation Image and Identity’, Corporate Reputation Review, 4(1), pp. 50–51.
Puh, B. (2014) ‘Destination image and Tourism Satisfaction: the Case of Mediterannean Destination’, Mediterannean Journal of Social Sciences, 5(13), pp. 538–544. Available at: https://www.bib.irb.hr/897624 (Accessed: 20 July 2018).
Ringle, C. M. et al. (2009) On the use of formative measurement specifications in structural equation modeling: A Monte Carlo simulation study to compare covariance-based and partial least squares model estimation methodologies, Research Memoranda from Maastricht (METEOR). Available at: https://mpra.ub.uni-muenchen.de/15390/ (Accessed: 20 April 2018).
Ringle, C. M., Sarstedt, M., Straub, D. (2012) ‘A Critical Look at the Use of PLS-SEM in MIS Quarterly’, MIS Qarterly, 36(1), pp. iii–xiv. Available at: https://papers.ssrn.com/sol3/papers.cfm?abstract_id=2176426.
Ryan, C. (1994) Researching Tourist Satisfaction: Issues, Concepts Problem. London: Internationa Thomson Business Press.
Saayman, M. et al. (2018) ‘Tourist satisfaction and subjective well-being: An index approach’, International Journal of Tourism Research. Wiley-Blackwell, 20(3), pp. 388–399. doi: 10.1002/jtr.2190.
Soldić Frleta, D., Smolčić Jurdana, D. (2018) ‘Seasonal variation in urban tourist satisfaction’, Tourism Review. Emerald Publishing Limited. doi: 10.1108/TR-09-2017-0148.
De Souza, S. C., Costa Machado, D. F. (2017) ‘Use and Influence of Social Media on Trip Planning: a quantitative study’, Revista Tourismo em Analise - RTA, 28(2), pp. 254–270.
Spence, M. (1973) ‘Spence 1973.pdf’, The Quarterly Journal of Economics, 87(3), pp. 355–375.
Su, L., Huang, Y., Hsu, M. (2018) ‘Unraveling the impact of destination reputation on place attachment and behavior outcomes among Chinese urban tourists’, Journal of Hospitality and Tourism Insights. Emerald Publishing Limited. doi: 10.1108/JHTI-11-2017-0026.
Swinyard, W. R. (1981) ‘The Interaction between Comparative Advertising and Copy Claim Variation’, Journal of Marketing Research. American Marketing Association, 18(2), pp. 175–186. doi: 10.2307/3150952.

J. Mušanović: Modeliranje utjecaja ugleda turističke destinacije prisutnog u društvenim medijima na...Zbornik Veleučilišta u Rijeci, Vol. 8 (2020), No. 1, pp. 77-101
100
Triantafillidou, A., Petala, Z. (2016) ‘The Role Of Sea-Based Adventure Experiences In Tourists’ Satisfaction and Behavioral Intentions’, Journal of Travel & Tourism Marketing. Routledge, 33(sup1), pp. 67–87. doi: 10.1080/10548408.2015.1008667.
Udit, C., Kalyan, S. S. (2017) ‘Factors Affecting Customers’ Accommodation Satisfaction and Service Quality in the Hotel Industry of Rural West Bengal’, LBS Journal of Management & Research. Diva Enterprises, 15(1), pp. 34–47. Available at: http://www.indianjournals.com/ijor.aspx?target=ijor:lbsjmr&volume=15&issue=1&article=004 (Accessed: 24 July 2018).
UNWTO (2019) International Tourism Highlights, 2019 Edition, International Tourism Highlights, 2019 Edition. World Tourism Organization (UNWTO). doi: 10.18111/9789284421152.
Urška Starc, P. et al. (2019) ‘Tourism 4.0: Challenges in Marketing a Paradigm Shift’, in IntechOpen (ed.) Consumer Behavior and Marketing.
Vengesayi, S. (2003) ‘A conceptual model of tourism destination competitiveness and attractiveness’, in ANZMAC Conference Proceedings Adelaide 1-3 December 2003, pp. 637–647.
Vilares, M. J., Almeida, M. H., Coelho, P. S. (2010) ‘Comparison of likelihood and PLS estimators for structural equation modeling: A simulation with customer satisfaction data’, in Vinzi, V. E. et al. (eds) Handbook of Partial Least Squares. Heidelberg: Springer, pp. 289–305.
We Are Social (2019) Digital 2019: Global Digital Yearbook — DataReportal – Global Digital Insights. Available at: https://datareportal.com/reports/digital-2019-global-digital-yearbook (Accessed: 3 October 2019).
Wu, H.-C., Ko, Y. J. (2013) ‘Assessment of Service Quality in the Hotel Industry’, Journal of Quality Assurance in Hospitality & Tourism. Routledge , 14(3), pp. 218–244. doi: 10.1080/1528008X.2013.802557.
Xiang, Z., Gretzel, U. (2010) ‘Role of social media in online travel information search’, Tourism Management. Elsevier Ltd, 31(2), pp. 179–188. doi: 10.1016/j.tourman.2009.02.016.
Yoon, E., Guffey, H. J. and Kijewski, V. (1993) ‘The effects of information and company reputation on intentions to buy a business service’, Journal of Business Research, 27(3), pp. 215–228. doi: 10.1016/0148-2963(93)90027-M.
Yu, L., Goulden, M. (2006) ‘A comparative analysis of international tourists’ satisfaction in Mongolia’, Tourism Management. Pergamon, 27(6), pp. 1331–1342. doi: 10.1016/J.TOURMAN.2005.06.003.

J. Mušanović: Modeliranje utjecaja ugleda turističke destinacije prisutnog u društvenim medijima na...Zbornik Veleučilišta u Rijeci, Vol. 8 (2020), No. 1, pp. 77-101
101
Original scientific paper https://doi.org/10.31784/zvr.8.1.12 Received: 30. 11. 2019. Accepted: 21. 1. 2020.
MODELING THE IMPACT OF TOURISM DESTINATION REPUTATION PRESENTED BY SOCIAL MEDIA ON THE
TOURIST SATISFACTIONJelena Mušanović
PhD, Postdoctoral Researcher, Faculty of Tourism and Hospitality Management, University of Rijeka, Primorska 42, 51410 Opatija, Croatia. e-mail: [email protected]
ABSTRACTBefore the appearance of user-generated content (UGC), sharing personal travel experiences through social media applications was limited to a narrow circle of friends and family. Today, tourists (social media users) exchange opinions via modern media online and shape the tourism destination reputation, thus affecting the travel decision of potential tourists. The purpose of this study is to examine the tourism destination reputation on social media and its impact on tourist satisfaction. The empirical research was conducted on the western coast of Istria (Croatia), using data from a survey of a sample of 305 tourists who were informed about the tourist destination on social media before traveling to the destination. Partial least squares were used to assess the structural model and impact of tourism destination reputation on social media on tourist satisfaction. The structural model is considered as a valid and reliable instrument for measuring the impact of tourism destination reputation on social media on tourist satisfaction. The results of this study and the proposed conceptual model provide a basis for future research and for the continuous monitoring and improving of the tourism destination reputation on social media and tourist satisfaction with the elements of tourism supply.
Key words: tourism destination reputation, tourist satisfaction, social media, modeling, multivariate statistical analysis
Creative Commons Attribution – NonCommercial 4.0 International License

M. Martinović, K. Vojvodić, A. Pušić: Kulturološki aspekti poslovnog pregovaranja menadžera hrvatskih...Zbornik Veleučilišta u Rijeci, Vol. 8 (2020), No. 1, pp. 103-119
103
Izvorni znanstveni rad https://doi.org/10.31784/zvr.8.1.13 Datum primitka rada: 2. 12. 2019. Datum prihvaćanja rada: 24. 1. 2020.
KULTUROLOŠKI ASPEKTI POSLOVNOG PREGOVARANJA MENADŽERA HRVATSKIH
PODUZEĆAMarija Martinović
Dr. sc., izvanredan profesor, Sveučilište u Dubrovniku, Odjel za ekonomiju i poslovnu ekonomiju, Lapadska obala 7, 20 000 Dubrovnik, Hrvatska; e-mail: [email protected]
Katija Vojvodić Dr. sc., izvanredan profesor, Sveučilište u Dubrovniku, Odjel za ekonomiju i poslovnu ekonomiju,
Lapadska obala 7, 20 000 Dubrovnik, Hrvatska; e-mail: [email protected]
Ana Pušić Mag. oec., asistent, Sveučilište u Dubrovniku, Odjel za ekonomiju i poslovnu ekonomiju, Lapadska obala 7,
20 000 Dubrovnik, Hrvatska; e-mail: [email protected]
SAŽETAKU kontekstu poslovnog pregovaranja od presudne je važnosti razumijevanje razlika među kulturama i njihovog utjecaja na pregovarački proces i ishode pregovaranja. Štoviše, kulturološka osviještenost omogućuje pregovaračima anticipiranje i tumačenje ponašanja suprotne pregovaračke strane te olakšava postizanje željenih ciljeva i unapređuje rezultate pregovaranja. Cilj je ovoga rada bio istražiti utjecaj odabranih obilježja hrvatskih pregovarača (dob, pozicija u poduzeću i učestalost pregovaranja) na kulturološke aspekte pregovaranja (tituliranje, neverbalnu komunikaciju i iskazivanje emocija). Istraživanje je provedeno na uzorku od 256 poduzeća u Republici Hrvatskoj. Rezultati istraživanja ukazali su na postojanje pozitivne korelacije između sljedećih varijabli: iskazivanje emocija i učestalost pregovaranja, dob i tituliranje te učestalost pregovaranja i neverbalna komunikacija. Multilinearna hijerarhijska regresija dala je detaljniji uvid u odnos među varijablama. Beta koeficijent ukazao je na statistički značajnu ovisnost iskazivanja emocija i neverbalne komunikacije o prediktoru učestalost pregovaranja te tituliranja o prediktoru dob. Rad pruža uvid u hrvatsku pregovaračku praksu i može poslužiti kao polazište za provođenje budućih empirijskih istraživanja.
Ključne riječi: poslovno pregovaranje, hrvatski menadžeri, kulturološki aspekti
Creative Commons Attribution – NonCommercial 4.0 International License

M. Martinović, K. Vojvodić, A. Pušić: Kulturološki aspekti poslovnog pregovaranja menadžera hrvatskih...Zbornik Veleučilišta u Rijeci, Vol. 8 (2020), No. 1, pp. 103-119
104
1. UVOD
Pregovaranje se, općenito, može promatrati kao proces davanja i uzimanja, tj. razmjena informacija i ustupaka na koju su pregovaračke strane spremne pristati. U suvremenim uvjetima poslovanja, pregovaranje predstavlja dinamičan proces tijekom kojeg se istodobno upravlja njegovim integralnim, ali nerijetko različitim dimenzijama (Age, Eklinder-Frick, 2017). Taj dinamični proces ujedno pretpostavlja i sustavno upravljanje odnosima unutar kojih se odvija pregovaranje (Lewthwaite, 2006). Osim što se smatra jednom od najvažnijih vještina suvremenih menadžera, uz pregovaranje se, osim znanosti, često vezuje i riječ umjetnost. Time se povezuje i prožima međudjelovanje pregovaračkih strana na koje utječu dimenzije poput kulture, stalno mijenjajućih okolnosti, očekivanja i sposobnosti (Gates, 2012). Iz tih je razloga razvidno kako pregovarački proces zahtijeva prilagodbu i predanost pregovarača (Oliver, 2011), ali i njegovu odgovornost (Lempereur, 2012). Navedena obilježja utječu na razvijanje pregovaračkih vještina te ih čine iznimno zahtjevnim, složenim i izazovnim zadatkom. Ne iznenađuje, stoga, što se iskusni i vješti pregovarači smatraju važnom imovinom koja pridonosi financijskim rezultatima poduzeća (ElShenawy, 2010).
Autori Uher i Loosemore (2004) poslovno pregovaranje poistovjećuju s „igrom strategija“. Strateško planiranje u procesu pregovaranja uvelike olakšava donošenje taktičkih odluka koje vode postizanju konačnog cilja (Frascogna, Hetherington, 2001), a uporaba unaprijed određenih strategija i taktika povećava vjerojatnost uspješnog ishoda cjelokupnog pregovaračkog procesa (Hoechlin, 2018). Dinamičnost pregovaračkog procesa podrazumijeva i kontinuiranu prilagodbu, tj. uvođenje različitih strategija u pregovarački proces (Olekalns, Weingart, 2008). Izmjena strategija tijekom pregovaranja, uvođenje novih ili odustajanje od već primijenjenih strategija mogu pridonijeti anticipiranju poteza suprotne strane, ali i učinkovitijem odgovoru na zahtjeve suprotne strane. Međutim, specifičnost i jedinstvenost svakog pregovaračkog procesa ujedno ograničava definiranje strategija koje bi se mogle okarakterizirati kao zajedničke ili opće za svaki takav proces. Štoviše, Korobkin (2014) naglašava da je pregovaranje aktivnost koja je previše ovisna o kontekstu što uvjetuje nepostojanje skupa taktika koje bi mogle biti univerzalno učinkovite.
Iako se posljednjih pedesetak godina velika pozornost posvećuje pregovaranju, posebice u kontekstu organizacijskog ponašanja i znanosti o menadžmentu (Brett, Thompson, 2016), u suvremenom, turbulentnom i stalno mijenjajućem poslovnom okruženju sve se veći naglasak stavlja na dimenzije koje su njegov sastavni dio. One se ponajprije odnose na rizik, neizvjesnost, promjene, konflikte, psihološke procese i kulturološku osviještenost te na ulogu informacijsko-komunikacijskih tehnologija u cjelokupnom procesu. Stoga, Saorin-Iborra, Redondo‐Cano, Revuelto‐Taboada (2013) ističu kako je upravo razumijevanje utjecaja pregovaračkog konteksta na ponašanje pregovarača presudno za predviđanje reakcija i poteza suprotne strane te postizanje najpovoljnijeg sporazuma. Uravnoteženost razmišljanja pregovarača i usredotočenost na razumijevanje interesa i prioriteta suprotne pregovaračke strane važne su pregovaračke vrline koje mogu pridonijeti pozitivnom pregovaračkom ozračju i konačnom ishodu pregovaranja. U tom smislu, Gates (2012) tvrdi da je učenje o pregovaranju ujedno i vrsta vježbe samosvijesti koja pregovaračima omogućuje da se izbore s pritiscima, dvojbama i stresom tijekom pregovaračkog procesa.

M. Martinović, K. Vojvodić, A. Pušić: Kulturološki aspekti poslovnog pregovaranja menadžera hrvatskih...Zbornik Veleučilišta u Rijeci, Vol. 8 (2020), No. 1, pp. 103-119
105
Cilj je ovoga rada istražiti utjecaj odabranih obilježja hrvatskih pregovarača na stil pregovaranja koji proizlazi iz organizacijske kulture njihovih poduzeća. Polazna pretpostavka je da odabrana obilježja pregovarača (dob, pozicija u poduzeću te učestalost pregovaranja) imaju utjecaj na kulturološku stranu pregovaračkog procesa. U okviru „meke“ strane pregovaranja istražuju se tri varijable - iskazivanje emocija, tituliranje te neverbalna komunikacija. Nakon uvodnog dijela, u drugom se dijelu daje pregled literature vezan za odabrane kulturološke aspekte poslovnog pregovaranja kao i pregled dosadašnjih istraživanja poslovnog pregovaranja u Republici Hrvatskoj. U trećem dijelu predstavljena je metodologija istraživanja, dok se u četvrtom dijelu razmatraju rezultati istraživanja. Konačno, rad je zaokružen zaključnim razmatranjima u kojima su istaknuta ograničenja istraživanja kao i preporuke za daljnja istraživanja i produbljivanja ove tematike.
2. PREGLED LITERATURE
2. 1 Utjecaj kulturoloških obilježja na pregovarački proces
Utjecaj kulture na poslovno pregovaranje moguće je promatrati iz perspektive različitih klasifikacija. Suvremeno poslovanje i pregovaranje u globalnom okruženju zahtijevaju od pregovarača dublje razumijevanje kulturoloških razlika i načina na koji se te razlike odražavaju na interese i primijenjene strategije u pregovaračkom procesu (Brett, 2017). Osim toga, Sobral, Carvalhal, Almeida (2008) ističu da uspješni međukulturalni pregovori zahtijevaju i razumijevanje pregovaračkog stila druge strane te prihvaćanje i poštivanje njezinih kulturnih uvjerenja i normi. Slično tome, Brett i Mitchell (2019) naglašavaju kulturološku osviještenost pregovarača u kontekstu razumijevanja i poštivanja ponašanja druge pregovaračke strane. Različite kulturološke dimenzije mogu izravno utjecati na ishode pregovaranja (Thomas, 2008), ali i na mnoge aspekte pregovaračevih pretpostavki i strategija koje koristi tijekom pregovaranja (Gunia, Brett, Gelfand, 2016).
S tim u vezi, Acuff (2008) ističe četiri kulturološka činitelja koja utječu na pregovaranje među različitim kulturama, a odnose se na percepciju vremena, individualizam/kolektivizam, uređenost uloga i obrasce komunikacije. S obzirom na vremensku dimenziju, Carnevale (2019) naglašava da vrijeme može utjecati na mnoge aspekte pregovaranja, od osnovnih pregovaračkih procesa i ishoda, odabira taktika, emocionalnih procesa, spoznaje i motivacije. Nadalje, Salacuse (1998) identificira deset kulturoloških razlika u procesu pregovaranja koje se odnose na cilj pregovaranja, pregovarački stav, osobni stil pregovarača, komunikaciju, vremensku dimenziju pregovaranja, emocije u pregovaranju, oblik ugovora, usuglašavanje oko elemenata ugovora, organizaciju pregovaračke skupine i preuzimanje rizika. Iako su brojne kulturološke dimenzije koje mogu utjecati na pregovarački proces, u nastavku se daje osvrt na osobni stil pregovarača, neverbalnu komunikaciju i ulogu emocionalnih stanja u kontekstu pregovaranja.
Svaki pregovarač ima svoj osobni stil koji je pod izravnim utjecajem kulture iz koje pregovarač dolazi te postaje sastavni dijelom pregovaračkog procesa. Osobni stilovi pregovarača izravno utječu na način njegova komuniciranja, pregovarački proces i ishode pregovaranja (Wang, 2018), ali i na rješavanje konflikata (Dwyer, Hopwood, 2019). Osobni stil pregovarača može biti formalan i neformalan. Kad se govori o formalnom stilu do izražaja dolazi formalnost s obzirom na način komunikacije, tj. korištenje pripadajuće titule u međusobnom obraćanju (npr. gospodine, doktore,

M. Martinović, K. Vojvodić, A. Pušić: Kulturološki aspekti poslovnog pregovaranja menadžera hrvatskih...Zbornik Veleučilišta u Rijeci, Vol. 8 (2020), No. 1, pp. 103-119
106
profesore, i sl.), izbjegavanje razgovora o privatnom ili obiteljskom životu sugovornika i inzistiranje na poslovnim temama. Njemački pregovarači tipičan su primjer formalnog stila. S druge strane, američki pregovarači imaju neformalan osobni stil uz koji se vezuje ležerniji stil odijevanja, komunikacija sa sugovornikom u kojoj se ne koristi tituliranje, nego se osobu oslovljava imenom te se nastoji brzo razviti prijateljski odnos sa suprotnom pregovaračkom stranom. Ukratko, neformalni pregovarači nastoje stvoriti ležerno i ugodno okruženje (Khan, Ebner, 2019).
Općeprihvaćena je tvrdnja da je razumijevanje neverbalne komunikacije od ključne važnosti za međukulturalne pregovore. Uz verbalnu komunikaciju, i neverbalna komunikacija utječe na primatelja poruke. Pojednostavljeno rečeno, neverbalna komunikacija odnosi se na komuniciranje bez uporabe riječi. Drugim riječima, pod neverbalnom komunikacijom podrazumijeva se sve što sudjeluje u razgovoru, a nije govor (Tomašević Lišanin, Kadić-Maglajlić, Drašković, 2019). Prema Hendon, Hendon, Herbig (1996), neverbalno ponašanje je svaki oblik namjernog ili nenamjernog ponašanja koji primatelj poruke interpretira određenim značenjem. Neverbalno ponašanje ima različita značenja za ljude koji pripadaju različitim kulturama i nerijetko je glavni razlog nerazumijevanja i sukoba. Neverbalna komunikacija uključuje izraz lica, kontakt očima, geste, pokrete tijela, držanje, fizički izgled i dodir. Često se naziva i „tihim jezikom“ koji se formalno ne uči, ali koji je postojao i prije nego je jezik nastao (Calero, 2005).
Poseban je oprez potreban pri tumačenju i razumijevanju neverbalnih znakova koje je potrebno razmatrati u širem kontekstu, uzimajući u obzir verbalni sadržaj i njegovo okruženje. U kroskulturnoj komunikaciji pregovarači moraju posebnu pozornost posvetiti neverbalnim znakovima kako bi bili primjereni kulturi s kojom se pregovara (Hurn, Tomalin, 2013). U kontekstu neverbalne komunikacije emocija, Tracy, Randles, Steckler (2015) ističu da izražavanje emocija igraju ključnu ulogu u vođenju društvene interakcije i ponašanja. Također, naglašavaju da je izražavanje emocija oblik prilagodljivog komunikacijskog signala koji ima veliki utjecaj na svakodnevnu društvenu komunikaciju.
Bitno je razumjeti ulogu emocionalnih stanja u kontekstu pregovaranja i njihovog utjecaja na tijek pregovaračkog procesa. Tako Barry, Fulmer, Goates (2006) ističu da pozitivni osjećaji povećavaju očekivanja, suradničku pregovaračku klimu i zajedničke koristi od pregovaranja. Pregovarači bi trebali biti svjesni svojih sposobnosti kontroliranja emocija tijekom pregovaranja. Općenito, kontroliranje emocija omogućuje pregovaraču da ih koristi kao svoju prednost (Carrell, Heavrin, 2004). Butt i Choi (2010) tvrde da jačina i priroda odnosa između emocija i ponašanja pregovarača ovise o snazi pregovarača. Osim toga, mnogi pregovarači strahuju da će pregovori u jednom trenutku postati emocionalni i, slijedom toga, previše osobni (Pinkley, Northcraft, 2014). Treba istaknuti da dinamičan tijek pregovora koji ne prate očekivani rezultati može uvelike utjecati na emocionalna stanja pregovaračkih strana i poteze na koje se odlučuju pod takvim utjecajem.
Poznato je da kako emocionalni intenzitet raste, ljudi postaju skloniji donositi neracionalne, emocionalno uvjetovane odluke (Warner, 2011). S tim u vezi, autori Jäger, Loschelder, Friese (2015) navode samoregulaciju kao jedan od moćnih alata za savladavanje izazova s kojima se suočavaju pregovarači. Sposobnost upravljanja i kontrole nad vlastitim ponašanjem i mislima te njihova prilagodba u skladu sa zahtjevima situacije daju pregovaraču prednost za pregovaračkim

M. Martinović, K. Vojvodić, A. Pušić: Kulturološki aspekti poslovnog pregovaranja menadžera hrvatskih...Zbornik Veleučilišta u Rijeci, Vol. 8 (2020), No. 1, pp. 103-119
107
stolom. Posljedično, važnost i uspješnost upravljanja tim emocionalnim procesima prepoznaje se i odražava kroz rješavanje sukoba. Wang, Han, Su (2017) naglašavaju važnost razumijevanja utjecaja emocija na oblikovanje razvoja i rješavanja sukoba, a Posthuma (2012) posebice ukazuje na potrebu razumijevanja emocija kako bi se lakše i učinkovitije upravljalo sukobima. S druge strane, nepoznavanje međukulturnih razlika u stilovima rješavanja sukoba može rezultirati frustracijom zbog ponašanja druge pregovaračke strane (Blume, 2017).
2. 2 Pregled istraživanja poslovnog pregovaranja u Republici Hrvatskoj
Istraživanja praktičnih aspekata pregovaranja u Republici Hrvatskoj uglavnom se razvijaju u dva smjera te se pri tome oslanjaju na Hofstedeov široko rasprostranjeni model kulturalnih razlika ili se orijentiraju na pojedinačne elemente poslovnog pregovaranja u različitim kontekstima. Prva skupina istraživanja, koja se oslanja na Hofstedeov model kulturalnih razlika, uzima u obzir šest dimenzija putem kojih kultura utječe na poslovanje (udaljenost moći, izbjegavanje neizvjesnosti, individualizam/kolektivizam, muževnost/maskulinitet i ženstvenost/feminitet društva, kratkoročna/dugoročna vremenska orijentacija te uživanje). Oslanjajući se na Hofstedeov koncept dimenzija nacionalne kulture, Lažnjak (2011) bavila se problematikom dimenzije nacionalne inovacijske kulture u Hrvatskoj. Rezultati studije inovacijske kulture pokazali su da Hrvatska ima nisku razinu inovativnosti te, posljedično, nizak stupanj dugoročne orijentacije i visok stupanj izbjegavanja nesigurnosti. Također, stupanj udaljenosti moći bio je relativno visok, dok je razina individualnosti bila niska sugerirajući prevladavajuće kolektivističke vrijednosti. Niski indeks muževnosti upućivao je na to da se Hrvatska kreće prema umjereno ženskom tipu društva.
Hofstedeov koncept dimenzija nacionalne kulture bio je temelj istraživanja kojeg su proveli Podrug, Filipović i Stančić (2014), a analizirale su se kulturne razlike između Hrvatske, Brazila, Njemačke i Srbije. Pokazalo se da se, u usporedbi s originalnim Hofstedovim istraživanjem, indeks udaljenosti moći u Hrvatskoj smanjio, dok nije bilo većeg pomaka u vidu manjeg stupnja izbjegavanja nesigurnosti. Hrvatska je pokazala tendencije transformacije u individualističko društvo, a od sve četiri promatrane zemlje Hrvatska se pokazala kao zemlja s najizraženijom kratkoročnom orijentacijom. U jednom od skorašnjih istraživanja, Rajh, Budak i Anić (2016) primijenili su Hofstedeov upitnik nacionalne kulture u Hrvatskoj i ispitivali regionalne razlike u stavovima hrvatskih građana o dimenzijama nacionalne kulture. Na temelju ankete velikog uzorka građana u Hrvatskoj, rezultati su pokazali da hrvatsku nacionalnu kulturu obilježava niža razina udaljenosti moći, umjereno viša razina individualizma, niska razina maskuliniteta i niža razina dugoročne orijentacije, što su sve obilježja razvijenih zemalja. Indeks izbjegavanja nesigurnosti pokazao se visokim, što je obilježje post-tranzicijskih zemalja.
Istraživanje kulturoloških razlika koje utječu na stilove odlučivanja proveli su Dabić, Podrug i Tipurić (2015) uspoređujući četiri države – Hrvatsku, Sloveniju, Bosnu i Hercegovinu i Mađarsku. U usporedbi s originalnim Hofstedovim istraživanjem, istaknuto je smanjenje indeksa udaljenosti moći i izbjegavanja nesigurnosti i rizika te sve izraženija individualistička orijentacija. Međutim, ističu još uvijek razvidnu dominaciju „muških“ vrijednosti u kulturi, tj. naglasak na asertivnosti, konkurentnosti, uspjehu, dostignućima i izazovima, a manje na „ženskim“ vrijednostima - suradnji, kvaliteti života i brizi za druge. U procesu odlučivanja Hrvati su vrlo oprezni, nastoje prikupiti sve

M. Martinović, K. Vojvodić, A. Pušić: Kulturološki aspekti poslovnog pregovaranja menadžera hrvatskih...Zbornik Veleučilišta u Rijeci, Vol. 8 (2020), No. 1, pp. 103-119
108
raspoložive informacije, razmotriti različite opcije i uzeti u obzir sve moguće posljedice koje odluke mogu prouzročiti.
Istraživanje temeljeno na komparativnoj analizi stilova upravljanja konfliktima između Hrvatske i SAD-a provele su Podrug i Gauta (2013). Utvrđeno je da se u hrvatskim poduzećima konflikti rješavaju kompromisom i međusobnom prilagodbom. Argumentirajući postupnu transformaciju Hrvatske u individualističko društvo, ističu kako su kompromisno rješavanje konflikata i suradnja između zaposlenika i nadređenih bitna obilježja individualističkih društava. Međutim, navode i da se nacionalna kultura ne može primjenjivati za svakog pojedinca te da unutar individualističke kulture može biti prisutna i kolektivistička orijentacija.
Druga skupina istraživanja odnosi se uglavnom na empirijska istraživanja pojedinih elemenata poslovnog pregovaranja u različitim kontekstima. Tako su Križman Pavlović i Kalanj (2008) istraživali ulogu koja se pridaje poslovnom pregovaranju kao jednom od izvora konkurentske prednosti u hrvatskim poduzećima. Rezultati njihova istraživanja pokazali su da je u hrvatskim poduzećima uvelike prisutna svijest o tome da sposobnost poslovnog pregovaranja predstavlja značajan izvor konkurentske prednosti, ali da ta svijest nije dostatno operacionalizirana. Dvije trećine hrvatskih poduzeća izjasnilo se da je sposobnost poslovnog pregovaranja značajni izvor konkurentske prednosti, iako je samo 40 % ispitanih poduzeća redovito ulagalo u razvijanje pregovaračke sposobnosti svojih zaposlenika. Nadalje, važnost pregovaranja kao sastavnog dijela prodajnog procesa razmatrali su autori Perkov, Primorac i Kozina (2016). Rezultati njihova istraživanja ukazuju na nedostatak svijesti zaposlenika o važnosti pripreme prije početka pregovora o prodaji. Osim neodgovarajuće pripreme za pregovarački proces, uočeno je i nedostatno poboljšavanje pregovaračkih vještina. S tim u vezi, Tomašević Lišanin (2004) je isticala da se edukacija o pregovaranju rijetko provodila u hrvatskim poduzećima. Razlozi koji su se često navodili odnosili su se na nedostatna financijska sredstva ili nerazumijevanje viših upravljačkih razina.
Autorice Tomašević Lišanin, Razum i Marić (2015) analizirale su vještine i pregovaračko ponašanje hrvatskih poduzetnika, a za obilježja koja određuju razinu pregovaračkih sposobnosti razmatrane su kognitivna, socijalna i emocionalna inteligencija. Cilj je bio istražiti razinu samosvijesti i samopoštovanja poduzetnika u pregovaračkim situacijama kako bi se otkrile moguće razlike u odnosu na razinu njihovih vještina. Istraživanje je pokazalo da hrvatski poduzetnici nemaju dostatno razvijenu emocionalnu i socijalnu inteligenciju u kontekstu pregovaračkog procesa, ali istodobno sebe smatraju uspješnim pregovaračima s razvijenim pregovaračkim vještinama. Za razliku od američke kulture koja je vrlo neformalna s obzirom na način komunikacije, uvažavanje starijih osoba i stečenih akademskih titula, Tomašević Lišanin, Kadić-Maglajlić i Drašković (2019) ističu da je Hrvatska, poput većina europskih zemalja vrlo formalna pa se nekorištenje pripadajuće titule u međusobnom obraćanju smatra nedostatkom uvažavanja ili čak i uvredljivim.
Na temelju prethodno istaknutih istraživanja razvidna je nedostatna zastupljenost problematike poslovnog pregovaranja, praktičnih aspekata pregovaranja u Hrvatskoj kao i rezultata empirijskih istraživanja. Empirijski podaci o hrvatskoj poslovnoj praksi i pregovaračkom ponašanju hrvatskih poslovnih ljudi još su uvijek nedovoljno istraženi kako bi omogućili donošenje zaključaka na nacionalnoj razini.

M. Martinović, K. Vojvodić, A. Pušić: Kulturološki aspekti poslovnog pregovaranja menadžera hrvatskih...Zbornik Veleučilišta u Rijeci, Vol. 8 (2020), No. 1, pp. 103-119
109
3. METODOLOGIJA ISTRAŽIVANJA
Za potrebe ovog rada provedeno je anketno istraživanje na uzorku menadžera hrvatskih poduzeća od ožujka do lipnja 2017. Baza za odabir poduzeća bio je registar poduzeća Hrvatske gospodarske komore. Ankete su slane ispitanicima elektroničkom poštom. Prije provođenja glavnog istraživanja, provedeno je preliminarno istraživanje kako bi se utvrdila pravilna strukturiranost upitnika. Cilj je rada bio ispitati utjecaj obilježja menadžera kao pregovarača na kulturološke aspekte komuniciranja (slika 1), a anketa je kreirana temeljem pregleda relevantne literature (Hendon, Hendon, Herbig, 1996; Salacuse, 1998; Katz, 2006; Kopelman, Rosette, Thompson, 2006; Katz, 2008; Kopelman, Rosette, 2008). Predloženi model sastoji se od ukupno šest varijabli. Varijable dob, radna pozicija i učestalost pregovaranja predstavljaju obilježja pregovarača, dok se kulturološki aspekti analiziraju kroz varijable iskazivanje emocija, tituliranje i neverbalna komunikacija.
Slika 1. Predloženi model
Izvor: autori
U tablici 1 prikazane su promatrane varijable s pripadajućim načinom mjerenja. Mjerne skale kreirane su na temelju rezultata i sugestija iz preliminarnog istraživanja. Prve tri varijable su zavisne. Iskazivanje emocija mjerilo se stupnjem suzdržanosti od iskazivanja emocija u rasponu od „u potpunosti suzdržan“ do „u potpunosti iskazujem emocije“. Varijabla tituliranje mjerila se iskazivanjem stava menadžera koliko im je važno oslovljavanje sugovornika njegovim punim naslovom u rasponu od „potpuno nevažno“ do „vrlo važno“. Za varijablu neverbalna komunikacija tražilo se od ispitanika da usporede važnost neverbalne i verbalne komunikacije. Raspon odgovora bio je od „potpuno nevažna“ do vrlo važna“. Sljedeće tri varijable - dob, radna pozicija i učestalost pregovaranja su nezavisne varijable, odnosno prediktori. Varijabla dob odnosi se na godine starosti ispitanika podijeljene u pet razreda. Druga nezavisna varijabla je radna pozicija gdje su se ispitanici trebali opredijeliti za jedan od dva položaja na hijerarhijskoj ljestvici u svom poduzeću: srednja i najviša razina menadžmenta. Naposljetku, varijabla učestalost pregovaranja ukazuje na iskustvo pregovarača, odnosno pokazuju je li pregovaranje rutinska ili tek sporedna aktivnost. Za to su pitanje ispitanici mogli birati između tri odgovora: nikad ili rijetko, ponekad i redovito.

M. Martinović, K. Vojvodić, A. Pušić: Kulturološki aspekti poslovnog pregovaranja menadžera hrvatskih...Zbornik Veleučilišta u Rijeci, Vol. 8 (2020), No. 1, pp. 103-119
110
Tablica 1. Pregled varijabli
Varijable Mjere
Iskazivanje emocija
U potpunosti suzdržan Umjereno suzdržan
Suzdržan samo u početku pregovora U potpunosti iskazujem emocije
Tituliranje
Potpuno nevažno Djelomično nevažno
Djelomično važno Vrlo važno
Neverbalna komunikacijaPotpuno nevažna
Jednako važna kao verbalna Vrlo važna
Dob
25-34 35-44 45-54 55-64
65 i više
Radna pozicijaMenadžer srednje razine Menadžer najviše razine
Učestalost pregovaranjaNikada/rijetko
Ponekad Redovito
Izvor: autori
Analiza podataka dobivenih anketnim istraživanjem provela se u tri koraka. U prvom koraku izložili su se osnovni podaci o uzorku, deskriptivna statistika, test normalnosti distribucije te karakteristike uzorka (frekvencije). U drugom koraku ispitalo se postojanje statistički značajne povezanosti između zavisnih i nezavisnih varijabli. Naposljetku, u trećem koraku primijenila se metoda multilinearne hijerarhijske regresije kako bi se ispitao pojedinačni doprinos svakog prediktora u objašnjavanju varijance zavisnih varijabli. Ukupno je poslano 1 110 anketnih upitnika, a vraćeno ih je 256 valjano popunjenih, što čini stopu povrata od 23 %.
4. REZULTATI ISTRAŽIVANJA
Rezultati dobiveni istraživanjem obrađeni su koristeći statistički program SPSS 20.0. Tablica 2 prikazuje deskriptivnu statistiku promatranih varijabli uključujući aritmetičku sredinu, standardnu devijaciju te koeficijente asimetrije i zaobljenosti.

M. Martinović, K. Vojvodić, A. Pušić: Kulturološki aspekti poslovnog pregovaranja menadžera hrvatskih...Zbornik Veleučilišta u Rijeci, Vol. 8 (2020), No. 1, pp. 103-119
111
Tablica 2. Deskriptivna statistika
VarijableAritmetička
sredinaStandardna
devijacijaKoeficijent asimetrije
Koeficijent zaobljenosti
Iskazivanje emocija 2,285 0,8904 0,213 –0,690
Tituliranje 2,637 1,0004 –0,334 –0,937
Neverbalna komunikacija 2,035 0,5265 0,042 0,636
Dob 1,637 0,4819 –0,572 –1,686
Radna pozicija 2,613 0,5556 –1,080 0,172
Učestalost pregovaranja 2,285 0,8904 0,213 –0,690Izvor: izračun autora
Koeficijenti asimetrije i zaobljenosti ukazuju na stupanj normalnosti distribucije promatranih varijabli. Uvriježene granice tolerancije za koeficijent asimetričnosti su od –1 do 1, a za koeficijent zaobljenosti od –2 do 2 (Hair et al., 2016: 54). Može se zaključiti da se sve varijable nalaze u prihvatljivim granicama simetrije i zaobljenosti.
Frekvencije varijabli prikazane su u tablici 3. Najveći dio ispitanih menadžera umjereno je suzdržan u iskazivanju emocija prilikom poslovnog pregovaranja (41 %), a skoro 30 % njih suzdržano je tek na početku pregovaranja. Preostalih 30 % nalazi se u krajnostima. Petina je potpuno suzdržana od pokazivanja bilo kakvih emocija, a tek malo više od 9 % menadžera priznaje da uopće ne skriva emocije prilikom poslovnog pregovaranja.

M. Martinović, K. Vojvodić, A. Pušić: Kulturološki aspekti poslovnog pregovaranja menadžera hrvatskih...Zbornik Veleučilišta u Rijeci, Vol. 8 (2020), No. 1, pp. 103-119
112
Tablica 3. Frekvencije odabranog uzorka menadžera
Varijable Frekvencija Udjel (%)
Iskazivanje emocija U potpunosti suzdržan Umjereno suzdržan Suzdržan samo u početku pregovora U potpunosti iskazujem emocije
51 105 76 24
19,9 41,0 29,7 9,4
Tituliranje Potpuno nevažno Djelomično nevažno Djelomično važno Vrlo važno
47 50
108 51
18,4 19,5 42,2 19,9
Neverbalna komunikacija Potpuno nevažna Jednako važna kao verbalna Vrlo važna
31 185 40
12,1 72,3 15,6
Dob 25-34 35-44 45-54 55-64 65 i više
70 82 64 36 4
27,3 32,0 25,0 14,1 1,6
Radna pozicija Menadžer srednje razine Menadžer najviše razine
93 163
36,3 63,7
Učestalost pregovaranja Nikada/rijetko Ponekad Redovito
9 81
166
3,5 31,6 64,8
Izvor: izračun autora
Tituliranje sugovornika je tek djelomično važno za većinu ispitanika (42 %). Ostali ispitanici su se gotovo podjednako rasporedili na ostale ponuđene odgovore (18,4 – 19,9 %). Najviše iznenađuje podatak da je razumijevanje i tumačenje govora tijela sugovornika prioritet za samo 15,6 % ispitanika posebice zato što u uzorku prevladavaju menadžeri najviše razine (63,7 %) i menadžeri koji redovito pregovaraju (64,8 %). Detaljnijom analizom utvrdilo se da od ukupno 256 menadžera njih 113, odnosno 44 % pripada najvišoj razini i redovito pregovara, stoga je rezultat 15,6 % niži od očekivanog. Ipak, za većinu je menadžera (72,3 %) neverbalna komunikacija jednako važna kao i verbalna. Menadžeri u ovom uzorku pripadaju mladim dobnim skupinama s obzirom na to da ih je

M. Martinović, K. Vojvodić, A. Pušić: Kulturološki aspekti poslovnog pregovaranja menadžera hrvatskih...Zbornik Veleučilišta u Rijeci, Vol. 8 (2020), No. 1, pp. 103-119
113
gotovo polovica mlađa od 45 godina. Tablica 4 daje odgovor na pitanje postoji li statistički značajna povezanost između zavisnih i nezavisnih varijabli.
Tablica 4. Koeficijenti korelacije
Iskazivanje emocija TituliranjeNeverbalna
komunikacija
Dob 0,049 0,282* –0,089
Radna pozicija –0,159* –0,080 –0,011
Učestalost pregovaranja 0,229* 0,028 0,206**p< 0,05.
Izvor: izračun autora
Vrijednosti koeficijenata korelacije ukazuju na statistički značajnu povezanost među nekim prikazanim varijablama. Rezultati statističke obrade podataka potvrđuju da menadžeri najviše razine nastoje prikriti emocije tijekom poslovnog pregovaranja. S druge strane, menadžeri nižih razina slobodniji su u iskazivanju emocija. Učestalost pregovaranja pozitivno je povezana s iskazivanjem emocija. To posebice vrijedi u slučaju kada se redovito pregovara s istim osobama jer su tada pregovarači opušteniji i skloniji iskazivanju osjećaja. Također, razvidna je pozitivna korelacija između varijabli dob i tituliranje. Slijedom toga, može se zaključiti kako stariji menadžeri više drže do formalnosti u ophođenju s poslovnim partnerima. Nasuprot tome, mlađi se pregovarači brže okreću manje formalnom obliku komunikacije. Naposljetku, utvrđena je pozitivna veza između varijabli učestalost pregovaranja i neverbalne komunikacije. To je i sasvim logično jer se tumačenje znakova tijela može smatrati vještinom koja se razvija s iskustvom. Pregovarač početnik zasigurno će svu pažnju usmjeriti na verbalnu komunikaciju. Tek kad verbalna komunikacija postane rutinska, može početi pridavati pozornost neverbalnim oblicima komunikacije.
Sljedeća faza u analizi podataka bila je utvrđivanje koliko varijance zavisne varijable objašnjava pojedina nezavisna varijabla. U tu je svrhu izrađena multilinearna hijerarhijska regresija za svaku zavisnu varijablu (tablica 5). To je vrsta linearne regresije gdje se u model postupno uvodi jedan po jedan prediktor kako bi se utvrdio specifičan doprinos svakog prediktora (ΔR2) na objašnjenje varijance zavisne varijable. Najprije je u regresijsku analizu uvršten prediktor dob (model 1), zatim radna pozicija (model 2) i na kraju učestalost pregovaranja (model 3).

M. Martinović, K. Vojvodić, A. Pušić: Kulturološki aspekti poslovnog pregovaranja menadžera hrvatskih...Zbornik Veleučilišta u Rijeci, Vol. 8 (2020), No. 1, pp. 103-119
114
Tablica 5. Rezultati multilinearne hijerarhijske regresije
Zavisne varijable Model 1 Model 2 Model 3
Iskazivanje emocija
R2 0,002 0,006 0,024
ΔR2 0,002 0,004 0,018
ΔF 0,600 1,019 4,554
Sig. 0,439 0,314 0,034
Tituliranje
R2 0,027 0,034 0,035
ΔR2 0,027 0,007 0,001
ΔF 1,722 1,913 0,211
Sig. 0,041 0,168 0,646
Neverbalna komunikacija
R2 0,008 0,010 0,026
ΔR2 0,008 0,002 0,016
ΔF 0,026 0,005 0,107
Sig. 0,056 0,045 0,004
Izvor: izračun autora
Kao što je razvidno iz tablice 5, sva tri prediktora zajedno objašnjavaju 2,4 % varijance iskazivanja emocija. Gledajući pojedinačni doprinos, prediktor dob objašnjava 0,2 %, radna pozicija 0,4 %, a učestalost pregovaranja objašnjava najviše varijance i to sa 1,8 %. Regresijskom analizom za varijablu tituliranje utvrđen je zajednički doprinos objašnjenju varijance od 3,5 %. Ipak, najveći pojedinačni doprinos ima varijabla dob i to 2,7 %, dok dosta skromniji doprinos imaju varijable radna pozicija (0,7 %) i učestalost pregovaranja (0,1 %). Neverbalna komunikacija je ovim regresijskim modelom objašnjena s 2,6 % varijance. Najveći udio u varijanci ima prediktor učestalost pregovaranja (1,6 %), dok je udio prediktora dob 0,8 %, a prediktora radna pozicija 0,2 %.
U tablici 6 prikazani su beta koeficijenti regresijskih modela, koji odražavaju jačinu ovisnosti zavisne varijable o pojedinom prediktoru.
Tablica 6. Beta koeficijenti regresijskih modela
Prediktori Zavisne varijable
Iskazivanje emocija TituliranjeNeverbalna
komunikacija
Dob 0,029 0,380* -0,045
Radna pozicija –0,151 -0,188 -0,008
Učestalost pregovaranja 0,217* 0,053 0,220**p < 0,05
Izvor: izračun autora

M. Martinović, K. Vojvodić, A. Pušić: Kulturološki aspekti poslovnog pregovaranja menadžera hrvatskih...Zbornik Veleučilišta u Rijeci, Vol. 8 (2020), No. 1, pp. 103-119
115
U slučaju varijable iskazivanje emocija jedino je statistički značajna ovisnost o učestalosti pregovaranja. Tituliranje je ovisno jedino o dobi gdje je beta koeficijent najveći, a neverbalna komunikacija ovisna je o učestalosti pregovaranja. Ostale ovisnosti nisu se pokazale statistički značajnima.
5. ZAKLJUČAK
Brojni su činitelji koji utječu na pregovarački proces, ponašanje pregovarača za pregovaračkim stolom i ishode pregovaranja. Detaljno poznavanje faza pregovaračkog procesa, taktika i strategija i činitelja koji utječu na cjelokupni proces pregovaranja pomaže pregovaračima ostvariti učinkovitu interakciju sa suprotnom pregovaračkom stranom i postizanje željenih ciljeva pregovaranja. S tim u vezi, razumijevanje kulturoloških sličnosti i razlika od iznimne je važnosti za pregovarače u suvremenom globaliziranom okruženju.
Različite dimenzije kulture utječu na rezultate pregovora, a kulturološka osviještenost pregovarača pridonosi cjelovitom razumijevanju ponašanja suprotne pregovaračke strane, njezinih interesa, preferencija, taktika i strategija te osigurava određenu prednost pregovaraču za pregovaračkim stolom. U radu se razmatrao utjecaj odabranih obilježja hrvatskih pregovarača (dob, pozicija u poduzeću i učestalost pregovaranja) na kulturološke aspekte pregovaranja (tituliranje, neverbalnu komunikaciju i iskazivanje emocija). Rezultati istraživanja ukazali su na postojanje pozitivne korelacije između varijabli učestalost pregovaranja i iskazivanje emocija, dob i tituliranje te učestalost pregovaranja i neverbalna komunikacija. Nadalje, beta koeficijenti regresijskih modela ukazali su na statistički značajnu ovisnost iskazivanja emocija i neverbalne komunikacije o prediktoru učestalost pregovaranja te ovisnost tituliranja o prediktoru dobi.
Ograničenja provedenog istraživanja odnose se na ograničen broj varijabli obuhvaćenih istraživanjem što ostavlja prostor za buduća istraživanja. Varijable kao što su tržišni položaj, vlasništvo ili geografski položaj poduzeća u ovom slučaju nisu uzeti u obzir. Osim navedenih, buduća istraživanja trebaju uzeti u razmatranje dodatna obilježja pregovarača, npr. spol, razinu obrazovanja, komunikacijski stil i sklonost preuzimanju rizika. Vezano uz varijablu dobi koja je istražena, buduća istraživanja bi mogla promatrati i testirati razlike u pregovaračkom kontekstu između pripadnika različitih generacijskih skupina (Baby Boomers, generacija X, generacija Y i sl.).
Također, u budućim se istraživanjima potrebno usredotočiti na dodatna pregovaračka obilježja koja mogu uključivati asertivnost, kulturološku osviještenost, povjerenje, fleksibilnost i kreativnost. S obzirom na ograničenu literaturu koja obrađuje pregovaračka obilježja hrvatskih menadžera, ovo istraživanje daje uvid u određene kulturološke aspekte poslovnog pregovaranja hrvatskih menadžera i može služiti kao temelj za provođenje budućih istraživanja u hrvatskom pregovaračkom kontekstu.
LITERATURA
Acuff, F. L. (2008) How to negotiate anything with anyone anywhere around the world, New York: Amacom
Age, L. J., Eklinder-Frick, J. (2017) “Goal-oriented balancing: happy-happy negotiations beyond win-win situations“, Journal of Business & Industrial Marketing, 32(4), p. 525-534

Barry, B., Fulmer, I. S., Goates, N. (2006) “Bargaining with Feeling: Emotionality in and Around Negotiation”. In: Negotiation Theory and Research, Thompson, L. L. (Ed.), New York: Taylor and Francis, p. 99-128
Blume, A. W. (2017) Social Issues in Living Color: Challenges and Solutions from the Perspective of Ethnic Minority Psychology, Santa Barbara: Praeger
Brett J., Thompson L. (2016) “Negotiation”, Organizational Behavior and Human Decision Processes, 136, p. 68-79
Brett, J. M. (2017) “Culture and negotiation strategy”, Journal of Business & Industrial Marketing, 32(4), p. 587-590
Brett, J., Mitchell, T. (2019) “Searching for trustworthiness: culture, trust and negotiating new business relationships”, International Journal of Conflict Management, https://www.emerald.com/insight/content/doi/10.1108/IJCMA-05-2019-0085/full/html (Accessed 9 September 2019)
Butt, A. N., Choi, J. N. (2010) “Does power matter?: Negotiator status as a moderator of the relationship between negotiator emotion and behaviour”, International Journal of Conflict Management, 21(2), p. 124-146
Calero, H. H. (2005) The Power of Nonverbal Communication: How You Act is More Important Than what You Say, Aberdeen: Silver Lake Publishing
Carnevale, P. J. (2019) “Strategic time in negotiation“, Current Opinion in Psychology, 26, p. 106-112
Carrell, M. R., Heavrin, C. (2004) The Everyday Negotiator: 50 Practical Negotiation Tactics for Work and Life, Amherst: HRD Press
Dabić, M., Podrug, N., Tipurić, D. (2015) “Cultural Differences Affecting Decision-Making Style: A Comparative Study Between 4 Countries“, Journal of Business Economics and Management, 16(2), p. 275 -289
Dwyer, J., Hopwood, N. (2019) The Business Communication Handbook, South Melbourne: Cengage
ElShenawy, E. (2010) “Does negotiation training improve negotiators’ performance?”, Journal of European Industrial Training, 34(3), p. 192-210
Frascogna, X. M., Hetherington, H. L. (2001) The Lawyer’s Guide to Negotiation: A Strategic Approach to Better Contracts and Settlements, Chicago: American Bar Association
Gates, S. (2012) The Negotiation Book: Your Definitive Guide To Successful Negotiating, West Sussex: John Wiley & Sons
Gunia, B. C., Brett, J. M., Gelfand, M. J. (2016) “The science of culture and negotiation”, Current Opinion in Psychology, 8, p. 78-83
Hair, J. F., Hult, G. T. M., Ringle, C. M., Sarstedt, M. (2016) A primer on partial least squares structural equation modeling (PLS-SEM), Thousand Oaks: Sage Publications
Hendon, D. W., Hendon, R. A., Herbig, P. (1996) Cross-cultural Business Negotiations, Westport: Quorum Books
Hoechlin, N. (2018) How to Negotiate Anything: The best negotiation book on training essentials, skills, techniques & style: Yes, become a business negotiation genius via this in-depth book on the art of negotiation, JNR Publishing Book
Hurn, B., Tomalin, B. (2013) Cross-Cultural Communication: Theory and Practice, Hampshire: Palgrave Macmillan
Jäger, A., Loschelder, D. D., Friese, M. (2015) “How self-regulation helps to master negotiation challenges: An overview, integration, and outlook”, European Review of Social Psychology, 26(1), p. 203-246
Katz, L. (2006) Negotiating International Business: The negotiator’s reference guide to 50 countries around the world, Charleston: Booksurge Publishing
Katz, L. (2008) Principles of Negotiating International Business: Success Strategies for Global Negotiators, Charleston: Booksurge Publishing
Khan, M. A., Ebner, N. (2019) The Palgrave Handbook of Cross-Cultural Business Negotiation, Verlag: Springer International Publishing
Kopelman, S., Rosette, A.S., Thompson, L. (2006) “The three faces of Eve: Strategic displays of positive, negative, and neutral emotions in negotiations“, Organizational Behavior and Human Decision Processes, 99(1), p. 81-101
M. Martinović, K. Vojvodić, A. Pušić: Kulturološki aspekti poslovnog pregovaranja menadžera hrvatskih...Zbornik Veleučilišta u Rijeci, Vol. 8 (2020), No. 1, pp. 103-119
117
Kopelman, S., Rosette, A.S. (2008) “Cultural variation in response to strategic emotions in negotiations”, Group Decision and Negotiation, 17, p. 65-77
Korobkin, R. (2014) Negotiation: Theory and Strategy, New York: Wolters Kluwer Law & Business
Križman Pavlović, D., Kalanj, I. (2008) “Uloga poslovnog pregovaranja u stjecanju konkurentske prednosti“, Ekonomska istraživanja, 21(4), p. 62-81
Lažnjak, J. (2011) “Dimensions of National Innovation Culture in Croatia: Content Validity of Hofstede’s Dimensions“, Društvena istraživanja, 20(4), p. 1015-1038
Lempereur, A. (2012) “Responsible negotiation: exploring the forest beyond the tree”, Journal of Global Responsibility, 3(2), p. 198-207
Lewthwaite J. (2006) Managing People for the First Time: Gaining Commitment and Improving Performance, London: Thorogood Publishing
Olekalns, M., Weingart, L. R. (2008) “Emergent Negotiations: Stability and Shifts in Negotiation Dynamics”, Negotiation and Conflict Management Research, 1(2), p. 135-160
Oliver, D. (2011) How to Negotiate Effectively, London: Kogan Page
Perkov D., Primorac D., Kozina G. (2016) “Business negotiation as a crucial component of sales”. In: Proceedings of the 13th International Scientific Conference on Economic and Social Development, Barcelona: Varaždin Development and Entrepreneurship Agency and University North, p. 638-647
Pinkley R. L, Northcraft, G. B. (2014) Get Paid What You’re Worth: The Expert Negotiators’ Guide to Salary and Compensation, New York: St. Martin’s Press
Podrug, N., Gauta, N. (2013) “Komparativna analiza stilova upravljanja konfliktima između Hrvatske i SAD-a“, Ekonomski pregled, 64(2), p. 123-142
Podrug, N., Filipović, D., Stančić, I. (2014) “Analysis of cultural differences between Croatia, Brazil, Germany and Serbia“, Ekonomska istraživanja, 27(1), p. 818-829
Posthuma, R. A. (2012) “Conflict management and emotions“, International Journal of Conflict Management, 23(1), p. 4-5.
Rajh, E., Budak, J., Anić, I.-D. (2016) “Hofstede’s culture value survey in Croatia: Examining regional differences“, Društvena istraživanja, 25(3), p. 309-327
Salacuse, J. W. (1998) “Ten Ways that Culture Affects Negotiating Style: Some Survey Results“, Negotiation Journal, 14(3), p. 221-240
Saorin‐Iborra, C. M., Redondo‐Cano, A., Revuelto‐Taboada, L. (2013) How BATNAs perception impacts JVs negotiations, Management Decision, 51(2), p. 419-433
Sobral, F., Carvalhal, E., Almeida, F. (2008) “The Influence of Culture on Negotiation Styles of Brazilian Executives“, Management Research, 6(2), p. 107-119
Thomas, D. C. (2008) Cross-Cultural Management: Essential Concepts, London: Sage Publications
Tomašević Lišanin, M. (2004) “Pregovaranje - poslovni proces koji dodaje vrijednost“, Zbornik Ekonomskog fakulteta u Zagrebu, 2(1), p. 143-158
Tomašević Lišanin M., Razum A., Marić N. (2015) “Skills and negotiation behaviour of Croatian Businessmen“, International Journal of Sales, Retailing and Marketing, 4(4), p. 168-178
Tomašević Lišanin, M., Kadić-Maglajlić, S., Drašković, N. (2019) Principi prodaje i pregovaranja, Zagreb: Sveučilište u Zagrebu, Ekonomski fakultet
Tracy, J. L., Randles, D., Steckler, C. M. (2015) “The nonverbal communication of emotions“, Current Opinion in Behavioral Sciences, 3, p. 25-30
Uher T. E., Loosemore M. (2004) Essentials of Construction Project Management, Sydney: UNSW Press

M. Martinović, K. Vojvodić, A. Pušić: Kulturološki aspekti poslovnog pregovaranja menadžera hrvatskih...Zbornik Veleučilišta u Rijeci, Vol. 8 (2020), No. 1, pp. 103-119
118
Wang, H. K. H. (2018) Business Negotiations in China: Strategy, Planning and Management, New York: Routledge
Wang M., Han Y., Su Y. (2017) ”Social contagion or strategic choice?: The interpersonal effects of emotions during Chinese negotiations“, Chinese Management Studies, 11(3), p. 463-478
Warner, C. (2011) Media Selling: Television, Print, Internet, Radio, Chichester: Wiley-Blackwell

M. Martinović, K. Vojvodić, A. Pušić: Kulturološki aspekti poslovnog pregovaranja menadžera hrvatskih...Zbornik Veleučilišta u Rijeci, Vol. 8 (2020), No. 1, pp. 103-119
119
Original scientific paper https://doi.org/10.31784/zvr.8.1.13 Received: 2. 12. 2019. Accepted: 24. 1. 2020.
CULTURAL ASPECTS OF CROATIAN MANAGERS’ BUSINESS NEGOTITATION
Marija Martinović PhD, Associate Professor, University of Dubrovnik, Department of Economics and Business Economics,
Lapadska obala 7, 20000 Dubrovnik, Croatia; e-mail: [email protected]
Katija Vojvodić PhD, Associate Professor, University of Dubrovnik, Department of Economics and Business Economics,
Lapadska obala 7, 20000 Dubrovnik, Croatia; e-mail: [email protected]
Ana Pusić M. A., Teaching Assistant, University of Dubrovnik, Department of Economics and Business Economics,
Lapadska obala 7, 20000 Dubrovnik, Croatia; e-mail: [email protected]
ABSTRACTIn the context of negotiation, it is of the utmost importance to understand the differences across cultures and their impact on the negotiation process and its outcomes. Furthermore, cultural awareness allows negotiators to anticipate and interpret their counterpart’s behaviour. Consequently, it facilitates achieving the desired negotiating objectives and enhances negotiation performance. The aim of this paper was to explore the impact of the selected features of Croatian negotiators (age, hierarchical level and negotiation frequency) on cultural aspects of negotiation (use of titles, nonverbal communication and expression of emotion). The research was conducted on a sample of 256 firms in the Republic of Croatia. The research results revealed a positive correlation between the following variables: expression of emotion and negotiation frequency, age and the use of titles and negotiation frequency and nonverbal communication. Multilinear hierarchical regression provided a more detailed insight into the correlation between variables. Beta coefficient showed a statistically significant dependence of variables expression of emotion and nonverbal communication on the predictor negotiation frequency; as well as the dependence of the variable use of titles on the predictor age. The paper provides insights into the Croatian negotiation practice and it could serve as a basis for conducting future empirical research in the field.
Key words: business negotiation, Croatian managers, cultural aspects
Creative Commons Attribution – NonCommercial 4.0 International License


J. Jardas Antonić, K. Kregar, N. Vretenar: Data Envelopment Analysis in Measuring the Efficiency of…Zbornik Veleučilišta u Rijeci, Vol. 8 (2020), No. 1, pp. 121-134
121
Original scientific paper https://doi.org/10.31784/zvr.8.1.14 Received: 3. 12. 2019. Accepted: 31. 1. 2020.
DATA ENVELOPMENT ANALYSIS IN MEASURING THE EFFICIENCY OF VOLLEYBALL TEAMS IN
PRIMORSKO-GORANSKA COUNTY Jelena Jardas Antonić
PhD, Assistant Professor, University of Rijeka, Faculty of Economics and Business, Ivana Filipovića 4, 51 000 Rijeka, Croatia; e-mail: [email protected]
Kristina Kregar M.A., Teaching assistant, University of Rijeka, Faculty of Economics and Business, Ivana Filipovića 4,
51 000 Rijeka, Croatia; e-mail: [email protected]
Nenad Vretenar PhD, Associate Professor, University of Rijeka, Faculty of Economics and Business, Ivana Filipovića 4,
51 000 Rijeka, Croatia; e-mail: [email protected]
AbstractEvery sport organisation strives to evaluate its performance: its weaknesses and strengths. Measuring efficiency and sports are two interrelated concepts and it is not surprising that most of the research on sports is focused on analysing the efficiency of teams according to player techniques, attack and defence efficiency. However, there are very few studies based on the analysis of financial factors such as teams’ revenue and costs. In this paper two Data Envelopment Analysis (DEA) models were used to evaluate 16 young cadet volleyball teams in Primorsko-Goranska County based on two economic inputs. The paper aims to explain the importance of teams’ financial resources in achieving sports efficiency. To analyse the relative efficiency of teams, two frequently used models are employed, the Banker Charnes Cooper (BCC) and the Charnes Cooper Rhodes (CCR) model. In the end, a super efficiency analysis was conducted to make a distinction in efficiency scores between efficient units. Analyses showed that financial factors are not crucial factors for efficiency score and gave possibility to use obtained results and improve the performance of inefficient volleyball teams. The study was conducted on a sample of 16 teams through 4 inputs and 1 output collected during 2017/2018 season.
Key words: relative efficiency, Data Envelopment Analysis, volleyball, sports teams, economic factors
Creative Commons Attribution – NonCommercial 4.0 International License

J. Jardas Antonić, K. Kregar, N. Vretenar: Data Envelopment Analysis in Measuring the Efficiency of…Zbornik Veleučilišta u Rijeci, Vol. 8 (2020), No. 1, pp. 121-134
122
1. INTRODUCTION
Efficiency and sports are two closely related concepts. Most of the research analyzing efficiency in sports investigates the effectiveness of one or a few sport segments such as player techniques or attack and defense performance, but rarely does it analyze the dependence of sports results on the revenues and costs of respective teams. A few decades ago, efficiency in sports was measured using simple methods. For example, in volleyball, they measured how many points athletes achieved with the same amount of tries and then they calculated the arithmetic mean for each athlete. Besides arithmetic means, they also calculated efficiency by observing the average relationship between two or more variables interrelated in some manner. For example, González-Silva et al. (2016), used multinomial logistic regression to calculate the efficiency of young male and female volleyball players. The main objective of that study was to analyze the variables that predicted setting efficiency in these categories. The study observed almost 6,000 game actions performed by teams that participated in the Under-16 Spanish Championship.
Volleyball is one of the most widely spread played sports in the world (Olympic Programme Commission Report, 2005). This is not that strange considering that almost every second little girl in the world has tried to play volleyball. Some of these girls continued playing professionally and some as a form of recreation. This may probably be the reason why volleyball has been called a “female” sport. The percentage of female athletes in volleyball also lies in the possibility of higher dispersion of male athletes into other team sports. Volleyball is a famous sport in Croatia. There are many teams trying to survive with the limited financial help offered by the Croatian government, especially in Primorsko - Goranska County (PGC). In PGC there are sixteen registered younger cadet teams. The actual number of teams is not known, as they probably do not have enough money to pay the registration fee in order to become a part of an official league. Namely, Croatian volleyball teams especially those involving children are mostly financed through membership fees, minor sponsors and donations.
In 2017, the Opatija Initiative, an initiative for sustainable financing of sports has been initiated. This initiative targets only the five top sports in PGC: football, basketball, volleyball, water-polo and handball. It has been recognized as a very creative concept, even revolutionary, with regard to financing sports and its role in the overall development of Croatian society. The initiative envisages new models of financing team sports from the sale of TV rights, sojourn taxes, betting agencies, municipal taxes and the introduction of tax breaks for sports. The trigger for this initiative lies in the fact that a large number of teams are on the edge of existence. Many are being shut down, and in the long run, the children will simply lose the opportunity to get involved in sports activities at low cost. Today there are more than 200,000 registered athletes in Croatia, and even more important, 100,000 of them are under the age of 18. The Croatian government, on an annual basis, is obliged to allocate fairly the budget means aimed for the financial support of volleyball teams. As this research aims to investigate whether the amount of funds at a team’s disposal, generated through various means i.e. membership fees, sponsors, the government etc. is related to the team’s sporting success, the research findings may serve as a guideline in the allocation of financial support in volleyball. The success of the teams was measured by their results within the season 2017/2018.

J. Jardas Antonić, K. Kregar, N. Vretenar: Data Envelopment Analysis in Measuring the Efficiency of…Zbornik Veleučilišta u Rijeci, Vol. 8 (2020), No. 1, pp. 121-134
123
In the past, the DEA approach was used for measuring efficiency in other contexts such as financial services (Fiordelisi, Molyneux, 2004), banking (Hauner, 2005), industry (Price, Weyman-Jones, 1996), hospitals (Dervaux et al., 2004) and electricity (Bagdadioglu et al, 1996). In the past 10 to 15 years, it has also been recognized as a common methodology for measuring efficiency in sports, such as football, handball, volleyball, etc. In 2018, Ali Emrouznejad and Guo Liang Yang published an invited paper A survey and analysis of the first 40 years of scholarly literature in DEA: 1978–2016 in which they provided for a list of all publications related to theory and application of DEA from 1978 to 2016. In their study they followed the expansion of DEA use in 3 stages and found that about 1000 papers per year were published in the last period. The five fields with the greatest number of studies using DEA include Agriculture, Banking, Supply Chain, Transportation and Public policy. In a total of 10,300 listed papers, sports papers and relating journals account only for 30 entries.
One of the DEA founders, William W. Cooper, and his coauthors Ramón, Ruiz, and Sirvent (2011) applied DEA to rank basketball players using cross-efficiency evaluation. They applied the output-oriented CCR model with a constant input and the following outputs: adjusted field goal (AFG), adjusted free throw (AFT), rebounds (REB), assists (AST), steals (STE), inverse of turnovers (ITURN), non-made fouls own (NFO) and fouls opposite (FOPP). Ramón, Ruiz, and Sirvent (2012) ranked tennis players through a common set of weights obtained as summaries of DEA profile weights. They used the CCR output-oriented model with the following outputs: percentage of 1st serve, percentage of 1st serve points won, percentage of 2nd serve points won, percentage of service games won, percentage of break points saved, percentage of points won returning 1st serve, percentage of points won returning 2nd serve, percentage of break points converted and percentage of return games won. As no input was considered, they introduced a nominal input with value equal 1 for all players. Alcaraz, Ramón and Ruiz (2013) also did a cross-efficiency evaluation which was carried out without the need to make any choice of DEA weights.
Lozano et al. (2002), performed a relative efficiency assessment of nations participating in the previous five Summer Olympic Games using DEA models to investigate the relation between GNP and a country’s population and the number of gold, silver and bronze medals won. Three output variables were considered: the total number of gold, the total number of silver and the total number of bronze medals won in the Olympics. As for the input variables, they opted to include just two: Gross National Product (GNP) and population. They assumed that the economic power and the demographic power capture the most important factors affecting the expected performance of a nation. They used one linear programming (LP) for each DMU.
De Carlos, Alén and Pérez-González (2017) did a research using the latter study in order to analyze the relative efficiency of the Spanish Olympic Sports Federations in the Olympic cycle 2010-2012 by employing a relational DEA model. In their analysis the data was grouped under 17 variables (4 inputs, 10 intermediate inputs and 3 outputs) which allowed them to simultaneously calculate the efficiency of the system and its different stages and show the impact of public and private financing on sport results.

J. Jardas Antonić, K. Kregar, N. Vretenar: Data Envelopment Analysis in Measuring the Efficiency of…Zbornik Veleučilišta u Rijeci, Vol. 8 (2020), No. 1, pp. 121-134
124
Finally, it is also important to mention studies correlating financial resources and efficiency scores, and financial resources and the effectiveness and productivity of sport federations. Ghotnian et al. (2018) used data such as amount of resources, facilities, goals and strategies to calculate the efficiency of thirty-nine sport federations. Meza et al. (2015) evaluate the efficiency of Brazilian Olympic Confederations based on the financial resources received and their conversion into results, e.g. medals. They employed two different models, the BCC model and the DEA non-radial model, which is very similar to the BCC model. The DEA non-radial model was formulated using two inputs and three outputs. The first input is represented by the funds coming from the Agnelo/Piva Law that were transferred to each Olympic Confederation by the Brazilian Olympic Committee in 2011. This input measures the amount of money available for each sport investment. The second one is the number of gold medals offered for each sport in the 2011 Guadalajara Pan American Games, as a proxy for difficulty measure in winning a medal. This second input represents the non-controllable variable of the problem. The outputs are the number of gold, silver and bronze medals won by each sport during the same sporting event.
The above mentioned studies justify the option to use the DEA approach in the analysis of the efficiency of 16 young cadet volleyball teams. The goal of the analysis is to investigate whether and to what extent a team’s financial resources impact the team’s sports results i.e. its efficiency with respect to selected inputs and output. Moreover, a strong hold for this analysis lies in the work of Guzmán and Morrow (2007); Gutiérrez and Lozano (2014); Moreno and Lozano (2015) whose implementation of DEA in sports using financial inputs/ outputs was very successful
2. METHODOLOGY
Data Envelopment Analysis (DEA) was first defined by Charnes, Cooper and Rhodes in 1978, who defined it as a methodology that measures relative efficiency of decision-making units (DMUs) by converting multiple inputs into multiple outputs. DEA is a linear programming method that compares the input and output levels of a decision making unit with the levels of other DMUs from its peer group. Namely, the ratio of outputs to inputs shows the relative efficiency of each DMUo (within DMUj) which is then evaluated relatively according to the ratios of all DMUj for j = 1,2,…,n.
As previously mentioned, DEA has numerous applications because it was developed for analysing relative efficiency of non-profit DMUs with heterogeneous inputs and outputs.
2. 1 BASIC CCR AND BCC MODEL
The first model to be used in the analysis is the Charnes Cooper Rhodes model (CCR-model). This model can be interpreted as the transformation of a multiple output/input ratio into a single virtual input and a single virtual output that represent a measure of a particular DMU’s efficiency. Using the obtained data, the efficiency of each DMU will be measured once, which means that n optimization need to be performed, one for each DMUj . Let the DMUj be evaluated based on the

J. Jardas Antonić, K. Kregar, N. Vretenar: Data Envelopment Analysis in Measuring the Efficiency of…Zbornik Veleučilišta u Rijeci, Vol. 8 (2020), No. 1, pp. 121-134
125
any trial for o = 1,…, n. Fractional linear programming should be solved to obtain input
weight values for iv ( mi ,...,1= ) and output weight values marked as ru ( sr ,...,1= ) variables.
In the mathematical form of fractional programming. this reads as (Cooper, Seiford and Tone, 2006):
momoo
sosoo
vu xvxvxvyuyuyu
++++++
=......max
2211
2211
,θ
subject to 1......
2211
2211 ≤++++++
mjmjj
sjsjj
xvxvxvyuyuyu
nj ,...,1=
Variables ur, vi, yr and xi represent the output weights, input weights, output and input values of the observed DMUo respectively. The constraint ensures that the ratio of virtual output vs virtual input for every DMU, including DMUo , will be less than or equal to unity. Namely, mathematically, the nonnegativity constraint is not sufficient for the fractional terms to have a positive value.
The second model used in the analysis is the Banker Charnes Cooper model (BCC model). The BCC model differs from the CCR model because it includes the convexity condition in its constraint. This additional constraint reflects graphically on the shape of the efficiency frontier. The efficiency frontier is spanned by efficient DMUs. The CCR model has thus a linear efficiency frontier while the BCC mode, a piecewise linear efficiency frontier. The BBC model’s piecewise linear shape is a result of variable returns to scale (See Figure 1).
Figure 1. The graphical representation of CCR and BCC productivity frontiers
Source: Authors according to the Cooper, W., Seiford, L., Tone K.: Introduction to Data Envelopment Analysis and Its Uses, Springer , 2006.
Data Envelopment Analysis models can be output or input oriented. Orientation is chosen according to the nature of the problem or the researcher’s perspective. In an input orientation, the DEA minimizes the input for a given level of output; in other words, it indicates how much a DMU
Production possibility set
O
U
T
P
U
T

J. Jardas Antonić, K. Kregar, N. Vretenar: Data Envelopment Analysis in Measuring the Efficiency of…Zbornik Veleučilišta u Rijeci, Vol. 8 (2020), No. 1, pp. 121-134
126
can decrease its input for a given level of output. In an output orientation, the DEA maximizes the output for a given level of input; in other words, it indicates how much a DMU can increase its output for a given level of input
However, DEA has some drawbacks. One of the main traps of the Data Envelopment Analysis is that efficiency scores are sensitive to the number of included inputs and outputs. Namely, the DEA methodology has limitations regarding the number of inputs and outputs because the efficiency scores can be overestimated in cases when the number of inputs and outputs is too high in regard to the number of variables i.e. observations. According to the studied literature, overestimation can be prevented if the number of inputs and outputs is tied to the number of DMUs (number of observations/ volleyball teams) in the following way (Dyson et al., 2001); n (number of observations) > 2ms, where m and s represent the number of inputs and outputs respectively. Another relevant solution in determining the adequate number of inputs/outputs, according to Raab and Lichty (2002), is given either by the relation n > 3(m + s) or according to Despotis (2002), where n ≥ max {m*s; 3(m + s)}.
2. 2 SUPEREFFICIENCY MODEL
As previously stated, all efficient DMUs, according to data envelopment analysis, are ranked equally in terms of performance. The standard DEA models have a large number of applications and modifications. One of the most important extensions of the DEA model is the formulation of super-efficiency models used for ranking DMUs with an efficiency unity score. The most well- known super efficiency model is that established by Anderson and Petersen in 1993. This model involves executing standard DEA models (constant return to scale and variable return to scale) under the assumption that the evaluated DMUs are excluded from the reference set.
The super efficiency model is given by (Petersen, Anderson 1993):
+− ′−−′− seseE j δδmin
subject to ∑≠=
−+=n
jkk
kkjj sXzXE1
∑≠=
++=n
jkk
kkj sYzY1 ,
0,, ≥−+ ssz
where jX represents the m-dimensional vector of input, jY the s-dimensional output vector,
jE the scalar defining the share of the input vector necessary for producing the jY DMU’s
output vector within the frames of referent technology, Z the vector of intensity where kz

J. Jardas Antonić, K. Kregar, N. Vretenar: Data Envelopment Analysis in Measuring the Efficiency of…Zbornik Veleučilišta u Rijeci, Vol. 8 (2020), No. 1, pp. 121-134
127
represents the intensity of the k-unit,δ the non-Archimedean infinitesimal, and e′ the unity vector of appropriate dimension.
Peterson and Anderson explained the consequence of excluding an evaluated unit from the reference set using a graphical example (more in Anderson, Peterson, 1993) Their model was used as a base for further super-efficiency model development (Tone, 2002).
3. DATA AND ANALYSIS
The data on the 16 analysed young cadet volleyball teams was obtained through questionnaires and interviews with individuals involved in managing the respective teams i.e. club management officials and coaches. The data covered the 2017 – 2018 season.
As only 16 DMUs are observed, we opted to take five inputs and a single output into analysis. Namely, in accordance with the above mentioned theoretical prepositions, the optimal number of observations should be greater than 10 (k >2∙5∙1) if we consider Dyson, or should be greater than 18 (3 ∙ (5+1)) if we follow Raab and Lichty.
The inputs used are as follows: the number of players (girls) registered, the number of coaches, the number of games played and total revenue and total costs. The number of won games is taken as the output as it is seen as a measure of a team’s success. The revenue of a team aggregates donations and monthly membership fees while total costs include sums paid out to coaches, monthly rent for the gym, costs of medical examinations, transportation costs, registration fees and money paid out for referees. The inputs and outputs were defined in consultation with the coaches/management of young cadet volleyball teams. The number of players is taken as one of the input values because the number of players affects the number of winnings because a greater number of players enables better team management on court; moreover, it also generates more revenue from membership fees. Revenue also contributes to better practice conditions, employment of better coaches with greater experience etc. The number of coaches is the second input as their number enables more efficient work. More coaches provide for the opportunity to have target trainings with individual groups of players, regular training sessions in cases of coach absence etc. Total revenue is the third input used in the analysis because revenue levels determine the number of coaches, the number of away games, the purchase of new equipment which usually motivates players, and better balanced meals before or after away games. All these factors depend on revenue, and according to the interviewed coaches affects sport results. The same, but opposite, can be said for total costs, which is the fourth input. Table 1 shows the values of selected inputs and output.
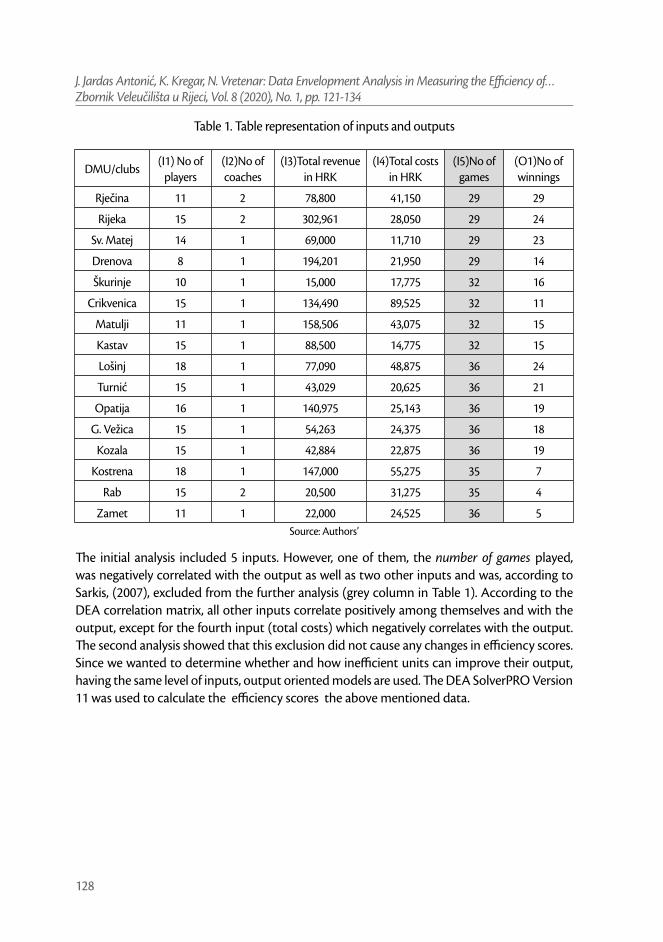
J. Jardas Antonić, K. Kregar, N. Vretenar: Data Envelopment Analysis in Measuring the Efficiency of…Zbornik Veleučilišta u Rijeci, Vol. 8 (2020), No. 1, pp. 121-134
128
Table 1. Table representation of inputs and outputs
DMU/clubs(I1) No of
players(I2)No of coaches
(I3)Total revenue in HRK
(I4)Total costs in HRK
(I5)No of games
(O1)No of winnings
Rječina 11 2 78,800 41,150 29 29
Rijeka 15 2 302,961 28,050 29 24
Sv. Matej 14 1 69,000 11,710 29 23
Drenova 8 1 194,201 21,950 29 14
Škurinje 10 1 15,000 17,775 32 16
Crikvenica 15 1 134,490 89,525 32 11
Matulji 11 1 158,506 43,075 32 15
Kastav 15 1 88,500 14,775 32 15
Lošinj 18 1 77,090 48,875 36 24
Turnić 15 1 43,029 20,625 36 21
Opatija 16 1 140,975 25,143 36 19
G. Vežica 15 1 54,263 24,375 36 18
Kozala 15 1 42,884 22,875 36 19
Kostrena 18 1 147,000 55,275 35 7
Rab 15 2 20,500 31,275 35 4
Zamet 11 1 22,000 24,525 36 5Source: Authors’
The initial analysis included 5 inputs. However, one of them, the number of games played, was negatively correlated with the output as well as two other inputs and was, according to Sarkis, (2007), excluded from the further analysis (grey column in Table 1). According to the DEA correlation matrix, all other inputs correlate positively among themselves and with the output, except for the fourth input (total costs) which negatively correlates with the output. The second analysis showed that this exclusion did not cause any changes in efficiency scores. Since we wanted to determine whether and how inefficient units can improve their output, having the same level of inputs, output oriented models are used. The DEA SolverPRO Version 11 was used to calculate the efficiency scores the above mentioned data.

J. Jardas Antonić, K. Kregar, N. Vretenar: Data Envelopment Analysis in Measuring the Efficiency of…Zbornik Veleučilišta u Rijeci, Vol. 8 (2020), No. 1, pp. 121-134
129
Table 2. Compared ranking of CCR and BCC model results
CCR results BCC results
No. DMU Score Rank No. DMU Score Rank
1 Rječina 1 1 1 Rječina 1 1
3 Sv. Matej 1 1 3 Sv. Matej 1 1
5 Škurinje 1 1 4 Drenova 1 1
9 Lošinj 1 1 5 Škurinje 1 1
10 Turnić 1 1 9 Lošinj 1 1
13 Kozala 0.9059 6 10 Turnić 1 1
4 Drenova 0.8235 7 2 Rijeka 0.9115 7
12 G. Vežica 0.8218 8 13 Kozala 0.9059 8
11 Opatija 0.8133 9 12 G. Vežica 0.8218 9
2 Rijeka 0.8014 10 11 Opatija 0.8133 10
7 Matulji 0.75 11 7 Matulji 0.8108 11
8 Kastav 0.6498 12 8 Kastav 0.6498 12
6 Crikvenica 0.4731 13 6 Crikvenica 0.4731 13
16 Zamet 0.2918 14 16 Zamet 0.2918 14
14 Kostrena 0.2917 15 14 Kostrena 0.2917 15
15 Rab 0.1829 16 15 Rab 0.2336 16Source: Authors’ calculation
If we compare the results obtained by using the CCR and BCC models, we can notice that according to the BCC model (Table 2) one additional DMU was estimated as efficient. The initial results showed that 31.25% of units (teams) are efficient according to the CCR model and 37.5% according to the BCC model. As this difference is not significant and since only one unit more is estimated as efficient by the BCC model, there is no variable return to scale and the analysis can be continued using just the CCR model. It can be also concluded that 69% of units are estimated above average according to both models (Table 3).
Table 3. Summary results according to CCR and BCC model
MODEL
DATACCR BCC
NUMBER OF DMUs 16 16
No. of relatively efficient DMUs 5 6
Average 0, 7378 0,7627
Max value 1 1
Min value 0,1829 0,2336Source: Authors’ calculation

J. Jardas Antonić, K. Kregar, N. Vretenar: Data Envelopment Analysis in Measuring the Efficiency of…Zbornik Veleučilišta u Rijeci, Vol. 8 (2020), No. 1, pp. 121-134
130
4. RESULTS AND DISCUSSION
Continuing the analysis with the CCR model, the reference sets were calculated as well as the following projections. The calculated reference sets for inefficient units are presented in Table 4.
Table 4. Inefficient units and their reference sets
No. DMU Score Rank Reference(Lambda)
1 Rab 0.1829 16 Škurinje 1.367
2 Kostrena 0.2917 15 Lošinj 1
3 Zamet 0.2918 14 Sv. Matej 0.044 Škurinje 0.791 Turnić 0.165
4 Crikvenica 0.4731 13 Sv. Matej 0.75 Lošinj 0.25
5 Kastav 0.6498 12 Sv. Matej 0.918 Lošinj 0.082
6 Matulji 0.75 11 Rječina 0.176 Sv. Matej 0.647
7 Rijeka 0.8014 10 Rječina 0.485 Sv. Matej 0.69
8 Opatija 0.8133 9 Sv. Matej 0.639 Lošinj 0.361
9 G. Vežica 0.8218 8 Sv. Matej 0.301 Lošinj 0.1 Turnić 0.599
10 Drenova 0.8235 7 Rječina 0.353 Sv. Matej 0.294
11 Kozala 0.9059 6 Škurinje 0.005 Turnić 0.995Source: Authors’ calculation
The frequency of appearance of a particular DMU in the reference sets confirms its ranking as an efficient unit. Namely, since all efficient units are rated with the maximum value of 1, the re-occurrence of a DMU in reference sets can tell us just how “strong” that evaluation really is. For instance, the DMU Sveti Matej has the highest frequency of appearing in different reference sets, i.e. Sveti Matej showed up as a referent unit in eight of the eleven cases.
A reference set also gives us information which volleyball team from the reference set can be used as a role model for others, the non-efficient volleyball teams, because all teams belonging to a reference set have very similar level of inputs but only the role model team(s) managed to achieve higher efficiency score(s).
As one of the advantages of DEA lies in the possibility to calculate projections, which may serve as benchmarks for improving efficiency, we calculated the projections for every inefficient unit in our sample. For example, the projections for DMU Rijeka, calculated with respect to the liner combination of two relatively efficient teams from the reference set (Rječina and Sveti Matej), show that Rijeka can improve its performance by as much as 25%. Namely, if we observe the data presented in Table 5, it can be seen that DMU Rijeka can reach the efficiency frontier and increase the number of winnings for approximately 25% (5 more wins) according to the selected inputs because they have an additional coach and more financial resources than other teams. Looking from the input oriented perspective, it can be said that even with decreasing inputs, i.e. less financial resources and less coach engagement their performance can remain at the same level (Table 5).

J. Jardas Antonić, K. Kregar, N. Vretenar: Data Envelopment Analysis in Measuring the Efficiency of…Zbornik Veleučilišta u Rijeci, Vol. 8 (2020), No. 1, pp. 121-134
131
Table 5. Example of projections for DMU Rijeka
Inputs/output
DMU data No of coaches
DMU Score Rank Data Projection Diff.(%)
Rijeka 0,8 10 2 1.6607 -16.97
Total revenue Number of winnings
Data Projection Diff.(%) Data Projection Diff.(%)
302961 85858.9 -71.66 24 29.95 24.78Source: Authors’ calculation
As mentioned earlier, efficient units were all rated with a maximum value of 1. However, the frequency of their re-occurrence in calculated reference sets indicates that there are differences in terms of efficiency among them. In order to rank them, a super-efficiency model was used. The one we opted for was the Slack based Model (SBM – CCR model) with output orientation developed by Kaoru Tone (2001), as it minimizes weighted l1 distance from an efficient DMU to the production possibility set, excluding the evaluated unit from the set. The results of the super-efficiency analysis of observed teams are shown in Table 6.
Table 6. Super-efficiency score
DMU Score Rank
Škurinje 2.1856 1
Sv. Matej 1.929059 2
Rječina 1.592743 3
Turnić 1.069606 4
Lošinj 1.043478 5Source: Authors’ calculation
According to the obtained results, the volleyball team Škurinje was estimated as the relatively most efficient DMU. Even though its output score is not the highest, it was ranked as the most efficient DMU because its ratio of inputs to output is higher than those of other DMUs. Namely, its scores are ranked fourth, but its inputs are significantly lower than those of Rijeka, Rječina and Sveti Matej. However, it should be noted that the reference set results indicated that Sveti Matej is the most efficient team (8 out of 11 appearances) which is somewhat confirmed by its ranking according to super-efficiency scores.
5. CONCLUSION
The intention of this paper was to include financial factors as inputs and to investigate whether these factors impact the relative efficiency sports results of young cadet volleyball teams using the non-parametric DEA approach on a sample of 16 volleyball teams in Primorsko-Goranska County

J. Jardas Antonić, K. Kregar, N. Vretenar: Data Envelopment Analysis in Measuring the Efficiency of…Zbornik Veleučilišta u Rijeci, Vol. 8 (2020), No. 1, pp. 121-134
132
with respect to 4 inputs and 1 output. The basic DEA analysis showed that 31.25% of units (teams) are efficient according to the CCR model and 37.5% according to the BCC model, 5 and 6 relatively efficient DMUs respectively. The analysis also showed that financial factors are important, but not crucial, for the efficiency score. The Data Envelopment Analysis enabled us to determine that on one hand, smaller clubs, with smaller financial support, like Škurinje, Sveti Matej and Rječina can be efficient and that on the other hand, clubs with higher revenues, like Rijeka, do not always yield success. Moreover, it may be said that revenue is the main pillar in ensuring the basic conditions for efficient work, but our analysis shows that the number of winnings depends also on the quality of their work and the capacity of players to overcome inequalities in financial inputs. This capacity may result from the team’s enthusiasm, motivation and hard work, factors which have not been included in this analysis but that could surely provide answers to why teams with less financial means achieve better results in relative efficiency scores.
Generally, it can also be concluded that DEA represents a powerful tool in measuring sports efficiency which enables benchmarking between homogeneous units that works in similar conditions. It also enables the creation of reference sets based on which projections can be calculated. Furthermore, it helps club managers to detect the weaknesses and strengths of their teams in order to improve their efficiency or it can help them to find sources of inefficiency.
Most importantly, the results of this study may serve as a guideline for a fairer allocation of state funds and the introduction of new models of sustainable financing of team sports, such as the one proposed by the Opatija Initiative. Namely, the survival of sport clubs, especially those involving children and teenagers are of extreme importance for the development of any society.
In order to obtain more plausible results, the research should be extended to include a larger sample, timeframe (window analysis) and more detailed analysis of financial inputs.
* This paper has been financially supported by the University of Rijeka, project ZP UNIRI 2/19
REFERENCES Alcaraz, J., Ramón, N., Ruiz, J. L. (2013) “Ranking ranges in cross-efficiency evaluations”, European Journal of Operational
Research, 226(3), 516-521. doi: 10.1016/j.ejor.2012.11.034
Andersen, P., Petersen N.C. (1993) “A Procedure for Ranking Efficient Units in Data Envelopment Analysis,” Management Science 39, pp.1261–1264.
Bagdadioglu, N., Price, C. W., Weyman-Jones, T. (1996) “Efficiency and ownership in electricity distribution: A non-parametric model of the Turkish experience”. Energy Economics, 18(1–2), 1-23. doi: 10.1016/0140-9883(95)00042-9
Cooper, W., Seiford, L., Tone K.(2006) Introduction to Data Envelopment Analysis and Its Uses, Springer , 2006.
Cooper, W. W., Ramón, N., Ruiz, J. L., Sirvent, I. (2011) “Avoiding large differences in weights in cross-efficiency evaluations: application to the ranking of basketball player”, Journal of centrum cathedra: The Business and Economics Research Journal, 4(2), 197-215. SSRN: https://ssrn.com/abstract=1931850
DEA SolverPRO Version 11, Saitech, http://www.saitech-inc.com/Products/DownloadDEA.asp
De Carlos, P., Alén, E., Pérez-González, A. (2017) “Measuring the efficiency of the Spanish Olympic Sports Federations”, European Sport Management Quarterly, 17(2), 210-225. doi: 10.1080/16184742.2016.1245769

J. Jardas Antonić, K. Kregar, N. Vretenar: Data Envelopment Analysis in Measuring the Efficiency of…Zbornik Veleučilišta u Rijeci, Vol. 8 (2020), No. 1, pp. 121-134
133
Dervaux, B., Ferrier, G. D., Leleu, H., Valdmanis, V. (2004) “Comparing French and US hospital technologies: a directional input distance function approach”, Applied Economics, 36(10), 1065-1081. doi: 10.1080/0003684042000246786
Despotis, D. K. (2002) „Improving the discriminating power of DEA: Focus on globally efficient units“, Journal of the Operational Research Society, 53(3), 314 – 323.
Dyson, R. G. et al. (2001). „Pitfalls and protocols in DEA. European Journal of Operational Research, 132(2), 245-259.
Emrouznejad, A., Yang, G. (2017) „A survey and analysis of the first 40 years of scholarly literature in DEA: 1978–2016“, Socio-Economic Planning Sciences. 10.1016/j.seps.2017.01.008.
Fiordelisi, F., Molyneux, P. (2004). “Efficiency in the Factoring Industry”, Appl Econ, 36(9), 947-959, doi: 10.1080/00036884042000233177
Ghotnian, S., Hosseinzadeh Lotfi, F., Tojari, F., Zarei, A. (2018). “Efficiency Calculation, Effectiveness and Productivity of Sports Federations Using the Method (DEA)”. Revista Publicando, 15(1), 328-345. ISSN 1390-9304
González-Silva, J., Domínguez, A. M. et al. (2016) “Analysis of Setting Efficacy in Young Male and Female Volleyball Players. Journal of Human Kinetics”, 53(1), 189–200. doi: 10.1515/hukin-2016-0022
González-Silva, J. et al. (2016) “Analysis of Setting Efficacy in Young Male and Female Volleyball Players. Journal of Human Kinetics”, 53(1), 189–200. doi: 10.1515/hukin-2016-0022
Gutiérrez, E., Lozano, S. (2014) „A DEA Approach to Performance-Based Budgeting of Formula One Constructors“, Journal of Sports Economics, 15(2), 180-200.
Guzmán, I., Morrow, S. (2007) „Measuring efficiency and productivity in professional football teams: evidence from the English Premier League“, Central European Journal of Operations Research(15), 309-328.
Hauner, D. (2005) “Explaining efficiency differences among large German and Austrian banks”, Applied Economics, 37(9), 969-980. doi: 10.1080/00036840500081820
IOC - Olympic Program Commission, Report to the 117th IOC Session, 24 May 2005. Retrieved 6/15, 2019, from https://www.google.com/url?sa=t&rct=j&q=&esrc=s&source=web&cd=1&ved=2ahUKEwjXpL7S6sbjAhVomYsKHRXtDCkQFjAAegQIABAC&url=https%3A%2F%2Fstillmed.olympic.org%2Fmedia%2FDocument%2520Library%2FOlympicOrg%2FIOC%2FWho-We-Are%2FCommissions%2FOlympic-Programme%2FEN-Olympic-Programme-Commission-Report-to-the-117th-IOC-Session.pdf&usg=AOvVaw08nOwYGiPL0vD_EtMAAEVu (15. 6. 2019.)
Lozano, S., Villa, G., Guerrero, F., Cortés, P. (2002) “Measuring the performance of nations at the Summer Olympics using data envelopment analysis”, Journal of the Operational Research Society, 53(5), 501–511. doi.org/10.1057/palgrave.jors.2601327
Meza, L. A., Valério, R. P., Soares de Mello, J. C. (2015) “Assessing the Efficiency of Sports in Using Financial Resources with DEA Models”, Procedia Computer Science, 55, 1151-1159. doi.org/10.1016/j.procs.2015.07.086
Moreno, P., Lozano, S. (2015) „Estimation of Productivity Change of NBA Teams from 2006-07 to 201-13 Season“, International Journal of Sport Finance, 10, 217-241.
Price, C. W., Weyman-Jones, T. (1996) “Malmquist indices of productivity change in the UK gas industry before and after privatization”, Applied Economics, 28(1), 29-39. doi: 10.1080/00036849600000004
Raab, R. L., Lichty R. W. (2002) „Identifying subareas that comprise a greater metropolitan area: The criterion of county relative efficiency“, Journal of regional science, 42(3), 579-158
Ramón, N., Ruiz, J. L., Sirvent, I. (2012) Common sets of weights as summaries of DEA profiles of weights: With an application to the ranking of professional tennis players. Expert Systems with Applications, 39(5), 4882-4889. doi:10.1016/j.eswa.2011.10.004
Sarkis J. (2007) „Preparing Your Data for DEA. In: Zhu“ J., Cook W.D. (eds) Modeling Data Irregularities and Structural Complexities in Data Envelopment Analysis. Springer, Boston, MA
Tone, K. (2002) “A slacks-based measure of super-efficiency in data envelopment analysis”, European Journal of Operational Research, 143(1), 32–41. doi: 10.1016/S0377-2217(01)00324-1
https://www.sabor.hr/hr/node/571 (23. 9. 2019.)

J. Jardas Antonić, K. Kregar, N. Vretenar: Data Envelopment Analysis in Measuring the Efficiency of…Zbornik Veleučilišta u Rijeci, Vol. 8 (2020), No. 1, pp. 121-134
134
Izvorni znanstveni rad https://doi.org/10.31784/zvr.8.1.14 Datum primitka rada: 3. 12. 2019. Datum prihvaćanja rada: 31. 1. 2020.
METODA OMEĐIVANJA PODATAKA U MJERENJU EFIKASNOSTI ODBOJKAŠKIH TIMOVA U
PRIMORSKO – GORANSKOJ ŽUPANIJIJardas Antonić
Dr. sc., docentica, Ekonomski fakultet Sveučilišta Rijeci, Ivana Filipovića 4, 51 000 Rijeka, Hrvatska; e-mail: [email protected]
Kristina Kregar Asistentica, Ekonomski fakultet Sveučilišta Rijeci, Ivana Filipovića 4, 51 000 Rijeka, Hrvatska;
e-mail: [email protected]
Nenad Vretenar Dr. sc., izv. prof., Ekonomski fakultet Sveučilišta Rijeci, Ivana Filipovića 4, 51 000 Rijeka, Hrvatska;
e-mail: [email protected]
SažetakSvaka sportska organizacija ulaže značajan trud u evaluaciju svoje učinkovitosti, svojih slabosti i snaga. Mjerenje efikasnosti i sport su međusobno isprepleteni pojmovi i nije iznenađujuće da je većina istraživanja u području sporta usredotočena na analize efikasnosti sportskih momčadi vezano uz tehniku igrača, efikasnost napada i obrane, a rijetko bazirano na financijskim čimbenicima poput prihoda i troškova momčadi. U ovom radu su promatrajući ekonomske inpute upotrjebljena dva modela metode omeđivanja podataka (DEA) za ocjenu šesnaest mlađih kadetskih odbojkaških momčadi u Primorsko-goranskoj županiji. Analizom se pokušalo utvrditi značajnost financijskih sredstava koje timovi imaju na raspolaganju u postizanju efikasnosti sportskih rezultata. Za analizu relativne efikasnost momčadi, upotrijebilo se dva učestalo korištena modela Banker Chames Cooperov (BCC) i Chames Cooper Rhodesov (CCR) model. Na kraju je izvršena analiza superefikasnosti kako bi se moglo razlučiti rezultate efikasnosti između efikasnih jedinica. Analiza je izvršena na uzorku od 16 momčadi uz pomoć 4 inputa i jednog outputa u sezoni 2017-2018.
Ključne riječi: relativna efikasnost, analiza omeđivanja podataka, odbojka, sportski timovi, ekonomski čimbenici
Creative Commons Attribution – NonCommercial 4.0 International License

S. Ravlić, J. Glavaš, M. Šimunić: The Impact of the IPA Cross-Border Co-operation Hungary – Croatia…Zbornik Veleučilišta u Rijeci, Vol. 8 (2020), No. 1, pp. 135-149
135
Original scientific paper https://doi.org/10.31784/zvr.8.1.15 Received: 6. 12. 2019. Accepted: 10. 1. 2020.
THE IMPACT OF THE IPA CROSS-BORDER CO-OPERATION HUNGARY - CROATIA 2007 – 2013 PROGRAMME - INFRASTRUCTURE, TOURISM AND
HUMAN CAPITALSanela Ravlić
PhD, Senior Adviser for project implementation, Croatian Employment Service Regional Office, Kneza Trpimira 2, 31 000 Osijek, Croatia; e-mail: [email protected]
Jerko Glavaš PhD, Associate Professor, J. J. Strossmayer University of Osijek, Faculty of Economics in Osijek,
Trg Ljudevita Gaja 7, 31 000 Osijek, Croatia; e-mail: [email protected]
Mislav Šimunić PhD, Full Professor, University of Rijeka, Faculty of Tourism and Hospitality Management, Primorska 42,
51 410 Opatija, Croatia; e-mail: [email protected]
ABSTRACTThe main purpose of the paper is to move towards quantification and clear distinction of invested IPA funds in the CBC area of Hungary and Croatia 2007. - 2013. Objective of the paper is to provide an insight into the real impact of allocated financial resources to the extent that was not examined so far at the level of institutions (lead beneficiary and project partners) and target group members. The main research questions is what is the impact that implemented projects in IPA CBC HU – CRO had in terms of different types of institutions, types of activities (educational or infrastructure), beneficiaries in local communities and regional development? The research was conducted in April/May 2018. The questionnaire consisted of 41 variables. Interview was the corrective method. Data analysis was conducted using SPSS v23. Total of 102 respondents participated, representing 358 institutions that implemented projects in the cross-border area. Data were first analysed using descriptive statistics, then compared by using t-test and ANOVA Chi-square test was performed to determine the likelihood of correlation between variables. Paper shows obtained results on personal, organisational and regional level. The outcome confirms the difference between human capital in institutions that implement projects and high dependence of EU funds in entire region. Beneficiaries are more aware of impact that lifelong learning activities can have on their labour market competitiveness. Investment in sustainable environment, tourism, development of economic cooperation, infrastructure and common human capacities will have a significant impact in the region.
Key words: human capital, European Union, regional development, cross-border cooperation
Creative Commons Attribution – NonCommercial 4.0 International License
S. Ravlić, J. Glavaš, M. Šimunić: The Impact of the IPA Cross-Border Co-operation Hungary – Croatia…Zbornik Veleučilišta u Rijeci, Vol. 8 (2020), No. 1, pp. 135-149
136
1. INTRODUCTION
By implementing projects in the cross-border area, networking among stakeholders, transfer of knowledge, education, skills development and exchange of best case practices among partners, there is a chance to develop human and other resources. However, there is a noticeable absence of willingness to determine the results on all levels that the projects within this cross-border programme have achieved. It is necessary to determine which direct and indirect effects the invested funds were able to ultimately achieve in the seven years of programme implementation. In the six cross-border cooperation programmes, with the exception of transnational programmes in which the Republic of Croatia has participated, more than 150,000,000 euro has been allocated, but the question of the effect of the invested funds spent is raised. Except for indicators at the level of each individual project, no clear review of the impact of these funds has been made for the observed area in order to assess the real impact of the funds invested on both sides of the border. In the document Strategic Framework for Development of Republic of Croatia 2006-2013., it was defined that a special emphasis is put on cross-border cooperation as one of the instruments of regional development. The project implementation and its success is of the utmost importance for the EU, given that it secures the continued operation and achievement of the project objectives after the completion its formal financing. It is expected that the achieved results and positive changes will be further spread in the community in which the project was implemented, and that in the future these created values will become the basis for further development, both for individuals who participated in the implementation of the project at personal level and at the level of community in which the interventions took place (Ravlić, 2019). Moreover, possible distinction between funds invested in different components should be detected for the future plans and actions since substantial amounts are being granted for this area.
The observed IPA Cross-border Program Hungary-Croatia 2007-2013, with more than 52.000.000.00 € allocated funds for seven years of the program, which has been the focus of this study, funded projects in the area of sustainable environment and tourism, development of economic cooperation, infrastructure and common human capacities, which are recognized as areas of exceptional local-specific importance of the cross-border area. As stated in the „On-going Programme Evaluation of the Hungary – Croatia IPA Cross-border Cooperation Programme 2007-2013“ it would be useful to „measure longer term effects of the funded activities and to ensure deeper knowledge capitalisation“, which is an additional confirmation of the necessity for this research. Therefore, the aim is to investigate and present the perception of the investments’ impacts created within the organisations that had a status of lead beneficiary or project partner primarily on the development of the human potential of the observed area and perception on the influence on regional development.
2. LITERATURE REVIEW
Human capital is important when we discuss its potential for multiplication effect in local communities that can be created due to the invested funds in the cross-border area of two countries. Investment in education and the acquisition of knowledge has been recognized as an important component of the European Union’s development, which under the Lisbon Strategy has

S. Ravlić, J. Glavaš, M. Šimunić: The Impact of the IPA Cross-Border Co-operation Hungary – Croatia…Zbornik Veleučilišta u Rijeci, Vol. 8 (2020), No. 1, pp. 135-149
137
highlighted investing in people as one of the main prerequisites for creating a modern knowledge-based economy (Babić, 2005:30). In recent years, the Republic of Croatia invested considerable funds in the development of its institutional framework for an efficient regional development, as well as in human resources development (Marijanović et al., 2010:991), but its effect and actual impact has not been thoroughly researched. Knowledge has become the key to economic competitiveness and success. An important part of an economy’s overall competitiveness – the ability to achieve success on markets – is labour-force competitiveness (Bejaković, 2006:109) that has to be understood and accepted on all levels and by all who participate and/or influence the labour market. When discussing about the observed area, on the Croatian side it is inevitable to take into consideration past events that shaped the future of the area. The economies of the countries in the region are burdened by two severe legacies: the arrangements of the old socialist semi-planned economy and the damaged structures of the war economies of the 1990s (Altman, 2004:69). Even since the declaration of independence, and especially after the end of the war (1995), Croatia faced a series of problems in the regional development field, such as: socio-economic disparities between different regions, depopulated areas (caused by the homeland war), large number of refugees, neglected technological and transport infrastructure (UNDP, 1999). The regional disparities that influence huge development gaps were inherited from the previous system (Dragičević, Letunić, 2008:3). Also, the combination of an unfavourable external environment and subdued domestic demand has taken a toll on the Croatian economy. Croatia is one of the few countries where real GDP has not grown at all since the beginning of the global financial crisis. This has worsened the fiscal picture, with public debt approaching 60% of GDP(Koerner et al., 2013:1). It should be highlighted that utilization of IPA funds overlapped with the years that crisis hit the entire EU market.
Most of the research conducted in the world indicate a positive link between investment in human capital and economic growth rates, yet it is often not possible to fully and accurately establish a clear correlation between the observed variables, which will show constancy in value when tested and observed. The reason is often in a large number of variables that affect the level of human potential, but also in the reasons for its loss over time, or over a longer period of time. Macroeconomists have indeed offered a number of models and theories in order to explain how investing in education is affecting economic growth. Research that, given the different position of education and the coverage of matter, show a significant and positive relationship between human capital and economic growth, are found in the works of the author Barro (1990), Otani and Villanueva (1990), Mankiw et al (1992), Judson (1996), Hansen and Knowles (1998), Poorfaraj et al (2011) and others. Additionally, approximately a third of the EU’s total budget is invested in regional policy in order to achieve greater economic and social cohesion of the Union more equitable development of member states and their regional units (Tišma et al., 2012:120).
Effects caused by the project implementation can be observed, except in organisations that implemented projects, also through the effects that it can achieve on the level of target group members, including members of the immediate and their extended family. Every town, city and community has unique local conditions that either help or hinder its economic development. These conditions will form the basis for designing and implementing a local economic development

S. Ravlić, J. Glavaš, M. Šimunić: The Impact of the IPA Cross-Border Co-operation Hungary – Croatia…Zbornik Veleučilišta u Rijeci, Vol. 8 (2020), No. 1, pp. 135-149
138
strategy (Swinburn, 2006:3). As highlighted in the Strategic Development Framework 2006 – 2013 „The reward for accepting the ambitious view that anything can be changed in the long run may be surprisingly copious. Such an approach indicates that we should act in the areas that today seem difficult to change. A small step from today to tomorrow may lead to a great stride from tomorrow to the day after. The main source and driver of this change are people – people prepared to learn and accept the challenges“. People, are becoming a strategic basis for the development of modern competitive economies and societies with their specific and unique combination of ideas, information, new knowledge and skills. The objective of regional development policy is to contribute to the socio-economic development of the Republic of Croatia, in accordance with the principles of sustainable development, by creating conditions that will enable all parts of the country to strengthen competitiveness and realize their own development potentials (Bilas et al., 2011:296). Increasingly, competitiveness and prosperity depend on the capacity of the people and businesses located there to make the best use of all of territorial assets. In a globalising and interrelated world economy, however, competitiveness also depends on building links with other territories to ensure that common assets are used in a coordinated and sustainable way. Cooperation along with the flow of technology and ideas as well as goods, services and capital is becoming an ever more vital aspect of territorial development(...)of the EU as a whole (CEC, 2008).
3. METHOD
3. 1 Design
The research, which will partially be presented in this paper, was conducted from 1st of April to 31st of May 2018. The survey consisted of 38 questions (41 variables). The corrective method was the interview method. The collected data were processed by appropriate statistical methods. Data analysis was done using SPSS v23. The focus is definitely on the insufficient monitoring of the effectiveness that invested funds created in the development of resources in the observed cross-border region of Hungary and the Republic of Croatia at the personal, institutional and local level.
3. 2 Research group
The respondents were project managers from organisation that implemented projects during the 7-year period from 2007 to 2013, according to the n + 3 rule. Of the potential 170, 102 respondents participated, representing 358 institutions out of a total of 581 institutions that took part in the projects under the 3 conducted Calls. The involved institutions included public sector institutions, educational and research institutions, trust funds, various chambers, public employment services, regional and local authorities (counties, cities and municipalities), regional development agencies, business incubators, entrepreneurial centres, R&D centres, associations, NGOs, employers’ associations, professional associations, trade unions, agricultural associations and cooperatives.
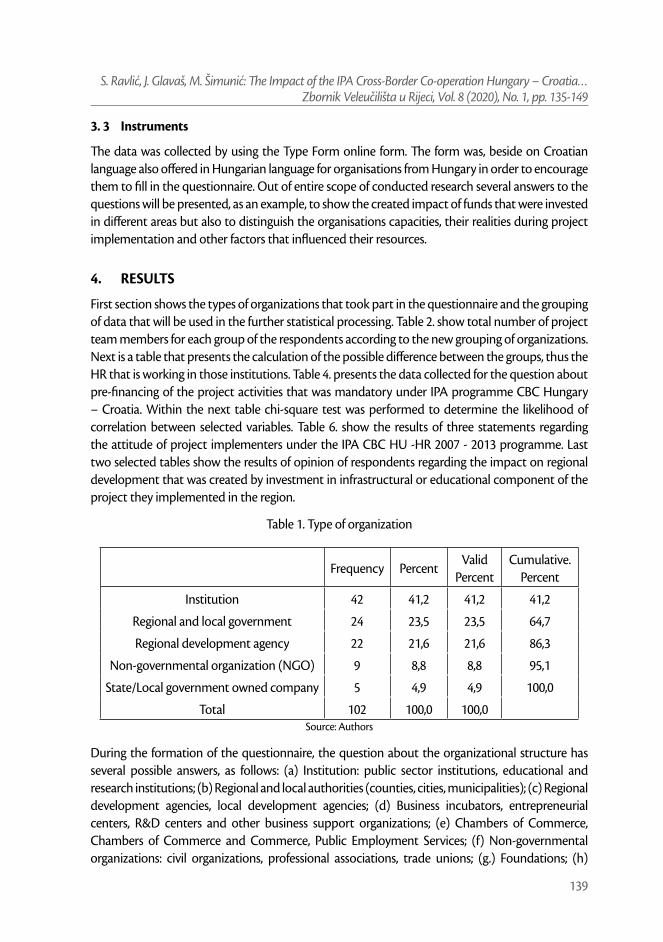
S. Ravlić, J. Glavaš, M. Šimunić: The Impact of the IPA Cross-Border Co-operation Hungary – Croatia…Zbornik Veleučilišta u Rijeci, Vol. 8 (2020), No. 1, pp. 135-149
139
3. 3 Instruments
The data was collected by using the Type Form online form. The form was, beside on Croatian language also offered in Hungarian language for organisations from Hungary in order to encourage them to fill in the questionnaire. Out of entire scope of conducted research several answers to the questions will be presented, as an example, to show the created impact of funds that were invested in different areas but also to distinguish the organisations capacities, their realities during project implementation and other factors that influenced their resources.
4. RESULTS
First section shows the types of organizations that took part in the questionnaire and the grouping of data that will be used in the further statistical processing. Table 2. show total number of project team members for each group of the respondents according to the new grouping of organizations. Next is a table that presents the calculation of the possible difference between the groups, thus the HR that is working in those institutions. Table 4. presents the data collected for the question about pre-financing of the project activities that was mandatory under IPA programme CBC Hungary – Croatia. Within the next table chi-square test was performed to determine the likelihood of correlation between selected variables. Table 6. show the results of three statements regarding the attitude of project implementers under the IPA CBC HU -HR 2007 - 2013 programme. Last two selected tables show the results of opinion of respondents regarding the impact on regional development that was created by investment in infrastructural or educational component of the project they implemented in the region.
Table 1. Type of organization
Frequency PercentValid
PercentCumulative.
Percent
Institution 42 41,2 41,2 41,2
Regional and local government 24 23,5 23,5 64,7
Regional development agency 22 21,6 21,6 86,3
Non-governmental organization (NGO) 9 8,8 8,8 95,1
State/Local government owned company 5 4,9 4,9 100,0
Total 102 100,0 100,0Source: Authors
During the formation of the questionnaire, the question about the organizational structure has several possible answers, as follows: (a) Institution: public sector institutions, educational and research institutions; (b) Regional and local authorities (counties, cities, municipalities); (c) Regional development agencies, local development agencies; (d) Business incubators, entrepreneurial centers, R&D centers and other business support organizations; (e) Chambers of Commerce, Chambers of Commerce and Commerce, Public Employment Services; (f) Non-governmental organizations: civil organizations, professional associations, trade unions; (g.) Foundations; (h)

S. Ravlić, J. Glavaš, M. Šimunić: The Impact of the IPA Cross-Border Co-operation Hungary – Croatia…Zbornik Veleučilišta u Rijeci, Vol. 8 (2020), No. 1, pp. 135-149
140
Other. The small number of responses collected in individual categories could affect the ability to analyse and possibly present valid results when testing individual answers to questions, or their further interpretation so the new clustering of data was undertaken, which would not diminish the significance of certain collected data, but allow their accurate presentation, taking into account all similarities and significant differences, but respecting the original intention of the questions. Therefore, the tourist board and chamber were merged with institutions, while the foundation was merged with associations and a new group of non-governmental organizations was formed. In addition, a group of entrepreneurial support institutions has been created, into which development agencies of all levels, business incubators, entrepreneurial centers, R&D centers have been merged. The grouping of data in the graphical representation was used in further statistical processing of the obtained data according to the representation in the table above.
Table 2. Total number of project team members
N MeanStd. Dev.
Std. Error
95% Conf. Interval for Mean
Min MaxLower Bound
Upper Bound
Institution 42 10,26 6,278 ,969 8,31 12,22 2 26
Regional and local government
24 7,29 3,250 ,663 5,92 8,66 3 16
Regional development agency
22 9,59 4,595 ,980 7,55 11,63 2 20
Non-governmental organization
9 6,22 1,563 ,521 5,02 7,42 4 9
State/Local govt. owned company
5 6,20 2,168 ,970 3,51 8,89 5 10
Total 102 8,86 5,066 ,502 7,87 9,86 2 26Source: Authors
The data collected was subjected to an ANOVA test to test the significance of differences between groups, including all relevant statistical indicators, such as standard deviation and average, in a complex model. Since the variance analysis test determines the existence or non-existence of differences between more than two groups taking into account arithmetic means, usually under the null hypothesis it is stated that differences between groups are not statistically significant. In this case, we assume that the groups are quite similar in this respect in their responses to a particle measuring quantity, intensity, etc.

S. Ravlić, J. Glavaš, M. Šimunić: The Impact of the IPA Cross-Border Co-operation Hungary – Croatia…Zbornik Veleučilišta u Rijeci, Vol. 8 (2020), No. 1, pp. 135-149
141
Table 3. Total number of project team members (ANOVA)
Sum of Squares dfMean Square
F Sig.
Between Groups
251,327 4 62,832 2,604 ,041
Within Groups 2340,751 97 24,131
Total 2592,078 101Source: Authors
The calculation confirmed that the difference between the groups is considerable (Sig. Value is 0.041), despite the extremely large variations within individual groups. This clearly confirms the possible difference between human capital among institutions who implement projects funded by the EU, in terms of their capabilities but also the costs of labour for certain institution.
Table 4. Own financing of the project (Cross tabulation)
Type of organization
TotalInstitution
Reg. development
agencies
Reg. development
agenciesNGO
State/Local govt.
owned company
NoNo. 20 9 13 0 5 47
% 47,6% 37,5% 59,1% 0,0% 100,0% 46,1%
YesNo. 21 12 6 7 0 46
% 50,0% 50,0% 27,3% 77,8% 0,0% 45,1%
I do not know
No. 1 3 3 2 0 9
% 2,4% 12,5% 13,6% 22,2% 0,0% 8,8%
TotalNo. 42 24 22 9 5 102
100,0% 100,0% 100,0% 100,0% 100,0% 100,0%Source: Authors
Table 4. shows the collected results for the question about the issues the organisation faced regarding the first reimbursement, i.e. if it has been a big challenge for the organization in order to prepare and implement all the project activities? For the purpose of a more detailed processing of the obtained results, a chi-square test was performed to determine the potential deviation of frequencies from the expected frequencies. We use it when trying to determine the likelihood of correlation between variables, and usually when the assumption is made that there is no difference in frequencies between some groups of subjects.

S. Ravlić, J. Glavaš, M. Šimunić: The Impact of the IPA Cross-Border Co-operation Hungary – Croatia…Zbornik Veleučilišta u Rijeci, Vol. 8 (2020), No. 1, pp. 135-149
142
Table 5. Chi-Square Tests
Value df Asymptotic Significance (2-sided)
Pearson Chi-Square 19,997a 8 ,010
Likelihood Ratio 26,004 8 ,001
No. of Valid Cases 102Source: Authors
The test negates it and confirms that there is an extremely large difference in the own financing of the implementation of the project by the institution until the first disbursement by budget users relative to the non-governmental sector.
The answer is negative, i.e. financing up to the first payment is not a problem in 100% of the responses of companies owned by regional or local government or the state, almost 60% of the responses of entrepreneurial support institutions and 47,6% of the responses of institutions. Regional and local self-government bodies show an almost percentage as it comes from responses from organizations that are located both in larger and smaller cities, towns and villages so it certainly depends on their financial strength.
Table 6. Attitude of project implementers under the IPA CBC HU-HR 2007 - 2013
Statement (1) (2) (3) (4) (5)Ar.
mean.
Our organization would certainly establish partnerships with organizations from another
country, partners in the project and carry out the activities of this project in this volume and without
EU funding or co-financing.
50,0 23,5 15,7 7,8 2,9 1,90
Partner organizations have greatly helped to develop the skills, knowledge and capabilities of our
organization2,9 4,9 19,6 41,2 31,4 3,93
By transferring knowledge, skills and experience, we have made it possible to improve our own business as well as that of our partners and associates in the
project.
1,0 2,9 15,7 48,0 32,4 4,08
Source: Authors
The statements in the table 6. range from 1 – 5, where 1 stands for “I strongly disagree”, number 2 “I disagree”, 3 is “neither agree nor disagree”, grade 4 is “I agree” and 5 is for “I completely agree with the statement”.
The first statement clearly points to the fact that partner organizations on both sides of the border do not make contact and spend planned project to the extent that they did so by supporting EU

S. Ravlić, J. Glavaš, M. Šimunić: The Impact of the IPA Cross-Border Co-operation Hungary – Croatia…Zbornik Veleučilišta u Rijeci, Vol. 8 (2020), No. 1, pp. 135-149
143
funds through IPA CBC HU - HR 2007-2013. (50% in the case of a “disagree” answer to which we can add and 23,5% a “disagree” answer). Only 15,7% of respondents expressed uncertainty and chose the answer “neither agree nor disagree”, and quite low number of respondents (7,8%) “I agree”, while 2,9% of respondents “completely agree”. Mean is at 1,90.
In the case of the second statement, of the total number of respondents, only 2,9% “disagree” with the statement that partner organizations helped to develop the skills, knowledge and capabilities of their organization, as well as 4,9% who do not “sufficiently” agree with the claim, which can be considered a success given the very low percentage of such projects in relation to their total number. 19,6% of the respondents answered “neither agree nor disagree”. The reason for this percentage may be the type of activities carried out by the organizations, that is, more emphasis is placed on the users themselves, and less on the linking of institutions and the transfer of knowledge and examples of good practice. Also, there was a language barrier on the part of the conductors, which could often not be heard during the seven-year implementation period. Although each conference or activity of this nature had a simultaneous translation, implementers still noted barriers to daily communication with their partners, which could be the cause of this response rate. More than two-thirds of the respondents answered yes to this statement, and 41,2% of respondents agree with it, while 31,4% of respondents completely agree with the stated statement. Mean is 3,93.
In the case of the last statement, where the mean is 4,08, the respondents show a really high degree of agreement with the statement that the implementation of this project has increased the number of contacts and cooperation with organizations at the local level, because as many as 47,1% of the respondents opted for the answer “I agree” and answered agree” 41,2% of respondents. Only a low 4,9% of respondents disagreed with the statement, while 6,9% of respondents did not express their clear position on the statement.
Table 7. Impact on regional development
Type of projects N Mean Std. Deviation Std. Error Mean
Infrastructural component 12 4,42 ,515 ,149
Educational component 90 4,06 ,740 ,078Source: Authors
When discussing projects implemented in the 7 year period, it is needed to take into consideration the difference of project components, thus their infrastructural of educational component which will be invested in sustainability of environment or tourism on both sides of the border together with their impact on regional development. Beside the impact, the possible difference that the invested funds in specific components could create, should be detected.
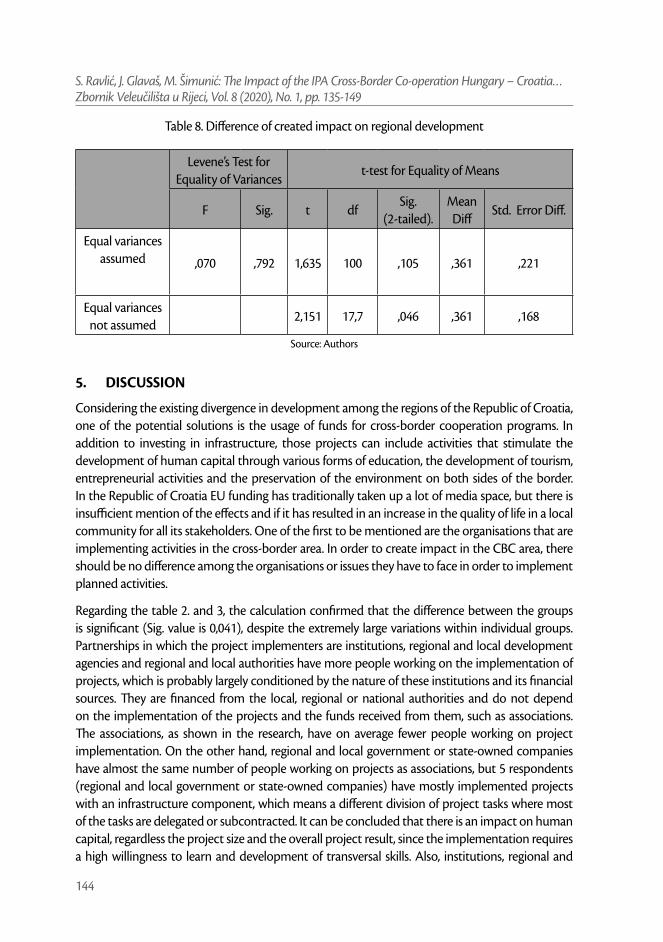
S. Ravlić, J. Glavaš, M. Šimunić: The Impact of the IPA Cross-Border Co-operation Hungary – Croatia…Zbornik Veleučilišta u Rijeci, Vol. 8 (2020), No. 1, pp. 135-149
144
Table 8. Difference of created impact on regional development
Levene’s Test for Equality of Variances
t-test for Equality of Means
F Sig. t dfSig.
(2-tailed).Mean Diff
Std. Error Diff.
Equal variances assumed ,070 ,792 1,635 100 ,105 ,361 ,221
Equal variances not assumed
2,151 17,7 ,046 ,361 ,168
Source: Authors
5. DISCUSSION
Considering the existing divergence in development among the regions of the Republic of Croatia, one of the potential solutions is the usage of funds for cross-border cooperation programs. In addition to investing in infrastructure, those projects can include activities that stimulate the development of human capital through various forms of education, the development of tourism, entrepreneurial activities and the preservation of the environment on both sides of the border. In the Republic of Croatia EU funding has traditionally taken up a lot of media space, but there is insufficient mention of the effects and if it has resulted in an increase in the quality of life in a local community for all its stakeholders. One of the first to be mentioned are the organisations that are implementing activities in the cross-border area. In order to create impact in the CBC area, there should be no difference among the organisations or issues they have to face in order to implement planned activities.
Regarding the table 2. and 3, the calculation confirmed that the difference between the groups is significant (Sig. value is 0,041), despite the extremely large variations within individual groups. Partnerships in which the project implementers are institutions, regional and local development agencies and regional and local authorities have more people working on the implementation of projects, which is probably largely conditioned by the nature of these institutions and its financial sources. They are financed from the local, regional or national authorities and do not depend on the implementation of the projects and the funds received from them, such as associations. The associations, as shown in the research, have on average fewer people working on project implementation. On the other hand, regional and local government or state-owned companies have almost the same number of people working on projects as associations, but 5 respondents (regional and local government or state-owned companies) have mostly implemented projects with an infrastructure component, which means a different division of project tasks where most of the tasks are delegated or subcontracted. It can be concluded that there is an impact on human capital, regardless the project size and the overall project result, since the implementation requires a high willingness to learn and development of transversal skills. Also, institutions, regional and

S. Ravlić, J. Glavaš, M. Šimunić: The Impact of the IPA Cross-Border Co-operation Hungary – Croatia…Zbornik Veleučilišta u Rijeci, Vol. 8 (2020), No. 1, pp. 135-149
145
local development agencies, regional and local government bodies can offer the acquisition of knowledge, skills and abilities to more people as more employees work on project implementation even though they have lesser work load than in the other institutions that are self-financed.
The data from the table 4. show the collected results for the question about the issues the organisation faced regarding the first reimbursement, i.e. if it has been a big challenge for the organization in order to prepare and implement all the project activities in the number and percentage. The data presented in the Table 5. organizations that are financed by the state/regional or local government are not burdened at all with the pre-financing of the projects, while in the non-governmental sector it is almost always a problem, making a difference in the starting position – planning, preparation and application of projects. In this situation non-governmental sector, which is generally closer to the target group members in the local communities, is in the disadvantaged situation. This will certainly influence the preparation and application of projects to non-budget users as it requires more resources while planning and they will not be able to implement high-scale projects. Moreover, their human capital will not be able to develop their capabilities to their maximum since they will not be able to apply for higher amount of funds, thus more complex projects. On the other hand, people employed for the government might not be as challenged since their teams, as we have already seen, have more members and the work load is divided. Therefore, this situation has its own difficulties for each of the observed organizations and their human capital, both budget users and self-funded organizations.
All three statements from Table 6. show that partner organisations from both side, as part of the IPA CBC HU – CRO programs, have mutually influenced the development of skills, knowledge, capabilities of employees and business processes within the organization on both sides of the border. Also, the collected data confirm that most organisations would not surely establish partnerships with organizations from another country, partners in the project and carry out the activities of this project to this extent without EU funding or co-financing. If we talk in figures, that is if we put the analyzed data in the financial perspective of the Program, we will notice that it is a really considerable amount of funds that would not be invested and that would not have the opportunity to create changes in local communities along the Hungarian-Croatian border. If we add up the financial value of the implemented projects by 67,6% of the respondents who answered “I disagree” and “I disagree”, we get a value of 29.098.306,18 euros, which is even 57,59% of the total budget of the whole of the seven-year Program. For the respondents who are not sure or “neither agree nor agree” with the statement, we cannot fully confirm whether they were implemented or not, 17,6% of them represent a total of 28,56% of the financial value of the Program. Expressed in Euros, it is 14.430.888,06 euro. According to the opinion of the respondents, projects that can be assumed to be implemented without the initial financial assistance of EU funds are represented with a low 13.85% or only 6.999.544,02 euro. According to the aforementioned, we can confirm the strong dependence of the implemented projects and the corresponding financial amounts to the EU funds, thus all the effects in the local communities they have influenced.
As shown in the table 8., the difference between impact on regional development based on the respondents who were the ones implementing activities in the cross-border region in the period of seven years was tested. Difference was tested taking into consideration infrastructural and

S. Ravlić, J. Glavaš, M. Šimunić: The Impact of the IPA Cross-Border Co-operation Hungary – Croatia…Zbornik Veleučilišta u Rijeci, Vol. 8 (2020), No. 1, pp. 135-149
146
educational component of the implemented projects. The result can be important on several levels but mostly it could be used for the planning of future actions in the cross-border region. To further examine the attitude of project implementers and if is there a difference between those who implemented projects with a greater infrastructure component compared to those with a educational component, a Student’s t-test of independent samples was conducted. It found that, although visible, the differences were not statistically significant (Sig. = 0.105). The importance of both types of project components for a local area, according to the implementers of such activities, is equal and the undertaken activities for both components would have a significant impact, both on the people and the area where the activities are being implemented.
6. CONCLUSION
Understanding the scarcity of resources of an area and the components of the real impact that those funds can create should be explored in more detail in order to find an approach that will produce the desired results.
The complexity of the reforms imposed by the EU accession process usually overburdens the national system, making the modernization and economic, politic, financial and administrative development very difficult both at national and regional level. In order for the process to succeed, it is necessary to have cooperation between the non-governmental actors and the private sector (…) since the reform as a process covers the entire civil society in its whole complexity, being more like a social process which takes place over generations. The experience of other states which have acceded to the EU shows that the successful implementation of a reform takes years (Ivan, Lov, 2010:111). Only synergy will allow these very delicate processes to occur and will be the basis for moving in the desired direction at the personal level, institutional level and finally for the entire local space.
Although there are many detectable impact factors in a certain area, it is still necessary to try to locate those that have the greatest impact. The analysis of the economic effects of EU integration is accompanied by a number of constraints that have to be taken into account when interpreting the results. First, it is not possible to explore (or, due to the high uncertainty, it is rather impossible to comprehend) all the economic costs and benefits of Croatia’s accession to the EU. Additionally complicating the analysis is the fact that when evaluating the economic implications of the accession it is necessary to separate the processes of economic reforms, that would take place without the accession from the processes that are solely due to the integration itself (Lejour, Mervar and Verweij, 2008:2). Still, managing the resources of an area and using the available funds give us the real possibility to detect the bottleneck of a certain location, correct them and make more informed decisions in a certain situation in the future.
Further research in this area should certainly examine more “in depth” the real impacts that invested EU funds has created at the personal, local and regional level in the cross border areas of intervention.

S. Ravlić, J. Glavaš, M. Šimunić: The Impact of the IPA Cross-Border Co-operation Hungary – Croatia…Zbornik Veleučilišta u Rijeci, Vol. 8 (2020), No. 1, pp. 135-149
147
REFERENCES
Altmann, F. (2004) „Regional economic problems and prospects“, Chaillot Paper: The Western Balkans Moving on, No. 70, Institute for Security Studies, European Union, Paris., Available at https://www.iss.europa.eu/sites/default/files/EUISSFiles/cp070.pdf (10. 10. 2019.)
Babić, Z. (2005) „Participacija i ulaganje u obrazovanje u Hrvatskoj“. Privredna kretanja i ekonomska politika, Vol.14, No. 101, pp. 30.
Barro, R. J. (1990) “Government spending in a simple model of endogeneous growth”. Journal of political economy, Vol. 98, No. 5, Part 2, pp. 103-125. http://dx.doi.org/10.1086/261726
Bejaković, P. (2006) “How prepared is Croatia for a knowledge-based society?”, Ott, K., Croatian Accession to the European Union: the Challenges of Participation, Zagreb: Institute for Public Finance, pp. 109-128.
Bilas, V., Franc, S., Cota, A. (2011) „Predpristupni fondovi Europske unije i Republika Hrvatska“. Ekonomska misao i praksa, Vol. , No. 1, pp. 289-309. Available at https://hrcak.srce.hr/69723 (9. 10. 2019.)
CEC (2008) „Green Paper on Territorial Cohesion: turning territorial diversity into strength“. Communication from t h e Commission to the Council, the European Parliament, the Committee of the Regions and the European Economic and Social Committee, Brussels. Available at http://ec.europa.eu/regional_policy/archive/consultation/terco/paper_terco_en.pdf (9. 9. 2019.)
Dragičević, M., Letunić, P. (2008) „Strengths and Constraints of Regional Development in Croatia“. An Enterprise Odyssey: Tourism – Governance and Entrepreneurship, Zagreb: Ekonomski fakultet Zagreb, pp. 114-129.
Hansen, P., Knowles, S. (1998) “Human capital and returns to scale”. Journal of Economic Studies, Vol. 25, No.2, pp. 118-123. http://dx.doi.org/10.1108/01443589810202120
Ivan, A. L., Iov, C. A. (2010) „Croatia: Administrative Reform and Regional Development in the Context of EU Accension“. Transylvanian Review of Administrative Sciences, Vol. 6, No. 31, pp. 93-113.
Judson, R. (1996) “Do Low Human Capital Coefficients Make Sense?: A Puzzle and Some Answers”. Division of Research and Statistics, Division of Monetary Affairs, Federal Reserve Board. http://dx.doi.org/10.17016/FEDS.1996.13
Koerner, K., Bletzinger, T., Lanzeni, M. L., AG, D. B., Hoffmann, R. and Speyer, B. (2013) „Croatia facing challenges on the EU’s doorstep“. Available at http://www.dbresearch.com/PROD/RPS_EN-PROD/PROD0000000000457230/Croatia_facing_challenges_on_the_EU%27s_doorstep.PDF (8. 9. 2019.)
Lejour, Arjan M., Mervar, A., Verweij, G. (2008) „The Economic Effects of Croatia’s Accession to the EU“. E c o n o m i c s Discussion Paper. No. 2008-6. http://dx.doi.org/10.2139/ssrn.1726704
Mankiw, N. G., Romer, D., Weil, D. N. (1992) „A contribution to the empirics of economic growth”. The Q u a r t e r l y Journal of Economics, Vol. 107, No. 2, pp.407-437. http://dx.doi.org/10.2307/2118477
Marijanović, G., Čućić, D., Žalac, G. (2010) „Role Of Development Agencies In The Regional Development Of The Republic Of Croatia“. Interdisciplinary Management Research, Josip Juraj Strossmayer University of Osijek, Faculty of Economics, Croatia, Vol. 6, pp. 990-1000.
Otani, I., Villanueva, D. (1990) “Long-term growth in developing countries and its determinants: An Empirical Analysis”. World Development. Vol. 18, No. 6, pp.769-783.
Poorfaraj, A., Samimi, A. J., Keshavarz, H. (2011) “Knowledge and economic growth: Evidence from some developing countries”. Journal of Education and Vocational Research, Vol. 1, No.1, pp.21-25. http://dx.doi.org/10.22610/jevr.v1i1.4
Ravlić, S. (2019) “Implemented projects in the cross-border area and their impact on the development of human resources and the increase of revenues”. Unpublished doctoral dissertation. University of J. J. Strossmayer, Postgraduate doctoral study “Management“, Croatia, Osijek.
Strategic Framework for Development of Republic of Croatia 2006-2013. Available at https://razvoj.gov.hr/UserDocsImages//arhiva/Publikacije//Strateski_okvir_za_razvoj_2006_2013.pdf (7. 9. 2019.)

S. Ravlić, J. Glavaš, M. Šimunić: The Impact of the IPA Cross-Border Co-operation Hungary – Croatia…Zbornik Veleučilišta u Rijeci, Vol. 8 (2020), No. 1, pp. 135-149
148
Swinburn, G. (2006) “Argumentation and Reference Paper on Local Economic Development”. Available at https://www.eda.admin.ch/dam/deza/en/documents/themen/privatsektorentwicklung/162773-led-argumentation-paper_EN.pdf (8. 10. 2019.)
Tišma, S., Samardžija, V., Jurlin, K., (2012) “Hrvatska i Europska unija. Prednosti i izazovi članstva”. Institut za međunarodne odnose – IMO, Zagreb. Available at http://www.irmo.hr/wp-content/uploads/2013/11/hrvatska_i_eu_prednosti_izazovi_.pdf (3. 10. 2019.)
UNDP (1999) Human Development Report, Zagreb, Croatia. Available at http://hdr.undp.org/en/content/national-human-development-report-croatia-1999 (3. 10. 2019.)

S. Ravlić, J. Glavaš, M. Šimunić: The Impact of the IPA Cross-Border Co-operation Hungary – Croatia…Zbornik Veleučilišta u Rijeci, Vol. 8 (2020), No. 1, pp. 135-149
149
Izvorni znanstveni rad https://doi.org/10.31784/zvr.8.1.15 Datum primitka rada: 6. 12. 2019. Datum prihvaćanja rada: 10. 1. 2020.
UTJECAJ PROGRAMA IPA PREKOGRANIČNE SURADNJE MAĐARSKA – HRVATSKA 2007. – 2013. –
INFRASTRUKTURA, TURIZAM I LJUDSKI KAPITALSanela Ravlić
Dr. sc., viši stručni savjetnik za provedbu projekata, Hrvatski zavod za zapošljavanje, Regionalni ured Osijek, Kneza Trpimira 2, 31 000 Osijek, Hrvatska; e-mail: [email protected]
Jerko Glavaš Dr. sc., izvanredni profesor, Sveučilište J. J. Strossmayera u Osijeku, Ekonomski fakultet u Osijeku, Trg
Ljudevita Gaja 7, 31 000 Osijek, Hrvatska; e-mail: [email protected]
Mislav Šimunić Dr. sc., redoviti profesor, Sveučilište u Rijeci, Fakultet za menadžment u turizmu i ugostiteljstvu,
Primorska 42, 51 410 Opatija, Hrvatska; e-mail: [email protected]
SAŽETAKGlavna svrha ovog rada jest kvantificiranje i jasno razlikovanje postignuća uloženih IPA sredstava na području prekogranične suradnje Mađarske i Hrvatske 2007. - 2013. Cilj rada je pružiti uvid u stvarni utjecaj dodijeljenih financijskih sredstava u mjeri koja dosad nije ispitivana na razini institucija (vodeći korisnik i projektni partneri) i članova ciljne skupine. Glavno istraživačko pitanje jest kakav utjecaj su imali implementirani projekti u IPA CBC HU - CRO u pogledu različitih institucija, vrsta aktivnosti, korisnika u lokalnim zajednicama i regionalnog razvoja? Istraživanje je provedeno u travnju/svibnju 2018. godine. Upitnik se sastojao od 41 varijable. Intervju je bio korektivna metoda. Analiza podataka provedena je pomoću SPSS v23. Ukupno su sudjelovala 102 ispitanika, predstavnika 358 institucija koje su provodile projekte u prekograničnom području. Podaci su prvo analizirani korištenjem deskriptivne statistike, zatim uspoređeni pomoću t-testa i provedenog ANOVA Chi-kvadrat kako bi se utvrdila vjerojatnost korelacije između varijabli. Rad prikazuje rezultate na osobnoj, organizacijskoj i regionalnoj razini. Potvrđena je razlika ljudskog kapitala u različitim institucijama koje provode projekte i visoka ovisnosti EU fondova u cijeloj regiji. Krajnji korisnici su svjesniji utjecaja koji aktivnosti cjeloživotnog učenja mogu imati na njihovu konkurentnost na tržištu rada. Ulaganje u održivo okruženje, turizam, razvoj gospodarske suradnje, infrastrukturu i zajedničke ljudske kapacitete imat će značajan utjecaj na regiju.
Ključne riječi: Ljudski kapital, Europska unija, regionalni razvoj, prekogranična suradnja
Creative Commons Attribution – NonCommercial 4.0 International License


R. Rusielik, B. Szczecińska: Technical Efficiency of Agriculture in EU CountriesZbornik Veleučilišta u Rijeci, Vol. 8 (2020), No.1, pp. 151-168
151
Original scientific paper https://doi.org/10.31784/zvr.8.1.16 Received: 11. 12. 2019. Accepted: 2. 3. 2020.
TECHNICAL EFFICIENCY OF AGRICULTURE IN EU COUNTRIES
Robert Rusielik PhD, Assistant Professor, ORCID 0000-0001-9821-4047, The West Pomeranian University of Technology
Szczecin, Faculty of Economics, Szczecin, Poland; e-mail: [email protected]
Beata Szczecińska PhD, Assistant Professor, ORCID 0000-0002-7718-777X, The West Pomeranian University of Technology
Szczecin, Faculty of Economics, Szczecin, Poland; e-mail: [email protected]
JEL: C38 , D24
ABSTRACTThe study attempts to assess the technical efficiency of agriculture in European Union countries. Two methods were used for this purpose. One was to establish a ranking and separate typological groups of countries similar to each other in terms of technical efficiency of agriculture, using the Hellwig’s taxonomic measure of development. The second one concerned the measurement of technical efficiency of EU countries using the DEA (Data Envelopment Analysis) method. A set of 6 variables determining the technology of agricultural activity was adopted for the model. The model assuming the variable effects of the BCC scale was adopted for the study. Based on the variables adopted for the DEA model, a set of diagnostic indicators was defined, which finally included 5 indicators. Based on these indicators, by means of a linear ordering method based on a synthetic variable, countries were grouped into 4 groups bringing together countries from the lowest to the highest efficiency. The results of both methods overlap in the part concerning the countries with the best efficiency. In other groups there are slight discrepancies that may result from limited access to information and selection of variables for research.
Key words: agriculture, efficiency, Hellwig’s taxonomical measure of development, Data Envelopment Analysis
Creative Commons Attribution – NonCommercial 4.0 International License

R. Rusielik, B. Szczecińska: Technical Efficiency of Agriculture in EU CountriesZbornik Veleučilišta u Rijeci, Vol. 8 (2020), No.1, pp. 151-168
152
1. INTRODUCTION
In the European Union, agriculture maintains its consistently significant role, it is therefore equally significant that agricultural efficiency be measured properly. EU Member States differ in terms of their level of development and – therefore – the efficiency with which they utilize their resources and make investments. With regard to the financing of agriculture, the Common Agricultural Policy has changed over the years in line with the assumptions of such reforms as „Agenda 2000”, „Mid Term Reform”, „Health Check”, the direct and indirect payment system, and the coupling of payments according to with non-market (mainly environmental) objectives. The implementation of these policies affects the efficiency and productivity of agricultural activity, and particularly the value of inputs and outputs, the consequences of investment decisions, the risks and the opportunities for growth and development in the sector, which has been emphasized in the papers of Kumbhakar and Lien (2010), Zhu and Oude-Lansink (2010), and Quiroga et al. (2017).
Although the Common Agricultural Policy has become more environmentally and socially responsible, it still needs to be competitive, and that is achieved by an effective and efficient agricultural production (Quiroga et al. 2017). In turn, the European Union’s sustainable development policy pursues the increasing of efficiency through deintensification, by resorting to technological progress and innovation. This means that as long as there are differences in respect of the level of agricultural development between particular regions, the funds designed for supporting agriculture and the implementation of that policy should be kept distributed and absorbed, also on the basis of analyzing the differences between countries in terms the efficiency of the inputs and outputs that they utilize. Therefore, it is essential that efficiency be studied both at the level of farms and countries/regions. The use of differing measurement methods may be the cause of issues, though, which is made even worse by the scarcity of papers comparing the different approaches to the methods and variables to be used for that purpose.
The main objective of the study was to attempt at assessing the technical efficiency of agriculture of EU Member States in three different years, namely 2007, 2011 and 2016. This efficiency pertained to the given country’s entire agriculture, and not just particular farm categories selected with regard to size or production type. The research consisted of two parts. One involved establishing a ranking and singling out typological groups of states similar to each other in terms of the technical efficiency of their agriculture, using Hellwig’s taxonomic measure of development. The other one involved a relative measurement of the EU Member States’ technical efficiency using the DEA (Data Envelopment Analysis) method. The authors of the present study believe that adopting different approaches simultaneously increases the credibility of the study and provides additional knowledge that can be used both in implementing agricultural policy and pursuing individual agricultural business objectives. What is innovative about this research as that it compares the results of two different approaches to assessing the efficiency of agriculture in EU Member States.
2. TECHNICAL EFFICIENCY OF AGRICULTURE IN SCIENTIFIC RESEARCH
Efficiency as a concept does not have a single clear definition, but what is certain about it is that it always describes a positive attribute of the undertaken activities. Its detailed sense is related to

R. Rusielik, B. Szczecińska: Technical Efficiency of Agriculture in EU CountriesZbornik Veleučilišta u Rijeci, Vol. 8 (2020), No.1, pp. 151-168
153
the nature of the activity being assessed, the assessing entity, the objectives of the analyses, etc. It is derived from the concepts of productivity and efficiency. In 1957, Farrell asserted that they both referred to the performance of the unit transforming inputs into outputs. He claimed that productivity was the ratio of actual outputs to actual inputs. The so-defined productivity had merely a purely theoretical meaning, as it could only be measured where there was one outcome. Where there were more output and inputs, it was necessary to refer to a different measure, i.e. efficiency. In Farrell’s opinion, efficiency described the relationship between the productivity of the given unit and the productivity of an efficient unit, i.e. the maximum productivity the attaining of which was possible under the given technological circumstances. In turn, T. Coelli et al. concluded in 1998 that the total efficiency of the enterprise was the resultant of the two components: technical efficiency reflecting the enterprise’s ability to reach maximum production using the given group of inputs, and allocative efficiency showing the enterprise’s ability to use inputs in optimum proportions, at established prices and with an established production technology.
According to K.R. Shanmugam and A. Venkataramani (2006), the efficiency of an agricultural farm can also be measured in terms of allocative efficiency (which reflects of the farm’s capability of utilizing inputs in optimal proportions taking into account their relevant prices) and technical efficiency. In their paper, they also studied technical efficiency, defining it as a business entity’s capability and readiness to achieve maximum production (frontier production) with a specific level of inputs and technology. For this purpose, they used a stochastic frontier production function model which allowed them to establish the mean technical efficiency for different agricultural farms.
Similar research was carried out by J.G. Djokoto, F.Y. Srofenyoh and A. Afrane-Arthur (2016). According to them, the first step on the way to improve technical efficiency was to measure it. They proposed that the relationship should be established between global production and frontier production that allowed for determining the gap between the two, which they called technical inefficiency. In their studies of technical inefficiency, they used meta-regression, determining the technical inefficiency variable as an exogenous variable in the model.
The technical efficiency of agricultural production has also been studied by A. Skarżyńska (2017). In her research, it was established through: an assessment of technical productivity (the productivity of individual factors of production), the technical efficiency of land (measured by the efficiency of the studied plant production activities), the technical efficiency of labor (the volume of production from 1 ha per 1 hour of labor inputs) and the technical efficiency of fixed assets (the volume of production per PLN 100 of the value of the invested fixed capital). This allowed her to compare farms from different regions of Poland in terms of their technical efficiency.
Agricultural efficiency can also be studied using the DEA (Data Envelopment Analysis) method. Literature is rich in reports on measuring this phenomenon with the help of the aforementioned approach, with researchers taking various perspectives, from economic through environmental and social. Such research is carried out at the levels of farms, countries and regions and focuses on diverse types of farms, crops, sizes and other aspects. The ScienceDirect databases render hundreds of search results for the last 10 years for conditions such as ‘agriculture, efficiency DEA’. However,

R. Rusielik, B. Szczecińska: Technical Efficiency of Agriculture in EU CountriesZbornik Veleučilišta u Rijeci, Vol. 8 (2020), No.1, pp. 151-168
154
there has not been much research into agricultural efficiency in EU Member States (Martinho, 2017). Most papers at the level of the EU or its regions only adopt one group of methods, with non-parametric methods, mainly DEA, prevailing definitively. Studies by Akande, 2012; Baran, 2016; Błażejczyk-Majka 2011, 2017; Bojnec et al. 2014; Cankurt et al. 2013; Iliyasu et al. 2016, Guth & Smędzik-Ambroży, 2019; Gavurova et al. 2019; Kołodziejczak, 2015; Nowak, Kijek, Domańska, 2015; Staniszewski, 2018 and Toma et al., 2017, which measured efficiency using various models and various sets of variables, are a number of examples.
Studies using parametric methods that first of all estimate the efficiency curve to be subsequently used as a basis for comparisons between actual units are less abundant in literature. However, there are many more papers adopting SFMs (Stochastic Frontier Models), which usually focus on a single country or region or production type (e.g. Rudinskaya et al., 2019, Quiroga et al., 2017, Zhu et al., 2008 and 2011). Extended research using two or more efficiency assessment methods can be found in the papers of Kočišová, 2015; Hoang and Trung, 2013; Marzec, 2019; Vlontzos et al., 2017, and others.
3. DESCRIPTION OF THE STATISTICAL MATERIAL
As mentioned before, the objective of the study was to apply two approaches to assessing agricultural efficiency of EU Member States. One of them made use of the assumptions of the DEA (Data Envelopment Analysis) method. The other involved linear ordering, which means that the synthetic measure of development was first calculated and subsequently used as a basis for establishing a ranking of units and grouping them with regard to the phenomenon studied herein. The obtained results allowed for determining whether there were differences between the results of assessments of the efficiency of individual countries or groups of countries depending on the method applied. EUROSTAT data were obtained for the purposes of the study. Comparisons were made for three periods, namely 2007, 2011 and 2016.
As the two approaches make use of different types of diagnostic criteria, an attempt was made to single out such data that could be used for comparisons. Due to the nature of the DEA method, a model was first constructed that included data concerning the main production factors, such as land, capital and labor. The data were grouped into a set of variables, the combination of which reflected the agricultural production technology in place. The model variables were selected on the basis of a literature review. The following set of variables was adopted: (y1) agricultural production (EUR million), (x1) agricultural area (thous. of hectares), (x2) labor (thous. of AWU), (x3) direct costs (EUR million), (x4) farming overheads (EUR million) and (x5) depreciation (EUR million). Direct costs (x3) included expenses on: seeds and seed potatoes, fertilizers, protection, veterinary applications and feed. The costs under the (x4) variable included expenses on: power, materials, building maintenance, agricultural services and other indirect costs.
A preliminary statistical analysis of these variables showed significant diversity between the individual countries in terms of the scale of their agricultural activity. One of the effects of the preliminary analysis was the adoption of the DEA model that assumes variable returns to scale and is input-oriented. This was in line with the tendencies within the EU sustainable development
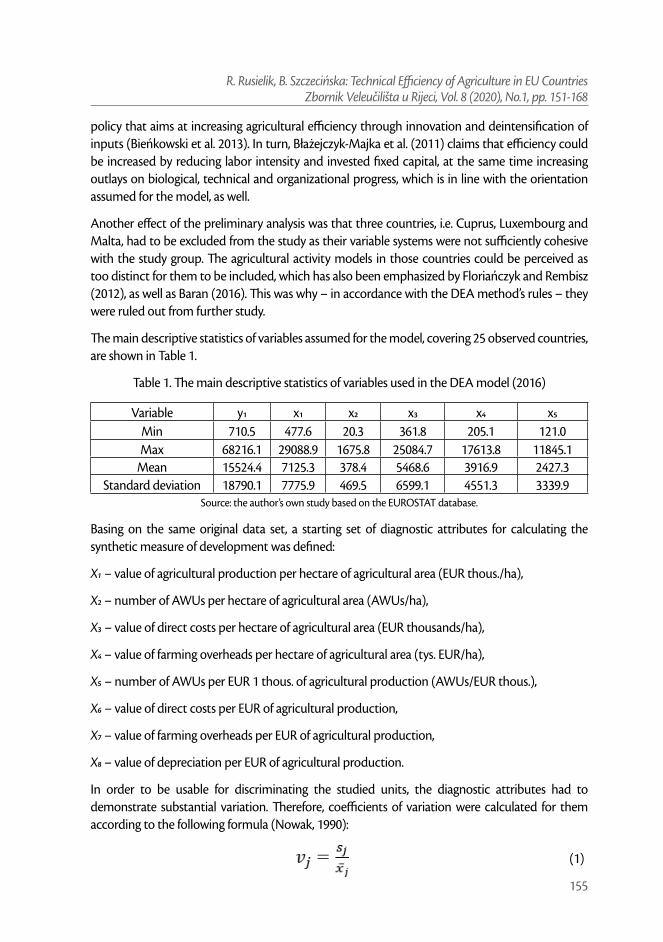
R. Rusielik, B. Szczecińska: Technical Efficiency of Agriculture in EU CountriesZbornik Veleučilišta u Rijeci, Vol. 8 (2020), No.1, pp. 151-168
155
policy that aims at increasing agricultural efficiency through innovation and deintensification of inputs (Bieńkowski et al. 2013). In turn, Błażejczyk-Majka et al. (2011) claims that efficiency could be increased by reducing labor intensity and invested fixed capital, at the same time increasing outlays on biological, technical and organizational progress, which is in line with the orientation assumed for the model, as well.
Another effect of the preliminary analysis was that three countries, i.e. Cuprus, Luxembourg and Malta, had to be excluded from the study as their variable systems were not sufficiently cohesive with the study group. The agricultural activity models in those countries could be perceived as too distinct for them to be included, which has also been emphasized by Floriańczyk and Rembisz (2012), as well as Baran (2016). This was why – in accordance with the DEA method’s rules – they were ruled out from further study.
The main descriptive statistics of variables assumed for the model, covering 25 observed countries, are shown in Table 1.
Table 1. The main descriptive statistics of variables used in the DEA model (2016)
Variable y1 x1 x2 x3 x4 x5Min 710.5 477.6 20.3 361.8 205.1 121.0Max 68216.1 29088.9 1675.8 25084.7 17613.8 11845.1
Mean 15524.4 7125.3 378.4 5468.6 3916.9 2427.3Standard deviation 18790.1 7775.9 469.5 6599.1 4551.3 3339.9
Source: the author’s own study based on the EUROSTAT database.
Basing on the same original data set, a starting set of diagnostic attributes for calculating the synthetic measure of development was defined:
X1 – value of agricultural production per hectare of agricultural area (EUR thous./ha),
X2 – number of AWUs per hectare of agricultural area (AWUs/ha),
X3 – value of direct costs per hectare of agricultural area (EUR thousands/ha),
X4 – value of farming overheads per hectare of agricultural area (tys. EUR/ha),
X5 – number of AWUs per EUR 1 thous. of agricultural production (AWUs/EUR thous.),
X6 – value of direct costs per EUR of agricultural production,
X7 – value of farming overheads per EUR of agricultural production,
X8 – value of depreciation per EUR of agricultural production.
In order to be usable for discriminating the studied units, the diagnostic attributes had to demonstrate substantial variation. Therefore, coefficients of variation were calculated for them according to the following formula (Nowak, 1990):
(1)

R. Rusielik, B. Szczecińska: Technical Efficiency of Agriculture in EU CountriesZbornik Veleučilišta u Rijeci, Vol. 8 (2020), No.1, pp. 151-168
156
where:
– standard deviation of the number j attribute,
– mean value of the attribute,
,
– number of attributes.
Subsequently, they were compared to the arbitrarily assumed critical value (in this study ). If there had been such values for which , they would have had to be excluded
from the set of potential attributes. However, all the attributes assumed in this study demonstrated considerable variation, with their coefficients of variation adopting the following value ranges: in 2007 = 16.33%-128.31%; in 2011 = 14.78 % –129.97 % and in 2016 = 17.50 % – 129.31 %. It should also be added that they were characterized by strong or very strong asymmetry.
The potential attributes characterizing the agricultural efficiency of EU Member States could be linked with one another, which might have resulted in replication of information about the units. For this reason, the degree of their correlation had to be determined and those attributes that were strongly linked to others needed to be removed. To this effect, a matrix of coefficients of correlation between the attributes was established, on the basis of which attributes were selected for the study using the parametric method proposed by Hellwig (Nowak 1990). The final set of attributes comprised five coefficients: X4, X5, X6, X7, X8. All of them were destimulants, meaning that from the point of view of the studied phenomenon the lower values the more favorable they were. The descriptive parameters for the assumed attributes are shown in Table 2.
Table 2. Values of the main descriptive parameters for the diagnostic attributes assumed for the study in 2007, 2011 and 2016
Diagnostic attribute Years X4 X5 X6 X7 X8
Mean2007 0.566 0.052 0.369 0.258 0.1432011 0.685 0.038 0.378 0.276 0.1422016 0.685 0.036 0.379 0.279 0.152
Standard deviation2007 0.726 0.045 0.060 0.070 0.0562011 0.890 0.029 0.056 0.079 0.0542016 0.886 0.028 0.066 0.074 0.056
Coefficient of variation
2007 128.305 87.563 16.328 27.172 39.3532011 129.969 75.875 14.785 28.443 37.7552016 129.314 79.492 17.501 26.565 36.884
Minimum value2007 0.147 0.007 0.242 0.120 0.0382011 0.192 0.005 0.264 0.140 0.0652016 0.227 0.006 0.245 0.128 0.074
Maximum value2007 3.963 0.167 0.461 0.390 0.2962011 4.841 0.093 0.511 0.484 0.2832016 4.817 0.113 0.514 0.415 0.301
Source: the author’s own calculations

R. Rusielik, B. Szczecińska: Technical Efficiency of Agriculture in EU CountriesZbornik Veleučilišta u Rijeci, Vol. 8 (2020), No.1, pp. 151-168
157
4. METHODS AND RESULTS
The methods for ordering the set of objects may be divided into linear and non-linear ones. The former of them allow for establishing the hierarchy of the objects according to a specified criterion. The latter, though, are only used to indicate objects similar in terms of the values of their features (Panek, 2009). Linear ordering methods are in universal use in economic studies, where they are applied to comparisons between units with regard to the studied phenomenon. They can be used for determining the ranking of various units with regard to different phenomena. Procedures based on the synthetic variable are one type of such methods. The linear ordering methods include, among others, also synthetic value-based procedures that use model and non-model indicators (Grabiński, 1992; Pociecha et al., 1988). In the non-model methods, the synthetic value is a function of standardized values of the input variables. The model methods, on their part, resort to the concept of the model object, i.e. a model object carrying desired values of the input variables. The synthetic measure is constructed on the basis of a measurement of the distance between the observed object and the model object (Panek, 2009; Tarczyński, Łuniewska, 2006).
In this paper, a classical approach to the model method was used for constructing the taxonomic measure of development. The classical measure of development is based on standardized z_ij values of the diagnostic features, therefore (Nowak, 1990, cf. Bąk, Szczecińska, 2013):
Subsequently, for each studied object its distance from the established model of development is determined along with the formula:
whereas for the stimulants , and for the destimulants .
The synthetic measure of development is determined using the following formula:
where:
– mean value of ,
– their standard deviation ,
– a constant value determined according to the formula (5).

R. Rusielik, B. Szczecińska: Technical Efficiency of Agriculture in EU CountriesZbornik Veleučilišta u Rijeci, Vol. 8 (2020), No.1, pp. 151-168
158
Using both the formula for calculating the synthetic measure of development and the information that the measure’s values range between 0 and 1, the limit for the a constant was determined (Tarczyński, Łuniewska 2006) 1:
The values of the synthetic variable for individual EU Member States, with account taken of the assumed diagnostic attributes, are shown in Table 3.
Table 3. Values of Hellwig’s synthetic variables for EU Member States in 2007, 2011 and 2016
Member State
Year2007 2011 2016
Value of measure
PlaceValue of measure
PlaceValue of measure
Place
Austria 0.321 17 0.359 16 0.302 20Belgium 0.405 11 0.244 21 0.342 16Bulgaria 0.255 22 0.344 18 0.519 6Croatia 0.509 6 0.418 11 0.428 13Czech 0.332 16 0.436 9 0.507 7
Denmark 0.344 15 0.391 14 0.322 18Estonia 0.520 4 0.471 6 0.220 23Finland 0.088 24 0.056 24 0.044 25France 0.542 3 0.558 3 0.553 5
Germany 0.425 9 0.484 5 0.436 12Greece 0.673 2 0.581 2 0.671 2
Hungary 0.392 12 0.465 7 0.562 3Ireland 0.379 13 0.377 15 0.474 11
Italy 0.427 8 0.405 13 0.499 8Latvia 0.300 18 0.177 23 0.276 21
Lithuania 0.415 10 0.409 12 0.380 14Netherlands 0.065 25 0.009 25 0.087 24
Poland 0.480 7 0.427 10 0.477 10Portugal 0.513 5 0.443 8 0.556 4Rumania 0.247 23 0.357 17 0.251 22Slovakia 0.279 20 0.243 22 0.363 15Slovenia 0.266 21 0.286 20 0.329 17
Spain 0.760 1 0.695 1 0.763 1Sweden 0.284 19 0.296 19 0.319 19
UK 0.378 14 0.538 4 0.490 9Source: the author’s own calculations.
All three rankings were topped by the same countries: Spain and Greece. They demonstrated the lowest values of such coefficients as farming overheads per unit of revenue, and AWUs per unit of revenue. The lowest raking positions in all the analyzed years were occupied by Finland and the
1 Here, ,which is why was accepted for calculating the synthetic measure of development.

R. Rusielik, B. Szczecińska: Technical Efficiency of Agriculture in EU CountriesZbornik Veleučilišta u Rijeci, Vol. 8 (2020), No.1, pp. 151-168
159
Netherlands. With regard to the X4 and X7 coefficients, these countries exceeded the average for all the units studied by far, and as these coefficients are destimulants their results should be treated as negative.
The three means method (Nowak 1990, p. 93) was used to group units bearing similarities in respect of the studied phenomenon, in line with the following rules:
group 1:
group 2:
group 3:
group 4:
where:
– mean value of the measure,
– standard deviation of the measure.
This method allowed for the set of the EU Member States to be divided into four group encompassing units bearing similarities with regard to agricultural efficiency (Table 4).
Table 4. EU Member States grouped with regard to efficiency in 2007, 2011 and 2016
GroupsEU Member States
2007 2011 2016
I Spain, Greece, France Spain, Greece, France, United
KingdomSpain, Greece
II
Estonia, Portugal, Croatia, Poland, Italy, Germany,
Lithuania, Belgium, Hungary
Germany, Estonia, Hungary, Portugal, Czech Republic, Poland, Croatia, Lithuania,
Italy, Denmark
Hungary, Portugal, France, Bulgaria, Czech Republic,
Italy, United Kingdom, Poland, Ireland, Germany,
Croatia
III
Ireland, United Kingdom, Denmark, Czech Republic,
Austria, Latvia, Sweden, Slovakia, Slovenia, Bulgaria, Romania
Ireland, Austria, Romania, Bulgaria, Sweden, Slovenia,
Belgium, Slovakia
Lithuania, Slovakia, Belgium, Slovenia, Denmark, Sweden,
Austria, Latvia, Romania
IV Finland, Netherlands Latvia, Finland, Netherlands Estonia, Netherlands, FinlandSource: the author’s own calculations.
The first group included those EU Member States whose synthetic measure value was higher than or equal to its mean value plus the standard deviation. These countries were assessed as the best

R. Rusielik, B. Szczecińska: Technical Efficiency of Agriculture in EU CountriesZbornik Veleučilišta u Rijeci, Vol. 8 (2020), No.1, pp. 151-168
160
from the point of view of agricultural efficiency. In 2007, this group comprised three countries (12 %), in 2001 four countries (16 %) and in 2016 only two countries (a mere 8 % of the total study group). In each of the analyzed years this group demonstrated the lowest mean values for the following destimulants: X4, X6, X7, X8.
The second group included those countries which were assessed as good in terms of the phenomenon studied herein. Depending on the period of study, their number ranged from 9 in 2007 (36 %) to 11 in 2016 (44 %). These EU Member States achieved good results when compared to the overall average values, especially with regard to the X7 and X8 coefficients. They stand a chance of improving their ranking position in the coming years.
The third group was the largest in 2007, when it comprised 11 countries (44 %). In comparison with the other groups, this one demonstrated the worst (highest) mean value for the X5 coefficient and worse mean values than groups 1 and 2 for the X6, X7 and X8 coefficients.
The last group included countries demonstrating the worst efficiency with regard to the analyzed coefficients. Their value of the synthetic measure was lower than the average value minus the standard deviation. Their poor positions mainly stemmed from their least favorable average levels in respect of such attributes as X4 and X8.
The DEA method is based on the concept of productivity authored by G. Debreu (1951) and M.J. Farrell (1957). Farrell created the concept of „efficiency frontier” or „(best practice) production frontier”. This frontier is accepted as the technology frontier of the production capacity achievable for the given decision-making unit (DMU) (in this study, the DMUs are represented by the individual EU Member States). Farrell’s concept provided for measuring the given DMU’s efficiency in relation to other units employing a similar production technology. From a single input and a single output, this idea was subsequently expanded to multi-dimensional cases through the research of A. Charnes, W. W. Cooper and E. Rhodes in 1978, who proposed a model assuming constant returns to scale, most frequently referred to in literature as the CCR model. With the development of research making use of this method’s assumptions, numerous alternative models and modifications to the original CCR model have been offered. As mentioned before, in this study the input-oriented BCC model assuming variable returns to scale was used (Banker, Charnes, Cooper, 1984).
The efficiency measurement concept applied in the CCR and BCC models makes use of one of the most popular techniques described in, inter alia, the paper titled „Production Frontiers” (Färe et al., 1995). If s – outcomes and m – inputs are available, technical efficiency can be derived using this formula (7):
where: yr – value of the outcome, ur – weight of the outcome, xi – value of the input, vi – weight of the input.

R. Rusielik, B. Szczecińska: Technical Efficiency of Agriculture in EU CountriesZbornik Veleučilišta u Rijeci, Vol. 8 (2020), No.1, pp. 151-168
161
For each unit, a linear programming problem is solved, where the derived efficiency measure takes the form of the objective function subject to maximization, and the variables subject to optimization take the form of the weights of outcomes and inputs. For input-oriented models, it is as follows (8):
with the following constraints (9):
where: Xo – input vector for the given unit (sized [1 × m]);
X – input matrix for all units (sized [n × m]);
Yo – outcome vector for the given unit (sized [1 × s]);
Y – outcome matrix for all units (sized [n × s]);
1,..., – linear combination coefficients;
– the efficiency measure of the unit.
The problem was solved for all n of the units. The purpose of the optimization was to find the minimum value of the efficiency measure for which inputs or resources could be reduced without affecting the level of the output. Where such reduction was not possible, then p = 1, which meant that a more favorable combination allowing the unit to achieve the same outcome did not exist. In that case, the unit was referred to as economically efficient. However, where < 1, there existed a more favorable input combination allowing for the same outcome to be achieved. The parameter determined the percentage of the observed unit’s inputs that was sufficient to achieve the current outcome level using the technology of efficient units. The information on the structure of the optimal input and outcome combination was provided by linear combination coefficients (Rusielik, 2017).
In 1984, Banker, Charnes and Cooper proposed that the CCR model be expanded to the BCC model assuming variable returns to scale (Banker, Charnes, Cooper, 1984). For this purpose, the CCR model can be modified by adding the convexity constraint =1, which results in the following model (10):

R. Rusielik, B. Szczecińska: Technical Efficiency of Agriculture in EU CountriesZbornik Veleučilišta u Rijeci, Vol. 8 (2020), No.1, pp. 151-168
162
with the following constraints (11):
This assumption causes the efficiency outcomes to be more precise in this model than those obtained under the CCR model assumptions.
For the observed group of 25 UE Member States, technical efficiency measures were derived using the input-oriented BCC model assuming variable returns to scale. The synthetic measurement scores, together with basic statistical data for the entire group of counties subject to comparison, are presented in Table 5.
Table 5. Mean technical efficiency (for the BCC model) of agricultural activity in selected European Union Member States in 2007, 2011 and 2016
Factor 2007 2011 2016Number of countries 25 25 25
Mean 0.922 0.956 0.982Minimum 0.724 0.787 0.890Maximum 1.000 1.000 1.000
Standard deviation 0.088 0.056 0.029Efficient countries 11 16 15
Source: the author’s own study
In the studied years, the mean efficiency measure kept growing. In 2007, it was 0.922, and grew to 0.982 by 2016, and so did the minimum efficiency level. The differences in efficiency levels between the observed countries decreased over these years, with the standard deviation dropping from 0.088 to 0.029, as well. The number of countries deemed as efficient grew from 11 in 2007 to 16 in 2011 and dropped to 15 in 2016.
The technical efficiency measures for the individual countries are shown in Table 6. The table also provides the numbers assigned to the groups created using the three means method on the basis of the synthetic measure value.

R. Rusielik, B. Szczecińska: Technical Efficiency of Agriculture in EU CountriesZbornik Veleučilišta u Rijeci, Vol. 8 (2020), No.1, pp. 151-168
163
Table 6. Technical efficiency of agriculture derived using the BCC model, and the typological groups created on the basis of the taxonomic measure of development in European Union
Member States in 2007, 2011
Country2007 2011 2016
BCC Group BCC Group BCC GroupAustria 0.898 III 0.953 III 0.951 IIIBelgium 1.000 II 1.000 III 1.000 IIIBulgaria 1.000 III 1.000 III 1.000 IICroatia 0.963 II 1.000 II 1.000 II
Czech Republic 0.836 III 0.900 II 0.944 IIDenmark 1.000 III 1.000 II 1.000 IIIEstonia 1.000 II 1.000 II 1.000 IVFinland 0.814 IV 0.787 IV 0.890 IVFrance 1.000 I 1.000 I 1.000 II
Germany 0.994 II 1.000 II 1.000 IIGreece 1.000 I 1.000 I 1.000 I
Hungary 0.767 II 0.890 II 0.964 IIIreland 0.856 III 0.922 III 0.971 II
Italy 1.000 II 1.000 II 1.000 IILatvia 0.887 III 1.000 IV 1.000 III
Lithuania 0.937 II 0.901 II 0.962 IIINetherlands 1.000 IV 1.000 IV 1.000 IV
Poland 1.000 II 1.000 II 1.000 IIPortugal 0.872 II 0.895 II 0.988 IIRomania 0.724 III 0.958 III 0.930 IIISlovakia 0.863 III 1.000 III 1.000 IIISlovenia 1.000 III 1.000 III 1.000 III
Spain 1.000 I 1.000 I 1.000 ISweden 0.835 III 0.922 III 0.957 III
United Kingdom 0.817 III 1.000 I 0.989 IISource: the author’s own study
Our analysis of the efficiency measure levels showed that 11 of the observed EU Member States were efficient. These were Belgium, Bulgaria, Denmark, Estonia, France, Greece, Italy, the Netherlands, Poland, Slovenia and Spain. Three more countries, namely Croatia, Latvia and Germany joined the group of efficient states in 2011 and were still part of it in 2016. The United Kingdom joined the group in 2011, as well, but its efficiency measure dropped slightly in 2016. The remaining countries demonstrated certain levels of inefficiency in all of the studied years. In 2007, the group of lowest efficiency countries included Romania (with an efficiency level of 72.4%), Hungary (76.7%) and

R. Rusielik, B. Szczecińska: Technical Efficiency of Agriculture in EU CountriesZbornik Veleučilišta u Rijeci, Vol. 8 (2020), No.1, pp. 151-168
164
Finland (81.4%). In 2011, this group included Finland (78.7%), Hungary (89.0%) and Portugal(89.5%). In 2016, it included Finland (89.0%), Romania (93.0%) and Czech Republic (94.4%).
5. CONCLUSION
The main goal of the research was to assess the effectiveness of agriculture in the European Union. We assumed that this is important because of the significant role it plays in the European economy. Agriculture in the European Union is shaped through the implementation of the Common Agricultural Policy. Financial resources for implementing this policy should also be distributed on the basis of differences in efficiency levels. The problem is that the assessment may differ due to the method used. There are no studies comparing alternative approaches. In our research, we used two different methods and performed an assessment of the level of effectiveness in individual countries. The results of both methods overlap only partially.
Comparison of the results in the first group, the highest rated in terms of effectiveness, using a synthetic measure, is consistent with the approaches used. The average technical efficiency index for this group was 1,000. All countries in this group (Spain, Greece and France) were fully technically effective in all the analysed years. In turn, Great Britain, which was in this group of countries in 2011, in other years was characterized by a certain level of technical inefficiency.
In turn, in the second group, assessed as good in all analysed years, there were countries such as Croatia, Germany, Hungary, Italy, Poland and Portugal. With the exception of Hungary and Portugal, these countries showed full technical efficiency. Three countries, i.e. the Czech Republic, Estonia and Lithuania were classified in this group in two analysed years, and among them Estonia showed full technical efficiency. The average technical efficiency index in this group ranged from 0.948 to 0.980. Unlike the previous group, there are discrepancies between the measurement results obtained using both methods. Over half of the countries can be considered as fully effective, i.e. they should be in the first group.
The third group rated as below the average in all analysed years included the following countries: Austria, Romania, Slovakia, Slovenia and Sweden, while in the two analysed years countries such as: Belgium, Bulgaria, Denmark, Ireland and Latvia. Comparing the results of the effectiveness assessment in this group, one can also notice discrepancies. According to the grouping of the synthetic index, the countries of this group should be characterized by below-average efficiency results, while the technical efficiency index shows that apart from 2007, half or more than half are countries that can be considered effective. The level of the average efficiency index in the analysed years ranged from 0.883 to 0.978 and was close to the level from the second group.
The fourth group, the least numerous one, are countries with an unfavourable level of analysed indicators. Finland and the Netherlands were in this group in all analysed years. In turn, Estonia and Latvia were in this group only in one year. In the case of this group, the level of technical efficiency index also varied. Finland showed one of the lowest performance indicators (0.787 to 0.890), while the Netherlands is shown as a fully effective country, just like Estonia and Latvia.

R. Rusielik, B. Szczecińska: Technical Efficiency of Agriculture in EU CountriesZbornik Veleučilišta u Rijeci, Vol. 8 (2020), No.1, pp. 151-168
165
Studies have shown differences in the assessment of effectiveness between the methods used. It can be assumed that making decisions based on one method or group of indicators may be wrong. In order to use financial resources in a rational manner for the implementation of the Common Agricultural Policy, redistribution of funds for this purpose should be associated with the efficiency of expenditure and resources used, but the assessment of this efficiency should be based on the analysis of the results of alternative measurement methods. At the current stage of the research, the authors are not able to answer what approaches, methods and models are the most reliable. There is no comparative study in the literature. Extending the research by analysing the results of performance assessment using several alternative methods will fill the knowledge gap on this subject. The implemented Common Agricultural Policy, despite changing priorities, will always have to be competitive, i.e. among others, it must be based on effective production. The effects of currently planned decisions related to the new financial perspective will have an impact on the efficiency of the agricultural activities of European manufacturers for many years. Hence the postulate to extend the research by assessing alternative measurement methods. This will increase the credibility of the results and help make better decisions.
REFERENCES
Akande O. P. (2012): An Evaluation of Technical Efficiency and Agricultural Productivity Growth in EU Regions. Wageningen University, Wageningen.
Banker, R. D., Charnes, A., Cooper, W. W. (1984). Some Models for Estimating Technical and Scale Inefficiency in Data Envelopment Analysis. Management Science 30, 1078–1092.
Baran, J. (2016). Efektywność polskiego rolnictwa na tle pozostałych krajów Unii Europejskiej. Wieś i Rolnictwo 3 (172)/2016, 63-85.
Bąk, I., Szczecińska, B. (2013). Wykorzystanie analizy taksonomicznej do wyznaczenia rankingu spółek sektora spożywczego notowanych na Giełdzie Papierów Wartościowych w Warszawie, Ekonometria 4(42), Wydawnictwo Uniwersytetu Ekonomicznego we Wrocławiu, Wrocław, 72-84.
Bieńkowski, J. F., Jankowiak, J., Dąbrowicz, R., Holka, M. (2013). Porównanie produkcyjności ogólnej polskiego rolnictwa na tle krajów Unii Europejskiej. Roczniki Naukowe SERiA. Tom XV, zeszyt 2, 35-40.
Błażejczyk-Majka, L. (2017). Application of DEA for evaluating the efficiency of economic policy as exemplified by EU agriculture. Studia Historiae Oeconomicae UAM vol. 35, Poznań, 163-176.
Blażejczyk-Majka, L., Kala, R., Maciejewski, K. (2011). Efektywność produkcji rolniczej na obszarze Unii Europejskiej w latach 1989-2007. Zeszyty Naukowe Szkoły Głównej Gospodarstwa Wiejskiego w Warszawie. Problemy Rolnictwa Światowego tom 11(26), nr 1, 28-38.
Bojnec, Š., Fert, Ő. I, Jámbor, A., Tóth, J. (2014), Determinants of technical efficiency in agriculture in new EU member states from Central and Eastern Europe. Acta Oecon. 64(2), 197 – 217.
Cankurt, M., Mİran, B., Gunden, C. (2013). A comparative analysis on productivity and efficiency of agricultural production of the EU and Turkey. Journal of Food, Agriculture & Environment 2013, Vol.11 No.2, 433-439.
Charnes, A., Cooper, W. W., Rhodes, E. (1978). Measuring the efficiency of decision making units. European Journal of Operational Research, Volume 2, Issue 6.
Coelli T., Rao D. S. Prasada, Battese G. E. (1998). An itroduction to efficiency and productivity analysis. Boston, Kluwer.
Debreu, G. (1951). The Coefficient of Recourse Utilisation. Econometrica, No 19 (3), July, 273–292.
R. Rusielik, B. Szczecińska: Technical Efficiency of Agriculture in EU CountriesZbornik Veleučilišta u Rijeci, Vol. 8 (2020), No.1, pp. 151-168
166
Djokoto, J., Srofenyoh, F. Y., Afrane-Arthur, A. A., (2016). Technical Inefficiency Effects in Agriculture – A Meta Regression, Journal of Agricultural Science, Vol. 8, No. 2, 109-121, https://www.researchgate.net/publication/291206413_Technical_ Inefficiency_Effects_in_Agriculture-A_Meta-Regression (accessed 05.11.2019).
Färe, R., Grosskopf, S. Lovell, A. K. (1995). Production Frontiers. Cambridge: Cambridge University Press.
Farrell, M. J. (1957). The Measurement of Productive Efficiency. Journal of the Royal Statistical Society, Series A, 1957, No 120(III), 253–281.
Floriańczyk, Z., Rembisz, W. (2012). Dochodowość a produktywność rolnictwa polskiego na tle rolnictwa unijnego w latach 2002–2010, W: Problemy rolnictwa Światowego, Zeszyty Naukowe SGGW, T 12, Zeszyt 1, Wyd. SGGW, Warszawa, 53-62.
Gavurová, B., Halásková, M., Koróny, S. (2019). Research and Development Indicators of EU28 CountriesfromView point of Super-efficiency DEA Analysis. Acta Univ. Agric. Silvic. Mendel. Brun. 67, 225–242.
Grabiński, T. (1992). Metody aksonometrii. Kraków, Akademia Ekonomiczna w Krakowie.
Guth, M., Smędzik-Ambroży, K., (2019.) Economic resources versus the efficiency of different types of agricultural production in regions of the European union, Economic Research-Ekonomska Istraživanja, DOI: 10.1080/1331677X.2019.1585270
Hoang, V. N., Trung, T. (2013) Analysis of environmental efficiency variation: a materials balance approach. Ecol Econ 86(1), 37 – 46.
Iliyasu, A, Mohamed, Z. A., Terano, R. (2016). Comparative analysis of technical efficiency for different production culture systems and species of freshwater aquaculture in Peninsular Malaysia. Aquac Rep 3, 51–57.
Kočišová, K. (2015). Application of the DEA on the measurement of efficiency in the EU countries. Agric. Econ. – Czech, 61, 51-62.
Kołodziejczak, M. (2015). Efektywność wykorzystania czynników produkcji w rolnictwie polskim na tle unii europejskiej wieś i rolnictwo, nr 2 (167) 2015, 169-192.
Kumbhakar, S. C., Lien, G. (2010). Impact of subsidies on farm productivity and efficiency. W: The Economic Impact of Public Support to Agriculture: An International Perspective, Springer, New York, 109-124.
Martinho, V. J. P. D. (2017). Efficiency, total factor productivity and returns to scale in a sustainable perspective: An analysis in the European Union at farm and regional level. Land Use Policy, 68, 232–245.
Marzec, J., Pisulewski, A., Prędki, A. (2019). Technical Efficiency and Productivity Growth of Polish Crop Farms. National Economy, 298(2), 95-125. https://doi.org/10.33119/GN/108607
Nowak, A., Kijek, T., Domańska, K. (2015). Technical efficiency and its determinants in the European Union agriculture. Agric. Econ – Czech, 61, (6), 275–283.
Nowak, E. (1990). Metody taksonomiczne w klasyfikacji obiektów społeczno-gospodarczych. Warszawa, PWE.
Panek, T. (2009). Statystyczne metody wielowymiarowej analizy porównawczej. Warszawa, Oficyna Wydawnicza SGGW.
Pociecha, J., Podolec, B., Sokołowski, A., Zając, K. (1988). Metody taksonomiczne w badaniach społeczno-ekonomicznych. Warszawa, PWN.
Quiroga, A., Suárez, C., Fernández-Haddad, Z., Philippidis, G., (2017). Levelling the playing field for European Union agriculture: Does the Common Agricultural Policy impact homogeneously on farm productivity and efficiency? Land Use Policy 63, 179–188.
Rudinskaya T., Hlavsa T., Hruska M. (2019): Estimation of technical efficiency of Czech farms operating in less favoured areas. Agricultural Economics – Czech, 65: 445–453.
Rusielik, R. (2017). Skala a efektywność techniczna produkcji trzody chlewnej. W: Wyzwania na rynku żywca wieprzowego w Polsce. Wydawnictwo SGGW, 2017, 69-78.

R. Rusielik, B. Szczecińska: Technical Efficiency of Agriculture in EU CountriesZbornik Veleučilišta u Rijeci, Vol. 8 (2020), No.1, pp. 151-168
167
Shanmugam, K. R., Venkataramani, A., (2006). Technical Efficiency in Agricultural Production and Its Determinants: An Exploratory Study at the District Level, Indian Journal of Agricultural Economics 61(2), 170-183, https://www.researchgate.net/publication/254406893_Technical_Efficiency_in_Agricultural_Production_and_Its_Determinants_An_Exploratory_Study_at_the_District_Level (accessed 03.10.2019).
Skarżyńska, A., (2017). Technical, economic and environmental efficiency of production of selected plant products in the agricultural polish regions, Problems of Agricultural Economics, 350(1), 117–137.
Staniszewski, J. (2018). Wpływ struktur wytwórczych na zrównoważoną intensyfikację produkcji rolnej w krajach Unii Europejskiej po 2004 roku. Praca doktorska. Uniwersytet Ekonomiczny w Poznaniu.
Tarczyński, W., Łuniewska, M. (2006). Metody wielowymiarowej analizy porównawczej na rynku kapitałowym. Warszawa, PWN.
Toma, P., Miglietta, P. P., Zurlini, G., Valente, D., Petrosillo, I. (2017). A non-parametric bootstrap-data envelopment analysis approach for environmental policy planning and management of agricultural efficiency in EU countries. Ecological indicators 83, 132-143.
Vlontzos, G., Pardalos, P. M. (2017). Assess and prognosticate green house gas emissions from agricultural production of EU countries, by implementing, DEA Window analysis and artificial neural networks. Renew. Sustain. Energy Rev. 2017, 76, 155–162.
Zhu, X., Demeter, R. M., Oude-Lansink, A., (2008). Competitiveness of dairy farms in three countries: the role of CAP subsidies. In: Paper Presentation at 12th Congress of the European Association of Agricultural Economists (EAAE 2008). Sevilla Spain. Jan 29th–Feb 1st.
Zhu, X., Oude-Lansink, A. (2010). Impact of CAP subsidies on technical efficiency of crop farms in Germany, the Netherlands and Sweden, Journal of Agricultural Economics, 61, 545-564.
Zhu, X., Karagiannis, G., Oude-Lansink, A., (2011). The impact of direct income transfers of CAP on greek olive farms’ performance: using a non-monotonic inefficiency effects model. J. Agric. Econ. 62, 630–638.

R. Rusielik, B. Szczecińska: Technical Efficiency of Agriculture in EU CountriesZbornik Veleučilišta u Rijeci, Vol. 8 (2020), No.1, pp. 151-168
168
Izvorni znanstveni rad https://doi.org/10.31784/zvr.8.1.16 Datum primitka rada: 11. 12. 2019. Datum prihvaćanja rada: 2. 3. 2020.
TEHNOLOŠKA EFIKASNOST POLJOPRIVREDE U ZEMLJAMA EUROPSKE UNIJE
Robert Rusielik Dr. sc., docent, ORCID 0000-0001-9821-4047, The West Pomeranian Unviersity of Technology Szczecin,
Ekonomski fakultet, Szczecin, Poljska; e-mail: [email protected]
Beata Szczecińska Dr. sc., docentica, ORCID 0000-0001-9821-4047, The West Pomeranian Unviersity of Technology Szczecin,
Ekonomski fakultet, Szczecin, Poljska; e-mail: [email protected]
JEL: C38 , D24
SAŽETAKIstraživanje pokušava ocijeniti tehnološku efikasnost poljoprivrede u zemljama Europske Unije. Dvije su metode korištene u tu svrhu. Jedna se koristila kako bi se utvrdilo rangiranje i posebne tipološke skupine zemalja koje nalikuju jedne drugima u pogledu tehnološke efikasnosti poljoprivrede koristeći Hellwigovo taksonomsko mjerenje razvoja. Druga se bavi mjerenjem tehnološke efikasnosti zemalja EU upotrebljavajući analizu omeđivanja podataka (AOMP). Niz od 6 varijabli, koje određuju tehnologiju poljoprivredne aktivnosti, prilagođen je ovomu modelu. Model koji pretpostavlja utjecaj varijabli modelom BCC prilagođen je ovom istraživanju. Temeljeno na varijablama usvojenima za analizu omeđivanja podataka (AOMP), definiran je niz dijagnostičkih pokazatelja, koje su konačno uključile 5 pokazatelja. Zasnovano na ovim pokazateljima, pomoću metode linearnog poretka prema sintetskoj varijabli, zemlje su grupirane u 4 grupe spajajući zemlje najniže i najviše efikasnosti. Rezultati obiju metoda se preklapaju u dijelu koji se odnosi na zemlje s najvećom efikasnosti. U drugim grupama postoje neznatne diskrepancije do kojih je moglo doći ograničenim pristupom informacijama i izborom varijabli za istraživanje.
Ključne riječi: poljoprivreda, efikasnost, Hellwigovo taksonomsko mjerenje razvoja, AOMP
Creative Commons Attribution – NonCommercial 4.0 International License

D. Širola: Determinants of Entrepreneurial Intentions: Empirical Evidence from Croatian PerspectiveZbornik Veleučilišta u Rijeci, Vol. 8 (2020), No. 1, pp. 169-187
169
Original scientific paper https://doi.org/10.31784/zvr.8.1.17 Received: 16. 12. 2019. Accepted: 10. 2. 2020.
DETERMINANTS OF ENTREPRENEURIAL INTENTIONS: EMPIRICAL EVIDENCE FROM
CROATIAN PERSPECTIVEDavor Širola
PhD, Senior Lecturer, Polytechnic of Rijeka, Vukovarska 58, 51 000 Rijeka, Croatia; e-mail: [email protected]
ABSTRACTThe growing body of literature is arguing that entrepreneurial intentions play a significant role in the decision-making process of becoming an entrepreneur. Bolstering the entrepreneurial and innovation-oriented mindsets, primarily among younger generations, might be considered crucial for the successful economic and social evolvement. Detecting the appropriate reasons which induce youngsters, especially students, to become entrepreneurs is a potentially valuable input for different policymakers and a problem explored in this paper. Personal attitudes, subjective norm and perceived behavioural control are called motivational ‘antecedents’ of entrepreneurial intentions and has been thoroughly studied within the theory of planned behaviour, developed by Ajzen (1991). The applicability of Ajzen’s model for predicting the main antecedents of entrepreneurial intentions were successfully tested in this study among students with or without international studying experience, as well as distinctions considering several background (individual and social) factors. The results of the correlation and regression analysis pointed out that personal attitudes towards entrepreneurship and entrepreneurial ability represent the most relevant components of the theory of planned behaviour model, while subjective norms have a minor role. Statistically significant differences were found in six factors: age, family background, household incomes, profession, country of origin, and student exchange programmes. These results confirmed previous conclusions about the explanation power of Ajzen’s model to predict entrepreneurial intentions and brought empirical evidence about studying abroad experience which has a noticeable impact on predictors of entrepreneurial intention among students, which potentially deserves additional incentives from policymakers and higher education institutions.
Key words: Entrepreneurial Intentions, Theory of Planned Behaviour, Background Factors
Creative Commons Attribution – NonCommercial 4.0 International License
D. Širola: Determinants of Entrepreneurial Intentions: Empirical Evidence from Croatian PerspectiveZbornik Veleučilišta u Rijeci, Vol. 8 (2020), No. 1, pp. 169-187
170
1. INTRODUCTION
Numerous empirical evidence has been accumulated since the 1990s which points to a positive and robust relationship between measures of entrepreneurship and a broad spectrum of economic performance measures such as employment creation, economic growth, firm survival, innovation and technological change, productivity increases, and exports (Audretsch, 2003: 13). However, entrepreneurial projects and entrepreneurial behaviour do not happen by reflex. Some individuals become more entrepreneurial than others. The reasons vary from individual to social, economic and political.
Recently introduced NACI index within GEM global report for 2019 (Bosma and Kelley, 2019: 58-60), represents a new composite index covering 12 framework conditions and the results show that Croatia occupies the last place among 18 European countries included in the measurement. This indicator alone implicates that there is a lot to improve. Another indicative information from GEM report (Bosma and Kelley, 2019: 23) positions Croatia along Austria as the countries which show a steep drop-off in the oldest age group (55-64 years) and a most prevalent entrepreneurial activity among ages 25-34, i.e. the group in which most of the graduate students belong. Consequently acquiring the necessary knowledge and entrepreneurial skills should be a major task for this age group and the responsible institutions.
This study attempts to verify the influence of some well-researched and widely applicable antecedents of the entrepreneurial intentions, in Croatian student context and to compare the relevance of the theory of planned behaviour model components, with previous studies. Additionally, it considers the country of origin and the influence of student exchange programmes involvement to entrepreneurial behaviour. The impact of country of origin has been studied frequently (regularly within GEM reports); however, the factor of studying abroad lacked the attention of researchers. This factor was chosen as according to Erasmus impact study (European Commission, 2019: 2), the students involved in student exchange programmes (like Erasmus or Ceepus) gain in adaptability, ability to collaborate with people from different cultures, communication skills and problem-solving skills. Furthermore, 80% of Erasmus graduates who participated in the exchange programme are more likely to find their first job in less than three months, and almost 75% of them plan to start their own company or can envisage doing so in the future. For comparison, according to the GEM Report (Bosma and Kelley, 2019: 55), on average, 10% of respondents in surveyed European countries declared entrepreneurial intentions (in the next three years).
International experiences might be especially requisite for Croatian students who should be able to embrace the advantages of a globalised economy and international labour market, considering that Croatia appertains to a group of a net labour export countries within the EU. The factor of studying abroad could be of particular interest to the higher education institutions, as they could boost the utilisation rate and influence to the availability of these programmes.
Finally, the results of the study can extend the economist’s contribution in the context of the theory of planned behaviour usage. Their contribution is considered worthwhile already, as they succeeded in exerting considerable influence over government policy using concepts derived

D. Širola: Determinants of Entrepreneurial Intentions: Empirical Evidence from Croatian PerspectiveZbornik Veleučilišta u Rijeci, Vol. 8 (2020), No. 1, pp. 169-187
171
predominantly from the psychology literature, despite the scarcity of evidence (Armitage, 2015: 151).
2. LITERATURE REVIEW AND HYPOTHESIS DEVELOPMENT
2. 1 Literature review
Regardless of entrepreneurship type (traditional, corporate or social), the opportunity identification process is intentional, so the role of entrepreneurial intention is critical. In order to assist in disclosing the appropriate public entrepreneurial behaviour incentives, the relevant antecedents of entrepreneurial intentions have been studied extensively. Intentions are considered a decisive predictor of entrepreneurial behaviour, a prerequisite for an entrepreneurial approach to occur in the private or public sector. Intentionality is a state of mind directing a person’s attention towards a specific object (Bird, 1988: 442), i.e. the entrepreneurial intention leads towards starting a business or some innovative path in existing organisations.
The literature on entrepreneurial intentions derives from two distinct strands (Linan and Fayolle, 2015: 908). The first comes from social psychology, which sheds light on the mental process leading from attitudes and beliefs to effective action (principal contributions comes from Ajzen and Fishbein, 1980, and Bandura, 1997). The second strand is specific to the field of entrepreneurship. Seminal papers by Shapero (Shapero, 1975; Shapero and Sokol, 1982), and Bird (1988), marked the starting point of this strand. By the end of 1990s entrepreneurship research has become one of the fastest-growing fields in social sciences (Katz, 2003: 294). Several meta-analyses emerged in the meantime, concerning different fields of research (e.g. Schlaegel and Koenig, 2014 performed meta-analytic test to compare the theory of planned behaviour and entrepreneurial event model; McEachan et al., 2011 meta-analysed health-related behaviours and Hagger et al., 2002 physical activity). More recently, Linan and Fayolle (2015: 911-914) conducted a meta-analysis of 409 papers studying entrepreneurial intentions between 2004 and 2013 and identified 24 most influential and most cited papers. They divided these studies into six categories (with several themes each). The study presented in this paper addresses the topics which appertain to the Core entrepreneurial intention model category, theme: General test of the theory (of planned behaviour), but also touches research areas like Personal-level variables, e.g. themes Background factors (different control variables) and Gender issues (probably the most researched single topic).
The paper by Krueger and Carsrud (1993) is probably the ‘breaking point’ responsible for the explosion of research in the field of entrepreneurial intention. These authors made the theory of planned behaviour the ‘reference’ theory in entrepreneurial intentions research (Linan and Fayolle, 2015: 909). The theory of planned behaviour originates from social psychology. It works on the assumption that intention is a significant predictor of behaviour, while intention itself is a function of behavioural beliefs that link the given behaviour to specific outcomes (Kautonen et al., 2011: 697). According to Icek Ajzen (author of the theory of planned behaviour), the theory reached over 2.400 applications in the last three decades (bibliography of English articles updated in March 2019, available at Ajzen, University of Massachusetts Amherst, https://people.umass.edu/aizen). However, the theory has become one of the most frequently cited and influential models for the

D. Širola: Determinants of Entrepreneurial Intentions: Empirical Evidence from Croatian PerspectiveZbornik Veleučilišta u Rijeci, Vol. 8 (2020), No. 1, pp. 169-187
172
prediction of human social behaviour, but it has also been the target of much criticism and debate. Still, meta-analyses showed a satisfactory level of (medium) correlations among the theory’s constructs ranging from (r) 0.31 to around 0.60 (Ajzen, 2011: 1114).
2. 2 Research model and hypotheses
According to the theory of planned behaviour, a close relationship would exist between the intention to be an entrepreneur and its effective performance. Intention becomes the fundamental element of explaining behaviour. Entrepreneurial intention indicates the effort that the person will make to carry out entrepreneurial behaviour (Linan and Chen, 2006: 4). It captures three behavioural antecedents (Ajzen, 1991): personal attitudes towards behaviour (personal attraction), subjective norm and perceived behavioural control (Linan and Chen, 2009: 596). These predictors represent main hypotheses of this research.
Personal attitudes towards entrepreneurship. According to Fishbein and Ajzen’s (1975) expectancy-value model of attitudes, attitudes (towards entrepreneurship) develop reasonably from the beliefs people hold about the entrepreneurship. So, individuals in general, favour behaviours they believe have predominantly desirable consequences and form unfavourable attitudes towards behaviours we associate with mostly undesirable consequences (Ajzen, 1991: 191). Numerous studies confirmed the relation between attitudes and intentions. For instance, Armitage and Conner (2001: 481) conducted a meta-analysis of 115 studies and determined an average (medium) correlation of 0.49. The results of the research performed with the sample of students (213 respondents), revealed a similar level of correlation (r = 0.46) in Macedonia (Tomovska Misoska et al., 2016: 1069), while Rajh et al. (2016: 14) research conducted in four Southeast European countries (1.200 students from Bosnia and Herzegovina, Croatia, Macedonia and Serbia) showed a statistically significant results of multiple regression analysis (beta = 0.44). As a result, the following hypothesis has been made:
H1 Favourable personal attitudes toward entrepreneurship, have a direct, positive and substantial influence on the entrepreneurial intentions of respondents.
Subjective norm is the perceived social pressure to engage or not to engage in a behaviour. It is assumed that subjective norm is determined by the total set of accessible normative beliefs concerning the expectations of essential referents, such as the person’s spouse, family, friends, supervisor, and coworkers. Meta-analyses of the theory of planned behaviour application proved subjective norm as a less critical component of the model. For instance, Steinmetz et al. (2016: 224) found the lowest weighted average effect size (δ = 0.14), while Armitage and Conner (2001: 481), determined the lowest average correlation with entrepreneurial intentions (r = 0.34). Even lower correlation results (r = 0.08) were discovered by Tomovska Misoska et al. (2016: 1069) and by Rajh et al. (2016: 14), with a regression coefficient (β) of 0.05. As a result, the following hypothesis has been made:
H2 Subjective norm, have a direct, positive and substantial influence on the entrepreneurial intentions of respondents.

D. Širola: Determinants of Entrepreneurial Intentions: Empirical Evidence from Croatian PerspectiveZbornik Veleučilišta u Rijeci, Vol. 8 (2020), No. 1, pp. 169-187
173
The third antecedent of intention is the degree of perceived behavioural control, which refers to the perceived ease or difficulty of performing the behaviour (i.e. of becoming an entrepreneur or acquiring entrepreneurial behaviour), and it is assumed to reflect experience as well as anticipated impediments and obstacles (Ajzen, 1991: 188). Previous studies implicate a positive relationship between perceived behavioural control and entrepreneurial intentions. Steinmetz et al. (2016: 224) found the weighted average effect size (δ) of 0.26), while Armitage and Conner (2001: 481), recorded the correlation level of (r) 0.43. Studies with somewhat geographically comparable samples determined similar results: Tomovska Misoska et al. (2016: 1069) found r = 0.31, while Rajh et al. (2016: 14), found regression coefficient (β) of 0.36. In this study, perceived behavioural control concerns the entrepreneurial ability of the respondents, so the following hypothesis has been made:
H3 Favourable entrepreneurial ability, have a direct, positive and substantial influence on the entrepreneurial intentions of respondents.
Ajzen’s theory of planned behaviour assumes several background factors which often have a significant impact on behaviour, normative and control beliefs which influence each of the three entrepreneurial intentions antecedents. These factors include individual (age, gender, education, income, values, etc.), and social factors like culture, economy, geography, etc. (Ajzen, University of Massachusetts Amherst, https://people.umass.edu/aizen). The researchers’ attention somewhat skipped this area as a relatively small number of studies tested the influence of these factors. For instance, Schlaegel and Koenig meta-analysis (2014: 307), of 98 studies (123 samples, n = 114.007), revealed that some 15% of papers incorporated age and gender, while Linan and Fayolle meta-analysis found only 35 (of 409 studies) considering various background factors).
Furthermore, the results of these studies are often inconsistent. For instance, Kibler (2013: 303) found statistically significant (p < 0.05) very weak, negative correlations for gender (female from r = ‒0.09 to 0.16), age (‒0.08 to ‒0.34), higher education (‒0.08), and population density (‒0.07), and positive correlations for entrepreneurial experience (from r = 0.08 to 0.13). Linan and Chen (2009: 606) found a weak positive correlation for (male) gender (0.225, p < 0.05) and non-significant results for age, while Schlaegel and Koenig (2014: 307) found positive relationship for age (r = 0.05) and negative for gender (‒0.06). Besides testing the impact of individual factors, this study included the country of origin and student exchange programmes participation, as specific background factors (control variables). Studying abroad factor was chosen considering the benefits for student emphasised in the introductory part. Consequently, the following hypothesis has been made:
H4 There is a statistically significant difference between personal attitudes towards entrepreneurship, subjective norm, entrepreneurial ability, and entrepreneurial intentions, regarding individual (age, sex, education level, profession, household income, population density, entrepreneurial environment, and work experience) and specific background factors (country of origin and participation in the student exchange programmes) of the respondents.
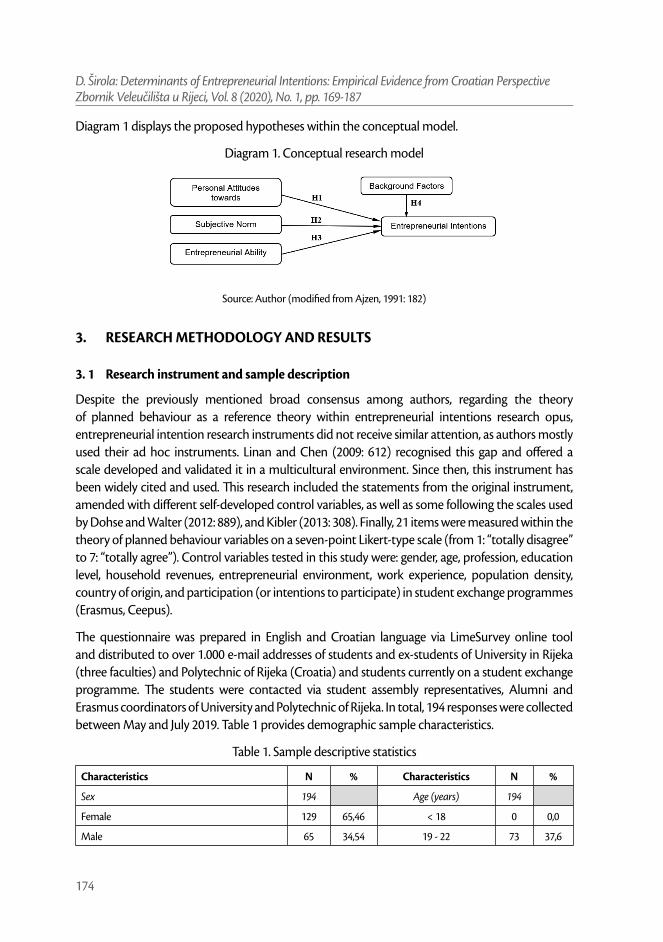
D. Širola: Determinants of Entrepreneurial Intentions: Empirical Evidence from Croatian PerspectiveZbornik Veleučilišta u Rijeci, Vol. 8 (2020), No. 1, pp. 169-187
174
Diagram 1 displays the proposed hypotheses within the conceptual model.
Diagram 1. Conceptual research model
Source: Author (modified from Ajzen, 1991: 182)
3. RESEARCH METHODOLOGY AND RESULTS
3. 1 Research instrument and sample description
Despite the previously mentioned broad consensus among authors, regarding the theory of planned behaviour as a reference theory within entrepreneurial intentions research opus, entrepreneurial intention research instruments did not receive similar attention, as authors mostly used their ad hoc instruments. Linan and Chen (2009: 612) recognised this gap and offered a scale developed and validated it in a multicultural environment. Since then, this instrument has been widely cited and used. This research included the statements from the original instrument, amended with different self-developed control variables, as well as some following the scales used by Dohse and Walter (2012: 889), and Kibler (2013: 308). Finally, 21 items were measured within the theory of planned behaviour variables on a seven-point Likert-type scale (from 1: “totally disagree” to 7: “totally agree”). Control variables tested in this study were: gender, age, profession, education level, household revenues, entrepreneurial environment, work experience, population density, country of origin, and participation (or intentions to participate) in student exchange programmes (Erasmus, Ceepus).
The questionnaire was prepared in English and Croatian language via LimeSurvey online tool and distributed to over 1.000 e-mail addresses of students and ex-students of University in Rijeka (three faculties) and Polytechnic of Rijeka (Croatia) and students currently on a student exchange programme. The students were contacted via student assembly representatives, Alumni and Erasmus coordinators of University and Polytechnic of Rijeka. In total, 194 responses were collected between May and July 2019. Table 1 provides demographic sample characteristics.
Table 1. Sample descriptive statistics
Characteristics N % Characteristics N %
Sex 194 Age (years) 194
Female 129 65,46 < 18 0 0,0
Male 65 34,54 19 - 22 73 37,6

D. Širola: Determinants of Entrepreneurial Intentions: Empirical Evidence from Croatian PerspectiveZbornik Veleučilišta u Rijeci, Vol. 8 (2020), No. 1, pp. 169-187
175
Education level 194 23 - 26 51 26,3
Lower 0 0,0 27 - 30 19 9,8
High school graduate 107 55,2 31 - 40 18 9,3
Bachelor’s degree 59 30,4 41 - 50 23 11,9
Master’s degree or higher 28 14,4 > 50 10 5,2
Your profession is (or will be) in the field of: 194
Economy/business/tourism 102 52,6
Engineering (traffic/machinery/electrotechnical/telematics, etc.) 36 18,6
Informatics/computing 31 16,0
Other engineering 25 12,9
My work experience encompasses: 194
Just obligatory pupil/student internship 41 21,1
Summer vacation jobs only 72 37,1
Occasional jobs during study 60 30,9
Permanent employment 99 51,0
Temporary unemployed 19 9,8
Other 11 5,7
Your permanent residence is in: 194
Urban (city/town) area 140 72,2
Rural (village) area 54 27,8
About Erasmus (or Ceepus) student exchange programme: 194
I was, or I am a part of the student exchange programme 42 21,6
I have not been, but I intend to go to the student exchange programme 43 22,2
Definitely not planning to go to a student exchange programme 109 56,2
Your close environment involves regular contacts with: 194
Parents and/or siblings who are entrepreneurs 51 26,3
Close relatives or friends who are entrepreneurs 84 43,3
I do not have any entrepreneurs in my close environment 59 30,4
How would you asses your household incomes in the last few years: 194
Below-average (hardly make our ends meet) 3 1,5
Average – enough for daily purposes and some savings 53 27,3
Above-average – we can save, go to trips, etc. 93 47,9
Considerably above-average – we live a luxurious life 45 23,2
Source: Author’s research
The sample included Croatian students (173 respondents) and international students from 11 EU countries (21 respondent). International students were surveyed during their Erasmus student exchange programme participation. Croatian students displayed a noticeable interest in student

D. Širola: Determinants of Entrepreneurial Intentions: Empirical Evidence from Croatian PerspectiveZbornik Veleučilišta u Rijeci, Vol. 8 (2020), No. 1, pp. 169-187
176
exchange programmes, as almost half of the respondents (43,8 %), declared that they ‘were’, ‘are’, or ‘will’ benefit from these programmes.
3. 2 The reliability test
The Cronbach alpha coefficients were calculated in order to verify the reliability of the measurement scales. Table 2 contains a summary of the results.
Table 2. Cronbach alpha coefficient values
Variable (concept) No. of items Cronbach α coefficient
Personal Attitudes towards Entrepreneurship 5 0,93
Subjective Norm 3 0,83
Entrepreneurial Ability 6 0,92
Entrepreneurial Intentions 7 0,93
Total instrument 21 0,95Source: Authors’ research
The reliability analysis shows that the value of the Cronbach alpha coefficient varies between 0.83 and 0.93 for each concept in the measurement instrument. All coefficients are within the referential limits of reliability. The coefficient of reliability for the total measurement instrument is 0.95, which indicate a high level of internal stability and instrument consistency.
4. RESEARCH RESULTS
For the analysis of the collected empirical data, methods of descriptive and inferential statistics were used, and the statistical tool GNU PSPP Statistical Analysis Software (Release 0.9.0–g3a3d58, version 2014). Collected data were first analysed with t-test for independent samples and ANOVA in order to compare the results regarding control variables. Tables 3 and 4 contain only statistically significant differences between the concept results based on background factors (control variables) within the theory of planned behaviour.

D. Širola: Determinants of Entrepreneurial Intentions: Empirical Evidence from Croatian PerspectiveZbornik Veleučilišta u Rijeci, Vol. 8 (2020), No. 1, pp. 169-187
177
Table 3. Statistically significant differences regarding individual factors
Age groups:Young
< 27 (N = 124)
Middle
≥ 27 ≤ 39 N=37)
Older
> 39 (N = 33) F Sig.
Concept A. M.Std. Dev.
A. M. Std. Dev. A. M. Std. Dev.
Subjective Norm 5,84 1,12 5,39 1,42 5,31 1,62 3,23 0,042*
Family background:Parents, brothers / sisters are entre-preneurs (N=51)
Close relatives or friends are entre-preneurs (N=84)
No entrepreneurs in close environ-ment
(N=59) F Sig.
Concept A. M.Std. Dev.
A. M. Std. Dev. A. M. Std. Dev.
Entrepreneurial Ability
4,39 1,36 4,71 1,41 3,68 1,51 9,26 0,000**
Entrepreneurial Intentions
4,08 1,93 4,52 1,65 3,49 1,55 6,35 0,002**
Household revenues:Below-average and sufficient (N = 56)
Average and above-average (N = 138)
t Sig.Concept A. M. Std. Dev. A. M. Std. Dev.
Entrepreneurial Ability 3,87 1,42 4,49 1,48 2,67 0,008**
Present or future profession:Economy/business/ tourism (N = 102)
Engineers, IT and others (N = 92)
t Sig.Concept A. M. Std. Dev. A. M. Std. Dev.
Personal Attitudes towards Entrepreneurship
5,24 1,48 4,70 1,53 - 2,53 0,012**
Entrepreneurial Ability 4,54 1,38 4,06 1,56 - 2,29 0,023**
Entrepreneurial Intentions 4,36 1,72 3,79 1,73 - 2,31 0,022**Notes: A. M. = arithmetic mean; Std. Dev. = standard deviation; Sig. = significance; **significance level at 0.01; *significance
level at 0.05
Source: Author’s research
The results of the analysis pointed out the most statistically significant differences (p < 0,01) in entrepreneurial abilities (perceived behaviour control) variable, followed by entrepreneurial intentions and subjective norm. The respondents in economy/business/tourism profession declared a higher level of entrepreneurial abilities (and entrepreneurial intentions), as well as those with average and above-average household revenues and entrepreneurs among close relatives or friends. The analysis of the subjective norm concept (i.e. the expected reactions to the decision to start a business from the people in the proximity) showed that younger respondents expect better (positive) reactions than the older age groups.

D. Širola: Determinants of Entrepreneurial Intentions: Empirical Evidence from Croatian PerspectiveZbornik Veleučilišta u Rijeci, Vol. 8 (2020), No. 1, pp. 169-187
178
Table 4. Statistically significant differences regarding specific factors
Country of origin: Croatia (N=173) Others (N = 21)t Sig.
Concept A. M. Std. Dev. A. M. Std. Dev.
Entrepreneurial Ability
4,37 1,47 3,29 1,41 - 2,38 0,018**
Student exchange programmes (Erasmus, Ceepus):
Was or is a part of the programme (N=42)
Was not, but intend to go
(N=43)
Definitely will not go (N=109) F Sig.
Concept A. M. Std. Dev. A. M. Std. Dev. A. M. Std. Dev.
Subjective Norm 5,80 1,28 6,08 0,91 5,44 1,39 4,15 0,017**Notes: A.M. = arithmetic mean; Std. Dev. = standard deviation; Sig. = significance; **significance level at 0.01; *significance
level at 0.05
Source: Author’s research
The results indicate that Croatian respondents evaluate their entrepreneurial abilities as average (4,37 on 1-7 scale), but higher than their international counterparts (3,29) from 11 EU countries (involved in the student exchange programme, during the survey). The same conclusion about more positive reactions about starting a business, valid for those who ‘have not been, but intend to go to student exchange’, followed by those who ‘were or currently are at the student exchange programme.’ The correlation analysis was performed for further analysis of the control variables impact (results in table 5).
Hypothesis H1, H2 and H3 assume that favourable personal attitudes towards entrepreneurship, subjective norms and entrepreneurial abilities have a direct, positive and statistically significant impact on entrepreneurial intentions. A correlation and multiple regression analysis were performed for examining the hypotheses. Table 5. exhibits results of Pearson correlation analysis of variables with statistically significant differences according to control variables.

D. Širola: Determinants of Entrepreneurial Intentions: Empirical Evidence from Croatian PerspectiveZbornik Veleučilišta u Rijeci, Vol. 8 (2020), No. 1, pp. 169-187
179
Table 5. Correlation analysis of analysed variables (abbreviated form)
Variable (concept) Pearson coeff.Significance (2-
tail)
H1: PAE ↔ EI 0,68 0,000**
H1: PAE ↔ EI Economy/business/tourism professions 0,64 0,000**
H1: PAE ↔EI Other professions 0,70 0,000**
H2: SN ↔ EI 0,30 0,000**
H2: SN ↔ EI Young < 27 years 0,31 0,000**
H2: SN ↔EI Middle ≥ 27 ≤ 39 years 0,26 0,027*
H2: SN ↔ EI Older > 40 years 0,34 0,182
H2: SN ↔ EI Was or are a part of the student exchange programme 0,19 0,225
H2: SN ↔ EI Was not, but intend to go to the student exchange programme
0,29 0,063
H2: SN ↔ EI Definitely will not go to the student exchange programme
0,33 0,001**
H3: EA ↔ EI 0,70 0,000**
H3: EA ↔ EI Parents or brothers/sisters are entrepreneurs 0,68 0,000**
H3: EA ↔ EI Close relatives or friends are entrepreneurs 0,64 0,000**
H3: EA ↔ EI No entrepreneurs in a close environment 0,73 0,000**
H3: EA ↔ EI Economy/business/tourism professions 0,63 0,000**
H3: EA ↔ EI Other professions 0,74 0,000**
H3: EA ↔ EI Below-average and sufficient household revenues 0,65 0,000**
H3: EA ↔ EI Average and above-average household revenues 0,70 0,000**
H3: EA ↔ EI Croatian 0,71 0,000**
H3: EA ↔ EI Other countries 0,62 0,043*Legend: PAE = Personal Attitudes towards Entrepreneurship; SN = Subjective Norm; EA = Entrepreneurial Ability (perceived behavioural control); EI = Entrepreneurial Intentions; ** - significant correlation on level 0.01; * - significant
correlation on level 0.05
Source: Authors’ research
The results indicate positive and statistically significant correlation, between all three predictors (personal attitudes towards entrepreneurship, subjective norm and entrepreneurial ability) and entrepreneurial intentions as a dependent variable. Meanwhile, the intensity of the correlations differs from weak (r = 0.30, p < 0.01) between subjective norm and entrepreneurial intentions, medium correlation (r = 0.68, p < 0.01) between personal attitudes towards entrepreneurship and entrepreneurial intentions and high correlations (r = 0.70, p < 0.01) between entrepreneurial abilities and entrepreneurial intentions. These results entirely support the hypotheses H1, H2 and H3.

D. Širola: Determinants of Entrepreneurial Intentions: Empirical Evidence from Croatian PerspectiveZbornik Veleučilišta u Rijeci, Vol. 8 (2020), No. 1, pp. 169-187
180
The correlation analysis regarding background factors (hypotheses 4) was performed for the individual and specific factors with statistically significant differences of results (as displayed in Tables 3 and 4). The correlation results proved the statistically significant relationships between the personal attitudes towards entrepreneurship and entrepreneurial ability of both professional groups (at p < 0.01) and entrepreneurial intentions as a dependent variable. A similar (medium to high) level of correlation was found between the entrepreneurial ability of respondents regarding three types of contacts with their close (entrepreneurial) environment, different groups of the profession, household revenues, country of origin, and the entrepreneurial intentions. Dohse and Walter (2011: 889), analysed the sample of 1.816 students in Germany and also found a positive impact of entrepreneurs among family, relatives, or friends, but with a very weak level of the regression coefficients (0.09 to 0.10 depending on the model, at p < 0.001).
The respondents below 27 years of age and those who will not go to the student exchange programmes, displayed a statistically significant (weak) level of correlation between subjective norm and entrepreneurial intentions (at p < 0.01). The relationships between subjective norm and the dependent variable of other age groups and groups who were (are), or plan to go to student exchange programmes, were positive, but statistically non-significant. For comparison, Schlaegel and Koenig (2014: 307) meta-analysis found 11 studies which tested age impact on the components of the theory of planned behaviour. The results of the correlations displayed very weak relations varying from 0.05 (age-entrepreneurial intent) to ‒0.05 (age-subjective norm). Hatak et al. (2014: 44) analysed the sample of 766 respondents in Austria and found that age has a negative impact (‒0.054, p < 0.01) on entrepreneurial intentions, i.e. older respondents are less likely to start the business.
These results partly support the hypotheses H4, i.e. confirm that there is a significant difference in correlations between all predictors of entrepreneurial intentions regarding six (out of ten) control variables: age, profession, household income, family background, country of origin and participation in student exchange programmes.
Other control variables displayed non-significant differences in predictor values which is comparable to (inconsistent) results of the previous studies. For instance, Haus et al. (2013: 145), gender meta-analysis of 30 studies with an overall sample size of 52.367 individuals, revealed very weak but significant negative relationships between gender and attitude (‒0.06), subjective norm (‒0.09) and perceived behavioural control (‒0.08 at p < 0.01). The similar (very weak) correlation coefficient level was found for gender impact in Schlaegel and Koenig (2014: 307) meta-analysis of 19 studies. These negative relationships imply that women express lower attitudes, subjective norms, and perceptions of control toward starting a business. The same conclusion was drawn from Bhandari’s (2012: 138) research on the sample of US students (390 respondents). This study found a non-significant gender influence. Furthermore, Dohse and Walter (2011: 889) established very weak, non-significant differences for population density parameter (β = 0.06) and work experience (β = 0.01), while Kibler (2013: 303) found the negative, very weak impact of population density (r = ‒0.07, p < 0.05) and positive, very weak correlation of work experience and entrepreneurial intention (0.09, p < 0.05). Finally, a meta-analysis conducted by Steinmetz et al. (2016: 224) found positive, weak correlation regarding higher education level (average β = 0.23).

D. Širola: Determinants of Entrepreneurial Intentions: Empirical Evidence from Croatian PerspectiveZbornik Veleučilišta u Rijeci, Vol. 8 (2020), No. 1, pp. 169-187
181
In order to determine the intensity of the correlations between predictors and the dependent variable, multiple regression analysis was conducted. The sample contains 194 informants, which meets the recommended criterion of 100 informants in the sample and the criterion of the least proposed ratio of 5:1 between the number of elements in the sample and the number of independent variables (Hair et al. 2010, 175-176). In the specific case, the ratio is 194:1 (194 informants and one variable). A distribution normality analysis was conducted in order to verify the representativeness requirement of the multiple regression analysis results (Table 6).
Table 6. Verification of distribution normality of variables in the regression model
Variable (concepts) A.M. Std. Dev. Skewness Kurtosis
Personal Attitudes towards Entrepreneurship 4,98 1,52 − 0,77 − 0,10
Subjective Norm 5,66 1,29 − 0,96 0,87
Entrepreneurial Ability 4,31 1,49 − 0,26 − 0,69
Entrepreneurial Intentions 4,09 1,75 − 0,24 − 0,98Legend: A.M. = arithmetic mean; Std. Dev. = standard deviation
Source: Authors’ research
A negative skewness of all variables was detected, but all skewness coefficients are within the acceptable referential limits for normal distribution. Table 7 indicate correlations coefficients in the regression model.
Table 7. Correlation coefficients in the regression model (model summary)
R R² Adjusted R² Standard error of the estimate
0.79 0.63 0.62 1.07Source: Authors’ research
The multiple correlation coefficient R (0.79), implies that there is a high (strong) correlation between three independent variables and dependent variable. According to the determination coefficient (R2 = 0.63), the model variables share 63% of common factors. It means that 63% of the variance (information) of entrepreneurial intentions may be predicted (explained) with personal attitudes towards entrepreneurship, subjective norm and entrepreneurial ability variables. Adjusted R² provides an insight into how well the regression model can be generalised. In this case, the adjusted R² is 0.62, which is very close to R², so the model derived from the population instead of the sample, account for 2.5% lower variance of the dependent variable. The standard error of the estimate implies that the limit of error for any value of the dependent variable could be estimated within the interval of ±2.14. The analysis of the variance was performed in order to examine the prediction capability of the regression model. The results are given in Table 8.

D. Širola: Determinants of Entrepreneurial Intentions: Empirical Evidence from Croatian PerspectiveZbornik Veleučilišta u Rijeci, Vol. 8 (2020), No. 1, pp. 169-187
182
Table 8. Analysis of variance for the regression model (ANOVA)
Sum of squares
Degrees of freedom
Mean square F Significance
Regression 370,64 3 123,55 107,62 0,000
Residual 218,11 190 1,15
Total 588,76 193Source: Authors’ research
The analysis of variance determined statistically significant results, F (3, 190) = 107.62 (at p < 0.01). It means that these independent variables can considerably predict the dependent variable, i.e., that personal attitudes towards entrepreneurship, subjective norm and entrepreneurial ability variables can successfully account for the entrepreneurial intentions. Table 9 displays the regression coefficients and their significance in the regression model.
Table 9. Regression coefficients in the regression model
Variables (concepts)Non-standardised
coefficientsStandardised coefficients t Significance
B Standard error β(Constant) − 0,66 0,38 0,00 − 1,75 0,082
Personal Attitudes towards Entrepreneurship
Subjective Norm
Entrepreneurial Ability
0,52
− 0,04
0,56
0,06
0,07
0,06
0,45
− 0,03
0,48
8,01
− 0,63
9,28
0,000*
0,532
0,000*
Source: Authors` research
According to the results presented in Table 9 (B coefficients), the increase of the results on the personal attitudes towards entrepreneurship scale by one point is associated with the average increase of results on the scale of entrepreneurial intentions by 0.52 point and entrepreneurial ability by 0.56 point. At the same time, the subjective norm indicates statistically non-significant results. These outcomes are comparable with B values from Pejić Bach et al. (2018: 1465) research of the sample of Slovenian students, which displayed similar order of the impact intensity of the variables (i.e. attitudes, perceived behavioural control and subjective norm). The obtained lower values of the regression coefficient’s standard error indicate a more reliable assessment of the extent to which the regression coefficient would change if it were calculated for different samples from the same population and more specific reliability intervals (Hair et al. 2010, 212). The values of t-test (Table 9) imply that personal attitudes towards entrepreneurship and entrepreneurial ability variables significantly (p < 0.01) contribute to entrepreneurial intentions.
Furthermore, the values of β coefficients show a proportional significance of independent variables in the regression model. The value of β for the personal attitudes towards entrepreneurship variable

D. Širola: Determinants of Entrepreneurial Intentions: Empirical Evidence from Croatian PerspectiveZbornik Veleučilišta u Rijeci, Vol. 8 (2020), No. 1, pp. 169-187
183
is 0.45 and for entrepreneurial ability 0.48, which means that they have a substantial influence on the entrepreneurial intentions. The results additionally confirm the hypotheses H1 and H3, i.e., determine the extent to which these variables directly, positively and significantly influence the entrepreneurial intentions of the respondents. However, the regression analysis results did not confirm the correlation between subjective norm and entrepreneurial intentions (H2).
5. DISCUSSION AND CONCLUSION
5. 1 Concluding remarks
Theory of planned behaviour is considered to have a good reputation and robust power for predicting entrepreneurial intentions in different contexts. The results of this study contributed to these considerations especially about the explanation power, as 63% of explained variance in this study, is comparable to the Linan and Fayolle meta-analysis (2015: 916), who found that same three predictors explain from 40% to 60% of the variance in entrepreneurial intentions, while Armitage and Conner, meta-analysis (2001: 481), found 39 % of explanation power, on average. Regarding the components of the model of the theory of planned behaviour, the results are comparable to previous studies. For instance, Schlaegel and Koenig (2014: 305), and Steinmetz et al. (2016: 223) meta-analyses found similar relative results between subjective norm and entrepreneurial intentions as the relationship with the lowest average corrected correlation coefficients of 0.36 and 0.25, respectively (0.30 in this study). Rajh et al. (2016: 16) found the lowest result of regression analysis (β = 0.05 at p < 0.01) for the same relationship and the similar geographical region. Schlaegel and Koenig (2014: 305), also found that perceived behavioural control – entrepreneurial intentions, relationship have the highest correlation result of 0.53 as in this study (r = 0.70), and the medium level of correlation of 0.43 (0.68 in this study) for the personal attitudes toward behaviour and entrepreneurial intentions relation. The outcomes of this study corroborate that the theory of planned behaviour with three antecedents could be seen as a good predictor on one’s entrepreneurial intention.
Furthermore, this study confirmed the reliability and applicability of the Linan and Chen (2009: 612-613) entrepreneurial intentions questionnaire. It also brought additional empirical evidence to prior observations about the impact of background factors (control variables), such as age, gender, household income, geographical and professional differences. The research in this area is rather scant, apart from gender which is probably the most frequent single research topic (for instance, see meta-analyses Linan and Fayolle, 2015: 917 and Schlaegel and Koenig, 2014: 307). The results of these studies are often inconsistent, so additional testing is welcomed. The study revealed a novelty regarding the influence of the participation (or non-participation) in student exchange programmes, which were found statistically significant.
These outcomes contribute to the evidence base for evaluating present and designing future incentive policies toward entrepreneurial behaviour development, particularly for the extending and utilisation boost of the student exchange programmes. This issue is of crucial importance for net labour exporting countries (like Croatia), as it enables students to acquire indispensable transversal and entrepreneurial skills. These results might become even more useful as could

D. Širola: Determinants of Entrepreneurial Intentions: Empirical Evidence from Croatian PerspectiveZbornik Veleučilišta u Rijeci, Vol. 8 (2020), No. 1, pp. 169-187
184
induce the actions on the micro-level, directly from the higher education institutions, without waiting for the massive bureaucratic system to move.
5. 2 Research limitations and areas for future research
Several limitations should be stressed out. First, the research is based on self-reported data retrieved from respondents via questionnaire, so they represent individual perceptions, not actual abilities or behaviours. In order to avoid this kind of subjectivity about real entrepreneurial intentions, objective data (from statistical sources) could be gathered, and/or compared with existing sources like GEM results (especially in the context of the country of origin effect). Otherwise, longitudinal studies of entrepreneurial intentions and actual behaviours might provide better results.
Second, the international part of the sample is insufficient to draw valid conclusions or comparisons between Croatian and international respondents. Although the Croatian part of the sample, was retrieved from one university and one polytechnic, it might be considered as a solid research base, especially regarding the usual large percentage of students originating outside the local/regional area. Third, the research goals did not cover the alternative relationships amid variables. For instance, the influence of subjective norm onto personal attitudes towards entrepreneurship and entrepreneurial abilities (perceived behavioural control), as suggested by Linan and Chen (2009: 597).
In order to offer additional empirical evidence, further research of this topic should include other control variables like entrepreneurial education impact, especially outside the economy/business type of studies. Moreover, the concept of the entrepreneurial intention should be extended to capture the holistic understanding of entrepreneurship, i.e. to investigate corporate, social, academic, and family entrepreneurship intentions (as recommended by Fayolle and Linan, 2014: 664).
REFERENCES
Ajzen, I. (1991) The Theory of Planned Behavior, Organizational behavior and human decision processes, Vol 50, str. 179-211, DOI: 10.1016/0749-5978(91)90020-T
Ajzen, I. (2011) The theory of planned behaviour: Reactions and reflections, Psychology & Health, 26:9, p. 1113-1127, DOI: 10.1080/08870446.2011.613995
Ajzen, I., University of Massachusetts Amherst, http://people.umass.edu/aizen/index.html, 05.10.2019.
Armitage, C. J. (2015) Time to retire the theory of planned behaviour? A commentary on Sniehotta, Presseau and Araújo-Soares, Health Psychology Review, Vol 9 No 2, 151-155, DOI: 10.1080/17437199.2014.892148
Armitage, C. J., Conner; M. (2001) Efficacy of the Theory of Planned Behaviour: A meta-analytic review, British Journal of Social Psychology, 40, p. 471–499, DOI: 10.1348/014466601164939
Audretsch, D. B. (2003) Entrepreneurship: A survey of the literature, Brussels, D-G European Commission, http://ec.europa.eu/enterprise/newsroom/document.htm
Bhandari, N. C. (2012) Relationship between students’gender, their own employment, their parents’employment, and the students’ intention for entrepreneurship. Journal of Entrepreneurship Education, 15, p. 133–144, ISSN 1528-2651

D. Širola: Determinants of Entrepreneurial Intentions: Empirical Evidence from Croatian PerspectiveZbornik Veleučilišta u Rijeci, Vol. 8 (2020), No. 1, pp. 169-187
185
Bird, B. (1988) Implementing Entrepreneurial Ideas: The Case for Intention, Academy of Management Review, Vol 13, No 3, p. 442-453, DOI: 10.2307/258091
Bosma, N., Kelley, D. (2019) Global Entrepreneurship Monitor 2018/2019 Global Report, ISBN: 978-1-9160178-0-1, available at https://www.gemconsortium.org/report
Dohse, D., Walter, S. G. (2012) Knowledge context and entrepreneurial intentions among students, Small Business Economics, Vol. 39, Issue 4, p. 877–895, DOI: 10.1007/s11187-011-9324-9
European Commission (2019) Erasmus+ Higher Education Impact Study Final Report, DOI:10.2766/162060 NC-02-19-323-EN-N, available at https://op.europa.eu/en/publication-detail/-/publication/94d97f5c-7ae2-11e9-9f05-01aa75ed71a1
Fayolle, A., Linan, F. (2014) The future of research on entrepreneurial intentions, Journal of Business Research, Volume 67, Issue 5, p. 663-666, DOI: 10.1016/j.jbusres.2013.11.024
Hagger, M., Chatzisarantis, N. L. D., Biddle, S.J.H. (2002) A Meta-Analytic Review of the Theories of Reasoned Action and Planned Behavior in Physical Activity: Predictive Validity and the Contribution of Additional Variables, Journal of Sport & Exercise Psychology 24(1), p. 3-32, DOI: 10.1123/jsep.24.1.3
Hair, J. F., Black, W. C., Babin, B. J., Anderson, R. E. (2010) Multivariate Data Analysis: A Global Perspective, 7th Edition, New Yersey, Upper Saddle River: Pearson Education Inc.,
Hatak, I., Harms, R., Fink, M. (2014) Age, job identification, and entrepreneurial intention, Journal of Managerial Psychology, 30 (1), p. 38-53, DOI: 10.1108/JMP-07-2014-0213
Haus, I., Steinmetz, H., Isidor, R., Kabst, R. (2013) Gender Effects on Entrepreneurial Intention: A Meta-Analytical Structural Equation Model, International Journal of Gender and Entrepreneurship vol. 5, No. 2, p. 130-156, DOI: 10.1108/17566261311328828
Katz, J.A. (2003) The chronology and intellectual trajectory of American entrepreneurship education 1876–1999, Journal of Business Venturing 18, p. 283–300, DOI: 10.1016/S0883-9026(02)00098-8
Kautonen, T., Marco Van Gelderen, M., Erno T. Tornikoski, E. T. (2011) Predicting entrepreneurial behaviour: a test of the theory of planned behaviour. Applied Economics, Taylor & Francis (Routledge), 45 (06), p. 697-707. DOI:10.1080/00036846.2011.61075
Kibler, E. (2013) Formation of Entrepreneurial Intentions in a Regional Context, Entrepreneurship and Regional Development Vol. 25 No. 2-3, p. 293-323, DOI:10.1080/08985626.2012.721008
Krueger, N. F., Carsrud, A. L. (1993) Entrepreneurial intentions: applying the theory of planned behavior, Entrepreneurship and Regional Development, 5(4), p. 315–330, DOI: 10.1080/08985629300000020
Linan, F., Chen, Y-W. (2009) Development and Cross-Cultural Application of a Specific Instrument to Measure Entrepreneurial Intentions, Entrepreneurship Theory&Practice, Vol. 33., p. 593-617, DOI: 10.1111/j.1540-6520.2009.00318.x
Linan, F., Chen, Y.-W. (2006) Testing the Entrepreneurial Intention Model on a Two-Country Sample, Documents de Treball (Universitat Autònoma de Barcelona. Departament d’Economia de l’Empresa)
Linan, F., Fayolle, A. (2015) A systematic literature review on entrepreneurial intentions: citation, thematic analyses, and research agenda, International Entrepreneurship and Management Journal, 11 (4), p. 907-933, DOI: 10.1007/s11365-015-0356-5
McEachan, R. R. C., Conner, M., Taylor, N. J., Lawton, R. J. (2011) Prospective prediction of health-related behaviours with the Theory of Planned Behaviour: a meta-analysis, Health Psychology Review, 5:2, p. 97-144, DOI: 10.1080/17437199.2010.521684
Pejić Bach, M., Aleksić, A. Merkač-Skok, M. (2018) Examining determinants of entrepreneurial intentions in Slovenia: applying the theory of planned behavior and an innovative cognitive style, Economic Research-Ekonomska Istraživanja, 31:1, p. 1453-1471, DOI: 10.1080/1331677X.2018.1478321

D. Širola: Determinants of Entrepreneurial Intentions: Empirical Evidence from Croatian PerspectiveZbornik Veleučilišta u Rijeci, Vol. 8 (2020), No. 1, pp. 169-187
186
Schlaegel, C., Koenig, M. (2014) Determinants of Entrepreneurial Intent: A Meta-Analytic Test and Integration of Competing Models, Entrepreneurship Theory and Practice, 38:2, p. 291-332, DOI: 10.1111/etap.12087
Steinmetz, H., Knappstein, M., Ajzen, I., Schmidt, P., Kabst, R. (2016) How Effective are Behavior Change Interventions Based on the Theory of Planned Behavior? A Three-Level Meta-Analysis, Zeitschrift für Psychologie, Vol. 224, Issue 3, p. 216-233, DOI: 10.1027/2151-2604/a000255.
Tomovska Misoska, A., Dimitrova, M., Mrsik, J. (2016) Drivers of entrepreneurial intentions among business students in Macedonia, Economic research - Ekonomska istraživanja, Vol. 29 No. 1, p. 1062-1074, DOI: 10.1080/1331677X.2016.1211956

D. Širola: Determinants of Entrepreneurial Intentions: Empirical Evidence from Croatian PerspectiveZbornik Veleučilišta u Rijeci, Vol. 8 (2020), No. 1, pp. 169-187
187
Izvorni znanstveni rad https://doi.org/10.31784/zvr.8.1.17 Datum primitka rada: 16. 12. 2019. Datum prihvaćanja rada: 10. 2. 2020.
ODREDNICE PODUZETNIČKIH NAMJERA: EMPIRIJSKI DOKAZI IZ HRVATSKE PERSPEKTIVE
Davor Širola Dr. sc., v. pred., Veleučilište u Rijeci, Vukovarska 58, 51 000 Rijeka, Hrvatska; e-mail: [email protected]
SAŽETAKRastući opus literature zastupa da poduzetničke namjere imaju krucijalnu ulogu u oblikovanju poduzetničkog ponašanja, kao i u procesu donošenja odluka o postajanju poduzetnikom. Podupiranje poduzetničkog i inovacijama orijentiranog načina razmišljanja, prvenstveno među mladima, može biti ključno za uspješan ekonomski i društveni razvoj. Otkrivanje pravih razloga koji potiču mlade, posebno studente da postanu poduzetnici, potencijalno čini vrijedan input različitim donositeljima politika i problem istraživan u ovom radu. Osobni stavovi, subjektivne norme i percipirana kontrola ponašanja predstavljaju motivacijske pretpostavke koje utječu na poduzetničke namjere i iscrpno se istražuju unutar teorije planiranog ponašanja koju je razvio Ajzen (1991). Primjenjivost Ajzenovog modela za predviđanje glavnih pretpostavki poduzetničkih namjera, ovom je studijom uspješno testirano na uzorku studenata sa ili bez iskustva studiranja u inozemstvu, kao i razlike nastale zbog utjecaja brojnih pozadinskih čimbenika (individualnih i društvenih). Rezutati korelacijske i regresijske analize pokazali su da osobni stavovi prema poduzetništvu i poduzetničke sposobnosti predstavljaju najutjecajnije komponente modela teorije planiranog ponašanja, dok subjektivne norme imaju skromniju ulogu. Statistički značajne razlike zabilježene su kod analize šest provjeravanih pozadinskih čimbenika kontrolnih varijabli (dob, poduzetničko obiteljsko porijeklo, prihodi kućanstava, zanimanje, država porijekla ispitanika i programi razmjene studenata). Ovi rezultati su potvrdili zaključke brojnih prethodnih istraživanja Ajzenovog modela i dali nove empirijske dokaze o studiranju u inozemstvu koji značajno utječe na prediktore poduzetničkih namjera među studentima što potencijalno zaslužuje dodatne poticaje nositelja politika i visokoškolskih institucija.
Ključne riječi: poduzetničke namjere, teorija planiranog ponašanja, pozadinski čimbenici
Creative Commons Attribution – NonCommercial 4.0 International License


A. M. Vrtodušić Hrgović, K. Črnjar, I. Škarica: Employee Engagement and Improvement as Important…Zbornik Veleučilišta u Rijeci, Vol. 8 (2020), No. 1, pp. 189-201
189
Original scientific paper https://doi.org/10.31784/zvr.8.1.18 Received: 30. 12. 2019. Accepted: 2. 3. 2020.
EMPLOYEE ENGAGEMENT AND IMPROVEMENT AS IMPORTANT PRINCIPLES OF TQM IN PUBLIC HEALTH
INSTITUTESAna-Marija Vrtodušić Hrgović
PhD, Associate Professor, University of Rijeka, Faculty of Tourism and Hospitality Management, Primorska 42, P.O.B. 97, 51410 Opatija, Croatia; e-mail: [email protected]
Kristina Črnjar PhD, Associate Professor, University of Rijeka, Faculty of Tourism and Hospitality Management,
Primorska 42, P.O.B. 97, 51410 Opatija, Croatia; e-mail: [email protected]
Ivana Škarica Mag. oec., PhD Student, University of Rijeka, Faculty of Tourism and Hospitality Management,
Primorska 42, P.O.B. 97, 51410 Opatija, Croatia; e-mail: [email protected]
ABSTRACTQuality assurance in public health presents one of the key factors in the quality of health service. Accordingly, there is increasing awareness of the need to integrate quality systems and their principles into the healthcare system. Their role is important in the context of quality assurance in accordance with patient requirements as well as in the process of improving the quality of health care service. They are essential for the successful implementation of a quality management system and refer to customer focus, leadership, engagement of people, process approach, improvement, evidence–based decision making, and relationship management. This paper presents the results of a study among Croatian Institutes of Public Health with regard to the level of implementation of quality principles related to employee engagement, improvement and internal customer focus. Analysis focused on the relationship between focus on internal customer (employees) and improvements as well as the employee engagement and improvement respectively. Results show there is a strong positive relationship between employee engagement and improvements, while between internal customer focus and improvement the relationship has not been verified. In the context of standardization of quality of public health services, the paper aims to expand theoretical knowledge about TQM principles, with the emphasis on the employee engagement, internal customer focus (employees) and process improvement. The results can serve as a basis for improving the existing practice of quality management system implementation in the public health sector, with emphasis on employees.
Key words: Total Quality Management, employee engagement, internal customer focus, improvement, public health institutes
Creative Commons Attribution – NonCommercial 4.0 International License

A. M. Vrtodušić Hrgović, K. Črnjar, I. Škarica: Employee Engagement and Improvement as Important…Zbornik Veleučilišta u Rijeci, Vol. 8 (2020), No. 1, pp. 189-201
190
1. INTRODUCTION
In the past, many healthcare institutions were characterised by the lack of an integrative approach to quality; attempts to improve quality were fragmented and inconsistent and all the efforts in this field were based on individual quality projects. The management of employees was given low priority in healthcare institutions. Often, employee management relating to TQM was mostly instrumental, with a strong focus on standardizing professional behaviour, selection procedures and training programmes, putting little or no emphasis on development, and employee satisfaction and engagement (Schalk, Van Dijk, 2005). Only in the last decade has a more systematic and structured approach to quality been adopted, the main goal being the harmonization of existing quality programmes and overall optimization of the healthcare system in order to promote, among other things, the principles and values of Total Quality Management (TQM). In relation to that this paper is focused on the implementation of the TQM principles in the Institutes of Public Health in Croatia in particular on the employee engagement, quality improvements and internal customer focus.
2. LITERATURE REVIEW
To achieve sustainable success, healthcare institutions will be seeking ways to reach maximum efficiency in the performance of all processes by optimizing procedures with minimum effort of time and costs. In order to reach this goal, they will have to rely on their employees to execute tasks to the best of their ability based on their knowledge and competences (Werner, Weckenmann, 2012: 1534). Employees’ knowledge, competences, engagement and commitment will give a company a critical competitive advantage. Quality can be defined as a satisfied external customer, the road to which is paved by satisfied internal customers (Varey, 1995:46). The cooperation and commitment of all employees, together with well-developed customer-supplier relationships and a quality culture, will be the source of differentiation for institutions striving to achieve customer satisfaction. Individual people’s involvement will be a key component in implementing Total Quality Management in the institution.
According to Oakland, TQM is “an approach to improving the competitiveness, effectiveness and flexibility of a whole organization. It is essentially a way of planning, organizing and understanding each activity and depends on each individual at each level.” (Oakland, 2003:30). The ISO 9000 standard defines it as a part of the management system with regard to quality (ISO 9000:2015: 17)
According to the same standard, a quality management system is based on seven guiding principles that represent a set of fundamental beliefs, norms, rules and values that are accepted (Quality Management Principles, 2015) and refer to customer focus, leadership, engagement of people, process approach, improvement, evidence-based decision making and relationship management.
Employee engagement is a concept trying to understand and therefore describe the relationship between the organization and its employees by using quantitative and qualitative elements. An “engaged employee” is defined as one who is fully absorbed by and enthusiastic about their work

A. M. Vrtodušić Hrgović, K. Črnjar, I. Škarica: Employee Engagement and Improvement as Important…Zbornik Veleučilišta u Rijeci, Vol. 8 (2020), No. 1, pp. 189-201
191
and so takes positive action to further the organization’s reputation and interests. An engaged employee has a positive attitude towards the organization and its values (Paul, 2017).
There is a lack of universal definition of “employee engagement” presented by researchers and organizations. William Kahn provided the first formal definition of personnel engagement as “the harnessing of organisation members’ selves to their work roles; in engagement, people employ and express themselves physically, cognitively, and emotionally during role performances” (Kahn, 1990).
In the effort to introduce an integrative quality management approach in the institution such as Total Quality Management employees will be main driver of the implementation process. This approach will require dealing with a whole set of activities focusing on management of human resources such as employees’ satisfaction, commitment (especially top management), empowerment and training. M. Urbaniak argues that organisations that put a particular emphasis on the process of personnel management, especially on raising personnel qualification by investing in its development, achieve higher employee engagement in improvement of processes, efficiently affecting their attitude regarding identification of problems and problem solving as well as reporting improvement initiatives (Brajer-Marczak 2014, p. 97).
In addition to quality measurements and benchmarking, process management, product design, supplier quality management and customer involvement and satisfaction need to be addressed. Employee satisfaction and the quality of process control is closely and directly related to employee commitment. To a lesser degree this also applies to measurement/registration and guidelines and protocols which will work only when employees are committed. Employees must be focused on the company’s philosophy of commitment to never-ending improvement, be informed of the company’s goals and be made to feel part of the team (Schalk, Van Dijk, 2005:1719).
In the last years’ employee engagement is strongly emblemized as a strategic business objective that can secure productivity, improvement in quality of work, motivation and consequently long-term retention of employees. By studding companies with over fifty-hundred employees’ researchers found that 71% of managers do see employee engagement as one of the key factor in overall company success. At the same time only 33% of employees, as shown in the Gallup research, perceive themselves as engaged at work. There are a whole set of factors influencing this kind of disengagement from the employees’ side like lack of recognition in the company for the effort and work rendered, poor company communication and poor understanding of the company vision and mission (Brook, 2017).
The engagement of people emphasizes the importance of involving all people at all levels and respecting them as individuals in order to manage an organization effectively and efficiently (Quality Management principles, 2015). The importance of employee engagement is also emphasized in ISO 9001, as part of the requirement related to Resource Management, including Human Resource Management. In relation to managing human resources, focus is given to their expertise, training, awareness and communication. With regard to human resources, Clause 7.1.2 states that the organization shall determine and provide the persons necessary for the effective implementation of its quality management system and for the operation and control of its processes (ISO 9001:2015:6).

A. M. Vrtodušić Hrgović, K. Črnjar, I. Škarica: Employee Engagement and Improvement as Important…Zbornik Veleučilišta u Rijeci, Vol. 8 (2020), No. 1, pp. 189-201
192
Clause 7.1.6 underlines the importance of employee knowledge, stating that the organization shall determine the knowledge necessary for the operation of its processes and to achieve conformity of products and services. (ISO 9001:2015: 7) In addition to knowledge, competencies are one of the most important resources. To assure the competence of employees, the standard requires that an organization shall determine the necessary competence of persons doing work under its control that affects the performance and effectiveness of the quality management system and ensure that these persons are competent on the basis of appropriate education, training or experience (ISO 9001:2015: 8).
In order to enhance employee engagement, the collaboration and involvement of all people at all levels in the organization is important. To this end, regular education, team work and internal communication have to be fostered. Team work enables the exchange of ideas and experiences as well as providing an opportunity for employees to work together on common goals. Taking into account the fact that most of the processes involve a considerable number of employees, necessary improvements often have to be based on team learning. (Džakula et al., 2014:95). Kanji points out that the standard itself is of no importance and does not guarantee quality if there is no employee engagement and involvement (Kanji, 2002:48). Engagement of people refers to their involvement but also to the responsibility of finding opportunities for improvement on the individual as well as the team level.
“Improvement is essential for an organization to maintain current levels of performance, to react to changes in its internal and external conditions and to create new opportunities “(Quality Management Principles, 2015:10). The core of continuous improvement can best be illustrated by Deming’s PDCA cycle which shows that improvement is a never-ending process that needs to be implemented daily, in all areas of business operations. “The PDCA cycle is more than just a tool; it is a concept of continuous improvement processes embedded in an organization’s culture” (Soković, Pavletić, Kern Pipan, 2010:478). Kanji (2002) points out that a quality management system is not a short-term solution or a project that ends when the objective has been achieved but rather it is an organization management process that acknowledges the fact that the competition is also continuously making improvements and that customers expect any organization in the market to continuously make improvements in all segments of its business operations. Ultimately, the basis of customer satisfaction is grounded in the continuous improvement of customer-focused processes and activities (Kanji, 2002: 77). In this segment, adequate measurement – measuring progress in achieving the set goals, identifying opportunities for improvement, measuring the organization’s performance against various internal and external standards, etc. – is pivotal in providing data to drive further improvement in the future.
Organizations currently compete in terms of having the capacity to improve their processes continuously. This capacity will be influenced by many factors undoubtedly employee engagement and focus on employees as internal customers are one of them (Pekar, 1995). Instruction in creating employee engagement can be found among TQM assumptions which mentioned that employees have to perceive the working environment as one that is based on cooperation, trust and openness, that they are involved in the continuous improvement process, have sufficient knowledge and skills associated and skills associated with continuous improvement of processes, employees are

A. M. Vrtodušić Hrgović, K. Črnjar, I. Škarica: Employee Engagement and Improvement as Important…Zbornik Veleučilišta u Rijeci, Vol. 8 (2020), No. 1, pp. 189-201
193
suggested constant training in “improvement of the ways of improvement” (Brajer-Marczak 2014, p. 94). Continues improvement of processes will be carried out by employees who will require analytical skills and conceptual thinking, understanding of organization goals and commitment to the costumers.
A number of researches did focus their research on human aspects in the process of implementing TQM. Tari and Sabater examined the relationship between quality management and human aspects (empowerment, recognition, personnel policies and effects on employees) and concluded that this relationship exists and that certified firms with a greater extent of quality management do show a higher interest in human aspects (Tari, Sabater, 2006:484). Mosadeghrad established a connection between employee empowerment and the implementation process of TQM, because those healthcare organizations that put more emphasis on employee empowerment are more successful in the implementation process. He argues that teamwork and participative culture contribute to employee empowerment and involvement in quality improvement activities. (Mosadeghrad, 2015:552, 553). Few studies emphasise the importance of training and education for successful TQM implementation and job involvement (Mosadeghrad, 2015: Karia, Asari, 2006)
Research findings from Salaheldin and Mukhalati (2009:1) have shown that there is a common understanding between managers in healthcare organizations about the significance of top management support, employee training and involvement in TQM implementation. Arsić et al. (2015) found that employees employed in companies with implemented quality systems are, in general, satisfied with their working conditions and committed to the organization.
3. RESEARCH METHODOLOGY
Public Health Institutes represent the “backbone “of public health in Croatia and therefore are represented in all Croatian counties.
The Croatian network of public health institutes consists of 21 county Institutes. Within the wide range of activities being performed within these institutes, mandatory is accreditation according to the standard ISO/IEC 17025 for activities such as safety testing for food, water, air, general use items, micro-biological cleanliness of objects and water sampling. In addition to some of the Institutes having implemented and certified ISO 9001, the above mentioned fact is the reason why 20 out of 21 county Institutes are accredited according to ISO/IEC 17025.
One of the advantages of accreditation lies in the fact that ISO/IEC 17025 includes quality principles in accordance with the ISO 9001, considered as being the first step towards TQM (Yung, 1997). Hence, all county Public Health Institutes were able to be included in this study to examine the application of TQM principles with the focus on the relationship of employee engagement and internal customer focus with improvements.
Hence, this study hypothesises the following:
H1: There is a significant positive correlation between internal customer focus (employees) and continuous improvement.

A. M. Vrtodušić Hrgović, K. Črnjar, I. Škarica: Employee Engagement and Improvement as Important…Zbornik Veleučilišta u Rijeci, Vol. 8 (2020), No. 1, pp. 189-201
194
H2: There is a significant positive correlation between employee engagement and continuous improvement.
To analyse the level of implementation of TQM principles, the study encompassed all the Croatian Institutes of Public Health. The main focus was on the extent to which TQM activities are implemented in the public health sector. Questionnaire was based on the Kanji TQM model (2002) and was adjusted to the specifics of Institutes of Public Health. The questionnaire was pretested by two employees from the Quality Department of the Teaching Institute of public health in Rijeka and it contained 48 questions in total (5 questions referred to Leadership, 11 to the principle Delight the customer, 7 questions referred to Continuous improvement, 9 questions to People-based management, and 16 questions to Management by fact). The questionnaire also included 2 questions focused on the information regarding quality management systems that are implemented or are planned to be implemented. Questionnaires were sent by e-mail to Quality Managers in all Public Health Institutes since each Institute appointed one Quality Manager as a Board representative. Therefore, Quality Managers formed the sample in this research.
The questionnaire contained questions in relation to the extent of implementation of quality principles by using a Likert-type scale (1 – very low, 5 – very high) and referred to stated principles – leadership, delight the customer (internal and external), improvement, people-based management and management by fact. The response rate was 95% (20 Institutes out of total of 21). The data were analysed using methods of descriptive and inferential statistics (with SPSS, Statistical Package for the Social Sciences) v.21).
4. RESEARCH RESULTS
The results of the performed descriptive analysis (mean, standard deviation) for the chosen TQM principles (employee engagement, improvement and internal customer focus) are presented in table 1.
Table 1. Descriptive statistics
PRINCIPLESCORE CONCEPTS
The extent to which:MEAN ST. DEV.
Employee EngagementFeedback is provided to employees on
their performance4.15 0.67
Employee EngagementQuality-related training is given to
employees4.00 0.73
Employee EngagementTeamwork is encouraged for employees to communicate to others about their jobs
3.95 0.76
Employee EngagementMeans are available for all employees to
contribute effectively to meeting the unit’s quality objectives
4.15 0.81

A. M. Vrtodušić Hrgović, K. Črnjar, I. Škarica: Employee Engagement and Improvement as Important…Zbornik Veleučilišta u Rijeci, Vol. 8 (2020), No. 1, pp. 189-201
195
Employee Engagement Action-teams are used to solve problems 3.80 0.70
Employee EngagementQuality-related training is given to
managers4.11 0.74
Employee EngagementThere are resources available for employee
training4.11 0.74
Employee EngagementManagers remove the barriers that
prevent people from improving quality3.95 0.61
Employee Engagement People are proud to work for the unit 4.00 0.73
ImprovementQuality improvement methods are used
to improve all services4.05 0.83
ImprovementProcesses are designed to prevent
potential problems4.05 0.76
ImprovementAn active employee suggestion scheme is
used3.65 1.04
ImprovementImproved customer services are introduced to drive out failures
4.15 0.81
ImprovementThe unit has quality culture of continuous
improvement3.95 0.95
ImprovementThe unit compares current quality
levels of services features with those of competitors
3.40 0.99
ImprovementUses information gained from customers
to improve services4.30 0.73
Customer Focus (internal)
Unit provides what is needed by employees for them to perform their jobs
4.30 0.73
Customer Focus (internal)
There exist methods to improve coordination of interdependent tasks
3.50 0.76
Customer Focus (internal)
There are strong employee interactions within organizational units
3.35 0.59
Source: Authors

A. M. Vrtodušić Hrgović, K. Črnjar, I. Škarica: Employee Engagement and Improvement as Important…Zbornik Veleučilišta u Rijeci, Vol. 8 (2020), No. 1, pp. 189-201
196
According to results, it can be concluded that the level of implementation of all analysed principles ranges from moderate to high (average grade ranging from 3,4 to 4,3), with the highest grades scored by the principles referring on employees and the assured resources (4,30) as well as using information gained from customers to improve services (4,30). Improvements can be done in strengthening the interactions among organizational units (3,35) and comparing quality levels of services with those of competitors (3,40) and fostering coordination of interdependent tasks (3,50).
Cronbach’s alpha coefficient as a measure of internal consistency reliability of scale was calculated for all three constructs - customer focus, continuous improvement and employee engagement. As can be seen from tables 2-5, results demonstrated satisfactory level of reliability:
Table 2. Cronbach’s alpha coefficient for all three constructs
Reliability StatisticsCronbach’s Alpha N of Items
.935 19Source: Authors
Table 3. Cronbach’s alpha coefficient for internal customer focus
Reliability StatisticsCronbach’s Alpha N of Items
.789 3Source: Authors
Table 4. Cronbach’s alpha coefficient for employee engagement
Reliability StatisticsCronbach’s Alpha N of Items
.896 9Source: Authors
Table 5. Cronbach’s alpha coefficient for continuous improvement
Reliability StatisticsCronbach’s Alpha N of Items
.921 7Source: Authors
Since Cronbach’s alpha coefficients were satisfactory for all constructs, composite variables were calculated and used in correlation analysis to prove the hypotheses.
In order to test the normality of distribution (McDonald, 2014), and having in mind the sample size (<50), the Shapiro-Wilk test was conducted. Based on the obtained results, Spearman correlation coefficient was calculated and presented in tables 6 and 7.

A. M. Vrtodušić Hrgović, K. Črnjar, I. Škarica: Employee Engagement and Improvement as Important…Zbornik Veleučilišta u Rijeci, Vol. 8 (2020), No. 1, pp. 189-201
197
Table 6. Spearman’s correlation coefficient between internal customer focus and continuous improvement
Continuous improvement Correlation Coefficient 0.318
Internal customer focus Sig. (2-tailed) 0.172Note: ** Correlation is significant at the 0.01 level (2-tailed)
Source: Authors
Table 7. Spearman’s correlation coefficient between employee engagement and continuous improvement
Continuous improvement Correlation Coefficient 0.840**
Employee engagement Sig. (2-tailed) 0.000Note: ** Correlation is significant at the 0.01 level (2-tailed)
Source: Authors
Correlation between two variables is quantified with a number which varies between -1 and +1. Zero means there is no correlation and 1 indicates complete correlation, while values between 0 and 1 are interpreted in the following way (Schober, Boer and Schwarte, 2018:1765; Akoglu, 2018:92):
Table 8. Interpretation of correlation coefficient
Correlation coefficient Interpretation
r > 0.70 Strong correlation
0.40 ≤ r ≤ 0.70 Moderate correlation
0 ≤ r ≤ 0.40 Weak correlationSource: Authors
According to the interpretation criteria shown in table 8, it can be concluded that the obtained results presented in table 6 and table 7 demonstrate statistically significant strong correlation between constructs Employee engagement and Continuous improvement, while the correlation between Internal customer focus and Improvements has not been detected. Therefore, it can be concluded that hypotheses H2 has been confirmed, while H1 not. One of the reasons may arise from the fact that the level of implementation of some activities related to employee engagement are still higher than those related to internal customer focus. In order to verify relationship between those principles further and more detailed research is needed.

A. M. Vrtodušić Hrgović, K. Črnjar, I. Škarica: Employee Engagement and Improvement as Important…Zbornik Veleučilišta u Rijeci, Vol. 8 (2020), No. 1, pp. 189-201
198
5. CONCLUSION AND DISCUSSION
Research results from the Croatian public health sector have shown that quality managers are familiar with TQM principles and are taking action in relation to their implementation. Three TQM principles were chosen for the purpose of this research – employee engagement, continuous improvement and internal customer focus (employees). Descriptive statistics demonstrated that the stated principles achieved a medium to high score with regard to level of implementation (average grade ranges from 3.4 to 4.3). In addition to the average score pertaining to the extent of implementation, the relationship between employee engagement and continuous improvement as well as the relationship between improvement and internal customer focus (employees) were analysed (Spearman’s correlation coefficient).
Results have shown that statistically significant strong positive relationship exists between some of the analysed constructs. Namely, employee engagement is significantly positively correlated with continuous improvement. The other correlation, the one between internal customer focus (employees) and continuous improvement has not been detected.
The scientific contribution of this study is that it expands knowledge on the role of quality principles for the public health services, with focus on employee engagement in the improvement process, as preconditions to creating a good working environment. The study’s applicative contribution is that its results can serve as guidelines for quality managers to facilitate the effective implementation of quality management principles in public health institutes with the focus on internal customers (employees).
A limitation of this study is the sample size. Accordingly, in addition to Public Health Institutes, researches could be expanded on other public health institutions both in Croatia as well as in neighbouring countries. After conducting the research authors concluded that further and more detailed research is needed in order to further examine the relationship between internal customer focus (employees) and continuous improvement as TQM principles.
Furthermore, future research could focus on the measurement of patient satisfaction and the analysis of the connection between employee and patient satisfaction, as well as on the analysis of impacts of TQM principles on patients’ and employees’ satisfaction.
REFERENCESAkola, H. (2018) “User’s guide to correlation coefficients”, Turkish journal of emergency medicine, 18 (3), pp. 91-93.
https://doi.org/10.1016/j.tjem.2018.08.001
Arndt, M., Bigelow, B. (1995) “The implementation of TQM in hospitals: How good is the fit?” Health care Management Review, 20(5), str. 7-14
Arsis, M., et al. (2012) “The effect of TQM on employee loyalty in transition economy”, Serbia. Total Quality Management and Business Excellence, 23(6), 719–729. doi: https://doi.org/10.1080/14783363.2012.669930
Brajer-Marczak, R. (2014) Employee engagement in continuous improvement of processes, Management, 18 (2), pp. 88-103. https://doi.org/10.2478/manment-2014-0044.

A. M. Vrtodušić Hrgović, K. Črnjar, I. Škarica: Employee Engagement and Improvement as Important…Zbornik Veleučilišta u Rijeci, Vol. 8 (2020), No. 1, pp. 189-201
199
Brook, J. (2019) Why Employee Engagement Is Key To Company Success, https://www.socialchorus.com/blog/employee-experience/employee-engagement-key-to-company-success/ accessed 20.10.2019.
Counte, M. A., Glandon, G. L., Oleske, D. M., Hill, J. P. (1995) “Improving hospital performance: Issues in assessing the impact of TQM impact activities”. Hospital and Health Services Administration, 40(1), pp. 80-94.
Džakula, A., et al. (2014) “Croatia: Health system review”. Health Systems in Transition, European Observatory on Health Systems and Policies, 16(3), pp. 1-162.
HRN EN ISO 9000, Quality management systems – Fundamentals and vocabulary (ISO 9000:2015; EN ISO 9000:2015), Croatian Standards Institute
HRN EN ISO 9001, Quality management systems – Requirements (ISO 9001:2015; EN ISO 9001:2015), Croatian Standards Institute
International Organization for Standardization (2015), Quality Management Principles, ISO Central Secretariat, Geneva, https://www.iso.org/files/live/sites/isoorg/files/archive/pdf/en/pub100080.pdf
Kahn, W. A (1990) “Psychological Conditions of Personal Engagement and Disengagement at Work”, Academy of Management Journal. 33 (4), pp. 692–724.
Kanji, G. K. (2002) Measuring Business Excellence, London: Routledge-Taylor & Francis Group.
Karia, N, Asaari, M. H. A. H. (2006) “The effects of total quality management practices on employees’ work-related attitudes”, The TQM Magazine, 18(1), pp. 30-43, https://doi.org/10.1108/09544780610637677
McDonald, J. H. (2014) Handbook of Biological Statistics, 3rd Edition, Sparky House Publishing, Baltimore, Maryland, USA.
Mosadeghrad, A. M. (2015). “Developing and validating a TQM management model for healthcare organisations”. The TQM Journal, 27 (5), pp. 544-564., https://doi.org/10.1108/tqm-04-2013-0051
Oakland, J. S., Total Quality Management text with cases, Elsevier Butteworth – Heinemann, Oxford, Burlington
Paul, E. (2017) Employee On boarding, HR Onboarding Effective Ways to Improve Employee Engagement, https://www.emptrust.com/blog/employee-engagement-a-key-hr-strategy accessed 20. 10. 2019.
Pekar, J. P. (1995). Total quality management: guiding principles for application, Philadelphia: American Society for Testing & Materials Petersen
Rizal, N. M., Wahl, Y. B. (2011) „Power comparisons of Shapiro-Wilk, Kolmogorov-Smirnov, Lilliefors and Anderson-Darling tests”, Journal of Statistical Modelling and Analytics, 2 (1), pp. 21–33.
Salaheldin, S. I., Mukhalati, B. A., (2009) “The implementation of TQM in the Qatari Healthcare sector”, Journal of Accounting – Business & Management, 16 (2), pp 1-14
Schalk, R., van Dijk, W. (2005), “Quality management and employee commitment: Illustrated with examples from Dutch health care”, International Journal of Health Care Quality Assurance, 18 (1), pp. 32-40. https://doi.org/10.1108/09526860510576956
Schobert, P., Boer, C., Schwerte, L. A. (2018) “Correlation Coefficients: Appropriate Use and Interpretation”, Anaesthesia and analgesia, 126(5), pp. 1763-1768.
Short, P. J., Rahim, M. A. (1995). “Total quality management in hospitals”, Total Quality Management, 6, pp. 255–263. doi: https://doi.org/10.1080/09544129550035422
Sokovic, M., Pavletic, D., Kern Pipan, K. (2010). „Quality Improvement Methodologies – PDCA Cycle, RADAR Matrix, DMAIC and DFSS“, Journal of Achievements in Materials and Manufacturing engineering, 43(1), pp. 476-483.
Tari, J. J., Sabater V. (2006). “Human aspects in a quality management context and their effects on performance”. The International Journal of HR Management, 17(3), pp. 484-503, https://doi.org/10.1080/09585190500521557
Werner, T., Weckenmann, A. (2012), “Sustainable quality assurance by assuring competence of employees”, Measurement, 45 (6), pp. 1534-1539, ISSN 0263-2241, https://doi.org/10.1016/j.measurement.2012.02.025.

A. M. Vrtodušić Hrgović, K. Črnjar, I. Škarica: Employee Engagement and Improvement as Important…Zbornik Veleučilišta u Rijeci, Vol. 8 (2020), No. 1, pp. 189-201
200
Varey, J. R. (1995). Internal marketing: a review and some interdisciplinary research challenges. International Journal of Service Industry Management, 6(1), pp. 40-63.
Zabada, C., Rivers, P. A., Munchus, G. (1998). “Obstacles to the application of total quality management in health-care organizations”. Total Quality Management, 9(1), 57–66. https://doi.org/10.1080/0954412989261
Yang, C. C. (2003). “The establishment of a TQM system for the health care industry”. The TQM Magazine, 15(2), pp. 93-98. https://doi.org/10.1108/09544780310461107
Yung, W. K. C. (1997) “The values of TQM in the revised ISO 9000 quality system”, International Journal of Operations & Production Management, 17(2), pp. 221–230. https://doi.org/10.1108/01443579710158078

A. M. Vrtodušić Hrgović, K. Črnjar, I. Škarica: Employee Engagement and Improvement as Important…Zbornik Veleučilišta u Rijeci, Vol. 8 (2020), No. 1, pp. 189-201
201
Izvorni znanstveni rad https://doi.org/10.31784/zvr.8.1.18 Datum primitka rada: 30. 12. 2019. Datum prihvaćanja rada: 2. 3. 2020.
UKLJUČENOST ZAPOSLENIKA I POBOLJŠANJA – ZNAČAJNA NAČELA TQM-A U ZAVODIMA ZA JAVNO
ZDRAVSTVO Ana-Marija Vrtodušić Hrgović
Dr. sc., izvanredna profesorica, Sveučilište u Rijeci, Fakultet za menadžment u turizmu i ugostiteljstvu, Primorska 42, p. p. 97, 51 410 Opatija, Hrvatska; e-mail: [email protected]
Kristina Črnjar Dr. sc., izvanredna profesorica, Sveučilište u Rijeci, Fakultet za menadžment u turizmu i ugostiteljstvu,
Primorska 42, p. p. 97, 51 410 Opatija, Hrvatska; e-mail: [email protected]
Ivana Škarica Mag. oec., doktorandica, Sveučilište u Rijeci, Fakultet za menadžment u turizmu i ugostiteljstvu,
Primorska 42, p. p. 97, 51 410 Opatija, Hrvatska; e-mail: [email protected]
SAŽETAKOsiguranje kvalitete u javnom zdravstvu predstavlja jedan od ključnih čimbenika kvalitete zdravstvene usluge. Sukladno tome raste svijest o nužnosti integriranja sustava kvalitete i njihovih načela u zdravstveni sustav. Njihova je uloga važna u kontekstu osiguranja kvalitete u skladu sa zahtjevima pacijenata kao i u procesu poboljšanja kvalitete zdravstvene usluge. Ključni su za uspješnu provedbu sustava upravljanja kvalitetom i odnose se na : usmjerenost na kupca, vodstvo, uključenost ljudi, procesni pristup, poboljšavanje, donošenje odluka na temelju činjenica i upravljanje odnosima, U ovom se radu daje prikaz rezultata istraživanja o razini primjene načela TQM-a u Zavodima za javno zdravstvo u Republici Hrvatskoj a vezano uz uključenost zaposlenika, poboljšanja i fokus na internog kupca. Analiza je usmjerena na utvrđivanje veze između uključivanja zaposlenika i poboljšanja te fokusa na unutarnjeg kupca (zaposlenika) i poboljšanja. Rezultati pokazuju da postoji snažna povezanost između uključenosti ljudi i poboljšanja, dok između primjene poboljšanja i usmjerenosti na unutarnjeg kupca nije utvrđena povezanost. U kontekstu standardizacije kvalitete usluga u javnom zdravstvu rad ima za cilj proširiti teorijske spoznaje o TQM načelima i to posebno za uključenost zaposlenika, fokus na internog kupca (zaposlenika) i poboljšanja procesa. Dobiveni rezultati mogu poslužiti kao osnova za poboljšanje postojeće prakse implementacije TQM-a u javno zdravstvenom sustavu s posebnim naglaskom na ulogu zaposlenika u tom procesu.
Ključne riječi: upravljanje potpunom kvalitetom, uključivanje zaposlenika, usmjerenost na internog kupca, Zavodi za javno zdravstvo
Creative Commons Attribution – NonCommercial 4.0 International License


V. Đurek, C. Sedda: Primjena metoda odlučivanja u lokalnoj samoupraviZbornik Veleučilišta u Rijeci, Vol. 8 (2020), No. 1, pp. 203-226
203
Prethodno priopćenje https://doi.org/10.31784/zvr.8.1.20 Datum primitka rada: 29. 6. 2019. Datum prihvaćanja rada: 17. 9. 2019.
PRIMJENA METODA ODLUČIVANJA U LOKALNOJ SAMOUPRAVI
Valentina Đurek Dipl. inf. univ. spec. oec., Grad Zabok, Zivtov trg 10, 49 210 Zabok, Hrvatska; e-mail: [email protected]
Claudia Sedda Mag. iur., Eurobridge, Via Roma 250, Gavoi 08020, Italija; e-mail: [email protected]
SAŽETAKSuradnja s udrugama u provedbi javnih politika najčešće se očituje kroz različite oblike financijske i nefinancijske podrške koje jedinice lokalne samouprave pružaju programima i projektima od interesa za opće dobro. Ta vrsta međusektorske suradnje ima veliki potencijal za generiranje brojnih pozitivnih promjena i stvaranje prijeko potrebnih sinergija za održiv društveni i gospodarski razvoj. U kojoj će mjeri taj potencijal biti ostvaren, uvelike ovisi o kvaliteti kriterija, standarda i postupaka za dodjelu financijskih i nefinancijskih podrški, kao i organizacijskim i ljudskim resursima unutar javnih institucija nužnih za uspješno praćenje i vrednovanje ugovorenih modela podrške. Glavni cilj ovog rada je na primjeru pokazati kako je moguće unaprijediti kvalitetu donošenja odluka u lokalnoj samoupravi primjenom metoda odlučivanja u procesu donošenja odluka o financiranju udruga u kulturi. Na primjeru će se odrediti važnost (težinski koeficijenti) kriterija i podkriterija za procjenu kvalitete projekata/prijava udruga u kulturi (N = 18) s područja Grada Zaboka. Isto tako, u ovom radu AHP metoda primijenit će se za izradu modela rangiranja programa/projekata u kulturi koji su financirani iz proračuna Grada Zaboka. Model će se validirati na povijesnim podacima iz 2018. godine.
Ključne riječi: višekriterijsko odlučivanje, AHP, matrica rizika, udruge, kultura
1. UVOD
Jedinice lokalne samouprave planiraju sredstva u proračunu, odnosno financijskom planu za narednu kalendarsku godinu za sufinanciranje programa/projekta udruga koja se raspodjeljuju temeljem Javnog natječaja. Iznos koji će se dodjeljivati udrugama od 2016. godine ne planira se u proračunu davatelja temeljem iznosa koji predlažu same udruge na osnovi vlastitih potreba za financijskim sredstvima, već se okvirni iznos za financiranje planira temeljem procjene prioritetnih potreba. Osim iznosa financijskih sredstava koja će se putem natječaja dodjeljivati udrugama, planiranje financijskih resursa za provedbu natječajnog procesa uključuje i planiranje dodatnih sredstava za troškove rada povjerenstva, za potencijalna stručna usavršavanja, za moguće troškove
Creative Commons Attribution – NonCommercial 4.0 International License

V. Đurek, C. Sedda: Primjena metoda odlučivanja u lokalnoj samoupraviZbornik Veleučilišta u Rijeci, Vol. 8 (2020), No. 1, pp. 203-226
204
povezane s najmom dvorana za predstavljanje ugovorenih projekata, odnosno programa ako davatelj financijskih sredstava već ne raspolaže dovoljnim prostorima, za podugovaranje provedbe svih ili pojedinih elemenata postupka financiranja i dr.
Praćenje rada udruga u kvalitativnom i financijskom smislu Grad Zabok je do 2015. godine provodio u skladu s mogućnostima Proračuna temeljem iznosa koji su predlagale same udruge. Prema Službenom glasniku Krapinsko-zagorske županije (2015) sufinanciranje za 2016., 2017. i 2018. godinu provedeno je sukladno odredbama Pravilnika o financiranju i odobravanju nefinancijskih podrška udrugama, te odredbama Uredbe o kriterijima, mjerilima i postupcima financiranja i ugovaranja programa i projekata od interesa za opće dobro koje provode udruge (Narodne novine, 2015). U ovom radu predlažu se metode za dodjelu sredstava udrugama temeljem Javnog natječaja čiji su obveznici sve JLS u Republici Hrvatskog (temeljem gore spomenute Uredbe), a primjena metode bit će demonstrirana na primjeru Grada Zaboka i dodijele sredstava udrugama u kulturi.
Sukladno navedenom, Grad Zabok pripremio je novi Javni natječaj za financiranje rada udruga s područja Grada Zaboka u 2019. godini kojim se definiraju glavna područja intervencije Grada Zaboka u kojima će se pružiti odgovarajuća financijska i institucionalna potpora za rad udruga s područja Grada Zaboka. Javni natječaj predstavlja temelj za izradu učinkovitog sustava financiranja programa i projekata organizacija civilnog društva s područja Grada Zaboka. Provođenje Javnog natječaja temelji se na načelima:
1.Transparentnosti – svaka udruga prilagala je zahtjev za financiranje uz opise akcija koje se planiraju provoditi te je javnost bila obaviještena o načinu i svrsi financiranja udruga koje su ostvarile potporu iz gradskog proračuna;
2. Jednakih mogućnosti – svaka udruga je putem javnog natječaja imala jednaku mogućnost ostvariti potporu iz proračuna;
3. Usmjerenosti – sredstva su dodjeljivana udrugama koje su jasno opisale doprinos projekta ostvarenju javnog interesa i općeg dobra svih građana grada Zaboka.
Prilikom pripreme Javnog natječaja i natječajne dokumentacije, gradske službe pridržavale su se Kodeksa pozitivne prakse, standarda i mjerila za ostvarivanje financijske potpore projektima i programima udruga. Tijekom 2018. godine ukupno je 27 udruga ostvarilo potporu Javnog natječaja za financiranje programa ili projekata udruga koji doprinose razvoju kapaciteta udruga iz prioritetnih područja kulture (18 udruga) i socijalne skrbi (9 udruga).
2. PREGLED DOSADAŠNJE LITERATURE
Rezultati pregleda dosadašnje literature pokazali su da su primjeri korištenja metoda višekriterijskog odlučivanja u jedinicama lokalne samouprave (JLS) i regionalne samouprave rijetki te da su u različitim područjima primjene.
Autori Magbagbeola et al. (2012) u svojem radu prikazuju primjenu metode za višekriterijsko odlučivanje AHP (engl. Analytical Hierarchy Process) u rješavanju problema statističkih podataka

V. Đurek, C. Sedda: Primjena metoda odlučivanja u lokalnoj samoupraviZbornik Veleučilišta u Rijeci, Vol. 8 (2020), No. 1, pp. 203-226
205
u poljoprivredi na razini jedinice lokalne samouprave, dok autori Tot et al. (2016) u svojem radu analiziraju, primjenom metode AHP, koji ključni čimbenici utječu na razvoj održivog gospodarenja otpadom.
Autori Setiawan et al., (2016) navode da se primjenjuje koncept sustava podrške grupnom odlučivanju za procjenu učinkovitosti projekata IKT-a u indonezijskim regionalnim državnim agencijama kako bi se prevladale sve moguće nedosljednosti do kojih može doći prilikom donošenja odluka pri čemu se integriraju metode AHP, TOPSIS (engl. Technique for Order Preference by Similarity to Ideal Solution) i metode Copeland za određivanje najbolje rangiranih projekta od strane donositelja odluka.
Autori Kadoic et al. (2016) u svojem radu prikazuju primjenu dviju metoda za višekriterijsko odlučivanje koje su podržane IKT-om: metoda AHP i rangiranje na temelju ocjena sudionika kao novi pristup za rješavanje problema u JLS-u, budući da u Republici Hrvatskoj nema primjera koji podržavaju IKT donošenje odluka u malim gradovima ili općinama.
Utjecaj IKT-a u strukturnom dijalogu između donositelja odluka na lokalnoj, regionalnoj, nacionalnoj i europskoj razini i građana, te metodologija koja će pomoći povećati razinu strukturiranog dijaloga između JLS-ova i nevladinih organizacija primijenjena je u projektu „Go, go, NO!“ (Kadoić, 2016). U jedinicama lokalne samouprave može se povećati razina strukturiranog dijaloga u područjima različitih društvenih pitanja korištenjem metodologije koja se temelji na Demingovom krugu i Sustavu uravnoteženih ciljeva (engl. Balanced Scorecard - BSC) (Kadoić, 2017).
Autori Listyaningsih i Utami (2018) navode da su se metode višekriterijskog odlučivanja AHP i TOPSIS pokazale vrlo učinkovitima u evaluaciji učinkovitosti jedinica lokalne samouprave; AHP metoda koristila se za određivanje težinskih vrijednosti kriterija, a TOPSIS metoda za rangiranje učinkovitosti JLS-ova.
3. MODELIRANJE SUSTAVA ODLUČIVANJA ZA ODABIR PROGRAMA/PROJEKATA AHP METODOM
Odlučivanje je kognitivni proces koji se sastoji od prepoznavanja problema i biranja mogućih rješenja koja vode do nekog željenog stanja. Odlučivanje je vrlo odgovoran i težak posao jer donošenje odluka za sobom nosi i način provođenja inih. Odlučivanje je prisutno u svakodnevnom životu, u profesionalnom i privatnom. Sposobnost donošenja odluke je vještina koja se usavršava s vremenom i iskustvom. Prema Weihrichu i Koontzu (1998), odlučivanje je izbor načina djelovanja između više alternativa. Prema Daftu (2001), proces odlučivanja je proces identifikacije i proces rješavanja problema.
U privatnom odlučivanju u velikoj se mjeri koristi intuitivno odlučivanje. Prema autorima Sikavica et al. (1999) poslovno odlučivanje zahtijeva više sistematičnosti nego odlučivanje u privatnom životu, zato što pogađa veći broj članova organizacije. Što je razina odlučivanja viša s aspekta raspona odgovornosti, to je i odlučivanje važnije budući da se tiče velikog broja članova organizacije pa u slučaju pogrešne odluke može imati katastrofalne posljedice za organizaciju kao cjelinu.

V. Đurek, C. Sedda: Primjena metoda odlučivanja u lokalnoj samoupraviZbornik Veleučilišta u Rijeci, Vol. 8 (2020), No. 1, pp. 203-226
206
3. 1 Višekriterijsko odlučivanje
Višekriterijsko odlučivanje primjenjuje se u situacijama odlučivanja kada postoji veći broj konfliktnih kriterija. Karakteristike problema višekriterijskog odlučivanja su prisutnost većeg broja kriterija ili atributa, konflikt među tim kriterijima, neusporedivost mjernih jedinica između kriterija, prisutnost većeg broja alternativa koje se međusobno razlikuju po vrijednostima određenih kriterija te izbor alternative koja je ukupno gledano između svih alternativa najbolja. Glavni elementi problema odlučivanja su ciljevi koji se žele postići odlukom, alternative između kojih se bira, kriteriji kojima se mjeri postizanje ciljeva i težine tih kriterija koje odražavaju njihovu važnost s obzirom na problem. Problem višekriterijskog odlučivanja moguće je prikazati pomoću tablice odlučivanja ili matrice koja je tipa gdje se u redovima nalazi alternativa ili mogućnosti, a u stupcima kriteriji ili atributi. Polje matrice predstavlja vrijednost atributa alternative . Redak matrice predstavlja vrijednosti atributa jedne alternative dok jedan stupac predstavlja vrijednosti jednog atributa za alternative koje su predmet odlučivanja.
3. 2 Analitički hijerarhijski proces - AHP metoda
Analitički hijerarhijski proces - AHP metoda jedna je od najpoznatijih metoda višekriterijskog odlučivanja. Prvi puta metodu spominje autor Saaty (1972). Autor Saaty (1977) detaljno opisuje metodu AHP. Mnogi autori u svojim radovima najčešće se referenciraju na knjigu istog autora objavljenu 1980. godine u kojoj autor Saaty (1980) navodi da se primjena AHP metode sastoji od 4 glavna koraka:
1. Razviti hijerarhijski model problema odlučivanja s ciljem na vrhu, kriterijima i podkriterijima na nižim razinama te alternativama na dnu modela (Slika 1). Potrebno je prepoznati cilj koji se želi postići, definirati alternative koje zadovoljavaju postavljene zahtjeve, definirati prioritete zahtjeva kako bi se alternative implementirale i ostvario globalni cilj. Složenost problema raste s brojem kriterija i s brojem alternativa. Sposobnost ljudskog uma u međusobnom razlikovanju velikog broja alternativa i kriterija je ograničena, te se u skladu s time, pri formiranju hijerarhije ne preporučuje više od elemenata na istoj razini.

V. Đurek, C. Sedda: Primjena metoda odlučivanja u lokalnoj samoupraviZbornik Veleučilišta u Rijeci, Vol. 8 (2020), No. 1, pp. 203-226
207
Slika 1. Hijerarhijski model problema odlučivanja
Izvor: obrada autora
2. U svakom čvoru hijerarhijske strukture međusobno se uspoređuju u parovima elementi tog čvora u odnosu na to koliko je puta jedan od njih važniji od drugog za postizanje cilja pomoću Saatyjeve ljestvice ocjenjivanja (Tablica 1).
Tablica 1. Saatyjeva ljestvica relativnih važnosti
Intenzitet važnosti
Definicija Objašnjenje
1 Jednako važno Dvije aktivnosti jednako doprinose cilju.
2
3
Slabo, blago važnije
Umjereno važnije
Na temelju iskustva i procjena daje se umjerena prednost jednoj aktivnosti u odnosu na drugu.
4
5
Umjerenije do
Strogo važnije
Na temelju iskustva i procjena, strogo se favorizira jedna aktivnost u odnosu na drugu.
6
7
Važna do
Vrlo stroga, dokazana važnost
Jedna aktivnost izrazito se favorizira u odnosu na drugu, njezina dominacija dokazuje se u praksi.
8
9
Vrlo, vrlo stroga do
Ekstremna važnost
Dokazi na temelju kojih se favorizira jedna aktivnost u odnosu na drugu, potvrđeni su s najvećom uvjerljivošću.
2,4,6,8 Međuvrijednosti
1.1 – 1.9 Slične aktivnostiPri usporedbi aktivnosti koje su po važnosti blizu jedna drugoj, potrebne su decimalne vrijednosti kako bi se
preciznije izrazila razlika u njihovoj važnosti.Izvor: T. L. Saaty (1977)

V. Đurek, C. Sedda: Primjena metoda odlučivanja u lokalnoj samoupraviZbornik Veleučilišta u Rijeci, Vol. 8 (2020), No. 1, pp. 203-226
208
3. Iz procjena relativnih važnosti elemenata odgovarajuće razine hijerarhijske strukture problema izračunaju se lokalne težine (prioriteti) kriterija i podkriterija, a na posljednjoj razini prioriteti alternativa. Ukupni prioriteti alternativa izračunavaju se tako da se njihovi lokalni prioriteti ponderiraju s težinama svih čvorova kojima pripadaju gledajući od najniže razine u hijerarhijskome modelu prema najvišoj i zatim zbroje.
4. Provodi se analiza osjetljivosti.
Prema Harkeru i Vargasu (1987) i Begičević (2008) AHP metoda zasniva se na sljedećim aksiomima:
1. Aksiom recipročnosti. Ako je element A puta značajniji od elementa B, tada je element B puta značajniji od elementa A.
2. Aksiom homogenosti. Usporedba ima smisla jedino ako su elementi usporedivi.
3. Aksiom zavisnosti. Dopušta se usporedba elemenata jedne razine u odnosu na element više razine, tj. usporedbe na nižim razinama zavise od elementa više razine.
4. Aksiom očekivanja. Svaka promjena u strukturi hijerarhije zahtijeva ponovni postupak računanja prioriteta.
3. 3 Razvoj AHP modela
AHP model za rangiranje programa/projekata u kulturi izrađen je u četiri koraka: Određivanje kriterija i podkriterija, Procjena važnosti kriterija u parovima, Matrica procijenjenih omjera važnosti kriterija i podkriterija te Izračun težinskih koeficijenata kriterija i podkriterija.
3. 3. 1 Određivanje kriterija i podkriterija
U cilju osiguravanja odgovarajuće financijske i institucionalne potpore za rad udruga Grad Zabok raspisuje Javni natječaj za financiranje potpore programima i projektima udruga kojim se utvrđuje koje će udruge u proračunskoj godini biti sufinancirane za prijavljene programe/projekte i u kojim iznosima. Odluka o odabiru financiranja programa/projekata udruga donosi se na temelju kriterija. Kriteriji su određeni temeljem Uredbe o kriterijima, mjerilima i postupcima financiranja i ugovaranja programa i projekata od interesa za opće dobro koje provode udruge (Narodne novine 26/2015.), međutim davatelj financijskih sredstava može uvjetima natječaja propisati da udruga mora ispunjavati i dodatne uvjete. Kriteriji relevantni za odabir programa/projekata u kulturi koje sufinancira Grad Zabok podijeljeni su u četiri skupine (Slika 2):
• Institucionalna sposobnost prijavitelja/partnera
• Relevantnost projekta/programa
• Proračun (troškovi)
• Prednost u financiranju
Svaka skupina ima podkriterije. Sveukupan broj podkriterija je 17.

V. Đurek, C. Sedda: Primjena metoda odlučivanja u lokalnoj samoupraviZbornik Veleučilišta u Rijeci, Vol. 8 (2020), No. 1, pp. 203-226
209
Slika 2. Kriteriji relevantni za odabir programa/projekata u kulturi
Izvor: obrada autora
3. 3. 2 Procjena važnosti kriterija i podkriterija u parovima
U drugom koraku razvoja AHP modela izvršena je usporedba kriterija u parovima grupnim odlučivanjem prema Saatyjevoj ljestvici relativne važnosti (Tablica 1.). Prema Hunjak (2004) Saatyjeva ljestvica omogućuje da pojedinac, ako poznaje problematiku na koju se odnosi problem

V. Đurek, C. Sedda: Primjena metoda odlučivanja u lokalnoj samoupraviZbornik Veleučilišta u Rijeci, Vol. 8 (2020), No. 1, pp. 203-226
210
odlučivanja, može koristiti tu ljestvicu za davanje konzistentnih procjena važnosti kriterija u parovima. Sudionici () u grupnom odlučivanju bili su članovi Odbora za kulturu Grada Zaboka, viša stručna suradnica za društvene djelatnosti i pročelnik Upravnog odjela za komunalno gospodarstvo i javne potrebe te zamjenica gradonačelnika ujedno i predsjednica Odbora za kulturu Grada Zaboka. Drugim riječima, u istraživanje su uključeni sudionici s komplementarnim znanjima o provedbi javnog natječaja. Nakon provedenog grupnog odlučivanja dobiveni su rezultati koji se mogu analizirati i interpretirati zasebno za svakog sudionika i grupno kao sinteza rezultata sudionika procesa grupnog odlučivanja.
3. 3. 3 Matrica procijenjenih omjera važnosti kriterija i podkriterija
U trećem koraku razvoja AHP modela formirana je matrica procijenjenih omjera važnosti kriterija K1, K2, K3 i K4 (Tablica 2). Proračun je izrađen alatu Microsoft Excel. U redu i stupcu matrice nalazi se vrijednost procijenjenog omjera prioriteta kriterija i kriterija , tj.:
K1:K3 = 3
K1:K4 = 2
K2:K1 = 2
K2:K3 = 3
K2:K4 = 4
K3:K4 = 3
Tablica 2. Matrica relativnih procjena težina – Sudionik 1
Kriteriji K1 K2 K3 K4
K1 1 ½ 3 2
K2 2 1 3 4
K3 1/3 1/3 1 3
K4 1/2 1/4 1/3 1Izvor: obrada autora
Rezultati usporedbe kriterija u parovima za preostalih pet sudionika istraživanja prikazani su u matrici procijenjenih omjera važnosti kriterija K1, K2, K3 i K4 (Tablica 3 – Tablica 7).

V. Đurek, C. Sedda: Primjena metoda odlučivanja u lokalnoj samoupraviZbornik Veleučilišta u Rijeci, Vol. 8 (2020), No. 1, pp. 203-226
211
Tablica 3. Matrica relativnih procjena težina – Sudionik 2
Kriteriji K1 K2 K3 K4
K1 1 1/3 1/2 3
K2 3 1 3 3
K3 2 1/3 1 3
K4 1/3 1/3 1/3 1Izvor: obrada autora
Tablica 4. Matrica relativnih procjena težina – Sudionik 3
Kriteriji K1 K2 K3 K4
K1 1 1/4 1/3 1/2
K2 4 1 2 3
K3 3 1/2 1 3
K4 2 1/3 1/3 1Izvor: obrada autora
Tablica 5. Matrica relativnih procjena težina – Sudionik 4
Kriteriji K1 K2 K3 K4
K1 1 1/3 1/3 2
K2 3 1 2 4
K3 3 1/2 1 3
K4 1/2 1/4 1/3 1Izvor: obrada autora
Tablica 6. Matrica relativnih procjena težina – Sudionik 5
Kriteriji K1 K2 K3 K4
K1 1 1/2 1/3 2
K2 2 1 3 3
K3 3 1/3 1 3
K4 1/2 1/3 1/3 1Izvor: obrada autora

V. Đurek, C. Sedda: Primjena metoda odlučivanja u lokalnoj samoupraviZbornik Veleučilišta u Rijeci, Vol. 8 (2020), No. 1, pp. 203-226
212
Tablica 7. Matrica relativnih procjena težina – Sudionik 6
Kriteriji K1 K2 K3 K4
K1 1 1/4 2 2
K2 4 1 4 4
K3 1/2 1/4 1 2
K4 1/2 1/4 1/2 1Izvor: obrada autora
Uz prethodno prikazane rezultate usporedbe kriterija u parovima, svaki sudionik istraživanja uspoređivao je u parovima dodatno četiri grupe podkriterija: podkriterije , podkriterije , podkriterije i podkriterije prema kojima su izrađene matrice procijenjenih omjera važnosti podkriterija. U Tablica 8 – 11 prikazani su rezultati za jednog od sudionika istraživanja – Sudionik 1.
Tablica 8. Matrica relativnih procjena težina podkriterija – Sudionik 1
Kriteriji K1.1 K1.2 K1.3 K1.4
K1.1 1 1/2 1/3 1/3
K1.2 2 1 1/2 1/3
K1.3 3 2 1 3
K1.4 3 3 1/3 1Izvor: obrada autora
Tablica 9. Matrica relativnih procjena težina podkriterija – Sudionik 1
Kriteriji K2.1 K2.2 K2.3 K2.4 K2.5 K2.6 K2.7 K2.8
K2.1 1 1/2 1/2 1/3 1/3 1/3 1/3 1/4
K2.2 2 1 3 2 2 1/2 1/2 1/3
K2.3 2 1/3 1 1/3 2 1/2 1/2 1/2
K2.4 3 1/2 3 1 3 2 2 1/2
K2.5 3 1/2 1/2 1/3 1 3 1/2 1/3
K2.6 3 2 2 1/2 1/3 1 3 3
K2.7 3 2 2 1/2 2 1/3 1 2
K2.8 4 3 2 2 3 1/3 1/2 1Izvor: obrada autora

V. Đurek, C. Sedda: Primjena metoda odlučivanja u lokalnoj samoupraviZbornik Veleučilišta u Rijeci, Vol. 8 (2020), No. 1, pp. 203-226
213
Tablica 10. Matrica relativnih procjena težina podkriterija – Sudionik 1
Kriteriji K3.1 K3.2
K3.1 1 3
K3.2 1/3 1Izvor: obrada autora
Tablica 11. Matrica relativnih procjena težina podkriterija – Sudionik 1
Kriteriji K4.1 K4.2 K4.3
K4.1 1 2 1/3
K4.2 1/2 1 1/3
K4.3 3 3 1Izvor: obrada autora
Vrlo važna značajka u primijeni AHP metode je konzistentnost procjena donositelja odluke. Prema Formanu i Selly (2001) AHP metoda spada u primjenjive metode i zato što ima sposobnost identificirati i analizirati nekonzistentnost donositelja odluke u procesu uspoređivanja elemenata hijerarhije. Čovjek je rijetko konzistentan pri procjenjivanju vrijednosti ili odnosa kvalitativnih elemenata u hijerarhiji, a uzroci nekonzistentnosti mogu biti različiti: pomanjkanje koncentracije, administrativna greška, nepostojanje konzistencije u stvarnom problemu koji treba modelirati, neadekvatna struktura modela, nedostatak informacija. Autor Hunjak (2004) navodi da je nekonzistentnost moguće najjednostavnije objasniti pomoću sljedećeg primjera. Pretpostavimo da imamo tri kamena A, B i C za koje znamo da ukupno teže 22 kg, ali nam nisu poznate njihove pojedinačne težine. Mi znamo njihove omjere težina (kamen A je dvostruko teži od kamena B) i (kamen A je trostruko teži od kamena C). Iz ovoga proizlazi diobeni omjer težina iz kojeg lako izračunamo da su tražene težine kamena redom 12, 6 i 4 kg. Umjesto kamena možemo zamisliti da međusobno uspoređujemo kriterije te im izračunavamo težine kao mjeru njihove važnosti. Isto tako možemo uspoređivati alternative po prioritetima kako bismo odredili prioritet svake od njih. Problemi nastaju zbog toga što naše procjene obično nisu konzistentne.
Tijekom procjene važnosti kriterija u parovima provjerava se konzistentnost procjena donositelja odluke i utvrđuje ispravnost dobivenih težinskih koeficijenata kriterija i prioriteta alternativa. Da bi matematički utvrdili konzistentnost matrice, koristi se sljedeći postupak:
• izračunaju se sume stupaca,
• normira se matrica (svaki stupac se podijeli sa zbrojem elemenata tog stupca),
• u normiranoj matrici se izračunaju sume redova – težine ,
• težine se podijele s vektorom prioriteta prve matrice,
• izračuna se kao prosječna vrijednost dobivenih veličina.

V. Đurek, C. Sedda: Primjena metoda odlučivanja u lokalnoj samoupraviZbornik Veleučilišta u Rijeci, Vol. 8 (2020), No. 1, pp. 203-226
214
AHP metoda omogućuje praćenje konzistentnosti procjena u svakom trenutku postupka. Autori Saaty i Vargas (2012) definiraju indeks konzistencije kao:
Autori Hunjak i Jakovčević (2003) objašnjavaju izračunavanje omjera konzistencije s pomoću navedenog indeksa konzistencije kao gdje je RI slučajni indeks (indeks konzistencije za matrice reda 𝑛 slučajno generiranih usporedaba u parovima, Tablica 12.) računa se CR, omjer konzistencije.
Tablica 12. Vrijednosti RI slučajnih indeksa
n 1 2 3 4 5 6 7 8 9 10
RI 0 0 0,52 0,89 1,11 1,25 1,35 1,40 1,45 1,49Izvor: T. L. Saaty (1980)
Ako za matricu A vrijedi CR ≤ 0,10, procjene relativnih važnosti kriterija (prioriteta alternativa) smatraju se prihvatljivima.
Indeks konzistencije (CR) kod svih matrica u ovom istraživanju je prihvatljiv i iznosi ≤ 0,10, tj. manje ili jednako od 10% (Tablica 13.).
Tablica 13. Rezultati indeksa konzistencije (CR)
KriterijiIndeks
konzistencije
K1-K4 0,02
K1.1 - K1.4 0,03
K2.1 - K2.8 -0,05
K4.1 - K4.3 0,02Izvor: obrada autora
3. 3. 4 Izračun težinskih koeficijenata kriterija i podkriterija
U četvrtom se koraku pristupilo računanju težinskih koeficijenata kriterija i podkriterija (Tablica 14.) tako da su zbrojeni stupci matrice, a na temelju toga izračunala se normalizirana matrica tako da se svaki element prethodne matrice podijelio sa zbrojem stupca kojem pripada. Nakon toga izračunate su težine koeficijenata kriterija i težine koeficijenata podkriterija, tj. prioriteti kao prosječne vrijednosti elemenata redova normalizirane matrice. Zatim se geometrijskom sredinom rezultata dobivenih kod sudionika istraživanja izračunala ukupna težina koeficijenata kriterija i težina koeficijenata podkriterija (Tablica 12.). Istraživanje je pokazalo da najveći težinski koeficijent 0,49 ima kriterij K2.Relevantnost projekta/programa koji obuhvaća podkriterije K2.1 (čija težinska vrijednost iznosi 0,18), K2.4 (čija težinska vrijednost iznosi 0,17), K2.2 (čija težinska vrijednost iznosi 0,14), K2.3 (čija težinska vrijednost iznosi 0,13), K2.7 (čija težinska vrijednost iznosi 0,10), K2.6

V. Đurek, C. Sedda: Primjena metoda odlučivanja u lokalnoj samoupraviZbornik Veleučilišta u Rijeci, Vol. 8 (2020), No. 1, pp. 203-226
215
(čija težinska vrijednost iznosi 0,10), K2.5 (čija težinska vrijednost iznosi 0,09) i K2.8 (čija težinska vrijednost iznosi 0,08).
Zatim slijedi kriterij K3.Proračun (troškovi) s težinskim koeficijentom 0,24. koji obuhvaća podkriterije K3.1 (čija težinska vrijednost iznosi 0,60) i K3.2 (čija težinska vrijednost iznosi 0,40).
Treći kriterij po važnosti je K1.Institucionalna sposobnost prijavitelja/partnera s težinskim koeficijentom 0,17 koji obuhvaća podkriterije K1.3 (čija težinska vrijednost iznosi 0,31), K1.4 (čija težinska vrijednost iznosi 0,28), K1.1 (čija težinska vrijednost iznosi 0,25) i K1.2 (čija težinska vrijednost iznosi 0,15).
Najmanju važnost ima kriterij K4.Prednost u financiranju s težinskim koeficijentom 0,11 koji obuhvaća podkriterije K4.2 (čija težinska vrijednost iznosi 0,37), K4.1 (čija težinska vrijednost iznosi 0,32) i K4.3 (čija težinska vrijednost iznosi 0,30).
Tablica 14. Pregled težinskih koeficijenta kriterija i podkriterija
Kriteriji i podkriterijiTežinski
koeficijenti
K1.Institucionalna sposobnost prijavitelja/partnera 0,17
K1.1 Ima li prijavitelj dovoljno iskustva i stručnog kapaciteta za provođenje planiranih aktivnosti projekata/programa?
0,25
K1.2 Imaju li partnerske organizacije dovoljno stručnog iskustva i kapaciteta za provođenje planiranih aktivnosti projekta (posebno znanje o problemima koji se rješavaju ovim Natječajem)?
0,15
K1.3 Imaju li prijavitelj i partner(i) dovoljno upravljačkog kapaciteta (uključujući osoblje, opremu i sposobnost vođenja proračuna projekta/programa)? Planira li prijavitelj u provedbu uključiti volontere?
0,31
K1.4 Postoji li jasna struktura upravljanja projektom/programom? Je li jasno definiran projektni tim i obveze njegovih članova?
0,28
K2.Relevantnost projekta/programa 0,49
K2.1 Koliko je projektni prijedlog relevantan u odnosu na ciljeve i prioriteta područja aktivnosti Natječaja (je li projekt/program u skladu s mjerama i aktivnostima u planiranim nacionalnim/regionalnim/lokalnim programima, strategijama i politikama koje su u nadležnosti davatelja financijskih potpora)?*
0,18
K2.2 Jesu li ciljevi projekta/programa jasno definirani i realno dostižni? 0,14
K2.3 Jesu li aktivnosti projekta/programa jasne, opravdane, razumljive i provedive?
0,13

V. Đurek, C. Sedda: Primjena metoda odlučivanja u lokalnoj samoupraviZbornik Veleučilišta u Rijeci, Vol. 8 (2020), No. 1, pp. 203-226
216
K2.4 Jesu li rezultati jasno određeni i hoće li aktivnosti dovesti do ostvarivanja rezultata?
0,17
K2.5 Ima li projekt/program jasno definirane korisnike (broj, dob, spol i sl.)? Definira li i u kojoj mjeri projekt/program njihove probleme i potrebe?
0,09
K2.6 Pridonosi li projekt/program i u kojoj mjeri rješavanju problema korisnika?
0,10
K2.7 U kojoj mjeri su rezultati projekta/programa održivi? Jesu li kvalitetno osmišljeni mehanizmi upravljanja rizicima u provedbi programa ili projekta?
0,10
K2.8 Uspostavlja li projekt model koji će druge organizacije moći primijeniti/ponoviti na području iste županije i/ili Republike Hrvatske?
0,08
K3.Proračun (troškovi) 0,24
K3.1 Jesu li troškovi projekta/programa realni u odnosu na određene rezultate i predviđeno vrijeme trajanja?
0,60
K3.2 Jesu li troškovi projekta usklađeni s planiranim aktivnostima projekta/programa?
0,40
K4.Prednost u financiranju 0,11
K4.1 Je li razvidno da je prijavitelj (i partneri) u prethodnom razdoblju bio aktivno uključen u kulturne programe Grada Zaboka namijenjene široj javnosti?
0,32
K4.2 Je li razvidno da prijavitelj (i partneri) nastavlja aktivno sudjelovati u programima Grada Zaboka u okviru prioritetnih područja?
0,37
K4.3 Prijavljeni projekt/program predviđa nove inicijative u prioritetnom području.
0,30
Izvor: obrada autora
3. 4 Analiza osjetljivosti
Analiza osjetljivosti se provodi s ciljem da se vidi u kojoj mjeri moguće promjene vrijednosti ulaznih varijabli modela utječu na izlazne vrijednosti varijabli modela. Na temelju analize osjetljivosti mogu se procijeniti posljedice realizacije odluke u različitim situacijama. Analiza osjetljivosti koristi se i za ispitivanje kvalitete modela odnosno provođenjem iste moguće je vidjeti u kojoj mjeri model omogućuje prepoznavanje manjih promjena u parametrima odluke, koji spadaju pod kontrolom donositelja odluke i promjenama parametara kojima se opisuje stanje okoline odnosno onih koje donositelj odluke ne kontrolira, ali također utječu na posljedice odluke. Prema Munđaru i Hunjaku (2012) analiza osjetljivosti preporučuje se i za donošenje odluka u javnom sektoru, dakle ona se ne provodi samo u poslovnom odlučivanju.

V. Đurek, C. Sedda: Primjena metoda odlučivanja u lokalnoj samoupraviZbornik Veleučilišta u Rijeci, Vol. 8 (2020), No. 1, pp. 203-226
217
Analiza osjetljivosti provedena je tako da su se mijenjali težinski koeficijenti pojedinih kriterija za +/– 5% (uz odgovarajuće promjene u težinama ostalih kriterija kako bi suma težinskih koeficijenta bila 100%) i promatrale su se promjene u odnosu na težinske koeficijente prikazane u Tablici 14.
Nakon provedene analize osjetljivosti možemo zaključiti da je razvijeni AHP model odlučivanja osjetljiv na smanjenje ili povećanje težine kriterija K1.Institucionalna sposobnost prijavitelja/partnera, na povećanje težine kriterija K2.Relevantnost projekta/programa i na povećanje kriterija K4.Prednost u financiranju. Nadalje, model odlučivanja malo je osjetljiv na smanjenje težine kriterija K2.Relevantnost projekta/programa i na smanjenje težine kriterija K4.Prednost u financiranju.
Model odlučivanja nije osjetljiv na smanjenje ili povećanje težine kriterija K3.Proračun (troškovi).
Rezultat provedenih osam analiza osjetljivosti pokazuje da ni u jednoj nije promijenjen rang alternativa od rangiranih 14. – 18. mjesta.
4. VALIDACIJA NA TEMELJU POVIJESNIH PODATAKA
Nakon provedenog istraživanja i modeliranja izrađena je usporedba dobivenih rezultata rangiranja alternativa dobivenih korištenjem postojećeg modela donošenja odluka i rangiranja alternativa dobivenih korištenjem razvijenog AHP modela pri čemu su se koristili podaci iz 2018. godine.
Postojeći model donošenja odluka rangiranja programa/projekta udruga u kulturi koristi statističku metodu aritmetičke sredine. Aritmetička sredina, kao prosječna vrijednost obilježja svih jedinica skupa, izravnava apsolutne razlike između podataka promatrane serije. Nakon što Povjerenstvo ocijeni svaki pristigli program/projekt na javni natječaj, računa se aritmetička sredina rezultata ocjenjivanja Povjerenstva. Dobiveni rezultati se rangiraju, odnosno određuje se koje će se alternative - programi/projekti udruga u kulturi financirati u tekućoj godini.
Rezultati usporedbe korištenja sadašnjeg modela donošenja odluka i razvijenog AHP modela prikazani su u Tablica 15. iz koje je vidljivo da došlo do promjena. Promjene su vidljive u rangiranju od 12.-15. mjesta.
Možemo zaključiti da korištenjem AHP modela dolazi do promjena u rangiranju u odnosu na postojeći model jer AHP model određuje težinske koeficijente alternativa pa je tako moguća razlika u rangiranju istih posebno kod onih koje su rangirane jedna iza/ispred druge tj. kod kojih je mala razlika u izračunima primjenom sadašnjeg modela izračuna prioriteta.
Rezultat primjene AHP modela za rangiranje programa/projekata udruga u kulturi daje ne samo matematički preciznije rezultate već dovodi do toga da se za financiranje putem javnog natječaja odabiru kvalitetniji programi/projekti udruga što je i cilj provedenog natječaja.

V. Đurek, C. Sedda: Primjena metoda odlučivanja u lokalnoj samoupraviZbornik Veleučilišta u Rijeci, Vol. 8 (2020), No. 1, pp. 203-226
218
Tablica 15. Validacija modela na temelju povijesnih podataka
Rangiranje alternativa aritmetičkom sredinom
Rangiranje alternativa korištenjem metode AHP
Rang Alternative Prioritet Rang Alternative Prioritet1 P16 101,00 1 P16 6,722 P17 99,66 2 P17 6,713 P12 99,00 3 P12 6,624 P18 97,66 4 P18 6,525 P10 96,66 5 P10 6,526 P11 96,33 6 P11 6,527 P14 96,33 7 P14 6,518 P13 96,33 8 P13 6,489 P15 94,33 9 P15 6,40
10 P2 90,66 10 P2 5,9711 P6 90,66 11 P6 5,9612 P8 89,66 12 P7 5,8313 P7 89,33 13 P8 5,8214 P9 88,33 14 P3 5,6215 P3 87,33 15 P9 5,4516 P5 80,66 16 P5 5,1017 P4 79,33 17 P4 4,9918 P1 55,66 18 P1 3,73
Izvor: obrada autora
5. ANALIZA RIZIKA
Na najopćenitijoj razini, rizik može značiti opasnost, gubitak ili neizvjesnost u pogledu posljedica budućeg događaja. U statistici, financijskom i investicijskom menadžmentu to pak znači varijabilnost ishoda odnosno odstupanje od određene očekivane vrijednosti.
Postoje različite definicije rizika, a najčešće se pod tim pojmom podrazumijeva opasnost da neki pothvat ne uspije ili se smanji očekivani rezultat, odnosno mogućnost nepovoljnog odstupanja od srednjeg očekivanja. Slični smisao imaju i definicije rizika kao stupnja podložnosti negativnim događajima i njihovim vjerojatnim posljedicama ili kao izloženost nezgodi, nesreći propasti, gubitku. Šire značenje definira rizik kao neizvjestan događaj ili stanje koje, ako se pojavi, ima pozitivan ili negativan utjecaj na ciljeve projekta (PMBOK Guide, 2000).
Autor Willet (1951) definira rizik kao objektiviziranu neizvjesnost ostvarenja neželjenog događaja. Rizik predstavlja kombinaciju vjerojatnosti događaja i negativnih posljedica gdje se u što većoj

V. Đurek, C. Sedda: Primjena metoda odlučivanja u lokalnoj samoupraviZbornik Veleučilišta u Rijeci, Vol. 8 (2020), No. 1, pp. 203-226
219
mjeri utječe na smanjenje jednog i drugog. Potrebno je razlikovati rizik, uzrok i posljedicu. Za svaki rizik postoji uzrok, a posljedica će postojati ako se rizik ostvari. Uzrok je postojeća situacija koja potiče rizik, a posljedica je rezultat nastanka rizika.
Rizik se uglavnom promatra kao negativan utjecaj na ukupnu situaciju, ali se isti može promatrati i kao prilika zato što ponekad rizik daje i neke pozitivne mogućnosti i može poboljšati ostvarenje projektnih ciljeva. Kod rizika je bitno razumjeti da se na neke može utjecati, da se mogu kontrolirati i smanjiti, ali se nikada ne mogu u potpunosti eliminirati. Osim toga, vrlo je važno razgraničiti pojmove vjerojatnosti i neizvjesnosti od rizika jer oni nisu istoznačni iako se nekad pogrešno poistovjećuju u svakodnevnom govoru.
Rizik i neizvjesnost karakteriziraju situacije gdje stvarni rezultat za pojedini događaj ili aktivnost ima više od jedne moguće vrijednosti. Uvriježeno je mišljenje da je rizik podložan statističkoj procjeni i proračunu, a neizvjesnost (= neznanje) nije. Kod neizvjesnosti se radi o subjektivnoj vjerojatnosti, ona nema mjerne atribute i ne može se ukalkulirati u planove. Kod rizika je poznato stanje u kojem se kao posljedica neke odluke može pojaviti niz rezultata, pri čemu je poznata i vjerojatnost nastupanja svakog pojedinog rezultata.
Prema Kerzneru (2003) rizik se često mjeri kroz:
• vjerojatnost da će se pojaviti,
• učinak na projektne ciljeve ako se pojavi (izloženost projekta tj. stupanj osjetljivosti koji je proporcionalan mogućoj šteti), te se iskazuje se kao umnožak ta dva faktora.
Svi rizici nisu jednako opasni za ustanovu, a to ovisi o njihovim posljedicama:
• Visoko rizičan – posljedice rizika imaju veliki utjecaj na realizaciju i rezultate projekta
• Umjereno rizičan – posljedice rizika imaju umjeren utjecaj na projekt
• Nisko rizičan – posljedice rizika imaju niski utjecaj na projekt.
Klasifikacija rizika u gore navedene kategorije može se izraditi s obzirom na spomenute varijable rizika: posljedice rizika (utjecaj na realizaciju projekta) i vjerojatnost nastanka rizika (Tablica 16).
Tablica 16. Klasifikacija rizika
Utjecaj posljedica rizika na realizaciju nastavka suradnje na projektu
1 2 3
Vjerojatnost nastanka
rizika
1 Nisko rizičan Nisko rizičan Umjereno rizičan
2 Nisko rizičan Umjereno rizičan Visoko rizičan
3 Umjereno rizičan Visoko rizičan Visoko rizičanIzvor: obrada autora

V. Đurek, C. Sedda: Primjena metoda odlučivanja u lokalnoj samoupraviZbornik Veleučilišta u Rijeci, Vol. 8 (2020), No. 1, pp. 203-226
220
U Tablici 17. identificirani su rizici vezani uz prijavu projekata na Javni natječaj za financiranje programa ili projekata udruga. Osim rizika dana je procjena vjerojatnosti nastanka istih te aktivnosti upravljanja rizicima.
Važno je naglasiti da se rizici opisani u Tablici 17. odnose na Grad Zabok budući da isti kao davatelj financijskih sredstava ima interes financirati najkvalitetnije programe/projekte udruga kojima će ostvariti ciljeve zadane procjenom prioritetnih potreba.
Tablica 17. Identificirani rizici Javnog natječaja za financiranje programa ili projekata udruga
RizikKlasifikacija
rizikaAktivnosti upravljanja rizikom
Nestručnost članova Povjerenstva
Nisko rizičan Nije potrebno poduzimati nikakve akcije.
Umjereno rizičanPrije provedbe natječaja provodi se edukacija
članova Povjerenstava.
Visoko rizičanČlanove Povjerenstva moguće je odabrati putem
javnog poziva za prijavu stručnjaka koji žele sudjelovati u postupku ocjenjivanja prijava.
Subjektivnost članova Povjerenstva
Nisko rizičan Nije potrebno poduzimati nikakve akcije.
Umjereno rizičanNakon otvaranja pristiglih prijava, članovi Povjerenstva obavezno potpisuju Izjavu o
nepostojanju sukoba interesa.
Visoko rizičanUkoliko se utvrdi da je pojedini član u sukobu
interesa, aktivira se zamjena člana Povjerenstva.
Utjecaj prijavitelja na članove Povjerenstva
Nisko rizičanImena članova Povjerenstva su tajna do objave
rezultata natječaja.
Umjereno rizičanImena članova Povjerenstva mogu se javno
objaviti tek nakon objave rezultata natječaja.
Visoko rizičanZbog pokušaja utjecaja na članove Povjerenstva
predmetna prijava se odbacuje.
Prekratki rokovi indikativnog
kalendara natječajnog postupka
Nisko rizičan Nije potrebno poduzimati nikakve akcije.
Umjereno rizičanRokove je u tijeku natječaja moguće po potrebi
produžiti ali navedena informacija mora biti dostupna javnosti.
Visoko rizičanPogrešno primjena i računanje rokova koji mogu biti osnova za prigovor na Odluku o financiranju.

V. Đurek, C. Sedda: Primjena metoda odlučivanja u lokalnoj samoupraviZbornik Veleučilišta u Rijeci, Vol. 8 (2020), No. 1, pp. 203-226
221
Izrada analize potreba i definiranje područja financiranja
Nisko rizičan Nije potrebno poduzimati nikakve akcije.
Umjereno rizičanNepotpuno utvrđivanje razvojnih ciljeva i prioritetnih područja financijske potpore
organizacijama civilnog društva.
Visoko rizičan
Korištenje netočnih podataka za utvrđivanje prioritetnih područja financijske potpore organizacijama civilnog društva što može
rezultirati nepoklapanjem sadržaja i cilja Javnog natječaja s prioritetnim područjima koje se žele
zadovoljiti.
Nejasnoće u tekstu natječaja i obrascima
Nisko rizičan Nije potrebno poduzimati nikakve akcije.
Umjereno rizičan
Prijavitelji imaju pravo u određenom roku elektroničkim putem postavljati pitanja davatelju financijskih sredstava čiji se odgovori na pitanja moraju javno objaviti kako bi najčešća pitanja i odgovori bili dostupni svim zainteresiranim
stranama prije proteka roka prijava na natječaj.
Visoko rizičan Potrebno je izvršiti ispravak natječaja.
Neobaviještenost prijavitelja o objavi
javnog natječaja
Nisko rizičan Nije potrebno poduzimati nikakve akcije.
Umjereno rizičan
Prije objave natječaja mogu se organizirati radionice za potencijalne prijavitelje te se natječaj
objavljuje na mrežnim stranicama davatelja sredstava, stranica Ureda vlade RH za udruge
zajedno s obavijesti o natječaju u jednim dnevnim novinama.
Visoko rizičan
Kako bi svi prijavitelji bili informirani o planiranim financiranjima davatelja sredstava u tijeku godine,
potrebno je objaviti Godišnji plan natječaja koji se također objavljuje na mrežnim stranicama
davatelja sredstava i stranicama Ureda vlade RH za udruge.
Partnerski odnosi na projektu
Nisko rizičan Nije potrebno poduzimati nikakve akcije.
Umjereno rizičan
Potpisivanje izjave o partnerstvu kojima partneri potvrđuju da se obvezuju pridržavati načela dobre prakse u partnerstvu i obveza partnera navedenih
u prijavi.
Visoko rizičanSklapanje sporazuma o partnerstvu kojim se na
detaljan način uređuju partnerski odnosi.

V. Đurek, C. Sedda: Primjena metoda odlučivanja u lokalnoj samoupraviZbornik Veleučilišta u Rijeci, Vol. 8 (2020), No. 1, pp. 203-226
222
Zaštita prava i interesa djece
Nisko rizičan Nije potrebno poduzimati nikakve akcije.
Umjereno rizičan
Ovisno o vrsti javnog natječaja u svrhu prijave, osoba koja će u provedbi projekta biti u kontaktu
s djecom kao korisnicima potpisuje izjavu o suglasnosti za uvid u kaznenu evidenciju.
Visoko rizičan
Ukoliko se utvrdi da je osoba kojoj su u prijavljenom projektu povjereni određeni poslovi i zadaci pravomoćno osuđena za određena kaznena
djela na štetu djece, s prijaviteljem se ne sklapa ugovor o sufinanciranju.
Postojanje dvostrukog financiranja
Nisko rizičan Nije potrebno poduzimati nikakve akcije.
Umjereno rizičan
Potpisivanje izjave o nepostojanju dvostrukog financiranja kojom prijavitelj potvrđuje da za
prijavljeni program ili projekt nije dobio financijska sredstva na natječajima iz javnih izvora.
Visoko rizičanUkoliko se potvrdi neistinitost takve izjave
potpisnik te izjave podliježe kaznenoj i materijalnoj odgovornosti.
Nedostavljanje opisnog i financijskog
izvještaja projekata
Nisko rizičan Nije potrebno poduzimati nikakve akcije.
Umjereno rizičan
Elektroničkom poštom podsjetiti korisnike s kojima je sklopljen ugovor o financiranju na obvezu dostavljanja opisnog i financijskog
izvještaja projekta.
Visoko rizičan
Kao prilog podsjetniku za dostavu izvješća napominje se kako u slučaju nedostavljanja izvješća ili njegovog neprihvaćanja od strane davatelja financijskih sredstava isti ne mogu
podnijeti prijavu na natječaj sljedeće dvije godine.
Nepotpuna i nejasna dokumentacija
prijava
Nisko rizičan Nije potrebno poduzimati nikakve akcije.
Umjereno rizičanPovjerenstvo može tražiti dodatna pojašnjenja od prijavitelja ukoliko uočeni nedostaci ne utječu na
sam sadržaj prijave.
Visoko rizičanUkoliko se nedostaci ne mogu ispraviti ili se
prijavitelj ne očituje u zadanom roku, prijava se odbacuje.
Izvor: obrada autora

V. Đurek, C. Sedda: Primjena metoda odlučivanja u lokalnoj samoupraviZbornik Veleučilišta u Rijeci, Vol. 8 (2020), No. 1, pp. 203-226
223
6. ZAKLJUČAK
Planiranje i donošenje optimalnih poslovnih odluka zahtjevan je i nimalo lak posao u kojem se pokušavaju predvidjeti potrebe korisnika Proračuna i procijeniti sposobnosti udruga za provođenje planiranih programa/projekata kojima će se realizirati prioritetne potrebe. Proračunom se definiraju kratkoročni ciljevi kojima se realiziraju i strateški ciljevi. Zato je važno da se odluke o aktivnostima koje će se staviti u Proračun donose na transparentan, konzistentan i jasan način.
Cilj ovog istraživanja bio je da se pomoću metode za višekriterijsko odlučivanje Analitički hijerarhijski proces - AHP i definiranih kriterija i podkriterija izradi model za rangiranje prijedloga programa/projekata pristiglih na Javni natječaj za financiranje programa ili projekata udruga Grada Zaboka iz prioritetnog područja kulture. Grupnim odlučivanjem dobile su se vrijednosti težina koeficijenata kriterija i vrijednosti težina koeficijenata podkriterija koji su važni za donošenje odluke o odabiru programa/projekata pristiglih na Javni natječaj. Nakon određivanja vrijednosti težina koeficijenata izradila se validacija na temelju povijesnih podataka iz 2018. godine. Usporedili su se rezultati Javnog natječaja iz 2018. godine koji su dobiveni izračunavanjem aritmetičke sredine s podacima koji su dobiveni primjenom AHP modela na podatke rezultata istog Javnog natječaja iz 2018. Korištenjem AHP modela dolazi do promjena u rangiranju u odnosu na postojeći model iz razloga jer AHP model (Kaluža, 2019) određuje težinske koeficijente kriterija i podkriterija tako da je moguća razlika u rangiranju alternativa posebno kod onih koje su rangirane neposredno jedna iza/ispred druge tj. kod kojih je mala razlika u izračunima primjenom sadašnjeg modela izračuna prioriteta. AHP model se u konačnici pokazao uspješnijim za primjenu na konkretnom predmetu iz razloga jer preciznije ocjenjuje i rangira alternative (projekte) s obzirom na težinske koeficijente kriterija na koje je osjetljiviji pa time dovodi do točnijih rezultata u vidu detektiranja kvalitetnijih programa/projekta udruga u kulturi koji će svojom provedbom znatnije doprinijeti općem dobru što je svakako glavni cilj Javnog natječaja. Bitno je naglasiti kako upravo distinkcija kriterija i podkriterija koji su sami po sebi sličnih ali ne i identičnih prioriteta omogućava ispunjavanje svrhe Javnog natječaja u punom smislu, omogućavajući jasne i precizne rezultate ocjenjivanja prijava na Javni natječaj.
Provedeno istraživanje može se smatrati indikativnim jer se provelo u jednoj jedinici lokalne samouprave korištenjem metode AHP. Pošto se na razini JLS-ova donose strateške odluke među kojima postoji zavisnost između kriterija buduća istraživanja mogu se usmjeriti prema primjeni metoda za višekriterijsko odlučivanje koje modeliraju zavisnosti među kriterijima: metoda ANP (engl. Analytic Network Process) (Kadoić et al., 2017b), (Kadoić, 2018) i metoda SNAP (engl. Social Network Analysis Process) (Kadoić et al., 2017a), (Kadoić et al, 2019).
LITERATURA
Begičević N. (2008) Višekriterijski modeli odlučivanja u strateškom planiranju uvođenja e-učenja, doktorska disertacija, Sveučilište u Zagrebu, Fakultet organizacije i informatike Varaždin.
Daft, R. L. (2001) Organization Theory and Design, 7th ed. Cincinnati, Ohio: South-Western College Publishing.

V. Đurek, C. Sedda: Primjena metoda odlučivanja u lokalnoj samoupraviZbornik Veleučilišta u Rijeci, Vol. 8 (2020), No. 1, pp. 203-226
224
Forman E., Selly M. A. (2001) Decision By Objectives (How to convince others that you are right), World Scientific Publishing Co Pte Ltd.
Harker P. T., Vargas L. G. (1987) The Theory of Ratio Scale Estimation: Saaty’s Analytic Hierarchy Process, Manage. Sci., vol. 33, no. 11, pp. 1383–1403.
Hunjak T., Jakovčević, D. (2003) Višekriterijski modeli za rangiranje i uspoređivanje banaka, Zbornik. Ekonomskog. Fakulteta, Zagreb., vol. 1, no. 1, pp. 43–60.
Hunjak T. (2004) Višekriterijsko odlučivanje, Informacijska tehnologija u poslovanju, V. Čerić and M. Varga, Eds. Zagreb:Element, pp. 105–119.
Kadoic N. i Kedmenec I. (2016) Using ICT tools for decision making support in local government units, in Proceedings of 39th International Convention, MIPRO 2016, pp. 1533–1538.
Kadoić N. (2016) ICT technologies and structured dialogue: experience of ‘Go, go, NGO!’ project, in Proceedings of 39th International Convention, MIPRO 2016, pp. 1792–1797.
Kadoić N. (2017) Citizen Participation in Decision Making Processes in Croatian Local Government Units, Int. J. Sci. Eng. Investig., vol. 6, no. 60, pp. 14–22.
Kadoić, N., Begičević Ređep, N. i Divjak, B. (2017a) A new method for strategic decision-making in higher education, Central European Journal of Operations Research, 26(3), pp. 611-628.
Kadoić, N., Begičević Ređep, N., Divjak, B. (2017b) Decision Making with the Analytic Network Process, 17th Proceedings. ection for Operational Research (SOR 2017), pp. 180–186.
Kadoić, N. (2018) Characteristics of the Analytic Network Process, a Multi-Criteria Decision-Making Method, Croatian Operational Research Review, 9(2), pp. 235–244.
Kadoić, N., Divjak, B. and Begičević Ređep, N. (2019) Integrating the DEMATEL with the analytic network process for effective decision-making, Central European Journal of Operations Research, 27(3), pp. 653–678.
Kaluža, M., Kalanj, M. i Vukelić, B. (2019) Comparison of Back-End Frameworks for Web Application, Zbornik Veleučilišta u Rijeci, Vol. 7, No. 1, pp. 317-332.
Kerzner, H. (2003) Project Management: A Systems Approach to Planning, Scheduling, and Controlling, 8th Edition, Eight. Berea, Ohio: John Wiley & Sons, Inc.
Listyaningsih, V., Utami, E. (2018) Decision Support System Performance-Based Evaluation of Village Government using AHP and TOPSIS Methods: Secang Sub-district of Magelang Regency as a Case Study, Intell. Syst. Appl., vol. 4, pp. 18–28.
Magbagbeola, J. A. O., Adetoso, J. A., Magbagbeola, E. O. (2012) Use of multicriteria decision-making (MDM) process to solving agricultural inputs problem in Oriade Local Government Area, Osun State, Nigeria, J. Emerg. Trends Econ. Manag. Sci., vol. 3, no. 1, pp. 99–102.
Munđar, D., Hunjak, T. (2012) Kvalitativni menadžment: Odlučivanje i rangiranje, Sveučilište u Zagrebu, Fakultet organizacije i informatike Varaždin.
Narodne novine, (2015) Uredba o kriterijima, mjerilima i postupcima financiranja i ugovaranja programa i projekata od interesa za opće dobro koje provode udruge, NN 26/2015.
Project Management Institute (2000) A Guide to the Project Management Body of Knowledge (PMBOK ® Guide), Newtoown Square; Pennsylvania, USA.
Saaty, T. L. (1972) An eigen value allocation model for prioritization and planning, Philadelphia, USA.
Saaty, T. L. (1977) A scaling method for priorities in hierarchical structures, J. Math. Psychol., vol. 15, no. 3, pp. 234–281.
Saaty, T. L. (1980) The Analytic Hierarchy Process: Planning, Priority Setting, Resource Allocation (Decision Making Series), New York, USA: McGraw-Hill, New York.
Saaty, T. L. (2008) Decision making with the analytic hierarchy process, Int. J. Serv. Sci., vol. 1, no. 1, pp. 83–98.

V. Đurek, C. Sedda: Primjena metoda odlučivanja u lokalnoj samoupraviZbornik Veleučilišta u Rijeci, Vol. 8 (2020), No. 1, pp. 203-226
225
Saaty, T. L., Vargas, L. G. (2012) Models, Methods, Concepts & Applications of the Analytic Hierarchy Process, vol. 175. Boston, MA: Springer US.
Setiawan, H., Wardoyo, R., Istiyanto, J., Santoso, P. (2016) The Group Decision Support System to Evaluate the ICT Project Performance Using the Hybrid Method of AHP, TOPSIS and Copeland Score, Int. J. Adv. Comput. Sci. Appl. , vol. 7, no. 4, pp. 334–341.
Sikavica, P., Bebek, B., Skoko, H., Tipurić, D. (1999) Poslovno odlučivanje, Zagreb: Informator.
Službeni glasnik Krapinsko-zagorske županije, (2015) Pravilnik o financiranju i odobravanju nefinancijskih podrška udrugama, Krapina, 31/2015, p. 2817.
Tot, B., Srđević B., Vujić, B., Russo, M. A. T., Vujić, G. (2016) Evaluation of key driver categories influencing sustainable waste management development with the analytic hierarchy process (AHP): Serbia example, Waste Manag. Res., vol. 34, no. 8, pp. 740–747.
Weihrich, H., Koontz, H. (1998) Menadžment, Zagreb: Mate.
Wiliet, A. H. (1951) The Economic Theory of Risk and Insurance, University of Pennsylvania, Philadelphia, USA.

V. Đurek, C. Sedda: Primjena metoda odlučivanja u lokalnoj samoupraviZbornik Veleučilišta u Rijeci, Vol. 8 (2020), No. 1, pp. 203-226
226
Preliminary communication https://doi.org/10.31784/zvr.8.1.20 Received: 29. 6. 2019. Accepted: 17. 9. 2019.
APPLICATION OF DECISION MAKING METHODS IN LOCAL SELF-GOVERNMENT
Valentina Đurek Mag. Inf. Univ. Ec. S, Grad Zabok, Zivtov trg 10, 49210 Zabok, Croatia; e-mail: [email protected]
Claudia Sedda LL. M., Eurobridge, Via Roma 250, Gavoi 08020, Italy; e-mail: [email protected]
ABSTRACTCollaboration with associations has been shown through various financial and non-financial support provided by local governments to programs and projects of general interest. This kind of cross-sectoral cooperation has great potential for generating many positive changes and creating the necessary synergies for sustainable social and economic development. To what extent this potential can be achieved largely depends on the quality of criteria, standards and procedures for granting financial and non-financial support as well as the organizational and human resources of public institutions that must successfully monitor and evaluate contracted support products. The main purpose of this paper was to determine whether it is possible to improve the quality of decision making in local government by using decision making methods in decision-making process regarding the financing of cultural associations. For example, the importance (weighting coefficients) of criteria and subcriteria for quality assessment of projects / applications of cultural associations (N = 18) will be determined from the area of Zabok. Likewise, in this paper, the AHP method will be used to create a model of program / project rating in cultural association that is financed from the budget of the City of Zabok. The model will be validated on historical data from 2018.
Key words: multi-criteria decision making, AHP, risk matrix, associations, culture
Creative Commons Attribution – NonCommercial 4.0 International License

G. Karanović, A. Štambuk, D. Jagodić: Profitability Performance Under Capital Structure and Other…Zbornik Veleučilišta u Rijeci, Vol. 8 (2020), No. 1, pp. 227-242
227
Preliminary communication https://doi.org/10.31784/zvr.8.1.21 Received: 24. 9. 2019. Accepted: 7. 10. 2019.
PROFITABILITY PERFORMANCE UNDER CAPITAL STRUCTURE AND OTHER COMPANY CHARACTERISTICS: AN EMPIRICAL STUDY OF
CROATIAN HOTEL INDUSTRYGoran Karanović
PhD, Associate Professor, University of Rijeka, Faculty of Tourism and Hospitality Management, Primorska 42, 52410 Opatija, Croatia; e-mail: [email protected]
Ana Štambuk PhD, Associate Professor, University of Rijeka, Faculty of Economics and Business, Ivana Filipovića 4,
51000 Rijeka, Croatia; e-mail: [email protected]
Davor Jagodić MSc, Administrator, University of Rijeka, Faculty of Tourism and Hospitality Management,
Primorska 42, 52410 Opatija, Croatia; e-mail: [email protected]
ABSTRACTThe main objective of this paper is to explore how capital structure and other financial characteristics of companies influence Croatian hotel industry performance. This study’s key goal is to analyze the debt-equity structure of hotel industry and to demonstrate its correlation with financial performance. The high significance and impact of hotel industry on the economy in Croatia was main reason why authors opted to investigate it. This study was carried out using panel data methodology on a sample of 19 Croatian hotel companies listed on the Zagreb Stock Exchange during the period of 2003-2017. Return on assets and return on equity were used as performance proxies and dependent variables. Twelve variables as capital structure measures and other company characteristics – cash ratio, current liquidity ratio, structure ratio, debt ratio, debt factor (in years), equity to non-current assets, total assets turnover, current assets turnover, accounts receivables, activity ratio, return on revenue and crises during the 2009-2015 period – were used as independent variables. The findings suggest that cash ratio, structure ratio, debt factor (in years), equity to non-current assets, total assets turnover, activity ratio, accounts receivables, return on revenue and crises in the 2009-2015 period are related to the financial performance of the Croatian hotel industry. Although profitability performance theory and influence of capital structure and other company characteristic on it is widely studied in financial literature, there are not many studies examining the hotel industry, especially in Croatia. Finally, this study should provide managers with additional insights in making optimal financial decisions.
Key words: Capital structure, Company characteristics, Profitability, Croatia, Hotel Industry
Creative Commons Attribution – NonCommercial 4.0 International License

G. Karanović, A. Štambuk, D. Jagodić: Profitability Performance Under Capital Structure and Other…Zbornik Veleučilišta u Rijeci, Vol. 8 (2020), No. 1, pp. 227-242
228
1. INTRODUCTION
Profitability performance indicators measure a company’s effectiveness and successfulness. Typical indicators used as company profitability measures are return on equity (ROE) and return on assets (ROA); in addition, return on investment (ROI) can also be used. Capital structure, i.e. debt-equity mix is one of the most important financial choices that every management may take. It has significant impact on companies’ financial performance and corporate value. Management should stream towards optimal capital structure that minimizes capital costs and maximizes company value. By optimizing the financial and capital leverage management may achieve optimal capital structure. Recent research on capital structure has focused on trade-off and pecking order theory. The trade-off theory encompasses optimal capital structure by trading off the tax benefits and costs of agency problems, while pecking order theory proposes that capital structure choice is guided by asymmetric information. The basis for trade-off theory and capital structure associated with the value of the company was defined by Modigliani and Miller (1958). In their work they demonstrated the irrelevance of capital structure on the company value. Assumptions of irrelevance were eligible only in perfect market conditions (free access to the market by all investors, zero transactions cost and no tax difference between dividends and capital gains, and rationality of all players present in the market). In their later communication, Miller and Modigliani (1963) corrected an error from the previous model by considering the effect of taxes and the risk of debt on capital structure. Although they upgraded the first model with this communication and brought theory closer to the real financial environment problems regarding capital structure and corporate value, the model was nevertheless far away from the praxis in the real world. Further research on corporate value and capital structure introduced the agency problem and related agency costs (Jensen and Meckling, 1976) as well as free cash flows problem and its control by debt financing (Jensen, 1986; Stulz, 1990). By encompassing all stated effect and concepts, trade-off theory was developed.
Pecking order theory was developed by Myers and Majluf (1984) by explaining financial behavior of corporation and hierarchy in choosing sources of finance. Myers (1984) upgraded the pecking order by recognizing the cost of financial distress besides asymmetric information. The pecking theory assumes that cost of financing increases with asymmetric information. Usually, corporate managers possess more information than outside creditors and even shareholders, which leads to the tendency of choosing internal sources over external sources. Additionally, when choosing external sources managers prefer debt over equity since they are less expensive.
In addition to these central theories of capital structure, there are authors and studies that have analyzed strategy of competing in the product market and product characteristics and its influence to the capital structure (Titman, 1984; Maksimovic, 1988, 1995; Stulz, 1988; Rotemberg and Scharfstein, 1990). Beside the industrial-organization-based approach, the influence of corporate control on the capital structure was investigated as well (Stulz, 1988; Harris and Raviv, 1991; Mehran, 1992; Zwiebel, 1996; Garvey and Hanka, 1999; Mishra and Mcconaughy, 1999; Novaes, 2003). Besides the core theories that have recognized fundamental factors that influence capital structure, there are wide-ranging theories identifying numerous internal factors and corporate characteristic that are influencing capital structure. Harris and Raviv (1991, p. 336) reviewed the surveyed literature and identified the following internal factors that shape corporate leverage,

G. Karanović, A. Štambuk, D. Jagodić: Profitability Performance Under Capital Structure and Other…Zbornik Veleučilišta u Rijeci, Vol. 8 (2020), No. 1, pp. 227-242
229
namely volatility, bankruptcy, profitability, fixed assets, tax shields, R&D, growth opportunities, size, free cash flow, ownership structure.
Due to the importance of this topic, we have decided to investigate the Croatian hotel industry profitability performance under capital structure and other company characteristics. The question that may arise relates to the way of investigating the hotel industry. The main issue and main disadvantage of the Croatian economy and its GDP is that it is highly dependable on tourism since total impact and share of tourism in GDP is 19,7%. With respect to indicated the main purpose of this paper was to present a new insights on profitability performance of the hotel industry in Croatia under capital structure. Besides that, goal and aim of the paper is to bring closer topic on causal relation of financial performance and capital structure as well as other companies characteristics to the experts. Additionally, to raise awareness and to influence to the state of minds of financial manager and decision makers was one of goals. Additionally, in line with Črnigoj and Mramor (2009) who suggested that financial behavior and linked capital structure is somewhat different in Emerging European Countries from those in the developed market economies, we have chosen Croatian hotel industry. It should be highlighted that financial performance is not only dependable on the capital structure. Menicucci (2018) found out that hotel profitability is determined by financial crisis, business model and ownership structure, size, internationalization, location, accommodation. Other authors arrived at the same result associated to the financial crisis and profitability (Shahzad et al., 2015). Xu and Chi (2017) pin pointed operating efficiency U.S hotels to be linked with hotel size and service price. Ben Aissa and Goaied (2016) examined Tunisian hotel profitability and indicated that hotel size has negative impact but also brings to light managerial skills as important factor for hotel profitability. Similar research on leadership styles and human capital (Tran, 2017; Sardo, Serrasqueiro and Alves, 2018) highlighted the positive influence of both human capital and leadership styles on hotel companies’ financial performance.
The paper is structured as follows: Section 1 provides the introduction. Section 2 presents an overview of existing literature on the topic of capital structure in the hotel industry sector and in the emerging markets. Data and methodology used for this analysis is elaborated in Section 3. In Section 4 the main empirical results are presented, while Section 5 provides an overall summary of final conclusions.
2. LITERATURE REVIEW
Frydenberg (2011) concludes that theories of capital structure are not “holy grail”, i.e. they are not providing answer to the everlasting questions of how and what financing politics firms should use. He also states that a search for a model that can explain capital structure is still work-in-progress. Based on that, we point at the majority of studies on capital structure and the impact that they have on profitability which have been investigated in developed markets; however, in the last two decades, the number of studies that have researched this topic in emerging markets are on the rise. Contrary to the main theories developed on mature markets, results from emerging markets research brought new insights on capital structure theory and profitability. Study on capital structure of Hungarian companies carried out by Nivorozhkin (2002) revealed that less indebted companies are more profitable than more indebted ones, which goes against the fundamental

G. Karanović, A. Štambuk, D. Jagodić: Profitability Performance Under Capital Structure and Other…Zbornik Veleučilišta u Rijeci, Vol. 8 (2020), No. 1, pp. 227-242
230
theories. Furthermore, they discovered negative relationship between leverage and proportion of tangible assets, caused by nonexistence of long-term debt on the market. In addition to the above, Baer and Gray (1995) have previously performed a similar regression analysis on the Polish market and firms, but found out positive yet primarily insignificant coefficients on the same variables. On the same track is a study carried out by Črnigoj and Mramor (2009) who investigated what influences the capital structure choice in Slovenian firms, arriving at the conclusion that financial behavior of emerging countries is somewhat different from those in developed markets. Lucey and Zhang (2011) have investigated the impact of country-level financial integration on corporate financing choices in 24 emerging counties, selected from MSCI Emerging Markets Indices 2007, with China omitted from the sample. Results from the study indicated that higher financial integration leads to significant use of debt and equity financing, which is more emphasized for high-growth firms than low-growth firms on credit use. Correspondingly, large firms in the process of integration tend to use more debt, especially long-term debt, and to issue more equity than small-firms. Booth, Aivazian, and Demirguc-Kunt (2001) analyzed capital structure of firms from ten developing countries and concluded that factors which influence capital structure choice are similar between developed and developing countries. In addition, they drew their attention on the fact that firms in developing countries have higher dependence on short- term debt and trade credit. These results could be explained by the fact of undeveloped financial markets. Limitations regarding outside financing were recognized in the study by Klapper, Sarria-Allende, and Sulla (2002) which investigated SME financing behavior in Eastern Europe. Nivorozhkin (2005) examined capital structure of five EU accession countries (Bulgaria, Czech Republic, Poland, Romania and Estonia). His results pointed out that the capital structures of firms of observed EU accession countries have a steady tendency towards leverage levels of the observed EU countries. Additionally, he found out that tangible assets are a poor source of collateral in five examined EU accessed countries. Abor (2005) brings insight for Ghanaian firms and identifies significant and positive relationship between short-term debt to return on equity and negative relationship of long-term debt.
Berk (2007) studied the role of the Slovenian capital market on determining corporate capital structure; results have indicated that private firms use significantly more debt financing than public ones. Similar results for companies from Serbia, Croatia, Montenegro and Macedonia were obtained by Arsov and Naumoski (2016) regarding firm size and leverage. In addition, in their study results indicated negative impact of profitability and tangible assets on leverage. Results of their study partly confirmed previous results of analysis for Serbian companies carried out by several authors (Malinić, Denčić-Mihajlov and Ljubenović, 2013). In their analysis, Malinić, Denčić-Mihajlov, and Ljubenović (2013) obtained results which indicated that leverage decreases with profitability, liquidity, tangibility and cash gap and increases with growth opportunities. To some degree, these results are in line with study of Ilyukhin (2017) in which he examines Russians non-financial traded firms. He found that most reliable variables that influence capital structure are firm size, growth opportunity and industry mean.
Croatia is not an island regarding results obtained in papers carried out on capital structure. Klapper and Tzioumis (2008) investigated influence of taxation on the capital structure in Croatia and

G. Karanović, A. Štambuk, D. Jagodić: Profitability Performance Under Capital Structure and Other…Zbornik Veleučilišta u Rijeci, Vol. 8 (2020), No. 1, pp. 227-242
231
concluded that results reveal significant impact of corporate taxation on corporate structure. Delic (2016) investigated financing behavior of Croatian SME and confirmed that Myers pecking order was statistically insignificant. Reasons for that may be found in the facts that Croatian financial markets are undeveloped and shallow, bank loans are main source of long-term financing and high insolvency. Učkar (2007) have analyzed relationship of financial structure and stock market values of selected companies form Croatian financial market and got positive results for trade-off theory. In the same vein, the model proposed by Učkar (2007) was not significant for traditional approach, Modigliani-Miller theory and signal theory of financial structure management. Harc (2015) investigated the connection between size and capital structure of 500 Croatian SMEs. Results from the study pointed out that Croatian SMEs tend to use long-term debt. Similar results were obtained by Ježovita (2019). Results of the analysis of 111 large Croatian companies carried out by Pepur, Ćurak, and Poposki (2016) are in line with previous studies of undeveloped markets (Booth, Aivazian and Demirguc-Kunt, 2001; Klapper, Sarria-Allende and Sulla, 2002; Nivorozhkin, 2002; Črnigoj and Mramor, 2009; Malinić, Denčić-Mihajlov and Ljubenović, 2013). The main result differs from main capital structure theories.
In the past, various authors have examined capital structure of companies from tourism and hotel industry. In study of Shamaileh and Khanfar (2014) reveal positive and significant impact of leverage to ROI. Capital structure of Portuguese hotel firms were examined by Salsa, Matias, and Afonso (2018) and results confirmed that variables examined in modern basic theories are significant. Strongest variable was tangibility; likewise, profitability has negative relationship with indebtedness. Pecking-order theory as well as trade of theory are confirmed. Similar results for Portuguese SME hotel companies were obtained by Pacheco and Tavares (2017) but with the indication that examined companies are not homogeneous, and both theories are necessary to explaining their capital structure. Somewhat different results were obtained by Karadeniz et al. (2009) and neither the trade-off nor the pecking order theory exactly seem to explain the capital structure of Turkish hotel companies. Phillips and Sipahioglu (2004) investigated impact of capital structure of quoted organizations with interest in hotel industry on their profitability. Results implied that there is no significant evidence on the relationship between the level of debt and financial performance. Survey of capital structure and impact on the profitability of Indian hotel companies by Madan (2007) indicated that leverage has positive impact just on a few observed companies while others affected negatively.
This study is based on the previous reserch (Burja, 2011; Li, 2012; Berzkalne and Zelgalve, 2014; Shamaileh and Khanfar, 2014; Vătavu, 2015; Oberholzer, 2017; Herzog, 2018).
3. DATA AND METHODOLOGY
For the purpose of this research, secondary data from Financial Agency (FINA) were used for all Croatian hotel companies listed on the Zagreb stock exchange. The study is based on the 2002-2017 financial data from a final sample of 20 hotel industry companies. To satisfy the criteria of inclusion in analysis the observed FINA data set of hotel companies for all variables should be viable for the whole period 2002-2017. Although, the number of listed hotel industry companies is 27 in the observed period we have excluded seven companies due to a couple of reasons: lack

G. Karanović, A. Štambuk, D. Jagodić: Profitability Performance Under Capital Structure and Other…Zbornik Veleučilišta u Rijeci, Vol. 8 (2020), No. 1, pp. 227-242
232
of data, mergers and acquisition by other company in the observed period, long-term insolvency and bankruptcy, or period of indexation shorter than observed 16 years. We tested various internal variables (Table 1) that influence financial performance of selected Croatian hotel industry companies expressed by proxies i.e. return on equity (ROE) and return on assets. Additionally, it should be highlighted that the spillover of the Global Financial crisis and its impact on the Croatian economy took place longer than in most other countries. The duration of the crisis extended over a six-year period, from 2009-2015.
Table 1. Internal tested variables
Variables Period Indicator Measures
Cash ratio 2002-2017 V01 Cash over current liabilities
Current ratio 2002-2017 V03Total current assets over total current liabilities
Financial stability coefficient
2002-2017 V04Long-term assets over sum of shareholders’ equity and long-term liabilities
Debt-to-assets ratio 2002-2017 V05 Total liabilities over total assets
Indebtedness factor 2002-2017 V08Total liabilities over sum of retained earnings depreciation and amortization
Degree of Coverage I 2002-2017 V09 Shareholders’ equity over fixed assets
Total assets turnover 2002-2017 V11 Total revenues over total assets
Current assets turnover
2002-2017 V12 Total revenues over total current assets
Accounts Receivable turnover
2002-2017 V13 Sales (revenue) over accounts receivable
Cost to income ratio 2002-2017 V15 Operating income over operating income
Gross Profit Margin 2002-2017 V17 Gross profit over revenue x 100
Crisis 2009-2015 2009-2015 KR0915 Crisis in Croatia 2009-2015
ROA 2002-2017 V20
ROE 2002-2017 V21Source: Autors
All explanatory variables are approximated, measured and presented in Table 2. (see appendix)
Since data are indexed by both unit (hotel company) and time (year), a panel regression model was employed. Several models have been used to select appropriate models. First, an applied two-way fixed effects was used, while random effects panel model was employed afterwards.
In order to evaluate the models, we have tested for serial correlation, contemporaneous correlation, and heteroscedasticity. To address the presence of serial correlation several tests have been used. Woolridge test is not significant even at α = 0.10 (F=0.564, p = 0.462), but Bias-corrected Born

G. Karanović, A. Štambuk, D. Jagodić: Profitability Performance Under Capital Structure and Other…Zbornik Veleučilišta u Rijeci, Vol. 8 (2020), No. 1, pp. 227-242
233
and Breitung Q(p) test is significant for most variables (p is mostly less than 0.001). Inoue and Solo LM-test does not show significant correlation (all p > 0,10). Two out of three tests do not reject the null hypothesis of no serial correlation but due to the one significant test, the possibility of autocorrelation could not be ruled out.
For heteroscedasticity testing we have used Modified Wald test; with chi2 = 6213.22, p < 0.001 the null hypothesis of no heteroscedasticity was rejected.
Cross-sectional Independence/Contemporaneous Correlation was tested using several tests, all with the null hypothesis of cross-sectional independence: Pesaran’s test (Pesaran = 0.444, p = 0.6569) is the only test that does not show cross-sectional dependency. Friedman’s test (Friedman = 31.138, p = 0.0390) and Frees’ test (Frees = 1.585) are indicating cross-sectional dependency as well as CD-test which for all except one variable has p < 0.001. Since three out of four tests are significant it is reasonable to reject the hypothesis of cross-sectional independence.
With the heteroscedasticity, contemporaneous correlation and possible serial correlation, it becomes evident that fixed and random models are not proper models to be employed in this case. Appropriate models are those with Panels Corrected Standard Errors (PCSEs) and Driscoll-Kraay standard errors fixed effect models (SCC). Feasible Generalized Least Squares (FGLS) model could not be used since T > N (Hoechle, 2007).
4. EMPIRICAL RESULTS REGARDING VARIABLES THAT HAVE INFLUENCE ON PROFITABILITY PERFORMANCE OF CROATIAN HOTEL INDUSTRY
Results for all models – fixed effects, random effects, PCSE and Driscoll-Kraay standard errors fixed effect models (SCC) – are presented in tables 3 and 4 (see app.). We have observed the influence of internal variables on two main financial performance indicators, ROA and ROE, of the Croatian hotel companies index on the Zagreb stock exchange. Due to the carried out we have excluded fixed effects model as well as random effects models. Appropriate models, such as Panels Corrected Standard Errors (PCSEs) and Driscoll-Kraay, were used. Results presented in table 3 (see app.) reveal that using Panels Corrected Standard Errors (PCSEs) following ratios as significant to ROA cash ratio, financial stability coefficient, indebtedness factor, degree of coverage I, total assets turnover, cost to income ratio and gross profit margin ratio. Driscoll-Kraay standard errors fixed effect suggest that indebtedness factor is not statistically significant but however implies crisis as significant factor. Basically, it may be concluded that there is a strong positive connection between financial stability, indebtedness factor, degree of coverage I, total assets turnover, cost to income ratio, gross profit margin to financial performance indicator - return on assets. Nevertheless, expected crisis had a negative influence on the ROA in the observed period. We have to draw the attention to the following issue, that capital structure observed through the share of shareholder’s equity in fixed assets is significant in all models.
Also, for ROE as the financial performance measure the same test was carried out, thus ruling out fixed effects and random effects models, with results presented in table 4 (see app.). Panels corrected standard Errors (PCSEs) model indicated that indebtedness factor, total assets turnover,

G. Karanović, A. Štambuk, D. Jagodić: Profitability Performance Under Capital Structure and Other…Zbornik Veleučilišta u Rijeci, Vol. 8 (2020), No. 1, pp. 227-242
234
accounts receivable turnover, cost to income ratio and gross profit margin have significant impact to return on assets. The highest significance of ROE have total assets turnover, cost to income ratio and gross profit margin, at the same time indebtedness factor and accounts receivables turnover have somewhat lover significance. Total assets turnover has the highest impact.
Unlike the previous model, PCSEs model Driscoll-Kraay revealed slightly different results for indebtedness factor and total assets turnover indicated it as insignificant while it pointed to crisis variable as very significant. Additionally, current ratio and financial stability in this model are significant also. Others analyzed variables were signaled as a very significant. Capital structure observed through share of shareholder’s equity in fixed assets is revealed as insignificant and does not have influence on return on equity among Croatian hotel companies.
5. CONCLUSION
The purpose of this paper was to present new insights on profitability performance of the hotel industry in Croatia by taking into account specific environment and industry issues. The results were obtained by applying dynamic panel methodology and revealed results that run contrary to capital structure. In the PCSEs and Driscoll-Kraay model capital structure was indicated as significant to return on assets while insignificant to the return on equity. Besides capital structure for both financial performance measures ROA and ROE, statistically significant variables were expected cost of income ratio and gross profit margin. We have to highlight that the crisis was indicated by using Driscoll-Kraay model for both measures as significant with high negative impact.
Given the importance of tourism and hotel industry to the Croatian economy, and the results provided by this study, we recommend it to the hotel decision makers. In addition, result may be used by financial managers in the hotel industry companies. The findings bring insights on financial performance measures and significance of examined variable as well as their impact to return on assets and return on equity. In addition, the crisis variable indicate that financial decisions should take into consideration outside economic environment and their impact on the industry and company as well.
This study also contains limitations, which emerge mainly due to a lack of data on growth opportunities, total debts and long term debt variables and specific industry financial elements as occupancy rates and revenue per available room. Although result provided by this research indicate significant impact of some variables on financial performance there is open question of results if some other variables were taken in account like market capitalization and room occupancy and others.
Suggestion for future research would be to include other capital structure variables as growth opportunity size of company, macroeconomics variables, tax shield, legal characteristic, financial market development measures, managerial style etc. It would be interesting for future work to expend current study at the level of entire central and eastern European region and to compare result of different counties.

G. Karanović, A. Štambuk, D. Jagodić: Profitability Performance Under Capital Structure and Other…Zbornik Veleučilišta u Rijeci, Vol. 8 (2020), No. 1, pp. 227-242
235
* This paper has been financially supported by the University of Rijeka, for the project ZP UNIRI 2/17.
* This work has been fully supported by/supported in part by the University of Rijeka under the project number 17.02.2.2.01.
APPENDIX
Table 2. Descriptive statistics of tested variables mean and standard deviation*
Year /Variables V21 V03 V04 V05 V08 V09 V11 V13 V15 V17
Overall 1.471 1.749 1.212 0.289 16.473 0.680 0.210 123.680 107.746 0.988
(7.406) (2.564) (0.382) (0.15) (40.428) (0.273) (0.109) (356.979) (38.005) (25.654)
2002 -0.306 2.253 1.461 0.216 43.154 0.537 0.171 141.101 102.136 -0.470
(5.952) (2.413) (0.315) (0.11) (123.457) (0.15) (0.094) (217.429) (18.527) (15.384)
2003 1.930 2.777 1.456 0.216 16.711 0.531 0.162 103.688 107.547 5.293
(4.189) (5.424) (0.287) (0.091) (25.906) (0.147) (0.076) (144.384) (15.833) (12.634)
2004 2.321 1.894 1.432 0.214 13.529 0.552 0.163 127.305 129.696 8.637
(10.608) (2.73) (0.31) (0.097) (10.045) (0.158) (0.067) (238.425) (91.167) (26.139)
2005 0.496 2.191 1.425 0.216 15.712 0.560 0.155 243.122 105.965 1.384
(8.452) (2.211) (0.312) (0.119) (20.997) (0.185) (0.066) (762.925) (20.513) (24.357)
2006 1.904 1.425 1.499 0.220 14.517 0.516 0.169 267.498 101.719 -0.628
(7.468) (1.787) (0.206) (0.115) (23.805) (0.101) (0.123) (899.392) (14.902) (16.906)
2007 -0.584 1.531 1.528 0.234 22.932 0.493 0.157 146.310 98.710 -4.173
(5.883) (1.58) (0.246) (0.132) (58.37) (0.098) (0.063) (333.875) (15.707) (19.461)
2008 -0.129 1.150 1.055 0.333 23.128 0.724 0.240 110.350 97.820 -6.803
(6.858) (1.53) (0.143) (0.146) (57.232) (0.232) (0.118) (266.464) (19.506) (25.388)
2009 -1.017 1.234 1.084 0.334 13.636 0.736 0.213 100.510 95.562 -11.360
(7.164) (1.839) (0.186) (0.153) (15.902) (0.295) (0.119) (162.413) (20.82) (35.742)
2010 -0.755 1.398 1.043 0.327 13.850 0.789 0.217 105.670 97.909 -6.044
(6.771) (2.201) (0.193) (0.159) (16.766) (0.382) (0.115) (200.426) (19.109) (21.754)
2011 -0.144 1.245 1.058 0.326 12.387 0.788 0.229 115.816 100.798 -5.347
(7.78) (2.143) (0.212) (0.171) (15.276) (0.385) (0.122) (229.638) (23.032) (30.095)
2012 0.292 1.009 1.071 0.342 13.034 0.757 0.244 99.393 100.317 -9.993
(10.192) (0.995) (0.229) (0.179) (16.882) (0.328) (0.122) (188.899) (25.553) (47.755)
2013 2.275 1.264 1.290 0.357 14.072 0.729 0.244 100.296 106.238 1.523
(7.113) (1.979) (0.955) (0.169) (17.609) (0.276) (0.122) (232.839) (19.109) (27.664)

G. Karanović, A. Štambuk, D. Jagodić: Profitability Performance Under Capital Structure and Other…Zbornik Veleučilišta u Rijeci, Vol. 8 (2020), No. 1, pp. 227-242
236
Year /Variables V21 V03 V04 V05 V08 V09 V11 V13 V15 V17
2014 2.924 2.196 1.035 0.349 14.099 0.757 0.232 63.762 108.340 4.523
(6.613) (3.376) (0.22) (0.158) (18.346) (0.277) (0.116) (84.949) (18.868) (19.982)
2015 5.062 1.879 1.004 0.332 12.479 0.793 0.249 60.885 134.229 13.535
(7.372) (2.618) (0.191) (0.162) (19.708) (0.309) (0.108) (106.677) (90.034) (21.807)
2016 4.232 2.035 0.991 0.318 11.695 0.788 0.249 104.249 115.192 11.229
(6.027) (2.483) (0.161) (0.157) (20.844) (0.236) (0.105) (280.412) (17.029) (14.418)
2017 5.033 2.497 0.966 0.288 8.626 0.836 0.261 88.924 121.752 14.502
(5.78) (2.832) (0.164) (0.123) (14.103) (0.205) (0.109) (291.031) (28.83) (15.519)
*Standard deviations are in parentheses

G. Karanović, A. Štambuk, D. Jagodić: Profitability Performance Under Capital Structure and Other…Zbornik Veleučilišta u Rijeci, Vol. 8 (2020), No. 1, pp. 227-242
237
Table 3. Determinants of hotel companies ROA
VARIABLES
FE RE XTPCSE XTSCC
V20 pval V20 pval V20 pval V20 pval
V01 0.236 0.325 0.152 0.470 0.216* 0.0520 0.236*** 0.00503
V03 0.00452 0.967 0.0280 0.701 –0.0185 0.734 0.00452 0.911
V04 2.005*** 0.00246 2.009*** 1.31e-05 1.313** 0.0230 2.005*** 0.000344
V05 2.568 0.471 3.595 0.143 0.835 0.714 2.568 0.203
V08 0.00528 0.276 0.00618 0.267 0.00443** 0.0383 0.00528 0.229
V09 4.311* 0.0907 5.401*** 0.00309 2.728** 0.0352 4.311*** 0.00204
V11 11.45*** 0.00250 11.41*** 7.86e-08 13.30*** 6.52e-08 11.45*** 0.00469
V12 –0.00724 0.882 –0.0237 0.581 –0.0362 0.300 –0.00724 0.842
V13 0.000313 0.258 0.000270 0.292 0.000580 0.198 0.000313 0.219
V15 0.0295*** 1.19e-06 0.0304*** 2.11e-10 0.0294*** 0 0.0295*** 3.16e-07
V17 0.0682*** 0.000106 0.0690*** 4.22e-06 0.0669*** 0 0.0682*** 2.42e-06
–
KR0915 –0.000587 0.999 –0.339 0.661 0.175 0.755 –10.82*** 9.77e-07
Constant –10.82*** 7.73e-05 –11.76*** 0 –6.809*** 3.46e-05 0
Observations 320 320 320 320
R-squared 0.779 0.859
Number of Id_subj 20 20 20
r2_w 0.779 0.777 . 0.779
r2_o 0.807 0.817 . .
r2_b 0.847 0.871 . .
F . . . 64.49
chi2type . Wald Wald .
chi2 . . 1408 .
p . . 0 0
sigma_u 1.277 0.658 . .
sigma_e 1.584 1.584 . .
rho 0.394 0.147 0.375 .
Number of groups 20 Robust standard e rrors in parentheses
*** p<0.01, ** p<0.05, * p<0.1

G. Karanović, A. Štambuk, D. Jagodić: Profitability Performance Under Capital Structure and Other…Zbornik Veleučilišta u Rijeci, Vol. 8 (2020), No. 1, pp. 227-242
238
Table 4. Determinants of hotel companies ROE
FE RE XTPCSE XTSCC
VARIABLES V21 pval V21 pval V21 pval V21 pval
V03 0.129 0.309 0.118 0.163 0.100 0.252 0.129* 0.0850
V04 1.551* 0.0879 1.662** 0.0242 0.974 0.419 1.551** 0.0433
V05 -0.831 0.869 0.658 0.845 -2.682 0.492 -0.831 0.785
V08 0.00767 0.277 0.00988 0.235 0.00787** 0.0228 0.00767 0.221
V09 1.609 0.628 4.152* 0.0931 0.307 0.886 1.609 0.468
V11 15.41 0.171 14.56** 0.0450 21.89*** 0.000178 15.41 0.132
V13 0.00129* 0.0973 0.00109 0.160 0.00168** 0.0225 0.00129** 0.0173
V15 0.0355*** 5.32e-05 0.0366*** 2.79e-07 0.0343*** 4.33e-08 0.0355*** 0.00149
V17 0.162*** 2.41e-06 0.162*** 1.15e-09 0.160*** 0 0.162*** 1.48e-05
KR0915 1.537 0.321 0.847 0.508 1.410 0.115 -8.817*** 0.00355
Constant -10.24*** 0.00328 -12.11*** 3.55e-08 -3.698 0.245 0
Observations 320 320 320 320
R-squared 0.707 0.794
Number of Id_subj 20 20 20
r2_w 0.707 0.704 . 0.707
r2_o 0.753 0.764 . .
r2_b 0.822 0.852 . .
F . . . 100.9
chi2type . Wald Wald .
chi2 . . 743.9 .
p . . 0 0
sigma_u 2.126 1.126 . .
sigma_e 3.280 3.280 . .
rho 0.296 0.105 0.326 .
Number of groups 20
Robust standard errors in parentheses
*** p<0.01, ** p<0.05, * p<0.1

G. Karanović, A. Štambuk, D. Jagodić: Profitability Performance Under Capital Structure and Other…Zbornik Veleučilišta u Rijeci, Vol. 8 (2020), No. 1, pp. 227-242
239
REFERENCES
Abor, J. (2005) ‘The effect of capital structure on profitability: an empirical analysis of listed firms in Ghana’, Journal of Risk Finance, 6(5), pp. 438–445. doi: 10.1108/15265940510633505.
Ben Aissa, S., Goaied, M. (2016) ‘Determinants of Tunisian hotel profitability: The role of managerial efficiency’, Tourism Management, 52, pp. 478–487. doi: 10.1016/j.tourman.2015.07.015.
Arsov, S., Naumoski, A. (2016) ‘DETERMINANTS OF CAPITAL STRUCTURE: AN EMPIRICAL STUDY OF COMPANIES FROM SELECTED POST-TRANSITION ECONOMIES’, Zbornik radova Ekonomskog fakulteta u Rijeci: časopis za ekonomsku teoriju i praksu / Proceedings of Rijeka Faculty of Economics: Journal of Economics and Business, 34(1), pp. 119–146. doi: 10.18045/zbefri.2016.1.119.
Baer, H. L., Gray, C. W. (1995) Debt as a Control Device Transitional Economies: The Experiences of Hungary and Poland, Policy Research Working Papers. 1480. Washington,.
Berk, A. (2007) ‘The role of capital market in determining capital structure: Evidence from Slovenian public and private corporations’, Acta Oeconomica, 57(2), pp. 123–155. doi: 10.1556/AOecon.57.2007.2.1.
Berzkalne, I., Zelgalve, E. (2014) ‘Return On Equity And Company Characteristics : An Empirical Study Of Industries In Latvia’, The 8th International Days of Statistics and Economics, pp. 94–103.
Booth, L., Aivazian, V., Demirguc-Kunt, A. (2001) ‘Capital Structures in Developing Countries’, The Journal of Finance, 56(1), pp. 87–130. doi: 10.1002/hup.1190.
Burja, C. (2011) ‘Factors Influencing the Companies “Profitability Factors Influencing the Companies” Profitability’, Annales Universitatis Apulensis Series Oeconomica, 13(215–224).
Črnigoj, M., Mramor, D. (2009) ‘Determinants of Capital Structure in Emerging European Economies: Evidence from Slovenian Firms’, Emerging Markets Finance and Trade, 45(1), pp. 72–89. doi: 10.2753/ree1540-496x450105.
Delic, A. (2016) ‘Financing preferences of croatian small and medium-sized companies’, in Cingula, M., Vlahov, R. D., and Dobrinic, D. (eds) Economic and Social Development. Varaždin: Varazdin Development and Entrepreneurship Agency and University N, pp. 456–463.
Frydenberg, S. (2011) ‘Capital Structure Theories and Empirical Tests: An Overview’, Capital Structure and Corporate Financing Decisions: Theory, Evidence, and Practice, pp. 127–149. doi: 10.1002/9781118266250.ch8.
Garvey, G. T., Hanka, G. (1999) ‘Capital Structure and Corporate Control: The Effect of Antitakeover Statutes on Firm Leverage’, The Journal of Finance, 54(2), pp. 519–546. doi: 10.1111/0022-1082.00116.
Harc, M. (2015) ‘THE EFFECT OF FIRM SIZE ON SME’s CAPITAL STRUCTURE’, in Economy of eastern Croatia yesterday, today, tommorow,. Osijek, Croatia: Josip Juraj Strossmayer University, Faculty of Economics, pp. 315–324.
Harris, M., Raviv, A. (1991) ‘The Theory of Capital Structure’, The Journal of Finance, 46(1), pp. 297–355. doi: 10.1111/j.1540-6261.1991.tb03753.x.
Herzog, S. (2018) ‘Financial Aid and College Persistence: Do Student Loans Help or Hurt?’, Research in Higher Education. Springer Netherlands, 59(3), pp. 273–301. doi: 10.1007/s11162-017-9471-1.
Hoechle, D. (2007) ‘Robust standard errors for panel regressions with cross-sectional dependence’, Stata Journal, 7(3), pp. 281–312. doi: The Stata Journal.
Ilyukhin, E. (2017) ‘The Determinants of Capital Structure: Evidence from Russia’, Journal of Corporate Finance Research / Корпоративные Финансы | ISSN: 2073-0438, 11(4), pp. 54–69. doi: 10.17323/j.jcfr.2073-0438.11.4.2017.54-69.
Jensen, M. C. (1986) ‘Agency Costs of Free Cash Flow, Corporate Finance, and Takeovers Agency Costs of Free Cash Flow, Corporate Finance, and Takeovers’, American Economic Review, 76(2), pp. 323–329.
Jensen, M. C., Meckling, W. H. (1976) ‘Theory of the firm: Managerial behavior, agency costs and ownership structure’, Journal of Financial Economics, 3(4), pp. 305–360. doi: 10.1016/0304-405X(76)90026-X.

G. Karanović, A. Štambuk, D. Jagodić: Profitability Performance Under Capital Structure and Other…Zbornik Veleučilišta u Rijeci, Vol. 8 (2020), No. 1, pp. 227-242
240
Ježovita, A. (2019) ‘Variations Between Financial Ratios for Evaluating Inancial Position Related To the Size of a Company’, Review of Innovation and Competitiveness, 1(1), pp. 115–136. doi: 10.32728/ric.2015.11/7.
Karadeniz, E. et al. (2009) ‘Determinants of capital structure: evidence from Turkish lodging companies’, International Journal of Contemporary Hospitality Management. Emerald, 21(5), pp. 594–609. doi: 10.1108/09596110910967827.
Klapper, L., Sarria-Allende, V., Sulla, V. (2002) Small- and Medium-Size Enterprise Financing in Eastern Europe, Policy Research Working Paper. 2933. Washington. Available at: https://openknowledge.worldbank.org/handle/10986/19200.
Klapper, L., Tzioumis, K. (2008) Taxation And Capital Structure: Evidence From A Transition Economy. Washington: The World Bank (Policy Research Working Papers). doi: 10.1596/1813-9450-4753.
Li, W. (2012) ‘Research on the Factors of Return on Equity--Empirical Analysis in Chinese Port Industries from 2000-2008’, in Fourth International Conference on Machine Vision (ICMV 2011): Machine Vision, Image Processing, and Pattern Analysis, pp. 1–6. doi: 10.1117/12.920576.
Lucey, B. M., Zhang, Q. (2011) ‘Financial integration and emerging markets capital structure’, Journal of Banking & Finance. Elsevier B.V., 35(5), pp. 1228–1238. doi: 10.1016/j.jbankfin.2010.10.017.
Madan, K. (2007) ‘An analysis of the debt-equity structure of leading hotel chains in India’, International Journal of Contemporary Hospitality Management, 19(5), pp. 397–414. doi: 10.1108/09596110710757561.
Maksimovic, V. (1988) ‘Capital Structure in Repeated Oligopolies’, The RAND Journal of Economics, 19(3), pp. 389–407.
Maksimovic, V. (1995) ‘Chapter 27 Financial structure and product market competition’, in Handbooks in Operations Research and Management Science, pp. 887–920. doi: 10.1016/S0927-0507(05)80071-4.
Malinić, D., Denčić-Mihajlov, K., Ljubenović, E. (2013) ‘The determinants of capital structure in emerging capital markets: Evidence from Serbia’, European Research Studies Journal, 16(2), pp. 98–119.
Mehran, H. (1992) ‘Executive Incentive Plans, Corporate Control, and Capital Structure’, The Journal of Financial and Quantitative Analysis, 27(4), p. 539. doi: 10.2307/2331139.
Menicucci, E. (2018) ‘The influence of firm characteristics on profitability: Evidence from Italian hospitality industry’, International Journal of Contemporary Hospitality Management, 30(8), pp. 2845–2868. doi: 10.1108/IJCHM-04-2017-0219.
Miller, M. H., Modigliani, F. (1963) ‘Corporate Income Taxes and the Cost of Capital: A Correction’, The American Economic Review, 53(3), pp. 433–443. doi: 10.2307/1809167.
Mishra, C. S., Mcconaughy, D. L. (1999) ‘Founding Family Control and Capital Structure: The Risk of Loss of Control and the Aversion to Debt’, Entrepreneurship Theory and Practice, 23(4), pp. 53–64. doi: 10.1177/104225879902300404.
Modigliani, F., Miller, M. H. (1958) ‘The Cost of Capital, Corporation Finance and the Theory of Investment’, American Economic Association, 48(3), pp. 261–297. Available at: http://www.jstor.org/stable/1809766.
Myers, S. C. (1984) ‘The Capital Structure Puzzle’, The Journal of Finance, 39(3), pp. 574–592. doi: 10.1111/j.1540-6261.1984.tb03646.x.
Myers, S. C., Majluf, N. S. (1984) ‘Corporate financing and investment decisions when firms have information that investors do not have’, Journal of Financial Economics, 13(2), pp. 187–221. doi: 10.1016/0304-405X(84)90023-0.
Nivorozhkin, E. (2002) ‘Capital Structures in Emerging Stock Markets: The Case of Hungary’, The Developing Economies, 40(2), pp. 166–187. doi: 10.1111/j.1746-1049.2002.tb01006.x.
Nivorozhkin, E. (2005) ‘Financing choices of firms in EU accession countries’, Emerging Markets Review, 6(2), pp. 138–169. doi: 10.1016/j.ememar.2004.10.002.
Novaes, W. (2003) ‘Capital Structure Choice When Managers Are in Control: Entrenchment versus Efficiency’, The Journal of Business, 76(1), pp. 49–82.
Oberholzer, M. (2017) ‘The relative importance of financial ratios in creating shareholders’ wealth’, South African Journal of Economic and Management Sciences, 15(4), pp. 416–428. doi: 10.4102/sajems.v15i4.167.

G. Karanović, A. Štambuk, D. Jagodić: Profitability Performance Under Capital Structure and Other…Zbornik Veleučilišta u Rijeci, Vol. 8 (2020), No. 1, pp. 227-242
241
Pacheco, L., Tavares, F. (2017) ‘Capital structure determinants of hospitality sector SMEs’, Tourism Economics, 23(1), pp. 113–132. doi: 10.5367/te.2015.0501.
Pepur, S., Ćurak, M., Poposki, K. (2016) ‘Corporate capital structure: The case of large Croatian companies’, Economic Research-Ekonomska Istrazivanja . Routledge, 29(1), pp. 498–514. doi: 10.1080/1331677X.2016.1175726.
Phillips, P. A., Sipahioglu, M. A. (2004) ‘Performance implications of capital structure: Evidence from quoted UK organisations with hotel interests’, Service Industries Journal, 24(5), pp. 31–51. doi: 10.1080/0264206042000276829.
Rotemberg, J. J., Scharfstein, D. S. (1990) ‘Shareholder-Value Maximization and Product-Market Competition’, The Review of Financial Studies, 3(3), pp. 367–391.
Salsa, L., Matias, F., Afonso, C. M. (2018) ‘Capital structure of Portuguese hotel firms: a structural equation modelling approach’, Tourism & Management Studies, 14(SI1), pp. 73–82. doi: 10.18089/tms.2018.14si108.
Sardo, F., Serrasqueiro, Z., Alves, H. (2018) ‘On the relationship between intellectual capital and financial performance: A panel data analysis on SME hotels’, International Journal of Hospitality Management. Elsevier, 75(July 2017), pp. 67–74. doi: 10.1016/j.ijhm.2018.03.001.
Shahzad, S. J. H. et al. (2015) ‘Financial leverage and corporate performance: Does financial crisis owe an explanation?’, Pakistan Journal of Statistics and Operation Research, 11(1), pp. 67–90. doi: 10.18187/pjsor.v11i1.781.
Shamaileh, M. O., Khanfar, S. M. (2014) ‘The Effect of the Financial Leverage on the Profitability in the Tourism Companies (Analytical Study- Tourism Sector- Jordan)’, Business and Economic Research, 4(2), p. 251. doi: 10.5296/ber.v4i2.5546.
Stulz, R. (1988) ‘Managerial control of voting rights’, Journal of Financial Economics, 20, pp. 25–54. doi: 10.1016/0304-405X(88)90039-6.
Stulz, R. (1990) ‘Managerial discretion and optimal financing policies’, Journal of Financial Economics, 26(1), pp. 3–27. doi: 10.1016/0304-405X(90)90011-N.
Titman, S. (1984) ‘The effect of capital structure on a firm’s liquidation decision’, Journal of Financial Economics, 13(1), pp. 137–151.
Tran, X. (2017) ‘Effects of Leadership Styles on Hotel Financial Performance’, Tourism and hospitality management, 23(2), pp. 163–183. doi: 10.20867/thm.23.2.7.
Učkar, D. (2007) ‘Mogućnosti optimizacije financijske strukture poduzeća u Republici Hrvatskoj’, Ekonomska istraživanja, 20(2), pp. 24–34.
Vătavu, S. (2015) ‘The Impact of Capital Structure on Financial Performance in Romanian Listed Companies’, Procedia Economics and Finance, 32(15), pp. 1314–1322. doi: 10.1016/s2212-5671(15)01508-7.
Xu, X., Chi, C. G. (2017) ‘Examining Operating Efficiency of U.S. Hotels: A Window Data Envelopment Analysis Approach’, Journal of Hospitality Marketing and Management. Routledge, 26(7), pp. 770–784. doi: 10.1080/19368623.2017.1314205.
Zwiebel, J. (1996) ‘Dynamic Capital Structure under Managerial Entrenchment’, The American Economic Review, 86(5), pp. 1197–1215.

G. Karanović, A. Štambuk, D. Jagodić: Profitability Performance Under Capital Structure and Other…Zbornik Veleučilišta u Rijeci, Vol. 8 (2020), No. 1, pp. 227-242
242
Prethodno priopćenje https://doi.org/10.31784/zvr.8.1.21 Datum primitka rada: 24. 9. 2019. Datum prihvaćanja rada: 7. 10. 2019.
UČINAK PROFITABILNOSTI KROZ PRIZMU KAPITALNE STRUKTURE I OSTALIH ZNAČAJKI PODUZEĆA: EMPIRIJSKA STUDIJA HRVATSKE
HOTELSKE INDUSTRIJEGoran Karanović
Dr. sc., izvanredan profesor, Sveučilište u Rijeci, Fakultet za menadžment u turizmu i ugostiteljstvu, Primorska 42, p. p. 97, 51410 Opatija, Hrvatska; e-mail: [email protected]
Ana Štambuk Dr. sc., izvanredna profesorica, Sveučilište u Rijeci, Ekonomski fakultet u Rijeci,
Ivana Filipovića 4, 51000, Hrvatska; e-mail: [email protected]
Davor Jagodić Mr. sc., administrator, Sveučilište u Rijeci, Fakultet za menadžment u turizmu i ugostiteljstvu, Primorska 42,
p. p. 97, 51410 Opatija, Hrvatska; e-mail: [email protected]
SAŽETAKGlavni je cilj ovog rada istražiti kako struktura kapitala i ostalih financijskih karakteristika poduzeća utječu na učinak profitabilnosti hrvatske hotelske industrije. Ključni cilj ove studije je analizirati strukturu duga i kapitala hotelske industrije i objasniti njezinu povezanost s financijskim rezultatima. Veliki značaj i utjecaj hotelijerstva na gospodarstvo je glavni razlog zašto su se autori odlučili istražiti ga. Ova je studija provedena korištenjem panel dana metodologije na uzorku od 19 hrvatskih hotelskih poduzeća koje kotiraju na Zagrebačkoj burzi u razdoblju od 2003. do 2017. godine. Povrat imovine i povrat na kapital korišteni su kao posrednici i ovisne varijable. Dvanaest varijabli kao mjere kapitalne strukture i ostale karakteristike poduzeća – koeficijent trenutne likvidnosti, koeficijent tekuće likvidnosti, koeficijent financijske stabilnosti, koeficijent zaduženosti, faktor zaduženosti (broj godina), stupanj pokrića dugotrajne imovine vlastitim izvorima, koeficijent obrtaja ukupne imovine, koeficijent obrtaja kratkotrajne imovine, vrijeme naplate kratkotrajnih potraživanja, ekonomičnost ukupnog poslovanja, rentabilnost prometa bruto i kriza u razdoblju 2009. - 2015. – korišteni su kao nezavisne varijable. Rezultati indiciraju da su koeficijent trenutne likvidnosti, koeficijent financijske stabilnosti, faktor zaduženosti (broj godina), stupanj pokrića dugotrajne imovine vlastitim izvorima, koeficijent obrtaja ukupne imovine, ekonomičnost ukupnog poslovanja, vrijeme naplate kratkotrajnih potraživanja, rentabilnost prometa bruto i kriza u razdoblju 2009. - 2015. povezani s financijskim učinkom hrvatske hotelske industrije. Iako teorija učinka profitabilnosti te utjecaj strukture kapitala i ostalih značajki poduzeća su široko proučavana u financijskoj literaturi, nema mnogo studija koje se bave hotelijerstvom, posebno u Hrvatskoj. Konačno, ova studija trebala bi menadžerima pružiti dodatni uvid u donošenje optimalnih financijskih odluka.
Ključne riječi: struktura kapitala, karakteristike poduzeća, profitabilnost, Hrvatska, hotelska industrija
Creative Commons Attribution – NonCommercial 4.0 International License

R. Sulejman: The Influence of Entrepreneurship in Youth Unemployment in Transition and MENA...Zbornik Veleučilišta u Rijeci, Vol. 8 (2020), No. 1, pp. 243-251
243
Preliminary communication https://doi.org/10.31784/zvr.8.1.7 Received: 2. 12. 2019. Accepted: 24. 1. 2020.
THE INFLUENCE OF ENTREPRENEURSHIP IN YOUTH UNEMPLOYMENT IN TRANSITION AND MENA
COUNTRIESRejhan Sulejman
PhD Candidate, University American College Skopje, Boulevard 3 Makedonska Brigada 60, 1000 Skopje Republic of North Macedonia; e-mail: [email protected]
ABSTRACTEven though young people do not have enough work experience and skills, there is no doubt that they are an important source of the economic growth. However, the integration of young individuals to the labor market faces difficulties because of the missing experience, so one of the tools used to integrate them easily in the market has been entrepreneurship. In the last decade the concept ‘entrepreneurship’ and ‘entrepreneur’ have become very popular especially among youth. Studies show that young people are becoming interested in start-up businesses because they think about what they can do for themselves instead of what the government can do for them. The aim of this paper is to identify the relationship of entrepreneurship with youth unemployment in transition and Middle East and North Africa (MENA) countries for the period 2008 – 2016. An econometric analysis of panel data for the 33 countries is executed in Stata 12, to identify whether entrepreneurship can be used as a tool to decrease youth unemployment. There is no universal method to measure entrepreneurship, so data collected from different countries can bring incorrect results. In order to avoid incorrectness and misleading results we use TEA (total-early stage entrepreneurial activity) for entrepreneurship, from the Global Entrepreneurship Monitor, which uses the same methodology for data collection in every country. This study proves the theories from the literature review stating that young people have ambitions and are interested in starting their own business.
Key words: entrepreneurship, youth unemployment, TEA, transition countries, MENA countries
1. INTRODUCTION
Scientists agree that entrepreneurship plays an important role in the economic development through innovation and job creation. The relationship between entrepreneurship and unemployment is analyzed through two -way communication, i.e. the unemployment push effect (necessity-based entrepreneurship) and the prosperity pull effect (opportunity-based entrepreneurship) (Parker et al., 2004). According to the unemployment push effect, high unemployment reduces the chances to obtain a stable job, and an expected income from employment, so the unemployed person is ‘’pushed’’ or forced to start a small business. However, according to Remeikienee and Startiene (2009), if the country has a high unemployment rate,
Creative Commons Attribution – NonCommercial 4.0 International License

R. Sulejman: The Influence of Entrepreneurship in Youth Unemployment in Transition and MENA...Zbornik Veleučilišta u Rijeci, Vol. 8 (2020), No. 1, pp. 243-251
244
entrepreneurs face reduced demand for their products or services. The high unemployment rate weakens the consumers’ buying power which leads to increasing the risk of bankruptcy and entrepreneurs and be easily pulled out of the private sector. According to the prosperity pull, individuals will open a business if the country’s economic situation will allow thus reducing the unemployment rate (Remeikiene & Startiene, 2009). According to Muhelberger, (2007) in Remeikiene and Startiene (2009), individuals tend to be self-employed when unemployment is low, since the chances of returning to a wage labor are higher.
2. THE RELATIONSHIP OF ENTREPRENEURSHIP AND YOUTH UNEMPLOYMENT
After the financial crises in 2008, Europe had for the first time more than 23 million unemployed, and majority of small and medium enterprises had not been able to jump back to the previous levels of employment (Rotar, 2014). According to data by Eurostat the youth unemployment rate was 23.9% (EU28) in the first quarter of 2013, and declined to 19.7% at the end of 2015. According to the International Labor Organization, the global youth unemployment rate was 16.6% in 2013, and in the EU youth unemployment increased by as much as 24.9% between 2008 and 2012 (Gopalakrishnan, 2016). Since the unemployment issue had appeared in Europe, EU member states have been using different tools to fight it. One of the tools that Europe has been using is entrepreneurship. Rotar (2014) agrees that entrepreneurship plays an important role to tackle the unemployment, especially the youth unemployment. Unemployment in the Western Balkans on the other side has been a key macroeconomic problem during the process of transition. It is four to five times higher in this part of Europe compared to other European Union Countries. However, studies show that youth unemployment is a worrying fact in both less developed and developed countries (Stevanovic and Bogdanovic, 2018). Signorelli (2017) states that unlike planned economies, transition economies have higher and unstable unemployment rates especially youth unemployment.
The integration of young individuals in the labor market is not a smooth process. Young people face a lack or a mismatch of skills and experience when entering the labor market. In the US there are 11 million unemployed people, and 4 million unfilled jobs, as a result of skills mismatch (Gopalakrishnan, 2016). Because of lack of experience, getting a job for many young people can be a great issue, which can bring long-term unemployment among youth. This long-term unemployment influences in general happiness, and social dissatisfaction among the youth, and can also have long-term scars on the working adults of the next generation (OECD, 2001). Scientists agree that young people should have entrepreneurial education to prepare them for entering the labor market. Entrepreneurial education should spread an entrepreneurial culture among students and staff, foster innovation and innovative thinking and should find ways to encourage exchange and knowledge transfer between the university, industry, and the local communities (Sandri, 2016). But, in order to promote entrepreneurial activity among young people, it is crucial to learn more about young people’s awareness and attitudes and aspirations towards entrepreneurship and business (Schoof, 2006).

R. Sulejman: The Influence of Entrepreneurship in Youth Unemployment in Transition and MENA...Zbornik Veleučilišta u Rijeci, Vol. 8 (2020), No. 1, pp. 243-251
245
According to a Euro barometer survey cited in Rotar (2014), the number of young people interested in self-employed business surpasses the number of middle aged people. It was found that middle age people generally do not want to take risks, they want to have stability in their job, and they are happier to have a regular fixed income versus an irregular variable income. On the other hand, young people are more interested in becoming self-employed because of personal independence, the desire to seek out new challenges, to earn more money, to realize an idea or vision, to gain more reputation, and to connect a passion with a job (Schoof, 2006). However, Barringer et al. (2011), states that the total number of young entrepreneurs is lower than women entrepreneurs, minority or senior entrepreneurs, but their interest in entrepreneurship is growing. According to Rotar (2014), Slovenian young people are very interested in start-up businesses because they think about what they can do for themselves instead of what the government can do for them, and with some changes in labor market policy, the number of young entrepreneurs can increase in Slovenia. Youth in Serbia also shows interest in entrepreneurship, with significant differences in interest among people who know entrepreneurs and those who do not know. Studies in Serbia prove the statement above regarding women participation in entrepreneurship and that men are more interested in becoming entrepreneurs than women (Stevanovic and Bogdanovic, 2018).
The structure of early stage entrepreneurship by age is similar across regions. Most entrepreneurs fall into the age group of 25 to 34 and from 35 to 44 years. It is important to note some differences observed in different regions. Thus, young entrepreneurs in the early stage of the group 18-24 years are most commonly seen in the European Union and North America, and the group of older entrepreneurs 55-64 years in the sub-Saharan Africa region. However, according to the GEM Report (2016/17), the low participation of youth entrepreneurs can be affected by tertiary education, compulsory military service in some countries or the access to finance since young people often do not have credit history or assets to serve as collateral for obtaining a loan. For example, in North Macedonia experts agree mostly with the following statements: “Most young people who have become entrepreneurs have been helped to start up by their families, close relatives or friends”.; and “Young people find life / work opportunities abroad more attractive”. They also consider that “financiers (banks, informal investors, business angels...)” are less likely to finance business initiatives from young people, compared to all other countries (GEM, 2013).
Transition Economies, Unemployment and Entrepreneurship
During the nineties the Eastern Europe and former Soviet Union countries, started to move from a centrally planned communist economy to a free market economy. In terms of implementation, the transition did not occur in all countries at the same time. Czechoslovakia, Poland and Hungary were the first countries in Central and Eastern Europe that launched plans for privatization, with Hungary having started testing market-oriented reforms since the 1980s (Blokker et al., 2008). This transition brought many political, economical and social issues to the countries. One of the main issues that all these countries have struggled in the beginning of the transition has been the decrease of GDP, which took all transition countries in recession in 1991. On the other side the bad economic performance brought problems in the performance of the labor market (Bah et al., 2014). As a result of the sharp decline in the economic performance in the transition countries, employment started to decline and the demand for labor collapsed immediately (Nestorova,

R. Sulejman: The Influence of Entrepreneurship in Youth Unemployment in Transition and MENA...Zbornik Veleučilišta u Rijeci, Vol. 8 (2020), No. 1, pp. 243-251
246
2002), which mostly were affected the youth population. On the long – run, the political and economical instability characterized the transition economies with slow economic growth and high unemployment rate (Bah et al., 2014).
According to GEM model, most of transition countries are in efficiency-driven economy. With the fall of communism in 1989, the development of small businesses became one of the main reform goals of the post-communist governments. The new governments reacted by quickly removing the main barriers to entry, and privatizing the small business sector and by taking over the basic reforms in the financial sector. As a result of these new opportunities, almost everywhere in Central and Eastern Europe a race for registration of new small businesses appeared. The support of international organizations such as: World Bank, UNDP, PHARE. USAID etc played a significant role in encouraging small businesses in transition countries (Fiti et al., 2007). According to Estrin and Mickiewicz (2010), in transition economies the rate of entrepreneurship is lower than in developed and developing market economies, and this low rate is more expressed in the countries of former Soviet Union than those of Central and Eastern Europe. The low rate of entrepreneurship is presumed to be as a result of slow adaptation of informal institutions, social norms and attitudes.
The economy in MENA region is a heterogeneous macroeconomic context dependent on the oil industry. Most of the GDP is based on oil and government activities related with the oil industry (Tagliapietra, 2017). This region has the highest rates of youth population in the world, but also the highest rates of youth unemployment (Kabbani, 2019). Almost every second young educated person in this region is unemployed (OECD, 2016). The top priority of this region has been job generation, since this region suffers from long-term unemployment (O’Sullivan, n/a). On of the tools to tackle the unemployment has been entrepreneurship, since data show that entrepreneurship in this region has a large opporotunity for development, since it is one of the most digitalized regions in the world, with 88% of the population being online daily (Alkasmi, 2018). On the other hand data show that entrepreneurship on the other hand highly present in the MENA region, even higher than USA and Germany, but most the entrepreneurships are necessity-based such as shop owners or cart sellers and farmers who try to satisfy their basic needs (World Economic Forum, 2011).
From the literature review, we can conclude that youth labor is important for the economy. Even though they lack skills and experience they bring enthusiasm and ideas to the labor market. Many of them want to accomplish their entrepreneurial ideas by starting a business; however they face difficulties with financial support. We can also conclude that young people are the most vulnerable group in the labor market in both transition and MENA countries.
3. METHODOLOGY
To accomplish the research objective, an econometric analysis of secondary data was conducted in Stata 12, to present the relationship of entrepreneurship and youth unemployment. The dependent variable i.e. youth unemployment data were collected from the World Development Indicators database, and represent young people from the age 15 to 25 without work but available for and seeking a job from the total youth labor force. On the other hand measuring entrepreneurship on

R. Sulejman: The Influence of Entrepreneurship in Youth Unemployment in Transition and MENA...Zbornik Veleučilišta u Rijeci, Vol. 8 (2020), No. 1, pp. 243-251
247
either individual level or on an aggregated level arises many difficulties. It is simply not possible to collect individual characteristics within a data set that can be comparable over nations. Therefore, the measurements of entrepreneurship will always suffer from incorrectness (Wong 2005). To avoid misleading results, for this research the independent variable that measures entrepreneurship is total - early stage Entrepreneurial Activity (TEA) from Global Entrepreneurship Monitor, and represents new business or owners / managers of a new business are considered to be the persons who paid the salary after the first three months (thus completing the start-up phase), up to 3.5 years or 42 months after starting the business. The other independent factor used in this research is the Growth Competitiveness Index, a framework used by the World Economic Forum’s Global Competitiveness Report (GCR). The main objective of GCR is to review the capacity of the world’s economies to achieve sustained economic growth. Through the measuring of GCI the GCR represents the national competitiveness to which individual national economies have the structures, institutions, policies and factors that determine the level of productivity (GCR, 2017-2018).
This research is based on 33 countries which include transition and MENA countries for the period 2008-2016. The countries used in this research are: Bosnia and Herzegovina, Bulgaria, Croatia, Czech Republic, Estonia, Georgia, Hungary, Latvia, Lithuania, Kazakhstan, Kosovo, Montenegro, North Macedonia, Poland, Romania, Serbia, Slovakia, Slovenia, Algeria, Egypt, Iran, Israel, Jordan, Lebanon, Libya, Morocco, Saudi Arabia, Syria, Qatar, Tunisia, Turkey, UAE, and Yemen.
4. EMPIRICAL DATA AND ANALYSIS
A linear regression analysis is used for this research to concretely identify if entrepreneurship is an effective tool to decrease youth unemployment in transition and MENA countries. For this research the following hypothesis was established.
H: The higher the TEA ratio, the lower the youth unemployment ratio
The first step of the analysis is to define a suitable technique for the panel data. The Hausman test was used to define the model of the regression. According to the results from the Hausman test, the p-value is 0.000. Since p-value is < 0.05, the null hypothesis is rejected, which means that a fixed effect method is preferred. The unit root test of Levin, Lin & Chu was employed to avoid misleading results. With p-value = 0.0188, the test proves that the panels are at stationary. Another testing that was used in this research was the heteroscedasticity test and with Prob > ch2 = 0.000, the results prove the presence of heteroscedasticity. To deal with this issue, the robust standard error is used in this research.
The following equation was established for this hypothesis:
YUNt = β0 + β1 TEAi,t-1 + β2 GCIi,t-1 + β1 YUNi,t-1 + Ɛit
YUN is the dependent variable and represents the youth unemployment rate, TEA and GCI are the independent variables that represent the total-early stage entrepreneurship and growth competitiveness index respectively. YUNt-1 is the lagged dependent variable i.e. the ratio of total

R. Sulejman: The Influence of Entrepreneurship in Youth Unemployment in Transition and MENA...Zbornik Veleučilišta u Rijeci, Vol. 8 (2020), No. 1, pp. 243-251
248
unemployment from the previous year. This variable exists in order to remove the serial correlation, t represents the time, i is the country index, β is the coefficients for the independent variables and Ɛ is the standard error term.
5. RESULTS AND DISSCUSION
The panel data uses lagged data as control variables, since the agents in the economy may have a delayed response in unemployment (Stel et al. 2005; Koellinger and Thurik, 2012; Doulety, 2017). The test (F) is equal to 0.000 and R-squared = 0.4646, meaning 46.46% of the independent variables are explained by this model.
Table 1. The effect of TEA on youth unemployment rate
The effect of TEA on Youth Unemployment
L. TEA -0.2967*
-0.1622
L. GCI -3.0075
-3.4396
L. YOUTH UNEMPLOYMENT 0.5854***
-0.0923
Constant 27.1799
-17.1392
Observations 113
Number of id 30
R-squared 0.4646
*, *** refer to statistical significance at the 10 and 1% level, respectively. The number in the parentheses represents the robust standard errors of the representative coefficients.
Source: Authors’ calculations
According to the estimated results we find a negative effect of GCI on youth unemployment, but it does not have an effect on the decrease of the youth unemployment since the p-value is statistically insignificant. However the effect of TEA shows to be statistically significant at 10% and its coefficient is negative. From the established results we cannot reject the test hypothesis (H), since it is empirically supported. According to the estimated panel data, for 10% increase of new entrepreneurial companies youth unemployment rate decreases for 0.2967. Lately many young individuals have started to see their future outside their own countries, especially young people from transition countries. The huge number of young going abroad has started to become a serious issue for countries such as North Macedonia and other Western Balkan countries.

R. Sulejman: The Influence of Entrepreneurship in Youth Unemployment in Transition and MENA...Zbornik Veleučilišta u Rijeci, Vol. 8 (2020), No. 1, pp. 243-251
249
Different programs have appeared for smoother integration of youth in the labor market, with one of them being entrepreneurship. This observation may indicate that youth who are still new in the labor market are more interested in starting their businesses during the time of unemployment, which empirically supports the idea for promoting entrepreneurship among young individuals. This model confirm the theory mentioned before (see Schoof, 2006; Rotar, 2014), declaring that youth who are still new in the labor market are more interested in starting their businesses during the time of unemployment. However, the insignificance of GCI can indicate that young people are more risk taking by not taking into consideration the willingness of the institutions and the macroeconomic environment. Even though the data show that TEA has a positive effect on the decrease of youth unemployment, according to the literature review, young individuals that want to become entrepreneurs face difficulties such compulsory military service and lack of support of financial institutions, since young people do not have credit history or assets to save as collateral for obtaining loan, so they are forced to require help from relatives, family and friends for starting a business.
In order to support the youth entrepreneurship the transition and MENA countries should engage different programs to increase the level of entrepreneurship among young individuals such as financial support, grants and other business program support for young people up to 29 years old. The government should also engage in programs for education, trainings and mentoring. The entrepreneurial education should be spread among young individuals in order to foster innovation and innovative thinking. Furthermore, the governments should find ways to encourage exchange and knowledge transfer between the university, industry and the local communities.
6. CONCLUSION
Studies prove the importance of young individuals in the labor market. They are many times stated as the future of the country, and those who bring enthusiasm and new ideas. Even though we cannot neglect their importance, studies prove that their transition from school to the labor market faces many obstacles, since they have a lack of skills and experience; so many young individuals try to integrate in the labor market through entrepreneurial activities and by starting their own business. The literature review supports this action of young entrepreneurs stating that young individuals are keen to work for themselves and expose their business ideas. The purpose of this study was to investigate the relationship of entrepreneurship with youth unemployment in 33 countries, which includes the transition and MENA (Middle East and North Africa) countries for the period 2008-2016. This research confirms that entrepreneurship can be used as a tool to integrate young people in the labor market in transition and MENA countries. However, the governments should engage more in business support programs through offering financial grants for young entrepreneurs, and engage more in entrepreneurial education, training and mentoring programs. Further research should be established on the influence of entrepreneurial education among young people, and the long – term influence of entrepreneurship on youth unemployment rate.

R. Sulejman: The Influence of Entrepreneurship in Youth Unemployment in Transition and MENA...Zbornik Veleučilišta u Rijeci, Vol. 8 (2020), No. 1, pp. 243-251
250
REFERENCES
Bah, E. M., Brada C. J. (2014) ‘Labor Markets in the Transition Economies An Overview’, The European Journal of Comparative Economics, 11(1), pp. 3–53.
Barringer B., Ireland R.D.(2011) ‘Entrepreneurship: Successfully Launching New Ventures (4rd Edition)’, Pearson Education, Inc. publishing as Prentice Hall
Dvoulety O.(2017) ‘What is the Relationship Between Entrepreneurship and Unemployment in Visegrad Countries?’ Central European Business Review vol.6, no.02, pp. 42-53, https://doi.org/10.18267/j.cebr.179
Global Entreprenuership Monitor (2013). Entrepreneurship in Macedonia
Global Entreprenuership Monitor (2017). Global Report 2016/17.
Gopalakrishnan K. (2014) ‘Youth Unemployment and the Role of Entrepreneurship’ Diplomatic Courier, 8, 1, pp. 70-72.
Eurostat (2019) ‘News release Euro indicators’ Retrieved on February 25th from: https://ec.europa.eu/eurostat/documents/2995521/9477410/3-09012019-AP-EN.pdf/1f232ebb-1dcc-4de2-85d1-5765fae86ea8
Kabbani, N. (2019) ‘Youth Employment in the Middle East and North Africa: Revisiting and Reframing the Challenge’, (February), pp. 1–15.
Koellinger, P. D., & Roy Thurik, A. (2012) ‘Entrepreneurship and the business cycle’ Review of Economics and Statistics, 94(4), 1143-1156. https://doi.org/10.1162/REST_a_00224
Leithner, A. (2017) ‘The middle East and North Africa’, The Other World: Issues and Politics in the Developing World: Tenth Edition, pp. 309–370
Nesporova, A. (2002) ‘Unemployment in the transition economies’, Romania, pp. 1–32.
O’Sullivan, A., Rey, M. and Mendez, J. G. (2011) ‘Key Challenges for the MENA Region Job creation is the top priority ’,
Organisation for Economic Co-operation and Development (2001) ‘Putting the Young in Business – Policy Challenges for Youth Entrepreneurship’.
Parker, S., & Robson, M. (2004) ‘Explaining International Variations in Self-Employment: Evidence from a Panel of OECD Countries’, Southern Economic Journal, 71, 2, pp. 287-301, 3. https://doi.org/10.2307/4135292
Remeikiene, R., Startiene, G. (2009) ‘Does the Interaction between Entrepreneurship and unemployment exist?’ Economics & Management 2009.14
Rotar, L. J., (2014) ‘Youth Unemployment and Entrepreneurship’ Ekonomika, 60, 4, pp. 43-56.
Saddi, J., Soueid, R. (2011) ‘Accelerating entrepreneurship in the Arab world’, World Economic Forum, (October), pp. 1–36.
Sandri, S. (2016). ‘The Need for Entrepreneurial Education in Jordan-An Empirical Investigation’, Jordan Journal Of Business Administration, 12, 2, pp. 417-435. https://doi.org/10.12816/0033357
Schoof, U. (2006). ‘Stimulating Youth Entrepreneurship: Barriers and incentives to enterprise start-ups by young people’, International Labor Organisation
Stel, A. Van, Carree, M., Thurik, R. (2005) ‘The effect of entrepreneurial activity on national economic growth’, Small Business Economics, 24(3), pp. 311–321.
Stevanovic T. A., Bogdanovic D. (2018) ‘Youth Unemployment and Entrepreneurship in Serbia’, Megatrend Review 15, (3), pp. 129-144. https://doi.org/10.5937/MegRev1803129T
Tagliapietra S. (2017) ‘The Political Economy of Middle East and North Africa’, 05, pp. 1–20.
Wong P. K., Ho Y. P., Autio E. (2005) ‘Entrepreneurship, Innovation and Economic Growth: Evidence from GEM data’ Small Business Economics 24, pp.355 – 350. https://doi.org/10.1007/s11187-005-2000-1
World Economic Forum (2017). The Global Competitiveness Report 2017-2018.

R. Sulejman: The Influence of Entrepreneurship in Youth Unemployment in Transition and MENA...Zbornik Veleučilišta u Rijeci, Vol. 8 (2020), No. 1, pp. 243-251
251
Prethodno priopćenje https://doi.org/10.31784/zvr.8.1.7 Datum primitka rada: 2. 12. 2019. Datum prihvaćanja rada: 24. 1. 2020.
UTJECAJ PODUZETNIŠTVA NA NEZAPOSLENOST MLADIH U TRANZICIJSKIM ZEMLJAMA I ZEMLJAMA
MENA-ERejhan Sulejman
Doktorandica, University American College Skopje, Boulevard 3 Makedonska Brigada 60, 1 000 Skopje, Republika Sjeverna Makedonija, e-mail: [email protected]
SAŽETAKIako mladi ljudi nemaju dovoljno radnog iskustva i vještina, nema sumnje da su oni važan izvor ekonomskog rasta. Međutim, integracija mladih osoba na tržištu rada suočava se s poteškoćama zbog nedostatka iskustva pa je jedan od alata, koji se koriste da bi se lakše integrirali na tržištu, poduzetništvo. U zadnjem desetljeću koncepti „poduzetništvo“ i „poduzetnik“ postali su vrlo popularni, pogotovo među mladima. Istraživanja su pokazala da mladi ljudi postaju zainteresirani za startupove zato jer razmišljaju što mogu učiniti za sebe, a ne što vlada može učiniti za njih. Cilj je ovoga rada prepoznati odnos poduzetništva s nezaposlenosti mladih u tranzicijskim zemljama i zemljama Bliskog istoka i Sjeverne AFRIKE (eng. MENA) za razdoblje od 2008. do 2016. godine. Ekonometrijska analiza panel podataka za 33 zemlje izvršena je u programu Stata 12 kako bi se prepoznalo može li poduzetništvo biti korišteno kao alat da se smanji nezaposlenost među mladima. Nema univerzalne metode kojom bi se mjerili pokazatelji poduzetništva pa prikupljeni podatci iz različitih zemalja mogu dati pogrešne rezultate. Kako bi se izbjegla netočnost i rezultati koji bi nas mogli zavaravati korišten je indeks TEA (ukupna poduzetnička aktivnost u ranoj fazi) za poduzetništvo iz studije globalnog poduzetničkog nadzora, koji koristi istu metodologiju za prikupljanje podataka u svakoj zemlji. Ovo istraživanje potvrđuje teorije navedene u prikazu literature tvrdeći da mladi ljudi imaju ambicije i da su zainteresirani za osnivanje vlastite tvrtke.
Ključne riječi: poduzetništvo, nezaposlenost mladih, TEA, tranzicijske zemlje; zemlje MENA-e.
Creative Commons Attribution – NonCommercial 4.0 International License


V. Bilas: What is the Relationship Between FDI and Economic Growth? Evidence from EU15 CountriesZbornik Veleučilišta u Rijeci, Vol. 8 (2020), No. 1, pp. 253-281
253
Preliminary communication https://doi.org/10.31784/zvr.8.1.8 Received: 3. 12. 2019. Accepted: 30. 1. 2020.
WHAT IS THE RELATIONSHIP BETWEEN FDI AND ECONOMIC GROWTH? EVIDENCE FROM EU15
COUNTRIESVlatka Bilas
PhD, Full Professor, University of Zagreb, Faculty of Economics and Business, Department of International Economics, Trg J. F. Kenedyja 6, 10000 Zagreb, Croatia;
e-mail: [email protected]
ABSTRACTThe aim of the paper is to examine the relationship between foreign direct investment (FDI) and economic growth in EU15 countries over the period 2002-2018. EU15 makes a group of countries which entered the EU prior to the biggest enlargement in 2004, namely latest in 1995 (Austria, Belgium, Denmark, Finland, France, Germany, Greece, Ireland, Italy, Luxembourg, Netherlands, Portugal, Spain, Sweden and United Kingdom). Paper findings contribute to the existing literature on the impact of FDI on economic growth. It employs different unit root tests, panel cointegration test (ARDL model) and Granger causality. Estimated panel ARDL model found some evidence that there are long-run equilibrium between LogGDP, LogFDI and LogFDIP series. The rate of adjustment back to equilibrium is between 4.43% and 5.95%. The long-run coefficients are all positive, but not all of them are statistically significant. In case of LogFDIP series long-run coefficients are statistically significant, varying between 0.1226 and 0.4398. These coefficients indicate that 1% increase in LogFDIP (logarithm of FDI to GDP) increases LogGDP between 0.1226% and 0.4398%. Results of Dumitrescu-Hurlin panel causality test indicated that there is only unidirectional causal relationship from GDP growth rate to FDI growth rate, and from GDP growth rate to LogFDIP. Conclusively, there is only a weak evidence that FDI had statistically significant impact on the GDP in EU15 countries.
Key words: unit root tests, cointegration test, Granger causality, EU15
1. INTRODUCTION
Although projection of the global FDI flows were that FDI will increase by about 5% in 2018 (UNCTAD, 2018), global FDI decreased in 2018 by 13% (UNCTAD (2019). Analysing the FDI flows over the period 1990-2018, it can be concluded that in 1990 more than 60% of FDI inflow in
Creative Commons Attribution – NonCommercial 4.0 International License

V. Bilas: What is the Relationship Between FDI and Economic Growth? Evidence from EU15 CountriesZbornik Veleučilišta u Rijeci, Vol. 8 (2020), No .1, pp. 253-281
254
developed countries went to Europe. In the observed period, the share of Europe was highest in 2005 when it exceeded 80% and after 2005 share of Europe started to decline to 31% in 2018.
In order to stimulate economic growth countries liberalise trade, the movement of capital, and even the labor. Related to FDI, they liberalise the movement of capital expecting positive effects on their economy from FDI inflows. The trends of proliferation and deepening regional economic integrations led to the liberalization of the movement of capital within and beyond regional economic integrations (Bilas, 2007). Developing countries try to attract more FDI with their incentives due to the expectation of a positive impact on the host economy (Kersan Skabic, 2013).
Many authors examined the effects of FDI on the host economy (Carbonell and Werner, 2018). There is a spread belief that FDI promotes economic development (Alfaro et al., 2010; Hunady and Orviska, 2014), especially in developing countries (Sokang, 2018). De Mello (1997) found that impact of FDI on output growth in the host economy depends on the scope of efficiency spillovers to domestic firms. Borensztein, De Gregorio and Lee (1998) examined the effect of FDI on economic growth for the period 1970-1989 on the sample of 69 developing countries and concluded that the effect of FDI on economic growth is dependent on the level of human capital available in the host economy. Gürsoy, Sekreter and Kalyoncu (2013) found biased results on the relationship between GDP and economic growth in the observed period 1997-2010.
Iamsiraroj and Doucouliagos (2015) applied meta-regression analysis to 946 estimates from 140 empirical studies. They found robust positive correlation between economic growth and FDI, significantly larger for single country case studies than with cross-country analysis. Similarly, Ozturk (2007) analysed literature on the relationship between FDI and economic growth and found that consensus has been reached that FDI tends to have significant effect on economic growth through multiple channels. On the other hand, Alfaro et al. (2010) claim that empirical literature finds weak support for an exogenous positive effect of FDI on economic growth.
Jirasavetakul and Rahman (2018) found FDI has played a strong role in the export-led growth of new European Union member countries. De Mello (1999) found on the sample of OECD and non-OECD countries over the period 1970-1990 that extent to which FDI fosters economic growth depends upon the level of complementarity and substitution of FDI and domestic investment. Ekananda and Parlinggoman (2017) found positive role of FDI and domestic investment on economic growth on the sample of 50 countries over the period 1992-2014.
Kurecic and Kozina (2017) examined the correlation between GDP and FDI in EU15 countries over the period 1980-2014 and found most of the EU15 member countries show a significant correlation. Tang (2015) examined the FDI effects on economic growth of the European Union member countries over the period 1987-2012 and concluded that EU countries can maintain sustainable higher growth by attracting more FDI.
Angelopoulou and Liargovas (2014) examined the relationship between FDI and economic growth for three group of countries, EU members, EMU members and transition countries, over the period 1989-2008 and found no robust causality relationship between FDI and economic growth.
V. Bilas: What is the Relationship Between FDI and Economic Growth? Evidence from EU15 CountriesZbornik Veleučilišta u Rijeci, Vol. 8 (2020), No. 1, pp. 253-281
255
Hlavacek and Bal-Domanska (2016) examined the impact of FDI on economic growth on the sample of Central and Eastern European countries (Czech Republic, Estonia, Hungary, Latvia, Lithuania, Poland, Slovakia and Slovenia) over the period 2000-2012 and found statistically significant relation between FDI and GDP, as well as growth of the FDI positively impacts growth of the GDP. Carstensen and Toubal (2004) examined the determinants of FDI into Central and Eastern European countries in the period 1993-1999 and identified the factors which encourage inflow of the FDI: market potential, low relative unit labor costs and skilled labor force. On the other side, Dhakal, Mixon and Upadhyaya (2007) on the same sample of countries for the period 1995-2004 found following determinants of FDI: real exchange rate, openness of the economy and deregulation. Furthermore, Jude and Pop Silaghi (2016) examined the impact of FDI on aggregate employment in Central and Eastern European countries for the observed period 1995-2012 and found a negative short run effect on employment which becomes positive in the long run.
Schmitt and Alexiou (2016) examined the FDI led growth hypothesis in Ireland over the period 1976-2011, using annual data. They found, among others, significant relationship between FDI and GDP, as well as unidirectional Granger causality from GDP to FDI. Similarly, Sârbu and Carp (2015) found that FDI has a positive effect on the economic growth in Romanian over the period 2000-2013.
Kikerkova et al. (2018) examined the impact of the FDI inflow on the economic growth of Macedonia over the period 2003-2015 and found positive bidirectional relationship, higher GDP can lead to higher FDI inflows, as well as the increase in FDI can cause positive reaction to the economic growth.
Mahmoodi and Mahmoodi (2016) examined the causal relationship between FDI, exports and economic growth in two panels of developing countries - eight European developing countries over the period 1992-2013 and eight Asian developing countries over the period 1986-2013. They found in the European developing panel bidirectional causality between GDP and FDI, as well as unidirectional causality from GDP and FDI to exports and for Asian developing panel bidirectional causality between exports and economic growth in short run. However, they found in the long run causality from export and FDI to economic growth, and causality from economic growth and export to FDI for both of the panels.
Chowdhury and Mavrotas (2006) examined the causal relationship between FDI and economic growth on the sample of Chile, Malaysia and Thailand over the period 1969-2000 and found GDP causes FDI in the case of Chile (unidirectional causality), while for both Malaysia and Thailand, there is a strong evidence of a bidirectional causality between the two variables. Suliman et al. (2018) found bidirectional relationship between FDI and economic growth - FDI boosts growth and the growth rate stimulates positively FDI inwards, for the Economic and Social Commission for Western Asia countries over the period 1980-2011. Iqbal et al. (2013) examined the relationship between FDI and GDP in Pakistan over the period 1983-2012 and found positive relationship between FDI and GDP. Similarly, Rahaman and Chakraborty (2015) examined the causal relationship between FDI and GDP in Bangladesh over the period 1987-2011 and found long-run equilibrium relationship and Granger unidirectional causality from FDI to GDP.
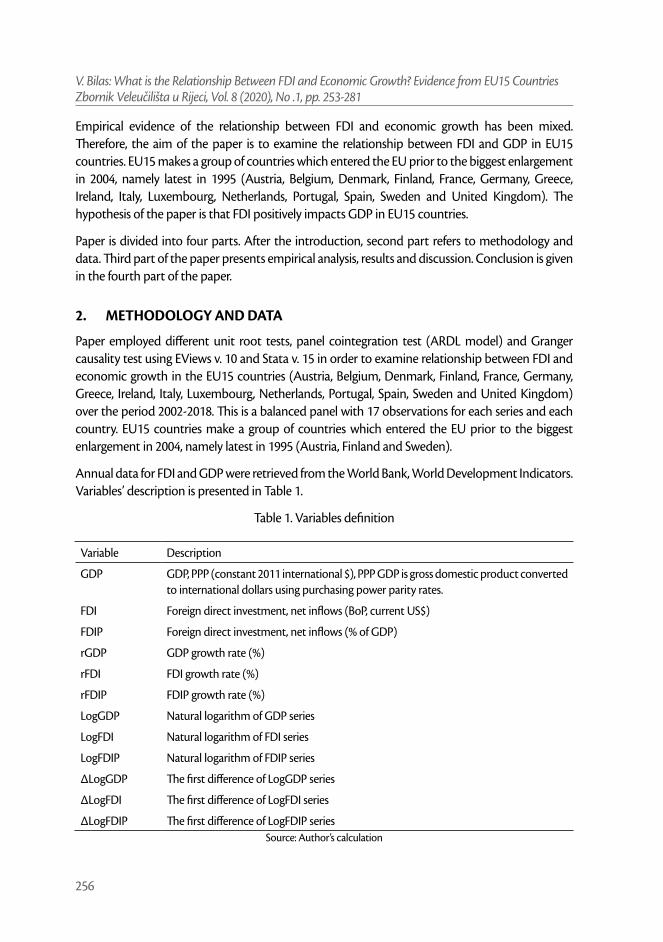
V. Bilas: What is the Relationship Between FDI and Economic Growth? Evidence from EU15 CountriesZbornik Veleučilišta u Rijeci, Vol. 8 (2020), No .1, pp. 253-281
256
Empirical evidence of the relationship between FDI and economic growth has been mixed. Therefore, the aim of the paper is to examine the relationship between FDI and GDP in EU15 countries. EU15 makes a group of countries which entered the EU prior to the biggest enlargement in 2004, namely latest in 1995 (Austria, Belgium, Denmark, Finland, France, Germany, Greece, Ireland, Italy, Luxembourg, Netherlands, Portugal, Spain, Sweden and United Kingdom). The hypothesis of the paper is that FDI positively impacts GDP in EU15 countries.
Paper is divided into four parts. After the introduction, second part refers to methodology and data. Third part of the paper presents empirical analysis, results and discussion. Conclusion is given in the fourth part of the paper.
2. METHODOLOGY AND DATA
Paper employed different unit root tests, panel cointegration test (ARDL model) and Granger causality test using EViews v. 10 and Stata v. 15 in order to examine relationship between FDI and economic growth in the EU15 countries (Austria, Belgium, Denmark, Finland, France, Germany, Greece, Ireland, Italy, Luxembourg, Netherlands, Portugal, Spain, Sweden and United Kingdom) over the period 2002-2018. This is a balanced panel with 17 observations for each series and each country. EU15 countries make a group of countries which entered the EU prior to the biggest enlargement in 2004, namely latest in 1995 (Austria, Finland and Sweden).
Annual data for FDI and GDP were retrieved from the World Bank, World Development Indicators. Variables’ description is presented in Table 1.
Table 1. Variables definition
Variable Description
GDP GDP, PPP (constant 2011 international $), PPP GDP is gross domestic product converted to international dollars using purchasing power parity rates.
FDI Foreign direct investment, net inflows (BoP, current US$)
FDIP Foreign direct investment, net inflows (% of GDP)
rGDP GDP growth rate (%)
rFDI FDI growth rate (%)
rFDIP FDIP growth rate (%)
LogGDP Natural logarithm of GDP series
LogFDI Natural logarithm of FDI series
LogFDIP Natural logarithm of FDIP series
∆LogGDP The first difference of LogGDP series
∆LogFDI The first difference of LogFDI series
∆LogFDIP The first difference of LogFDIP seriesSource: Author’s calculation

V. Bilas: What is the Relationship Between FDI and Economic Growth? Evidence from EU15 CountriesZbornik Veleučilišta u Rijeci, Vol. 8 (2020), No. 1, pp. 253-281
257
Table 2. Descriptive statistics for EU15 members
Variable Obs Mean Std. Dev. Min Max
gdp4 255 1.01e+12 1.03e+12 3.79e+10 3.81e+12
fdi 255 4.18e+10 7.96e+10 -2.39e+11 7.34e+11
fdip 255 6.992461 14.45328 -58.32288 86.61077
rgdp4 255 1.521327 2.996384 -9.13254 25.16233
rfdi 253 274.9144 3530.726 -843.0771 55862.27
rfdip 253 255.694 3430.596 -760.4657 54347.48
loggdp4 255 27.04025 1.162207 24.35926 28.96899
logfdi 255 19.4214 13.61418 -26.20086 27.32179
logfdip 255 1.327866 1.400505 -4.082995 4.472904
dloggdp4 255 .0146727 .0291417 -.095768 .2244415
dlogfdi 253 -.7039818 16.65308 -51.49107 48.55619
dlogfdip 253 -.0815229 1.480817 -8.426331 6.703549
Original series: gdp4, fdi, fdip. Growth rates: rgdp4, rfdi, rfdip. Logarithm transformation: loggdp4, logfdi, logfdip. The first
difference: dloggdp4 dlogfdi dlogfdip
Source: Author’s calculation
3. EMPIRICAL ANALYSIS, RESULTS AND DISCUSSION
3. 1 Unit root tests
Levin-Lin-Chu (2002) and Breitung (2000, 2002) tests are using t—statistic to test the null hypothesis of common unit root. Im-Pesaran-Shin (2003) with W-statistic, ADF (Dickey and Fuller, 1979, 1981) Fisher and PP Fisher with Chi-square statistics are testing the null hypothesis of individual unit root against an alternative hypothesis of some cross-sections without unit root. Finally, the null hypothesis of stationarity was tested using Hadri (2000) Z-statistic and heteroscedastic consistent Z-statistic. The results are presented in Table 3.

V. Bilas: What is the Relationship Between FDI and Economic Growth? Evidence from EU15 CountriesZbornik Veleučilišta u Rijeci, Vol. 8 (2020), No .1, pp. 253-281
258
Table 3. First generation panel unit root tests
Variables
Null hypothesis: U
nit root – comm
on rootN
ull hypothesis: Unit root – individual root
Null hypothesis: Stationarity
Levin, Lin & Chu
t-statisticBreitung t-statistic
Im, Pasaran &
Shin W
-statisticAD
F Fisher Chi-square
PP Fisher Chi-square
Hadri Z-statistic
Heteroscedastic consistent
Z-statistic
LevelG
DP
-1.35 (.09)-2.95 (<.01)
0.29 (.62)24.64 (.74)
13.57 (<.01)3.52 (<.01)
3.59 (<.01)
FDI
-7.64 (<.01)-5.09 (<.01)
-5.53 (<.01)81.24 (<.01)
82.14 (<.01)6.26 (<.01)
3.83 (<.01)
FDIP
-8.88 (<.01)-5.12 (<.01)
-6.06 (<.01)87.35 (<.01)
101.57 (<.01)5.73 (<.01)
7.04 (<.01)
rGD
P-6.78 (<.01)
-5.94 (<.01)-4.08 (<.01)
66.74 (<.01)84.35 (<.01)
6.67 (<.01)12.43 (<.01)
rFDI
-10.59 (<.01)-6.01 (<.01)
-9.85 (<.01)131.45 (<.01)
155.48 (<.01)1.58 (.06)
12.07 (<.01)
rFDIP
-9.50 (<.01)-5.58 (<.01)
-10.07 (<.01)133.43 (<.01)
157.31 (<.01)1.58 (.06)
11.52 (<.01)
LogGD
P-1.78 (<.04)
-3.62 (<.01)-0.20 (.42)
26.57 (.65)15.36 (.99)
4.85 (<.01)3.71 (<.01)
LogFDI
-9.37 (<.01)-2.72 (<.01)
-6.82 (<.01)106.80 (<.01)
129.36 (<.01)4.75 (<.01)
9.17 (<.01)
LogFDIP
-8.21 (<.01)-2.68 (<.01)
-6.30 (<.01)96.05 (<.01)
123.60 (<.01)4.80 (<.01)
9.94 (<.01)
First difference
∆G
DP
-6.85 (<.01)-6.22 (<.01)
-4.14 (<.01)67.21 (<.01)
84.31 (<.01)7.12 (<.01)
12.52 (<.01)
∆FD
I-17.97 (<.01)
-8.64 (<.01)-16.12 (<.01)
206.00 (<.01)269.47 (<.01)
12.57 (<.01)16.75 (<.01)
∆FD
IP-18.22 (<.01)
-6.94 (<.01)-15.90 (<.01)
204.51 (<.01)275.22 (<.01)
19.54 (<.01)19.36 (<.01)
∆rG
DP
-11.70 (<.01)-13.52 (<.01)
-10.92 (<.01)149.07 (<.01)
307.70 (<.01)17.11 (<.01)
22.66 (<.01)
∆rFD
I-17.95 (<.01)
-4.28 (<.01)-17.92 (<.01)
214.50 (<.01)284.69 (<.01)
38.97 (<.01)23.46 (<.01)
∆rFD
IP-18.06 (<.01)
-4.19 (<.01)-18.62 (<.01)
225.03 (<.01)290.55 (<.01)
39.01 (<.01)21.81 (<.01)
∆LogG
DP
-6.80 (<.01)-6.16 (<.01)
-3.99 (<.01)65.40 (<.01)
83.34 (<.01)6.82 (<.01)
12.16 (<.01)
∆LogFD
I-14.31 (<.01)
-3.20 (<.01)-16.35 (<.01)
217.35 (<.01)260.02 (<.01)
3.46 (<.01)20.57 (<.01)
∆LogFD
IP-17.28 (<.01)
-4.79 (<.01)-16.03 (<.01)
208.79 (<.01)259.56 (<.01)
4.67 (<.01)14.18 (<.01)
Note: Th
e following exogenous variables w
ere included in the test equation: Individual effects, individual linear trends. Schwarz autom
atic selection of maxim
um lags criterion,
New
ey-West autom
atic bandwidth selection and Bartlett kernel w
ere used.Source: Author’s calculation

V. Bilas: What is the Relationship Between FDI and Economic Growth? Evidence from EU15 CountriesZbornik Veleučilišta u Rijeci, Vol. 8 (2020), No. 1, pp. 253-281
259
The problem with all the first generation panel unit root tests is that they assume cross-sectional independence. Therefore, the first generation panel unit root tests cannot be applied to panels where cross-sectional dependence cannot be excluded. Before using panel unit root test that can deal with cross-sectional dependence we highlight the cross-sectional dependence in our data. The null hypothesis is that there is no cross-section dependence. The results of all cross-sectional dependence tests are presented in Table 4.
Table 4. Cross-sectional dependence test statistic
Variable Breusch-Pagan LM Pesaran scaled LM Bias-corrected scaled LM Pesaran CD
GDP 1070.34 (<.01) 66.61 (<.01) 66.15 (<.01) 24.53 (<.01)
FDI 173.59 (<.01) 4.73 (<.01) 4.26 (<.01) 4.84 (<.01)
FDIP 163.69 (<.01) 4.05 (<.01) 3.58 (<.01) 4.03 (<.01)
rGDP 920.24 (<.01) 56.27 (<.01) 55.79 (<.01) 29.22 (<.01)
rFDI 102.02 (.56) -0.21 (.84) -0.67 (.50) -0.72 (.47)
rFDIP 102.38 (.55) -0.18 (.86) -0.65 (.52) -0.97 (.33)
LogGDP 1077.49 (<.01) 67.11 (<.01) 66.64 (<.01) 24.56 (<.01)
LogFDI 111.56 (.31) 0.45 (.65) -0.02 (.99) 1.01 (.31)
LogFDIP 134.03 (.03) 2.00 (.05) 1.53 (.13) 3.20 (<.01)
∆GDP 940.47 (<.01) 57.65 (<.01) 57.18 (<.01) 29.56 (<.01)
∆FDI 168.88 (<.01) 4.41 (<.01) 3.94 (<.01) 2.04 (.04)
∆FDIP 161.91 (<.01) 3.93 (<.01) 3.46 (<.01) 1.92 (.06)
∆rGDP 983.34 (<.01) 60.61 (<.01) 60.14 (<.01) 29.60 (<.01)
∆rFDI 148.42 (<.01) 3.00 (<.01) 2.53 (.01) -0.37 (.71)
∆rFDIP 155.08 (<.01) 3.46 (<.01) 2.99 (<.01) -0.54 (.59)
∆LogGDP 936.08 (<.01) 57.35 (<.01) 56.88 (<.01) 29.52 (<.01)
∆LogFDI 121.93 (.12) 1.17 (.24) 0.70 (.48) 0.70 (.48)
∆LogFDIP 133.52 (.03) 1.97 (.05) 1.50 (.13) 1.55 (.12)
Note: Cross-section means were removed during computation of correlations. Degree of freedom for all tests is 105.
Source: Author’s calculation
All the tests applied reject the null hypothesis of cross-sectional independence for level of three series (original series and logarithm transformed series) with one exception. Series LogFDI and ∆LogFDI and also some of the growth rates and the first difference series show no cross-sectional dependence. While for these series we can trust the outcome of the first generation panel unit root tests results, results of cross-sectional independence tests for other series recommend use of the second generation panel unit root tests.
One of the tests that can deal with cross-sectional dependence is the Pesaran’s CIPS test (Pesaran, 2007). We have use Stata v. 15 to apply Pesaran’s CIPS test for unit roots in heterogeneous panels,

V. Bilas: What is the Relationship Between FDI and Economic Growth? Evidence from EU15 CountriesZbornik Veleučilišta u Rijeci, Vol. 8 (2020), No .1, pp. 253-281
260
i.e. in the presence of cross-section dependence. The null hypothesis is that all panels contain unit root, against the alternative hypothesis that some panels are stationary. Results of this tests are presented in Table 5.
Table 5. Pesaran’s CIPS test statistic for unit roots in heterogeneous panels
Variable Without trend With trend
GDP -0.82 -1.99
FDI -3.60 -3.54
FDIP -3.15 3.69
rGDP -2.80 -2.83
rFDI -4.37 -4.66
rFDIP -4.41 -4.66
LogGDP -0.82 -2.64
LogFDI -3.12 -3.41
LogFDIP -3.27 -3.59
∆GDP -2.38 -2.76
∆FDI -5.44 -5.51
∆FDIP -5.31 -5.59
∆rGDP -4.22 -3.97
∆rFDI -5.51 -5.49
∆rFDIP -5.68 -5.54
∆LogGDP -2.75 -2.51
∆LogFDI -4.87 -4.96
∆LogFDIP -5.40 -5.12
Note: individual dynamics specifications in each regression is based on the Wald test of composite linear hypothesis about the parameters of the model. The 10%, 5% and 1% critical values for the model without trend are −2.14, −2.26 and
−2.47, and −2.67, −2.78 and −3.01 for the model with trend, respectively.
Source: Author’s calculation
Pesaran CIPS test indicates for all but two series that the null hypothesis of unit root in all panels should be rejected at the 1% significance level. Two exceptions are series GDP and LogGDP for which the Pesaran CIPS test indicated unit root in all panels.
Finally, Levin, Lin & Chu and Breitung (2000, 2002) tests reject the null hypothesis of common unit root for all series at all significance levels (Table 3). We reached the same conclusion when using Im-Pasaran-Shin, ADF Fisher and PP Fisher tests, with two exceptions. Namely for series GDP and LogGDP these tests suggested that null hypothesis of unit root with individual trend can’t be rejected. Contrary to the results of the above tests Hadri test and test based on heteroscedastic consistent Z-statistic reject for all series null hypothesis of stationarity. Possible reason why we are

V. Bilas: What is the Relationship Between FDI and Economic Growth? Evidence from EU15 CountriesZbornik Veleučilišta u Rijeci, Vol. 8 (2020), No. 1, pp. 253-281
261
getting such mixed results could be that these tests have lower power in case of the structural break in time series, which is evident in case of GDP and LogGDP series.
Therefore, because of the strong cross-sectional dependence for some of the series, results of the Pesaran CPIS tests are more reliable than the results of the first generation panel unit root tests. In summary, we may say that all series both in level and the first difference are I(0), with GDP and LogGDP being the only exception. These two series are considered to be I(1).
3. 2 Panel cointegration test (ARDL model)
Since unit root tests result suggested that GDP/LogGDP and FDI/LogFDI series are of different order of integration (I(1) and I(0) respectively), for these series cointegration tests based on ARDL model will be used.
The panel ARDL technique was selected to investigate the long-term and short-term cointegration correlations between GDP and FDI and extract the error correction version of the panel characteristics to identify the short-term dynamic. The panel ARDL method was preferred over more traditional cointegration techniques, such as Johansen (1991) cointegration test, because it could be used with the studied factors regardless of whether they were I(0), I(1), or both I(0) and I(1). Using panel ARDL, both long-term and short-term coefficients are provided at once.
This approach is based on the use of the panel form of ARDL model proposed by Pesaran and Shin (1999) and Pesaran Shin and Smith (2001). The asymptotic features of these panels are different from the traditional panels’ assumptions, with homogeneous slope parameters across the groups. They developed the pooled mean group (PMG) estimator, where the PMG assumes the combination of both pooling and averaging of the coefficients. In this respect, therefore, the intercept and slope parameters, and the error correction variances may all differ across the groups. To assess impact of the optimal lag length criteria on the ARDL results we have used both Akaike (1974) information criterion (AIC) and Schwarz (1978) information criterion (SIC). We have also estimated ARDL models for both original and logarithm transformation of the original series. Finally, ARDL models were estimated with two different trend specification: constant level and linear trend.
ARDL models based on logarithm transformation of the original series are preferred, for at least two reasons. First, most of the ARDL models estimated in literature are based on logarithm transformed series. Second, interpretation of the coefficients in such models is more intuitive. Coefficients in these models are elasticities, showing for how much will change the dependent variable for 1% change in independent variables. Therefore we are presenting all the results, but will comment only on those models with logarithm transformed series.

V. Bilas: What is the Relationship Between FDI and Economic Growth? Evidence from EU15 CountriesZbornik Veleučilišta u Rijeci, Vol. 8 (2020), No .1, pp. 253-281
262
Table 6. Panel ARDL (PMG) estimation (dependent variable: GDP)
VariableConstant Linear trend
Coefficient t-statistic P-value Coefficient t-statistic P-value
Long run equation
FDI 4.9547 4.83 <.01 1.9042 8.69 <.01
Short run equation
Cointegrating equation -0.0494 -1.37 .17 -0.2014 -2.42 .02
∆FDI 0.1038 0.66 .51 -0.0548 -0.43 .67
Trend 3.71E+09 1.42 .16
Constant 1.00E+11 1.40 .16 2.99E+11 2.09 .04
Note: Schwarz criterion (SIC) was used for optimal lag length selection. ARDL(1,1) model was selected.
Source: Author’s calculation
Table 7. Panel ARDL (PMG) estimation (dependent variable: GDP)
VariableConstant Linear trend
Coefficient t-statistic P-value Coefficient t-statistic P-value
Long run equation
FDI 4.8973 8.23 <.01 4.3829 6.71 <.01
Short run equation
Cointegrating equation -0.0700 -1.42 .16 -0.0873 -1.52 .13
∆GDP(-1) 0.1695 1.41 .16 0.0227 0.17 .87
∆GDP(-2) -0.2367 -2.94 <.01 -0.2943 -2.32 .02
∆GDP(-3) -0.0451 -0.54 .59
∆FDI 0.0932 0.33 .74 0.0598 0.23 .82
∆FDI(-1) 0.1950 0.83 .41 0.2609 0.96 .34
∆FDI(-2) 0.0042 0.02 .98 0.1826 0.66 .51
∆FDI(-3) -0.1089 -0.88 .38 0.0241 0.16 .87
Trend -1.03E+9 -0.89 .38
Constant 1.20E+11 1.20 .23 1.13E+11 1.40 .16Note: Akaike criterion (AIC) was used for optimal lag length selection. ARDL(3,4) model with constant and ARDL(4,4) model with trend were selected.
Source: Author’s calculation

V. Bilas: What is the Relationship Between FDI and Economic Growth? Evidence from EU15 CountriesZbornik Veleučilišta u Rijeci, Vol. 8 (2020), No. 1, pp. 253-281
263
Table 8. Panel ARDL (PMG) estimation (dependent variable: GDP)
VariableConstant Linear trend
Coefficient t-statistic P-value Coefficient t-statistic P-value
Long run equation
FDIP 9.51E+10 4.60 <.01 8.22E+10 8.13 <.01
Short run equation
Cointegrating equation -0.0448 -1.28 .20 -0.1280 -2.28 .02
∆FDIP -6.65E+8 -0.29 .77 -4.71E+9 -1.60 .11
Trend 2.68E+9 1.29 .20
Constant 9.26E+10 1.31 .19 1.98E+11 1.98 .05
Note: Schwarz criterion (SIC) was used for optimal lag length selection. ARDL(1,1) model was selected.
Source: Author’s calculation
Table 9. Panel ARDL (PMG) estimation (dependent variable: GDP)
VariableConstant Linear trend
Coefficient t-statistic P-value Coefficient t-statistic P-value
Long run equation
FDIP 8.98E+10 4.09 <.01 6.70E+10 7.00 <.01
Short run equation
Cointegrating equation -0.0424 -1.16 .25 -0.1408 -2.16 .03
∆GDP(-1) 0.1914 2.61 <.01 0.1735 2.90 <.01
∆FDIP -3.05E+8 -0.13 .90 -4.03E+9 -1.44 .15
Trend 3.35E+9 1.35 .18
Constant 8.78E+10 1.18 .24 2.27E+11 1.90 .06
Note: Akaike criterion (AIC) was used for optimal lag length selection. ARDL(2,1) model was selected.
Source: Author’s calculation

V. Bilas: What is the Relationship Between FDI and Economic Growth? Evidence from EU15 CountriesZbornik Veleučilišta u Rijeci, Vol. 8 (2020), No .1, pp. 253-281
264
Table 10. Panel ARDL (PMG) estimation (dependent variable: LogGDP)
VariableConstant Linear trend
Coefficient t-statistic P-value Coefficient t-statistic P-value
Long run equation
LogFDI 0.8026 0.14 .89 0.0292 7.34 <.01
Short run equation
Cointegrating equation -0.0005 -0.52 .61 -0.1643 -2.44 .02
∆LogFDI 0.0020 1.66 .10 -0.0021 -1.93 .05
Trend 0.0010 0.92 .36
Constant 0.0190 2.51 .01 4.4572 2.44 .02
Note: Schwarz criterion (SIC) was used for optimal lag length selection. ARDL(1,1) model was selected.
Source: Author’s calculation
Table 11. Panel ARDL (PMG) estimation (dependent variable: LogGDP)
VariableConstant Linear trend
Coefficient t-statistic P-value Coefficient t-statistic P-value
Long run equation
LogFDI 0.0321 1.73 .09 2.6923 0.05 .96
Short run equation
Cointegrating equation -0.0477 -2.27 .02 -0.0004 0.87 .39
∆LogGDP(-1) 0.2351 3.32 <.01 0.2094 2.99 <.01
∆LogFDI 0.0011 0.95 .34 0.0027 2.14 .03
Trend 0.0003 1.03 .30
Constant 1.2669 2.34 .02 0.0167 0.98 .33
Note: Akaike criterion (AIC) was used for optimal lag length selection. ARDL(2,1) model was selected.
Source: Author’s calculation

V. Bilas: What is the Relationship Between FDI and Economic Growth? Evidence from EU15 CountriesZbornik Veleučilišta u Rijeci, Vol. 8 (2020), No. 1, pp. 253-281
265
Table 12. Panel ARDL (PMG) estimation (dependent variable: LogGDP)
VariableConstant Linear trend
Coefficient t-statistic P-value Coefficient t-statistic P-value
Long run equation
LogFDIP 0.1226 3.74 <.01 0.4398 5.76 <.01
Short run equation
Cointegrating equation -0.0523 -1.95 .05 -0.0408 -1.71 .09
∆LogFDIP 0.0006 0.19 .85 -0.0064 -1.19 .23
Trend -0.0005 -0.49 .62
Constant 1.4660 1.95 .05 1.13 1.73 .09
Note: Schwarz criterion (SIC) was used for optimal lag length selection. ARDL(1,1) model was selected.
Source: Author’s calculation
Table 13. Panel ARDL (PMG) estimation (dependent variable: LogGDP)
VariableConstant Linear trend
Coefficient t-statistic P-value Coefficient t-statistic P-value
Long run equation
LogFDIP 0.1350 3.33 <.01 0.3245 4.87 <.01
Short run equation
Cointegrating equation -0.0595 -2.48 .01 -0.0443 -2.12 .04
∆LogGDP(-1) 0.2382 2.71 <.01 0.1460 2.07 .04
∆LogGDP(-2) -0.2855 -6.53 <.01
∆LogFDIP 0.0005 0.13 .90 -0.0034 -0.99 .32
Trend 1.58E-5 0.03 .98
Constant 1.65 2.44 .02 1.22 2.14 .04
Note: Akaike criterion (AIC) was used for optimal lag length selection. ARDL(3,1) model with constant and ARDL(2,1)
model with trend were selected.
Source: Author’s calculation
The coefficient of the error correction term (ECT) goes in line with the underlying convergence assumptions in order to validate the long-run equilibrium nature of the model. These include that the ECT be negative, significant, and less than one (Pesaran et al., 1999). We are commenting on the results of models based on Akaike information criterion presented in Tables 11 and 13. The reason is that the Schwarz information criterion tends to underestimate optimal lag length.

V. Bilas: What is the Relationship Between FDI and Economic Growth? Evidence from EU15 CountriesZbornik Veleučilišta u Rijeci, Vol. 8 (2020), No .1, pp. 253-281
266
For instance Akaike criterion suggested ARDL(3,1), while Schwarz criterion suggested ARDL(1,1) model. As a consequence of such underestimation there could be some residual autocorrelation. While Akaike information criterion tends to overestimate the optimal lag length, this has less serious consequence on the reliability of the estimated panel ARDL model.
The cointegrating equations (model with trend: –0.0443 and model with constant: –0.0595) in Table 13 explain that the rate of adjustment back to (long-run) equilibrium is 4.43% (model with trend) and 5.95% (model with constant) which are significant at 4% and 1 % significance level respectively. In the short-run, only the coefficients of each of LogGDP(–1) and LogGDP(–2) are each significantly related to LogGDP, at less than 1% significance level.
More mixed results are presented in Table 11 for LogFDI series. Here we have the cointegrating equation (model with constant: –0.0477) explains that the rate of adjustment back to (long-run) equilibrium is 4.77% which are significant at 2% significance level. However, the ECT in the model with trend is not statistically significant, though it is negative and less than one. In the short-run, only the coefficient of LogGDP(–1) is significantly related to LogGDP, at less than 1% significance level.
The panel ARDL is a long-run estimate of the equilibrium analysis, and therefore the long-run coefficients are usually given higher importance. The long-run coefficients are all positive, but not all of them are statistically significant. For instance the long-run coefficient for LogFDI (0.029) is statistically significant only in the model with trend (Table 9) but not in other models (Table 11). In case of LogFDIP series long-run coefficients are statistically significant in all four models in Tables 12 and 13, varying between 0.1226 and 0.4398. These coefficients indicate that 1% increase in LogFDIP (logarithm of FDI to GDP) increases LogGDP between 0.1226% and 0.4398%.
Therefore, the cointegration test based on panel ARDL (PMG) model confirm that there are long-term relationship between LogGDP, LogFDI and LogFDIP series in case of 15 “old” European Union countries for the period being investigated (2002-2018).
3. 3 Granger causality analysis
We tested whether there is a causal relationship among the variables using the panel Granger non-causality test developed by Dumitrescu and Hurlin (2012). The null hypothesis is that variable X does not homogeneously cause variable Y, against the alternative hypothesis that X does Granger-cause Y for at least one panel. Table 14 gives the results of this test.

V. Bilas: What is the Relationship Between FDI and Economic Growth? Evidence from EU15 CountriesZbornik Veleučilišta u Rijeci, Vol. 8 (2020), No. 1, pp. 253-281
267
Table 14. Dumitrescu-Hurlin panel causality test
Null hypothesis Decision*
rGDP does not Granger-cause FDI 2.58 4.34 (.07) 2.55 (.07) No causality
FDIP does not Granger-cause rGDP 1.50 1.36 (.31) 0.51 (.61) No causality
rGDP does not Granger-cause FDIP 2.46 4.01 (.09) 2.33 (.09) No causality
LogFDI does not Granger-cause ∆LogGDP 1.98 2.68 (.09) 1.52 (.10) No causality
∆LogGDP does not Granger-cause LogFDI 1.63 1.72 (.20) 0.83 (.27) No causality
LogFDIP does not Granger-cause ∆LogGDP 1.22 0.33 (.75) -0.15 (.92) No causality
∆LogGDP does not Granger-cause LogFDIP 2.46 3.99 (.04) 2.45 (.04) Causality
LogFDI does not Granger-cause LogGDP 1.66 1.82 (.26) 0.97 (.39) No causality
LogGDP does not Granger-cause LogFDI 2.30 3.55 (.09) 2.24 (.09) No causality
LogFDIP does not Granger-cause LogGDP 1.46 1.25 (.38) 0.56 (.56) No causality
LogGDP does not Granger-cause LogFDIP 1.66 1.82 (.40) 0.97 (.50) No causality
∆LogFDI does not Granger-cause ∆LogGDP 1.79 2.17 (.15) 1.56 (.28) No causality
∆LogGDP does not Granger-cause ∆LogFDI 1.64 1.77 (.01) 0.87 (.02) Causality
∆LogFDIP does not Granger-cause ∆LogGDP 1.13 0.36 (.77) -0.13 (.92) No causality
∆LogGDP does not Granger-cause ∆LogFDIP 1.89 2.42 (.13) 1.33 (.19) No causalityNote: P-values were computed using 100 bootstrap replications and provided in the brackets. BIC criterion used to
decide on the optimal number of lags. * Decision was made based on the 5% significance level.
Source: Author’s calculation
According to Table 14 there is no causal relationship between any two variables considered with only two exceptions. When investigated the causal relationship between GDP growth rate (∆LogGDP) and FDI growth rate (∆LogFDI) we can say that GDP growth rate cause FDI growth rate at least of 2% significance level, while FDI growth rate does not cause GDP growth rate. Thus, there is a unidirectional causal relationship between the GDP growth rate and FDI growth rate. Similarly, there is a unidirectional causal relationship between the GDP growth rate and LogFDI at 4% significance level.
Expectation is that if there is a cointegration between two series then they are also causally related. However, mixed results of cointegration test based on ARDL (PMG) model and the Dumitrescu-Hurlin panel causality test do not confirm this, which could be caused by lower power of these tests and weak relationship between series. Therefore we can say that there is only a weak evidence of the positive impact FDI has on GDP growth in the “old” European Union member countries.
4. CONCLUSION
The aim of this paper was to examine the relationship between FDI and economic growth in EU15 countries over the period 2002-2018. Based on the conducted analysis following conclusions can be drawn. Results of the Pesaran CIPS panel unit root test indicated that all series considered

V. Bilas: What is the Relationship Between FDI and Economic Growth? Evidence from EU15 CountriesZbornik Veleučilišta u Rijeci, Vol. 8 (2020), No .1, pp. 253-281
268
are stationary, i.e. I(0), with two exceptions. This test indicated that series GDP and LogGDP are with unit root, i.e. I(1). Since level of GDP series is I(1) and levels of FDI and FDIP are I(0) only the ARDL modelling approach to cointegration could be used, because this approach allows series to be different order of integration. Estimated panel ARDL (PMG) model found some evidence that there are long-run equilibrium between LogGDP, LogFDI and LogFDIP series. The rate of adjustment back to equilibrium is between 4.43% and 5.95%. The long-run coefficients are all positive, but not all of them are statistically significant. For instance the long-run coefficient for LogFDI (0.029) is statistically significant only in the model with trend, but not in other models. In case of LogFDIP series long-run coefficients are statistically significant in all four models, varying between 0.1226 and 0.4398. These coefficients indicate that 1% increase in LogFDIP (logarithm of FDI to GDP) increases LogGDP between 0.1226% and 0.4398%. Results of Dumitrescu-Hurlin panel causality test indicated that there is only unidirectional causal relationship from GDP growth rate to FDI growth rate, and from GDP growth rate to LogFDIP. There is no other causal relationship between any other two variables considered. Conclusively, there is only a weak evidence that FDI had statistically significant impact on the GDP in EU15 countries for the period being investigated. Despite its insights and accomplishments, this research has some limitations, for example number of variables which could have impact on FDI and GDP should be extended. Therefore, it is advised to include in future research other variables (for example, institutional quality, human capital, market size, unit labour costs, openness of the economy, etc.). There is also a need to extend the period of research and/or to use quarterly/monthly data if possible in order to increase the number of observations. Also, single-country studies are needed, due to the heterogeneous relationship between FDI and growth.
REFERENCES
Akaike, H. (1974) “A new look at the statistical model identification”, IEEE Transactions on Automatic Control, 19(6), pp. 716–723. http://dx.doi.org/10.1109/tac.1974.1100705
Alfaro, L., Chanda, A., Kalemli-Ozcan, S., Sayek, S. (2010) “Does Foreign Direct Investment Promote Economic Growth? Exploring the Role of Financial Markets on Linkages?” Journal of Development Economics, 91(2), pp. 242-256. http://dx.doi.org/10.1016/j.jdeveco.2009.09.004
Angelopoulou, A., Liargovas, P. (2014) “Foreign Direct Investment and Growth: EU, EMU, and Transition Economies”, Journal of Economic Integration, 29(3), pp. 470-495. http://dx.doi.org/10.11130/jei.2014.29.3.470
Bilas, V. (2007) “Regional economic integrations and capital movement – measuring the level of capital mobility”, Zbornik radova Ekonomskog fakulteta u Rijeci, 25(2), pp. 269-290
Borensztein, E., De Gregorio, J., Lee, J-W. (1998) “How does foreign direct investment affect economic growth?”, Journal of International Economics, 45(1998), pp. 115–135
Breitung, J. (2000). “The Local Power of Some Unit Root Tests for Panel Data,” in B. Baltagi (ed.), Advances in Econometrics, (15): Nonstationary Panels, Panel Cointegration, and Dynamic Panels, Amsterdam: JAI Press, pp. 161–178. http://dx.doi.org/10.1016/s0731-9053(00)15006-6
Breitung, J. (2002). “Nonparametric tests for unit roots and cointegration”, Journal of Econometrics, 108(2), pp. 343–363. http://dx.doi.org/10.1016/s0304-4076(01)00139-7

V. Bilas: What is the Relationship Between FDI and Economic Growth? Evidence from EU15 CountriesZbornik Veleučilišta u Rijeci, Vol. 8 (2020), No. 1, pp. 253-281
269
Carbonell, J. B., Werner, R. A. (2018) “Does Foreign Direct Investment Generate Economic Growth? A New Empirical Approach Applied to Spain”, Economic Geography, 94(4), pp. 425-456. http://dx.doi.org/10.1080/00130095.2017.1393312
Carstensen, K., Toubal, F. (2004) “Foreign direct investment in Central and Eastern European countries: a dynamic panel analysis”, Journal of Comparative Economics, 32(1), pp. 3–22. https://doi.org/10.1016/j.jce.2003.11.001
Chowdhury, A., Mavrotas, G. (2006) “FDI and Growth: What Causes What?”, The World Economy, 29(1), pp. 9-19. http://dx.doi.org/10.1111/j.1467-9701.2006.00755.x
De Mello, L. R. (1997) “Foreign direct investment in developing countries and growth: A selective survey”, The Journal of Development Studies, 34(1), pp. 1-34. http://dx.doi.org/10.1080/00220389708422501
De Mello, L. R. (1999) “Foreign direct investment-led growth: evidence from time series and panel data”, Oxford Economic Papers, 51(1), pp. 133-151. http://dx.doi.org/10.1093/oep/51.1.133
Dhakal, D., Mixon, F., Upadhyaya, K. (2007) “Foreign direct investment and transition economies: empirical evidence from a panel data estimator”, Economics Bulletin, 6(33), pp. 1-9
Dickey, D. A., Fuller, W. A. (1981) “Likelihood ratio statistics for autoregressive time series with a unit root”, Econometrica, 49(4), pp. 1057–1072. http://dx.doi.org/10.2307/1912517
Dickey, D. A., W. A. Fuller (1979) “Distribution of the Estimators for Autoregressive Time Series with a Unit Root”, Journal of the American Statistical Association, 74(366a), pp. 427–431. http://dx.doi.org/10.1080/01621459.1979.10482531
Dumitrescu, E. I., Hurlin, C. (2012) “Testing for Granger non-causality in heterogeneous panels”, Economic Modelling, 29(4), pp. 1450-1460. http://dx.doi.org/10.1016/j.econmod.2012.02.014
Ekananda, M., Parlinggoman, D. J. (2017) “The Role of High-Tech Exports and of Foreign Direct Investments (FDI) on Economic Growth”, European Research Studies Journal, XX(4A), pp. 194-212.
Gürsoy, F., Sekreter, A., Kalyoncu, H. (2013) „FDI and Economic Growth Relationship Based on Cross-Country Comparison“, International Journal of Economics and Financial Issues, 3(2), pp. 519-524
Hadri, K. (2000) “Testing for Stationarity in Heterogeneous Panel Data”, Econometric Journal, 3(2), pp. 148–161. http://dx.doi.org/10.1111/1368-423x.00043
Hlavacek, P., Bal-Domanska, B. (2016) “Impact of Foreign Direct Investment on Economic Growth in Central and Eastern European Countries”, Inzinerine Ekonomika-Engineering Economics, 27(3), pp. 294-303. http://dx.doi.org/10.5755/j01.ee.27.3.3914
Hunady, J., Orviska, M. (2014) “Determinants of Foreign Direct Investment in EU countries – Do Corporate Taxes Really Matter?”, Procedia Economics and Finance, 12, pp. 243-250. http://dx.doi.org/10.1016/s2212-5671(14)00341-4
Iamsiraroj, S., Doucouliagos, H. (2015) “Does growth attract FDI?”, Kiel Institute for the World Economy, Economics Discussion Papers, No. 2015-18. http://dx.doi.org/10.5018/economics-ejournal.ja.2015-19
Im, K. S., M. H. Pesaran, Y. Shin (2003) “Testing for Unit Roots in Heterogeneous Panels”, Journal of Econometrics, 115(1), pp. 53–74. http://dx.doi.org/10.1016/s0304-4076(03)00092-7
Iqbal, N., Ahmad, N., Haider, Z., Anwar, S. (2013) “Impact of foreign direct investment (FDI) on GDP: A Case study from Pakistan”, International Letters of Social and Humanistic Sciences, 16, pp. 73-80. http://dx.doi.org/10.18052/www.scipress.com/ilshs.16.73
Jirasavetakul, L-B. F., Rahman, J. (2018) “Foreign Direct Investment in New Member States of the EU and Western Balkans: Taking Stock and Assessing Prospects”, IMF Working Paper, 18(187), p.1. http://dx.doi.org/10.5089/9781484373323.001
Johansen, S. (1991) “Estimation and Hypothesis Testing of Cointegration Vectors in Gaussian Vector Autoregressive Models”, Econometrica, 59 (6), pp. 1551–1580. http://dx.doi.org/10.2307/2938278
Jude, C., Pop Silaghi, M. I. (2016) “Employment effects of foreign direct investment: New evidence from Central and Eastern European countries”, International Economics, 145(2016), pp. 32–49. https://doi.org/10.1016/j.inteco.2015.02.003

V. Bilas: What is the Relationship Between FDI and Economic Growth? Evidence from EU15 CountriesZbornik Veleučilišta u Rijeci, Vol. 8 (2020), No .1, pp. 253-281
270
Kersan-Skabic, I. (2013) “Institutional Development as a Determinant of FDI Attractiveness in Southeast Europe”, Drustvena istrazivanja, 22(2), pp. 215-235. http://dx.doi.org/10.5559/di.22.2.01
Kikerkova, I. et al. (2018) “Vector Error Correction Model on FDI and their Impact in the Republic of Macedonia”, Zagreb International Review of Economics & Business, 21(2), pp. 19-35. http://dx.doi.org/10.2478/zireb-2018-0012
Kurecic, P., Kozina, G. (2017) “The Correlation between the FDI and the GDP in the EU15 Member States in the period 1980-2014”, Tehnicki vjesnik, 24(2), pp. 521-524. http://dx.doi.org/10.17559/tv-20150920174332
Levin, A., Lin, C. F., Chu, C. (2002) “Unit Root Tests in Panel Data: Asymptotic and Finite-Sample Properties”, Journal of Econometrics, 108(1), pp. 1-24. http://dx.doi.org/10.1016/s0304-4076(01)00098-7
Mahmoodi, M., Mahmoodi, E. (2016) “Foreign direct investment, exports and economic growth: evidence from two panels of developing countries”, Economic Research-Ekonomska Istrazivanja, 29(1), pp. 938-949. http://dx.doi.org/10.1080/1331677x.2016.1164922
Ozturk, I. (2007) “Foreign Direct Investment - Growth Nexus: A Review of the Recent Literature”, International Journal of Applied Econometrics and Quantitative Studies, 4-2, pp. 79-98
Pesaran, M. H. (2007) “A simple panel unit root test in the presence of cross-section dependence”, Journal of Applied Econometrics, 22(2), pp. 265–312. http://dx.doi.org/10.1002/jae.951
Pesaran, M. H., Shin, Y. (1999) “An Autoregressive Distributed-Lag Modelling Approach to Cointegration Analysis,” in Strøm, S. (ed.) Econometrics and Economic Theory in the 20th Century: The Ragnar Frisch Centennial Symposium. Cambridge: Cambridge University Press (Econometric Society Monographs), pp. 371–413. http://dx.doi.org/10.1017/ccol521633230.011
Pesaran, M. H., Shin, Y., Smith, R. J. (2001) “Bounds testing approaches to the analysis of level relationships”, Journal of Applied Econometrics, 16(3), pp. 289-326. http://dx.doi.org/10.1002/jae.616
Rahaman, A., Chakraborty, S. (2015) “Effects of Foreign Direct Investment on GDP: Empirical Evidence from Developing Country”, Advances in Economics and Business, 3(12), pp. 587-592
Sârbu, M-A., Carp, L. (2015) “The Impact of Foreign Direct Investment on Economic Growth: The Case of Romania”, Economica, 11(4), pp. 127-137
Schmitt, D., Alexiou, C. (2016) “On the FDI-led Growth Hypothesis: Empirical Evidence from Ireland”, The Empirical Economics Letters, 15(2), pp. 135-144
Schwarz, G. E. (1978) “Estimating the dimension of a model”, The Annals of Statistics, 6 (2), pp. 461–464. http://dx.doi.org/10.1214/aos/1176344136
Sokang, K. (2018) “The Impact of Foreign Direct Investment on the Economic Growth in Cambodia: Empirical Evidence”, International Journal of Innovation and Economic Development, 4(5), pp. 31-38. http://dx.doi.org/10.18775/ijied.1849-7551-7020.2015.45.2003
Suliman, A. H., Elian, M. I., Ali, H. E. (2018) “Endogenous Specification of FDI and Economic Growth: Cross-Economies’ Evidence”, International Journal of Business, 23(1), pp. 89-109
Tang, D. (2015) “Has the Foreign Direct Investment Boosted Economic Growth in the European Union Countries?”, Journal of International and Global Economic Studies, 8(1), pp. 21-50
UNCTAD (2018) World Investment Report 2018. New York and Geneva: United Nations
UNCTAD (2019) World Investment Report 2019. New York and Geneva: United Nations

V. Bilas: What is the Relationship Between FDI and Economic Growth? Evidence from EU15 CountriesZbornik Veleučilišta u Rijeci, Vol. 8 (2020), No. 1, pp. 253-281
271
ANNEX 1. LINE GRAPHS
Line graphs for all variables in Table 1 are presented in Figures 1 to 12. The first three figures show the first three series: GDP, FDI and FDIP, the next three annual growth rates, then three natural logarithm series, and the last three figures display the first difference of the logarithm series.
Graph 1. GDP time series

V. Bilas: What is the Relationship Between FDI and Economic Growth? Evidence from EU15 CountriesZbornik Veleučilišta u Rijeci, Vol. 8 (2020), No .1, pp. 253-281
272
Graph 2. FDI time series
Graph 3. FDIP time series

V. Bilas: What is the Relationship Between FDI and Economic Growth? Evidence from EU15 CountriesZbornik Veleučilišta u Rijeci, Vol. 8 (2020), No. 1, pp. 253-281
273
Graph 4. GDP growth rate
Graph 5. FDI growth rate

V. Bilas: What is the Relationship Between FDI and Economic Growth? Evidence from EU15 CountriesZbornik Veleučilišta u Rijeci, Vol. 8 (2020), No .1, pp. 253-281
274
Graph 6. FDIP growth rate
Graph 7. LogGDP time series

V. Bilas: What is the Relationship Between FDI and Economic Growth? Evidence from EU15 CountriesZbornik Veleučilišta u Rijeci, Vol. 8 (2020), No. 1, pp. 253-281
275
Graph 8. LogFDI time series
Graph 9. LogFDIP time series

V. Bilas: What is the Relationship Between FDI and Economic Growth? Evidence from EU15 CountriesZbornik Veleučilišta u Rijeci, Vol. 8 (2020), No .1, pp. 253-281
276
Graph 10. ∆GDP time series
Graph 11. ∆FDI time series

V. Bilas: What is the Relationship Between FDI and Economic Growth? Evidence from EU15 CountriesZbornik Veleučilišta u Rijeci, Vol. 8 (2020), No. 1, pp. 253-281
277
Graph 12. ∆FDIP time series
Graph 13. ∆rGDP time series

V. Bilas: What is the Relationship Between FDI and Economic Growth? Evidence from EU15 CountriesZbornik Veleučilišta u Rijeci, Vol. 8 (2020), No .1, pp. 253-281
278
Graph 14. ∆rFDI time series
Graph 15. ∆rFDIP time series

V. Bilas: What is the Relationship Between FDI and Economic Growth? Evidence from EU15 CountriesZbornik Veleučilišta u Rijeci, Vol. 8 (2020), No. 1, pp. 253-281
279
Graph 16. ∆LogGDP time series
Graph 17. ∆LogFDI time series

V. Bilas: What is the Relationship Between FDI and Economic Growth? Evidence from EU15 CountriesZbornik Veleučilišta u Rijeci, Vol. 8 (2020), No .1, pp. 253-281
280
Graph 18. ∆LogFDIP time series

V. Bilas: What is the Relationship Between FDI and Economic Growth? Evidence from EU15 CountriesZbornik Veleučilišta u Rijeci, Vol. 8 (2020), No. 1, pp. 253-281
281
Prethodno priopćenje https://doi.org/10.31784/zvr.8.1.8 Datum primitka rada: 3. 12. 2019. Datum prihvaćanja rada: 30. 1. 2020.
KOJA JE POVEZANOST IZMEĐU INOZEMNIH IZRAVNIH ULAGANJA I EKONOMSKOG RASTA?
PRIMJER ZEMALJA EU15Vlatka Bilas
Dr. sc., redovita profesorica, Sveučilište u Zagrebu, Ekonomski fakultet, Katedra za međunarodnu ekonomiju, Trg J. F. Kenedyja 6, 10 000 Zagreb, Hrvatska;
e-mail: [email protected]
SAŽETAK
Cilj rada je istražiti povezanost inozemnih izravnih ulaganja (FDI) i ekonomskog rasta u zemljama EU15 tijekom razdoblja 2002-2018. EU15 čini skupina zemalja koje su ušle u Europsku uniju prije najvećeg proširenja 2004. godine, a posljednji put 1995. godine (Austrija, Belgija, Danska, Finska, Francuska, Njemačka, Grčka, Irska, Italija, Luksemburg, Nizozemska, Portugal, Španjolska, Švedska i Ujedinjeno Kraljevstvo). Zaključci iz rada doprinose postojećoj literaturi o utjecaju inozemnih izravnih ulaganja na ekonomski rast. U radu se koriste testovi jediničnih korijena, testovi panel kointegracije (ARDL model) i Grangerova uzročnost. Prema procijenjenom ARDL modelu postoji dugotrajna ravnoteža između LogGDP, LogFDI i LogFDIP (logaritam udjela FDI u BDP-u) serija. Stopa prilagođavanja vraćanja u ravnotežu je između 4,43% i 5,95%. Svi koeficijenti su pozitivni u dugom roku, ali nisu svi statistički značajni. U slučaju LogFDIP serije, koeficijenti su statistički značajni i variraju između 0,1226 i 0,4398. Ti koeficijenti pokazuju da porast LogFDIP od 1% povećava LogGDP između 0,1226% i 0,4398% u dugom roku. Rezultati Dumitrescu-Hurlin testa uzročnosti pokazali su kako postoji samo jednosmjerna uzročna veza od stope rasta BDP-a i stope rasta FDI te stope rasta BDP-a prema LogFDIP. Zaključno, postoje slabi dokazi da su inozemna izravna ulaganja imala statistički značajan utjecaj na BDP u zemljama EU15.
Ključne riječi: testovi jediničnih korijena, testovi kointegracije, Grangerova uzročnost, EU15
Creative Commons Attribution – NonCommercial 4.0 International License


V. Šarlija, V. Buterin, D. Buterin: Utjecaj sezonskih oscilacija na kretanje cijene dionica u sektoru turizmaZbornik Veleučilišta u Rijeci, Vol. 8 (2020), No. 1, pp. 283-293
283
Prethodno priopćenje https://doi.org/10.31784/zvr.8.1.19 Datum primitka rada: 13. 1. 2020. Datum prihvaćanja rada: 3. 2. 2020.
UTJECAJ SEZONSKIH OSCILACIJA NA KRETANJA CIJENE DIONICA U SEKTORU TURIZMA
Vedran Šarlija Stručni specijalist poduzetništva, 51 000 Rijeka, Hrvatska; e-mail: [email protected]
Vesna Buterin Dr. sc., docentica, Sveučilište u Rijeci, Ekonomski fakultet Rijeka, Ivana Filipovića 4, 51 000 Rijeka, Hrvatska;
e-mail: [email protected]
Denis Buterin Mr. sc., viši predavač, Veleučilište u Rijeci, Trpimirova 2/V, 51 000 Rijeka, Hrvatska; e-mail: [email protected]
SAŽETAKTurizam i djelatnosti povezane s turizmom značajan su čimbenik hrvatskog gospodarstva, s jasnim naznakama nastavka takvih trendova i u budućnosti. Istraživanja pokazuju kako se udio turizma u hrvatskom bruto domaćem proizvodu povećao, a sve su više primjetna nastojanja za podizanjem kvalitete turističke ponude i produžavanja turističke sezone. Nositelji takvih inicijativa od kojih se očekuju povećani povrati u dugom roku zasad su uglavnom turistička poduzeća s najvećim financijskim potencijalom. U ovom radu autori istražuju je li kretanje cijene dionica takvih trgovačkih društava povezano s povećanim prihodima u vrijeme sezone, odnosno je li kretanje cijene povezano sa sezonskim oscilacijama ili je povezano s njihovom dugoročnom poslovnom politikom. Istraživanje je pokazalo da sezonske promjene imaju određeni utjecaj, ali nedovoljan da značajnije determiniraju kretanje cijene vrijednosnica na financijskom tržištu promatranih poduzeća. Unatoč značajnom povećanju prihoda, trend je silazan, a naznake njegovog obrata u kratkom i srednjem roku nisu uočene, što može ukazivati na nepovjerenje ulagača u takav oblik razvoja turističkih poduzeća.
Ključne riječi: financijska tržišta, turizam, tehnička analiza
1. UVOD
U središtu promatranja tehničke analize je kretanje cijene dionice i volumena prodaje kroz određene vremenske periode (Mishkin, 2005). Svrha provođenja tehničke analize je pravovremeno otkrivanje trenda ili smjera kretanja cijene dionice te predviđanje budućih događanja na financijskom tržištu sa svrhom potpore pri donošenju odluka o načinu i smjeru djelovanja na financijskim tržištima (Galetić et al, 2007). Da izračuni u tehničkoj analizi služe za mjerenje tržišnog trenda radi pravovremenog
Creative Commons Attribution – NonCommercial 4.0 International License

V. Šarlija, V. Buterin, D. Buterin: Utjecaj sezonskih oscilacija na kretanje cijene dionica u sektoru turizmaZbornik Veleučilišta u Rijeci, Vol. 8 (2020), No. 1, pp. 283-293
284
uključivanja u smjer trenda smatra i Schwager (1996). Suštinu tehničke analize moglo bi se sažeti u zaključak da je svrha njezine primjene shvaćanje tržišta prije obrata njegovih trendova (Kostolany, 1998). Premda na kretanja na financijskom tržištu značajno utječu i sentimenti sudionika povezani s vanjskim utjecajima, tehnička ih analiza isključuje kao što isključuje i ostale čimbenike koji bi se u drugim uvjetima i u drugačijim analizama mogli smatrati relevantnima (Shim et al, 2017). Tehnička analiza isključuje i učinke prelijevanja koji su na financijskim tržištima jače izraženi u vremenima krize (Živkov et al, 2018). Međutim, takvi se čimbenici često koriste kad se primjenjuje ex post tehnička analiza te kada se pokazatelji i trendovi i pripadajuća kretanja cijena i volumena prodaje uspoređuju s vanjskim i unutarnjim utjecajima za koje se pretpostavlja da bi mogli imati značajan utjecaj na cjenovna kretanja. Za ex post analizu u ovom radu odabrana su tri turistička trgovačka društva čije dionice kotiraju na vodećem i redovitom tržištu Zagrebačke burze: Plava laguna, Maistra i Valamar Riviera. Radi se o trgovačkim društvima koja raspolažu respektabilnim financijskim potencijalom i čiji se temeljni kapital kreće u rasponu od 1,3 do 1,7 milijardi kuna te o trgovačkim društvima koja posljednjih godina investiraju značajna sredstva u poboljšanje vlastitih kapaciteta. Uz to, upravo je sezonski karakter obavljanja turističke djelatnosti presudan za zapaženi porast prihoda u određenim ljetnim mjesecima što utječe na segmente ulagača, a time i na pojačanu potražnju i pozitivne cjenovne pomake. Treba ipak imati na umu da premda postoje autori koji hrvatsko tržište vrijednosnih papira, odnosno Zagrebačku burzu smatraju modernim tržištem uređenim u skladu sa stečevinama Europske unije, ipak je ono nedovoljno razvijeno, odnosno usko zbog malog broja ulagača i plitko zbog malog broja naloga koji bi bili u stanju dovesti do značajnijih pomaka cijena i burzovnih indeksa te je posljedično nedovoljno likvidno i ne sasvim efikasno (Schabek et al, 2019; Olgić Draženović et al, 2016). Takva situacija očekivani je nastavak višedesetljetnog sustava krutog kreditno- distributivnog sustava financiranja uz veliku ulogu bankovnog aparata (Olgić Draženović et al, 2018). Iako rezultate provedene ex post tehničke analize promatranih poduzeća treba sagledavati u okviru trenutne situacije na Zagrebačkoj burzi, oni ipak daju odgovor na pitanje utjecaja sezonskih oscilacija na kretanje cijene.
2. POKAZATELJI TEHNIČE ANALIZE ODABRANIH TURISTIČKIH PODUZEĆA (MAIS, PLAG, RIVP)
2. 1 Trendovi
Vremenski se trendovi klasificiraju u tri kategorije: glavni, koji je duži od jedne godine, srednjoročni koji traje do šest mjeseci te kratkoročni, od dva do tri mjeseca. Trend predstavlja smjer kretanja cijene dionice, a može se podijeliti na padajući odnosno medvjeđi, rastući odnosno bikovski te horizontalni ili, češće nazivan, bez trenda (Maričić, 2011). Iako je fundamentalna analiza osnova za procjenu vrijednosti dionica poduzeća i donošenje investicijskih odluka (Prohaska et al, 2011), tehnička analiza bitan je alat za kratkoročne i dugoročne analize trendova na financijskim tržištima i u brojnim slučajevima pruža upotrebljivije rezultate od fundamentalne analize (Lazibat i Matić, 2002).

V. Šarlija, V. Buterin, D. Buterin: Utjecaj sezonskih oscilacija na kretanje cijene dionica u sektoru turizmaZbornik Veleučilišta u Rijeci, Vol. 8 (2020), No. 1, pp. 283-293
285
Grafikon 1. Analiza trendova dionica MAIS, PLAG, RIVP
Izvor: Investing (2019)

V. Šarlija, V. Buterin, D. Buterin: Utjecaj sezonskih oscilacija na kretanje cijene dionica u sektoru turizmaZbornik Veleučilišta u Rijeci, Vol. 8 (2020), No. 1, pp. 283-293
286
Promatrajući grafičke prikaze kretanja trenda dionica turističkih poduzeća Maistra d. d., Plava Laguna d. d. te Valamar Riviera d.d. vidljive su sličnosti u kretanju vrijednosti dionica poduzeća na tržištu vrijednosnica. Sve tri vrijednosnice imaju rastući trend u promatranom razdoblju s početkom promatranja trenda u lipnju 2016. godine. Obrat kretanja smjera trenda se događa u kratkom vremenskom periodu za sve promatrane dionice. Uzlazni trend dionice MAIS promatran je u razdoblju od 498 dana te je u tom vremenskom periodu vrijednost dionice porasla s 207,08 kn po dionici na 301,00 kn što je povećanje od 93,92 kn po dionici odnosno 45,35%. Najviša postignuta cijena dionice za vrijeme uzlaznog trenda je 338,45 kn. Razdoblje uzlaznog trenda završava 7. 11. 2017. kada započinje razdoblje bez trenda. U tom razdoblju dolazi do povremenog smanjivanja vrijednosti dionice, ali se cijena redovito ponovno vraća na početnu razinu. Razdoblje s neizraženim trendom traje 335 dana, odnosno do kraja promatranog razdoblja što je vidljivo iz grafičkog prikaza.
Uzlazni trend dionice PLAG promatran je u razdoblju od 548 dana. U tom razdoblju se cijena po dionici povećala sa 1 100,00 kn na 1 870,00 kn po dionici. U promatranom razdoblju dolazi do povećanja vrijednosti dionice za 770,00 kn po dionici odnosno izraženo u postotku povećanje od 70 %. Silazni trend te period medvjeđeg tržišta promatran je u razdoblju od 272 dana kada se cijena dionice smanjila sa 1 870,00 kn po dionici na 1 700,00 kn po dionici što je promjena od 170,00 kn ili u postotku 9,10 %. Promatrajući potez dijeljenja dionice te smanjenja cijene dionice sa 4 465,00 kn na 1 088,00 kn po dionici uočljiv je nastavak dugoročnog uzlaznog trenda na nižoj razini cijene. Nadalje, vidljivo je značajno povećanje trgovine dionicom što je dodatno potaknulo rast njene vrijednosti na tržištu. Uzlazni trend dionice RIVP traje 445 dana. Cijena vrijednosnice bila je 23,93 kn na početku uzlaznog trenda te se podigla na najvišu razinu od 48,00kn po vrijednosnici u promatranom razdoblju. Cijena se povećala za 24,07 kn po vrijednosnici odnosno izraženo u postotku 100,53 %. Završetkom uzlaznog trenda slijedi obrat tržišta te silazni trend čije je trajanje do kraja promatranog razdoblja odnosno na grafičkom prikazu 417 dana te je također dugoročni trend. Tržište je medvjeđe te vrijednosnice bilježe smanjenje vrijednosti na tržištu i to sa 48,00 kn na 37,80 kn. Vrijednost dionice se smanjila za 10,20 kn što u postotku iznosi 21,25 %.
Na grafikonu 1 označeni su vremenski periodi trajanja turističke sezone u područjima djelovanja promatranih turističkih poduzeća. Vidljivi su porasti cijena dionica u istaknutim vremenskim periodima, ali rast ne prestaje po isteku perioda već se kontinuirano nastavlja. Utjecaj sezonskih oscilacija nema snagu utjecaja na kretanje vrijednosti dionica na tržištu. Utjecaj sezonskih oscilacija na dionice je ograničen drugim čimbenicima određivanja vrijednosti dionica na financijskim tržištima. Povoljni utjecaj mogu doprinijeti pozitivnom smjeru kretanja cijena na tržištu kao što negativni utjecaju mogu doprinijeti negativnim kretanjima smjera dionica no nemaju dovoljnu snagu kako bi promijenili kontinuirani smjer kretanja vrijednosti dionica na financijskim tržištima.
2. 2 Pomični prosjeci
Pomični prosjek u tehničkoj analizi je pokazatelj koji se koristi kako bi se slijedili trendovi i pravovremeno predvidjele promjene njihova smjera. Svrha analize pomičnih prosjeka je identificirati i signalizirati početak novog trenda ili obrat postojećeg trenda (Edwards et al, 2007). Oni predstavljaju prosjeke određenog skupa podataka (Prohaska, 1997).

V. Šarlija, V. Buterin, D. Buterin: Utjecaj sezonskih oscilacija na kretanje cijene dionica u sektoru turizmaZbornik Veleučilišta u Rijeci, Vol. 8 (2020), No. 1, pp. 283-293
287
Grafikon 2. Pomični prosjeci dionica MAIS, PLAG, RIVP
Izvor: Investing (2019)
Pomični prosjeci dionica promatrani su u razdoblju od 35, 50 i 120 dana. Promatrani prosjeci od 35 i 50 pokazuju ranije signale promjene na tržištu dok pomični prosjek od 120 daje kasnije, ali točnije signale. Presijecanje pomičnih prosjeka u tri točke potvrđuje obrat tržišta te promjenu smjera kretanja trenda. Promatrajući dionicu MAIS vidljiva su česta te naglašena presijecanja prosjeka s kraćim vremenskim intervalom do čega su dovele veće promjene u vrijednosti dionice u kratkom periodu. Najizraženija su zadnja dva presijecanja prije obrata tržišta i presijecanja svih triju pomičnih prosjeka. Promatrajući kretanje pomičnih prosjeka dionica PLAG I RIVP uočavaju se manje amplitude zbog manje izraženih razina promjena cijene dionica. U silaznom trendu promatranih dionica vidljivo je kretanje prosjeka u vrlo malim razmacima bez naglih oscilacija određenog pomičnog prosjeka. Kreću se kontinuiranim tokom, dok pomični prosjeci kod dionice MAIS imaju izražajnije amplitude razdoblja bez izraženog trenda za razliku od ostalih promatranih dionica kojima je trend silazan.
2. 3 Analiza momentuma
Kod analize oscilatora, momentumom se mjeri brzina cjenovnih promjena tako da se cijene za određeno fiksno razdoblje neprekidno oduzimaju. Momentum je osnovni oblik analize oscilatora, a njime se mjeri razlika između cijena u dva vremenska razdoblja (Murphy, 2007). Promatranjem

V. Šarlija, V. Buterin, D. Buterin: Utjecaj sezonskih oscilacija na kretanje cijene dionica u sektoru turizmaZbornik Veleučilišta u Rijeci, Vol. 8 (2020), No. 1, pp. 283-293
288
kretanja linije momentuma može se uočiti ubrzava li rastući trend ili su kapitalni dobici jednaki onima iz prethodnog razdoblja te započinje li silazni trend. Za učinkovitije prepoznavanje obrata trenda potrebno je koristiti duži momentum.
Grafikon 3. Momentumi dionica MAIS, PLAG, RIVP
Izvor: Investing (2019)
Na grafikonu 3 linijski je prikazano usporedno kretanje cijene dionica na tržištu kroz promatrano razdoblje. Vidljivo je kako u određenim vremenskim periodima dionice različitih poduzeća ostvaruju rast vrijednosti u sličnoj mjeri te slijede uzlazni trend što obilježava bikovsko tržište. Može se reći kako sektor turizma ostvaruje rast vrijednosti poduzeća na financijskom tržištu. Završetkom uzlaznog trenda dolazi do razilaženja i neravnomjernog kretanja vrijednosti dionica promatranih poduzeća. Dolazi do obrata tržišta na medvjeđe i mijenja se smjer kretanja trenda. Dionica MAIS i RIVP počinju istovremeno gubiti na vrijednosti dionice s tim da je smanjenje vrijednosti izražajnije kod dionice MAIS koja se kroz vremenski period vraća na prethodnu razinu te njezin trend ostaje neizražen dok dionica RIVP na početku postiže manje smanjenje vrijednosti koje se kontinuirano nastavlja bez naznaka obrata te trend ostaje negativan. Dionica poduzeća PLAG ostvarila je duži vremenski rast od ostalih promatranih poduzeća tako da se obrat dogodio nešto kasnije nakon čega slijedi kontinuirani pad vrijednosti. Promatrajući momentume poduzeća koji su promatrani u vremenskim periodima od 14, 35 i 50 dana primjećuju se sličnosti između snage trenda određene promatrane dionice. Za vrijeme bikovskog tržišta momentum je izražajniji te ukazuje na jačanje uzlaznog trenda u određenim vremenskim periodima. Momentumi ukazuju na jačanje snage uzlaznog trenda dionica PLAG i RIVP na početku uzlaznog razdoblja. Primjećuje

V. Šarlija, V. Buterin, D. Buterin: Utjecaj sezonskih oscilacija na kretanje cijene dionica u sektoru turizmaZbornik Veleučilišta u Rijeci, Vol. 8 (2020), No. 1, pp. 283-293
289
se kako momentum od 14 ima vrlo izražene promjene u smjeru kretanja krivulje što je uzrokovano naglim promjenama u cijeni koje utječu na momentum te se promatraju duži momentumi kako bi se postigla relevantnost informacija. Momentumi od 35 i 50 kreću se sličnim putanjama te dobivaju na snazi u sličnim vremenskim periodima. Momentum dionice MAIS nešto kasnije od ostalih dobiva na snazi uzlaznog trenda koji je slabije izražen jer je rast kontinuiran u manjim stopama. Završetkom bikovskog tržišta svi promatrani momentumi se kreću uz linije cijene bez većih oscilacija. Tržišni trend je stagnirajući ili negativan, ali njegova snaga nije naročito naglašena što se iz grafikona prilično jasno može vidjeti.
2. 4 Indeks relativne snage
U analizi oscilatora, često je korišten i indeks relativne snage koji umanjuje distorzije koje se kod naglih promjena cijene javljaju kod momentuma. Indeks relativne snage fiksira momentum u raspon od 0 do 100 (Agram brokeri, 2008). U interpretaciji indeksa relativne snage postoji problem takozvanog neuspješnog zamaha, koji se odnosi na slučajeve kada je indeks ispod 30 ili 70 bodova, odnosno kada u rastućem trendu vrh indeksa relativne snage ne uspije premašiti prethodni vrh te kada doseže niže dno od prethodnog. Ako je trend padajući, proces je obrnut: novi vrhovi i nova dna viša su od prethodnih (Šarlija et al, 2019).
Grafikon 4. Indeks relativne snage dionica MAIS, PLAG, RIVP
Izvor: Investing (2019)

V. Šarlija, V. Buterin, D. Buterin: Utjecaj sezonskih oscilacija na kretanje cijene dionica u sektoru turizmaZbornik Veleučilišta u Rijeci, Vol. 8 (2020), No. 1, pp. 283-293
290
Promatrajući RSI dionica zaključuje se kako dionice imaju sličnosti u kretanju RSI oscilatora. Početkom uzlaznog trenda dolazi do povećane potražnje za dionicama što se vidi na grafovima indeksa relativne snage gdje linija premašuje gornju granicu raspona kod sve tri dionice. Nakon proboja gornje granice dolazi do pada te se linija počinje spuštati prema donjoj granici oscilatora, ali samo kod dionice RIVP ona dotiče donju granicu raspona dok kod dionica MAIS i PLAG ona ima blaži pad nakon čega slijedi ponovni rast. Pokazatelj dionice MAIS prelazi još jednom gornju granicu raspona te se nakon toga kreće unutar raspona sve do silaznog trenda pred kraj promatranog razdoblja kada prelazi donju granicu raspona. Dionice PLAG i RIVP imaju izražajnije promjene u dužem periodu u odnosu na prethodnu dionicu, ali i kod tih dionica se primjećuje zaokret tržišta a pred kraj razdoblja njihove linije indeksa relativne snage se kreću uz donju granicu raspona te imaju tendenciju prelaska donje granice.
2. 5 MACD pokazatelj
Oscilator MACD (Moving average convergence/divergence) pokazuje odnos između dvaju pomičnih prosjeka cijena, a služi za otkrivanje promjena u snazi, pravcu, momentumu i trajanju trenda (Eric et al, 2009). Brža MACD linija rezultat je dvaju eksponencijalno vaganih pomičnih prosjeka zaključnih cijena, dok sporija odnosno signalna linija predstavlja eksponencijalno vagani prosjek u posljednjih 9 razdoblja (Murphy, 2007).
Grafikon 5. MACD pokazatelj dionica MAIS, PLAG, RIVP
Izvor: Investing (2019)

V. Šarlija, V. Buterin, D. Buterin: Utjecaj sezonskih oscilacija na kretanje cijene dionica u sektoru turizmaZbornik Veleučilišta u Rijeci, Vol. 8 (2020), No. 1, pp. 283-293
291
Promatranjem MACD oscilatora za dionice vidljivo je smanjenje raspona amplituda s odmakom vremenskog perioda. U razdoblju bikovskog tržišta amplitude su veće te su razlike u cijeni izraženije a kupovni i prodajni signali naglašeniji u kraćim razdobljima. Presijecanje linije MACD i signalne linije najavljuje obrat kretanja cijene što se vidi iz grafičkih prikaza. Dionica MAIS u periodu uzlaznog trenda iskazuje sličnosti s kretanjima ostalih promatranih dionica na tržištu što nije slučaj nakon promjene tržišta jer dionica ima neizražen trend te se linija signala i MACD kreću paralelno uz manje promjene u kojima se presijecaju. Dionice PLAG i RIVP imaju izražajnije amplitude i za vrijeme medvjeđeg tržišta u fazi silaznog trenda što je vidljivo na grafikonu 5 te vrijednosno u promjenama cijene tijekom promatranog vremenskog razdoblja.
3. ZAKLJUČAK
Promatrajući duži vremenski period vidljiva je promjena na tržištu koja se odrazila na cijene dionica. Upotrebom alata za provođenje ex post analize dobiveni su rezultati koji su korišteni u donošenju konačnih zaključaka. Kretanjem trendova na tržištu može se utvrditi pozitivni trend u prvom dijelu promatranog razdoblja te bikovsko tržište i pozitivan smjer kretanja cijena dionica. Uvjeti na tržištu bili su vrlo povoljni za ulaganje te su razlike u cijeni bile izražajnije. U kratkom vremenskom periodu dolazi do obrata tržišta te sve promatrane dionice mijenjaju smjer kretanja trenda. Dionica MAIS ostaje s neizraženim trendom dok dionice PLAG I RIVP imaju negativan trend. Promatranjem pomičnih prosjeka nisu vidljive naznake promjene trenda u kratkom i srednjem roku kao ni promjene na tržištu. Pomični prosjeci se kreću kontinuiranim putanjama bez naglih odstupanja. Promatranjem momentuma vidljiva su izražajnija kretanja u uzlaznom trendu dok u fazi silaznog trenda momentumi nemaju veliku snagu što potvrđuje blagi pad na tržištu bez tendencija naglih promjena. Indeksi relativne snage se kreću uz donje razine promatranih raspona. Indeks relativne snage umanjuje distorzije momentuma te se može promatrati s većom vjerodostojnošću. MACD oscilator nakon uzlazne faze s naglašenim amplitudama te izraženim signalima i promjenama u vrijednosti slabi te nema naglašene promjene kao i jako izražene signale. Promatranjem perioda turističke sezone u usporedbi s primijenjenim pokazateljima vidljivo je kako je turistička sezona samo jedan od čimbenika utjecaja na cijene dionica turističkih poduzeća na financijskim tržištima te kako ustvari veći broj čimbenika utječe na formiranje cijene kao i smjer kretanja cijene. Promatrajući turistička poduzeća te kretanje dionica na financijskim tržištima zaključuje se kako je tržište u silaznoj fazi te dolazi do smanjenja vrijednosti. Nisu uočene naznake obrata tržišta u kratkom i srednjem roku te se pretpostavlja daljnji smjer kretanja kontinuiranim trenutnim tokom bez većih oscilacija te naglih zaokreta u vrijednostima dionica turističkih poduzeća na financijskim tržištima. Zaključno, uzimajući u obzir ograničenja malog uzorka i stanja na hrvatskom tržištu vrijednosnih papira, može se reći kako povoljne sezonske oscilacije zasad nemaju značajnijeg utjecaja na kretanje cijene dionica vrijednosnih papira.
* Ovaj rad je financiralo/sufinanciralo Sveučilište u Rijeci projektima uniri-drustv-18-27 i uniri-drustv-18-61.

V. Šarlija, V. Buterin, D. Buterin: Utjecaj sezonskih oscilacija na kretanje cijene dionica u sektoru turizmaZbornik Veleučilišta u Rijeci, Vol. 8 (2020), No. 1, pp. 283-293
292
LITERATURAAgram brokeri (2008) Uvod u tehničku analizu, Zagreb, Agram brokeri
Edwards D. R., Magee J., Bassetti W. H. C. (2007) Technical analysis of stock trends 9th edition, New York: Taylor &Francis Group
Ekonomski institut, Zagreb (2013), Sektorske analize, Turizam, 2, 19, ur. Božić, Lj.
Ekonomski institut, Zagreb (2018), Sektorske analize, Turizam, 7, 65, ur. Rašić Bakarić, I.
Eric, D., Andjelic, G., Redzepagic, S. (2009) „Application of MACD and RVI indicators as functions of investment strategy optimization on the financial market“. U: Zbornik radova Ekonomskog fakulteta u Rijeci, 27(1), p. 171-196
Galetić, F., Herceg, T., Morić Milovanović, B. (2007) „Mikroekonomska analiza tržišta hrvatskih dioničkih investicijskih fondova“, U: Zbornik Ekonomskog fakulteta u Zagrebu, 5(1), p. 431-437
https://www.investing.com/equities/plava-laguna-dd (30.11.2019.)
https://www.investing.com/equities/maistra-dd (30.11.2019.)
https://www.investing.com/equities/valamar-riviera-dd (30.11.2019.)
Kostolany, A. (1998), Izazovi burze, Zagreb: LMN
Lazibat, T., Matić, B. (2002), “Fundamentalna i tehnička analiza cijena na terminskim tržištima, Ekonomski pregled“ U: Ekonomski pregled, 53(5-6), 507-524
Maričić, Z., (2011) „Forex - karakteristike, trgovanje, tehnička i fundamentalna analiza“. U: Zbornik radova Međimurskog veleučilišta u Čakovcu, 2(1), 55-68
Mishkin, F. S. (2010), Ekonomija novca, bankarstva i financijskih tržišta, Zagreb, Mate
Murphy, J. J. (2007), Tehnička analiza financijskih tržišta: sveobuhvatni vodič za trgovinske metode i njihovu primjenu, Zagreb: Masmedia
Olgić Draženović, B., Maradin, D., Buterin, V. (2016), Tax framework of Croatian financial system, 5th International Scientific Symposium “Economy of Eastern Croatia - Vision and Growth”, procceedings / Mašek Tonković, A., Sveučilište Josipa Jurja Strossmayera u Osijeku, Ekonomski fakultet Osijek, 2016, 1060-1068
Olgić Draženović, B., Buterin, V., Buterin, D. (2018), Strukturne reforme zemalja CEE u tranzicijskom razdoblju – pouke i zaključci, Zbornik Veleučilišta u Rijeci, Vol, 6, No. 1, 121-142
Prohaska, Z. (1997) Mjesto i značenje tehničke analize u investicijskoj industriji. Računovodstvo, financije i revizija u suvremenim gospodarskim uvjetima, Pula: Hrvatska zajednica računovođa i financijskih djelatnika
Prohaska, Z., Uroda, I., Suljić, S. (2011) SP – A Computer Program for Fundamental Analysis of Stocks, Čičin-Šain, M., Uroda, I., Turčić-Prstačić, I. i Sluganović, I. (ur.) Proceedings of the 34th International convention on information and communication technology, electronics and microelectronics, Vol. IV, Computers in education, MIPRO - hrvatska udruga za informacijsku i komunikacijsku tehnologiju, elektroniku i mikroelektroniku (Croatian Society for Information and Communication Technology, Electronics and Microelectronics), Rijeka, str. 88-92.
Schabek, T., Olgić Draženović, B., Mance, D. (2019), Reaction of Zagreb Stock Exchange CROBEX Index to macroeconomic announcements within a high frequency time interval, Zbornik radova Ekonomskog fakulteta u Rijeci: časopis za ekonomsku teoriju i praksu, Vol 37, No 2., 741-758
Schwager, D. J. (1996) Shwager on Futures: TehnicalAnalysis, New York: JohnWiley&Sons, Inc
Shim, H., Kim, M. H., Ryu, D. (2017), „Effects of intraday weather changes on asset returns and volatilities“, Zbornik radova Ekonomskog fakulteta u Rijeci: časopis za ekonomsku teoriju i praksu, Vol 35, No 2. https://doi.org/10.18045/ zbefri.2017.2.301
Šarlija, V., Vuraić-Kudeljan, M., Buterin, D. (2019), Protokoli tehničke analize u razlučivanju potcijenjenosti od niske cijene, Zbornik Veleučilišta u Rijeci, Vol, 7, No. 1, 287-300
Živkov, D., Njegić, J., Momčilović, M. (2018), „Bidirectional spillover effect between Russian stock index and the selected commodities“, Zbornik radova Ekonomskog fakulteta u Rijeci: časopis za ekonomsku teoriju i praksu, Vol 36, No 1.

V. Šarlija, V. Buterin, D. Buterin: Utjecaj sezonskih oscilacija na kretanje cijene dionica u sektoru turizmaZbornik Veleučilišta u Rijeci, Vol. 8 (2020), No. 1, pp. 283-293
293
Preliminary communication https://doi.org/10.31784/zvr.8.1.19 Received: 13. 1. 2020. Accepted: 3. 2. 2020.
THE INFLUENCE OF SEASONAL OSCILLATIONS ON STOCK PRICE TRENDS IN THE TOURISM SECTOR
Vedran Šarlija Professional Specialist of Entrepreneurship, 51 000 Rijeka, Croatia;
e-mail: [email protected]
Vesna Buterin PhD, Assistant Professor, University of Rijeka, Faculty of Economics in Rijeka, Ivana Filipovića 4,
51000 Rijeka, Croatia; e-mail: [email protected]
Denis Buterin MSc, Senior Lecturer, Polytechnic of Rijeka, Trpimirova 2/V, 51000 Rijeka, Croatia; e-mail: [email protected]
ABSTRACT
Tourism and tourism-related activities are a significant factor in the Croatian economy, with clear indications of the continuation of such trends in the future. Research shows that the share of tourism in the Croatian gross domestic product has increased, and efforts to raise the quality of the tourist offer and extend the tourist season are becoming more noticeable. Holders of such initiatives, which are expected to increase long-term returns, are currently mostly tourism companies with the highest financial potential. In this paper, the authors investigate whether the movement in the stock price of such companies is associated with increased revenues during the season, that is, whether the price movement is related to seasonal fluctuations or is related to their long-term business policy. The research has shown that seasonal changes have some influence, but not sufficient to significantly determine the price movement of securities in the financial market of observed enterprises. Despite a significant increase in revenue, the trend is downward and indications of its turnaround have not been observed in the short and medium term, which may indicate investors’ lack of confidence in this form of tourism business development.
Key words: financial markets, tourism, technical analysis
Creative Commons Attribution – NonCommercial 4.0 International License


D. Miljenović, G. Kutnjak, P. Jakovac: Determiniranje obilježja djelotvornosti javnog sektora i javnog...Zbornik Veleučilišta u Rijeci, Vol. 8 (2020), No. 1, pp. 295-311
295
Pregledni rad https://doi.org/10.31784/zvr.8.1.22 Datum primitka rada: 13. 2. 2019. Datum prihvaćanja rada: 5. 6. 2019.
DETERMINIRANJE OBILJEŽJA DJELOTVORNOSTI JAVNOG SEKTORA I JAVNOG MENADŽMENTA
Dejan Miljenović Dr. sc., docent, Ekonomski fakultet Sveučilišta u Rijeci, I. Filipovića 4, 51000 Rijeka, Hrvatska;
e-mail: dejan.miljenović@efri.hr
Goran Kutnjak Dr. sc., redoviti profesor, Ekonomski fakultet Sveučilišta u Rijeci, I. Filipovića 4, 51000 Rijeka, Hrvatska;
e-mail: [email protected]
Pavle Jakovac Dr. sc., docent, Ekonomski fakultet Sveučilišta u Rijeci, I. Filipovića 4, 51000 Rijeka, Hrvatska;
e-mail: [email protected]
SAŽETAKJavni sektor u suvremenom poslovnom okruženju biva izložen isti m utjecajima globalnog poslovanja, društvenih i kulturnih promjena kao i privatni sektor, te se sukladno tome prilagođava postojećim socio-ekonomskim potrebama. Zadaća je javnog sektora da zajedno s privatnim sektorom unaprjeđuje društvo, stvara predispozicije društvenog rasta i razvoja, utječe na pozitivno određenje nacionalnih ekonomija i rada poslovnih subjekata u svrhu stvaranja novih vrijednosti. Također, kao javni servis, javni sektor osigurava pravovremeno, kvalitetno i sadržajno ostvarenje interesa građana. Stoga je nužno definirati i razvijati oblike javnog menadžmenta koji se mogu odgovarajuće prilagoditi promjenama okruženja i djelotvorno upravljati različitim aspektima internih funkcija javnog sektora. Cilj rada je istražiti temeljna obilježja suvremenog javnog sektora i na temelju toga odrediti potrebne modalitete javnog menadžmenta. Metodologija istraživanja temelji se na analizi strukture javnog sektora s osvrtom na Republiku Hrvatsku, uz pregled javnih upravljačkih odnosa koji u njemu trenutno postoje. Pritom se uvažava diverzifikacija javnog sektora na opću državu (javnu upravu) i javna (društvena) poduzeća. Svaka razina javnog sektora ima svoje podrazine djelovanja u različitim vidovima djelatnosti sa specifičnim ciljevima i zahtjevima, što pred javni menadžment postavlja uvjet uske specijaliziranosti, multidisciplinarnosti i interaktivnosti s različitim subjektima poslovnog okruženja. Rezultati istraživanja očituju se u predlaganju razvojnog modela menadžmenta s ciljem povećanja reagibilnosti javnog sektora na promjene u suvremenom društvenom i poslovnom okruženju. Istovremeno se kao glavni zaključak nameće da je razvoj transparentnog javnog menadžmenta preduvjet razvoja javnog sektora koji može uspješno zadovoljavati potrebe i pratiti interese svih njegovih korisnika u 21. stoljeću.
Ključne riječi: javni sektor, opća država, javna poduzeća, javni menadžment
Creative Commons Attribution – NonCommercial 4.0 International License

D. Miljenović, G. Kutnjak, P. Jakovac: Determiniranje obilježja djelotvornosti javnog sektora i javnog...Zbornik Veleučilišta u Rijeci, Vol. 8 (2020), No. 1, pp. 295-311
296
1. UVOD
Stanje javnog sektora neke države vrlo često odražava njen istinski „karakter“, razinu njezine (de)centraliziranosti, stupnja razvoja javnih sloboda i zaštite prava građana. To znači da je učinkovitost javnog sektora pretežno odraz odnosa i procesa koji se u njemu odvijaju, a uvjetovani su odnosima i modelom upravljanja tim procesima koji se naziva javni menadžment. Javni menadžment ima zadatak stvaranja ravnoteže između društvenih i poslovnih interesa različitih institucijskih, društvenih i poslovnih dionika. Prema Kutnjaku, tendencije suvremenog društva tako su sve više usmjerene na kompromis javnog i privatnog sektora koji generiraju, usmjeravaju i kontroliraju razvojne procese. Istovremeno fokusi privatnog i javnog sektora konvergiraju u smislu općih razvojnih determinacija i stvaranja novih ekonomskih, društvenih i drugih vrijednosti (Kutnjak, 2018:216). U suvremenim i razvijenim državama svijeta, kao i onima u razvoju, sve je izraženije shvaćanje o potrebnosti redefiniranja, odnosno dereguliranja postojećeg koncepta javnog sektora. Naime, nije rijetkost da zbog loše organizacije javni sektor često biva inertan dok neučinkovitom birokracijom značajno usporava razvojne procese. Tako koncipiran javni sektor umanjuje efikasnost, zahtijeva dodatna troškovna opterećenja i narušava društveni standard. Stoga je sveprisutan društveno-politički interes da se javni sektor smanji i decentralizira, da bude ciljno orijentiran na anticipiranje događaja i promjena koje nosi budućnost te da poslovni sustavi javnog sektora budu definirani planiranim, ciljno upravljačkim ponašanjem kao novim načinom reagiranja na razvojne probleme i najopćenitiji izraz pravca razvoja (Kostadinović, 2008:25). Funkcionalnost javnog sektora uvijek se sagledava u mogućnosti pravovremenog zadovoljenja općih funkcija alokacije, distribucije i stabilizacije, a za što mora biti ustrojena odgovarajuća institucijska struktura i model upravljanja javnim organizacijama.
Diverzificiranost javnog sektora očituje se u različitoj problematici koja je od značaja za državu i njeno društvo u određenom trenutku. Tako Bergmann (2019:75) navodi da je glavna orijentacija javnog sektora današnjice na globalnoj razini upravljanje javnim financijama. Neki drugi autori pak istražuju problematiku „javne vrijednosti“ (engl. public value), tj. mjerenja vrijednosti koju javni sektor stvara za svoje korisnike (Jørgensen, Bozeman, 2002; Mulgan, 2010; Papi et. al., 2018), što je osobito značajno i za vrijednost reformi koje se provode u javnom sektoru. Massey (2019:9–10) navodi kako je upravo stalno provođenje reformi glavna determinanta javnog sektora i da se u tome okviru i procesi javnog menadžmenta neprestano revidiraju. Stalna je i rasprava o novim oblicima javnog menadžmenta (engl. New Public Management – NPM, Hood, 1991), a koja prema Grueningu (2001:7–9) podliježe neprestanim teoretskim promjenama i različitim pristupima u praksi, a ovisno o danim političkim, društvenim i ekonomskim uvjetima. Iz navedenoga je očito da tematika upravljanja javnim sektorom istovremeno nameće više različitih pitanja za menadžere koji u njemu djeluju, pa je stoga i pitanje javnog menadžmenta vrlo aktualno i podložno promjenama. Iako javni sektor ima svrhu ispunjenja cijelog niza pozitivnih normi i ciljeva, poput opće demokratizacije društva, izrade i potpore zakonodavstva, osiguranja učinkovitog javnog financiranja i procesa javne nabave, prisutna je također i negativna identifikacija ciljeva javnog sektora. Tako su tromost, inertnost i birokracija često prepreka učinkovitom ostvarenju javnih interesa. U tome smislu javni sektor se posljednjih desetljeća izrazito orijentira na prihvaćanje tržišnih načela, pa i potvrđivanje poslovnim rezultatom, naglašavajući važnost društveno odgovornog poslovanja, socijalnu

D. Miljenović, G. Kutnjak, P. Jakovac: Determiniranje obilježja djelotvornosti javnog sektora i javnog...Zbornik Veleučilišta u Rijeci, Vol. 8 (2020), No. 1, pp. 295-311
297
inovativnost i konkurentnost te praćenje uspjeha javnih zaposlenika. Stoga se kao radna hipoteza nameće istraživanje odnosa između strukture javnog sektora i općih potreba njegovih korisnika, koji se oblikuju u procesu javnog menadžmenta. U tome smislu u ovom se radu javni menadžment sagledava kao pokretač, a potom i ključna „karika“ inoviranja javnih servisa. Menadžeri javnih institucija time dobivaju višestruku odgovornost: prema državi kao osnivaču, građanima kao korisnicima i društvu u cjelini. Istovremeno ih se stavlja u ravnopravan položaj menadžera koji istu odgovornost razvijaju prema vlasnicima privatnih poduzeća. U nastavku rada obrađuju se glavna obilježja učinkovitosti javnog sektora, institucijska struktura na primjeru javnog sektora Republike Hrvatske, značaj javnih poduzeća te se na temelju provedene analize definiraju suvremene javne potrebe i prikladni oblici menadžmenta javnog sektora.
2. METODOLOGIJA
Kako bi se odredile temeljne značajke suvremenih javnih sektora, metodologija se temelji na prikazu glavnih strukturnih aspekata javnog sektora, tj. s institucijskog stajališta opće države (javne uprave) i javnih (društvenih) poduzeća. Nadalje, analizom na primjeru Republike Hrvatske osvrće se na učinkovitost javnog sektora u praksi jedne zemlje, njegove nedostatke te važnost i udio javnih poduzeća. Upravo se po pitanju uspjeha/neuspjeha javnih poduzeća vrlo često ističe važnost funkcije javnog menadžmenta. Velik je broj istraživanja posvećen ovoj problematici, osobito kroz već spomenutu paradigmu „novog javnog menadžmenta“. Tako se redovito ističu istraživanja o učinkovitosti menadžmenta javno-privatnih partnerstava i općenito o takvom obliku partnerstava kao nužnom preduvjetu funkcioniranja javnih sektora u skladu s tržišnim zahtjevima (Casady, Eriksson, Levitt, Scott, 2019). Snažno empirijsko uporište imaju istraživanja teorije javne vrijednosti koja polaze od (Hartley, Alford, Knies, Douglas, 2017:672):
1. korelativnog odnosa javne vrijednosti i učinkovitog upravljanja (menadžmenta javnih organizacija) te
2. pravilne raspodjele javne vrijednosti na sve njene dionike (engl. stakeholders).
U novije vrijeme značajna su istraživanja utjecaja digitalnih tehnologija u kreiranju strategija javnog menadžmenta, a zbog širenja virtualne dostupnosti javnih usluga (Gil-Garcia, Dawes, Pardo, 2018). U navedenom pregledu radova istraživačka metodologija redovito polazi od određenja temeljnih karakteristika analiziranog javnog sektora. Stoga se i u ovom radu primarno polazi od strukturnih čimbenika javnog sektora te definiranja učinkovitosti njegovog sadržaja. Nadalje se različita istraživanja i analize odnose na pojedine zemlje, za što je u ovu svrhu analiziran javni sektor Republike Hrvatske. Slične analize provedene su na primjeru većeg broja država i pripadajućih javnih sektora (Rana, Hoque i Jacobs, 2019; Chan, 2019; Lynn Jr., 1999), a značajne su i usporedne analize učinaka reformi javnog sektora različitih zemalja (Baraldi, 2014). Analize javnog sektora pojedinih zemalja, kao što je to slučaj kod Danske i Švedske, u potpunosti su posvećene problematici stvaranja učinkovitog javno-privatnog partnerstva koje je i u Hrvatskoj u određenom političkom momentu imalo snažan zamah (Christensen, 2017; Petersen, 2010; Etherington, 1996). Značajno je i uvođenje novih pokazatelja socijalne održivosti javnih investicija, a koji se u Hrvatskoj nažalost ne koriste prikladno niti dovoljno. Tako su, i na razini lokalnih samouprava, provedena istraživanja

D. Miljenović, G. Kutnjak, P. Jakovac: Determiniranje obilježja djelotvornosti javnog sektora i javnog...Zbornik Veleučilišta u Rijeci, Vol. 8 (2020), No. 1, pp. 295-311
298
korištenjem pokazatelja društvenog povrata na investiciju (engl. Social Return on Investment – SROI) kojim se mjeri uspješnost upravljanja projektima u javnom sektoru (Purwohedi, Gurd, 2019; Mook, Maiorano, Ryan, Armstrong, Quarter, 2015). Najraširenija je 3E metodologija prema kojoj se svaki javni sektor može analizirati na temelju triju ključnih odrednica (Liu, Cheng, Mingers, Qi, Meng, 2010:306):
E1) učinak: ono što sustav proizvodi (efekt, op. a.),
E2) efikasnost: kako sustav stvara učinak,
E3) efektivnost: zašto sustav proizvodi određeni učinak.
3E metodologija svakako je vezana uz djelotvornost javnog menadžmenta i potrebu njegova stalnog usavršavanja u praksi. Budući da se navedena istraživanja diverzificiraju po ciljevima, opsegu istraživačke problematike i rezultatima, u ovom radu koristit će se kombinacija pregleda podataka javnih sektora pojedinih država, analiza njihovih strukturnih specifičnosti i stupnja implementacije politika suvremenog javnog menadžmenta. Metodologija se temelji na kombinaciji obilježja analiziranog javnog sektora Republike Hrvatske i kreiranju odgovarajućeg modela javnog menadžmenta, a uz uvažavanje obilježja učinkovitosti tih dviju varijabli.
3. ODREĐENJE I KARAKTERISTIKE JAVNOG SEKTORA I NOVOG JAVNOG MENADŽMENTA
Javni sektor obuhvaća različite institucije i poduzeća kojima upravlja država, a koje djeluju u okviru četiriju skupina djelatnosti: a) društvene, b) komunalne, c) infrastrukturne i d) upravne djelatnosti. Riječ je o mreži formalnih organizacija i tijela koje zapošljavaju javne službenike, donose i reguliraju propise, raspolažu vlastitom imovinom i upravljaju javnim poduzećima (Pusić, 1995). To je definicijski, strukturni aspekt javnog sektora kojem se obavezno mora pridodati odgovarajući upravljački aspekt. Upravljački aspekt podrazumijeva javni menadžment koji u formalnom sustavu implementira korisne programe i treba ostvariti pozitivne javne ishode. Prema 3E metodologiji jedinstveno određenje javnog sektora jest njegova djelotvornost predstavljena obilježjima efikasnosti i efektivnosti u stvaranju učinaka, tj. javnih dobara i usluga. Djelotvornost je uvijek određena načinom upravljanja javnim sektorom, pa se javni menadžment jasno definira u tome smislu. Iako se prakse upravljanja privatnim sektorom često prenose u javni sektor, među njima postoje vrlo jasne razlike (shema 1).

D. Miljenović, G. Kutnjak, P. Jakovac: Determiniranje obilježja djelotvornosti javnog sektora i javnog...Zbornik Veleučilišta u Rijeci, Vol. 8 (2020), No. 1, pp. 295-311
299
Shema 1. Karakteristike javnog sektora u odnosu na privatni sektor
Izvor: Salkić (2011:31)
Osim glavnih obilježja, shema 1 istovremeno ukazuje na tradicionalne nedostatke javnih sektora u smislu krutosti organizacije, birokracije te upitne motivacije ljudskih potencijala. Novi javni menadžment ima za cilj uklanjanje ovih nedostataka jačanjem reaktivnosti javnih menadžera glede tržišnih inicijativa, ali i njihova „agencijskog odnosa“ prema državi i korisnicima javnih dobara (Considine, Nguyen, O’Sullivan 2018:1188-1191). Upravo se zbog involviranosti tržišnih načela u suvremenom društvu javni sektori više ne mogu unificirati u pogledu javnih ciljeva, jer uz zadovoljenje javnih interesa susreću i odgovaraju na potrebe lokalnog stanovništva i društva u cjelini koje se povodi tržišnim osnovama. Ova veza je povratna jer vrlo često potrebe suvremenog tržišta potiču demokratizaciju odnosa u društvu i posljedično u njegovom javnom sektoru. Tržišni utjecaji su se tako vrlo rano javili u modelu javnog menadžmenta, prvenstveno radi postizanja učinkovitosti tri osnovne funkcije javnog sektora (Musgrave, Musgrave, 1993:5):
a) funkcija alokacije resursa za ravnomjerno zadovoljavanje javnih potreba
b) funkcija preraspodjele dohotka i bogatstva i
c) funkcija stabilizacije u pogledu visoke zaposlenosti, stabilnosti cijena i ekonomskog rasta).
U tome smislu otvara se problematika javnog menadžmenta, budući da se modeli upravljanja i pojedina rješenja preuzimaju iz opće paradigme menadžmenta koja je prvotno implementirana u privatnom sektoru (Khan, Khandaker, 2016; Kattel et al., 2013; Nutt, 2006). Javni sektor se suočava s minimalnim prijetnjama konkurenata u pružanju dobara i usluga, jer u osnovi ne djeluje na konkurentnom tržištu. Čak i uz prisutnu konkurenciju javni sektor uvijek zadržava dominantnu poziciju (Boyne, 2002:102). Neprofitabilnost javnog sektora nije isključiva jer je uz ograničeno djelovanje tržišnih zakonitosti moguće i profitabilno poslovanje. Rasprava o novom

D. Miljenović, G. Kutnjak, P. Jakovac: Determiniranje obilježja djelotvornosti javnog sektora i javnog...Zbornik Veleučilišta u Rijeci, Vol. 8 (2020), No. 1, pp. 295-311
300
javnom menadžmentu svoje začetke ima u Ostromovoj sintezi javne administracije i inovacijske teorije iz 1973. godine, dok je sintagmu novog javnog menadžmenta u svrhu ostvarivanja javnih ušteda 1991. godine jasno ustanovio Hood. Prema Hoodu (1991) birokracijski neefikasni i veliki javni sustavi već su 1980-ih zahtijevali orijentaciju na troškovnu učinkovitost i otvaranje prema inicijativama privatnog sektora. Isto se nastojalo postići različitim oblicima suradnje s privatnim poduzećima (tzv. outsourcingom djelatnosti), razvojem menadžmenta orijentiranog na rezultate i na zadovoljstvo korisnika. U praksi je ta izvorna paradigma novog javnog menadžmenta često bila lišena učinkovite realizacije javne vrijednosti za krajnje korisnike, pa su kritičari ocijenili potrebu za njezinom doradom (Lapsley, 2009; Kooiman and Jentoft 2009). Tako se, radi jačanja kvalitete, javni upravljački mehanizmi počinju temeljiti na procesima učenja, inovacijama, mjerenju i kontroli kvalitete javnog učinka. Kinder (2012) navodi kako suvremeni javni menadžment povezuje dvije ključne agende: 1) stalni razvoj sposobnosti javnih menadžera i 2) kvalitetu i kapacitet javnih usluga (shema 2). Andrews i Van de Walle (2013:763) ovu vezu analiziraju kao parametre djelotvornosti novog javnog menadžmenta.
Shema 2. Parametri djelotvornosti novog javnog menadžmenta
Izvor: izrada autora prema Kinder (2012:404) i Andrews, Van de Walle (2013:763)
Pojam djelotvornosti objedinjuje efikasnost i efektivnost, podrazumijevajući da su prakse javnog menadžmenta redovito povezane s percepcijom građana o pravovremenoj, pravednoj i učinkovitoj javnoj usluzi. Također, svojim rastom i razvojem javni sektor neizbježno korelira s razvojem gospodarstva, pa kao čimbenik razvoja mora biti ustrojen tako da osigura odgovarajuću razinu zadovoljavanja potreba i interesa građana. U nastavku se vrši analiza strukture javnog sektora Republike Hrvatske sa stajališta opće države (javne uprave) i javnih poduzeća, a s ciljem određivanja temeljnih obilježja djelotvornosti javnog menadžmenta koji bi trebao odgovoriti na suvremene izazove stvaranja troškovno prihvatljivog i kvalitetnog javnog dobra i usluge.
3. 1 Institucijska struktura javnog sektora i javnog menadžmenta u Republici Hrvatskoj
Veličinu i strukturu javnog sektora, čiji su korisnici u pravilu građani, određuje politički, društveni i ekonomski razvoj, čiji je primarni cilj osigurati jednake mogućnosti zadovoljavanja javnih potreba preraspodjelom dohotka među stanovništvom (Salkić, 2011:29). Stoga pri svakoj analizi javnog sektora treba uvažiti i nacionalne specifičnosti jer one vrlo često određuju razinu njegove učinkovitosti.

D. Miljenović, G. Kutnjak, P. Jakovac: Determiniranje obilježja djelotvornosti javnog sektora i javnog...Zbornik Veleučilišta u Rijeci, Vol. 8 (2020), No. 1, pp. 295-311
301
U Hrvatskoj je javni sektor tijekom posljednja tri desetljeća bio na putu sustavne transformacije i provedbe reformskih rješenja s jasnim ciljem povećanja njegove učinkovitosti. Stalna reformska „želja“ za smanjenjem troškova i cijene javnih usluga rezultirala je i dovođenjem javnog sektora u stanje „stalnih promjena“, iako taj sektor predstavlja najstabilniji dio državne brige za društvo. Nestabilnost u provođenju reformi dovela je do izrazito kritičkog viđenja javnog sektora u Hrvatskoj, a poglavito javne uprave. Istovremeno, snažne političke tendencije pri upravljanju javnim poduzećima pridonijele su nerazumijevanju u odnosima s privatnim sektorom, građanima općenito, ali i akademskom zajednicom, koji su iskazivali zajednički interes za poboljšanim sustavom stvaranja javne vrijednosti. Opravdanost takvog viđenja je u glomaznosti domaćeg javnog sektora za koji se često čini da je „učinkovit samome sebi“, a građani i poduzetnici često odustaju od borbe za efikasnijom opskrbom javnim dobrima i uslugama. Važno je jasno naglasiti da se javni menadžment ne odnosi u istome obimu na upravljanje javnom upravom i javnim poduzećima (društvima), već postoji razlika između te dvije kategorije, tj. razlikuje se:
1. menadžment vezan uz zadatke i rad javne uprave i
2. menadžment vezan uz poslovanje javnih poduzeća.
Shema 3. Struktura javnog sektora i kategorije javnog menadžmenta
Izvor: prilagodba autora prema Bejaković, Vukšić, Bratić (2011:101)
Metodologija MMF-a unutar javnog sektora uključuje ukupnu (opću) državu i javna poduzeća, koja se, pak, razlikuju kao financijska i nefinancijska javna društva (Bejaković, Vukšić, Bratić, 2011:101). Sukladno strukturi javnog sektora prva kategorija javnog menadžmenta odnosi se na zadatke i rad javne uprave na tri razine, tj. razini središnje države te regionalne i lokalne vlasti. Uz ove tri razine veže se upravljanje državnim institucijama, uredima, agencijama i organizacijama, županijskim institucijama, uredima i školstvom te institucijama pod ingerencijom jedinica lokalne uprave i samouprave. Druga kategorija javnog menadžmenta odnosi se na upravljanje javnim poduzećima. Bajo, Zuber i Primorac (2017) prema klasifikaciji Fine i OECD-a javna poduzeća definiraju kao poduzeća u vlasništvu države (središnje, federalne, lokalne ili regionalne) koja u njima ima značajnu kontrolu kroz potpuno, većinsko ili manjinsko vlasništvo. Zajedničko obilježje kategorija javnog

D. Miljenović, G. Kutnjak, P. Jakovac: Determiniranje obilježja djelotvornosti javnog sektora i javnog...Zbornik Veleučilišta u Rijeci, Vol. 8 (2020), No. 1, pp. 295-311
302
menadžmenta na razini opće države i javnih poduzeća jest da podrazumijevaju proces upravljanja javnim sadržajima u danom političkom kontekstu i prema zahtijevanim društvenim ishodima javnog sektora.
3. 2 Položaj i funkcija opće države u javnom sektoru
Nazivana još i državnim sektorom ili aparatom, opća država ima primarni zadatak obavljanja izvršnih, zakonodavnih i sudskih funkcija. Uz navedeno podrazumijeva ukupnost tijela državne vlasti koja su namijenjena izvršenju državnih politika kroz pružanje netržišnih usluga i preraspodjelu dohotka i imovine, a čime odražava društvene odnose u okviru javnog sektora. Fiskalne aktivnosti koje se obavljaju izvan sektora opće države, a koje izvršavaju agencije monetarnog (nefiskalnog) tipa, nazivaju se kvazifiskalne (Žmegač, Ostojić, 2014). Opća država u Republici Hrvatskoj dijeli se na središnju državu koja se sastoji od njenih proračunskih i izvanproračunskih korisnika (shema 4).
Shema 4. Institucijska struktura opće države u Republici Hrvatskoj
Izvor: Jurčić (2011:14)
Regionalna i lokalna vlast, kao podsektori središnje države, uz fondove socijalne sigurnosti čine opću državu. Prema ESA metodologiji (European Systems of Accounts - Europska komisija, 2013) u središnju državu spadaju tijela državne uprave, poput ministarstava, zavoda, agencija, akademija i komisija. Također uključuje i izvanproračunske fondove/korisnike u koje se ubrajaju HZZO, HZMO, HZZ, Hrvatske vode, Hrvatske ceste, Fond za zaštitu okoliša i energetsku učinkovitost, Agencije za osiguranje štednih uloga i sanaciju banaka te Centar za restrukturiranje i prodaju. Broj ovih korisnika često se mijenja te imaju značajnu autonomiju u pogledu javnog menadžmenta, budući da samostalno odlučuju glede svojih prihoda i rashoda. Ovakva struktura opće države predstavlja značajan izazov jer uz funkciju izvršne javne vlasti određeni izvanproračunski korisnici,

D. Miljenović, G. Kutnjak, P. Jakovac: Determiniranje obilježja djelotvornosti javnog sektora i javnog...Zbornik Veleučilišta u Rijeci, Vol. 8 (2020), No. 1, pp. 295-311
303
poput Hrvatskih voda i Hrvatskih cesta, zahtijevaju od javnog menadžmenta kreiranje i provođenje poslovnih politika uz praćenje tržišnih trendova.
Navedenu složenost i međuovisnost javnih podsektorskih razina u Hrvatskoj prati značajni broj javnih službenika, pa se utjecaj javnog sektora na društveni rast i razvoj sagledava i kroz prizmu zapošljavanja. Hrvatskoj se kao članici EU-a često pripisuje negativna konotacija omjera broja zaposlenih u javnom sektoru u odnosu na stanje realnog sektora, tj. gospodarstva, što pred javni menadžment stavlja dodatne izazove. U nastavku je dan pregled broja državnih i javnih službenika, namještenika i pravosudnih dužnosnika u javnom sektoru na razini opće države (tablica 1, prema sustavu COP - Centralizirani obračun plaća na dan 31. 12. 2017. godine).
Tablica 1. Broj zaposlenih na razini opće države javnog sektora Republike Hrvatske
Grupa institucija Ukupan broj zaposlenihMinistarstva 42.791Državne upravne agencije 2.834Središnji državni uredi 227Stručne službe i uredi Vlade RH 478Uredi državne uprave u županijama 2.556Pravosudna tijela 10.111Ostala državna tijela 1.096Zdravstvo 64.842Socijalna skrb 6.876Kultura 1.843Znanost i visoko obrazovanje 16.872Školstvo 65.997Zaštita prirode i okoliša 413OSTALI (agencije i druge pravne osobe za čije se zaposlene plaća osigurava u državnom proračunu)
10.230
UKUPNO 227.166Izvor: Ministarstvo uprave (2018:46)
Prema podacima Ministarstva uprave ukupan broj zaposlenih koji rade u jednom resoru je 227.166, ali mu je nužno pribrojiti 2.130 zaposlenika koji istovremeno rade u dva ili više resora (npr. zaposlenik koji istovremeno radi u sustavu obrazovanja i sustavu zdravstva). Također, u okviru Sustava socijalne skrbi djeluju domovi za starije i nemoćne osobe, čiji se podaci djelomično održavaju kroz COP, a njih je ukupno 3.732. Time se broj ukupno zaposlenih javnih službenika i namještenika diže na 233.028. Radi se o iznimnom ljudskom resursu, pa upravljanje njime nadilazi uobičajene funkcije menadžerskog kadroviranja i vođenja. Naime, u pojedinim državnim službama (npr. Porezna uprava) hijerarhijska složenost je nužna radi široke dostupnosti javne usluge, ali istovremeno i otežava praćenje učinkovitosti u tako velikim sustavima. Stoga je zadatak javnog menadžmenta u okviru opće države optimizacija broja zaposlenih i kvalitete javnih učinaka.

D. Miljenović, G. Kutnjak, P. Jakovac: Determiniranje obilježja djelotvornosti javnog sektora i javnog...Zbornik Veleučilišta u Rijeci, Vol. 8 (2020), No. 1, pp. 295-311
304
3. 3 Javna poduzeća
Glavno obilježje suvremenih javnih poduzeća jest da objedinjavaju aspekte javnog i tržišnog pristupa. U tome smislu zadatak menadžmenta javnih poduzeća jest zadovoljenje društvenih potreba uz potencijalnu dobit, ali i odgovornost, jer loši učinci u obliku neadekvatnih javnih usluga i mogućih gubitaka pripadaju cijelom društvu. Pod javnim poduzećima u Republici Hrvatskoj smatraju se poduzeća u većinskom vlasništvu i pod kontrolom države. U slučaju manjinskog vlasništva uloga države ostvaruje se barem na kontrolnoj razini.
U strukturi opće države jasno se izdvajaju javna poduzeća strateškog interesa iz područja cestovnog, željezničkog, plovnog i avioprometa (Hrvatske ceste, Hrvatske željeznice, Croatia Airlines) te iz područja upravljanja prirodnim resursima (poput Hrvatskih šuma i Hrvatskih voda). Neka od njih, poput Hrvatskih voda i Hrvatskih cesta, su izvanproračunski korisnici, ali sa snažnim aspektom javnog menadžmenta u pogledu samostalnog odlučivanja. Takva poduzeća, budući da pokrivaju strateške sektore prijevoza, energetske infrastrukture, vojne industrije i informacijskih tehnologija, spadaju u cijelosti ili djelomično pod središnju državnu kontrolu te su od interesa za razvoj i rast gospodarstva. Uz navedena poduzeća u sklopu opće države, u ovom radu pojam javnog menadžmenta odnosi se i na poduzeća regionalne i lokalne razine, poput poduzeća komunalne i vodovodne djelatnosti (npr. u općinama i gradovima). Tako je Hrvatska 2016. godine u većinskom državnom vlasništvu imala 1.149 javnih poduzeća (Bajo, Zuber i Primorac, 2017:2), među kojima su i ona u vlasništvu lokalnih jedinica te u mješovitom vlasništvu, a gdje je država većinski vlasnik (grafikon 1).
Grafikon 1. Udio države u djelatnostima (po sektorima) u 2016. godini
Izvor: Bajo, Zuber i Primorac (2017:4)
Prema istraživanju koje su proveli Bajo, Zuber i Primorac (2017) Hrvatska pripada kategoriji europskih država s izrazito visokim udjelom javnih poduzeća u BDP-u. Riječ je o poduzećima koja su raspršena po svim gospodarskim sektorima i čiji je doprinos proračunskim prihodima malen zbog slabog financijskog poslovanja uz isticanje problema nadzora nad njihovim poslovanjem.

D. Miljenović, G. Kutnjak, P. Jakovac: Determiniranje obilježja djelotvornosti javnog sektora i javnog...Zbornik Veleučilišta u Rijeci, Vol. 8 (2020), No. 1, pp. 295-311
305
Izniman je udio od 34 % javnih poduzeća u sektoru opskrbe vodom, otpadnih voda i gospodarenja otpadom, a što je očekivano s obzirom na to da ove djelatnosti spadaju pod djelovanje brojnih lokalnih vlasti u Republici Hrvatskoj. Bez obzira na veličinu i položaj javnih poduzeća unutar opće države, njihove djelatnosti uvijek se odnose na pružanje komercijalnih, nekomercijalnih ili industrijskih usluga za širu javnost. To im pruža monopolski položaj, pa su kao takva izrazito podložna određenoj razini vlasti koja ih u najvećoj mjeri kontrolira, ali i stvara uvjete da javna poduzeća posluju u okviru javnih interesa.
Osim po strukturi opće države, javna poduzeća u Hrvatskoj dijele se na (Bajo, Jurlina Alibegović, 2008:25-27):
1) financijska i
2) nefinancijska javna poduzeća.
Financijska javna poduzeća dodatno se dijele na monetarna i nemonetarna javna poduzeća. Monetarnim javnim poduzećima smatraju se depozitarna društva koje direktno kontroliraju tijela opće države te se sastoje od financijskih, kvazijavnih društava i tržišnih neprofitnih institucija, a čija je primarna djelatnost ostvarivanje društvenih učinaka uz dugoročnu financijsku održivost (npr. Hrvatska banka za obnovu i razvoj - HBOR, Hrvatska narodna banka - HNB i Hrvatska poštanska banka - HPB). Pod nemonetarnim financijskim poduzećima smatraju se sva financijska društva koja država izravno kontrolira, uz izuzetak javnih depozitarnih društava i središnje banke (Bajo, Jurlina Alibegović 2008:27), a koja se bave izvršavanjem djelatnosti vezanih uz transakcije financijske imovine i obveza (Hrvatska agencija za nadzor financijskih usluga - HANFA, Financijska agencija - FINA i Središnje klirinško depozitarno društvo - SKDD). Nefinancijska javna poduzeća i usluge koje nude u Hrvatskoj smatraju se poduzećima od izrazitog značaja zbog kontinuirane provedbe ekonomskih mjera i politika Vlade Republike Hrvatske (npr. HEP, INA, Hrvatska lutrija, Hrvatske šume, Adriatic Croatia International - ACI, Jadranski naftovod, Hrvatska radiotelevizija).
S obzirom na danu diverzifikaciju javnih poduzeća u Republici Hrvatskoj, očito je da se obilježja javnog menadžmenta na svim razinama mogu iskazati ujednačeno, ali samo u glavnim odrednicama. Naime, domaći javni sektor predstavlja vrlo složen i slojevit sustav koji je dodatno zbog uključenosti nefinancijskih subjekata iznimno sofisticiran. Stoga prikladan javni menadžment zahtijeva uključenost svih dionika na različitim razinama, pa i onih civilnog društva. Navedeno se najbolje očituje u provođenju projekata financiranih sredstvima EU-a kada se sve razine vlasti uključuju u realizaciju takvih procesa te uz društvene dionike kreiraju javne kontrolne i informacijsko-povratne mehanizme.
4. MODELIRANJE DJELOTVORNOSTI JAVNOG MENADŽMENTA
Dani pregled strukture javnog sektora u svim aspektima zahtijeva potrebu jačanja djelotvornosti javnog menadžmenta. Djelotvornost je širok pojam, a omogućava prilagodbu procesa upravljanja specifičnostima pojedinog javnog subjekta. Nemoguće je uvesti i očekivati iste parametre djelotvornosti kod javnih poduzeća poput državnih (auto)cesta ili lokalnog komunalnog društva.

D. Miljenović, G. Kutnjak, P. Jakovac: Determiniranje obilježja djelotvornosti javnog sektora i javnog...Zbornik Veleučilišta u Rijeci, Vol. 8 (2020), No. 1, pp. 295-311
306
Njihovi upravljački aspekti i funkcionalnost značajno se razlikuju, ali pritom imaju isti političko-društveni kontekst pružanja javne usluge, kako je prikazano idućom shemom.
Shema 5. Procesni pristup javnog menadžmenta na razini opće države i javnih poduzeća
Izvor: prilagodba autora prema Schmidt, Groeneveld, Van de Walle (2017:1542)
Javni sektor uvijek se prilagođava danom političkom, društvenom, kulturnom pa i tehnološkom okruženju. Navedeni kontekst snažno kreira javne potrebe, pa suvremeni javni menadžment izlazi iz okvira običnog birokratskog upravljanja i prelazi u stalni proces učenja, inoviranja i proaktivnog djelovanja. Naime, javni sektor tradicionalno je prepoznatljiv po birokraciji i nižoj upravljačkoj moći, dok suvremeno društveno okruženje zahtijeva tzv. vodstvo temeljeno na učinku. To znači da, bez obzira na složenost, javne upravljačke strukture moraju imati uvid u kvantitetu i kvalitetu javnih učinaka za koje su zadužene.
Općenito se djelotvornost javnog menadžmenta svake razine vlasti te onog u javnim poduzećima promatra kroz četiri osnovne varijable (Andrews, Van de Walle, 2013:768-769):
1. Efikasnost – očituje se u doživljaju građana ima li određeno javno dobro ili usluga „vrijednost za novac“. Time se želi uvažiti postojanje odnosa cijene i kvalitete unutar javnog sektora, tj. odnosa javnih inputa i outputa.
2. Pravodobnost – odnosi se na tretiranje građana s poštovanjem i vremenskim uvažavanjem od strane javnih službi.
3. Ravnopravnost – odražava koliko su javne organizacije sposobne kreirati javne usluge tako da one zadovolje potrebe raznolikog spektra društvenih grupa (dionika) i građana.
4. Efektivnost – predstavlja doživljaj građana o ukupnoj učinkovitosti javnih vlasti svih razina u ostvarivanju javnih zadataka i odgovornosti.
Navedene varijable čine temelj za poboljšanje učinkovitosti javnog menadžmenta, ali samo ako se vrednuju u daljnjim procesima učenja javnih djelatnika/menadžera, inoviranja javnih organizacija i kontrole kvalitete javnih učinaka, kako je prikazano shemom 6.
Shema 6. Proces učenja i inovacija kao odgovor javnog menadžmenta na promjene u okruženju

D. Miljenović, G. Kutnjak, P. Jakovac: Determiniranje obilježja djelotvornosti javnog sektora i javnog...Zbornik Veleučilišta u Rijeci, Vol. 8 (2020), No. 1, pp. 295-311
307
Izvor: prilagodba autora prema Kinder (2012: 407)
Suvremeni javni menadžment suprotstavlja se uvriježenoj formalizaciji donošenja odluka u javnom sektoru i zalaže za veću fleksibilnost. Ponekad je to iznimno teško, jer je rad javnih menadžera u velikoj mjeri ograničen brojnim zakonima, pravilima i zahtjevima nosilaca javnih politika i interesa (Boyne, 2002:105). Javni menadžment unatoč nadležnim sustavima kontrole ima priliku biti pokretačem promjena, osobito u oblikovanju suvremenih procesa pružanja javnih usluga. Da bi ostvarili potpunu djelotvornost, menadžeri javnog sektora moraju se uključiti u diskusiju i rad s društvenim dionicima te zajedno s njima vršiti mjerenje rezultata provedbe javnih politika, analize kvalitete javnih učinaka te zajedničkog kreiranja novih javnih politika.
Iako Deželjin i Vujić (1995:149) ovakav razvoj javnog menadžmenta pripisuju sve većoj ekonomsko-socijalnoj ulozi države u tržišnom društvu 20. stoljeća, smatra se da je taj proces obostran, tj. tržišni elementi snažno prodiru u javni sektor čineći njegov menadžment otvorenijim i marketinški orijentiranim. Tako postaje uobičajeno da ministarstva, državni zavodi, regionalne i lokalne agencije te javna poduzeća komuniciraju sa širom javnosti putem medija, a s ciljem promoviranja svojih mjera ili agitirajući za provođenje određenih programa. Vrlo je često i uključivanje javnih poduzeća u promicanje strategija društvene odgovornosti u poslovanju, a koje su odraz sve širih zahtjeva za održivosti i dodavanjem održive vrijednosti (Miljenović, 2016 i 2018), pa i u javnom sektoru.
5. ZAKLJUČAK
Na temelju danih odrednica opće države i javnih poduzeća u radu je analiziran odnos strukture javnog sektora i djelotvornosti pružanja javnih usluga uz posredovanje novog javnog menadžmenta. Uvidom u prethodna istraživanja utvrđeno je da suvremeni javni sektori sve više bivaju nužna „derivacija” javnih i privatnih aspekata društvenog i ekonomskog razvoja. Također, analize javnih sektora pojedinih zemalja pokazuju da korisnici javnih usluga ocjenjuju ukupnu djelotvornost javnih subjekata, bez obzira na razinu javne vlasti koja ih osigurava. Također, svaka zemlja vrednuje javne organizacijske modele sukladno njenim specifičnostima i zakonskim

D. Miljenović, G. Kutnjak, P. Jakovac: Determiniranje obilježja djelotvornosti javnog sektora i javnog...Zbornik Veleučilišta u Rijeci, Vol. 8 (2020), No. 1, pp. 295-311
308
osnovama. Analiza strukture javnog sektora Republike Hrvatske u ovom radu pokazala je da se radi o složenom mehanizmu, naglašenih različitosti i problematika te sa značajnim udjelom djelatnosti javnih poduzeća, što predstavlja različite izazove u kreiranju odgovarajućih politika javnog menadžmenta. Upravo u pogledu javnog menadžmenta struktura opće države i djelatnosti pripadajućih poduzeća javnog sektora u Republici Hrvatskoj omogućavaju kreiranje jedinstvenog procesnog modela javnog menadžmenta zasnovanog na varijablama djelotvornosti.
Istraživanje modela djelotvornosti u ovom radu pokazalo je da javni menadžment u suvremenom okruženju biva pokretač i ključna karika inoviranja javnih servisa. U Hrvatskoj su strukture javnog menadžmenta stavljene u „kruti“ kontrolni i zakonski odnos spram vlasti, ali im se upravo kroz procese učenja, inoviranja javnih upravljačkih modela te uključivanja dionika u kreiranje javnih politika omogućava snažnija dinamika i proaktivnost. U tome smjeru jasno se naglašava korištenje modela novog javnog menadžmenta koji promovira navedenu dinamiku javnih procesa, tj. brže prilagođavanje javnih subjekata promjenama okruženja i potrebama društva koje pritom proizlaze.
Značajna ograničenja istraživanju predstavlja neujednačenost modela vrednovanja ishoda javnog menadžmenta u različitim državama, kao i različito poimanje varijabli efikasnosti i efektivnosti, a što je djelomično rezultatom nacionalnih specifičnosti. Također je u smislu budućih istraživanja zanimljivo ujednačiti aspekte učinkovitosti opće države i javnih poduzeća u objedinjenom modelu javnog menadžmenta, tako da ih se dodatno odvojeno kategorizira na operativnim razinama. Stoga bi se buduća istraživanja svakako trebala usmjeriti na jedinstvene modele ocjene učinka javnog menadžmenta, s posebnim kategorijama djelotvornosti na razini opće države i javnih poduzeća. Ovo je nužno budući da, globalno gledano, javna poduzeća sve više poprimaju tržišne elemente te svojim monopolskim položajem uz društveni razvoj postaju i činiteljima tržišnog razvoja.
LITERATURAAndrews, R., Van de Walle, S. (2013) ˝New Public Management and Citizens’ Perceptions of Local Service Efficiency,
Responsiveness, Equity and Effectiveness ,̋ Public Management Review, 15(5), p. 762-783
Bajo, A., Jurlina Alibegović, D. (2008) Javne financije lokalnih jedinica vlasti, Zagreb: Školska knjiga; Ekonomski institut; Institut za javne financije
Bajo, A., Zuber, L., Primorac, M. (2017) „Uspješnost financijskog poslovanja poduzeća (trgovačkih društava) u vlasništvu države ,̋ Fiscus, 5, p. 1-22
Baraldi, S. B. (2014) ˝Evaluating results of public sector reforms in Rechtsstaat countries: The role of context and processes in the reform of the Italian and French cultural heritage system ,̋ International Public Management Journal, 17(3), p. 411-432
Bejaković, P., Vukšić, G., Bratić, V. (2011) „Veličina javnog sektora ,̋ Hrvatska i komparativna javna uprava: časopis za teoriju i praksu javne uprave, 11(1), p. 99-125
Bergmann, A. (2019) ˝Editorial: Improving global public financial management ,̋ Public Money & Management, 39(2), p. 75-76
Boyne , G. A. (2002) ˝Public and Private Management: What’s the difference? ,̋ Journal of Management Studies, 39(1), p. 97-122
Casady, C. B., Eriksson, K., Levitt, R. E., Scott, W. R. (2019) ˝(Re)defining public-private partnerships (PPPs) in the new public governance (NPG) paradigm: an institutional maturity perspective ,̋ Public Management Review, p. 1-23 objavljeno online i dostupno uz DOI: 10.1080/14719037.2019.1577909.

D. Miljenović, G. Kutnjak, P. Jakovac: Determiniranje obilježja djelotvornosti javnog sektora i javnog...Zbornik Veleučilišta u Rijeci, Vol. 8 (2020), No. 1, pp. 295-311
309
Chan, J. L. (2019) ˝New development: China renews reform of central–local fiscal relations and provides for basic national public services ,̋ Public Money & Management, 39(1), p. 64-69
Christensen, L. T. (2017) ̋ How hybridity has evolved in the governance of state-owned enterprises: evidence from Danish and Swedish passenger rail services from 1990 to 2015 ,̋ Public Money & Management, 37(6), p. 401-408
Considine, M., Nguyen, P., O’Sullivan, S. (2018) ˝New public management and the rule of economic incentives: Australian welfare-to-work from job market signalling perspective ,̋ Public Management Review, 20(8), p. 1186-1204
Deželjin, J., Vujić, V. (1995), Vlasništvo, poduzetništvo, management, Zagreb: Alinea; Rijeka: Sveučilište u Rijeci
Etherington, D. (1996) ˝Strategies for decentralization and local government autonomy—an assessment of a Danish initiative ,̋ Public Money & Management, 16(1), p. 45-50
Europska komisija (2013) European Systems of Accounts, Luxembourg: Publications Office of the European Union, 2013, http://ec.europa.eu/eurostat/web/esa-2010 (11. 4. 2019.)
Gil-Garcia, J. R., Dawes, S. S., Pardo, T.A. (2018) ̋ Digital government and public management research: finding the crossroads ,̋ Public Management Review, 20(5), p. 633-646
Gruening, G (2001) ˝Origin and theoretical basis of New Public Management ,̋ International Public Management Journal, 4, p. 1-25
Hartley, J., Alford, J., Knies, E., Douglas, S. (2017) ˝Towards an empirical research agenda for public value theory ,̋ Public Management Review, 19(5), p. 670-685
Hood, C. (1991) ˝A Public Management for all Seasons?˝ Public Administration, 69, p. 3–19
Jelčić, B. (2001) Javne financije, Zagreb: RRiF-plus
Jørgensen, T. B., Bozeman, B. (2002) Public Values Lost? ˝Comparing cases on contracting out from Denmark and the United States ,̋ Public Management Review, 4(1), p. 63-81
Jovanović, M. (2016) Osnove ekonomike javnog sektora, Rijeka: Pravni fakultet Sveučilišta u Rijeci
Jurčić, Lj. (2011) ˝Restrukturiranje javnog sektora kao pretpostavka rasta profitnog sektora ,̋ izlaganje na 46. Simpoziju ˝Financijske i računovodstvene mjere izlaska iz recesije ,̋ Hrvatska zajednica računovođa i financijskih djelatnika: Dubrovnik, 5. - 7. 5. 2011.,
http://www.efzg.unizg.hr/UserDocsImages/PDS/OrganizacijaIManagement/5._JAVNA_DOBRA_I_JAVNI_SEKTOR.pdf (15. 4. 2019.)
Kattel, R., Cepilovs, A., Drechsler, W., Kalvet, T., Lember, V., Tõnurist, P. (2013) Can we measure public sector innovation? A literature review, Ragnar Nurkse School of Innovation and Governance, Project paper, Tallinn, Estonia: Ragnar Nurkse School of Innovation and Governance.
Khan, A. R., Khandaker, S. (2016) ˝Public and Private Organizations: How Different or Similar are They ,̋ Journal of Siberian Federal University. Humanities & Social Sciences, 9(12), p. 2873-2885
Kinder, T. (2012) ˝Learning, Innovating and Performance in Post-New Public Management of Locally Delivered Public Services ,̋ Public Management Review, 14(3), p. 403-428
Kooiman, J., van Vliet, M. and Jentoft, S. (1993) Creative Governance: Opportunities for Fisheries in Europe, Aldershot: Ashgate
Kostadinović, S. (2008) Upravljanje javnim sektorom, Beograd: Fakultet za menadžment Univerziteta Braća Karić
Kutnjak, G. (2018) „Reforme javnog sektora s osnova novog javnog menadžmenta ,̋ In: Proceedings 6th International Conference ˝Vallis Aurea˝ Focus on: Research & Innovation (ed. Katalinic, B.), 20th-22nd September, Požega/Vienna (Croatia/Austria), p. 215-223
Lapsley, I. (2009) ˝New Public Management: The Cruellest Invention of the Human Spirit?˝ ABACUS, 45(1), p. 1–21
Liu, W.B., Cheng, Z.L., Mingers, J., Qi, L., Meng, W. (2010) ˝The 3E methodology for developing performance indicators for public sector organizations ,̋ Public Money & Management, 30 (5), p. 305-312

D. Miljenović, G. Kutnjak, P. Jakovac: Determiniranje obilježja djelotvornosti javnog sektora i javnog...Zbornik Veleučilišta u Rijeci, Vol. 8 (2020), No. 1, pp. 295-311
310
Lynn Jr., L. E. (1999) ˝Public Management In North America ,̋ Public Management an International Journal of Research and Theory, 1(2), p. 301-310
Massey, A. (2019) ˝Persistent public management reform: an egregore of liberal authoritarianism? ,̋ Public Money & Management, 39(1), p. 9-17
Miljenović, D. (2016) Razvoj modela standardnog izvještavanja o društvenoj odgovornosti poduzeća, doktorska disertacija, Rijeka : Ekonomski fakultet
Miljenović, D. (2018) ˝Testing sustainable value added as an integrative measure of business sustainability ,̋ Proceedings of Rijeka Faculty of Economics and Business: Journal of Economics and Business, 36(1), p. 155-181
Mook, L., Maiorano, J., Ryan, S., Armstrong, A., Quarter, J. (2015) ̋ Turning social return on investment on its head ,̋ Nonprofit Management & Leadership, 26(2), p. 229–246
Mulgan, G. (2010). ˝Measuring social value ,̋Stanford Social Innovation Review, 8(3), p. 38–43
Musgrave, R. A., Musgrave, P. B. (1993) Javne financije u teoriji i praksi, Zagreb: Institut za javne financije
Nutt, P. C. (2005) ˝Comparing Public and Private Sector Decision-Making Practices ,̋ Journal of Public Administration Research and Theory, 16(2), p. 289-318
Ostrom, V. (1973) The Intellectual Crisis in American Public Administration, Alabama: Alabama University Press
Papi, L., Bigoni, M., Bracci, E., Deidda Gagliardo, E. (2018) ˝Measuring public value: a conceptual and applied contribution to the debate ,̋ Public Money & Management, 38(7), p. 503-510
Petersen, O. H. (2010) ˝Regulation of public–private partnerships: the Danish case ,̋ Public Money & Management, 30(3), p. 175-182
Polese, F. et al. (2017) ˝Performance Evaluation and Measurement in Public Organizations: A Systematic Literature Review ,̋ International Journal of Business Administration, 8(1), p. 106-117
Purwohedi, U., Gurd, B. (2019) ˝Using Social Return on Investment (SROI) to measure project impact in local government ,̋ Public Money & Management, 39(1), p. 56-63
Pusić, E. (1993) Nauka o upravi, 10. izmijenjeno i dopunjeno izd., Zagreb: Školska knjiga
Pusić, E. (1995) Upravna znanost, Zagreb: Naprijed
Rana, T., Hoque, Z., Jacobs, K. (2019) ̋ Public sector reform implications for performance measurement and risk management practice: insights from Australia ,̋ Public Money & Management, 39(1), p. 37-45
Salkić, I. (2011) Upravljanje kvalitetom javnih usluga, Sarajevo/Zagreb: BTC Šahinpašić
Schmidt, E., Groeneveld, S., Van de Walle, S. (2017) ˝A change management perspective on public sector cutback management: towards a framework for analysis ,̋ Public Management Review, 19(10), p. 1538-1555
Ministarstvo uprave (2018) Statistički prikaz Ministarstva uprave, broj 9, siječanj. Zagreb: Ministarstvo uprave
Vašiček, D. (2009) ̋ Računovodstvo i financijsko izvještavanje u funkciji upravljanja u javnom sektoru ,̋ Hrvatska i komparativna javna uprava: časopis za teoriju i praksu javne uprave, 9(2), p. 393-420
Žmegač, D., Ostojić, A. (2014) ˝Značajke organizacije javnih i privatnih poslovnih sustava u Republici Hrvatskoj ,̋ In: Proceedings of 4th International Conference ˝Vallis Aurea” Focus on: Regional & Innovation Development,Katalinić, Branko (ur.)., 18.-20.09.2014, Požega: Polytechnic in Pozega, Croatia & DAAAM International Vienna, Austria, p. 0801-0809

D. Miljenović, G. Kutnjak, P. Jakovac: Determiniranje obilježja djelotvornosti javnog sektora i javnog...Zbornik Veleučilišta u Rijeci, Vol. 8 (2020), No. 1, pp. 295-311
311
Review article https://doi.org/10.31784/zvr.8.1.22 Received: 13. 2. 2019. Accepted: 5. 6. 2019.
DETERMINATION OF EFFICIENCY AND EFFECTIVENESS WITHIN PUBLIC SECTOR
AND PUBLIC MANAGEMENTDejan Miljenović
PhD, Assistant Professor, Faculty of Economics and Business, I. Filipovića 4, 51000 Rijeka, Croatia; e-mail: dejan.miljenović@efri.hr
Goran Kutnjak PhD, Full Professor, Faculty of Economics and Business, I. Filipovića 4, 51000 Rijeka, Croatia;
e-mail: [email protected]
Pavle Jakovac PhD, Assistant Professor, Faculty of Economics and Business, I. Filipovića 4, 51000 Rijeka, Croatia;
e-mail: [email protected]
ABSTRACT
The public sector operating in the modern business environment is exposed to the impacts of global business, social and cultural changes to the same extent as the private sector and is, therefore, equally adjusting to the existing socio-economic requests. The general objective of the public sector is, in alignment with the private sector, to improve society, create predispositions to social growth and development, influence the positive determination of national economies and business entities in order to create new values. With the notion of a ˝public service˝, the public sector ensures timely engaged, high quality and content realization of citizens' public interests. Therefore, it is necessary to define and develop models of public management that will adapt to changes in the social environment and effectively manage various aspects of the public sector's internal functions. The aim of this paper is to explore modern aspects of the public sector and to determine adequate public management modalities. The research methodology is based on analysis of the public sector structures in the Republic of Croatia, accompanied with a review of current public governance relationships. Respectfully, the public sector is divided into the general government (public administration) and public (social) companies. Each level of the public sector has its own sub-sectors with different activities, specific goals and requirements. This also requires public management to set the conditions for specialization, multidisciplinary approach and interactivity with different subjects from the business environment. Research results indicate the development of a public management model intended to increase public sector responsiveness to contemporary changes in the social and business environment. The main conclusion states that developing transparent public management is a prerequisite for developing an efficient public sector that can successfully meet the needs of all its users in the 21st century.
Key words: public sector, general state, public companies, public management
Creative Commons Attribution – NonCommercial 4.0 International License


N. Ljubičić, D. Jakšić, P. Poščić: Napadi ubacivanjem SQL izraza – prevencija i obranaZbornik Veleučilišta u Rijeci, Vol. 8 (2020), No. 1, pp. 313-330
313
Pregledni rad https://doi.org/10.31784/zvr.8.1.10 Datum primitka: 25. 11. 2019. Datum prihvaćanja: 8. 1. 2020.
NAPADI UBACIVANJEM SQL IZRAZA – PREVENCIJA I OBRANA
Nikolina Ljubičić Univ. bacc. inf, studentica, 51 000 Rijeka, Hrvatska; e-mail: [email protected]
Danijela Jakšić Dr. sc., docentica, Odjel za informatiku, Sveučilište u Rijeci, Radmile Matejčić 2, 51 000 Rijeka, Hrvatska;
e-mail: [email protected]
Patrizia Poščić Dr. sc., redovita profesorica, Odjel za informatiku, Sveučilište u Rijeci, Radmile Matejčić 2, 51 000 Rijeka,
Hrvatska; e-mail: [email protected]
SAŽETAKNapad ubacivanjem SQL izraza jedna je od najozbiljnijih prijetnji sigurnosti aplikacija zasnovanih nad bazom podataka. Ona omogućuje napadaču da stekne kontrolu nad bazom podataka aplikacije, čime napadač dobiva mogućnost izmjene podataka. Mnoga se istraživanja usmjeravaju na ovaj problem. Brojni su autori predložili različite pristupe za otkrivanje i sprječavanje ove ranjivosti, no koliko je ovaj problem i dan danas prisutan govori i činjenica da ni ti pristupi ne predstavljaju u potpunosti uspješno rješenje. U ovom radu opisano je nekoliko vrsta napada ubacivanjem SQL izraza te različiti alati i metode koji mogu pružiti određenu prevenciju i obranu od tih napada. Predložene su različite metode za rješavanje problema napada ubacivanjem SQL izraza u obliku opsežnih pregleda varijacija napada ubacivanjem SQL izraza te njihovih opisa i primjera, kako bi se bolje spoznao njihov štetan utjecaj i krajnje posljedice. Štoviše, u radu je dan i kratak pregled prijedloga pojedinih autora vezanih uz prevenciju i obranu od napada ubacivanjem SQL izraza. Na kraju je iznesen zaključak uz objektivan pregled i analizu cjelokupnog istraživanja. Glavni doprinos rada je pregled dosadašnjih istraživanja i pristupa vezanih uz: a) prevenciju napada ubacivanjem SQL izraza i b) obranu od napada ubacivanjem SQL izraza.
Ključne riječi: napad ubacivanjem SQL izraza, prevencija, obrana, napad, tehnike
1. UVOD
U današnje vrijeme su Internet i web tehnologije postale vrlo bitne stavke našeg društva, čime se javlja potreba za njihovim stalnim rastom i razvitkom. Samim time povećava se broj poslovnih
Creative Commons Attribution – NonCommercial 4.0 International License

N. Ljubičić, D. Jakšić, P. Poščić: Napadi ubacivanjem SQL izraza – prevencija i obranaZbornik Veleučilišta u Rijeci, Vol. 8 (2020), No. 1, pp. 313-330
314
aplikacija koje sadrže osobne, financijske i ostale vrste podataka, a povezane su na Internet, ili ga koriste kao temelj svojeg svakodnevnog rada. Sukladno tome povećao se i broj napada ubacivanjem SQL izraza, odnosno dovodi se u pitanje sigurnost njihove baze podataka. Napad ubacivanjem SQL izraza predstavlja napad u kojem se zlonamjeran kod umeće u nizove koji se kasnije prosljeđuju SQL poslužitelju za raščlanjivanje i izvršavanje. Ako pri izradi aplikacije postoji nedostatak odgovarajućeg znanja ili nerazumijevanje određenih segmenata ona time postaje podložnija napadima ubacivanjem SQL izraza. Određeno potencijalno rješenje može biti učinkovito u sadašnjoj upotrebi, ali se zbog promjene tehnologije pojavljuju novi rizici i izazovi. Štoviše, moraju se kombinirati različita rješenja učinkovitosti protiv različitih vrsta napada i sigurnosti te zbog toga sustav treba biti pod stalnim nadzorom.
Postoji više načina da programer, odnosno administrator sustava, spriječi napade na svoje sustave. Pri tome se koriste brojne tehnike u sustavima koji imaju različite primjene, kao što su: provjera unosa, najmanje privilegije, prilagođena poruka o pogrešci i slično. Iako ove tehnike predstavljaju najbolji način za prevenciju i obranu od ranjivosti napada ubacivanjem SQL izraza, njihova primjena je problematična u praksi. Te su tehnike sklone ljudskim pogreškama te stoga nisu jednako učinkovite kao automatizirane tehnike, unatoč trudu programera da primjene defanzivno kodiranje prema svim pravilima - uvijek postoji mogućnost da se potkradu greške. Stoga su istraživači predložili niz tehnika i pristupa da pomognu razvojnim inženjerima nadoknaditi nedostatke prilikom kodiranja.
2. NAPAD UBACIVANJEM SQL IZRAZA
Napad ubacivanjem SQL izraza odnosi se na slabost ili nedostatak u sustavu, koji se iskorištava na način da neovlašteni korisnik pristupa pohranjenim podacima. Napad općenito predstavlja ilegalni pristup koji je stečen dobro izrađenim mehanizmima. Napad ubacivanjem SQL izraza je vrsta napada prilikom kojeg napadač dodaje zlonamjerne ključne riječi ili operatore u SQL upite. To napadaču omogućuje ilegalan i neograničen pristup pohranjenim podacima u bazi podataka (Kindy i sur., 2012). Napadači su razvili široku lepezu sofisticiranih tehnika napada koje se koriste prilikom iskorištavanja SQL ranjivosti (Halfond, Orso, 2008).
SQL napadi se najčešće događaju kada programer web aplikacije nije osigurao da se primljene vrijednosti iz web obrasca, kolačića, ulaznog parametra i slično zaštite. Parametre je potrebno provjeriti prije prosljeđivanja SQL upitima koji će se kasnije izvršiti na poslužiteljima baze podataka (Clarck, 2012).
U svrhu izbjegavanja napada potrebno je dobro poznavanje temeljne baze podataka s kojom su programeri u interakciji te dubinsko razumijevanje i svijest o mogućim sigurnosnim pitanjima. U suprotnome programeri aplikacija često mogu razviti inherentno nesigurne aplikacije koje su osjetljive na napade ubacivanjem SQL izraza. Svaka aplikacija je različita pa samim time treba biti svjestan da je na taj način i svaka SQL točka ubrizgavanja jedinstvena (Clarck, 2012).

N. Ljubičić, D. Jakšić, P. Poščić: Napadi ubacivanjem SQL izraza – prevencija i obranaZbornik Veleučilišta u Rijeci, Vol. 8 (2020), No. 1, pp. 313-330
315
2. 1 Primjeri napada ubacivanjem SQL izraza
Teško je prikupiti točne podatke o tome koliko je organizacija bilo ugroženo i napadnuto putem napada ubacivanjem SQL izraza kroz povijest. Povrede sigurnosti i uspješnost napada izvršenih od strane zlonamjernih napadača su zasigurno omiljena tema svjetskih medija. Štoviše, ova tema je postala jako publicirana. Čak i najmanji slučajevi napada neće proći nezapaženo široj javnosti, dok se nekad napadi nisu toliko objavljivali (Clarck, 2012). Međutim, poznato je kako će velike tvrtke zasigurno taj problem pokušati, pa na kraju čak i uspjeti, sakriti od javnosti.
Ovdje su prikazani samo neki od javno dostupnih izvora gdje su injekcijski napadi prouzročili probleme:
• U prosincu 2006. godine američki diskontni trgovac TJX uspješno je napadnut i napadači su ukrali milijune podataka o platnim karticama iz TJX baza podataka
• U kolovozu 2007. godine napadnuto je web-mjesto Ujedinjenih naroda umetanjem SQL izraza kako bi se prikazale anti-američke poruke
• U srpnju 2008. godine napadnuta je Malezijska stranica antivirusnog alata „Kaspersky“ umetanjem SQL koda
• U lipnju 2011. godine napadnuta je web stranica pjevačice Lady Gage umetanjem SQL koda. Napadom su prikupljeni podaci o obožavateljima kao što su: njihove e-mail adrese, brojevi telefon te adrese mjesta stanovanja. Smatra se kako su ti podaci iskorišteni za daljnje napade
• U ožujku 2011. godine napadnuta je web stranica „mysql.com“ umetanjem SQL koda (Clarck, 2012)
Postoji veliki broj slučaja gdje napadači umeću SQL izraze kako bi došlo do napada na bazu podataka, ovdje su navedeni neki najčešći primjeri.
Napadači imaju cilj zaobići izvršavanje pravilne prijave. Oni su dužni upisati svoje korisničko ime i lozinku, ali to rade na način da u polje, na primjer, unose izraz ‘OR ‘1’ = ‘1, čime se stvara sljedeći SQL kod:
SELECT Ime FROM Korisnik
WHERE Ime = ‘ ‘ OR ‘1’ = ‘1’
AND Lozinka = ‘ ‘ OR ‘1’ = ‘1’
Nakon takvog upita, više se ne uspoređuju podaci koje je predao korisnik sa onima u bazi podataka, već upit uspoređuje samo istinitost relacije, odnosno provjerava je li tvrdnja ‘1’ = ‘1’ istinita. Rezultat toga je uvijek istinit. Samim time svi uvjeti u WHERE dijelu postaju zadovoljeni te se vraća prvi redak u određenoj tablici.
Postoje i drukčiji načini da napadač unese sličan niz znakova, no učinak za napadača i posljedica za bazu je ista. Moguće je umetnuti sljedeći niz znakova: ‘ OR ‘x’ = ‘x , ‘ OR’ ‘ = ‘ i OR 1=1. Valja napomenuti kako je uz spomenute nizove moguće napraviti još nekoliko dodatnih varijanti. Ovaj napad je utemeljen na tautologiji.

N. Ljubičić, D. Jakšić, P. Poščić: Napadi ubacivanjem SQL izraza – prevencija i obranaZbornik Veleučilišta u Rijeci, Vol. 8 (2020), No. 1, pp. 313-330
316
Postoji mogućnost da napadač zagasi bazu podataka naredbom SHUTDOWN. Kako bi napadač u tome uspio u određeno polje za unos korisničkog imena i lozinke napadač upisuje: ‘; SHUTDOWN – – . Nakon toga dobiva sljedeći SQL kod:
SELECT Ime FROM Korisnik
WHERE Ime = ‘ ‘ ;
SHUTDOWN – –
‘AND Lozinka = ‘password’
Također, postoji i naredba koja briše cijelu bazu podataka sa svim podacima. U slučaju kada napadač pronađe način da ubaci naredbu DROP TABLE tada dolazi do uništenja cijele baze podataka. Kako bi to uspio napadač unosi u polje sljedeće podatke: ‘ ; DROP TABLE Korisnik – – . Nakon čega se dobiva sljedeći SQL kod koji je skoro pa identičan u odnosu na prethodno spomenuti kod:
SELECT Ime FROM Korisnik
WHERE Ime = ‘ ‘ ;
DROP TABLE Korisnik – –
‘AND Lozinka = ‘password’
Ovdje su prikazani primjeri samo nekih najčešćih oblika napada. (Clarke, 2012).
Iz navedenih primjera se može primijetiti kako niti jedna stranica nije u potpunosti zaštićena od SQL napada.
2. 2 Vrste SQL napada
Nije lako odrediti i kategorizirati sve vrste SQL napada. Isti napadi mogu se u određenim slučajevima zvati različitim nazivom, ovisno o scenariju sustava. Postoje različite metode napada koje ponajviše ovise o cilju napadača. U ovome poglavlju predstavit će se samo najčešće. U sljedećoj tablici prikazan je kratak opis određene vrste te njezina svrha.
Tablica 1. Vrste SQL napada
Vrsta SQL napada
Opis Svrha
Tautologija
Ubrizgavaju se u jednu ili više uvjetnih naredbi te se uvijek
ocjenjuju kao istiniti (Halfond i Orso, 2008)
Određivanje injekcijskih parametara, zaobilaženje autentifikacija te izdvajanje
podataka (John i sur., 2012)

N. Ljubičić, D. Jakšić, P. Poščić: Napadi ubacivanjem SQL izraza – prevencija i obranaZbornik Veleučilišta u Rijeci, Vol. 8 (2020), No. 1, pp. 313-330
317
Union upit
Ova vrsta napada se izvršava umetanjem ključnog parametra „UNION“
(Parameswari, Kavitha, 2018)
Zaobilaženje provjere autentičnosti i izdvajanje podataka (Parameswari, Kavitha,
2018)
Piggy backed upit
Kod ovog tipa napada zlonamjerni napadač ubacuje dodatne upite u izvorni upit
(Fouad, Elshazly, 2013)
Izdvajanje podataka te izmjenjivanje skupa podataka (Fouad, Elshazly, 2013)
Logički neispravan upit
Ovaj napad se smatra preliminarnim korakom za daljnje napade. Šalju se pogrešni upiti u bazu podataka nakon čega
poslužitelj baze podataka vraća poruke o pogrešci koje napadač iskorištava za daljnje
napade (Fouad, Elshazly, 2013)
Određivanje injekcijskih parametara, identificiranje baze podataka te izdvajanje
podataka (Fouad, Elshazly, 2013)
Svim napadima je zajednički cilj prikupiti što više osobnih informacija kako bi se ti podaci mogli dalje iskorištavati.
3. PREVENCIJA
SQL napadi mogu prouzročiti iznimne štete. Stoga je potrebno poduzeti pravodobne mjere zaštite prije nego što do napada uopće dođe. To se postiže prevencijom koja predstavlja skup mjera i postupaka kojim se sprječava potencijalni napad. Prevencija traži način na koji bi se izbjegao potencijalni napad.
Prevencija se postiže provjeravanjem ulaznih podataka što ujedno predstavlja najjednostavniji način prevencije. Programer može onemogućiti ulaz određenih znakova i na taj način se aplikacije mogu zaštiti od mogućih napada. Međutim, mnogi programeri ignoriraju ovu vrstu provjere (Zhang i sur., 2011).
Poseban problem koji se pojavljuje je unošenje meta znakova, jer ih napadači zlonamjerno iskorištavaju. Zabrana takvih znakova nije nužno rješenje. Bolje rješenje bilo bi korištenje funkcija koje kodiraju cjelinu tako da se svi meta znakovi posebno šifriraju i interpretiraju od strane baze podataka. Programeri nisu uvijek u mogućnosti provjeravati sve nevažeće unose pa je s te strane potrebno odrediti one ulaze koji su zakoniti upravo uz pomoć tih funkcija. Ovakav pristup u kojem dolazi do provjere valjanosti unosa naziva se pozitivno podudaranje uzoraka (Halfond i sur., 2006).
Funkcije i procedure koje će zasigurno pomoći pri prevenciji od napada ubacivanjem SQL izraza navedene su u nastavku.

N. Ljubičić, D. Jakšić, P. Poščić: Napadi ubacivanjem SQL izraza – prevencija i obranaZbornik Veleučilišta u Rijeci, Vol. 8 (2020), No. 1, pp. 313-330
318
QUOTENAME čini funkciju koja se koristi za izbjegavanje napada ubacivanjem SQL izraza na način da se varijable pročišćuju od neželjenih znakova te na taj način štite podatke izložene napadima. Ova funkcija predstavlja ugrađenu funkciju SQL Servera te sadrži neka ograničenja kao što je primjerice to da ulazni niz znakova funkcije QUOTENAME može imati samo 128 znakova, a ukoliko je dužina znakova veća od 128 znakova vraća se NULL (Khan, 2005).
Proširena pohranjena procedura sp_executesql također može smanjiti broj napada ubacivanjem SQL izraza, odnosno zaštititi od napada. Spomenuta procedura uzima tip podataka u obliku niza (engl. string) konstante ili varijable kao SQL izraz za izvršavanje. Također, sp_executesql nudi još jednu prednost, a to je da može odrediti svoje parametre odvojeno od izjave. Bitno je istaknuti kako sp_executesql parametrizacija na strani klijenta štiti od napada i pruža prednosti performanse u pred memoriranju upita pri ponovnom izvođenju (Coles, 2007).
Postoji mogućnost da do napada dođe čak i nakon primjene obrambenih praksi kodiranja. Prije svega to se događa jer je teško obuhvatiti sve izvore ulaza (engl. input) u obrambenim praksama kodiranja. Takvo kodiranje sklono je ljudskoj pogrešci pa samim time nije precizno i potpuno kao primjenjivanje nekih automatiziranih tehnika (Mavromoustakos, 2016).
Napadi ubacivanjem SQL izraza su ozbiljna prijetnja za web baze podataka, a posebno u današnje vrijeme kad računarstvo, pohrana i aplikacije u oblaku postaju sve popularnije i korištenije. Kako bi se riješio ovaj problem, u radu (Haixia, Zhihong, 2009) prikazana je shema testiranja sigurnosti baze podataka. Ona proučava kako otkriti potencijalne ulazne točke napada ubacivanjem SQL izraza, automatski generirati testne slučajeve i pronaći ranjivost baza podataka.
Autori (Haixia, Zhihong, 2009) predložili su i nekoliko metoda, kao što su: otkrivanje mogućih ulaznih točaka napada ubacivanjem SQL izraza, automatsko generiranje testnih slučajeva te konačno pronalaženje ranjivosti na bazama podataka pokretanjem testnih slučajeva za simulaciju napada na web-aplikaciju. Predložena shema se pokazala kao učinkovita jer točno prepoznaje ulazne točke injekcije u očekivanom vremenu.
Međutim, nakon analize sheme, otkriveno je kako pristup ne daje potpuno rješenje, već su potrebna dodatna poboljšanja u dva glavna aspekta: sposobnost otkrivanja i razvoj pravila napada.
4. TEHNIKE I MEHANIZMI PREVENCIJE
Postoje razne metode, tehnike i algoritmi koji se primjenjuju kako bi se spriječilo da do napada uopće dođe. Sukladno tome koriste se određeni mehanizmi prevencije koji su opisani u ovom poglavlju.
4. 1 Usporedba triju algoritama
U ovom djelu analizirana su tri najpoznatija algoritma:
Algoritam podudaranja uzoraka: U ovom algoritmu uobičajene SQL naredbe za ubrizgavanje se sastoje od posebnih znakova kao što su: {}, [], (), &, +, ‘, =, <>, < = >. U tu skupinu spadaju i ključne riječi kao što su: ažuriranje, brisanje, ispuštanje, sjedinjavanje te Boolean znakovi kao što su:

N. Ljubičić, D. Jakšić, P. Poščić: Napadi ubacivanjem SQL izraza – prevencija i obranaZbornik Veleučilišta u Rijeci, Vol. 8 (2020), No. 1, pp. 313-330
319
AND i OR. Korisnički unos se zatim uspoređuje s iznad navedenim propisima kako bi se provjerila ranjivost s obzirom na napade ubacivanjem SQL izraza. Rezultati ove metode nisu uvijek korisni te ponekad može doći do pogrešne procjene ranjivosti (Senthilkumar i sur., 2017).
Algoritam za provjeru valjanosti stabla raščlanjivanja: Stablo raščlanjivanja sadrži različite čvorove za svaki segment upita. Ono je raščlanjeno prikazivanjem SQL upita. Kako bi se izvršila ova operacija potrebno je poznavanje gramatike jezika. Nakon generaliziranja i stvaranja novog upita dobivaju se stabla koja se mogu usporediti kako bi se utvrdilo sadrže li oba upita istu strukturu. Stablo s ispravnim korisničkim unosima ispunjava prazne čvorove na stablu. Ako dođe do neispravnih korisničkih unosa, stablo koje se tada izradilo razlikuje se od onog s ispravnim unosima te se time potvrđuje njegova ranjivost (Senthilkumar i sur., 2017).
Kriptografija: Ovaj algoritam ima za cilj pohranjivanje korisničkih ulaza i ostalih podataka u šifriranom obliku obrasca u bazi podataka. Ovom metodom šifrirani oblik unosa ulazi u upit za usporedbu s bazom podataka i time sprječava injekciju. Čak i ako napadač kojim slučajem uspije pristupiti podacima, oni će biti u šifriranom obliku. Samim time podatke se ne može dešifrirati ako napadač ne poznaje korišteni način šifriranja i ključ za šifriranje (Senthilkumar i sur., 2017).
Hibridni algoritam: Ovaj algoritam sastoji se od najboljih značajki prethodno navedenih algoritama. Korisnički unosi se najprije uspoređuju s nizom uzoraka za provjeru ranjivosti prijetnje. Ako su uzorci prisutni potrebno je raščlaniti SQL upite na stabla, prije i poslije dodavanja ulaza te ih zatim usporediti. Vrijednosti se dešifriraju prije prikazivanja korisniku (Senthilkumar i sur., 2017).
Svaki od prethodno spomenutih algoritama koristi se za otkrivanje i prevenciju SQL ranjivosti na temelju korisničkih ulaza. Spomenuti algoritmi nisu uvijek učinkoviti te su skloni pogreškama. Stoga se preporučuje korištenje hibridnog algoritma. Ovaj algoritam provodi daljnje provjere nakon što jedan algoritam otkrije ranjivost. Zatim obavlja provjeru valjanosti stabla i kriptografije u svrhu poboljšanja učinkovitosti validacije, ako su ulazi osjetljivi na napade ubacivanjem SQL izraza. (Senthilkumar i sur., 2017).
Ispod je dana tablica koja prikazuje prethodno spomenute algoritme. Iz tablice je vidljivo kako se najveća efektivnost postiže upravo Hibridnim algoritmom, a pri čemu je algoritam za podudaranje uzoraka najmanje efikasan (Senthilkumar i sur., 2017).
Tablica 2. Prikaz efikasnosti određenih algoritama
SQLi Tehnike\Algoritmi
Podudaranje uzoraka
Validacija stabala raščlanjivanja
KriptografijaHibridni
Algoritam
Tautologija Manje efikasno Jako efikasno Efikasno Jako efikasno
UNION Efikasno Efikasno Efikasno Jako efikasno
Komentar Efikasno Jako efikasno Efikasno Jako efikasnoIzvor: Senthilkumar, Reddy(2017)
U nastavku je opisano još nekoliko preventivnih tehnika:

N. Ljubičić, D. Jakšić, P. Poščić: Napadi ubacivanjem SQL izraza – prevencija i obranaZbornik Veleučilišta u Rijeci, Vol. 8 (2020), No. 1, pp. 313-330
320
PSIAQOP: Ova metoda služi za sprječavanje napada ubacivanjem SQL izraza temeljenih na procesu optimizacije upita. Tehnika se zasniva na optimizaciji SQL upita koji dobivaju ulazne podatke od korisnika te su ujedno ranjivi u fazi izvođenja. PSIAQOP analizira izvorni kôd koji se koristi u web aplikacijama i identificira točke koje predstavljaju ranjive upite. Nakon toga ranjivi upiti prolaze kroz proces optimizacije koji se temelji na heurističkim pravilima. U ovom slučaju, analizator upita najprije generira inicijalno predstavljanje ranjivih upita koji je uglavnom u oblicima relacijskog izraza algebre kojim upravlja mehanizam optimizacije. Pogon optimizacije zatim generira broj važećih izvedbi u skladu s heurističkim pravilima za odabir optimalnog plana. Konačno, PSIAQOP zamjenjuje svaku točku pristupne točke optimiziranim upitom u kodu web aplikacije. Web aplikacija tada normalno pokreće svoj kôd te sprječava napade ubacivanjem SQL izraza u postizanju štetnih ciljeva (Lawal i sur., 2016).
SQLProb: Arhitektura koja je utemeljena na proxy poslužitelju kao cilj sprječavanja SQL napada. Ova metoda koristi se u operativnoj pozadini kako bi zaštitila back-end i front-end web servise. Tehnika dinamički prepoznaje i uklanja zlonamjerne SQL strukture sa korisničkih ulaza (Liu i sur., 2009).
X-LOG: Tehnika za provjeru autentičnosti kako bi se spriječili napade ubacivanjem SQL izraza. U ovoj se metodi prijetnja napada ubacivanjem SQL izraza provjerava tijekom izvođenja (engl. runtime). Ova metoda nadgledava dinamički stvorene upite s modelom podataka koji je kreiran od strane X-Log generatora tijekom izvođenja. U slučaju kada sličnost podataka nije ista model prikazuje potencijalni SQL napad. Tada se zaustavlja izvršavanje i izvještavanje na bazi podataka (Indrani, Ramaraj, 2011).
ASCII tehnika: Učinkovita tehnika za detekciju i prevenciju od napada ubacivanjem SQL izraza koja koristi ASCII znakove. Tehnika kombinira statičku i dinamičku analizu. Prevencijske metode su podijeljene u nekoliko faza:
a. Zamjenski znak koji je korišten od strane napadača i zaustavljen detektorom za tekst.
b. Postoji ograničenje za prijavu kao i definirani broj znakova koji se može koristiti za prijavu i unošenje lozinke.
c. ASCII vrijednost se stvara u bazi podataka za osjetljive podatke kao što su: korisnički ID ASCII i ASCII lozinka za zaštitu baze podataka (Balasundram, Ramaraj, 2012).
Amnesia: Ova metoda je potpuno automatizirana u sustavu zaustavljanja SQL napada. Prepoznaje upite prije nego što se krenu izvršavati. Oni su prethodno prepoznati pomoću pristupa koji je temeljen na modelu, a sastoji se od statičkog dijela u kojem se automatski gradi model legitimnog upita pomoću analize programa. Drugi dio od kojeg se model sastoji je dinamički dio u kojem se pregledava i provjerava autentičnost upita koji su dinamički stvoreni sa statičkim modelom kao pomoć pri praćenju izvođenja. Blokiraju se oni upiti za koje se misli da su zlonamjerni. Tehnika se sastoji od nekoliko faza: prepoznavanje hotspota, stvaranje SQL-upita, primjena instrumenata, provjera tijekom izvođenja i nadzor (Kumar, Pateriya, 2012), (Johari, Sharma, 2012). U (Junjin, 2009) Junjin predlaže korištenje ove metode za praćenje SQL ulaznih tokova kao i za generiranje testnih slučajeva.

N. Ljubičić, D. Jakšić, P. Poščić: Napadi ubacivanjem SQL izraza – prevencija i obranaZbornik Veleučilišta u Rijeci, Vol. 8 (2020), No. 1, pp. 313-330
321
CANDID: Metoda dinamičke ocjene kandidata za automatsko sprječavanje napada ubacivanjem SQL izraza. Ovaj okvir dinamički izdvaja strukture upita te rješava problem vezan uz ručno mijenjanje aplikacije za izradu pripremljenih izjava. Pokazalo se kako je ova metoda učinkovita samo u nekim slučajevima. Na primjer, neučinkovita je kada se suočava sa vanjskim funkcijama i kada se primjenjuje na pogrešnoj razini. Osim toga, metoda ponekad ne uspijeva zbog ograničene sposobnosti sustava. Bisht i suradnici (Bisht i sur., 2010) predlažu metodu CANDID, prvenstveno iz razloga što rješava problem ručne izmjene aplikacije za izradu pripremljenih izjava.
SQL Dom: Ova tehnika koristi sve razine sučelja (CLI) koje se nalaze na sredini aplikacije i njene baze podataka. Ovo rješenje koristi API koji analizira baze podataka. API određuje ispravnu validaciju ulaznih podataka koja se provjerava kod kompilacije (Kumar, Pateriya, 2012), (Tajpour, 2011), (Amirtahmasebi, 2009).
Tehnike se uglavnom fokusiraju na prepoznavanje prepreka u interakciji s bazom podataka putem CLI-a. SQL DOM je predloženo rješenje za njihovo rješavanje sigurnog okuženja za komunikaciju. Kvalitetna procjena ovog pristupa je pokazala mnoge prednosti u smislu pogreške otkrivanja tijekom vremena kompiliranja, pouzdanosti, testiranja i održavanja. Iako se ovaj mehanizam smatra učinkovitim, on svejedno može biti dodatno poboljšan s više naprednih i novijih alata (Kumar, Pateriya, 2012).
SANIA: Sintaktička i semantička analiza za automatizaciju testiranja protiv napada ubacivanjem SQL izraza, odnosno Sania. Sania predstavlja tehniku za otkivanje SQL napada na web aplikacijama koje su u razvoju te posljedično otklanja pogreške pomoću sljedećih pet postupaka:
a. Sania dohvaća SQL upite između web aplikacije i baze. Zatim prikuplja pravilne SQL upite između klijenta i web aplikacije te između web aplikacije i baze podataka pri čemu anali-zira ranjivost.
b. Automatski generira i razrađuje napade prema sintaksi i semantici potencijalno osjetljivih mjesta u SQL upitima.
c. Nakon napada se s generiranim kodom sakupljaju stvoreni SQL upiti.
d. Sania uspoređuje stabla raščlanjivanja planiranog SQL upita i onih koji su nastali nakon napada kako bi procijenila sigurnost tih mjesta.
e. Konačno, Sania određuje je li napad uspio ili nije.
Analizirajući sintaksu stabla raščlanjivanja SQL upita, moguće je generirati precizne zahtjeve za točnim napadom (Sajjadi, Pour, 2013).
AIIDA-SQL: Ova metoda sugerira hibridni pristup temeljen na adaptivnoj inteligentnoj detekciji za otkrivanje napada ubacivanjem SQL izraza. AIIDA-SQL kombinira prednosti CBR (engl. Case-Based Reasoning) sustava utemeljenog na učenju te prilagodbi s mogućnostima kombinacije umjetne neuronske mreže (engl. Artificial Neural Network) i stroja za vektorsku potporu (engl. Support Vector Machine). Kroz te mehanizme uzimaju se prednosti obje strategije kako bi klasificiranje SQL upita bilo što pouzdanije. Konačno, kako bi se SQL upiti klasificirali kao nepovjerljivi, koristi

N. Ljubičić, D. Jakšić, P. Poščić: Napadi ubacivanjem SQL izraza – prevencija i obranaZbornik Veleučilišta u Rijeci, Vol. 8 (2020), No. 1, pp. 313-330
322
se mehanizam virtualizacije koja kombinira tehnike klasteriranja i neuronskih modela koji su bez nadzora (Sajjadi, Pour, 2013).
Kombinatorni pristup za sprečavanje napada ubacivanjem SQL izraza: Ova tehnika koristi inovativan visoko automatiziran pristup za sprečavanje napada ubacivanjem SQL izraza na web aplikacijama. Ovaj se pristup sastoji od tri koraka:
• Analiziranje točaka iz aplikacije
• Zaštita koda web aplikacije statičkom analizom i provjerom tijekom izvođenja koristeći Hirschberg algoritam za otkrivanje napada ubacivanjem SQL izraza
SUBP (sustav za upravljanje bazom podataka) zatim se koristi pri metodi revizije kako bi se otkrile transakcije. Hircbergov algoritam koristi podjelu te smanjuje vrijeme i prostor za otkrivanjem SQL prijetnji ubrizgavanja. Podržava autentifikaciju korisnika kako bi zaustavilo izvršenje napada ubacivanjem SQL izraza nakon analize SUBP-a (Ezumalai, Aghila, 2009).
SAFELI: Ovo je okvir statičke analize dizajna koji se temelji na prepoznavanju ranjivosti napada ubacivanjem SQL izraza tijekom kompilacijskog vremena. Loša strana ove tehnike je da detektira samo napade ubacivanjem SQL izraza koji se provode posebno na Microsoftovim proizvodima (Fu, Qian, 2008).
SWADDLER: Ova tehnika ispituje stanje internih web aplikacija. Na vrlo dojmljiv način pokazuje otpornost na složene napade na web aplikacijama korištenjem jedne ili čak više varijabli. Tehnika u početku opisuje normalne vrijednosti varijable stanja aplikacije u kritičnim točkama komponenti aplikacije. Kasnije, tijekom faze detekcije pristup prati primjenu nad aplikacijama za identificiranje abnormalnih stanja. Nedostatak ovog pristupa je taj da ponekad djelomično otkriva napade ubacivanjem SQL izraza (Cova i sur., 2007).
5. OBRANA
Kad dolazi do napada na sustav ponekad je potrebno koristiti neke druge tehnike i mehanizme koji se ponešto razlikuju od preventivnih tehnika.
Mehanizmi obrane uključuju tehnike kao što su: resetiranje sustava, reorganiziranje različitih elemenata u sustavu, ponovno miješanje baze podataka i slično. To predstavlja shemu oporavka od napada ubacivanjem SQL izraza (Kindy i sur., 2012).
Stephen Tomas i njegovi suradnici predložili su pripremljeni zamjenski algoritam i odgovarajuću automatizaciju za uklanjanje ranjivosti od napada ubacivanjem SQL izraza iz ranjivih SQL izraza, zamjenjujući ih sa sigurnim pripremljenim izjavama. Ovdje se ne pokušava ukloniti ranjivost SQL izraza, već je naglasak na zamjeni SQL izraza sa već sigurnim i pripremljenim izrazima. Kreiran je pripremljeni algoritam za zamjenu izraza pod nazivom PSR algoritam (engl. Prepared Statement Replacament) koji prikuplja informacije iz izvornoga kôda koji sadrži maliciozni kôd. Na taj se način generira siguran pripremljeni kôd izraza koji održava funkcionalni integritet. Sukladno tome, kreiran je i PSR generator koji automatizira generiranje pripremljenog kôda na temelju izraza u Javi. PSR generator je napisan u Javi zbog dostupnosti Open source Java projekata koji sadrži SQLIV.

N. Ljubičić, D. Jakšić, P. Poščić: Napadi ubacivanjem SQL izraza – prevencija i obranaZbornik Veleučilišta u Rijeci, Vol. 8 (2020), No. 1, pp. 313-330
323
Njihov istraživački rad je proveden korištenjem četiri prijedloga otvorenog izvora: (i) Net-trust, (ii)ITrust, (iii) WebGoat i (iv) Roller. Na temelju analize, njihov pripremljeni kôd SQL izraza bio je u stanju zamijeniti 64% ranjivosti napada ubacivanjem SQL izraza u četiri otvorena prijedloga izvora. Tada je još analiza provedena samo pomoću Jave, s ograničenim brojem prijedloga. Međutim, logika u algoritmu nije ograničena, pa se može koristiti i proširiti kako bi odgovaralo sintaksi bilo kojeg jezika. To je i dalje otvoreno istraživanje koje je potrebno detaljnije istražiti (Thomas i sur., 2007).
Za obranu od napada ubacivanjem SQL izraza koristi se još jedan pristup, a to je: SQL Rand. Ovaj pristup koristi proxy poslužitelj smješten na sredini web poslužitelja i poslužitelja baze podataka za razmijenjene upite između klijenta i poslužitelja baze podataka. Poslužitelj baze podataka prima skup prihvaćenih ključnih riječi iz nasumičnih SQL upita za računanje. Pogreška koju je stvorio poslužitelj baze podataka, a koja se sastoji od nelegitimnih upita skrivena je kako bi se izbjeglo da se hakeru pruži prilika za dobivanje arhitekture tablica i shema baze podataka (Kumar, Pateriya, 2012), (Tajpour i sur., 2011), (Amirtahmasebi, 2009).
Za provedbu su koristili koncept proxy poslužitelja između Web poslužitelja i SQL poslužitelja. Ne-nasumični upiti primljeni od klijenta šalju zahtjev poslužitelju. Ovaj okvir ne-nasumičnosti ima dvije glavne prednosti: prenosivost koja je primijenjena sa širokim rasponom DBMS-a i sigurnost. Predložena shema ima dobre performanse. Dakle, učinkovito je s obzirom na postignute rezultate i obranu protiv ubrizganih upita. Međutim, još uvijek zahtijeva daljnje testiranje i podršku od strane programera u izgradnji alata koji koriste SQLrand (Boyd, Keromytis, 2004).
U literaturi se najviše raspravlja o prevenciji, pa samim time nema puno govora i prijedloga kako se obraniti od napada ubacivanjem SQL izraza. Prioritet je dan na prevenciji, odnosno želi se na vrijeme zaštiti aplikacije i baze podataka kako do napada ne bi ni došlo, što u konačnici uvelike ima smisla provoditi.
6. PREGLED PRISTUPA
Do sada su korišteni mnogi okviri i pristupi za prevenciju i obranu od napada ubacivanjem SQL izraza u web-aplikacijama. Ovdje će se ukratko spomenuti istaknuta rješenja i njihove metode rada, kako bi čitatelji dobili bolji pregled o temeljnim idejama.
U ovom radu (Panah i sur., 2016) predstavljen je novi pristup za rasijecanje HTTP prometa i pregled složenih napada ubacivanjem SQL izraza. Model koji je predstavljen je hibridni sustav za sprečavanje ubrizgavanja (HIPS) koji koristi klasifikator strojnog učenja i mehanizma za provjeru uzorka, koji se temelji na smanjenim skupovima sigurnosnih pravila. Njihova arhitektura vatrozida web aplikacija ima za cilj optimizirati performanse otkrivanja pomoću modula predviđanja koji isključuje legitimne zahtjeve iz procesa nadzora (Makiou i sur., 2014).
U (Appelt i sur., 2014) autori predstavljaju pristup automatiziranog testiranja pod nazivom μ4SQLi i njegov temeljni skup operatora mutacija. μ4SQLi može proizvesti učinkovite ulaze koji dovode do izvršnih i štetnih SQL izraza. Izvršnost je ključna jer se inače ne može iskoristiti ranjivost ubrizgavanja. Njihova procjena je pokazala da je pristup učinkovit za otkrivanje ranjivosti pri

N. Ljubičić, D. Jakšić, P. Poščić: Napadi ubacivanjem SQL izraza – prevencija i obranaZbornik Veleučilišta u Rijeci, Vol. 8 (2020), No. 1, pp. 313-330
324
napadu ubacivanjem SQL izraza i za proizvodnju ulaza koji zaobilaze vatrozide aplikacija, što je uobičajena konfiguracija u stvarnom svijetu.
Alnabusi i suradnici predlažu inovativno rješenje za filtriranje napada ubacivanjem SQL izraza pomoću SNORT IDS-a. Predložena tehnika detekcije koristi SNORT alat povećavajući brojna dodatna SNORT pravila. Predloženo rješenje su usporedili s još nekoliko postojećih tehnika. Eksperimentalni rezultati pokazuju da predložena metoda nadmašuje druge slične tehnike koristeći isti skup podataka (Alnabusi i sur., 2015).
Ovaj rad (Das, Bhattacharrya, 2018) prikazuje metodu provjere web-dokumenata i izvodi se eksperimentiranje na strani klijenta koristeći benignu strukturu skripte. Ova metoda može otkriti sve zlonamjerne skripte koje se ubacuju u web-dokument tijekom transporta od poslužitelja do klijenta ili zbog prethodno pohranjenih sadržaja u operaciji klijenata ili poslužitelja. Zadovoljavajući rezultati pronađeni su vlastitim generiranjem i javno dostupnim skupom podataka.
Ovaj rad (Kar i sur., 2015) predstavlja novi pristup za detekciju napada ubacivanjem SQL izraza u realnom vremenu pomoću transformacije upita i mjere sličnosti dokumenata. Djelujući kao vatrozid baze podataka, predloženi sustav pod nazivom SQLiDDS može zaštititi više web aplikacija pomoću poslužitelja baze podataka. Uz dodatne ulazne podatke od stručnjaka za ljudske resurse, SQLiDDS također može postati robusniji tijekom vremena. Provedeni eksperimenti kao rezultat su dobili potvrdu da ovaj pristup može učinkovito otkriti i spriječiti sve vrste napada ubacivanjem SQL izraza s dobrom točnošću, ali zanemarivim utjecajem na performanse sustava. Pristup je testiran na web aplikacijama izrađenim pomoću PHP-a i MySQL-a, no može se lako primijeniti u drugim platformama s minimalnim promjenama.
U (Ruse i sur., 2010) Ruse i suradnici predlažu tehniku i okvir koji koriste automatsko generiranje testnog slučaja radi otkrivanja napada ubacivanjem SQL izraza. Glavna ideja ovog okvira temelji se na stvaranju specifičnog modela koji se automatski bavi SQL upitima. Pokazalo se kako metodologija može specifično identificirati 85% točnosti. Štoviše, ne proizvodi lažne pozitive ili lažne negative i u stanju je otkriti stvarne slučajeve napada. Usprkos učinkovitosti tehnike, nedostatak je to što nije testirana sa stvarnim upitima u stvarno postojećoj bazi podataka.
U (Shin i sur., 2009) Shin i suradnici su predložili SQLUnitGen, alat koji se temelji na statičkoj analizi i koji automatizira testiranje za identifikaciju ulaznih podataka manipulacijske ranjivosti. Pokazalo se da je predloženi mehanizam učinkovit s obzirom na činjenicu da su lažni pozitivi u potpunosti odsutni u eksperimentima. Međutim, za različite scenarije uočeni su lažni negativi na malom broju. Osim toga, utvrđeno je da se zbog nekih nedostataka može pojaviti značajna stopa lažnih negativnih rezultata za druge aplikacije. Stoga autori govore o usredotočenosti oslobađanje od tih značajnih lažnih negativa i daljnje poboljšanje pristupa za pokrivanje ulaznih manipulacija ranjivosti kao i njihovi budući radovi.
Rochman i Gudes predstavili su novu metodu zaštite internetskih baza podataka na temelju istančanog mehanizma kontrole (engl. fine-grained acces) pristupa. Ova metoda koristi ugrađene mehanizme kontrole pristupa bazama podataka s prikazanim parametrima i prilagođava ih radu s web aplikacijama. Predloženi mehanizam kontrole pristupa je primjenjiv na sve postojeće baze
N. Ljubičić, D. Jakšić, P. Poščić: Napadi ubacivanjem SQL izraza – prevencija i obranaZbornik Veleučilišta u Rijeci, Vol. 8 (2020), No. 1, pp. 313-330
325
podatka i sposoban je spriječiti mnogo vrsta napada, čime se znatno smanjuje napad na površini baze podatka (Roichman, Gudes, 2007).
Kemalis i Tzouramanis su razvili prototip SQL sustava za detekciju ubrizgavanja (SQLIDS) koji implementira predloženi algoritam. Sustav nadzire Java aplikacije i otkriva SQL ubrizgavanje napada u stvarnom vremenu. Proveli su nekoliko preliminarnih eksperimenata tijekom nekoliko napada ubacivanjem SQL izraza. Rezultati su bili vrlo uspješni. Provođenjem eksperimenata nije došlo do lažnih pozitiva i negativa. Dakle, novi pristup se je pokazao vrlo učinkovitim u praksi. Međutim, pristup zahtijeva više analize kao i dostupne tehnike otkrivanja pod zajedničkim i fleksibilnim okruženjem (Kemalis, Tzouramanis, 2008).
Napadi nastali ubacivanjem SQL izraza javljaju se zbog ranjivosti u strukturi upita gdje zlonamjerni korisnik može iskoristiti mogućnost unosa za umetanje kôda u upite koji mijenjaju uvjete upita, što rezultira neovlaštenim pristupom bazi podataka. Sarkar i suradnici pružaju novu tehniku kako bi identificirali mogućnost takvih napada. Središnja tema njihove tehnike temelji se na automatskom razvoju modela za SQL upit tako da model bilježi zavisnost između različitih komponenti upita. Između ostalog, analiziraju model pomoću generatora CREST test slučaja i identificiraju uvjete pod kojima se upit koji odgovara modelu smatra ranjivim. Također, analiziraju i dobiveni uvjet kako bi identificirali njegov podskup. Taj se podskup naziva uzročnim skupom ranjivosti. Njihova tehnika razmatra semantiku uvjeta upita, to jest odnos između uvjeta i kao takva nadopunjuje postojeće tehnike koje se oslanjaju samo na sintaktičku strukturu SQL upita. Ukratko, ova tehnika može otkriti ranjivost ugniježđenih SQL upita i daje rezultate bez lažnih negativa u usporedbi s postojećim tehnikama (Ruse i sur., 2010).
U radu (Halfond, Orso, 2008) predložen je pristup kombiniranja statističke analize i praćenje izvršavanja upita baze podataka. Tehnika koristi analizu programa za automatsku izradu legitimnih upita koji će biti generirani od strane aplikacije. Tehnika prati dinamički generirane upite i provjerava njihovu prihvatljivost sa statički generiranim modelom. Upit koji se ne podudara s modelom predstavlja potencijalni napad ubacivanja SQL izraza pa je stoga spriječeno njegovo izvršavanje na bazi podataka.
Shema i suradnici (Ali i sur., 2009) su usvojili pristup hash vrijednosti prema daljnjem poboljšanju mehanizma autentifikacije korisnika. Oni koriste korisničko ime i hash vrijednosti lozinke SQLIPA (engl. SQL Injection Protector for Authentication). Prototip je razvijen kako bi testirao okvire. Korisničko ime i vrijednosti hash-a za lozinku stvaraju se i izračunavaju tijekom izvođenja kada se prvi put kreira određeni korisnički račun. Hash vrijednosti pohranjuju se u tablici korisničkih računa. Iako je predloženi okvir testiran na nekoliko uzoraka podataka i dalje zahtijeva daljnje poboljšanje kako bi se smanjilo vrijeme opterećenja. Također, zahtijeva da bude testiran od strane veće količine podataka.
Ovaj rad (Som i sur., 2016) daje pregled sprječavanja napada ubacivanjem SQL izraza u pohranjenim procedurama. Aplikacija je osigurana od napada pomoću tehnike koja je podijeljena u dvije faze, a to su: faza sučelja, i faza pozadine. U slučaju kada prva faza nije u stanju zaštiti od SQL napada, tada druga faza sprječava napad. Tijekom skupljanja informacija o upitu ova tehnika koristi AES algoritam, kako bi se izbjegao napad ubacivanjem SQL izraza. Njihovi rezultati istraživanja pokazali

N. Ljubičić, D. Jakšić, P. Poščić: Napadi ubacivanjem SQL izraza – prevencija i obranaZbornik Veleučilišta u Rijeci, Vol. 8 (2020), No. 1, pp. 313-330
326
su kako postoji širok raspon stranica koji može zaštiti od napada. Ova metodologija potiče brzo i stručno upoznavanje sustava s bazom podataka te se drži podalje od memorije.
7. REZULTATI I ANALIZA
Više od polovice ranjivosti može se klasificirati kao manipulacija ulazom. Iz toga se razloga sve više koriste alati za automatsku statističku analizu kako bi se identificirala upravo ranjivost tih ulaza. Međutim, ovi alati ne mogu otkriti prisutnost ili učinkovitost crnih ili bijelih ulaznih filtera popisa pa mogu imati visoku razinu lažnih rezultata (Roichman i Gudes, 2007).
Radi bolje obrane i prevencije dolazi se do ideje spajanja više algoritama u jedan, što daje značajnu efikasnost. U radu je kao primjer takve ideje prikazan hibridni algoritam.
Sljedeća tablica prikazuje nekoliko važnijih metoda za prevenciju i obranu od napada ubacivanjem SQL izraza.
Tablica 3. Prikaz metoda
Metoda Osvrt
CANDID
Metoda za automatsko sprječavanje napada ubacivanjem SQL izraza
Prednost: primjenjiv na sve baze podataka
Nedostatak: smanjena učinkovitost pri suočavanju s vanjskim funkcijama
SAFELI
Okvir statičke analize dizajna koji se temelji na prepoznavanju SQL napada
Prednost: vrlo učinkovito prepoznavanje napada
Nedostatak: detektira samo napade ubacivanjem SQL izraza koji se posebno provode na Microsoftovim stranicama
PSR-generator
Automatizira generiranje pripremljenog koda
Prednost: zamjenjuje SQL izjave sa već pripremljenim izjavama
Nedostatak: analiza je provedena samo pomoću Jave
SQLUnitGen
Alat koji se temelji na statističkoj analizi
Prednost: lažan pozitiv je potpuno odsutan u pokusima
Nedostatak: za neke aplikacije se može pojaviti određena stopa lažnih negativnih rezultata
Proučavanjem literature može se primijetiti kako su dosadašnja istraživanja najviše posvećena detekciji i prevenciji od napada ubacivanjem SQL izraza, dok je u manjoj mjeri zastupljena

N. Ljubičić, D. Jakšić, P. Poščić: Napadi ubacivanjem SQL izraza – prevencija i obranaZbornik Veleučilišta u Rijeci, Vol. 8 (2020), No. 1, pp. 313-330
327
literatura koja govori o obrani od napada ubacivanjem SQL izraza. Sljedeći graf prikazuje upravo tu zastupljenost.
Graf 1. Istraženo područje fokusa
Izvor: Panah i sur. (2016)
8. ZAKLJUČAK
Iako su napretkom tehnologije interaktivne web-stranice svakoga dana sve sigurnije njihova nepobitnost je i dalje pod upitnikom. Napad ubacivanja SQL izraza predstavlja najveću prijetnju online tvrtkama koje u pozadini imaju bazu podataka. U ovom je radu dan pregled najpopularnijih metoda i tehnika za prevenciju i obranu od napada ubacivanjem SQL izraza. Postoje metode koje su tek implementirane te im je potrebno dodatno testiranje i uvođenje. S druge strane neke metode se već dugi niz godina unaprjeđuju te već mogu uvelike pomoći u prevenciji i obrani od napada ubacivanjem SQL izraza.
U istraživanjima se opsežno govori o prevenciji te se predlaže niz spomenutih metoda i tehnika, dok kod obrane od napada ubacivanjem SQL izraza to nije slučaj. Iz pregleda literature vidljivo je kako svaka detekcija i tehnika prevencije ne može pružiti potpunu zaštitu protiv napada ubacivanjem SQL izraza jer se mnogi pristupi ne bave tim problemom u cijelosti ili pak stvaraju poteškoće prilikom njihova praktičnog uvođenja. Unatoč tome kombinacija prikazanih mehanizama zasigurno će pokriti široki raspon zaštite baze podataka od napada ubacivanjem SQL izraza. Općenito područje vezano uz obranu i prevenciju od napada ubacivanjem SQL izraza je dobro istraženo pa je stoga i osmišljeno mnogo tehnika i mehanizama u tu svrhu.
Može se reći da postoji još prostora za istraživanje i napredovanje u spomenutim područjima s obzirom da tehnike, pa tako i ljudsko znanje svakim danom sve više širi svoje granice. Posebno treba istaknuti brzo rastući trend računarstva u oblaku, odnosno korištenja „oblaka“ za pohranu podataka, kao i aplikacije koje u potpunosti funkcioniraju u „oblaku“. Ovaj aspekt problema napada ubacivanjem SQL izraza nije bio toliko u fokusu ovoga rada, međutim svakako treba istaknuti

N. Ljubičić, D. Jakšić, P. Poščić: Napadi ubacivanjem SQL izraza – prevencija i obranaZbornik Veleučilišta u Rijeci, Vol. 8 (2020), No. 1, pp. 313-330
328
da ostaje za daljnje istraživanje. Daljnjim razvitkom web tehnologija, kao i postojećih tehnika za obranu i prevenciju napada ubacivanjem SQL izraza povećava se i spektar oblika napada, stoga je od izrazite važnosti voditi računa o konstantnom unaprjeđenju tehnika, metoda i mehanizama potrebnih za prevenciju i obranu od napada ubacivanjem SQL izraza. Kako bi se to postiglo valja ustrajati u osmišljavanju novih rješenja kako bi se u budućnosti osigurala potpuna kontrola i zaštita od napada ubacivanjem SQL izraza. Ono što ostaje za budući rad jest napraviti detaljniji pregled problema i izazova vezanih uz napad ubacivanja SQL izraza nad web aplikacijama te bazama podataka u „oblaku“.
ZAHVALEOvaj se rad temelji na radu koji je Sveučilište u Rijeci podržalo u okviru projekata „uniri-drustv-18-182“.
LITERATURAAli S., Rauf A., Javed H. (2009) „SQLIPA: An authentication mechanism against SQL injection“, European Journal of
Scientific research, vol.38, pp 604-611
Alnabulsi H., Islam M. R., Mamun Q. (2015) „Detecting SQL injection attacks using SNORT IDS“
Amirtahmasebi K., Jalalinia S. R., Khadem S. (2009) „A survey of SQL injection defense mechanisms“
Appelt D., Nguyen C. D., Briand L. C., Alshahwan N. (2014) „Automated testing for SQL injection vulnerabilities: an input mutation approach“, international Symposium on Software testing and Analysis, pp 259-269.
Balasundram I., Ramaraj E., (2012) „An efficient techinque for deection and prevention of SQL injection attack using ASCII based string matching“.
Bisht P., Madhusasudan P., Venkatakrishnan V. N. (2010) „CANDID: Dynamic Candidate Evaluations for Automatic Prevention of SQL Injection Attacks “
Boyd S. W. i Keromytis A. D. (2004) „SQLrand: Preventing SQL injection attacks“, department of Computer Science
Centar informacijske sigurnosti (2012) FER
Clark J. (2012) „SQL injection attacks and defense“
Coles M. (2007) „Pro T-SQL Programmer’s Guide“
Cova M., Balzarotti D. Felmetsger V., Vigna G. (2007) „An approach for the anomaly-based detection of state violations in web applications“
Das D., Bhattacharrya D. K., (2018) „Defeating Cyber Attacks Due to Script Injection“, International Journal of Network Security, vol.20, pp. 225-234.
Ezumalai R., Aghila G. (2009) „Combinatorial approach for preventing SQL injection attacks“
Fouad Y., Elshazly K. (2013) „Detection and Prevention of SQL Injection Attacks on Web Applications“, IJCSNS International Journal of Computer Science and Network Security, vol. 13.
Fu X., Qian K. (2008) „SAFELI: SQL injection scanner using symbolic execution“
Haixia Y., Zhihong N. (2009) „A database security testing scheme of web application“
Halfond W. G. J., Orso A. (2008) „WASP: Protecting W eb Applications Using Positive T ainting and Syntax-Aware Evaluation“, IEE Transaction on Softeare engineering

N. Ljubičić, D. Jakšić, P. Poščić: Napadi ubacivanjem SQL izraza – prevencija i obranaZbornik Veleučilišta u Rijeci, Vol. 8 (2020), No. 1, pp. 313-330
329
Halfond W. G. J., Orso A., Manolios P. (2006) „Using Positive tainting and Syntax-Aware Evaulation to Counter SQl Injection Attacks “, College of Computing
Indrani B., Ramaraj E. (2011) „X-Log authentication technique to prevent SQL injection attacks“
Johari R., Sharma P. (2012) „A survey on web application vulnerabilities (SQLIA, XSS) exploitation and security engine for SQL injection“
John A., Agarwal A., Bhardwaj M. (2012) “An adaptive algorithm to prevent SQL injection”, American Journal of Networks and Communications
Junjin M. (2009) „An approach for SQL injection vulnerability detection“
Kar D., Panigrahi S., Sundararajan S., (2015) „SQLiDDS: SQL injection detection using query transformation and document similarity, pp.377-390.
Kemalis K., Tzouramanis T. (2008) „SQL-IDS: A specification-based approach for SQL-injection detection“,
Khan A. (2005) „SQL Injection“
Kindy D. A., K. Pathan K. Al-S. (2012) „A Detailed Survey on Various Aspects of SQL Injection in Web Applications: Vulnerabilities, Innovative Attacks, and Remedies“, International Journal
Kumar P. i Pateriya R. K. (2012) „A survey on SQL injection attacks, detection and prevention techinque“
Lawal M.A., Bakar A., Sultan M., Shakiru A. O. (2016) „Systematic Literature Review on SQL Injection Attack“, International Journal of Soft Computing, pp 26-35.
Liu A., Yuan Y., Wijesekera D. (2009) „SQLProb: A Proxy-based Architecture toward Preventing SQL Injection Attacks“
Makiou A., Begriche Y., Serhrouchni A. (2014) „Improving web application firewalls to detect advancedd SQL injection “
Mavromoustakos S., Patel A., Chaudhary K., Chokshi P., Patel S. (2016) „Causes and Prevention of SSQL Injection Attacks in Web Applications“
Panah M. V., Bayat N. K., Asami A., Shahmirzadi A. (2016) „SQL injection attacks: A System Review“
Parameswari S. i Kavitha K. (2018) „SQL Injection Attack on Web Application“, Asisan Journal of Computer Science and Technology, vol. 7, pp. 11-15.
Roichman A., Gudes E. (2007) „Fine-grained acces control to web database“
Ruse M., Sarkar T., Basu S. (2010) „Analysis & detection of SQL injection vulnerabilities via automatic test case genration of programs“
Sajjadi S. M. S., Pour B. T. (2013) „Study of SQL injection attacks and countermeasures“, International Journal of Computer and Communication Engineering, vol. 2.
Senthilkumar S., Reddy K. T. (2017) „Preventing SQL Injection Attack Using Pattern Matching, Parsee Tree Validation and Cryptography Algorithms“, Jouurnal of Environmental Science, Computer Science and Engineering and Techonolgy, vol.6, pp 246-253.
Shin Y., Williams L., Xie T. (2009) „SQLUnitGen: Test Case Generation for SQL injection detection“
Som S., Sinha S., Kataria R. (2016) „Study on SQL injection attacks: mode, detection and prevention“, International Journal of Engineering Applied Sciences and Technology, vol.1, pp 23-29.
Tajpour A., Ibrahim S., Masrom M. (2011) „SQL injection detection and prevention techniques“
Thomas S., L. Williams, Xie T. (2007) „On automated prepared statement generation to remove SQL injection vulnerabilities“, Information and Software technology
Zhang K-X., Lin C-J., Chenn S-J., Hwang Y. (2011) „TransSQL:A Translation and Validation-Based Solution for SQL-injection Attacks“

N. Ljubičić, D. Jakšić, P. Poščić: Napadi ubacivanjem SQL izraza – prevencija i obranaZbornik Veleučilišta u Rijeci, Vol. 8 (2020), No. 1, pp. 313-330
330
Review article https://doi.org/10.31784/zvr.8.1.10 Received: 25. 11. 2019. Accepted: 8. 1. 2020.
SQL INJECTION – PREVENTION AND DEFENSENikolina Ljubičić
Univ. bacc. inf, Student, 51000 Rijeka, Croatia; e-mail: [email protected]
Danijela Jakšić PhD, Assistant professor, University of Rijeka, Department of Informatics, Radmile Matejčić 2, 51000 Rijeka,
Croatia; e-mail: [email protected]
Patrizia Poščić PhD, Full Professor, University of Rijeka, Department of Informatics, Radmile Matejčić 2, 51000 Rijeka,
Croatia; e-mail: [email protected]
ABSTRACTSQL injection is one of the most serious security threats to applications that have their own database. In fact, it allows the attacker to gain control of the application database by giving attacker the ability to modify the data. Many researchers have been trying to solve this problem. They have suggested different approaches to detect and prevent this vulnerability, but even these approaches do not fully represent a successful solution. This paper introduces several types of SQL injection attacks, as well as various tools and methods that can provide some prevention and defense against these attacks. Various methods have been proposed to address the problem of SQL injection attacks in the form of extensive reviews of variations of SQL injection attacks. Also, descriptions and examples were offered in order to understand their adverse impact and the consequences better.This paper also provides a brief overview of what some authors suggest when it comes to preventing and defending from SQL injection. Finally, a conclusion is drawn with an objective review and analysis of the overall research. The main contribution of the paper is an overview of the research available so far, limited to relational databases and categorized on: a) prevention of SQL injection and b) defence from SQL injection.
Key words: SQL injection, prevention, defense, attack, techniques
Creative Commons Attribution – NonCommercial 4.0 International License

D. Naletina, M. Damić, L. Meštrović: Zadovoljstvo mladih korisnika uslugama paketnih dostavljača…Zbornik Veleučilišta u Rijeci, Vol. 8 (2020), No. 1, pp. 331-351
331
Pregledni rad https://doi.org/10.31784/zvr.8.1.9 Datum primitka rada: 2. 12. 2019. Datum prihvaćanja rada: 27. 1. 2020.
ZADOVOLJSTVO MLADIH KORISNIKA USLUGAMA PAKETNIH DOSTAVLJAČA U REPUBLICI HRVATSKOJ
Dora Naletina Dr. sc., docent, Ekonomski fakultet, Trg J. F. Kennedy 6, 10 000 Zagreb, Hrvatska;
e-mail: [email protected]
Mate Damić Dr. sc., docent, Ekonomski fakultet, Trg J. F. Kennedy 6, 10 000 Zagreb, Hrvatska;
e-mail: [email protected]
Luka Meštrović Mag. oec., PBZ d. d., Radnička 45, 10 000 Zagreb, Hrvatska; e-mail: [email protected]
SAŽETAKPosljednjih godina, uloga paketne dostave u urbanim područjima kontinuirano raste, prvenstveno zbog ubrzanog rasta online kupovine, a navedeno nije zaobišlo niti hrvatsko tržište. Pristupanjem Hrvatske Europskoj uniji, tržište poštanskih usluga se liberaliziralo te su se stvorili preduvjeti za proširenje postojeće ponude usluga, porast konkurencije kao i povećanje količine prenesenih paketa. Na tržištu paketne distribucije u Republici Hrvatskoj djeluju gotovo svi svjetski poznati pružatelji usluga. Uzevši u obzir kako upravo mladi korisnici u najvećoj mjeri koriste informacijske tehnologije, a samim time i kupovinu putem iste, nameće se potreba istraživanja njihova zadovoljstva kvalitetom usluga paketnih dostavljača na području Republike Hrvatske. Cilj ovog rada je, na temelju provedenog primarnog istraživanja, ispitati zadovoljstvo mladih korisnika uslugama paketnih dostavljača u Republici Hrvatskoj. Pouzdanost usluge i poštivanje roka dostave potvrđeni su kao najvažniji čimbenici koji determiniraju zadovoljstvo mladog korisnika kvalitetom cjelokupne usluge. Ispitanici su kao najmanje važno istaknuli prepoznatljivost imena poduzeća koje im pruža usluge paketne distribucije. Poduzeća koja posluju na ovom tržištu moraju poboljšati dostupnost informacija, brzinu i sigurnost dostave paketa, ali i ulagati u daljnju modernizaciju.
Ključne riječi: Hrvatska, mladi korisnici, paketna pošiljka, paketna dostava
1. UVOD
Paketna distribucija postaje sve prisutnija u svakodnevnom životu. Promjene na tržištu poštanskih usluga javljaju se uslijed završetka liberalizacijskog procesa u zemljama članicama, napretka tehnologije, ali i ubrzanog rasta online kupovine. Nije samo poslovanje poduzeća na ovom tržištu
Creative Commons Attribution – NonCommercial 4.0 International License

D. Naletina, M. Damić, L. Meštrović: Zadovoljstvo mladih korisnika uslugama paketnih dostavljača…Zbornik Veleučilišta u Rijeci, Vol. 8 (2020), No. 1, pp. 331-351
332
determinirano ubrzanim rastom online trgovine, već i poslovanje poduzeća na ostalim tržištima (Vakulenko et al., 2018). Obzirom da raste i broj konkurenata na tržištu, postaje komplicirano organizirati distribuciju paketa u što kraćem roku, a uz što veću kvalitetu usluge koju zahtijevaju krajnji korisnici. Digitalizacija je utjecala na značajno smanjenje obujma pisama koji se distribuiraju, odnosno, u 2018. godini zabilježen je 7% manji volumen u odnosu na godinu ranije. Stoga se poštanski operatori, kako bi opstali i spriječili daljnji pad prihoda, moraju prilagoditi ubrzanim promjenama u okruženju (Finnish Transport and Communications Agency, 25.06.2019.).
Obzirom kako mladi korisnici u najvećoj mjeri koriste informacijske tehnologije, kao i kupovinu putem iste, nameće se potreba istraživanja njihova zadovoljstva kvalitetom usluga paketnih dostavljača na području Republike Hrvatske. Cilj ovog rada je provesti primarno istraživanje zadovoljstva mladih korisnika kvalitetom usluga paketnih dostavljača u Republici Hrvatskoj, a kako bi se utvrdilo trenutno zadovoljstvo mladih korisnika stanjem na tržištu distribucije paketa u Republici Hrvatskoj. Time bi se istaknule postojeće prednosti i nedostaci kao i preporuke za bolji razvoj tržišta distribucije paketa u svrhu pružanja većeg zadovoljstva krajnjim korisnicima.
Nakon uvodnog dijela, u drugom poglavlju pobliže se objašnjava paketna distribucija, definiraju se ključni pojmovi i karakteristike, ali se analiziraju i sudionici na promatranom tržištu. Kao uvod u provedeno primarno istraživanje, daje se pregled postojećih istraživanja, a potom se objašnjava metodologija istraživanja, rezultati te ograničenja, kao i preporuke za buduća istraživanja.
2. OPĆENITO O PAKETNOJ DISTRIBUCIJI
Prvenstveno zahvaljujući kupovini putem interneta na koju se odlučuje sve veći broj osoba, paketna distribucija postaje sve zastupljenija u svakodnevnom životu ljudi. Tako su pružatelji usluga na ovom tržištu, s jedne strane, suočeni s distribucijom sve većeg broja paketa, dok s druge strane korisnici iz dana u dan imaju sve veće zahtjeve glede brzine i kvalitete pružene usluge. Stoga se u nastavku ovog poglavlja daje definicija paketne distribucije i karakteristike iste, a potom se analiziraju i sudionici ovog tržišta.
2. 1 Definiranje i karakteristike paketne distribucije
Paketna distribucija je djelatnost koja se odnosi na distribuciju roba u paketnom obliku (Bendeković i Batarelo, 2009: 79). Zadatak politike distribucije mora biti prvenstveno omogućiti redovitu te pravodobnu nabavu proizvoda nekog poduzeća, te sukladno navedenom, najpovoljnije osiguravanje prisutnosti na tržištu. Važnost distribucije ogleda se upravo u činjenici da postojanje potražnje za robom nije dovoljno već je iznimno bitno da ta roba određenim kanalima dođe do krajnjih korisnika. Andrijanić (1999: 31). Isporuka robe u obliku paketa najčešće podrazumijeva isporuku komadne pošiljke u određenom obliku i pakiranju, a koji ovise o traženom načinu isporuke, odnosno prijevoznom sredstvu i brzini isporuke. O uvjetima isporuke koje zahtijeva korisnik ovise i ostali bitni čimbenici poput načina preuzimanja, manipulacije i isporuke pošiljke, ali i visina naknade za obavljeni posao isporuke (Bendeković i Batarelo, 2009: 80).
Prema Zakonu o poštanskim uslugama (Narodne novine, 144/12):

D. Naletina, M. Damić, L. Meštrović: Zadovoljstvo mladih korisnika uslugama paketnih dostavljača…Zbornik Veleučilišta u Rijeci, Vol. 8 (2020), No. 1, pp. 331-351
333
• Paket podrazumijeva poštansku pošiljku koja sadrži robu i predmete;
• Poštanska usluga je usluga koja uključuje svako postupanje s poštanskim pošiljkama od strane davatelja poštanskih usluga, a osobito prijam, usmjeravanje, prijenos i uručenje poštanskih pošiljaka u unutarnjem ili međunarodnom poštanskom prometu. Poštanske usluge obuhvaćaju univerzalnu uslugu, zamjenske poštanske usluge i ostale poštanske usluge.
• Univerzalna usluga je skup poštanskih usluga koje su dostupne svim korisnicima poštanskih usluga na cijelom području Republike Hrvatske po pristupačnoj cijeni. Zamjenske poštanske usluge su poštanske usluge koje mogu odstupati od uvjeta univerzalne usluge, kao što su obveza dnevne dostave ili obavljanje usluga na cijelom području države, no sa stajališta korisnika mogu se smatrati uslugama unutar opsega univerzalne usluge, jer su u dostatnoj mjeri zamjenjive univerzalnom uslugom. Ostale poštanske usluge se odnose na usluge prijma, usmjeravanja, prijenosa i uručenja poštanskih pošiljaka, u unutarnjem i međunarodnom prometu, koje nisu obuhvaćene univerzalnom uslugom ili zamjenskim poštanskim uslugama. Dopunske poštanske usluge su usluge koje sadrže poseban način postupanja tijekom prijma, usmjeravanja, prijenosa i uručenja pošiljaka kod obavljanja poštanskih usluga.
Poštanske pošiljke su pismovne pošiljke, paketi, preporučene pošiljke, pošiljke s označenom vrijednosti, sekogrami, izravna pošta i tiskanice (NN, 37/10).
Industrija poštanskih usluga koja uključuje paketnu distribuciju igra važnu ulogu u gospodarskom i društvenom razvoju mnogih država (Kollara, 2017: 10). Sam proces paketne distribucije te broj sudionika u istoj ovisi u prvom redu o tome koji model distribucije određeno poduzeće primjenjuje, a u literaturi se ističu ambulantna distribucija (kapilarna ili direktna distribucija) i centralna distribucija. Kod ambulantne distribucije proizvođači sami prodaju vlastite proizvode krajnjim korisnicima dok centralna distribucija podrazumijeva distribuciju roba preko jednog ili manjeg broja skladišta, nakon čega slijedi daljnja distribucija robe prema maloprodajnim mjestima. Bitna karakteristika ambulante distribucije je da se pošiljka distribuira direktno primatelju bez posrednika (Dujak, 2012). Usluge paketne distribucije su bitne za zadovoljenje potreba brojnih industrija. Bilo da se radi o bankama, osiguravajućim društvima, državnim institucijama ili bilo kojem drugom poduzeću. I javni i privatni korisnici oslanjali su se i oslanjaju se i danas na poštanske usluge za razmjenu informacija, dokumenata, paketa ili pisama (Hillebrand et al., 2016: 3).
2. 2 Sudionici u procesu paketne distribucije
Svi sudionici u procesu paketne distribucije trebali bi međusobno koordinirati svoje aktivnosti jer upravo o njima ovisi koliko će na kraju biti uspješan cijeli proces. Sudionici u poslovanju međunarodne paketne distribucije su svi subjekti koji na bilo koji način sudjeluju u procesu međunarodne paketne distribucije od trenutka davanja naloga za slanje do isporuke pošiljke, a u pravilu se razlikuju (Bendeković i Batarelo, 2009: 81):

D. Naletina, M. Damić, L. Meštrović: Zadovoljstvo mladih korisnika uslugama paketnih dostavljača…Zbornik Veleučilišta u Rijeci, Vol. 8 (2020), No. 1, pp. 331-351
334
• direktni sudionici (korisnik usluga). Korisnik usluga može biti poduzeće, institucija ili osoba koja želi koristiti uslugu nacionalne ili međunarodne paketne distribucije zbog nekog svog poslovnog ili osobnog interesa.
• poduzeće za paketnu distribuciju. Isto logistikom koju pruža ili suradnjom s međunarodnim partnerima omogućuje uspješnu realizaciju procesa distribucije.
• transportne organizacije koje sudjeluju u procesu distribucije, a sudjeluju u procesu u slučajevima kada poduzeće koje se bavi paketnom distribucijom nema organiziranu vlastitu transportnu mrežu u određenim dijelovima svijeta ili kada je njihovo korištenje neizbježno s obzirom na udaljenosti i vrstu transporta koja se zahtijeva. Na tržištu distribucije paketa nužno je osvijestiti poduzeća kako je posjedovanje vlastitog voznog parka skupo te se što više trebaju oslanjati na outsourcing, odnosno, trebaju sklopiti ugovor o suradnji s transportnim poduzećem. Navedeno omogućuje poduzećima da se više posvete svojoj temeljnoj djelatnosti i u konačnici ostvare puno bolje poslovne rezultate (Jackson, 01.05.2008.)
• državne institucije vezane za distribuciju i transport robe bitan su i nezaobilazan sudionik u procesu paketne distribucije, a propisima i postupcima nastoje uspostaviti jednaka pravila kao u zemljama i regijama u okruženju. Uloga državnih institucija je iznimno velika obzirom da je Hrvatska učlanjenjem u Europsku uniju pristupila zajedničkom tržištu univerzalnih poštanskih domaćih i prekograničnih usluga. Iste moraju osigurati da cijena isporuke univerzalnih usluga zadovoljava standarde prema troškovnoj usmjerenosti (Ministarstvo pomorstva, prometa i infrastrukture, 2014: 20).
Važno je spomenuti i centre za sortiranje u kojima se prikuplja roba s različitih lokacija te se potom sortira ovisno o mjestu narudžbe, konsolidira te otprema prema krajnjem korisniku. Poštanski operatori moraju izabrati hoće li imati nekoliko većih centara za sortiranje ili će imati više malih centara za sortiranje. Ukoliko se odluče na nekoliko većih sortirnih centara, tada se radi o uspostavi centralizirane prometne mreže te su prijevozne rute duže. U slučaju uspostave velikog broja malih sortirnih centara radi se o uspostavi decentralizirane prometne mreže (Kollara, 2017: 13).
Osnovni cilj poduzeća koje se bavi paketnom distribucijom je u što kraćem vremenu i uz minimalne troškove dostaviti paket i tako osigurati zadovoljstvo svih sudionika u procesu. Pošiljatelj i primatelj će biti zadovoljniji što je dostava bila brža, dok će se ostali sudionici u ovom distribucijskom procesu zadovoljiti s naknadom za obavljene usluge (Kollara, 2017: 36).
3. ISTRAŽIVANJE ZADOVOLJSTVA MLADIH KORISNIKA KVALITETOM USLUGA PAKETNIH DOSTAVLJAČA U REPUBLICI HRVATSKOJ
U nastavku ovog poglavlja prvo se daje pregled izabranih istraživanja koja su u fokusu imala tržište poštanskih usluga, potom se objašnjava metodologija istraživanja, analiziraju dobiveni rezultati i ističu ograničenja provedenog istraživanja.

D. Naletina, M. Damić, L. Meštrović: Zadovoljstvo mladih korisnika uslugama paketnih dostavljača…Zbornik Veleučilišta u Rijeci, Vol. 8 (2020), No. 1, pp. 331-351
335
3. 1 Pregled postojećih istraživanja
Kristensen i suradnici (2000) istražuju zadovoljstvo potrošača uslugama pošte u Danskoj, te koriste metodologiju Europskog indeksa zadovoljstva potrošača. Poseban naglasak stavljen je na ideju kombiniranja generičkih mjerenja zadovoljstva kupaca sa specifičnim mjerenjima Danske pošte. Rezultati su pokazali kako je utjecaj imidža znatno slabiji na poslovnom tržištu nego li na tržištu privatnih korisnika, dok s druge strane utjecaj interakcije s kupcima ima znatno veći utjecaj na tržištu poslovnih korisnika nego na tržištu privatnih korisnika.
Li i suradnici (2006) proveli su istraživanje u svrhu usporedbe zadovoljstva kupaca vodećim američkim poduzećima koja se bave distribucijom paketa, UPS-om i FedEx-om. Uspoređivalo se cjelokupno zadovoljstvo kupaca na temelju pet kritičnih čimbenika (dostupnost, odaziv, pouzdanost, potpunost i profesionalnost usluge) koji izravno utječu na zadovoljstvo kupaca u djelatnosti distribucije paketa, te posljedično i na dva promatrana poduzeća koja se bave distribucijom paketa. Uzimajući u obzir dolaznu i odlaznu poštu, rezultati su pokazali kako ne postoje značajne razlike u rangiranju kvalitete usluge između dva analizirana poduzeća. Rezultati istraživanja sugeriraju kako sličnost u ocjeni kvalitete usluge ova dva poduzeća proizlazi i dijelom kao posljedica dominantne pozicije istih u paketnoj industriji. Bitno je istaknuti kako cijena usluge dostave pošiljaka nije bila uključena u istraživanje, a smatra se bitnim faktorom prilikom odabira poduzeća za isporuku paketa.
Seitz i suradnici (2008) nastojali su utvrditi mjerila koja se koriste prilikom odabira malih paketnih transportnih poduzeća, uz određivanje razina važnosti po kriterijima. Najizraženiji kriterij ocjenjivanja koji su koristili ispitanici je realizacija dostave na vrijeme. Doplate su bile najmanje važan kriterij pri odabiru malog paketnog prijevoznika. Iako je vrijeme isporuke rangirano najviše u svim funkcijama, uredski menadžeri ih svrstavaju na drugo mjesto, odnosno, poslije razine cijena. Dostava proizvoda postala je više od puke robne usluge te stoga odabir malog paketnog transportnog poduzeća ovisi o brzini i točnosti isporuke, ali i o odnosu između cijena i razine usluge.
Kujačić i suradnici (2009) analiziraju model održivosti univerzalnog poštanskog servisa, a u svrhu definiranja prijedloga novog modela održivosti univerzalnog poštanskog servisa kako bi se povećala efikasnost nacionalnog poštanskog operatora u Srbiji. Naglašava se potreba osiguranja dodatnih prihoda za nacionalnog operatora u Srbiji i to kroz pružanje novih usluga, ali i potreba liberalizacije dijela tržišta za koje je procijenjeno kako bi ulazak novih poduzeća pozitivno utjecao na kvalitetu i cijenu usluge koju pruža nacionalni poštanski operator.
Peković i Tričković (2010) provode istraživanje u Srbiji u svrhu modeliranja optimalnog rasporeda jedinica poštanske mreže, a u cilju poboljšanja logističkih performansi poštanskih sistema. Ističu kako bi se modeliranje poštanske mreže trebalo raditi na osnovi resursa kojima državna uprava, lokalna samouprava i pošta raspolažu, kao i na temelju očekivanih koristi za određeno područje. Prilikom izbora modela treba voditi računa o broju i strukturi zaposlenih u državnoj upravi i lokalnoj samoupravi, načinu pribavljanja sredstava te iskorištenosti kapaciteta i obujma usluga državne administracije. Proces modeliranja zapravo je zajednički poduhvat javnog operatora te državne uprave, ali i lokalne samouprave.

D. Naletina, M. Damić, L. Meštrović: Zadovoljstvo mladih korisnika uslugama paketnih dostavljača…Zbornik Veleučilišta u Rijeci, Vol. 8 (2020), No. 1, pp. 331-351
336
Liu i Wen (2012) analiziraju konkurentnost na slučaju DHL-a te postavljaju dva istraživačka pitanja: 1. Koje konkurentske prednosti DHL dobiva od vanjskih i unutarnjih čimbenika. 2. Koji nedostatak posjeduje DHL u odnosu na konkurente? Što DHL može naučiti analizirajući nedostatke u konkurentnosti? Primarni podaci za ovo istraživanje prikupljeni su uglavnom putem intervjua dok su službena izvješća korištena kao izvori sekundarnih podataka. Obzirom na vanjske i unutarnje čimbenike DHL-a, vrši se implikacija SWOT analize koja pokazuje da snaga DHL-a proizlazi iz zadovoljstva kupaca. Slabosti su cijena te osiguranje od odgovornosti. Mogućnosti su razvoj suradnje te primjena i razvoj inovacija. Prijetnje proizlaze iz izrazite konkurentnosti. Snaga i mogućnosti smatraju se izvorom kompetitivne prednosti DHL-a, dok slabost i prijetnje predstavljaju konkurentske slabosti te treba raditi na njima (Liu i Wen, 2012). Šarac i Jovanović (2012) analiziraju aktualno stanje kvalitete poštanskih usluga s aspekta korisnika, a u svrhu identificiranja potencijala za njihovo unapređenje. Primijenjen je Servqual model s ciljem prepoznavanja nedostataka trenutne realizacije poštanskih usluga. Rezultati istraživanja pokazali su kako korisnici očekuju više u pogledu poštanskih usluga po svim promatranim dimenzijama (pouzdanost, sigurnost, opipljivost, empatija, sposobnost). Primijenjeni model je pokazao kako na prvom mjestu pozornost treba posvetiti dimenziji sigurnosti te da treba znatno poraditi i na ljubaznosti zaposlenika. Potrebno je raditi na razvijanju i podržavanju adekvatne kulture usluživanja korisnika obzirom da se treba uspostaviti usklađenost između kvalitete zaposlenika i zahtjeva korisnika.
Dobrodolac i suradnici (2013) u svom radu analiziraju mogućnosti za unapređenje univerzalne poštanske usluge i to sa stajališta korisnika, ali i efikasnosti poslovanja poštanskog sustava. Istraživanje je provedeno nad uzorkom od 26 javnih poštanskih operatora iz Europe. Predlaže se uvođenje novog koncepta u kojem bi prvo pošiljatelj specificirao rok za isporuku i u kojem se ostvareni rezultati javnog operatora ne bi mjerili na globalnom nivou već prema potrebama korisnika. Uvođenje novog koncepta usluga omogućilo bi unapređenje organizacije dostave kod javnog poštanskog operatora (Dobrodolac et al., 2013: 207-211). Gligorić i Đumić (2013) provode istraživanje elemenata netržišnog poslovnog okruženja na tržištu poštanskih usluga u Srbiji. Cilj rada je pokazati kako tradicionalne poštanske usluge ne zadovoljavaju gotovo niti jedan uvjet koji klasična ekonomska teorija zahtijeva da bi se pružanje određenih privatnih dobara smatralo prirodnim monopolom. Predlaže se uspostava modela koji poštanske usluge neće tretirati kao prirodni monopol te se zahtijeva prilagodba regulatornog okvira u tu svrhu. Primjerenijom regulacijom ovog tržišta ne bi se stvorili samo uvjeti za očuvanje infrastrukture već bi se omogućilo i unapređenje ukupne ekonomske aktivnosti.
Chou (2014) provodi istraživanje o kvaliteti usluge, povjerenju i lojalnosti potrošača koji koriste usluge kućne dostave u Tajvanu. Kao instrument u primarnom istraživanju korišten je anketni upitnik, a u istom je korišteno modeliranje strukturalnim jednadžbama. Rezultati su pokazali kako kvaliteta usluge i povjerenje pozitivno utječu na lojalnost kupaca, dok kvaliteta usluga ima pozitivan utjecaj na povjerenje kupaca. Provedena je i analiza faktora, a rezultati su pokazali kako ispitanici kao ključnu odrednicu usluge vide faktor pouzdanosti. Podaci o pošiljateljima su analizirani u svrhu oblikovanja grupa pošiljatelja. Rezultati analize pokazali su kako pošiljatelji koji su usmjereni na usluge ostvaruju bolje povjerenje i lojalnost kupaca. Menadžeri mogu povećati

D. Naletina, M. Damić, L. Meštrović: Zadovoljstvo mladih korisnika uslugama paketnih dostavljača…Zbornik Veleučilišta u Rijeci, Vol. 8 (2020), No. 1, pp. 331-351
337
povjerenje potrošača povećanjem povjerenja istih u usluge dostave kako bi isti koristili ili poticali druge u okolini da koriste usluge kućne dostave.
Lăzărescu (2017) promatra izazove s kojima se susreće tržište poštanskih usluga uslijed procesa globalizacije. Poštanske usluge pojavile su se kako bi zadovoljile komunikacijske potrebe čovjeka u posebnim društvenim odnosima. Zadovoljavanje ovih potreba temelji se na mrežnoj organizaciji koja omogućava prijevoz ili slanje paketa na daljinu. Osnivanje Svjetske poštanske unije omogućilo je poduzećima koordinaciju poštanskih usluga širom svijeta kako bi se postigla globalizacija među prvim poštanskim uredima. Funkcija nacionalnih poštanskih mreža bila je u fokusu državnih tijela koja su stvorila specifičan zakonski okvir koji omogućava njihovu komercijalizaciju te samofinanciranje. Globalizacijske tendencije uzrokovale su i strateške promjene na tržištu poštanskih usluga, što se reflektiralo na potrebu provedbe liberalizacije tržišta. Čimbenici koji utječu na tržište poštanskih usluga dijele se na vanjske i unutarnje. Vanjski čimbenici su omogućili razvoj poštanske mreže, a podrazumijevaju razvoj i poboljšanje sredstava komunikacije, prijevoznih sredstava, razvoj komunikacijskih putova kopnom, morem, zrakom te liberalizaciju poštanske usluge. Unutarnji čimbenici su povećanje i diversifikacija tradicionalne poštanske usluge povećanjem volumena komercijalnih usluga i povećanjem bankovnih transfera (Lăzărescu, 2017).
Heco (2018) istražuje mogućnosti unapređenja koncepta održivog razvoja poštanskog sektora i zaštite okoline u Bosni i Hercegovini s osvrtom na univerzalne poštanske usluge. Obzirom da je poštanska usluga javna funkcija koja je iznimno važna za funkcioniranje društva, od velike je važnosti osigurati unapređenje koncepta održivog razvoja poštanskog sektora. Nacionalna pošta svakako mora redefinirati postojeću poslovnu strategiju, a s druge strane treba se i uskladiti nacionalna regulativa poštanskog tržišta sa Zakonodavstvom Europske unije.
Dwianto i Purnamasari (2018) istražuju utjecaj kvalitete usluge (pouzdanost, odgovornost i sl.) na cjelokupno ili djelomično zadovoljstvo potrošača, a u svrhu utvrđivanja što ima dominantniji utjecaj od kvalitete usluge na zadovoljstvo potrošača prilikom korištenja usluge dostave paketa na primjeru indonezijske pošte u Banjarmasinu. U primarnom istraživanju kao instrument istraživanja je korišten strukturirani podsjetnik za intervju, a koji je proveden nad uzorkom od 100 ispitanika. Rezultati su pokazali kako opipljivost i sigurnost nemaju značajan utjecaj za tumačenje promjena kod ponašanja domaćih potrošača koji koriste usluge poštanskih ureda u Banjarmasinu, dok se pokazalo kako dominantan utjecaj ima odaziv, odnosno, spremnost poduzeća da pruži informacije o isporuci, brzini, kao i mogućnostima dostave paketa te spremnost poduzeća na pomoć u slučaju problema prilikom isporuke.
3. 2 Metodologija istraživanja
Obzirom na nedovoljan broj istraživanja usluga koje nude paketnih dobavljači, i posebice nedovoljna saznanja o čimbenicima koji utječu na zadovoljstvo mladih korisnika uslugama paketnih dostavljača u Republici Hrvatskoj, upravo je navedeno cilj empirijskog dijela istraživanja. Istraživanje je inspirirano, a sam je instrument istraživanja u velikoj mjeri oblikovan po uzoru na najrecentnija postojeća istraživanja koja obuhvaćaju područje paketne distribucije, među kojima prednjače autori Chou (2014), Seitz et al. (2008) i Li et al. (2006).

D. Naletina, M. Damić, L. Meštrović: Zadovoljstvo mladih korisnika uslugama paketnih dostavljača…Zbornik Veleučilišta u Rijeci, Vol. 8 (2020), No. 1, pp. 331-351
338
Empirijsko istraživanje provedeno je u rujnu 2018. godine putem online anketnog upitnika dizajniranog u SurveyMonkeyu, a poziv za sudjelovanje u istraživanju zajedno s poveznicom na anketni upitnik: https://www.surveymonkey.com/r/paketni_dostavljaci, proslijeđen je putem društvenih mreža mladim potrošačima koji su bili i ciljna skupina ovog istraživanja. Anketni se upitnik sastojao od 19 pitanja, kojima se ispitivalo:
Ad 1. korištenje usluga paketnih dostavljača u Republici Hrvatskoj
Ad 2. usluge kojih paketnih dostavljača (DHL, DPD, FedEx, GLS, Hrvatska pošta, InTime, Overseas, Tisak, UPS, nekih drugih paketnih dostavljača) u Republici Hrvatskoj su se ispitanici koristili
Ad 3. navođenje pružatelja usluge paketne distribucije s kojima su ispitanici najzadovoljniji
Ad 4. navođenje država iz kojih su ispitanici najčešće naručivali pakete iz inozemstva
Ad 5. vrsta proizvoda koje su ispitanici najčešće naručivali putem paketne dostave
Ad 6. učestalost korištenja usluga paketne dostave
Ad 7. uobičajena visina cijene paketa kojeg ispitanici naručuju
Ad 8. vrsta dostave koju ispitanici koriste kada naručuju paket.
Nadalje, ispitanici su bili zamoljeni da rangiraju važnost sljedećih atributa: poštivanje roka dostave, cijenu, ponudu usluga, standarde poslovanja, naknade, tehnologiju, prepoznatljivost imena, globalno poslovanje/internacionalnost, dostupnost usluge, pouzdanost usluge, potpunost usluge, profesionalizam usluge, prilikom odabira pružatelja usluge paketne distribucije, ocjenama od 1 do 5, gdje je 1 = najmanje važan atribut, a 5 = najvažniji atribut. Potom su zamoljeni da navedu stupanj slaganja s 30 tvrdnji koje se odnose na pružatelje usluge paketne distribucije, a preuzete su iz postojeće literature i prethodno navedenih istraživanja, pomoću Likertove skale, na ljestvici od 1 do 5, gdje je 1 = u potpunosti se ne slažem, 2 = ne slažem se, 3 = niti se ne slažem, niti se slažem, 4 = slažem se i 5 = u potpunosti se slažem. Nadalje, ispitanike se pitalo jesu li imali pritužbe prilikom korištenja usluga paketne distribucije i ukoliko jesu, da opišu svoja iskustva. Otvorenim pitanjem bili su zamoljeni da navedu na koji način bi se paketni dostavljači mogli prilagoditi njihovim željama i potrebama u budućnosti. Anketni upitnik završava pitanjima koja obuhvaćaju sociodemografska obilježja ispitanika – spol, dob, stručnu spremu, radni status, regiju u kojoj ispitanici stanuju i osobni mjesečni prihod ispitanika.
3. 3 Rezultati istraživanja
3. 3. 1 Sociodemografske karakteristike ispitanika
U istraživanju je sudjelovalo 282 ispitanika, od čega su 166 (59,93 %) ispitanika bili muškarci, a 111 (40,07 %) ispitanika su bile žene. Pet ispitanika nije dalo odgovor na pitanje o spolnoj strukturi. Ispitanici su grupirani prema dobi kako slijedi: manje od 18 godina (1,07 %); od 18 do 24 godine (25,98 %), od 25 do 34 godine (34,16 %), od 35 do 44 godine (12,10 %); od 45 do 54 godine (10,68 %), od 55 do 64 godine (13,17 %) i više od 65 godina (2,85 %). Obzirom na navedenu dobnu

D. Naletina, M. Damić, L. Meštrović: Zadovoljstvo mladih korisnika uslugama paketnih dostavljača…Zbornik Veleučilišta u Rijeci, Vol. 8 (2020), No. 1, pp. 331-351
339
strukturu, u tablici 1 se može uočiti kako je mladih ispitanika (mlađi od 35 godina) bilo 177, dok je 118 ispitanika imalo 35 godina ili više.
Tablica 1. Starosna struktura ispitanika
DOSTAVLJAČ A SKUPINA FREKVENCIJA % KUMULATIV %
MLADI
manje od 18 godina 3 1,00 1,00
18 do 24 godine 74 25,00 26,10
25 do 34 godine 100 33,8 60,00
STARIJI
35 do 44 godine 36 12,20 72,20
45 do 54 godine 32 10,80 83,10
55 do 64 godine 41 13,90 96,90
više od 65 godine 9 3,00 100,00
UKUPNO 295 99,70 Izvor: izrada autora na temelju prikupljenih podataka
S obzirom na stručnu spremu, najveći broj ispitanika, njih čak 56,58 % (n = 159) ima završenu višu školu ili fakultet; 28,11 % ispitanika ima završenu srednju stručnu školu ili gimnaziju - 4 godine; a 13,17 % ispitanika ima završen magisterij ili doktorat. Najmanji broj ispitanika koji su sudjelovali u istraživanju su bez stručne spreme ili imaju završenu osnovnu (0,71 %) ili trogodišnju srednju školu (1,42 %). Promatra li se radni status ispitanika, uočava se kako je sudjelovalo najviše zaposlenih, u stalnom radnom odnosu (55,43 %), nezaposlenih (15,94 %) i ispitanika koji rade preko studentskog ugovora (13,04 %). Kod ispitivanja o regiji u kojoj ispitanici stanuju, od ukupnog broja ispitanika, njih 153 (54,45 %) odgovorilo je da žive u Dalmaciji, 99 ispitanika živi u Zagrebu i okolici (35,23 %), 11 ispitanika stanuje u Slavoniji (3,91 %), osam ispitanika u sjevernoj Hrvatskoj, a po pet u Lici, Kordunu i Banovini te Istri, Primorju i Gorskom Kotaru. Osobni mjesečni prihod ispitanika varira od iznosa manjeg od 1200 kuna sve do više od 9000 kn. Dok 63 (22,50 %) ispitanika ima prihode više od 9000 kn, 16,43 % ispitanika imaju osobne mjesečne prihode od 5 501 do 7 000 kn, onih koji imaju prihode od 7 001 do 9 000 kn ima 45 (16,07 %) dok je 42 (15,00 %) ispitanika imalo osobne prihode od 3 501 do 5 500 kn. Svega 4 ispitanika navelo je da imaju osobni mjesečni prihod do 500 kn, a 40 ispitanika je bez osobnog mjesečnog prihoda.
3. 3. 2 Korištenje usluga paketnih dostavljača u Republici Hrvatskoj
Kako bi se utvrdilo utječe li dob ispitanika na preferencije glede odrednica kvalitete poštanskih usluga, u softverskom programu SPPS isto je testirano. Rezultati provedenog testa potvrdili su utjecaj dobi samo kod tri čimbenika: cijena, dostupnost usluge te brzina pružanja usluge. Stoga su u nastavku prikazani rezultati za cjelokupni uzorak, dok će prilikom analize navedena 3 čimbenika u fokusu biti isključivo mladi korisnici.
Prvo pitanje koje je ispitanicima postavljeno odnosilo se na korištenje usluga paketnih dobavljača u Republici Hrvatskoj, a ispitanicima je dana uputa da navedeno podrazumijeva i primitak paketa iz inozemstva. Većina ispitanika (245; 86,87 %) odgovorilo je da su koristili usluge paketnih

D. Naletina, M. Damić, L. Meštrović: Zadovoljstvo mladih korisnika uslugama paketnih dostavljača…Zbornik Veleučilišta u Rijeci, Vol. 8 (2020), No. 1, pp. 331-351
340
dostavljača u Republici Hrvatskoj. Ispitanici koji su izjavili da nikada nisu koristili usluge paketnih dostavljača u Republici Hrvatskoj, njih 37 (13,12 %), zamoljeni su da odgovore na 13. pitanje u anketnom upitniku kojim su se ispitivali razlozi nekorištenja usluga paketne dostave. U Tablici 2 navedene su usluge paketnih dostavljača koje su ispitanici (n = 245) koristili u Republici Hrvatskoj. Ovdje je ispitanicima dana mogućnost odabira višestrukog odgovora.
Tablica 2. Korištenje usluga paketnih dostavljača u Republici Hrvatskoj
DOSTAVLJAČ % n
DHL 60,00% 153
DPD 16,47% 42
FedEx 18,04% 46
GLS 23,92% 61
Hrvatska pošta 81,18% 207
Intime 4,71% 12
Overseas 47,45% 121
Tisak 38,04% 97
UPS 13,73% 35
Ostali paketni dostavljači 1,18% 3Izvor: izrada autora na temelju prikupljenih podataka
Kao što je vidljivo iz tablice 2, ispitanici najviše koriste usluge Hrvatske pošte (81,18 %), DHL-a (60,00 %) i GLS-a (23,92 %). Na Grafikonu 1 može se uočiti kako su ispitanici najzadovoljniji uslugama DHL-a, a potom uslugama hrvatskog nacionalnog poštanskog operatora (Hrvatska pošta).
Grafikon 1. Zadovoljstvo ispitanika s pružateljem usluga paketne distribucije
Izvor: primarno istraživanje

D. Naletina, M. Damić, L. Meštrović: Zadovoljstvo mladih korisnika uslugama paketnih dostavljača…Zbornik Veleučilišta u Rijeci, Vol. 8 (2020), No. 1, pp. 331-351
341
Glede država iz koje su ispitanici najčešće naručivali paket iz inozemstva, naveli su Njemačku, Ujedinjeno Kraljevstvo, Kinu, Englesku, Ameriku, Austriju, Irsku, Francusku, Slovačku, a što svjedoči o velikoj prednosti i pogodnosti usluge transporta i dostave robe koju pružatelji takvih usluga nude potrošačima u premošćivanju velikih geografskih udaljenosti. S obzirom na vrstu proizvoda koje ispitanici najčešće naručuju (Grafikon 2) putem paketne dostave, primat ima tehnička oprema (33,60 %), slijede odjeća (19,60 %), knjige (16,80 %), modni dodaci i obuća.
Grafikon 2. Vrsta proizvoda koje ispitanici najčešće naručuju putem paketne dostave
Izvor: primarno istraživanje
U Tablici 3 prikazana je učestalost korištenja usluga paketne dostave. Najčešće se usluge paketne dostave koriste jednom u šest mjeseci (41,34%) ili jednom mjesečno (34,65%).
Tablica 3. Učestalost korištenja usluga paketne dostave
Učestalost % n
svaki dan 0,39% 1
jednom do dva puta tjedno 3,94% 10
jednom mjesečno 34,65% 88
jednom u šest mjeseci 41,34% 105
jednom godišnje 16,93% 43
ostalo 2,76% 7
Izvor: primarno istraživanje
Ispitanici su bili upitani koliko uobičajeno iznosi cijena paketa kojeg naručuju. Zanimljivo je da su odgovori ispitanika značajno varirali i kreću se u rasponu od najniže spomenute cijene (50 kn), do najviše cijene u iznosu od 1 500 kn. Što se tiče vrste dostave koju ispitanici koriste, najveći broj ispitanika (65,61 %) navodi standardnu dostavu, potom kombinaciju standardne i ekspres dostave (24,11 %), a svega 10,28 % ispitanika koristi isključivo ekspres dostavu.

D. Naletina, M. Damić, L. Meštrović: Zadovoljstvo mladih korisnika uslugama paketnih dostavljača…Zbornik Veleučilišta u Rijeci, Vol. 8 (2020), No. 1, pp. 331-351
342
Tablica 4. Važnost pojedinih atributa prilikom odabira pružatelja usluge pakete distribucije
ATRIBUTI 1 2 3 4 5 x̅ Rang
n (%) n (%) n (%) n (%) n (%) n (%)
poštivanje roka dostave 6 2,37%5
1,98%21
8,30%42
16,60%179
70,75%4,51 2
cijena5
1.98%13
5,16%60
23,81%65
25,79%109
43,25%4,03 6
ponuda usluga14
5.58%13
5,18%82
32,67%83
59 23,51%
3,64 11
standardi poslovanja13
5,22%13
5,22%53
21,29%78
33,07%92
36,95%3,90 8
naknade9
3,61%10
4,02%61
24,50%63
25,30%106
42,57%3,99 7
tehnologija12
4,80%16
6,40%76
30,40%72
28,80%74
29,60%3,72 10
prepoznatljivost imena34
13,60%40
16,00%65
26,00%70
28,00%41
16,40%3,18 12
globalno poslovanje/internacionalnost
15 6,02%
18 7,23%
60 24,10%
80 32,13%
76 30,52%
3,74 9
dostupnost usluge7
2,76%6
2,36%27
10,63%65
25,59%149
58,66%4,35 5
pouzdanost usluge8
3,16%3
1,19%14
5,53%29
11,46%199
78,66%4,61 1
potpunost usluge4
1,59%4
1,59%29
11,55%52
20,72%162
64,54%4,45 3
profesionalizam usluge6
2,37%6
2,37%24
9,49%51
20,16%166
65,61%4,44 4
Izvor: primarno istraživanje
Tablica 4 prikazuje važnost pojedinih atributa prilikom odabira pružatelja usluge paketne distribucije. Atributi su djelomično preuzeti iz postojeće literature (Seitz et al., 2008; Chou, 2014), a djelomično preuzeti i po potrebi modificirani iz preostalih znanstvenih članaka analiziranih u pregledu postojećih istraživanja. Ispitanici su bili zamoljeni da rangiraju koliko su im sljedeći atributi: poštivanje roka dostave, cijena, ponuda usluga, standardi poslovanja, naknade, tehnologija, prepoznatljivost imena, globalno poslovanje, dostupnost usluge, pouzdanost usluge, potpunost usluge i profesionalizam usluge važni kod odabira pružatelja usluge paketne distribucije. Ispitanicima je na prvom mjestu pouzdanost usluge (x̅ = 4,61), potom poštivanje roka dostave (x̅ = 4,51), potpunost usluge (x̅ = 4,45), profesionalizam usluge (x̅ = 4,44), dostupnost usluge (x̅ = 4,35),

D. Naletina, M. Damić, L. Meštrović: Zadovoljstvo mladih korisnika uslugama paketnih dostavljača…Zbornik Veleučilišta u Rijeci, Vol. 8 (2020), No. 1, pp. 331-351
343
cijena (x̅ = 4,03), naknade (x̅ = 3,99), standardi poslovanja (x̅ = 3,90), globalno poslovanje (x̅ = 3,74), tehnologija (x̅ = 3,72), ponuda usluga (x̅ = 3,64) i prepoznatljivost imena (x̅ = 3,18).
Rezultati provedenog testa nezavisnih uzoraka potvrdili su kako isključivo kod tri čimbenika (cijena, dostupnost usluge te brzina pružanja usluge) dob utječe na preferencije ispitanika. Za navedena tri čimbenika p vrijednost je iznosila ,000. Rezultati istraživanja ne odstupaju značajnije od postojećih istraživanja danih u pregledu postojeće literature i samo potvrđuju važnost pojedinih obilježja usluge, posebice prilikom paketne distribucije, kao što su pouzdanost usluge, poštivanje roka dostave i ostala neopipljiva obilježja usluga koja su presudna prilikom odabira pružatelja usluge paketne distribucije.
Nadalje, ispitanici su bili zamoljeni da na Likertovoj skali, ocjenama od 1 do 5 ocjene stupanj slaganja s tvrdnjama koje se odnose na pružatelje usluge paketne distribucije. Tvrdnje su se odnosile na ekološku odgovornost pružatelja usluge paketne distribucije, preporuku prijatelja za korištenje pružatelja usluge paketne distribucije, razliku u cijeni ekspresne dostave i standardne dostave, sigurnost paketa, isporučivost paketa u stanju u kojem je paket bio i poslan, usporedbu brzine usluge dostave paketa hrvatskog nacionalnog poštanskog operatora i inozemnih pružatelja usluge distribucije paketa prisutnih na hrvatskom tržištu, zadovoljstvo korisnika cijenom usluge dostave paketa, načinom na koji je paket zapakiran u svrhu zaštite prilikom transporta, radnim vremenom kontaktnog centra kurirskih službi, uslugom dispečera u kontaktnom centru, kvalitetom servisa za praćenje pošiljke, ljubaznošću dostavljača. Navedene su tvrdnje preuzete iz postojeće literature, a djelomično su i modificirane i prilagođene za potrebe provođenja ovoga istraživanja. Analizirajući stupanj slaganja ispitanika s tvrdnjama koje se odnose na pružatelje usluge paketne distribucije, zaključuje se da su ispitanici najzadovoljniji kada njihov paket sretno stigne na odredište (x̅ = 3,89) i kada pružatelji usluga distribucije vode računa o sigurnosti paketa (x̅ = 3,87) i da paket bude isporučen u stanju u kojem je i poslan (x̅ = 3,85). Poražavajući su rezultati koji govore da ispitanici prilikom odabira usluge paketne distribucije, najmanje vode računa o ekološkoj odgovornosti pružatelja usluge (x̅ = 2,85) te da imaju negativna iskustva s poštovanjem roka dostave od stane hrvatskog nacionalnog poštanskog operatora (x̅ = 3,06) (vidi Tablica 5).

D. Naletina, M. Damić, L. Meštrović: Zadovoljstvo mladih korisnika uslugama paketnih dostavljača…Zbornik Veleučilišta u Rijeci, Vol. 8 (2020), No. 1, pp. 331-351
344
Tablica 5. Stupanj slaganja ispitanika s tvrdnjama koje se odnose na pružatelje usluge paketne distribucije
TVRDNJE 1 2 3 4 5 xn (%) n (%) n (%) n (%) n (%)
Prilikom odabira usluge paketne distribucije, vodim računa o ekološkoj odgovornosti pružatelja usluge.
51 20,08%
43 16,93%
87 34,25%
39 15,35%
34 13,39%
2,85
Prilikom odabira usluge paketne distribucije, koristim pružatelje koje mi predlažu moji prijatelji.
29 11,46%
37 14,62%
67 26,48%
83 32,81%
37 14,62%
3,25
Ponekad nisam u mogućnosti odabrati distributera, s obzirom da određena poduzeća imaju unaprijed dogovorenog pružatelja usluga s kojim posluju.
15 5,91%
12 4,72%
61 24,02%
73 28,74%
93 36,61%
3,85
Smatram da je previsoka razlika u cijeni ekspresne dostave i cijeni regularne dostave.
7 2,76%
13 5,12%
93 36,61%
75 29,53%
66 25,98%
3,71
Pružatelji usluge distribucije paketa s kojima sam do sada imao iskustva, vode računa o sigurnosti paketa.
4 1,57%
15 5,91%
62 24,41%
101 39,76%
72 28,35%
3,87
Pružatelji usluge distribucije paketa s kojima sam do sada imao iskustva, vode računa o tome da paket bude isporučen u stanju u kojem je bio i poslan.
7 2,77%
20 7,91%
52 20,55%
99 39,13%
75 29,64%
3,85
Mišljenja sam da je kvaliteta usluge dostave paketa hrvatskog nacionalnog poštanskog operatora ispod razine kvalitete usluge vodećih inozemnih pružatelja usluge distribucije paketa prisutnih na hrvatskom tržištu.
23 9,06%
33 12,99%
94 37,01%
47 18,50%
57 22,44%
3,32
Mišljenja sam da je brzina usluge dostave paketa hrvatskog nacionalnog poštanskog operatora ispod brzine usluge dostave vodećih inozemnih pružatelja usluge distribucije paketa prisutnih na hrvatskom tržištu.
20 7,87%
35 13,78%
82 32,28%
55 21,65%
62 24,41%
3,41
Imam negativna iskustva s poštivanjem roka dostave od strane hrvatskog nacionalnog poštanskog operatora.
38 14,96%
58 22,83%
60 23,62%
48 18,90%
50 19,69%
3,06
Zadovoljan/-na sam cijenom usluge dostave paketa.
6 2,37%
29 11,46%
109 43,08%
79 31,23%
30 11,86%
3,39
Zadovoljan/-na sam načinom na koji je moj paket zapakiran u svrhu zaštite prilikom transporta.
5 1,98%
14 5,53%
76 30,04%
100 39,53%
58 22,92%
3,76
Zadovoljan/-na sam radnim vremenom kontaktnog centra kurirskih službi.
20 7,87%
38 14,96%
92 36,22%
78 30,71%
26 10,24%
3,2

D. Naletina, M. Damić, L. Meštrović: Zadovoljstvo mladih korisnika uslugama paketnih dostavljača…Zbornik Veleučilišta u Rijeci, Vol. 8 (2020), No. 1, pp. 331-351
345
Zadovoljan/-na sam uslugom dispečera u kontaktnom centru.
18 7,09%
27 10,63%
103 40,55%
78 30,71%
28 11,02%
3,28
Dispečer u kontaktnom centru posjeduje adekvatna znanja i pomaže mi u rješavanju problema.
19 7,48%
28 11,02%
105 41,34%
75 29,53%
27 10,63%
3,25
Nezadovoljan/-na sam informacijama o cijeni dostave, uvjetima dostave koji su raspoloživi na web stranici pružatelja usluge.
23 9,06%
37 14,57%
114 44,88%
49 19,29%
31 12,20%
3,11
Zadovoljan/-na sam informacijama o cijeni dostave i uvjetima dostave kojima raspolažu dispečeri u kontaktnom centru.
13 5,12%
19 7,48%
121 47,64%
72 58,35%
29 11,42%
3,33
Zadovoljan/-na sam kvalitetom servisa za praćenje pošiljke.
17 6,72%
22 8,70%
76 30,04%
90 35,57%
48 18,97%
3,51
Zadovoljan/-na sam uslugama dobivanja poruka na svoj mobilni telefon i e-mail u svezi kretanja pošiljke.
13 5,18%
25 9,96%
68 27,09%
85 33,86%
60 23,90%
3,61
Zadovoljan/-na sam preciznošću specificiranja dolaska dostavljača paketa na moju adresu.
8 3,20%
35 14,00%
62 24,80%
94 37,60%
51 20,40%
3,58
Nezadovoljan/-na sam vremenom čekanja do javljanja dispečera u kontaktnom centru.
14 5,65%
28 11,29%
111 44,76%
53 21,37%
42 16,94%
3,33
Zadovoljan/-na sam brzinom rješavanja problema s dostavom moje pošiljke.
18 7,62%
27 10,89%
111 44,76%
66 26,61%
26 10,48%
3,22
Zadovoljan/-na sam korištenjem web stranice pružatelja usluge za prijavu problema.
1 5,65%
26 10,48%
109 43,95%
71 28,63%
28 11,29%
3,29
Do sada se nisam susreo s gubitkom mog paketa.
30 11,95%
22 8,76%
24 9,56%
45 17,93%
130 51,79%
3,89
Zadovoljan/-na sam brzinom kojom je dostavljač došao preuzeti moj paket za otpremu.
5 2,04%
18 7,35%
95 38,78%
80 32,65%
47 19,18%
3,60
Paketi koje sam slao nikada se nisu oštetili.6 2,43%
20 8,10%
69 27,94%
67 27,13%
85 34,41%
3,83
Paketi koje sam slao dostavljeni su u dogovoreno vrijeme.
5 2,02%
19 7,66%
81 32,66%
82 33,06%
61 24,60%
3,71
Kontaktni centar poduzeća za distribuciju paketa pružio mi je pomoć od početka, pa do kraja zaključivanja procesa slanja paketa.
13 5,26%
14 5,67%
104 42,11%
82 33,20%
34 13,77%
3,45
Zadovoljan/-na sam ljubaznošću dostavljača.8
3,23%13
5,24%71
28,63%91
36,69%65
26,21%3,77
Zadovoljan/-na sam kvalitetom cjelokupne usluge poduzeća za distribuciju paketa.
5 1,99%
14 5,58%
78 31,08%
105 41,83%
49 19,52%
3,71
Usluga paketnog dostavljača bila je u skladu sa očekivanjima.
4 1,60%
13 5,20%
67 26,80%
110 44,00%
56 22,40%
3,80
Izvor: primarno istraživanje

D. Naletina, M. Damić, L. Meštrović: Zadovoljstvo mladih korisnika uslugama paketnih dostavljača…Zbornik Veleučilišta u Rijeci, Vol. 8 (2020), No. 1, pp. 331-351
346
Tablica 6. Latentne dimenzije kvalitete usluga
ODREDNICE DIMENZIJA Opterećenje faktora
Dispečer u kontaktnom centru posjeduje adekvatna znanja i pomaže mi u rješavanju problema.
,681
Zadovoljan/-na sam kvalitetom servisa za praćenje pošiljke. ,682
Zadovoljan/-na sam uslugama dobivanja poruka na svoj mobilni telefon i e-mail u svezi kretanja pošiljke.
,686
Zadovoljan/-na sam brzinom rješavanja problema s dostavom moje pošiljke. ,689
Kontaktni centar poduzeća za distribuciju paketa pružio mi je pomoć od početka, pa do kraja zaključivanja procesa slanja paketa.
,727
Zadovoljan/-na sam kvalitetom cjelokupne usluge poduzeća za distribuciju paketa. ,729
cijena ,501
visina naknada ,567
dostupnost usluge ,668
pouzdanost usluge ,567
potpunost usluge ,562
profesionalizam usluge ,576
Mišljenja sam da je kvaliteta usluge dostave paketa hrvatskog nacionalnog poštanskog operatera ispod razine kvalitete usluge vodećih inozemnih pružatelja usluge distribucije paketa prisutnih na hrvatskom tržištu.
,478
Mišljenja sam da je brzina usluge dostave paketa hrvatskog nacionalnog poštanskog operatera ispod brzine usluge dostave vodećih inozemnih pružatelja usluge distribucije paketa prisutnih na hrvatskom tržištu.
,536
Imam negativna iskustva s poštivanjem roka dostave od strane hrvatskog nacionalnog poštanskog operatera.
,488
Nezadovoljan/-na sam informacijama o cijeni dostave, uvjetima dostave koji su raspoloživi na web stranici pružatelja usluge.
,447
ponuda usluga ,304
Prilikom odabira usluge paketne distribucije, vodim računa o ekološkoj odgovornosti pružatelja usluge.
,314
Ponekad nisam u mogućnosti odabrati distributera, s obzirom da određena poduzeća imaju unaprijed dogovorenog pružatelja usluga s kojim posluju.
,309
Izvor: primarno istraživanje
U svrhu utvrđivanja latentnih dimenzija kvalitete usluge na tržištu paketne distribucije identificirane su latentne dimenzije prikazane u Tablici 6. U istoj se uočava kako su odrednice prve dimenzije determinirane znanjem i kvalitetom kako dispečera u kontaktnom centru tako i kvalitetom drugih pratećih usluga koje utječu na ocjenu cjelokupnog zadovoljstva kvalitetom usluge. Analizom druge dimenzije evidentno je kako je kvaliteta usluge na ovom tržištu determinirana različitim čimbenicima koji utječu na istu. U sklopu treće dimenzije uočava se kako je stav ispitanika da

D. Naletina, M. Damić, L. Meštrović: Zadovoljstvo mladih korisnika uslugama paketnih dostavljača…Zbornik Veleučilišta u Rijeci, Vol. 8 (2020), No. 1, pp. 331-351
347
je kvaliteta, ali i brzina usluge hrvatskog nacionalnog poštanskog operatera na nižoj razini od inozemnih pružatelja iste usluge.
Ispitanici su bili zamoljeni da navedu jesu li imali pritužbe prilikom korištenja usluga paketne distribucije. Čak 87,40 % ispitanika navodi da nisu imali pritužbe, dok je 12,60 % ispitanika imalo pritužbe prilikom korištenja usluga paketne distribucije. Ispitanici koji su imali pritužbe prilikom korištenja usluga paketne distribucije naveli su svoja iskustva. Neka od navedenih su: „Nepravovremena dostava te nepravovremene obavijesti“, „kašnjenje isporuka“, „Ostave potvrdu o pošiljci iako se ista može dostaviti“, „ne dostavljaju pošiljku na vrata već samo ostave obavijest o pošiljci“, „Primio sam obavijest da je bio pokusaj dostave a da nikoga nije bilo na adresi, iako sam u vremenu dostave bio kod kuće. Znači da nitko nije niti pozvonio nego je ostavio obavijest“; „Oštećenje robe pa loša usluga povodom toga; Ostavim kontakt broj mobitela, ali ne žele nazvat prije uručenja pošiljke“. Prilikom pitanja o načinu na koji bi se paketni dostavljači mogli prilagoditi željama i potrebama ispitanika u budućnosti, ispitanici navode: bolju organiziranost i dostupnost informacija, brzinu i sigurnost dostave pošiljaka, modernizaciju, profesionalizam.
Ispitanici koji su naveli da ne koriste usluge paketnih dostavljača u Republici Hrvatskoj, kao razloge navode sljedeće: kašnjenje isporuke, nepouzdanost dostave, nepovjerenje u kupovinu putem Interneta, nepostojanje potrebe za takvom vrstom usluge, nekvalitetnu uslugu paketnih dostavljača, dodatno naplaćivanje unatoč plaćenoj poštarini, nepouzdanost, nepovjerenje u korištenje usluga paketnih dostavljača, sporu dostavu i velike naknade.
Pouzdanost usluge i poštivanje roka dostave pokazali su se kao najvažniji atributi koje trebaju zadovoljavati pružatelji usluga. Mladi su korisnici iskazali najviše zadovoljstvo uslugama pružatelja paketne dostave kada njihov paket sretno stigne na odredište i kada pružatelji usluga distribucije vode računa o sigurnosti paketa, te da je isti isporučen u stanju u kojem je i poslan.
3. 4 Ograničenja i preporuke za buduća istraživanja
Provedeno istraživanje o zadovoljstvu mladih korisnika uslugama paketnih dostavljača u Republici Hrvatskoj ima svoja ograničenja. Kako ne postoje dovoljna saznanja u znanstvenoj literaturi i obzirom na to da je područje paketne dostave nedovoljno istraženo među mladim korisnicima, uistinu je teško komparirati rezultate provedenoga istraživanja s ostalim istraživanjima u području korištenja usluga paketnih dostavljača.
U ovom se radu ispitivalo općenito zadovoljstvo mladih korisnika uslugama paketne distribucije i pružatelja usluga paketne distribucije. U budućnosti bi se istraživački fokus trebao usmjeriti i na detaljnu analizu proizvoda koji se dostavljaju koristeći usluge pojedinih pružatelja usluga.
Osim istraživanja provedenog među potrošačima, po uzoru na svjetska istraživanja, predlaže se u budućnosti istraživački fokus usmjeriti i na poslovne korisnike usluga paketne distribucije. Zanimljivo bi bilo istražiti i percepcije pružatelja usluge paketne distribucije, po uzoru na Seitz et al. (2008). Ovo istraživanje, prvo takve vrste i opsega u Hrvatskoj, može pomoći u sistematizaciji postojećih znanja i unapređenju rada i ponude usluga paketnih dostavljača u Republici Hrvatskoj, na opće zadovoljstvo korisnika navedenih usluga.

D. Naletina, M. Damić, L. Meštrović: Zadovoljstvo mladih korisnika uslugama paketnih dostavljača…Zbornik Veleučilišta u Rijeci, Vol. 8 (2020), No. 1, pp. 331-351
348
4. ZAKLJUČAK
Uslijed završetka liberalizacijskih procesa poštanskih tržišta u zemljama članicama, te kontinuiranog rasta online kupovine, potreba za paketnom dostavom sve je veća. Uslijed tehnološkog napretka i ranije navedenih procesa, mijenja se i ponašanje korisnika, ali i njihova očekivanja glede kvalitete te brzine usluge. Raste i konkurencija na ovom tržištu te poduzeća nastoje, s jedne strane minimizirati troškove, a s druge strane pružiti veću kvalitetu usluge kako bi u konačnici osigurali zadovoljstvo svih sudionika u procesu.
Za potrebe rada provedeno je primarno istraživanje kojim se ispitivalo zadovoljstvo korisnika pružateljima usluga paketne dostave. Rezultati istraživanja upućuju na frekventno korištenje usluga paketne dostave inozemnog pružatelja (DHL), kao i domaćeg pružatelja usluga poštanske dostave (Hrvatska pošta). Među najznačajnijim rezultatima istraživanja ističe se pouzdanost usluge i poštivanje roka dostave, a koji su se pokazali kao najvažniji atributi koje trebaju zadovoljavati pružatelji usluga. No, bitno je istaknuti kako se dob ispitanika pokazala značajnom samo za tri čimbenika: cijena, dostupnost usluge te brzina pružanja usluge. Mladi korisnici najviše preferiraju da njihov paket sretno stigne na odredište i da je pri tome isti došao u stanju u kojem je poslan. Najmanje važnim pokazala se prepoznatljivost imena poduzeća koje vrši dostavu paketa. Zabrinjavajuće je što ispitanici najmanje vode računa o ekološkoj odgovornosti pružatelja usluge.
Rezultati provedenog istraživanja mogu uvelike pomoći u sistematizaciji postojećih znanja i unapređenju rada i ponude usluga paketnih dostavljača u Republici Hrvatskoj, a na opće zadovoljstvo korisnika navedenih usluga. Obzirom da se u ovom radu ispitivalo općenito zadovoljstvo korisnika uslugama paketne distribucije i pružatelja usluga paketne distribucije, u budućnosti bi se istraživački fokus trebao usmjeriti i na detaljnu analizu proizvoda koji se dostavljaju koristeći usluge pojedinih pružatelja usluga. Također, trebalo bi i utvrditi vezu između rasta online kupovine te lojalnosti korisnika pojedinom pružatelju poštanskih usluga. Obzirom kako na ovom tržištu usluge pružaju kako domaća tako i inozemna poduzeća, u budućim istraživanjima trebalo bi analizirati razliku između ključnih odrednica kvalitete usluge između istih.
LITERATURAAndrijanić, I. (1999) Vanjska trgovina: Kako poslovati s inozemstvom. Zagreb: Mikrorad
Bendeković, J., Batarelo, T. (2009) ‘’Modeli poslovnih strategija međunarodne paketne distribucije’’, Poslovna izvrsnost, 3(2), str. 79-98
Chou, P. F. (2014) ‘’An evaluation of service quality, trust, and customer loyalty in home-delivery services’’, International Journal of Research in Socail Science, 3(8), str. 99-108.
Dobrodolac, M., Ralević, P. (2013) ‘’Predlog novog koncepta univerzalne poštanske usluge u Republici Srbiji’’, XXXI Simpozijum o novim tehnologijama u poštanskom i telekomunikacionom saobraćaju – PosTel 2013, Beograd, str. 204-212, http://postel.sf.bg.ac.rs/simpozijumi/POSTEL2013/RADOVI%20PDF/Postanski%20saobracaj,%20mreze%20i%20servisi/10.%20Dobrodolac,%20Ralevic,%20Stanivukovic.pdf (13.10.2019.)
Dujak, D. (2012) ‘’Upravljanje opskrbnim lancem od strane maloprodaje kroz centralnu distribuciju’’ U: Segetlija, Z. et al. (Ur.) Poslovna logistika u suvremenom menadžmentu, Osijek: Ekonomski fakultet u Osijeku, str. 47-59
Dwianto, A. S., Purnamasari, P. (2018) ‘’Analysis the influence of service quality on customer satisfaction of domestic postal parcels at Kantor Pos Banjarmasin’’, Proceedings International Seminar On Accounting for Society, International
D. Naletina, M. Damić, L. Meštrović: Zadovoljstvo mladih korisnika uslugama paketnih dostavljača…Zbornik Veleučilišta u Rijeci, Vol. 8 (2020), No. 1, pp. 331-351
349
Seminar on Accounting for Society, Pamulang: Faculty of Economy, 1(1), http://openjournal.unpam.ac.id/index.php/Proceedings/article/view/1810/1508 (13.10.2019.)
Finnish Transport and Communications Agency (25.06.2019.) Parcel volumes continued strong growth – letter, newspaper and magazine deliveries declined, https://www.traficom.fi/en/news/parcel-volumes-continued-strong-growth-letter-newspaper-and-magazine-deliveries-declined (22.11.2019.)
Gligorić, L., Đumić, S. (2013) ‘’Elementi netržišnog poslovnog okruženja na tržištu poštanskih usluga u Srbiji’’, XXXI Simpozijum o novim tehnologijama u poštanskom i telekomunikacionom saobraćaju – PosTel 2013, Beograd, str. 171-182, http://postel.sf.bg.ac.rs/simpozijumi/POSTEL2013/RADOVI%20PDF/Postanski%20saobracaj,%20mreze%20i%20servisi/7.%20Gligoric,%20Djumic.pdf (17.10.2019.)
Gligorić, L., Đumić, S. (2013) ‹›Elementi netržišnog poslovnog okruženja na tržištu poštanskih usluga u Srbiji››, XXXI Simpozijum o novim tehnologijama u poštanskom i telekomunikacionom saobraćaju – PosTel 2013, Beograd, 03.-04.12.2013., str. 171-182, http://postel.sf.bg.ac.rs/simpozijumi/POSTEL2013/RADOVI%20PDF/Postanski%20saobracaj,%20mreze%20i%20servisi/7.%20Gligoric,%20Djumic.pdf (07.09.2018.)
Heco, S. (2018) ‘’Unapređenje koncepta održivog razvoja poštanskog sektora i zaštite okoline sa osvrtom na univerzalne poštanske usluge’’, Zbornik radova 5. Konferencija „Održavanje - Maintenance 2018“, Zenica, 10.-12.05.2018., str. 329-334, http://www.odrzavanje.unze.ba/zbornici/2018/045-O18-045.pdf (06.09.2018.)
Hillebrand, A. et al. (2016) Technology and change in postal services – impacts on consumers. Bad Honnef: WIK Consult and ITA Consulting
Jackson, P. (01.05.2008.) We need a new business model for the postal market. Post&Parcel, https://postandparcel.info/24446/news/we-need-a-new-business-model-for-the-postal-market/ (16.08.2018.)
Kollara, N. H. (2017) Digital transformation, business models and the postal industry, doktorski rad, Lausanne: Ecole polytechnique fédérale de Lausanne
Kristensen, K., Martensen, A., Gronholdt, L. (2000) ‘’Customer satisfaction measurement at post Denmark: results of application of the European customer satisfaction index methodology’’, Total Quality Management, 11(7), str. 1007-1015. https://doi.org/10.1080/09544120050135533
Kujačić, M., Šarac, D., Jovanović, B. (2009) ‘’Model održivosti univerzalnog poštanskog servisa’’, XXVII Simpozijum o novim tehnologijama u poštanskom i telekomunikacionom saobraćaju – PosTel 2009, Beograd, str. 3-13, http://postel.sf.bg.ac.rs/simpozijumi/POSTEL2009/RADOVI%20PDF/Uvodno%20izgaganje/M.%20Kujacic,%20D.%20Sarac,%20B.Jovanovic.pdf (06.09.2018.)
Lăzărescu, C. (2017) ‘’The Postal Market – a New Economic Challenge in the Context of Globalization’’, Journal of Humanistic and Social Studies, br. 1, str. 187-196
Li, B. et al. (2006) ‘’A comparison study of customer satisfaction between the UPS and FedEx: an empirical study among university customers’’, Industrial Management & Data Systems, 106(2), str. 182-199. https://doi.org/10.1108/02635570610649844
Liu, J., Wen, Y. (2012) Study of Competitiveness: A Case Study of DHL. University of Gavle. Department of Business and Economic studies, http://www.diva-portal.org/smash/get/diva2:545580/FULLTEXT02.pdf (04.09.2018.)
Ministarstvo mora, prometa i infrastrukture (N/A) ‘’Propisi’’, http://www.mppi.hr/default.aspx?id=639 (05.07.2018.)
Narodne novine (2015) Zakon o izmjenama i dopunama Zakona o poštanskim uslugama, Zagreb: Narodne novine d.d., br. 78
Peković, O., Tričković, I. (2010) ‘’Modeliranje optimalnog rasporeda jedinica poštanske mreže u cilju poboljšanja logističkih performansi poštanskih sistema’’, XXVIII Simpozijum o novim tehnologijama u poštanskom i telekomunikacionom saobraćaju – PosTel 2010, Beograd, http://postel.sf.bg.ac.rs/simpozijumi/POSTEL2010/RADOVI%20PDF/Postanske%20tehnologije%20i%20elektronsko%20poslovanje/7.%20O.Pekovic%20I.Trickovic.pdf (07.09.2018.)
Seitz, V., Razzouk, N. and Williams, S. L. (2008) ‘’Small Package Transportation Companies: An Exploratory Analysis’’, Review of Economic and Business Studies, br. 2, str. 77-92.

D. Naletina, M. Damić, L. Meštrović: Zadovoljstvo mladih korisnika uslugama paketnih dostavljača…Zbornik Veleučilišta u Rijeci, Vol. 8 (2020), No. 1, pp. 331-351
350
Šarac, D., Jovanović, B. (2012). ‹›Procena kvaliteta poštanskih usluga››, XXX Simpozijum o novim tehnologijama u poštanskom i telekomunikacionom saobraćaju – PosTel 2012, Beograd, 04.-05.12.2012., str. 193-200, http://postel.sf.bg.ac.rs/simpozijumi/POSTEL2012/RADOVI%20PDF/Postanski%20saobracaj,%20mreze%20i%20servisi/10.%20D.%20Sarac,%20B.%20Jovanovi-%87.pdf (08.09.2018.)
Vakulenko, Y., Hellström, D., Hjort, K. (2018) ‘’What’s in the parcel locker? Exploring customer value in e-commerce last mile delivery’’, Journal of Business Research, Vol. 88(July), str. 421-427. https://doi.org/10.1016/j.jbusres.2017.11.033

D. Naletina, M. Damić, L. Meštrović: Zadovoljstvo mladih korisnika uslugama paketnih dostavljača…Zbornik Veleučilišta u Rijeci, Vol. 8 (2020), No. 1, pp. 331-351
351
Review article https://doi.org/10.31784/zvr.8.1.9 Received: 2. 12. 2019. Accepted: 27. 1. 2020.
SATISFACTION OF THE YOUNG USERS WITH THE PARCEL DELIVERY SERVICES IN CROATIA
Dora Naletina PhD, Assistant Professor, Faculty of Economics and Business, J. F. Kennedy 6, 10000 Zagreb, Croatia;
e-mail: [email protected]
Mate Damić PhD, Assistant Professor, Faculty of Economics and Business, J. F. Kennedy 6, 10000 Zagreb, Croatia;
e-mail: [email protected]
Luka Meštović Mag. oec., PBZ Plc., Radnička 45, 10000 Zagreb, Croatia; e-mail: [email protected]
SUMMARYIn the last years, the role of parcel delivery in urban areas has been continuously growing, first and foremost because of the intense importance online commerce is gaining. This is also true of the Croatian market. With the Croatian accession to the European Union, postal services market has liberalized which has created suitable preconditions for the existing services, growth of competi-tion and more packages to be delivered. Almost all world-renown service providers are present on the Croatian parcel distribution market. Bearing in mind that mostly younger population uses information technologies, and therein shop online, their satisfaction with the services provided by the parcel delivery companies in Croatia should be investigated. Therefore, the purpose of this re-search paper is, based on the primary research, to explore how well young users are satisfied with the package delivery services in Croatia. Reliability and punctuality have been confirmed as the most significant factors that determine the level of satisfaction of the young users with the quality of the overall service. The research also suggests that recognition of the company’s name is the least important element. Companies that operate on this market have to improve information availability, work on providing safe and timely delivery and invest in further modernization.
Key words: Croatia, young consumers, parcel consignment, parcel delivery
Creative Commons Attribution – NonCommercial 4.0 International License


S. Bailoa, P. Cravo: Strategic Tourism Planning in Portugal: Challenges for the National Tourism...Zbornik Veleučilišta u Rijeci, Vol. 8 (2020), No. 1, pp. 353-374
353
Review article https://doi.org/10.31784/zvr.8.1.23 Received: 6. 12. 2019. Accepted: 27. 1. 2020.
STRATEGIC TOURISM PLANNING IN PORTUGAL: CHALLENGES FOR THE NATIONAL TOURISM
DEVELOPMENTSandra Bailoa
PhD, Adjunct Professor, Polytechnic Institute of Beja, R. Pedro Soarez, Campus do Instituto Politécnico de Beja, 7800-295 Beja, Portugal; e-mail: [email protected]
Pedro Cravo PGrad, Assistant Professor, Polytechnic Institute of Beja, R. Pedro Soarez, Campus do Instituto Politécnico
de Beja, 7800-295 Beja, Portugal; e-mail: [email protected]
ABSTRACTThe growth of tourism in Portugal allowed leveraging the economy on the last decade more than any other economic activity. The positive results in many indicators, such as the contribution to GDP, exports and revenues, show that it has been considered an engine of the economy that has produced effects in all the regions of the country. Also contributing to these results were the various strategies that the government has continually defined over the past two decades. This paper starts with a brief literature review and presents a descriptive analysis of the main long-term instruments that feature the Portuguese strategy for tourism, showing the important role that planning can have on the management of the impacts that come from the implementation of these activities. Also, the results of the main indicators (published by several different sources) are presented. The results reveal that there are still several issues that need addressing, so the main challenges for tourism development in Portugal are exposed.
Key words: Development, National strategies, Portugal, Strategic planning, Tourism
1. INTRODUCTION
Over the last decade tourism has been an important economic activity in Portugal and is even considered the country’s largest exporting economic activity. It facilitates the development process of many regions, without which a better quality of life for their population wouldn’t have been possible. Tourism development causes multiple positive and negative effects so strategic planning can be an important instrument to manage these effects. Strategic planning in the tourism area can be considered a tool of the economic and social policy of a country that ensures a more
Creative Commons Attribution – NonCommercial 4.0 International License

S. Bailoa, P. Cravo: Strategic Tourism Planning in Portugal: Challenges for the National Tourism...Zbornik Veleučilišta u Rijeci, Vol. 8 (2020), No. 1, pp. 353-374
354
balanced and sustained development. It can contribute to reduce regional disparities and ensure a more harmonious and better distribution of equipment, infrastructure, economic activities and use of the territory.
The leading objective of this paper is to analyse the main strategic instruments that have been defined and implemented in Portugal and guided the national strategy for tourism development throughout the last two decades. Another purpose of the paper is to presents some of the results achieved using these strategic planning instruments in the area of tourism, identifying the main challenges for the Portuguese tourism in the future. We will try to appraise the major benefits that resulted from these instruments and try to identify the areas that still need further improvement.
The methodology adopted was the documental analysis, based in the exploration of the different strategic planning instruments used in Portugal over the last two decades, in order to identify the main areas of intervention during this period. After that, we collected data from a variety of institutional sources, which allowed us to study the evolution of various social and economic indicators regarding tourism. The main indicators for tourism development (arrivals, receipts, guests, overnights and jobs) were analysed, in order to evaluate the efficiency of the planning instruments that were adopted (measured by the variation of those indicators, but also by the variation of the industry’s contribution to the GDP). Taking also in consideration some of the megatrends for the sector, we were able to identify various challenges that still lie ahead.
This text is organized in three main chapters: the first is reserved for the literature review about strategic planning and tourism planning; the second one deals with the strategic tourism planning instruments used in Portugal over time; and the third analyses the major economic indicators related to tourism and identifies the aspects that still need to improve to continue promoting the development of the activity in Portugal.
2. STRATEGIC TOURISM PLANNING: LITERATURE REVIEW
2. 1 Strategic planning in tourism
Despite the origin of the concept of strategy being very much associated with the military field, nowadays it is also related with the ability to manage and lead organizations and has multiple contributions from the areas of management and administration. In literature, it is possible to realize that each author in each temporal context has contributed to a better conception of what is strategy. Mintzberg et al. (1998) categorizes the different views of strategy in ten schools of strategic thinking. The concept of strategic planning fits into the Planning School thus designated by Mintzberg et al. (1998:48) that understands strategy formation as a formal process (that is analytical, detailed and decomposed into distinct phases).
In a general way planning is a function of the management process, in which the objectives and the ways to fulfil them are defined. According to Williams (2003:126) “‘Planning’ has been defined in various ways, but a common perspective recognises it as an ordered sequence of operations and actions that are designed to realise either a single goal or a set of inter-related goals and objectives.”

S. Bailoa, P. Cravo: Strategic Tourism Planning in Portugal: Challenges for the National Tourism...Zbornik Veleučilišta u Rijeci, Vol. 8 (2020), No. 1, pp. 353-374
355
Williams (2003:127) presents a general model of the planning process in which the principal elements in devising and implementing a plan are envisaged as a series of key stages:
Figure 1. General sequence for the production and implementation of a plan
Source: Williams (2003:127)
In the tourism sector the need for planning is clearly visible when comparing experiences of success of most of local rationally planned tourist destinations with the negative experience of many unplanned locations verifying negative impacts and low levels of tourist satisfaction. For Williams (2003:125) the absence of planning brings evident risks for tourism development because it “will become unregulated, formless or haphazard, inefficient and likely to lead directly to a range of negative economic, social and environmental impacts.”
Williams (2003:129-130) presents some reasons to justify the importance of planning in tourism:
• Provides a mechanism for a structured provision of tourist facilities and associated infrastructures;
• Permits the co-ordination of activity;• Allows at conserving resources, but also at maximising the benefits to local populations;• Provides a mechanism for the distribution and redistribution of tourism-related investment
and economic benefits;• Gives the industry a political significance (since most planning systems are subject to political
influence and control) and therefore provides a measure of status and legitimacy;• To anticipate likely demand patterns and to attempt to match supply to those demands;• To maximise visitor satisfaction.

S. Bailoa, P. Cravo: Strategic Tourism Planning in Portugal: Challenges for the National Tourism...Zbornik Veleučilišta u Rijeci, Vol. 8 (2020), No. 1, pp. 353-374
356
According to Teixeira (2005:49), strategic planning, unlike other levels, aims to anticipate the long-term future, including the definition of objectives and the ways of action to achieve them. Strategic decisions have long term impact, such as the ones that imply the definition of products, services, markets, the development of destinations and regions, high investments, among others. According to Ferreira (2009:1520), planning must be seen as a critical element that guarantees, in the long term, the sustained development of the tourist destination. To Carvalho & Costa (2014:2) strategic planning in tourism is crucial as a tool for the development of the regions, since it can help in the planning and qualification of the territory, guide public and private investment, strengthen the qualification of human resources and the development of products and destinations.
Tourism development at the international level has increased competition between destinations, resulting in a number of positive but also negative impacts. Planning can be the answer to achieve, on the one hand, the maximization of income from this activity and, on the other hand, minimizing its negative effects. Due to the set of peculiar resources used and effects that derive from tourism over diverse sectors, then the development of these activities should be based on a planning process that includes a solid assessment of the destination resources and their attractiveness potential and an assessment of possible impacts.
The negative effects of mass tourism brought to the discussion the concept of sustainable development of tourism. Holden (2008:171) refers that there is an evident need for the environmental planning and management of tourism, because of the sometimes negative interaction between tourism and the natural environment and that has become a concern to different stakeholders in tourism as governments, NGOs, local communities, donor agencies and the private sector. Hall (2000) proposes a sustainable approach of the tourist planning or, in other words, an integrated tourism development planning. This means that tourism planning must be able to articulate the physic and economic dimension of tourism, ensuring, in a long-term, the viability of the tourism industry. The author identifies that strategic long-term tourism planning has three objectives: conservation of tourism resource values; experience of visitors who interact with tourism resources; and maximizing economic, social and environmental returns for the communities’ stakeholders. For Tribe (2004:380) sustainability can be that level of development which does not exceed the carrying capacity of the destination and, thus, does not cause serious or irreversible changes to the destination and that can sustain itself in the long run.
To Williams (2003:131) tourism planning, as a concept, is characterised by a range of meanings, applications and uses because it encompasses many activities; addresses physical, social, economic, business and environmental concerns; involves different groups, agencies and institutions; may be exercised by both the public and the private sectors and be subject to varying degrees of legal enforcement; works at local, regional, national and (occasionally) at international scales. Table 1 summarises a cross-section of applications within the broad realms of tourism planning according to Williams (2003:132).

S. Bailoa, P. Cravo: Strategic Tourism Planning in Portugal: Challenges for the National Tourism...Zbornik Veleučilišta u Rijeci, Vol. 8 (2020), No. 1, pp. 353-374
357
Table 1. Diversity of tourism planning
Planning Sector Typical Tourism Planning Concerns/Issues
Physical (land)
Control over land development by both public and private sectors Location and design of facilities Zoning of land uses Development of tourist transportation systems Development of public utilities (power, water, etc.)
Economic
Shaping spatial and sectoral patterns of investment Creation of employment Labour training Redistribution of wealth Distribution of subsidies and incentives
Social/cultural
Social integration/segregation of hosts and visitors Hospitality Authenticity Presentation of heritage and culture Language planning Maintenance of local custom and practice
Environmental
Designation of conservation areas Protection of flora and fauna Protection of historic sites/buildings/environments Regulation of air/water/ground quality Control over pollution Assessment of hazards
Business and marketing
Formation of business plans and associated products Promotional strategies Advertising Sponsorship Quality testing and product grading Provision of touristic information service
Source: Williams (2003:132)
In summary strategic planning in tourism is a long-term process that can encompass different scales, sectors and activities.
2. 2 Tourism planning at the national level
Usually Tourism planning at national level represents in a country the higher level of policies to develop this sector. National plans and policies define the main orientations of tourism development and are the guidelines to elaborate regional and local plans and shape the policies

S. Bailoa, P. Cravo: Strategic Tourism Planning in Portugal: Challenges for the National Tourism...Zbornik Veleučilišta u Rijeci, Vol. 8 (2020), No. 1, pp. 353-374
358
at lower levels of administrative organization. Williams (2003:125) considers that ”Planning, in its different forms, can be a mechanism for:
• integrating tourism alongside other economic sectors;
• shaping and controlling physical patterns of development;
• conserving scarce or important resources;
• providing frameworks for active promotion and marketing of destinations.”
As tourism sector has represented a significant weight in the western national economies, then this activity must be properly thought out so that its development can be sustained and sustainable. In pursuit of this objective, governments can play a central role in planning and managing the tourism development process at national scale. For Baum & Szivas (2008:784) the way how is perceived the role of government and its agencies in to formulate policy, shape practice and deliver services is influenced by the political interpretation of the role of the state in the management of the economy and the social and cultural environment. Thus, in a destination the level of state intervention and direct engagement with the tourism sector that is found will depend upon the way is perceived the economic development, if it is based more on free market or planned models or their combination that are prevalent in the country at a particular point in time, a political construction that varies across time and place (Baum & Szivas, 2008:784). So, it is possible to find situations where the role of the government is more intervenient and others where its plans are more indicative.
According to Williams (2003:135) national-level planning of tourism seeks to define primary goals for tourism development and identify policies and broad strategies for their implementation. According to this author usually national tourism plans reflects concerns over economic issues because of the perceived capacity of international tourism to affect positively a country’s balance of payments account and the capacity to create employment and that justifies why a growing number of nations have positioned tourism centrally within their national economic development plans. Williams (2003:135) refer that a second role for national tourism plans is the development of regions, to contribute for the redistribution of wealth and to narrow inter-regional disparities; to create employment; to channel tourism development into zones that possess appropriate attractions and infrastructure; to protect fragile regions from potentially adverse effects of tourism development as environmental factors. Williams (2003:135) also indicates a third focus of national-level tourism planning that is marketing, which is especially prominent amongst developed destinations that possess the expertise and the resources to form and promote a distinctive set of national tourism products.
Whatever the tourism development objectives, governments can use a varied set of planning instruments. Holden (2008:174) argues that although national priorities and global economic forces that derive from tourism development may detract from environmental conservation then governments have a range of policy and legislative measures (a mix of policy and planning measures) at their disposal which can be used to safeguard resources. Holden (2008:175) indicates some typical measures that governments can consider such as:

S. Bailoa, P. Cravo: Strategic Tourism Planning in Portugal: Challenges for the National Tourism...Zbornik Veleučilišta u Rijeci, Vol. 8 (2020), No. 1, pp. 353-374
359
• The establishment of protected areas through legislation, for example, national parks, and application for international recognition of significant environments, such as the World Heritage Site status given by UNESCO;
• The implementation of land-use planning measures such as zoning, carrying capacity analysis, and limits of acceptable change to control development;
• Mandatory use of environmental impact analysis for certain types of projects;
• Encouraging co-ordination between government departments over the implementation of environmental policy and entering into dialogue with the private sector to encourage the adoption of environmental management policies, such as environmental auditing and the development of environmental management systems.
Tribe (2004: 382) also presents different approaches to encourage sustainability that includes different instruments:
• Regulation – generally functions at the national and international level: Planning; Environmental impact assessment; Laws and regulation; Special status designation.
• Market approaches – to influence the demand and supply of goods and services: Ownership; Taxes, subsidies and grants; Tradable rights and permits; Deposit–refund schemes; Product and service charges;
• Soft tools – to influence consumption at the consumer level: Tourism eco-labelling; Certification/award schemes; Guidelines, treaties and agreements; Citizenship, education and advertising.
According to Benur & Bramwell (2015: 214) when working toward sustainable development and competitive advantage, destinations have fundamental strategic options, that is whether there is product concentration (one or few products) or diversification (diverse products). Also, they must think about their tourism product intensification, that is whether they develop niche or mass tourism products according to the desired market size and physical scale of development. The same authors refer that both strategies have potential advantages and disadvantages for business profitability, destination competitiveness and sustainable development and it is necessary for policy makers, planners, businesses and citizens to be aware and assess such potential advantages and disadvantages, and to consider them carefully in the specific context and circumstances of each destination.
On the last decades, an increase of domestic and international tourist arrivals and, at the same time, an increase on the supply of destinations allowed an increase of competitiveness on the marketplace on both the demand and supply side. Mariani et al. (2014:270) refer that, while competition among tourism destinations is increasing significantly, competitive advantage is typically sustained on a shorter and shorter span of time. Destinations increasingly need to adapt continuously to the changing tourist preferences and, at the same time, need to review if their image still reflects their strong points and credibility. This means a review of its strategies and its strategic positioning.

S. Bailoa, P. Cravo: Strategic Tourism Planning in Portugal: Challenges for the National Tourism...Zbornik Veleučilišta u Rijeci, Vol. 8 (2020), No. 1, pp. 353-374
360
According to Fyall (2019:271) the emergence of so many new destinations around the world brings the need for tools and techniques for destinations to maintain and/or increase their competitive position and their ability to be truly distinctive in the marketplace. This author argues that this is especially the case of many destinations that seek to position themselves beyond tourism goals as great places to live, work, invest and study as well as to visit. Fyall (2019:272) refers that for many destinations re-positioning represents an opportunity to rejuvenate and re-energize themselves with a change on its strategic approach. However, re-positioning strategy must be a campaign based upon real foundations and infrastructural change, tangible actions, to be believable and credible therefore, not to be superficial with words, images and logos not supported by actions (Fyall, 2019:281).
Mariani et al. (2016:4) refer that strategies in tourism became more complex due a tension between collaborative and competitive behaviours, a tendency that means that tourism destinations wherein competing tourism business have also to cooperate with the aim of marketing the destination and strengthening its brand image. Mariani et al. (2014:270) identified a trend that is the increasing importance of collaboration and especially coopetition (which is a mix of cooperation and competition), not only within a tourism destination, but also among destinations, as a strategy for a destination to achieve a competitive advantage in the long term.
The definition of strategies for the development of tourism destinations does not seem to be a consensual process anyway, it is a process that needs to be thought out and planned. Although the strategic tourism planning process is associated with a set of advantages and benefits, its implementation is not without constraints. Williams (2003:131) refers that there have been some constraints and weaknesses associated to tourism planning that includes a tendency towards short-termism (short-term perspectives limits the development of longer-term, strategic planning for tourism; reflection of the natural rhythm of annual cycles and consequence of the structure of the industry at most destinations and the dominance of small enterprises); organizational deficiencies (organizational shortcomings and an absence of planners with specialist knowledge of the industry); and problems of implementation (a divergence between what is intended by a tourism plan and what is actually delivered).
3. NATIONAL STRATEGIES FOR TOURISM IN PORTUGAL
In Portugal tourism is considered a strategic sector of economic development because of its capacity for wealth-generation, contributing to GDP, to the balance of payments, to job creation, and consequently to the country’s competitiveness. Therefore, due to this importance, it is possible to find some national strategies for the development of the tourism sector with a strong commitment of government and tourism stakeholders. Despite that recent priority, it took time for the country to define a long-term major policy for tourism and to produce some planning instrument. Table 2 presents the major strategies for tourism in Portugal.

S. Bailoa, P. Cravo: Strategic Tourism Planning in Portugal: Challenges for the National Tourism...Zbornik Veleučilišta u Rijeci, Vol. 8 (2020), No. 1, pp. 353-374
361
Table 2. National Strategies for Tourism in Portugal
Year Strategy denomination
1986 National Tourism Plan
2007 PENT - National Strategic Plan for Tourism
2011 PENT (1st revision)
2013 PENT (2nd revision)
2015 Tourism 2020 - Action Plan for Tourism Development in Portugal 2014-2020
2015 Tourism 2020 - 5 Principles for an Ambition
2017 Tourism Strategy 2027
Source: Authors
Moreira (2018) refers that in Portugal tourist planning was non-existent until the 1980s when the first National Tourism Plan (Plano Nacional de Turismo) was published in 1986. According to Moreira (2018): “Under this plan, 19 Regional Tourist Boards were created, following a policy approach to decentralize state power that saw some importance ascribed at both a local and regional scale; land-use planning was valued, as well as investments, professional training, tourist entertainment, balneology and spas and promotion aimed at diversifying markets and increasing revenues.”
From 2006 to 2015, the great reference and strategic orientation for the development of the tourism sector was the National Strategic Plan for Tourism (PENT - Plano Estratégico Nacional do Turismo) which defined the necessary actions for its sustained growth. The first version of PENT was approved by Resolution of the Council of Ministers no. 53/2007, of April 4, and was developed for the 2006-2015 time horizon (Turismo de Portugal, 2013:4). Presenting the lines for the strategic development of tourism, PENT was structured in 5 axes: Territory, Destinations and Products; Brands and Markets; Qualification of Resources; Distribution and Marketing; Innovation and Knowledge (Turismo de Portugal, 2007:8); and its implementation required 11 projects, at various levels and encompassing multiple entities.
The main objective was the sustained growth above the European average, with a particular focus on revenue, translated into the following goal: annual growth in the number of international tourists above 5% and revenues above 9% (Turismo de Portugal, 2007:47). The objectives were then defined regionally for the 7 Portuguese regions (Porto and Norte, Centro, Lisbon, Alentejo, Algarve, Azores, Madeira). The strategy was based on the combination of (Turismo de Portugal, 2007:45):
• The differentiating elements – these are tourism resources that distinguish Portugal from other competing destinations: climate and light; history, culture and tradition; hospitality; concentrated diversity;
• The qualifying elements – these are necessary to qualify Portugal in the range of options for the tourists: modern authenticity, security and excellence in the relation quality/price.

S. Bailoa, P. Cravo: Strategic Tourism Planning in Portugal: Challenges for the National Tourism...Zbornik Veleučilišta u Rijeci, Vol. 8 (2020), No. 1, pp. 353-374
362
The strategy considered Portuguese “raw materials” – climatic conditions, natural and cultural resources. Ten strategic tourism products were defined for development and consolidation: Sun and Beaches, Cultural and Landscape Tourism, City Break, Business Tourism, Nature Tourism, Nautical Tourism (includes Cruises), Health and Wellness, Golf, Integrated Resorts and Residential Tourism, and Gastronomy and Wines (Turismo de Portugal, 2007:63). For each region a set of products that would contribute to its performance in the short/medium term were defined, according to the resources and distinctive factors of each one. The strategic product x destination matrix is presented on Table 3 and shows the contribution of different products to each region.
Table 3. PENT’s Strategic Products x Destination matrix
Source: adapted from Turismo de Portugal (2015a:75)
PENT was then object of two revisions, the first in 2011 and the second in 2013. The last revision (Resolution of the Council of Ministers 24/2013 of April 16) was due to its need to be adapted to the strategic changes of the XIX government, due to the instability in the financial markets and moderate economic growth of the main tourist emitting economies of Portugal and also because the reality had shown that the definition of the objectives was not realistic because the results were far below the expectations (Turismo de Portugal, 2013:4). The 2013-2015 strategy continued to build on the 10 products defined in the PENT in order to reinforce the importance of supply stability in the external perception of destiny (Turismo de Portugal, 2013:14). To achieve the objectives, 8 development programs were defined, and 40 projects were implemented (Turismo de Portugal, 2013:48).
In 2015 Turismo de Portugal (National Tourism Authority) launched two strategic documents based on the 2020 time horizon: Tourism 2020 - Action Plan, intended at identifying priorities for the use of community funds for the 2014-2020 programming period; and Tourism 2020 - 5 Principles for an Ambition. Therefore, PENT was replaced by the Tourism 2020 Plan that defined the guiding principles of tourism public policies for 2016-2020. This plan is distinguished from the previous one by aiming at an ambition based on the private sector of tourism, an influence of the philosophy of the right-wing parties that constituted the XIXth constitutional government, which defined an ambition of competitiveness for Portugal and five principles that favour its concretization:

S. Bailoa, P. Cravo: Strategic Tourism Planning in Portugal: Challenges for the National Tourism...Zbornik Veleučilišta u Rijeci, Vol. 8 (2020), No. 1, pp. 353-374
363
the Person, Liberty, Openness, Knowledge and Collaboration (Turismo de Portugal, 2015a:4). Its objectives were to create conditions so that the revenues earned by the private tourism sector grow in Portugal above the average of its competitors and to be one of the ten most competitive destinations in the world (Turismo de Portugal, 2015a:4). The plan expressed this ambition in six different ways (Turismo de Portugal, 2015a:7-8):
1. A sustainable and quality destination;
2. A destination of competitive companies;
3. An entrepreneurial destination;
4. A destiny linked to the World;
5. A destination managed effectively;
6. A destination that marks.
Another difference in this plan is the fact that it does not want to define strategic tourism products for each region, now focusing on the motivations and experiences to the detriment of the products, as can be seen in Table 4. So according to this plan: “Strategic will thus be any product that, in a sustainable and integrated way in the territory, can respond to tourist motivations through a sustainable business model.” (Turismo de Portugal, 2015a:59)
Table 4. Tourism 2020’s Motivations vs Products Matrix
Source: adapted from Turismo de Portugal (2015a:59)

S. Bailoa, P. Cravo: Strategic Tourism Planning in Portugal: Challenges for the National Tourism...Zbornik Veleučilišta u Rijeci, Vol. 8 (2020), No. 1, pp. 353-374
364
Tourism 2020 - Action Plan consist on the strategic benchmark that establishes the objectives and the investment priorities in the area of tourism framed in the Portugal 2020, the European investment funds program of Portugal (Turismo de Portugal, 2015b). This plan follows the European Community programming cycle establishing goals and investment priorities and allocating the European structural and investment funds as a way of strengthening sectorial and territorial coordination. It provides a strategic frame of reference for the development of tourism by establishing its vision in a set of 5 strategic objectives (Turismo de Portugal, 2015b):
• To attract – Qualification and valorisation of the territory and its distinctive touristic resources;
• To compete – Reinforcement of the competitiveness and internationalization of tourism companies;
• To train – Training and, R&D and innovation in tourism;• To communicate – Promotion and commercialization of the tourist offer of the country
and the regions;• To cooperate – Strengthening international cooperation.
In 2017 the Tourism Strategy 2027 (Estratégia Turismo 2027 - ET27) was approved by the Resolution of Council of Ministers no. 134/2017 of September 27, which is, in the next decade, the strategic reference for Tourism in Portugal and the framework to follow the next cycle of Community Programming. The construction of the Strategy for Tourism 2027 was based on a participatory process, broad and creative, in which the State assumes its responsibility and mobilizes the various agents and society. It establishes a long-term vision, combined with action in the short term, allowing stakeholders to act with greater strategic sense in the present and to frame the future community support framework 2021-2027.
The ET27 is a long-term shared strategy for Tourism in Portugal that aims at the following objectives (Turismo de Portugal, 2017:10):
• To provide a 10-year strategic framework for national tourism;• To ensure stability and commitment on strategic options for national tourism;• To promote integration of sectoral policies;• To generate a continuous articulation between the various agents of Tourism;• To act with strategic sense in the present and in the short/medium term.
The implementation and materialization of the ET27 goes through the implementation of projects, based on the lines of action of its 5 strategic axes (Turismo de Portugal, 2017:50):
• To value the territory and the communities;• To boost the economy;• To enhance knowledge;• To generate networks and connectivity;• To project Portugal;
And it is committed to goals of economic, social and environmental sustainability.

S. Bailoa, P. Cravo: Strategic Tourism Planning in Portugal: Challenges for the National Tourism...Zbornik Veleučilišta u Rijeci, Vol. 8 (2020), No. 1, pp. 353-374
365
This is a strategy focused on 10 assets that aim at the sustainability and competitiveness of the Portugal destination distributed in 4 categories of strategic assets (Turismo de Portugal, 2017:46). Table 5 presents the 10 strategic assets that aim the sustainability and competitiveness of the destination.
Beyond the referred strategic plans, it should be noted that in Portugal tourism is also subject to a set of spatial planning instruments (territorial plans and programs that compose the Portuguese Territorial Management System which establishes in different levels (national, regional and municipal) the objectives, principles and responsibilities for spatial and urban planning1) and other legal framework (as the Fundamental Network for Nature Conservation2) that affect its development and which implies a diversity of actors, decision-making powers, private and public interests that is not always easy to reconcile and to coordinate. Tourism is included in a first level in the sectoral policy instruments with territorial impact and in connection with the other territorial management instruments. Therefore, in the regional plans, municipal plans and in the special plans must be identified the location and distribution of the touristic activities and spaces and legal restrictions related to the use of natural resources, land-use among others that affect touristic activities.
Table 5. Tourism Strategy 2027’s Strategic Assets
A - Unique/Transversal Asset
1. People
The main asset of tourism, its human resources, all the people that intervene in the different activities.
B - Differentiating Assets C - Qualifying Assets D - Emerging Assets
2. Climate and Sunlight 3. History, Culture and Identity 4. Sea 5. Nature 6. Water
7. Gastronomy and Wines 8. Artistic-Cultural, Sports and Business Events
9. Wellness 10. Living in Portugal
Anchor attributes that constitute the basis and substance of the national tourism offer, having one or more of the following characteristics: - Endogenous, which reflect intrinsic and distinctive characteristics of the destination/territory, with international tourist recognition and/or high development potential in the future; - Non-tradable, that are part of a specific destination/territory, not transferable to another location and not imitable; - Flow generators, that stimulate demand.
Assets that enrich the tourism experience and/or add value to the offer of the territories, leveraged by the differentiating as-sets of the destination.
Assets that are beginning to be recognized interna-tionally and which present a high potential for growth, which in the future may generate high added value movements and boost the multiplier effect of tourism in the economy.
Source: adapted from Turismo de Portugal (2017:46)
1 In Portugal, the spatial and urban planning policy is established by the Law 31/2014 of May 30, which establishes the framework law of public policy of soils, of spatial planning and of urbanism, and by the Decree-Law 80/2015 of May 14, which establishes the legal regime of the territorial management instruments.
2 In 2008, the Decree-Law 142/2008 of July 24 created the Fundamental Network for Nature Conservation (RFCN) and established the legal regime for the conservation of nature and biodiversity, being applicable to all the values and natural resources present in the territory and in waters under national jurisdiction.

S. Bailoa, P. Cravo: Strategic Tourism Planning in Portugal: Challenges for the National Tourism...Zbornik Veleučilišta u Rijeci, Vol. 8 (2020), No. 1, pp. 353-374
366
In any case, the number and diversity of plans and legal framework with influence on touristic activity has not always been positive, sometimes ending in a complex normative of difficult coordination and articulation between sectoral and territorial scope. According to Machado (2010:58) the institutional history of the Portuguese tourist development reveals difficulties in the cross between sectorial tourism policy and territorial planning and urbanism, leading to the insufficiency and ineffectiveness of political options of touristic spatial planning.
4. MAIN RESULTS AND CHALLENGES FOR TOURISM IN PORTUGAL
Almost 15 years after the first major strategic plan for tourism development in Portugal, and 5 years after the Tourism 2020 Plan, it is important to look at the current situation and see how tourism has evolved and how it contributes to the economic development of the country today.
Looking as far back as the middle of the XXth century (Graph 1), we see that Portugal has come a long way. According to Moreira (2018), during the 1960s the expansion of commercial flights to Portugal let to the tripling of the accommodation capacity, in order to serve this increase on the demand. After some fluctuation in the 1970s, due to the oil crisis, but also to the 1974 revolution, the country joined the European Economic Community in 1986, and the investment in infrastructure led to the improvement of supply which, in turn, was reflected in an increase of overnight stays.
Graph 1. Hotel establishments and overnight stays evolution in Portugal (1965-2016)
Source: Moreira (2018)

S. Bailoa, P. Cravo: Strategic Tourism Planning in Portugal: Challenges for the National Tourism...Zbornik Veleučilišta u Rijeci, Vol. 8 (2020), No. 1, pp. 353-374
367
After 2012 the number of overnight stays boosted. On one hand, this was because of changes in the regulation of some types of accommodation, that facilitated the opening of new establishments. On the other hand, several international events turned Portugal in to an interesting alternative to some Mediterranean destinations with security issues. Lastly this boost may also be attributed to the effects of the previously identified strategic planning instruments which, together with the international promotion of the destination and international awards received, pushed the growth of demand upwards.
Looking at the Tourism Satellite Account (TSA) data, from the National Statistics Board (Instituto Nacional de Estatística - INE, 2018), we find that the Gross Value Added (GVA) generated by tourism activities in Portugal rose 6,6% in 2016 and 13,6% in 2017, accounting for 7,5% of the national GVA in 2017. The national economy GVA only rose 4% in the same period, so this reflects the activity’s importance to the country’s economy.
The World Travel & Tourism Council data for Portugal (WTTC, 2018), shows that tourism accounted for 10,2% of the investment made in 2017 and 8,5% of the existing employment is in tourism activities, a figure that rises to more than 20,4% if indirect and induced effects are also accounted for. The TSA data indicates that tourism activities accounted for 9,4% of the national employment in 2017, which represents an increase of 4,8% relative to the previous year, a figure higher than the national employment evolution, that only rose 2,1%.
Considering the information made available by Pordata (2019), in 2018, the tourism sector generated 328,5 thousand jobs (weighting 6,7% in the national economy), representing an increase of 5,3 thousand jobs compared to the year 2017. The tourism sector is the largest economic activity in the country, accounting for 51,5% of exports of services and 18,6% of total exports in 2018, with tourism revenues accounting for 8,2% of Portuguese GDP.
The main results from the TSA (INE, 2018) are presented in Table 6. As we can see, the tourism demand, measured by the tourism consumption on the economic territory (which includes accommodation, food and beverage, transportation, travel agencies, leisure and recreation and other services) has been raising consistently, both in figure and in its weight on the GDP.
Table 6. Tourism Demand according to the TSA (2018)
Tourism Demand 2014 2015 2016 2017
- value (in million euros) 20 675 21 902 23 321 26 707
- variation (%) --- 5,9 6,5 14,5
- weight on the GDP (%) 11,9 12,2 12,5 13,7
Source: INE (2018)
According to the European Travel Commission (2019), up until July, the data for 2019 showed a positive performance for the European tourism sector following the solid performance in 2018. Portugal grew both in number of arrivals and in overnights, benefitting significantly from increasing year-on-year tourism revenues. Although competing destinations, like Turkey, Greece or Cyprus, had strong performances, that didn’t lead to a decrease in the demand for Portugal.

S. Bailoa, P. Cravo: Strategic Tourism Planning in Portugal: Challenges for the National Tourism...Zbornik Veleučilišta u Rijeci, Vol. 8 (2020), No. 1, pp. 353-374
368
Table 7, shows the evolution of the main indicators commonly used. These figures confirm that, although there was a period of recession that started after the 2007 international crises, which reflects on the numbers for 2010, tourism has been able to power the Portuguese economy forward. Even during the intervention of the International Monetary Fund, the European Central Bank and the European Union (commonly called the “troika”), between 2011 and 2014, most of these indicators recovered, having continued to grow after the “clean exit” of the “troika”. The tourism demand amounted to 13,7% of the GDP in 2017, a growth of 14,5% in relation to the previous year.
Table 7. Evolution of the main indicators in Portugal
2006 2010 2014 2018
Arrivals 11 282 000 6 832 000 9 277 000 21 400 000
Receipts (in million euros) 8 377 10 077 13 808 16 614
Guests 12 376 941 13 537 040 17 301 622 24 800 000
Overnights 46 038 957 45 863 005 55 912 865 66 100 000
Jobs --- 287 000 276 400 328 500
% GDP --- 9,2% 11,9% 13,7%
Source: UNWTO (2007, 2011, 2015), WTTC (2018), Pordata (2019)
Tourism in Portugal ended 2018 with indicators growing. There were 24,8 million guests registered, a growth of 3,8% over 2017. Among these, 15 million were foreign guests. With a total of 66,1 million overnight stays in 2018 (46,5 million overnight stays by foreigners and 19,6 million overnight stays by nationals), the main emitting markets for Portugal were the United Kingdom (9,1 millions), Germany (6,2 millions) and Spain (4,8 millions) (Turismo de Portugal, 2019).
The increases were also reflected in revenues, with a growth of 9,6%, corresponding to 16,6 billion euros. In this indicator, the main issuing markets for Portugal were the United Kingdom (2,8 billion €), France (2,7 billion €) and Spain (2,2 billion €) (Turismo de Portugal, 2019).
The results presented above reveal the capacity of Portuguese tourism to generate more revenue, more employment and to extend more and more the activity throughout the year and the territory and, therefore, that tourism has the capacity to be a sustainable activity all through the year, not only during the “high season” months.
4. 1 Challenges for the future
In the new Strategy for Tourism 2027, Turismo de Portugal identifies the positive factors of a decade (2005-2015) of tourism strategies and the aspects to improve in the future. These are presented in Table 8.

S. Bailoa, P. Cravo: Strategic Tourism Planning in Portugal: Challenges for the National Tourism...Zbornik Veleučilišta u Rijeci, Vol. 8 (2020), No. 1, pp. 353-374
369
Table 8. A decade in analysis – synthesis
Positive factors Aspects to improve • Better qualified territory and tourism
resources • Development support infrastructures
• Growth in various indicators of tourism demand
• Better qualified supply of accommodation
• New forms of accommodation and touristic animation
• Growing creative entrepreneurship
• Increase in the offer of touristic animation activities
• Acknowledgments and international awards in several areas of Portuguese tourism
• Increase of flight connections
• Capitalization of companies • Human Resources Qualification
• Income of tourism workers
• Bureaucracy and context costs • Digital transformation of tourism supply
• Seasonality • Regional asymmetries
• Information about Portugal in foreign markets
• Networking, joint promotion and cocreation
• Sustainability of the destination and businesses
Source: Turismo de Portugal (2017:30)
Analysing the decade, it was possible to see that the several projects implemented on the sequence of the national strategies had positive effects in developing the tourism supply and infrastructures, like the accommodations. But there are also many areas to improve, as the human resources qualifications, competitiveness of companies, bureaucracy, regional asymmetries, among other aspects that consist on challenges for the future. Thus, Turismo de Portugal (2017:38) pinpoints the 10 challenges for a 10-year strategy, which are:
1. People – To promote employment, qualification and the valuing of people and to increase the income of tourism professionals.
2. Cohesion – To extend tourism to the whole territory and to promote tourism as a factor of social cohesion.
3. Growth in Value – To achieve an accelerated rhythm of growth in revenue vs. overnights.
4. Tourism All Year – To extend the tourism activity throughout the year, so that tourism is sustainable.
5. Accessibilities – To ensure the competitiveness of accessibilities to Portugal as a destination and to promote mobility within the territory.
6. Demand – To reach the markets that best respond to the challenges of growing in value and that allow to extend the tourism to the whole year and in the whole territory.
7. Innovation – To stimulate innovation and entrepreneurship.

S. Bailoa, P. Cravo: Strategic Tourism Planning in Portugal: Challenges for the National Tourism...Zbornik Veleučilišta u Rijeci, Vol. 8 (2020), No. 1, pp. 353-374
370
8. Sustainability – To ensure the preservation and the sustainable economic valuation of cultural and natural heritage and local identity as strategic assets, as well as to make this activity compatible with the permanence of the local community.
9. Simplification – To simplify legislation and streamline administration.
10. Investment – To Ensure financial resources and to promote investment.
According to Luís Araújo (2019), president of Turismo de Portugal, one of the objectives of the Tourism Strategy 2027 is “to affirm Tourism as a hub for economic, social and environmental development throughout the territory, positioning Portugal as one of the most competitive and sustainable tourist destinations in the world”.
To achieve this goal, and address the 10 challenges identified above, several measures have been defined, which include investment in technology, infrastructure and human resources. To this end, specific financing lines have been set up to promote the development of inland tourism and instruments that enable the mobilization of tourist businesses and public entities to ensure a more sustainable, affordable and inclusive tourism offer.
Taking in consideration the megatrends that WTTC (2019) identified as having implications for the travel and tourism industry, we can understand more clearly some of the challenges for the Portuguese tourism.
Related with the innovation challenge, the Reality Enhanced and the Data Revolutionised megatrends imply that tourism activities need to be more experience driven. This can be made possible by the easy access to information and the use of big data and IoT in today’s world, that allows a better personalization of tourism products.
Related with the people and with the cohesion challenges, the Life Restructured and the Power Redistributed megatrends imply that the activity has to take in consideration all the recent social changes, not only in terms of local communities, workers and business models, but also in terms of demand and what tourists value. Individuals are becoming increasingly more mobile and are demanding more accountability from tourist companies.
Related with the demand and the sustainability challenges, the Consumption Reimagined megatrend reflects the growing importance of environmental awareness, but also social and economical concerns of younger generations. Destinations must take these aspects in consideration or face the risk of losing important niches of demand.
Regarding Portugal, these megatrends are, somewhat, already embedded in the challenges identified. All the policies that have been adopted, in recent years, have addressed most of these trends and have proven to bring positive effects. Nevertheless, there is an acknowledgment of aspects to improve, and all the stakeholders have been working together to face these challenges, in order to promote the county’s economic and social development.
S. Bailoa, P. Cravo: Strategic Tourism Planning in Portugal: Challenges for the National Tourism...Zbornik Veleučilišta u Rijeci, Vol. 8 (2020), No. 1, pp. 353-374
371
5. CONCLUSION
The development of touristic destinations implies the analysis of competitiveness factors and assessment of potential impacts involving the definition and implementation of strategies that comprises a complete, careful and meticulous planning and promotion process. Strategic planning in tourism is crucial because it allows the maximization of income from this activity and, the minimizing of its negative effects and in the long term, the sustained development of the touristic destination. Therefore, national-level planning of tourism seeks, in many countries, to identify a set of objectives that intend to develop this sector trough the definition of strategies and policies that could fulfil that intent.
In Portugal the strategic importance that this sector has in the economy has long been perceived, due to its capacity for wealth-generation, job-creation and contribution to the country’s competitiveness and cohesion. So, a set of strategies for its development have been developed. This paper presented the main national strategic instruments that have been guiding the development of tourism in Portugal analysing its objectives and ways of implementation.
From all the references, PENT proved to be the first major strategy for the sector occupying the horizon of a decade. Although it has been replaced by other strategies, these still contain some aspects of this plan, both in the objectives and at the level of the strategic products / resources / assets to be further developed.
The major indicators analysed show that the strategies had positive effects to develop the touristic supply and infrastructures, as accommodations. Worthy of mention is also the merit of tourism companies, which have improved its qualification, competitiveness and modernization. However, there are many areas to improve as the human resources qualifications, competitiveness of companies, bureaucracy, regional asymmetries, among other aspects that consist on challenges for the future. These aspects to improve and challenges are directly related to the megatrends identified by the WTTC, which focus on the tourists, their needs and their power, but also on the technologies and the ways they can be used to process information and respond to the consumer’s needs.
Despite the efforts of the Government and tourism stakeholders that have recently made a stronger commitment to develop this sector, it must be taken into account that tourism is subject to a quantity of plans and legal framework that affect its development, which implies a diversity of actors, decision-making powers, private and public interests that are not always easy to reconcile and to coordinate.
This paper presented an analysis of Portuguese strategic planning instruments in the area of tourism and explored the main indicators for tourism development, trying to assess the major benefits that resulted from the implementation of these instruments. The main challenges for the Portuguese tourism and the areas that still need further improvement were also identified.
The limitations of this paper are related to the fact it is focused only in Portugal. As a future work, it would be important to compare the results obtained in Portugal to the ones obtained in other

S. Bailoa, P. Cravo: Strategic Tourism Planning in Portugal: Challenges for the National Tourism...Zbornik Veleučilišta u Rijeci, Vol. 8 (2020), No. 1, pp. 353-374
372
markets with similar characteristics and that have also implemented national tourism plans. This benchmarking would, surely, highlight new aspects to be taken in consideration in future plans.
REFERENCESAraújo, L. (2019) “Sustainability”, travelBI by Turismo de Portugal, https://travelbi.turismodeportugal.pt/en-US/
pages/sustentabilidade.aspx
Baum, T., Szivas, E. (2008) “HRD in tourism: a role for government?”, Tourism Management, Vol.29, No.4, pp.783-794, https://doi.org/10.1016/j.tourman.2007.09.002
Benur, A.M., Bramwell, B. (2015) “Tourism product development and product diversification in destinations”, Tourism Management, Vol.50, pp.213-224, https://doi.org/10.1016/j.tourman.2015.02.005
Carvalho, L., Costa, M.T. (2014) “Planeamento estratégico: um caso aplicado ao turismo rural”, IX Congresso Internacional sobre Turismo Rural e Desenvolvimento Sustentável (CITURDES), São Paulo, Brasil, 9-10 September, https://comum.rcaap.pt/handle/10400.26/6739
European Travel Commission (2019) “European Tourism – Trends & Prospects (Q3/2019)”, European Travel Commission, https://etc-corporate.org/reports/european-tourism-2019-trends-prospects-q3-2019/
Ferreira, L. (2009) “Planeamento Estratégico de Destinos Turísticos”, 1º Congresso de Desenvolvimento Regional de Cabo Verde / 15º Congresso da APDR, Cape Verde, pp.1509-1537, http://www.apdr.pt/congresso/2009/pdf/Sess%C3%A3o%2015/178A.pdf
Fyall, A. (2019) “Tourism Destination Re-positioning and Strategies”, in E. Fayos-Solà, C. Cooper (eds.), The Future of Tourism, Innovation and Sustainability, Springer International Publishing AG, https://doi.org/10.1007/978-3-319-89941-1_14
Hall, C.M. (2000) Tourism Planning: Policies, Processes and Relationships, Harlow: Prentice Hall
Holden, A. (2008) Environment and Tourism, Second Edition, Routledge
INE (2018) “Tourism Satellite Account for Portugal”, Instituto Nacional de Estatística / Statistics Portugal, https://www.ine.pt/xportal/xmain?xpid=INE&xpgid=ine_destaques&DESTAQUESdest_boui=340407247&DESTAQUESmodo=2&xlang=en
Mariani, M., Buhalis, D., Czakon, W., Vitouladiti, O. (2016) Tourism Management, Marketing, and Development: Performance, Strategies, and Sustainability, Palgrave Macmillan, https://doi.org/10.1057/9781137401854
Mariani, M., Buhalis, D., Longhi, C., Vitouladiti, O. (2014) “Managing Change in Tourism Destinations: Key Issues and Current Trends”, Journal of Destination Marketing & Management, Vol.2, No.4, pp.269-272 https://doi.org/10.1016/j.jdmm.2013.11.003
Mintzberg, H., Ahlstrand, B., Lampel, J. (1998) Strategy Safari, The Free Press
Moreira, C. (2018) “Portugal as a tourism destination: paths and trends”, Méditerranée, no.130, https://journals.openedition.org/mediterranee/10402
Pordata (2019) “Turismo” Pordata: Base de Dados Portugal Contemporâneo / Fundação Francisco Manuel dos Santos, https://www.pordata.pt/Tema/Portugal/Turismo-82
Teixeira, S. (2005) Gestão das Organizações, Lisboa: Mc Graw Hill
Tribe, J. (2004) The Economics of Recreation, Leisure and Tourism, Third edition, Elsevier
Turismo de Portugal (2007) “Plano Estratégico Nacional do Turismo: Para o Desenvolvimento do Turismo em Portugal”, Lisboa: Turismo de Portugal, https://travelbi.turismodeportugal.pt/pt-pt/Documents/Estrat%C3%A9gia/PENT_2007.pdf
Turismo de Portugal (2013) “Plano Estratégico Nacional do Turismo: Revisão e Objetivos 2013-2015”, Lisboa: Turismo de Portugal, https://travelbi.turismodeportugal.pt/pt-pt/Documents/Estrat%C3%A9gia/PENT_2013.pdf

S. Bailoa, P. Cravo: Strategic Tourism Planning in Portugal: Challenges for the National Tourism...Zbornik Veleučilišta u Rijeci, Vol. 8 (2020), No. 1, pp. 353-374
373
Turismo de Portugal (2015a) “Turismo 2020: Plano de Ação para o Desenvolvimento do Turismo em Portugal”, Lisboa: Turismo de Portugal, https://estrategia.turismodeportugal.pt/sites/default/files/Turismo2020_Parte%20I_mercados%20-%20SWOT.pdf
Turismo de Portugal (2015b) “Turismo 2020: Cinco princípios para uma ambição”, Lisboa: Turismo de Portugal, https://www.historico.portugal.gov.pt/media/15123712/20150805-turismo-2020.pdf
Turismo de Portugal (2017) “Estratégia Turismo 2027: Liderar o Turismo do Futuro”, Lisboa: Turismo de Portugal, http://www.turismodeportugal.pt/SiteCollectionDocuments/Estrategia/estrategia-turismo-2027.pdf
Turismo de Portugal (2019) “Desempenho Turístico”, Turismo de Portugal Business, http://business.turismodeportugal.pt/pt/Conhecer/Apresentacao/Desempenho_Turistico/Paginas/default.aspx
UNWTO (2007) “UNWTO Tourism Highlights: 2007 Edition”, Madrid: UNWTO eLibrary, https://www.e-unwto.org/doi/book/10.18111/9789284413539
UNWTO (2011) “UNWTO Tourism Highlights: 2011 Edition”, Madrid: UNWTO eLibrary, https://www.e-unwto.org/doi/book/10.18111/9789284413935
UNWTO (2015) “UNWTO Tourism Highlights: 2015 Edition” Madrid: UNWTO eLibrary, https://www.e-unwto.org/doi/book/10.18111/9789284416899
Williams, S. (2003) Tourism geography, London: Routledge
WTTC (2018) “Travel & Tourism Economic Impact 2018: Portugal”, Secretaria-Geral da Economia, https://www.sgeconomia.gov.pt/ficheiros-externos-sg/wttc_portugal2018-pdf.aspx
WTTC (2019) “World, Transformed: Megatrends and Their Implications for Travel & Tourism”, World Travel and Tourism Council, https://www.wttc.org/publications/2019/megatrends-2019/

S. Bailoa, P. Cravo: Strategic Tourism Planning in Portugal: Challenges for the National Tourism...Zbornik Veleučilišta u Rijeci, Vol. 8 (2020), No. 1, pp. 353-374
374
Pregledni rad https://doi.org/10.31784/zvr.8.1.23 Datum primitka rada: 6. 12. 2019. Datum prihvaćanja rada: 27. 1. 2020.
STRATEŠKO PLANIRANJE TURIZMA U PORTUGALU: IZAZOVI U RAZVOJU NACIONALNOG TURIZMA
Sandra Bailoa Dr. sc., profesor visoke škole, Veleučilište u Beji, R. Pedro Soarez, Campus do Instituto Soarez
Politecnico de Beja, 7800-295 Beja, Portugal; e-mail: [email protected]
Pedro Cravo Doktorand, asistent, Veleučilište u Beji, R. Pedro Soarez, Soarez Politecnico de Beja, 7800-295 Beja,
Portugal; e-mail: [email protected]
SAŽETAKRast turizma u Portugalu pridonio je ekonomskom zamahu u posljednjem desetljeću više od bilo koje druge ekonomske aktivnosti. Pozitivni rezultati mnogih pokazatelja, kao što su doprinos BDP-u, izvozu i prihodima, pokazuju da je turizam bio poticaj ekonomiji koji je utjecao na sve regije u zemlji. Također, doprinos ovim rezultatima dale su i različite strategije koje je vlada kontinuirano definirala tijekom posljednja dva desetljeća. Rad započinje s kratkim prikazom literature i predstavlja deskriptivnu analizu glavnih dugoročnih instrumenata koji uključuju portugalsku strategiju u turizmu, pokazujući važnost uloge koju planiranje može imati na upravljanje učincima koji proizlaze iz primjene tih aktivnosti. Nadalje, rezultati glavnih pokazatelja (objavljenih u nekoliko različitih izvora) su prikazani. Rezultati otkrivaju da postoji nekoliko problema kojima treba pristupiti te su predstavljeni glavni izazovi za razvoj turizma u Portugalu.
Ključne riječi: razvoj, nacionalne strategije, Portugal, strateško planiranje, turizam
Creative Commons Attribution – NonCommercial 4.0 International License

D. Šantek, S. Debeljak, R. Isidoro: Occupational Health and Safety Specialist in Croatian and Portugese...Zbornik Veleučilišta u Rijeci, Vol. 8 (2020), No. 1, pp. 375-391
375
Review article https://doi.org/10.31784/zvr.8.1.24 Received: 3. 1. 2020. Accepted: 4. 2. 2020.
OCCUPATIONAL HEALTH AND SAFETY SPECIALIST IN CROATIAN AND PORTUGUESE LEGISLATION
Domagoj Šantek Professional Specialist Engineer of Safety and Protection, graduate student at Polytechnic of Rijeka,
Vukovarska 58, 51 000 Rijeka, Croatia; e-mail: [email protected]
Sandra Debeljak PhD, Lecturer, Polytechnic of Rijeka, Vukovarska 58, 51 000 Rijeka, Croatia;
e-mail: [email protected]
Rui Isidoro PhD, Adjunct Professor, Polytechnic Institute of Beja, Rua Pedro Soares,
Campus do Instituto Politécnico de Beja, 7800-295 Beja, Portugal; e-mail: [email protected]
ABSTRACTThe domain of occupational safety and health at work is put for regulation through directives by founding agreements. This means that the institutions of the European Union prescribe minimum standards of safety and health at work through directives and Member States need to accomplish goals that a particular directive pursues. At the same time, this means that each Member State can also set stricter standards than the ones prescribed through directives and for this reason some differences in regulations of individual Member States can be noticed. In this paper, authors focus on the role of occupational safety specialist and the manner in which the Republic of Croatia and the Portuguese Republic, in their legislation, prescribe obligations of the employer in terms of contracting the performance of occupational health and safety tasks with an occupational safety specialist or an external service. Authors furthermore examine required conditions which occupational safety specialist must meet to perform those tasks. Apart from outlining the Croatian and Portuguese legislation, authors also present and define fundamental similarities and differences in the regulations within this domain of security legislation.
Key words: Directive 89/391/EEC, occupational health and safety specialist, Croatian legislation, Portuguese legislation
Creative Commons Attribution – NonCommercial 4.0 International License

D. Šantek, S. Debeljak, R. Isidoro: Occupational Health and Safety Specialist in Croatian and Portugese...Zbornik Veleučilišta u Rijeci, Vol. 8 (2020), No. 1, pp. 375-391
376
1. INTRODUCTION
As binding agreements between the Member States, EU agreements stipulate, through directives, that competent European Union institutions make minimum requirements to encourage improvements, particularly in the domain of work environment, in order to ensure a higher level of safety and health protection of workers at work. It can therefore be stated that the Council Directive of 12 June 1989 on the introduction of measures for encouraging improvements in safety and health protection of workers at work (89/391/EEC)1 is one of the most significant documents that introduces minimum standards in this domain in all Member States, at the same time not interfering with the existence and application of higher and stricter standards that Member States might have and/or develop.
One of the domains in which the European Union supports and supplements activities of Member States refers to the improvement of work environment in particular, for the purpose of protection of health and safety of workers. With that purpose, the European Parliament and the Council may adopt measures in order to support cooperation between Member States through different initiatives with the aim of improving knowledge, exchange of data and best practices, promoting innovative approaches and evaluating experiences. In addition to these activities, the European Parliament and the Council may, by means of directives, adopt minimum requirements for encouraging improvements in safety and health at work (Article 153 of the UEU)2. Therefore, in addition to the aforementioned Directive 89/391/EEC, some thirty individual directives were adopted for the domain of safety and health of workers at work and related to work (Šokčević, 2014).
Directive 89/391/EEC realizes its objective of introducing measures to encourage improvements in safety and health of workers at work, containing in its provisions general principles concerning prevention of occupational risks, protection of safety and health, elimination of risk and accident factors, informing and consultation in accordance with national laws and / or practices and training of workers and their representatives, as well as general guidelines for the implementation of said principles (Article 1, paragraphs 1 to 2 of Directive 89/391/EEC).
EU and national legislations that set good standards of protection present the first step towards achieving quality of health and safety protection in the workplace. Clear and effective rules are a significant basis for further improvement of occupational safety and health. Employers should have a clear understanding of minimum requirements set by relevant regulations so that they can develop the best possible safety culture, primarily with the assistance of occupational health specialists. In this regard, many authors emphasize the importance of effective cooperation of all participants in implementation of occupational safety and pay particular attention to the occupational safety specialist and his education and training.
Research shows that occupational safety specialists themselves point out the lack of knowledge in certain areas as well as the lack of opportunities to fulfil their needs in terms of continuous training. With regard to their advisory role for the employer, occupational safety specialists must
1 OJ L 183, 29. 6. 1989; hereinafter referred to as Directive 89/391/EEC or the Directive.2 Treaty on European Union (consolidated version), OJ C 202, 7.6.2016., hereinafter referred: UEU.

D. Šantek, S. Debeljak, R. Isidoro: Occupational Health and Safety Specialist in Croatian and Portugese...Zbornik Veleučilišta u Rijeci, Vol. 8 (2020), No. 1, pp. 375-391
377
follow dynamic changes in the field of work and, with their knowledge and skills, assist employers in securing a safe and healthy workplace (Krišto, Batak, 2012). It is the task of occupational safety specialists to educate and simultaneously motivate workers towards practising healthy ways of work. At the same time, they should develop an appropriate culture of protection and, additionally, continuously work on their education. In this regard, it is a calling with a universal role that connects all forms of knowledge in an understandable way and passes it on to competent persons at the company – therefore, motivation for advancement in the profession and increase of knowledge for such specialists should not be put into question (Ninčević, Pavlič, 2016). There is an increasing need for skilled OSH professionals in the world where working conditions for the majority of workers do not meet the minimum standards and guidelines. Training programs in occupational safety and health are fundamental to prevention in the workplace (Bosio et al., 2018, 331).
In the field of occupational safety and health, which is subject to constant influences and changes, it is important to preserve acquired rights in the legislation in general, and in particular in labour legislation and regulation regarding safety at work. This is in accordance with the universal and regional sources of law (such as Directive 89/391/EEC), as well as with basic national legal acts of individual countries. Occupational health professionals, as experts in their field, must play a key role here (Učur, 2013). Due to the shared responsibility of all participants for occupational safety and health, strategies in this field must focus on consistent implementation of regulations that define the area, as well as on measures that will encourage employers to ensure better working conditions than the minimum ones required by regulations (Vedenik, 2011). In order to put into practice the legislation of occupational safety and health, cooperation between all participants in this process -such as the employer, employees, occupational safety services and selected occupational health specialists – is essential (Sarić et al. 2019).
The role and importance of knowing and understanding applicable legal rules in a particular area of occupational safety and health is an extremely important first step in the effective protection of occupational health for all participants, and in particular for employers with the highest burden of obligations and responsibilities in this area. In this paper, the authors focus on the part of Directive 89/391/EEC provisions which regulate the issue of determining one or more workers to carry out occupational risk protection and prevention activities on behalf of the employer, possible engagement of professional external services or persons and the Member States’ obligation to determine abilities and skills required for such appointed workers or external services so that they can carry out activities related to protection and prevention of occupational risks for which they are appointed or contracted within the undertaking or establishment. Authors present how these issues and definitions of the Directive are regulated and applied in Croatian and Portuguese legislation and show basic differences in legislation of these two EU Member States.
2. METHODOLOGY
In order to achieve the objective of the article, a secondary survey was conducted, one that included an analysis of available scientific and professional domestic and international literature, as well as an analysis of valid legal rules within the framework of EU law and under Croatian and Portuguese legislations. Research of available scientific and professional literature was done

D. Šantek, S. Debeljak, R. Isidoro: Occupational Health and Safety Specialist in Croatian and Portugese...Zbornik Veleučilišta u Rijeci, Vol. 8 (2020), No. 1, pp. 375-391
378
primarily by searching the Internet, but also using relevant literature from the libraries of the authors’ native institutions. Relevant legal documents used in the article were collected from the official gazettes of Croatia and Portugal (https://www.nn.hr/, https://dre.pt/) and the official website of EU legislation (https://eur-lex.europa.eu/), as well as from other relevant data sources, such as websites of the relevant ministries and other. Collected data was processed by analysis, synthesis, compilation and comparative method.
3. DIRECTIVE 89/391/EEC, CROATIAN AND PORTUGUESE LEGISLATION IN RELATION TO OCCUPATIONAL HEALTH AND SAFETY SPECIALIST
3. 1 Protection and prevention services according to Directive 89/391/EEC
Article 5 (1) of the Directive, containing general provisions, states that the employer’s duty is to ensure the safety and health of workers in all aspects related to their work. Consequently, in Article 7 (Protective and preventive services), the employer specifies one or more workers to carry out activities related to the protection and prevention of occupational risks to the undertaking or establishment (Article 7 (1) Directive 89/391/EEC). However, if such protective and preventive measures cannot be organized due to the lack of competent personnel, the employer is obliged to enlist competent external services or persons (Article 7, paragraph 3 of Directive 89/391/EEC).
Appointed workers must have the necessary abilities and resources, while consulted external services or persons must also have required abilities and appropriate personal and professional resources. The number of appointed workers and external services or persons must be sufficient to organize protection and prevention measures depending on the size of the undertaking, dangers to which workers are exposed and their disposition in the undertaking or the establishment. Member States define necessary abilities and skills of designated workers and external services or persons and may determine their sufficient number (Article 7, paragraphs 5 and 8 of Directive 89/391/EEC).
Depending on the nature of the activity and the size of the undertaking, Member States may determine types of undertakings in which the employer, provided he is competent, assumes responsibility for carrying out these measures related to protection and prevention of occupational risks for the undertaking or establishment (Article 7 (7) of Directive 89/391/EEC), by which the possibility that the employer himself carries out occupational safety work if he is competent is prescribed.
In Case C-441/01, the Court of the European Union points out that Article 7 of the Directive places priority on the employer’s obligations. Priority is given to the obligation of the employer to designate one or more workers to implement the protection and prevention of occupational risks, and only (indirectly) to engage external assistance in cases, when protection and prevention of occupational risks cannot be organized due to the lack of competent workers. The Court also explains objectives of the Directive relating to Article 7 in other cases, such as in Case C-49/00, C-428/04, and others. The basic principle of EU law is that there must always be a worker in the undertaking with a previously stated engagement in occupational safety works. More specifically, that can be an appointed worker, that is, workers, the employer himself (within certain frameworks and with adequate competencies),

D. Šantek, S. Debeljak, R. Isidoro: Occupational Health and Safety Specialist in Croatian and Portugese...Zbornik Veleučilišta u Rijeci, Vol. 8 (2020), No. 1, pp. 375-391
379
and, in cases in which such requirements are not met, an external legal or natural person (Šokčević, 2014).
The aforementioned persons should not be confused with the concept of workers’ representatives with special responsibility for safety and health of workers referred to in Article 3 (1) (c) of the Directive. This notion refers to any person who is elected, chosen or designated in accordance with national laws and/or practices to represent workers in case of problems arising in the area of safety and health at work.
3. 2 Legislation of the Republic of Croatia
The Occupational Health and Safety Act is the basic act regulating health and safety at work in The Republic of Croatia (OG No. 71/14, 118/14, 154/14, 94/18 and 96/18).3 It regulates issues and relations between numerous subjects in occupational safety. The most important persons in this regard are, of course, the employer and the worker, but their rights, obligations, and responsibilities function also in relation to other persons, such as the employer’s authorized representative, commissioner for occupational safety, specialist in occupational medicine, occupational health and safety specialist, the authorized person, and others. Each of these subjects has rights, obligations and responsibilities not only under the Occupational Safety Act but also according to standards of numerous other heteronomous and autonomous regulations in the field of occupational safety. Certain issues relevant to the work of some of these entities are regulated by subordinate legal acts (Učur, 2015).
In Article 3, The Occupational Health and Safety Act defines, inter alia, notions of authorized officer, authorized person, commissioner for occupational safety and occupational health and safety specialist. According to the Act, the authorized officer is an employee to whom the employer gives authority to implement occupational safety and health protection, notwithstanding other contracted work (Article 3, paragraph 1, item 12 of The Occupational Health and Safety Act).
The employer may delegate implementation of occupational health and safety in writing to his authorized officer within his scope of work. Legal provisions state authorizations of the authorized officer on the basis of which he is authorized not to allow an employee to work if he is not trained to work in a safe manner or to work without the supervision of a trained employee; not to allow employees to perform works with special working conditions if they do not meet the requirements for that work; prohibit particularly vulnerable groups of employees to work in operations which could adversely affect them; exclude from use defective work equipment; keep designated records in collaboration with the specialist for occupational health and safety; supervise and even prohibit the work of workers; ensure the required number of employees trained for evacuation, rescue and first aid; ensure the ban on alcohol use during work hours and other (Articles 23-24 of the The Occupational Health and Safety Act; Učur, 2015). Commissioner for occupational safety is an employee elected to represent, in accordance with The Occupational Health and Safety Act, the interests of employees in the domain of occupational health and safety (Article 3, paragraph 1, item 17 of The Occupational Health and Safety Act). He is obliged to protect interests of employees in the domain of occupational health and safety and monitor implementation of rules, measures,
3 Hereinafter referred: The Occupational Health and Safety Act or Act.

D. Šantek, S. Debeljak, R. Isidoro: Occupational Health and Safety Specialist in Croatian and Portugese...Zbornik Veleučilišta u Rijeci, Vol. 8 (2020), No. 1, pp. 375-391
380
procedures and activities relating to occupational health and safety (Article 71, paragraph 1 of The Occupational Health and Safety Act). It is a person referred to in Article 3 (1) (c) of Directive 89/391/EEC. Occupational health and safety specialist is an employee appointed by the employer to perform tasks of occupational health and safety who meets requirements prescribed for performing such tasks, and an authorized person is a legal or natural person authorized to perform activities of occupational safety and health protection by the competent ministry of labor (Article 3, paragraphs 1, 13 and 29 of The Occupational Health and Safety Act).
The following pages discuss contracting an occupational health and safety specialist, and exceptionally an authorized person, with occupational health and safety tasks, occupational health and safety tasks, conditions that must be met by occupational health and safety specialists and the manner of their training, as well as the necessary number of these persons with individual employers.
3. 2. 1 Performing of occupational health and safety tasks
Article 20 of The Occupational Health and Safety Act of the Republic of Croatia, in accordance with Article 7 of the Directive, stipulates conditions under which the employer contracts one or more persons with carrying out of occupational safety tasks, i. e an occupational health and safety specialist or an external service. Required qualifications and the number of occupational health and safety specialists, manner and conditions for carrying out occupational safety tasks with the employer depending on the risks, activity and the number of employees, are prescribed in Ordinance on Performance of Occupational Health and Safety Tasks (OG No. 112/14, 43/15, 72/15 and 140/15)4 and Ordinance on Occupational Health and Safety Training and Professional Examination (OG No. 112/14).5
In Occupational Health and Safety Act, contracting the performance of occupational health and safety tasks depends on the number of employees in the company:
• Up to and including 49 employees: the employer may carry out the tasks referred to in paragraph 1 of this Article himself if he meets the prescribed requirements or can contract the performance of these tasks by virtue of an employment contract with an occupational health and safety specialist; in accordance with subordinate regulation, this must be at least one occupational health and safety specialist, I degree (Article 20, paragraph 2 of the Act, Article 6 of the Ordinance on performance of Occupational Health and Safety Tasks)
• from 50 up to, and including, 249 employees: the employer is obliged to contract the performance of an occupational health and safety specialist, II degree6, with the tasks by virtue of an employment contract (Article 20, paragraph 3 of the Act, Article 7, paragraph 1 of the Ordinance on Performance of Occupational Health and Safety Tasks)
4 Hereinafter referred: Ordinance on performing of occupational health and safety tasks.5 Hereinafter referred: Ordinance on Occupational Health and Safety Training and Professional Examination.6 Except where at least 80% of employees carry out only low-risk jobs; in that case it is sufficient to hire an occupational
health and safety specialist, I degree (Section 7, paragraph 2 of the Ordinance on Performance of Occupational Health and Safety Tasks).

D. Šantek, S. Debeljak, R. Isidoro: Occupational Health and Safety Specialist in Croatian and Portugese...Zbornik Veleučilišta u Rijeci, Vol. 8 (2020), No. 1, pp. 375-391
381
• 250 or more employees: the employer is obliged to contract the performance of the tasks with one or more occupational health and safety specialists in accordance with subordinate regulations; at least one occupational health and safety specialists, II degree, and one occupational health and safety specialist, I degree, and at least one occupational health and safety specialist, II degree, for up to every following 500 workers7 (Article 20, paragraph 4 of the Act, Article 8, paragraph 1 of the Ordinance on Performance of Occupational Health and Safety Tasks).
Exceptionally, the employer may contract the performance of the tasks of occupational health and safety with an authorized person. This is only possible when there is an objective and legitimate reason for the employee not being able to perform occupational health and safety tasks by himself, or when he cannot contract the performance of these tasks by working contract with the occupational health and safety specialist (Article 20, paragraph 5 of the Act).8 In such case, an authorized person has to appoint, in writing, one or more occupational health and safety specialists to perform occupational health and safety tasks for that employer (Article 20, paragraph 6 of the 7 Except where at least 80% of employees carry out only low-risk jobs, and at least one occupational health and safety
specialist, II degree, performs occupational health and safety tasks, and for every following 2,000 workers, at least one more occupational health and safety specialist, II degree, performs such tasks (Article 8, paragraph 2 of the Ordinance on Performance of Occupational Health and Safety Tasks).
8 One of the following reasons is considered to be an objective and justifiable reason for contracting out an occupational health and safety tasks with an authorized person:
• commencement of the business activity, for a period of maximum of 3 months from the date when the employer’s obligation to apply the regulations on occupational health and safety begins;
• unforeseeable reasons (death, dismissal, etc.) for which the employer temporarily loses the occupational health and safety specialist, for a maximum of 3 months from the day when these reasons have occurred;
• if an employer who employs up to and including 249 workers has no employees with required professional qualifications for taking a professional exam for occupational health and safety specialists among the workers who are employed for an indefinite period,;
• if an employer employs additional workers, whether seasonal or temporary, or uses the workers assigned to work temporarily, which increases the requirements for performing occupational health and safety tasks in accordance with prescribed conditions, where such employment does not last for more than 6 months; a period shorter than two months is not considered to be an interruption of the said period;
• When an employer employing up to and including 49 workers cannot arrange performing of occupational health and safety tasks because the employer does not have a worker who fulfils the conditions for carrying out these jobs (Article 5, paragraph 2 of the Ordinance on Performance of Occupational Health and Safety Tasks).
It should be emphasized that objective and justified reasons are expressly provided by the provisions of the Ordinance on Performance of Occupational Health and Safety Tasks. At the time of adoption of the Occupational Health and Safety Act in 2014 and this Ordinance, a more detailed definition of what the considered objective and justified reasons for contracting of performing occupational health and safety tasks at work with an authorized person are was completely missing. The first four reasons are stated in the Addendum to the 2015 Ordinance (OG No. 43/15), while additional addendum of the mentioned Ordinance from the same year (OG No. 72/15) adds the fifth reason, primarily because of the pressure of smaller employers who were, with the new Act and subordinate regulations of 2014, faced with the obligation to hire occupational health and safety specialists even in cases of having only one employee employed on small-risk works. By the aforementioned amendment and by fulfilling prescribed conditions, they are able to arrange the performance of occupational health and safety tasks with an external service authorized for such tasks, the same as before the time of adoption of new regulations. At the same time, they can use other objective and justified reasons that correspond to their specific situation and function within some of the prescribed frameworks.

D. Šantek, S. Debeljak, R. Isidoro: Occupational Health and Safety Specialist in Croatian and Portugese...Zbornik Veleučilišta u Rijeci, Vol. 8 (2020), No. 1, pp. 375-391
382
Act). An occupational health and safety specialist, appointed by an authorized person to perform occupational safety tasks, is obliged to perform these tasks at the workplace of the employer and the authorized person and the employer are obliged to keep records and submit them to the Institute for the Advancement of Safety at Work (Article 5, paragraph 3 of the Ordinance on Performance of Occupational Health and Safety Tasks).
3. 2. 2 Conditions for an occupational health and safety specialist
Occupational health and safety tasks for the employer can be performed by an occupational health and safety specialist who meets the requirements stated by the Ordinance on Performance of Occupational Health and Safety Tasks (Article 2, paragraph 1 of the Ordinance on Performance of Occupational Health and Safety Tasks).
Occupational health and safety specialist who performs occupational health and safety tasks for the employer or an employer who performs those tasks himself must be educated in the area of technical, bio-technical or natural sciences or in the area corresponding to the employer’s activity. Depending on the number of workers and business activities of the employer, the occupational health and safety specialist can perform occupational health and safety tasks for the employer as an occupational health and safety specialist, I or II degree (Article 2, paragraphs 2 and 3 of the Ordinance on Performance of Occupational Health and Safety Tasks).
An occupational health and safety specialist, I degree, is a person who has completed a high school level of education and who has successfully passed the general part of professional occupational health and safety exam, or has completed a high school level of education and has a recognized status as an occupational health and safety specialist, or possesses the certificate of occupational health and safety at work approved by the competent education authority. An occupational health and safety specialist, II degree, is a person who has at least obtained an undergraduate degree (bachelor’s degree) and has passed both the general and special parts of the professional examination for an occupational health and safety specialist or has the recognized status of the occupational health and safety specialist (Article 3 of the Ordinance on Performance of Occupational Health and Safety Tasks).
Regarding occupational health and safety specialists who are employed by an authorized person, the Ordinance on Authorizations for Occupational Health and Safety Tasks (OG No.50/19)9 prescribes conditions that define prescription of a type and number of occupational health and safety specialists with an authorized person who must be a full-time employee (Čizmar, 2017). Occupational health and safety tasks for which the authorized person is authorized are occupational health and safety tasks with an employer, occupational health and safety training (training of workers to work safely and training of employers, authorized officer and commissioner of occupational safety), drafting risk assessment, checking work equipment, and testing physical, chemical and biological factors in the work environment (Article 2, paragraph 1 of the Ordinance on Authorizations for Occupational Health and Safety Tasks). All professional conditions to be met by the employer, legal or natural person, in order to obtain authorization for some or all of
9 Hereinafter referred: Ordinance on Authorizations for Occupational Health and Safety Tasks.

D. Šantek, S. Debeljak, R. Isidoro: Occupational Health and Safety Specialist in Croatian and Portugese...Zbornik Veleučilišta u Rijeci, Vol. 8 (2020), No. 1, pp. 375-391
383
these types of tasks, are prescribed by articles 3 to 7 of this Ordinance. Depending on the type of occupational health and safety tasks for which authorization is issued, a minimum of occupational health and safety specialists and those who have completed a field of study in relevant fields such as mechanical engineering, physics, electrical engineering, chemistry, and others, a certain number of years of work experience in occupational health and safety, as well as other appropriate conditions (Articles 3 to 7 of the Ordinance on Authorizations for Occupational Health and Safety Tasks) are required.
In contrast to the Ordinance on Authorizations for Occupational Health and Safety Tasks, which explicitly stipulates the obligation to employ a certain number of occupational health and safety specialists with authorized person employed full-time10, when it comes to occupational health and safety specialists employed by the employer to perform occupational health and safety tasks, they can, but do not have to, be employed full-time, because such condition is not prescribed. However, in this case, it is necessary that conditions set out in article 22, paragraph 1 of The Occupational Health and Safety Act, particularly those regarding the obligation of the employer to enable the occupational health and safety specialist to meet his obligations and to provide the necessary time (Čizmar, 2017).
The professional exam for occupational health and safety specialist consists of a general and a special part. The general part of a professional examination can be taken by a person who has at least a gymnasium or a vocational high school degree, and the special part can be taken by a person who has passed the general part of the examination and completed the undergraduate degree obtaining a bachelor’s qualification (baccalaureus) (Article 11, paragraphs 1, 3 and 4 of the Ordinance on Occupational Health and Safety Training and Professional Examination).
Professional exams for occupational health and safety specialists are taken in the manner and according to the Ordinance on Occupational Health and Safety Training and Professional Examination. The candidate submits application for taking the exam to the competent ministry (Ministry of Labor and Pension System), and annexed to the Ordinance is the description of all elements that the professional examination for occupational health and safety specialists consists of (http://uznr.mrms.hr; Article 11, paragraph 2, Article 12, paragraph 1 of the Ordinance on Occupational Health and Safety Training and the Professional Examination).
The status of occupational health and safety specialist (general and special part) is awarded to a person who has completed at least the undergraduate degree with a bachelor’s qualification and passed a state professional occupational health and safety exam with state administration bodies responsible for occupational health and safety or completed the minimum undergraduate study with the acquired bachelor’s degree and passed a state professional examination for labor inspector in the field of occupational health safety (Article 11, paragraph 5 of the Ordinance on Occupational Health and Safety Training and the Professional Examination).
10 In addition, if an authorized person fulfils this requirement, other occupational health and safety specialists may also be employed, and they may be employed full-time or part-time or may contract additional work (up to 8 hours per week in accordance with Article 61 paragraph 3 of the Labor Act (OG, No. 93/14, 127/17, 98/19) (Čizmar, 2017).

D. Šantek, S. Debeljak, R. Isidoro: Occupational Health and Safety Specialist in Croatian and Portugese...Zbornik Veleučilišta u Rijeci, Vol. 8 (2020), No. 1, pp. 375-391
384
3. 2. 3 Conditions for the employer (or his authorized officer) for independent performance of occupational health and safety tasks
An employer employing up to and including 49 workers can perform occupational health and safety tasks independently or through an authorized person if prescribed conditions are fulfilled (Article 20, paragraph 2 of The Occupational Health and Safety Act). These conditions are stipulated by the Ordinance on Performance of Occupational Health and Safety Tasks. Employer or his authorized officer can perform the aforementioned tasks in the following cases: if he meets the requirements for the occupational health and safety specialist, I degree, prescribed by the Ordinance; or if he has acquired necessary occupational health and safety knowledge during formal education; or if passed a state professional exam for construction or design work that includes occupational health and safety material; or if he has passed the craftsman examination in the activity that he carries out, including occupational health and safety (Article 4 of the Ordinance on Performance of Occupational Health and Safety Tasks).11
However, if the employer or his authorized officer meet some of these conditions, but not the one that would allow them to meet the requirements for occupational health and safety specialists, therefore fulfilling one of the three remaining conditions, they would not be able to take part in the risk assessment or trainings as occupational health and safety specialists. If, on the other hand, the employer (or his authorized officer) fulfils the conditions for the occupational health and safety specialist, I degree, prescribed by the Ordinance, he is simultaneously an occupational health and safety specialist and can participate as an occupational health and safety specialist in preparation of risk assessments and training.
It is prescribed that an occupational health and safety specialist must take part in risk assessment and training, but it is not stipulated where this specialist must be employed. Therefore, a specialist may be employed by an employer to perform occupational health and safety tasks or employed with an authorized person.12 For a specialist who is employed with the authorized person, it is not decisive whether he is a specialist thanks to the authorized person or if he is a new, independent occupational health and safety specialist employed with the authorized person (Cizmar, 2017).
3. 2. 4 Occupational health and safety tasks under the Occupational Health and Safety Act of the Republic of Croatia
Occupational health and safety tasks are in particular:
• expert assistance to the employer and his authorized employees, employees and employees’ commissioners for occupational health and safety in implementation and improvement of
occupational health and safety 11 Authors Lalić and Lise emphasize that such legal definition leads to a degraded role of occupational safety
professionals and raise the question why such an employer would spend his resources on hiring, educating or training of an occupational safety specialist when the regulation allows him to perform occupational safety tasks by himself (Lalić, Lise, 2017).
12 When the occupational health and safety specialist is employed by an authorized person for training tasks, he must be a specialist, II degree, in accordance with provisions of Article 3, paragraph 1 of the Ordinance on Occupational Health and Safety Training and Professional Examination.

D. Šantek, S. Debeljak, R. Isidoro: Occupational Health and Safety Specialist in Croatian and Portugese...Zbornik Veleučilišta u Rijeci, Vol. 8 (2020), No. 1, pp. 375-391
385
• participation in the development of business strategy, operational plans and programmes of the employer’s business activities, in the part related to occupational health and safety, as well as participation in the implementation of management methods and techniques for strategy implementation
• participation in the procedure of drafting risk assessment
• internal supervision of implementation of occupational health and safety rules, as well as encouragement and consultation for the employer and his authorized officers in eliminating deficiencies in occupational health and safety discovered by the internal control
• collecting and analysing data in relation to work related accidents andinjuries, , occupational diseases and diseases in relation to work as well as preparation of prescribed registration of injuries at work and occupational diseases and drafting reports for the employer’s needs
• cooperation with work inspection bodies, with the institute in charge of health protection and safety at work, authorized persons and with a specialist in occupational medicine
• training of employees, employers and authorized officers for work in a safe manner
• training of employees’ occupational health and safety commissioners and assistance in their activities
• active participation in the employer’s committee for occupational health and safety
• cooperation with the employer during design, construction, and reconstruction of buildings intended for work, procurement of work equipment and other means of work, personal protective equipment, and dangerous chemicals
• participation in implementation of international certification standards for occupational health and safety management, quality, risks, social responsibility in business activities etc. in the undertaking
• other occupational health and safety tasks in accordance with the employer’s needs (Article 21, paragraph 1 of The Occupational Health and Safety Act).
Performing these occupational health and safety tasks can be arranged by the employer in the ways outlined in Article 20 of the Act, which are previously presented in this paperwork (under subsection 3.1). Regardless of which of these methods the employer has chosen (independently performing those tasks by fulfilling relevant conditions and competencies, hiring an occupational health and safety specialist or engaging an external service), tasks that must be performed are always at least the ones mentioned in Article 21, paragraph 1 of the Act (Šokčević, 2014).
3. 3 Portuguese legislation
The Occupational Health and Safety act is the basic act which regulates the area of health and safety at work in Portugal. It regulates issues and relationships among many subjects in occupational safety (L n.º 102/2009, changed by L n.º 42/2012, L n.º 3/2014, DL n.º 88/2015, L n.º 146/2015 and L n.º 28/2016).

D. Šantek, S. Debeljak, R. Isidoro: Occupational Health and Safety Specialist in Croatian and Portugese...Zbornik Veleučilišta u Rijeci, Vol. 8 (2020), No. 1, pp. 375-391
386
As in Croatian legislation, the most important roles in Portuguese legislation are given to the employer and the worker or self-employed worker, but their rights, obligations, and responsibilities are also related to other individuals, such as the workers’ representative, occupational physician, superior occupational health and safety technician and others. Each of these subjects has the right, obligations and responsibilities, not only under the Occupational Safety Issues, but also according to standards of numerous other heteronomous and autonomous regulations in the field of occupational safety. Certain subjects relevant to the work of some of these entities are regulated by subordinate legal acts.
The occupational health and safety concepts in Article 15 define 11 general obligations of the employer. Until 2016, 9 obligations were defined, but with the changes done in 2016, the number of obligations increased to 11 (Marecos, 2016).
Development of policies and programmes, such as the implementation of pro-active measures, must be supported by coordination of the means available, assessment of results in terms of reducing occupational risks and damage to workers’ health, and mobilisation of the actors on whom their implementation depends, particularly the employer, the workers and their representatives (Rebelo, 2019).
The workers’ representative is an employee elected to represent the interests of employees in the field of occupational health and safety (Article 4, d of L 102/2009). This representative protects the interests of employees in terms of occupational health and safety and monitors the implementation of rules, measures, procedures, and activities relating to occupational health and safety.
Workers’ representatives may submit their comments to the working conditions authority or to another competent authority. They may also request the intervention of the Working Conditions Authority if they find that the measures taken, and the means provided by the employer, are insufficient to ensure health and safety at work.
Superior occupational safety technician is the person that organises, develops, coordinates and controls occupational risk prevention activities, while an occupational safety technician is the person who carries out prevention and protection activities against occupational risks.
3. 3. 1 Performance of occupational health and safety tasks
Article 100 of The Occupational Health and Safety Law of Portugal, in accordance with Article 7 of the Directive, stipulates the conditions under which the employer undertakes to carry out occupational safety tasks with one or more persons, i.e. an internal or an external service. The number of superior occupational safety technicians and occupational safety technicians depends on the activity and the number of employees.
According to the Occupational Health and Safety Act, contracting the performance of occupational health and safety tasks is based on the number of employees in an industrial company:

D. Šantek, S. Debeljak, R. Isidoro: Occupational Health and Safety Specialist in Croatian and Portugese...Zbornik Veleučilišta u Rijeci, Vol. 8 (2020), No. 1, pp. 375-391
387
• up to 50 employees, one occupational safety technician, and, over 50, two occupational safety technicians, per 1500 workers covered or fraction, at least one of whom must be a superior occupational safety technician.
In other kinds of establishments:
• up to 50 employees, one occupational safety technician, and, over 50, two occupational safety technicians, per 3000 workers covered or fraction, at least one of whom must be a superior occupational safety technician.
An occupational safety technician is a person who has completed a high school level of education at minimum and possesses the certificate of occupational safety at work approved by the working conditions authority. A superior occupational safety technician is a person who has at minimum completed the undergraduate degree with a bachelor’s qualification and possesses the certificate of advanced occupational safety at work approved by the working conditions authority, or possesses the certificate of Master or PhD in the field of occupational safety at work approved by the education authority (Article 5 of the L 42/2012).
3. 3. 2 Occupational health and safety deontological principles under the Occupational Health and Safety Act of Portugal
Occupational health and safety deontological principles:
• to consider the safety and health of workers as priority factors in intervention
• to base activity on scientific knowledge and technical competence and to propose the intervention of specialized experts where necessary
• to acquire and update skills and knowledge necessary for the performance of duties
• to carry out functions with technical autonomy, collaborating with the employer in fulfilling their obligations
• to inform the employer, the workers and their representatives for occupational safety and health about the existence of particularly dangerous situations that require immediate intervention
• to collaborate with workers and their representatives on occupational safety and health by developing their capacity for intervention on occupational risk factors and appropriate prevention measures
• to keep classified information about the organization, methods of production or business of which they are aware by virtue of the performance of their functions
• to protect the confidentiality of data that affects the privacy of workers
• to consult and cooperate with National Network for Prevention of Occupational Risks (Freitas, 2019)

D. Šantek, S. Debeljak, R. Isidoro: Occupational Health and Safety Specialist in Croatian and Portugese...Zbornik Veleučilišta u Rijeci, Vol. 8 (2020), No. 1, pp. 375-391
388
4. RESULTS AND DISCUSSION
Considering the legal provisions of Croatian and Portuguese law related to the provisions of Article 7 of Directive 89/391 / EEC, Croatia and Portugal, as Member States, implemented in their laws and regulations the minimum standards imposed by that Directive. It is also apparent that there are some differences, which is not surprising, since Directive 89/391/ EEC provides the basic rules and obligations of the employer to determine one or more workers to be responsible for the activities related to protection and prevention of occupational risks for the undertaking and/or establishment or, if that is not possible, stipulate the obligations of the employer to engage professional external services and persons and impose that those workers or services possess the necessary capabilities and resources, while leaving the rest of specific rules and conditions to the Member States.
In this respect, Member States independently determine the required number of workers and their required competences and skills, which applies equally to external services, but they must make sure that the number of appointed workers and external services is sufficient to organize protection and prevention measures depending on the size of undertaking, the dangers to which workers are exposed, and their schedule in the undertaking or establishment.
Differences between Croatian and Portuguese legislation are contained in precisely these provisions. Croatian legislation imposes a different number of such appointees, or services, depending on the number of workers, without distinguishing between an industrial enterprise and other types of establishments, a difference which is contained in Portuguese legislation. However, indirectly, Croatian legislation, through subordinate regulations, makes this distinction in a certain way, focusing on the number of workers in companies where the low-risk jobs are performed most. Furthermore, differences are also reflected in the number of appointed workers compared to the number of employees, but there are no major discrepancies.
One of the more interesting and important differences, especially from the point of view of Croatian occupational safety specialist, is that Portuguese legislation recognizes the person possessing the bachelor certificate, and training recognized by the authority for working conditions, a Master or a PhD certificate in the field of occupational safety at work approved by the Education Authority as an occupational health and safety specialist, II degree. In Croatian law, this is not possible, so even a person who has completed a specialist graduate professional study in occupational safety and education for a total of 5 years in the field of occupational safety and health has to take an additional exam for an occupational safety expert (first and second degree) in order to (subject to other additional conditions) be able to perform occupational safety work with an employer or an authorized person.
Occupational safety and health principles, which occupational safety legislation is based on in both states, equally emphasize occupational safety specialist as a person who provides expert assistance to the employer in the field of occupational safety and health, monitors and supervises the state of occupational safety and health, takes all necessary measures to alert the employer and workers of risks in the work environment, but also to train them to take preventive measures to avoid occupational risks at work.

D. Šantek, S. Debeljak, R. Isidoro: Occupational Health and Safety Specialist in Croatian and Portugese...Zbornik Veleučilišta u Rijeci, Vol. 8 (2020), No. 1, pp. 375-391
389
5. CONCLUSION
As Member States, Croatia and Portugal have implemented the requirements set by Directive 89/391/EEC. The Directive sets only minimum conditions which the Member States must meet, without imposing in any way the obligation to take additional measures if need arises in certain economies, that is, the Member States. Croatian and Portuguese legislations have applied only minimum conditions that vary only minimally. It is evident from the aforementioned that there is not enough will for states to upgrade the minimum conditions required by the directive, which is precisely what the needs and situations in practice require. Therefore, the question arises to whom this situation suits the most, and whether the national legislations of those states try to facilitate and unburden employers at the expense of the profession and, ultimately, of the workers.
It is also concluded that the Directive and legislations under review are not entirely clear with regards to the occupational safety professional, i.e. his competence to perform occupational safety and health activities. It is interesting and somewhat incredible that engineers with a master’s degree are not taken into consideration, and in the worst case, not mentioned at all in the legislation of the Republic of Croatia, while the Portuguese legislation recognizes them. This rises the question of competences that persons performing occupational health and safety tasks have when they have only passed a professional examination based solely on legal regulations in contrast to competences and knowledge of specialists with five years of university education in the field. It is evident that states favour and facilitate employers’ jobs and thus automatically engage in discrimination against the profession and the workers who are entitled to safe jobs.
Further research should be done towards examining the ability and competence of persons to perform occupational health and safety work, especially regarding occupational health professionals and occupational safety engineers with a Master’s degree. Research should also be carried out on the extent to which the legal frameworks of individual states contribute to occupational safety and health protection.
The domain of occupational safety is an interdisciplinary field that cannot be viewed from one position alone: all relevant factors must be taken into account and should not be conducive to any interest group. Safety of the workplace and the workers must be put first because serious injuries and fatalities such as aircraft crashes do not happen often, but when they do, the consequences are disastrous.
REFERENCESBosio, D. et al. (2018), “Emerging needs in OSH: A new master in Occupational Safety and Health by ILO and University
of Turin”, Sigurnost 60 (4), pp. 321 – 333. https://hrcak.srce.hr/214663 (24. 1. 2020)
Council Directive of 12 June 1989 on the introduction of measures to encourage improvements in the safety and health protection of employees at work (89/391/EEC), OJ L 183, 29. 6. 1989.
Čizmar, Đ. (2017) “Poslovi zaštite na radu prema Zakonu o zaštiti na radu”, Sigurnost, 59 (2), pp. 153-155. https://hrcak.srce.hr/184933 (16. 8. 2019)
Freitas, L. (2019) “Manual de Segurança e Saúde do Trabalho”. Sílabo. 4th ed. Lisbon

D. Šantek, S. Debeljak, R. Isidoro: Occupational Health and Safety Specialist in Croatian and Portugese...Zbornik Veleučilišta u Rijeci, Vol. 8 (2020), No. 1, pp. 375-391
390
Krišto, I., Batak, M. (2012) “ Istraživanje područja interesa i problema u radu stručnjaka zaštite na radu”, Sigurnost, 54 (3), pp. 303-308. https://hrcak.srce.hr/87366 (24. 1. 2020.)
Labor Act (OG No. 93/14., 127/17., 98/19.)
Lalić, Ž., Lise, I. (2017) “Degradiran položaj stručnjaka zaštite na radu u skladu s novim Zakonom o zaštiti na radu”, Sigurnost 59 (3), pp. 237-244. https://hrcak.srce.hr/187220 (25. 1. 2020.)
Marecos, D. (2016) “Lei 102/2009 - Regime Jurídico da Promoção da Segurança e Saúde no Trabalho”. Petrony. Lisbon.
Ministarstvo rada i mirovinskog sustava, Stručnjaci zaštite na radu, http://uznr.mrms.hr/znr/strucnjaci-zastite-na-radu/ (30. 8. 2019.)
Ninčević, A., Pavlič, M. (2016) “Motiviranost stručnjaka zaštite na radu za obrazovanje”, Sigurnost 58 (1), pp. 31-45. https://hrcak.srce.hr/167680 (24. 1. 2020.)
Occupational Health and Safety Act (L n.º 102/2009, changed by L n.º 42/2012, L n.º 3/2014, DL n.º 88/2015, L n.º 146/2015 and L n.º 28/2016)
Occupational Health and Safety act (OG No. 71/14., 118/14., 154/14., 94/18., 96/18.)
Ordinance on Authorizations for Occupational Health and Safety tasks (OG No. 50/19.)
Ordinance on Occupational Health and Safety Training and Professional Examination (OG No. 112/14.).
Ordinance on Performing of Occupational Health and Safety Tasks (OG No. 112/14., 43/15., 72/15. i 140/15.)
Rebelo, G. (2019) “Código do Trabalho”. Sílabo, 8th ed. Lisbon
Šarić, V. et al. (2019) “Suradnja kao temelj za promicanje sustava sigurnosti i zdravlja zaposlenika”, Sigurnost, 61 (4), pp. 373-378. https://hrcak.srce.hr/230928 (23. 1. 2020.)
Šokčević, S. (2014) Zakon o zaštiti na radu s komentarima i tumačenjima, Zagreb: TIM press d.o.o.
Treaty on European Union (consolidated version), OJ C 202, 7.6.2016., http://data.europa.eu/eli/treaty/teu_2016/2019-05-01, 12. 9. 2019.
Učur, M. Đ. (2015) “Neki posebni subjekti i odnosi po Zakonu o zaštiti na radu”, Zbornik Pravnog fakulteta Sveučilišta u Rijeci, 36 (1), pp. 533-546. https://hrcak.srce.hr/141262 (20. 7. 2019.)
Učur, M. Đ. (2013) “Promišljanje prava zaštite na radu kao samostalne pravne discipline”, Zbornik Veleučilišta u Rijeci, 1 (1), pp. 197-208. https://hrcak.srce.hr/103333 (24. 1. 2020.)
Vedenik, L. (2011) “Sigurnost i zaštita zdravlja na radu kao sastavni dio nacionalne i državne sigurnosti”, Sigurnost 53 (3), pp. 235-242. https://hrcak.srce.hr/71904 (24. 1. 2020.)

D. Šantek, S. Debeljak, R. Isidoro: Occupational Health and Safety Specialist in Croatian and Portugese...Zbornik Veleučilišta u Rijeci, Vol. 8 (2020), No. 1, pp. 375-391
391
Pregledni rad https://doi.org/10.31784/zvr.8.1.24 Datum primitka rada: 3. 1. 2020. Datum prihvaćanja rada: 4. 2. 2020.
STRUČNJAK ZAŠTITE NA RADU U HRVATSKOM I PORTUGALSKOM ZAKONODAVSTVU
Domagoj Šantek Struč. spec. ing. sec., diplomirani student, Veleučilište u Rijeci, Vukovarska 58, 51 000 Rijeka, Hrvatska;
e-mail: [email protected]
Sandra Debeljak Dr. sc., predavač, Veleučilište u Rijeci, Vukovarska 58, 51 000 Rijeka, Hrvatska;
e-mail: sandra.debeljak @veleri.hr
Rui Isidoro Dr. sc., prof. v. š., Polytechnic Institute of Beja, Rua Pedro Soares,
Campus do Instituto Politécnico de Beja, 7800-295 Beja, Portugal: e-mail: [email protected]
SAŽETAKOsnivačkim ugovorima određeno je da se područje sigurnosti i zaštite zdravlja na radu uređuje putem direktiva. To znači da institucije Europske unije putem direktiva propisuju minimalne standarde sigurnosti i zaštite na radu, a države članice obvezne su ostvariti ciljeve koje pojedina direktiva postavlja. Istovremeno to znači da svaka država članica može propisati i strože standarde od onih propisanih direktivama pa se iz tog razloga mogu uočiti i određene razlike u propisima pojedinih država članica. Autori se u radu usmjeravaju na ulogu stručnjaka zaštite na radu i način na koji Hrvatska i Portugal u svojem zakonodavstvu propisuju obveze poslodavca u pogledu ugovaranja poslova zaštite na radu sa stručnjakom zaštite na radu ili vanjskom službom. Nadalje, autori ispituju uvjete koje mora ispunjavati stručnjak zaštite na radu za obavljanje svojih poslova. Uz prikaz hrvatskog i portugalskog zakonodavstva, autori definiraju i prikazuju i temeljne sličnosti i razlike u propisima unutar ovog područja zakonodavstva sigurnosti.
Ključne riječi: Direktiva 89/391/EEZ, stručnjak zaštite na radu, hrvatsko zakonodavstvo, portugalsko zakonodavstvo
Creative Commons Attribution – NonCommercial 4.0 International License


TEHNIČKE ZNANOSTI


K. Dundović, S. Stašić: Rad na siguran način u skučenim prostorimaZbornik Veleučilišta u Rijeci, Vol. 8 (2020), No. 1, pp. 395-412
395
Pregledni rad https://doi.org/10.31784/zvr.8.1.25 Datum primitka rada: 10. 12. 2019. Datum prihvaćanja rada: 5. 2. 2020.
RAD NA SIGURAN NAČIN U SKUČENIM PROSTORIMA
Kristina Dundović Dipl. ing., predavač, Veleučilište u Rijeci, Vukovarska 58, 51 000 Rijeka, Hrvatska;
e-mail: [email protected]
Stela Stašić Struč. spec. ing. sec., Viktor Lenac d. d., Martinšćica bb, p. p. 210, 51 000 Rijeka, Hrvatska;
e-mail: [email protected]
SAŽETAKSkučeni prostor može se definirati kao prostor koji je dovoljno velik da radnik u njega može u potpunosti ući i obaviti posao, nije dizajniran za stalan boravak radnika i ima ograničenja pri ulasku ili izlasku. Najveće opasnosti u skučenim prostorima povezane su s atmosferskim uvjetima tih prostora. Atmosfera unutar različitih skučenih prostora ovisi o vrsti prostora, radovima koji se odvijaju unutar njega i onome što je u njima ranije bilo pohranjeno. Najučestalije opasnosti u skučenim prostorima su opasnost od gušenja, opasnost od požara i/ili eksplozije i opasnost od trovanja. Rad u skučenim prostorima predstavlja visokorizičnu aktivnost stoga je provođenje mjera zaštite na radu od ključne važnosti za očuvanje zdravlja i sigurnosti svih radnika koji ulaze i rade u takvim prostorima. Svrha ovog rada je istražiti i analizirati opasnosti i štetnosti povezane s radom u skučenim prostorima. Cilj rada je teorijski prikazati i opisati mjere i postupke za rad na siguran način u skučenim prostorima.
Ključne riječi: mjere zaštite, opasnosti, skučeni prostor
1. UVOD
Rad u skučenom prostoru spada pod visokorizičnu aktivnost i predstavlja značajnu opasnost kako za radnike tako i za osobe zadužene za evakuaciju i spašavanje u hitnim slučajevima. Rizici prilikom rada u skučenim prostorima mogu biti izuzetno visoki. Atmosferski uvjeti su vodeći uzrok nesreća i smrtnih slučajeva u skučenim prostorima.
Skučeni prostori predstavljaju opasnost jer obično nisu dizajnirani kao prostori u kojima ljudi borave i rade. Također, navedeni prostori često imaju slabu ventilaciju koja omogućava brzo razvijanje opasne atmosfere, osobito ako je prostor mali. Opasnosti nisu uvijek očite i mogu se izmijeniti od jednog do drugog ulaska u skučeni prostor.
Creative Commons Attribution – NonCommercial 4.0 International License

K. Dundović, S. Stašić: Rad na siguran način u skučenim prostorimaZbornik Veleučilišta u Rijeci, Vol. 8 (2020), No. 1, pp. 395-412
396
Svrha ovog rada je istražiti i analizirati opasnosti i štetnosti povezane s radom u skučenim prostorima.
Cilj rada je teorijski prikazati i opisati mjere i postupke za rad na siguran način u skučenim prostorima.
2. METODOLOGIJA
Metodologija rada obuhvaća uvodna razmatranja autora istaknutog problema istraživanja te se nastavlja istraživanjem pojmovnog određenja skučenog prostora nakon čega se pristupilo istraživanju opasnosti i štetnosti koje se javljaju pri radu u skučenom prostoru.
Problem istraživanja opisan je metodom deskripcije dok su prikupljeni podaci istraživani metodama analize, sinteze, komparacije i kompilacije.
3. POJMOVNO ODREĐENJE SKUČENIH PROSTORA
Europska agencija za zaštitu na radu (OSHA) definira skučeni prostor kao prostor koji:
• je dovoljno velik da radnik u njega može u potpunosti ući i obaviti posao
• nije dizajniran za stalan boravak radnika
• ima ograničenja pri ulasku ili izlasku
Britanski Izvršni odbor za zdravlje i sigurnost definira skučeni prostor kao takav ukoliko su ispunjeni sljedeći uvjeti:
• prostor mora biti zatvoren, ali ne nužno u cijelosti
• postoji prisutnost ili vjerojatnost nastanka jednog ili više rizika, primjerice povećan rizik od ozbiljnih ozljeda, gubitka svijesti, gušenja, utapanja itd.
Skučeni prostori mogu biti ispod ili iznad razine zemlje i mogu se naći na gotovo svakom mjestu rada. Skučeni prostor nije nužno mali prostor. Primjeri skučenih prostora su silosi, šahte, kanalizacija, cijevi, kamionske ili željezničke cisterne, krila zrakoplova, kotlovi, crpne stanice, digestori, jame, tankovi tereta na brodovima, tankovi pitke vode ili goriva, tankovi fekalija na brodovima, tankovi balasta, brodska dvodna itd. Jarci i rovovi također mogu biti skučeni prostori kada je pristup ili izlaz ograničen.

K. Dundović, S. Stašić: Rad na siguran način u skučenim prostorimaZbornik Veleučilišta u Rijeci, Vol. 8 (2020), No. 1, pp. 395-412
397
Slika 1. Primjeri skučenih prostora
Izvor: prilagođeno prema https://www.mhlnews.com/sites/mhlnews.com/files/uploads/2012/11/confinedexamples_1.jpg
Skučenim prostorom može se smatrati prostor u kojem je jedina opasnost otežan ulazak i izlazak iz prostora. Smatra se da je radnik „ušao“ u skučeni prostor kada njegova zona disanja prelazi ravninu otvora za pristup prostoru. Primjeri skučenih prostora mogu uključivati potkrovlje zgrade, podzemne prostore i neke prostore za puzanje u zgradama.
Nadalje, skučenim prostorom može se smatrati i prostor u kojem dođe do promjene uvjeta rada. (www.open.alberta.ca, 30. 11. 2019.) Na primjer, prostor može imati sigurnu razinu kisika, ali posao koji treba obaviti to može promijeniti. Primjeri takvih radova i prostora su (www.hse.gov.uk, 30. 11. 2019.):
• zavarivanje koje bi potrošilo dio kisika
• kabina za bojenje tijekom prskanja boje
• korištenje kemikalija za čišćenje koje mogu stvoriti toksičnu atmosferu
Primjerice, iskopani rov se ne smatra skučenim prostorom samo na temelju rizika od strukturnog urušavanja, ali će takav postati ako potencijalno sadrži štetne plinove, pare ili tvari u zraku u koncentracijama koje mogu uzrokovati oštećenje zdravlja, gubitak svijesti ili gušenje (www.safeworkaustralia.gov.au, 30. 11. 2019.).
U takvim se slučajevima prostor može definirati kao skučeni prostor za vrijeme trajanja tih radova, dok se ne postigne sigurna razina kisika ili dok se zagađivači ne otklone iz prostora (www.hse.gov.uk, 30. 11. 2019.).

K. Dundović, S. Stašić: Rad na siguran način u skučenim prostorimaZbornik Veleučilišta u Rijeci, Vol. 8 (2020), No. 1, pp. 395-412
398
Slika 2. Brodski tank tereta s upozorenjem opasnosti od smanjenja razine kisika
Izvor: izrada autora
4. OPASNOSTI I ŠTETNOSTI U SKUČENIM PROSTORIMA
Najveće opasnosti u skučenim prostorima povezane su s atmosferskim uvjetima tih prostora. Atmosfera unutar različitih skučenih prostora varira ovisno o vrsti prostora, radovima koji se odvijaju unutar njega i onome što je u njima ranije bilo pohranjeno. Najučestalije opasnosti u skučenim prostorima mogu se razvrstati u (www.wshc.sg, 2. 12. 2019.):
• opasnost od gušenja – zbog nedostatka kisika
• opasnost od požara / eksplozije – zbog prisutnosti zapaljivih tvari
• opasnost od trovanja – zbog prisutnosti otrovnih tvari
4. 1 Opasnost od gušenja
Zrak u našem prirodnom okruženju sadrži 20,9 % kisika. Atmosferom sa smanjenim udjelom kisika smatra se atmosfera u kojoj je koncentracija kisika manja od 19,5 %. Niska razina kisika u skučenom prostoru može biti uzrokovana oksidacijom, hrđanjem, rastom bakterija, radom kao što je zavarivanje, plinsko rezanje itd. U kanalizaciji će prirodni proces oksidacije uslijed truljenja tvari iscrpiti kisik, što će rezultirati nedostatkom kisika. Smanjena razina kisika mogla bi se pojaviti i u skučenim prostorima sa slabom ventilacijom (www.wshc.sg, 2. 12. 2019.).
U tablici 1. prikazani su učinci i simptomi različitih razina kisika na čovjeka.

K. Dundović, S. Stašić: Rad na siguran način u skučenim prostorimaZbornik Veleučilišta u Rijeci, Vol. 8 (2020), No. 1, pp. 395-412
399
Tablica 1. Učinci i simptomi različitih razina kisika na čovjeka
Udio O2u zraku Učinci i simptomi na čovjeka
19,5 Minimalna razina za siguran ulazak
16 - 19 Slaba koordinacija, umor
12 – 16 Ubrzan puls, otežano disanje
10 – 12 Ubrzano i duboko disanje, plave usne, glavobolja
8 – 10 Nesvjestica, mučnina, povraćanje
6 – 8 Smrt za 8 minuta; u 50 % slučajeva smrt za 6 minuta
<6 Koma za 1 minutu, konvulzije, respiratorni i srčani zastoj, smrt
Izvor: prilagođeno prema Technical Advisory on Working Safely in Confined Spaces, 2010., str. 13, http://www.asmi.com/download.cfm?dobjid=285
Neke situacije mogu uzrokovati drastično smanjenje razine kisika što dovodi do atmosfere sa smanjenim udjelom kisika i mogućeg gušenja. To se može dogoditi u slučajevima kada:
• je kisik istisnut plinovima nastalim tijekom bioloških procesa (npr. metan u kanalizaciji),
• je kisik istisnut tijekom degazacije skučenog prostora inertnim plinom radi uklanjanja zapaljivih ili otrovnih para,
• je kisik iskorišten unutar metalnih spremnika i posuda kroz površinsku oksidaciju (npr. kada se formira hrđa),
• je kisik potrošen tijekom izgaranja zapaljivih tvari,
• se kisik apsorbira ili reagira sa žitaricama, drvnom sječkom, tlom ili kemikalijama u zatvorenim silosima.
Osim niskih razina kisika, radnici također mogu biti izloženi toksičnim tvarima kao što su dimovi, plinovi i pare tijekom rada unutar skučenog prostora. Ti zagađivači imaju granice profesionalne izloženosti na temelju svoje toksičnosti koje su u Republici Hrvatskoj definirane Pravilnikom o zaštiti radnika od izloženosti opasnim kemikalijama na radu, graničnim vrijednostima izloženosti i biološkim graničnim vrijednostima (N. N. br. 91/2018).
Istraživanja pokazuju kako postoji širok raspon toksičnih tvari koje mogu biti opasne u skučenim prostorima, ali većina smrtnih slučajeva nastala je uslijed nedostatka kisika ili povećane razine ugljičnog monoksida i sumporovodika (Selmanetal, 2018.).
Sumporovodik je plin koji nastaje u procesu razgradnje smeća i otpada u kanalizacijama. Jedan udisaj u atmosferi u kojoj se nalazi sumporovodik u koncentraciji od oko 500–700 ppm može biti smrtonosan. Niska razina sumporovodika ima karakterističan miris pokvarenih jaja, ali na oko 100 ppm drastično se smanjuje osjetilo mirisa i stvara lažan dojam da nema opasnosti.

K. Dundović, S. Stašić: Rad na siguran način u skučenim prostorimaZbornik Veleučilišta u Rijeci, Vol. 8 (2020), No. 1, pp. 395-412
400
Ugljični monoksid vrlo je čest otrovan plin koji nema mirisa ni okusa, bistar je i bezbojan. Trovanje ugljičnim monoksidom može biti vrlo suptilno i može uzrokovati pospanost, kolaps i smrt (www.ihsa.ca, 2. 12. 2019.).
Opasnost od zatrpavanja ili ukopavanja znači da radnik može biti „progutan“ u materijalu što može dovesti do gušenja. Primjeri materijala koji mogu predstavljati opasnost od zatrpavanja su pijesak, tekućine, gnojivo, žito, ugljen, proizvodi od ugljena, leteći pepeo, stočna hrana itd.
Pohranjeni materijali kao što su pijesak i žito mogu stvoriti koru ili most kada se spremnik isprazni odozdo ostavljajući gornji sloj na mjestu. Radnici koji se kreću mostom ili rade ispod mosta na podu spremnika mogu biti zatrpani ukoliko se tako formirani most uruši (www.worksafe.qld.gov.au, 2. 12. 2019.).
4. 2 Opasnost od požara i eksplozije
Opasnost od požara ili eksplozije u zatvorenom prostoru iznimno je visoka kad god se nakupe bilo koji zapaljivi plinovi i pare. Ako su plin ili para bezbojni i bez mirisa, nakupljanje se ne može otkriti bez korištenja instrumenata za detekciju plina. Da bi se zapaljivi plinovi i pare zapalili i doveli do požara ili eksplozije potrebno je zadovoljiti tri uvjeta, a to su goriva tvar, temperatura paljenja i kisik.
Zapaljiva atmosfera je atmosfera koja sadrži koncentraciju zapaljivih tvari u količini većoj od 10% od donje granice eksplozivnosti. Zapaljiva atmosfera u skučenim prostorima može biti posljedica isparavanja zapaljivih materijala koji se koriste u prostoru, kemijske reakcije kao što je stvaranje metana u kanalizaciji ili prisutnosti zapaljive prašine, poput one u silosima. Ukoliko se izvor zapaljenja, kao što je električni alat koji iskri, koristi u prostoru koji sadrži zapaljivu atmosferu, vjerojatno će doći do eksplozije. Eksploziju može izazvati i statički elektricitet (www.worksafe.qld.gov.au, 2. 12. 2019.).
„Granica zapaljivosti je područje koncentracija kod kojeg se smjesa zraka i zapaljivog materijala može nekim izvorom paljenja (iskrenjem, električnim lukom ili zagrijavanjem) zapaliti ili eksplodirati. Ovo područje se još naziva i područjem eksplozivnosti i ograničeno je donjom i gornjom granicom zapaljivosti.“ (www.glossary.periodni.com, 2. 12. 2019.).
Kada je koncentracija ispod donje granice eksplozivnosti (DGE) mješavina je previše siromašna, a kada je iznad gornje granice eksplozivnosti (GGE) mješavina je prebogata. Koncentracija plinova i para između DGE i GGE se naziva eksplozivnim opsegom ili područjem eksplozivnosti.
U slučaju zapaljivosti tekućina, zapaljiva smjesa pare / zraka može se generirati samo ako je temperatura okoline jednaka ili viša od temperature paljenja tekućine. Primjeri DGE i GGE vrijednosti za nekoliko zapaljivih tvari prikazane su u tablici 2.

K. Dundović, S. Stašić: Rad na siguran način u skučenim prostorimaZbornik Veleučilišta u Rijeci, Vol. 8 (2020), No. 1, pp. 395-412
401
Tablica 2. Granice eksplozivnosti plinova i para
medij% g/m3
DGE GGE DGE GGEgustoća u odnosu
na zrakmetan 5 15 33 400 0,554
etan 3 15,5 37 195 1,049
propan 2,1 9,5 39 180 1,562
amonijak 15 28 105 200 0,597
ugljični monoksid 12,5 74 145 870 0,967
metanol 5,5 40 73 530 1, 11
acetilen 1,5 80 16 880 0,906
vodik 4,0 75,6 3 64 0,069Izvor: prilagođeno prema: http://www.hkis.hr/upload/documents/ssu/predavanja/20120923%20slavko%20rumb
akosnove%20protueksplozijske%20za%C5%A1tite_1%20dio.pdf
4. 3 Opasnost od trovanja
Otrovna atmosfera je atmosfera koja sadrži štetne tvari u koncentraciji većoj od granične vrijednosti izloženosti. Različite toksične tvari mogu biti prisutne u isto vrijeme u različitim vrstama zatvorenih prostora. Izlaganje toksičnim tvarima kao što su sumporovodik i ugljični monoksid može rezultirati smrću ili nepovratnim učincima na zdravlje (www.wshc.sg, 2.12.2019.).
Udisanje otrovnih plinova/para/prašina može djelovati na organizam na nekoliko načina (Uhlik, 2014:1230):
• nadražiti sluznice gornjih dišnih putova i dišnog sustava
• uzrokovati upalu/edem pluća
• utjecati na središnji živčani sustav
• uzrokovati gušenje.
Djelovanje na središnji živčani sustav manifestira se pojavom vrtoglavice i gubitkom ravnoteže. Pare nekih otapala mogu uzrokovati hipnotička stanja. U težim slučajevima posljedice mogu biti psihofizički poremećaji, npr. šok, nesvjestica (Uhlik, 2014:1230).
Plinovita tvar udisanjem dospije u krvotok, veže se na hemoglobin i tako sprječava prijenos kisika. To se još naziva i “kemijsko” gušenje, a na taj način djeluju npr. ugljikov monoksid i cijanovodik. Slično djeluju i neke kemijske tvari u krutom obliku ako u organizam dospiju gutanjem. Velika koncentracija, obično inertnog plina, smanjuje koncentraciju kisika u zraku i može prouzročiti gušenje zbog pomanjkanja kisika. Na taj način djeluju npr. ugljikov dioksid i dušik (Uhlik, 2014:1230).

K. Dundović, S. Stašić: Rad na siguran način u skučenim prostorimaZbornik Veleučilišta u Rijeci, Vol. 8 (2020), No. 1, pp. 395-412
402
Različite toksične tvari imaju različite učinke na zdravlje pri različitim koncentracijama stoga je neophodno znati koje toksične tvari mogu biti prisutne u skučenim prostorima tako da se može ispravno postaviti odgovarajuća oprema za ispitivanje atmosfere, kao i odgovarajući alarm upozorenja prilikom detekcije opasne koncentracije nekog plina (www.wshc.sg, 2. 12. 2019.).
4. 4 Druge opasnosti i štetnosti
Kontakt s mikroorganizmima, kao što su virusi, bakterije ili gljivice, može rezultirati infektivnim bolestima, dermatitisom ili plućnim bolestima. Kanalizacije, silosi za žitarice i jame za stajsko gnojivo su neki od primjera skučenih prostora gdje mogu biti prisutne biološke štetnosti (www.wshc.sg, 2. 12. 2019.).
Izlaganje mehaničkim opasnostima povezanim s proizvodnim procesima može rezultirati zaplitanjem, drobljenjem, rezanjem, probijanjem ili razdiranjem dijelova tijela osobe. Izvori mehaničkih opasnosti uključuju različite strojeve i uređaje kao što su miješalice ili drugi strojevi i uređaji s rotirajućim dijelovima kao što su zupčanici, remeni, osovine i tome slično. Mehaničke opasnosti prijete i od ručnih alata kojima se radi u skučenom prostoru, a to mogu biti brusilice, bušilice, pneumatski pištolji itd (www.wshc.sg, 2. 12. 2019.).
Česte su opasnosti od pada u dubinu ili pada predmeta na radnika. Skučeni prostori često su dizajnirani tako da nemaju sigurne površine za kretanje i imaju puno strukturalnih elemenata koji predstavljaju prepreke za kretanje. Osim toga, ukoliko se neki radovi izvode iznad neograđenog otvora za ulazak u skučeni prostor moguće je da alati ili dijelovi materijala upadnu unutra i ozlijede radnike koji rade u prostoru. Površine u skučenim prostorima često mogu biti masne ili mokre, kao što je to slučaj u tankovima ulja ili balasta, što povećava rizik od pokliznuća.
Opasnost od električne struje može uzrokovati ozljede zbog mogućnosti strujnog udara i/ili opeklina, a mogu nastati zbog kabela, transformatora, kondenzatora, izloženih priključaka i mokrih površina gdje se koristi električna oprema.
Priroda skučenog prostora je takva da lakše može dovesti do povećane vjerojatnosti kontakta kože s površinskim zagađivačima. Dodir kože s opasnim tvarima može rezultirati neposrednim zdravstvenim učincima kao što su opekotine, iritacije, alergijski dermatitis itd. (www.wshc.sg, 2.12.2019.).
Buka nastala uslijed procesa rada u skučenom prostoru može se pojačati zbog refleksije od tvrde površine. Izlaganje prekomjernoj buci može rezultirati gubitkom sluha, tinitusom i drugim štetnim učincima na zdravlje. Buka može spriječiti radnike da čuju signale upozorenja u slučaju opasnosti. Osim toga, konstanta buka može djelovati ometajuće na radnike i na taj način povećati rizik od ozljeda (www.wshc.sg, 2. 12. 2019.).
Opasnosti koje proizlaze iz ručno obavljanih radnih zadataka mogu se pogoršati zbog skučenosti prostora i ograničenjima vezanim za rad u takvom prostoru. Dodatne opasnosti mogu nastati zbog uporabe osobnih zaštitnih sredstava koja ograničavaju kretanje i hvat (www.wshc.sg, 2. 12. 2019.).

K. Dundović, S. Stašić: Rad na siguran način u skučenim prostorimaZbornik Veleučilišta u Rijeci, Vol. 8 (2020), No. 1, pp. 395-412
403
Zračenje može imati štetan učinak na zdravlje izloženih radnika, a taj učinak ovisi o izvoru zračenja. Izvori zračenja uključuju radioaktivne izvore, rendgenske zrake, laser, bljesak zavarivanja, radiofrekvenciju i mikrovalove (www.wshc.sg, 2. 12. 2019.).
5. RAD NA SIGURAN NAČIN U SKUČENIM PROSTORIMA
Preduvjet za obavljanje poslova koji obuhvaćaju rad u skučenom prostoru jest taj da radnik prije svega mora biti osposobljen za rad u skučenom prostoru te upoznat sa opasnostima i štetnostima koje mu prijete prilikom obavljanja navedenog rada.
5. 1 Analiza i procjena rizika
Prije svega, potrebno je analizirati i procijeniti rizike rada u skučenom prostoru. Prvi korak postupka za rad na siguran način vodi stručnjake sigurnosti kroz analizu karakteristika skučenog prostora. Analizom se istražuju karakteristike prostora, karakteristike zadatka i zahtjevi za reagiranje u izvanrednim situacijama.
Prva analiza uključuje analizu karakteristika skučenog prostora. Geometrijske karakteristike i atmosferske karakteristike skučenog prostora utječu na sigurnosne uvjete jer su takvi prostori ograničena područja s ograničenim otvorima za ulazak i izlazak. Posljedica toga je ograničeni protok zraka pa opasne tvari mogu stvoriti atmosferske uvjete koji su trenutno opasni po život ili zdravlje radnika.
Druga analiza istražuje karakteristike zadatka koji se obavlja u skučenom prostoru. Radna oprema i aktivnost koje se trebaju obaviti mogu utjecati na atmosferske uvjete. Konačno, treća analiza uključuje proučavanje zahtjeva za sigurne hitne operacije evakuacije i spašavanja. Analiza plana evakuacije i spašavanja u izvanrednim situacijama ima za cilj osigurati visoku učinkovitost u slučaju nesreće u skučenom prostoru (Botti et al., 2018.).
Identifikacija i procjena rizika za rad u skučenim prostorima složen je zadatak jer su gotovo uvijek prisutni višestruki rizici prilikom rada u takvom prostoru. Cilj je identificirati i procijeniti moguće uzroke ozljeda i nesreća u skučenim prostorima kako bi se utvrdile mjere za uklanjanje odnosno smanjivanje opasnosti, štetnosti i napora (Botti et al., 2018.).
5. 2 Dozvola za ulazak u skučeni prostor
Nakon provedene analize i procjene rizika, potrebna je formalna provjera kako bi se osiguralo da su ispunjeni svi uvjeti za siguran ulazak i rad u skučenim prostorima. Nitko ne smije ući ili raditi u skučenom prostoru bez valjane dozvole. Također, dozvola predstavlja i jedan oblik komunikacije između voditelja radova, poslovođe, stručnjaka sigurnosti na radu i radnika te osigurava da su odgovorne osobe izvršile provjeru i odobrile ulazak i rad u skučeni prostor. (www.worksafe.qld.gov.au, 2. 12. 2019.).

K. Dundović, S. Stašić: Rad na siguran način u skučenim prostorimaZbornik Veleučilišta u Rijeci, Vol. 8 (2020), No. 1, pp. 395-412
404
Preporučuje se da dozvola za ulazak u skučeni prostor jasno identificira uloge i odgovornosti osoba koje mogu odobriti određene poslove i koje su odgovorne za određivanje potrebnih sigurnosnih mjera (npr. izolacija, ispitivanja atmosfere, mjere u slučaju opasnosti).
Za rad u skučenim prostorima treba uspostaviti i provoditi sustav dozvola za rad i dozvola za ulazak u skučeni prostor. Implementacijom takvog sustava osigurava se da:
• se rad u zatvorenom prostoru provodi s pažljivim razmatranjem sigurnosti i zdravlja osoba koje obavljaju posao
• su osobe obaviještene o opasnostima povezanima s radom u zatvorenom prostoru
• su provedene potrebne sigurnosne mjere kada se obavlja rad u zatvorenom prostoru

K. Dundović, S. Stašić: Rad na siguran način u skučenim prostorimaZbornik Veleučilišta u Rijeci, Vol. 8 (2020), No. 1, pp. 395-412
405
Slika 3. Primjerak dozvole za ulazak u skučeni prostor
Izvor: Interna dokumentacija brodogradilišta Viktor Lenac

K. Dundović, S. Stašić: Rad na siguran način u skučenim prostorimaZbornik Veleučilišta u Rijeci, Vol. 8 (2020), No. 1, pp. 395-412
406
Dozvola za ulazak u skučeni prostor treba sadržavati:
• identifikaciju i lokaciju skučenog prostora
• svrhu ulaska
• datum i vrijeme ulaska
• valjanost dozvole (datum i vrijeme završetka radova / isteka dozvole)
• potencijalne opasnosti i sigurnosne mjere
• ime osobe u pripravnosti na ulazu
• rezultate mjerenja atmosfere (kisik, zapaljivi plinovi, ostali otrovni plinovi)
• imena i potpise osobe u pripravnosti na ulazu, stručnjaka sigurnosti na radu, rukovoditelja radova, podnositelja zahtjeva.
5. 3 Ispitivanje atmosfere
Nikada nije sigurno vjerovati osjetilima kada treba odrediti je li atmosfera u skučenom prostoru sigurna za disanje. Nedostatak kisika i prisutnost mnogih toksičnih ili zapaljivih plinova ne može se vidjeti, okusiti niti osjetiti. Važno je izvršiti ispitivanje atmosfere skučenih prostora kako bi se osiguralo da atmosfera bude sigurna za ulazak osoba.
Također je važno kontinuirano pratiti stanje atmosfere nakon ulaska kako bi se održala na sigurnoj razini (www.wshc.sg, 2. 12. 2019.).
Atmosferska ispitivanja potrebna su zbog procijene opasnosti u skučenom prostoru i provjere/potvrde sigurnog ulaska u navedeni prostor. Nitko ne smije ući u skučeni prostor dok se ne utvrdi da je atmosfera unutar prostora sigurna. Ako je ulazak potreban, ovlašteni radnik mora biti opremljen odgovarajućim osobnim zaštitnim sredstvima (www.wshc.sg, 2. 12. 2019.).
Prilikom ispitivanja atmosfere u skučenom prostoru, važno je uzeti u obzir geometriju prostora i fizikalna svojstva plinova koji se mjere. Plinovi mogu biti na različitim razinama ili mjestima unutar skučenog prostora, ovisno o tome jesu li lakši ili teži od zraka.
Čak i kada je atmosfera u skučenom prostoru ispitana i ocijenjena kao sigurna za ulazak, barem jedan radnik u grupi koja radi u istoj okolini mora biti opremljen odgovarajućim instrumentom za mjerenje kisika, zapaljivih tvari i toksičnih tvari (www.wshc.sg, 2. 12. 2019.).
5. 4 Pročišćavanje, ventilacija i inertiranje zatvorenih prostora
Kada je poznato da skučeni prostor sadrži opasne kontaminante, ključno je da se prostor pročisti na odgovarajući način prije svakog ulaska. Nakon toga treba osigurati kontinuiranu ventilaciju radi održavanja sigurnog radnog okruženja. Također je važno napomenuti da čišćenje i ventilacija ne isključuju potrebu za ispitivanjem atmosfere (www.wshc.sg, 2. 12. 2019.).
Pročišćavanje uključuje uklanjanje kontaminanata unutar skučenog prostora na način da se opasna atmosfera zamjeni neopasnom pomoću dovođenja zraka kako bi se postigla sigurna atmosfera. Na
K. Dundović, S. Stašić: Rad na siguran način u skučenim prostorimaZbornik Veleučilišta u Rijeci, Vol. 8 (2020), No. 1, pp. 395-412
407
primjer, ako je skučeni prostor izvorno sadržavao otrovni plin, zrak bi trebalo upuhivati u prostor kako bi se smanjila koncentracija otrovnog plina na sigurnu razinu.
Pročišćavanje zraka unutar skučenog prostora provodi se prije svakog ulaska i svrha je uklanjanje bilo kojih postojećih kontaminanata zamjenom opasne atmosfere s drugim medijem kao što je zrak, voda, para ili inertni plin. Izbor prikladnog medija ovisit će o čimbenicima kao što su svojstva zagađivača i njihove koncentracije.
Nakon što su onečišćivači uklonjeni, skučeni prostor može se ventilirati. Ventilacija znači kontinuirano uvođenje svježeg zraka u prostor pomoću mehaničkih sredstava za održavanje prihvatljivih razina atmosfere. Prostor se mora ventilirati za vrijeme trajanja radova kako bi se održala prihvatljiva koncentracija kisika, osigurala zaštita u slučaju slučajnog ispuštanja kemikalija, uklonili kontaminanti nastali obavljenim radom ili kako bi se prostor ohladio (www.labour.gov.on.ca, 4. 12. 2019.).
Ventilacija uključuje istiskivanje zraka i uvođenje svježeg zraka ili kontinuirano uklanjanje kontaminanata lokalnom ispušnom ventilacijom na izvoru zagađenja, primjerice zavarivanja.
Kako bi se osigurala odgovarajuća ventilacija, mjesta dovoda zraka i ispušnih plinova treba što je moguće više odvojiti. Čisti kisik ne smije se koristiti za ventilaciju skučenog prostora (www.labour.gov.on.ca, 4. 12. 2019.).
Inertiranje je poseban oblik pročišćavanja i ventilacije. Inertiranje uključuje smanjivanje razine kisika unutar skučenog prostora pomoću inertnog plina kao što je dušik, ugljični dioksid ili argon kako bi se uklonila opasnost od požara ili eksplozije. Koncentracija kisika se smanjuje ispod razine koja može podržati izgaranje. Nakon inertiranja konstantno se prati koncentracija kisika i skučeni prostor može se ventilirati pomoću inertnog plina kako bi se osiguralo da se koncentracija kisika ne povećava. Inertni plinovi stvorit će nesigurnu atmosferu (nedostatak kisika) i stoga radnici koji ulaze u skučeni prostor trebaju koristiti odgovarajuće izolacijske respiratore (www.labour.gov.on.ca, 4. 12. 2019.).
Zbog jedinstvenih karakteristika skučenih prostora, prirodna ventilacija obično nije adekvatna i zahtijeva uporabu mehaničke ventilacije koja može biti prisilna ventilacija ili lokalna ispušna ventilacija.
Pri određivanju vrste ventilacije u obzir se uzimaju svojstva kontaminanata, konfiguracija prostora i očekivani rad koji će se obaviti u skučenom prostoru.
5. 4. 1 Prisilna ventilacija
Prisilna ventilacija dovodi svježi zrak u skučeni prostor upotrebom mehaničkih uređaja za kretanje zraka, poput puhala. Stalna opskrba svježim zrakom u dovoljnoj količini pomoći će održati razinu kisika u prostoru unutar sigurnog raspona, kao i razrijediti razinu opasnih ili otrovnih tvari koje se oslobađaju u skučenom prostoru (www.wshc.sg, 2. 12. 2019.).

K. Dundović, S. Stašić: Rad na siguran način u skučenim prostorimaZbornik Veleučilišta u Rijeci, Vol. 8 (2020), No. 1, pp. 395-412
408
Važno je osigurati da se uređaj za dovođenje zraka postavi tamo gdje je zrak koji se uvlači u skučeni prostor čist. Na primjer, nije prikladno smjestiti uređaj za dovođenje zraka iza dizel generatora gdje ispušni plinovi iz generatora mogu ući u skučeni prostor (www.wshc.sg, 2. 12. 2019.).
U nekim slučajevima, skučeni prostori mogu biti ispunjeni zapaljivim plinovima i parama, osobito ako je izvorna koncentracija zapaljivih iznad GGE. Ventilacijom sa svježim zrakom, koncentracija tih tvari može se dovesti unutar područja eksplozivnosti. Tada treba razmotriti korištenje lokalne ispušne ventilacije ili inertiranje medijem kao što je dušik (www.wshc.sg, 2. 12. 2019.).
Slika 4. Primjer uređaja za prisilnu ventilaciju
Izvor: Technical Advisory on Working Safely in Confined Spaces, 2010., str. 44, http://www.asmi.com/download.cfm?dobjid=285
5. 4. 2 Lokalna ispušna ventilacija
Ispušna ventilacija se postiže izvlačenjem zraka iz skučenog prostora, a tim procesom se uklanjaju zagađivači iz prostora. Lokalna ispušna ventilacija specifična je primjena ispušne ventilacije gdje se izvlačenje primjenjuje izravno na izvoru onečišćenja (www.wshc.sg, 2. 12. 2019.).
Korištenje lokalne ispušne ventilacije treba uzeti u obzir kada prisilna ventilacija nije učinkovita zbog ograničenja u skučenom prostoru ili kada se tijekom rada mogu pojaviti visoke koncentracije kontaminanata zbog postupka kao što su zavarivanje, nanošenje antikorozivnih premaza ili korištenje kemijskih sredstava za čišćenje (www.wshc.sg, 2. 12. 2019.).
Da bi lokalna ispušna ventilacija bila učinkovita, ključno je postaviti usisni dio cijevi blizu izvora onečišćenja. Osim toga, važno je da je kapacitet ventilatora dovoljan za potrebe osiguravanja sigurne atmosfere s obzirom na konfiguraciju prostora i prirodu obavljanog posla (www.wshc.sg, 2. 12. 2019.).
5. 4. 3 "Push-pull" sustav ventilacije
Obzirom da lokalna ispušna ventilacija izvlačenjem zraka iz prostora stvara neznatan negativan tlak u prostoru, važno je da se zamjenski zrak osigurava u obliku dovodne ventilacije. Sustav "push-pull" koristi kombinaciju prisilne ventilacije i lokalne ispušne ventilacije i na taj način uvodi svježi zrak u prostor istovremeno izvlačeći onečišćeni zrak iz prostora. Ovakav sustav ventilacije obično pruža učinkovitiju ventilaciju skučenog prostora nego što bi to bilo samo korištenjem jednog sustava ventilacije i preporučuje se kad god je to izvedivo (www.wshc.sg, 2. 12. 2019.).

K. Dundović, S. Stašić: Rad na siguran način u skučenim prostorimaZbornik Veleučilišta u Rijeci, Vol. 8 (2020), No. 1, pp. 395-412
409
Slika 5. Primjer "push-pull" sustava ventilacije
Izvor: Technical Advisory on Working Safely in Confined Spaces, 2010., str. 46, http://www.asmi.com/download.cfm?dobjid=285
5. 5 Rasvjeta u skučenim prostorima
Za ulazak i rad u skučenom prostoru potrebno je osigurati odgovarajuću i prikladnu rasvjetu. Pristup i prolaz u prostor mora imati osvjetljenje od najmanje 50 lux-a. Sva prijenosna ručna rasvjeta koja se nalazi u skučenim prostorima mora raditi pod naponom koji ne prelazi 55 V izmjenične struje ili 110 V istosmjerne struje (www.wshc.sg, 2. 12. 2019.).
Takva protueksplozijska rasvjeta radi obično pod naponom od 24 V ili 12 V, a ponekad i nižem. Protueksplozijske svjetiljke imaju smanjen rizik od izazivanja eksplozije jer njihova konstrukcija izolira iskre unutar jedinice čime se sprječava da svjetiljka postane izvor zapaljenja. Osim toga, robusno kućište djeluje kao dodatna zaštita (www.larsonelectronics.com, 4. 12. 2019.)
Specijalna rasvjetna tijela strogo su regulirana OSHA-om radi njihove sposobnosti da smanje intenzitet strujnog udara. Korištenjem protueksplozijske rasvjete niskog napona povećavaju se šanse za preživljavanje pri kontaktu s električnom komponentom. Udar iz niskonaponskog rasvjetnog tijela može izbaciti radnika iz ravnoteže, ali mu neće uzrokovati ozbiljne opekline i nekontrolirano potresanje koje bi lako moglo dovesti do ozbiljnih ozljeda ili smrti (www.larsonelectronics.com, 4. 12. 2019.).
5. 6 Evakuacija i spašavanje
Prije nego što je bilo tko ovlašten ući u skučeni prostor, ključno je imati na raspolaganju osposobljeno osoblje za izvanredne situacije kada radnik treba pomoć. Važno je da takvo osoblje odmah dođe do lokacije i zna kako se nositi s hitnim slučajevima. Svako neplanirano spašavanje, kao kad netko instinktivno uđe u skučeni prostor da pomogne unesrećenom kolegi, može dovesti do dvostrukog smrtnog slučaja (www.wshc.sg, 2. 12. 2019.).
Obaveza je imati pisani plan i uspostavljeni sustav spašavanja na licu mjesta koji uključuje opremu, uređaje za izvlačenje unesrećenika, uređaje za disanje i reanimaciju. Težina nesreće može se smanjiti pravovremenim upozorenjima od strane osobe u pripravnosti koja se nalazi izvan skučenog prostora. Dobro obučeni i potpuno opremljeni spasilački tim može osigurati brzu reakciju u hitnim
K. Dundović, S. Stašić: Rad na siguran način u skučenim prostorimaZbornik Veleučilišta u Rijeci, Vol. 8 (2020), No. 1, pp. 395-412
410
slučajevima. Pisani plan spašavanja uspostavlja se u svrhu spašavanja osoba iz skučenog prostora. Plan akcije spašavanja mora sadržavati imena spasilačkog osoblja, metode spašavanja kako bi se izvukle osobe iz zatvorenog prostora, propisanu vrstu opreme potrebne za spašavanje i dostupnost iste te sredstva za pravovremeno pozivanje imenovanog spasioca (www.wshc.sg, 2. 12. 2019.).
Procjena rizika će odrediti koje su metode spašavanja potrebne. Metode spašavanje ovisit će o prirodi skučenog prostora, utvrđenim rizicima i vrstama hitnih situacija koje se mogu predvidjeti. Važno je uočiti moguće izvanredne situacije u skučenom prostoru, te bilo koju drugu predvidivu nesreću za uspješno provođenje operacije spašavanja (www.wshc.sg, 2. 12. 2019.).
6. ZAKLJUČAK
Skučeni prostori nisu namijenjeni za rad i boravak ljudi i mogu biti vrlo opasni. Rad u navedenim prostorima predstavlja visokorizičnu aktivnost pa je provođenje mjera zaštite na radu od ključne važnosti za očuvanje zdravlja i sigurnosti svih radnika koji ulaze i rade u takvim prostorima.
Najveće opasnosti u skučenim prostorima povezane su s atmosferskim uvjetima tih prostora. Atmosfera unutar različitih zatvorenih prostora ovisi o vrsti prostora, radovima koji se unutra odvijaju i onome što je u njima ranije bilo pohranjeno. Najučestalije opasnosti u skučenim prostorima su opasnost od gušenja, opasnost od požara i/ili eksplozije i opasnost od trovanja.
Stoga je vrlo važno kao prvi korak izvršiti analizu samog prostora kako bi se mogle prepoznati sve opasnosti i štetnosti koje prijete prilikom rada u skučenom prostoru. Na osnovu izvršene analize, slijedeći korak izrada je adekvatne procjene rizika koja će biti temelj za određivanje mjera sigurnosti kako bi se utvrđeni rizik uklonio.
Ono što je vrlo bitno u čitavom procesu jest izdavanje dozvole za ulazak u skučeni prostor nakon što se utvrdi da su izvršene sve propisane mjere sigurnosti i da je sam prostor kao takav siguran za obavljanje predviđenog rada. Sustav dozvola za ulazak u skučene prostore osigurava komunikaciju između ovlaštenih i odgovornih osoba za izvršenje određenog rada u takvom prostoru. Rizik rada u skučenom prostoru može se smanjiti adekvatnom procjenom rizika i provedbom propisanih mjera sigurnosti.
LITERATURAConfined Spaces, https://www.ihsa.ca/pdfs/safety_manual/Confined_Spaces.pdf (2.12.2019.)
Botti, L. et al. (2018) “An integrated holistic approach to health and safety in confined spaces”, Journal of Loss Prevention in the Process Industries, 55, pp. 25–35. https://doi.org/10.1016/j.jlp.2018.05.013
Granica zapaljivosti, https://glossary.periodni.com/glosar.php?hr=granica+zapaljivosti (2.12.2019.)
Guideline for Developing a Code of Practice for Confined Space Entry,
https://ohs-pubstore.labour.alberta.ca/download/sample/154 (30.11.2019.)
HSE, Safe work in confined spaces, Approved Code of Practice and guidance, 2014., http://www.hse.gov.uk/pubns/priced/l101.pdf (30.11.2019.)
Selmanetal, J., An investigation into the rate and mechanism of incident of work-related confined space fatalities, Safety Science 109, 2018., str. 333–343

K. Dundović, S. Stašić: Rad na siguran način u skučenim prostorimaZbornik Veleučilišta u Rijeci, Vol. 8 (2020), No. 1, pp. 395-412
411
Low Voltage Lights for Confined Spaces and Wet Locations, https://www.larsonelectronics.com/blog/2017/01/10/confined-space/low-voltage-lights-confined-spaces-wet-locations (4.12.2019.)
Pravilnik o zaštiti radnika od izloženosti opasnim kemikalijama na radu, graničnim vrijednostima izloženosti i biološkim graničnim vrijednostima, NN 91/2018,
https://narodne-novine.nn.hr/clanci/sluzbeni/full/2018_10_91_1774.html (2.12.2019.)
Safe Work Australia, Confined spaces – Code of Practice, 2018.,
https://www.safeworkaustralia.gov.au/system/files/documents/1810/modelcopconfined_spaces.pdf (30.11.2019.)
Uhlik Branko, Požarno opasne, toksične i reaktivne tvari, Kem. Ind. 63 (5-6),1229–1231, 2014.,
https://hrcak.srce.hr/file/178534 (2.12.2019.)
Workplace Health and Safety Queensland, Confined spaces: Code of Practice, 2011.,
https://www.worksafe.qld.gov.au/__data/assets/pdf_file/0010/58159/Confined-spaces-COP-2011.pdf
(2.12.2019.)
WSH COUNCIL (Workplace Safety and Health Council): Technical Advisory on Working Safely in Confined
Spaces, 2010., https://www.wshc.sg/files/wshc/upload/cms/file/2014/cs2.pdf (2.12.2019.)
K. Dundović, S. Stašić: Rad na siguran način u skučenim prostorimaZbornik Veleučilišta u Rijeci, Vol. 8 (2020), No. 1, pp. 395-412
412
Review article https://doi.org/10.31784/zvr.8.1.25 Received: 10. 12. 2019. Accepted: 5. 2. 2020.
SAFE WORK IN CONFINED SPACES
Kristina Dundović MEng, Lecturer, Polytechnic of Rijeka, Vukovarska 58, 51 000 Rijeka, Croatia; e-mail: [email protected]
Stela Stašić Professional Specialist Engineer of Safety and Protection, Occupational Health And Safety,
Viktor Lenac d. d., Martinšćica bb, P. O. box 210, 51 000 Rijeka, Croatia; e-mail: [email protected]
ABSTRACTA confined space can be defined as a space large enough for a worker to fully enter in it and do the work, as a space that is not designed for permanent residence of workers and has restrictions on entry or exit. The greatest hazards in confined spaces are related to the atmospheric conditions of those spaces. The atmosphere inside the confined spaces depends on the type of the space, the work that is taking place inside and on what has previously been stored there. The most common hazards in confined spaces are the risk of suffocation, the risk of fire and / or explosion and the risk of poisoning. Work in confined spaces is a high-risk activity, so the implementation of occupational safety measures is crucial for maintaining the health and safety of all workers who enter and work in such spaces.
Key words: occupational safety measures, hazards, confined spaces
Creative Commons Attribution – NonCommercial 4.0 International License

R. Obajdin, G. Štimac Rončević, S. Braut: Utjecaj dodatnog tereta na dinamiku polovinskog modela...Zbornik Veleučilišta u Rijeci, Vol. 8 (2020), No. 1, pp. 413-426
413
Stručni rad https://doi.org/10.31784/zvr.8.1.26 Datum primitka rada: 6. 12. 2019. Datum prihvaćanja rada: 3. 2. 2020.
UTJECAJ DODATNOG TERETA NA DINAMIKU POLOVINSKOG MODELA VOZILA PRI PRELASKU
PREKO UMJETNE IZBOČINERobert Obajdin
Bacc. ing. mech., Tehnički fakultet Sveučilišta u Rijeci, Vukovarska 58, 51 000 Rijeka, Hrvatska; e-mail: [email protected]
Goranka Štimac Rončević Dr. sc., docentica, Tehnički fakultet Sveučilišta u Rijeci, Vukovarska 58, 51 000 Rijeka, Hrvatska;
e-mail: [email protected]
Sanjin Braut Dr. sc., redoviti profesor, Tehnički fakultet Sveučilišta u Rijeci, Vukovarska 58, 51 000 Rijeka, Hrvatska;
e-mail: [email protected]
SAŽETAKU ovom radu opisan je matematički model vozila s četiri stupnja slobode gibanja tzv. polovinski model vozila te postupak modeliranja umjetne izbočine. Dimenzije izbočina propisane su Pravilnikom i ovise o ograničenjima brzine. Za izabrani tip automobila provedene su potrebne simulacije kako bi se prikazao utjecaj dodatnog tereta na gibanje težišta vozila pri prelasku preko umjetne izbočine. Sve numeričke simulacije provedene su u programskom paketu Matlab/Simulink. Rezultati simulacija prikazani su tablično, gdje je dana usporedba maksimalnih vrijednosti pomaka i ubrzanja vozila i kotača pri brzinama vožnje 20 km/h, 30 km/h i 50 km/h u dva promatrana slučaja, tj. bez i s dodatnim teretom. U vremenskoj domeni prikazani su odzivi vertikalnih i kutnih pomaka i ubrzanja vozila pri brzinama 30 i 50 km/h.
Ključne riječi: dinamika vozila, dodatni teret, umjetne izbočine, numerička simulacija
1. UVOD
Vozilo je tijekom vožnje izloženo utjecaju neravnina na cesti / kolniku. Te neravnine (izbočine i ulegnuća) mogu nastati na pojedinim dionicama kolnika tijekom vremena uslijed prolaska teških teretnih vozila, slijeganja tla i slično, a mogu biti i namjerno postavljene na cesti kao naprave za smirivanje prometa (NN 92/2019). Prijelaz kotača preko lokalne neravnine rezultira tzv. prijelaznim
Creative Commons Attribution – NonCommercial 4.0 International License

R. Obajdin, G. Štimac Rončević, S. Braut: Utjecaj dodatnog tereta na dinamiku polovinskog modela...Zbornik Veleučilišta u Rijeci, Vol. 8 (2020), No. 1, pp. 413-426
414
ili tranzijentnim vertikalnim odzivom vozila. Pravilnim odabirom vrste ovjesa te proračunom njegovih parametara može se uvelike utjecati na vibracijski odziv vozila. U tom smislu, svrha ovjesa je povećanje udobnosti putnika tijekom vožnje te osiguranje stabilnosti i upravljivosti vozila. Postoji više vrsta izvedbi mehanizma ovjesa no kad se analizira dinamika ovjesa često se koriste modeli sa koncentriranim parametrima, tj. opis pomoću ovješene i neovješene mase, opružnog i prigušnog elementa (Reza, 2008).
Za analizu dinamike ovjesa koriste se četvrtinski (¼ model), polovinski (½ model) i puni model ovjesa vozila. Četvrtinski model (Shelke i dr. 2018) opisan je ovješenom masom (odgovara ¼ ukupne mase vozila), neovješenom masom (masa kotača), koeficijentima krutosti i prigušenja te služi samo za analizu vertikalnog translacijskog gibanja. Sukladno tome, ½ model ovjesa (Shahriar i dr. 2016, Shelke i Mitra, 2018) koristi polovicu od ukupne mase vozila i dvije neovješene mase a puni model ovjesa (Radelja i dr. 2007) razmatra ukupnu masu vozila i sva četiri kotača. ¼ model ima dva stupnja slobode gibanja, ½ model ima četiri stupnja slobode gibanja, a puni model sedam stupnjeva slobode gibanja. Razlikujemo dvije vrste ½ modela ovjesa, pri čemu prvi razmatra posrtanje ovješene mase (zakretanje oko poprečne osi), a drugi naginjanje ovješene mase (zakretanje oko uzdužne osi vozila).
U ovom radu razmatra se ½ model ovjesa sa posrtanjem ovješene mase (Obajdin, 2017). Takav model je prikladan za analizu dinamike ovjesa vozila prilikom prelaska umjetne izbočine na ravnoj dionici ceste. Za osobno vozilo danih karakteristika analiziran je utjecaj dodavanja tereta na odziv ovjesa, tj. uspoređivani su slučajevi odziva bez i sa dodatnom masom tereta. Numeričke simulacije provedene su u programskom paketu Matlab/Simulink. Usporedba rezultata simulacija dana je u vidu maksimalnih vrijednosti odziva (pomaka i ubrzanja težišta vozila i kotača) pri brzinama vožnje 20 km/h, 30 km/h i 50 km/h. Naposljetku, prikazani su odzivi vertikalnih i kutnih pomaka i ubrzanja težišta vozila, pri brzinama 30 km/h i 50 km/h u vremenskoj domeni.
2. ½ MODEL VOZILA – POSRTANJE OVJEŠENE MASE
Vozilo je tijekom vožnje izloženo djelovanju neravnina na cesti. Pravilnim odabirom ovjesa ostvaruje se povećanje udobnosti vozača i putnika tijekom vožnje te osiguranje stabilnosti i upravljivosti vozila. Odabir vrste i parametara ovjesa često predstavlja kompromis različitih zahtjeva tj. vozilo se kako numerički tako i eksperimentalno testira u različitim uvjetima vožnje. Kako je cilj ovog rada dati usporedbu odziva za slučajeve prelaska vozila preko umjetne izbočine na ravnoj cesti, valjanje neće imati bitnijeg utjecaja te se stoga razmatra ½ model ovjesa sa posrtanjem ovješene mase. Slika 1 prikazuje vozilo sa svim stupnjevima slobode gibanja.
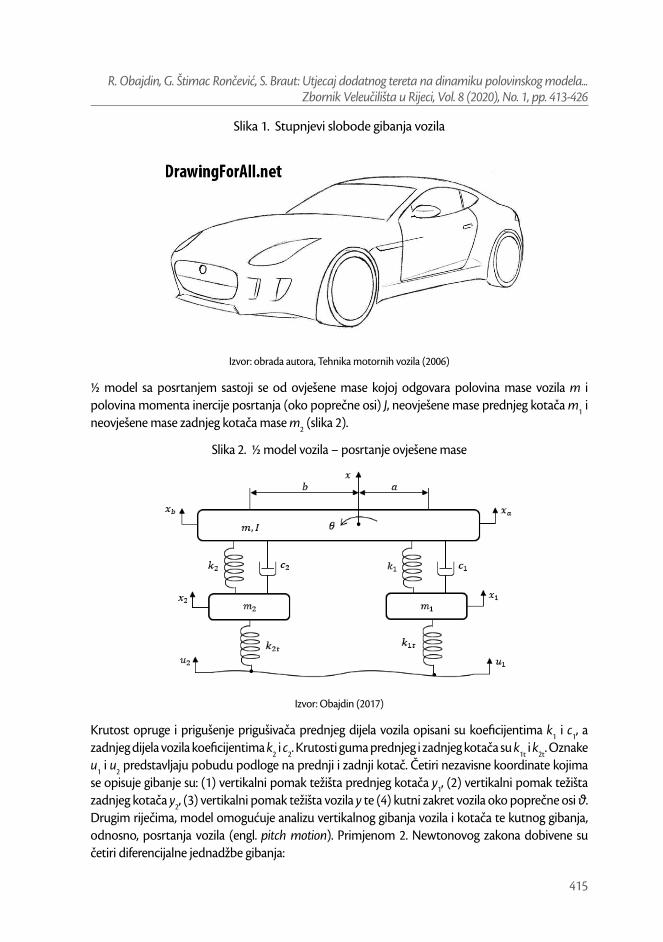
R. Obajdin, G. Štimac Rončević, S. Braut: Utjecaj dodatnog tereta na dinamiku polovinskog modela...Zbornik Veleučilišta u Rijeci, Vol. 8 (2020), No. 1, pp. 413-426
415
Slika 1. Stupnjevi slobode gibanja vozila
Izvor: obrada autora, Tehnika motornih vozila (2006)
½ model sa posrtanjem sastoji se od ovješene mase kojoj odgovara polovina mase vozila m i polovina momenta inercije posrtanja (oko poprečne osi) J, neovješene mase prednjeg kotača m1 i neovješene mase zadnjeg kotača mase m2 (slika 2).
Slika 2. ½ model vozila – posrtanje ovješene mase
Izvor: Obajdin (2017)
Krutost opruge i prigušenje prigušivača prednjeg dijela vozila opisani su koeficijentima k1 i c1, a zadnjeg dijela vozila koeficijentima k2 i c2. Krutosti guma prednjeg i zadnjeg kotača su k1t i k2t. Oznake u1 i u2 predstavljaju pobudu podloge na prednji i zadnji kotač. Četiri nezavisne koordinate kojima se opisuje gibanje su: (1) vertikalni pomak težišta prednjeg kotača y1, (2) vertikalni pomak težišta zadnjeg kotača y2, (3) vertikalni pomak težišta vozila y te (4) kutni zakret vozila oko poprečne osi θ. Drugim riječima, model omogućuje analizu vertikalnog gibanja vozila i kotača te kutnog gibanja, odnosno, posrtanja vozila (engl. pitch motion). Primjenom 2. Newtonovog zakona dobivene su četiri diferencijalne jednadžbe gibanja:

R. Obajdin, G. Štimac Rončević, S. Braut: Utjecaj dodatnog tereta na dinamiku polovinskog modela...Zbornik Veleučilišta u Rijeci, Vol. 8 (2020), No. 1, pp. 413-426
416
2 2 2 2 1 1 1 1( ) ( ) ( ) ( )my c y b y k y b y c y a y k y a yθ θ θ θ= − − − − − − − + − − + − (1.a)
2 2 2 2 1 1 1 1( ) ( ) ( ) ( )J c b y b y k b y b y c a y a y k a y a yθ θ θ θ θ= − − + − − − + − − + − (1.b)
1 1 1 1 1 1 1 1 1( ) ( ) ( )tm y c y a y k y a y k y uθ θ= + − + + − − − (1.c)
2 2 2 2 2 2 2 2 2( ) ( ) ( )tm y c y b y k y b y k y uθ θ= − − + − − − − . (1.d)
3. UMJETNE IZBOČINE
Prema Pravilniku o prometnim znakovima, signalizaciji i opremi na cestama (NN 92/2019) umjetne izbočine su gotovi modularni proizvodi od gume ili plastike, a postavljaju se prije zone smirivanja prometa preko jedne polovine ili po cijeloj širini prometne trake, većinom u stambenim ulicama. Ovisno o ograničenju brzine, prema dimenzijama razlikuju se tri tipa izbočina:
a) za brzine vožnje 50 km/h ili manje, širina ne smije biti manja od 60 cm, a visina ne smije prelaziti 3 cm,
b) za brzine vožnje 40 km/h ili manje, širina ne smije biti manja od 90 cm, a visina ne smije prelaziti 5 cm,
c) za brzine vožnje 30 km/h ili manje, širina ne smije biti manja od 120 cm, a visina ne smije prelaziti 7 cm.
Umjetna izbočina na koju nailazi kotač može se opisati funkcijom parabole:
2
1 2Lu H p x = − −
, (2)
gdje je H maksimalna visina izbočine, L maksimalna duljina izbočine te x prijeđeni put, koji se može odrediti kao umnožak brzine vozila v i vremena prelaska preko prepreke t, kako slijedi:
x v t= ⋅ . (3)
Koeficijent p u jednadžbi (2) dobiven je iz poznatih uvjeta u trenutku t = 0 (x = 0 i u1 = 0), primjenom čega slijedi:
2
4HpL
= . (4)
Matematički model umjetne izbočine za brzine vozila do 30 km/h prikazan je na slici 3.

R. Obajdin, G. Štimac Rončević, S. Braut: Utjecaj dodatnog tereta na dinamiku polovinskog modela...Zbornik Veleučilišta u Rijeci, Vol. 8 (2020), No. 1, pp. 413-426
417
Slika 3. Umjetna izbočina za brzine vozila do 30 km/h
0 0.2 0.4 0.6 0.8 1 1.2
Duljina (m)
0
0.02
0.04
0.06
0.08
Visi
na (m
)
Ležeći policajac za brzine do 30 km/h
Izvor: Obajdin (2017)
4. NUMERIČKI MODEL
Radi jednostavnije implementacije modela vozila opisanog jednadžbama (1) u programski paket Matlab/Simulink iste su svedene na slijedeći oblik (Obajdin, 2017):
2 2 2 2 2 2 1 1 1 1 1 11 ( ) ( ) ( ) ( ) = − − + − − + − − − − − −
my c y y c b k y y k b c y y c a k y y k am
θ θ θ θ (5.a)
2 2 2 22 2 2 2 2 2 1 1 1 1 1 1
1 ( ) ( ) ( ) ( ) = − − + − − − − − − − − c b y y c b k b y y k b c a y y c a k a y y k a
Jθ θ θ θ θ (5.b)
1 1 1 1 1 1 1 1 1 1 1 11
1 ( ) ( ) t tm y c y y c a k y y k a k y k um
θ θ = − + + − + − + (5.c)
2 2 2 2 2 2 2 2 2 2 22
1 ( ) ( ) = − − + − − − + t ty c y y c b k y y k b k y k u
mθ θ . (5.d)
Na temelju jednadžbi (5) izrađen je Simulink model, kao što je prikazano na slici 4. Ovim modelom prati se struktura matematičkog modela (tok informacija), a ne fizikalna struktura stvarnog sustava (tok energije). Za dobivanje numeričkog riješenja običnih diferencijalnih jednadžbi (5) u programu Matlab/Simulink korištena je funkcija ode45, kojom se implementira Runge-Kutta metoda s promijenjivim vremenskim korakom.
U podsustavu Umjetna izbocina na slici 4, definirana je pobuda koja djeluje na prednji kotač, kako je prikazano na slici 5. Umnožak brzine i vremena (v·t) je ulazni signal u Matlab funkciju (MATLAB Fcn), gdje se na temelju izraza (2) definira pobuda prednjega kotača kao:
2
1 2Lu H p vt = − −
. (6)

R. Obajdin, G. Štimac Rončević, S. Braut: Utjecaj dodatnog tereta na dinamiku polovinskog modela...Zbornik Veleučilišta u Rijeci, Vol. 8 (2020), No. 1, pp. 413-426
418
U bloku t0 definira se trenutak t0 u kojem vozilo nailazi na prepreku (u ovom radu t0 = 0.5 s). Pobuda zadnjeg kotača u2 jednaka je pobudi prednjeg kotača (u2 = u1) i vremenski je pomaknuta za iznos:
+=
a btv
, (7)
gdje su a i b udaljenosti prednjeg i zadnjeg kotača od težišta vozila, odnosno njihova suma predstavlja vrijednost međuosovinskog razmaka.
Slika 4. ½ model vozila implementiran u Matlab/ Simulink
Izvor: obrada autora, Obajdin (2017)

R. Obajdin, G. Štimac Rončević, S. Braut: Utjecaj dodatnog tereta na dinamiku polovinskog modela...Zbornik Veleučilišta u Rijeci, Vol. 8 (2020), No. 1, pp. 413-426
419
Slika 5. Podsustav – Umjetna izbocina
Izvor: Obajdin (2017)
5. REZULTATI SIMULACIJE
Da bi se istražio utjecaj dodavanja tereta na gibanje vozila prilikom prelaska preko umjetne izbočine provedene su dvije odvojene simulacije za koje su ulazni podaci dani u tablici 1. Dimenzije umjetne izbočine preuzete su iz Pravilnika (NN 92/2019) za brzine manje od 30 km/h te iznose H = 0,07 m i L = 1,2 m (slika 3).
Vertikalni pomaci i ubrzanja vozila i kotača te kutni pomaci i ubrzanja vozila pri brzini vožnje 30 km/h za 1. slučaj (bez dodane mase) prikazani su na slici 6. U 1. slučaju podrazumjeva se da ovješenu masu čine polovica mase praznog vozila i vozača. Na slici 6, su primjetne dvije vršne vrijednosti vertikalnih pomaka od kojih se prva odnosi na trenutak (t = 0,58 s) prelaska prednjeg kotača, a druga vršna vrijednost na trenutak (t = 0,92 s) prelaska zadnjeg kotača preko umjetne izbočine. Vremenski razmak između navedene dvije vršne vrijednosti iznosi 0,34 s, a uvjetovano je brzinom vozila i međuosovinskim razmakom vozila. Sa slike 6 vidljivo je kako su vertikalna ubrzanja prednjeg i zadnjeg kotača u oba slučaja znatno veća od vertikalnog ubrzanja vozila, što znači da je ovjes u velikoj mjeri smanjio prijenos vertikalnog ubrzanja s kotača na vozilo. Zbog relativnog međudjelovanja prvog kotača i ovješene mase tijekom prelaska prvog kotača preko umjetne izbočine pomak ima jednu vršnu vrijednost dok ubrzanje ima dvije vršne vrijednosti. Isto se događa i tijekom prelaska zadnjeg kotača preko umjetne izbočine. Praćenjem kutnih zakreta oko poprečne osi može se zaključiti da se ovješena masa nakon nailaska prednjih kotača na umjetnu izbočinu počinje uspinjati dok u trenutku nailaska zadnjeg kotača na umjetnu izbočinu ovješena masa počinje posrtati. Nakon prelaska zadnjeg kotača preko izbočine, ovješena masa doživljava još jedan puni prigušeni titraj kutnog pomaka nakon čega se vraća u početni horizontalni položaj. Što se tiče kutnog ubrzanja ovješene mase, ono slično vertikalnom ubrzanju doživljava više promjena nego odgovarajući kutni pomak, pri čemu su vršne vrijednosti vezane uz trenutak nailaska prvog, odnosno, drugog kotača na izbočinu puno intenzivnije u odnosu na druge vršne vrijednosti.
Ako se vozilu iz 1. slučaja doda teret mase 300 kg (npr. zbog ukrcaja putnika na sjedalo suvozača i na stražnje sjedalo te dodavanja tereta u prtljažniku) to će dovesti do pomaka centra mase vozila za 0,2 m prema zadnjem kraju vozila. U tom slučaju nove udaljenosti prednjeg i zadnjeg kotača od težišta vozila iznose redom: a = 1,4 + 0,2 = 1,6 m, b = 1,47 – 0,2 = 1,27 m.

R. Obajdin, G. Štimac Rončević, S. Braut: Utjecaj dodatnog tereta na dinamiku polovinskog modela...Zbornik Veleučilišta u Rijeci, Vol. 8 (2020), No. 1, pp. 413-426
420
Tablica 1. Ulazni podaci
Veličina 1. slučaj (bez dodane mase) 2. slučaj (s dodanom masom)m, kg 1085/2 1385/2
J, kgm2 1100/2 1317/2a, m 1,4 1,6 b, m 1,47 1,27
k1, N/m 10000 10000k2, N/m 10000 10000c1, Ns/m 1000 1000c2, Ns/m 1000 1000m1, kg 40 40m2, kg 40 40
k1t, N/m 150000 150000k2t, N/m 150000 150000
Izvor: obrada autora, Reza (2008), Kulikowki i Szpica (2014)
Slika 6. Vertikalni pomaci i ubrzanja vozila i kotača te kutni pomaci i ubrzanja vozila pri brzini vožnje 30 km/h (1. slučaj)
0 0.5 1 1.5 2 2.5 3 3.5 4-50
0
50
100
v = 30 km/hPomak kotaca i vozila na vertikalnoj osi
Pom
ak, m
m
Prednji kotac, y1
Zadnji kotac, y2
Vozilo, y
0 0.5 1 1.5 2 2.5 3 3.5 4-100
-50
0
50
100Ubrzanje kotaca i vozila na vertikalnoj osi
Ubr
zanj
e, m
/s2
Prednji kotac, ay1
Zadnji kotac, ay2
Vozilo, ay
0 0.5 1 1.5 2 2.5 3 3.5 4-30
-15
0
15
30
θ, m
rad
Kutni pomak oko poprecne osi
0 0.5 1 1.5 2 2.5 3 3.5 4-8
-4
0
4
8
t, s
ε, ra
d/s2
Kutno ubrzanje oko poprecne osi
Izvor: rad autora

R. Obajdin, G. Štimac Rončević, S. Braut: Utjecaj dodatnog tereta na dinamiku polovinskog modela...Zbornik Veleučilišta u Rijeci, Vol. 8 (2020), No. 1, pp. 413-426
421
U tablicama 2, 3 i 4 prikazana je usporedba maksimalnih apsolutnih vrijednosti promatranih veličina (vertikalnih pomaka i ubrzanja vozila i kotača te kutnih pomaka i ubrzanja vozila) u oba slučaja (bez i s teretom) pri brzinama vožnje 20 km/h, 30 km/h i 50 km/h, respektivno. Dobar uvid u utjecaj dodatnog tereta na gibanje vozila može se dobiti promatranjem postotnog odstupanja maksimalnih vrijednosti u slučaju bez i sa dodanim teretom. Najveća se odstupanja javljaju kod vertikalnih pomaka (–21.75%, –3.39%, –16.84%) i vertikalnih ubrzanja (–22.13%, –20.98%, –24.01%) vozila te kutnih pomaka (–8.31%, –11.69%, –2.15%) i kutnih ubrzanja vozila (–5.96%, –6.47%, –6.06%). To je pokazatelj učinkovitosti ovjesa, koji je u ovom slučaju gotovo u potpunosti smanjio prijenos vertikalnog gibanja s kotača na vozilo. Najveća odstupanja vertikalnih pomaka i vertikalnih ubrzanja vozila uočeni su pri brzinama vožnje za koje nije projektirana izbočina (20 km/h i 50 km/h), dok se najveći kutni pomaci i kutna ubrzanja javljaju pri brzini 30 km/h. Vremenski odzivi veličina s najizraženijim odstupanjima, odnosno, vertikalnih pomaka i ubrzanja vozila te kutnih pomaka i ubrzanja vozila, kod brzina vožnje 30 i 50 km/h, prikazani su na slikama 7 i 8, respektivno.
Tablica 2. Usporedba maksimalnih vrijednosti promatranih veličina u 1. i 2. slučaju pri brzini
vožnje 20 km/h
v = 20 km/h 1. slučaj 2. slučaj
y1, mm 74,39 74,35 -0.05%
y2, mm 74,37 73,57 -1.06%
y, mm 24,88 19,47 -21.75%
ay1, m/s2 58,56 58,53 -0.05%
ay2, m/s2 58,43 58,21 -0.36%
ay, m/s2 3,38 2,63 -22.13%
θ, mrad 26,98 24,73 -8.31%
, rad/s2 4,43 4,16 -5.96%
Izvor: rad autora

R. Obajdin, G. Štimac Rončević, S. Braut: Utjecaj dodatnog tereta na dinamiku polovinskog modela...Zbornik Veleučilišta u Rijeci, Vol. 8 (2020), No. 1, pp. 413-426
422
Tablica 3. Usporedba maksimalnih vrijednosti promatranih veličina u 1. i 2. slučaju pri brzini vožnje 30 km/h
v = 30 km/h 1. slučaj 2. slučaj
y1, mm 87,23 87,19 -0.05%
y2, mm 88,22 86,98 -1.41%
y, mm 18,13 17,42 -3.93%
ay1, m/s2 76,57 76,55 -0.03%
ay2, m/s2 76,87 76,75 -0.16%
ay, m/s2 4,09 3,23 -20.98%
θ, mrad 22,48 19,85 -11.69%
, rad/s2 5,42 5,07 -6.47%Izvor: rad autora
Tablica 4. Usporedba maksimalnih vrijednosti promatranih veličina u 1. i 2. slučaju pri brzini vožnje 50 km/h
v = 50 km/h 1. slučaj 2. slučaj
y1, mm 94,64 94,60 -0.04%
y2, mm 95,75 94,40 -1.41%
y, mm 18,18 15,12 -16.84%
ay1, m/s2 179,80 179,80 0.00%
ay2, m/s2 179,09 180,17 0.60%
ay, m/s2 8,00 6,08 -24.01%
θ, mrad 12,95 12,67 -2.15%
, rad/s2 10,69 10,04 -6.06%
Izvor: rad autora
Kod brzina 20 i 50 km/h utjecaj promjene opterećenja mase vozila ima izraženije posljedice u smislu promjene vertikalnih pomaka (–21,75 %, –16,84 %) ovješene mase, y, dok se kod brzine 30 km/h uočava da promjena opterećenja vozila ima gotovo zanemariv utjecaj na vertikalne pomake ovješene mase (–3,93 %). Iz navedenoga slijedi; ako se vozilo giba sa brzinom za koji je izbočina projektirana tada promjena opterećenja vozila nema značajniji utjecaj na promjenu odziva ovješene mase. Treba napomenuti da su predmet usporedbe bile apsolutne veličine kinematičkih veličina te da kod različitih brzina vozila i različitih kinematičkih odziva ovjesa (vertikalni i kutni pomaci i ubrzanja) one mogu biti vezane ili uz trenutak prelaska prednjih ili uz trenutak prelaska

R. Obajdin, G. Štimac Rončević, S. Braut: Utjecaj dodatnog tereta na dinamiku polovinskog modela...Zbornik Veleučilišta u Rijeci, Vol. 8 (2020), No. 1, pp. 413-426
423
zadnjih kotača preko umjetne izbočine. Osim toga, predmet usporedbe mogu biti maksimalne apsolutne vrijednosti pozitivnih ili negativnih vrijednosti. Iz toga može se zaključiti da u relativnoj usporedbi ne uspoređujemo uvijek iste pod-događaje niti iste ekstreme odziva (min, max) iz čega proizlaze i odstupanja od očekivanih intuitivnih trendova.
Slika 7. Usporedba vertikalnih i kutnih pomaka i ubrzanja vozila pri brzini vožnje 30 km/h u 1. i 2. slučaju (puna linija: bez dodane mase, crtkana linija: s dodanom masom)
0 0.5 1 1.5 2 2.5 3 3.5 4-10
0
10
20Pomak vozila na vertikalnoj osi
y, m
m
0 0.5 1 1.5 2 2.5 3 3.5 4-8
-4
0
4
8Ubrzanje vozila na vertikalnoj osi
a y, m/s
2
0 0.5 1 1.5 2 2.5 3 3.5 4-25
-12.5
0
12.5
25
θ, m
rad
Kutni pomak oko poprecne osi
0 0.5 1 1.5 2 2.5 3 3.5 4-12
-6
0
6
12
t, s
ε, ra
d/s2
Kutno ubrzanje oko poprecne osi
Izvor: rad autora

R. Obajdin, G. Štimac Rončević, S. Braut: Utjecaj dodatnog tereta na dinamiku polovinskog modela...Zbornik Veleučilišta u Rijeci, Vol. 8 (2020), No. 1, pp. 413-426
424
Slika 8. Usporedba vertikalnih i kutnih pomaka i ubrzanja vozila pri brzini vožnje 50 km/h u 1. i 2. slučaju (puna linija: bez dodane mase, crtkana linija: s dodanom masom)
0 0.5 1 1.5 2 2.5 3 3.5 4-10
0
10
20Pomak vozila na vertikalnoj osi
y, m
m
0 0.5 1 1.5 2 2.5 3 3.5 4-8
-4
0
4
8Ubrzanje vozila na vertikalnoj osi
a y, m/s
2
0 0.5 1 1.5 2 2.5 3 3.5 4-20-10
01020
θ, m
rad
Kutni pomak oko poprecne osi
0 0.5 1 1.5 2 2.5 3 3.5 4-12
-6
0
6
12
t, s
ε, ra
d/s2
Kutno ubrzanje oko poprecne osi
Izvor: rad autora
6. ZAKLJUČAK
U ovom radu opisan je matematički model vozila s četiri stupnja slobode gibanja te postupak modeliranja umjetne izbočine. Matematički model vozila, odnosno, diferencijalne jednadžbe gibanja vozila dobivene su primjenom 2. Newtonovog zakona. Za izabrani tip automobila, provedene su numeričke simulacije u računalnom programu Matlab/Simulink kako bi se pokazao utjecaj dodatnog tereta na gibanje vozila pri prelasku preko umjetne izbočine. Usporedbom pomaka i ubrzanja vozila i kotača u slučaju bez i s teretom kod tri brzine vožnje (20 km/h, 30 km/h i 50 km/h) pokazano je da dodavanje tereta smanjuje vertikalne i kutne pomake i ubrzanja vozila, dok nema značajnijeg utjecaja na pomake i ubrzanja kotača. To je pokazatelj učinkovitosti ovjesa, koji je u promatranom slučaju gotovo u potpunosti smanjio prijenos gibanja s kotača na vozilo.
R. Obajdin, G. Štimac Rončević, S. Braut: Utjecaj dodatnog tereta na dinamiku polovinskog modela...Zbornik Veleučilišta u Rijeci, Vol. 8 (2020), No. 1, pp. 413-426
425
LITERATURANN 92/2019, Pravilnik o prometnim znakovima, signalizaciji i opremi na cestama, Ministarstvo mora, prometa i
infrastrukture
Kulikowski, K., Szpica, D. (2014) Determination of directional stiffnesses of vehicles’ tires under a static load operation. Eksploatacja i Niezawodnosc – Maintenance and Reliability; 16 (1): 66–72.
Obajdin, R. (2017) Modeliranje i simulacija ½ modela ovjesa, Završni rad, Rijeka: Sveučilište u Rijeci, Tehnički fakultet
Popović, G. (preveo) (2006) Tehnika motornih vozila, Hrvatska obrtnička komora, Pučko otvoreno učilište Zagreb, Zagreb
Radelja, H., Žigulić, R., Braut, S. (2007) Numerical Simulation of the Vehicle Passage over the Obstacles on the Road, Engineering review, 27 (2), 93-101
Reza, N. J. (2008) Vehicle Dynamics: Theory and Application, Springer
Shahriar, A., Rahman, K. A., Tanvir, S. (2016) Simulation and analysis of half-car passive suspension system, Mechanical Engineering Research Journal, 10, 66-70
Shelke, G. D., Mitra, A. C., Varude, V. R. (2018) Validation of Simulation and Analytical Model of Nonlinear Passive Vehicle Suspension System for Quarter Car, materialstoday: PROCEEDINGS, 5-9 (3), 19294-19302
Shelke, G. D., Mitra, A. C. (2018) Analysis and Validation of Linear Half Car Passive Suspension System with Different Road Profiles, IOSR Journal of Engineering, 14-19.

R. Obajdin, G. Štimac Rončević, S. Braut: Utjecaj dodatnog tereta na dinamiku polovinskog modela...Zbornik Veleučilišta u Rijeci, Vol. 8 (2020), No. 1, pp. 413-426
426
Professional paper https://doi.org/10.31784/zvr.8.1.26 Received: 6. 12. 2019. Accepted: 3. 2. 2020.
THE INFLUENCE OF ADDITIONAL WEIGHT ON HALF CAR SUSPENSION DYNAMICS WHEN DRIVING
ACROSS ARTIFICIAL BUMPSRobert Obajdin
Bacc. ing. mech., Faculty of Engineering, University of Rijeka, 51000 Rijeka, Croatia; e-mail: [email protected]
Goranka Štimac Rončević PhD, Assistant Professor, Faculty of Engineering, University of Rijeka, 51000 Rijeka, Croatia;
e-mail: [email protected]
Sanjin Braut PhD, Full Professor, Faculty of Engineering, University of Rijeka, 51000 Rijeka, Croatia;
e-mail: [email protected]
ABSTRACTIn this paper a mathematical model of a vehicle with four degrees of freedom i.e. half vehicle model and a procedure for modelling artificial bumps are described. The dimensions of the artificial bumps are prescribed by the Rulebook and depend on speed limits. To show the influence of additional cargo on vehicle movement when driving across artificial bumps, for the selected type of car, required numerical simulations are carried out. All numerical simulations are carried out in the Matlab/Simulink software package. The simulation results are presented in the table form, where the comparison of the maximum values of vehicle and wheel displacements and accelerations for three vehicle speeds (v = 20 km/h, v = 30 km/h and v = 50 km/h) and for two cases, i.e. without and with additional cargo, is given. Vertical and angular displacements and accelerations of the vehicle are also shown in the time domain for speeds 30 and 50 km/h.
Key words: vehicle suspension dynamics, additional weight, artificial bumps, numerical simulation
Creative Commons Attribution – NonCommercial 4.0 International License

B. Rudić, E. Gržin: Razvoj kontejnerizacije u svijetu i analiza kontejnerskog prometa u luci RijekaZbornik Veleučilišta u Rijeci, Vol. 8 (2020), No. 1, pp. 427-442
427
Stručni rad https://doi.org/10.31784/zvr.8.1.6 Datum primitka rada: 15. 12. 2019. Datum prihvaćanja rada: 19. 2. 2020.
RAZVOJ KONTEJNERIZACIJE U SVIJETU I ANALIZA KONTEJNERSKOG PROMETA U LUCI RIJEKA
Barbara Rudić Mag. oec., viši predavač, Veleučilište u Rijeci, Vukovarska 58, 51 000 Rijeka, Hrvatska;
e-mail: [email protected]
Erika Gržin Struč. spec. ing. traff., predavač, Veleučilište u Rijeci, Vukovarska 58, 51 000 Rijeka, Hrvatska;
e-mail: [email protected]
SAŽETAKKontejnerizacija je utjecala na razvoj međunarodne trgovine, te je postala nezamjenjiv oblik prijevoza robe, spajajući pomorski, cestovni i željeznički prijevoz u cjeloviti transportni lanac. Stoga je cilj ovog rada ukazati na važnost kontejnerizacije, prikazati stanje kontejnerskog prometa u svijetu i analizirati kontejnerski promet u Hrvatskoj na primjeru luke Rijeka. Rad sadržava razvoj kontejnerizacije te pokazatelje vezane za promet kontejnera u najvećim svjetskim morskim lukama, kao i pokazatelje najvećih kontejnerskih brodara. U radu je naglašena važnost glavnih elemenata kontejnerizacije te ostali sudionici u sustavu kontejnerizacije. Prikupljeni podaci analizirani su primjenom metoda deskriptivne statističke analize. Rezultati pokazuju konstantni rast svih elemenata kontejnerizacije na svjetskoj razini. Na razini Hrvatske, na primjeru luke Rijeka, također su vidljivi pozitivni rezultati na području kontejnerskog prometa.
Ključne riječi: razvoj kontejnerizacije, kontejnerski promet, kontejnerski brod, luka Rijeka, analiza
1. UVOD
Kontejnerizacija i kontejnerski promet doživjeli su u posljednjih nekoliko desetljeća veliku transformaciju i razvoj. Uvođenje tehnoloških inovacija i standardizacija dimenzija kontejnera omogućili su učinkovitiji prijevoz različitih vrsta tereta, te je kontejnerizacija postala nezamjenjiv oblik prijevoza robe u međunarodnom pomorskom i kopnenom prometu.
Pregled literature upućuje na različita istraživanja prema kojima kontejnerizacija i promet kontejnera pozitivno utječu na razvoj trgovine, ekonomski rast, razvoj lučke infrastrukture i logističke procese (Heaver, 2002., Bernhofen et al. 2016.). Nadalje, prema Hlali i Hammami (2019.), kontejnerizacija čini 80 % ukupnog prijevoza robe morem, te ima značajnu ulogu u svjetskoj međunarodnoj trgovini.
Creative Commons Attribution – NonCommercial 4.0 International License

B. Rudić, E. Gržin: Razvoj kontejnerizacije u svijetu i analiza kontejnerskog prometa u luci RijekaZbornik Veleučilišta u Rijeci, Vol. 8 (2020), No. 1, pp. 427-442
428
U posljednjem je desetljeću u domaćoj literaturi objavljeno nekoliko radova povezanih s konceptom kontejnerizacije. Tako su Kos et al. (2010) analizirali relevantne parametre kontejnerskih morskih luka Rijeka, Split i Ploče. Slično, Zelenika et al. (2011) analizirali su uspješnost poslovanja teretnih morskih luka u Hrvatskoj. Rudić et al. (2013) istraživali su probleme funkcioniranja lučkog sustava i poslovanja kontejnerskog terminala na primjeru luke Rijeka. O značajkama kontejnerskih brodova i njihovom razvoju pisali su Erak et al. (2015), Mišković et al. (2016) i Vladimir et al. (2017).
Cilj ovog rada je ukazati na važnost kontejnerizacije, prikazati stanje kontejnerskog prometa u svijetu i analizirati kontejnerski promet u Hrvatskoj na primjeru luke Rijeka. U tu su svrhu korišteni sekundarni podaci objavljeni u tiskanim publikacijama i na internetu. Analiza prikupljenih podataka temelji se na primjeni metoda deskriptivne statističke analize.
Rad je strukturiran kako slijedi. Nakon uvodnog dijela s kratkim pregledom dosadašnjih istraživanja koncepta kontejnerizacije, slijedi teorijsko opredjeljenje osnovnih pojmova vezanih uz glavnu temu rada. U nastavku rada analiziran je kontejnerski promet u svijetu i u Hrvatskoj na primjeru luke Rijeka. Na kraju su predstavljeni glavni zaključci i prijedlozi za buduća istraživanja.
2. TEORIJSKO OPREDJELJENJE OSNOVNIH POJMOVA I RAZVOJ KONTEJNERIZACIJE
2. 1 Razvoj kontejnerizacije
Naziv kontejner potječe od engleske riječi „container“ (contain-sadržavati) a znači sve ono što u sebi može sadržavati nešto drugo.
„Kontejner je manipulativna prijevozna oprema, najčešće u obliku zatvorene posude, koja služi za formiranje krupnih manipulativnih jedinica tereta u cilju racionalizacije manipulacijskih i skladišnih operacija“ (www. prometna-zona.com/kontejneri-i-kontejnerizacija/).
Proizvodnja kontejnera iz godine u godinu ima sve veći uzlazni trend razvoja, kako po broju, tako i po opsegu, ali i po sve većoj suvremenosti. Godišnja proizvodnja iznosi oko 700 tisuća kontejnera raznih dimenzija i namjena. Samo u pomorskom brodarstvu sada u svijetu ima oko 9 milijuna TEU kontejnera.
Sve se više proizvode veći kontejneri (iznad 40 stopa), i to od 45, 48, 53 i 60 stopa.
U početku i polovicom osamdesetih godina proizvodnja kontejnera premještena je sa Zapada na Daleki istok, posebice Republiku Koreju, koja je imala komparativne prednosti u odnosu na ostale zemlje tržišne ekonomije.
Kontejnerizacija pomorskog i kopnenog prometa ne može postojati bez određenog sustava kontejnera. Osim kontejnera za kontejnerizaciju prometa potrebna su prekrcajna sredstva te ostala potrebna oprema za podešavanje i privez kontejnera u toku prijevoza.
Formiranje, funkcioniranje i održavanje potrebnog i stabilnog sustava kontejnera, vrlo su značajna pitanja i temeljne pretpostavke za uspješnu kontejnerizaciju.

B. Rudić, E. Gržin: Razvoj kontejnerizacije u svijetu i analiza kontejnerskog prometa u luci RijekaZbornik Veleučilišta u Rijeci, Vol. 8 (2020), No. 1, pp. 427-442
429
Kapaciteti kontejnerskih brodova , kontejnerski terminali i kontejnerski depoi značajno utječu na optimalno stanje i funkcioniranje sustava kontejnera svakog kontejnerskog brodara.
Kontejnerizacija nekog kontejnerskog servisa, veličina brodova, kao i poteba za vrstom kontejnera na nekoj razini definiraju potrebu za brojem kontejnera i vrstom kontejnera.
Uz ostalo vrlo značajno pitanje predstavlja i struktura sustava kontejnera nekog brodara prema vlasništvu. Tako su nekada u počecima kontejnerizacije prijevoznici u pomorskom i željezničkom prometu imali pretežito vlastite kontejnere, što je zahtijevalo velike investicije u vlastite kontejnere te posebice probleme oko praćenja i prebacivanja te skladištenja praznih vlastitih kontejnera.
U novije vrijeme u svijetu su se formirale posebne velike kompanije koje se bave davanjem kontejnera u zakup na određeno putovanje, nakon čega se prazni kontejneri na odredištu prepuštaju vlasniku kontejnera.
Zbog održavanja stabilnog sustava kontejnera, kontejnerski brodovi imaju službu za praćenje kontejnera. Dobro organizirana služba praćenja kontejnera podrazumjeva sposobne i iskusne kadrove kao i suvremenu opremu koja osigurava dobru povezanost sa brodovima te posebice sa kontejnerskim terminalima u svijetu te povezanost sa poslovnim partnerima po pitanju stanja i kretanja kontejnera.
Sustav kontejnerskog prometa privlači veliku pozornost jer je to jedan od vrlo značajnih oblika suvremenih tehnologija prometa, a nekoliko zadnjih desetljeća kontejnerizacija ima iznimno značanje u prijevozu robe od proizvođača do potrošača.
Sustav kontejnerskog prometa je složeni sustav koji osigurava brz i racionalan prijevoz roba širom svijeta. Velike prednosti kontejnerskog prijevoza temelje se na sustavu kontejnera, normizaciji prijevoznih sredstava, te raznim prekrcajnim sredstvima na kontejnerskim terminalima.
2. 2 Važnost i prednosti kontejnerizacije
Analizirajući brzi razvoj kontejnerizacije zadnjih desetljeća u svijetu i značenje kontejnerizacije za razvoj svjetske trgovine mnogi stručnjaci i znanstvenici istražuju elemente koji su doprinjetli razvoju i širenju kontejnerizacije. Nakon analize došlo se do zaključka da postoji veliki broj prednosti koje su dovele do tako naglog razvoja kontejnerizacije. Od brojnih prednosti, posebno se u teoriji razvoja kontejnerizacije mogu navesti neke, kao što su:
- brzina prijevoza kontejnera
- sigurnost prijevoza tereta
- integracija svih oblika tereta
- ekonomičnost prijevoza
- primjena suvremenih strategija prometa i logistike
- spoznaje o mogućnosti razvoja kontejnerizacije u budućnosti

B. Rudić, E. Gržin: Razvoj kontejnerizacije u svijetu i analiza kontejnerskog prometa u luci RijekaZbornik Veleučilišta u Rijeci, Vol. 8 (2020), No. 1, pp. 427-442
430
Zahvaljujući osnovnim obilježjima i prednostima kontejnerizacije, došlo je do širenja kontejnerizacije, naročito u pomorskom prijevozu. Počeli su se graditi sve veći i složeniji kontejnerski brodovi. Na taj način stvoreni su brodski kapaciteti koji omogućuju kontejnerski prijevoz raznih vrsta tereta, među kojima i onih tereta koji su u početku kontejnerizacije smatrani nepogodnima za kontejnerski pomorski prijevoz (Rudić, 1997:74).
Kontejnerizacija u pomorskom prometu omogućila je okrupnjavanje tereta ili robe u velike standardne transportne jedinice i omogućila velike učinke u rukovanju s robom što je smanjilo vrijeme boravka linijskih kontejnerskih brodova u lukama, što je dugo vremena bio jedan od glavnih problema linijskog brodarstva.
Analizirajući naglo širenje i afirmaciju kontejnerizacije, treba naglasiti veliki doprinos međunarodnih i nacionalnih organizacija koje definiraju standarde, označavanje i evidenciju kontejnera. Osim navedenog međunarodne organizacije definiraju procese i dokumentaciju u prijevozu kontejnera.
Velika važnost razvoja kontejnerizacije sastoji se i u realizaciji suvremenih ekonomskih i logističkih strategija, kao što su brzina, sigurnost, racionalnost prijevoza, dostava robe od vrata do vrata i druge.
Razvoj kontejnerizacije na globalnoj razini najbolje predstavljaju glavni elementi kontejnerizacije koji se daju i analiziraju u narednim podtočkama ovoga poglavlja.
2. 3 Kontejnerski brodovi
Od svojih početaka dizajn brodova za prijevoz kontejnera se mijenjao tijekom vremena prateći potrebe tržišta i razvoj tehnologije (Mišković, et al., 2016.). Da bi se ostvarile sve velike prednosti kontejnerizacije na svjetskoj razini, bilo je nužno napraviti preokret u gradnji i konstrukciji kontejnerskih brodova. Analizom razvoja linijskih brodova za generalne terete u pomorskom prijevozu, može se zaključiti da su ti brodovi imali velike probleme na području brzine, sigurnosti i dobrog korištenja kapaciteta. Svi zahvati i poboljšanja tokom vremena nisu davali značajnije rezultate, posebice pokušaji da se linijski brodovi kraće zadržavaju u lukama.
Izgradnja potpuno kontejnerskih brodova velikog kapaciteta i velike brzine kao i osiguranje velikih prekrcajnih mogućnosti na dobro opremljenim pomorskim terminalima doveli su do prave revolucije u pomorskom prijevozu te ukupnom prijevozu robe širom svijeta.
Uvođenje u pomorski promet velikih i skupih kontejnerskih brodova tražilo je izgradnju novih lučkih terminala kao i nabavku novih i skupih prekrcajnih sredstava, kao što su velike dizalice i brojna mehanizacija za rukovanje s kontejnerima na kontejnerskom terminalu.
Upravo zbog novih koncepcija i velikih financijskih ulaganja nije bilo stručnjaka u morskom brodarstvu i morskim lukama koji su mogli zamisliti tako brzi razvoj kontejnerskih brodova prije pedeset godina.
Danas svjetsku kontejnerizaciju označavaju veliki i brzi kontejnerski brodovi, kontejnerski terminali u lukama, velike specijalne dizalice koje su izmjenile izgled velikih morskih luka u svijetu.

B. Rudić, E. Gržin: Razvoj kontejnerizacije u svijetu i analiza kontejnerskog prometa u luci RijekaZbornik Veleučilišta u Rijeci, Vol. 8 (2020), No. 1, pp. 427-442
431
2. 4 Kontejnerski terminali
Pomorski terminali kao mjesto povezivanja pomorskog i kopnenog prijevoza imaju veliko značenje u razvoju sustava kontejnerizacije te mogu predstavljati ograničavajući faktor funkcioniranja suvremenih tehnologija prometa.
U novije vrijeme posebice se razvijaju kontejnerski terminali u velikim pomorskim lukama svijeta koji ne mogu izdržati konkurenciju bez stalnoga razvoja novih oblika i strukture terminala te posebice bez potrebne opreme. Povezivanje terminala s okruženjem, automatizacija i informatika predstavljaju uvijet uspješnog funkcioniranja najvećih lučkih i kontejnerskih terminala. Zbog toga kontejnerski terminali zahtjevaju neprestano istraživanje i usvršavanje.
Zbog unaprijeđenja tradicionalnih dokumentarnih procedura koje postaju zapreka ubrzanog i efikasnog poslovanja te komuniciranja razvija se suvremeni informacijski sustav koji osigurava komuniciranje između računarskih sustava na različitim mjestima na kopnu i brodovima. Upravo zahtjeve logistike potpuno zadovoljavaju kontejnerski terminali, posebice oni pomorski, locirani u lukama.
Lučki kontejnerski terminal dio je lučkog sustava koji predstavlja posebno izgrađen i opremljen objekt namjenjen prekrcaju kontejnera izravnim ili posrednim rukovanjem između morskih brodova i kopnenih prijevoznih sredstava. Kontejnerski terminal povezuje najmanje dva prometna sustava, a za uspješno odvijanje procesa upotrebljavaju se specijalizirana prekrcajna sredstva.
Razvitkom pomorskih kontejnerskih i multimodalnih centara na kopnu omogućuje se stvaranje cjelovite mreže terminala koja je ugrađena u jedinstveni prometni sustav koncipiran na logističkim načelima. Tako koncipirani prometni tokovi na jednom mjestu predstavljaju najvažnije infrastrukturne objekte ukupne logistike, čiji nedostatak u novije vrijeme stvara velike probleme u funkcioniranju gospodarstva mnogih zemalja, a posebice onih koje imaju značajan geoprometni položaj.
2. 5 Željeznički i cestovni promet u funkciji kontejnerizacije
Imajući na umu složeni sustav kontejnerizacije i njegove glavne elemente, može se zaključiti da elementi željezničkog i cestovnog prometa imaju značaj početnih i završnih elemenata kontejnerizacije bez kojih nema cjelovitog sustava kontejnerizacije. Polazeći od standardizacije pojedinih oblika kontejnerizacije i potrebe povezivanja svih elemenata, željeznički i cestovni promet zaslužuju posebnu pozornost i stalno istraživanje.
Analizom željezničkog i cestovnog prometa treba naglasiti razvoj kontejnerskih kopnenih terminala te sustav kontejnerskih vlakova i kamionskih vlakova. Budući da se većina kopnenih kontejnerskih terminala nalazi u čvorištima željezničkih i cestovnih prometnica sa jakim gravitacijskim zaleđem, oni se danas najčešće izgrađuju kao željezničko-cestovni kontejnerski terminali.
U sustavu željezničkog i cestovnog prometa, željezničko-cestovni suvremeni terminali trebaju zadovoljiti postojeće potrebe te osigurati daljnji fazni razvoj kontejnerizacije. Osim terminala,

B. Rudić, E. Gržin: Razvoj kontejnerizacije u svijetu i analiza kontejnerskog prometa u luci RijekaZbornik Veleučilišta u Rijeci, Vol. 8 (2020), No. 1, pp. 427-442
432
najvažnije specifične značajke željezničkog transporta i prometa su željeznička infrastruktura i željeznička suprastruktura.
Analizirajući osnovne značajke glavnih elemenata kontejnerizacije, treba naglasiti da nema uspješne kontejnerizacije bez standardizacije, unifikacije i povezivanja svih glavnih elemenata kontejnerizacije.
Upravo sve navedeno govori u prilog visokoj razini kontejnerizacije u razvijenim zemljama svijeta te pokazuje manje razvijenim zemljama kako trebaju razvijati i afirmirati glavne elemente kontejnerizacije.
Osim glavnih elemenata kontejnerizacije, treba naglasiti i ostale logističke djelatnosti u vezi s transportom i prometom kao što su djelatnosti međunarodnog špeditera, djelatnosti morskih luka, djelatnosti lučkih slagača, djelatnosti skladišta i terminala, djelatnosti carinskih skladišta, djelatnosti slobodnih zona, djelatnosti robnotransportnih centara, djelatnosti robnodistribucijskih centara, djelatnosti robnotrgovinskih centara, djelatnosti logističkih centara, djelatnosti pomorskih agenata, djelatnosti izvršitelja ugovorne kontrole, djelatnosti osiguravajućih društava, djelatnosti tijela državne uprave, ostale logističke djelatnosti.
3. STANJE KONTEJNERSKOG PROMETA U SVIJETU
Svjetska pomorska trgovina izražena u prevezenim kontejnerima vrlo je značajan pokazatelj stanja kontejnerskog prometa u svijetu. Analizirajući promet kontejnera tijekom godina može se zaključiti stalni rast prevezenoga tereta u kontejnerima. Zbog toga znanstvenici i stručnjaci postavljaju pitanje što je to u kontejnerima da osiguravaju tako značajno širenje i afirmaciju. Kontejnerski promet je specifičan u odnosu na prijevoz roba na konvencionalne načine u tome što ima na raspolaganju različite standardizirane kontejnere od 20, 40, 45, 48 i 56 stopa, u koje se mogu ukrcavati, transportirati i iskrcavati tereti.
Osim toga u novije vrijeme specijalne robe se prevoze u posebnim ili specijalnim standardnim kontejnerima koji osiguravaju siguran i brz prijevoz roba od vrata do vrata.
Sve navedeno, uz prije navedene važnosti i prednosti kontejnerizacije osigurava prijevoz velikih količina roba u međunarodnoj pomorskoj trgovini i razmjeni.
Količine prevezenih roba u kontejnerima u međunarodnoj robnoj razmjeni u zadnjih nekoliko desetljeća navode se u tablici 1.

B. Rudić, E. Gržin: Razvoj kontejnerizacije u svijetu i analiza kontejnerskog prometa u luci RijekaZbornik Veleučilišta u Rijeci, Vol. 8 (2020), No. 1, pp. 427-442
433
Tablica 1. Svjetska pomorska trgovina prevezenog tereta u kontejnerima 1980-2017. godine
Godina Promet tereta u kontejnerima / Milijuni tona
1980. 102
1985. 152
1990. 234
1995. 371
2000. 598
2005. 1 001
2010. 1 291
2015. 1 660
2016. 1 734
2017. 1 834
Izvor: www.statista.com (30. 11. 2019.), obrada autora
Iz tablice 1 vidljiv je prijevoz i porast prevezenih roba u razdoblju 1980. do 2017. godine.
Evidentan porast prevezenih količina tereta posljedica je neprekidnog ulaganja u kontejnerski promet i njegove glavne elemente. Sukladno razvoju svjetske pomorske trgovine i kontejnerizacije potrebno je posvetiti posebnu pažnju prometu kontejnera u najvećim svjetskim kontejnerskim lukama.
Zbog uvida u preglednost najvećih svjetskih kontejnerskih luka i terminala u tablici 2. daje se pregled najvećih kontejnerskih luka prema broju prekrcanih kontejnera od 2014. do 2018. godine.

B. Rudić, E. Gržin: Razvoj kontejnerizacije u svijetu i analiza kontejnerskog prometa u luci RijekaZbornik Veleučilišta u Rijeci, Vol. 8 (2020), No. 1, pp. 427-442
434
Tablica 2. Promet kontejnera u 20 najvećih svjetskih kontejnerskih luka prema TEU-a od 2014. do 2018. godine
Rang LukaKoličina 2018. (milijun TEU)
Količina 2017. (u mil. TEU)
Količina 2016.(u mil. TEU)
Količina 2015.(u mil. TEU)
Količina 2014.(u mil.
TEU)
1 Šangaj, Kina 42.01 40.23 37.13 36.54 35.29
2 Singapur 36.60 33.67 30.90 30.92 33.87
3 Shenzhen, Kina 27.74 25.21 23.97 24.20 24.03
4Ningbo-
Zhoushan, Kina26.35 24.61 21.60 20.63 19.45
5 Luka Guangzhou 21.87 20.37 18.85 17.22 16.16
6Busan, Južna
Koreja21.66 20.49 19.85 19.45 18.65
7Hong Kong, SAR,
Kina19.60 20.76 19.81 20.07 22.23
8 Qingdao 18.26 18.30 18.01 17.47 16.62
9 Tianjin, Kina 16.00 15.07 14.49 14.11 14.05
10Jebel Ali, Dubai,
Ujedinjeni Arapski Emirati
14.95 15.37 15.73 15.60 15.25
11Rotterdam, Nizozemska
14.51 13.73 12.38 12.23 12.30
12Port Klang,
Malezija12.32 13.73 13.20 11.89 10.95
13Antwerpen,
Belgija11.10 10.45 10.04 9.65 8.98
14Kaohsiung, Tajvan, Kina
10.45 10.27 10.46 10.26 10.59
15 Xiamen, Kina 10.00 10.38 9.61 9.18 10.13
16 Dalian, Kina 9.77 9.70 9.61 9.45 10.13
17 Los Angeles, SAD 9.46 9.43 8.86 8.16 8.33
18Tanjung Pelepas,
Kina8.96 8.38 8.28 9.10 8.50
19Hamburg, Germany
8.73 8.86 8.91 8.82 9.73
20Long Beach,
U.S.A.8.09 7.54 6.80 7.19 6.82
Izvor: www.worldshipping.org
Podaci u tablici 2 pokazuju da se najviše svjetskog kontejnerskog prometa odvija u azijskim zemljama, pri čemu se posebno ističe dominacija kineskih luka. Od 20 svjetskih kontejnerskih luka,
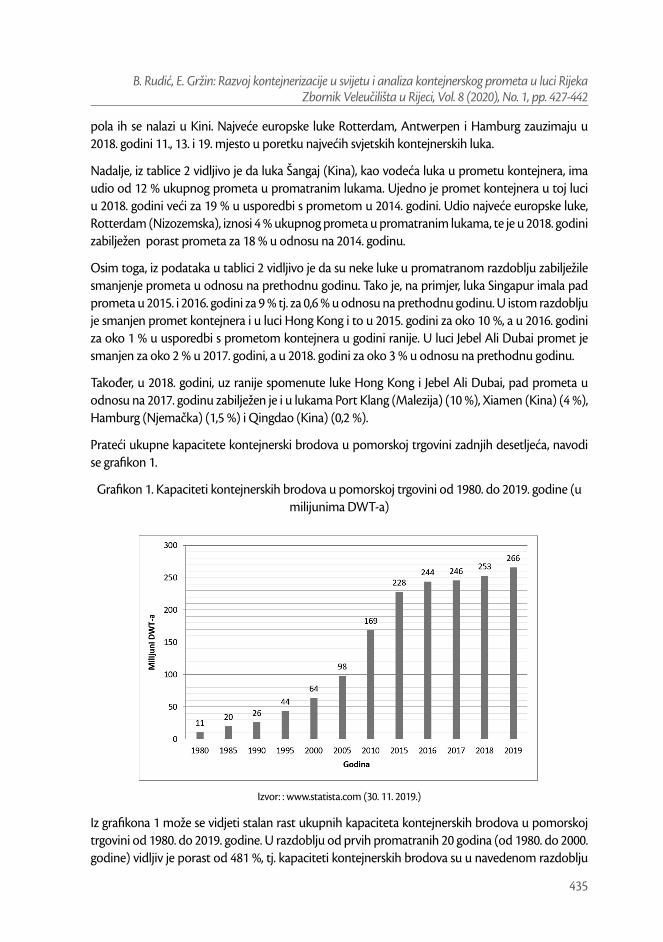
B. Rudić, E. Gržin: Razvoj kontejnerizacije u svijetu i analiza kontejnerskog prometa u luci RijekaZbornik Veleučilišta u Rijeci, Vol. 8 (2020), No. 1, pp. 427-442
435
pola ih se nalazi u Kini. Najveće europske luke Rotterdam, Antwerpen i Hamburg zauzimaju u 2018. godini 11., 13. i 19. mjesto u poretku najvećih svjetskih kontejnerskih luka.
Nadalje, iz tablice 2 vidljivo je da luka Šangaj (Kina), kao vodeća luka u prometu kontejnera, ima udio od 12 % ukupnog prometa u promatranim lukama. Ujedno je promet kontejnera u toj luci u 2018. godini veći za 19 % u usporedbi s prometom u 2014. godini. Udio najveće europske luke, Rotterdam (Nizozemska), iznosi 4 % ukupnog prometa u promatranim lukama, te je u 2018. godini zabilježen porast prometa za 18 % u odnosu na 2014. godinu.
Osim toga, iz podataka u tablici 2 vidljivo je da su neke luke u promatranom razdoblju zabilježile smanjenje prometa u odnosu na prethodnu godinu. Tako je, na primjer, luka Singapur imala pad prometa u 2015. i 2016. godini za 9 % tj. za 0,6 % u odnosu na prethodnu godinu. U istom razdoblju je smanjen promet kontejnera i u luci Hong Kong i to u 2015. godini za oko 10 %, a u 2016. godini za oko 1 % u usporedbi s prometom kontejnera u godini ranije. U luci Jebel Ali Dubai promet je smanjen za oko 2 % u 2017. godini, a u 2018. godini za oko 3 % u odnosu na prethodnu godinu.
Također, u 2018. godini, uz ranije spomenute luke Hong Kong i Jebel Ali Dubai, pad prometa u odnosu na 2017. godinu zabilježen je i u lukama Port Klang (Malezija) (10 %), Xiamen (Kina) (4 %), Hamburg (Njemačka) (1,5 %) i Qingdao (Kina) (0,2 %).
Prateći ukupne kapacitete kontejnerski brodova u pomorskoj trgovini zadnjih desetljeća, navodi se grafikon 1.
Grafikon 1. Kapaciteti kontejnerskih brodova u pomorskoj trgovini od 1980. do 2019. godine (u milijunima DWT-a)
Izvor: : www.statista.com (30. 11. 2019.)
Iz grafikona 1 može se vidjeti stalan rast ukupnih kapaciteta kontejnerskih brodova u pomorskoj trgovini od 1980. do 2019. godine. U razdoblju od prvih promatranih 20 godina (od 1980. do 2000. godine) vidljiv je porast od 481 %, tj. kapaciteti kontejnerskih brodova su u navedenom razdoblju

B. Rudić, E. Gržin: Razvoj kontejnerizacije u svijetu i analiza kontejnerskog prometa u luci RijekaZbornik Veleučilišta u Rijeci, Vol. 8 (2020), No. 1, pp. 427-442
436
porasli 4,8 puta. Veliko petogodišnje povećanje vidljivo je u razdoblju od 2005. do 2010. godine i to za 72 %. Nakon 2015. godine rast kapaciteta kontejnerskih brodova se usporio, te je u 2019. godini zabilježen porast kapaciteta od 17 % u odnosu na 2015. godinu. Promatrajući razdoblje od 2015. godine do danas, kapaciteti kontejnerskih brodova su se u prosjeku povećavali za 8,5 milijuna DWT-a godišnje.
Naglo širenje kontejnerizacije u pomorskom prometu, podrazumijeva veliki porast broja kontejnerskih brodova raznih kapaciteta. Stanje broja kontejnerskih brodova velikih svjetskih kontejnerskih brodara vidljivo je iz grafikona 2.
Grafikon 2. Vodeći kontejnerski brodari prema broju brodova na dan 30. studeni 2019. godine
Izvor: www.statista.com (30. 11. 2019.)
Prema podacima iz grafikona 2 vidljivo je da je APM-Maersk vodeći kontejnerski brodar s ukupno 707 brodova, što čini udio od oko 22 % u ukupnom broju brodova promatranih kontejnerskih brodara. Više od 500 brodova imaju još dva brodara, Mediterranean Shg Co i CMA CGM Group, svaki s udjelom od 17 % tj. 15 % u ukupnom broju brodova promatranih kontejnerskih brodara. Većina promatranih brodara ima manje od 500 brodova u svojoj floti.
Osim broja kontejnerskih brodova u svijetu, posebnu pozornost privlače i ukupni kapaciteti kontejnerskih brodara u TEU. Kapaciteti najznačajnijih kontejnerskih brodara prikazuju se na grafikonu 3.

B. Rudić, E. Gržin: Razvoj kontejnerizacije u svijetu i analiza kontejnerskog prometa u luci RijekaZbornik Veleučilišta u Rijeci, Vol. 8 (2020), No. 1, pp. 427-442
437
Grafikon 3. Vodeći svjetski kontejnerski brodari na dan 30. studeni 2019. prema kapacitetu TEU-a
Izvor: www.statista.com (30. 11. 2019.)
Podaci na grafikonu 3 pokazuju da je vodeći kontejnerski brodar APM Maersk, s ukupnim kapacitetom 4,2 mil. TEU-a. Većina najvećih brodara ima kapacitet veći od 1 mil. TEU-a.
4. ANALIZA KONTEJNERSKOG PROMETA U LUCI RIJEKA
U literaturi postoji niz istraživanja o kontejnerskim lukama, njihovom prometu, uslugama i pokazateljima poslovanja. Prema Hsu (2013), to je posljedica sve veće važnosti kontejnerskog prometa na globalnoj razini.
Ng (2006) je istraživao atraktivnost glavnih pretovarnih luka u Sjevernoj Europi, te zaključio da su najatraktivnije sjevernoeuropske luke Hamburg i Roterdam, a iza njih se nalaze Antwerpen i Bremerhaven. Notteboom (2010) u svom radu detaljno analizira promet kontejnera u europskim lukama. Urbanyi-Popiolek i Klopott (2016) istraživali su utjecaj kontejnerskih luka na lučke gradove u Poljskoj. Rezultati istraživanja su pokazali da povećanje kontejnerskog prometa u lukama ima pozitivne i negativne posljedice na urbana područja u blizini luka. Hlali i Hammami (2019) analiziraju kontejnerski promet u lukama u Alžiru, Tunisu i Maroku i zaključuju da je lučka infrastruktura osnovni nedostatak promatranih luka. Olapujo (2019) je analizirao tržišni udio kontejnerskog prometa u nigerijskim lukama. Rezultati su pokazali da luke u zapadnom dijelu države ostvaruju veći promet u odnosu na luke u istočnom dijelu države.
Zbog značenja kontejnerizacije za prometni pravac od Rijeke prema Zagrebu i Budimpešti te dostignute razine funkcioniranja kontejnerskog terminala u riječkoj luci, vrlo važno je analizirati razvoj kontejnerizacije u Rijeci i posebice kontejnerskog terminala u Rijeci.
Pod utjecajem ratnih rizika i tehnološke stagnacije kontejnerskog terminala u Rijeci te neadekvatne povezanosti riječke luke sa zaleđem, u razdoblju od 1990. do 1999. zabilježen je stalan pad prometa

B. Rudić, E. Gržin: Razvoj kontejnerizacije u svijetu i analiza kontejnerskog prometa u luci RijekaZbornik Veleučilišta u Rijeci, Vol. 8 (2020), No. 1, pp. 427-442
438
kontejnera u riječkoj luci. Tako je na kontejnerskom terminalu Brajdica u Rijeci 1999. godine ostvaren promet od samo 10.134 TEU-a.
Nakon 1999. godine započinje tehnološka i organizacijska modernizacija kontejnerskog terminala, a rezultat je toga porast prometa kontejnera već 2004. godine na 60.000 TEU-a, što je najbolje pokazalo značenje kontejnerkog terminala u sustavu kontejnerizacije i afirmacije luke Rijeka kao najznačajnije logističke i prometne točke ukupnog prometnog sustava Republike Hrvatske.
U povećanju prometa kontejnera u Rijeci bitno su sudjelovali u početku feeder servisi domaćih i stranih kontejnerskih brodara te su osim feeder servisa 2003. godine započeli riječku luku ticati veliki kontejnerski brodovi (matice) poznatih svjetskih kontejnerskih brodara koji i danas tiču kontejnersku luku.
Nakon uspješnog širenja kontejnerizacije na kontejnerskom terminalu Brajdica u Rijeci, Lučka uprava Rijeka prišla je izgradnji druge faze kontejnerskog terminala Brajdica koja je završena 2013. godine. Glavni operater na kontejnerskom terminalu Brajdica je koncesionar Jadranska vrata d.d. Druga faza izgradnje kontejnerskog terminala Brajdica uključivala je četiri komponenete Rudić et al. (2013) uključivala je:
- produženje obale 330 metara te pratećeg skladišnog prostora; izgradnja nove obale, te 50.0000 m2 površine. Završetkom izgradnje ove druge faze udvostučiti će se kapacitet skladištenja kontejnera. Nabavom dodatne prekrcajne opreme omogućio bi se istovremeni prekrcaj dvaju kontejnerskih brodova na jednoj obali.
- izgradnja novog ulazno-izlaznog punkta
- željeznička ukrcajno-iskrcajna stanica
- objekti servisnih djelatnosti
Imajući na umu strategiju širenja kontejnerizacije u svijetu Lučka upava Rijeka, razmišlja o novom kontejnerskom terminalu Zagrebačka obala u Rijeci. Tako najvažniji i najveći kapitalni projekt u sklopu Rijeka Gateway projekta je upravo izgradnja novog kontejnerskog terminala na Zagrebačkom pristaništu koji se streba realizirati kroz dvije osnovne faze. Prva faza projekta uključuje izgradnju obale dužine 400 metara i završena je 2019. godine. Lučka uprava Rijeka nastavlja javni natječaj za koncesionara koji bi bio operator na terminalu te je zamišljeno da isti nabavi i stavi u funkciju opremu terminala te je zamišljeno da se u drugoj fazi izgradnje produži terminal za 280 metara obalnog zida sa zaobaljem kako bi terminal u konačnici iznosio 680 metara dužine. Realiziranjem tog plana na Zagrebačkoj obali ukupni kapaciteti godišnji kontejnerskog terminala Zagrebačka obala iznosili bi 500.000 TEU-a. Uz navedeni terminal bitna je izgradnja ceste D403 koja bi osigurala uspješno funkcioniranje kontejnerskog terminala te doprinijela novoj kvaliteti odvijanja prometa u zapadnom dijelu grada.
U nastavku ovog dijela rada prikazat će se rezultati analize kontejnerskog prometa luke Rijeka, s obzirom na to da luka Rijeka u Hrvatskoj ima vodeću ulogu u kontejnerskom prometu. Analiza obuhvaća promet kontejnera u razdoblju od 2008. do 2018. godine.

B. Rudić, E. Gržin: Razvoj kontejnerizacije u svijetu i analiza kontejnerskog prometa u luci RijekaZbornik Veleučilišta u Rijeci, Vol. 8 (2020), No. 1, pp. 427-442
439
Tablica 3. Kontejnerski promet luke Rijeka od 2008. do 2018. godine
Godine
Kontejnerski promet
(u TEU)
Verižni indeks
Stopa promjene (%)
Bazni indeks
Stopa promjene (%)
2008. 168 761 - - 100,00 0,00
2009. 130 740 77,47 -22,53 77,47 -22,53
2010. 137 048 104,82 4,82 81,21 -18,79
2011. 150 677 109,94 9,94 89,28 -10,72
2012. 171 945 114,11 14,11 101,89 1,89
2013. 169 943 98,84 -1,16 100,70 0,70
2014. 192 004 112,98 12,98 113,77 13,77
2015. 200 102 104,22 4,22 118,57 18,57
2016. 214 348 107,12 7,12 127,01 27,01
2017. 249 975 116,62 16,62 148,12 48,12
2018. 260 375 104,16 4,16 154,29 54,29
Izvor: https://www.portauthority.hr/statistike-i-tarife/ (30. 11. 2019.), obrada autora
Iz tablice 3 vidljivo je da kontejnerski promet u luci Rijeka u promatranom razdoblju raste u svim godinama u odnosu na prethodnu, osim u 2009. i 2013. godini. U 2009. godini promet je bio u padu za 22,53 % u odnosu na 2008. godinu, što je posljedica ekonomske krize. Blagi pad prometa zabilježen je u 2013. godini i to za 1,16 % u odnosu na prethodnu godinu. Najveći porast kontejnerskog prometa u luci Rijeka u odnosu na prethodnu godinu bio je 2017. godine, kada je promet kontejnera porastao za 16,62 % u usporedbi s godinom ranije. Sličan porast prometa bio je i 2012. godine, za 14,11 % u odnosu na 2011. godinu. U 2018. godini kontejnerski promet raste za 4,16 %, što je najmanje povećanje prometa u odnosu na prethodnu godinu u promatranom razdoblju.
Osim toga, rezultati u tablici 3 pokazuju da je u odnosu na 2008. godinu, kontejnerski promet bio u padu do 2011. godine, kada je promet bio za 10,72 % manji nego u 2008. godini. Od 2012. godine kontejnerski promet bilježi pozitivne rezultate u odnosu na 2008. godinu, te se u posljednjoj promatranoj godini ostvaruje rast od 54,29 % u usporedbi s kontejnerskim prometom u 2008. godini.
Ujedno, analizirajući tendenciju kretanja kontejnerskog prometa, dolazi se do zaključka da je promet kontejnera u luci Rijeka u promatranih 10 godina rastao u prosjeku za 11.689,26 TEU-a godišnje.

B. Rudić, E. Gržin: Razvoj kontejnerizacije u svijetu i analiza kontejnerskog prometa u luci RijekaZbornik Veleučilišta u Rijeci, Vol. 8 (2020), No. 1, pp. 427-442
440
5. ZAKLJUČAK
Osnovni cilj ovog rada bio je ukazati na važnost kontejnerizacije, prikazati stanje kontejnerskog prometa u svijetu i analizirati kontejnerski promet u Hrvatskoj na primjeru luke Rijeka, kao najprometnije hrvatske kontejnerske luke.
Analizirajući sve navedeno u ovome radu, može se zaključiti kako postoji velika važnost kontejnerizacije jer kontejnerizacija kao suvremena tehnologija prometa podrazumijeva realizaciju suvremenih ekonomskih i logističkih strategija kao što su: brzina, sigurnost i racionalnost prijevoza u dostavi robe od vrata dovrata.
Stanje kontejnerskog prometa u svijetu pokazuje stalan rast. Tako je 1980. godine promet robe u kontejnerima u pomorskoj trgovini iznosio 102 milijuna tona da bi 2017. prijevoz robe u kontejnerima narastao na 1.834.000 tona.
Istraživanjem i analizom u ovome radu analizirano je 20 najvećih svjetskih kontejnerskih luka, među kojima je luka Šangaj koja je imala u 2018. godini promet od 42 milijuna TEU.
Rezultati pokazuju konstantni rast svih elemenata kontejnerizacije na svjetskoj razini. Na razini Hrvatske, na primjeru luke Rijeka, također su vidljivi pozitivni rezultati na području kontejnerskog prometa, iako su oni daleko ispod rezultata vodećih europskih kontejnerskih luka.
S obzirom na to da će dostupnost luke u smislu njenog geografskog položaja i povezanosti sa zaleđem u vidu razvijene željezničke i cestovne infrastrukture imati i dalje bitnu ulogu u privlačenju brodara i rastu prometa, u budućim bi se istraživanjima o kontejnerskom prometu trebao analizirati i utjecaj tog elementa sustava kontejnerizacije na poslovanje kontejnerskih luka. Nadalje, buduća istraživanja mogu biti usmjerena i na detaljniju analizu kontejnerskog prometa i poslovanja u svim kontejnerskim lukama u Hrvatskoj. Kako bi se utvrdila relativna važnost i uloga hrvatskih luka u okruženju, predlaže se provesti komparativna istraživanja svih elemenata kontejnerizacije u konkurentskim kontejnerskim lukama u susjednim državama.
LITERATURABernhofen, D., El-Sahli, Z., Kneller R. (2016) “Estimating the Effects of the Container Revolution on World Trade”, Journal
of International Economics, pp. 36-50. DOI: http://dx.doi.org/10.7708/ijtte.2019.9(2).05
Erak, I., Ivče, R., Komadina, P. (2015) “Suvremeni kontejnerski brodovi i fenomen parametrijskog ljuljanja”, Pomorski zbornik, 49-50(1), pp. 75-86.
Heaver, T. (2002) “The evolving roles of shipping lines in international logistics”, International journal of maritime economics, 4, pp. 210-230.
Hlali, A., Hammami, S. (2019) “The evolution of containerization and its impact on the Maghreb ports”, Annals of Marine Science, 3(1), pp. 1-5. DOI: http://dx.doi.org/10.17352/ams.000012
Hsu, W. K. K. (2013) “Improving the service operations of container terminals”, The International Journal of Logistics
Management, 24(1), pp. 101-116.
Mišković, D., Ivče, R., Popović, M. (2016) “Tehnološki razvoj kontejnerskog broda kroz povijest”, Naše more, 63(1 Supplement), pp. 9-15. https://doi.org/10.17818/NM/2016/1.8
B. Rudić, E. Gržin: Razvoj kontejnerizacije u svijetu i analiza kontejnerskog prometa u luci RijekaZbornik Veleučilišta u Rijeci, Vol. 8 (2020), No. 1, pp. 427-442
441
Ng, K. Y. (2006) “Assessing the attractiveness of ports in the North European container transhipment market: an agenda for future research in port competition”, Maritime Economics & Logistics, 8(3), pp. 234-250.
Notteboom, T. (2010) “Concentration and the formation of multi-port gateway regions in the European container port system: an update” Journal of transport geography, 18(4), pp. 567-583.
Olapoju O. M. (2019) “An Appraisal of Containerization in Ports of Western and Eastern Nigeria”, International Journal for Traffic and Transport Engineering, 9(2), pp. 188 – 197.
Rudić, D., Hlača, B., Gržin, E. (2013) “Strateške odrednice kontejnerskog prometa u riječkoj luci”, Zbornik Veleučilišta u Rijeci, 1(1), pp. 259-277.
Urbanyi-Popiolek, I., Klopott, M. (2016) “Container terminals and port city interface – a study of Gdynia and Gdańsk ports”, Transportation Research Procedia, 16, pp. 517 – 526
Vladimir, N., Malenica, Š., Senjanović, I., De Lauzon, J., Im, H., Cho, D. (2017) “Evaluation of structural design of ultra large container vessel” Rad Hrvatske akademije znanosti i umjetnosti. Tehničke znanosti, (531=18), pp. 27-46.
www.portauthority.hr/rgp-kontejnerski-terminal-jadranska vrata (2019)
www.statista.com/statistics/198214/total-teus-of-worldwide-leading-container-ship-operators-in-2011/ (2019)
www.statista.com/statistics/263291/container-shipping-companies-worldwide-number-of-ships/ (2019)
www.statista.com/statistics/267603/capacity-of-container-ships-in-the-global-seaborne-trade/ (2019)
www.worldshipping.org/about-the-industry/global-trade/top-50-world-container-ports (2019)
Zelenika, R., Mrvčić, A., Pavlić Skender, H. (2011) “Analiza I ocjena stupnja uspješnosti u poslovanju teretnih morskih luka u Republici Hrvatskoj”, Naše more, 58(1-2), pp. 9-21.

B. Rudić, E. Gržin: Razvoj kontejnerizacije u svijetu i analiza kontejnerskog prometa u luci RijekaZbornik Veleučilišta u Rijeci, Vol. 8 (2020), No. 1, pp. 427-442
442
Professional paper https://doi.org/10.31784/zvr.8.1.6 Received: 15. 12. 2019. Accepted: 19. 2. 2020.
THE DEVELOPMENT OF CONTAINERIZATION IN THE WORLD AND THE ANALYSIS OF CONTAINER TRAFFIC
IN THE PORT OF RIJEKABarbara Rudić
M Econ, Senior Lecturer, Polytechnic of Rijeka, Vukovarska 58, 51 000 Rijeka, Croatia; e-mail: [email protected]
Erika Gržin Spec. Ing. Traff., Lecturer, Polytechnic of Rijeka, Vukovarska 58, 51 000 Rijeka, Croatia;
e-mail: [email protected]
ABSTRACTContainerization has influenced the development of international trade and has become an irreplaceable transport mode combining maritime, road and rail transport in a complete transport chain. The purpose of this paper is to show the importance of containerization, to give an overview of the situation of the container traffic in the world and to analyse the container traffic in Croatia, taking Rijeka as an example. The paper focuses on the development of containerization, as well as on indicators connected with the container traffic in the world's busiest seaports together with the indicators from the largest container ship operators. The paper stresses the importance of the main elements of containerization and other participants in the system of containerization. The collected data has been analysed using descriptive statistics. The results obtained show continuous growth of all the elements of containerization on the global level. In Croatia, using Rijeka as an example, positive results are also visible in the field of container transport.
Key words: development of containerization, container traffic, container ship, port of Rijeka, analysis
Creative Commons Attribution – NonCommercial 4.0 International License

BIOTEHNIČKE ZNANOSTI


E. Štefanić, Đ. Maletić, D. Zima, I. Štefanić: Economic Evaluation of Different Strategy for Weed…Zbornik Veleučilišta u Rijeci, Vol. 8 (2020), No. 1, pp. 445-454
445
Review article https://doi.org/10.31784/zvr.8.1.5 Received: 12. 10. 2019. Accepted: 27. 12. 2019.
ECONOMIC EVALUATION OF DIFFERENT STRATEGY FOR WEED MANAGEMENT IN GARLIC PRODUCTION
Edita Štefanić PhD, Full Professor, Faculty of Agrobiotechnical sciences Osijek, V. Preloga 1, 31000 Osijek, Croatia;
e-mail: [email protected]
Đorđe Maletić Mag. Ing. Agr., OPG Đorđe Maletic, 32000 Vukovar, Croatia.
Dinko Zima Dr. sc., College Professor, Polytechnic in Požega, Vukovarska 17, 34000 Požega, Croatia.
Ivan Štefanić PhD, Full Professor, Faculty of Agrobiotechnical sciences Osijek, V. Preloga 1, 31000 Osijek, Croatia.
ABSTRACTA field experiment was conducted to evaluate various weed management options on garlic (Alium sativum L.) production in Northeastern Croatia. This study focus on how different strategies of weed control affects weed community composition and economic benefit of weed management. An experiment was arranged as a complete block design with three different weed management strategies: chemical control (PRE EM and POST EM), mechanical control (three times during the season), and combination of chemical and mechanical treatments, together with weeded checks. Data on weed density, fresh above weed biomass and garlic yield per m2 were collected at the end of the growing season, and were subjected to statistical and economic analysis. The mayor weeds found in the experimental plots were: Sorghum halepense, Ambrosia artemisiifolia, Cirsium arvense and Chenopodium album. The various weed growth (density and biomass) and yield varied with application of weed management practices. Significantly lower values of weed density and fresh above weed biomass were recorded on plots with mechanical and combination of chemical and mechanical treatments compared to weeded check. Chemical application gave in this study insufficient weed control and resulted in lower yields compared to the mechanical treatments and combination of mechanical and mechanical weed control. The best cost: benefit ratio was observed on treatment with combination of chemical and mechanical weed control and can be successfully applied to boost up the bulb yield in garlic and to harvest the maximum profit for farmers.
Key words: weed control efficacy, garlic, economic analysis
Creative Commons Attribution – NonCommercial 4.0 International License
E. Štefanić, Đ. Maletić, D. Zima, I. Štefanić: Economic Evaluation of Different Strategy for Weed…Zbornik Veleučilišta u Rijeci, Vol. 8 (2020), No. 1, pp. 445-454
446
1. INTRODUCTION
Garlic (Allium sativum L.) is an important bulbs crop worldwide, with a total production of 26.573.001 t (FAOSTAT database, 2016, http://www.fao.org/faostat/en/#home). It is still under represented in the Croatian vegetable production, although there is significant demand for this crop. According to the TISUP 2017 (www.tisup.mps.hr), garlic was cultivated in Croatia on about 3.000 ha with the average yield of 3.000kg/ha. However, the average yield of garlic is very low as compared to other leading countries due to many factors. One of the main limiting factors for garlic production is weed infestation, since weeds pose one of the most serious threats to this crop. Many researchers have reported garlic poor competition ability (Carlson and Kirby, 2005, Smith et al., 2008). Weeds compete with garlic for light, nutrients, water and space (Qasem, 1995). They are also host plants of several harmful insects and pathogens (Mishra et al., 2014, Zewde et al., 2007). Also, being a closely planted crop with very small canopy, non-branching habit, sparse foliage and shallow root system, garlic requires frequent irrigation and high fertilizer application that aid to variation in weed species and its abundance (Sahoo, et al., 2018). Moreover, according to Zimdahl (1980), garlic can tolerate weeds only up to three weeks after seedling, while Garcia et al. (1994) reported that economic threshold occurred from 61 to 74 days after transplanting during which time the crop must be kept weed free to maximize bulb yields. In Croatia, most of the farmers depend on manual labor for weeding garlic crop. This traditional method on small family farms include preparatory land tillage, hand weeding by hoe and hand pulling. The alternate method is the use of herbicides. However, weed management methods best suited for an individual grower should depend on several factors such as present weed species, crop variety and stage of growth of the crop, labor costs and availability (Bell and Boutwell, 2001.). Therefore, this study has been conducted to evaluate adequate weed management practice with the best agronomic yield and best economic benefit to the small and medium scale farmers.
2. MATERIAL AND METHODS
A field experiment was conducted at OPG (Family farm) Maletic situated in Brsadin village in Vukovar-Srijem county (Northeastern part of Croatia) during the 2018/19 growing season. This is an open and flat region with a warm and moderate to dry lowland climate (from the west to east part of the region, respectively) with an average yearly temperature 11.4 0C, and average yearly rainfall of 699 mm having the highest spring rainfall regime in June. The experiment was laid out in randomized block design with four replications and comprised of untreated control and three different weed management strategies: chemical control, mechanical control, and combination of chemical and mechanical treatments (Table 1).
All the plots have an area of 300 m2. Garlic cloves were planted on October 25th, 2018 at a rate of
2.800 kg/ha-1 after seedbed preparation in first decade of October. The previous crop was sweet corn. Before the garlic was planted, the soil was thoroughly ploughed, leveled and fertilized with recommended doses of NPK (Parađiković, 2009). Row to row and plant to plant distances were kept 30 cm and 10 cm respectively. On plots with chemical treatments pendimethalin at a dose of 2,5 l/ha-1 was sprayed 4 days after planting (DAP) and before the garlic emergence, while combination of clopyralid and fluroxypyr (0,75 + 0,75 l/ha-1) was applied post emergence in 180 DAP, when

E. Štefanić, Đ. Maletić, D. Zima, I. Štefanić: Economic Evaluation of Different Strategy for Weed…Zbornik Veleučilišta u Rijeci, Vol. 8 (2020), No. 1, pp. 445-454
447
garlic has developed 3-4 leaves. Mechanical weed control included three hand weeding during the crop season (in early, mid and late of spring 2019). Combination of chemical and mechanical weed control included PRE-EM (pendimethalin) and POST-EM application (clopyralid and fluroxypyr) of herbicides on the same dose and time as on plots with chemical treatments and one mechanical weeding in the beginning of June 2019. No weeding was done in the weeded control plots. Garlic was harvested by hand on 7th July 2019 using a small hand-hoe.
Table 1. Description of the experiment
No. Abbreviation Treatment’s description*
1 UTC Untreated control
2 Chem PRE-EM (4 DAP) and POST-EM (180 DAP)
3 Mech Three cultivations during the season
4 Chem+Mech PRE-EM (4 DAP) and POST-EM (180 DAP) + 1 cultivationSource: Author’s research object
*PRE-EM: pre emergence application of herbicide; POST-EM: post emergence application of herbicide; DAP: days after planting
Data were collected at the end of the growing season (during the harvest) after the effect of herbicides and mechanical cultivation had become evident. Remaining weed community was sampled by means of four randomly placed 1 × 1m quadrates in each plot. Weeds were cut at ground level, separated by species, counted and weight. Bulb yield from these quadrats were also recorded (in kg/m-2), and then converted to tons per ha for the economic analysis. Prior to statistical analyses the data were checked for normal distribution and homogeny of variance, and then were subjected to ANOVA using PROC GLM procedure in SAS (SAS v9.4, SAS Institute Inc., Cary, NC). The means were compared with Fisher’s Protected LSD test at the 5% level of probability. To determine the most economically acceptable treatment, a partial budget analysis was performed to estimate the gross value of the garlic bulb yield from different weed management methods. The cost of production and gross margin of each treatment was calculated considering the current rate of agricultural operations right from preparatory tillage to harvesting including cleaning as well as market prices of inputs, seeds, fertilizers, insecticides and other variable costs.
3. RESULTS AND DISCUSSION
3. 1 Weed infestation
The naturally occurring weed community found in the study area consisted of a mix of annual and perennial grasses and broadleaf weeds, common to this region (Štefanić et al., 2017). Weed community was dominated by a few species that had high relative abundance values and density (Table 2), while most of the species were of low abundance and density per square meter and with the low impact on the crop.

E. Štefanić, Đ. Maletić, D. Zima, I. Štefanić: Economic Evaluation of Different Strategy for Weed…Zbornik Veleučilišta u Rijeci, Vol. 8 (2020), No. 1, pp. 445-454
448
Table 2. Dominant weed species throughout the experimental period
Species FamilyFunctional
groups*Treatments
MF LC 1 2 3 4Elytrigia repens (L.) Nevski Poaceae M P - - + -Ambrosia artemisiifolia L. Asteraceae D A + - + +Chenopodium album L. Chenopodiaceae D A + + + -Cirsium arvense L.Scop. Asteraceae D P + - + -Myosotis arvensis (L.) Hill. Boraginaceae D A - - + -Portulaca oleracea L. Portulacaceae D A - - + -Setaria viridis (L.) P. Beauv. Poaceae M A - - + -Sinapis arvensis L. Brassicaceae D A - - + -Sorghum halepense (L.) Pers. Poaceae M P + + + +
MF- Morphotypes: M=monocotyledon; D=dicotyledon
LC- Life cycle: P=perennial; A=annual; B=biannual
Source: Author’s original work
The mayor weeds found in the experimental plots were: Sorghum halepense (Johnsongrass), Ambrosia artemisiifolia (common ragweed), Cirsium arvense (Canada thistle) and Chenopodium album (lambsquarters). Among them S. halepense and A. artemisiifolia are not only noxious weeds in the fields, but also a serious plant invaders in agricultural landscapes of the investigated region as well as in many parts of Europe (Chapman et al., 2017, Stefanic et al., 2017b). Dicot weeds were dominating more in the field than monocots, as well as annuals in relation to perennials. Weed control methods significantly affected the weed biomass and weed density (Table 3, Figure 1). Common ragweed (A. artemisiifolia) developed the significant aboveground biomass (1,95 kg/m2) and had the highest density (26 plants) per m2 on untreated control plots, followed by C. arvense and C. album. Weed control efficiency ranged from 96% and 91% (chemical + mechanical and mechanical control respectively) to only 12% (chemical treatment). Mechanical and combination of chemical and mechanical treatments successfully controlled weeds, having only few shoots of dominant weeds per m2 with insignificant biomass.

E. Štefanić, Đ. Maletić, D. Zima, I. Štefanić: Economic Evaluation of Different Strategy for Weed…Zbornik Veleučilišta u Rijeci, Vol. 8 (2020), No. 1, pp. 445-454
449
Figure 1. Density and biomass of dominant weeds (per m2) in garlic experimental plot
Source: Author’s original work
Application of herbicides lead to insufficient control efficacy of two noxious weed species S. halepense and C. album, although in some other studies pendimethalin and clopyralid demonstrated a satisfactory control, particularly for Chenopodium album (Ujgur et al., 2010., Sahoo et al., 2018). These weeds developed at the end of growing season in average 1,53 kg and 1,29 kg of

E. Štefanić, Đ. Maletić, D. Zima, I. Štefanić: Economic Evaluation of Different Strategy for Weed…Zbornik Veleučilišta u Rijeci, Vol. 8 (2020), No. 1, pp. 445-454
450
fresh above biomass per 1 m2 respectively. Regarding plant density per m2, S. halepense had 45, and C. album 8 shoots in average.
Table 3. Analysis of variance (ANOVA) for the effect of weed management systems on weed density and biomass and garlic yield
Sum of squares
df Mean square F Sig.
Wee
d bi
omas
s Between groups 33,451 3 11,150 16,358 0,000Within groups 8,180 12 0,682
Total 41,630 15
Wee
d de
nsity Between groups 3738,500 3 1246,167 11,206 0,001
Within groups 1334,500 12 111,208Total 5073,000 15
Gar
lic
yiel
d Between groups 0,719 3 0,240 16,420 0,000Within groups 0,175 12 0,015
Total 0,894 15Source: Author’s original work
Results of this study are in agreement with experiment done by Vora and Mehta (1998) where herbicide application alone did not control weeds effectively but herbicide application followed by one hand hoeing gave the best results in garlic crop. Therefore, in minor crops like garlic, low availability of herbicides imposes to adopt an integrated use of non-chemical weed control method, or to combine those methods with existing herbicides option (Rahman et al., 2011). Also, the superiority of the mechanical and combination of chemical and mechanical weed control could be explained on the basis of better growth and higher uptake of nutrients under these practices which are corroborated with the findings Malik et al. (2017) and Vermani et al. (2001.). Mechanical control methods, however, over the last 20 years have become effective, fast and do not leave chemical residues on crops (Pannaci & Tei, 2014).
3. 2 Garlic yield
Weeds can reduce garlic yields considerably if not managed properly (Table 3, Fig. 2). This results, in which weeded check caused 82% reduction in the garlic yields when compared with chemical and mechanical treatment, show that weed control is very important for garlic production. However, in some other studies, due to unrestricted weed growth, yield loss in garlic was even up to 94.8% due to weed competition (Anon, 2009).The highest yield (8,3 t/ha) was obtained with combination of chemical and mechanical weed control. Mechanical weed control throughout the growing season gave the significantly lower yield (5,5 t/ha), while chemical application and weeded check had the worst results with 3,5 t/ha and 2,8 t/ha, respectively. Also, these bulbs were of low quality and not for commercial sale.

E. Štefanić, Đ. Maletić, D. Zima, I. Štefanić: Economic Evaluation of Different Strategy for Weed…Zbornik Veleučilišta u Rijeci, Vol. 8 (2020), No. 1, pp. 445-454
451
Figure 2. Garlic yield from different weed control treatments
Source: Author’s original work
3. 3 Economic analysis
Weed management is an important factor that influences the economic importance of garlic production. Weeds not only compete for nutrients, water, light, space but also increase cost of labor and render the harvesting operations difficult. The impact of weed management method on expenditure, gross income, net income and benefit: cost ratio is shown in Table 4.
Table 4. Economic benefit of investigated weed management methods in garlic
TreatmentExpenditure
(kn/ha-1)Gross income
(kn/ha-1)Net income
(kn/ha-1)Benefit cost ratio
(%)UTC 58,700 67.600 8.900 13,1
Chem 40.661 83.000 42.339 51Mech 88.240 127.000 38.761 30,5
Chem+Mech 72.561 188.600 116.039 61,5Source: Author’s original work
Based on a current market prices of herbicides, cultivations, and the wholesale price of garlic it could be concluded that combination of chemical and mechanical control method gave the best benefit cost ratio. Mechanical cultivation, due to the high labor costs, did obtained satisfactory economic benefit. Therefore, an integrated weed management approach (IWM) could be a good

E. Štefanić, Đ. Maletić, D. Zima, I. Štefanić: Economic Evaluation of Different Strategy for Weed…Zbornik Veleučilišta u Rijeci, Vol. 8 (2020), No. 1, pp. 445-454
452
option for a successful garlic production. IWM provides diverse weed control tools that are feasible in a given socio-economic situation (Mehmood et al., 2006, Lamichhane et al., 2017).
4. CONCLUSION
In present study, weed community in garlic dominated with johnsongrass (Sorghum halepense), common ragweed (Ambrosia artemisiifolia) Canada thistle (Cirsium arvense) and lambsquarters (Chenopodium album). Those weeds compete with garlic for nutrients, soil moisture, space, and light and considerably reduce the yield, quality and value of the crop through increased production and harvesting costs. Chemical treatment alone did not provide a season long weed control. Manual weeding is a very expensive laborious method of weed control, even often damages the crop. This research demonstrated that good option (higher yield and economic benefit) could be implementation of IWM i.e. combination chemical and mechanical weed control. This treatment successfully controlled weeds, gave the highest yield and the best economic benefit.
REFERENCESAnonymous. (2009) Crop-weed competition studies in onion and garlic. Annual Report 2008-09. Directorate of Onion
and Garlic, Indian Council of Agricultural Research, Rajgurunagar, Dist. Pune, Maharashtra, 2009, 21-22
Bell, C.E., Boutwell, B.E. (2001) Combining Bensulide and Pendimethalin Controls Weeds in Onions. California Agriculture, January-February, pp. 35-38.
Carlson, H.L., Kirby, D. (2005) Effect of Herbicide Rate and Application Timing on Weed Control in Dehydrator Onions. University of Florida, Intermountain Research and Extension Center, Number, 115: p. 4.
Chapman, D.S., Scalone, R., Stefanic, E., Bullock, J.M. (2017) Mechanistic species distribution modeling reveals a niche shift during invasion. Ecology 98, 1671-1680.
Garcia, D. C., Barni, V., Storck, L. (1994) Influence of the weed competition on yield of onion bulbs. Pesquisa Agropecuaria Brasileira, 29, No.10., 1557-1563.
Lamichhane, J.R., Devos, Y., Beckie, H.J., Owen, M.D., Tillie, P., Messean, A., Kudsk, P. (2017) Integrated weed management systems with herbicide-tolerant crops in the European Union: Lessons learnt from home and abroad. Critical Reviews in Biotechnology, 37, No. 4, 459-475.
Malik, S., Sharangi, A.B., Datta, N. (2017) Herbicidal Options in Managing Weeds towards Growth and Yield Dynamics of Single Clove Garlic. International Journal of Agriculture Sciences 9., No. 1, 3627-3630.
Mishra, R.K., Jaiswal, R. K., Kumar, D., Saabale, P.R., Singh, A. (2014) Management of major diseases and insect pests of onion and garlic: A comprehensive review, Journal of Plant Breeding and Crop Science 6 (11), 160-170.
Mehmood, T., Khokhar, K.M., Shakeel, M. (2006) Integrated weed management practices in garlic crop in Pakistan. Crop Protection 26, 1031-1035.
Parađiković, N. (2009) Opće i specijalno povrćarstvo. Sveučilište J.J. Strossmayera u Osijeku, Poljoprivredni fakultet Osijek, pp. 536.
Qasem, J.R. (1995): Weed competition in garlic (Allium sativum L.). Journal of Horticultural Science 71, 41-48. Pannaci, E., Tei, F. (2014) Effect of mechanical and chemical methods on weed control, weed seed rain, and crop yield in maize, sunflower and soybean. Crop Protection 64, 51-59.
Rahman, H., Ullah, K., Sadiq, M., Khan, H.U., Khan, M.A., Khattek, A.M. (2011) Relationship between manual weeds removal timings and garlic *Allium sativum L.) production. Pak.J.Weed.Sci.Res. 17 (3), 285-292.

E. Štefanić, Đ. Maletić, D. Zima, I. Štefanić: Economic Evaluation of Different Strategy for Weed…Zbornik Veleučilišta u Rijeci, Vol. 8 (2020), No. 1, pp. 445-454
453
Sahoo, S., Oatel, T.U., Baldanya, M.J., Chawan, A., Murmu, S. (2018) Effect of herbicide on crop growth and yield of garlic (Allium sativum L.). International Journal of Chemical Studies 6, No. 3., 3248-3250.
Smith, R., Fennimore, S.A., Orloff, S., Poole, G.J. (2008) In: Bell, C.E., Cudney, D.W., Fennimore, S.A., Orloff, S.:Weeds. UC IPM Pest Management Guidelines: Onion and Garlic. University of California, Agriculture and Natural Resources, Publication, p. 3453.
Štefanić, E., Kovačević, V., Dimić, D., Štefanić, I., Antunović, S. (2017a) Changes in weed species composition in northeastern Croatian row crops from 1977 to 2015. Herbologia, Vol. 16, No. 2, 57-62.
Štefanić, E., Dimic, D., Sudarić, A., Štefanić, I.,Antunović, S., Horvat, G. (2017b) Seasonal dynamic of weed biomass in narrow and wide row soybean (Glycine max (L.) Merr.). . Herbologia, Vol. 16, No. 2. 57-62.
Uygur, S., Gürbüz, R., Uygur, N. (2010) Weeds of onion fields and effects of some herbicides on weeds in Cukurova region, Turkey. African Journal of Biotechnology Vol. 9(42), 7037-7042.
Vermani , A., Nandal, T.R., Singh, R. (2001) Nutrient uptake and economic weed management in garlic (Allium sativum L.). Indian Journal of Weed Science.33. No. 3&4, 225- 226.
Vora, V.D., Mehta, D.R. (1998) Integrated wed management in winter garlic. Agric. Sci. Digest Karnal 18 (4), 237-239.
Zewde, T., Fininsa, C., Sakhuja, P.K., Ahmed, S. (2007) Association of white rot (Sclerotioum cepivorum) of garlic with environmental factors and cultural practices in the North Shewa highlands of Ethiopia. Crop Protection 26, 1566-1573.
Zimdahl, R. (1980) Weed-crop competition: A review. International Plant Protection Center. Oregon State University, Corvallis, Oregon, pp: 195.

E. Štefanić, Đ. Maletić, D. Zima, I. Štefanić: Economic Evaluation of Different Strategy for Weed…Zbornik Veleučilišta u Rijeci, Vol. 8 (2020), No. 1, pp. 445-454
454
Pregledni rad https://doi.org/10.31784/zvr.8.1.5 Datum primitka rada: 12. 10. 2019. Datum prihvaćanja rada: 27. 12. 2019.
EKONOMSKA EVALUACIJA RAZLICITIH STRATEGIJA SUZBIJANJA KOROVA U PROIZVODNJI CESNJAKA
Edita Štefanić Dr. sc., redoviti profesor, Fakultet agrobiotehničkih znanosti Osijek, V. Preloga 1, 31 000 Osijek, Hrvatska;
e-mail: [email protected]
Đorđe Maletić Mag. ing. agr., OPG Đorđe Maletic, 32 000 Vukovar, Hrvatska.
Dinko Zima Dr. sc., profesor visoke škole, Veleučilište u Požegi, Vukovarska 17, 34 000 Požega, Hrvatska.
Ivan Štefanić Dr. sc., redoviti profesor, Fakultet agrobiotehničkih znanosti Osijek, V. Preloga 1, 31 000 Osijek, Hrvatska.
SAŽETAKPoljski pokus je proveden na području sjeveroistočne Hrvatske s ciljem evaluacije različitih strategija suzbijanja korova u češnjaku (Alium sativum L.). Predmet ovog istraživanja bio je utvrditi kako različite strategije suzbijanja korova utječu na korovnu zajednicu u češnjaku i kakav je ekonomski učinak svakog od istraživanih tretmana. Pokus je postavljen po slučajnom blok rasporedu sa tri različita tretmana suzbijanja korova: kemijsko (sa PRE-EM i POST-EM primjenom), mehaničko (tri puta tijekom vegetacijske sezone) i kombinaciju kemijskog i mehaničkog suzbijanja. Zakorovljena, kontrolna varijanta je također bila uključena u pokus. Dobiveni podatci o gustoći korova, svježoj nadzemnoj biomasi korova i prinosu češnjaka prikupljeni su na kraju vegetacijske sezone te statistički i ekonomski analizirani. Najznačajniji korovi tijekom provedbe pokusa bili su: Sorghum halepense, Ambrosia artemisiifolia, Cirsium arvense and Chenopodium album. Primjenjene strategije suzbijanja korova različito su utjecale na gustoću i nadzemnu biomasu korova te na prinos češnjaka. Signifikantno manja gustoća korova i njihova nadzemna biomasa u usporedbi sa zakorovjenom kontrolom utvrđena je na parcelama s mehaničkim suzbijanjem korova i s kombinacijom mehaničkog i kemijskog suzbiljanja. Aplikacija herbicida u ovom pokusu nije se pokazala uspješnom i ostvarila je na kraju vegetacijske sezone signifikantno niži prinos u odnosu na ostale tretmane. Tretman s najboljem omjerom troškova i koristi jest kombinacija kemijskog i mehaničkog suzbijanja korova i može se preporučiti farmerima kao uspješna strategija za postizanje visokog pronosa i ostvarenja maksimalnog profita.
Ključne riječi: suzbijanje korova, češnjak, ekonomska analiza
Creative Commons Attribution – NonCommercial 4.0 International License

T. Šugar, K. Brščić, T. Kocković Zaborski: Mišljenje proizvođača ekoloških prehrambenih proizvoda…Zbornik Veleučilišta u Rijeci, Vol. 8 (2020), No. 1, pp. 455-469
455
Stručni rad https://doi.org/10.31784/zvr.8.1.4 Datum primitka rada: 18. 11. 2019. Datum prihvaćanja rada: 3. 1. 2020.
MIŠLJENJE PROIZVOĐAČA EKOLOŠKIH PREHRAMBENIH PROIZVODA O MOGUĆNOSTIMA
RAZVOJA EKOLOŠKE POLJOPRIVREDE U HRVATSKOJTina Šugar
Doktorandica, asistentica, Institut za poljoprivredu i turizam, Karla Huguesa 8, 52 440 Poreč, Hrvatska; e-mail: [email protected]
Kristina Brščić Dr. sc., predstojnica Zavoda za turizam, Institut za poljoprivredu i turizam, Karla Huguesa 8,
52 440 Poreč, Hrvatska; e-mail: [email protected]
Tanja Kocković Zaborski Dr. sc., kustosica, Etnografski muzej Istre, Trg Istarskog razvoda 1275, No. 1, 52 000 Pazin, Hrvatska;
e-mail: [email protected]
SAŽETAKU posljednjih nekoliko godina zabilježen je trend rasta površina pod ekološkom proizvodnjom u Hrvatskoj. Razvoj ekološke poljoprivredne proizvodnje sve je više potican kao model proizvodnje koji je od presudne važnosti za očuvanje najvažnijih prirodnih resursa u proizvodnji hrane, u Hrvatskoj i Europi. Cilj rada bio je utvrditi mišljenja ekoloških proizvođača o ograničenjima i mogućnostima razvoja ekološke poljoprivrede u Hrvatskoj. U članku su predstavljeni rezultati istraživanja provedenog na manifestaciji “Pazi što jedeš” održanoj u Puli 2015. godine. Sudionici su bili izlagači na sajmu, proizvođači ekoloških prehrambenih proizvoda iz Hrvatske. U istraživanju je sudjelovao 41 proizvođač ekoloških proizvoda. Glavni rezultati studije odnose se na opće informacije o proizvodnji ekološke hrane, vrstama proizvodnje i načinu distribucije. Također, dobiveno je mišljenje proizvođača o najčešćim problemima koji se javljaju u ekološkoj proizvodnji hrane. Rezultati mogu poslužiti kao informativna podloga o stajalištima proizvođača o problemima proizvodnje ekološke hrane kao i za kreiranje budućih aktivnosti u cilju jačanja ekološke proizvodnje u Hrvatskoj te kao podloga za kreiranje budućih istraživanja.
Ključne riječi: ekološka poljoprivreda, proizvođači ekoloških proizvoda, ekološki proizvodi, Hrvatska
Creative Commons Attribution – NonCommercial 4.0 International License

T. Šugar, K. Brščić, T. Kocković Zaborski: Mišljenje proizvođača ekoloških prehrambenih proizvoda…Zbornik Veleučilišta u Rijeci, Vol. 8 (2020), No. 1, pp. 455-469
456
1. UVOD
Konvencionalna poljoprivredna proizvodnja sve se više razvija obzirom na rast broja stanovnika u svijetu i povećanje potreba za količinom hrane. Međutim, takav način proizvodnje često ima negativne utjecaje na okoliš i prirodne ekosustave. Smanjenje negativnih utjecaja na okoliš osnovni je razlog interesa proizvođača za ekološku proizvodnju (Magdoff, 2007; Norton, 2016). Prema istraživanju provedenom u sjeverozapadnoj Hrvatskoj, glavni motiv većine proizvođača da sudjeluju u ekološkoj proizvodnji je proizvodnja hrane na ekološki prihvatljiv način (Zrakić i sur., 2017). Posljednjih nekoliko godina zabilježen je trend rasta broja proizvođača ekoloških proizvoda i površina pod ekološkom poljoprivrednom proizvodnjom. Razlozi tomu su višestruki, a dijelom leže i u činjenici da prelaskom iz konvencionalne u ekološku poljoprivrednu proizvodnju te diferenciranjem proizvoda oznakom ekološki proizvod, proizvođači mogu ostvariti pozitivne učinke na poslovanje gospodarstva (Štefanić i sur., 2001; Bimbo i sur., 2016). Najčešći problem razvoja ekološke poljoprivrede u Hrvatskoj odnosi se na nedovoljno razvijeno tržište ekoloških proizvoda (Batelja Lodeta i sur., 2011; Pejnović i sur., 2012) i poteškoće pri plasmanu proizvoda na europsko tržište (Rengel, 2013). Dosadašnji način organiziranja proizvođača ekoloških proizvoda nije značajnije utjecao na razvoj ekološke proizvodnje, a Renko i Bošnjak (2009) kao rješenje navedenog problema ističu važnost osnivanja krovne organizacije proizvođača ekoloških proizvoda koja bi pregovarala i surađivala sa supermarketima radi plasmana ekoloških proizvoda, čime bi se proizvođačima omogućio novi kanal distribucije proizvoda. Naime, time bi se postigla i veća dostupnost i bolja ponuda ekoloških proizvoda na hrvatskom tržištu. Petljak (2011) temeljem pregleda razvoja ekološke poljoprivrede u Hrvatskoj od 1991. do 2008. godine, kao zaključak navodi kako je uz podršku institucija i državnih tijela, važno i potrebno međusobno povezivanje proizvođača ekoloških proizvoda kako bi zajednički nastupili na tržištu. Temeljem jedanaestogodišnje analize stanja i razvoja ekološke poljoprivrede Gugić i sur. (2017) navode kako poticanje poljoprivrednih gospodarstava da proizvode ekološke proizvode može imati pozitivan učinak na revitalizaciju ruralnih područja i očuvanje lokalnog kulturalnog identiteta. Osim toga, sve veća briga potrošača o sigurnosti hrane i ekološkim pitanjima dovodi do porasta potražnje za ekološkim proizvodima (Sanjuán i sur., 2003). Postoji više razloga zašto kupci biraju ekološki proizvedenu hranu. Neki od razloga su veća svijest među potrošačima o utjecajima konvencionalne poljoprivrede na okoliš te se dio potrošača želi odgovorno ponašati i tako smanjiti negativan utjecaj na okoliš. Međutim, najveći motiv kupnje ekoloških proizvoda je pozitivan utjecaj na zdravlje koji potrošači očekuju od konzumacije ekoloških proizvoda (Paul i Rana, 2012; Chen, 2009). Potrošači su svjesni da je kupnja ekoloških proizvoda društveno poželjna, ali također i činjenice da takvo ponašanje još uvijek nije mainstream (Ham i sur., 2018). Ham (2019) također zaključuje kako će potrošači biti više zainteresirani za ekološke proizvode ako će od ekoloških proizvoda imati više osobnih koristi nego li će kupnjom proizvoda doprinijeti društvu kao cjelini. Teme koje su obuhvaćene dosadašnjim istraživanjima odnose se na utvrđivanje obilježja, navika i ponašanja potrošača pri kupovini ekoloških proizvoda (Renko i Bošnjak, 2009; Kuran i Mihić, 2014), koliko su potrošači spremni platiti za ekološke proizvode i koliko su informirani o dobrobiti ekološke proizvodnje (Radman, 2005; Aryal i sur., 2009; Rödiger i sur., 2016; Pellegrini i Farinello, 2009). Prema dosadašnjim istraživanjima potrošači imaju različite stavove vezano uz ekološke proizvode. Skupine potrošača s pozitivnim stavovima prema ekološkim proizvodima pokazuju i veću spremnost plaćanja viših cijena za ekološki proizvod.

T. Šugar, K. Brščić, T. Kocković Zaborski: Mišljenje proizvođača ekoloških prehrambenih proizvoda…Zbornik Veleučilišta u Rijeci, Vol. 8 (2020), No. 1, pp. 455-469
457
Radman (2005) stoga zaključuje kako je potrebno kreirati marketinške aktivnosti usmjerene na skupine potrošača s pozitivnim stavom prema ekološkim proizvodima. Nekoliko dosadašnjih istraživanja u Hrvatskoj potvrdilo je da su potrošači spremni platiti višu cijenu za ekološki proizvod u odnosu na konvencionalni proizvod. Štefanić i sur. (2001) u istraživanju provedenom u Osijeku navode kako su potrošači za ekološki proizvod spremni platiti 4-16 %, dok Radman (2005), prema istraživanju provedenom u Zagrebu, ističe kako je većina ispitanika spremna platiti 11-20 % višu cijenu za proizvod proizveden na ekološki način. Prema istraživanju provedenom u Karlovačkoj županiji navodi se kako su kupci ekoloških prehrambenih proizvoda uglavnom stariji, zaposleni potrošači s višim mjesečnim prihodima, odnosno, većom kupovnom moći (Anić i sur., 2015). Renko i Bošnjak (2009) ističu kako su cijene ekoloških proizvoda u Hrvatskoj relativno visoke, a ambalaža nije u skladu s cjenovnom kategorijom u usporedbi s ekološkim proizvodima koji se nude na europskom tržištu. Prema istraživanju provedenom u Njemačkoj, Rödiger i sur. (2016) utvrdili su da visina cijene koju su potrošači spremni platiti za ekološki proizvod značajno ovisi o kategoriji proizvoda iako su za svaku kategoriju spremni platiti najmanje 30 % višu cijenu, dok su primjerice na tržištu Srbije potrošači spremni platiti do 20 % više za ekološke proizvode (Vapa-Tankosić i sur., 2018), odnosno, razlike postoje ovisno o tržištima (Sriwaranun i sur., 2015; Sanjuán i sur., 2003; Sakagami i sur., 2006; Rodríguez i sur., 2007). Većina istraživanja potvrđuje da potrošači ekoloških proizvoda u Hrvatskoj smatraju ekološke proizvode zdravima, kvalitetnima i ukusnima (Štefanić i sur., 2001; Radman, 2005; Renko i Bošnjak, 2009). Prema istraživanju provedenom u Hrvatskoj, utvrđeno je da potrošači nisu dovoljno informirani o konceptu ekološke poljoprivrede, ali 90 % ispitanika vjeruje da postoje značajne razlike između ekoloških i konvencionalnih proizvoda (Radman, 2005). Jedan od novijih pokreta u Hrvatskoj koji se sve češće spominje su grupe solidarne razmjene koje se baziraju na solidarnosti, izravnom kontaktu potrošača i proizvođača te kupnji ekoloških proizvoda od lokalnog proizvođača (Sarjanović, 2014; Orlić, 2014). Također, jedan od novijih oblika prodaje ekoloških proizvoda u Hrvatskoj je i eko tržnica (Siljan i Cerjak, 2017). Cilj rada bio je utvrditi ograničenja razvoja ekološke proizvodnje i najčešćih problema koji se javljaju u ekološkoj proizvodnji iz perspektive proizvođača ekoloških proizvoda u Hrvatskoj. U radu je dan kratki pregled stanja ekološke poljoprivrede i broja proizvođača ekoloških proizvoda u svijetu, Europi i Hrvatskoj.
2. MATERIJALI I METODE
Rezultati istraživanja dobiveni su anketiranjem proizvođača ekoloških proizvoda koji su izlagali na sajmenom dijelu manifestacije “Pazi što jedeš” u Puli. Zadatak istraživanja bio je utvrditi socio-demografska obilježja proizvođača ekoloških proizvoda, opće podatke o njihovoj proizvodnji i mišljenja proizvođača vezana uz ograničenja i mogućnosti razvoja ekološke proizvodnje te motive dolaska i zadovoljstvo sudjelovanjem na manifestaciji. Anketiranje je provedeno na petoj manifestaciji “Pazi što jedeš” u Puli, 7. i 8. studenog 2015. godine. Manifestacija “Pazi što jedeš” međunarodna je manifestacija u organizaciji Etnografskog muzeja Istre i udruge Istarski Eko Proizvod čija je misija prijenos znanja o tradicionalnoj i lokalnoj prehrani i promocija lokalne hrane kroz različite edukacije, predavanja, radionice i sajam koji okuplja isključivo certificirane proizvođače ekoloških proizvoda. Za potrebe istraživanja kreiran je upitnik, a ciljana skupina ispitanika bili su registrirani proizvođači ekoloških proizvoda koji su sudjelovali na manifestaciji.

T. Šugar, K. Brščić, T. Kocković Zaborski: Mišljenje proizvođača ekoloških prehrambenih proizvoda…Zbornik Veleučilišta u Rijeci, Vol. 8 (2020), No. 1, pp. 455-469
458
Anketar, ujedno i autor istraživanja, provodio je istraživanje putem intervjua sa svim izlagačima, odnosno proizvođačima ekoloških proizvoda koji su sudjelovali na sajmu, ukupno njih 41, za vrijeme trajanja sajma. Anketa je sadržavala 26 pitanja otvorenog i zatvorenog tipa. U pojedinim pitanjima korištena je skala tipa Likertove skale 1 – 5, pri čemu je ocjena 1 označavala da je navedeni element potpuno nevažan, a ocjena 5 da je element u potpunosti važan. Za mjerenje stavova ispitanika prema pojedinim elementima manifestacije korištena je Likertova skala sa stupnjevima od 1 – 5 pri čemu je 1 označavao najmanji stupanj zadovoljstva, a 5 najveći stupanj zadovoljstva. Rezultati su u radu prikazani pomoću deskriptivne statistike.
3. EKOLOŠKA POLJOPRIVREDA U SVIJETU, EUROPSKOJ UNIJI I HRVATSKOJ
Prema službenim podacima The World of Organic Agriculture (2019), u 2017. godini u svijetu je bilo registrirano ukupno 2,9 milijuna proizvođača ekoloških proizvoda na površini od 69,8 milijuna hektara, uključujući i proizvodnju u prijelaznom razdoblju. U 2017. godini je tako zabilježen najveći porast ekoloških poljoprivrednih površina diljem svijeta. Australija je zemlja s najvećim udjelom površina pod ekološkom poljoprivredom s 35,6 milijuna hektara, slijedi Argentina s 3,4 milijuna hektara i Kina s 3 milijuna hektara. Najveći broj proizvođača ekoloških proizvoda u svijetu u 2017. godini zabilježen je u Indiji (835 000 proizvođača), zatim u Ugandi (210 352 proizvođača) i Mexicu (210 000 proizvođača). U odnosu na 2016. godinu broj proizvođača porastao je za oko 5 %. U Oceaniji je zastupljena polovina globalne površine pod ekološkom poljoprivredom (35,9 milijuna hektara), slijedi Europa s 21 % (14,6 milijuna hektara) i Latinska Amerika s 11 % (8 milijuna hektara). U 2017. godini zemlje s najvećim tržištima ekološke hrane su USA, Njemačka i Francuska. Najveće jedinstveno tržište ima USA (47 % globalnog tržišta), slijedi EU (37 %) i Kina (8 %). U Europskoj uniji (EU) bilo je 12,8 milijuna hektara pod ekološkom poljoprivredom što čini 7,2 % poljoprivrednog zemljišta s ukupno 305.000 proizvođača. Zemlje članice koje imaju najviše površina pod ekološkom proizvodnjom u 2017. godini bile su Španjolska (2,1 milijuna ha), Italija (1,9 milijuna hektara) i Francuska (1,7 milijuna hektara). Maloprodaja ekoloških proizvoda u EU, u 2017. godini iznosila je 34,3 milijarde eura. Prema službenim podacima EUROSTAT-a, zemlje s najvećim udjelom zemljišta pod ekološkom proizvodnjom (iznad 19 %) u 2017. godini, bile su Austrija (23,4 %), Estonija (19, 6 %) i Švedska (19, 2 %). U razdoblju od 2012. do 2017. godine Bugarska i Hrvatska zabilježile su rast ukupne površine pod ekološkom proizvodnjom iznad 100 % dok je u Rumunjskoj, Grčkoj, Ujedinjenom Kraljevstvu i Poljskoj zabilježen pad. U razdoblju od 2012. do 2017. godine u Hrvatskoj se povećala ukupna površina pod ekološkom proizvodnjom (uključujući i prijelazno razdoblje) za 202,8 % i još uvijek bilježi pozitivan rast (EUROSTAT, 2017). Prema službenim podacima Ministarstva poljoprivrede u 2007. godini u Hrvatskoj je bilo 7577 hektara pod ekološkom proizvodnjom, a u 2017. godini 96 618 ha što znači da se u razdoblju od 10 godina povećala površina pod ekološkom proizvodnjom za značajnih 89 041 hektara (Grafikon 1) (Ministarstvo poljoprivrede, 2019).
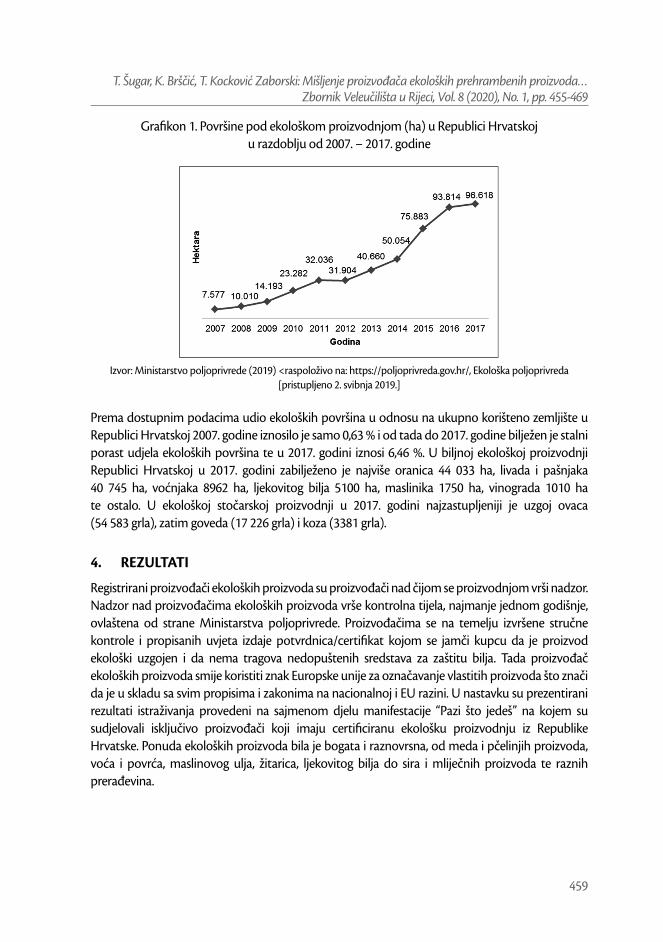
T. Šugar, K. Brščić, T. Kocković Zaborski: Mišljenje proizvođača ekoloških prehrambenih proizvoda…Zbornik Veleučilišta u Rijeci, Vol. 8 (2020), No. 1, pp. 455-469
459
Grafikon 1. Površine pod ekološkom proizvodnjom (ha) u Republici Hrvatskoj u razdoblju od 2007. – 2017. godine
Izvor: Ministarstvo poljoprivrede (2019) <raspoloživo na: https://poljoprivreda.gov.hr/, Ekološka poljoprivreda [pristupljeno 2. svibnja 2019.]
Prema dostupnim podacima udio ekoloških površina u odnosu na ukupno korišteno zemljište u Republici Hrvatskoj 2007. godine iznosilo je samo 0,63 % i od tada do 2017. godine bilježen je stalni porast udjela ekoloških površina te u 2017. godini iznosi 6,46 %. U biljnoj ekološkoj proizvodnji Republici Hrvatskoj u 2017. godini zabilježeno je najviše oranica 44 033 ha, livada i pašnjaka 40 745 ha, voćnjaka 8962 ha, ljekovitog bilja 5100 ha, maslinika 1750 ha, vinograda 1010 ha te ostalo. U ekološkoj stočarskoj proizvodnji u 2017. godini najzastupljeniji je uzgoj ovaca (54 583 grla), zatim goveda (17 226 grla) i koza (3381 grla).
4. REZULTATI
Registrirani proizvođači ekoloških proizvoda su proizvođači nad čijom se proizvodnjom vrši nadzor. Nadzor nad proizvođačima ekoloških proizvoda vrše kontrolna tijela, najmanje jednom godišnje, ovlaštena od strane Ministarstva poljoprivrede. Proizvođačima se na temelju izvršene stručne kontrole i propisanih uvjeta izdaje potvrdnica/certifikat kojom se jamči kupcu da je proizvod ekološki uzgojen i da nema tragova nedopuštenih sredstava za zaštitu bilja. Tada proizvođač ekoloških proizvoda smije koristiti znak Europske unije za označavanje vlastitih proizvoda što znači da je u skladu sa svim propisima i zakonima na nacionalnoj i EU razini. U nastavku su prezentirani rezultati istraživanja provedeni na sajmenom djelu manifestacije “Pazi što jedeš” na kojem su sudjelovali isključivo proizvođači koji imaju certificiranu ekološku proizvodnju iz Republike Hrvatske. Ponuda ekoloških proizvoda bila je bogata i raznovrsna, od meda i pčelinjih proizvoda, voća i povrća, maslinovog ulja, žitarica, ljekovitog bilja do sira i mliječnih proizvoda te raznih prerađevina.

T. Šugar, K. Brščić, T. Kocković Zaborski: Mišljenje proizvođača ekoloških prehrambenih proizvoda…Zbornik Veleučilišta u Rijeci, Vol. 8 (2020), No. 1, pp. 455-469
460
4. 1 Socio-demografska obilježja ispitanika
U istraživanju je sudjelovalo 51,22 % žena i 48,78 % muškaraca. Prema razini obrazovanja najveći broj ispitanika ima završenu srednju školu (53,66 %), zatim slijede ispitanici sa završenim fakultetom (21,95 %) i višom stručnom spremom (19,51 %). Najveći broj ispitanika spada u kategoriju kućanstva prema prosječnim mjesečnim prihodima od 5001 – 10.000 kn (31,71 %), slijedi kategorija s prihodima manjim od 5000 kn (29,27 %) i kategorija u koju spadaju ispitanici s mjesečnim prihodima od 10.001 – 15.000 kn (21,95 %) (Tablica 1).
Tablica 1. Socio-demografska obilježja proizvođača ekoloških proizvoda na manifestaciji “Pazi što jedeš”
Socio-demografska obilježja proizvođača
Udio (%) N
Spol (n=41)muški 48,78 20ženski 51,22 21
Razina obrazovanja (n=41)Osnovna škola 2,44 1Srednja škola 53,66 22
Viša škola 19,51 8Fakultet 21,95 9
Dr. sc./mr. sc. 2,44 1Prosječni mjesečni prihodi po kućanstvu (n=41)
≤ 5.000 kn 29,27 125.001 - 10.000 kn 31,71 13
10.001 - 15.000 kn 21,95 915.001 - 20.000 kn 2,44 120.001 - 25.000 kn 2,44 1
> 25.000 kn 4,88 2ne želim odgovoriti 7,32 3
Izvor: rezultati istraživanja, studeni 2015.
U istraživanju su sudjelovali proizvođači ekoloških proizvoda prosječne starosne dobi od 48 godina. Prosječan broj članova kućanstva iznosi 4 člana, što je više od nacionalnog prosjeka koji iznosi 2,8 (Državni zavod za statistiku, 2017). U prosjeku 2 su člana kućanstva zaposlena na OPG-u, a 1 član izvan OPG-a uzimajući u obzir činjenicu da su pojedini članovi djeca, nezaposleni ili umirovljenici (n = 37). Ispitanici su u anketi trebali navesti jesu li završili neki oblik edukacije vezane uz ekološku proizvodnju te je 48,78 % potvrdno odgovorilo. Najveći udio ispitanika završio je tečaj biodinamičke proizvodnje (45,45 %), zatim slijede ispitanici koji su sudjelovali na raznim seminarima vezanim uz ekološku poljoprivredu (36,37 %) i podjednak broj ispitanika koji su završili Agronomski fakultet smjera ekološka poljoprivreda (9,09 %) i osposobljavanje za ekološkog gospodarstvenika na otvorenim učilištima (9,09 %).
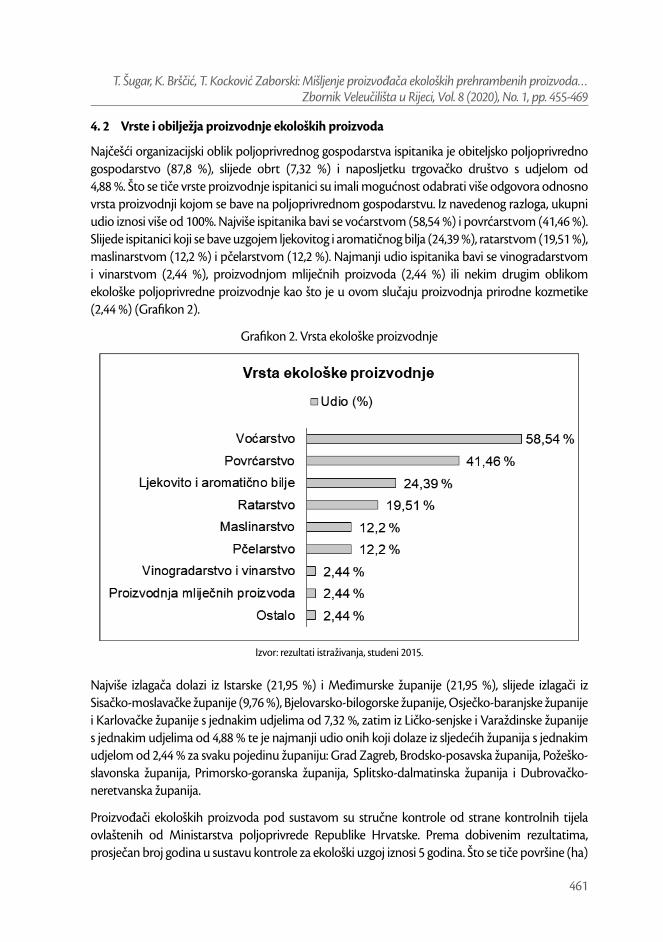
T. Šugar, K. Brščić, T. Kocković Zaborski: Mišljenje proizvođača ekoloških prehrambenih proizvoda…Zbornik Veleučilišta u Rijeci, Vol. 8 (2020), No. 1, pp. 455-469
461
4. 2 Vrste i obilježja proizvodnje ekoloških proizvoda
Najčešći organizacijski oblik poljoprivrednog gospodarstva ispitanika je obiteljsko poljoprivredno gospodarstvo (87,8 %), slijede obrt (7,32 %) i naposljetku trgovačko društvo s udjelom od 4,88 %. Što se tiče vrste proizvodnje ispitanici su imali mogućnost odabrati više odgovora odnosno vrsta proizvodnji kojom se bave na poljoprivrednom gospodarstvu. Iz navedenog razloga, ukupni udio iznosi više od 100%. Najviše ispitanika bavi se voćarstvom (58,54 %) i povrćarstvom (41,46 %). Slijede ispitanici koji se bave uzgojem ljekovitog i aromatičnog bilja (24,39 %), ratarstvom (19,51 %), maslinarstvom (12,2 %) i pčelarstvom (12,2 %). Najmanji udio ispitanika bavi se vinogradarstvom i vinarstvom (2,44 %), proizvodnjom mliječnih proizvoda (2,44 %) ili nekim drugim oblikom ekološke poljoprivredne proizvodnje kao što je u ovom slučaju proizvodnja prirodne kozmetike (2,44 %) (Grafikon 2).
Grafikon 2. Vrsta ekološke proizvodnje
Izvor: rezultati istraživanja, studeni 2015.
Najviše izlagača dolazi iz Istarske (21,95 %) i Međimurske županije (21,95 %), slijede izlagači iz Sisačko-moslavačke županije (9,76 %), Bjelovarsko-bilogorske županije, Osječko-baranjske županije i Karlovačke županije s jednakim udjelima od 7,32 %, zatim iz Ličko-senjske i Varaždinske županije s jednakim udjelima od 4,88 % te je najmanji udio onih koji dolaze iz sljedećih županija s jednakim udjelom od 2,44 % za svaku pojedinu županiju: Grad Zagreb, Brodsko-posavska županija, Požeško-slavonska županija, Primorsko-goranska županija, Splitsko-dalmatinska županija i Dubrovačko-neretvanska županija.
Proizvođači ekoloških proizvoda pod sustavom su stručne kontrole od strane kontrolnih tijela ovlaštenih od Ministarstva poljoprivrede Republike Hrvatske. Prema dobivenim rezultatima, prosječan broj godina u sustavu kontrole za ekološki uzgoj iznosi 5 godina. Što se tiče površine (ha)

T. Šugar, K. Brščić, T. Kocković Zaborski: Mišljenje proizvođača ekoloških prehrambenih proizvoda…Zbornik Veleučilišta u Rijeci, Vol. 8 (2020), No. 1, pp. 455-469
462
pod ekološkim uzgojem prosječna veličina iznosi 5,4 ha (n = 37). Više od polovice ispitanika, njih 56 %, kao jedini izvor prihoda u kućanstvu navodi prihode od ekološke proizvodnje, dok se ostali udio od 44 % ispitanika bavi ekološkom poljoprivredom kao dopunskom djelatnošću.
Na pitanje vezano uz načine prodaje ekoloških proizvoda postojala je mogućnost više odgovora zbog toga konačni zbroj svih udjela iznosi više od 100 %. Najčešći način prodaje, kako je i vidljivo na grafikonu 3, je prodaja na sajmovima (85,37 %), slijedi prodaja na vlastitom gospodarstvu (73,17 %) i prodaja putem organiziranih solidarnih ekoloških grupa (58,54 %), zatim prodaja na tržnicama (41,46 %), prodaja putem posrednika (26,83 %) i najmanji je udio onih koji svoje proizvode prodaju putem Interneta (24,39 %).
Grafikon 3. Načini prodaje ekoloških proizvoda
Izvor: rezultati istraživanja, studeni 2015.
4. 3 Mogućnosti i ograničenja razvoja ekološke proizvodnje
Prema dobivenim odgovorima ispitanika, veliki udio ispitanika, čak njih 70,73 %, planira u budućnosti širiti ekološku proizvodnju, dok ostali ispitanici (29,27 %) u budućnosti planiraju ostati na sličnom obujmu proizvodnje kao i do sada.
Vezano uz buduće aktivnosti i plasman proizvoda na tržište, na pitanje smatraju li da je potrebno udruživanje proizvođača ekoloških proizvoda radi zajedničkog nastupa na tržištu, većina ispitanika 92,68 % mišljenja je da je svakako potrebno udruživanje. Kao obrazloženje navode: lakši plasman proizvoda na tržište, smanjenje troškova proizvodnje, bolja pregovaračka moć, osiguranje veće količine proizvoda, postizanje bolje cijene, dostupnost većeg broja kupaca i bolja konkurentnost na tržištu. Na pitanje smatraju li da je potrebno osnivanje Saveza udruga proizvođača ekoloških proizvoda na razini države koje bi predstavljalo ekološke proizvođače, većina ispitanika (92,68 %)

T. Šugar, K. Brščić, T. Kocković Zaborski: Mišljenje proizvođača ekoloških prehrambenih proizvoda…Zbornik Veleučilišta u Rijeci, Vol. 8 (2020), No. 1, pp. 455-469
463
smatra da je osnivanje Saveza potrebno radi zastupanja zajedničkih interesa proizvođača ekoloških proizvoda na razini države, lakši pristup tržištu, lakše rješavanje problema u ekološkoj proizvodnji i veći zajednički utjecaji na zakonodavstvo.
Budući da su proizvođači ekoloških proizvoda temeljni nositelji proizvodnje, zanimalo nas je što smatraju najvećim problemom ili ograničavajućim čimbenikom za daljnji razvoj ekološke proizvodnje. Pitanje je bilo otvorenog tipa te je svaki ispitanik mogao navesti neograničen broj ograničavajućih čimbenika za razvoj ekološke poljoprivrede. Iz navedenog razloga, ukupan zbroj udjela iznosi više od 100 %. Na ovo pitanje odgovorilo je ukupno 35 ispitanika. Većina ispitanika, 37,14 %, smatra da je tržište ekoloških proizvoda neorganizirano što prema mišljenju proizvođača ekoloških proizvoda znači lošu kontrolu na tržištu, nedostatnu proizvedenu količinu ekoloških proizvoda, lažno predstavljanje proizvođača na tržištu i neorganizirani otkup proizvoda. Drugi najčešći problem koji navode proizvođači (25,71 %) odnosi se na visoke cijene reprodukcijskog materijala za ekološku proizvodnju koji je također teško dobavljiv na tržištu. Dio ispitanika (20 %) smatra da je problem u tome što potrošači nisu dovoljno educirani o razlikama između konvencionalnih i ekoloških proizvoda. Pojedini ispitanici (17,14 %) smatraju da nadležne institucije ne podupiru dovoljno male proizvođače ekoloških proizvoda. Neki proizvođači (11,43 %) smatraju da je problem i u nedovoljnoj educiranosti proizvođača ekoloških proizvoda zatim nedostatku radne snage (8,57 %), kompliciranoj administraciji (5,71 %) i ovisnosti proizvodnje o vremenskim prilikama (5,71 %). Ostali ograničavajući čimbenici koje navode ispitanici (17,14 %) odnose se na probleme u zakonodavstvu, promociji ekoloških proizvoda, zakupu poljoprivrednog zemljišta, slaboj kupovnoj moći, slabom sustavu certifikacije i nedovoljnoj suradnji ekoloških proizvođača (Tablica 2).

T. Šugar, K. Brščić, T. Kocković Zaborski: Mišljenje proizvođača ekoloških prehrambenih proizvoda…Zbornik Veleučilišta u Rijeci, Vol. 8 (2020), No. 1, pp. 455-469
464
Tablica 2. Ograničavajući čimbenici u razvoju ekološke poljoprivrede u Hrvatskoj
Čimbenici Udio (%) NNeorganizirano tržište ekoloških proizvoda (loša kontrola na
tržištu, nedostatna količina proizvedenih ekoloških proizvoda, lažno predstavljanje proizvođača na tržištu, neorganizirani otkup
proizvoda)
37,14 13
Visoke cijene reprodukcijskog materijala za ekološku proizvodnju 25,71 9Nedovoljna edukacija potrošača o razlikama između
konvencionalnih i ekoloških proizvoda20,00 7
Nedostatak potpore malim proizvođačima ekoloških proizvoda od strane nadležnih institucija
17,14 6
Ostalo (zakonodavstvo, promocija ekoloških proizvoda, zakup poljoprivrednog zemljišta, slaba kupovna moć, slab sustav
certifikacije, nedovoljna suradnja proizvođača)17,14 6
Nedovoljna educiranost proizvođača ekoloških proizvoda 11,43 4Nedostatak radne snage 8,57 3
Komplicirana administracija 5,71 2Ovisnost proizvodnje o vremenskim prilikama (npr. navodnjavanje u
periodu suše)5,71 2
Izvor: rezultati istraživanja, studeni 2015.
Za ocjenu utjecaja pojedinih čimbenika (elemenata) iz okruženja na razvoj ekološke proizvodnje ispitanicima su ponuđene tvrdnje koje su ispitanici trebali ocijeniti ocjenom od 1 do 5 obzirom na važnost. Cilj je bio saznati što ispitanici smatraju važnim za razvoj ekološke poljoprivrede. Prema dobivenim rezultatima najvažniji čimbenici za razvoj ekološke proizvodnje su uređeni zakonski okvir i sustav nadzora za ekološku poljoprivredu. Ostale elemente također smatraju važnima za daljnji razvoj ekološke proizvodnje, a to su povećanje potražnje za ekološkim proizvodima i financijski poticaji za ekološku proizvodnju (Tablica 3).
Tablica 3. Mišljenje proizvođača ekoloških proizvoda o važnosti pojedinih elemenata iz okruženja koji utječu na razvoj ekološke poljoprivrede
Elementi iz okruženja koji utječu na razvoj ekološke poljoprivredeAritmetička
sredinaSD
Uređeni zakonski okvir za ekološku poljoprivredu 4,56 0,71Uređeni sustav nadzora 4,54 0,78
Trend povećanja potražnje ekoloških proizvoda 4,49 0,93Poticaji u ekološkoj poljoprivredi 4,10 1,28
Izvor: rezultati istraživanja, studeni 2015.
Istraživanje je pokazalo da je gotovo polovina ispitanika (48,33 %) vrlo zadovoljna ili zadovoljna prodajom i potražnjom ekoloških proizvoda. Osim toga, najvažniji razlozi donošenja odluke

T. Šugar, K. Brščić, T. Kocković Zaborski: Mišljenje proizvođača ekoloških prehrambenih proizvoda…Zbornik Veleučilišta u Rijeci, Vol. 8 (2020), No. 1, pp. 455-469
465
proizvođača ekoloških proizvoda o sudjelovanju na manifestaciji “Pazi što jedeš” su prodaja, promocija vlastitih ekoloških proizvoda, izgradnja imidža i umrežavanje s ostalim proizvođačima. Kod ocjene manifestacije “Pazi što jedeš”, proizvođači su u potpunosti zadovoljni organizacijom, međutim manje zadovoljni prodajom proizvoda. Stoga njihove preporuke za povećanje prodaje proizvoda su bolja promocija i oglašavanje manifestacije te veći broj proizvođača ekoloških proizvoda na manifestaciji radi raznovrsnije ponude.
5. DISKUSIJA
Prema dobivenim rezultatima, većina ispitanika (92,68 %) navela je da je udruživanje proizvođača ekoloških proizvoda potrebno radi zajedničkog nastupa na tržištu i plasmana proizvoda. U istraživanju provedenom u sjeverozapadnom dijelu Hrvatske također je potvrđeno da proizvođači ekoloških proizvoda imaju pozitivan stav prema udruživanju (Zrakić i sur., 2017). Renko i Bošnjak (2009) također naglašavaju potrebu za udruživanjem proizvođača ekoloških proizvoda kako bi mogli jamčiti dostatnu količinu i kvalitetu ekoloških proizvoda potrebnu za nastup na tržištu i distribuciju ekoloških proizvoda u supermarketima. Pejnović i sur. (2012) zaključili su prema mišljenju proizvođača ekoloških proizvoda da su neorganizirano tržište, plasman proizvoda i nedovoljno razvijena ekološka svijest u društvu glavni ograničavajući čimbenici za brži razvoj ekološke poljoprivrede u Hrvatskoj. Iste razloge, navode i ispitanici u ovom istraživanju, naglašavajući teškoću plasmana proizvoda na tržište te nedovoljnu educiranost kupaca o ekološkim proizvodima kao osnovne probleme koje je važno riješiti za budući razvoj tržišta ekoloških proizvoda. Pejnović i sur. (2012) ističu kako 70 % ispitanika navodi da će se i dalje baviti ekološkom poljoprivredom, a najčešći način plasmana ekoloških proizvoda u Hrvatskoj je prodaja na sajmovima. Analizom podataka provedenog istraživanja dobiveni su isti rezultati. Naime, 70,73 % ispitanika navodi da će se i dalje baviti ekološkom proizvodnjom i u budućnosti namjerava proširiti proizvodnju, a kao najčešći način prodaje navode sajmove (85,37 %). Time se opravdava postojanje i daljnji razvoj sajmova kao najčešćeg načina plasmana ekoloških proizvoda. Isti rezultati kao u istraživanju Pejnović i sur. (2012) potvrđeni su za obrazovnu strukturu proizvođača ekoloških proizvoda gdje više od polovice ispitanika ima završenu srednju stručnu spremu, ali je i sve veći broj onih koji su završili višu i visoku stručnu spremu što je “odraz je rastućeg značenja tog oblika poljoprivrede u sustavu vrijednosti, ali i društveno-ekonomskoj strukturi društva”. Gugić i sur. (2017) utvrdili su pomoću SWOT analize glavne čimbenike koji utječu na perspektivu razvoja ekološke poljoprivrede u Hrvatskoj, a neke od slabosti su nerazvijenost domaćeg tržišta ekoloških proizvoda, previsoke cijene, nedovoljna kontrola ekoloških proizvoda na tržištu, nedostatna ekološka proizvodnja itd. Provedenim istraživanjem prema mišljenju proizvođača ekoloških proizvoda potvrđeno je da najveći problem predstavljaju neorganizirano domaće tržište ekoloških proizvoda što podrazumijeva nedovoljnu kontrolu na tržištu, nedostatne količine proizvoda na tržištu i nedostatnu proizvodnju te lažno predstavljanje proizvođača na tržištu. Navedeno upućuje na potrebu dodatnih ulaganja u edukaciju potrošača i proizvođača u cilju daljnjeg razvoja tržišta ekoloških proizvoda.

T. Šugar, K. Brščić, T. Kocković Zaborski: Mišljenje proizvođača ekoloških prehrambenih proizvoda…Zbornik Veleučilišta u Rijeci, Vol. 8 (2020), No. 1, pp. 455-469
466
6. ZAKLJUČAK
U posljednjih nekoliko godina zabilježen je trend rasta površina pod ekološkom proizvodnjom te se povećao i broj proizvođača ekoloških proizvoda, kako u svijetu i Europskoj uniji, tako i u Hrvatskoj. U radu su prikazani rezultati istraživanja koji su provedeni s 41 proizvođačem ekoloških proizvoda. Što se tiče ekološke proizvodnje, prosječna veličina površina pod ekološkim uzgojem je 5,4 ha, a prosječan broj godina u sustavu kontrole je oko 5 godina te je za 56 % ispitanika navedena djelatnost jedini izvor prihoda. Najviše ispitanika bavi se uzgojem voća (58,54 %) i povrća (41,46 %), a najčešći oblik organizacije je obiteljsko poljoprivredno gospodarstvo (87,8 %). U istraživanju većina je ispitanika (70,73 %) navela da u budućnosti planira proširiti postojeću ekološku proizvodnju što pretpostavlja da su zadovoljni dosadašnjim stečenim iskustvom u ekološkoj proizvodnji, ali i uspješnim plasmanom svojih proizvoda. Radi još uspješnijeg nastupa na tržištu, čak 92,68 % ispitanika smatra da je potrebno udruživanje proizvođača ekoloških proizvoda. Prema dobivenim rezultatima, možemo utvrditi da su proizvođači voljni surađivati, a njihovim udruživanjem možda bi mogli otkloniti i/ili umanjiti neke od negativnih aspekata proizvodnje. Proizvođači ekoloških proizvoda smatraju da su uređeni zakonodavni okvir i sustav kontrole najvažniji elementi koji utječu na daljnji razvoj ekološke proizvodnje. Također, navode i veliki broj problema s kojima se susreću u proizvodnji kao što su primjerice: pojedinačno premale količine proizvodnje za plasman na tržištu, slaba konkurentnost na tržištu, nedovoljna povezanost proizvođača ekoloških proizvoda, visoki troškovi proizvodnje, otežana nabava i visoka cijena ekološkog repromaterijala. Rezultati istraživanja pokazuju da su dosad najvažniji razlozi sudjelovanja izlagača na manifestaciji “Pazi što jedeš” prodaja i promocija proizvoda. Temeljem navedenog predlaže se kreiranje i organizacija novih sajmova koji promoviraju ekološke poljoprivredne proizvode. Za to postoji više razloga. Sajmovi su dobar oblik podrške proizvođačima u prodaji i promociji vlastitih ekoloških proizvoda. Osim toga, organiziranjem sajmova podiže se svijest javnosti o dobrobiti ekološke poljoprivrede i važnosti uloge proizvođača ekoloških proizvoda u proizvodnji hrane i očuvanju okoliša. Ograničenje navedenog istraživanja odnosi se na veličinu i odabir uzorka. Naime, istraživanje je provedeno na jednom sajmu, a broj anketiranih proizvođača ekoloških proizvoda je relativno mali te stoga nije reprezentativan. Za buduća istraživanja potrebno je obuhvatiti veći broj proizvođača ekoloških proizvoda kako bi se utvrdilo opće stanje razvoja ekološke proizvodnje, identificirali ograničavajući čimbenici i najčešći problemi s kojima se proizvođači susreću. Navedeno istraživanje može poslužiti kao informativna podloga u kreaciji budućih istraživanja na temu ekološke poljoprivrede. U budućim istraživanjima bilo bi korisno utvrditi osnovne razlike između proizvođača ekoloških proizvoda i proizvođača koji se bave konvencionalnom poljoprivrednom proizvodnjom, utvrditi socio-demografske razlike i najčešće probleme s kojima se poljoprivredni proizvođači susreću. Time, bi se utvrdile i diferencirale osnovne potrebe proizvođača u obje kategorije radi kreiranja budućih strategija za efikasniji razvoj poljoprivredne proizvodnje.
ZAHVALAZahvaljujemo se svim proizvođačima ekoloških proizvoda na suradnji i što su ispunjavanjem ankete doprinijeli ovom istraživanju.

T. Šugar, K. Brščić, T. Kocković Zaborski: Mišljenje proizvođača ekoloških prehrambenih proizvoda…Zbornik Veleučilišta u Rijeci, Vol. 8 (2020), No. 1, pp. 455-469
467
REFERENCESAnić, I. D., Jelenc, L., Šebetić, N. (2015) “Istraživanje demografskih obilježja i ponašanja kupaca ekoloških prehrambenih
proizvoda u Karlovačkoj županiji“, Ekonomska misao i praksa, 2, pp. 367-388.
Aryal, K. P., Chaudhary, P., Pandit, S., Sharma, G. (2009) “Consumers´willingness to pay for organic products: a case from Kathmandu Valley“, The Journal of Agriculture and Environment, 10, pp. 15-26. https://doi.org/10.3126/aej.v10i0.2126
Batelja Lodeta, K., Gugić, J., Čmelik, Z. (2011) “Ekološka poljoprivreda u Europi i Hrvatskoj s osvrtom na stanje u voćarstvu“, Pomologica Croatica: Glasilo Hrvatskog agronomskog društva, 17(3-4), pp. 135-148.
Bimbo, F., Bonanno, A., Viscecchia, R. (2016) “Do health claims add value? The role of functionality, effectiveness and brand“, European Review of Agricultural Economics, 43(5), pp. 761-780. https://doi.org/10.1093/erae/jbw002
Chen, M. F. (2009) “Attitude toward organic foods among Taiwanese as related to health consciousness, environmental attitudes, and the mediating effects of a healthy lifestyle“, British Food Journal, 111(2), pp. 165-178. https://doi.org/10.1108/00070700910931986
Državni zavod za statistiku (2017), dostupno na: www.dzs.hr (13.3.2017.)
Eurostat, Europski ured za statistiku (2017), dostupno na: https://ec.europa.eu/eurostat/statistics-explained/index.php?title=Organic_farming_statistics#Organic_production (28.4.2019.)
Eurostat, Europski ured za statistiku (2019), dostupno na: http://appsso.eurostat.ec.europa.eu/nui/show.do?dataset=org_coptyp&lang=en (6.5.2019.)
Gugić, M., Grgić, I., Dorbić, B., Šuste, M., Džepina, M., Zrakić, M. (2017) “Pregled stanja i perspektiva razvoja ekološke poljoprivrede u Republici Hrvatskoj“, Glasnik zaštite bilja, 3, pp. 20-30.
Ham, M., Pap, A., Stanić, M. (2018) “What drives organic food purchasing? - Evidence from Croatia“, British Food Journal, 120(4), pp. 734-748. https://doi.org/10.1108/BFJ-02-2017-0090
Ham, M. (2019) “Beliefs about effects of organic products and their impact on intention to purchase organic food“, Ekonomski vjesnik : Review of Contemporary Entrepreneurship, Business, and Economic Issues, 32(1), pp. 69-80.
Kuran, L. M., Mihić, M. (2014) “Applying the Theory of Planned Behavior in the Purchase of Organic Food“, Market/Tržište, 26(2), pp. 179-197.
Ministarstvo poljoprivrede (2019), dostupno na: https://poljoprivreda.gov.hr/ (30.4.2019.)
Magdoff, F. (2007) “Ecological agriculture: Principles, practices, and constraints“, Renewable Agriculture and Food Systems, 22(2), pp. 109-117. https://doi.org/10.1017/S1742170507001846
Norton L. R. (2016) “Is it time for a socio-ecological revolution in agriculture?“, Agriculture, Ecosystems and Environment, 235, 13-16. https://doi.org/10.1016/j.agee.2016.10.007
Orlić, O. (2014) “Grupe solidarne razmjene. Počeci ekonomije solidarnosti u Hrvatskoj“, Etnološka tribina: Godišnjak Hrvatskog etnološkog društva, 44(37), pp. 72-88.
Paul, J., Rana, J. (2012) “Consumer behavior and purchase intention for organic food“, Journal of Consumer Marketing, 29 (6), pp. 412-422. https://doi.org/10.1108/07363761211259223
Pejnović, D., Ciganović, A., Valjak, V. (2012) “Ekološka poljoprivreda Hrvatske: problemi i mogućnosti razvoja, Hrvatski geografski glasnik, 74(1), pp. 141-159. https://doi.org/10.21861/HGG.2012.74.01.08
Pellegrini, G., Farinello, F. (2009) “Organic consumers and new lifestyles: An Italian country survey on consumption patterns“, British Food Journal, 111(9), pp. 948-974. https://doi.org/10.1108/00070700910992862
Petljak, K. (2011) “Pregled razvoja i obilježja ekološke poljoprivrede u Republici Hrvatskoj“, Ekonomski Vjesnik/Econviews: Review of contemporary business, entrepreneurship and economic issues, 24(2), pp. 382-395.
Radman, M. (2005) “Consumer consumption and perception of organic products in Croatia“, British Food Journal, 107(4), pp. 263-273. https://doi.org/10.1108/00070700510589530

T. Šugar, K. Brščić, T. Kocković Zaborski: Mišljenje proizvođača ekoloških prehrambenih proizvoda…Zbornik Veleučilišta u Rijeci, Vol. 8 (2020), No. 1, pp. 455-469
468
Rengel, A. (2013) “Hrvatski eko-proizvodi na tržištu EU“, Agronomski glasnik, 75(1), pp. 55-68.
Renko, S., Bošnjak, K. (2009) “Aktualno stanje i perspektive budućeg razvoja tržišta ekološke hrane u Hrvatskoj“, Ekonomski pregled, 60(7-8), pp. 369-395.
Rodríguez, E., Lacaze, V., Lupín, B. (2007) “Willingness to pay for organic food in Argentina: evidence from a consumer survey“, EAAE Seminar,“International Marketing and Trade of Quality Food Products“, Bologna, Italy, pp. 187-213.
Rödiger, M., Plaßmann, S., Hamm, U. (2016) “Organic consumers’ price knowledge, willingness-to-pay and purchase decision“, British Food Journal, 118(11), pp. 2732-2743. https://doi.org/10.1108/BFJ-04-2016-0164
Sakagami, M., Sato, M., Ueta, K. (2006) “Measuring consumer preferences regarding organic labelling and the JAS label in particular“, New Zealand Journal of Agricultural Research, 49(3), pp. 247-254. https://doi.org/10.1080/00288233.2006.9513715
Sanjuán, A. I., Sánchez, M., Gil, J. M., Gracia, A., Soler, F. (2003) “Brakes to organic market enlargement in Spain: consumers’ and retailers’ attitudes and willingness to pay“, International Journal of Consumer Studies, 27(2), pp. 134-144. https://doi.org/10.1046/j.1470-6431.2003.00295.x
Sarjanović, I. (2014) “The role of community supported agriculture in the development of organic agriculture in Croatia“, Geoadria, 19(1), pp. 1-25. https://doi.org/10.15291/geoadria.37
Siljan, D., Cerjak, M. (2017) “The first organic farmer’s market in Croatia–satisfaction of producers and consumers“, Agroeconomia Croatica, 7(663-2017-3100), pp. 88-97.
Sriwaranun, Y., Gan, C., Lee, M., Cohen, D. A. (2015) “Consumers’ willingness to pay for organic products in Thailand“, International Journal of Social Economics, 42(5), pp. 480-510. https://doi.org/10.1108/IJSE-09-2013-0204
Štefanić, I., Štefanić, E., Haas, R. (2001) “What the customers really want: organic food market in Croatia?“, Die Bodenkultur, 52(4), pp. 243-248.
The World of Organic Agriculture (2017), dostupno na: http://www.ifoam.bio/sites/default/files/press-release-world-2017-english.pdf (20.2.2017.)
The World of Organic Agriculture (2019), dostupno na: https://shop.fibl.org/CHde/mwdownloads/download/link/id/1202/?ref=1 (20.2.2019.)
Vapa-Tankosić, J., Ignjatijević, S., Kranjac, M., Lekić, S., Prodanović, R. (2018) “Willingness to pay for organic products on the Serbian market“, International Food and Agribusiness Management Review, 21(6), pp. 791-801. https://doi.org/10.22434/IFAMR2017.0068
Zrakić, M., Jež Rogelj, M., Grgić, I. (2017). “Organic agricultural production on family farms in Croatia“, Agroecology and Sustainable Food Systems, 41(6), 635-649. https://doi.org/10.1080/21683565.2017.1290731

T. Šugar, K. Brščić, T. Kocković Zaborski: Mišljenje proizvođača ekoloških prehrambenih proizvoda…Zbornik Veleučilišta u Rijeci, Vol. 8 (2020), No. 1, pp. 455-469
469
Professional paper https://doi.org/10.31784/zvr.8.1.4 Received: 18. 11. 2019. Accepted: 3. 1. 2020.
THE OPINION OF PRODUCERS OF ORGANIC FOOD PRODUCTS ABOUT THE POSSIBILITIES OF ORGANIC
AGRICULTURE DEVELOPMENT IN CROATIATina Šugar
PhD Student, Assistant, Institute of Agriculture and Tourism, Karla Huguesa 8, 52 440 Poreč, Croatia; e-mail: [email protected]
Kristina Brščić PhD, Head of the Department of Tourism, Institute of Agriculture and Tourism, Karla Huguesa 8,
52 440 Poreč, Croatia; e-mail: [email protected]
Tanja Kocković Zaborski PhD, Curator, Ethnographic Museum of Istria, Trg Istarskog razvoda 1275, No. 1, 52 000 Pazin, Croatia;
e-mail: [email protected]
ABSTRACTIn the last few years, the trend of growing areas of organic agricultural land in Croatia has been recorded. The development of organic production is increasingly encouraging as a production model which is of crucial importance for the conservation of the most important natural resources in food production, in Croatia and Europe. The paper aimed to determine the opinions of organic producers about the limitations and possibilities of organic agriculture development in Croatia. In the paper, the results of the survey conducted in the “Watch What You Eat” event held in Pula in 2015 were presented. The participants were exhibitors on the fair, producers of organic food products from Croatia. In total, 41 producers participated in the study. The main results of the study are general information on organic food production, type of production and distribution channels. Also, the opinion of producers on the most common problems that occur in organic food production was obtained. The results can serve as information on producer’s views on organic food production problems for the development of future actions towards to enhancement of organic food production in Croatia as well as a base for the creation of future researches.
Key words: organic agriculture, organic producers, organic food products, Croatia
Creative Commons Attribution – NonCommercial 4.0 International License


Uredništvo: Politika časopisa i upute autorimaZbornik Veleučilišta u Rijeci, Vol. 8 (2020), No. 1, pp. 471-480
471
POLITIKA ČASOPISA I UPUTE AUTORIMA
Zbornik Veleučilišta u Rijeci je recenzirani časopis otvoren za suradnju znanstvenicima i stručnjacima iz područja prirodnih, biotehničkih, tehničkih i društvenih znanosti. U Zborniku se objavljuju radovi koji su po svom sadržaju važni za znanstvenu i stručnu javnost iz različitih područja ekonomije, informacijskih i komunikacijskih tehnologija, računarstva, prometa i prometne tehnologije, agronomije, enologije i primijenjene matematike.
Tekstovi se objavljuju na hrvatskom ili engleskom jeziku.
Politika uređivanja
Uredništvo zaprima prijave radova na propisanom obrascu (obrazac prijave sadrži i prošireni sažetak od 250 - 500 riječi, pisano u 3. licu) te rukopis (pisan korištenjem Predloška). Potpisom Izjave o autorskim pravima u obrascu Prijava rada autor potvrđuje izvornost svoga članka i svoje autorstvo. Da bi se izbjeglo autorovo odustajanje od objave članka u tijeku recenzentskog postupka, autor se obvezuje svojim potpisom i na prihvaćanje recenzentskog postupka.
Zaprimljene prijave upućuju se u postupak prosudbe (assessment process) članovima Uredništva (prema području rada), ali i ekspertima koji nisu dio Uredništva, u slučaju specifičnog sadržaja. Uredništvo pregledava dostavljene rukopise, te donosi odluke za daljnji postupak i to:
a) koji će rukopisi, u slučaju potrebe, biti vraćeni autoru sa sugestijama, preporukama i primjedbama radi poboljšanja, prije svega, metodološke prezentacije građe istraživanja;
b) koji će rukopisi biti upućeni u postupak recenziranja (reviewing process);
c) koji će rukopisi biti odbijeni, budući:
• da tema ne zadovoljava zahtijevanu znanstvenu/stručnu razinu;
• da je autor članak sa sličnom temom već objavio;
• da tema ne ispunjava kriterije zbornika, osobito ako je sadržaj izvan koncepcije ori-jentacije zbornika te ne ispunjava metodološke standarde kojih se zbornik mora pri-državati.
Ako članak nije prihvaćen, Uredništvo autoru šalje obavijest, ali rukopis se ne vraća. Ako je autor usvojio primjedbe i sugestije iz postupka prosudbe i poboljšao tekst prema zahtjevu navedenog postupka, rukopis se šalje u postupak recenziranja.
Prikazi knjiga, doktorskih disertacija, međunarodnih konferencija i drugih znanstvenih skupova ne podliježu recenziji. Uredništvo odabire i uređuje prikaze koji su relevantni za objavljivanje u zborniku sukladno koncepciji uređivačke politike. Prikazi knjiga i ostalih publikacija trebaju biti napisani kao kritičke recenzije, a opseg prikaza ne bi trebao prelaziti osam kartica.
Uredništvo: Politika časopisa i upute autorimaZbornik Veleučilišta u Rijeci, Vol. 8 (2020), No. 1, pp. 471-480
472
Prijevodi značajnih radova, odnosno onih koji po svom sadržaju mogu pobuditi interes znanstvene i stručne javnosti, također se objavljuju u časopisu, a njihov opseg ne bi trebao biti veći od 20 kartica.
Prilozi trebaju biti pisani standardnim jezikom bez pravopisnih i gramatičkih grešaka. Autori su odgovorni za jezičnu ispravnost teksta. Prije konačne objave prihvaćenih članaka, probni će primjerak pripremljenog teksta biti poslan autorima na korekturu, pri čemu je u ovoj fazi moguće ispraviti samo tiskarske pogreške.
Uredništvo časopisa se odriče odgovornosti za jezične i tiskarske pogreške.
Ako nitko od autora ne govori hrvatskim jezikom, Uredništvo će osigurati prijevod sažetka članka (uključujući naslov i ključne riječi) na hrvatski jezik.
Kako bi osigurali najvišu razinu etičkih standarda, uredništvo časopisa Zbornik Veleučilišta u Rijeci slijedi preporuke COPE Code of Conduct for Journal Editors (https://publicationethics.org/).
Postupak recenziranja
Svi članci obvezno se recenziraju. Za svaki članak predviđena su dva recenzenta i to anonimna i nezavisna. Imena autora također su za recenzente anonimna. Recenzenti pišu recenziju prema dobivenim uputama i na propisanom obrascu. Ako članak, prema stajalištu recenzenta, ne udovoljava međunarodnim standardima i kriterijima časopisa, Uredništvo članak ne prihvaća. Ako recenzent članak pozitivno ocijeni, može ga kategorizirati u jednu od kategorija vrsnoće:
• Izvorni znanstveni članak (Original scientific paper) - originalno znanstveno djelo u kojem su izneseni novi rezultati fundamentalnih ili primijenjenih istraživanja. Članak sastavljen tako da se može na temelju datih informacija:
o reproducirati metodološki i računski postupak i dobiti rezultate s jednakom toč-nošću ili unutar granice stupnja slobode, kako to navodi autor; ili
o ponoviti autorova opažanja i prosuditi njegove analize; ili
o provjeriti točnost analiza i dedukcija na kojima se temelje autorovi nalazi.
• Prethodno priopćenje (Preliminary communication) - znanstveni članak koji obavezno sa-drži jednu ili više znanstvenih informacija, ali bez dovoljno pojedinosti koje bi omogućile čitatelju provjeru iznesenih znanstvenih spoznaja.
• Izlaganje sa znanstvenog skupa (Conference paper) - može biti objavljeno samo kao cjelo-vit članak koji je prethodno referiran na znanstvenom skupu, a u obliku cjelovitog članka nije objavljen u zborniku skupa.
• Pregledni rad (Review article) - rad koji sadrži temeljit i obuhvatan kritički pregled određe-ne problematike, no bez značajnije izvornosti rezultata; sadrži posebni problem o kojem je već publiciran znanstveni rad, ali mu se pristupa na nov način.
• Stručni članak (Professional paper) - sadrži korisne priloge iz struke i za struku.
Recenzenti se moraju pridržavati Uputa za recenzente.
Uredništvo: Politika časopisa i upute autorimaZbornik Veleučilišta u Rijeci, Vol. 8 (2020), No. 1, pp. 471-480
473
Nakon što budu napisane, Uredništvo analizira recenzije. Komentari recenzenata dostavljaju se autoru nakon primitka obje recenzije. Ako je to potrebno, od autora se traži da rad prilagodi zahtjevima recenzenta. U slučajevima gdje se ne dovodi u pitanje kvaliteta i autoriziranost teksta, Uredništvo također može intervenirati. Ukoliko je potrebno, Uredništvo može zatražiti mišljenje trećeg nezavisnog recenzenta.
Autor usklađeni rad dostavlja Uredništvu uz obrazac koji sadrži odgovore / komentare na preporuke recenzenata. Za svakog recenzenta sastavlja se zaseban Obrazac odgovora. Uredništvo utvrđuje usklađenost članka s primjedbama recenzenata.
Objavljuju se samo kategorizirani radovi koji imaju dvije pozitivne recenzije. Glavni i odgovorni urednik, nakon završetka postupka recenziranja te izmjena i dopuna tekstova koje su unijeli autor i Uredništvo, predlaže redoslijed prihvaćenih članaka u sadržaju.
Kriteriji redoslijeda jesu:
(1) kategorizacija sukladno stupnju znanstvene vrsnoće;
(2) ako su recenzenti različito kategorizirali članak, glavni i odgovorni urednik predlaže od-luku Uredništvu, u pravilu, u prilog autora, tj. višu kategoriju;
(3) uvažavanje aktualnosti teme, autora i interesa zbornika u slučaju konkurentnosti iste razine znanstvene vrsnoće (kategorije).
Politika otvorenog pristupa
Časopis Zbornik Veleučilišta u Rijeci podržava politiku otvorenog pristupa koja omogućuje neograničeni pristup objavljenim radovima kako bi se doprinijelo lakšoj razmjeni znanja.
Puni tekst objavljenih radova besplatno se smije koristiti za osobne, edukacijske ili istraživačke svrhe uz poštivanje autorskih prava autora i izdavača.
Prava na korištenje radova definirana su licencom Creative Commons CC BY-NC 4.0. Sukladno navedenom, korisnici radove smiju besplatno čitati, preuzimati, kopirati, distribuirati, tiskati, prerađivati ili koristiti ih na druge zakonite načine, uz ispravno navođenje izvornika i nekomercijalnu svrhu uporabe.
Potpisivanjem Prijave rada autor iskazuje suglasnost s objavom dostavljenog rada u časopisu Zbornik Veleučilišta u Rijeci prema pravilima licence CC BY-NC.
Radove objavljene u Zborniku Veleučilišta u Rijeci dozvoljeno je pohranjivati u institucijske i tematske repozitorije uz osiguravanje poveznica na web stranice časopisa i Hrčka.
Prema politici samoarhiviranja, dozvoljeno je pohraniti recenziranu ili izdavačku verziju rada.
Autorska prava
Potpisivanjem obrasca prijave s Izjavom o autorskim pravima autori izjavljuju da članak nije objavljen u sadašnjem ili sličnom obliku nigdje drugdje te da rukopis nije podnesen na objavu niti jednom drugom časopisu.

Uredništvo: Politika časopisa i upute autorimaZbornik Veleučilišta u Rijeci, Vol. 8 (2020), No. 1, pp. 471-480
474
Potpisivanjem prijavnog obrasca i Izjave o autorskim pravima autori ustupaju Veleučilištu u Rijeci autorsko pravo rukopisa namijenjenog za objavljivanje ako i kada rad bude prihvaćen za objavljivanje. Navedeno uključuje prava na distribuciju rada u svim oblicima i medijima, to jest prostorno i vremenski neograničen prijenos sljedećih prava: pravo reprodukcije, uključujući pravo na pohranu u elektroničkom obliku, pravo na distribuciju i pravo na osiguravanje dostupnim rada javnosti.
Prihvaćanjem radova za objavljivanje, izdavač postaje nositelj autorskih prava, ako u sporazumu nije navedeno drukčije.
Potpisivanjem prijavnog obrasca (Izjave o autorskim pravima) autor daje suglasnost za objavljivanje članka prema pravilima CC BY-NC licence.
Kada je jednom prihvaćen, članak obvezuje autora, stoga ga ne smije objaviti drugdje bez dozvole Uredništva Zbornika koje je članak prihvatilo, a i tada isključivo uz podatak o tome gdje je članak objavljen prvi put.
Plagijarizam
Podnošenjem rukopisa s ispunjenim i potpisanim prijavnim obrascem koji uključuje i Izjavu o autorskim pravima, autori izjavljuju da je tekst rada njihovo originalno djelo, da ne sadrži plagirane dijelove te da nije objavljen nigdje drugdje, niti je poslan u bilo koji drugi časopis.
U slučaju da je utvrđen plagijarizam, članak će biti uklonjen iz časopisa i zamijenjen bilješkom u kojoj su navedena imena autora i opis plagijarizma. Autori i njihove institucije bit će obaviješteni.
Da bi se otkrio i izbjegao plagijarizam, svaki se rukopis provjerava korištenjem alata Crossref Similarity Check (iThenticate).
UPUTE AUTORIMA ZA OBLIKOVANJE TEKSTA I PRIJAVU RADA
Sadržaj članka
Rad treba biti relevantan za međunarodnu znanstvenu i stručnu javnost s jasno naznačenim ciljevima i rezultatima istraživanja, zaključkom, referencama u tekstu i bibliografskim jedinicama na kraju rada. Ideje u radu moraju biti originalne i trebaju značajno pridonositi razvoju predmeta istraživanja, a metodologija mora biti jasno opisana.
Autori u članku moraju posebnu pozornost obratiti odgovarajućem strukturiranju teksta i njegovoj odgovarajućoj dužini sukladno s priznatim standardima znanstvene metodologije.
Rad se dostavlja s obrascem prijave (priložen obrazac Prijava rada) u okviru kojega se potpisuje i Izjava o autorskim pravima, suglasnost za upućivanje rada u postupak recenzije te Izjava - privola za prikupljanje, obradu i objavu osobnih podataka (ukoliko je više autora, svaki autor mora potpisati izjave i suglasnost).
Prijava rada sadrži: naslov članka, ime i prezime autora ili, ako je više koautora, za svakog ponaosob znanstveno zvanje, stručnu spremu, znanstveni interes, odnosno područje kojim se autor bavi,

Uredništvo: Politika časopisa i upute autorimaZbornik Veleučilišta u Rijeci, Vol. 8 (2020), No. 1, pp. 471-480
475
naziv i adresu institucije u kojoj je autor zaposlen, broj telefona, broj faksa i adresu e-pošte. Svi navedeni podaci moraju biti napisani:
– na hrvatskom jeziku
– na engleskom jeziku, ako izvorni jezik članka nije engleski.
Prva stranica članka treba sadržavati: naslov članka, sažetak i ključne riječi na jeziku članka (na prvoj stranici članka koji se dostavlja ne navode se autori!). Na kraju članka isti podaci daju se na:
– hrvatskom jeziku (ako je tekst članka na engleskom jeziku), te
– na engleskom jeziku, ako izvorni jezik članka nije engleski.
Tekst članka mora početi uvodom, a sadrži još glavna poglavlja, fusnote, tablice, grafikone, sheme, reference u tekstu, zaključak i popis korištene literature.
Tehničko uređivanje članka
Tekstovi se pišu u Microsoft Word Windows programu (95 i viši). Opseg rada ne smije prelaziti 7000 riječi, a tekst treba biti pisan u fontu Arial, veličine 11, s jednostrukim proredom (single), poravnan s obje strane, pisan od početka reda (bez uvlačenja prvog retka ulomka), s marginama od 2,5. Opseg rada može biti veći samo ako je to dogovoreno s glavnim i odgovornim urednikom. Ako je u tekstu potrebno posebno označiti neku riječ ili rečenicu, koriste se pisana kosa slova (italic), nikako ne podebljana (bold). Za odvajanje odlomaka koristi se dvostruki razmak.
Fusnote se rabe samo za dodatna pojašnjenja osnovnoga teksta. One se ne koriste kao poziv na Literaturu. Označavaju se na dnu stranice, u kontinuitetu, kroz cijeli članak, arapskim brojevima počevši od 1.
Naslovi poglavlja (od Uvoda do Zaključka) moraju biti kratki i jasni, te redom numerirani arapskim jednoznamenkastim brojevima. Poglavlja mogu imati i potpoglavlja koja se obavezno numeriraju s dvoznamenkastim, odnosno najviše troznamenkastim brojevima (primjer: 1; 1.1; 2.; 2.1; 2.1.1 itd.), ne više od toga.
Tablice, grafikoni i sheme moraju imati broj i naziv (piše se iznad tablice, grafikona, sheme) te izvor podataka (navodi se u podnožju u skraćenom obliku; ako je preuzeto iz određenog izvora – Prezime autora (godina); npr. Izvor: Driankov et al. (1996)). Numeriraju se u kontinuitetu arapskim brojevima (posebno grafikoni, posebno sheme).
Važna napomena: Ako tablica, grafikon ili slika sadržavaju posebne znakove te su rađeni u posebnom programu, dostavljaju se u posebnoj datoteci s točno navedenim i označenim položajem na kojem dolaze u tekstu.
Članak mora zadovoljavati sve tehničke propozicije navedene u ovim uputama.
Stil i organizacija teksta
Autori se obvezno moraju pridržavati znanstvene metodologije prezentacije građe u pisanju tekstova koja je uobičajena u znanstvenim publikacijama (Harvard style).

Uredništvo: Politika časopisa i upute autorimaZbornik Veleučilišta u Rijeci, Vol. 8 (2020), No. 1, pp. 471-480
476
To zahtijeva sljedeći pristup:
(1) Naslov i organizacija prezentacije građe:
Naslov je najvažniji sažetak rada koji mora odražavati sadržaj i svrhu rada. Mora biti jasan, koncizan i informativan (veličina fonta 14).
Građu se raspoređuje u dijelove kao što su:
• Sažetak (Abstract) – ispod naslova
• Ključne riječi
• Uvod
• Metodologija/metoda/model/koncepcija analize – u drugom poglavlju
• Empirijski podaci (dokumentacijska podloga) i analiza – slijede u trećem
• poglavlju.
• Rezultate i diskusiju – prezentira se u četvrtom poglavlju
• Zaključci – (naravno) slijede na kraju.
(2) Sadržaj pojedinih dijelova prezentirane građe:
a. Sažetak – na skraćeni način opisuje sadržaj članka, sadrži opći prikaz teme i ispisuje se u 150 - 250 riječi single spaced, veličina fonta 10, italic, obvezno treba sadržavati:
• utvrđeni cilj istraživanja
• metodu/model/koncepciju analize
• glavni rezultat istraživanja (analize)
• temeljni zaključak istraživanja
Sažetak se ne smije pisati u odlomcima.
b. Ključne riječi – moraju odražavati suštinu sadržaja rada, a navodi se tri do pet takvih riječi (veličina fonta 10, italic).
c. Uvod – sadrži definiranje problema i predmeta istraživanja s pozivom na recen-tnu literaturu, odnosno rezultate istraživanja (taj se dio može istaknuti i u poseb-nom, tj. 2. poglavlju kao Literature review); pri kraju uvodnog dijela utvrditi radnu/e pretpostavku/e (hipotezu/e) istraživanja – o kojoj/kojima se treba očitovati (kasnije) na početku zaključaka; taj dio završiti s naznakom organizacije teksta.
d. Metodologija/Metoda/Model/Koncepcija – obično se prezentira u drugom poglavlju; metoda/model/koncepcija analize mora biti transparentno istaknuta radi eventual-nog (ponavljanja) testiranja rezultata od zainteresiranih istraživača (to je jedno od temeljnih pravila znanstvene metodologije).

Uredništvo: Politika časopisa i upute autorimaZbornik Veleučilišta u Rijeci, Vol. 8 (2020), No. 1, pp. 471-480
477
e. Empirijski podaci i analiza – sadržavaju dokumentacijsku podlogu i rezultate analize.
f. Rezultati i rasprava – objasniti rezultate, osobito njihovo ekonomsko značenje i po-ruke.
g. Zaključak – treba imati u vidu da taj dio teksta nije i ne smije biti rezime! Zaključci su autorovo originalno mišljenje (ocjena) o dobivenim rezultatima te sadrže očitovanje o polaznoj hipotezi (je li ili nije dokazana), glavne rezultate istraživanja/analize, osvrt na ograničenja i probleme u istraživanju te smjernice za buduća istraživanja.
(3) Literatura – navesti samo one naslove (izvore) koji su korišteni u tekstu! Koristi se veličina fonta 9; viseći prvi redak.
Iza teksta članka na hrvatskom jeziku i popisa literature treba priložiti sažetak članka na engleskom jeziku (do 250 riječi). Uz sažetak na engleskom jeziku navodi se i naslov članka te ključne riječi (u konačnom prihvaćenom radu za objavu navode se i podaci o autorima na engleskom jeziku).
TABLICE dolaze unutar teksta. Svi podaci u tablici stavljaju se u redove i stupce odvojene jednostrukim tankim linijama. Svaki stupac sadrži naziv i uključuje numeričku jedinicu koja se odnosi na cijeli stupac. Tako se za višeznamenkaste brojeve rabe jedan ili dva broja, a u nazivu za određeni stupac označuju se numeričke jedinice u tisućama, milijunima i sl. Tablice se numeriraju u kontinuitetu arapskim brojevima (tablica 1, tablica 2 itd.), a pored broja i naziva, moraju imati i izvor podataka.
GRAFIKONI I SHEME dolaze unutar samog teksta. Moraju imati broj, naziv i izvor podataka. Numerira ih se u kontinuitetu arapskim brojevima (posebno grafikoni, posebno slike). Izvori podataka, navode se ispod grafikona, odnosno slika.
Napomena. U tekstu se ne prepričavaju i ne ponavljaju rezultati koji su navedeni u tablicama i grafikonima, već se rabe referentne oznake koje upućuju na podatke u tablicama ili grafikonima.
REFERENCE U TEKSTU. Citirane dijelove teksta navodi se u tekstu, a ne u bilješkama. Stavlja ih se u zagrade, uz prezime autora i godinu izdanja npr. (Horvat, 2003), a u slučaju citata navodi se još i stranica (Horvat, 2003:150). Ne koristi se ibid. i sl. Svaka bilješka navodi se kao i prvi put. Ako se radi o dvojici autora: (Horvat, Courty, 2004). Ako je više autora navesti prvog i pisati et al. (Horvat et al., 2003). Ako se radi o izvoru s interneta, u referenci u tekstu navodi se samo osnovna domena (http://www.veleri.hr). Svaka referenca mora se navesti u popisu literature.
LITERATURA obuhvaća sve korištene izvore i potpune podatke o djelima koja se obvezno spominju u referencama. Popis literature piše se bez broja poglavlja i dolazi na kraju rada (poslije Zaključka). Literaturu se ne numerira. Uređuje se abecednim redom prema prezimenu autora te kronološki za radove istog autora.
Literaturu se citira prema primjerima za knjige, časopise i ostale izvore:
• Knjige: prezime, inicijali (godina) Naslov, mjesto izdavanja: ime izdavača
Mohr, L. B. (1996) Impact analysis for program evaluation, 2nd. ed. London: Sage

Uredništvo: Politika časopisa i upute autorimaZbornik Veleučilišta u Rijeci, Vol. 8 (2020), No. 1, pp. 471-480
478
Ako su dva ili tri autora, redom navesti njihova prezimena i inicijale (godinu) Naslov, mjesto izdavanja: ime izdavača
Riddersträle, J., Nordström, K. (2004) Karaoke Capitalism Management for Mankind, Harlow: Pearson Education Ltd.
Perišin, I., Šokman. A., Lovrinović, I. (2001) Monetarna politika, Pula: Sveučilište u Rijeci, Fakultet ekonomije i turizma “Dr. Mijo Mirković”
Ako je više autora (četiri ili više), navodi se prezime prvog autora nakon čega slijedi et al.
Norton, M. B. et al. (1981) A People and a Nation – A History of the United States, Boston: Houghton Mifflin Company.
• Časopisi: prezime, inicijali (godina) “Naslov članka”, naziv časopisa u kojem je objavljen, volumen(broj), stranice
Fox, S. (1994) “Empowerment as a Catalyst for Change: An Example from the Food Industry”, Supply Chain Management, 2(3), p. 29-33
Ako je više autora (četiri ili više), navodi se prezime prvog autora nakon čega slijedi et al.
Di Noia, C. et al. (1999) “Should Banking Supervision and Monetary Policy Tasks be Given to Different Agencies?”, International Finance, 2(3), p. 361-378
Ako je više radova istog autora objavljenih iste godine, uz godinu se rabe oznake “a, b, c”:
Quah, Danny Tyson. (1993 a) “Empirical Cross-section Dynamics in Economic Growth”, European Economic Review, 37(2-3), p. 426-434
Quah, Danny Tyson. (1993 b) “Galton’s Fallacy and Tests of the Convergence Hypothesis”, Scandinavian Journal of Economics, 95(4), p. 427-443
• Izvori preuzeti s interneta: prezime autora/urednika, inicijali imena, (godina), “Naslov članka”, Naslov časopisa, datum publikacije, godište, broj, stranice, adresa na internetu (datum pregleda adrese na internetu)
Ako kod izvora preuzetih s interneta nema autora: adresa na internetu (datum pregleda adrese na internetu).
Martin, C. L. (1998) “Relationship Marketing: a High-Involvement Product Attribute Approach, Journal of Product and Brand management, 7(1), p. 6-26, http://www.apmforum.com/emerald/marketing-research-asia.htm (3. 10. 2002.)
• Knjige sabranih djela: autor poglavlja/odjeljka (godina) “Naslov poglavlja/odjeljka’’. U: ime izdavača ili autora sabranih djela, Naslov sabranih djela, mjesto izdavanja: izdavač.
Silobrčić, V. (2000) “Znanstvena proizvodnost i kriteriji vrednovanja znanstvenika u Hrvatskoj’’. U: Sunko, U. D. (ur.) Znanost u Hrvatskoj na pragu trećeg tisućljeća, Zagreb: HAZU.
• Radovi u Zborniku skupa: autor (godina izdanja) “Naslov članka”. U: Naslov zbornika. Mjesto izdanja: izdavač, stranice

Uredništvo: Politika časopisa i upute autorimaZbornik Veleučilišta u Rijeci, Vol. 8 (2020), No. 1, pp. 471-480
479
Fedchak, E., Duvall, L. (1996) “An engineering approach to electronic publishing” In: Proceedings of the International Workshop on Multimedia Software Development, 25-26 March. Berlin, Los Alimos, Ca: IEEE Comput. Soc. Press, p. 80-88.
• Teze i disertacije: navodi se ime autora (godina) naslov, te institucija gdje su teze obra-njene
Whitehead, S. M. (1996) Public and private men: masculinities at work in education management, doktorska disertacija, Leeds Metropolitain University
• Službene publikacije: naziv publikacije/organizacije/ustanove, (godina) Naslov, mjesto izdavanja: izdavač
Department of the Environment (1986) Landfilling wastes. London: HMSO (Waste management paper, 26)
Autori bi trebali u popis referenci uključiti i DOI brojeve (kao poveznicu). DOI broj je moguće pronaći putem obrasca Simple Text Query form (Crossref; poveznica: https://apps.crossref.org/SimpleTextQuery). DOI broj autor upisuje na kraju pojedine reference u sljedećem obliku: https://doi.org/10.31784/zvr.7.1.3
Ostali prilozi u Zborniku
Ostali prilozi dostavljaju se na isti način kao i članci. Ne recenziraju se, a Urednički odbor ih ocjenjuje i razvrstava u sljedeće vrste priloga:
Prikazi knjiga. Kritička recenzija pisana jasnim i konciznim stilom u kojoj se procjenjuje struktura, stil i znanstvena dostignuća knjige. U naslovu Prikaza navodi se autor knjige. Ispod toga osnovni podaci o autoru knjige (titula, ustanova u kojoj je autor zaposlen), naslov i podnaslov rada, ako postoji, godina izdanja, izdavač, broj stranica, vrsta izdanja, jezik, ISBN i adresu e-pošte za dopisivanje. Autor prikaza potpisuje se na kraju. Uz ime autora navodi se i ustanova u kojoj je autor zaposlen i prilaže se kopija naslovne stranice.
Prikazi doktorskih disertacija. U naslovu Prikaza navodi se autor disertacije. Ispod toga osnovni podaci o autoru (titula, ustanova u kojoj je autor zaposlen), naslov i, ako postoji, podnaslov rada te članovi komisije za obranu. Dalje se navodi datum, godina te ustanova i mjesto obrane. U kritičkom prikazu opisuje se struktura, stil i vrednuju metodologija i rezultati istraživanja. Analiziraju se teoretski i praktični doprinosi u određenom znanstvenom području. Autor prikaza potpisuje se na kraju. Uz ime autora navodi se i ustanova u kojoj je autor zaposlen.
Prikazi konferencije ili drugih skupova. Pišu se kao kritičke recenzije. U naslovu prikaza navodi se: Naziv konferencije, organizator, datum održavanja, mjesto održavanja, jezik konferencije, osoba za kontakt, e-pošta, web-stranica, podatak o materijalu s konferencije. Prikaz daje jasan i koncizan pregled glavnih ciljeva konferencije, imena ključnih izlagača te diskusije sudionika o znanstvenim dostignućima, rezultatima istraživanja i prijedlozima za daljnja istraživanja o ključnim pitanjima. Autor prikaza potpisuje se na kraju. Uz ime autora navodi se i ustanova u kojoj je autor zaposlen.

Uredništvo: Politika časopisa i upute autorimaZbornik Veleučilišta u Rijeci, Vol. 8 (2020), No. 1, pp. 471-480
480
Pisma uredniku. Poseban odjeljak dostupan je za komentare, mišljenja i prijedloge čitatelja, autora i ostalih autora.
Ostale važne napomene Uredništva
Nužno je osigurati primjenu etičkih standarda od strane svih sudionika postupka objavljivanja. Autor(i) su dužni pročitati Izjavu o izdavačkoj etici (Etički kodeks) objavljenu na internetskim stranicama časopisa i prema njoj postupati.
Uredništvo pridržava pravo da tekstove koji ne odgovaraju kriterijima uputa vrati autoru, odnosno da radove u potpunosti prilagodi propozicijama Zbornika i standardima hrvatskog književnog jezika, odnosno stranog jezika. Autori su dužni pridržavati se tehničkih i ostalih uputa koje propisuje Uredništvo.
Konačnu odluku o objavljivanju članaka kao i redoslijed članaka, određuje Uredništvo Zbornika. Jedan autor u jednom Zborniku može objaviti najviše jedan rad.
Časopis Zbornik Veleučilišta u Rijeci autorima ne naplaćuje naknadu za objavu radova (non-APC model).
Autor(i) bi se trebali registrirati putem poveznice https://orcid.org/signin kako bi dobili ORCID identifikator. ORCID identifikator je jedinstveni i trajni identifikator istraživača koji omogućava bolju vidljivost i interoperabilnost širokog spektra informacijskih sustava.
Dostavljanje radova
Radovi se dostavljaju u elektroničkom obliku putem elektroničke pošte uz popunjeni popratni obrazac (Prijava rada) koji sadrži sljedeće podatke: naslov članka, ime i prezime autora i koautora te za svakoga ponaosob znanstveno zvanje, stručnu spremu, znanstveni interes, odnosno područje kojim se autor bavi, naziv i adresu institucije u kojoj je autor zaposlen, broj telefona, broj faksa, adresu e-pošte, potpisanu Izjavu o autorskim pravima te suglasnost za upućivanje rada u postupak recenzije i Izjavu – privolu za prikupljanje, obradu i objavu osobnih podataka. Svi navedeni podaci moraju biti napisani na jeziku članka, na hrvatskom jeziku i na engleskom jeziku (ako izvorni jezik članka nije engleski). Ukoliko je više autora, obrazac Prijava rada potpisuju svi autori.
Ako niti jedan od autora ne govori hrvatski jezik, Uredništvo će osigurati prijevod sažetka rada (uključujući naslov i ključne riječi) na hrvatski jezik.
Adresa za dostavu radova:
e-pošta: [email protected]
VELEUČILIŠTE U RIJECI Zbornik Veleučilišta u Rijeci Vukovarska 58, 51 000 Rijeka
Informacije o Zborniku Veleučilišta u Rijeci nalaze se na web-stranicama časopisa: https://student.veleri.hr/zbornik
UREDNIŠTVO

Editorial Board: Journal Policy and Guidelines for AuthorsZbornik Veleučilišta u Rijeci, Vol. 8 (2020), No. 1, pp. 481-491
481
JOURNAL POLICY AND GUIDELINES FOR AUTHORSThe Journal of the Polytechnic of Rijeka is a peer reviewed journal open for collaboration to scientists and experts in the field of natural, biotechnical, technical and social sciences. It publishes papers that are relevant for the scientific and professional public in different fields of economics, information and communication technologies, computing, traffic and transport technology, agronomy, oenology and applied mathematics.
Texts will be published in Croatian or in English.
Editing Policy
The Editorial Board accepts applications in a presrcibed form (Application form contains even an extended summary from 250 to 500 words, written in the third person) and a manuscript (written using the template). By signing the Copyright Statement in the Application form the author confirms the originality of work and authorship. In order to avoid withdrawing the paper during the review process, by signing the Copyright Statement the author also asserts compliance with the review process.
All applications go through the assessment process carried out by the members of the Editorial Board (according to the subject area addressed), as well as by other experts who are not members of the Editorial Board in the case of a specific content. The Editorial Board reviews the submitted manuscripts and decides on further procedure as follows:
a) which manuscripts, in case it is necessary, will be returned to the author with suggestions, recommendations and comments with the scope of improving primarily methodological presentation of research materials;
b) which manuscripts will go through review process;
c) which manuscripts will be rejected since:
• the subject matter does not meet the required scientific or professional level;
• the author has already published an article with a similar topic;
• the subject matter does not meet the Journal criteria, particularly if the content is beyond the concept orientation of the Journal and does not meet the methodological standards that the Journal must comply with.
If an article is not accepted, the Editorial Board notifies the author without returning the manuscript. If the author has accepted comments and suggestions given in the assessment process and has improved the text according to the requests made, the manuscript is then sent to review process.
Reviews of books, doctoral dissertations, international conferences and other scientific meetings/gatherings do not go through the the review process. The Editorial Board chooses and edits reviews they consider relevant for publication in the Journal and in line with the editing policy concept.
Editorial Board: Journal Policy and Guidelines for AuthorsZbornik Veleučilišta u Rijeci, Vol. 8 (2020), No. 1, pp. 481-491
482
Reviews of books and other contributions should be written as a critical review and their length should not exceed 8 typed double-spaced pages.
Translations of important papers, i.e. the content of which can arouse interest of scientific and professional public will also be published in the Journal and their lengths should not exceed 20 typed double-spaced pages.
Contributions should be written in standard language free of spelling and grammar mistakes. The authors are responsible for language editing. Before the final publication of accepted articles, a test print will be sent to authors to proofread, and at this stage, only misprints will be corrected.
Editorial Board disclaims responsibility for language and printing errors.
If none of the authors speak Croatian, the Editorial Board will provide translation of the article summary (including the title and key words) into Croatian.
In order to maintain the highest level of publishing ethical standards the Editorial Board of the Journal of the Polytechnic of Rijeka follows the recommendations of the COPE Code of Conduct for Journal Editors (https://publicationethics.org/).
Review Process
All articles submitted for publication are reviewed by two anonymous and independent reviewers. The names of the authors will also be unknown to the reviewers. Reviewers evaluate the article following some already given criteria by filling in a reviewer evaluation form. If the reviewers find that the article does not meet international standards and the Journal criteria, the Editorial Board does not accept the article. If the reviewer gives a positive review the article can be categorized into one of the following categories:
• Original scientific paper – an original scientific work which presents new results of some fundamental or applied research. The article is written in a way that using the information given the following can be done:
- reproduce methodological procedures and mathematical calculations obtaining equally accurate results or within the permitted deviation as indicated by the author himself; or
- repeat the author’s observations and judge his analyses; or
- check the accuracy of the analyses’ results and deductions on which the author bases his findings.
• Preliminary communication – a scientific article which has to contain one or more pieces of scientific information, but without sufficient details which would enable readers to check the presented scientific findings.
• Conference paper – can be published only as a full text previously presented at a scientific conference, but not published as a complete article in conference proceedings.

Editorial Board: Journal Policy and Guidelines for AuthorsZbornik Veleučilišta u Rijeci, Vol. 8 (2020), No. 1, pp. 481-491
483
• Review article – an article which contains thorough and complete critical review of a specific problem, but without any significant original results; deals with a specific problem already discussed in a previously published work but adopting new approach.
• Professional paper – contains some useful contributions in the field of profession and for the profession in question.
Reviewers should carefully follow the Guidelines for reviewers.
After the reviews have been completed the Editorial Board analyzes them. Reviewer’s comments are sent to the author after both reviews are received. If necessary, the author needs to adjust his/her paper to the reviewer’s demands. In cases where the quality and originality of the text in not in question the Editorial Board is empowered to intervene. In case it is necessary, the Editorial Board may ask the third reviewer for an opinion.
The author delivers the revised paper to the Editorial Bord accompanied by the form that contains answers/comments to reviewers’ suggestions. For each reviewer, a separate Author’s response form is compiled. The Editorial Board verifies whether the article has been revised following the reviewers’ comments and suggestions.
Only categorized papers given two positive reviews are published. After the review process has been completed and the articles changed and revised by the authors and the Editorial Board, the Editor-in-Chief proposes the sequence of the accepted articles in the table of contents.
The criteria for the order in which the articles will appear in the Journal are:
(1) Categorization according to level of scientific excellence;
(2) If the reviewers have categorized the article in different categories, the Editor-in-Chief proposes to the Editorial Board the categorization in favour of the author, i.e. to a higher category;
(3) The topicality of the theme, author and the Journal’s field of interest in the case when articles have been assigned the same level of scientific excellence (category).
Open Access Policy
The Journal of the Polytechnic of Rijeka supports an open access policy, which enables unlimited access to published papers in order to contribute to easier knowledge exchange.
The usage of full-text of the articles can be used exclusively for personal, research-related or educational purposes, with regard to the authors’ and publishers’ rights. The rights to use the papers are defined by the Creative Commons CC BY-NC 4.0. licence. According to the above-mentioned, users are allowed to read, download, copy, distribute, print and transform or use them for any other lawful purpose as long as they attribute the source in an appropriate manner and for the non-commercial purpose of the usage.

Editorial Board: Journal Policy and Guidelines for AuthorsZbornik Veleučilišta u Rijeci, Vol. 8 (2020), No. 1, pp. 481-491
484
By signing the Application form the author gives consent to publish the delivered paper in The Journal of the Polytechnic of Rijeka according to the rules of a CC BY-NC licence.
The papers published in The Journal of the Polytechnic of Rijeka can be deposited and self-archived in the institutional and thematic repositories providing the link to the Journal’s web pages or HRČAK.
According to self-archiving policy it is allowed to archive post-print (final draft post-refereeing) or publisher’s version of the paper.
Copyright
By signing Copyright Statement authors declare that the article has not been published in its current or similar form anywhere else and that the manuscript has not been submitted to any other journal. Authors guarantee that their paper represents an original contribution and that its publication will not infringe any existing copyright.
By signing Copyright Statement authors assign to the Polytechnic of Rijeka the copyright of the manuscript intended for publication if and when the article is accepted for publication. This includes the rights to supply the article in all forms and media, that is the non-exclusive and spatially and temporally unlimited transfer of following rights: right of reproduction, including the right to be stored in electronic form, right of distribution and right to make available to the public.
By signing the Application form (Copyright Statement) the author gives consent to publish the article according to the rules of a CC BY-NC licence.
Once the article has been accepted for publication, the author cannot publish it somewhere else without the permission of the Journal’s Editorial Board, and even then the author will have to state where the article was published for the first time.
Plagiarism – Copyright Statement
By submitting the manuscript with the completed Application form and a signed Copyright Statement, the authors declare that the text of the article is their original work, does not contain any plagiarism and has not been published anywhere else or submitted to any other journal.
If plagiarism is found, a whole article will be removed from the journal and replaced with a note indicating the authors´ names and description of the plagiarism. Authors and their institutions will be notified.
In order to detect and avoid plagiarism, each manuscript is checked using Crossref Similarity Check (iThenticate).
GUIDELINES FOR AUTHORS ON FORMATTING TEXT AND SUBMITTING A PAPER
Content of the Article
The paper must be relevant for international scientific and professional public with clearly defined objectives and results of the research, conclusion, references in the text and bibliography at the end

Editorial Board: Journal Policy and Guidelines for AuthorsZbornik Veleučilišta u Rijeci, Vol. 8 (2020), No. 1, pp. 481-491
485
of the paper. The ideas presented in the paper must be original, considerably contributing to the development of the topic researched with clearly described methodology.
When writing articles authors must pay special attention to the appropriate structuring of the text and its length which should be in line with the accepted standards of scientific methodology.
The paper is delivered together with the Application form, which includes signing of the Copyright Statement, consent to submitting the paper to the reviewing procedure and Statement – consent for personal data collection, processing and sharing (if there is more than one author, every author has to sign the statement and consent).
Paper submission should contain: the title of the article, name and surname of the author or, if there are more co-authors academic affiliation, title, the field of scientific interest i.e. the field that the author has special interest in, the name and address of the institution, phone number, fax number and email address for each author. All the above mentioned information must be written:
- in Croatian- in English.
The first page of the article should contain: the title of the article, abstract and key words in the language of the article (on the first page of the article submitted the authors are not mentioned). At the end of the article the same information is given:
- in Croatian (if the article is in English) and
- in English, if the original language of the article is other than English.
The main body of the text should begin with an introduction and contain sections, footnotes, tables, graphs, diagrams, references in the text, conclusion and bibliography.
Text Editing
The text of the article should be written in Microsoft Word Windows program (95 or later versions). The length of the paper should not exceed 7000 words in length, and the font used should be Arial, font size 11 single-spaced, justified, written from the begining to the end of the line (without indenting the first line of a paragraph), all margins at 2.5 cm. The length of the paper can exceed the above mentioned limit only if the Editor-in-Chief consents. If it is necessary to highlight a specific word or a sentence italics should be used, never bold. Paragraphs should be double-spaced.
Footnotes should be used only for additional explanations of the text. They are not used to refer to literature used. They are put at the bottom of the page and numbered consecutively in Arabic numerals starting with number 1.
Section headings (from Introduction to Conclusion) should be short and clear and numbered using single Arabic numerals. Section headings can have subsection headings which must be marked with double or maximum triple-digit numbers (e.g. 1; 1.1; 2.; 2.1; 2.1.1 etc.), but not more than that.
Tables, graphs and diagrams should have a number and a caption (written above the table, graph or diagram) as well as the source of information (written in short form at the bottom; if it has been taken from another source – surname of the author (year); e.g. Source: Driankov et al. (1996)). They

Editorial Board: Journal Policy and Guidelines for AuthorsZbornik Veleučilišta u Rijeci, Vol. 8 (2020), No. 1, pp. 481-491
486
should be numbered consecutively in Arabic numerals (graphs should be numbered separately from diagrams).
Important note: If a table, graph or diagram contains some specific signs and is written in a special program, it should be submitted as a separate file with precise indications and marked insertion point in the text.
The article should comply with all the editing requirements listed in these guidelines.
Text Organization and Style
Authors should apply scientific methodology in presenting the contents of their papers complying with the standards of scientific publications (‘’Harvard Style’’)
This implies the following:
(1) Title and organization of the content of the paper:
The title is the most important abstract of the work which must contain the content and the objective of the paper. It should be clear, concise and informative (font size 14).
The content is divided into sections as follows:
• Abstract – below the title
• Key words
• Introduction
• Methodology /method / model / conception of the analysis – in the second section
• Empirical data (documented background) and analysis – in the third section
• Results and discussion – are presented in the fourth section
• Conclusion – at the end
(2) The content of particular sections of the material presented:
a. Abstract – it describes in short the content of the article, it contains a general overview of the topic in 150-250 words single spaced, font size 10, italic, and should include:
• Established objective of the research
• Method / model / conception of the analysis
• Main results of the research (or the analysis)
• Basic conclusion of the research
The abstract should not be written in paragraphs.
b. Key words – should reflect the essence of the article’s content, usually there are three to five words (font size 10, italic).
c. Introduction – is focused on defining the problem and subject matter of the research with reference to the latest literature, i.e. research results (this part can also be indicated in a

Editorial Board: Journal Policy and Guidelines for AuthorsZbornik Veleučilišta u Rijeci, Vol. 8 (2020), No. 1, pp. 481-491
487
separate section i.e. in the second section as Literature review; towards the end of introduction working hypotheses should be formulated which will be discussed later on at the beginning of the conclusion; this part should end indicating the organization of the text.
d. Methodology /method / model / conception - is usually presented in the second section; the method /model / conception of the analysis should clearly be stated because of possible re-testing of the research results by interested researchers (this is one of the fundamental principles of scientific methodology).
e. Empirical data and analysis – contain documentation background and the results of the analysis.
f. Results and discussion – explain results, particularly their economic significance and messages.
g. Conclusion – it should be kept in mind that this part does not represent a summary! Conclusions are the author’s original opinion on or evaluation of results obtained and they contain information on the starting hypothesis (which can be contradicted or confirmed), main results of the research/analysis, referring to limitations and problems of the research as well as guidelines for future research.
(3) References – list only titles (sources) referred to in the text! Font size 9 is to be used, first line hanging.
After the text of the article written in Croatian and bibliography, abstract in English should follow (up to 250 words). Together with the abstract in English, the title and key words of the article should also be included (in the final version of the article accepted for publication basic information on the authors in English is also included).
TABLES should be included in the text. All the information given in tables are put in rows and columns separated by single thin lines. Each column heading for numerical data should include the unit of measurement applied to all data under the heading. Large numbers can be expressed in smaller units with appropriate column headings (in thousands, millions, etc.). Tables are numbered consecutively in Arabic numerals (e.g. Table 1, Table 2, etc.), and next to the number the source of data should also be stated.
GRAPHS AND DIAGRAMS should be included in the text. They need to have a number, the title and the source of information. They should be numbered in sequence with Arabic numerals (graphs separately from pictures). The sources of information are stated below the graphs i.e. pictures.
Note: The results indicated in tables and graphs are not described and repeated in the text, but should be related in the text by means of reference marks.
REFERENCES IN THE TEXT. Cited parts of the text are included in the text of the article, not in the footnotes. They are put in brackets with the name of the author and the year of publication e.g. (Horvat, 2003), and in the case of a citation, the page is also indicated (Horvat, 2003:150). Ibid. and similar words should not be used. Each note is indicated in the same way it has been indicated the

Editorial Board: Journal Policy and Guidelines for AuthorsZbornik Veleučilišta u Rijeci, Vol. 8 (2020), No. 1, pp. 481-491
488
first time. If there are two authors e.g.: (Horvat, Courty, 2004). If there are more than two authors, the first one should be indicated followed by ‘’et al’’, e.g. (Horvat et al., 2003). For Internet sources in the references included in the text only the basic domain is indicated (http://www.veleri.hr). Each refernece should be listed in bibliography.
Bibliography comprises all sources used as well as complete information on works mentioned in references. Bibliography does not include the number of headings and is put at the end of the paper (after Conclusion). Bibliography is not numbered and it is listed in alphabetical order by first author’s last name and in chronological order when there are more works by the same author.
References for books, journals and other sources are cited according to the following examples:
• Books: surname, initials (year) Title, place of publication: name of the publisher
Mohr, L. B. (1996) Impact analysis for program evaluation, 2nd. ed. London: Sage
If there are two or three authors, their surnames and initials (year) are put in order as they appear in the book Title, place of publication: name of the publisher
Riddersträle, J., Nordström, K. (2004) Karaoke Capitalism Management for Mankind, Harlow: Pearson Education Ltd.
Perišin, I., Šokman. A., Lovrinović, I. (2001) Monetarna politika, Pula: Sveučilište u Rijeci, Fakultet ekonomije i turizma “Dr. Mijo Mirković”
If there are more authors (four or more), the surname of the first author is put followed by et al.
Norton, M. B. et al. (1981) A People and a Nation – A History of the United States, Boston: Houghton Mifflin Company.
• Journals: surname, initials (year) “Title of the article”, title of the journal in which it was published, volume (number), pages
Fox, S. (1994) “Empowerment as a Catalyst for Change: An Example from the Food Industry”, Supply Chain Management, 2(3), p. 29-33
If there are more authors (four or more), the surname of the first author is put followed by et al.
Di Noia, C. et al. (1999) “Should Banking Supervision and Monetary Policy Tasks be Given to Different Agencies?”, International Finance, 2(3), p. 361-378
Multiple works by the same author published in the same year, besides the year the “a, b, c” letters are used after the year:
Quah, Danny Tyson. (1993 a) “Empirical Cross-section Dynamics in Economic Growth”, European Economic Review, 37(2-3), p. 426-434
Quah, Danny Tyson. (1993 b) “Galton’s Fallacy and Tests of the Convergence Hypothesis”, Scandinavian Journal of Economics, 95(4), p. 427-443

Editorial Board: Journal Policy and Guidelines for AuthorsZbornik Veleučilišta u Rijeci, Vol. 8 (2020), No. 1, pp. 481-491
489
• Sources from the Internet: surname of the author/editor, name initials, (year), “Title of the article”, Title of the journal, date of publication, year, volume, number, pages or onli-ne equivalent, Internet address (date of accession)
If Internet sources do not give the name of the author: Internet address (date of accession).
Martin, C. L. (1998) “Relationship Marketing: a High-Involvement Product Attribute Approach, Journal of Product and Brand management, 7(1), p. 6-26, http://www.apmforum.com/emerald/marketing-research-asia.htm (3. 10. 2002.)
• Books of collected writings: author of the chapter (year of publication) “Title of the chap-ter’’. In: name of the publisher or author of collected writings, Title of collected writings, place of publication: publisher.
Silobrčić, V. (2000) “Znanstvena proizvodnost i kriteriji vrednovanja znanstvenika u Hrvatskoj’’. U: Sunko, U. D. (ur.) Znanost u Hrvatskoj na pragu trećeg tisućljeća, Zagreb: HAZU.
• Papers in Conference Proceedings: author (year of publication) “Title of the article”. In: Title of the Conference Proceedings. Place of publication: publisher, pages of the section referred to:
Fedchak, E., Duvall, L. (1996) “An engineering approach to electronic publishing” In: Proceedings of the International Workshop on Multimedia Software Development, 25-26 March. Berlin, Los Alimos, Ca: IEEE Comput. Soc. Press, p. 80-88.
• Theses and dissertations: name of the author is stated (year) title, and the name of the awarding institution
Whitehead, S. M. (1996) Public and private men: masculinities at work in education management, doctoral dissertation, Leeds Metropolitain University
• Official publications: title of the publication/organization/institution, (year) Title, place of publication: publisher
Department of the Environment (1986) Landfilling wastes. London: HMSO (Waste management paper, 26)
DOIs should be included in references (as a link). Authors can retrieve DOI through the Simple Text Query form (Crossref; link: https://apps.crossref.org/SimpleTextQuery). DOI is inserted by the author at the end of references in the form such as: https://doi.org/10.31784/zvr.7.1.3
Other Journal Contributions
Other contributions are submitted in the same way as articles. They are not reviewed, but are evaluated and grouped by the Editorial Board in the following types of contributions:
Books reviews. Critical reviews are written in clear and concise manner evaluating the structure, style and scientific achievements of a particular book. It starts with the name of the author (of the book in question), followed by his academic title, institution affiliation, the title and subtitle (if there is one) of the work, year of publication, publisher, number of pages, type of edition, language,

Editorial Board: Journal Policy and Guidelines for AuthorsZbornik Veleučilišta u Rijeci, Vol. 8 (2020), No. 1, pp. 481-491
490
ISBN and email address for contact. The author of the review signs the text at the end. Together with the name of the reviewer, the institution affilitaion is given and a copy of the cover page is enclosed.
Doctoral Dissertations Reviews. In the title of the review, the author of the dissertation is stated, followed by some basic information on the author (academic title, institution affiliation), title and subtitle (if there is one) of the dissertation, as well as the names of the members of the Ph.D. committee. Further on date, year, institution and place of the dissertation defence is indicated. The critical review describes the structure, style, evaluating methodology and research results. Theoretical and practical contributions to a particular scientific field are analysed. The author of the review signs the text at the end. Together with the name of the reviewer, the institution affilitaion is given.
Reviews on conferences and other scientific gatherings. They are written as critical reviews. In the title of the review the following is included: title of the conference, organizers, date and venue of the conference/meeting, official language of the conference, the name of the person for contact, followed by email, webpage and information on conference materials. The review provides a clear and concise survey of the main objectives of the conference, names of keynote speakers and discussions of the participants on scientific achievements, research results and suggestions for further researches on key issues. The author of the review signs the text at the end. Together with the name of the reviewer, the institution affilitaion is given.
Letters to the Editor. Special section is available for comments, opinions and suggestions by readers, authors and other contributor.
Other Important Information
It is necessary to ensure the application of the standards of ethical practice by all parties that participate in the publication procedure. Author(s) should read Publication Ethics Statement (Code of Ethics) published on the website of the Journal and act according to it.
The Editing Board reserves the right to return texts to authors which do not meet the guidelines criteria, or to fully adapt contributions to comply with the Journal editing rules and the standard Croatian language, i.e. the language of the article. Contributions should be written in standard language free of spelling and grammar mistakes. Authors have to comply with all the editing and other guidelines provided by the Editorial Board.
Final decision on publication of an article, as well as the order of articles in the Jouranl is made by the Editorial Board. In one issue of the Journal one author can publish not more than one article.
The Journal of the Polytechnic of Rijeka does not charge article processing charge (non-APC model).
The author(s) should register via link: https://orcid.org/signin in order to obtain an ORCID identifier. The ORCID identifier is a researcher’s unique and permanent identifier which allows for better visibility and interoperability of wide range of information systems.

Editorial Board: Journal Policy and Guidelines for AuthorsZbornik Veleučilišta u Rijeci, Vol. 8 (2020), No. 1, pp. 481-491
491
Manuscript Submission
Papers are submitted in the electronic (via e-mail) form together with a completed form (Application form) which contains the following information: title of the article, name and surname of the author and co-author, and academic title, qualification, field of interest, i.e. field that the author deals with, name and address of the institution affiliation, telephone number, fax number, email address, and a signed Copyright Statement, the consent to submit the paper to the reviewing procedure, and Statement - consent for personal data collection, processing and sharing. All the information given should be written in the language of the article, in Croatian and in English (if the original language of the article is other than English). If there is more than one author, Application form has to be signed by all authors.
If none of the authors speak Croatian, the Editorial Board will provide translation of the article summary (including the title and key words) into Croatian.
Address for manuscript submission:
e-mail: [email protected]
VELEUČILIŠTE U RIJECI
Zbornik Veleučilišta u Rijeci
Vukovarska 58, 51 000 Rijeka
Information on the Journal of the Polytechnic of Rijeka (Zbornik Veleučilišta u Rijeci) can be obtained on the Journal’s website: https://student.veleri.hr/zbornik
EDITORIAL BOARD


493
Zbornik Veleučilišta u Rijeci – Journal of the Polytechnic of RijekaVol. 8 (2020), No. 1, Rijeka, 2020. ISSN 1848-1299 (tisak) 1849-1723 (online)
prof. dr. sc. Božidar Kliček, Fakultet organizacije i informatike, Varaždin
prof. dr. sc. Branimir Marković, Sveučilište Josipa Jurja Strossmayera u Osijeku
prof. dr. sc. Čedomir Dundović, Pomorski fakultet Sveučilišta u Rijeci (ret.)
prof. dr. sc. Damir Zec, Pomorski fakultet Sveučilišta u Rijeci
prof. dr. sc. Dragica Obratov-Petković, Univerzitet u Beogradu, Šumarski fakultet (SRB)
prof. dr. sc. Hinko Wolf, Fakultet strojarstva i brodogradnje, Sveučilište u Zagrebu
prof. dr. sc. Kornelije Rabuzin, Fakultet organizacije i informatike, Varaždin
prof. dr. sc. Nela Vlahinić Lenz, Ekonomski fakultet Sveučilišta u Rijeci
prof. dr. sc. Neven Šerić, Ekonomski fakultet Sveučilišta u Splitu
prof. dr. sc. Nika Šimurina, Ekonomski fakultet, Sveučilište u Zagrebu
prof. dr. sc. Selma Kadic-Maglajlic, Copenhagen Business School (DK)
prof. dr. sc. Slađana Benković, Fakultet organizacionih nauka, Univerzitet u Beogradu (SRB)
prof. dr. sc. Srećko Goić, Ekonomski fakultet, Sveučilište u Splitu
prof. dr. sc. Sunčica Oberman Peterka, Ekonomski fakultet u Osijeku, Sveučilište Josipa Jurja Strossmayera u Osijeku
prof. dr. sc. Zorica Sredojević, University of Belgrade, Faculty of Agriculture, Institute of Agroeconomy (SRB)
prof. dr. sc. Maja Meško, University of Primorska, Faculty of management (SLO)
prof. dr. sc. Zijada Rahimić, Ekonomski fakultet, Univerzitet u Sarajevu (BIH)
Terrence W Thomas, PhD, professor, North Carolina Agricultural &Technical State University (SAD)
izv. dr. sc. Laurentiu Droj, University of Oradea (RO)
izv. prof. dr. sc. Aleksandra Ilić Petković, Fakultet zaštite na radu u Nišu (SRB)
izv. prof. dr. sc. Anamarija Delić, Ekonomski fakultet u Osijeku, Sveučilište Josipa Jurja Strossmayera u Osijeku
RECENZENTI - REVIEWERS
494
Zbornik Veleučilišta u Rijeci – Journal of the Polytechnic of RijekaVol. 8 (2020), No. 1, Rijeka, 2020. ISSN 1848-1299 (tisak) 1849-1723 (online)
izv. prof. dr. sc. Ana-Marija Vrtodušić Hrgović, Sveučilište u Rijeci, Fakultet za menadžment u turizmu i ugostiteljstvu
izv. prof. dr. sc. Bojana Olgić Draženović, Ekonomski fakultet, Sveučilište u Rijeci
izv. prof. dr. sc. Dina Lončarić, Fakultet za menadžment u turizmu i ugostiteljstvu, Sveučilište u Rijeci
izv. prof. dr. sc. Dragan Benazić, Sveucilište Jurja Dobrile u Puli, Fakultet ekonomije i turizma "Dr. Mijo Mirkovic"
izv. prof. dr. sc. Ivan Mijailović, Fakultet zaštite na radu u Nišu, Univerzitet u Nišu (SRB)
izv. prof. dr. sc. Ivana Bjedov, Univerzitet u Beogradu, Šumarski fakultet (SRB)
izv. prof. dr. sc. Kristina Afric Rakitovac, Fakultet ekonomije i turizma "Dr. Mijo Mirković", Sveučilište Jurja Dobrile
izv. prof. dr. sc. Kristina Črnjar, Sveučilište u Rijeci, Fakultet za menadžment u turizmu i ugostiteljstvu
izv. prof. dr. sc. Maja Arslanagić-Kalajdžić, Ekonomski fakultet Univerziteta u Sarajevu (BIH)
izv. prof. dr. sc. Sandro Gerić, Fakultet organizacije i informatike, Varaždin
izv. prof. dr. sc. Saša Sladić, Tehnički fakultet, Sveučilište u Rijeci
izv. prof. dr. sc. Violeta Cvetkoska, Ss. Cyril and Methodius University in Skopje, Faculty of Economics (North Macedonia)
izv. prof. dr. sc. Vlado Frančić, Pomorski fakultet, Sveučilište u Rijeci
izv. prof. dr. sc. Zoran Ježić, Ekonomski fakultet, Sveučilište u Rijeci
doc. dr. Peter Štrukelj, Faculty of Management, University of Primorska (SLO)
doc. dr. sc. Adis Muminović, Mašinski fakultet Sarajevo (BIH)
doc. dr. sc. Ana Aleksić, Ekonomski fakultet, Sveučilište u Zagrebu
doc. dr. sc. Daniel Dragičević, Fakultet za menadžment u turizmu i ugostiteljstvu, Sveučilište u Rijeci
doc. dr. sc. Daniela Soldić Frleta, Fakultet za menadžment u turizmu i ugostiteljstvu, Sveučilište u Rijeci
doc. dr. sc. Dijana Oreški, Fakultet organizacije i informatike, Varaždin
doc. dr. sc. Jernej Prišenk, Faculty of Agriculture and Life Sciences, University of Maribor (SLO)

495
Zbornik Veleučilišta u Rijeci – Journal of the Polytechnic of RijekaVol. 8 (2020), No. 1, Rijeka, 2020. ISSN 1848-1299 (tisak) 1849-1723 (online)
doc. dr. sc. Marija Nikolić, University of Belgrade, Faculty of Agriculture, Institute of Agroeconomy (SRB)
doc. dr. sc. Persefoni Polychronidou, International Hellenic University University campus of SerresTerma Magnisias, Department of Economics (GR)
doc. dr. sc. Siniša Bogdan, Fakultet za menadžment u turizmu i ugostiteljstvu, Sveučilište u Rijeci
doc. dr. sc. Vesna Buterin, Ekonomski fakultet, Sveučilište u Rijeci
doc. dr. sc. Željko Mateljak, Ekonomski fakultet, Sveučilište u Splitu
doc. dr. sc. Margareta Gardijan Kedžo, Ekonomski fakultet Sveučilišta u Zagrebu
doc. dr. sc. Mario Galić, Sveučilište Josipa Jurja Strossmayera u Osijeku, Građevinski i arhitektonski fakultet Osijek
dr. sc. Anita Prelas Kovačević, Visoka škola u Virovitici
dr. sc. Darko Palačić, Visoka škola za sigurnost, Zagreb
dr. sc. Nikola Kadoić, Fakultet organizacije i informatike, Varaždin
dr. sc. Stella Suljić Nikolaj, Ekonomski fakultet, Sveučilište u Rijeci
dr. sc. Veronika Boškov, Visoka poslovna škola strukovnih studija Novi Sad (SRB)
dr. sc. Biljana Grgurović, Visoka ICT škola, Beograd (SRB)