Youth and Social Security Coverage in Brazil
16
Open Access Open Journal of Social Sciences, 2014, 2, 144-159 Published Online January 2014 in SciRes. http://www.scirp.org/journal/jss http://dx.doi.org/10.4236/jss.2014.21014 Youth and Social Security Coverage in Brazil * Paulo Tafner 1 , Carolina Botelho 2 1 Institute for Applied Economic Research, Rio de Janeiro, Brazil 2 Institute for Social and Political Studies Rua da Matriz, Rio de Janeiro, Brazil Email: [email protected] , [email protected] Received 27 September 2013; revised 30 October 2013; accepted 8 November 2013 Copyright © 2014 Paulo Tafner, Carolina Botelho. This is an open access article distributed under the Creative Commons Attribution License, which permits unrestricted use, distribution, and reproduction in any medium, provided the original work is properly cited. In accordance of the Creative Commons Attribution License all Copyrights © 2014 are reserved for SCIRP and the owner of the intellectual property Paulo Tafner, Carolina Botelho. All Copyright © 2014 are guarded by law and by SCIRP as a guardian. Abstract Brazil is still a young country, just starting the process of aging, but Brazil’s spending on social se- curity is similar to those countries whose population aging has already occurred. Some studies ex- plain the high cost of the Brazilian Social Security System due to the assumption that there is a positive relationship between social security and poverty alleviation. In fact, the effectiveness of this instrument as reducing poverty was high until 2002, but stopped growing and fell slightly thereafter. Brazilian law provides that wives and children or stepchildren under age 21, or under 25, since they are college students, are welfare beneficiaries. In other words they are protected by Brazilian Social Security System. However, data reveals that in Brazil, children and young people have a very low social security direct coverage, which increases with age and reaches high levels for individuals aged 60 or older. Children and young people are the groups most affected by pov- erty and extreme poverty in Brazil. In this sense, the assumption according to which Social Secu- rity helps combat family poverty is flawed. Considering these issues, this article aims to contribute to the debate on the need to rethink the Brazilian Social Security System and the need of construc- tion of specific policies for children and young people in Brazil. Keywords Social Security in Brazil; Youth; Poverty and Public Policy 1. Introduction Two of the most frequent concerns of the Brazilian Social Welfare analysts are the relatively low rate of pension * The authors thank to Rafael Erbisti for preparing figures and tables. How to cite this paper Tafner, P. and Botelho, C. (2014) Youth and Social Security Coverage in Brazil. Open Journal of Social Sciences, 2, 144-159. http://dx.doi.org/10.4236/jss.2014.21014
-
Upload
independent -
Category
Documents
-
view
0 -
download
0
Transcript of Youth and Social Security Coverage in Brazil

Open Access Open Journal of Social Sciences, 2014, 2, 144-159 Published Online January 2014 in SciRes. http://www.scirp.org/journal/jss http://dx.doi.org/10.4236/jss.2014.21014
Youth and Social Security Coverage in Brazil* Paulo Tafner1, Carolina Botelho2
1Institute for Applied Economic Research, Rio de Janeiro, Brazil 2Institute for Social and Political Studies Rua da Matriz, Rio de Janeiro, Brazil
Email: [email protected], [email protected]
Received 27 September 2013; revised 30 October 2013; accepted 8 November 2013
Copyright © 2014 Paulo Tafner, Carolina Botelho. This is an open access article distributed under the Creative Commons Attribution License, which permits unrestricted use, distribution, and reproduction in any medium, provided the original work is properly cited. In accordance of the Creative Commons Attribution License all Copyrights © 2014 are reserved for SCIRP and the owner of the intellectual property Paulo Tafner, Carolina Botelho. All Copyright © 2014 are guarded by law and by SCIRP as a guardian.
Abstract Brazil is still a young country, just starting the process of aging, but Brazil’s spending on social se- curity is similar to those countries whose population aging has already occurred. Some studies ex- plain the high cost of the Brazilian Social Security System due to the assumption that there is a positive relationship between social security and poverty alleviation. In fact, the effectiveness of this instrument as reducing poverty was high until 2002, but stopped growing and fell slightly thereafter. Brazilian law provides that wives and children or stepchildren under age 21, or under 25, since they are college students, are welfare beneficiaries. In other words they are protected by Brazilian Social Security System. However, data reveals that in Brazil, children and young people have a very low social security direct coverage, which increases with age and reaches high levels for individuals aged 60 or older. Children and young people are the groups most affected by pov-erty and extreme poverty in Brazil. In this sense, the assumption according to which Social Secu-rity helps combat family poverty is flawed. Considering these issues, this article aims to contribute to the debate on the need to rethink the Brazilian Social Security System and the need of construc-tion of specific policies for children and young people in Brazil.
Keywords Social Security in Brazil; Youth; Poverty and Public Policy
1. Introduction Two of the most frequent concerns of the Brazilian Social Welfare analysts are the relatively low rate of pension
*The authors thank to Rafael Erbisti for preparing figures and tables.
How to cite this paper Tafner, P. and Botelho, C. (2014) Youth and Social Security Coverage in Brazil. Open Journal of Social Sciences, 2, 144-159. http://dx.doi.org/10.4236/jss.2014.21014
P. Tafner, C. Botelho
145
coverage and high and persistent rate of non-contributory membership. These phenomena, of course, are not re- stricted to Brazil and they are in fact characteristic features of many developing countries, such as many Latin American countries as well as several African countries.
These two indicators of the amplitude of the social security system, although often been treated as synonyms, are of different natures, determined by different factors and also differently affect particular groups—though sometimes the same individual is subject to both. At last, they usually cause different effects in terms of fairness and justice.
The social security coverage here named as pension coverage, in broad terms, refers to the many ways of so-cial protection that an individual may get. Contribution to social security is solely one of these forms. All those who receive social security benefits are covered (protected) by the social security system, even though they have not been in the past a contributor for the Brazilian social pension. In 2011, for example, 7 of every 10 Brazilians had social protection, while less than 47% of individuals of working age were social security contributors.
First, it is necessary to make clear that when an individual, and also his or her offspring, are protected by so-cial security. However, in Brazil, more than 50% of people of working age do not contribute to social foresight and thus have no pension coverage. Consequently, their children are not protected as well. This phenomenon, as will be seen below, is particularly evident in groups of young adults that live in young families. Their children are still young and are not able to get job either income. Besides being a serious lack of social protection for a significant portion of our society, this phenomenon also produces two highly undesirable effects: the first, is that it limits the financing capacity of the system requiring high burden on the set of social security taxpayers (work-ers and firms)—with obvious impacts on the cost of labor and the prices of our products; the second is that it produces—given the current rules of access and fixing the of benefit’s value—a numerous contingent of indi-viduals who have never contribute to the social security will receive in the future benefits with no contribution. This means that people who are in this situation now will receive in the future social benefits whose values will be equal to those who throughout their working lives contributed for social security, thus creating an inequality in relation to the conditions for obtaining welfare income.
The paper is divided into four sections, besides this introduction. The second section presents Brazilian social security system in figures and offers some international comparisons. In the third, it presents and discusses var-ious ways of measuring pension coverage and also the evolution of these measures in Brazil in the 1982-2011 period. In the fourth section, these measures are presented according to different attributes of coverage, in which there is a highlight of the significantly low coverage for children, youth and young adults. The final section pro-vides the main conclusions.
2. An Overview of Brazilian Social Security The Brazilian pension system had its current institutional design set from the 1988 Constitution. Since then, the system has gone through two constitutional reforms (CA 20/1998 and CA 41/2003) and regulations resulting from these reforms. In particular, Law No. 8213 of 24/07/1991 defines and regulates the Benefit Plan of Social Security and Law No. 8.742, of December 7, 1993 (Organic Law of Social Assistance—LOAS), states that, in Brazil, the social assistance is a citizen’s right and a duty of the State. As a policy of social security non-contri- butory, the Brazilian social assistance should ensure minimum income and must be accomplished through an in- tegrated set of initiatives by government and by society, to ensure the provision of basic needs of the popula- tion1.
The system is divided into two regimes. The first one is the General Regime of Social Security (RGPS admi- nistered by INSS). It manages the pension system for private sector workers and monthly pays something close to 23.5 million benefits. The second regime manages the Pension Plan for civil servant of the three levels of government, and each level has its own plan (RPP). Within the Union, the RPP monthly pays something slightly more than 1 million benefits. The military staff has specific plans. Table 1 presents, for 2009-2012, the revenue of social security contributions and the expenditure on retirees and pensioners and other welfare benefits, sepa- rating the information for each of the schemes.
These statistics may bring up an equivocal idea that the main problem of fiscal sustainability of Social Secu- rity is located in the public sector system. A detailed analysis, however, leads us to the opposite conclusion. Al-
1For a detailed description, see “Statistical Yearbook of Social Security—Historical Supplement”, MPAS. 2011.

P. Tafner, C. Botelho
146
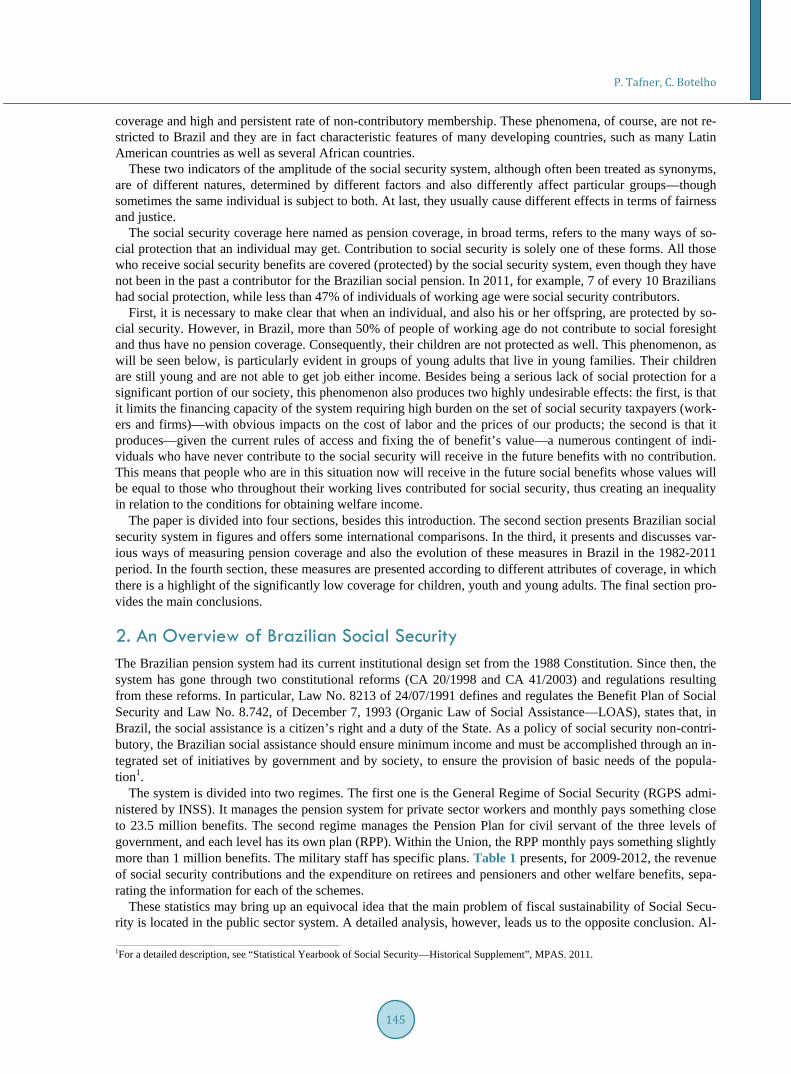
though it is still high the deficit in public sector system, this result reflects the rules before the 1998 and 2003 reforms. The high imbalance stems from the fact that there are a significant number of civil servants who retired according to the old rules which were much less restrictive. This situation has been structurally modified after the two reforms mentioned. This clearly can be seen from data presented in Figure 1.
Data shows that since 1991, the expense of RPP grew consistently until 1994-95, as a result of the implemen- tation of constitutional precept, but it remained stable since then. The same, however, did not happen with the INSS spending which increased throughout the period, except in 2008 and 2010 when GDP grew at very high rates. This expenditure increased from 3.4% of GDP in 1994 to 7.2% in 2012 and is now the major expense of the federal budget.
Three combined factors have contributed to the RGPS’s spending performance: a) less restrictive rules for pension and retirement in the face of changing demographics of the country, b) the effect of minimum wage ad- justments since the mid-90’s, and c) low GDP average growth. Besides those, for the future, a fourth component will have a decisive role: the demographic dynamics (see Figure A1 in the Annex). As announced by the IBGE, with revisions made in 2008, the country will face an accelerated aging process in the next 30 years, imposing challenges to our social security system and to public finances as well.
It must be pointed out that in Brazil the pension system is modeled as a PAYG (pay-as-you-go), i.e., the cur- rent productive generation supports the benefits to the generation that has retired in the past and believes that
Table 1. Social security balance: 2009 throughout 2012 (% of GDP).
Social security system 2009 2010 2011 2012
Civil servant −1.7 −1.7 −1.6 −1.6
Revenues 0.3 0.3 0.3 0.3
Expenditures 2.0 2.0 1.9 1.8
INSS −1.4 −1.5 −0.9 −0.9
Revenues 5.8 5.8 5.9 6.3
Expenditures 7.2 7.3 6.8 7.2
Total −3.1 −3.2 −2.5 −2.5
Revenues 6.1 6.1 6.2 6.5
Expenditures 9.2 9.3 8.7 9.0
Figure 1. RGPS and RPPS expenditures on benefits (as % of GDP), Source: MPOG, MPAS, STN.
3.4
4.3
4.9 4.94.6
4.9 5.05.4 5.5 5.6
5.86.0
6.36.5
6.87.0 7.0
6.6
7.2 7.3
6.87.2
0.91.1
1.72.0 2.1 2.1
1.8 2.0 2.1 2.0 2.1 2.1 2.1 2.0 2.0 1.9 1.8 1.8 2.0 2.0 1.9 1.8
0.0
1.0
2.0
3.0
4.0
5.0
6.0
7.0
8.0
RGPS RPPS (Civil Servant)

P. Tafner, C. Botelho
147
will be funded by a new generation in the future. Given the demographic conditions the Brazilian social security exposes all their fragility since now, when we are still young the social security system presents structural defi- cits. How to bet on the logic of intergenerational solidarity if one that is now a contributor has no institutional safeguards that your efforts will be compensated in the future? And how to solve the issue if nowadays people live longer than in the past and there is a large portion of informal working? According to Giambiagi and Tafner [1], “If the parameters that govern the system are well calibrated and if there are no significant changes in the demographic dynamics or restrictions on the labor market, it is possible that the system will survive without se- rious imbalances and no deficits or fiscal pressure. But what if it does not?”
Taking data from 1990 to 2011, it is observed that the volume of granting new benefits has grown at an aver- age annual rate quite high. Table 2 presents, for selected years, the amount of benefits provided by Social Secu- rity. It is noteworthy that the average growth of granting full benefits of Social Security between 1990 and 2011was 6.04% per year in the period. The pension benefits granted in the same period was 5.96% per year, and retirement benefits granted grew at an annual rate of 4.74%. It is also important to mention that the elderly pop- ulation in the same period, increased from 9.897 million individuals in 1990 to 23.536 million in 2011, equiva- lent to an average annual growth rate of only 4.21%, slightly more than the pace of granting pension benefits and 11% lower than the pace of retirement benefits.
The growth of the INSS spending was also a result of “price effect”, in others words, the adjustment of pension benefits. For the period between 1994 and 20011 (the period for which detailed data are available), Ta- ble 3 shows the real value of benefits issued by the INSS (deflated by INPC annual). It is noteworthy that, in just 17 years, spending on social security benefits were doubled, especially those on retirement and survivor pension have increased in real terms. In virtually all groups of benefits the real spending growth rate was higher than the increase in the number of issued benefits, reflecting the adjustment of the real value of the benefit in the period.
It seems clear that the Brazilian social security system showed high growth, in the number of contributors, in the number of beneficiaries—increasing as consequence the membership contribution and pension coverage—, and in the level of expenditure. The expenditures are very high compared to other countries, even having a still young population, as shown in Figure 2. Table 2. Number of granted benefits—social security: 1990-2011.
Type of benefit 1990 1994 1998 2002 2006 2011 %Variation (2011/1990)
Annual average
rate
Total 1,390,693 2,081,153 2,346,817 3,867,564 4,238,816 4,767,039 242.8 6.04
RGPS benefits 1,305,541 2,006,673 2,074,254 3,582,821 3,932,623 4,423,616 238.8 5.98
Social security benefits 1,207,692 1,830,801 1,898,325 3,378,764 3,773,809 4,077,115 237.6 5.96
Retirement 401,128 894,954 834,270 763,411 819,593 1,061,724 164.7 4.74
Contribution time-range 63,165 222, 369 297,857 159,961 185,093 297,707 371.3 7.66
Age 229,391 555,607 391,636 428,896 462,647 580,716 153.2 4.52
Disability 108,572 116,978 144,777 174,554 171,853 183,301 68.8 2.53
Survivor pension 220,992 317,573 283,290 325,594 334,801 396,278 79.3 2.82
Aids 549,224 576,951 635,210 1,294,728 2,202,709 2,050,673 273.4 6.47
Others 36,348 41,323 145,555 995,031 416,706 568,440 1463.9 13.99
Accident 97,849 175,872 175,929 204,057 158,814 346,501 254.1 6.21
Survivor benefit 4613 4370 6737 9687 5854 11,108 140.8 4.27
Others 93,236 171,502 169,192 194,370 152,960 335,393 259.7 6.29
Assistance benefits 85,152 74,480 272,563 284,743 306,127 341,643 301.2 6.84
LOAS and RMV 85,143 70,725 132,359 139,939 173,719 341,291 300.8 6.83 Others 9 3755 140,204 144,804 132,408 352 n.a 19.08
EPU-UNION WELFARE CHARGE 0 0 0 0 0 1780 n.a n.a
Source: AEPS—Historical Supplement, 2011.

P. Tafner, C. Botelho
148
Table 3. Issued benefit´s value—INSS: 1994-2011 (In R$ million position in December, selected years)/a.
Type of benefit 1994 1998 2002 2006 2011 Variation % (2011/1994)
Annual average rate
Total 6445 10,394 12,174 16,635 21,200 228.9 7.26
RGPS benefits 6023 9820 11,414 15,258 19,076 216.7 7.02
Social security benefits 5846 9495 11,0332 14,809 18,512 216.7 7.02
Retirement 4160 6925 7606 9909 12,761 206.8 6.82
Contribution time-range 2019 4134 4182 4829 5967 195.5 6.58
Age 1488 1911 2303 3387 4668 213.8 6.96
Disability 653 880 1121 1694 2125 225.5 7.19
Survivor pension 1472 2233 2718 3618 4654 216.2 7.01
Aids 199 324 625 1263 1060 433.0 10.34
Others 16 13 83 18 37 133.5 5.11
Accident 177 325 381 449 565 218.3 7.05
Survivor benefit 36 65 89 124 158 343.6 9.16
Others 142 260 292 325 406 186.8 6.39
Assistance benefits 421 575 760 1364 2109 400.4 9.93
LOAS and RMV 415 563 748 1351 2094 404.1 9.98
Others 6 12 12 13 15 142.2 5.34
EPU-UNION WELFARE CHARGES 0 0 0 14 15 n.a n.a
Source: AEPS—Historical Supplement, 2011. /a: Deflated by INPC.
Figure 2. Pension expenditures (as % of GDP)—sample of 90 countries, Source: World Bank data base.
The literature has treated the social security coverage as the ratio of individuals who are affiliated to the
pension scheme and the employed population. Membership can be given in several ways, and even simulta- neously. A traditional way to measure coverage is through the relative incidence of contributors to the system. Before take care of this issue we present an international overview on coverage. In 1994, the World Bank pre- pared the report “Averting the Old Age Crisis: Policies to Protect the Old and Promote Growth.” In it are availa- ble data on pension coverage for more than sixty countries. Table 4 presents the data for some selected countries.
Bolivia
Brazil
South Korea
Netherlands
IrelandIsrael
Italy
JapanMexico
Mongolia
Poland
-3-113579
1113151719
2 5 8 11 14 17 20 23 26 29 32
Pens
ion
expe
nditu
res (
as %
of
GD
P)
Demographic dependency ratio

P. Tafner, C. Botelho
149
In the overall, Brazil is located in the upper third of higher coverage countries, but at a level lower than that ob- served for developed countries and even for some of Latin American countries.
Comparing data from two different years in Brazil (2011 and 1988) on social security contribution of working age population (15 - 59 years) one can see that in 2011 this rate was 15% higher than in 1988, having increased just over 6 percentage points. Although modest, this result is very expressive, because in the same period the working age population increased its size by almost 50%. This means that even pressured by demographic effect, the labor market and Social Security institutional improvements contributed to increase contributory member- ship. Table 5 presents the data on contributory membership and pension coverage.
Spite the contribution rate be an important indicator of the social security performance, the social security coverage however, as stated earlier, seems to be a more appropriate measure of the extent of the pension system. It can occur either by contribution or by receiving regular benefits. Between 1984 and 2011 (Table 5), pension coverage rose by almost 5 percentage points, reaching in 2011 almost 3/4 of the population.
Between 1984 and 2011, the expansion of total social security coverage was 5.4 percentage points. At same time, for the elderly segment (individuals aged 65 or more) this rose from 90.2% to 94.41%. However, this per- formance was not accompanied by young population. In fact, the pension coverage for young people was slightly reduced from 60% in 1984 to 59.6% in 2011. Another issue that must be pointed out is that in Brazil we still have 28% of the population that is not covered by social security.
3. The Social Security Coverage in Brazil—Recent Years 3.1. The Direct Social Security Coverage: Definitions The direct social security coverage2 is a result of the individual insertion in the welfare system. This insertion can basically be done by two different forms: by receiving regular benefits, such as retirement, pension or BPC-LOAS or by contributing to the pension system. So, the person who receive a benefit from welfare system or contribute to welfare system will be considered as directly protected by welfare system.
Table 4. Social security coverage (in %)—many countries.
Country Year Coveragee Country Year Coveragee Country Year Coveragee
Argentina 1989 53.2% India 1990 10.6% Senegal 1990 6.9%
Bolivia 1992 11.7% Indonesia 1991 10.7% South Korea 1991 30.0%
Brazil 2004 49.7% Jamaica 1991 39.3% Spain 1992 85.3%
Burkina Faso 1989 3.7% Japan 1989 100.0% Sri Lanka 1990 28.8%
Cameron 1989 13.7% Kenya 1990 14.7% Sweden 1990 100.0%
Canada 1989 97.4% Malaysia 1991 48.7% Switzerland 1992 97.4%
Chile 1992 55.7% México 1990 37.9% Taiwan 1988 86.7%
Colombia 1989 23.9% Mozambique 1986 0.2% Tanzania 1990 5.1%
Costa Rica 1993 54.2% Niger 1990 2.8% Turkey 1990 34.6%
Denmark 1990 100.0% Nigeria 1990 2.4% United Kingdom 1990 94.2%
Dominican Republic 1988 11.5% Pakistan 1989 3.5% Uruguay 1989 68.8%
Ecuador 1989 37.8% Panamá 1990 39.6% USA 1989 96.9%
Egypt 1989 62.3% Peru 1992 25.7% Venezuela 1990 34.3%
Ghana 1989 13.3% Philippines 1990 19.1% Zambia 1989 13.8%
Honduras 1990 18.7% Ruanda 1989 9.3% Source: World Bank (2004).
2The coverage rate is expressed by a ratio. The numerator is the sum of individuals who contribute to social security, of individuals receiving retirement benefit and of individuals who receive the pension benefit. The denominator is the population.

P. Tafner, C. Botelho
150
Table 5. The evolution of social security contribution rate and social security coverage—Bra- zil: 1984-2011.
Year % Contributors/a % Coverage /b
Total Up to 14 years 60 - 64 years 65 years or more
1984 35.88 68.00 60.03 86.20 90.20
1988 40.76 69.66 63.42 87.78 91.78
1992 41.91 79.53 76.22 93.01 95.23
1996 37.99 77.25 72.18 94.60 95.84
2001 37.06 68.92 60.29 93.32 95.65
2002 37.15 76.24 70.24 95.00 96.68
2003 37.80 66.73 56.16 93.51 96.22
2004 38.15 65.80 54.92 92.60 95.42
2005 39.53 67.04 56.14 93.03 95.43
2006 40.96 67.86 57.12 91.61 93.76
2007 41.89 68.56 57.49 91.86 93.87
2008 43.74 69.93 58.04 92.54 94.62
2009 44.55 70.36 58.49 92.57 94.52
2011 46.89 71.90 59.57 92.50 94.41
Var. 2011/1984 30.68 5.74 −0.76 7.31 4.66
/a: expressed in percentage of population age 15 to 59 years. /b: expressed in percentage of all population. Source: National Household Sample Survey (Pnad)/IBGE, several years.
For the calculation of this statistic we use the Pnad. Although the coverage of Pnad for topics related to social
security is less than in administrative records, their distribution is very similar to that observed in the records of the Ministry of Social Welfare (MPAS), the responsible agency for the management and control of information on social welfare.
3.2. The Total Social Security Coverage: The Evidence Besides the usual way to calculate the coverage of social security, as stated above, there are many others to measure it. All of them can be calculated and they express the magnitude of the social security system. As we said, in Brazil, an individual will have direct welfare coverage if he pays the social security fees, or he receives a benefit from INSS (retirement or a survivor benefit).
Using data from several Pnads (between 1982 and 2011) it is observed a consistent growing on direct social security coverage rate and it happened in all of its forms, as can be seen in Table 6. The direct pension coverage rate has grown from 26.53% in 1982, to 41.94% in 2011. This increase in the direct coverage occurred with the expansion of social security coverage in all its forms: by contributing and by receiving benefits. This perfor-mance however was not homogeneous. At the bottom of Table 6 one can find the rates of change between 1982 and 2011 and between 1988 and 2011.
In the period, the direct coverage as a whole has expanded by 58.05%. The portion due to retirement benefits grew 87.23%, those due to pension benefits grew 131.11%. But those due to contributory membership grew solely 45.54%. Taken the post-Constitution period, the numbers are lower: 39.09%, 65.59%, 75.45% and 29.39%, respectively. Symmetrically, the rate of non-coverage fell by 15.4 percentage points, which represents a decrease of 20.96% in the whole period and 16.87% in the post-Constitution.
Nevertheless there is a wide variation between regions, either in the levels of coverage for each specific type or in the pace at which rates vary in time. Southeast and especially the South, present higher coverage rates in all

P. Tafner, C. Botelho
151
Table 6. Direct social security coverage—Brazil: 1982-2011 (selected years).
Year Coverage by retirement
Coverage by pension
Coverage by contribution
Total direct coverage
Not direct coverage
1982 5.01 1.44 20.09 26.53 73.47
1985 5.35 1.65 20.35 27.35 72.65
1988 5.67 1.89 22.59 30.15 69.85
1990 5.91 2.23 26.39 34.54 65.46
1995 6.96 2.65 21.99 31.60 68.40
1998 7.74 2.82 21.19 31.75 68.25
2001 7.82 2.98 22.08 32.89 67.11
2005 7.87 3.43 24.12 35.43 64.57
2008 8.53 3.47 26.99 38.99 61.01
2011 9.38 3.32 29.23 41.94 58.06
Var. 2011/1988 65.59 75.45 29.39 39.09 −16.87
Var. 2011/1982 87.23 131.11 45.54 58.05 −20.96
Source: Pnad/IBGE, several years. forms compared to those observed in other regions. For example, while coverage due to retirement in the North is only 5.7% in 2011, this same statistic is 11.2% in the South, for the same year. Similarly, while coverage in South and Southeast due to contributory membership in 2011 stood close to 35% in the North and Northeast these values were less than 20%.
In terms of growth pace there are also large differences between regions of the country. The contributory membership rate, for example, showed an increase over 65% in the Northeast, South and Midwest, from 1982 to 2011, whereas In the Southeast, this growth was 34.9% and in the North of only 2.5%. It is also in the North Region that one can find the lowest rates of expansion of pension coverage in all forms and the lowest overall rate of direct pension coverage as well.
In the same period, while the national average expansion of pension coverage due to retirement was 87.2% in the North was only 58.0%. The increase in the coverage due to pension, in Brazil was 131.1% but in the North it was of only 43.8%. Considering the very low performance of all forms of direct coverage in the North Region— below the national average—the direct coverage in the North region were the lowest in the country and that which growth is the lesser over the past almost 30 years. Table 7 presents this information.
From the perspective of the gender, there is a significant advancement of direct pension coverage among women. In 1982, only 17.9% of the women had social security direct coverage. In 2011, that number was more than double: 38.1%. Decomposing the direct total coverage, it is observed that, with the exception of coverage by pension, the pace of increase in coverage among women has occurred more rapidly than among men. Among women, the pension coverage by retirement between 1982 and 2011 increased from 3.7% to 8.4%. Among men, this coverage increased from 6.4% to 10.5%. The same applies to the coverage by contribution. Although wom- en are still at a level very lower than that of men (21.8% versus 32.5%), the expansion speed of coverage for women happened in a pace more pronounced. On average, women increased their coverage by contributions at a rate 5 times higher than that for men throughout the period considered. In the case of pensions, the reverse process occurred. The pace of expansion for men was higher. But still, given the characteristics of this benefit, coverage among women is more than 7 times higher than for men yet.
It should also be noted that this expansion of coverage of women is continuous throughout the period, and even before the Constitution of 1988, the rate of expansion of coverage was high, and, in fact, 76% higher than that observed in the post-Constitution period. This occurs in all of the three possible ways of coverage. The ex- pansion of coverage for women is a process previous of the 1988 Constitution. The 1988 Constitution may have assisted in the expansion of social security protection given to women, but it is not the origin, neither the main cause of coverage expansion for women (Table 8).

P. Tafner, C. Botelho
152
Table 7. Incidence of direct pension coverage by type, and region—selected years.
Year Region Coverage by retirement
Coverage by pension
Coverage by contribution
Total direct coverage
Not direct coverage
1982
Brazil 5.01 1.44 20.09 26.53 73.47
North 3.58 1.23 18.77 23.58 76.42
Northeast 5.04 0.82 10.94 16.79 83.21
Southeast 5.35 1.96 25.91 33.22 66.78
South 4.93 1.48 21.83 28.24 71.76
Center-West 3.41 0.68 18.35 22.43 77.57
1988
Brazil 5.67 1.89 22.59 30.15 69.85
North 3.79 1.30 19.42 24.51 75.49
Northeast 5.79 1.19 12.88 19.87 80.13
Southeast 5.98 2.50 28.74 37.22 62.78
South 5.78 1.93 24.50 32.20 67.80
Center-West 3.74 1.18 21.24 26.17 73.83
2011
Brazil 9.38 3.32 29.23 41.94 58.06
North 5.66 1.77 19.23 26.66 73.34
Northeast 9.32 2.85 18.93 31.10 68.90
Southeast 9.96 3.73 34.94 48.64 51.36
South 11.20 4.34 36.45 51.99 48.01
Center-West 7.07 2.59 32.93 42.59 57.41
Var. (%) 2011/1982
Brazil 87.23 131.11 45.54 58.05 −20.96
North 57.98 43.83 2.46 13.06 −4.03
Northeast 85.16 249.18 73.05 85.23 −17.20
Southeast 86.08 90.11 34.88 46.39 −23.08
South 127.45 193.19 66.94 84.11 −33.10
Center-West 107.51 279.38 79.52 89.84 −25.98
Source: Pnad/IBGE, several years. Table 8. Incidence of direct pension coverage by type and by gender—Brazil: 1982-2011.
Years Coverage by retirement
Coverage by pension
Coverage by contribution Total coverage Not direct coverage
Male Female Male Female Male Female Male Female Male Female
1982 6.35 3.70 0.21 2.64 28.80 11.52 35.35 17.86 64.65 82.14
1988 6.94 4.44 0.23 3.49 30.89 14.59 38.06 22.53 61.94 77.47
1993 7.92 5.27 0.27 4.30 28.89 14.71 37.08 24.28 62.92 75.72
1997 8.96 6.05 0.40 4.97 27.76 15.90 37.12 26.92 62.88 73.08
2001 9.25 6.47 0.53 5.30 27.38 17.07 37.16 28.84 62.84 71.16
2005 9.34 6.48 0.72 6.02 29.29 19.21 39.35 31.70 60.65 68.30
2009 9.99 7.31 0.97 6.02 33.02 22.54 43.99 35.87 56.01 64.13
2011 10.46 8.37 0.91 5.59 34.60 24.17 45.98 38.13 54.02 61.87
Var. 2011/1982 64.85 126.13 335.56 111.55 20.17 109.79 30.05 113.44 −16.43 −24.67
Source: Pnad/IBGE, several years.

P. Tafner, C. Botelho
153
Another important dimension of social security coverage refers to the individual’s age. The direct coverage is very different according to age. Children and young people, a group that will be carefully analyzed ahead, have low direct social security coverage. The direct coverage for children and young people which were very low in 1982 fell by half in 2008. And that was basically due to the reduction in coverage by contribution. At same time it reveals a social advancement, since relatively fewer children and adolescents are in the labor market.
At the other side of the age distribution, it appears that direct coverage of the group of 60 or more increased from 67.4% in 1982 to 82.3% in 2011. This growth was not higher because there was a slight reduction of 2 percentage points in coverage due to contributory membership. In summary, the expansion of social security coverage for this age group was motivated solely by the expansion of granting social security benefits.
For economically active age group (individuals between 16 and 59 years) pension coverage expanded from 40.6% in 1982 to 50.8%. In 2011.This increase is almost equally split between granting of benefits and mem- bership contribution (58% for the first and 42% for the second). Table 9 summarizes this information.
3.3. The Total Social Security Coverage: Definition Brazilian law provides that spouses and children or stepchildren under age 21 are potentially protected. The sta- tistic of coverage that incorporates these segments provides a more accurate picture of the extent of the Brazilian social security system, in terms of protected population and it also allows the identification of social groups more exposed to social unprotection risk and its measurement
The construction of direct plus indirect coverage variable was made through the “extension” of direct cover- age to members of the family unit, according to each type of coverage. So for example, if the reference person in the family unit (or your spouse) has pension coverage by contributing to social security, your spouse, your children or stepchildren under age 21 also have pension coverage. The same applies if the reference person or spouse receives benefits (retirement or pension).
The Social Security as a Way for Reducing Poverty and Inequality
Some analysts consider social security as a social program to ensure to all old individual a non-contributory benefit. Sometimes this idea is complemented by the understanding that social security should be a redistributive welfare system in which the contributions are payable upon availability of each individual and the benefits re- ceived according to their need [2-4].
Two of the arguments most often used for supporting the idea of a welfare system as a “minimum income program”, or as a non-contributory program, are 1) the fact that social security system is a powerful instrument for reducing poverty and social inequality, both individual and household, and 2) it is a necessary guarantee of income against the labor market high informality. Both arguments are true. But they have serious limitations. Table 9. Incidence of direct pension coverage by type and by age group—Brazil: 1982-2011.
Year People who have social security protection
Up to 15 years 16 thru 59 years 16 thru 59 benefits 60 years and over 60 years and over benefits
1982 0.59 40.76 4.57 67.36 60.62
1988 0.88 44.52 5.06 72.23 65.53
1990 0.97 51.00 5.24 74.86 67.46
1995 0.64 43.11 5.65 80.71 76.02
1999 0.32 41.05 6.21 81.27 76.95
2005 0.15 44.11 5.77 82.48 78.16
2008 0.21 47.82 5.46 82.03 77.18
2011 0.26 50.84 5.43 82.34 76.75
Var. 2011/1982 −55.73 24.72 18.74 22.23 26.62
Source: Pnad/IBGE, several years.

P. Tafner, C. Botelho
154
It seems a consensus among analysts that the welfare—there including assistance component—acts strongly on poverty reduction and on individual and household inequality as well. In fact, after the payment of pensions for families, poverty is reduced, as can be seen in Figure 3.
The effectiveness of the instrument as reducing poverty was accelerated until 2002, but stopped growing and fell slightly thereafter. In 1992, it reduced the incidence of poverty by 10.9 percentage points (from 50.4% to 39.5%) and in 2003, the reduction was 7.8 percentage points (from 43.6% to 35.8%). But in 2009, poverty re- duction was 6.1 percentage points, corresponding to a drop of 22.2%.
The initial increase was due to two simultaneous factors: on the one hand, the increase of issued benefits which happened at a very high pace, especially those of minimum value, known as “floor benefit”. The second factor was the growing in the real value of the benefit that started in the second half of the mid-90. However, recent years reveal the weakening of the instrument.
The fact that the social security is an instrument for reducing poverty does imply neither that it is efficiently used nor that it is acting on the poorest. To do so, it is enough simply indicate that if two poor individuals, one being poorer than the other, and if the public policy allocate resources to the less poor, poverty will certainly de- crease but it will not reach the poorest, and so it will not reach its maximum power. Therefore, reducing poverty does not necessarily mean protect the poorest, but only the poor. Indeed, Barros and Carvalho [5] showed that: 1) only three out of ten welfare recipients who receive the minimum wage live in poor family (7 in ten are out of poverty), and 2) that the minimum wage is between 3 and 4 times less effective in reducing poverty than a tar- geted program (such as Bolsa Família, BF, for example) and, consequently, is nearly four times more expensive than this program to achieve the same goal.
Now, if the desirable goal is reducing poverty, then definitely the social security is not the best tool, because as it is designed it is expensive, discourages the contribution, and subverts the concept of social insurance. Just as an exercise, it would be possible to devise a program of income transfer focused on the poorest, in the shape of BF. For comparison, the exercise is done by keeping constant the amount of resources transferred by social security. If the program was focused on the most deprived segments of income, the impact on poverty reduction would be much more intense than by social security, as shown in the Figure 4.
A second aspect of the question concerns to the ability of social security to reduce household poverty, partic- ularly among children and young people. An argument often used is that the elderly who receive an income from the pension system share it in household. However, if this assertion were true, this would imply that the inci- dence of poverty would be invariant with age. If so, the incidence of poverty among children and young people could not be higher than among the elderly. However, that is not what happens in Brazil.
The incidence of poverty among children and youth (under 18 years) is more than three times higher than among elderly (aged 65 and over). That is far from what was envisioned by the proponents of the idea of soli-
Figure 3. Household poverty before and after payment of social security benefits (in%)—Brazil: 1992-2009, Source: Pnad/IBGE several years. Prepared by Tafner (2007) and updated by the authors.
50.4 50.1
41.4 41.0 41.1 41.5 43.0 42.7 43.5 43.6 42.1 41.4
34.330.8
28.0 27.5
39.5 40.2
33.6 33.1 33.6 32.3 34.3 35.2 34.535.8
34.331.5
27.124.4 22.6 21.4
0.0
10.0
20.0
30.0
40.0
50.0
60.0
1992 1993 1995 1996 1997 1998 1999 2001 2002 2003 2004 2005 2006 2007 2008 2009Before After

P. Tafner, C. Botelho
155
Figure 4. Household poverty before and after payment of social security benefits and the simulation of a focused income distribution program among the poorest (in%)—Brazil: 1992-2009, Source: Pnad/IBGE: prepared by Tafner (2007), several years and updated by the authors.
darity between generations. It also means that the income transferred from social security does not provide sig- nificant benefits for children and youth. Table 10 presents some important information concerning to the condi- tion of these groups such as per capita income, poverty, extreme poverty and wage.
From this information we may say that the social security is reducing the high level of poverty in the country. Nevertheless, this does not means that the instrument is focusing on the poorest. As just shown, social security resources do not circulate between generations in order to promote a balance for all ages. If we wanted social security as a redistributive program, we should draw it transferring resources to the poorest—young people and children.
Barros and Carvalho [5] showed that if 20% of the total transferred to the elderly, were instead transferred to youngest people, poverty would be reduced by almost 10% percentage points—and 13% among children. By doing so, poverty among the elderly would increase only 3%. In aggregate terms, this would reduce poverty in Brazil 4 percentage points.
The evidence reveal that the argument that social security should be kept as it is now because it is a mechan- ism to transfer income is flawed. And this is because two reason: first, because the foundation of social security in Brazil, as in many countries, is social insurance, which means that the system is a contract in which each in- dividual agrees to pay a portion of their income to support the system and then when he loses the ability to work, get the right to be supported by social security; and secondly because who is a beneficiary of welfare system is not the poorest. It is more appropriate, therefore overcome the problems of social security system and improve social programs, focusing resources and attention on the poor, with priority assistance to the poorest.
4. Challenges An important aspect of Brazilian social security refers to the welfare coverage. The rate of expanded welfare coverage (direct plus indirect) is approximately 71% of the population which, according to many analysts is low. It would be even lower if the granting of benefits post-CF-1988 had not been so high. Using data from PNAD 1982 and applying the same criteria used in Table 5, surprisingly we find out same result: 71% of the population was already covered before CF-1988. What changed, and changed a lot, is the coverage composition. In sum- mary: by one hand we extended coverage (by granting benefits) to all individuals over 60 years and by other the
50.4 50.1
41.4 41.0 41.1 41.543.0 42.7 43.5 43.6
42.1 41.4
34.3
30.828.0 27.5
39.5 40.2
33.6 33.1 33.632.3
34.3 35.2 34.5 35.8 34.331.5
27.124.4
22.6 21.4
33.6 33.8
26.8 26.4 26.724.9
26.3 26.8 25.8 26.123.6
20.0
15.812.9
10.8 9.0
0.0
10.0
20.0
30.0
40.0
50.0
60.0
1992 1993 1995 1996 1997 1998 1999 2001 2002 2003 2004 2005 2006 2007 2008 2009Before After Focused

P. Tafner, C. Botelho
156
social protection for children and young people has been reduced (Table 11). Once obtained the coverage rate, one may determine its symmetrical named as “no coverage rate. Doing this
by age (and not by age group), the “no-coverage” rate for children and young people is up to 5 times higher than among elderly (above 60 years). And what is even worse: between 1982 and 2011 the “no-coverage” rate has increased from 38.9% to 40.4%, as shown in Table 11. As known, children and teens, in general, have young adult as parents. If young and teens have no welfare protection this is because their parents are also unprotected. A policy that brings youth and young adults in to the formal labor market is needed. This is the way to assure welfare protection to children and youth in Brazil. This need is even more urgent because almost half of working age people are out of welfare protection.
Young adults in Brazil have been systematically excluded from access to positions that allow them to have conditions of autonomous life. The welfare no-protection is at same time a cause and a consequence of this se- rious social situation. Young adults that are excluded from the formal labor market have their children also ex- Table 10. Per capita household income, household poverty and income below minimum wage—Brazil 2011.
Age Per capita monthly household income (in R$)
Poverty incidence (%)
Extremely poverty incidence (%)
Percentage of individuals with remuneration below minimum wage
15 504 32.9 12.3 90.9
16 521 29.7 11.4 81.2
17 550 27.8 10.8 68.6
18 583 26.0 10.1 54.6
19 605 22.3 8.3 43.5
20 674 20.0 8.2 39.4
21 676 19.7 8.0 35.4
22 704 19.7 8.2 32.6
23 738 19.6 8.1 30.0
24 766 18.9 7.5 28.5
0 to 14 468 38.4 15.0 n.a
15 to 24 629 23.9 9.4 42.8
25 and over 902 15.1 5.3 24.1
Source: Pnad/IBGE. Table 11. Direct and indirect coverage in the Brazilian social security system—1982 and 2011 (%).
Age group Year: 1982 Year: 2011
Under 15 years
15 to 59 years
60 to 69 years
70 years and over
Under 15 years
15 to 59 years
60 to 69 years
70 years and over
Direct coverage (A) 0.22 39.41 58.25 81.83 0.16 49.44 76.90 89.12
Indirect coverage (B) 60.94 29.31 22.08 9.68 59.41 23.01 13.73 5.68
By retirement 4.04 5.03 11.78 7.57 2.14 4.26 7.06 3.68
By pension 1.75 0.63 1.16 0.50 1.73 0.63 1.37 0.88
By contribution 55.15 23.65 9.14 1.62 55.53 18.12 5.31 1.13
Total coverage (A + B = C) 61.15 68.72 80.34 91.52 59.57 72.45 90.63 94.80
Uncovered (100 − C) 38.85 31.28 19.66 8.48 40.43 27.55 9.37 5.20
Source: Pnad/IBGE.

P. Tafner, C. Botelho
157
cluded from social protection, producing a perverse cycle of poverty that is repeated for generations. Promoting a set of institutional reforms dealing with welfare exclusion seems to be an urgent political agenda in Brazil.
5. Conclusions In the last three decades, many countries have reformed their pension systems. These reforms were the response to the inadequacy of their institutional framework which was not adapted to demographic, economic and social changes that occurred in the 20th century boosted spending and eroded the base funding of social security sys-tems. Brazil, nearly 30 years ago, also undertook a reform (later amended in 1998 and 2003) facing the same challenges. These reforms, however, were partial and incomplete, so a new round of adjustments will be re-quired.
A new round of reforms probably raises into citizens a sense of permanent change of rules. And this feeling tends to raise political resistance to change. This resistance reflects the imbalance between losses and gains, be- tween present and future, and it is often a result of absence of precise information which induces people to have prejudices and wrong ideas. To a large extent this is because reforms involve technical particularities, diverse social and political actors, and different costs and penalties, according to age, gender, economic activity and life plans. For all social groups, however, changing pension rules means taking losses in the present to avoid bigger losses in the future
A new round of institutional reforms probably raises into citizens a sense of permanent change of rules. And this feeling is likely to raise social and political resistance to change. This resistance largely reflects the imbal-ance between losses and gains, between present and future, and it is often a result of absence of precise informa-tion which allows people make up correct ideas devoid of prejudices. This, far from being a Brazilian peculiarity, is the norm in most countries. To a large extent this is because doing pension reform requires technical particu-larities, diverse social and political actors and different costs and penalties, according to age, gender, economic activity and life plans. For all social groups, however, changing pension rules means taking losses in the present to avoid bigger losses in the future.
Another important aspect is that, as the reforms involve several minor operational adjustments—like changing age for entitling the benefit, contribution period, the benefit amount, and conditions for termination—a particular change may cause loss to some, but being neutral for others. In general, vetoes for this kind of change are strongly preferred by small groups, producing various minorities with strong opposition.
Overcoming resistance and generate a set of minimum acceptance parameters takes time. Besides that, there must be broad technical information in order to guide the debate on more substantive issues. Technical informa- tion are important because they allow parties understand and make calculation, including those in absence of re-forms. The explanation of the trade-offs is essential to move forward. And that takes time.
In Brazil, poverty and extreme poverty are restricted to groups of children and youth. As shown by Tafner, Carvalho and Botelho [6], an individual with up to 20 years of age is ten times more likely to be extremely poor than an individual aged 60 or more. In addition, three quarters of federal social spending goes to Social Security (nearly 9% of GDP), while the Bolsa Família Program, for example, which has proved be more effective in re- ducing poverty and destitution in the country, consumes less than 0.5% of GDP. In 2011, for instance, more than 95% of individuals aged 60 or older were protected by Social Security, but among children and young, less than two thirds were protected. The remaining individuals (almost 30 million) were with no protection at all. If noth- ing is changed, the effects can be harmful to particular groups, particularly young people. It is well known that the difficulties they face in entering the formal labor market may reduce the social protection for this group. The result, in terms of social problems, is a huge amount of children and young people living in poverty, reproducing a cycle of poverty that affects not only the group itself, but its future generations. It also affects the society, since there are many negative externalities in this situation.
The main purpose of this paper is to provide some information that could contribute to the debate on the pension system. We also show that Brazilian Social Security System has accumulated serious imbalances, mak-ing pressure on government accounts with negative impacts on the long-term possibilities of growth.
References [1] Giambiagi, F. and Tafner, P. (2010) Demographics—The invisible threat: The pension dilemma that Brazil must face.

P. Tafner, C. Botelho
158
Rio de Janeiro. Elsevier. [2] Delgado, G. and Cardoso Jr., J.C. (2000) Universalization of minimum social rights in Brazil: The case of rural welfare
in the 90s. In: Social Security, welfare and poverty alleviation. MPAS, Brasilia. [3] Delgado, G.C. (2005) Social policy and income distribution in Brazil. In Seminar: Wages and Development.
IE/Unicamp, Campinas. [4] Lavinas, L. (2006) From means-test schemes to basic income in Brazil: Exceptionality and paradox. International So-
cial Security Review, 59, 103-125. http://dx.doi.org/10.1111/j.1468-246X.2006.00249.x [5] Barros, R.P. and Carvalho, M. (2005) Minimum wage and income distribution. IPEA Set, Rio de Janeiro. [6] Tafner, P., Carvalho, M. and Botelho, C. (2009) The improvement of social policies towards the Bolsa Família in Bra-
zil 2.0 post-Crisis-agenda for the next decade. Rio de Janeiro, Elsevier.

P. Tafner, C. Botelho
159
Annex
Figure A1. Demographic changes in Brazil—1980-2050s.
Population by age group (million) - Brazil: 1980
Up to 14 years 15 to 59 years 60 years and over
45,3
66,0
7,2
Population by age group (million) - Brazil: 2020
Up to 14 years 15 to 59 years 60 years and over
41,6 137,3
28,3
Population by age group (million) - Brazil: 1990
Up to 14 years 15 to 59 years 60 years and over
51,8
84,9
9,9
Population by age group (million) - Brazil: 2030
Up to 14 years 15 to 59 years 60 years and over
36,8139,2
40,5
Population by age group (million) - Brazil: 2000
Up to 14 years 15 to 59 years 60 years and over
51,0
106,4
13,9
Population by age group (million) - Brazil: 2040
Up to 14 years 15 to 59 years 60 years and over
32,6134,4
50,1
Population by age group (million) - Brazil: 2010
Up to 14 years 15 to 59 years 60 years and over
49,4124,5
19,3
Population by age group (million) - Brazil: 2050
Up to 14 years 15 to 59 years 60 years and over
28,3122,9
64,1