Yemen Country Report on OOSC_EN.pdf .pdf - UNICEF
140
MIDDLE EAST AND NORTH AFRICA OUT-OF-SCHOOL CHILDREN INITIATIVE OCTOBER 2014 ALL IN SCHOOL YEMEN COUNTRY REPORT ON OUT-OF-SCHOOL CHILDREN
-
Upload
khangminh22 -
Category
Documents
-
view
0 -
download
0
Transcript of Yemen Country Report on OOSC_EN.pdf .pdf - UNICEF

MIDDLE EAST AND NORTH AFRICAOUT-OF-SCHOOL CHILDREN INITIATIVE
OCTOBER 2014
ALL IN SCHOOL
YEMENCOUNTRY REPORT ON OUT-OF-SCHOOL CHILDREN


OCTOBER 2014
YEMENCOUNTRY REPORT ON OUT-OF-SCHOOL CHILDREN
MIDDLE EAST AND NORTH AFRICAOUT-OF-SCHOOL CHILDREN INITIATIVE
ALL IN SCHOOL

© 2015 UNICEF Yemen Country Office
Cover photo: Abdullah Modhesh, UNICEF Yemen Country Office

Yemen Country Report on Out-of-School Children iii
Preface
The Government of Yemen is committed to fulfilling the right of every girl and boy in Yemen to an education of good quality. This commitment is reflected in key national strategies and programmes, such as the Transitional Program for Stabilization and Development (2012-2014) and Global Partnership for Education (2014-2017), both of which focus upon targeted interventions to increase the enrolment of children in education as a national social and developmental priority. As a development partner supporting education in Yemen since 1985, UNICEF is pleased to continue its support to the Government of Yemen to fulfil this commitment to all children in Yemen.
In line with national strategies and priorities, this study engages recent national and survey data to identify the profile of out-of-school girls and boys in Yemen, the bottlenecks they encounter in accessing education, and intersecting challenges that prevent them from enrolling and completing basic education. Following this analysis of the situation of out-of-school children in Yemen, the international and Yemeni experts offer a set of policy recommendations to improve enrolment and retention rates across the country.
The significance of this study stems from its relevance to the Government of Yemen’s efforts to fulfil its commitment to the Education for All (EFA) and the Millennium Development Goals (MDGs), particularly Goals 2 and 3; the achievement of universal primary education and gender equality. The findings of the study identify critical gaps and propose innovative and durable opportunities to support the country’s progress towards fulfilling these commitments. The Government of Yemen, UNICEF and other education sector development partners must continue to work together to implement these recommendations and enable all girls and boys in Yemen to participate in education of good quality.
Abdulrazaq Al-Ashwal
Minister of Education
Julien Harneis
UNICEF Representative

Middle East and North Africa Out-of-School Children Initiativeiv
Acknowledgements
UNICEF and the Yemeni Ministry of Education collaborated closely to produce this Out-of-School Children Initiative Study in Yemen. The Study was developed and finalized by a technical team comprised of two international consultants and a national core team from the Ministry of Education (MOE) and the Educational Research and Development Center. Dr. Mouna H. Hashem, the lead international consultant, was responsible for the overall development of the study and served as the principal author and editor of the report. Ms Karin Seyfert, was the international consultant responsible for the data analysis of the administrative and household surveys and writing of Chapter 2. From the MOE core team, Mr. Hashim Al-Shamiri assisted in the research of the MOE data, while others contributed research papers on the various issues: Mr. Faisal Ahmed Muhalap and Dr. Insaf Qassem’s contributed a paper on Early Childhood Education; Ms Aman Albaadani contributed a paper on Girls’ Education; Mr. Khalil Al-Hussaini and Ms. Aziza Alhababi contributed a paper on Education in Emergencies; and Ms. Asia Almishriqi and Mr. Ahmed Mahyoob Alwajeeh contributed a paper on Children with Special Needs and Exclusive Groups. In Chapter 4, Dr. Ibrahim Al-Houthy and Dr. Insaf Qassem from the Education Research Development Center and Dr. Hamoud Al-Sayani from the MOE, contributed a research paper on the MOE policies and strategies.
Special thanks to His Excellency Dr. Abdulrazaq Alashwal, Minister of Education, Mr. Khalil Al-Hussaini, Head of the Coordination Unit in the MOE and Mr. Khaled Al-Qubaty, designated coordinator between UNICEF and the MOE for their support throughout the study. Mr. Al-Qubaty’s efforts were especially valuable during the final national workshop where the findings of the study were presented to the MOE, international development partners, NGOs and civil society groups and academicians. We also thank all those we consulted during the research phase; a list of their names is included in the Annex.
Valuable data and technical support from various institutions has contributed to the development of this report. Special appreciation to Oxford Policy Management, specifically Stuart Cameron who has provided valuable technical input; the UNESCO Institute of Statistics (UIS) for technical support on the profiles chapter, specifically Sheena Bell and Talal El Hourani; Understanding Children’s Work (UCW) for technical support on data on child labour, specifically Lorenzo Guarcello, and the International Policy Center (IPC). Special gratitude to Dr. Andrea Rugh for reviewing the study and offering valuable comments.
Throughout this effort, the team was fortunate to have on-going support from the UNICEF MENARO Education Section, and the UNICEF Yemen Country Office: Jeremy Hopkins, Mohamed Ali Bile, Belqis Al-Dabbi, Therese Cregan, and Abdullah Modhesh, in addition to Bassam Al-Abbadi, who was responsible for the logistics.

Contents
List of figures and tables vi
List of acronyms viii
Executive summary 1
1 Introduction 9
1.1 Country context 9
1.2 Education sector 12
1.3 School attendance 16
1.4 The Five Dimensions of Exclusion Model 18
1.5 Methodology 19
2 Profiles of excluded children 21
2.1 Data sources 21
2.2 Dimension 1: Pre-primary school children 28
2.3 Dimensions 2 and 3 29
2.4 Dimensions 4 and 5 37
2.5 Child labour 43
2.6 Marginalized children 47
3 Bottlenecks and policies/strategies 57
3.1 Dimension 1: Bottlenecks and policies/strategies 57
3.2 Dimensions 2 and 3: Bottlenecks 60
3.3 Dimensions 2 and 3: Policies and strategies 74
4 Recommendations and conclusions 81
References 90
Annexes 95
Annex 1 Data inventory template on out-of-school children 96
Annex 2 Data quality assessment worksheets 102
Annex 3 Additional tables, figures and data discussions 114
Annex 4 Additional tables for the bottleneck discussion 120
Annex 5 Meetings and consultations 122

Middle East and North Africa Out-of-School Children Initiativevi
List of figures and tables
Figures
Figure 1.1 Primary adjusted net enrolment rate and gender parity for children 16 ages 6-11 years old
Figure 1.2 School participation from survey data, enrolment rate by cycle and 17 age (2012/2013)
Figure 2.1 Pre-primary enrolment, children 5-6 years old 28
Figure 2.2 Dimension 2: Out-of-school children by school exposure 29
Figure 2.3 Percentage of primary school age children 6-11 years 30 old, out of school
Figure 2.4 Dimension 2: Out-of-school children by governorate (2012/2013) 31
Figure 2.5 Dimension 3: Out-of-school children by school exposure 32
Figure 2.6 Percentage of lower secondary school children age 12-14 years 33 out of school
Figure 2.7 Dimension 3: Out-of-school children by governorate 34
Figure 2.8 Out-of-school children by school exposure 35
Figure 2.9 Gender parity index for age specific enrolment rates by geography 36
Figure 2.10 Dropout rates by grade, from Grade 1 to Grade 9 40
Figure 2.11 Dropout rates by grade and sex 41
Figure 2.12 Children at risk of leaving school by maternal education 42
Figure 2.13 Percentage of out-of-school children by age (6-14 years old) and 43 child labour status
Figure 2.14 Percentage of out-of-school children (6-13 years old) who are 45 involved in child labour by characteristics
Figure 2.15 Out-of-school children (6-13 years old) engaged in child labour by 46 type of economic activity
Figure 2.16 Distribution of internally displaced students from 48 Abyan (6-14 years old) enrolled in recipient governorates
Figure 2.17 Profiles of out of school Muhamasheen children from Sana’a, 50 Aden and Hodeida
Figure 2.18 Dropout rates of Muhamasheen children by grade 52
Figure 2.19 Types of disability affecting students (6-14 years old) and children 55 in general (0-19 years old)

Yemen Country Report on Out-of-School Children vii
Tables
Table 2.1 Survey inventory 23
Table 2.2 Selected education indicators from survey and administrative sources 25
Table 2.3 Comparing primary adjusted net enrolment rates from administrative 27 and survey data (2012/2013)
Table 2.4 Comparing basic school attendance from various surveys 27
Table 2.5 Children of primary school age (6-11 years old) at risk of 38 leaving school
Table 2.6 Children of lower secondary school age school (12-14 years old) 39 at risk of leaving school
Table 3.1 Profiles, bottlenecks and causes of exclusion 67

Middle East and North Africa Out-of-School Children Initiativeviii
List of acronyms
BEDP Basic Education Development Program
CCT conditional cash transfer
CFS comprehensive food security
CSO Central Statistics Office
CES Cyclical Education Survey
CMF conceptual methodology framework
DOE District Offices of Education
ECD early childhood development
EMIS education information management system
EFA Education For All
FTI Fast Track Initiative
FOE Faculty of Education
GER gross enrolment rate
GPE Global Partnership in Education
GCC Gulf Cooperation Council
GIZ German Development Cooperation (Gesellschaft für Internationale Zusammenarbeit)
HCMC Higher Council for Motherhood and Childhood
KfW German Development Bank
ILO International Labour Organization
IPC International Policy Centre for Inclusive Growth
IPEC International Programme on the Elimination of Child Labour
MDGs Millennium Development Goals
MICS Multiple Indicator Cluster Survey
MOCL Ministry of Civil Service and Insurance
MOE Ministry of Education
MOF Ministry of Finance
MOPHP Ministry of Public Health and Population
MOPIC Ministry of Planning And International Cooperation
MOSAL Ministry of Social Affairs And Labour
MOTEVT Ministry of Technical Education and Vocational Training
MTRF Mid-Term Results Framework
NBEDS National Basic Education Strategy
NGO non-governmental organization
OCHA Office for the Coordination of Humanitarian Affairs
OOSCI Out-of-School Children Initiative

Yemen Country Report on Out-of-School Children ix
PAPFAM Pan Arab Project For Family Health
PSE pre-school education
SFD Social Fund for Development
SDG School Development Grants
SPM social protection monitoring
TEVT technical education and vocational training
TIMSS Trends in International Mathematics and Science Study
UCW Understanding Children’s Work
UNESCO United Nations Educational, Scientific and Cultural Organization
UIS UNESCO Institute for Statistics
UNICEF United Nations Children’s Fund
USAID United States Agency for International Development
WFP World Food Programme
YEGRA Yemeni Early Reading Assessment


Yemen Country Report on Out-of-School Children 1
Executive summary
As one of the poorest countries in the world, Yemen requires an educated citizenry for its economic and social development. This means ensuring that all children have access to and can take advantage of a quality education. The difficulty of the task, with its myriad of economic, political and social challenges, is reflected in the 1.6 million children between the ages of 6 to 14 who are out-of-school. As part of the Global Out-of-School Children Initiative (OOSCI), this study examines the issue of out-of-school children in Yemen, and asks the questions who are they, why are they out of school and how can they be brought back to school.
A small country at the tip of the Arabian peninsula, Yemen has an estimated population of 25.6 million (2012) of whom 51 per cent are under 18 years of age and 17 per cent under the age of 5 years.1 The majority of the population (71 per cent in 2004) lives in rural areas, mostly in the 160,000 villages scattered across Yemen’s varied topography. Extending infrastructure and services (paved roads, electricity, piped water, education and health care) to scattered rural villages is an overwhelming challenge to the government.
Inspired by the pro-democracy movements in the region in 2011, Yemeni youth and other groups initiated a successful grass-root movement to overthrow the regime of President Ali Abdullah Saleh. Since then the country has been in a state of political transition and instability. Yemenis feel a growing frustration with the high rate of unemployment, severe poverty, and inequitable distribution of resources and basic services. This state of affairs is reflected in the Human Development Index (HDI, 2011) where Yemen placed 154 out of 187 countries.
The education sector
In the last 30 years, the education sector has performed remarkably well in expanding coverage and increasing enrolment, yet, the country still has the lowest pre-primary gross enrolment rate (GER) among all low-income countries. Gender disparities are most pronounced at the lower secondary level.
The National Basic Education Development Strategy (NBEDS, 2003–2015) has set a goal of increasing enrolment in basic education, particularly of girls and in rural areas with a goal of 82.7 per cent, and closing the gender gap from 81 to 84 per cent. Impediments to achieving these targets are the Ministry of Education’s (MOE) weak institutional capacity, inadequately qualified professionals, lack of technical skills, and a weak education management information system (EMIS). In addition, the Government of Yemen depends on international development partners for financial and technical support for the education sector.
1 UNICEF. Situation Analysis of Children in Yemen. (2014). pg. 57.

Middle East and North Africa Out-of-School Children Initiative2
The Five Dimensions of Exclusion Model
In line with the Conceptual and Methodological Framework of OOSCI, the Yemen Country Report applies the Five Dimensions of Exclusion model. This includes:
Dimension 1: Children of pre-primary school age who are not in pre-primary or primary school.
Dimension 2: Children of primary school age who are not in primary or secondary school.
Dimension 3: Children of lower secondary school age who are not in primary or secondary school.
Dimension 4: Children who are in primary school but at risk of dropping out.
Dimension 5: Children who are in lower secondary school but at risk of dropping out.
The most relevant to Yemen’s current context are Dimensions 2 and 3.
Profiles of out-of-school children and those at risk of dropping out
The large majority (92 per cent) of pre-primary aged children are not in school. One in three Yemeni children between ages 6 and 11 (30 per cent) are out of school (Dimension 2). This amounts to a total of 1.2 million children in that age group. One in five children between 12 and 14 years old (22 per cent) is out of school, which amounts to 400,000 children (Dimension 3). One in six students (16 per cent) currently in primary school are at risk of dropping out before reaching Grade 6 (Dimension 4) and roughly one in nine students (11 per cent) currently in lower secondary school is at risk for dropping out before reaching Grade 9 (Dimension 5).
The characteristics associated with the likelihood of being out of school include age, female, rural residence, low wealth quintile and parents’ education. Child labour is also a characteristic and due to its high prevalence, is discussed separately with three other groups of marginalized children: children in conflict areas, children from a minority group and children with disabilities.
Child labour
Working increases a child’s likelihood of being out of school. Twenty-one per cent of out-of-school children between the ages of 6 and 13 years work. Out-of-school child labourers are mostly unpaid or family workers. In rural areas the children are mostly working in agriculture and in urban areas services and manufacturing are the important sectors in employing children.
Marginalized children
Three groups of children find it particularly difficult to access education: children in conflict areas, a minority group referred to as Al-Muhamasheen (aka al-akhdam), and children with disabilities.
Children in areas of conflict are likely to have reduced teaching hours. Al-Muhamasheen children face significant socio-economic barriers to education and may drop out of school early due to abusive treatment and discrimination in the school. As for children with disabilities, there is an estimate of 580,000 children with disabilities of school age (6-14 years) in Yemen. However, schools may not accept children with disabilities due to shortages in teaching facilities, learning materials and staff. The 2005 Household Budget survey states that 41 per cent of children with disabilities are out-of-school.
Yemen Country Report on Out-of-School Children 3
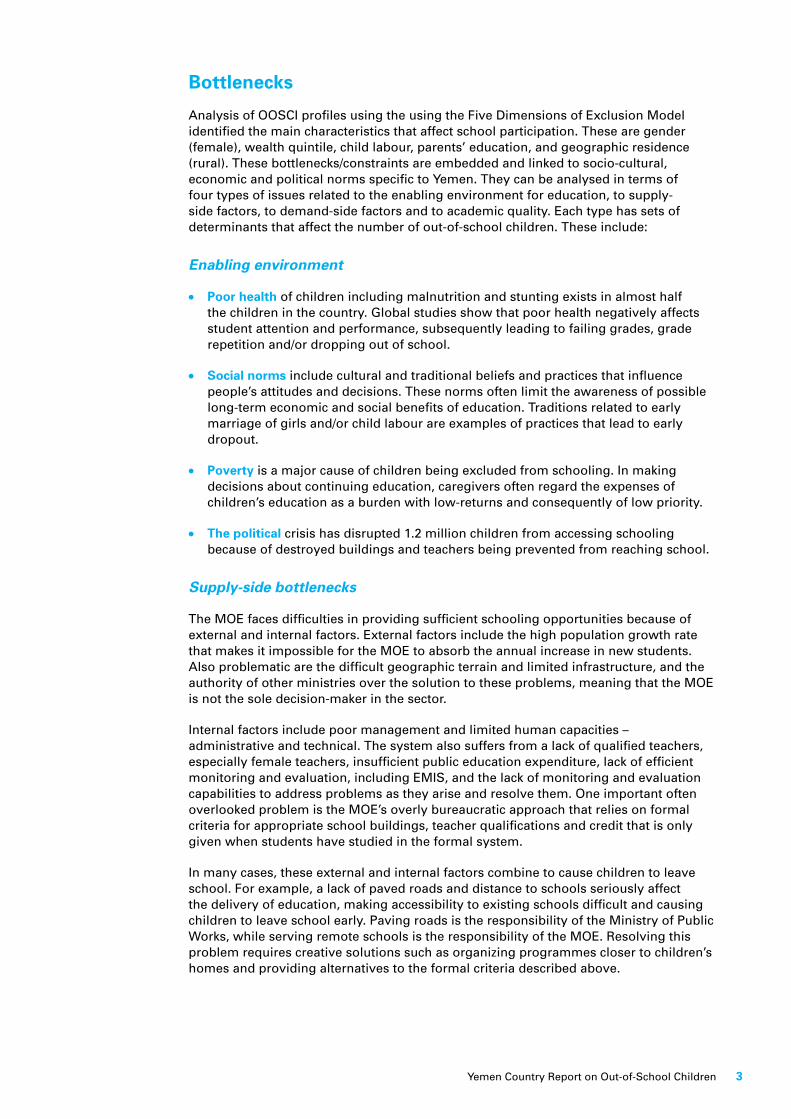
Bottlenecks
Analysis of OOSCI profiles using the using the Five Dimensions of Exclusion Model identified the main characteristics that affect school participation. These are gender (female), wealth quintile, child labour, parents’ education, and geographic residence (rural). These bottlenecks/constraints are embedded and linked to socio-cultural, economic and political norms specific to Yemen. They can be analysed in terms of four types of issues related to the enabling environment for education, to supply-side factors, to demand-side factors and to academic quality. Each type has sets of determinants that affect the number of out-of-school children. These include:
Enabling environment
l Poor health of children including malnutrition and stunting exists in almost half the children in the country. Global studies show that poor health negatively affects student attention and performance, subsequently leading to failing grades, grade repetition and/or dropping out of school.
l Social norms include cultural and traditional beliefs and practices that influence people’s attitudes and decisions. These norms often limit the awareness of possible long-term economic and social benefits of education. Traditions related to early marriage of girls and/or child labour are examples of practices that lead to early dropout.
l Poverty is a major cause of children being excluded from schooling. In making decisions about continuing education, caregivers often regard the expenses of children’s education as a burden with low-returns and consequently of low priority.
l The political crisis has disrupted 1.2 million children from accessing schooling because of destroyed buildings and teachers being prevented from reaching school.
Supply-side bottlenecks
The MOE faces difficulties in providing sufficient schooling opportunities because of external and internal factors. External factors include the high population growth rate that makes it impossible for the MOE to absorb the annual increase in new students. Also problematic are the difficult geographic terrain and limited infrastructure, and the authority of other ministries over the solution to these problems, meaning that the MOE is not the sole decision-maker in the sector.
Internal factors include poor management and limited human capacities – administrative and technical. The system also suffers from a lack of qualified teachers, especially female teachers, insufficient public education expenditure, lack of efficient monitoring and evaluation, including EMIS, and the lack of monitoring and evaluation capabilities to address problems as they arise and resolve them. One important often overlooked problem is the MOE’s overly bureaucratic approach that relies on formal criteria for appropriate school buildings, teacher qualifications and credit that is only given when students have studied in the formal system.
In many cases, these external and internal factors combine to cause children to leave school. For example, a lack of paved roads and distance to schools seriously affect the delivery of education, making accessibility to existing schools difficult and causing children to leave school early. Paving roads is the responsibility of the Ministry of Public Works, while serving remote schools is the responsibility of the MOE. Resolving this problem requires creative solutions such as organizing programmes closer to children’s homes and providing alternatives to the formal criteria described above.

Middle East and North Africa Out-of-School Children Initiative4
Demand-side bottlenecks
Parents demand certain conditions before they agree to enrol their children. For example, schools should be nearby and safe, they should be sex-segregated, and their daughters should be taught by female teachers, especially at the secondary level; classes should not be overcrowded; teachers should treat children with respect, and textbooks should be delivered on time. Parents also expect that the costs of schooling will not be prohibitive, especially given the usual case where there are several children in the family.
Quality
In relation to international standards, TIMSS (2007) results ranked Yemeni students lowest among 36 countries in both tests. The poor performance was partially attributed to student inability to read test questions.2 A recent (2012) USAID study evaluated the reading capabilities of students in the first three grades in three different governorates and found most students had still not acquired the basic skill needed for literacy and comprehension by the end of Grade 3.3 Interestingly, the MOE and its development partners seldom mention student performance as an objective in education policies and programmes. Instead quality is referred to in terms of inputs needed in the education system. The MOE’s investment in quality education has included training of teachers and school principals in school administration and management, in establishing father and mother councils (FMCs), development of a new curricula and textbooks, and social counselling. However, there has been no effort to measure the impact of these inputs on student performance, and it is quite possible that they have had little effect, at least partly because they have not been directly linked to improving student performance.
Policies/strategies
The National Basic Education Strategy (NBEDS) sets the agenda for all education policies, strategies, programmes and activities. There are no specific policies/strategies targeting out-of-school children. In addition, if children drop out of school, it is difficult for them to re-enrol mainly because the system lacks support mechanisms to help them catch-up with their peers. On the other hand, the MOE with the support of its development partners have developed policies/strategies that indirectly address some of the bottlenecks affecting out-of-school children in Yemen. These are described in more detail in the full report and include:
l Abolishing school fees
l Offering conditional cash transfers (CCTs)
l Providing school grants (SGs)
l Giving free school kits and food rations
l Raising awareness
Recommendations and conclusions
The following recommendations respond to bottlenecks on two critical levels – national-level delivery and school-level learning. The focus is on these levels because the limited resources available require that priorities be selected that are likely to produce the best results, in this case student learning, which in turn will affect enrolments and children staying in school longer. In addition, the recommendations should be low cost and build on on-going efforts.
2 Ibid. pg. 182.3 Research Triangle Institute. Early Grade Reading Assessment (EGRA). 2012. Pg. 25.

Yemen Country Report on Out-of-School Children 5
Enabling environment recommendations
1. The issue of out-of-school children is a multidimensional problem that requires an integrated inter sectoral (a body of inter-ministerial and non-governmental organizations and institutions) and holistic approach. In the best of all worlds, all aspects of the problem would be addressed together but in Yemen’s case its limited resources must be used in ways that ensure results in the most cost-effective way possible. Two options have the potential to support the MOE’s efforts:
i) To establish a higher council for basic education similar to the Higher Council for Motherhood and Childhood (HCMC) that would respond to the different needs of children in basic education grades. Such issues could include health, poverty and appropriate basic infrastructure (i.e., access to water, school facilities and roads). Establishing a Higher Council for Basic Education (HCBE) would expand the efforts of the HCMC. Already the HCMC’s responsibilities include pregnant mothers and children in the first three grades of basic education. The HCBE would include children in the remaining primary school years from Grades 4 to 6 and the lower secondary Grades 7 to 9. The HCBE would formulate policies, enact legislation and develop strategies with crosscutting effect, i.e. across sectors; and, top-bottom, bottom-up.
ii) A second alternative would be for the MOE to collaborate with different relevant sectors and form partnerships with responsible ministries, development partners, non-governmental institutions and organizations in designing programmes and activities that target exclusionary factors.
Hence, both options emphasize improving the enabling environment in Yemen by addressing factors affecting non-enrolment and school leaving. It is these options that the MOE should be considering when it prepares the National Education Vision for Yemen (NEVY).
2. Awareness-raising campaigns implemented at different levels. This includes:
l A national level media campaign using different mediums (television, radio and printed matter) needs to be mounted to cover the entire country. Messages should be directed at parents and children to explain the benefits of education as they relate to their families and children. Parents do not respond to messages related to national-level benefits and priorities. The messages should include that education is compulsory and that there are penalties for non-compliance.
l A community-level awareness-raising campaign needs to employ several outreach methods. For example:
i) The village shaykh at the mosque (masjid) can be involved. This is where villagers, particularly men, congregate to discuss local issues and the shaykh can be asked to include appropriate messages in his Friday sermons (khutba).
ii) FMCs should be asked to advocate for two priorities: 1) to persuade caregivers and children to enrol in school; and 2) to reinforce the importance of staying in school to parents and children, especially those who are enrolled in school but at risk of dropping out.
iii) School administration should keep records of students who did not re-enrol at the beginning of the year and those who dropped out during the year. This should help keep records at the school level in identifying out-of-school children. At the community level, school staff and parent’s councils need to identify out-of-school children at the beginning of the school year (i.e., children who did not return to school) and those who drop out during the school year. The principal or a social worker can visit these children’s homes to persuade the parents and the children to return to school, not only because it is important but also because it is the law.

Middle East and North Africa Out-of-School Children Initiative6
3. Fees for schooling in poor areas need to be abolished and schools should be prohibited from substituting other fees. To make up the shortfall, parent councils or student groups might lead fundraising efforts. Or zakat money might be used to help students with these extra fees.
4. There needs to be a process by which out-of-school children can return to school. This is especially needed for the largest populations of out-of-school children: child labourers, girls, children who dropped out of school and children with special needs. One option, where resources or volunteers are available, is to provide remedial classes for children 8-15 years old. Local councils could be asked to find locations, such as community centres, and teachers for these classes, and perhaps even raise money to support them. An alternative option is for NGOs to provide remedial education classes.
Supply-side recommendations
5. Strengthening the institutional capacities of the MOE to focus its energies on bringing children into school and keeping them there. A major part of this is making sure all its inputs are geared to increasing student learning/performance. Building these capacities may encompass training in management, monitoring and evaluation, EMIS, governance, coordinating activities, etc., but only if the training can be shown to achieve increased participation and learning.
6. Capacity for data collection needs improvement at three levels: at the MOE level, at the school level and at the national level. We will only address the first two here, knowing that until more accurate information is available it will be difficult to know the proportion of the population out-of-school children. At the school level, it is important that all schools report the same categories of information and this data is copied from actual school records and not from the memory of senior staff, and that the coverage is adequate to assess not only participation but also elements related to student achievement and the inputs made available to improve instruction. This can be achieved by the MOE determining the indicators, for example, enrolees, children who dropout, children who repeat grades, and exam scores by subject, level and individual). A section on students with disabilities and/or special also needs to be included. Developing standard forms for all schools that uses these indicators is critical. It is equally important to ensure that school administrators are able to collect this information; therefore, the involvement of school principals in the development of these forms is necessary.
7. At the MOE level, the capacity of the Department of Statistics (DOS) needs strengthening, especially in research survey skills and monitoring. A cost-effective approach is to recruit experts to provide the DOS staff hands-on training in questionnaire design, data collection and in analysing the data to ensure it is mined for the kinds of information that can improve both the quality and quantity of education outcomes. Once data has been entered and analysed, it should be subject to a quality review. Existing partnerships between UIS or EMIS could be mobilized to carry out this review. Another option could be having a third party hire of an NGO to monitor data collection and carry out repeat visits to a selection of schools. Another alternative is for MOE to outsource data entry, cleaning and some analysis to the Central Statistical Organization (CSO), which has very strong capacities. This would mean that another institution compiles education statistics with no direct interest in the findings.
8. To make the system more accountable, reform is needed at the legislative level to streamline budgeting and recruitment. More autonomy and decision-making needs to be delegated to appropriate levels of the MOE so staff there can be held directly accountable for the areas of their responsibility.
Yemen Country Report on Out-of-School Children 7
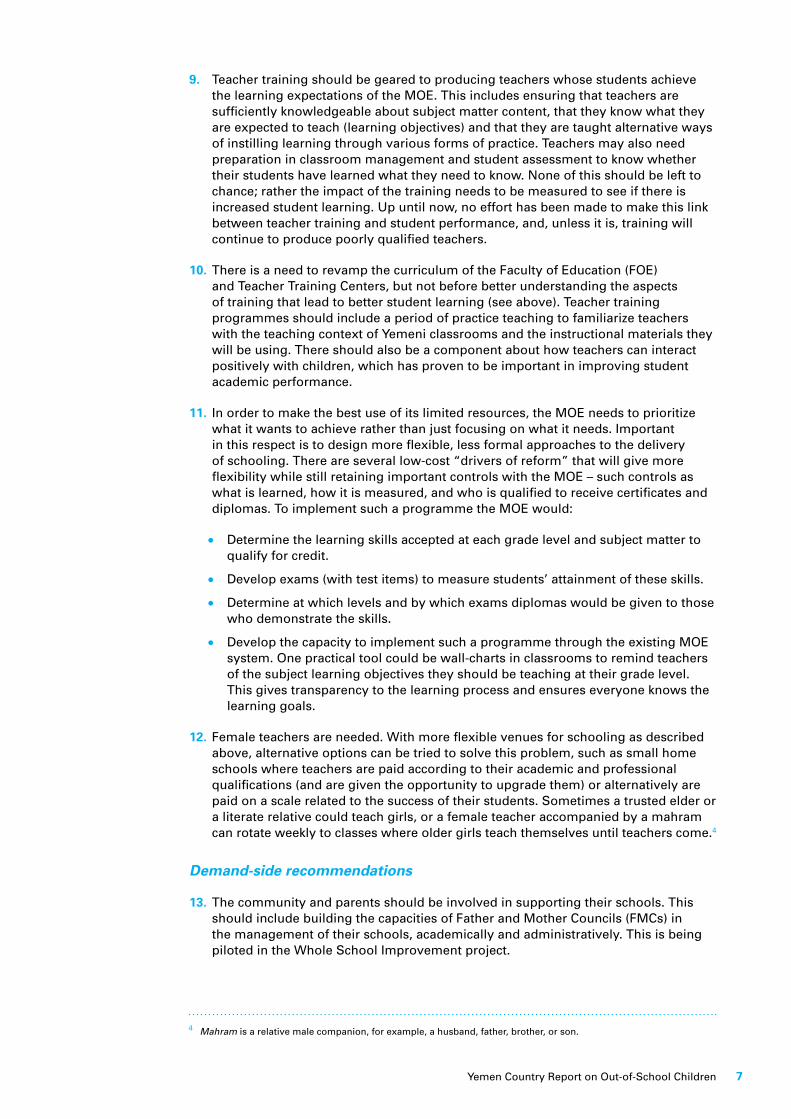
9. Teacher training should be geared to producing teachers whose students achieve the learning expectations of the MOE. This includes ensuring that teachers are sufficiently knowledgeable about subject matter content, that they know what they are expected to teach (learning objectives) and that they are taught alternative ways of instilling learning through various forms of practice. Teachers may also need preparation in classroom management and student assessment to know whether their students have learned what they need to know. None of this should be left to chance; rather the impact of the training needs to be measured to see if there is increased student learning. Up until now, no effort has been made to make this link between teacher training and student performance, and, unless it is, training will continue to produce poorly qualified teachers.
10. There is a need to revamp the curriculum of the Faculty of Education (FOE) and Teacher Training Centers, but not before better understanding the aspects of training that lead to better student learning (see above). Teacher training programmes should include a period of practice teaching to familiarize teachers with the teaching context of Yemeni classrooms and the instructional materials they will be using. There should also be a component about how teachers can interact positively with children, which has proven to be important in improving student academic performance.
11. In order to make the best use of its limited resources, the MOE needs to prioritize what it wants to achieve rather than just focusing on what it needs. Important in this respect is to design more flexible, less formal approaches to the delivery of schooling. There are several low-cost “drivers of reform” that will give more flexibility while still retaining important controls with the MOE – such controls as what is learned, how it is measured, and who is qualified to receive certificates and diplomas. To implement such a programme the MOE would:
l Determine the learning skills accepted at each grade level and subject matter to qualify for credit.
l Develop exams (with test items) to measure students’ attainment of these skills.
l Determine at which levels and by which exams diplomas would be given to those who demonstrate the skills.
l Develop the capacity to implement such a programme through the existing MOE system. One practical tool could be wall-charts in classrooms to remind teachers of the subject learning objectives they should be teaching at their grade level. This gives transparency to the learning process and ensures everyone knows the learning goals.
12. Female teachers are needed. With more flexible venues for schooling as described above, alternative options can be tried to solve this problem, such as small home schools where teachers are paid according to their academic and professional qualifications (and are given the opportunity to upgrade them) or alternatively are paid on a scale related to the success of their students. Sometimes a trusted elder or a literate relative could teach girls, or a female teacher accompanied by a mahram can rotate weekly to classes where older girls teach themselves until teachers come.4
Demand-side recommendations
13. The community and parents should be involved in supporting their schools. This should include building the capacities of Father and Mother Councils (FMCs) in the management of their schools, academically and administratively. This is being piloted in the Whole School Improvement project.
4 Mahram is a relative male companion, for example, a husband, father, brother, or son.

Middle East and North Africa Out-of-School Children Initiative8
14. The MOE needs to focus on the most vulnerable out-of-school children, such as those in the poorest governorates, children with disabilities, Muhamasheen, child labourers and internally displaced children in areas of emergency. One way would be for the MOE district offices to partner with local development associations and NGOs to reach out to these children to provide them with remedial education. Volunteer teachers could be recruited to teach these children in the masjid, or the local shaykh’s home. With the incentive of obtaining diplomas as described above, these children could offset the difficulties they have had in entering or staying in formal programmes.
Quality recommendations
Quality in the academic programme has been described above. The following section addresses other elements related to quality. To reiterate: quality refers to the achievement of student learning – at the core learning to read, write and comprehend and attain math skills. Children go to school to learn and a quality programme is one where children learn what they are supposed to learn.
15. Quality education must be result-based, affordable and expandable. This means defining quality education. We suggest the following definition: “A quality education is one which accomplishes the education goals and objectives of the Government of Yemen.” This would mean that children would master the academic skills put forth in government documents. An education system that produced these results, as measured by academic performance, would be considered a quality one.
16. Curriculum improvement requires that the MOE address the issue of coverage, which means that all topics in the curriculum are taught and the official total hours of instruction per academic year are met. Currently, for example, the actual ‘taught’ mathematic topics cover only 46 per cent of all items in the curricula; and in about 70 per cent of the time are used only by high-performing systems. This teaching time is further compressed by teacher absenteeism and the late delivery of textbooks. Another possibility is that teachers may not themselves have sufficient knowledge of the content. Changing the curriculum by itself will not contribute to improving the quality of education if these other issues are not also addressed.
17. The MOE needs to devise a system to deal with teacher absenteeism. This includes keeping records on teachers’ school attendance. The school principal should be held accountable for teacher absenteeism and ‘ghost’ teachers. Involvement of school administrators and FMC would help but also critical is the use student performance data to determine whether the system is effectively delivering education. When all the parts of the system are working well – including teachers being present, instructional time being sufficient and books being delivered on time – students will be learning. When students are not learning, school principals need to look for why this is and, if, for example, the problem is teacher absenteeism, then they need to take action to correct the problem. Again the focus needs to be on performance rather than rules.
Yemen Country Report on Out-of-School Children 9
11.1 Country context
Yemen’s national environment, cultural, economic and political characteristics have major impact on national development. Traditional socio-cultural norms are persistent and continue to influence people’s perceptions and practices concerning fundamental issues such as education and health. This is particularly evident in rural communities and these communities stance concerning gender roles and responsibilities, education, and family planning. It is within this context, therefore, children’s education must be considered.
Situated at the southern tip of the Arabian Peninsula, Yemen’s diverse landscape stretches over an area of 528,000 square kilometres consisting of highlands in the west and south that drop to a hot and arid coastal zone, Tihama, along the Red Sea. The highlands in the east and north descend to the vast desert of the Empty Quarter (Al-Rub’al Khali). The highlands are approximately 1,830 metres above sea level and rise to 3,670 metres at Jabal al Nabi Shu’ayb Alaihe Al Salam, which is the highest peak on the Arabian peninsula.5
Although linked to its neighbouring Gulf oil-rich countries by religion and language, its characteristics are unique in comparison – economically, socially and politically. Its gross national income per capita in 2007 was US $870 with 54 per cent of the population living on less than $2 a day, which makes it the poorest among the Arab countries and one of the poorest in the world.
In 2012 its population was estimated at 25.6 million of whom 51 per cent are under 18 years of age and 17 per cent under the age of 5 years.6 The majority of the population (71 per cent in 2004) lives in rural areas, most in 160,000 scattered villages across its varied topography. Extending infrastructure and delivery of services (paved roads, electricity, piped water, education and health care) to scattered rural villages with small communities is an overwhelming challenge to the government. In addition, these communities’ lack of basic services not only negatively affects their livelihood but also constrains their ability to participate fully as equal citizens or receive their rightful benefits from development.
Twenty nine per cent of the population resides in urban areas, of which one third lives in the capital city, Sana’a. There are exceptionally high population growth rates in the main cities, particularly Sana’a and Aden, due to rural-to-urban migration to these areas. It is estimated that the population between 1994 and 2004 grew at an average rate of 5.5 per cent per annum in the capital city of Sana’a, 3.8 per cent in the city of Aden, and 3.0 per cent nationally.7
Introduction
5 World Bank and MOIPC. Republic of Yemen Education Status Report: Challenges and Opportunities. 2010 pg. 40.6 UNICEF. Situation Analysis of Children in Yemen. (2014). pg. 57.7 Ibid.

Middle East and North Africa Out-of-School Children Initiative10
A looming threat to the country is its rapidly depleting water supply due to unregulated over-drilling of wells and changes in rainfall.
1.1.1 Governance and political overview
The Yemen is a republic, with a popularly elected President as the head of state, and a Consultative (Shura) Council in which the 111 members are appointed by the President from across the country including powerful tribal leaders.8 The President appoints the Vice President, subject to a two-thirds majority vote of the parliament. Yemen’s parliamentary system comprises a House of Representatives in which members are elected for six-year terms at national elections across 301 single-member constituencies. The government of the day rules whilst the Prime Minister – as the head of government – maintains the confidence of the House of Representatives. Primary government decision-making occurs via the Council of Ministers, which is defined as “the highest executive and administrative authority of the State” (Constitution, Article 129).9
The country governing structures include 21 governorates and one municipality (centred on the capital, Sana’a). The governorates are sub-divided into 333 districts and further into 2,210 sub-districts and almost 40,000 villages.10 During the present transition period, the governorate structure is being subjected to a Constitutional review in relation to the context of the National Dialogue and consideration of the establishment of a federated system.
The judiciary system operates independently of the government and the parliament, and is governed via the Supreme Judicial Council established by the judiciary, with Shari’a as the main source of law. Many judges are religious scholars as well as legal authorities. The Supreme Court is the highest court.
In 2011, inspired by the pro-democracy movements in Tunisia, Egypt and other Arab countries in the region, Yemeni youth initiated a grass-root movement calling for an end to undemocratic governance, high rates of unemployment, severe poverty, and a lack of equitable distribution of resources and participation. Continued youth-led protests and the resulting fracturing of government and the military finally led to a political process that put an end to the 33-year rule of President Ali Abdullah Saleh.
Since the events of 2011, the country has been in a state of political transition and turmoil. Brokered by the Gulf Cooperation Council (GCC) the “Transition Agreement” signed in Riyadh on 23 November 2011, a government of national unity was formed and Vice President Abdu Rabo Mansour Al-Hadi was sworn in as interim President. In January 2014, the National Dialogue was completed and its list of recommendations was presented to the government for the drafting of the new Constitution, which is underway, and the reform of the army and security establishments have been initiated. This period of transition will end with the holding of general elections and the inauguration of a new President for the Republic of Yemen.
These efforts, however, are being stalled due to the worsening political situation, which has been a major preoccupation of the government on several fronts. According to the UNICEF Situation Analysis (2014), the UN’s 2013 conflict assessment identifies four ‘conflict-specific drivers’:11
l The Southern Separationist Conflict that stems from the perceived shortcomings of the 1990 unification with regard to equal north/south political and economic treatment, but also including intra-south tensions;
8 UNICEF, Yemen Situation Analysis (2014). pg. 64.9 Ibid. pg. 65.10 Ibid. pg. 65.11 Ibid. pg. 62.
Yemen Country Report on Out-of-School Children 11
l The Al-Houthi-Salafist Conflict that is rooted in ideological and material causes but remains difficult to understand, but appears motivated by the promotion of Salafist religious ideology and the defence of Al-Houthi identity, each of which serve to drive the recruitment of young people to each side;
l The Al-Houthi-Islah Conflict that has been poorly examined but appears to revolve around competition for young recruits not only in the northern provinces where the Houthis are strongest but also in places such as Taiz, where growing numbers are taking up the Houthi label. The conflict stems from opposition to Islah’s brand of moderate Islamism and perceived links with Salafists and Wahabists, which has driven supporters of secular governance towards the Houthis.
l Extremist Group Violence and Conflict that primarily refers to AQAP and Ansar al-Sharia that are viewed as drivers of terrorism-related violence and radicalization of recruits, with AQAP support viewed as a desperate response to widespread insecurity of household livelihoods rather than being ideologically based.
The recent conflicts and on-going political crisis has severely exhausted national resources and human capital. Moreover, it has also exacerbated the humanitarian crisis, the major needs of which have been described by the UN Office for the Coordination of Humanitarian Affairs (OCHA) as follows:12
l Nearly half the population is facing food insecurity, up by 50 per cent since 2009.
l One million children under 5 suffer from acute malnutrition, including 250,000 severely malnourished.
l 760,000 pregnant and lactating women are undernourished.13
l Around 50 per cent of Yemenis do not have access to safe water and sanitation.
l 25 per cent of the population lacks access to healthcare.
l 307,000 Yemenis continue to be internally displaced, primarily as a result of conflict in the North (oriented around Sa’ada) and in the South (as a result of the 2011-12 conflict in Abyan).
Power plants are repeatedly attacked. In addition, there are frequent assassinations and kidnappings. According to the MOE, an estimated 810 schools, health centres and other sector buildings have been damaged or destroyed by armed conflict.14
1.1.2 Human development
Over the years there have been some improvements in the country’s human development indicators. For example, population growth rate has decreased from 4.8 per cent per annum in the early 1990s to 3.0 per cent in the early 2000s; fertility rates declined from 8.7 children per woman in the early 1980s to 5.9 in the early 2000s.15 Nonetheless, Yemen still has one of the highest fertility and population growth rates in the world.
This progress, however modest it may seem, means Yemen still ranks poorly in the Human Development Index (HDI, 2011). It is ranked 154 out of 187 countries and it is not expected to reach its Millennium Development Goals (MDGs) by 2015. This is demonstrated by its indicators, which are some of the worst in the region and the world, such as mortality rates at 73 per 1,000 children under five years of age; high prevalence of childbearing at an early age, 20 per cent of girls had their first born child before they were 18 years of age.16 Moreover, children suffer from malnutrition and lack of proper immunization. Severe stunting affects 27 per cent of 2 to 5-year-olds in the country.
12 Cited from UNICEF Situation Analysis 2014.13 The Yemen Humanitarian Response Plan (OCHA, 2014). 14 Chapter 2.2 provides a more detailed explanation of the impact of the political crises on children’s education. 15 World Bank and MOPIC. pgs. 9-10.16 Ibid.

Middle East and North Africa Out-of-School Children Initiative12
It is beyond the Government of Yemen’s financial and human resources and institutional capacity to respond to these issues. The country depends heavily on the international development community for financial and technical assistance in improving its human development status. The on-going political and economic crisis exacerbate the country’s lack of resources and make it even more difficult to provide basic services, such as adequate electrical power. Therefore, the government was forced to call for more foreign assistance.
By 2013, there were 23 UN agencies, 45 international NGOs and 500 local NGOs operating in Yemen.17 Recently, neighbouring countries have also become involved, including the Gulf Cooperation Council, the Khalifa Foundation, the Qatari Charity and the Organization of Islamic Conference. Most of the international stakeholders work jointly in a cluster approach under the auspices of the Inter-Agency Standing Committee. The proposed total cost of needed interventions is estimated at $584.5 million (OCHA, 2012-2013), of which food needs account for over 30 per cent, followed by multi-sector (refugees), nutrition, health and shelter. Education needs account for about $20 million of this sum.
1.2 Education sector
Education is considered the foundation for the economic and social development of Yemen. It has been emphasized in every government development Five-Year Plan from 1996 until the present (2013). In the last 30 years the education sector has performed remarkably well in expanding coverage and increasing enrolment, especially considering the geographic, institutional and infrastructural challenges. However, the continued rapid population growth rate and difficult terrain with scattered villages pose the most difficult challenges in trying to reach the country’s educational goals.
Three ministries are responsible for education. Pre-school, basic and general secondary education is under the administration of the MOE. The Ministry of Technical Education and Vocational Training (MOTEVT) manages post-basic technical education and vocational training (TEVT) and post-secondary TEVT, and community colleges; University education is under the mandate of the Ministry of Higher Education. Literacy is the mandate of the Literacy and Adult Education Organization and supervised by the MOE.
In 2001, the Government of Yemen decentralized public sector operations and service delivery as a demonstration of commitment towards democratization by increasing participatory governance. It was also a means of reducing poverty by improving public sector efficiency, delivering improved and more public services, and distributing public resources more equitably.18 Within this context the MOE was decentralized and the Basic Education Development Strategy (BEDS, 2003-2015) was formulated to define the policy and investment framework, objectives and programmes for the government and the MOE to achieve national and international policy targets. Decentralization was viewed both as a means to achieve educational reform through improved efficiency in the planning and delivery of educational services, and as an obligation on the part of the MOE to restructure and build capacity at all levels.19
The MOE has made progress in decentralizing, for example by developing the framework and mechanisms for managing the process. Governorates and district education offices have also assumed many new duties. However, more needs to be done to enable the executive offices and the local councils at both the governorate
17 Lucienne Maas. A Time To Enrol, A time To Stop… Policies, perceptions and practices influencing the right to basic education in Yemen. Doctorate dissertation, 2012. pg. 23.
18 Mouna Hashem and Karen Tietjen. Support of Decentralization of Basic Education. Situation Analysis: and Recommendations. Basic Education and Policy Support (BEPS) Activity. United States Agency for International Development Contract No. HNE-I-00-00-00038-00. April 2004. Pgs. 9-10.
19 Ibid.

Yemen Country Report on Out-of-School Children 13
and district levels to plan, manage, and assess the impact of their education inputs and ensure successful implementation of the national education strategy.20 Many MOE District Offices are restricted in their capacity to operate because of their lack of qualified personnel and physical resources. For example, out of 333 MOE District Offices only 188 offices are fully equipped (i.e., furniture and a computer) and staffed. As for the remaining offices, some are semi-equipped, while others consist only of a District Officer and his briefcase.21
Policy-making, planning and budgeting continue to be centralized with instructions passed down to the governorate and district field offices. MOE district officers face restrictions and bottlenecks in the process of governing especially when it comes to decision-making. As a result, there is little relationship between the supply of services imposed at the central level and the needs at the governorate and district levels.22 In addition, as the geographic distance of districts increases, the fewer resources are left to reach remote villages.23 Consequently, the resource gap between the centre and periphery widens and results in inequality of access to basic education between urban and rural areas.
Overall, decentralization in the education sector is constrained by (1) weak institutional capacity, (2) inadequate technical skills and management systems, and (3) deficient infrastructure and equipment. These problems are exacerbated by national systemic constraints, such as:24
l The lack of clarity in staffing requirements, job descriptions and routine operations so that governorate and district offices are not sure how to operate.
l The lack of comparable fiscal decentralization has starved governorate and district authorities of resources for operations and maintenance, consequently restricting the education office’s ability to underwrite essential operational expenses for meetings, stationary, utilities, communications and transportation.
l Inadequate qualifications of many education staff to carry out assigned tasks. The shortage of qualified staff is most acute at the district level.
l The lack of guidance in planning, budgeting, administration, etc. at the management level.
The MOE under Basic Education Development Program BEDP2 (2013-2017) will be receiving assistance for institutional capacity building to enhance its effectiveness and efficiency in managing resources to deliver quality education services. This support is intended to accomplish the following:25
l The restructuring the MOE and implementation of the EMIS developed under BEDP. Development of policy frameworks for teachers and for early childhood development (ECD).
l A communication strategy to raise awareness about girls’ education and the importance of learning to read.
l An integrated National Education Vision for Yemen (NEVY).
20 Interview with MOE official. MOE, 19 November 2013.21 Ibid. 22 The lack of coordination in recruitment of teachers is exemplified in chapter 3. 23 Hashem and Tietjen. p. 3-4.24 Ibid.25 Republic of Yemen Ministry of Education. Education Development Projects Administration Unit. BEDP2 (2013-2107).

Middle East and North Africa Out-of-School Children Initiative14
l Provision of equipment, furniture, consultant services training and study tours in support of the following:
• modernization and reorganization of the MOE;
• implementation of the EMIS;
• enhanced capacity in the MOE to design policies, plan and manage; and
• preparation of NEVY and related stakeholder consultations.
1.2.1 Policies in place
Currently, there are five major national education strategies at various levels. These include:26
1. The National Basic Education Development Strategy (NBEDS, 2003–15) aims to increase enrolment in basic education, particularly of girls and in rural areas, to reach 95 per cent of 6–14 year-olds in Yemen by 2015. Progress in achieving this target is not on track. The political crisis of 2011 and the on-going instability have increased the number of out-of-school children. As a result, the MOE produced the Medium Term Results Framework (MTRF) (2013-2015), which adjusted the NBEDS targets to a net enrolment of 82.7 per cent, closing the gender gap from 81 to 84 per cent, and decreasing the overall failure rate from 9.4 per cent to 7 per cent (for girls, from 7.7 per cent to 5.2 per cent).27
2. The National General Secondary Education Strategy (NGSES, 2007–2015) aims to provide equitable and cost-effective quality secondary education that facilitates the transition to tertiary education and the labour market. To implement policy reforms planned under the NGSES, the MOE contracted formal agreements with the governorates and relevant ministries to ensure that they would comply with policy reforms related to recruitment, deployment and monitoring of teachers. An initial strong support from donors to the NGSES has diminished recently, due in part to delays in implementation.
3. The National Strategy for the Development of Vocational and Technical Education (NSDVTE, 2004–2014) aims to achieve an “adequate” balance between general education and TVET. Among the policy reforms implemented under the NSDVTE was an amendment of the law concerned with the Social Development Fund (SDF) in 2009 to grant the SDF greater autonomy in its dealings with employers. To implement the strategy, the government received support from a number of donors including Saudi Arabia, the Department for International Development, the United Kingdom (DFID), the German Development Agency (GIZ) and the International Development Association (IDA).
4. The National Strategy for the Development of Higher Education in Yemen (NSDHEY, 2006) focuses on four areas of reform: governance, finance, quality and diversification. Regarding enrolment growth, the strategy aims to expand access to universities and other higher education institutions (including TVET), particularly for the 19–23 year-old age group, from 13 per cent to 16 per cent by 2010, and to 35 per cent by 2025. One of the key policy reforms implemented under the NSDHEY was the establishment of the Higher Council for Quality Assurance and Accreditation. Implementation of the NSDHEY received support from government of the Netherlands and IDA.
26 MTRF (2013). p. 13.27 UN Secretary General Global Initiative. Global Education First Initiative. Accelerating Progress to 2015 Yemen.
Working Paper. April 2013.

Yemen Country Report on Out-of-School Children 15
5. The National Children and Youth Strategy (NCYS) was prepared as a response to challenges in addressing the risks (particularly those related to health education, and employment) that Yemeni children and youth face. It uses an integrated cross-sectoral framework to identify the issues and gaps across the human development sectors that are most likely to impact the MDGs, and to propose action plans to be implemented by concerned line ministries as part of their respective sector programmes.
In addition to these five strategies, Yemen has an on-going National Strategy for Literacy and Adult Education that aims to eradicate illiteracy in the population aged 10 to 40; and has prepared a National Strategy for Early Childhood Development 2013-2017.
1.2.2 International development partners
As the MOE depends on international development partners for financial and technical assistance to implement its policies in the education sector, it is important to consider their role in influencing the MOE’s education programmes and strategies.
Development partners have been trying to coordinate their activities under the umbrella of the MOE. In 2003, for example, several donors (DFID, GIZ, KfW, the Embassy of the Royal Netherlands and the World Bank) formed the Basic Education Development Program (BEDP, 2003-2012) to provide the financial and technical assistance to the MOE needed to achieve the Education for All – Fast Track Initiative (EFA & FTI) and the MDGs. An administrative objective in establishing BEDP was to use donor resources more efficiently by avoiding replication of projects and target groups. This had become a major issue for the MOE.
BEDP is now in its second phase (BEDP2, 2013 -2017). Its main objective is quality education, including four components:28
1. Improving the quality of basic education and enhancing student performance: the objective is to assist the MOE in improving the quality of education by focusing on reading competencies for Grades 1 through 3.
2. Promoting equitable access to quality education: this component includes three types of interventions: (i) civil works and furniture in eight governorates and Sana’a, the capital city, to reduce over-crowding in urban and rural schools; (ii) recruitment and training of 700 rural teachers and expansion of the BEDP Conditional Cash Transfer (CCT) Programme; (iii) support of Fathers’ and Mothers’ Councils (FMC) and community participation including provision of School Development Grants to about 210 schools.
3. Developing sector institutional capacity, which includes restructuring of the MOE, deployment of the EMIS, development of the EMIS, development policy framework for teachers and for early childhood development (ECD), and support of the development of an integrated NEVY.
4. Improving project management.
The number of members supporting BEDP2 has declined since BEDP1. They now include the World Bank, GIZ and KfW. Other development partners, however, have expressed interest in contributing to their activities. For example, USAID is expected to contribute to the quality component and UNESCO will contribute to the EMIS by building the capacity of relevant MOE staff to manage education statistics.29
The Education Cluster represents another assembly of development partners working in the education sector. The Education Cluster consists of all UN agencies, some
28 Ministry of Education. Education. Development Projects Administration Unit. BEDP2 (2013-2017).29 Education Development Projects Administration Unit. BEDP2.

Middle East and North Africa Out-of-School Children Initiative16
bi-lateral donors and NGOs, co-led by UNICEF and Save the Children.30 It was formed in 2010 in response to the political crises in the country. Its objective is to keep education a priority on the national agenda during the humanitarian crisis and to respond with well-coordinated efforts.31 Concurrently, it aims to strengthen the capacity and preparedness of humanitarian personnel and government authorities so they can assess needs and identify priorities in providing emergency education services to internally displaced children.32
1.3 School attendance
The following section surveys school enrolment and attendance over the past decade and a half. It compares the difference between boys and girls’ enrolment. Differences across data sources are discussed in the Appendix 1.
Primary enrolment rates, increased between 1999 and 2005. After 2005, trends in enrolment rates remained approximately constant. Around three quarters (76 per cent) of children aged 6-11 years old enrolled in 2011 compared to 77 per cent in 2005 (see Figure 1.1, blue line).33
Improvements in primary gender parity (for ages 6-11 years old) were more sustained and the gender parity index increased until 2008 (see Figure 1.1, pink line). While in 1999 there were about 6 girls for every 10 boys enrolled, this improved to 8 girls in school for every 10 boys in 2008. However, improvements in gender parity have since slowed, improving by only a few decimal points each year. A similar argument can be made using survey data instead of administrative data (see Appendix 1).
Hence, primary enrolment in Yemen improved only marginally since the mid 2000s. Small improvements that have been made are largely due to an increase of girls’ enrolment. Still, despite larger improvements in girls’ enrolment, a significantly smaller proportion of girls are enrolled in school than boys.
Figure 1.1 Primary adjusted net enrolment rate and gender parity for children ages 6-11 year olds
Source: UNESCO Institute of Statistics (UIS) database34
30 Members of the Education Cluster include UNICEF, Save the Children, Community Learning Project, CHF, Islamic Relief Organization, SFD, OCHA, UNHCR, Relief International and RGP.
31 Snapshot – Education Cluster. Yemen: Education Cluster Activities Updated (as of 31 May 2013).32 The requested fund for the Education Cluster is $20 million; the amount approved is $2.7 million. Ibid.33 UIS.34 UIS.
95
85
75
65
55
45
90
80
70
60
50
401999 2000 2001 2002 2003 2004 2005 2006 2007 2008 2009 2010 2011 2012
Enrolment
En
rolm
ent
rate
(%
)
Gender parity index
Gen
der
par
ity
ind
ex

Yemen Country Report on Out-of-School Children 17
1.3.1 School participation by age group
Very few children attend pre-school (see Figure 1.2). More generally it is noteworthy that children frequently do not attend the grade that would be appropriate to their age (see Figure 1.2 and Annex 3 Figure A3.2). This is mainly due to late entrance, which is a serious problem in school participation of Yemeni children.
Only one third of six-year-old children (33 per cent) are in school (see Figure 2.1). Very similar observations about late entrance are made in the Child Labour Survey, which states that 33 per cent of children aged 6 years old are in school.35 Enrolment rates for 7 year olds are also low, only about two thirds are enrolled in primary school (61 per cent). Enrolment peaks for children at ten and eleven years old. In this age group 88 per cent of children attend school. For children younger than 10 or older than 11 years old enrolment rates decrease (see Figure 1.2).36
35 ILO-IPEC and others, pgs. 5, 29–30.36 Due to the fact that the survey used to calculate these figures was conducted during the first three months of the
school year, which starts in mid-September, the age of up to a quarter of children may have been overestimated. They may have been 5 years old at the beginning of the school year and hence not old enough to enrol. If that was the case, how would it affect the enrolment rate of six year olds? Imagine that a quarter of the six and seven year old cohort, about 180,000 children per year, slide down the age ladder, a six year old becomes a five year old and a seven year old becomes a six year old. Assume that the 180,000 seven year olds that became six year olds take with them their probability of being in or out of school (60 per cent) but replace six-year-old children that are out of school. That is to say, 60 per cent or about 100,000 six-year old children are in school instead of out of school. This would increase the enrolment rate of six year olds from 36 per cent to just under 50 per cent, which still means that half of all six year olds are not in school. The enrolment rate of all subsequent cohorts would also have to be adjusted.
Figure 1.2 School participation from survey data, enrolment rate by cycle and age (2012/2013)
Source: National Social Protection Monitoring Survey in Yemen, Baseline, 2012 (UNICEF & IPC, 2013)
The delay accrued due to late entry is carried over to the remaining grades. For instance, despite the fact that students should attend Grade 7 at the age of twelve, two thirds of twelve year olds (66 per cent) remain in primary grades (Grades 1-6), below the level they should be attending. The same applies to 13-year-old children, 42 per cent of which are enrolled in primary level grades, despite the fact that they should be in lower secondary grades. Note that administrative data does not show this phenomenon of late entrance.
100
80
60
40
20
0
Per
cen
t
5 6 7 8 9 10 11 12 13 14 15 16 17Age
Pre-primary Primary Secondary 1 Secondary 2

Middle East and North Africa Out-of-School Children Initiative18
1.4 The Five Dimensions of Exclusion Model
The study of Yemen’s out-of-school children is based on the Conceptual and Methodological Framework of the Global Out-of-School Children Initiative (OOSCI) Five Dimensions of Exclusion Model. Each dimension of exclusion represents target groups of children from different age ranges and different levels of education: pre-primary, primary and lower secondary. The purpose of this model is to identify and categorize out-of-school children according to each of these Five Dimensions of Exclusion (see Box 1.1).37
In addition, each DE has certain attributes that must be considered in the data and analysis. For example:
Dimension 1 consists of children 5 years old, not in pre-primary school. Children in this Dimension are under the official primary school age (6 years). As pre-primary schooling is not compulsory in Yemen, children in Dimension 1 are considered not in school rather than out-of-school. Initially, Dimension 1 was included as out-of-school, yet later in the Global OOSCI Report of the Istanbul Workshop, this classification was revised to include them as not in school.38
Dimensions 2 and 3 include children out-of-school in primary grades and lower secondary grades, respectively. Each of these Dimensions is subdivided into three subgroups based on previous or future school exposure in primary or lower secondary, respectively. This includes:
i) children who had attended school but left;
ii) children who are likely never enter school; and
iii) children who are likely to enter school in the future.
Dimensions 4 and 5 are children in school but at risk of dropping out in primary and lower secondary, respectively. The populations of these two Dimensions are grouped according to the level of education they attend, regardless of their age.
Box 1.1 The Five Dimensions of Exclusion Model
Dimension 1: Children of pre-primary school age who are not in pre-primary or primary school.
Dimension 2: Children of primary school age who are not in primary or secondary school.
Dimension 3: Children of lower secondary school age who are not in primary or secondary school.
Dimension 4: Children who are in primary school but are at risk of dropping out.
Dimension 5: Children who are in lower secondary school but are at risk of dropping out.
37 UNICEF UNESCO Institute for Statistics. Report and Methodological Guidance Note OOSCI Methodology Workshop Istanbul, 27-31 May 2013.
38 This revision was made in the OOSCI Istanbul Workshop Report (May 2013).
Yemen Country Report on Out-of-School Children 19
In the Yemen, the most relevant are Dimensions are 2 and 3 for the following reasons:
Dimension 1 comprises pre-primary education, which in Yemen is voluntary. In addition, few kindergartens exist, and those that exist are mainly in urban areas and mostly private. Although the MOE is giving pre-primary education more attention as evident in its National Development Strategy for Early Childhood Education, in the past, investment in pre-primary was not a priority compared with basic education. This is apparent in the limited number of kindergartens available in the country (591 in 2011). Moreover, pre-primary education is not compulsory, and ‘exclusion’ does not apply to this group.39
Second, in Dimensions 4 and 5, children are in school, but may be at risk of dropping out. Data on these groups is by proxy because we do not have time series data following students through the dropout process. Although the analysis identifies factors that explain why these children may be at risk, these children still attend school and therefore cannot be defined as ‘excluded’
For these reasons, this study focuses on analysis of Dimensions 2 and 3, as they are the most relevant. Dimensions 2 and 3 also include the largest population of out-of-school children, and therefore exemplify the major bottlenecks and policies concerning children’s schooling.
1.5 Methodology
The study applies the Global OOSCI Conceptual and Methodological Framework (CMF) to the research and analysis process. The CMF is based on three major questions:
l Who is out of school?
l Why are they out school?
l And, how can out-of-school children be brought back to school?
These questions provide a comprehensive view of the situation by linking research, actions and policies. The objective is to obtain a diagnostic analysis of out-of-school children in order to implement more effective educational reforms and develop policies that target out-of-school children and ensure that children complete school.
The study was carried out by a research team consisting of an international lead consultant, an international statistician and a national core team composed of 12 members from various departments of the MOE representing different issues in the study (for example, Department of Statistics, Girls’ Education, Early Childhood Education, Children with Special Needs, Emergency Education and the Education Research Development Center). The core team was divided into three working groups, each focusing on one of the three major questions of the study. The international consultants provided support to the working groups and conducted workshops during the different phases of the study to share research findings, discuss challenges and decide on next steps in the research work plan.
Various research methodologies were employed to answer each question. As a first step, the researchers conducted an extensive inventory of administrative data, national household surveys, qualitative studies, project and evaluation reports; and assessed their reliability, relevance and suitability. The objective was threefold: first, to examine the issue of out-of-school children in a more analytic and systematic way; second, to link the research to subsequent policy and action, and, third, to identify gaps that would improve data collection and education reforms related to out-of-school children.
39 Ibid. pg. 4.

Middle East and North Africa Out-of-School Children Initiative20
Key characteristics of profiles of out-of-school children, addressing question of who they are, were established from analysis of administrative data and household surveys in line with the Five Dimensions of Exclusion Model. The research also conducted multivariate analysis entailing socio-economic background variables of students (e.g. age, gender, mother’s education, income quintile, and rural/urban residence) to examine their effect on student enrolment. In both sets of regressions, student attendance is the unit of analysis.
These characteristics guided the research in examining why children, in particular in Dimensions 2 and 3, are out of school. This research entailed reviewing qualitative studies to further explain the quantitative findings within a wider context. In addition, the lead consultant collected primary data by means of interviews with relevant MOE officials and agencies such as the High Council for Maternal and Child (HCMC), and international development partners (BEDP2, GIZ, KfW, Save the Children, UNICEF, WFP, USAID and the World Bank), along with school principals, supervisors and teachers, to attain information regarding the barriers and bottlenecks they experience in their education efforts.40 Furthermore, the lead consultant attended two workshops that were conducted by the MOE and the Community Learning Project (CLP) for first and second grade teachers on how to implement the new Yemeni Early Grade Reading Assessment (YEGRA) curricula.41
Because an overwhelming majority of out-of-school are engaged in some form of work activity, a separate subsection is included on child labour. In addition, there are three distinct groups of children that are more disadvantaged and encounter more impediments to education, and in these groups the majority are out of school. These groups include:
i) children of a minority group referred to as Muhamasheen (aka al-akhdam),
ii) children with disabilities, and
iii) internally displaced children in areas of conflict.
These groups are discussed in a subsection in the out-of-school profile chapter (Chapter 2).
Finally, in examining how out-of-school children can be brought to school, the research included data analysis of government policies and strategies, qualitative studies, and international development project reports and evaluations. Additional information was solicited during workshops with the national core team from the MOE.
1.5.1 Limitations and validity
As this study depends substantially on secondary data, it encountered limitations concerning the consistency and reliability of the administrative data. There is also a discrepancy between administrative data and household survey data, which will be explained in more detail in Chapter 2. Recent data shows that there are over 300,000 children out of school due to the ongoing political turmoil at the time of this study. Therefore, in some cases, administrative data collected during the last few years is biased by these events since it was not collected during normal periods. For example, since 2011, enrolment rates were skewed in some governorates as a result of schools closing or being destroyed, hence, decreasing student attendance.42 Many children and their families were displaced; while others moved to other governorates and enrolled in schools there, consequently, increasing enrolment rates in these governorates. The same explanation applies to data on teacher availability and school facilities.
40 Appendix D includes the list of meetings and consultations.41 Additional information and discussion on the YEGRA curriculum is provided in Chapters 3 and 4.42 For example, Sa’ada has been in a state of conflict with the government since 2004.

Yemen Country Report on Out-of-School Children 21
22.1 Data sources
Identification of the Five Dimensions of Exclusion depends on a comprehensive analysis of quantitative data, which includes administrative data and household surveys. An overview of this data highlights the various types of data available and the advantages and challenges in using this data.
2.1.1 Administrative data: The Cyclical Educational Survey
Administrative data is collected and distributed by the MOE. There are two types of educational survey. Every four years the Comprehensive Educational Survey is conducted, in which data collectors from the MOE visit all schools in Yemen. During all other years, the Cyclical Education Survey (CES) is carried out. Ministerial officials at the district level visit each school in the district and complete a questionnaire disseminated by the MOE.
Respondents to the questionnaire are senior school staff, such as school principals and/or teachers. Respondents are asked to indicate the number, age and sex of students per grade, in addition to the number of repeaters. School characteristics, such as availability of bathrooms, number of chairs and school staff is also collected, though not all on an annual basis.
The fact that a third party does not collect data is a potential source of misreporting. A second source of error in administrative data may be due to old and incorrect census data. The most recent population data available is from the 2004 census and current population figures are estimates based on that census. The National Population Council produces the census.
There is some uncertainty as to the accuracy of the original census. Recent survey relisting exercises indicate that the population grew in some areas, such as in the Tihama, while it shrank in others, such as in Hajja or Al-Jawf governorates.43 This implies that geographically homogenous population extrapolations are likely to produce inaccurate indicators at the sub-national level. In addition, informal conversations with Central Statistics Office (CSO) staff hinted at the possibility that monitoring of census data collection was weak and that some areas may have reported an exaggerated number of residents, indicating that there may be a mistake in the number of residents estimated at the national level as well.
In terms of dissemination, CES data is shared by the MOE with the UNESCO Institute for Statistics (UIS) through a designated country coordinator who is a regular MOE staff member. The MOE also shares data with the CSO. Both UIS and CSO publish CES data independently of the MOE.
Profiles of excluded children
43 UNICEF, Baseline Survey Report (Sana’a, Yemen, 2013).

Middle East and North Africa Out-of-School Children Initiative22
However, UIS uses a different population estimate, namely the 2012 revision of the World Population Prospects by the United Nations Population Division (UNPD).44 In addition, while UIS receives raw data from the MOE, all further calculations to produce enrolment and dropout rates are done by UIS independently.45 This may account for differences between UIS and governmental data, despite the fact that both are based on the Cyclical Education Survey.
2.1.2 Survey data
The Yemeni government does not carry out regular nationally representative household surveys. Instead large national surveys are carried out with the funding and technical assistance of development agencies, mostly UN agencies. Five surveys will be used in this report. Calculations on the original datasets were carried out on three of them: the Social Protection Monitoring Survey (SPM),46 the Baseline Survey47 and the Child Labour Survey.48 The first survey was commissioned by the Yemeni Ministry of Planning and International Cooperation (MOPIC) and UNICEF; the second by UNICEF and the third is a cooperative effort between the International Labour Organization (ILO), UNICEF and the Yemeni Social Fund for Development. Existing tabulations published in final reports from the 2006 Multiple Indicator Cluster Survey (MICS)49 and the Comprehensive Food Security Survey (CFS)50 were used. The former was produced by the Yemeni Ministry of Public Health (MOPH), the Pan Arab Project for Family Health (PAPFAM) and UNICEF; the latter by the World Food Programme (WFP) in Yemen.
With the exception of MICS, which was carried out in 2006 and will serve as a historical reference point, all surveys were carried out between May 2010 and March 2013. Note that data collection took place close enough to the beginning of the school year for ages of school children not to have to be set back by a year. Sample sizes range between 3,544 and 9,571 households (see Table 2.1 for details and acronyms).
All five surveys adopted a two-stage stratified cluster sampling approach using enumeration areas – defined by CSO – as clusters or primary sampling units and households as secondary sampling units. The 2004 census was used as a sampling frame, which was updated using relisting for sampled enumeration areas.
The surveys exclude islands, nomadic population and Yemenis living in institutions, such as orphanages or army barracks. Most surveys are national and offer precise estimates at the urban and rural level. An exception is the UNICEF Baseline Survey, which is a sub-national survey, covering 106 mostly rural districts, about one third of the county. The selected districts are among the poorest in Yemen. Sampling approaches adopted by the SPM and CFS surveys were such that governorate-level indicators can be calculated.
44 UIS, ‘Data Center Readers Guide’, 2013 <http://stats.uis.unesco.org/unesco/tableviewer/document.aspx?FileId=140> [accessed 20 November 2013].
45 See UIS, ‘FAQ – Why Do National and International Education Data Sometimes Differ?’, 2013 <http://www.uis.unesco.org/Education/Pages/FAQ.aspx> [accessed 2 December 2013] for an in depth discussion why national and UIS data may differ.
46 IPC and UNICEF, National Social Protection Monitoring Survey in Yemen – Baseline Analytical Report (Brasilia, Brazil: IPC-UNDP, June 2013).
47 The Baseline Survey was funded and conducted with the assistance of UNICEF.48 ILO-IPEC and others, Working Children in the Republic of Yemen – The Results of the 2010 National Child Labour
Survey (Sana’a, Yemen, 2012).49 MOPHP, UNICEF and PAPFAM, Yemen Multiple Indicator Cluster Survey 2006 (Sana’a, Yemen: Ministry of Public
Health & Population, Pan-Arab Project for Family Health and United Nations Children’s Fund, 2008) <http://www.childinfo.org/files/MICS3_Yemen_FinalReport_2006_Eng.pdf> [accessed 11 May 2013].
50 WFP, The State of Food Security and Nutrition in Yemen – Comprehensive Food Security Survey (Sana’a, Yemen, 2012).
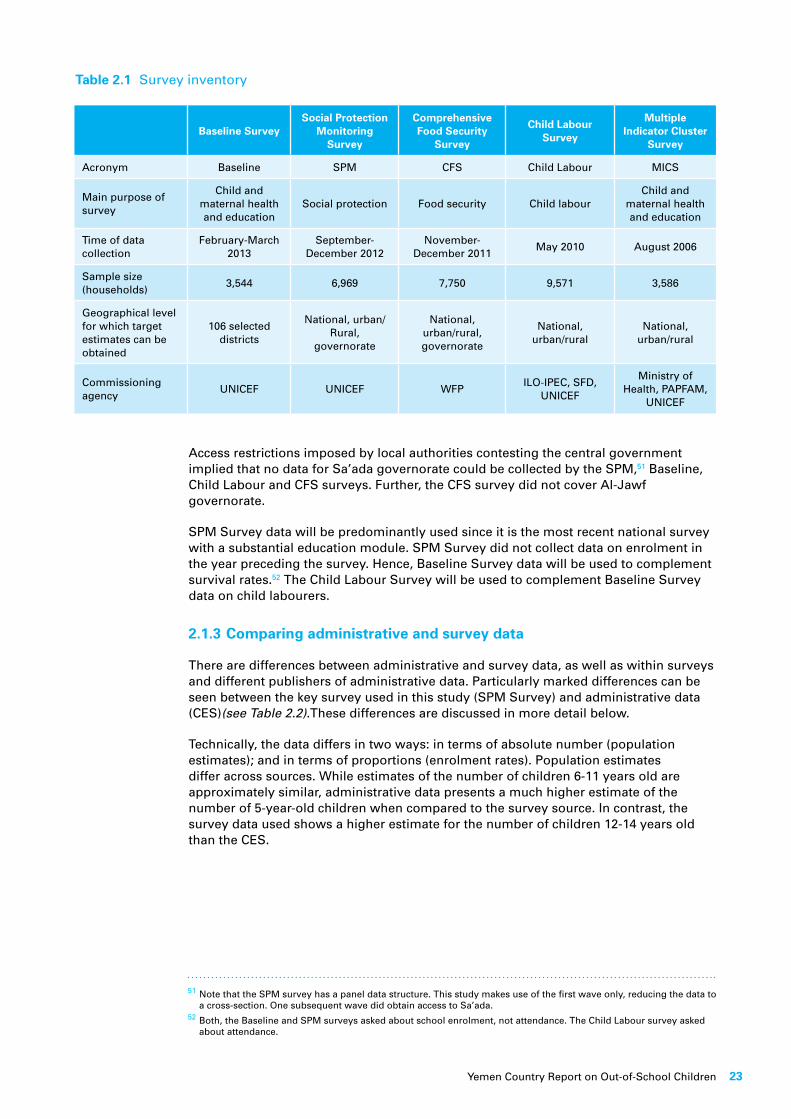
Yemen Country Report on Out-of-School Children 23
Access restrictions imposed by local authorities contesting the central government implied that no data for Sa’ada governorate could be collected by the SPM,51 Baseline, Child Labour and CFS surveys. Further, the CFS survey did not cover Al-Jawf governorate.
SPM Survey data will be predominantly used since it is the most recent national survey with a substantial education module. SPM Survey did not collect data on enrolment in the year preceding the survey. Hence, Baseline Survey data will be used to complement survival rates.52 The Child Labour Survey will be used to complement Baseline Survey data on child labourers.
2.1.3 Comparing administrative and survey data
There are differences between administrative and survey data, as well as within surveys and different publishers of administrative data. Particularly marked differences can be seen between the key survey used in this study (SPM Survey) and administrative data (CES)(see Table 2.2).These differences are discussed in more detail below.
Technically, the data differs in two ways: in terms of absolute number (population estimates); and in terms of proportions (enrolment rates). Population estimates differ across sources. While estimates of the number of children 6-11 years old are approximately similar, administrative data presents a much higher estimate of the number of 5-year-old children when compared to the survey source. In contrast, the survey data used shows a higher estimate for the number of children 12-14 years old than the CES.
Table 2.1 Survey inventory
Baseline SurveySocial Protection
Monitoring Survey
Comprehensive Food Security
Survey
Child Labour Survey
Multiple Indicator Cluster
Survey
Acronym Baseline SPM CFS Child Labour MICS
Main purpose of survey
Child and maternal health and education
Social protection Food security Child labourChild and
maternal health and education
Time of data collection
February-March 2013
September-December 2012
November-December 2011
May 2010 August 2006
Sample size (households)
3,544 6,969 7,750 9,571 3,586
Geographical level for which target estimates can be obtained
106 selected districts
National, urban/Rural,
governorate
National, urban/rural, governorate
National, urban/rural
National, urban/rural
Commissioning agency
UNICEF UNICEF WFPILO-IPEC, SFD,
UNICEF
Ministry of Health, PAPFAM,
UNICEF
51 Note that the SPM survey has a panel data structure. This study makes use of the first wave only, reducing the data to a cross-section. One subsequent wave did obtain access to Sa’ada.
52 Both, the Baseline and SPM surveys asked about school enrolment, not attendance. The Child Labour survey asked about attendance.

Middle East and North Africa Out-of-School Children Initiative24
As discussed in the previous section, population estimates used by the MOE are extrapolations based on the 2004 census. It is unclear what these extrapolations are based on, though most likely a constant population growth multiplier. Population estimates used by the SPM survey are extrapolations from a relisting exercise, a sort of mini-census, carried out in a randomly selected number of enumeration areas. Enumeration areas are very small geographical units in which about 150 households resided at the time of the 2004 census. Data collectors selected a random number of enumeration areas and counted the number of households resident in them in 2012. It is than assumed that population numbers collected in the sample of enumeration areas apply to neighbouring enumeration areas. This is how estimates were obtained for the rest of the country.
The difference in proportions is not unusual for survey data. For instance, the SPM survey data presents lower net enrolment rates when compared to CES data (see Table 2.2). Administrative data captures student registrations at the beginning of the school year, in this case September 2012, while survey data inquires about enrolment throughout the school year, in this case between October and December 2012.
It is noteworthy that the SPM survey data shows a much higher number of students between 12-14 years old registered in primary school education than CES data. This pushes the total net enrolment rate at the lower secondary level above that presented by CES data. One explanation for this may be the incorrect specification of students’ ages.
The exact determination of students’ age is fraught with difficulty. Dates of birth are not routinely recorded. Only 17 per cent of children under the age of five had a birth certificate in 2012 in rural areas.53 Hence, only relatively recent birth dates of children five years old or younger were collected in full. For all remaining household members, including school children, age was collected in full years only. Even that proved difficult. During data collection of both the SPM and the Baseline surveys, data collectors were trained on how to collect ages of household members. To assist them and the respondents, event sheets were developed that listed important historical events to aid respondents memory. Still, bunching can be observed around ages ending in a 0 or a 5 in the Baseline Survey indicating that respondents themselves do not remember their exact birthday.54
If even household members cannot remember correct ages, it is likely that the error in age collection at the school level is even higher. Teachers and parents may indicate the age that is appropriate for the grade rather than the students’ accurate age. If there is doubt, a student’s grade may bias teachers’ responses towards a certain age. This may explain differences in enrolment rates between administrative data and survey data. If administrative data are more likely to record age as appropriate to grade but not the actual age of the student, and considering that students in Yemen start school late, the age of overage students may be recorded as appropriate for the grade, even if it is not. This may explain why survey data indicates a much larger number of students between 12-14 year olds in primary school when compared to administrative data (see Table 2.2).
To sum, the nominator (children enrolled in school) as well as denominator (population of children) for both data sources differ. While administrative data uses students registered at the beginning of the year as nominator, survey data asked households which members were enrolled in school between October and December 2012. As for the denominator, administrative data uses extrapolated census data, while survey data uses population estimates extrapolated from a selected number of enumeration areas.
53 IPC and UNICEF, pg. 109.54 UNICEF, pg. 15.

Yemen Country Report on Out-of-School Children 25
Table 2.2 Selected education indicators from survey and administrative sources
*Note: that data referring to pre-primary enrolment and student numbers from the MOE is for the academic year 2011/2012.
Sources: survey data from SPM 2012, administrative data from MOE using CES 2012/2013 and population estimates from the National Population Council based on the 2004 census.
SPM 2012/2013
(survey data)
MOE (CES)2012/2013
(administrative data)
Pre-primary (5 years old)*
5 year olds enrolled in pre-primary 5,817 12,043
Total number of 5 year olds 435,417 718,428
Net enrolment rate, pre-primary 1.3% 1.7%
5 year olds enrolled in primary 28,055 40,167
Adjusted net enrolment rate, pre-primary
7.9% 7.3%
Primary (6-11 year olds)
6-11 year olds enrolled in primary 2,755,001 3,372,174
Total number of 6-11 year olds, primary 3,958,335 3,708,051
Net enrolment rate, primary 69.6% 90.9%
6-11 year olds enrolled in Secondary 1 0 19,505
Adjusted net enrolment rate, primary 69.6% 91.5%
Lower secondary (12-14 year olds)
12-14 year olds enrolled in Secondary 1 599,413 741,644
Total number of 12-14 year olds, Secondary 1
1,868,773 1,796,809
Net enrolment rate, Secondary 1 32.1% 41.3%
12-14 year olds enrolled in Primary 837,286 468,300
12-14 year olds enrolled in Secondary 2 29,343 0
Total net enrolment rate, Secondary 1 78.5% 67.3%
Out-of-school children (Dimensions 1, 2 and 3)*
Rate of out-of-school children, pre-primary school age
92.1% 92.7%
Number of OOSC, Pre-primary school age
401,544 666,218
Rate of out-of-school children, primary school age
30.4% 8.5%
Number of out-of-school school children, primary school age
1,198,655 287,715
Rate of out-of-school children, lower secondary school age
21.5% 32.7%
Number of out-of-school children, lower secondary school age
402,284 242,232

Middle East and North Africa Out-of-School Children Initiative26
2.1.4 Conceptual differences between survey and administrative data
Administrative data is obtained by collecting data from everyone in a target population. For instance, schools collect data from all students, hospitals from all patients and so on. In contrast, survey data is obtained by collecting data from a random sample drawn from the population and assuming that it is representative of the entire country.
Both data sources are subject to errors. The most likely error that can occur in administrative data are mistakes resulting from data collection. The resulting divergence from the observed value to the one actually existing in the population is called bias. An example is the inaccurate recording of students’ ages discussed in the previous section. Bias due to how data is collected can also occur in survey data and is called non-sampling error.55 However, in the present case, it is likely to have more of an impact on administrative than survey data.56
If administrative data has been correctly collected, the resulting indicator is the one applicable to the underlying population. In contrast, since survey data only collects data from a sub-sample of the population, there is a limit to how confident one can be if the observed result is observed only in that sample or in the population in general.
Confidence intervals have been added to most figures discussed in the text to illustrate the level of precision of various estimates. For example, finding show that 30 per cent of children 6-11 years old in the sample of the SPM Survey are out of school (see Figure 2.3). The confidence interval shows that one can be pretty confident that the actual figure observed in the population is close to that value. The confidence interval indicates that there is a 95 per cent chance that between 27 per cent and 34 per cent of children 6-11 years old are out of school.
Survey data also frequently collects data on school attendance rather than enrolment. The SPM and the Baseline surveys ask respondents if their children are enrolled in school. The Child Labour Survey asks parents if their child attends school. Comparing results across surveys indicates that the phrasing of the question does not greatly affect results.
In sum, when national data collection and monitoring capacity is weak and census data old, bias is likely to occur in administrative data. If capacity for survey data collection is high and care has been taken in training data collectors as well as monitoring them, bias are likely to be smaller in survey data. Though less biased, survey data is less precise than administrative data.
The lack of precision in surveys can be estimated and is therefore preferable to the use of potentially biased administrative data. In this study, SPM Survey data will largely be used, though whenever possible complemented by administrative data.
As mentioned in section 2.1.1, the UNESCO Institute of Statistics (UIS) and the MOE disseminate education statistics based on the same underlying dataset, the Cyclical or Comprehensive Education Survey. These use different population estimates and, therefore, the same variable differs across sources for the same year (see Table 2.3).
Generally, administrative data gives higher enrolment rates than survey data, which is presently the case. It is curious, however, that gender parity rates calculated on the basis of administrative records are much lower than those obtained by survey data.
55 Another source of error is called sampling error due to the non-random selection of respondents, an unlikely source of error for the present surveys.
56 This is because the SPM Survey research protocol consciously tried to minimize non-sampling error by hiring third-party data collection team supervisors, and carrying out field monitoring visits. In contrast, data for the CES is collected by district MOE staff who complete questionnaires and send them back to the MOE without third-party monitoring. Hence, school-based respondents may complete the questionnaire from memory rather than consult other teachers or use other labour-intensive data-collection methods. In addition, whenever data collectors have an interest in the data they collect, there is an incentive to manipulate data.

Yemen Country Report on Out-of-School Children 27
2.1.5 Differences within survey data
With the exception of the Baseline Survey, enrolment indicators are remarkably similar across surveys. Recall that the Baseline Survey only covers 106 rural districts, which are among the poorest in Yemen. Considering the relationship between poverty or living in a rural area and school attendance (see Figures 2.3 and 2.6), enrolment rates in these districts are expected to be lower than the national average. This helps to explain why the Baseline Survey reports a basic school enrolment rate well below the rates reported by other surveys (see Table 2.4).
57 UIS, Data Centre (Montreal, Canada: UNESCO Institute for Statistics, 2013) <http://stats.uis.unesco.org/unesco/TableViewer/document.aspx?ReportId=143&IF_Language=eng> [accessed 24 September 2013].
58 IPC and UNICEF.59 WFP, p. 27.
Table 2.3 Comparing primary adjusted net enrolment rates from administrative and survey data (2012/2013)
Type of data
MOEAdministrative data
UISAdministrative data
SPMHousehold survey data
ANER (%)Gender
parity (%)ANER
(%)Gender
parity (%)ANER (%)
Gender parity (%)
Primary school age (6-11 years old)
92 85 87 84 70 94
Sources: MOE Cyclical Education Survey (2012/2013), UNESCO Institute of Statistics (UIS) database,57 National Social Protection Monitoring Survey in Yemen, Baseline, 2012.58
Table 2.4 Comparing basic school attendance from various surveys
UNICEF Baseline Survey
Social Protection Monitoring Survey
Comprehensive Food Security
Survey
Child Labour Survey
Multiple Indicator Cluster
Survey
Basic education (children 6-14 years old)
61%b
(CI: 58.6%-63.8%)72%b
(CI: 69.5%-75.4%)80%c 74%a 68%a
MOE rate for comparable yeard n.a. n.a. 82%b 76%b 67%b
Academic year 2012/2013 2012/2013 2011/2012 2009/2010Summer break after 2005/2006
a Net attendance ratio (NAR)b Adjusted net enrolment ratio (ANER)c This is the simple average of figures presented in the text and may only refer to primary school. The original reads: “Around three-quarters of girls and 84 per cent of boys are enrolled in (at least) primary school.”59 d MOE Cyclical Education Survey, various years
The SPM Survey reports a basic school enrolment rate of 72 per cent, comparable to that reported by the Child Labour Survey (74 per cent). The CFS Survey reports higher enrolment rates of 80 per cent, though this may refer only to primary school enrolment, which would explain the higher enrolment rates. Basic school enrolment rates reported by MICS are slightly lower with 68 per cent.
The differences in enrolment rates observed in the survey samples may not actually be observed in the population. As discussed in section 2.1.2, all surveys listed use similar sampling strategies. Surveys of comparable sample size and sample design are likely to have comparable confidence intervals. Only the SPM and Baseline surveys report confidence intervals. Despite the different sample sizes, both surveys report a

Middle East and North Africa Out-of-School Children Initiative28
confidence interval of around ±3 percentage points around the stated basic enrolment rate.60 Assuming estimators reported by all surveys discussed in this section have that same error margin of ±3 percentage points, the confidence intervals of the basic enrolment rates reported by the Child Labour Survey and MICS may overlap with those reported by the SPM Survey. This implies that differences in enrolment observed in the surveys may not actually be observed in the Yemeni population.
It is noteworthy that with the exception of the CFS Survey, evidence shows little variation in enrolment rates over the past seven years. This confirms data from UIS, which reports approximately stagnant enrolment rates from the mid 2000s onwards but in contrast with MOE data, which reports increasing enrolment rates. When confronted with the divergence in data across data sources, core group members working on this study insisted on the use of ministerial data since this is the official source of statistics. The authors of this report are more sceptical towards ministerial data. Throughout this report SPM Survey data will be used in conjunction with administrative data from the MOE.
2.2 Dimension 1: Pre-primary school children
The large majority (92.1 per cent) of pre-primary school children age five year olds are not in school. This share is similar using either administrative or survey data (see Table 2.2). Survey data indicates that though pre-primary education should be targeted at children who are five years old, it is actually six year olds who are more likely to attend. Six year olds have been included in the discussion as a noteworthy case. Four per cent of six-year-old children are in pre-primary school compared to only 1 per cent of five year olds.
A slightly higher share of boys in the sample attend pre-primary school when compared to girls. More notable is the difference in enrolment between urban and rural areas. Children from urban areas are 12 times more likely to attend pre-primary school than children growing up in rural areas.
60 As sample size increases the marginal gains in precision decline. In addition, the SPM sampling design was slightly more complex than that used by SPM, which comes at the cost of loss in precision.
Figure 2.1 Pre-primary enrolment, children ages 5-6 years old
Note: Confidence intervals for rural urban split not available.
Source: National Social Protection Monitoring Survey in Yemen, Baseline, 2012 (UNICEF & IPC, 2013)
Total
Rural
Boys
Urban
Geography
Sex
Girls
0 2 4 6 8 10 12
Per cent
Children 6 years old Children 5 years old
4%
1%
1%
1%
12%
5%
3%
2%
1%
1%

Yemen Country Report on Out-of-School Children 29
2.3 Dimensions 2 and 3
One in three Yemeni children from 6-11 years old (Dimension 2) and one in five children from 12-14 years old (Dimension 3) are out of school. This amounts to a total of 1.2 million children from 6-11 years old and 400,000 children from 12-14 years old. The percentage of out-of-school children in Yemen has been reduced (see Figure 1.1) over the past decade up until the mid 2000s, when progress in enrolling more children slowed. A number of characteristics affect a child’s likelihood of being out of school. These characteristics include, but are not limited to, the child’s age and sex. Family characteristics such as place of residence, mother’s education level and household wealth also play a role.
Social data is commonly disaggregated into rural and urban areas since it is assumed that each have distinct characteristics, with rural area most often lacking access to public services. Similarly disaggregation by wealth quintiles is common since wealthy households are able to afford giving their children opportunities that poor households are not. However, the wealth index referred to in these pages is not a direct indicator of household income. It relies instead on accounting for household assets, including public utilities such as access to sanitation and electricity. Furthermore, in a country like Yemen, wealth distribution is likely to be skewed with many very poor people and very few rich people. That is to say, a household may be classified into the fourth rather than the lowest quintile merely on the basis of possessing a low value asset such as a radio.
These factors will be discussed in the following sections. Child labour is also an important factor in school enrolment, which is discussed separately in section 2.5.
2.3.1 Dimension 2: Out-of-school children between 6-11 years old
About a third of Yemeni children (30 per cent) between 6-11 years old are not in school. This amounts to 1.2 million children out of school in this age group. MOE data puts the share of out-of-school children at 17 per cent. The number of out-of-school children according to the MOE is 565,382, half that estimated by survey data. In what follows survey data will be used.
As for out-of-school children by school exposure, of the 30 per cent out of school between the ages 6-11, 83 per cent are expected to enrol by the time they are 14 years old (see Figure 2.2). This reflects observations made in the previous section, that children start school late. In other words, most out-of-school children between the ages of 6-11 are likely to enrol in school by the time they are 14. If they do enrol, they are very likely to be late entrants. Eleven per cent of out-of-school children are likely to never enter school, and 6 per cent have already dropped out of school.
Figure 2.2 Dimension 2: Out-of-school children by school exposure
Source: National Social Protection Monitoring Survey in Yemen, Baseline, 2012 (UNICEF & IPC, 2013).
100%
90%
80%
70%
60%
50%
40%
30%
20%
10%
0%
Pri
mar
y ag
e ch
ildre
nin
an
d o
ut
of
sch
oo
l
In school
Out-of-school children
Left school
Likely to enter by age 14
Likely to never enter
11%
6%
83%
30.3
69.7

Middle East and North Africa Out-of-School Children Initiative30
Profiles of out-of-school children between 6-11 years old
The likelihood a child being out of school decreases with age.61 Six-year-old children are more than five times more likely to be out of school than eleven-year-old children. The share of out-of-school children decreases from 67 per cent of six year olds to 12 per cent of eleven year olds (see Figure 2.3). Six and seven year olds make up nearly three quarters of a million out-of-school children. This is more than half of all out-of-school children in Dimension 2.
As for gender parity, slightly more girls are out of school (33 per cent) compared to boys (28 per cent). The gender parity index for adjusted net primary enrolment is 0.94.62 An index of 1 implies complete parity. More noteworthy is that children 6-11 years old growing up in rural areas are nearly twice more likely to be out of school (34 per cent) compared to children growing up in urban areas, where 18 per cent are not enrolled in school.
Parents’ education and wealth quintiles have a significant impact on children’s school enrolment. Children whose mothers had at least some education are less likely to be out of school than children whose mothers had no education at all. Thirty six per cent of children whose mothers have received no education are out of school, compared to around 20 per cent of children whose mothers have received at least basic education.
Figure 2.3 Percentage of primary school age children, 6-11 years old, out of school
Source: National Social Protection Monitoring Survey in Yemen, Baseline, 2012 (UNICEF & IPC, 2013).
61 The decrease is monotonous and statistically significant.62 IPC and UNICEF.
Per cent
None
Basic
Secondary +
Non-standard education
Orphan or mother not in the HH
Poorest
Second
Middle
Fourth
Richest
Total
6 years old
7 years old
8 years old
9 years old
10 years old
11 years old
Boys
Girls
Urban
Rural
0 10 20 30 40 50 60 70 80
Maternal education
Geography
Sex
Age
Wealth quintiles
30
67
39
26
17
12
12
28
33
18
34
36
19
22
24
56
29
25
20
16
15
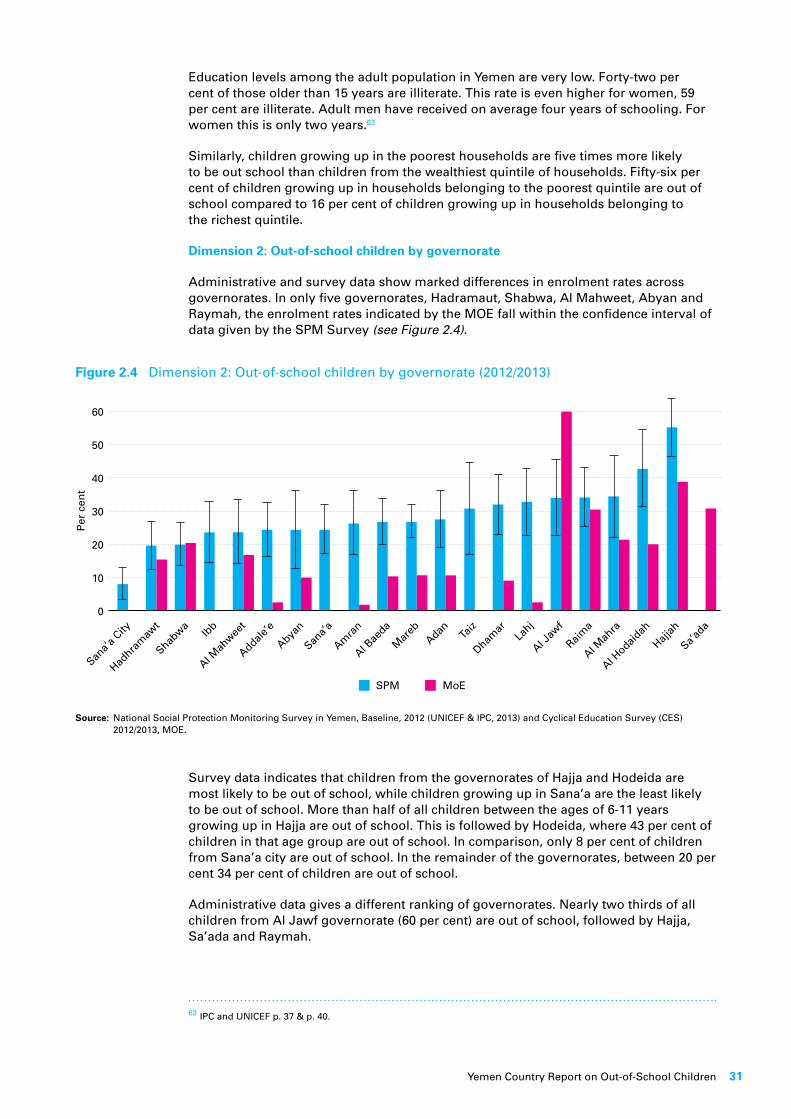
Yemen Country Report on Out-of-School Children 31
Education levels among the adult population in Yemen are very low. Forty-two per cent of those older than 15 years are illiterate. This rate is even higher for women, 59 per cent are illiterate. Adult men have received on average four years of schooling. For women this is only two years.63
Similarly, children growing up in the poorest households are five times more likely to be out school than children from the wealthiest quintile of households. Fifty-six per cent of children growing up in households belonging to the poorest quintile are out of school compared to 16 per cent of children growing up in households belonging to the richest quintile.
Dimension 2: Out-of-school children by governorate
Administrative and survey data show marked differences in enrolment rates across governorates. In only five governorates, Hadramaut, Shabwa, Al Mahweet, Abyan and Raymah, the enrolment rates indicated by the MOE fall within the confidence interval of data given by the SPM Survey (see Figure 2.4).
63 IPC and UNICEF p. 37 & p. 40.
Figure 2.4 Dimension 2: Out-of-school children by governorate (2012/2013)
Source: National Social Protection Monitoring Survey in Yemen, Baseline, 2012 (UNICEF & IPC, 2013) and Cyclical Education Survey (CES) 2012/2013, MOE.
SPM MoE
60
50
40
30
20
10
0
Per
cen
t
Sana’a
City
Hadhra
maw
tIb
b
Al Mah
weet
Addale’e
Abyan
Sana’a
Amra
n
Al Bae
da
Mar
ebAdan Ta
iz
Dhamar
Lahj
Al Jaw
f
Raima
Al Mah
ra
Al Hodaid
ah
Hajjah
Sa’ada
Shabwa
Survey data indicates that children from the governorates of Hajja and Hodeida are most likely to be out of school, while children growing up in Sana’a are the least likely to be out of school. More than half of all children between the ages of 6-11 years growing up in Hajja are out of school. This is followed by Hodeida, where 43 per cent of children in that age group are out of school. In comparison, only 8 per cent of children from Sana’a city are out of school. In the remainder of the governorates, between 20 per cent 34 per cent of children are out of school.
Administrative data gives a different ranking of governorates. Nearly two thirds of all children from Al Jawf governorate (60 per cent) are out of school, followed by Hajja, Sa’ada and Raymah.
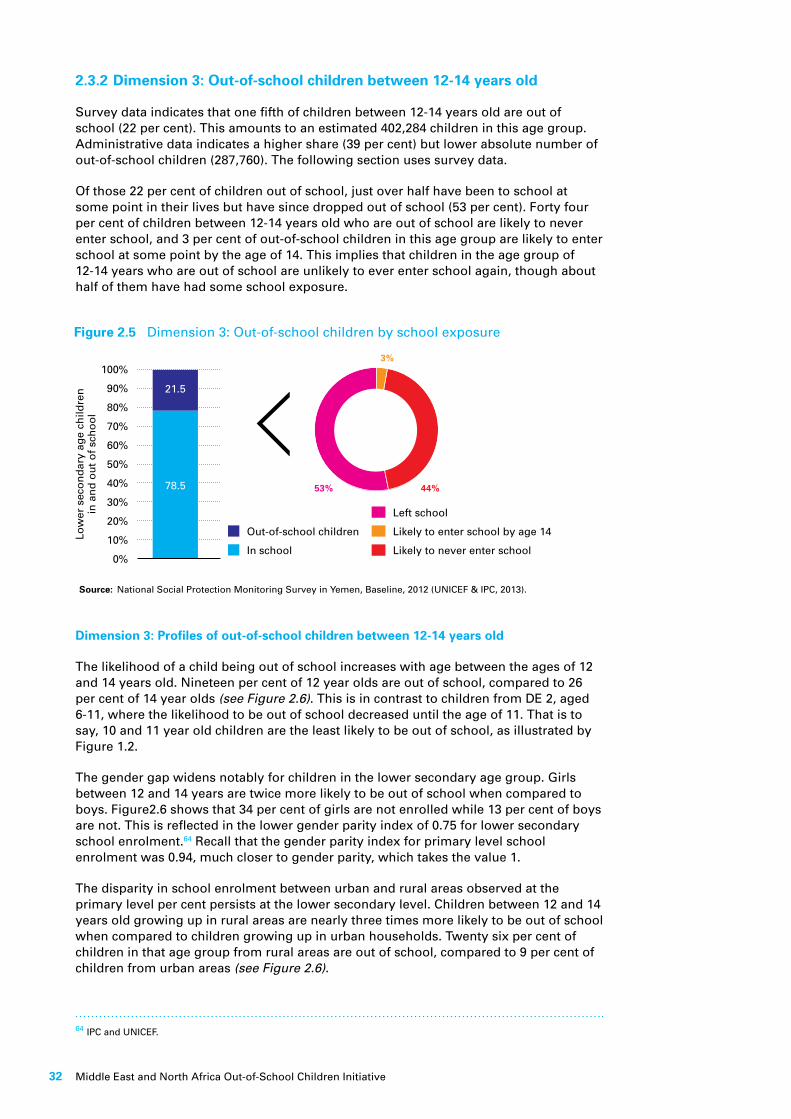
Middle East and North Africa Out-of-School Children Initiative32
2.3.2 Dimension 3: Out-of-school children between 12-14 years old
Survey data indicates that one fifth of children between 12-14 years old are out of school (22 per cent). This amounts to an estimated 402,284 children in this age group. Administrative data indicates a higher share (39 per cent) but lower absolute number of out-of-school children (287,760). The following section uses survey data.
Of those 22 per cent of children out of school, just over half have been to school at some point in their lives but have since dropped out of school (53 per cent). Forty four per cent of children between 12-14 years old who are out of school are likely to never enter school, and 3 per cent of out-of-school children in this age group are likely to enter school at some point by the age of 14. This implies that children in the age group of 12-14 years who are out of school are unlikely to ever enter school again, though about half of them have had some school exposure.
Figure 2.5 Dimension 3: Out-of-school children by school exposure
Source: National Social Protection Monitoring Survey in Yemen, Baseline, 2012 (UNICEF & IPC, 2013).
100%
90%
80%
70%
60%
50%
40%
30%
20%
10%
0%
Low
er s
eco
nd
ary
age
child
ren
in
an
d o
ut
of
sch
oo
l
In school
Out-of-school children
Left school
Likely to enter school by age 14
Likely to never enter school
21.5
78.5
Dimension 3: Profiles of out-of-school children between 12-14 years old
The likelihood of a child being out of school increases with age between the ages of 12 and 14 years old. Nineteen per cent of 12 year olds are out of school, compared to 26 per cent of 14 year olds (see Figure 2.6). This is in contrast to children from DE 2, aged 6-11, where the likelihood to be out of school decreased until the age of 11. That is to say, 10 and 11 year old children are the least likely to be out of school, as illustrated by Figure 1.2.
The gender gap widens notably for children in the lower secondary age group. Girls between 12 and 14 years are twice more likely to be out of school when compared to boys. Figure2.6 shows that 34 per cent of girls are not enrolled while 13 per cent of boys are not. This is reflected in the lower gender parity index of 0.75 for lower secondary school enrolment.64 Recall that the gender parity index for primary level school enrolment was 0.94, much closer to gender parity, which takes the value 1.
The disparity in school enrolment between urban and rural areas observed at the primary level per cent persists at the lower secondary level. Children between 12 and 14 years old growing up in rural areas are nearly three times more likely to be out of school when compared to children growing up in urban households. Twenty six per cent of children in that age group from rural areas are out of school, compared to 9 per cent of children from urban areas (see Figure 2.6).
64 IPC and UNICEF.
3%
44%53%

Yemen Country Report on Out-of-School Children 33
Similarly, mothers’ education and wealth quintiles remain important predictors for children’s continued school participation at the lower secondary level. Children whose mothers have not received any schooling are more than twice as likely to be out of school when compared to children whose mothers received at least some basic education. Twenty six per cent of children whose mothers never attended school are themselves out of school compared to 8 per cent of children whose mothers received basic education.65
65 Note that the variation in the share of children out of school whose mothers received either basic, secondary or higher or non-standard education, is likely to be different in observations in the drawn sample only, but not reflected in the entire population.
Figure 2.6 Percentage of lower secondary school children age 12-14 years out of school
Source: National Social Protection Monitoring Survey in Yemen, Baseline, 2012 (UNICEF & IPC, 2013)
Per cent
None
Basic
Secondary +
Non-standard education
Orphan or mother not in the HH
Poorest
Second
Middle
Fourth
Richest
Total
12 years old
12 years old
14 years old
Boys
Girls
Urban
Rural
0 10 20 30 40 50
Maternal education
Geography
Sex
Age
Wealth quintiles
20%
19%
21%
26%
13%
34%
9%
26%
26%
8%
22%
41%
23%
20%
17%
3%
5%
10%
The impact of wealth on schooling is further accentuated at the lower secondary level when compared to the primary level discussed above. Children between the ages of 12 and 14 years old from the wealthiest quintile of households are eight times less likely to be out of school when compared to children growing up in households from the poorest quintile. Forty one per cent of children from households in the poorest wealth quintile are out of school, compared to only 5 per cent of children from households in the wealthiest quintile.

Middle East and North Africa Out-of-School Children Initiative34
To sum up differences between Dimensions 2 and 3, it appears that discriminating factors such being a girl, being from rural areas, being poor or being brought up by an uneducated mother have a much stronger impact on school participation at the lower secondary level than they did at the primary level. Hence, young children up until the ages of 10 and 11 are more likely to be treated equally. However, as they grow older, their sex, socio-economic and geographic contexts play an increasing role in excluding them from education.
Dimension 3: Out-of-school children by governorate
For Dimension 3 as well, administrative data by governorate differs from survey data. Generally, administrative data indicates that a higher share of children are out of school when compared to survey data. Administrative data from only 6 governorates (Hadhramawt, Taiz, Aden, Al Mahra, Amran and Hajja) falls within the confidence interval of enrolment rates indicated by survey data.
Figure 2.7 Dimension 3: Out-of-school children by governorate
Source: National Social Protection Monitoring Survey in Yemen, Baseline, 2012 (UNICEF & IPC, 2013).
Survey data indicates that the geographical distribution of out-of-school children between 12-14 years old is roughly similar to that of children between 6-11 years old, as shown by survey data. As was the case for children between 6-11 years old, children between 12-14 years from Hajja are the most likely to be out of school, while children from Sana’a city in that age group are the least likely to be out of school. Forty-nine per cent of children between 12-14 years old from Hajja are out of school compared to 8 per cent in Sana’a city. Similarly, in the governorates of Ibb and Addale’e comparatively few children between 12-14 years are out of school (10 per cent). Following Hajja, Hodeida is the governorate with the second highest share of out-of-school children between 12-14 years old. A third of children (33 per cent) in that age group are out of school (see Figure 2.7).
The three governorates with the highest share of out-of-school children for Dimension 2, namely Al-Jawf, Hajja and Sa’ada, also have the highest share of out-of-school children in Dimension 3.
SPM (2012/2013) MOE (2011/2012)
70
60
50
40
30
20
10
0
Per
cen
t
Sana’a
City
Hadhra
maw
tIb
b
Al Mah
weet
Addale’e
Abyan
Sana’a
Amra
n
Al Bae
da
Mar
ebAdanTa
iz
Dhamar
Lahj
Al Jaw
f
Raima
Al Mah
ra
Al Hodaid
ah
Hajjah
Sa’ada
Shabwa
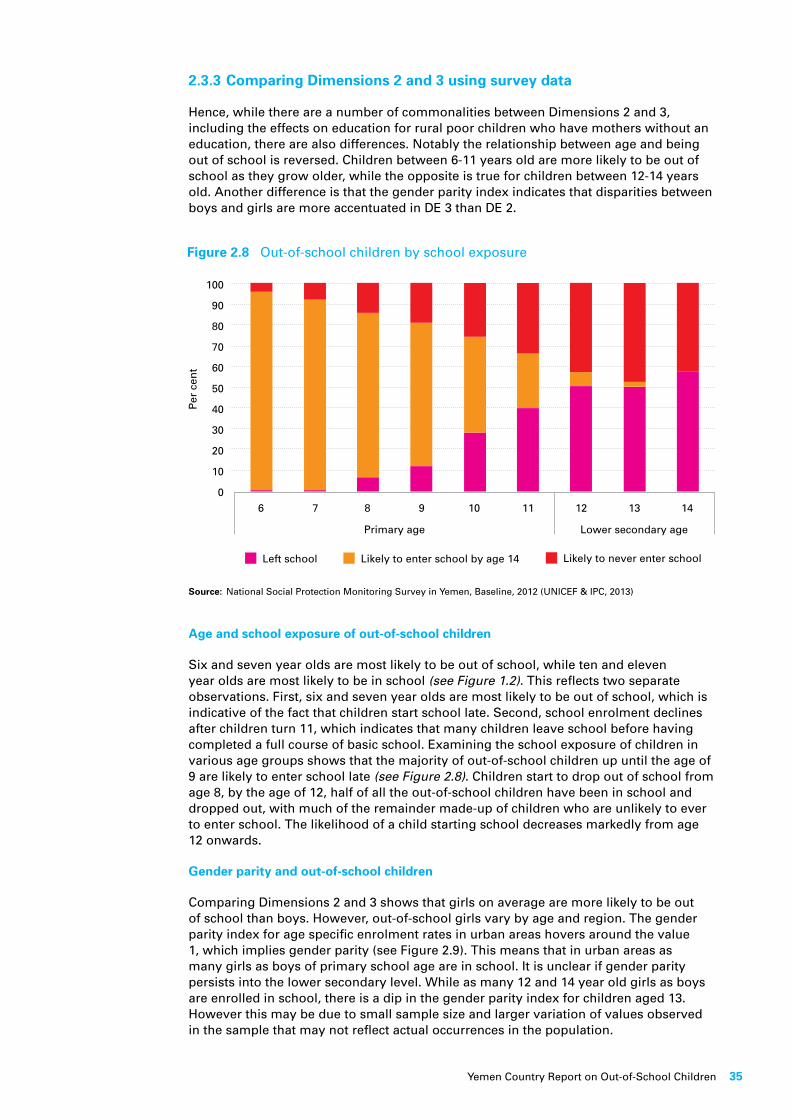
Yemen Country Report on Out-of-School Children 35
2.3.3 Comparing Dimensions 2 and 3 using survey data
Hence, while there are a number of commonalities between Dimensions 2 and 3, including the effects on education for rural poor children who have mothers without an education, there are also differences. Notably the relationship between age and being out of school is reversed. Children between 6-11 years old are more likely to be out of school as they grow older, while the opposite is true for children between 12-14 years old. Another difference is that the gender parity index indicates that disparities between boys and girls are more accentuated in DE 3 than DE 2.
Figure 2.8 Out-of-school children by school exposure
Source: National Social Protection Monitoring Survey in Yemen, Baseline, 2012 (UNICEF & IPC, 2013)
Age and school exposure of out-of-school children
Six and seven year olds are most likely to be out of school, while ten and eleven year olds are most likely to be in school (see Figure 1.2). This reflects two separate observations. First, six and seven year olds are most likely to be out of school, which is indicative of the fact that children start school late. Second, school enrolment declines after children turn 11, which indicates that many children leave school before having completed a full course of basic school. Examining the school exposure of children in various age groups shows that the majority of out-of-school children up until the age of 9 are likely to enter school late (see Figure 2.8). Children start to drop out of school from age 8, by the age of 12, half of all the out-of-school children have been in school and dropped out, with much of the remainder made-up of children who are unlikely to ever to enter school. The likelihood of a child starting school decreases markedly from age 12 onwards.
Gender parity and out-of-school children
Comparing Dimensions 2 and 3 shows that girls on average are more likely to be out of school than boys. However, out-of-school girls vary by age and region. The gender parity index for age specific enrolment rates in urban areas hovers around the value 1, which implies gender parity (see Figure 2.9). This means that in urban areas as many girls as boys of primary school age are in school. It is unclear if gender parity persists into the lower secondary level. While as many 12 and 14 year old girls as boys are enrolled in school, there is a dip in the gender parity index for children aged 13. However this may be due to small sample size and larger variation of values observed in the sample that may not reflect actual occurrences in the population.
Left school Likely to enter school by age 14 Likely to never enter school
100
90
80
70
60
50
40
30
20
10
0
Per
cen
t
6 7
Primary age Lower secondary age
8 9 10 11 12 13 14
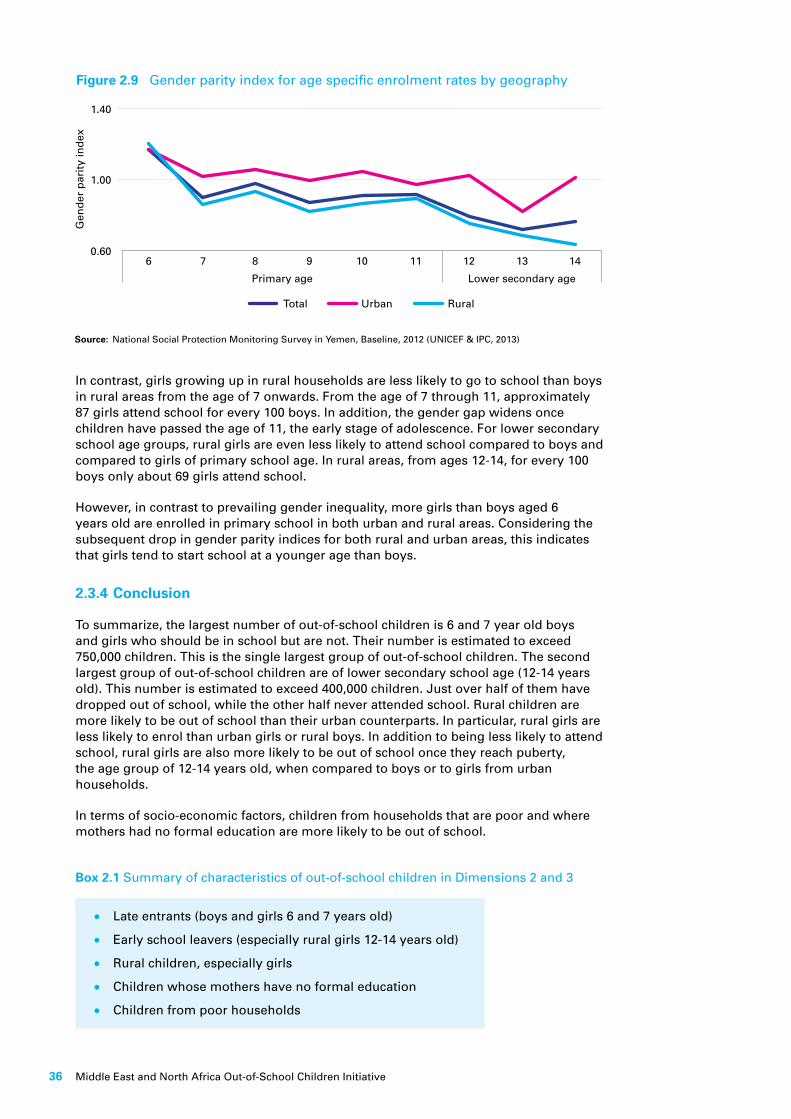
Middle East and North Africa Out-of-School Children Initiative36
In contrast, girls growing up in rural households are less likely to go to school than boys in rural areas from the age of 7 onwards. From the age of 7 through 11, approximately 87 girls attend school for every 100 boys. In addition, the gender gap widens once children have passed the age of 11, the early stage of adolescence. For lower secondary school age groups, rural girls are even less likely to attend school compared to boys and compared to girls of primary school age. In rural areas, from ages 12-14, for every 100 boys only about 69 girls attend school.
However, in contrast to prevailing gender inequality, more girls than boys aged 6 years old are enrolled in primary school in both urban and rural areas. Considering the subsequent drop in gender parity indices for both rural and urban areas, this indicates that girls tend to start school at a younger age than boys.
2.3.4 Conclusion
To summarize, the largest number of out-of-school children is 6 and 7 year old boys and girls who should be in school but are not. Their number is estimated to exceed 750,000 children. This is the single largest group of out-of-school children. The second largest group of out-of-school children are of lower secondary school age (12-14 years old). This number is estimated to exceed 400,000 children. Just over half of them have dropped out of school, while the other half never attended school. Rural children are more likely to be out of school than their urban counterparts. In particular, rural girls are less likely to enrol than urban girls or rural boys. In addition to being less likely to attend school, rural girls are also more likely to be out of school once they reach puberty, the age group of 12-14 years old, when compared to boys or to girls from urban households.
In terms of socio-economic factors, children from households that are poor and where mothers had no formal education are more likely to be out of school.
Box 2.1 Summary of characteristics of out-of-school children in Dimensions 2 and 3
l Late entrants (boys and girls 6 and 7 years old)
l Early school leavers (especially rural girls 12-14 years old)
l Rural children, especially girls
l Children whose mothers have no formal education
l Children from poor households
Figure 2.9 Gender parity index for age specific enrolment rates by geography
Source: National Social Protection Monitoring Survey in Yemen, Baseline, 2012 (UNICEF & IPC, 2013)
1.40
1.00
0.606 7
Primary age Lower secondary age
8 9 10 11 12 13 14
Total Urban Rural
Gen
der
par
ity
ind
ex

Yemen Country Report on Out-of-School Children 37
2.4 Dimensions 4 and 5
Many children currently attending school are at risk of dropping out. One in six students in primary school is likely to drop out before reaching sixth grade and roughly one in nine students in lower secondary school is likely to drop out before reaching ninth grade. This amounts to nearly half a million primary school students and just under 75,000 secondary students. As was the case for out-of-school children, children at risk have a number of characteristics that set them apart from children more secure in their school enrolment.
2.4.1 Data challenges in calculating Dimensions 4 and 5
The risk of a child dropping out cannot be easily observed. For an external observer such as a teacher or survey data collector, it is difficult to know which child currently at school will no longer be attending school next year or even next week. Therefore, observations from the past are used for this data. The question becomes: Who are the children currently out of school that used to be in school? Data on past school enrolment and student characteristics can be obtained from survey data. To obtain current data and to avoid recall bias, only children who attended school during the past academic year but who currently no longer attend school are considered. In the present case, only the Baseline Survey includes recent data on students who dropped out of school. However, the Baseline Survey is not a national survey and has been carried out only in poor, rural districts.66 This means that dropout rates from this survey may be different from the national average.
Due to sample-size restrictions, survey data is rarely able to give precise estimations of the number of students by age group and grade, which is necessary to calculate age-based dropout rates.
To complement the survey data, administrative data will be used. Administrative data is collected from schools; therefore, information can be obtained on the number of students that graduated per class from one year to the next as well as the number of repeaters. But administrative data contains little information on individual student characteristics, while it does cover age and sex; it does not include the mother’s or father’s education.
MOE data for survival and dropout rates diverges significantly from that obtained in the Baseline Survey or from UIS data (see Table 2.5). Population estimates cannot explain this difference since dropout and survival rates are calculated from the present student population. Though Baseline Survey and MOE data will be discussed in this section, UIS data will be used as the reference source (see Annex 3 sub-section; Further discussion of data sources for Dimensions 4 and 5).
2.4.2 Dimension 4
According to administrative data compiled by UIS three quarters of students (76 per cent) entering first grade will graduate to the sixth grade. This figure given by MOE is much lower with less than half (42 per cent) surviving from first grade to sixth grade. Administrative data figures are worse than those observed using survey data, even from poor and rural districts as covered by the Baseline Survey. According to survey data, 84 per cent of children are likely to reach the final grade of primary school, Grade 6 (see Table 2.5).
66 National Social Protection Monitoring Survey in Yemen, Baseline, 2012 (UNICEF & IPC, 2013).
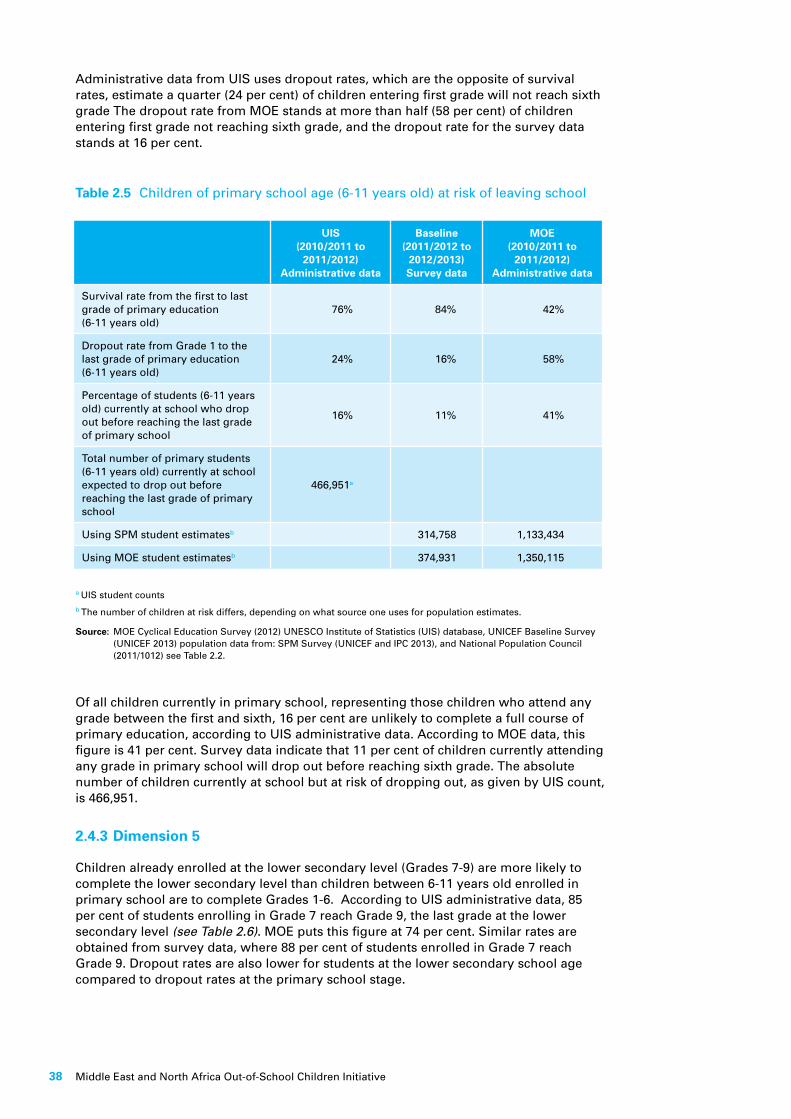
Middle East and North Africa Out-of-School Children Initiative38
Administrative data from UIS uses dropout rates, which are the opposite of survival rates, estimate a quarter (24 per cent) of children entering first grade will not reach sixth grade The dropout rate from MOE stands at more than half (58 per cent) of children entering first grade not reaching sixth grade, and the dropout rate for the survey data stands at 16 per cent.
Table 2.5 Children of primary school age (6-11 years old) at risk of leaving school
a UIS student countsb The number of children at risk differs, depending on what source one uses for population estimates.
Source: MOE Cyclical Education Survey (2012) UNESCO Institute of Statistics (UIS) database, UNICEF Baseline Survey (UNICEF 2013) population data from: SPM Survey (UNICEF and IPC 2013), and National Population Council (2011/1012) see Table 2.2.
UIS(2010/2011 to
2011/2012)Administrative data
Baseline(2011/2012 to
2012/2013)Survey data
MOE(2010/2011 to
2011/2012)Administrative data
Survival rate from the first to last grade of primary education (6-11 years old)
76% 84% 42%
Dropout rate from Grade 1 to the last grade of primary education (6-11 years old)
24% 16% 58%
Percentage of students (6-11 years old) currently at school who drop out before reaching the last grade of primary school
16% 11% 41%
Total number of primary students (6-11 years old) currently at school expected to drop out before reaching the last grade of primary school
466,951a
Using SPM student estimatesb 314,758 1,133,434
Using MOE student estimatesb 374,931 1,350,115
Of all children currently in primary school, representing those children who attend any grade between the first and sixth, 16 per cent are unlikely to complete a full course of primary education, according to UIS administrative data. According to MOE data, this figure is 41 per cent. Survey data indicate that 11 per cent of children currently attending any grade in primary school will drop out before reaching sixth grade. The absolute number of children currently at school but at risk of dropping out, as given by UIS count, is 466,951.
2.4.3 Dimension 5
Children already enrolled at the lower secondary level (Grades 7-9) are more likely to complete the lower secondary level than children between 6-11 years old enrolled in primary school are to complete Grades 1-6. According to UIS administrative data, 85 per cent of students enrolling in Grade 7 reach Grade 9, the last grade at the lower secondary level (see Table 2.6). MOE puts this figure at 74 per cent. Similar rates are obtained from survey data, where 88 per cent of students enrolled in Grade 7 reach Grade 9. Dropout rates are also lower for students at the lower secondary school age compared to dropout rates at the primary school stage.

Yemen Country Report on Out-of-School Children 39
According to UIS administrative data, 11 per cent of students currently enrolled at the lower secondary level, at any grade, are likely to drop out before reaching Grade 9, the last grade at the lower secondary level. This figure is close to that obtained from survey data (9 per cent). MOE data puts this figure at 26 per cent. In terms of absolute numbers, this amounts to 73,225 lower secondary level students being at risk of dropping out before reaching Grade 9.
In sum, children at the primary school level are more at risk of dropping out than children at the lower secondary school level.
2.4.4 Profiles of Dimensions 4 and 5
Particular grade levels
This section discusses at which specific grade levels children are most likely to leave school, by grade for both administrative and survey data (see Figure 2.10).
UIS(2010/2011 to
2011/2012)Administrative data
Baseline(2011/2012 to
2012/2013)Survey data
MOE(2010/2011 to
2011/2012)Administrative data
Survival rate from first to last grade of lower secondary education (12-14 years old)
85% 88% 74%
Dropout rate from Grade 7 to last grade of lower secondary education (12-14 years old)
15% 12% 26%
Percentage of students (12-14 years old) currently enrolled in lower secondary school who drop out before reaching ninth grade
11% 9% 19%
Total number of lower secondary students (12-14 years old) currently at lower secondary school expected to drop out before reaching ninth grade
73,225a
Using SPM student estimatesb 50,952 115,332
Using MOE student estimatesb 63,074 142,770
Table 2.6 Children of lower secondary school age (12-14 years old) at risk of leaving school
a UIS student countsb The number of children at risk differs, depending on what source one uses for population estimates.
Source: MOE Cyclical Education Survey (2012) UNESCO Institute of Statistics (UIS) database, UNICEF Baseline Survey (UNICEF 2013) population data from: SPM Survey (UNICEF and IPC 2013), and National Population Council (2011/1012) see Table 2.2.

Middle East and North Africa Out-of-School Children Initiative40
As discussed in the previous section, overall dropout rates are higher in administrative data (UIS and MOE) when compared to survey data (Baseline). According to administrative data, students are most likely to drop out when transitioning from Grade 1 to Grade 2, 10 per cent of first graders do not make it to second grade according to UIS. MOE puts this figure at 15 per cent. This figure varies greatly in the survey data, where only 2 per cent of first graders dropout. One explanation is that many students may dropout within the first weeks of registration (additional information is provided in Appendix 3). For these children, registration is captured by administrative data, but not by survey data, which asks about enrolment throughout the year. In the case of the Baseline Survey, data collection took place in February and March, which is the middle of the school year. This suggests that a number of students may have the intention to attend school, but certain factors push them to dropout within a few weeks after starting. Another consideration is that either the survey or the administrative data is flawed.
Both data sources show that dropout rates are lowest in low grades and increase steadily from grade 2 onwards (see Figure 2.11) until it peaks around Grade 6, the end of the primary school. Survey data indicates that students are least likely to transition from Grade 6 to Grade 7. According to the Baseline Survey data, 8 per cent of students drop out at this level. Administrative data from MOE indicates that 11 per cent of students drop out when transitioning from Grade 6 to 7 and again from Grade 7 to 8. Dropout rates decrease again after sixth and seventh grade, and students are more likely to move up to the following grades. These peaks in dropout rates can be explained by different enrolment behaviour of boys and girls, which is discussed in the following section.
Differences between boys and girls
In the Baseline Survey data, dropout rates by grade differ between boys and girls (see Figure 2.11). The spike in dropout rates at Grade 6 is uniquely due to a higher share of girls dropping out compared to boys. Dropout rates by grade for boys also increase with grade levels, peaking at the transition from Grade 7 to 8, but the variation in dropout rates is much less marked. Girls in Grade 6 are more than seven times more likely to dropout of school than girls in Grade 1 or 2. The increase in risk for boys is much lower. Boys in Grade 7 are about three times more likely to drop out compared to boys in Grade 2. The difference in dropout rate between boys and girls is statistically significant.
However, this difference between boys’ and girls’ dropout rates is specific to survey data and does not appear in administrative data published by MOE (see Annex 3, Figure A3.3). Though dropout rates for girls are consistently higher than those for boys, the difference between boys and girls in administrative data is surprisingly uniform across grade levels.
Source: UIS database academic year 2011/2012, UNICEF Baseline Survey academic year 2012/2013, MOE Cyclical Education Survey academic year 2011/2012
Figure 2.10 Dropout rates by grade, from Grade 1 to Grade 9
UIS Baseline MoE
16
14
12
10
8
6
4
2
0
Per
cen
t
Grade1 to 2
Dimension 4 Dimension 5
Grade2 to 3
Grade3 to 4
Grade4 to 5
Grade5 to 6
Grade6 to 7
Grade7 to 8
Grade8 to 9

Yemen Country Report on Out-of-School Children 41
Maternal education
As was the case with Dimensions 2 and 3, maternal education reduces a child’s likelihood of being at risk of dropping out. Children whose mothers have received at least one year of schooling are more likely to complete a full course of primary education as well as more likely to complete a full course of lower secondary education when compared to children whose mothers have received no formal schooling (see Figure 2.12). This is evident in the higher survival rates. Ninety per cent of children whose mothers have had some schooling are likely to make it from the first to the sixth grade and 97 per cent from Grade 7 to Grade 9. In comparison only 84 per cent of children whose mothers are without schooling are likely to complete a full course of primary education, and 87 per cent a full course of lower secondary school education. Similarly, dropout rates are lower for children whose mother have received at least one year of formal schooling.
Interestingly, the impact of mothers’ education is more important for children in Dimension 5 (children 12-14 years old enrolled at the lower secondary level) than for children in Dimension 4 (children 6-11 years old enrolled at the primary level). Indeed, maternal education decreases the likelihood of a child currently enrolled in primary school dropping out before reaching the sixth grade by 2 percentage points, from 11 per cent to 9 per cent. In contrast, maternal education decreases the likelihood of a child currently in lower secondary school dropping out before reaching the Grade 9 by 6 percentage points, from 9 per cent to 3 per cent. Hence the impact of a mother’s education on a child’s risk of leaving school is particularly important at the lower secondary level. At the lower secondary level, maternal education has the same association with girls’ enrolment as it does with boys’ enrolment (see Annex 3, Figure A3.4).68
Figure 2.11 Dropout rates by grade and sex
Source: UNICEF Baseline Survey67
67 UNICEF.68 Due to missing data we were unable to do a complete comparison of fathers’ education with mothers’ education on
student enrolment. Considering fathers’ education in relation to enrolment in Yemen is important due to the fact that in Yemeni society the father (or the eldest male member in the family) is the primary decision maker in children’s education not the mother. According to the data available, a father’s primary schooling is not significantly associated with a reduced risk of a child being out of school, compared to fathers without any schooling at all. However, children with fathers that have secondary or higher schooling are less likely to be out of school when compared to children whose fathers had no schooling at all. Examining linear combinations of fathers’ education shows that children whose fathers have secondary education are less likely to be out of school than children whose fathers have only primarily level schooling. These observations apply to both Dimensions 2 and 3. Yet, the effect of the a father’s education decreases the risk of a child being out of school is stronger for children in Dimension 3.
Total Boys Girls
14
12
10
8
6
4
2
0
Per
cen
t
Grade1 to 2
Grade2 to 3
Grade3 to 4
Grade4 to 5
Grade5 to 6
Grade6 to 7
Grade7 to 8
Grade8 to 9

Middle East and North Africa Out-of-School Children Initiative42
2.4.5 Conclusion
In sum, the largest number of children at risk of dropping out is students between ages 6-11 years old at the primary school level. This is true in absolute numbers with 466,951 children at risk of dropping out as well as in terms of relative terms, with 16 per cent of children between 6-11 years old enrolled in primary school grades at risk of dropping out.
Within this group, first graders who have just registered are particularly at risk as well as girls enrolled in Grades 5 to 7. Girls are significantly more likely to drop out at this level than boys.
As for Dimension 5, between 73,225 children currently enrolled in lower secondary grades are at risk of dropping out before reaching Grade 9. This amounts to between 11 per cent of students currently enrolled at this level. Girls are more likely to drop out of lower secondary grades than boys but the difference is less marked than it was at the primary level. Children whose mothers have received at least one year of formal schooling are at a lower risk of leaving school. Maternal education has a higher impact on children at the lower secondary than at the primary level.
Box 2.2 Summary of characteristics of children at risk of dropping out of school in Dimensions 4 and 5
l Children in primary school are more at risk than children in lower secondary school
l First graders who have just enrolled
l Girls in higher grades, especially Grade 6
l Children whose mothers have no formal education, especially at the lower secondary level
Figure 2.12 Children at risk of leaving school by maternal education
Source: UNICEF Baseline Survey69
69 UNICEF.
Survival rate Grade 1 to Grade 6
Drop out rate Grade 1 to Grade 6
Drop out before Grade 6 from any grade
Survival rate Grade 7 to Grade 9
Drop out rate Grade 7 to Grade 9
Drop out before Grade 9 from any grade
Dimension 4
Dimension 5
Mother has no formal schooling Mother has at least one year of schooling
0 10 20 30 40 50 60 70 80 90 100
Per cent
84
16
11
90
10
9
87
13
9
97
3
3

Yemen Country Report on Out-of-School Children 43
2.5 Child labour
The likelihood of a child being out of school is related to child labour. This section examines the characteristics of out-of-school children who are also child labourers. Fourteen-year-old children working are not considered child labourers under Yemeni law. Hence, the age bracket considered in this section is that of children between 6-13 years old.
No distinction will be made between children 6-11 years old (Dimension 2) who work and out-of-school children between 12-13 years old (Dimension 3) who work. Appendix 3 elaborates on the differences across the dimensions using different data sources. In addition, it examines data sources in more detail. The key source used here are UCW tables analysing the Child Labour Survey dataset (see section 2.1.2 for a description). Note that in contrast to previous sources, the Child Labour Survey uses school attendance instead of school enrolment.
One in seven children (14 per cent) between the ages of 6-13 years is engaged in child labour. Child labour is defined as being engaged in paid or unpaid work, inside or outside the home, for at least one hour over the reference week for children 6-11 years old, and children 12-13 years old have to be engaged in work for at least 14 hours over the reference period. Children engaged in hazardous work or more than 28 hours of housework are classified as child labourers irrespective of age. This definition of child labour is the standard definition used by the ILO as well as UNICEF70 (see Appendix 3, Table A3.1 for a detailed discussion of the definition). Using SPM population estimates, approximately 730,000 children are engaged in child labour. Out of the 1.6 million children in Yemen who are out of school, one in five are engaged in child labour (21 per cent) (see Figure 2.14). Children engaged in child labour are more likely to be out of school when compared to children who are not engaged in child labour (Figure 2.13). Across all cohorts, except children 6 years olds, the share of child labourers out of school is at least 10 percentage points higher than the share of children not engaged in child labour who are out of school. The difference becomes particularly stark for children of lower secondary age, where child labourers are approximately three times more likely to be out of school when compared to children not engaged in child labour.
70 UNICEF, ‘Childinfo.org: Multiple Indicator Cluster Surveys – MICS4 – Survey Tools’, 2012 <www.childinfo.org/> [accessed 28 April 2013].
Note: UCW data is using school attendance not enrolment.
Source: UCW child labour tables calculated 2013 using the Child Labour Survey 2010 by ILO-IPEC (2012)
Figure 2.13 Percentage of out-of-school children by age (6-14 years old) and child labour status
Child labour Not engaged in child labour
6 7 8 9 10 11 12 13 14
Primary age Lower secondary age
80
70
60
50
40
30
20
10
0
Per
cen
t

Middle East and North Africa Out-of-School Children Initiative44
Housework is part of the child labour definition. Children spending more than 28 hours per week on housework are considered to be engaged in child labour. The relationship between housework and being out of school has been analysed in more detail in the Baseline Survey.71 Though figures published by the Baseline Survey are not directly comparable here and will hence not be cited, the survey found that out-of-school children are significantly more likely to spend long hours on housework than children in school.72 In particular, collecting water is mostly considered girls’/women’s work. In households where the water source is not on their premises, in two thirds of cases it is the adult women who collect water. Girls younger than 15 years old are second most likely to collect water. They collect water for 18 per cent of households without direct water access in UNICEF target districts. This is largely similar to the proportion of households where men older than 15 years fetch water. In the highlands of Dhamar, Raymah and Ibb, girls are most likely to collect drinking water. They are responsible for fetching water for a quarter of households that do not have water pumped directly into their premises.73
2.5.1 Profile of out-of-school child labourers
Age is an important factor in the likelihood that out-of-school children work. Fourteen per cent of out-of-school children between 6-11 years old are involved in child labour (see Figure 2.14). Out-of-school children between 12-13 years old are three times more likely to work, as 47 per cent of out-of-school children in in the 12-13 age group do. This implies that work is not a key reason why young children are out of school, but may become a factor as children grow older.
Out-of-school girls are slightly more likely to work than boys. However, the difference between boys and girls is small and may be observed in the sample only but not in the underlying data.
Rural children are three times more likely to work when compared to urban children. Seven per cent of urban out-of-school children are engaged in child labour compared to 23 per cent of rural out-of-school children.
Out-of-school children whose head of household had no formal schooling are more likely to be engaged in child labour when compared to children whose head of household had received at least some education. Twenty-three per cent of out-of-school children whose head of household had no education work; compared to 10 per cent of out-of-school children whose mothers have a primary or secondary education. Children whose head of household had vocational, secondary or higher education are more likely to work (see Figure 2.14). However, the underlying sample of heads of household with these types of training is likely to be very small, in particular for vocational training, and figures reliant on it may be unreliable.
Out-of-school children growing up in households from the poorer quintiles are marginally more likely to work than children growing up in households from the richest wealth quintile. One in five children from the poorest quintile works (20 per cent) compared to one in seven from the richest quintile (15 per cent) (see Figure 2.14). However, these observed differences are very small. An analysis from an alternative data source shows that wealth quintiles may be associated with children being economically active (see Appendix 3, Figure A3.5).
71 Recall that the survey is not national and covers rural areas only, see section 2.1.2 for a discussion.72 UNICEF, Baseline Survey Report (Sana’a, Yemen, 2013), pg. 93.73 UNICEF, Baseline Survey Report (Sana’a, Yemen, 2013), pg. 113.
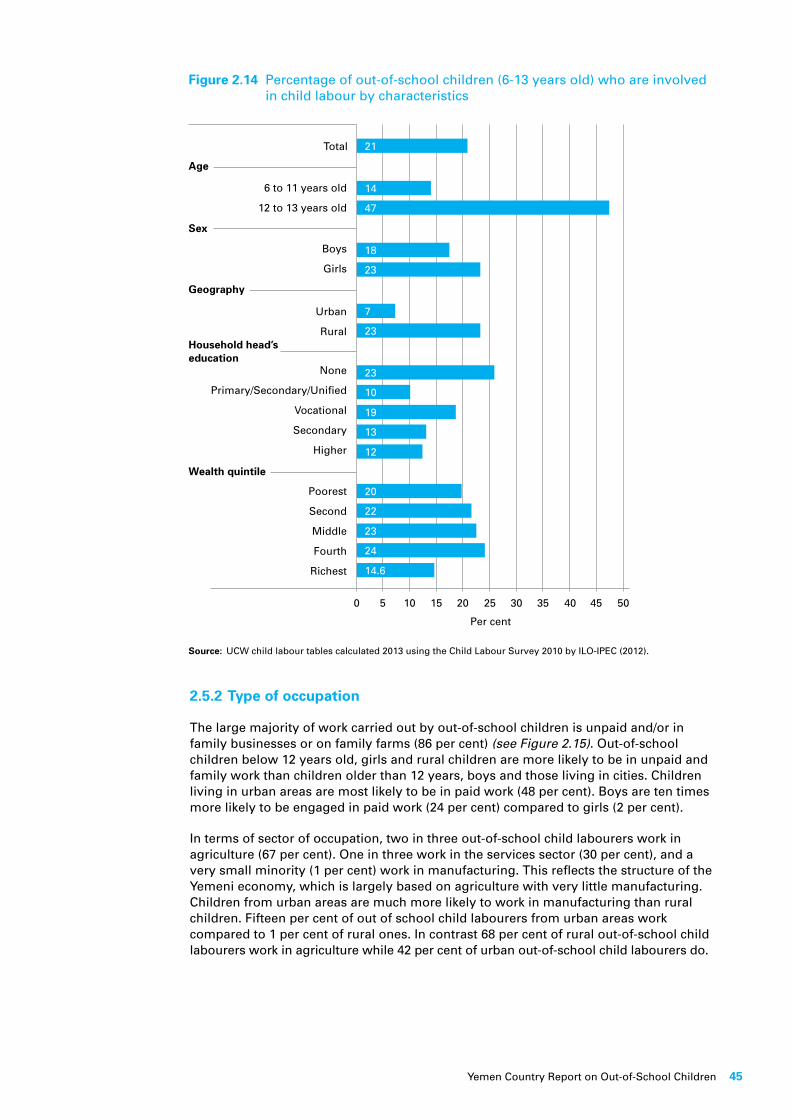
Yemen Country Report on Out-of-School Children 45
2.5.2 Type of occupation
The large majority of work carried out by out-of-school children is unpaid and/or in family businesses or on family farms (86 per cent) (see Figure 2.15). Out-of-school children below 12 years old, girls and rural children are more likely to be in unpaid and family work than children older than 12 years, boys and those living in cities. Children living in urban areas are most likely to be in paid work (48 per cent). Boys are ten times more likely to be engaged in paid work (24 per cent) compared to girls (2 per cent).
In terms of sector of occupation, two in three out-of-school child labourers work in agriculture (67 per cent). One in three work in the services sector (30 per cent), and a very small minority (1 per cent) work in manufacturing. This reflects the structure of the Yemeni economy, which is largely based on agriculture with very little manufacturing. Children from urban areas are much more likely to work in manufacturing than rural children. Fifteen per cent of out of school child labourers from urban areas work compared to 1 per cent of rural ones. In contrast 68 per cent of rural out-of-school child labourers work in agriculture while 42 per cent of urban out-of-school child labourers do.
Figure 2.14 Percentage of out-of-school children (6-13 years old) who are involved in child labour by characteristics
Source: UCW child labour tables calculated 2013 using the Child Labour Survey 2010 by ILO-IPEC (2012).
None
Primary/Secondary/Unified
Vocational
Secondary
Higher
Poorest
Second
Middle
Fourth
Richest
Total
6 to 11 years old
12 to 13 years old
Boys
Girls
Urban
Rural
Age
Sex
Geography
Household head’seducation
Wealth quintile
21
14
18
7
23
20
19
23
12
14.6
47
23
23
10
22
13
24
Per cent
0 5 10 15 20 25 30 35 40 45 50

Middle East and North Africa Out-of-School Children Initiative46
2.5.3 Conclusion
In sum, one in five out-of-school children between the ages of 6 and 13 years old work. In particular, once out-of-school children reach lower secondary school, they are more likely to work. This indicates that work may become a barrier to school attendance for teenage out-of-school children.
Interestingly out-of-school girls are more likely to work than out-of-school boys. However, these differences between boys and girls may not be statistically significant and require additional significance testing. Out-of-school children of any age group are less likely to work if they grow up in an urban household or if their head of household has received some formal education.
Out-of-school child labourers are mostly unpaid or family workers. They mostly work in agriculture. In urban areas services and manufacturing are also important sectors of employment.
Box 2.3 Summary of profiles of out-of-school children likely to be engaged in child labour
l Child labourers are more likely to be out of school.
l Out-of-school children of lower secondary age are more likely to work.
l Rural out-of-school children are more likely to work.
l Out-of-school children whose head of household had no schooling are more likely to work.
l Out-of-school child labourers are mostly unpaid or family workers in agriculture
Figure 2.15 Out-of-school children (children 6-13 years old) engaged in child labour by type of economic activity
Source: UCW child labour tables calculated 2013 using the Child Labour Survey 2010 by ILO-IPEC (2012).
Unpaid/Family farm-business Paid work Self employment
Per cent
Boys
Girls
Urban
Rural
806040200 100
Geography
Sex
Age
Total
6 to 11 years old
12 to 13 years old
86%
91%
72%
44%
81%
97%
88%
11% 3%
3%
3%
3%
5%
8%
2 2
6%
16%
24%
48%
9%
Yemen Country Report on Out-of-School Children 47
2.6 Marginalized children
Three groups of children have been identified in the framework of this study as particularly marginalized in their access to education. These include children in emergency and conflict areas, children from the Muhamasheen community (aka al-akhdam), and children with special needs and disabilities.
Administrative and survey data do not systematically collect information on these groups. They may be included in data collection, but are not identified as growing up in an emergency setting, coming from the Muhamasheen community or being disabled. Hence, other data sources were used to compile this section such as reports and the existing literature. Data challenges particular to each group are discussed below.
2.6.1 Children in emergency and conflict areas
The climate of insecurity affects school attendance as well as teaching quality. Parents may not allow their children to attend school for fear of their safety. A UNICEF study states that in 2011 and 2012 the revolution and subsequent uprisings alone prevented 1.2 million children in Yemen from regularly accessing education, particularly in Sana’a city, Taiz, Lahj, Abyan, Aden and Sa’ada.74 Since early 2011, 820 schools have ceased operating, 592 were damaged, more than 100 occupied by internally displaced persons, militias or the military, and many more schools have been looted.75
Key areas of conflict were Sana’a city during the uprising in 2011, Abyan and Sa’ada in 2011 and 2012, and Haradh is host to many migrants seeking refuge in Yemen who are living in emergency situations. Each of these will be discussed briefly below.
Sana’a in the 2011 uprising
During the 2011 uprising, Sana’a was particularly affected. Mostly armed groups such as the First Armoured Division – a breakaway division supporting anti-government protesters – and militias associated with the Al-Ahmar tribe attacked at least 77 schools in 130 incidents.76 About 200,000 children had their education disrupted.77 Both government and anti-government forces used schools.78 This is evidenced by occupation of schools around Change Square, the key locus of the demonstrations. Of the eleven schools occupied by combatants in 2011 and 2012, six had been taken over by the First Armoured Division rebels, five by government forces and one by the Presidential Guard.79
Consequences of the conflict in Sa’ada
The conflict between the Yemeni army and Houthi’s in the northern governorate of Sa’ada during the summer of 2009 and early 2010 led to an increase in attacks on schools there.
Government officials report that all 725 schools were closed during the conflict, 220 of them were completely or partially destroyed or looted. Up to 75 schools were almost completely destroyed.80 Over the past 7 years, more than 230 schools in Sa’ada have
74 Education-Focused Conflict Analysis of the Republic of Yemen. Draft Final report (Sana’a, Yemen: UNICEF Yemen Country Office, 2013), p. 22.
75 MOE, Yemen Education Sector Plan Mid-Term Results Framework 2013-2015 (Sana’a, Yemen: Republic of Yemen, 2013).76 The Education-Focused Conflict Analysis Report. Cited from the Secretary-General on Children in Armed Conflict,
April 2012, at pg. 32, para. 168. 77 Ibid.78 Human Rights Watch, Classrooms in the Crosshairs: Military Use of Schools in Yemen’s Capital, September 11, 2012.79 Child Protection citing Human Rights Watch, Classrooms in the Crosshairs: Military Use of Schools in Yemen’s
Capital, September 11, 2012.80 Child Protection citing YEMEN: Saada schools reopen: 220 destroyed, damaged or looted, IRIN, 28 February 2010,
http://www.irinnews.org/Report.aspx?ReportId=88255; Muhammad Al-Shamiri, Director of Sa’ada Education Office. Interviewed by Fuad Rajeh for Education under Attack, 9 March 2013.

Middle East and North Africa Out-of-School Children Initiative48
been destroyed or damaged and the majority, reportedly, have not been rebuilt.81 The education of 30,000 children was disrupted.82
The Houthis claim that in addition to being marginalized from government education spending, the role of the Zaydis in Yemen history has been removed from the curriculum and textbooks.83
Consequences of the conflict in Abyan
It is estimated that 18,548 internally displaced students left the two most populous districts of Abyan, Zinjibar and Khanfar, between May 2011 and January 2012.84 The internally displace population fled to Aden and Lahj governorates. The result of influx of refugees had a considerable impact on school attendance in these two governorates.
Out of the 18,548 internally displaced children, 1,212 are estimated to be enrolled in Lahj and 8,769 in Aden, either in standard or in special schools for internally displaced students. According to the Abyan Education Office, 4,371 internally displaced children are estimated to have remained in Abyan governorate. However, Al-Dabbi notes that there is some inconsistency in the data and advises caution or revision of this information. This leaves 4,196 internally displaced children unaccounted for, most likely out of school. These data apply to the school year 2011/2012, which is also the reference year for the administrative data used in this study.85
Estimating that about a quarter of the internally displaced children are out of school may be an underestimate (see Figure 2.16). A survey in Lahj governorate found that two thirds of school aged internally displaced children in Lahj are out of school.86
Half of the internally displaced children in Aden (4,398) are enrolled in schools in Aden. The remainder attend school for internally displaced children, which were set up by the Abyan Education Office and moved to Aden. Despite the fact that internally displaced
Figure 2.16 Distribution of internally displaced students from Abyan (6-14 years old) enrolled in recipient governorates
Source: Belqis Al-Dabbi, Brief Assessment of Education Situation in the South (Sana’a, Yemen: UNICEF Yemen Country Office, 2013), p. 12.
81 Zyck, p. 22.82 Child Protection citing IRIN, Yemen: Rebel occupation of schools threatens northern ceasefire, 10 May 2010,
http://www.irinnews.org/report/89079/yemen-rebel-occupation-of-schools-threatens-northern-ceasefire.83 Zyck, p. 34.84 Belqis Al-Dabbi, Brief Assessment of Education Situation in the South (Sana’a, Yemen: UNICEF Yemen Country
Office, 2013), p. 12.85 Al-Dabbi, p. 12 citing Aden Education Office.86 Al-Dabbi, p. 15.
Unaccounted for out-of-school children 23%
Abyan 24%
Aden 47%
Lahj 6%

Yemen Country Report on Out-of-School Children 49
children enrolled in schools in Aden, total enrolment of students in schools in Aden (2011/2012) declined by about 5,000 students, or 5 per cent. In Lahj no decline in gross enrolment was observed, even allowing for internally displaced students.87
Consequently, to accommodate the increased number of students and to cope with a lack of school buildings, a number of schools in Aden and Lahj were re-housed and/or teaching shifts were added to existing schools. In addition, laboratories, libraries and other auxiliary rooms were used as classrooms. This required the re-allocation of students to schools, often far from students’ homes, negatively affecting early grade enrolment and girls’ enrolment. Often, teaching took place in tents. This organizational effort led to the school year starting between 1-2 months late. The government is not allocating alternative buildings to internally displaced students, and hence the constrained conditions continued into the academic year 2012/2013.88
Adverse teaching conditions and reduced teaching time affected the quality of education. Only 23 per cent of the curriculum was covered.89 With the exception of students in Grades 9 and 12, who sit for national exams, courses only covered a limited amount of the curriculum. Student stress was observed in the forms of declining educational standards and worsening student behaviour. Teachers and social workers reported increases of nervousness and fear among students, as well as verbal abuse, neglect of homework and studies, and damage of teaching material.90
Box 2.4 Case study of the effects of lacking school buildings on Hatem School in Sheikh Othman district
In Hatem School “13,721 students from nine schools were studying in one building, […] which consists of 28 classrooms. This was done by operating the building [in] three shifts per day, three days per week for boys and three days per week for girls. There were only three hours of […teaching per] student, every other day which […] allowed [for only] 9 hours [of teaching] per week instead of the standard 27 hours […]. In addition time was lost in the change of shifts for such [a] large numbers of students. [The] duration of lessons was also reduced to only half an hour for each subject instead of the usual 45 minutes. In this case the student to teacher ratio for girls was 69 and for boys […] 94 in spite of the sufficient availability of teachers. [This was] due to [the] limited number of classrooms […] (28).”
Source: Belqis Al-Dabbi, Brief Assessment of Education Situation in the South (Sana’a, Yemen: UNICEF Yemen Country
Office, 2013), p. 4
Internally displaced students enrolled in schools run by the Abyan Education Office that were relocated to Aden, were most were taught by volunteers who had no teaching experience. Though internally displaced teachers from Abyan had been recruited to teach these students in Aden, at the time of report writing they had yet to be deployed. One challenge facing the deployment of recruited teachers is lack of knowledge of their current whereabouts, whether they are in Abyan or Aden.91
As noted, for internally displaced students taught in schools in Aden, teaching space is a major constraint. Though tents were provided by UNICEF, these proved to be poor teaching environments because of the heat and high temperatures, especially from March and onwards.92
87 Al-Dabbi citing Aden Education Office.88 Al-Dabbi.89 Al-Dabbi, p. 5.90 Al-Dabbi, p. 7.91 Al-Dabbi, p. 13.92 Al-Dabbi, p. 13.
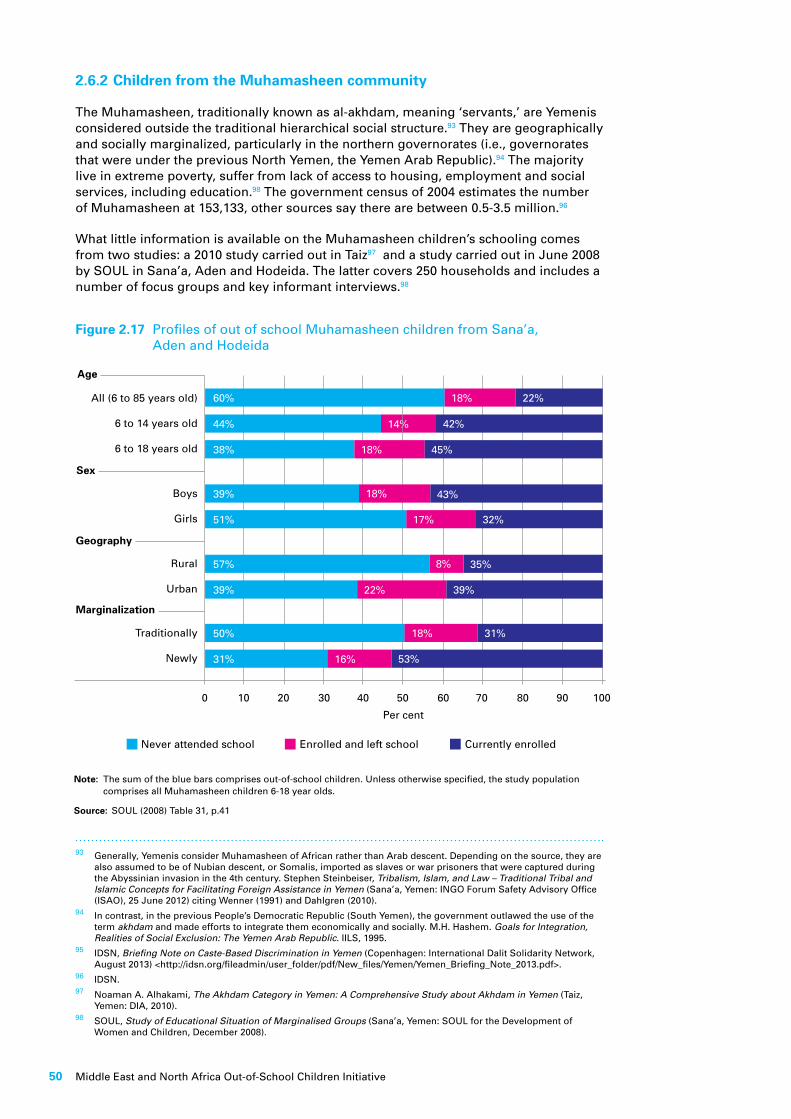
Middle East and North Africa Out-of-School Children Initiative50
2.6.2 Children from the Muhamasheen community
The Muhamasheen, traditionally known as al-akhdam, meaning ‘servants,’ are Yemenis considered outside the traditional hierarchical social structure.93 They are geographically and socially marginalized, particularly in the northern governorates (i.e., governorates that were under the previous North Yemen, the Yemen Arab Republic).94 The majority live in extreme poverty, suffer from lack of access to housing, employment and social services, including education.98 The government census of 2004 estimates the number of Muhamasheen at 153,133, other sources say there are between 0.5-3.5 million.96
What little information is available on the Muhamasheen children’s schooling comes from two studies: a 2010 study carried out in Taiz97 and a study carried out in June 2008 by SOUL in Sana’a, Aden and Hodeida. The latter covers 250 households and includes a number of focus groups and key informant interviews.98
93 Generally, Yemenis consider Muhamasheen of African rather than Arab descent. Depending on the source, they are also assumed to be of Nubian descent, or Somalis, imported as slaves or war prisoners that were captured during the Abyssinian invasion in the 4th century. Stephen Steinbeiser, Tribalism, Islam, and Law – Traditional Tribal and Islamic Concepts for Facilitating Foreign Assistance in Yemen (Sana’a, Yemen: INGO Forum Safety Advisory Office (ISAO), 25 June 2012) citing Wenner (1991) and Dahlgren (2010).
94 In contrast, in the previous People’s Democratic Republic (South Yemen), the government outlawed the use of the term akhdam and made efforts to integrate them economically and socially. M.H. Hashem. Goals for Integration, Realities of Social Exclusion: The Yemen Arab Republic. IILS, 1995.
95 IDSN, Briefing Note on Caste-Based Discrimination in Yemen (Copenhagen: International Dalit Solidarity Network, August 2013) <http://idsn.org/fileadmin/user_folder/pdf/New_files/Yemen/Yemen_Briefing_Note_2013.pdf>.
96 IDSN.97 Noaman A. Alhakami, The Akhdam Category in Yemen: A Comprehensive Study about Akhdam in Yemen (Taiz,
Yemen: DIA, 2010).98 SOUL, Study of Educational Situation of Marginalised Groups (Sana’a, Yemen: SOUL for the Development of
Women and Children, December 2008).
Note: The sum of the blue bars comprises out-of-school children. Unless otherwise specified, the study population comprises all Muhamasheen children 6-18 year olds.
Source: SOUL (2008) Table 31, p.41
Figure 2.17 Profiles of out of school Muhamasheen children from Sana’a, Aden and Hodeida
Never attended school Enrolled and left school Currently enrolled
Boys
Girls
Rural
Urban
Traditionally
Newly
Marginalization
Geography
Sex
14%
Age
All (6 to 85 years old)
6 to 14 years old
6 to 18 years old
Per cent
0 10 20 30 40 50 60 70 80 90 100
50%
39%
31% 16%
18%
51% 17%
38% 18%
18%
60% 22%18%
44% 42%
45%
43%
32%
57% 8% 35%
39% 22% 39%
31%
53%

Yemen Country Report on Out-of-School Children 51
Muhamasheen children are twice more likely to be out of school when compared to non-Muhamasheen children. More than half of all Muhamasheen children (58 per cent) between the ages of 6-14 years old studied by SOUL are out of school (see Figure 2.17), compared to 27 per cent of non-Muhamasheen children of that age group.99
The majority of Muhamasheen out-of-school children in that age group have never attended school. Forty-four per cent of children between 6-14 years old never attended school, 14 per cent have attended school at some point, and only 42 per cent are currently enrolled in school.100
Thirty per cent of students had repeated a year, and 30 per cent were frequently or sometimes absent. SOUL notes that 23 per cent of 6-18 year olds surveyed were sick in the month preceding the study. The report conjectures that this is above average and recommends that the increased susceptibility to illness needs to be taken into consideration when discussing Muhamasheen children absenteeism from school.101
It is noteworthy that the dropout rate of Muhamasheen children found by SOUL (see Figure 2.18) is not much different from dropout rates observed in survey data from non-Muhamasheen communities (see Tables 2.5 and Table 2.6). SOUL conjectures that barriers to education faced by Muhamasheen are primarily due to access to education. SOUL argues that once Muhamasheen children are enrolled, their chances of progression are not too dissimilar from non-Muhamasheen students. Hence social and discriminatory barriers facing Muhamasheen children are higher compared to children from non-Muhamasheen communities.
Muhamasheen children tend to dropout in earlier grades when compared to children from non-Muhamasheen communities (compare Figure 2.10 and Figure 2.18). Dropout rates are highest when transitioning to Grades 2, 3 and 4. These are also the grades most often repeated by Muhamasheen students.102 It should be kept in mind that this observation is not based on a substantive sample, and therefore not nationally representative of Muhamasheen. The calculation of dropout rates is based on a sample of only 63 students.
Cumulative dropout rates or the likelihood of completing primary Grades 1-6 or the basic Grades 1-9 are not available from the SOUL study. The Taiz study found that 87 per cent of Muhamasheen children dropout of basic school before reaching ninth grade.103
Profiles of out-of-school Muhamasheen children
Girls are more likely to be out-of-school than boys (see Figure 2.17). This difference is largely due to girls being less likely to attend school in the first place rather than being more likely to dropout of school. Note that this applies to children between ages 6-18 years old.104
Rural children are more likely to be out of school that urban children (see Figure 2.17). This is due to the fact that rural Muhamasheen children are less likely to ever attend school when compared to urban children. Fifty-seven per cent of rural Muhamasheen children never attended school compared to 39 per cent of urban Muhamasheen children. In contrast, dropout rates for rural Muhamasheen children are lower (8 per cent) than those of urban Muhamasheen children (22 per cent). Again these figures are based on a very small sample and caution should be used citing them. In addition, the entire rural sample of the survey is based in Hodeida, while observations from Aden and Sana’a are all urban. Governorate dynamics may hence influence rural vs. urban dynamics.
99 SOUL.100 SOUL.101 SOUL.102 SOUL, p. 43.103 Alhakami.104 SOUL.

Middle East and North Africa Out-of-School Children Initiative52
Though no statistics are available on the direct impact of parental education on school enrolment of Muhamasheen children, focus group discussions led by SOUL gave important insights. Illiteracy among the Muhamasheen in Taiz is close to 90 per cent for women and 50 per cent for men.105 In Muhamasheen households from Hodeida, Aden and Sana’a, 83 per cent of heads of households are illiterate. In focus groups parents acknowledged that their own illiteracy is a barrier to their ability to communicate with schools and support their children’s learning.106
As for the impact of wealth on school attendance, the quantitative evidence is sketchy. In focus group discussions, parents identified economic hardship as a main barrier to children’s schooling. Parents indicated that they felt the main reason for school absence was financial followed by the child being too young. It is noteworthy that they indicated more frequently that children did not want to attend school than parents not wanting them to.107
The economic situation of a household is linked to economic activity108 of children. Sixteen per cent of Muhamasheen children were working, 24 per cent of boys compared to 8 per cent of girls. Working children were less likely to be enrolled (28 per cent) compared to those children who were not working. Dropout rates (39 per cent) and the share of those never attending were also higher (33 per cent) among working Muhamasheen children. Longer working hours were associated with an increased likelihood of being absent from school.109
Children indicated that the main reason for working was their households’ dire financial situations. In focus groups, parents pointed out that the decision to abandon schooling for work was always the children’s. Most working children indicated they contributed to family budget.110
Figure 2.18 Dropout rates of Muhamasheen children by grade
Source: SOUL (2008) Table 33-a p43.
105 Alhakami.106 SOUL.107 SOUL.108 Economic activity includes employment outside the house for cash payment only. This is a more restricted
definition than used in the remainder of this study. However, the reference age group is also older (6-18 years instead of 6-14 years). Among the most frequently cited occupations by children were daily labour (i.e. construction), plastics collector or begging.
109 SOUL.110 SOUL.
25
20
15
10
5
0
Pe
r ce
nt
Grade1 to 2
Grade2 to 3
Grade3 to 4
Grade4 to 5
Grade5 to 6
Grade6 to 7
Grade7 to 8

Yemen Country Report on Out-of-School Children 53
Violence and discrimination toward Muhamasheen children
There are reports that Muhamasheen children are subject to violence and discrimination by teachers and are humiliated and verbally abused by fellow students. Muhamasheen children may be exposed to a greater degree to sexual abuse since these transgressions are not sanctioned to the same degree as if they were carried out against children from outside the Muhamasheen community.111
Steinbeiser states that Muhamasheen children may be prevented from attending Yemeni schools, though in the areas studied by SOUL, Muhamasheen children attended school alongside non-Muhamasheen children.112 Zyck and Alhakami cite anecdotal evidence indicating that Muhamasheen students may be asked to participate in school cleaning due to their perceived role as garbage collectors.113
SOUL focus group discussions with Muhamasheen parents revealed that in Aden non-Muhamasheen parents, whose children attend school with Muhamasheen children, stated that children relate well to one another.114 In contrast, in Sana’a, parents made accusations of Muhamasheen children being violent at school, stealing stationary from other children, forming gangs and intimidating non-Muhamasheen children. A few parents even suggested segregating Muhamasheen from non-Muhamasheen. In fact, it was noted by focus group participants in Sana’a that it was teachers who promoted separating children in the classrooms.115
School authorities in Sana’a, but not in Aden, made similar accusations of Muhamasheen students. However, teachers and support staff state that aggression levels improve in higher grades. One social worker justified the aggressiveness by stating that Muhamasheen children feel intimidated by their discrimination consequently react aggressively and defensively.116
2.6.3 Children with disabilities
Estimates on the disability prevalence in Yemen vary widely across sources. Estimates vary between 0.4 per cent and 12 per cent depending on reports.117 According to the Household Budget Survey in 2005, there are 1.3 million people with disabilities in Yemen, about 6 per cent of the population.118 The National Union of the Disabled states that there are about 2 million physically disabled people in Yemen, approximately 10 per cent of the population.119 An MOE report argues that disability prevalence is estimated to be between 8 and 13 per cent.120
111 Alhakami cited in AYN and IDSN (2013).112 SOUL.113 Ibid, p. 33. Also cited in AYN and IDSN (2013).114 As discussed in footnote 92, the experience of Muhamasheen in the previous South Yemen is different from
those in the previous North Yemen. As a result, they are more integrated in society, are seldom referred to as Muhamasheen, and do not experience discrimination as those in the northern governorates. M.H. Hashem 1995.
115 SOUL.116 SOUL.117 Marian Guest and Ashley Schofield, Consultancy to Support Organisational Development of the Care and
Rehabilitation Fund of the Disabled, and the National Union of Disabled Associations (Oxford, UK: Oxford Policy Management for the Socila Fund for Development, May 2011) <http://www.opml.co.uk/sites/opml/files/Yemen%20SFD.pdf> [accessed 17 November 2013].
118 Asia Abdullah Almashraqi and Ahmed Mahyoub Alwajeeh, Low Enrolment Rate among Children with Disabilities; the Underlying Reasons Why Most of Them Are out-of-School and Dropout in Yemen. (Sana’a, Yemen: Ministry of Education, Republic of Yemen, 2013), p. 8.
119 Guest and Schofield cite 2004 census.120 Almashraqi and Alwajeeh, p. 8.
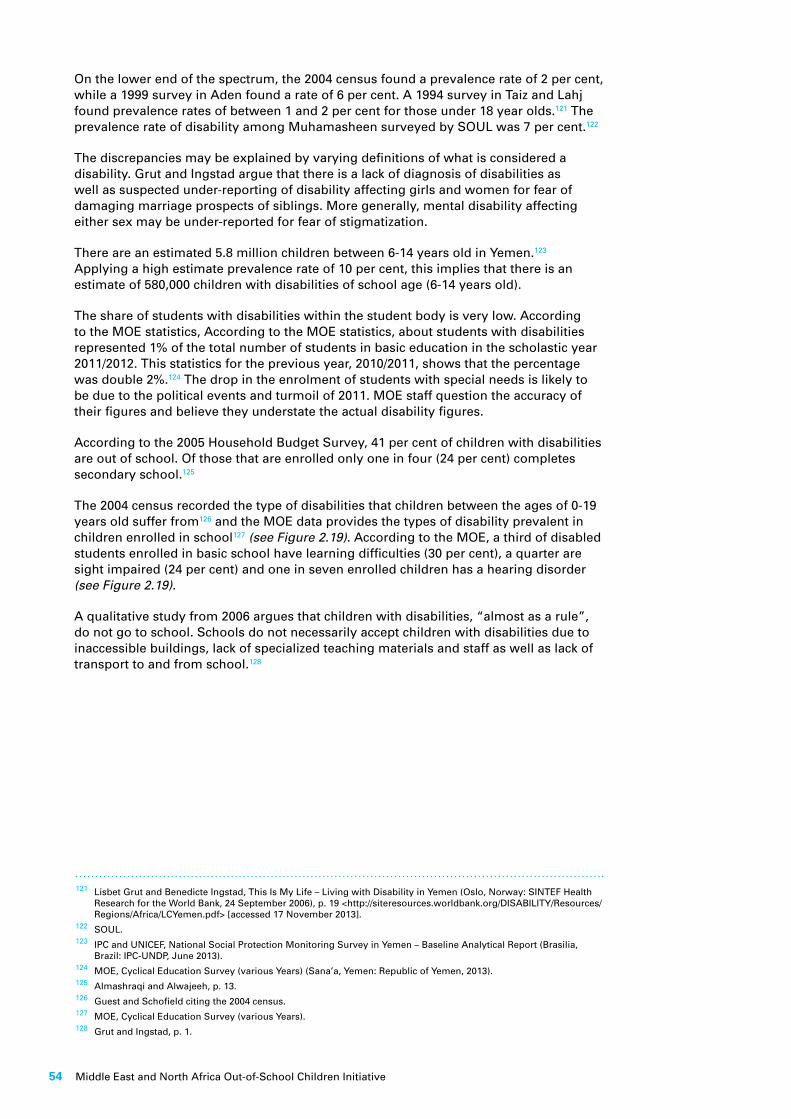
Middle East and North Africa Out-of-School Children Initiative54
On the lower end of the spectrum, the 2004 census found a prevalence rate of 2 per cent, while a 1999 survey in Aden found a rate of 6 per cent. A 1994 survey in Taiz and Lahj found prevalence rates of between 1 and 2 per cent for those under 18 year olds.121 The prevalence rate of disability among Muhamasheen surveyed by SOUL was 7 per cent.122
The discrepancies may be explained by varying definitions of what is considered a disability. Grut and Ingstad argue that there is a lack of diagnosis of disabilities as well as suspected under-reporting of disability affecting girls and women for fear of damaging marriage prospects of siblings. More generally, mental disability affecting either sex may be under-reported for fear of stigmatization.
There are an estimated 5.8 million children between 6-14 years old in Yemen.123 Applying a high estimate prevalence rate of 10 per cent, this implies that there is an estimate of 580,000 children with disabilities of school age (6-14 years old).
The share of students with disabilities within the student body is very low. According to the MOE statistics, According to the MOE statistics, about students with disabilities represented 1% of the total number of students in basic education in the scholastic year 2011/2012. This statistics for the previous year, 2010/2011, shows that the percentage was double 2%.124 The drop in the enrolment of students with special needs is likely to be due to the political events and turmoil of 2011. MOE staff question the accuracy of their figures and believe they understate the actual disability figures.
According to the 2005 Household Budget Survey, 41 per cent of children with disabilities are out of school. Of those that are enrolled only one in four (24 per cent) completes secondary school.125
The 2004 census recorded the type of disabilities that children between the ages of 0-19 years old suffer from126 and the MOE data provides the types of disability prevalent in children enrolled in school127 (see Figure 2.19). According to the MOE, a third of disabled students enrolled in basic school have learning difficulties (30 per cent), a quarter are sight impaired (24 per cent) and one in seven enrolled children has a hearing disorder (see Figure 2.19).
A qualitative study from 2006 argues that children with disabilities, “almost as a rule”, do not go to school. Schools do not necessarily accept children with disabilities due to inaccessible buildings, lack of specialized teaching materials and staff as well as lack of transport to and from school.128
121 Lisbet Grut and Benedicte Ingstad, This Is My Life – Living with Disability in Yemen (Oslo, Norway: SINTEF Health Research for the World Bank, 24 September 2006), p. 19 <http://siteresources.worldbank.org/DISABILITY/Resources/Regions/Africa/LCYemen.pdf> [accessed 17 November 2013].
122 SOUL.123 IPC and UNICEF, National Social Protection Monitoring Survey in Yemen – Baseline Analytical Report (Brasilia,
Brazil: IPC-UNDP, June 2013).124 MOE, Cyclical Education Survey (various Years) (Sana’a, Yemen: Republic of Yemen, 2013).125 Almashraqi and Alwajeeh, p. 13.126 Guest and Schofield citing the 2004 census.127 MOE, Cyclical Education Survey (various Years).128 Grut and Ingstad, p. 1.
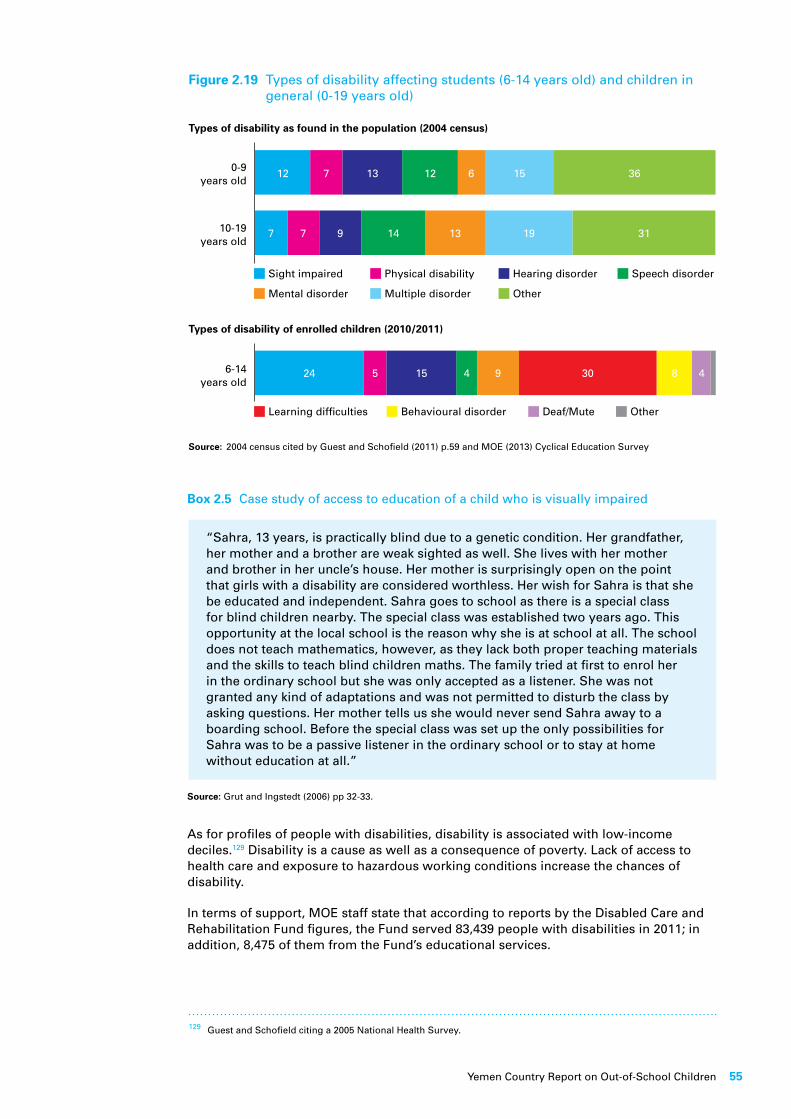
Yemen Country Report on Out-of-School Children 55
Box 2.5 Case study of access to education of a child who is visually impaired
“Sahra, 13 years, is practically blind due to a genetic condition. Her grandfather, her mother and a brother are weak sighted as well. She lives with her mother and brother in her uncle’s house. Her mother is surprisingly open on the point that girls with a disability are considered worthless. Her wish for Sahra is that she be educated and independent. Sahra goes to school as there is a special class for blind children nearby. The special class was established two years ago. This opportunity at the local school is the reason why she is at school at all. The school does not teach mathematics, however, as they lack both proper teaching materials and the skills to teach blind children maths. The family tried at first to enrol her in the ordinary school but she was only accepted as a listener. She was not granted any kind of adaptations and was not permitted to disturb the class by asking questions. Her mother tells us she would never send Sahra away to a boarding school. Before the special class was set up the only possibilities for Sahra was to be a passive listener in the ordinary school or to stay at home without education at all.”
Source: Grut and Ingstedt (2006) pp 32-33.
As for profiles of people with disabilities, disability is associated with low-income deciles.129 Disability is a cause as well as a consequence of poverty. Lack of access to health care and exposure to hazardous working conditions increase the chances of disability.
In terms of support, MOE staff state that according to reports by the Disabled Care and Rehabilitation Fund figures, the Fund served 83,439 people with disabilities in 2011; in addition, 8,475 of them from the Fund’s educational services.
Figure 2.19 Types of disability affecting students (6-14 years old) and children in general (0-19 years old)
Source: 2004 census cited by Guest and Schofield (2011) p.59 and MOE (2013) Cyclical Education Survey
129 Guest and Schofield citing a 2005 National Health Survey.
Learning difficulties Behavioural disorder Deaf/Mute Other
6-14years old
Types of disability of enrolled children (2010/2011)
24 5 15 4 9 8 430
Sight impaired
Mental disorder
Physical disability
Multiple disorder
Hearing disorder
Other
Speech disorder
0-9 years old
10-19years old
Types of disability as found in the population (2004 census)
7 7 9 14 13 19 31
12 7 13 12 6 15 36


Yemen Country Report on Out-of-School Children 57
3To better understand why children are out of school and how they can be re-enrolled in school, the focus of this chapter is twofold: first, to identify bottlenecks that cause children to be excluded from schooling;130 and second, to examine the policies that have been instituted to tackle these bottlenecks and transform the process of exclusion to one of inclusion. Emphasis will be on profiles of children in Dimensions 2 and 3 as they are the most relevant to Yemen, include the largest populations of out-of-school children, and exemplify the major bottlenecks and policies experienced by children deprived of schooling.
As the CMF suggests that the bottlenecks should be country specific, we modified the CMF to fit the specific conditions of Yemen. For example, after identifying the characteristics of out-of-school children based on the Five Dimensions of Exclusion Model (Chapter 2), we carried out an in-depth study of the characteristics of out-of-school children as to determine the underlying barriers associated with each of the characteristics. This analysis comprised findings from the quantitative data analysis of the out-of-school profiles, qualitative studies, interviews with relevant stakeholders, and information and observations collected from relevant workshops. The bottlenecks were then categorized under the issues of enabling environment, supply-side, demand-side and quality. This includes modifying UNICEF’s determinant framework to make it country specific.
3.1 Dimension 1: Bottlenecks and policies/strategies
The analysis of profiles of out-of-school children in the Five Dimensions of Exclusion Model identified relevant characteristics, which include age, gender, geographic location, wealth quintile, and maternal education.131 These characteristics are not new and have been identified as affecting children’s schooling for decades in Yemen. The MOE has been trying to overcome their impact for some time with modest success. These characteristics, however, are not sufficient to explain the bottlenecks causing children’s exclusion from school. For instance, it is not because a child is a girl that she is excluded from attending school. Rather, it is because the underlying causes associated with being a girl set in motion bottlenecks causing her exclusion from school.132 These bottlenecks are embedded and interconnected in socio-cultural, economic and political norms. An in-depth look at these characteristics highlights the bottlenecks associated with each of the characteristics.
Bottlenecks and policies/strategies
130 Please note that the term “bottleneck” is used in accordance to the CMF of the Global Initiative on OOSC. Emphasis is in explaining the overall barriers OOSC encounter in access to education.
131 Families whose per capita consumption is below the poverty line are classified as poor. World Bank & MOPIC. pg. 40.132 UNICEF and UNESCO Institute for Statistics. MENA Istanbul OOSC Initiative Workshop 27-31 May 2013.
Middle East and North Africa Out-of-School Children Initiative58
3.1.1 Dimension 1 Bottlenecks: Pre-school education
Children in pre-school, as mentioned earlier, are not in school as opposed to being out of school. Kindergartens have not been part of the education system until recently and there is still low community awareness as well as facilities, particularly in rural areas. Most kindergartens (66.2 per cent) are privately operated and concentrated in urban areas. Only 1 per cent of children between the ages of 5-6 years are in kindergartens.133 The remaining children in this age group are either poor or live in areas where there are no kindergartens. The CSO data for 2009-2010 shows that the highest concentrations of pre-school centres are in Sana’a city (240), followed by Taiz governorate (93). Governorates that do not have any pre-school centres include Al-Dhale, Al-Jawf, Al-Mahweet, Amran, Mareb, Raymah and Sa’ada.134
Abundant research confirms the positive impact of early childhood development (ECD), such as improved cognitive development and school achievement, less repetition and dropout, improved nutrition and health, reduced social inequality and long-term economic and social gains.135 It is particularly important, therefore, that children from poorer households and with uneducated parents make up for their disadvantages by putting their children in a stronger position to enter basic education. Yet, kindergartens are non-existent in rural areas and parents are unaware of the importance of early childhood education, so there has been little demand for this level. Moreover, as most kindergartens are privately operated and located in urban areas, enrolment rates even in these kindergartens are low due to the inability of most families in urban areas to pay for this education, especially when it is not a high priority. Hence, kindergartens are more accessible to children from more affluent families.136
In addition, the quality of education in private kindergartens is questionable. Some of these are located in private homes, and there is no standard curriculum, or monitoring and evaluation of the quality of services. More important, there is no certification for teachers, most who are either former basic education teachers or women who are jobless and are available for such employment.137
In 1992, the Government of Yemen adopted Education Law No. 45 in recognition of pre-school education as an integral component of the national education system. Subsequently, the government established the Higher Council for Motherhood and Childhood (HCMC) by republican decree No. 53. The HCMC represents a unique governmental coordinating body for all ministries, and governmental and non-governmental organizations and institutions. Its responsibilities include coordinating the drawing up of policies, legislation and strategies to ensure the prosperity of childhood and motherhood in Yemen.138
The Government of Yemen has only taken modest steps to implement this law. This is due to the MOE’s weak institutional capacity and strained financial and human resources, which reflect some of the supply-side constraints restricting the expansion of kindergartens in the country. In addition, the MOE’s preoccupation with basic education has caused it to focus on increasing enrolment rates there. This focus on basic education has also aligned with donor strategies and programmes.
As a result, what causes children in this profile not to attend kindergarten is both supply-side and demand-side bottlenecks, which include lack of accessibility to kindergartens and lack of parental awareness of the importance of kindergarten education.
133 Although the profile of out-of-school children in Dimension 1 includes 5 year-old children not in pre-school the data showed that there were 6 year-old children attending pre-school.
134 Ibid.135 International Bank of Reconstruction and Development, The World Bank and the Republic of Yemen. Republic of
Yemen Education Status Report: Challenges and Opportunities. June 2010. Pgs. 38-39.136 UNICEF. Situation Analysis of Children in Yemen. (2014). pg. 183.137 World Bank, et. al. al, (2012). Pgs. 115-116.138 The Presidency of Council of Ministries, UNICEF, ECD Resource Center. The National Strategy for Early Childhood
Development 2012-2016. 2011.

Yemen Country Report on Out-of-School Children 59
With significant numbers of children under the age of 6 years who are mostly poor and many suffering from malnutrition and stunting, early childhood education is an important component to ensure these children will enter first grade.
3.1.2 Dimension 1: Policies/Strategies
In the last few years, the Government of Yemen has been giving pre-school education more attention. For instance, from 2005 to 2012, kindergartens in Yemen increased from 358 to 591, and as a result the number of children who were enrolled doubled to 42,422. Similarly, the number of pre-school teachers also increased by 50 per cent to 2,242. This brought the child/teacher ratio from 15 to 19 children per teacher.139 This finding may suggest a growing demand for kindergartens in urban areas.
Another effort is being mounted by the newly adopted National Early Childhood Development Strategy (2012-2016), which gives more focus to pre-school education and considers the different needs of children from birth to 8years old. This strategy is the first of its kind because it applies a holistic integrative approach (HIA), which is a recent worldwide trend in early childhood development (ECD).140 The term ‘integrative’ is used to describe the process of creating a network of services that work together.141 This includes creating a synergy of people and resources drawn from various sectors related to early childhood development such as health, nutrition, education and other services. It is particularly effective for poor children as it addresses all children’s basic needs, such as food, protection and health care in addition to affection, intellectual stimulation, supportive human interaction and opportunities and activities that promote learning.142 Hence, the paradigm shifts from a family’s exclusive responsibility to a shared responsibility with a greater state role in providing for a wider age range of factors and focusing on the whole development of the child.
The Yemeni HIA implementers are multi-sectoral, representing the MOE, Ministry of Health, Ministry of Social Affairs and Labour (MOSAL), Ministry of Human Rights (MOHR), Ministry of Public Health and Population (MOPH), the Parliament, HCMC, and other related sectors such as cultural, media, guidance and endowment, and non-governmental agencies and organizations.
Current programmes and activities of the MOE, BEDP2 and the SFD include support for the expansion of pre-school education. The MTRF includes a detailed strategy for ECD.143 The Global Partnership in Education (GPE) also includes a subcomponent to provide support to ECD through the following deliverables:144
l provide and equip 200 early childhood development (ECD) classes in targeted governorates with supplies and learning materials;
l improve teachers’ skills to enable them to impart knowledge and skills in a child-centred manner;
l support advocacy and awareness-raising of communities on the value of early child education; and,
l train pre-school heads and teachers on inclusive learning approaches
139 UNICEF. pg. 104.104 Presidency of Council of Ministries, et. al.141 http://unesdoc.unesco.org/images/0012/001279/127983e.pdf142 Ibid. pg. 29.143 Yemen Education Sector Plan. Mid Term Results Framework 2013-2015. A Document of Yemen Ministry of Education.
Draft, October 2103.144 Ibid.
Middle East and North Africa Out-of-School Children Initiative60
This strategy is complemented by the MOE gradually increasing the budget for ECD education. For example, in 2011 its budget for ECD was $6.6 million. It is set to increase to $9.4 million in 2013 and to $12.7 million by 2015.145
In spite of these positive steps there are many challenges, including:146
l insufficient resources and financial support allocated for ECD programmes, which include foreign funds that are not continuous or guaranteed;
l lack of qualified administrators working in ECD due to the lack of training and qualifying programmes;
l high fertility rates;
l weak monitoring and evaluation systems for the ECD programmes;
l lack of awareness of the importance of ECD at the community and institutional ministerial levels;
l inadequate infrastructure that has a negative impact on ECD in general;
l difficult natural terrain and dispersed populations of Yemen; and
l lack of security in many areas.
3.2 Dimensions 2 and 3: Bottlenecks
The characteristics of out-of-school profiles in Dimensions 2 and 3 are similar; therefore, they are discussed jointly to avoid repetition. Out-of-school children in Dimensions 2 and 3 are analysed in terms of the following characteristics: age, gender, geographic location (urban-rural) and wealth quintile.147 These variables are not mutually exclusive. For example, the older a girl is in a rural area, if she comes from a poor family and has an uneducated mother, the lower her chances are of enrolling in school or completing nine years of basic education. A similar situation exists for boys coming from the same background: the older he becomes, the more his work potential is of value to the family and the less likely it is that he will be attending school. An in-depth look at each of these characteristics highlights why these children are out of school.
Age
The impact of age on a child’s schooling differs according to the various roles they are expected to play in the family and community at different developmental stages. In the cohort of children ages 6 to 11 years old, those most likely to be out of school are 6 years of age (67 per cent). The number decreases as their age increases up until the age of 11 years old, when the trend reverses. The impact of age on school participation also differs between urban and rural children. The analysis shows only 18 per cent of urban children (ages 6 to 11) are out of school compared to 34 per cent of rural children.
The high number of out-of-school children at the age of six results from the common practice of beginning school at age seven or older in both urban and rural areas. There are two opposing explanations for this late entry of urban children. One is that it is due to overcrowded classrooms that cause some parents not to send their children at a young age when the experience may be overwhelming for them, and, therefore, they hold them back a year. The other explanation is that schools are turning away children whose parents want to enrol them at age 6 because school administrators want to limit class size. Although by law entry level to first grade is 6 years old, school principals have the discretion to hold back children until they are 7 years old. The MOE is aware of this practice, yet, has not made any effort to prohibit this practice. A MOE official
145 UNICEF 2013. pg 104.146 The Presidency of Council of Ministries, UNICEF, ECD Resource Center.147 Child labour, which is also a characteristic, has been discussed in Chapter 2.

Yemen Country Report on Out-of-School Children 61
explained that due to their successful education campaigns there has been a significant increase in student enrolment at age 6 in basic education, especially in urban centres, and the demand now exceeds the supply.
Another important issue explaining this high demand is the high population growth rate estimated at 3 per cent in the 2004 population census. This means that approximately 640,000 children 6 years of age are ready to begin school each year.148 The country’s high population growth rate has a critical effect on the government’s capacity to meet demands in all the social sectors, especially education. For example, the MOE’s fragile institutional capacity, which includes the problems of poor governance and fiscal management, weak decentralized functions and low technical capacity, chronically challenges its capacity to absorb these extra children. Furthermore, this situation is compounded by the decrease in public education expenditure due to the shifting budget allocations to defence and internal security, which costs the country a high percentage of its GDP every year.149 Public expenditure on education has dropped from 21 per cent in 2002 to 14 per cent in 2007.150 Since it is difficult to predict how long it may take to restore security and political stability to the country, the MOE will continue to be constrained in its ability to absorb this large demand for schooling at entry level. This situation accentuates supply-side bottlenecks.
Age is also a major predictor of boys and girls being out of school in the lower secondary grades and upward. As children reach sixth grade (12 years old), there is a gradual reverse trend in enrolment. Once boys and girls reach adolescence, parents are more likely to demand sex-segregated schools, classrooms and teachers. These demands are difficult for the MOE to meet. In addition, at this age, both parents’ and children’s perceptions and priorities concerning education change. As children become older their attitudes towards education become a factor in the decision-making process regarding schooling. This is an important issue that is often overlooked in analysing factors that affect out-of-school children (Maas 2012).151 In a study on children’s attitudes towards school enrolment at lower secondary school, Maas found that children have a say regarding their school attendance.152 Furthermore, out-of-school children who had some years of schooling did not consider themselves as dropouts, rather that they had themselves decided to “stop” going to school.153 In many cases, both parents and children did not consider schooling a high priority.154
Furthermore, the political crisis, especially in areas of conflict, has led many parents to withdraw younger children from school and keep them home for safety. At the start of the academic year 2011-2012, more than 150 schools were occupied by either armed forces (34 schools in Sana’a) or internally displaced persons (76 schools in Aden and 43 school in Abyan). Other schools were inaccessible or closed due to conflict-based security concerns, affecting 100,000 children.155 Regarding older children, the United Nations has documented 84 cases of recruitment of boys into armed forces and armed groups between the ages of 10-17 years old.156 There are also reports of a number of child casualties related to mines, unexploded ordnance and explosive remnants of war.157
148 UNICEF. Accelerating Girls’ Education in Yemen: Rethinking Policies in Teacher Recruitment and School Distribution. 2007. pg. 8.
149 Ibid. pg. 9.150 World Bank 2010. pg 34.151 The impact of school distance will further be discussed under the independent variable rural areas.152 Lucienne Maas. A Time To Enrol, A time To Stop… Policies, Perceptions and Practices Influencing the Right to Basic
Education in Yemen. Doctorate dissertation, 2012.153 Ibid. pgs. 67-70. 154 Ibid.155 UNICEF (2013). pgs. 166-167. 156 World Bank, UN, European Union, Islamic Development Bank, Yemen Ministry of Planning and International
Cooperation. Joint Social Economic Assessment for the Republic of Yemen. 2012. pg. 118.157 http://reliefweb.int/report/yemen/report-secretary-general-children-and-armed-conflict-yemen-s2013383

Middle East and North Africa Out-of-School Children Initiative62
Gender
As the data on school enrolment indicates, there is parity between boys’ and girls’ enrolments at the primary level in both urban and rural areas. In lower secondary grades, however, gender disparity becomes more apparent since more girls than boys begin leaving school from Grade 6. These rates continue to increase with age. For example, in lower secondary school 19 per cent of 12 year olds are out of school, by age 14 this increases to 26 per cent.158
Socio-cultural beliefs and practices significantly affect children’s attendance to school, in particular girls from rural poor families. Traditional beliefs and practices hold that girls at an adolescent age must perform family duties, which range from contributing to household chores, especially fetching water, to preparing for early marriage. Many studies have shown that fetching water is a major impediment to girls’ education.159 Due to the country’s inadequate infrastructure, only 44 per cent of the rural population (2008) have access to safe drinking water.160 Fetching water is the responsibility of women and girls. This is just one more example of how infrastructural deficits create barriers for children’s schooling.
Early marriage is another socio-cultural practice that deprives girls of education. Studies have found that one of the primary causes for girls’ to be out of school is early marriage.161 Fourteen per cent of Yemeni girls are married before age 15, and 32 per cent are married before the age of 18.162 This is reflected in the profiles of out-of-school children in Dimensions 2 and 3, which show girls’ enrolment beginning to drop at the age of 12 years old and continuing to increase as they grow older. While some never enrol in school, others leave school before they are able to read and write.163 Because early marriage appears to affect girls’ education and has multiple effects, we will elaborate this issue further.
Early marriage is a precursor to an amalgamation of negative socio-economic effects that spills over to the next generation. Demographic and fertility studies have shown that early marriage leads to early pregnancies and multiple miscarriages.164 In addition, stunting of the children of adolescent girls is often correlated with early marriage. On the other hand, the number of years a girl attends school is directly linked to the postponement of marriage, which increases the likelihood that she begins child bearing at a later age when she has a better chance of surviving pregnancy and being able to better care for her children.165 Moreover, girls who continue their education are more likely to be in a better position to understand their own reproductive health needs and the nutritional and educational needs of their children, and want to invest in their children’s education.166
Social norms are not the only dominant cause of early marriage; poverty is also a catalyst in sustaining this practice. The deepening sense of financial insecurity as a consequence of unemployment, rising food, water and fuel prices drives families to engage in this practice, which can decrease the size of the family. The Joint Social and Economic Assessment of Yemen (2012) found that political conflict has exacerbated this practice among displaced families living in poverty.167 One third of internally displaced
158 This is a 7 point increase that falls within the confidence interval; therefore, one cannot be sure if it reflects reality.159 UN Secretary General Global Initiative on Education. Accelerating Progress to 2015 Yemen. Working Paper April
2013. pg. 8.160 The Presidency of Council of Ministries. pg. 19.161 Human Rights Watch. How Come You allow Girls to Get Married? December 8, 2011.162 Ministry of Health and Population and UNICEF. Yemen Multiple Indicator Cluster Survey 2006, Final Report.
2008. pg. 56.163 Ibid.164 UNICEF. Innocenti Digest. Early Marriage, Child Spouses. http://www.unicef-ipcI.org/pubications/p.16.165 Ibid. pg. 37.166 Ibid. 167 World Bank, MOIPC, et al (2012). pg 66.

Yemen Country Report on Out-of-School Children 63
children’s caregivers revealed their willingness to allow their under-age girls to marry for various reasons ranging from the strong incentive to reduce the family household size to lessen their financial burden, to feelings of obligation toward host families who are rewarded by marriage of their girls.168
Socio-cultural norms also influence what parents demand from the education sector, such as insisting that there are nearby safe schools, female teachers, segregated schools, girls’ lavatories and wall barriers. The adverse combination of bottlenecks embedded in the enabling environment as well as supply-side and demand-side variables reinforce the processes of exclusion affecting children. Consequently, as it is beyond the government’s capacity to respond to these demands swiftly and parents remain adamant about their rejection of co-education, girls are caught between the priorities of those at both the national and household levels.
Wealth quintiles and poverty
Widespread poverty in the country creates a complicated web of issues involving the economy, and the social and political situation. Together these issues combine to exclude vulnerable children from school. Yemen’s out-of-school children are part of the reflection of the state of the country.
According to the profiles of out-of-school children, the majority of children are poor (66 per cent), of which 56 per cent are between the ages of 6-11 years old and 41 per cent are between the ages of 12-14 years old, and predominantly reside in rural areas. The stagnant economy severely impacts children. For example, 29 per cent of families live on less than 2 dollars a day.169 This implies that 34.8 per cent live under the poverty line and about 17.6 per cent under the nutritional poverty line; most of these poor families (65 per cent) live in rural areas.170 Poverty among poor children, especially younger ones, is estimated at 46 per cent compared to poverty among adults, which is estimated at 38 per cent.171
Severe poverty translates into poor health and nutrition of young children. Global data shows that Yemen has the second highest rate of moderately and severely underweight children in the world, at 43 per cent of children under the age of 5 years severely underweight.172 This translates into one in five young children in Yemen being severely underweight. Acute child malnutrition increased from 12.9 per cent in 1997 to 15.7 per cent in 2010, while chronic child malnutrition has increased from 51.7 per cent in 1997 to 57.9 per cent in 2010.173 Furthermore, 25 per cent of Yemeni females aged 16 to 59 years old were found to be acutely malnourished. Sixteen per cent of child deaths are due to diarrhoea.174 Safe water and sanitation is another challenge. In 2008, only 44 per cent of the rural population had access to safe drinking water.175
Stunting, which is a consequence of malnutrition, is also prevalent and of special concern as it is irreversible if left unattended in the first two years of life, and has adverse consequences for children’s growth and development. Children who are stunted are more likely to dropout of school early and suffer from chronic diseases.176 The prevalence of stunting is a product of poor nutrition that can be traced to the foetal stage and is strongly associated with a mother’s early age at pregnancy.177
168 Ibid.169 The Presidency of Council of Ministries, UNICEF, ECD Resource Center 2013. pg 16.170 Ibid.171 Ibid.172 Timor-Leste has a rate of 45%. Cited from UNICEF. 2013. pg 88.173 World Bank, UN, EU, Islamic Development Bank and Ministry of Planning an International Cooperation. Joint Social
and Economic Assessment for the Republic of Yemen. 2012. pg. 79.174 Ibid. pg 80.175 The Presidency of Council of Ministries. pg. 19.176 UNICEF (2013). pg. 99. 177 Ibid. pg. 91.
Middle East and North Africa Out-of-School Children Initiative64
Health and sanitation challenges not only affect student enrolment but also affect retention, achievement and children’s attention span and psychological well-being.
Poverty also marginalizes the economic benefits of children’s education, and makes parents of poor families see children’s education and its related costs as producing low returns. With the high unemployment rate, parents are increasingly depending on their children to work either domestically or in income-generating activities. Profiles of out-of-school children indicate that out of the 1.6 million children in Yemen who are out of school, one in five are engaged in child labour. Boys in particular are withdrawn from school to find work. As the out-of-school profile data shows, boys are ten times more likely to be engaged in paid work (24 per cent) than girls (2 per cent).
Economic constraints have a greater impact on boys’ retention. This may explain why boys’ enrolment for ages –14 years old has not increased in the last few years as expected. For example, the number of boys enrolled in basic education in 2007-2008 was at the same level as it was five years earlier. This levelling off was due mainly to deteriorating retention rates. The number of boys enrolling in secondary schools in 2007-2008 was lower than five years earlier (367,000 in 2007-2008 compared to 386,000 in 2002-2003).178 This is a serious phenomenon that needs immediate attention and should be monitored, especially as increasing girls’ enrolment has been almost the entire focus of policies and programmes.
The current economic crisis has exacerbated the economic hardships of children that are already marginalized, such as the Muhamasheen, children with disabilities, and internally displaced children from areas of conflict.179 Many of these children are visible in the streets of Sana’a peddling, washing car windows or begging. These are tasks, which expose children to abuse, hazards and risks.180
Another deterrent affecting the participation of out-of-school children is the cost of education. Although the MOE has tried to alleviate the cost of education by making education free for girls from Grades 1-6 and for boys from Grade 1-3, resource-strapped schools demand that parents pay operating costs. An example from one school includes 300 Yemeni Riyal (YR) in registration fees, 50 YR for exam fees, 150 YR for certificate fees at the end of the year, 250 YR for seating number fees, 50 YR for cleaning materials and 100 YR for absenteeism fees.181 In addition to these expenses, families have to buy school supplies for their children. As a result, although the abolition of school fees was a positive MOE policy, poor families continue to need to cover costs that are beyond their financial means, especially when they have several school-age children.
Ensuring equity in the educational system will remain a challenge as long as there is unequal access to education based on economic and social inequalities.
Geographic residence: Urban/rural disparities
Rural children more than urban children are likely to be deprived of an education or have their education cut short. Eighty-seven per cent of out-of-school children are in rural areas and half are in the governorates of Hodeida and Hajja. The disparity in education is most apparent in the lower secondary grades. Twenty-four per cent of rural children between the ages of 12-14 years old are out of school compared to 9 per cent of children in this age group in urban areas.
Factors causing impediments to education in rural areas include supply and demand-side bottlenecks pertaining to the weak infrastructure such as lack of roads, lack of nearby schools and socio-cultural norms. The more remote a village is the less likely it
178 Ibid. pg. 37.179 These groups were discussed in Chapter 2.180 These groups of OOSC have previously been discussed in Chapter 2. 181 These expenses are an example from one school; expenses differ from one school to another. UNICEF. Situation
Analysis (2014). pg 188.

Yemen Country Report on Out-of-School Children 65
is that children and their families living there will be provided basic services including paved roads, safe drinking water, health services and employment. The country’s difficult terrain with citizens dispersed among remote villages is the foremost challenge in the government’s efforts to provide development benefits to all citizens.
During the periods from 2002-2003 and 2010-2011 the number of schools increased in urban areas from 898 to 2,426 and in rural areas from 10,293 to 16,439.182 Although the MOE is continually making efforts to expand the number of schools in rural areas around the country, many of these schools lack qualified teachers, have inadequate classroom furniture and insufficient instructional resources.
Twenty-eight per cent of out-of-school children reported that they were not in school because they did not have access to a school.183 In many rural schools the highest grade offered is Grade 6; thus affecting school enrolment beyond this grade for both boys and girls. In 2007-2008, over half (57 per cent) of basic education schools only offered schooling only through Grade 6. Of these schools, 60 per cent were located in rural areas.184
The distance from home to school in rural areas also plays an important role in relation to both enrolment and retention.185 Parents are less likely to send their younger children to school if they need to walk a long distance, which often includes difficult terrain without appropriate shoes or clothing, and harsh temperatures. Therefore, parents opt to wait until the child is old enough and strong enough to endure this journey.
Socio-cultural beliefs and practices, which are more strongly observed in rural areas than in urban ones, also play a role. This is evident in rural areas when parents insist on having a sex-segregated school. In the MOE’s effort to accommodate this requirement, especially to ensure girls’ retention, the schools may function in double shifts, mornings for boys, afternoons for girls. An additional challenge becomes finding qualified teachers, males and females, to staff these village schools. To increase girls’ enrolment, the MOE has tried to recruit female teachers from larger villages.186 However, this has proved difficult since traditional cultural norms do not allow a female teacher to live in another village except if accompanied by an adult male (e.g. husband or brother). Situations where this scheme has been successful are limited. In villages where teachers, male or female, have been recruited from other villages, they are frequently absent because of difficulty in commuting. Teacher absenteeism has become a national issue in the education system.187
Poor rural girls are most vulnerable to being excluded from schooling for several reasons; the school is more likely to be too far from their homes, does not have female teachers, does not have a latrine and water, or boundary walls, and because many teachers use corporal punishment.188 Girls begin to leave school by Grade 6 and dropout increases significantly in the higher grades. In many cases this is due to the absence of a secondary school in their village at a time when family perspectives on girls’ education may not see a reason for girls to continue. Boys often can walk to the next village where a secondary school exists, but parents find this daily commute unsafe for
182 Ibrahim Al-Houthy, Insaf Abdu Qasim, Hamoud Al-Sayani. Out-of-School Children in Yemen: Policies and Strategies. Paper prepared for out-of-school children country study workshop. Yemen. November 2013. pg. 7.
183 UN Secretary General (2013). pg. 9.184 Ibid.185 UNICEF (2007). pg. 12.186 UNICEF (2007). pgs. 14-15.187 Mohamed H. Al-Mekhlafy. Teacher Absence and the Implementation of Official MOE Time Table. GIZ. 2013. Teacher
Absenteeism will be discussed further in section 3.2.2 Quality: Bottlenecks and Policies/Strategies.188 The small data set of about 200 schools collected by the Baseline survey found that sanitary facilities in schools
are scarce. Only one third of the surveyed schools had water available (33 per cent) and more than half of the interviewed schools (52 per cent) indicated that the water source in use is not enough for the entire school. Hence, there are severe shortcomings in water availability at schools. As for girls’ toilets, only one in four surveyed schools (26 per cent) have girls’ toilets and more than half of them (56 per cent) are not physically separate from boys’ toilets. It is frequently hypothesized that the availability of girls’ toilets is associated with girls’ school enrolment; however, no such association could be found in the Baseline Survey. UNICEF, Baseline Survey Report (Sana’a, Yemen, 2013). pg. 27.

Middle East and North Africa Out-of-School Children Initiative66
their daughters.189 Although there is no available data to track enrolment rate to school distance, this issue becomes more evident in relation to girls’ dropping out of school as they grow older.
Another phenomenon regarding out-of-school children in rural areas is that enrolment rates vary significantly across governorates, particularly among girls. This may confirm that poverty, as indicated in the multivariate analysis, plays an important role in explaining these differences. For example, the governorates of Hajja and Hodeida, which are two of the poorest governorates, have the highest share of out-0f-school children (49 per cent and 33 per cent, respectively), in comparison to Sana’a city (8 per cent).
However, the expansion of schools in rural areas exemplifies the MOE’s on-going effort to increase student enrolments. Unfortunately these increases come at the cost of providing quality education. Quality education is particularly compromised in rural areas. For example, only 40 per cent of teachers have a bachelor degree and children often receive their textbooks close to the end of the school year. The outcome of poor quality education was demonstrated in the Trends in Mathematics and Science Study (TIMSS) in 2007, whereby Yemeni students in Grade 4 ranked the lowest among 36 countries predominantly because they could not read the narrative-based test questions.190
In conclusion, while demand-side factors account for a large proportion of reasons for out-of-school children in urban areas, supply-side factors are more important reasons for out-of-school children in rural areas.
3.2.1 Linkages between out-of-school children profiles and bottlenecks
As discussed in the previous sections, it is clear that there are four main types of bottlenecks responsible for children being out-of-school: the enabling environment, supply-side bottlenecks, demand-side bottlenecks and quality issues. The relationship between the causes of exclusion and various characteristics of out-of-school children demonstrates a dependent relationship of the bottlenecks on the profiles of out-of-children (see Table 3.1).
Enabling environment
Factors related to exclusion in the enabling environment include access to adequate facilities; legislation/policy; and timing and continuity of use.191 Although these are considered generally relevant in identifying bottlenecks affecting out-of-school children, in the case of Yemen, they do not give a complete picture of the problem. The CMF study found additional factors that are more country-specific and affect the enabling environment for education in Yemen at national, household and school levels. Additional factors of exclusion in Yemen are a product of the country’s social norms, such as poor human development, and the economic and political context. These factors are not mutually exclusive but overlap and are interrelated.
The following describes determinants in the enabling environment of Yemen as they relate to education:
l Health: Poor health status of children, as indicated by global studies, affects student attention and performance, which can lead to failing grades, grade repetition and/or dropout. As explained, malnutrition and stunting, for example, are found in almost half the population of children in the country. Many of these health issues such as stunting begin at the prenatal phase and are often associated with early marriage.
189 UNICEF (2007). pg. 12.190 World Bank, et al. 2012. pg. 116.191 These categories are extrapolated from UNICEF’s Determinant Framework.

Yemen Country Report on Out-of-School Children 67
l Social norms: Traditional and cultural beliefs and attitudes continue to influence people’s attitudes and decisions especially in rural areas. For example, children’s, especially girls’, education may be cut short as they reach adolescence and are expected to take on roles consistent with their family responsibilities, such as household chores and preparing for and entering early marriage. Lack of awareness of alternatives reinforces social norms including parents’ acceptance of children deciding to leave school. Attitudes and decisions may not be based on potential long-term economic and social benefits of education but on more immediate short-term economic, cultural and traditional practices in daily life. Early marriage of girls and child labour are both examples of this.
l The economy: Poverty is a major cause of children being excluded from schooling. The country’s current economic crisis and high rate of unemployment has exacerbated the problems of this already impoverished country. In making decisions about continuing education, caregivers regard the related expenses of their children’s education a burden with low-returns and consequently of low priority.
l Political crisis: The current political situation has had a detrimental impact on education by causing more than 300,000 children to be out of school, destroying buildings and keeping teachers away from school. As long as the country remains unstable, the education sector will continue to be affected, and in turn the state of turmoil will affect children’s and teachers’ attendance and retention in school.
Table 3.1 Profiles, bottlenecks and causes of exclusion
Out–of-school children Dimensions 2 and 3
Enabling environment
Supply-side bottlenecks
Demand-side bottlenecks
Quality of education
• Age
• Gender
• Wealth quintile
• Geographic residence (rural/urban)
Socio-cultural norms:
• Parent’s perception of the limited long-term social and economic benefits of education;
• Adolescence, early marriage, household chores (fetching water), child labour;
• Parents and children’s negative attitude towards school.
Child-health: Malnutrition, stunting and disease.
• Economy: Poverty
• Political crisis
• High population growth rate
• Limited Infrastructure
• MOE weak institutional capacity
• Decrease in education public expenditure
• Insufficient schools beyond 6th grade
• Lack of qualified teachers, especially female teachers
• Cost of education
• Distant schools
• Unsafe schools
• Poor quality
• Female teachers
• Nearby schools
• Sex segregated schools
• Poor student performance
• Overcrowded classrooms
• Negative teacher feedback.
• Corporal punishment
• Teacher absenteeism
• Insufficient reading practice
• Late delivery of textbooks and teacher guidebooks
• Teacher absenteeism

Middle East and North Africa Out-of-School Children Initiative68
Supply-side bottlenecks
Determinants categorized under supply-side bottlenecks that hinder the MOE performance include both external and internal factors. External factors pertain to:
l The high population growth rate that is beyond the MOE’s capacity/ability to expand fast enough to absorb the new students.
l The difficult terrain and limited infrastructure (e.g. only 14 per cent of roads paved and low percentage of rural areas with piped water);
l The authority of other ministries over the MOE, which means the MOE is not the sole decision-maker in the other sectors that affect education.
Internal factors impeding the MOE’s performance are its poor management and limited human resource capacities, both administrative and technical; a lack of qualified teachers, especially female teachers; insufficient public education funds; lack of efficient monitoring and evaluation including EMIS; and lack of research and development capacity to address problems and solve them. One of the important issues often overlooked is the MOE’s bureaucratic approach that relies on formal requirements such as school buildings, teacher qualifications and credit only given when students meet requirements in the formal system. Because of the difficult conditions in Yemen, schooling can only be expected to reach all children when some flexibility is shown with regard to schooling venues, less qualified but literate teachers and credit given to any student studying anywhere who can demonstrate competence in the expected skills. This would require clarity about learning expectations, textbooks that provide the needed content and exams that test learning objectives, as well as a system that is willing to be more flexible.
These external and internal factors work together to cause children to leave school. For example, the lack of paved roads and distant schools seriously affect the accessibility of existing schools and cause children to drop out of school. Lack of paved roads is the responsibility of the Ministry of Public Works, while remote schools are the responsibility of the MOE. Resolving this problem of accessibility requires creative solutions such as organizing programmes closer to children’s homes and exempting them from the formal criteria as mentioned above.
Demand-side bottlenecks
Both parents and children have expectation of schooling. At a minimum, they expect that schooling will give children the ability to read and write and do basic mathematics. They become discouraged when these basic expectations are not met and children in the upper grades of primary have not attained even these basic skills. Parents also want nearby safe schools, sex-segregated safe schools, secondary schools, classes that are not overcrowded, female teachers, teachers that treat children with respect, and textbooks that are delivered on time. They also expect that the related costs of schooling will not be prohibitive, especially given the usual case where there are several children in the family. The overall poor quality of education is an important determinant in causing children to leave school. Parents, even if illiterate, can judge the quality of education their children are receiving and see if their children are acquiring expected skills at different grade levels. When schooling does not produce the expected results caregivers and children become convinced that going to school is a waste of time.
3.2.2 Quality: Bottlenecks and policies/strategies
Improving the quality of education is the MOE’s overarching goal. In regard to out-of-school children, the quality of education is an important means to keep children in school and possibly return those who left.
Yemen Country Report on Out-of-School Children 69
Quality education is also a monumental challenge for the MOE due to its strapped financial and human resources. Moreover, given the MOE’s constrained capacity, it has been in a quandary on how to invest in quality education and yet at the same time pursue expansion of the educational system. In an effort to fulfil its commitment to the Education For All (EFA) and MDGs, the MOE has skewed its investment towards increasing student enrolment rates. The result of these efforts has been to short-change the quality of education. Hence, as more students enter the educational system, more poorly educated students have exited. This also has caused low retention rates, which are indicative of a system unable to retain students once in the system. As a result, resources are not being used as effectively as they might be.
Several measures confirm the seriousness of the poor quality of education. In relation to international standards, as previously mentioned, TIMSS (2007) results ranked Yemeni students lowest among 36 countries in both tests. The poor performance was partially attributed to students’ inability to read test questions.192 A recent (2012) USAID study evaluated the reading capabilities of students in the first three grades in three different governorates and found most students had still not acquired the basic skill needed for literacy and comprehension by the end of Grade 3.193 In a case study of Yemen in the Arab Knowledge Report, a randomly selected population of Yemeni secondary students was tested on cognitive skills. The result showed that 85 to 95 per cent of secondary students lacked the cognitive skills necessary for problem solving, written communication, IT skills and information searching.194
The MOE has no measurement system of its own to assess education quality. Measuring student learning outcomes is necessary to determine the quality of education, factors that influence good performance, and to assess progress once reforms are made. There are discussions to establish a national assessment system but currently the MOE does not have one in place.195 Instead, student performance is assessed by mid-year and end of year classroom examinations at the national level and by public examinations at certain grade levels in the school system, usually Grades 9 and 12.196 These findings affirm the importance of measuring an educational system’s quality of education by student performance since their acquisition of skills should be the central objective of an educational system. Yet, student performance is seldom mentioned as an objective in education policies and programmes when discussing quality education. Instead, quality is referred to in terms of inputs needed in the education system.
For example, the Basic Education Development Programme 2 (BEDP2, 2013-2017) includes quality as an underlying objective. Its component promoting equitable access to quality education consists of the following activities:197
l Civil works and necessary furniture and equipment to reduce overcrowding in selected urban and suburban schools; and improve physical learning environment for children through rehabilitation of about 150 cluster schools;
l Interventions to promote equity through the recruitment and training of about 700 rural female teachers expansion of the BEDP Conditional Cash Transfer (CCT) programme; and
l Support to the FMCs to strengthen school-based capacity and community participation including the provisions of School Development Grants to about 210 schools.
192 Ibid. pg. 53.193 Research Triangle Institute. Early Grade Reading Assessment (EGRA). 2012. pg. 25.194 Ibid.195 International Bank of Reconstruction and Development, The World Bank and the Republic of Yemen (2010). pg. 51.196 Ibid.197 MOE. Education Development Projects Administration Unit. 2013.

Middle East and North Africa Out-of-School Children Initiative70
The Social Fund for Development (SFD) initiatives to support quality education consist of:
l Supporting pre-school programs, KGs and gifted and talented students’ programmes;
l Experimenting with new approaches in quality education development;
l Introducing new technologies in teaching and learning; and
l Plotting several new concepts, methods and applications to aide capacity building.198
Although these inputs from BEDP2 and the SFD are important contributions, there is no empirical evidence showing that these interventions correlate with student performance.199
The Mid-Term Review Framework (MTRF 2013) states that the government is more engaged in wanting to improve qualitative aspects of education.200 Improving the quality of education 2005-2010 entailed improvements in teachers’ performance, school administration and education quality. More specifically this entailed the following:201
l More than 75 per cent of teachers received integrated training on teaching skills. Training was also given to rural females, with the aim of then contracting successful trainees as teachers. Rural areas were chosen because this is where qualified teachers are needed.
l More than 90 per cent of basic school principals and 40 per cent of secondary school heads have been trained in school administration and management practices.
l Community participation is fostered through establishing “father and mother” councils.
l School curricula for both basic and secondary phases, are being developed, although with some delays.
l Specialist working teams are developing improved school textbooks for each subject.
l School counselling is being introduced by involving social workers in schools.
Review of several qualitative studies provides insight into the links between these inputs and quality education.
Teacher training: Only forty per cent of teachers have a university degree while the remaining have a high school diploma. Because teachers often lack formal qualifications, a common component in the MOE’s policies/strategies and development partners’ projects is teacher training in pedagogical skills.202 Studies on the quality of education in Yemeni primary schools, however, show that other factors may have more impact on student performance than training teachers in teaching skills. For example, one study tested three factors: classroom inputs (physical characteristics of the classroom), teacher characteristics (gender, Yemeni nationality,203 education, teacher qualification, number of years teaching, in-service training) and teacher management and organization methods (i.e., social interactions between teachers and students, feedback, disciplinary methods, etc.). Of these three factors, the most effective was teacher management and organization of the classroom, specifically the learning environment the teacher creates, for example, positive feedback and interactions with students, which allow them to direct some learning activities, and disciplinary methods.204
198 Social Fund For Development. Annual Report 2011. Republic of Yemen. pg 16.199 Benjamin Bloom. Human Characteristics and Student Learning. New York: McGraw Hill. pgs 110-111. Also, Mouna
H. Hashem, pgs. 135-136.200 MTRF (2013). pg 29.201 Ibid.202 For example, BEDP2.203 At the time of the study in 1990, the majority of the teachers were expatriates, most of whom were Egyptian, and
other Arab nationals.204 Mouna Hashem. Factors that Influence Student Achievement in Primary Schools in Yemen. University of Michigan.
1992. pg. 141.
Yemen Country Report on Out-of-School Children 71
A study by Collins and Messaoud-Galusi (2012) found that teachers’ corrective feedback contributed to better student achievement, which supports the above finding about teacher-student interaction. Other determinants that had a positive correlation with student performance were student attendance and opportunities for reading practice.205 Mekhlafy (2009) found the determinants related to student performance included class-size, while teacher qualification and experience had mixed results. Yuki and Kameyama (2013) indicated that lower teacher qualification alone is not significantly associated with student achievements.206 Class-size, however, is significantly and negatively associated with student achievements.207
These studies confirm that it is not teachers’ low formal qualifications that affect student performance but rather their capacity to create positive learning environments in their classrooms. This can be attributed at least in part to the large number of multi-age students in a classroom with different learning needs, which can be overwhelming for any teacher regardless of her/his qualifications. On average, a classroom in Yemen contains 65 students and can go up to 100 students. Consequently, having the skills to manage and deal with such large numbers of students is more important than having expertise in methods for teaching a subject matter. Other relevant studies complementing these findings highlight that negative teacher behaviour, such as corporal punishment, violence, negative student feedback and teacher absenteeism, also lead to low student performance and student dropout.208
Corporal punishment is a common in Yemeni schools and affects student retention. For example, Al-Thabbani (2004) reported that, for 81.7 per cent (79.1 per cent of boys and 51 per cent of girls) of the 586 children surveyed, the most common form of physical punishment reported was being hit by a stick.209
In line with Global Initiative to End All Corporal Punishment of Children, a ministerial decree in 2006 banned physical punishment in the schools.210 This ban, however, did not put an end to this practice.211 A baseline report by Save the Children (2009), reported that 19.6 per cent of children experienced physical punishment and, of those punished, 48 per cent, reported that they had been hit with an object by their teacher.212 Thus, banning corporal punishment without institutionalizing operational mechanisms to enforce it is not sufficient to end the practice.
Communal Participation: Father and Mother Councils (FMCs): The MOE has been promoting the role of FMCs in schools in the last several years, which is evident in many development partners’ projects (GIZ, KfW, SFD, UNICEF and BEDP). The underlying objective is to engage parents’ participation in their children’s schooling in such activities as school construction, maintenance and extra-curricula activities. Yet, it is important to note that in the past, studies have shown that these activities enhance communal participation and sometimes increases in enrolment but do not affect student achievement.213
205 Penelope Collins and Souhila Messaoud-Galusi. Student Performance on the Early Grade Reading Assessment (EGRA) in Yemen. RTI International. 2012. pgs- 3-6.
206 Takako Yuki and Yuriko Kameyama. Improving the Quality of Basic Education for the Future Youth of Yemen Post Arab Spring. Global Economy & Development. Working Paper 59. January 2013. pgs 8-9.
207 Ibid.208 Cited from Sarah Graham. Desk Review on the Prevalence of Violence in Schools in Yemen. UNICEF-Yemen.
November 2012. pg. 6.209 Ibid.210 Save the Children. The Global Initiative to End All Corporal Punishment of Children. 2011.211 Interviews with teachers and representatives in the Higher Council for Motherhood and Childhood in Sana’a,
Republic of Yemen. 26 November 2013.212 Sarah Graham. pg 190.213 A. Rugh, and H. Bossert. Involving Communities: Participation in the Delivery of Education Programs. Creative
Associates, USAID ABEL Project 1998.
Middle East and North Africa Out-of-School Children Initiative72
The GIZ has been active in working with FMCs for several years and their experience provides valuable lessons on the role of FMCs. An evaluation of their General Improvement Programme in Yemen (GEIP, 2011) assessed the impact of FMCs in Hajja and Mareb. The assessment was carried out by dividing schools from these two governorates into two groups: schools with FMCs and a control group of schools with no FMCs.214 The findings showed FMCs in schools, whether newly established under the GEIP or older established FMCs, had a positive impact on higher student enrolment, lower student dropout, higher girls’ enrolment, student achievement, improved school management, and teacher and student attendance. The control-group schools continued to rate poorly on all these measures.
Hajja is one of the poorest governorates in Yemen and has the lowest basic education enrolment rates in the country. Therefore, these findings suggest that in conditions such as these FMCs can play an important role in the school. However, investments in building the capacities of FMCs must be balanced with the needs in other aspects of education. With limited resources, the MOE has to consider whether the benefits of FMCs offset the declines in funding for other pressing programmes.
Box 3.1 Example of FMCs self-initiated activities in the pilot schools: Textbooks
The burden of distributing and retrieving textbooks at the end of each school year used to be unbearable for both the teacher and management at Khawla Primary and Secondary School in al-Shahel District, Hajja governorate. The sight of the piles of books accumulated and scattered each year was painful.
A decisive intervention was a must to ease retrieving, preserving and counting textbooks as well as identifying the increase or decrease in quantity. A donation of 87,000 riyals by the Fathers’ Council served as an altogether solution for the problem and provided an appropriate bookcase for storing books and classifying them by grades. It is now possible that students can get clean textbooks and can hand in clean textbooks at the end of each year.215
General Education Improvement Programme in Yemen (GEIP). Result-Based Monitoring 2011.
School curriculum: The MOE is in the process of reforming the school curricula for both basic and secondary schools. Interestingly, there are no studies confirming the relationship between the curriculum and student achievement.
Since 1990, the MOE has reformed the general education curriculum twice.216 The first time was after the unification of North and South Yemen. The curriculum of the two countries was merged into one, but no new learning methods were introduced.217 The second change of curriculum, which included all 12 grades began in 1995 and was completed in 2004. This new curriculum was aimed at transforming the learning process from one based on rote learning to one that required more critical thinking. Although the strategy was interesting, it failed to take into consideration the education context. For example, to implement the reforms, teachers required a lot of training that was never completed; the teacher guidebooks did not provide the necessary information for teachers to respond to students’ questions and, due to their lack of content knowledge, teachers were unable to provide the answers. As a result, teachers, parents and students all found the new curriculum unsuitable.218
214 Rainer Hampel. General Education Improvement Programme in Yemen (GEIP). Result Based Monitoring 2011. C3. Community Participation with Special Emphasis on Girls’ Education. January 2011.
215 Ibid. pg. 31.216 World Bank et. al. 2010. pg. 58.217 Unification of North Yemen (the Arab Republic of Yemen) and South Yemen (the People’s Democratic Republic)
took place in 1990.218 Interview with MOE official and the Education Research Development Center (ERDC). Sana’a,15 December 2014.
The ERDC participated in the development of the new curriculum (1995-2004).
Yemen Country Report on Out-of-School Children 73
A study by Yuki and Kameyama (2103) suggests that it is not the content of the curriculum that affects student performance but rather the instructional time spent on teaching a topic.219 Their findings are based on two significant issues: first, according to the TIMSS 2007, the “intended” curriculum of Yemen covers the TIMSS mathematics items at more or less the same level as the international average – the same as Japan. However, “taught” mathematic topics cover only 46 per cent of all items, the smallest percentage among all participant countries.220 Generally, high scoring countries such as Singapore have a high percentage of “taught” items in the topics.221 Second, the official total of instruction hours per academic year is shorter in Yemen. As Yuki and Kameyama explain, Yemen has 729.6 hours of teaching per year in primary and 864 hours in secondary education, which is about 70 per cent of the time used by high-performing systems at the secondary level.222 Furthermore, the time to deliver the curriculum is compressed due to the high level of teacher absenteeism and limited hours of operation, particularly in rural areas.223 The delay in delivering textbooks and teacher guidebooks on time also compounds the situation of implementing the curriculum in an effective manner. These problems are due to delays in printing and the inadequacies of the distribution budget.224
In 2012, the USAID/ Community Learning Project (CLP) launched the Yemeni Early Grade Reading Assessment (YEGRA), which focuses on improving reading and writing skills of Grades 1-3. The project was initiated as a result of the MOE’s concern over Yemen’s poor student ranking in the TIMSS and the USAID funded pilot assessment showing low reading levels.225 At the time of conducting the OOSCI study, CLP was the only donor project that was focusing on student learning skills. The YEGRA approach is to improve student reading skills by implementing an evidence-based early grades reading instruction programme, which includes a phonics-based scope and sequence, scripted lesson plans for teachers, student readers, teacher training, and coaching and mobilizing father and mother council support.226 The intervention targeted students in Grade 1 who were attending the 2012-2013 school year. In 2013, MOE adopted the YEGRA as the curricula for the Arabic reading for Grade 1. As a result, new textbooks and teacher guidebooks have been prepared, and the programme includes on-going teacher training workshops to teach the new approach in certain governorates. The project was launched in Grade 1 and in the coming year will include Grades 2 and 3. In 2013, BEDP2 began participating in extending this new curriculum to all the governorates.
By the end of its first year of implementation (2013), the YEGRA approach was evaluated and findings showed improvement in some areas more than others. Since it was still in the pilot stage, there was time to make modifications. For example, some adjustments and corrections were made in the textbooks and teacher guidebooks after their first year in use. However, according to some teachers interviewed, the modified teachers’ guidebooks continue to have errors that need correction.227 These initial changes appear to be mainly factual revisions, and a broader look at the lesson formats and other aspects of the books, such as ease of teacher use, may be necessary in the future.
During a visit to the YEGRA teacher-training workshop in Sana’a, teachers said they liked the new curriculum, which provides them with step-by-step instructions on how to teach the topics. However, they felt it was too intense and did not take into consideration their teaching environment. For instance, teachers for Grades 1-3 have,
219 Yuki and Kameyama (2103). pg. 16.220 World Bank et. al. 2012. pg. 53.221 Ibid.222 Ibid. pg. 15.223 World Bank and MOIPC (2010).224 Ibid.225 USAID-Yemen (2013). Improved Reading Performance in Yemeni Schools. Impact Assessment Report on the
Yemeni Early Grade Reading Assessment Phase 1: 2012-2013.226 Ibid. pg. 2.227 Interviews were conducted after the YEGRA teacher-training workshop on 20 November 2013.

Middle East and North Africa Out-of-School Children Initiative74
on average, 65 students in their class. In addition, the Arabic reading class is for two periods. The YEGRA curricula approach requires a lot of teacher-student involvement. To do so in such a large classroom is exhausting and by the end of the lesson teachers are too tired to teach the remaining subjects. One teacher said that they had asked the YEGRA organizers if teachers could modify the approach to the needs of their classrooms. The response was that they had to follow the teaching method specifically as in their teaching manual. This is of concern because if this methodology is too exhausting, teachers may not follow it for long.
School counselling: Another component the MOE has introduced to improve the quality of education is school counselling. This involves social workers that function as caretakers for special needs students and as career advisors. Given the fragile background of students, including those with disabilities, from areas of conflict, living in extreme poverty and the general lack of awareness about the importance of education, it was thought social workers would be able to provide valuable support so that these vulnerable children might stay in school longer. In terms of the quality of education, we found no studies in Yemen that assessed whether the provision of social workers increases student academic performance.
The GIZ project (GEIP) mentioned earlier, which included a role for social workers, found that social workers in the pilot schools in Hajja and Mareb proved good facilitators in establishing, and revitalizing or strengthening existing FMCs.228 However, with regard to the guidance and counselling of slow learners, special needs students and talented students, the project found that in one third of the schools social workers were under-performing in counselling students with learning and behavioural difficulties. Although this study looks at social workers in schools in only two governorates, it does indicate that if the MOE is to invest in school counselling, it is essential that social workers receive appropriate training and are monitored to ensure that they perform their duties effectively. Again a question exists of whether the benefits they produce outweigh the disadvantages of having fewer resources for other important aspects of education.
In conclusion, identifying factors that affect student performance is essential to help education policy makers and donor partners know where to invest in interventions that would achieve more students learning.
3.3 Dimensions 2 and 3: Policies and strategies
In the previous section, the study provided a diagnostic analysis of why children are out of school. The remaining question is how can out-of-school children be brought back to school and encouraged to stay there? There are no specific policies, strategies or activities targeting out-of-school children. In addition, if a child drops out of school, it is difficult for him or her to re-enrol mainly because of the lack of support mechanisms to help in catching up with peers who have stayed in school. The MOE, with the support of its donor partners, does have policies/strategies to address some of the bottlenecks affecting out-of-school children in Yemen. The following section links these bottlenecks to policies/strategies and examines their impact in reversing mechanisms of exclusion to ones that allow for the inclusion of out-of-school children in the educational system.
3.3.1 Enabling environment
Social norms, such as negative attitudes towards girls’ education, lack of parents’ and children’s awareness of the value of education, early marriage and child labour, are major impediments to children attaining an education. Several policies and strategies address these issues.
228 Rainer Hampel. pg. 16.

Yemen Country Report on Out-of-School Children 75
The National Basic Education Development Strategy (NBEDS, 2003-2015) emphasizes girls’ education as a crosscutting theme in its objectives, as girls represent the major population of out-of-school children, especially in Dimension 3. To reach the NBEDS goal of increasing girls’ enrolment to 82.7 per cent by 2015,229 the following policies and strategies have been implemented:
l A national decree (2007-2008) abolishing school fees for girls’ enrolment in Grades 1-6, and boys in Grades 1-3.
l Training of 700 rural female teachers and expansion of the CCT (equivalent to 40 US dollars) to help poor families meet education-related expenses and enrolment of girls (Grades 4-9).
l The SFD’s awareness-raising campaigns and mobilization to advocate for girls’ education in rural areas where the gender gap exceeds 90 per cent.
l GIZ formation of school FMCs and social workers to advocate for girls’ education, while KfW complements the effort by building schools that include latrines and wall barriers that are more female-suitable in the same target areas.
l UNICEF provision of school kits to girls who enrol.
l WFP provision of food rations (wheat and vegetable oil) for families in remote villages that enrol their daughters in school.
Assessments of these policies/strategies highlight important findings on their impact:
Abolishing school fees has significantly increased girls’ enrolment in rural areas, and girls’ enrolment in Grade 1 in urban areas.230 These girls are out-of-school children in Dimension 2 (6 year olds), which data show has the highest number of out-of-school children. This suggests the possibility that poor families may be delaying girls’ enrolments for financial reasons.
The MOE, however, has not made any arrangements to meet the high response to this decree, such as increasing needed school facilities and resources. Consequently, the problem of overcrowded classrooms, lack of sufficient textbooks and unequipped teachers continue to exacerbate the issue of poor quality education and serve as a catalyst for student dropout.
Schools have also been negatively affected by the abolition of school fees, as it decreased their funds available to cover operational costs. To make up for this loss, school administrators have been charging parents to pay for various other expenses (photocopying, exam papers, report cards, etc.) and consequently they are defeating the purpose of the decree, which was to alleviate school costs so poor families would enrol their children. The survey found that almost 80 per cent of the families interviewed had a monthly income of less than 40,000 YR ($136).
An interesting finding was that 15 per cent of households with children not enrolled in school were unaware of the abolition of school fees, which suggests that the policy has not been advertised sufficiently to maximize its impact.
Conditional cash transfer (CCT) is another strategy to reduce the problem of costs. CCT provides families with cash ($40) to cover the expenses for enrolling their daughter in school. An assessment of this strategy in Lahj and Hodiedah showed a significant increase in girls’ enrolment from 29,730 in 2008 to 44,760 in 2012 in both governorates. This increase exceeded the project’s expected outcome indicator of 56 per cent or 33,820 by the year 2011-2012.231
229 The NBEDS goal was initially to increase girls’ education to 95 per cent but due to the political crisis reduced this rate to 82.7 per cent.
230 The assessment was conducted by he Education Research Development Center (ERDC) and funded by UNICEF. Cited from I. Al-Houthy, et al. OOSC Core Team working paper (November 2013).
231 Ibid.

Middle East and North Africa Out-of-School Children Initiative76
School grants (SGs) have been recently introduced by donor partners, such as the World Bank and UNICEF, and adopted by the MOE under the Whole School Improvement programme. The aim of these grants (1,500 US$ each) is to encourage school improvements and cover operational costs. An important implementation strategy is to link the school and the community by giving FMCs a role in managing how these funds are used.
School kits and food rations implemented by UNICEF and WFP, respectively, have shown positive results in increasing girls’ enrolment. However, there have also been some disappointing effects. For example, when school kits were given to the school administrators (mainly the school principals) to distribute, they did not always reach target beneficiaries.232 At the same time, the WFP’s food rations seemed to have only a temporary impact in some cases. For example, some parents enrolled their daughters and after receiving the food rations withdrew them; and nearby villages were upset that they did not receive the food rations when they were equally poor. They resented the fact that parents from other villages could temporarily enrol their daughters to get the food ration and then withdraw them.
Excluding boys from these benefits did not increase overall school enrolments as much as expected; i.e., while there was an increase in girls’ enrolment there was a surge in boys’ dropout rates. Parents in rural areas began giving less priority to sending boys to school, especially boys as of Grade 4 who were no longer exempted from school fees, since there was no incentive (CCT or food rations) as there was with girls. As a result, by preventing boys from attending school, parents were able to reduce their expenses by not having to pay school fees and other related expenses. This may have also been a catalyst in taking boys out-of-school to begin working, as parents are struggling to make ends meet with their financial situation severely deteriorating due to the on-going political and economic crises during this last decade.
GIZ’s work includes encouraging community participation, promoting and building the capacities of FMCs in school management, and promoting girls’ education. As previously discussed, these strategies have been effective, which indicates that involvement of the community (including FMCs and local councils) is important and that by making parents stakeholders in the school, they feel more confident in sending their children, especially girls, to school.
In contrast, building schools, which KfW, SFD and the MOE have been doing, has not produced the expected outcomes, especially with regard to the aim of increasing girls’ enrolment. Although more schools are needed in Yemen, girls are still not going to school for several reasons including the lack of piped water; this includes the need for girls to fetch water for home consumption and because of the lack of water in the school for sanitation. The second major reason is the cost of schooling, which schools are requiring parents to pay to cover operational costs.
Awareness-raising strategies are being implemented by BEDP2, which is in the process of developing a communication strategy; SFD also includes awareness-raising activities at the community level. An assessment of awareness-raising activities by the Education Research Development Center (ERDC), found that these activities have not had a significant impact on girls’ enrolment. The study notes that this may not necessarily be due to the lack of effectiveness of this kind of campaign but rather to the fact that school conditions, particularly in rural areas, do not encourage girls or their parents to want them to enrol (for e.g., the lack of sex-segregated schools and female teachers). This conclusion is too general as it overlooks the fact that awareness-raising campaigns have been implemented at different phases with two different target groups. Initially due to the overall low enrolment rates in school, the awareness-raising campaigns focused mainly on increasing enrolment of all children in school. This campaign was successful and, as the MOE states, it significantly increased children’s enrolment in school, which
232 Ibid.
Yemen Country Report on Out-of-School Children 77
is also evident in the data showing the high rates of enrolment rates of girls and boys in Grades 1-3. More recently, due to low enrolment rates and/or high dropout rates of girls, especially during adolescent years, current awareness-raising campaigns target girls’ enrolment. It is this latter campaign that the ERDC is correct in concluding may have not been successful.
Mass (2012) provides an alternative view based on an in-depth study regarding children and parents’ perception towards education.233 Her findings show that even if demand-side conditions were available (such as, sex-segregated schools, female teachers and sanitation facilities), children and parents, particularly in rural Yemen, would still choose to “stop” schooling by adolescence. This is based on their perception that schooling is only an important “childhood” activity but has little relationship to the future in social or financial terms. Many children and parents expressed that children stopped school “when and because they were ready to begin the transition to adulthood.”234 The skills considered key for adulthood, such as their ability to do certain tasks and demonstrate mature behaviour, are not taught at the school, or after the completion of a certain number of grades, or associated by age in years.235 It is also more important to support family and group solidarity rather than prioritize the individual goal of school completion. Mass confirms there is a strong relationship between adolescence and stopping schooling, which is similar to our findings as indicated in the profile of out-of-school children: as children begin adolescence the trend towards dropping out of school increases.
Hence, these findings demonstrate that parents’ perceptions towards education weigh more heavily on social norms than on economic needs. While children, who also have some say in attending school, are largely unaware of the importance of education, and so far have not been targeted in awareness-raising campaigns.
For awareness-raising activities to be effective, the message needs to correspond to social perceptions, especially involving adolescent children. For example, calling attention to the importance of adolescent girls’ education in decreasing maternal and infant mortality, which affects many families in rural Yemen.
Early marriages are not addressed in any policies or programmes. This may be due to the fact that Yemen has no minimum legal age for marriage. In 2009, the Government of Yemen advised the UN Human Rights Council (UNHCR) that it would propose a 17-year old minimum age legislative revision that “will be implemented upon completion of its issuance procedures.”236 The National Team for legislation review finalized the drafting of this legislation and it has been submitted for debate in Parliament.237 Approval for this legislation has also been advocated in the National Dialogue Conference.238 To date, no consensus has been reached due to the controversy surrounding this matter.239
Child labour
An estimated 1.3 million children are classified as child labourers in Yemen, of these children 50.7 per cent are engaged in hazardous work, 36.6 per cent are under the age of 14 years old, and 12.7 per cent are between the ages of 14-17 years old and are working more than 30 hours per week.240
233 Many studies suggest that parents in rural areas are often unaware of the value of education, especially in terms of long-term cost-benefit ratios. Instead, they consider the short-term opportunity cost of children attending school rather than the potential long-term benefit of employment. This attitude is reinforced by high unemployment rates in the country.
234 Mass. pg. 84.235 Ibid.236 UNHRC 2009a, para 14. Cited from UNICEF (2013).pg. 147.237 Ibid.238 Samir Al-Abdali, Early Marriage. Oxfam and The Higher Council for Motherhood and Childhood. April 2012. pg 4.239 Samir Al-Abdali, Early Marriage. Oxfam and The Higher Council for Motherhood and Childhood. April 2012. pg 4.240 UNICEF (2013). Pg. 157.
Middle East and North Africa Out-of-School Children Initiative78
Under the ILO minimum age convention (No. 138), the Government of Yemen has specified 14 years old as the minimum age for children to work, with 18 years old being the minimum age at which persons may be employed in hazardous work.241 In 2004, Ministerial Decree No. 55 that was issued to prohibit and regulate child labour and included the establishment of the Child Labour Unit in the Ministry of Social Affairs and Labour (MOSAL), and national laws and regulations were prepared to comply with international conventions.242 In complying with ratification of its two ILO conventions, the Government of Yemen also adopted a national strategy to end child labour (the National Policy and Programme Framework for the Eradication of Child Labour and Elimination of Worst Forms, 2005).243 Implementation, however, of these measures has been lacking. Similarly, the operationalization of the National Policy and Programme Framework has been delayed more than five years due to lack of funds and poor coordination.244
In addition, the relationship between out-of-school children and child labour is in breach of the ILO conventions and the Yemen Constitution, which state that education is compulsory for children in the ages of 6-14 years old. This issue of child labour needs attention not only at the family level but also at the national policy level.
Policies/strategies to deal with the political crisis
In response to the country’s political crisis and the problems it creates by preventing an estimated 1.2 million children from accessing schools, the MOE and the Emergency Education Cluster are taking action to address this matter. A major concern regarding out-of-school children is the urgency in making sure they enrol and stay in school, and that they and their parents are provided with the necessary safety nets during this time of political crisis. Of particular concern are boys being in school to prevent them from being recruited into the armed forces.
The MOE has formed a ministerial committee representing all concerned sectors of the ministry to plan and supervise education emergency services. This includes taking inventory of the damage to educational facilities and developing a renovation plan. However, given the extensive damage and the MOE’s limited capacity and experience in emergency situations, the response has been described as slow. Not only has the performance been poor but also the MOE lacks the necessary tools to deal with the crisis and has little experience in addressing the needs of education systems in emergencies. Some donor partners have also aggravated the situation by implementing educational interventions without coordinating with the MOE. Consequently, these haphazard interventions have resulted in duplication of many efforts in the same location. In addition, development partners’ resources and assistance have been distributed inequitably by concentrating interventions in a limited number of affected governorates while excluding others.
The Education Emergency Cluster, co-led by UNICEF and Save the Children has been conducting the following activities:245
l Distributing resources equitably to various programmes in various affected areas.
l Reducing duplication and redundancy in implementation of activities.
l Coordinating and integrating the efforts of organizations engaged in emergency response.
l Developing uniform implementation mechanisms and tools.
241 Cited from UNICEF (2013). pg. 157.242 Ibid.243 Ibid. pg. 160. 244 Ibid.245 Snapshot-Education Cluster. Yemen: Education Cluster Activities Updated (as of 31 May 2013). During the
preparation of this study, there were no assessments of the Emergency Cluster interventions.

Yemen Country Report on Out-of-School Children 79
l Bringing about effective responses in terms of planning and implementation.
l Providing resources and integration of efforts.
l Investing in the best resources available.
l Building capacity in the MOE to respond to emergency situations in various stages of implementation.
l Promoting and applying minimum standards for education in emergencies.
3.3.2 Demand-side policies and strategies
The availability of female teachers has a significant impact on girls’ school attendance, especially in lower secondary schools. An examination of the MOE policy regarding this component shows that there are no special recruitment policies to target female teachers. Females account for only 22 per cent of all teachers and of these only 9 per cent are females teaching in rural basic education.246 The proportion is even lower in secondary schools (5 per cent) and combined basic and secondary schools (3.6 per cent).247
The issue of teacher recruitment is complex and involves several ministries each with its own set of requirements. Teacher recruitment highlights the mismatch of policies to realities on the ground. For instance, in 2006, in trying to improve the quality of teaching the government mandated that the minimum qualification to become a teacher was a university degree, the only exception being to allow lower qualifications in governorates with isolated villages. In addition, to ensure the quality of teacher training, the government limited teachers’ training centres to a few major urban areas. Consequently, the government made it more difficult to recruit rural females due to the fact that few females have a secondary diploma. In addition, with the traditional social context of restricting female mobility, by closing regional teachers’ training centres that were geographically more accessible, the government made it more difficult for rural females to obtain teaching credentials. Our finding is that these decisions decreased the pool of rural female teachers.
Teachers represent a substantial portion of the public education expenditure (between 50-65 per cent). The recruitment process involves several key ministries. Committees within the Ministry of Finance (MOF) prepare a budget each year. The MOE at the governorate level develops the recruitment needs and the Ministry of Civil Service (MOCS), with the support of Local Councils, begins the recruitment process.248 It is at this phase that the disparity appears between the needs at district and governorate level and the allocations made by decision makers at the central level. Often, decision-makers at the central level reduce the requested funding amounts from the governorates based on the assumption that the requests are inflated.249
Moreover, within this recruitment process, men and women compete for the same posts at training colleges. Men however are more likely to have secondary school credentials in comparison to women candidates, and socially they have more influence in gaining the posts. As a result the chances of women being recruited are slim. Overall the lack of specific policies to increase the number of female teachers in rural areas has limited the availability of these teachers, and indirectly has diminished girls’ enrolment and retention.
It should be noted that teaching is a highly respected profession in Yemen, a profession that rural families would allow their daughters to pursue.
246 UNICEF (2007). Pg. 15.247 Ibid.248 Local Councils are at the district level. 249 UNICEF. 2007. Pgs. 14-15.
Middle East and North Africa Out-of-School Children Initiative80
Finally, what the recruitment process shows is that in spite of efforts to decentralize the functions of the MOE, which were implemented with the aim of improving efficiency, budgetary decisions made at the central level prevent the MOE at the governorate level from responding to local needs or functioning more effectively.
3.3.3 Supply-side policies and strategies
Paradoxically, in spite of Yemen’s low student enrolment rates, the government is unable to meet the high demand for schooling. As discussed earlier, population growth rate and the dispersion of the population across the country are overwhelming challenges before even considering the MOE’s weak institutional capacity. The fact that only 57 per cent of rural areas have schools offering education beyond Grade 6 explains the high rate of out-of-school children at the lower secondary level (Dimension 3) in rural areas.
The strategies of BEDP2, SFD, KfW and USAID are all assisting the MOE build more schools. Supplying these schools with qualified teachers, however, will be another challenge. BEDP2 is also addressing the MOE’s weak institutional capacity, in a continuation of its efforts launched under BEDP1.
As of yet, there are no policies/strategies at the legislative level to streamline budgeting and recruitment. The mismatch of demand and supply in the recruiting process is due mainly to the involvement of several ministries including the Ministry of Finance (MOF) and the Ministry of Civil Service (MOCS). This limits the MOE’s decision-making authority at different levels.
Another problem in the MOE’s supply-side performance is wastage in the system related to ghost teachers and teacher absenteeism. In 2006, a policy was issued linking teachers’ posts to schools instead of to persons. The earlier practice meant that teachers were allowed to take their posts with them when changing residential location. Teachers would apply to rural posts where demand for teachers was high and once in the system, these teachers would not attend their posts or they would relocate. The aim of the new policy was to stop this practice, which was creating staffing gaps. With the new policy, once teachers relocated, they would have to reapply for a post rather than continue to be counted in the system. However, as of yet, this policy has not been sufficiently implemented to assess its impact.

Yemen Country Report on Out-of-School Children 81
4 The recommendations aim to respond to the bottlenecks at two critical levels – national-level delivery and school-level learning. The focus on these levels is because the limited resources available require that priorities be selected that are most likely to produce the best results, which in this case is student learning. This in turn will affect enrolments and children staying longer in school. In addition, the recommendations provided are low cost and can build on on-going efforts.
Enabling environment
1. The issue of out-of-school children is a multidimensional problem that requires an integrated inter-sectoral and holistic approach. This approach needs to include all the relevant ministries; such as the MOE, Ministry of Public Health and Population (MOPH), Ministry of Labour and Social Affairs (MOSAL), Ministry of Human Rights (MOHR), and Ministry of Public Works (MOWP). This was indicated in the description of the what factors in the enabling environment affect children’s schooling, and how these causes are not confined to the education sector, the community or household separately. Nor are they limited to supply-side or demand-side bottlenecks. Rather they are a reflection of economic, political and social issues confronting the country at the national level and reaching down to exclude children at the school level. These issues define the enabling environment and cannot be overlooked when they affect approximately 1.6 million children out-of-school.
There are two recommended options that may alleviate the MOE’s burden:
i) To establish a Higher Council for Basic Education, which should include a body of inter-ministerial, governmental and non-governmental organizations and institutions to coordinate, and to draw up policy legislation and strategies to ensure the education and protection of children. This is similar to the Higher Council for Motherhood and Childhood (HCMC), which is responsible for early childhood development.250 The government established the HCMC to respond to the variety of children’s needs at this early age. Here also a multi-sectoral approach was required to ensure the well being of childhood and motherhood. Findings of this out-of-school study indicate that to tackle the different causes affecting children’s attendance in school and/or to safeguard them from dropping out also needs a multi-sectoral approach.
Recommendations and conclusions
250 The new National Early Childhood Development Strategy (2012-2016) includes children from birth to 8 years old.

Middle East and North Africa Out-of-School Children Initiative82
Equally, the approach required should be holistic. The HCMC adopted the Holistic Integrative Approach (HIA) in its new National Early Childhood Development Strategy (2012-2016). This strategy was a first of its kind, supporting the recent trend toward early childhood development in the world including Yemen.251 The HIA builds on multi-sectoral efforts that include health, education, social affairs, cultural norms, media, guidance and endowment, and governmental institutions such as the MOSAL, MOHR, MOPH, the Parliament, HCMC and other related entities, such as NGOs and other institutions.252
Establishing a Higher Council for Basic Education (HCBE) would expand and continue the efforts of the HCMC. The HCMC includes pregnant mothers, their children up to the age of 8 years old, and children in the first three grades of basic education. The HCBE would go further and include children from Grades 4-9. This cut-off point of Grade 9 would ensure that children who complete this grade and leave school would have at least mastered reading and numeracy skills.
The HCBE would formulate policies, enact legislation and develop strategies with crosscutting effects across sectors and at various levels. HCBE would not operate in the same manner as NBEDS, establishes uniform programmes and strategies for target governorates at the national level, without accounting for the governorates different attributes, needs and priorities. The differences in terrain, dispersion of villages and varying climates of the governorates alone underscore the variety of conditions that exist from one governorate to the next. In addition, the HCBE would need to include the participation of officials at the governorate and district levels as well as local councils if there is to be a more inclusive and democratic process, and ensure more efficient and effective planning and programming.
ii) An alternative would be to have the MOE collaborate with different relevant sectors and form partnerships with ministries, donor partners, non-governmental institutions and organizations in designing programmes and activities targeting the different exclusionary factors. For example, due to the staggering numbers of children suffering from malnutrition, stunting, and other child diseases, the MOE could coordinate with the MOH to identify children needing preventive and curative interventions. Many children now go undiagnosed and as their health worsens with time, it affects their school performance and leads to their dropping out of school.
Implementation of this option might include several strategies, for example:
• The MOE and MOH could declare a national health week and send physicians and nurses to conduct general check-ups to identify children suffering from disease or in need of immunization (for children in lower grades). The MOH could also call on private physicians to volunteer and be sent to different governorates. The MOE and MOH could partner with donor partners, such as UNICEF and WHO, in conducting such activities.
• Health education, especially nutrition should be introduced to children in class, and to their parents during school meetings or in meetings with school social workers. There is a food pyramid for Arab countries developed by the Food and Agriculture Organization (FAO). Posters illustrating the food pyramid can be hung in classrooms and brochures distributed to parents.
• In regard to food insecurity and malnutrition, the MOE can collaborate with the Ministry of Agriculture (MOA) in developing schemes to subsidize food costs for poor families and/or provide food rations. WFP provides food rations in remote villages but only to families who enrol their girls in school. WFP plans to include on-site school meals to boys and girls in high poverty and food
251 Presidency of Council of Ministries, UNICEF, ECD Resource Center. The National Early Childhood Development Strategy (2012-2016). pg. 7.
252 Ibid.
Yemen Country Report on Out-of-School Children 83
insecurity rural areas, however, this activity is still at the design stage. School meals are important and would give relief to families and children in food insecure areas. Yet, these are short-term solutions and limited in their coverage. Such an activity is too costly for the MOA to replicate and expand coverage.
Another option, as most poor families live in rural areas, is to assist them in forming small agricultural cooperatives to produce their own food. They can provided with small plots of land, such as from the wakf land. An interesting project, which provides a good model for Yemen is the MDG Joint Programme, which aims to combat food insecurity and child malnutrition in Mauritania. This programme entailed the collaboration of several ministries (MOA, MOH, MOLSA) and IFAD, WFP, WHO and UNICEF.253 Its holistic approach ranges from training poor families to develop cooperatives for producing their own food using innovative and practical agriculture practices, to providing health education for pregnant women, mothers and caregivers of children under the age of 5 years old. The project in Mauritania significantly improved poor families food security. The project also included a micro-credit component for these farmers. There are lessons to be learned from this experience that are applicable to Yemen.
Hence, both options emphasize improving the enabling environment in Yemen. To address the exclusionary factors that affect non-enrolment and school leaving, the government and the MOE must mount an inter-sectoral, holistic strategy for basic education. It is this course of action that the MOE should be considering when it prepares the National Education Vision for Yemen (NEVY).
2. Raising awareness is key to changing attitudes and perceptions; yet, its success depends on how and what information is conveyed. Awareness-raising campaigns should be contextualized to people’s cultural perceptions, which need to be identified, with the information further tailored according to the specific target group rather than being too general. For example a campaign targeted to rural parents in a specific location so that they can relate to the information being conveyed. These messages should aim to be easy to understand but also to expand people’s knowledge so they can make better-informed choices. It is important to be sure to disseminate information regarding the abolished school fees and to emphasize that basic education is compulsory by law.
An awareness-raising strategy implemented at different levels should include:
l A national-level campaign using different media (television, radio and printed matter) that would cover the entire country, particularly remote villages. A prominent public relations expert/company specializing in promoting social issues could be contacted to ensure that information regarding out-of-school children and their situation is transmitted in a culturally sensitive manner. BEDP2 is in the process of developing a communication strategy to raise awareness, but this is limited to girls’ education and learning to read. It would be a good opportunity for the MOE to broaden this strategy’s outreach to address broader issues of out-of-school children. This would need a comprehensive strategy that makes officials aware of its impact on the economic and social development of the country. Moreover, the strategy should explain how education impacts other spheres of life and show how the relationships between education and poverty, nutrition and student performance, child labour and dropout, early marriages and miscarriages, pre-natal care and stunting all affect both children in school and out-of-school children. Messages to parents should be oriented toward explaining the benefits of education as they relate to their families and children, since they are unlikely to respond to national-level benefits and priorities.
253 M. H. Hashem. Evaluation `a mi-parcours du Programme Conjoint F-OMD : Accélération de la Lutte Contre la Faim et la Malnutrition dans le sud-est Mauritanien. UN MDG-F Secrétariat. 2012.

Middle East and North Africa Out-of-School Children Initiative84
l A community-level campaign employing several outreach methods, including:
i) Gaining the support of the village shaykh at the mosque (masjid), where villagers, particularly men congregate and have discussions. The shaykh can promote the importance of education in his Friday sermons (khutba). A preliminary step would be identifying shaykhs that would agree to advocate for education, especially for girls.
ii) Involving FMCs in raising awareness in the community by meeting with parents and children. The objective of their advocacy would be twofold: 1) to persuade caregivers and children to enrol in school (or re-enrol for those who have dropped out); 2) to reinforce the importance of staying in school to parents and children who are enrolled in school but at risk of dropping out. FMCs can be influential and persuasive given that communities are tight knit and people trust them, which are important assets in advocating girls’ education for both enrolment and retention. Using FMCs has already proven to be effective in Hajja and Mareb, as explained earlier. However, it would be essential that FMCs be given some training in advocacy strategies.
iii) Keeping records of students who did not re-enrol at the beginning of the year and those who dropped out during the year. This should by done by school administrators to help identify out-of-school children. The school principal or social workers can visit these children’s homes to persuade parents and their children to return to school, not only because it is important but also because it is the law.
Awareness-raising campaigns should also spread the information that education is compulsory, since this is not widely known.
3. Poverty is at the core of children’s exclusion from schooling. Lack of employment opportunities, and economic and political crises have exacerbated the conditions of poor families. There is a need to identify strategies to alleviate financial burdens to make poor families less dependent economically on their children, especially boys. Children are perceived as part of the financial burden, especially girls. Fees for schooling in poor areas need to be abolished equally for boys and girls. Finding effective strategies is a challenge in a poor country such as Yemen.
Several on-going projects (USAID and BEDP2) provide poor rural families CCTs. These programmes currently are limited to encouraging girls’ enrolments. The shortcomings of these schemes are the following:
l CCTs exclude boys, whose dropout rates increase by secondary school.
l Once the projects terminate these schemes are not sustainable because the government cannot adopt them.
l They are, therefore, short-term solutions.
Microcredit programmes, if designed to improve the livelihood of the poor, can be effective. Yet, this experience globally has had conflicting outcomes. As Muhammad Yunus, founder of the Grameen Bank, explains there are two different models of microcredit, one type that is designed to serve the poor and another type to maximize financial returns of moneylenders.254
254 New York Times op-ed. January 15, 2011.

Yemen Country Report on Out-of-School Children 85
4. There needs to be a process by which out-of-school children can return to school. This is especially the case for the largest populations of out-of-school children: child labourers, girls, children who have dropped out and children with special needs. One option, where resources or volunteers are available, is to provide remedial classes for children 8-15 years old in the afternoon to make it easier for them to attend. Local councils could be asked to find locations such as community centres and teachers for these classes, and perhaps even raise money to support them. An alternative option is for NGOs to provide remedial education classes.
Supply side
5. Strengthening the institutional capacities of the MOE at the decentralized level should build on existing activities. It needs to be holistic, inter-sectoral, and phased to ensure its effectiveness. Building these capacities needs to encompass training in management, monitoring and evaluation, research and development, EMIS, governance, coordinating activities, etc.255 This requires giving the MOE, governorate and district offices more decision-making power to oversee their own special educational needs and priorities. BEDP2 includes a component for institutional capacity building of the MOE, which would apply to this recommendation.
6. Capacity for data collection needs improvement at three levels: at the MOE level, at the school level, and at the national level. We will only address the first two here, given that until more accurate information is available it will be difficult to know the proportion of the out-of-school population.
l At the school level, it is important that all schools report the same categories of information, and that this data is from actual school records and not from the memory of senior staff, and that the coverage is adequate to assess not only student participation but also student achievement and the inputs made available to improve instruction. The MOE needs to determine indicators and develop standard forms for all schools to use, for example: enrolment, dropout, grade repetition, and exam scores by subject, level and individual; a section on students with disabilities and/or special needs should also be included. It is important that schools are able to collect this information from their records. Therefore, involvement of school principals with the MOE in the development of these forms is necessary to ensure that appropriate indicators are identified. Having a workshop for the MOE and school principals to carry this out would be a good venue. Conversely, if the forms are developed solely by the MOE and the information requested is not easy to collect from existing school records, the school administrators will need to make up the data to adhere to the requirements.
l At the MOE level, the capacity of the Department of Statistics needs strengthening. In terms of geographical reach, the ministry’s capacity is remarkable. This translates into a comparative advantage in data collection from schools. Yet, research survey skills such as questionnaire design, data collection and monitoring of data collection and quality needs improvement. This training could be implemented under BEDP2. Capacity building of the MOE was a core objective under BEDP1 and remains so under BEDP2. In BEDP1 a cadre of MOE staff from the Department of Statistics were sent to workshops overseas. Yet, this approach has not shown any significant improvement in capacities. One explanation is that the training is mostly conceptual, which may make it challenging for the cadre to apply these research skills when they return. A more effective approach could be to recruit experts to provide hands-on training in research survey. More specifically, this would include strengthening skills in designing questionnaires that are culturally sensitive in collecting factual data that
255 Since 1996/7, the MOE continues to use the same survey questionnaires, with minor modifications, and the same poorly qualified professionals for data collection. Interview with MOE Statistics Office, Sana’a, Republic of Yemen. 21 November 2013.

Middle East and North Africa Out-of-School Children Initiative86
would produce valid and reliable demographic variable measures; and conducting pilot studies to test the appropriateness of these questionnaires with sample selections of the population (when applicable). In addition, the MOE will need to be trained in analysing the data to ensure it is mined for the kinds of information that can improve both the quality and quantity of education outcomes. Once data has been entered and analysed, it should be subject to a quality review. Existing partnerships between UIS or EMIS could be mobilized to carry out this review.
While data collection should remain in the hands of the MOE, a third party, for instance an NGO, could be hired to monitor data collection and carry out repeat visits to a selection of schools. The prospect of being monitored should lead to more accurate data collection.
Another option is outsourcing data entry, cleaning and some analysis to the Central Statistical Organization (CSO), which has very strong capacities. The CSO and MOE already share data at the governorate level, though compiling these data into national statistics frequently results in different values being obtained by the MOE and CSO. Outsourcing data entry processing to the CSO would mean that another institution compiles education statistics with no direct interest in the findings. Yet, this may be controversial since it will devolve control over national education statistics to a different institution.
7. Reform is needed at the legislative level to streamline budgeting and recruitment. The mismatch of demand and supply bottlenecks is a result of the involvement of several ministries such as the Ministry of Finance (MOF) and the Ministry of Civil Service (MOCS), thus, giving the MOE little say in spending for projects that affect educational participation. More autonomy and decision-making power should be given to the MOE at different levels.
8. Teacher training should be geared to producing teachers whose students achieve the learning expectations of the MOE. Since little is known about the relationship between teacher training and student performance, it is important to identify what would constitute effective training. This might include ensuring that teachers are sufficiently knowledgeable about the subject matter content, that they know what they are expected to teach (learning objectives) and that they are taught alternative ways of instilling learning through various forms of practice. Teachers may also need preparation in classroom management and student assessment to know whether their student have learned what they need to know. The impact of the training needs to be measured through evaluating student learning. Up until now, no effort has been made to link teacher training to student performance and, unless it is done, training will continue to produce poorly qualified teachers who do not improve student performance.
9. There is a need to revamp the curriculum of the Faculty of Education (FOE) and Teacher Training Centres, but not before understanding which aspects of training lead to better student learning. The present FOE curriculum is theoretical and out of date. Consequently, students graduate with no practical skills to equip them for teaching in Yemeni schools. Teacher training programmes should require trainees do an internship in teaching to gain experience, and to familiarize them with teaching on the context of Yemeni classrooms and the curriculum. There should be a training component on how teachers can interact positively with children, which has proven to be important in improving student academic performance. There should also be a component on how teachers can interact positively with children, which has proven to be important in improving student academic performance.
Yemen Country Report on Out-of-School Children 87
10. The MOE needs more resources. Yet, given the constraints in the country, this is not an option. Therefore, the MOE needs to consider how to improve the education sector within these constraints. The best approach is to prioritize what they want to achieve in the long term, while noting what is feasible to do in the short term, and then determine how best to utilize their available resources to achieve these objectives. In particular, the MOE needs to consider more flexible, less formal approaches to schooling, and to think in terms of low-cost drivers of reform. In this respect the following is recommended:
l Diplomas and exams drive education participation and attainment. The MOE needs to control what is learned, how it is measured and who is qualified to receive certificates. However, within these parameters, the MOE needs to show flexibility: school facilities are not education, and qualifications and training do not guarantee good teaching. Learning can take place in many types of environments with a literate person teaching.
l To implement a more flexible programme, the MOE must 1) determine the learning skills acceptable at each grade level and subject matter to qualify for credit; 2) develop exams (with test items) to measure students’ attainment of these skills; 3) determine at which levels and by which exams diplomas will be given to those who demonstrate the needed skills; and 4) develop institutional capacity to implement such a programme. This system could be applied to children who learn in the formal system and those who learn outside the formal system.
This frees the MOE to educate more children for longer in community centres, at home or in any other venue and with various levels of instructors. The benefits are that this approach is less costly and can reach children in remote villages, even ones where the appropriate-sex teacher is not available, or children are not allowed to study in public schools.
l Training programmes and their reforms could also be measured by the extent to which teachers produce the required learning in students. Worldwide, education ministries are turning to the method of creating clear learning objectives (usually national curriculum objectives), and the use of specific test items that measure student acquisition of the skills (example of a skill is “addition of two digit numbers”). This moves away from rote memory skills. A simple way to help teachers remain aware of these objectives is through wall charts that show the skills by grade and subject matter. Teachers will be told that exams will test these skills and if children learn and practice them enough they will pass. This allows teachers to use any methodologies they feel are appropriate in the conditions existing in their classes and means that teachers will not have to implement techniques that do not work in their specific situations. These sets of skills/objectives, exam items and charts can be developed in small workshops that contain small numbers of MOE staff, principals and teachers. Samples of these kinds of learning objectives can be found in a number of countries as reference.
The MOE has to be willing to implement this system within their existing constrained school programme. This approach has been used in Pakistan, India and Afghanistan and other countries, and has been proven successful at increasing skills.256 Moreover children who are successful in meeting these clear objectives on exams are more likely to stay in school.
256 Andrea Rugh. “Models, Policy Options, and Strategies: A Discussion Paper in Support of Afghan Education.” UNICEF. 2001.
Middle East and North Africa Out-of-School Children Initiative88
11. Female teachers: With more flexible venues for schooling, alternative options can be tried to solve the problem of separation and/or limited facilities, such as small home schools where teachers are paid according to their academic and professional qualifications (and are given the opportunity to upgrade them) or alternatively are paid on a scale related to the success of their students. When teacher qualifications are not a barrier to teaching, many more opportunities open up.
In this ‘pared-down’ way of providing services (which actually improves those services), training at all levels of the ministry, district offices and schools would be focused on ‘hands on’ training to do whatever the trainees’ jobs are scheduled to be. Any theoretical training would wait until the trainees have worked long enough in their areas to want less practical training.
Demand side
12. The community and parents should be involved in supporting their schools. Capacity building of FMCs is essential to improving their effectiveness in improving school activities and management. Currently, KfW and GIZ have two complementary projects, one that builds schools, and the other that builds the capacities of the community and FMCs in the management of their schools, academically and administratively. An evaluation of these projects has shown that they have had a positive impact on parents’ involvement and student enrolment.257 Within a community, a sense of ownership of their schools means parents feel more confident in sending their children, especially girls to school. BEDP2 and the SFD activities also include capacity building of FMCs.
13. The MOE needs to focus on the most vulnerable out-of-school children, such as those in the poorest governorates, children with disabilities, Muhamasheen children, child labourers and internally displaced children in conflict areas. One way to approach this challenge would be for the MOE district offices to partner with local development associations and NGOs to reach out to these children and provide them with remedial education. Volunteer teachers could be recruited and teach these children in the masjid or in the local shaykh’s home. With the incentive of obtaining diplomas as described above, these children could offset the difficulties that had in entering or staying in formal programmes.
Quality
14. Quality and quantity are the overarching goals of the MOE; yet, the objectives, particularly of quality, are not clearly defined. Quality of education must be results-based, affordable and expandable. This means determining what quality education means. We suggest a definition such as the following: “A quality education is one which accomplishes the education goals and objectives of the Government of Yemen.” This would mean that children would master the academic skills put forth in Government documents. An education system that produced these results, as measured by academic performance, would be considered a quality one. Yet, in Yemen the definition of quality education by the MOE and its development partners define quality as building more schools, furnishing classrooms, providing children with school bags, providing CCTs to parents, food rations, etc. Although these material inputs are important and may facilitate access to school, they are not about student learning. What is the use of putting more children through the system if the outcome does not include achieving the basic skills to read and write? Moreover, the material improvements are costly and do not address the problem at hand.
257 Rainer Hampel (2011). Pg. 31.

Yemen Country Report on Out-of-School Children 89
15. Curriculum improvement requires that the MOE address the issue of coverage. The official hours of teaching per year in Yemen is 729.6 hours in primary and 864 hours in secondary education, which is only about 70 per cent of the time used by high-performing systems at the secondary level.258 This teaching time is further compressed by teacher absenteeism and the late delivery of textbooks. Another potential teaching setback is that teachers may not have sufficient knowledge of the content. One way to find this out is to administer the primary grade leaving exams to a sample of teachers to see whether they have sufficient knowledge. In other systems, where coverage is poor, teachers’ content knowledge has proved to be the main problem even when teachers are secondary and college graduates. Changing the curriculum alone will not improve the quality of education. Other issues must also be addressed.
16. The MOE needs to devise a system to deal with teacher absenteeism and ghost teachers. This includes keeping records on teachers’ school attendance. Teacher absenteeism and the ghost teacher phenomenon affect student achievement and reduce the resources available for making improvements in the education system. The MOE does not know how many ghost teachers there are because it lacks credible data. FMCs’ help in supervision, which has proved effective in some projects, can be replicated elsewhere since most schools have FMCs.
The issue of absent teachers cannot be resolved until there are separate payrolls for each school. Subsequently, the school principal would be held accountable for teacher absenteeism and ghost teachers. Involvement of school administrators and FMCs would help and another aid in determining the effectiveness in delivering education is to use student performance data.
When all the parts of the system are working well – including teachers being present, instructional time being sufficient, books being delivered on time – students will be learning. When students are not learning, school principals need to look for why this is the case and, if the problem is teacher absenteeism, then they need to take action to correct the problem. The focus needs to be on performance rather than on rules.
258 Ibid. Pg 15

Middle East and North Africa Out-of-School Children Initiative90
References
Al-Abdali, Samir. . Oxfam and The Higher Council for Motherhood and Childhood (Yemen, 2012)
Al-Dabbi, Belqis, Brief Assessment of Education Situation in the South (Sana’a, Yemen: UNICEF Yemen Country Office, 2013)
Al Fanar Association, Monitoring Report Out-of-School Children Programme (2013) Taiz (Sana’a, Yemen: UNICEF Yemen Country Office, 2013)
Al-Hakami, Noaman A., The Akhdam Category in Yemen: A Comprehensive Study about Akhdam in Yemen (Taiz, Yemen: DIA, 2010)
Al-Mansoob, Mohammed Abdul Kareem, Household & School Survey on the Impact of School Fee Abolition (Sana’a, Yemen: CMT House for UNICEF Yemen Country Office, 2007)
Al-Mashraqi, Asia Abdullah, and Ahmed Mahyoub Alwajeeh, Low Enrolment Rate among Children with Disabilities; the Underlying Reasons Why Most of Them Are out-of-School and Dropout in Yemen (Sana’a, Yemen: Ministry of Education, Republic of Yemen, 2013)
Al-Mekhlafy, Tawfiq, Teacher Absence and the Implementation of the Official MOE Time Table (GIZ, 2013)
Al-Mekhlafy, Tawfiq Ahmad, Performance of Fourth Graders of the Republic of Yemen in TIMSS 2007 (Sana’a, Yemen, 2009)
Al-Sayani, Hamoud, and Elena Matsui, Accelerating Progress to 2015 – Yemen, A Report Series to the UN Special Envoy for Global Education, commissioned by UN Special Envoy for Global Education and coordinated by the Center for Universal Education at the Brookings Institution (Global Education First Initiative and The Good Planet Foundation, 2013)
AYN, and IDSN, UPR Yemen 2014 The Human Rights Situation of Al-Akhdam in Yemen (Sana’a, Yemen: The All Youth Network for Society Development (AYN) and The International Dalit Solidarity Network (IDSN), June 2013) <http://idsn.org/fileadmin/user_folder/pdf/New_files/Yemen/UPR_joint_submission_IDSN_AYN_June_2013FINAL.pdf> [accessed 11 November 2013]
Bloom, Benjamin, Human Characteristics and Student Learning (New York: McGraw Hill, 1976)
Child Protection, Embargoed Report on Attacks on Schools (2013)
Collins, Penelope, and Souhila Messaoud-Galusi, Student Performance on the Early Grade Reading Assessment (EGRA) in Yemen (Sana’a, Yemen: RTI International and USAID, 2012) <http://pdf.usaid.gov/pdf_docs/pnadz047.pdf> [accessed 6 November 2013]
Graham, Sarah, Desk Review on the Prevalence of Violence in Yemeni Schools (Sana’a, Yemen: UNICEF Yemen Country Office, 2012)
Grut, Lisbet, and Benedicte Ingstad, This Is My Life – Living with Disability in Yemen (Oslo, Norway: SINTEF Health Research for the World Bank, 24 September 2006) <http://siteresources.worldbank.org/DISABILITY/Resources/Regions/Africa/LCYemen.pdf> [accessed 17 November 2013]
Guest, Marian, and Ashley Schofield, Consultancy to Support Organisational Development of the Care and Rehabilitation Fund of the Disabled, and the National Union of Disabled Associations (Oxford, UK: Oxford Policy Management for the Social Fund for Development, May 2011) <http://www.opml.co.uk/sites/opml/files/Yemen%20SFD.pdf> [accessed 17 November 2013]

Yemen Country Report on Out-of-School Children 91
Hampel, Rainer, Result-Based Monitoring 2011 Component 3 Community Participation With Special Emphasis On Girls’ Education, General Education Improvement Programme, Sana’a, Yemen (GIZ, 2011)
Hashem, Mouna H., Evaluation `a mi-parcours du Programme Conjoint F-OMD : Accélération de la Lutte Contre la Faim et la Malnutrition dans le sud-est Mauritanien. (UN MDG-F Secrétariat. New York, 2012)
Hashem, Mouna H., Factors That Improve Education Effectiveness in Primary Schools in the Republic of Yemen (University of Michigan, 1992)
Hashem, Mouna. H. and Tietjen Karen (2004)
Human Rights Watch, Child Marriage Spurs Abuse of Girls and Women (Yemen, 2011)
Human Rights Watch, How Come You Allow Little Girls to Get Married? – Child Marriage in Yemen (Sana’a, Yemen, 2011)
Human Rights Watch, Travelling to Yemen Is Travelling To Your Death” Torture Camps, Human Smugglers and Government Complicity in Yemen (Washington, DC, USA:, forthcoming)
IBRD, World Bank and Republic of Yemen, Republic of Yemen Education Status Report Challenges and Opportunities (Washington, DC, USA: World Bank Publications, 2010)
IDSN, Briefing Note on Caste-Based Discrimination in Yemen (Copenhagen: International Dalit Solidarity Network, August 2013) <http://idsn.org/fileadmin/user_folder/pdf/New_files/Yemen/Yemen_Briefing_Note_2013.pdf>
ILO-IPEC, UNICEF, Social Fund for Development, and MoPIC, Working Children in the Republic of Yemen – The Results of the 2010 National Child Labor Survey (Sana’a, Yemen, 2012)
IPC, Policy Research Brief: Out-of-School Children in Yemen: 2012/2013 (Brasilia, Brazil: IPC and UNDP, 2013)
Maas, Lucienne, A Time to Enrol, a Time To Stop – Policies, Perceptions and Practices Influencing the Right to Basic Education in Yemen (Enschede, Netherlands: Ipskamp Drukkers B.V., 2012)
MOE, Cyclical Education Survey (various Years) (Sana’a, Yemen: Republic of Yemen, 2013)
---, Education for All by 2015-Fast Track Initiative Country Credible Plan
---, Eighth Joint Annual Review for the Implementation of the National Strategies for General Education Development – Annual Progress Report on NGEDS Implementation for 2012 (Republic of Yemen, 2013)
---, Yemen Education Sector Plan Mid Term Results Framework 2013-2015 (Sana’a, Yemen: Republic of Yemen, 2013)
---, Yemen Education Sector Plan, Mid Term Results Framework 2013-2015, Draft, 2013
,التقرير الدوري الرابع ملستوى تنفيذ االتفاقية الدولية لحقوق الطفل (2001-2008م ,---
تأثري األزمة التي حدثت خالل العام 2011م. عىل قطاع التعليم ,---
(Sana’a, Yemen, 2013) عرض لخطة برنامج التعليم يف الطوارئ املمول من الرشاكة العاملية ,---
MOE – return to school project, ‘
’ (presented at the OOSCI Core Group Workshop Presentation, Sana’a, Yemen, 2013)
MOE and GIZ, Innovative Interventions – Father and Mother Councils (FMC) General Education Improvement Program 2002 – 2013 (Sana’a, Yemen, 2013)

Middle East and North Africa Out-of-School Children Initiative92
MOPH, UNICEF, and PAPFAM, Yemen Multiple Indicator Cluster Survey 2006 (Sana’a, Yemen: Ministry of Public Health & Population, Pan-Arab Project for Family Health and United Nations Children’s Fund, 2008) <http://www.childinfo.org/files/MICS3_Yemen_FinalReport_2006_Eng.pdf> [accessed 11 May 2013]
MOPIC, IPC, and UNICEF, National Social Protection Monitoring Survey in Yemen – Baseline Analytical Report (Brasilia, Brazil: IPC-UNDP, June 2013)
MOPIC, Social Expenditure through 2000-2012 (Sana’a, Yemen: Republic of Yemen, 2013)
Nijhowne, Diya, ‘Communication to Gudrun Orth on Attacks on Schools in Yemen from the Global Coalition to Protect Education from Attack’, 27 March 2013
OCHA, Yemen: Humanitarian Response Plan 2013
Republic of Yemen, The Presidency of Council of Ministries, UNICEF, ECD Resource Center, The National Strategies for Early Childhood Development 2012-2016
Republic of Yemen Ministry of Education, Education Development Projects Administration Unit, BEDP2 (2013-2107)
Rugh, A and H. Bossert, Involving Communities: Participation in the Delivery of Education Programs Creative Associates (USAID ABEL Project 1998)
Rugh, Andrea, “Models, Policy Options, and Strategies: A Discussion Paper in Support of Afghan Education,” UNICEF. 2001
Qirbi, Azziza, ‘Prevalence of Childhood Disabilities in Yemen Arab Republic’, International Journal of Special Education, 2 (1987), 69–79
Qube, An Evaluation Study on the Impact of Country Female Teachers’ Existence on Girls’ Enrolment and Retention in Basic Education (English Executive Summary, Original in Arabic) (UNICEF Yemen Country Office, 2009)
Qube, (Sana’a, Yemen: UNICEF Yemen Country Office, 2009)
Ba-Saddik, A.S., and A.S. Hattab, ‘Physical Abuse in Basic-Education Schools in Aden Governorate, Yemen: A Cross-Sectional Study’, Eastern Mediterranean Health Journal, 19 (2013), 337
Seeger, Anna, and Gentjana Sula, Feasibility Study of the Possible Use of ICT in Education in Yemen, Draft (Sana’a, Yemen: GIZ, 2013)
Seif, Huda Gerard, Situation Analysis on the Status of Protection, Education, Health, Water and Sanitation among ‘Al-Akhdam’ Children in Yemen (Sana’a, Yemen: UNICEF Yemen Country Office, 2013)
Social Fund For Development, Annual Report 2011, Republic of Yemen
UCW, Child Labour and out-of-School Children in MENA: A Statistical Profile (Rome, Italy, 2013)
UIS, ‘Data Center Readers Guide’, 2013 <http://stats.uis.unesco.org/unesco/tableviewer/document.aspx?FileId=140> [accessed 20 November 2013]
---, Data Centre (Montreal, Canada: UNESCO Institute for Statistics, 2013) <http://stats.uis.unesco.org/unesco/TableViewer/document.aspx?ReportId=143&IF_Language=eng> [accessed 24 September 2013]
---, ‘FAQ – Why Do National and International Education Data Sometimes Differ?’, 2013 <http://www.uis.unesco.org/Education/Pages/FAQ.aspx> [accessed 2 December 2013]
---, Out-of-School Children (OOSC) in Yemen, 2012
UNDP, International Human Development Indicators, 2012
http://unesdoc.unesco.org/images/0012/001279/127983e.pdf
UNICEF, Accelerating Girls’ Education in Yemen: Rethinking Policies in Teacher Recruitment and School Distribution (New York, 2007)
Yemen Country Report on Out-of-School Children 93
---, Attacks on Schools – DRAFT Not for Circulation, (Sana’a, Yemen, 2013)
---, Baseline Survey Report (Sana’a, Yemen, 2013)
UNICEF, and Government of Yemen, Proposal to the Global Partnership for Education for a Catalytic Contribution towards Implementation of Yemen’s Education Sector Plan 2013-2015 – Final Programme Document for GPE Grant Application, 2013
UNICEF and MOPIC, Situation Analysis of Children in Yemen 2014 (Sana’a, Yemen: UNICEF, 2014)
United Nations General Assembly Security Council, Children and Armed Conflict – Report of the Secretary General, A/67/845–S/2013/245 (New York: United Nations, 2013)
United Nations Secretary General Global Initiative on Education. Accelerating Progress to 2015 Yemen. Working Paper April 2013
United Nations Security Council, Report of the Secretary-General on Children and Armed Conflict in Yemen, S/2013/383 (New York: United Nations, 2013)
USAID Yemen (2013), Improved Reading Performance in Yemeni Schools, Impact Assessment Report on the Yemeni Early Grade Reading Assessment Phase 1: 2012-2013
Van der Straaten, Jaap, Towards Universal Birth Registration In Yemen – Situation Assessment and Recommendations for Government and UNICEF, Version 3 (The Hague, Netherlands: Civil Registration Centre for Development—CRC4D, 2013)
WASL Project, Summary: Opinions, Issues, Aspirations and Challenges Facing Yemeni Adolescents, Yemeni Adolescents Rights and Issues Document, First Draft (Sana’a, Yemen, 2013)
WFP, Development Projects – Yemen 200432 – Food Assistance to Promote Girls’ Education, WFP/EB.A/2013/9-A/2 (Rome, Italy, 2013)
---, Summary Evaluation Report – Yemen Country Portfolio, WFP/EB.2/2011/6-E (Rome, Italy, 2011)
---, The State of Food Security and Nutrition in Yemen – Comprehensive Food Security Survey (Sana’a, Yemen, 2012)
World Bank, Tracking Basic Education Expenditures in Yemen: Analyses of Public Resource Management and Teacher Absenteeism (Washington, DC, USA: World Bank Publications, 2006)
World Bank, United Nations, European Union, and Islamic Development Bank, Joint Social and Economic Assessment – Republic of Yemen (Sana’a, Yemen, 2013)
Yuki, Takako, and Yuriko Kameyama, ‘Improving the Quality of Basic Education for the Future Youth of Yemen Post Arab Spring’, Brookings Institution Working Paper, 59 (2013) <http://www.brookings.edu/research/papers/2013/01/education-yemen-yuki-kameyama> [accessed 5 November 2013]
Zyck, Steven A, Education-Focused Conflict Analysis of the Republic of Yemen – NOT FOR CIRCULATION OR CITATION, Draft Final report (Sana’a, Yemen: UNICEF Yemen Country Office, 2013)
<http://www.aljazeera-online.net/index.php?t=9&id=21> [accessed 5 2008, November 2013]
(Sana’a, Yemen: MOE, 2007) الصالحى, .فؤاد, ملخص لدراسة أطفال الشوارع يف اليمن
and (Sana’a, Yemen and MOE, financed by UNICEF, 2012)


Yemen Country Report on Out-of-School Children 95
Annexes
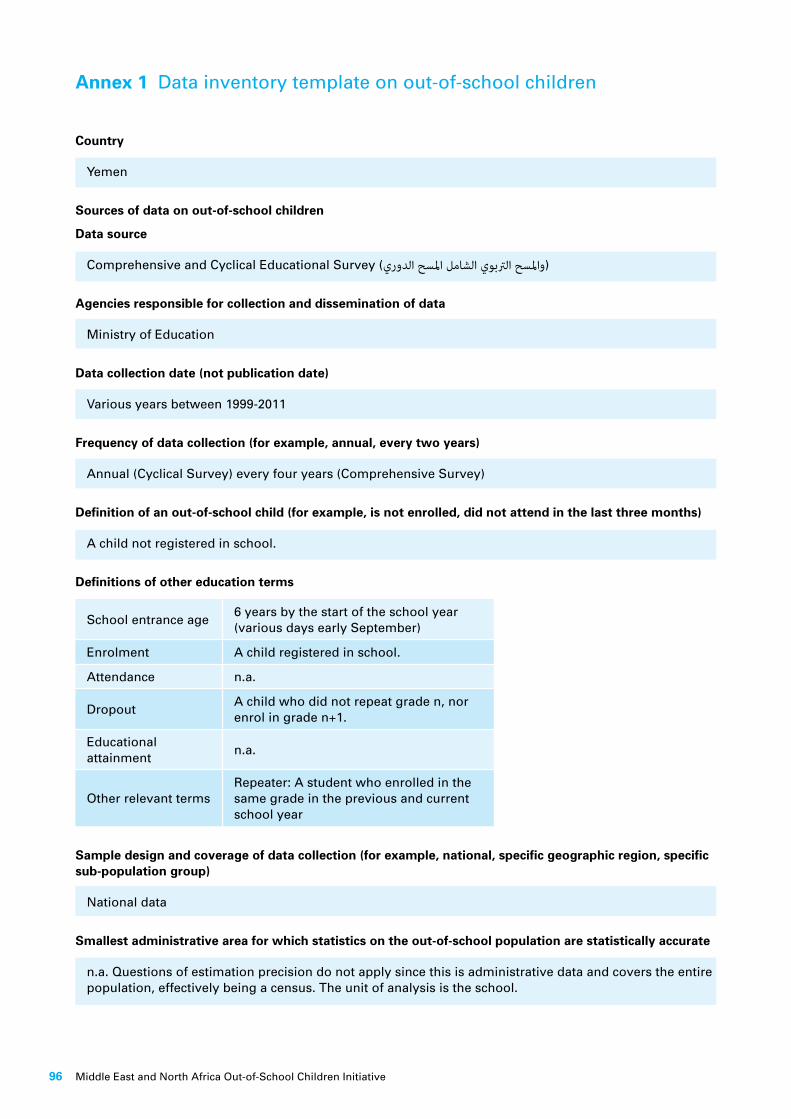
Middle East and North Africa Out-of-School Children Initiative96
Annex 1 Data inventory template on out-of-school children
Country
Yemen
Sources of data on out-of-school children
Data source
Comprehensive and Cyclical Educational Survey (واملسح الرتبوي الشامل املسح الدوري)
Agencies responsible for collection and dissemination of data
Ministry of Education
Data collection date (not publication date)
Various years between 1999-2011
Frequency of data collection (for example, annual, every two years)
Annual (Cyclical Survey) every four years (Comprehensive Survey)
Definition of an out-of-school child (for example, is not enrolled, did not attend in the last three months)
A child not registered in school.
Definitions of other education terms
School entrance age6 years by the start of the school year (various days early September)
Enrolment A child registered in school.
Attendance n.a.
DropoutA child who did not repeat grade n, nor enrol in grade n+1.
Educational attainment
n.a.
Other relevant termsRepeater: A student who enrolled in the same grade in the previous and current school year
Sample design and coverage of data collection (for example, national, specific geographic region, specific sub-population group)
National data
Smallest administrative area for which statistics on the out-of-school population are statistically accurate
n.a. Questions of estimation precision do not apply since this is administrative data and covers the entire population, effectively being a census. The unit of analysis is the school.
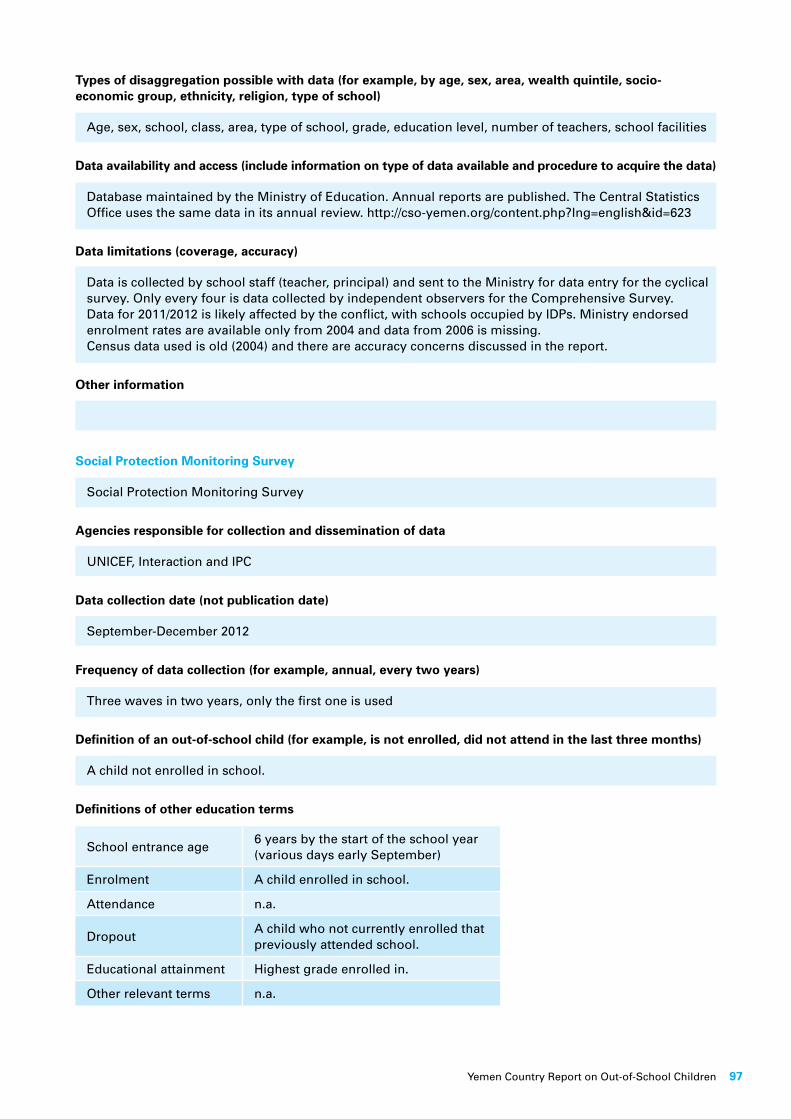
Yemen Country Report on Out-of-School Children 97
Types of disaggregation possible with data (for example, by age, sex, area, wealth quintile, socio-economic group, ethnicity, religion, type of school)
Age, sex, school, class, area, type of school, grade, education level, number of teachers, school facilities
Data availability and access (include information on type of data available and procedure to acquire the data)
Database maintained by the Ministry of Education. Annual reports are published. The Central Statistics Office uses the same data in its annual review. http://cso-yemen.org/content.php?Ing=english&id=623
Data limitations (coverage, accuracy)
Data is collected by school staff (teacher, principal) and sent to the Ministry for data entry for the cyclical survey. Only every four is data collected by independent observers for the Comprehensive Survey. Data for 2011/2012 is likely affected by the conflict, with schools occupied by IDPs. Ministry endorsed enrolment rates are available only from 2004 and data from 2006 is missing. Census data used is old (2004) and there are accuracy concerns discussed in the report.
Other information
Social Protection Monitoring Survey
Social Protection Monitoring Survey
Agencies responsible for collection and dissemination of data
UNICEF, Interaction and IPC
Data collection date (not publication date)
September-December 2012
Frequency of data collection (for example, annual, every two years)
Three waves in two years, only the first one is used
Definition of an out-of-school child (for example, is not enrolled, did not attend in the last three months)
A child not enrolled in school.
Definitions of other education terms
School entrance age6 years by the start of the school year (various days early September)
Enrolment A child enrolled in school.
Attendance n.a.
DropoutA child who not currently enrolled that previously attended school.
Educational attainment Highest grade enrolled in.
Other relevant terms n.a.

Middle East and North Africa Out-of-School Children Initiative98
Sample design and coverage of data collection (for example, national, specific geographic region, specific sub-population group)
National
Smallest administrative area for which statistics on the out-of-school population are statistically accurate
Sample design has been such that estimators are unbiased. A reasonable level of precision can be obtained at the governorate level.
Types of disaggregation possible with data (for example, by age, sex, area, wealth quintile, socio-economic group, ethnicity, religion, type of school)
Age, sex, grade, education level, household characteristics
Data availability and access (include information on type of data available and procedure to acquire the data)
Owned by UNICEF and IPC. Full data set only available in 2014, until that date IPC does carry out analyses for us.
Data limitations (coverage, accuracy)
Sa’ada excluded from first wave
Other information
Baseline Survey
UNICEF Baseline Survey 2013
Agencies responsible for collection and dissemination of data
UNICEF with Yemeni Central Statistics Office
Data collection date (not publication date)
February -March 2013
Frequency of data collection (for example, annual, every two years)
One off (may be repeated at end of current county program)
Definition of an out-of-school child (for example, is not enrolled, did not attend in the last three months)
A child not enrolled in school.

Yemen Country Report on Out-of-School Children 99
Definitions of other education terms
School entrance age6 years by the start of the school year (various days early September)
Enrolment A child registered in school.
Attendance n.a.
DropoutA child who did not repeat grade n, nor enrol in grade n+1.
Educational attainment Highest grade enrolled in.
Other relevant termsRepeater: A student who enrolled in the same grade in the previous and current school year
Sample design and coverage of data collection (for example, national, specific geographic region, specific sub-population group)
Only UNICEF target districts
Smallest administrative area for which statistics on the out-of-school population are statistically accurate
Sample design has been such that estimators are unbiased. A reasonable level of precision can be obtained at the strata level. The sample has been split into five strata.
Types of disaggregation possible with data (for example, by age, sex, area, wealth quintile, socio-economic group, ethnicity, religion, type of school)
Age, sex, grade, education level, household characteristics
Data availability and access (include information on type of data available and procedure to acquire the data)
Owned by UNICEF
Data limitations (coverage, accuracy)
Sa’ada excluded.
Other information
Child Labour Survey
Child Labour Survey
Agencies responsible for collection and dissemination of data
ILO-IPEC, Social Fund for Development, UNICEF
Data collection date (not publication date)
May 2010

Middle East and North Africa Out-of-School Children Initiative100
Frequency of data collection (for example, annual, every two years)
One off
Definition of an out-of-school child (for example, is not enrolled, did not attend in the last three months)
A child not attending school.
Definitions of other education terms
School entrance age6 years by the start of the school year (various days early September)
Enrolment n.a.
Attendance A child attending school.
DropoutA child no longer in school but previously enrolled.
Educational attainment Highest grade attended.
Other relevant terms n.a.
Sample design and coverage of data collection (for example, national, specific geographic region, specific sub-population group)
National
Smallest administrative area for which statistics on the out-of-school population are statistically accurate
Sample design has been such that estimators are unbiased. A reasonable level of precision can be obtained at the urban/rural and national level.
Types of disaggregation possible with data (for example, by age, sex, area, wealth quintile, socio-economic group, ethnicity, religion, type of school)
Age, sex, grade, education level, household characteristics
Data availability and access (include information on type of data available and procedure to acquire the data)
Owned by ILO.
Data limitations (coverage, accuracy)
Sa’ada excluded.
Other information
Multiple Indicator Cluster Survey 2006
MICS 2006
Agencies responsible for collection and dissemination of data
Ministry of Health, PAPFAM, UNICEF

Yemen Country Report on Out-of-School Children 101
Data collection date (not publication date)
August 2006
Frequency of data collection (for example, annual, every two years)
Irregular, alternating with DHS
Definition of an out-of-school child (for example, is not enrolled, did not attend in the last three months)
A child not attending school.
Definitions of other education terms
School entrance age6 years by the start of the school year (various days early September)
Enrolment n.a.
Attendance A child attending school.
DropoutA child who did not repeat grade n, nor attend in grade n+1.
Educational attainment Highest grade attended.
Other relevant termsRepeater: A student who attended in the same grade in the previous and current school year
Sample design and coverage of data collection (for example, national, specific geographic region, specific sub-population group)
National
Smallest administrative area for which statistics on the out-of-school population are statistically accurate
Sample design has been such that estimators are unbiased. A reasonable level of precision can be obtained at the urban/rural and national level.
Types of disaggregation possible with data (for example, by age, sex, area, wealth quintile, socio-economic group, ethnicity, religion, type of school)
Age, sex, grade, education level, household characteristics
Data availability and access (include information on type of data available and procedure to acquire the data)
Owned by UNICEF.
Data limitations (coverage, accuracy)
Other information

Middle East and North Africa Out-of-School Children Initiative102
Annex 2 Data quality assessment worksheets
YemenName of data source:
Comprehensive and Cyclical Educational Survey (املسح الدوري واملسح الرتبوي الشامل)
Score Data source assessment criteria: value
1. Age: When were the data collected (not published)?
(1) o 6-10 years ago (2003-2007)
(2) o 3-5 years ago (2008-2010)
(3) ox Within the last 2 years (2011-present)
2. Frequency: How often are the data collected? (Possibility of time series data)
(1) o The data are from a one-time collection
(2) o The data are from a repeated or periodic collection (For example: every 3-5 years)
(3) ox The data are from an annual or semi-annual collection
3. Accuracy of age data: How are children’s age data collected?
(1) o Age data not reported
(2) ox Age data for children are collected from the teacher or household respondent
(3) o Age data for children are collected from official records (birth certificate, etc.)
4. Ease of access: What is the procedure to acquire access to the dataset in standard format for analysis (raw, unit level)?
(1) o Data access procedure is time consuming and likelihood of access is uncertain
(2) ox Data access procedure is time consuming and likelihood of access is certain
(3) o Data access procedure is not time consuming and likelihood of access is certain
5. Software expertise required for data analysis: Is there sufficient capacity in the software generally used to analyze this data?
(1) o Insufficient capacity
(2) o Some capacity or possibility of training or support
(3) ox Sufficient capacity
6. Purpose: To what extent was this data source designed to collect data on education? (Consider whether it includes a specific education module, coverage of appropriate age groups, sample design (if survey))
(1) o Data collection not intended for generating education statistics (labour force, health, etc.)
(2) o Data collection is intended for generating statistics on education and other sectors (health and education)
(3) ox Data collection primarily intended for generating education statistics
7. Coverage of age data: For which ages are data on current school attendance collected?
(1) o Primary and lower secondary age
(2) ox Pre-primary to upper secondary age
(3) o Pre-primary to tertiary age
8. Coverage of education levels: For which levels of education are attendance data collected?
(1) o Primary education
(2) ox Primary and secondary education NOTE: only enrolment data is collected
(3) o Pre-primary to tertiary education

Yemen Country Report on Out-of-School Children 103
9. Coverage of educational institution types: Are data collected on (or do they include) all types of educational institutions in the country (Example: public, private, NGO, religious, community or unregistered schools)?
(1) o Data collection excludes some important types of educational institutions
(2) ox Data collection includes most types of educational institutions
(3) o Data collection includes all types of educational institutions
10. Usefulness for disaggregated data analysis: What is the smallest administrative area for which the data source is designed to provide reliable and representative statistics on out-of-school children?NOTE: criteria of precision do not apply to census type data. I counted it as ‘3’ in the score.
(1) o National level only
(2) o Macro administrative region (for example, state or province) and area of residence (urban/rural)
(3) ox Micro administrative region (for example, district or village)
11. Usefulness for identifying characteristics of out-of-school children: To what extent is disaggregation (sub-national analysis) possible with this data source (for example, by age, sex, area, wealth, disability, ethnicity, region, and child labour status)?
(1) o Limited disaggregation possible (for example, only by sex)
(2) ox Some disaggregation possible, but some important groups are not available (for example, analysis by area of residence and wealth quintile is possible, but not ethnicity or disability)
NOTE: disaggregation along school criteria is possible (number of female teachers, availability of bathrooms etc. not however along household characteristics.
(3) o Significant disaggregation possible, including most high priority groups (for example, by disability, child labour status, etc.)
Consider the definitions of the following key terms used in the data source:l School participation (What is the definition of “in school”?)l School dropout (What kind of school absence is considered “dropping out”?)l Educational attainmentl Other relevant terms
12. Consistency of education terms: How would you rate these terms on their consistency with standard international definitions? (UIS indicator and education term definitions can be found in Arabic, English and French in the UIS Glossary (www.uis.unesco.org/Pages/Glossary.aspx), and the UIS Global Education Digest)
(1) o Very few education terms are consistent with standard definitions
(2) ox Some education terms are consistent with standard definitions
(3) o Most education terms are consistent with standard definitions
13. Comparability of education terms: How comparable are the definitions with other national data sources?
(1) o Very few education terms are comparable with other national data sources
(2) ox Some education terms are comparable with other national data sources
(3) o Most education terms are comparable with other national data sources
Additional criteria relevant to household survey data sources
14. Data coverage of population of interest: To what extent has the data source considered coverage of disadvantaged groups in its data collection (sample design)?
(1) ox Sample design does not explicitly consider coverage of disadvantaged groups NOTE: I understand this to mean that disadvantaged groups (such as the Muhammasheen or disabled children)
are not identified or separately sampled.
(2) o Sample design considers coverage of some disadvantaged groups
(3) o Sample design considers coverage of many disadvantaged groups
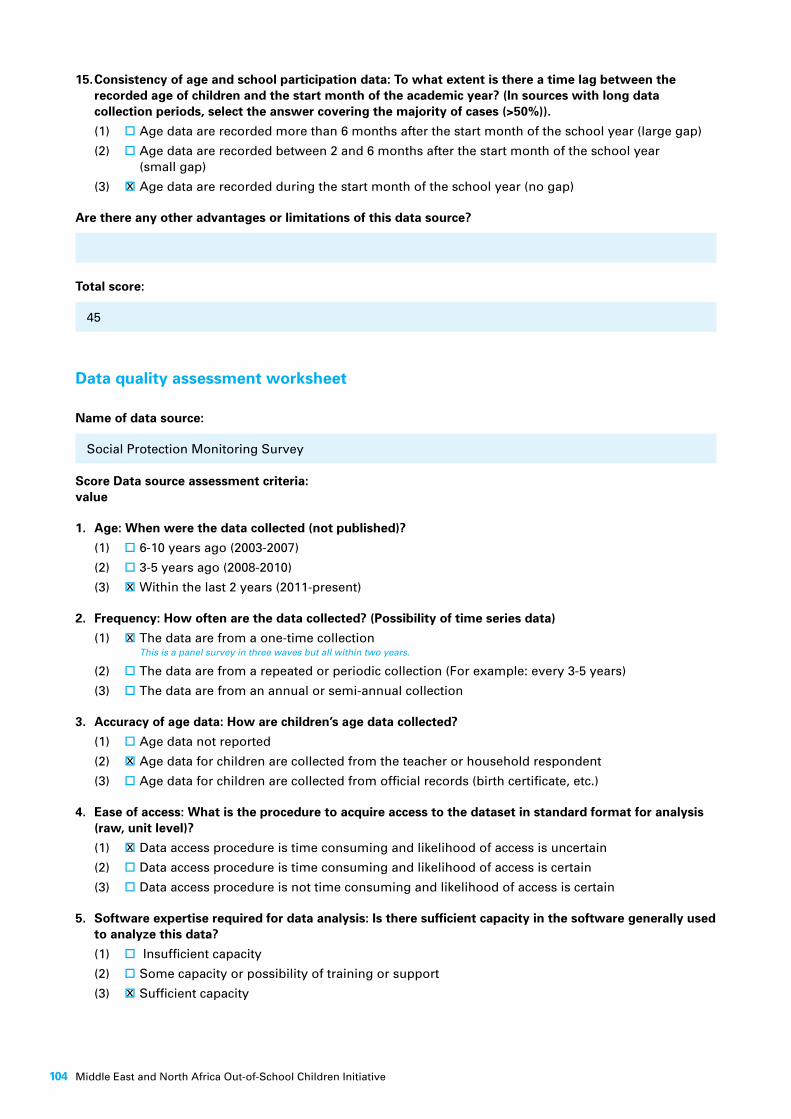
Middle East and North Africa Out-of-School Children Initiative104
15. Consistency of age and school participation data: To what extent is there a time lag between the recorded age of children and the start month of the academic year? (In sources with long data collection periods, select the answer covering the majority of cases (>50%)).
(1) o Age data are recorded more than 6 months after the start month of the school year (large gap)
(2) o Age data are recorded between 2 and 6 months after the start month of the school year (small gap)
(3) ox Age data are recorded during the start month of the school year (no gap)
Are there any other advantages or limitations of this data source?
Total score:
45
Data quality assessment worksheet
Name of data source:
Social Protection Monitoring Survey
Score Data source assessment criteria: value
1. Age: When were the data collected (not published)?
(1) o 6-10 years ago (2003-2007)
(2) o 3-5 years ago (2008-2010)
(3) ox Within the last 2 years (2011-present)
2. Frequency: How often are the data collected? (Possibility of time series data)
(1) ox The data are from a one-time collection This is a panel survey in three waves but all within two years.
(2) o The data are from a repeated or periodic collection (For example: every 3-5 years)
(3) o The data are from an annual or semi-annual collection
3. Accuracy of age data: How are children’s age data collected?
(1) o Age data not reported
(2) ox Age data for children are collected from the teacher or household respondent
(3) o Age data for children are collected from official records (birth certificate, etc.)
4. Ease of access: What is the procedure to acquire access to the dataset in standard format for analysis (raw, unit level)?
(1) ox Data access procedure is time consuming and likelihood of access is uncertain
(2) o Data access procedure is time consuming and likelihood of access is certain
(3) o Data access procedure is not time consuming and likelihood of access is certain
5. Software expertise required for data analysis: Is there sufficient capacity in the software generally used to analyze this data?
(1) o Insufficient capacity
(2) o Some capacity or possibility of training or support
(3) ox Sufficient capacity
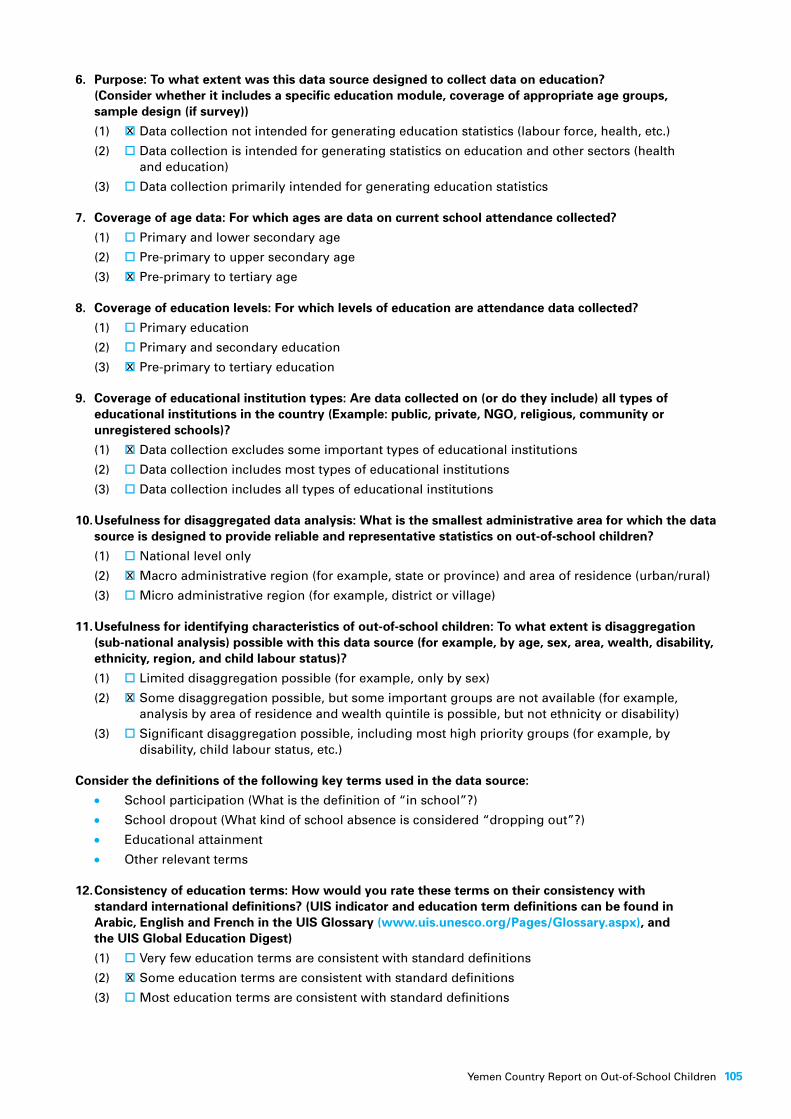
Yemen Country Report on Out-of-School Children 105
6. Purpose: To what extent was this data source designed to collect data on education? (Consider whether it includes a specific education module, coverage of appropriate age groups, sample design (if survey))
(1) ox Data collection not intended for generating education statistics (labour force, health, etc.)
(2) o Data collection is intended for generating statistics on education and other sectors (health and education)
(3) o Data collection primarily intended for generating education statistics
7. Coverage of age data: For which ages are data on current school attendance collected?
(1) o Primary and lower secondary age
(2) o Pre-primary to upper secondary age
(3) ox Pre-primary to tertiary age
8. Coverage of education levels: For which levels of education are attendance data collected?
(1) o Primary education
(2) o Primary and secondary education
(3) ox Pre-primary to tertiary education
9. Coverage of educational institution types: Are data collected on (or do they include) all types of educational institutions in the country (Example: public, private, NGO, religious, community or unregistered schools)?
(1) ox Data collection excludes some important types of educational institutions
(2) o Data collection includes most types of educational institutions
(3) o Data collection includes all types of educational institutions
10. Usefulness for disaggregated data analysis: What is the smallest administrative area for which the data source is designed to provide reliable and representative statistics on out-of-school children?
(1) o National level only
(2) ox Macro administrative region (for example, state or province) and area of residence (urban/rural)
(3) o Micro administrative region (for example, district or village)
11. Usefulness for identifying characteristics of out-of-school children: To what extent is disaggregation (sub-national analysis) possible with this data source (for example, by age, sex, area, wealth, disability, ethnicity, region, and child labour status)?
(1) o Limited disaggregation possible (for example, only by sex)
(2) ox Some disaggregation possible, but some important groups are not available (for example, analysis by area of residence and wealth quintile is possible, but not ethnicity or disability)
(3) o Significant disaggregation possible, including most high priority groups (for example, by disability, child labour status, etc.)
Consider the definitions of the following key terms used in the data source:l School participation (What is the definition of “in school”?)l School dropout (What kind of school absence is considered “dropping out”?)l Educational attainmentl Other relevant terms
12. Consistency of education terms: How would you rate these terms on their consistency with standard international definitions? (UIS indicator and education term definitions can be found in Arabic, English and French in the UIS Glossary (www.uis.unesco.org/Pages/Glossary.aspx), and the UIS Global Education Digest)
(1) o Very few education terms are consistent with standard definitions
(2) ox Some education terms are consistent with standard definitions
(3) o Most education terms are consistent with standard definitions

Middle East and North Africa Out-of-School Children Initiative106
13. Comparability of education terms: How comparable are the definitions with other national data sources?
(1) o Very few education terms are comparable with other national data sources
(2) ox Some education terms are comparable with other national data sources
(3) o Most education terms are comparable with other national data sources
Additional criteria relevant to household survey data sources
14. Data coverage of population of interest: To what extent has the data source considered coverage of disadvantaged groups in its data collection (sample design)?
(1) o Sample design does not explicitly consider coverage of disadvantaged groups
(2) ox Sample design considers coverage of some disadvantaged groups
(3) o Sample design considers coverage of many disadvantaged groups
15. Consistency of age and school participation data: To what extent is there a time lag between the recorded age of children and the start month of the academic year? (In sources with long data collection periods, select the answer covering the majority of cases (>50%)).
(1) o Age data are recorded more than 6 months after the start month of the school year (large gap)
(2) ox Age data are recorded between 2 and 6 months after the start month of the school year (small gap)
(3) o Age data are recorded during the start month of the school year (no gap)
Are there any other advantages or limitations of this data source?
Total score:
30
Data quality assessment worksheet
Name of data source:
Baseline Survey
Score Data source assessment criteria: value
1. Age: When were the data collected (not published)?
(1) o 6-10 years ago (2003-2007)
(2) o 3-5 years ago (2008-2010)
(3) ox Within the last 2 years (2011-present)
2. Frequency: How often are the data collected? (Possibility of time series data)
(1) ox The data are from a one-time collection
(2) o The data are from a repeated or periodic collection (For example: every 3-5 years)
(3) o The data are from an annual or semi-annual collection
3. Accuracy of age data: How are children’s age data collected?
(1) o Age data not reported
(2) ox Age data for children are collected from the teacher or household respondent
(3) o Age data for children are collected from official records (birth certificate, etc.)

Yemen Country Report on Out-of-School Children 107
4. Ease of access: What is the procedure to acquire access to the dataset in standard format for analysis (raw, unit level)?
(1) o Data access procedure is time consuming and likelihood of access is uncertain
(2) o Data access procedure is time consuming and likelihood of access is certain
(3) ox Data access procedure is not time consuming and likelihood of access is certain
5. Software expertise required for data analysis: Is there sufficient capacity in the software generally used to analyze this data?
(1) o Insufficient capacity
(2) o Some capacity or possibility of training or support
(3) ox Sufficient capacity
6. Purpose: To what extent was this data source designed to collect data on education? (Consider whether it includes a specific education module, coverage of appropriate age groups, sample design (if survey))
(1) o Data collection not intended for generating education statistics (labour force, health, etc.)
(2) ox Data collection is intended for generating statistics on education and other sectors (health and education)
(3) o Data collection primarily intended for generating education statistics
7. Coverage of age data: For which ages are data on current school attendance collected?
(1) o Primary and lower secondary age
(2) o Pre-primary to upper secondary age
(3) ox Pre-primary to tertiary age
8. Coverage of education levels: For which levels of education are attendance data collected?
(1) o Primary education
(2) o Primary and secondary education
(3) ox Pre-primary to tertiary education
9. Coverage of educational institution types: Are data collected on (or do they include) all types of educational institutions in the country (Example: public, private, NGO, religious, community or unregistered schools)?
(1) ox Data collection excludes some important types of educational institutions
(2) o Data collection includes most types of educational institutions
(3) o Data collection includes all types of educational institutions
10. Usefulness for disaggregated data analysis: What is the smallest administrative area for which the data source is designed to provide reliable and representative statistics on out-of-school children?
Note: Only sub-national level data are available.
(1) ox National level only
(2) o Macro administrative region (for example, state or province) and area of residence (urban/rural)
(3) o Micro administrative region (for example, district or village)
11. Usefulness for identifying characteristics of out-of-school children: To what extent is disaggregation (sub-national analysis) possible with this data source (for example, by age, sex, area, wealth, disability, ethnicity, region, and child labour status)?
(1) o Limited disaggregation possible (for example, only by sex)
(2) ox Some disaggregation possible, but some important groups are not available (for example, analysis by area of residence and wealth quintile is possible, but not ethnicity or disability)
(3) o Significant disaggregation possible, including most high priority groups (for example, by disability, child labour status, etc.)
Middle East and North Africa Out-of-School Children Initiative108
Consider the definitions of the following key terms used in the data source:l School participation (What is the definition of “in school”?)l School dropout (What kind of school absence is considered “dropping out”?)l Educational attainmentl Other relevant terms
12. Consistency of education terms: How would you rate these terms on their consistency with standard international definitions? (UIS indicator and education term definitions can be found in Arabic, English and French in the UIS Glossary (www.uis.unesco.org/Pages/Glossary.aspx), and the UIS Global Education Digest)
(1) o Very few education terms are consistent with standard definitions
(2) o Some education terms are consistent with standard definitions
(3) ox Most education terms are consistent with standard definitions
13. Comparability of education terms: How comparable are the definitions with other national data sources?
(1) o Very few education terms are comparable with other national data sources
(2) ox Some education terms are comparable with other national data sources
(3) o Most education terms are comparable with other national data sources
Additional criteria relevant to household survey data sources
14. Data coverage of population of interest: To what extent has the data source considered coverage of disadvantaged groups in its data collection (sample design)?
(1) ox Sample design does not explicitly consider coverage of disadvantaged groups
(2) o Sample design considers coverage of some disadvantaged groups
(3) o Sample design considers coverage of many disadvantaged groups
15.Consistency of age and school participation data: To what extent is there a time lag between the recorded age of children and the start month of the academic year? (In sources with long data collection periods, select the answer covering the majority of cases (>50%)).
(1) o Age data are recorded more than 6 months after the start month of the school year (large gap)
(2) ox Age data are recorded between 2 and 6 months after the start month of the school year (small gap)
(3) o Age data are recorded during the start month of the school year (no gap)
Are there any other advantages or limitations of this data source?
Total score:
32

Yemen Country Report on Out-of-School Children 109
Data quality assessment worksheet
Name of data source:
Child Labour Survey
Score Data source assessment criteria: value
1. Age: When were the data collected (not published)?
(1) o 6-10 years ago (2003-2007)
(2) ox 3-5 years ago (2008-2010)
(3) o Within the last 2 years (2011-present)
2. Frequency: How often are the data collected? (Possibility of time series data)
(1) ox The data are from a one-time collection
(2) o The data are from a repeated or periodic collection (For example: every 3-5 years)
(3) o The data are from an annual or semi-annual collection
3. Accuracy of age data: How are children’s age data collected?
(1) o Age data not reported
(2) ox Age data for children are collected from the teacher or household respondent
(3) o Age data for children are collected from official records (birth certificate, etc.)
4. Ease of access: What is the procedure to acquire access to the dataset in standard format for analysis (raw, unit level)?
(1) o Data access procedure is time consuming and likelihood of access is uncertain
(2) o Data access procedure is time consuming and likelihood of access is certain
(3) ox Data access procedure is not time consuming and likelihood of access is certain
5 Software expertise required for data analysis: Is there sufficient capacity in the software generally used to analyze this data?
(1) o Insufficient capacity
(2) o Some capacity or possibility of training or support
(3) ox Sufficient capacity
6. Purpose: To what extent was this data source designed to collect data on education? (Consider whether it includes a specific education module, coverage of appropriate age groups, sample design (if survey))
(1) ox Data collection not intended for generating education statistics (labour force, health, etc.)
(2) o Data collection is intended for generating statistics on education and other sectors (health and education)
(3) o Data collection primarily intended for generating education statistics
7. Coverage of age data: For which ages are data on current school attendance collected?
(1) o Primary and lower secondary age
(2) ox Pre-primary to upper secondary age
(3) o Pre-primary to tertiary age
8. Coverage of education levels: For which levels of education are attendance data collected?
(1) o Primary education
(2) o Primary and secondary education
(3) ox Pre-primary to tertiary education

Middle East and North Africa Out-of-School Children Initiative110
9. Coverage of educational institution types: Are data collected on (or do they include) all types of educational institutions in the country (Example: public, private, NGO, religious, community or unregistered schools)?
(1) ox Data collection excludes some important types of educational institutions
(2) o Data collection includes most types of educational institutions
(3) o Data collection includes all types of educational institutions
10. Usefulness for disaggregated data analysis: What is the smallest administrative area for which the data source is designed to provide reliable and representative statistics on out-of-school children?
(1) o National level only
(2) ox Macro administrative region (for example, state or province) and area of residence (urban/rural)
(3) o Micro administrative region (for example, district or village)
11. Usefulness for identifying characteristics of out-of-school children: To what extent is disaggregation (sub-national analysis) possible with this data source (for example, by age, sex, area, wealth, disability, ethnicity, region, and child labour status)?
(1) o Limited disaggregation possible (for example, only by sex)
(2) ox Some disaggregation possible, but some important groups are not available (for example, analysis by area of residence and wealth quintile is possible, but not ethnicity or disability)
(3) o Significant disaggregation possible, including most high priority groups (for example, by disability, child labour status, etc.)
Consider the definitions of the following key terms used in the data source:l School participation (What is the definition of “in school”?)l School dropout (What kind of school absence is considered “dropping out”?)l Educational attainmentl Other relevant terms
12. Consistency of education terms: How would you rate these terms on their consistency with standard international definitions? (UIS indicator and education term definitions can be found in Arabic, English and French in the UIS Glossary (www.uis.unesco.org/Pages/Glossary.aspx), and the UIS Global Education Digest)
(1) o Very few education terms are consistent with standard definitions
(2) ox Some education terms are consistent with standard definitions
(3) o Most education terms are consistent with standard definitions
13. Comparability of education terms: How comparable are the definitions with other national data sources?
(1) o Very few education terms are comparable with other national data sources
(2) ox Some education terms are comparable with other national data sources
(3) o Most education terms are comparable with other national data sources
Additional criteria relevant to household survey data sources
14. Data coverage of population of interest: To what extent has the data source considered coverage of disadvantaged groups in its data collection (sample design)?
(1) ox Sample design does not explicitly consider coverage of disadvantaged groups
(2) o Sample design considers coverage of some disadvantaged groups
(3) o Sample design considers coverage of many disadvantaged groups

Yemen Country Report on Out-of-School Children 111
15. Consistency of age and school participation data: To what extent is there a time lag between the recorded age of children and the start month of the academic year? (In sources with long data collection periods, select the answer covering the majority of cases (>50%)).
(1) ox Age data are recorded more than 6 months after the start month of the school year (large gap)
(2) o Age data are recorded between 2 and 6 months after the start month of the school year (small gap)
(3) o Age data are recorded during the start month of the school year (no gap)
Are there any other advantages or limitations of this data source?
Total score:
28
Data quality assessment worksheet
Name of data source:
Multiple Indicator Cluster Survey 2006
Score Data source assessment criteria: value
1. Age: When were the data collected (not published)?
(1) ox 6-10 years ago (2003-2007) This is not negative since the survey is used for historical comparison.
(2) o 3-5 years ago (2008-2010)
(3) o Within the last 2 years (2011-present)
2. Frequency: How often are the data collected? (Possibility of time series data)
(1) o The data are from a one-time collection
(2) ox The data are from a repeated or periodic collection (For example: every 3-5 years)
(3) o The data are from an annual or semi-annual collection
3. Accuracy of age data: How are children’s age data collected?
(1) o Age data not reported
(2) ox Age data for children are collected from the teacher or household respondent
(3) o Age data for children are collected from official records (birth certificate, etc.)
4. Ease of access: What is the procedure to acquire access to the dataset in standard format for analysis (raw, unit level)?
(1) o Data access procedure is time consuming and likelihood of access is uncertain
(2) ox Data access procedure is time consuming and likelihood of access is certain
(3) o Data access procedure is not time consuming and likelihood of access is certain
5. Software expertise required for data analysis: Is there sufficient capacity in the software generally used to analyze this data?
(1) o Insufficient capacity
(2) o Some capacity or possibility of training or support
(3) ox Sufficient capacity

Middle East and North Africa Out-of-School Children Initiative112
6. Purpose: To what extent was this data source designed to collect data on education? (Consider whether it includes a specific education module, coverage of appropriate age groups, sample design (if survey))
(1) o Data collection not intended for generating education statistics (labour force, health, etc.)
(2) ox Data collection is intended for generating statistics on education and other sectors (health and education)
(3) o Data collection primarily intended for generating education statistics
7. Coverage of age data: For which ages are data on current school attendance collected?
(1) o Primary and lower secondary age
(2) o Pre-primary to upper secondary age
(3) ox Pre-primary to tertiary age
8. Coverage of education levels: For which levels of education are attendance data collected?
(1) o Primary education
(2) o Primary and secondary education
(3) ox Pre-primary to tertiary education
9. Coverage of educational institution types: Are data collected on (or do they include) all types of educational institutions in the country (Example: public, private, NGO, religious, community or unregistered schools)?
(1) ox Data collection excludes some important types of educational institutions
(2) o Data collection includes most types of educational institutions
(3) o Data collection includes all types of educational institutions
10. Usefulness for disaggregated data analysis: What is the smallest administrative area for which the data source is designed to provide reliable and representative statistics on out-of-school children?
(1) o National level only
(2) ox Macro administrative region (for example, state or province) and area of residence (urban/rural)
(3) o Micro administrative region (for example, district or village)
11. Usefulness for identifying characteristics of out-of-school children: To what extent is disaggregation (sub-national analysis) possible with this data source (for example, by age, sex, area, wealth, disability, ethnicity, region, and child labour status)?
(1) o Limited disaggregation possible (for example, only by sex)
(2) ox Some disaggregation possible, but some important groups are not available (for example, analysis by area of residence and wealth quintile is possible, but not ethnicity or disability)
(3) o Significant disaggregation possible, including most high priority groups (for example, by disability, child labour status, etc.)
Consider the definitions of the following key terms used in the data source:l School participation (What is the definition of “in school”?)l School dropout (What kind of school absence is considered “dropping out”?)l Educational attainmentl Other relevant terms
12. Consistency of education terms: How would you rate these terms on their consistency with standard international definitions? (UIS indicator and education term definitions can be found in Arabic, English and French in the UIS Glossary (www.uis.unesco.org/Pages/Glossary.aspx), and the UIS Global Education Digest)
(1) o Very few education terms are consistent with standard definitions
(2) o Some education terms are consistent with standard definitions
(3) ox Most education terms are consistent with standard definitions

Yemen Country Report on Out-of-School Children 113
13. Comparability of education terms: How comparable are the definitions with other national data sources?
(1) o Very few education terms are comparable with other national data sources
(2) ox Some education terms are comparable with other national data sources
(3) o Most education terms are comparable with other national data sources
Additional criteria relevant to household survey data sources
14. Data coverage of population of interest: To what extent has the data source considered coverage of disadvantaged groups in its data collection (sample design)?
(1) ox Sample design does not explicitly consider coverage of disadvantaged groups
(2) o Sample design considers coverage of some disadvantaged groups
(3) o Sample design considers coverage of many disadvantaged groups
15. Consistency of age and school participation data: To what extent is there a time lag between the recorded age of children and the start month of the academic year? (In sources with long data collection periods, select the answer covering the majority of cases (>50%)).
(1) ox Age data are recorded more than 6 months after the start month of the school year (large gap)
(2) o Age data are recorded between 2 and 6 months after the start month of the school year (small gap)
(3) o Age data are recorded during the start month of the school year (no gap)
Are there any other advantages or limitations of this data source?
Total score:
30
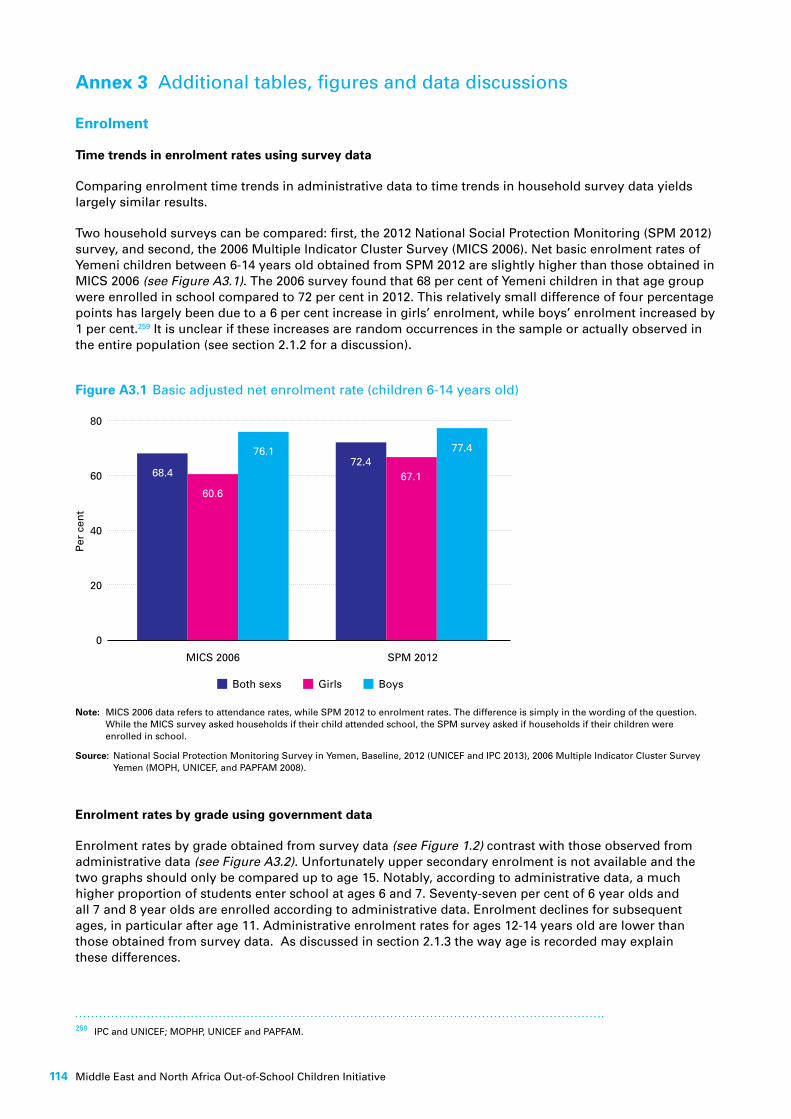
Middle East and North Africa Out-of-School Children Initiative114
Annex 3 Additional tables, figures and data discussions
Enrolment
Time trends in enrolment rates using survey data
Comparing enrolment time trends in administrative data to time trends in household survey data yields largely similar results.
Two household surveys can be compared: first, the 2012 National Social Protection Monitoring (SPM 2012) survey, and second, the 2006 Multiple Indicator Cluster Survey (MICS 2006). Net basic enrolment rates of Yemeni children between 6-14 years old obtained from SPM 2012 are slightly higher than those obtained in MICS 2006 (see Figure A3.1). The 2006 survey found that 68 per cent of Yemeni children in that age group were enrolled in school compared to 72 per cent in 2012. This relatively small difference of four percentage points has largely been due to a 6 per cent increase in girls’ enrolment, while boys’ enrolment increased by 1 per cent.259 It is unclear if these increases are random occurrences in the sample or actually observed in the entire population (see section 2.1.2 for a discussion).
259 IPC and UNICEF; MOPHP, UNICEF and PAPFAM.
Figure A3.1 Basic adjusted net enrolment rate (children 6-14 years old)
Note: MICS 2006 data refers to attendance rates, while SPM 2012 to enrolment rates. The difference is simply in the wording of the question. While the MICS survey asked households if their child attended school, the SPM survey asked if households if their children were enrolled in school.
Source: National Social Protection Monitoring Survey in Yemen, Baseline, 2012 (UNICEF and IPC 2013), 2006 Multiple Indicator Cluster Survey Yemen (MOPH, UNICEF, and PAPFAM 2008).
Enrolment rates by grade using government data
Enrolment rates by grade obtained from survey data (see Figure 1.2) contrast with those observed from administrative data (see Figure A3.2). Unfortunately upper secondary enrolment is not available and the two graphs should only be compared up to age 15. Notably, according to administrative data, a much higher proportion of students enter school at ages 6 and 7. Seventy-seven per cent of 6 year olds and all 7 and 8 year olds are enrolled according to administrative data. Enrolment declines for subsequent ages, in particular after age 11. Administrative enrolment rates for ages 12-14 years old are lower than those obtained from survey data. As discussed in section 2.1.3 the way age is recorded may explain these differences.
80
60
40
20
0
Per
cen
t
Both sexs Girls Boys
MICS 2006 SPM 2012
68.4
60.6
76.172.4
67.1
77.4

Yemen Country Report on Out-of-School Children 115
Figure A3.2 Participation from administrative data – enrolment rate by cycle and age (2012/2013)
Source: Cyclical Education Survey (CES) 2012/2013, MOE
Dropout rate by grade using administrative data
Figure A3.3 Dropout rates by grade,– administrative data from MOE
Source: MOE Cyclical Education Survey academic year 2011/2012
100
90
80
70
60
50
40
30
20
10
0
Per
cen
t
Age
Primary Secondary 1
5 6 7 8 9 10 11 12 13 14 15 16 17
Total Boys Girls
16
14
12
10
8
6
4
Per
cen
t
Grade1 to 2
Grade2 to 3
Grade3 to 4
Grade4 to 5
Grade5 to 6
Grade6 to 7
Grade7 to 8
Grade8 to 9
Dimension 4 Dimension 5

Middle East and North Africa Out-of-School Children Initiative116
Further discussion of data sources for Dimensions 4 and 5
It is noteworthy that the difference in students currently enrolled but expected to drop out before reaching the last grade differs between Dimensions 4 and 5 across sources. MOE dropout rates between Dimension 4 and 5 decreases by more than half, or 22 percentage points from 41 per cent to 19 per cent. For UIS administrative data this difference is 4 percentage points between 15 per cent at the primary and 11 per cent at the lower secondary level. Higher than in survey data where the difference is a mere 2 percentage points, with 11 per cent at the primary and 9 per cent at the lower secondary level. This implies that student attrition between primary and lower secondary levels, as registered by administrative data, is higher than that captured by survey data.
One explanation for the comparatively higher student dropout in administrative data compared to survey data is that many more students register, as would be captured by administrative data, than those who actually attend school. Survey data is more likely to capture actual school attendance. If a large percentage of students drop out only a few weeks after registering, they will be captured by administrative data as dropping outs, yet in survey data they will be counted as ‘out of school’. Hence survey data will indicate a higher share of out-of-school children but a lower share of children at risk of dropout. Indeed, administrative data shows a higher dropout rate than survey data (see Table 2.5) possibly due to students leaving immediately after registration, while survey data shows a higher share of students being out of school (see Table 2.2 ). This relationship does not exist at the lower secondary level (compare Table 2.6 and Table 2.2 ). This may be explained by the fact that in Yemen, basic education includes primary and lower secondary school (Grades 1-9) into one and the registration process takes place only once.
The impact of maternal education on enrolment is not gendered
Figure A3.4 shows that the association between maternal education and enrolment is similar for boys and girls.
Figure A3.4 Out-of-school boys and girls by maternal education
Boys Girls
12-14 years6-11 years
80
60
40
20
0
Per
cen
t
None Basic Secondary + Orphans
80
60
40
20
0
Per
cen
t
None Basic Secondary + Orphans
1719 7070 172046 5
95
3 43 7365

Yemen Country Report on Out-of-School Children 117
Child labour
Child labour definitions and data sources
Child labour data is available from the Baseline,260 the SPM261 and the Child Labour262 surveys. The dataset underlying the Child Labour Survey has also been used by Understanding Children’s Work (UCW) to compile additional child labour statistics. All four sources use different definitions of Child Labour. Some differ only marginally (see Table A3.1 for a summary).
Following the UNICEF standard263 the Baseline Survey defines child labour for children between 5-11 years old as paid or unpaid work for at least an hour over the past week; this can be outside the home or for a family business. In addition, fetching water or spending more than 28 hours a week on household chores is also classified as child labour. For children between 12-14 years old, child labour is defined as any work that cumulatively takes up 14 hours or more of the child’s time per week. If the child spends more than 28 hours a week on household chores, he or she is also classified as engaged in child labour. Household chores include tasks such as shopping, cleaning, or caring for children, elderly or sick members of the household during a reference week.
In contrast the SPM Survey264 only asked if the respondent ‘worked in the past 30 days’. Hence activities not considered ‘work’ by the respondent may not be included. Housework in particular is unlikely to be included.
The Child Labour265 Survey report distinguishes between children in employment and child labour. Children between 5-17 years old are defined as working or employed if they worked for at least one hour over the week preceding the survey. Work here means “all market-oriented activities, production of goods for own-consumption and certain services rendered for and by household members (such as major household repairs, fetching water or carrying firewood for household use)”266 The survey also explicitly asks about household chores. This is similar to the definition used by UNICEF.
The definition of child labour used by the Child Labour Survey is in accordance with the Yemeni 1995 Labour Law as well as ILO conventions 138 and 182. Accordingly, children between 5-13 years old working for even one hour per week are considered child labourers. Children between 14-17 years old who are working more than 30 hours per week are considered to be engaged in child labour. Children engaged in hazardous occupations are considered child labourers irrespective of the number of hours worked.267
The UCW tables use the same dataset as the Child Labour Survey as a basis of calculating child labour and economic activity. The same legislation was used as a basis to define child labour. The definition used for economic activity is akin to that termed ‘children in employment’ used by the Child Labour Survey.
Children 6-11 years old in economic activity for at least one hour a week are considered to be engaged in child labour. For children 12-13 years old, the number of hours worked has to be 14 or more to be classified as child labour. Any child in hazardous employment is considered a child labourer irrespective of hours worked. Any child engaged in more than 28 hours of housework is also considered a child labourer, irrespective of age. The cut-off age of 14 is used to conform to Yemeni Labour Law.268
260 UNICEF.261 IPC and UNICEF.262 ILO-IPEC and others.263 UNICEF, ‘Childinfo.org: Multiple Indicator Cluster Surveys – MICS4 – Surv ey Tools’.264 IPC and UNICEF.265 ILO-IPEC and others, Working Children in the Republic of Yemen – The Results of the 2010 National Child Labor Survey (Sana’a, Yemen, 2012)266 ILO-IPEC and others, p. 69.267 ILO-IPEC and others, p. 69.268 UCW, Child Labour and Out-of-School Children in MENA: A Statistical Profile (Rome, Italy, 2013).

Middle East and North Africa Out-of-School Children Initiative118
Since the Baseline Survey does not have national data, and the SPM and Child Labour surveys use non-standard definitions of Child Labour, UCW calculations are the preferred source.
It is noteworthy that, though using different definitions, the SPM and UCW results, present very similar results on a number of key indicators. Table A3.2 shows that the percentage of child labourers, the share of children between 6-11 years old out of school, the share of child labourers who are out of school and the share of out-of-school children who are involved in child labour are very similar across the two data sources. Most indicators from the UCW Survey fit into the confidence interval indicated by the SPM Survey.
Table A3.1 Definitions of child labour across sources
Source: UNICEF (2013), UCW (2013), IPC and UNICEF (2013), ILO-IPEC and others (2012).
Baseline Survey UCW Survey SPM Survey Child Labour Survey
Standard definition Non-standard definition
Reference period Past week Past week Past 30 days Past week
Economic activity Paid or unpaid market-oriented activities and certain services rendered to the household such as fetching water or carrying firewood
Paid or unpaid market-oriented activities and certain services rendered to the household such as fetching water or carrying firewood
Paid or unpaid market-oriented activities and certain services rendered to the household such as fetching water or carrying firewood
Child labour 6-11 years Economically active for at least an hour over the past week or spending more than 28 hours a week on household chores
6-11 yearsEconomically active for at least an hour over the past week or spending more than 28 hours a week on household chores
6-14 yearsWorked for at least an hour
6-13 yearsEconomically active for at least an hour over the past week
12-14 yearsEconomically active for at least 14 hours over the past week or spending more than 28 hours a week on household chores
12-13 yearsEconomically active for at least 14 hours over the past week or spending more than 28 hours a week on household chores
14 yearsEconomically active for at least 30 hours over the past week
Table A3.2 Child labour indicators from two different surveys for 6-11 year olds
Note: See Table A3.1 for definitions of child labour for the various sources.
Sources: IPC and UNICEF (2013), UCW (2013).
6-11 years old 12-14 year olds 12-13 year olds
SPM Survey (2012)
UCW Survey (2010)
SPM Survey (2012)
UCW Survey (2010)
Percentage of children who are out of school
30.4 (CI: 27.2-33.5)
28.221.5
(CI: 18.0-25.0)19.9
Percentage of out-of-school children who are involved in child labour
16.2 (CI 10.7-21.7)
14.150.2
(CI: 42.0-58.4)47.4
Percentage of children who are involved in child labour
11.8 (CI: 8.9-14.7)
11.423.8
(CI: 18.4-29.3)20.8
Percentage of child labourers who are out of school
37.2 -
34.936.7
-45.3

Yemen Country Report on Out-of-School Children 119
Complementing the profile of out of school child labourers using additional sources
The UCW Survey uses slightly different characteristics for the profiles of out-of-school children than those used by IPC and UNICEF using SPM data. The association between maternal education and being an out-of-school child labourer are not examined. Instead the education of the head of household is used. Similarly, wealth quintiles are likely to have been calculated differently since their predictive power in the UCW analysis is different from that found in the IPC and UNICEF analysis using the SPM Survey.
In addition, profiles of out-of-school child labourers are not separated by dimension, instead Dimensions 1 and 2 are analysed jointly. So as to illustrate structural differences between the two dimensions as well as wealth effects, Figure A3.5 shows the analysis carried out in section 2.5.1 using SPM data instead of UCW data.
The share of out-of-school children involved in child labour increases with age, especially once children turn 9 years old the likelihood of them being engaged in child labour doubles. Twenty-two per cent of 8-year-old out-of-school children work compared to 43% of 9 year olds.
Figure A3.5 Percentage of out-of-school children (6-11 and 12-14 years old) involved in child labour
6-11 years 12-14 years
Per cent
Total
6 years old
7 years old
8 years old
9 years old
10 years old
11 years old
12 years old
13 years old
14 years old
Boys
Girls
Urban
Rural
0 20 40 60 80
None
Basic
Secondary +
Non-standard education
Orphan or mother not in the HH
Poorest
Second
Middle
Fourth
Richest
Maternal education
Geography
Sex
Age
Wealth quintiles
1650
2
11
22
43
38
54
51
45
54
14
18
2
2
2
21
18
19
5
21
28
11
7
5
57
47
13
55
52
55
58
53
64
54
35
33
21
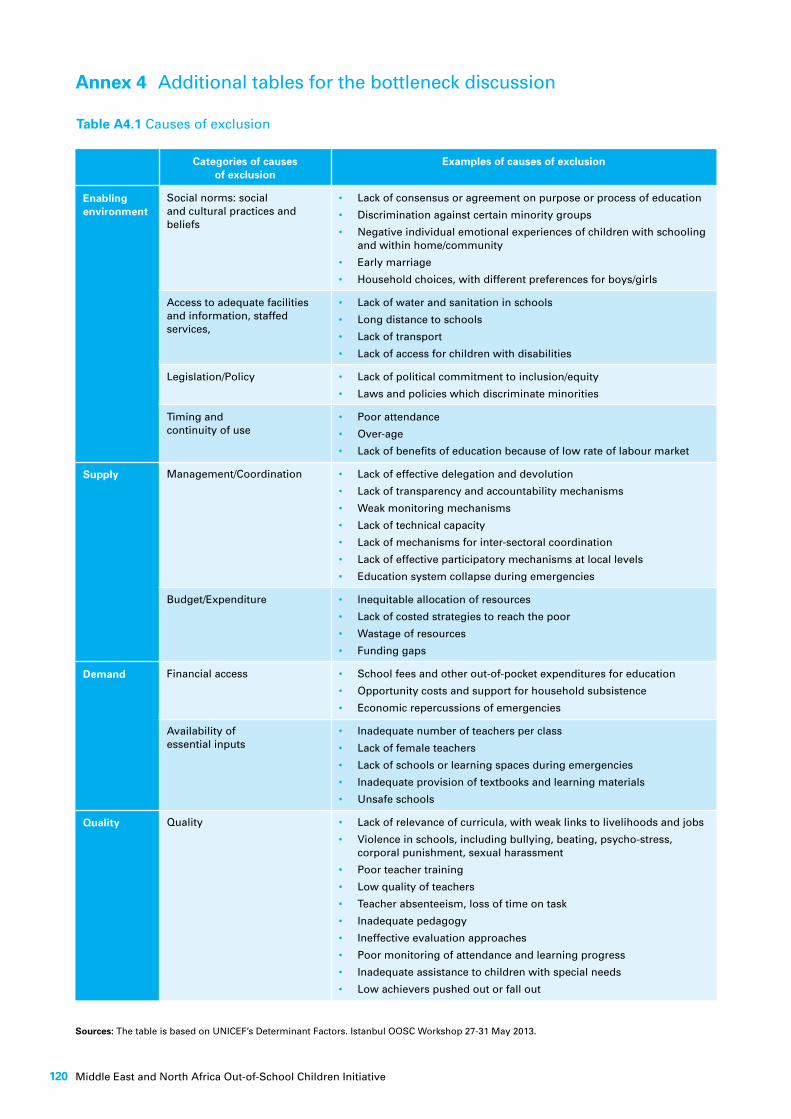
Middle East and North Africa Out-of-School Children Initiative120
Annex 4 Additional tables for the bottleneck discussion
Table A4.1 Causes of exclusion
Categories of causes of exclusion
Examples of causes of exclusion
Enabling environment
Social norms: social and cultural practices and beliefs
• Lack of consensus or agreement on purpose or process of education
• Discrimination against certain minority groups
• Negative individual emotional experiences of children with schooling and within home/community
• Early marriage
• Household choices, with different preferences for boys/girls
Access to adequate facilities and information, staffed services,
• Lack of water and sanitation in schools
• Long distance to schools
• Lack of transport
• Lack of access for children with disabilities
Legislation/Policy • Lack of political commitment to inclusion/equity
• Laws and policies which discriminate minorities
Timing and continuity of use
• Poor attendance
• Over-age
• Lack of benefits of education because of low rate of labour market
Supply Management/Coordination • Lack of effective delegation and devolution
• Lack of transparency and accountability mechanisms
• Weak monitoring mechanisms
• Lack of technical capacity
• Lack of mechanisms for inter-sectoral coordination
• Lack of effective participatory mechanisms at local levels
• Education system collapse during emergencies
Budget/Expenditure • Inequitable allocation of resources
• Lack of costed strategies to reach the poor
• Wastage of resources
• Funding gaps
Demand Financial access • School fees and other out-of-pocket expenditures for education
• Opportunity costs and support for household subsistence
• Economic repercussions of emergencies
Availability of essential inputs
• Inadequate number of teachers per class
• Lack of female teachers
• Lack of schools or learning spaces during emergencies
• Inadequate provision of textbooks and learning materials
• Unsafe schools
Quality Quality • Lack of relevance of curricula, with weak links to livelihoods and jobs
• Violence in schools, including bullying, beating, psycho-stress, corporal punishment, sexual harassment
• Poor teacher training
• Low quality of teachers
• Teacher absenteeism, loss of time on task
• Inadequate pedagogy
• Ineffective evaluation approaches
• Poor monitoring of attendance and learning progress
• Inadequate assistance to children with special needs
• Low achievers pushed out or fall out
Sources: The table is based on UNICEF’s Determinant Factors. Istanbul OOSC Workshop 27-31 May 2013.

Yemen Country Report on Out-of-School Children 121
Table A4.2 Linking profiles, bottlenecks and policies
Profiles Barriers/Bottlenecks Policies/Strategies
Dimension 1:Example: Girls from ethnic minorities
Environment - Supply–Demand - Quality
Environment - Supply–Demand - Quality
Dimension 2:Example: Rural girls from poorest quintiles
Environment - Supply–Demand - Quality
Environment - Supply–Demand - Quality
Dimension 3:Example: Working boys in urban slums
Environment - Supply–Demand - Quality
Environment - Supply–Demand - Quality
Dimension 4:Example: 15-year old girls in rural areas in North
Environment - Supply–Demand - Quality
Environment - Supply–Demand - Quality
Dimension 5:Example: 16-year old orphan in farming community
Environment - Supply–Demand - Quality
Environment - Supply–Demand - Quality
Sources: Presentation ‘Categories and definitions of bottlenecks to participation and policies/strategies that reduce exclusion’ by Dina Craissati.
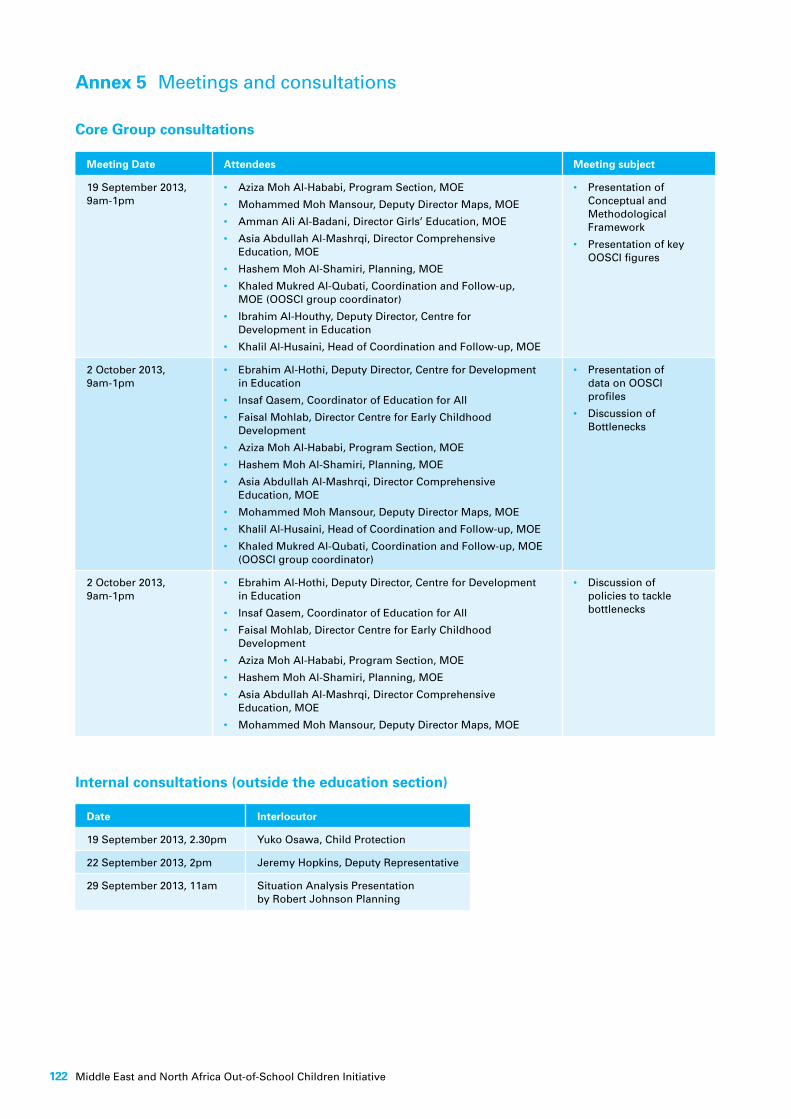
Middle East and North Africa Out-of-School Children Initiative122
Annex 5 Meetings and consultations
Meeting Date Attendees Meeting subject
19 September 2013, 9am-1pm
• Aziza Moh Al-Hababi, Program Section, MOE
• Mohammed Moh Mansour, Deputy Director Maps, MOE
• Amman Ali Al-Badani, Director Girls’ Education, MOE
• Asia Abdullah Al-Mashrqi, Director Comprehensive Education, MOE
• Hashem Moh Al-Shamiri, Planning, MOE
• Khaled Mukred Al-Qubati, Coordination and Follow-up, MOE (OOSCI group coordinator)
• Ibrahim Al-Houthy, Deputy Director, Centre for Development in Education
• Khalil Al-Husaini, Head of Coordination and Follow-up, MOE
• Presentation of Conceptual and Methodological Framework
• Presentation of key OOSCI figures
2 October 2013, 9am-1pm
• Ebrahim Al-Hothi, Deputy Director, Centre for Development in Education
• Insaf Qasem, Coordinator of Education for All
• Faisal Mohlab, Director Centre for Early Childhood Development
• Aziza Moh Al-Hababi, Program Section, MOE
• Hashem Moh Al-Shamiri, Planning, MOE
• Asia Abdullah Al-Mashrqi, Director Comprehensive Education, MOE
• Mohammed Moh Mansour, Deputy Director Maps, MOE
• Khalil Al-Husaini, Head of Coordination and Follow-up, MOE
• Khaled Mukred Al-Qubati, Coordination and Follow-up, MOE (OOSCI group coordinator)
• Presentation of data on OOSCI profiles
• Discussion of Bottlenecks
2 October 2013, 9am-1pm
• Ebrahim Al-Hothi, Deputy Director, Centre for Development in Education
• Insaf Qasem, Coordinator of Education for All
• Faisal Mohlab, Director Centre for Early Childhood Development
• Aziza Moh Al-Hababi, Program Section, MOE
• Hashem Moh Al-Shamiri, Planning, MOE
• Asia Abdullah Al-Mashrqi, Director Comprehensive Education, MOE
• Mohammed Moh Mansour, Deputy Director Maps, MOE
• Discussion of policies to tackle bottlenecks
Core Group consultations
Internal consultations (outside the education section)
Date Interlocutor
19 September 2013, 2.30pm Yuko Osawa, Child Protection
22 September 2013, 2pm Jeremy Hopkins, Deputy Representative
29 September 2013, 11am Situation Analysis Presentation by Robert Johnson Planning

Yemen Country Report on Out-of-School Children 123
External consultations
Date Interlocutor
19 September 2013, 3.30pmAbdulrahman Al SharjabiWorld Bank
22 September 2013, 11amAzziza Abdullah Al DhabbiProgramme Officer Health and Education, KfW
23 September 2013, 9am-12pm GIZ workshop on teacher absenteeism and ICT usage in Yemeni schoolsContact: Kristina Willebrand
23 September 2013 12.15pmAbdulhamid AlajamiUSAID
23 September 2013 2pmNajeeb Al ShaibaEducation Programme Officer, WFP
6 November 2013, 9:30amBelqis Al-Sharii,Project Director, BEDP
6 November 2013, 10:30pmRiyadh Al-YamaniBasic Education Advisor, BEDP
11 November 2013, 3pmJoy du PlesisDirector, Community Learning Project (CLP)
18 November 2013, 10amAbdelrahman Al-SamawiGeneral Director for Planning ad Statistics
18 November 2013Mohamed Abdel Malik Al-Tha’aPlanning and Statistics Administration
20 November 2013, 1am USAID/ CLP YEGRA Teacher Training Workshop
21 November 2013, 9:30amCasey Harrity, Director of Programme Development & QualitySave the Children
21 November, 10:30amAbdullah S. Modhesh Consultant Coordinator for the Education ClusterUNICEF/Save the Children
21 November 2103, 4pmBoushra Al-MunaifiMOE Supervisor (CLP Master trainer)
21 November 2103, 3pmKifah AbdullahFirst Grade Teacher, Athban Primary School
21 November 2103, 3pmYasmine AhmadFirst Grade Teacher, Athban Primary School
24 November 2013, 10am
Higher Council of Motherhood and Childhood
Fathia M. Abdullah, Deputy Secretary GeneralAdel A. Al-Raeeini, Dir. of Planning, Coordination & Follow-up
Majeda A. Awasah, Director of Early Childhood Development
Abeer Mutlaq, Child Protection Unit Officer
26 November 2013, 8:30am
Shouhada Al-Sabeen SchoolClassroom Workshop for teacher implementation of EGRA curricula
Amat-Al-Sabour Sharaf Al-DeenTechnical Supervisor


For more informationvisit our Website: www.oosci-mena.org
UNICEF Yemen Country OfficeP.O. Box 725 Off No. 5 Street, Asir AreaSana’aRepublic of YemenTel: +967 1 211400http://www.unicef.org/infobycountry/yemen.html