Yala-Ecosystem-Service-Assessment-Report.pdf - Nature Kenya
56
ii Balancing development and conservation in Kenya’s largest freshwater wetland Yala Swamp Ecosystem Service Assessment Report By Nature Kenya Supported by 1. Darwin Initiative 2. USAID/PREPARED 3. MacArthur Foundation
-
Upload
khangminh22 -
Category
Documents
-
view
3 -
download
0
Transcript of Yala-Ecosystem-Service-Assessment-Report.pdf - Nature Kenya
ii
Balancing development and conservation in Kenya’s largest freshwater wetland
Yala Swamp Ecosystem Service Assessment Report
By
Nature Kenya
Supported by
1. Darwin Initiative
2. USAID/PREPARED
3. MacArthur Foundation
iii
Balancing development and conservation in Kenya’s largest freshwater wetland
Yala Swamp Ecosystem Service Assessment Report
Disclaimer
The work reported here was made possible by the generous support of 1. The United Kingdom (UK) Government through Darwin Initiative
2. The American People through the United States Agency for International Development (USAID) program
“Planning for Resilience in East Africa through Policy Adaptation, Research, and Economic Development
(PREPARED)”
3. John D. and Catherine T. MacArthur Foundation
The contents of this report are the sole responsibility of its authors and do not necessarily reflect the views of the
donors (Darwin Initiative, USAID/PREPARED and John D. and Catherine T. MacArthur Foundation).
Copyright
©Nature Kenya-the East Africa Natural History Society, 2015
ISBN ----
Recommended citation: Paul Muoria1,2, Rob Field3, Paul Matiku1, Serah Munguti1, Emily Mateche1, Simon Shati1, Dickens Odeny4 (2015). Yala Swamp Ecosystem Service assessment.
Institutional Affiliation: 1 Nature Kenya, 2 Kenyatta University, 3 RSPB Centre for Conservation Science, Royal
Society for the Protection of Birds, 4 National Museums of Kenya
Published by Nature Kenya – the East Africa Natural History Society
P.O Box 44486 GPO, Nairobi 00100, Kenya
Phone (+254) (0) 20 3537568 or (+254) (0) 751624312, 7771343138
Fax (+254) (0) 20 3741049
E-mail: [email protected]
Website: www.naturekenya.org
iv
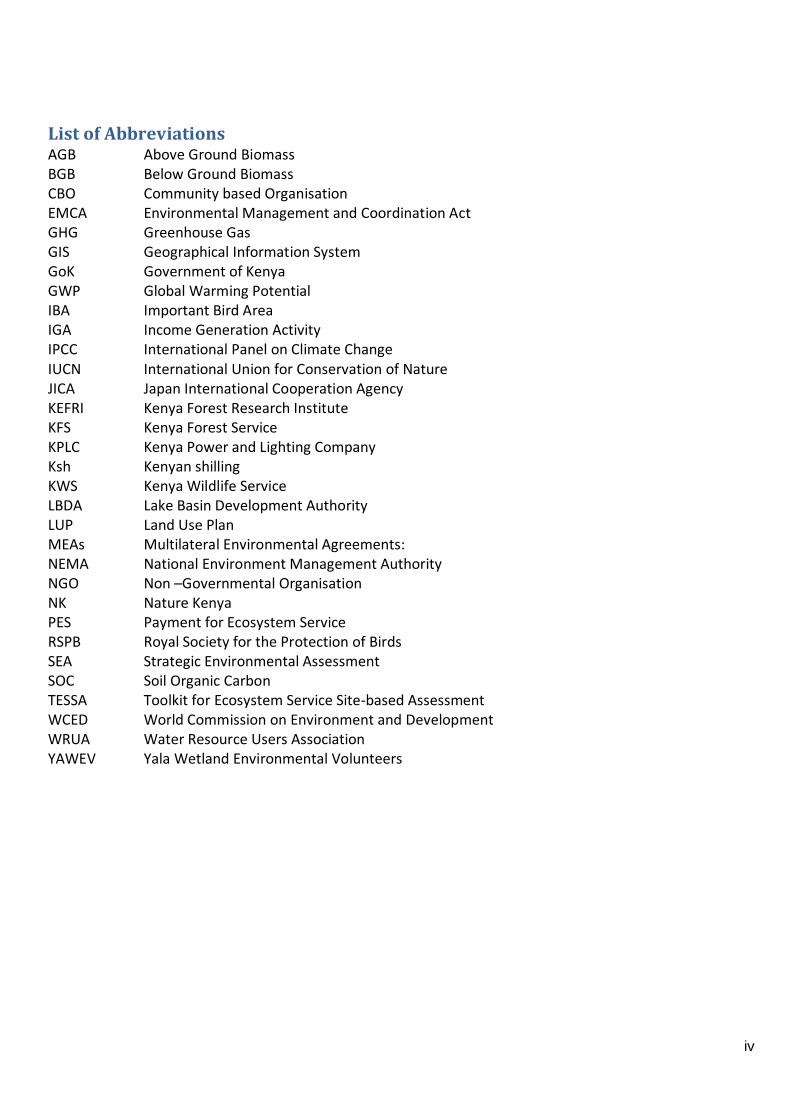
List of Abbreviations AGB Above Ground Biomass BGB Below Ground Biomass CBO Community based Organisation EMCA Environmental Management and Coordination Act GHG Greenhouse Gas GIS Geographical Information System GoK Government of Kenya GWP Global Warming Potential IBA Important Bird Area IGA Income Generation Activity IPCC International Panel on Climate Change IUCN International Union for Conservation of Nature JICA Japan International Cooperation Agency KEFRI Kenya Forest Research Institute KFS Kenya Forest Service KPLC Kenya Power and Lighting Company Ksh Kenyan shilling KWS Kenya Wildlife Service LBDA Lake Basin Development Authority LUP Land Use Plan MEAs Multilateral Environmental Agreements: NEMA National Environment Management Authority NGO Non –Governmental Organisation NK Nature Kenya PES Payment for Ecosystem Service RSPB Royal Society for the Protection of Birds SEA Strategic Environmental Assessment SOC Soil Organic Carbon TESSA Toolkit for Ecosystem Service Site-based Assessment WCED World Commission on Environment and Development WRUA Water Resource Users Association YAWEV Yala Wetland Environmental Volunteers
v
Contents LIST OF ABBREVIATIONS ............................................................................................................................................................... IV ACKNOWLEDGEMENT .................................................................................................................................................................. VI EXECUTIVE SUMMARY................................................................................................................................................................. VII 1.0 INTRODUCTION ................................................................................................................................................................ 1
1.1 SITE DESCRIPTION .............................................................................................................................................................. 1 1.1.1 Location .................................................................................................................................................................... 1 1.1.2 Biodiversity Importance ............................................................................................................................................. 1 1.1.3 Official Protection and Management Status............................................................................................................... 3
1.2 RATIONALE FOR ECOSYSTEM SERVICE ASSESSMENT..................................................................................................................... 4 1.2.1 Importance of Yala Swamp Ecosystem Service Assessment ........................................................................................ 4 1.2.2 General approach ...................................................................................................................................................... 4
2.0 RAPID APPRAISAL OF ECOSYSTEM SERVICES PROVIDED BY YALA SWAMP ........................................................................ 8 2.1 METHODS ........................................................................................................................................................................ 8 2.2 RESULTS ........................................................................................................................................................................ 10
2.2.1 Current land use/Land cover types ........................................................................................................................... 10 2.2.2 Current drivers of change to Yala Swamp and their impact ...................................................................................... 10
2.2.3 PLAUSIBLE FUTURE SCENARIOS............................................................................................................................................. 11 2.2.3 OUTCOME OF THE STAKEHOLDER WORKSHOP .......................................................................................................................... 12
3.0 DETAILED ECOSYSTEM SERVICE ASSESSMENT ................................................................................................................. 14 3.1 INTRODUCTION ................................................................................................................................................................ 14
3.1.1 Land Use Land Cover Changes in Future Scenarios ................................................................................................... 14 3.2 CLIMATE REGULATION ....................................................................................................................................................... 17
3.2.1 Methods ................................................................................................................................................................. 17 3.2.2 RESULTS ............................................................................................................................................................................ 21
3.2.2.1 Carbon Storage ........................................................................................................................................................ 21 3.2.2.2 Global warming potential .................................................................................................................................... 24
3.3 CULTIVATED GOODS ......................................................................................................................................................... 26 3.3.1 Methods ................................................................................................................................................................. 26 3.3.2 Results .................................................................................................................................................................... 26
3.4 HARVESTED WILD GOODS .................................................................................................................................................. 29 3.4.1 Methods ................................................................................................................................................................. 29 3.4.2 Results .................................................................................................................................................................... 29
3.5 WATER PROVISION, FLOOD REGULATION AND WATER QUALITY REGULATION SERVICES ..................................................................... 31 3.5.1 Methods ................................................................................................................................................................. 31 3.5.2 Results .................................................................................................................................................................... 31 3.5.2.3 Flooding .............................................................................................................................................................. 32 3.5.2.4 Water Quality Regulation .................................................................................................................................... 33
3.6. NATURE BASED RECREATION .................................................................................................................................................... 35 3.6.1 Methods ................................................................................................................................................................. 35 3.6.2 Results .................................................................................................................................................................... 35
4.0 NET VALUE OF SERVICES MEASURED. ............................................................................................................................. 37 4.1 METHODS ...................................................................................................................................................................... 37 4.2 RESULTS ........................................................................................................................................................................ 38
5.0 DISCUSSION .................................................................................................................................................................... 40 6.0 CONCLUSIONS AND RECOMMENDATIONS ...................................................................................................................... 42 REFERENCES ................................................................................................................................................................................ 44
APPENDIX 1: STAKEHOLDERS IN THE CONSERVATION AND MANAGEMENT OF YALA SWAMP ............................................................................. 46 APPENDIX 2: YALA SWAMP ECOSYSTEM ASSESSMENT: RAPID APPRAISAL PARTICIPANTS LIST. ........................................................................... 47
vi
Acknowledgement
We sincerely thank the various stakeholders who contributed their time, resources and information that led to the production of this report. First, we acknowledge the financial support provided by Darwin Initiative to Nature Kenya for the implementation of the project “Balancing development and conservation in Kenya’s largest freshwater wetland” under which this assessment was carried out. This work has also been supported by the Planning for Resilience in East Africa through Policy, Adaptation, Research, and Economic Development (PREPARED) Program funded by the U.S. Agency for International Development’s East Africa Regional
Mission (USAID/East Africa) and also by a MacArthur Foundation’s grant to Nature Kenya. We are very grateful for this support. We also wish to appreciate the various partners involved in the implementation of project. These include Nature Kenya, the Royal Society for the Protection of Birds, Siaya County Government, Dominion Farms Limited, Kenya Wildlife Service, National Environment Management Authority and Yala Wetland Environmental Volunteers. We also wish to acknowledge the support we continue enjoying from various national government agencies and departments including Kenya Forest Service and Kenya Forest Research Institute. Siaya County Government led by his Excellency Hon Rasanga has been very supportive throughout the process. We are also very grateful to all Nature Kenya staff members led by the Executive Director, Dr. Paul Matiku, for the support and team spirit that enabled us to complete this exercise. We appreciate the support we received from KEFRI through Mary Gathara, Nadir and Kirui on gathering data to estimate below and above ground carbon. Engineer Eugine provided guidance on water issues in the swamp. Faith and Richard, both of Dominion Farms Limited, led in gathering data on recreation use of the swamp and also in providing information of farming activities. We appreciate the contribution of the enumerators who tirelessly administered a long questionnaire to residents around the swamp and local residents who volunteered the information used in this report. Drs Richard Bradbury and Kelvin Peh provided critical comments on a previous draft
vii
EXECUTIVE SUMMARY
Yala Swamp is a complex of wetlands in the delta of the Yala River, on the north-east shore of Lake Victoria. The site is globally recognized as an Important Bird Area, hosting at least 172 bird species, some of which are globally threatened or biome-restricted. Lake Kanyaboli, a satellite lake found in the wetland, is an important refuge for endemic Lake Victoria cichlid fish, many of which have been exterminated in the main lake. Yala Swamp is one of the few sites in which the nationally endangered Sitatunga (Tragecephalus spekeii) occurs. The Swamp also has a rich invertebrate fauna including mayflies (Ephemeroptera), dragonflies (Odonata), oligochaete worms and molluscs. The site is largely unprotected, but Lake Kanyaboli was gazetted as a National Reserve in 2010. The Swamp is believed to be playing an important role as a filter for pollutants arising from the upper Yala River catchment. Yala Swamp provides many potential ecosystem services to the local communities including water, papyrus products, fisheries, and has a high potential as a tourism destination. Local people also rely on the site for products including firewood, thatch grass and fodder for their livestock. Like other swamps, the site is a very important carbon sink that contributes to global climate regulation. However, Yala Swamp is very attractive to both large and small-scale farmers, who use part of the swamp for crop production. Although it is an important ecosystem service, cultivated food production and other development activities are in direct competition with other services, leading to conflicts between different stakeholders. It is therefore important to conduct a balanced ecosystem service assessment that can inform policy processes including county and national development plans and land use plans.
We used the Toolkit for Ecosystem Service Site-based Assessment (TESSA) developed by Peh et al (2013) to conduct this assessment (http://www.birdlife.org/worldwide/science/assessing-ecosystem-services-tessa). Based on the findings of a rapid appraisal, we identified two possible future scenarios; namely, continued development and balanced scenarios (where conservation and development coexist). We assessed climate regulation, cultivated goods, harvested wild goods, water services and recreation services provided by the swamp in the current and future scenarios. Most of the data on cultivated crops, harvested wild goods and water services were obtained by interviewing Yala Swamp residents. Data on harvested crops from Dominion Farms were based on a questionnaire filled by the farm management, staff interview and field observations. We assessed habitat carbon stocks and recreation value of the swamp using methods laid out in Peh at al (2013).
Soil and vegetation carbon pools at Yala were greatest in natural and semi-natural papyrus dominated habitats and lowest in the drained farmed areas. Current land use in the Yala swamp basin has a net global cooling effect but if reclamation of the organic soils of the swamp continues at the current rate and the stated aims of the rice farming franchise are realised, this net cooling effect is likely to change into a nationally significant net warming effect.
We estimated the net income realised from cultivated crops to be Ksh 113,789,749 for all village farms, but Ksh 509,481,518 for the rice farm, under current land use. This is expected to increase in the development and in the balanced scenarios. Fish is the most valuable wild good harvested from the swamp, earning the residents an estimated Ksh 314,192,139 in the current state. The residents also earn an estimated Ksh 80,865,635, Ksh 57,627,056 and Ksh 8,572,344 from papyrus, firewood and thatch grass, respectively, in the current state. The amount of harvested goods from the swamp is expected to decline if the continued development pathway is followed.
Nearly all respondents interviewed obtained water from various sources within the swamp, including from Lake Kanyaboli, canals within the swamp, rivers, boreholes, and dams. However, the residents think that
viii
there is already a problem with water quality. There is a need to conduct a more detailed water quality analysis to conclusively determine the impact of increased agricultural activities on the water quality.
On recreation, the swamp receives both national and international visitors who spend Ksh 1,170,200 per year at the site. Although this is a rather tiny value compared to those of other services, there is great potential for enhancement through investments in tourism infrastructure, marketing and capacity building among stakeholders.
However, this potential would be lost if the continued development pathway is followed.
Yala Swamp has a very high realized and potential monetary value. Continued development would likely lead to an increase in cultivated food production by both Dominion Farms Limited and local residents. However, it would also lead to a nationally significant reduction in climate regulation value, reduced wild goods harvest, lower recreation value and reduced capacity to regulate water quality and flow. Overall, increased agricultural activities by large scale enterprises world lead to increased cultivated food production but the benefits will be enjoyed by a smaller segment of society. On the other hand, expansion of agricultural activities by small holders would lead to increased benefits to a larger segment of society. Although a balance between development and conservation would lead to reduced agricultural potential, the site would have higher climate, water quantity and quality regulation, and higher recreation values. We therefore recommend that Yala Swamp land use and management policies and plans adopt a balance between development and conservation, so as to improve the socio-economic well-being of the local residents while protecting the diverse biodiversity, and ecosystem services that the site provides.
1
1.0 INTRODUCTION
1.1 Site Description
1.1.1 Location
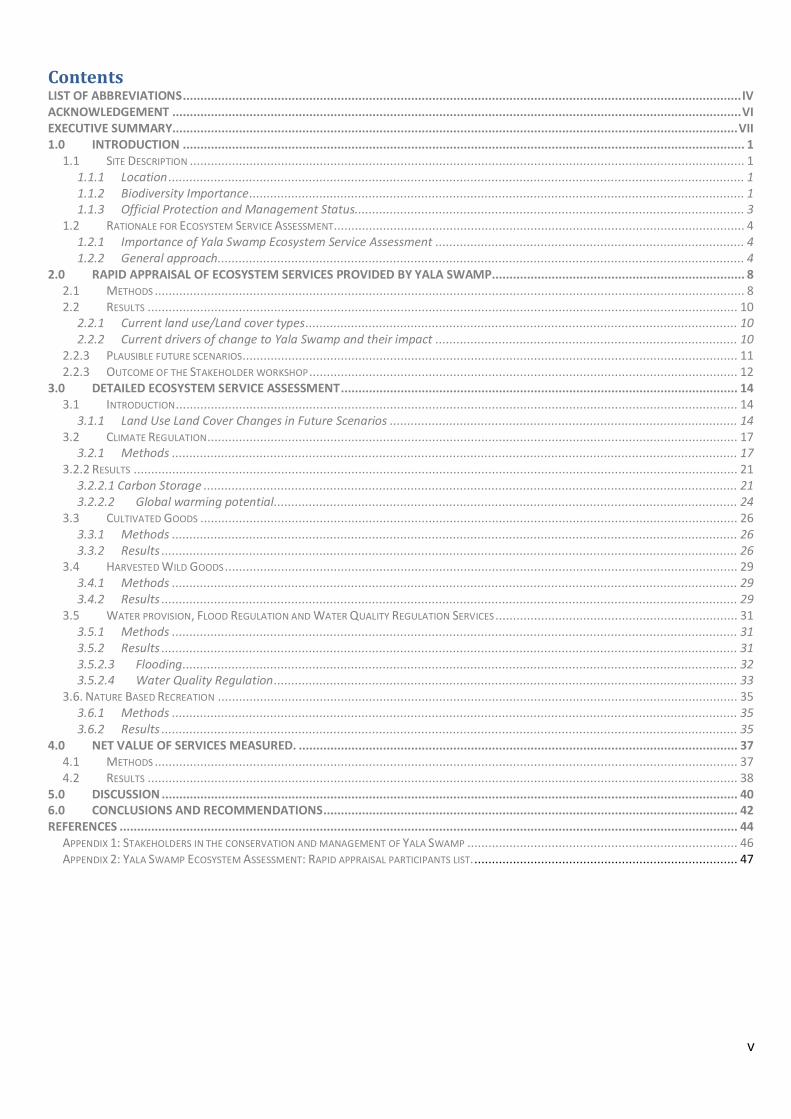
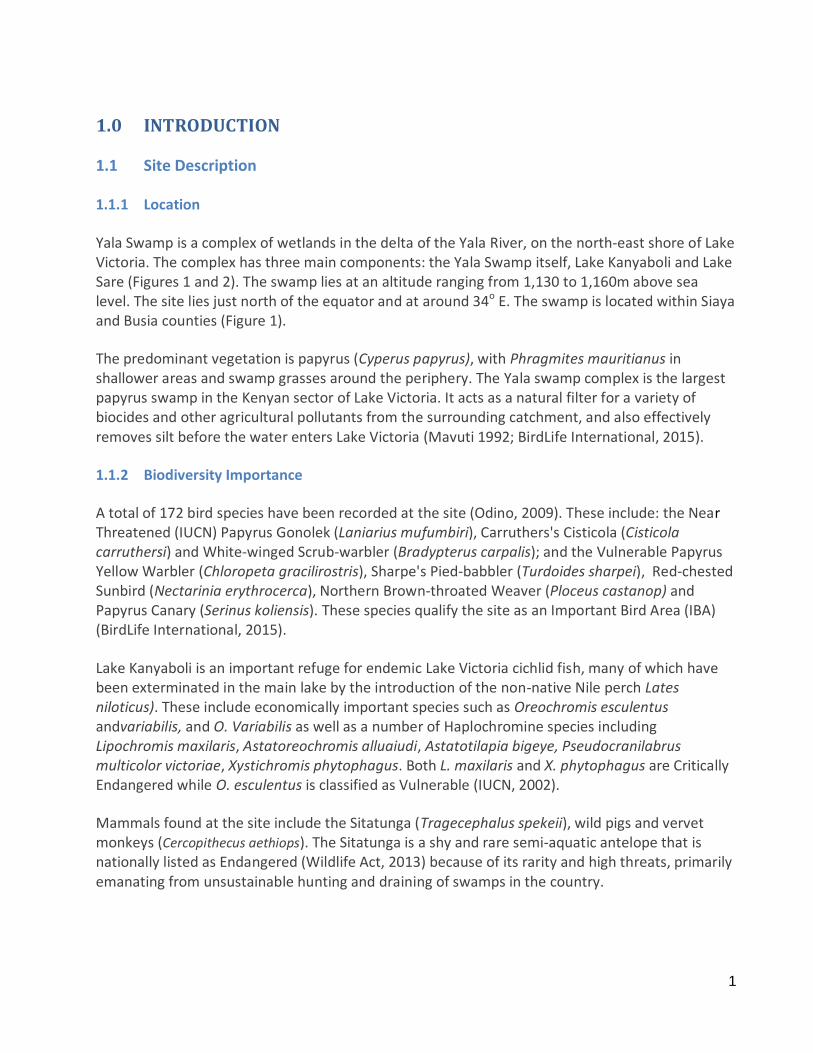
Yala Swamp is a complex of wetlands in the delta of the Yala River, on the north-east shore of Lake Victoria. The complex has three main components: the Yala Swamp itself, Lake Kanyaboli and Lake Sare (Figures 1 and 2). The swamp lies at an altitude ranging from 1,130 to 1,160m above sea level. The site lies just north of the equator and at around 34o E. The swamp is located within Siaya and Busia counties (Figure 1).
The predominant vegetation is papyrus (Cyperus papyrus), with Phragmites mauritianus in shallower areas and swamp grasses around the periphery. The Yala swamp complex is the largest papyrus swamp in the Kenyan sector of Lake Victoria. It acts as a natural filter for a variety of biocides and other agricultural pollutants from the surrounding catchment, and also effectively removes silt before the water enters Lake Victoria (Mavuti 1992; BirdLife International, 2015).
1.1.2 Biodiversity Importance
A total of 172 bird species have been recorded at the site (Odino, 2009). These include: the Near Threatened (IUCN) Papyrus Gonolek (Laniarius mufumbiri), Carruthers's Cisticola (Cisticola carruthersi) and White-winged Scrub-warbler (Bradypterus carpalis); and the Vulnerable Papyrus Yellow Warbler (Chloropeta gracilirostris), Sharpe's Pied-babbler (Turdoides sharpei), Red-chested Sunbird (Nectarinia erythrocerca), Northern Brown-throated Weaver (Ploceus castanop) and Papyrus Canary (Serinus koliensis). These species qualify the site as an Important Bird Area (IBA) (BirdLife International, 2015).
Lake Kanyaboli is an important refuge for endemic Lake Victoria cichlid fish, many of which have been exterminated in the main lake by the introduction of the non-native Nile perch Lates niloticus). These include economically important species such as Oreochromis esculentus andvariabilis, and O. Variabilis as well as a number of Haplochromine species including Lipochromis maxilaris, Astatoreochromis alluaiudi, Astatotilapia bigeye, Pseudocranilabrus multicolor victoriae, Xystichromis phytophagus. Both L. maxilaris and X. phytophagus are Critically Endangered while O. esculentus is classified as Vulnerable (IUCN, 2002).
Mammals found at the site include the Sitatunga (Tragecephalus spekeii), wild pigs and vervet monkeys (Cercopithecus aethiops). The Sitatunga is a shy and rare semi-aquatic antelope that is nationally listed as Endangered (Wildlife Act, 2013) because of its rarity and high threats, primarily emanating from unsustainable hunting and draining of swamps in the country.
2
Figure 1.Location of Yala swamp within East Africa, Kenya and local county boundaries
3
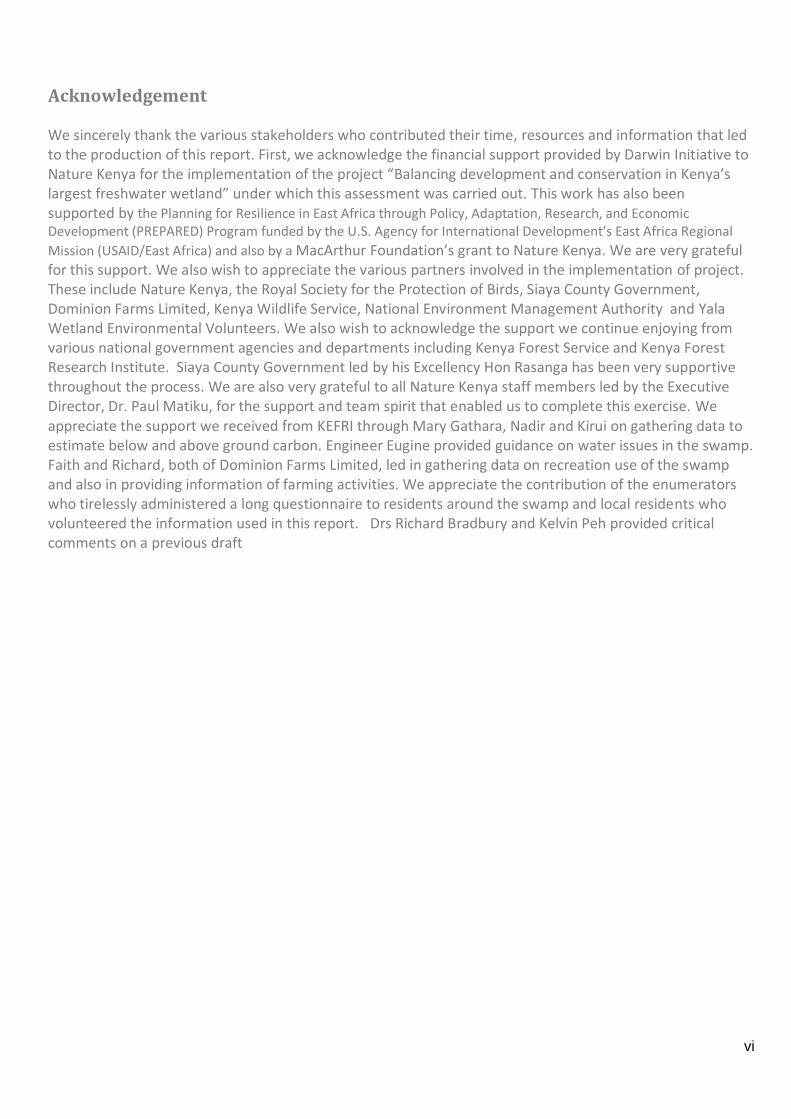
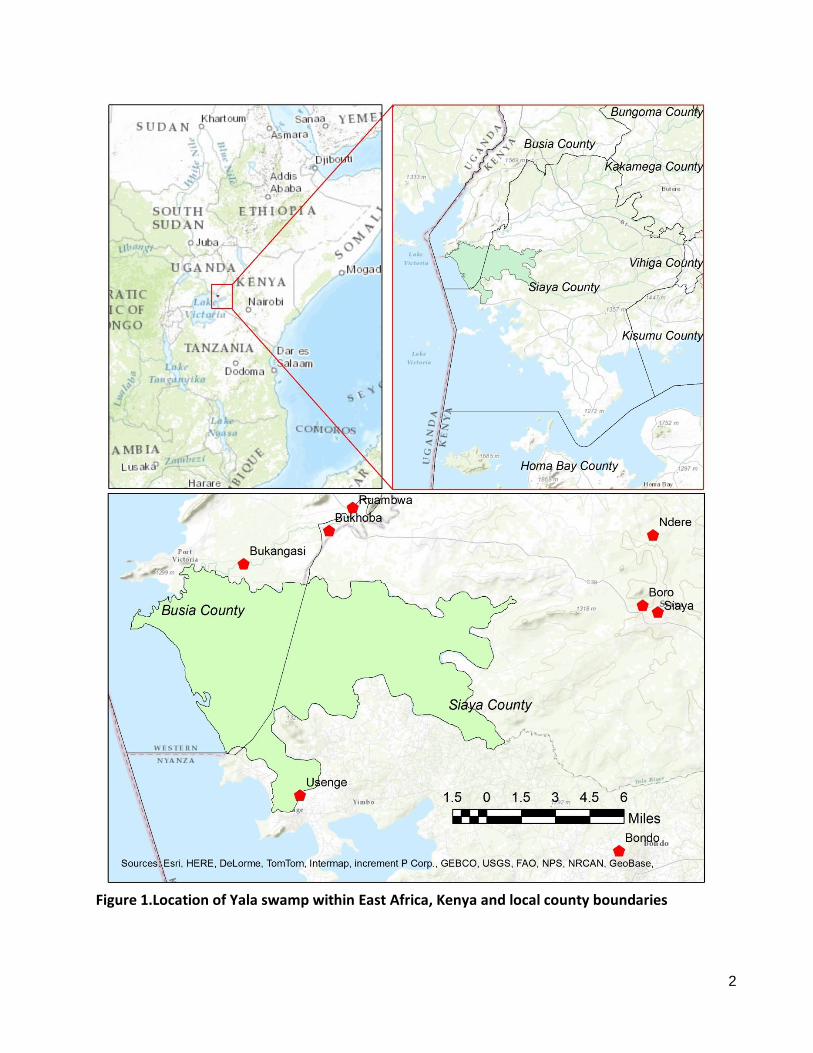
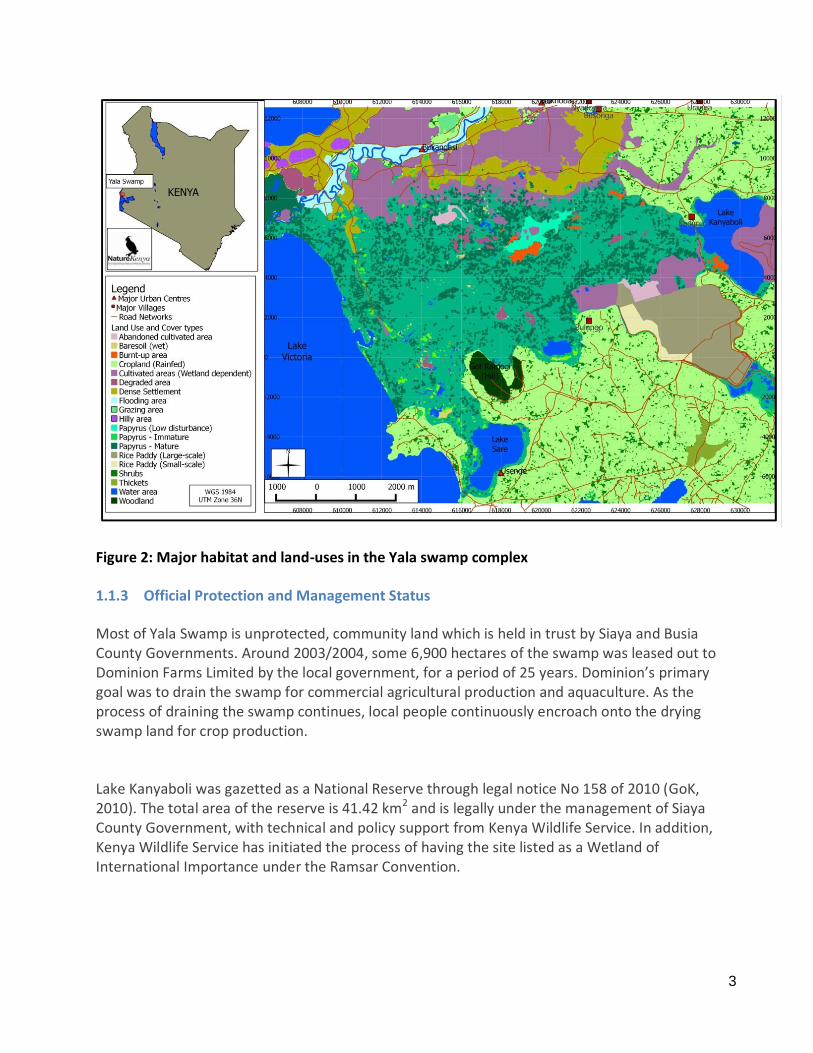
Figure 2: Major habitat and land-uses in the Yala swamp complex
1.1.3 Official Protection and Management Status
Most of Yala Swamp is unprotected, community land which is held in trust by Siaya and Busia County Governments. Around 2003/2004, some 6,900 hectares of the swamp was leased out to Dominion Farms Limited by the local government, for a period of 25 years. Dominion’s primary goal was to drain the swamp for commercial agricultural production and aquaculture. As the process of draining the swamp continues, local people continuously encroach onto the drying swamp land for crop production.
Lake Kanyaboli was gazetted as a National Reserve through legal notice No 158 of 2010 (GoK, 2010). The total area of the reserve is 41.42 km2 and is legally under the management of Siaya County Government, with technical and policy support from Kenya Wildlife Service. In addition, Kenya Wildlife Service has initiated the process of having the site listed as a Wetland of International Importance under the Ramsar Convention.
4
1.2 Rationale for Ecosystem Service Assessment
1.2.1 Importance of Yala Swamp Ecosystem Service Assessment
‘Ecosystem services’ is the term given to the goods and services provided by natural and modified ecosystems that benefit, sustain and support the well-being of people. They include production of food and medicines, regulation of climate and disease, provision of productive soils and clean water, and landscape opportunities for recreation and spiritual benefits. Unsustainable utilisation any part or component of an ecosystem can diminish the ecosystem service. Ecosystem services underpin our well-being, including the production of most of our other living needs, and so are of significant value.
Yala Swamp provides important ecosystem services (food, water, papyrus products, thatching material and water quality and quantity regulation, amongst others). At the same time, it hosts important biodiversity, including several endemic and/or globally threatened species, and has high but largely unexploited tourism potential. The high agricultural potential of the swamp has attracted large scale agricultural interests including Dominion Farms Limited. Members of the local community have also been expanding their commercial and subsistence agricultural activities in the swamp. At the same time, Siaya County Government is also targeting the site for both agricultural and tourism development (Siaya County Government, 2012). Lake Kanyaboli and its littoral vegetation were gazetted as a National Reserve in 2010 and there has been pressure from conservationists to have the swamp recognized as a Wetland of International Importance (Ramsar Site) due to its importance in biodiversity conservation and ecosystem service provision.
Appendix 1 shows that there are diverse stakeholders involved in the conservation and management of Yala Swamp, some with conflicting interests. To resolve these issues, a clear understanding of the value of ecosystem services provided by the swamp is necessary and hence this assessment. We expect the results to be important to decision makers as they devise strategies and plans for biodiversity conservation and ecosystem service delivery. In addition we expect that the results of the assessment will help identify stakeholders affected by different management decisions and actions. We hope this will help resolve conflicts, because the findings can be used to spread costs among the stakeholders. More importantly, the findings of this assessment will provide conservation organisations with evidence that has been lacking while communicating the importance of Yala Swamp to decision makers.
1.2.2 General approach
The engagement of all stakeholders is critical in the successful measurement and monitoring of ecosystem services. Engaging all stakeholders also maximizes the chances that the findings of the exercise will be acceptable to all of them. The primary stakeholders in the management of Yala Swamp include the local community, Dominion Farms Limited, Siaya County Government and Non-Governmental Organizations like Nature Kenya (Appendix 1). Many other stakeholders are
5
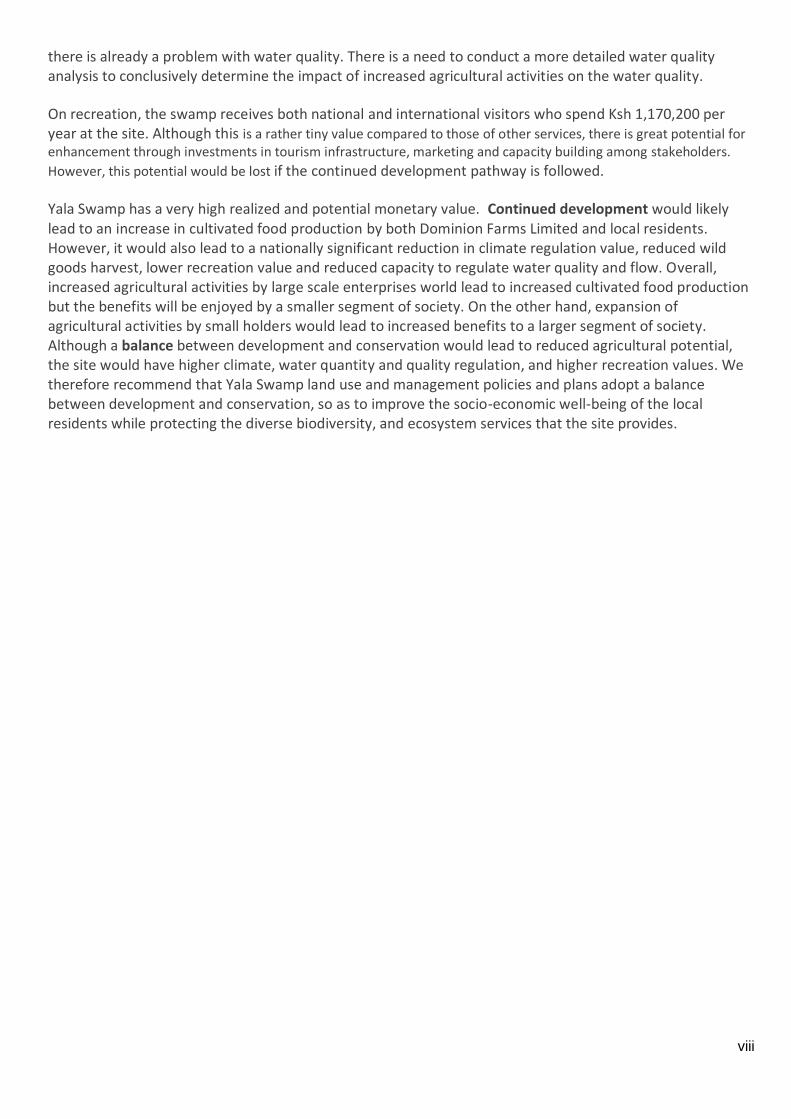
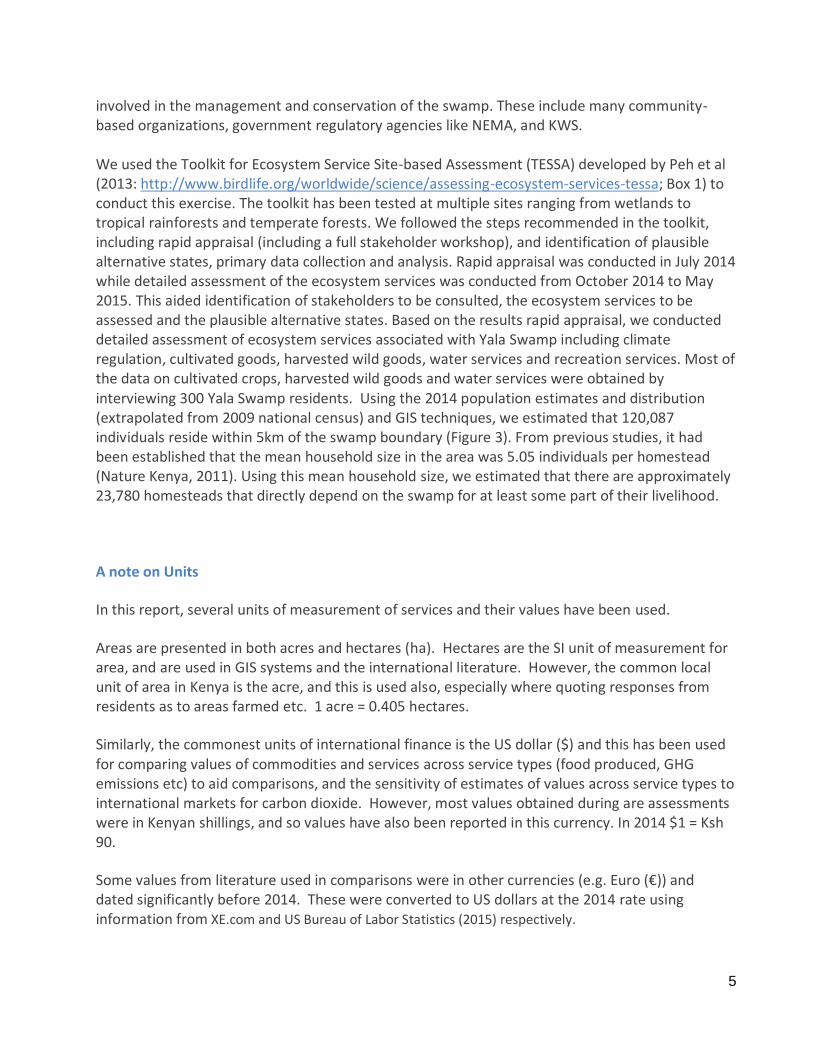
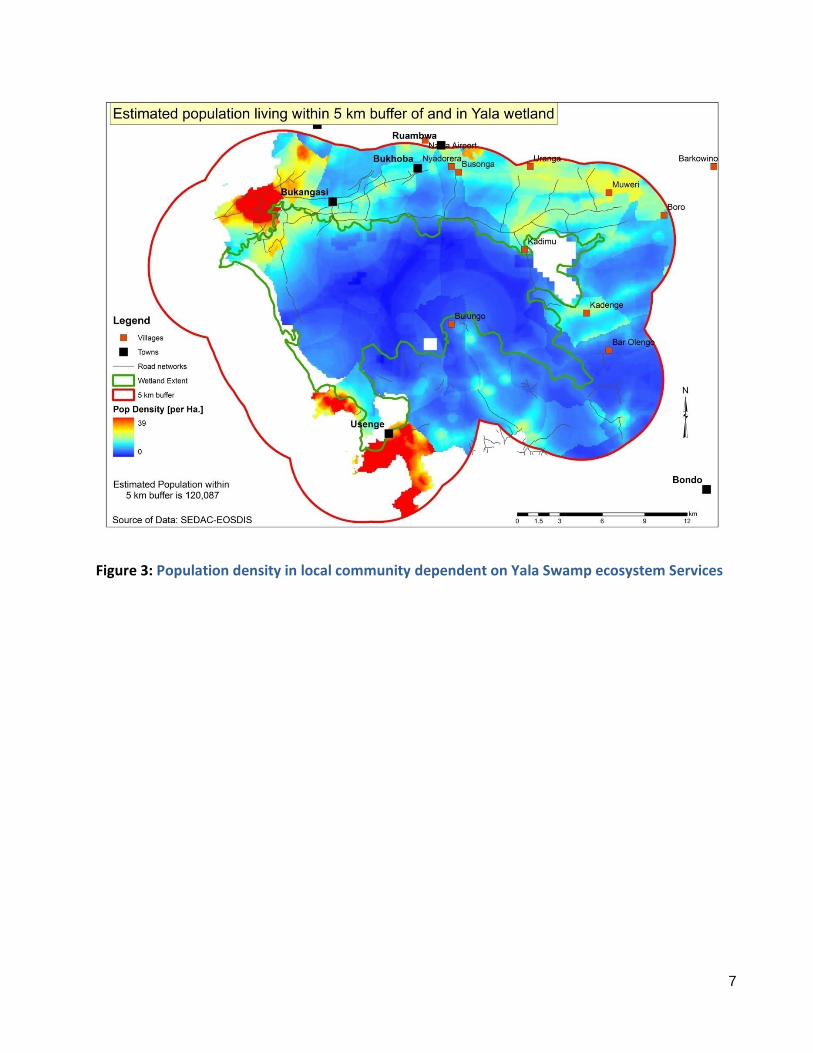
involved in the management and conservation of the swamp. These include many community-based organizations, government regulatory agencies like NEMA, and KWS. We used the Toolkit for Ecosystem Service Site-based Assessment (TESSA) developed by Peh et al (2013: http://www.birdlife.org/worldwide/science/assessing-ecosystem-services-tessa; Box 1) to conduct this exercise. The toolkit has been tested at multiple sites ranging from wetlands to tropical rainforests and temperate forests. We followed the steps recommended in the toolkit, including rapid appraisal (including a full stakeholder workshop), and identification of plausible alternative states, primary data collection and analysis. Rapid appraisal was conducted in July 2014 while detailed assessment of the ecosystem services was conducted from October 2014 to May 2015. This aided identification of stakeholders to be consulted, the ecosystem services to be assessed and the plausible alternative states. Based on the results rapid appraisal, we conducted detailed assessment of ecosystem services associated with Yala Swamp including climate regulation, cultivated goods, harvested wild goods, water services and recreation services. Most of the data on cultivated crops, harvested wild goods and water services were obtained by interviewing 300 Yala Swamp residents. Using the 2014 population estimates and distribution (extrapolated from 2009 national census) and GIS techniques, we estimated that 120,087 individuals reside within 5km of the swamp boundary (Figure 3). From previous studies, it had been established that the mean household size in the area was 5.05 individuals per homestead (Nature Kenya, 2011). Using this mean household size, we estimated that there are approximately 23,780 homesteads that directly depend on the swamp for at least some part of their livelihood.
A note on Units
In this report, several units of measurement of services and their values have been used.
Areas are presented in both acres and hectares (ha). Hectares are the SI unit of measurement for area, and are used in GIS systems and the international literature. However, the common local unit of area in Kenya is the acre, and this is used also, especially where quoting responses from residents as to areas farmed etc. 1 acre = 0.405 hectares.
Similarly, the commonest units of international finance is the US dollar ($) and this has been used for comparing values of commodities and services across service types (food produced, GHG emissions etc) to aid comparisons, and the sensitivity of estimates of values across service types to international markets for carbon dioxide. However, most values obtained during are assessments were in Kenyan shillings, and so values have also been reported in this currency. In 2014 $1 = Ksh 90.
Some values from literature used in comparisons were in other currencies (e.g. Euro (€)) and dated significantly before 2014. These were converted to US dollars at the 2014 rate using information from XE.com and US Bureau of Labor Statistics (2015) respectively.
6
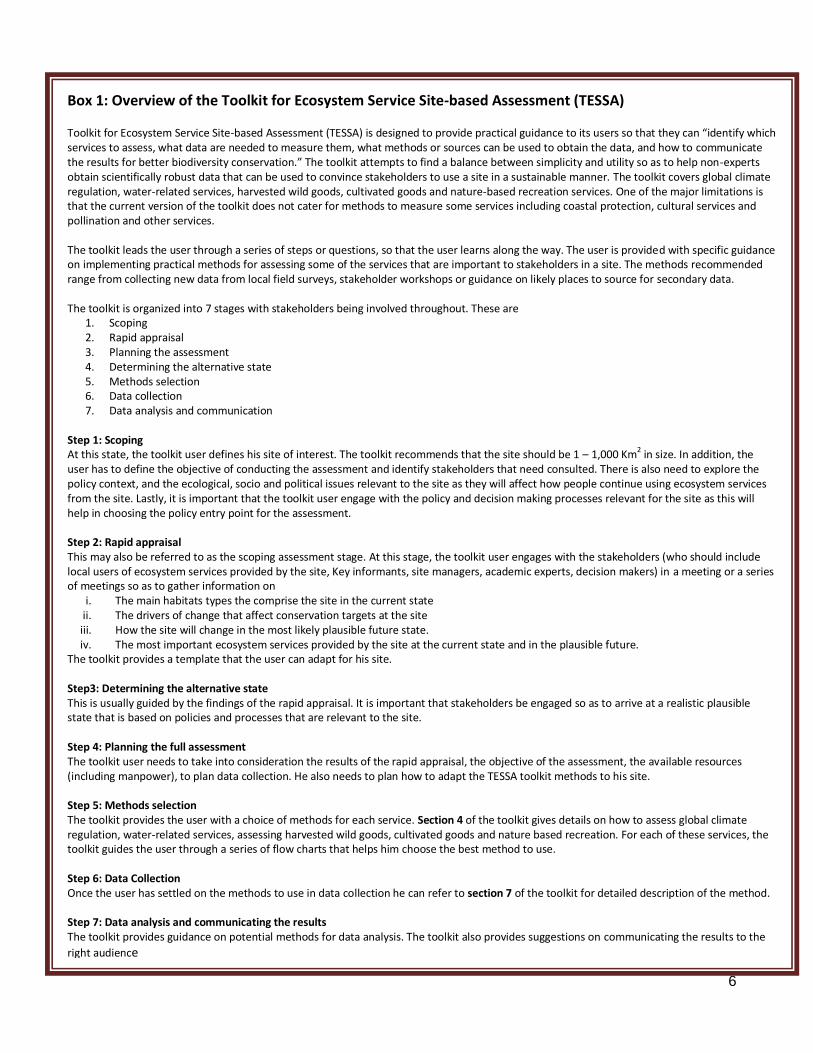
Box 1: Overview of the Toolkit for Ecosystem Service Site-based Assessment (TESSA) Toolkit for Ecosystem Service Site-based Assessment (TESSA) is designed to provide practical guidance to its users so that they can “identify which services to assess, what data are needed to measure them, what methods or sources can be used to obtain the data, and how to communicate the results for better biodiversity conservation.” The toolkit attempts to find a balance between simplicity and utility so as to help non-experts obtain scientifically robust data that can be used to convince stakeholders to use a site in a sustainable manner. The toolkit covers global climate regulation, water-related services, harvested wild goods, cultivated goods and nature-based recreation services. One of the major limitations is that the current version of the toolkit does not cater for methods to measure some services including coastal protection, cultural services and pollination and other services. The toolkit leads the user through a series of steps or questions, so that the user learns along the way. The user is provided with specific guidance on implementing practical methods for assessing some of the services that are important to stakeholders in a site. The methods recommended range from collecting new data from local field surveys, stakeholder workshops or guidance on likely places to source for secondary data. The toolkit is organized into 7 stages with stakeholders being involved throughout. These are
1. Scoping 2. Rapid appraisal 3. Planning the assessment 4. Determining the alternative state 5. Methods selection 6. Data collection 7. Data analysis and communication
Step 1: Scoping At this state, the toolkit user defines his site of interest. The toolkit recommends that the site should be 1 – 1,000 Km2 in size. In addition, the user has to define the objective of conducting the assessment and identify stakeholders that need consulted. There is also need to explore the policy context, and the ecological, socio and political issues relevant to the site as they will affect how people continue using ecosystem services from the site. Lastly, it is important that the toolkit user engage with the policy and decision making processes relevant for the site as this will help in choosing the policy entry point for the assessment. Step 2: Rapid appraisal This may also be referred to as the scoping assessment stage. At this stage, the toolkit user engages with the stakeholders (who should include local users of ecosystem services provided by the site, Key informants, site managers, academic experts, decision makers) in a meeting or a series of meetings so as to gather information on
i. The main habitats types the comprise the site in the current state ii. The drivers of change that affect conservation targets at the site iii. How the site will change in the most likely plausible future state. iv. The most important ecosystem services provided by the site at the current state and in the plausible future.
The toolkit provides a template that the user can adapt for his site. Step3: Determining the alternative state This is usually guided by the findings of the rapid appraisal. It is important that stakeholders be engaged so as to arrive at a realistic plausible state that is based on policies and processes that are relevant to the site. Step 4: Planning the full assessment The toolkit user needs to take into consideration the results of the rapid appraisal, the objective of the assessment, the available resources (including manpower), to plan data collection. He also needs to plan how to adapt the TESSA toolkit methods to his site. Step 5: Methods selection The toolkit provides the user with a choice of methods for each service. Section 4 of the toolkit gives details on how to assess global climate regulation, water-related services, assessing harvested wild goods, cultivated goods and nature based recreation. For each of these services, the toolkit guides the user through a series of flow charts that helps him choose the best method to use. Step 6: Data Collection Once the user has settled on the methods to use in data collection he can refer to section 7 of the toolkit for detailed description of the method. Step 7: Data analysis and communicating the results The toolkit provides guidance on potential methods for data analysis. The toolkit also provides suggestions on communicating the results to the
right audience
7
Figure 3: Population density in local community dependent on Yala Swamp ecosystem Services
8
2.0 RAPID APPRAISAL OF ECOSYSTEM SERVICES PROVIDED BY YALA SWAMP
2.1 Methods
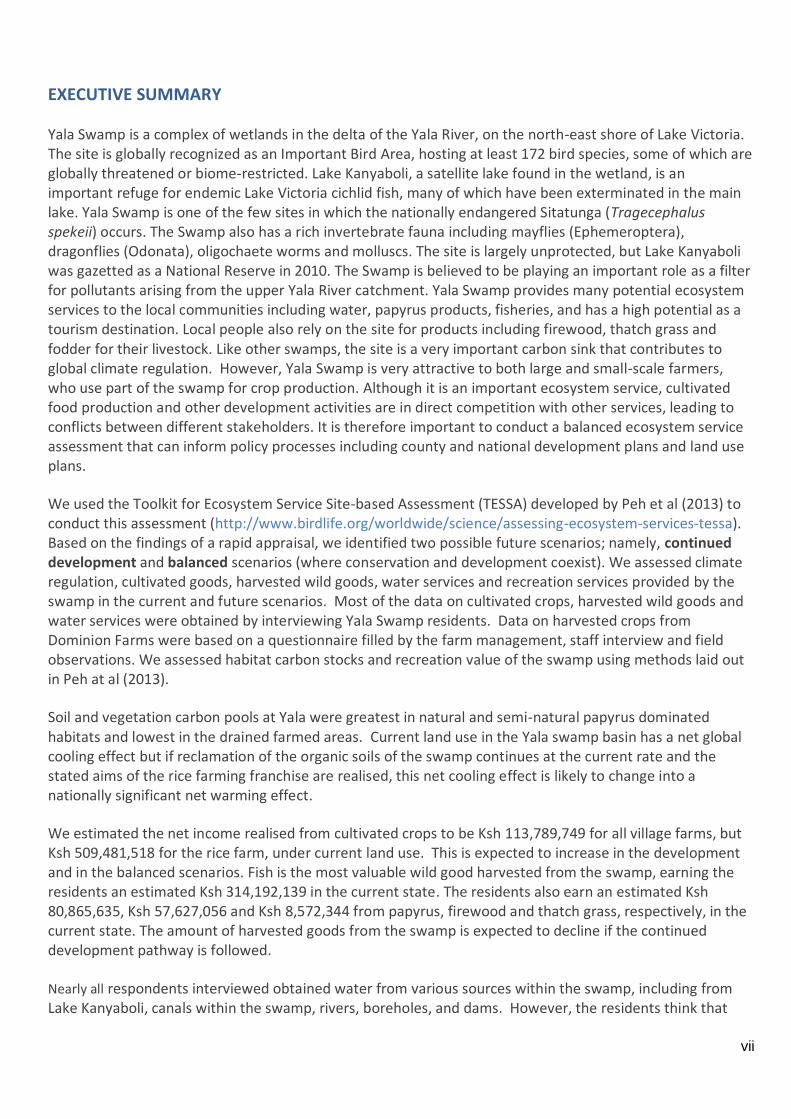
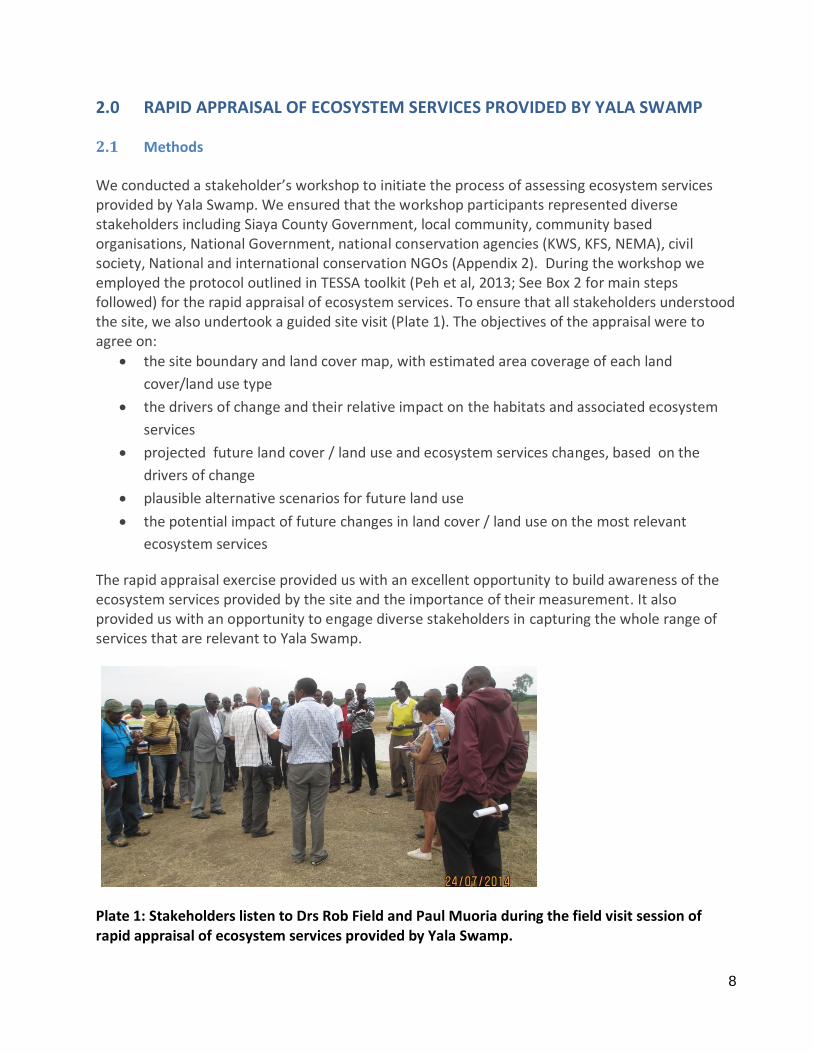
We conducted a stakeholder’s workshop to initiate the process of assessing ecosystem services provided by Yala Swamp. We ensured that the workshop participants represented diverse stakeholders including Siaya County Government, local community, community based organisations, National Government, national conservation agencies (KWS, KFS, NEMA), civil society, National and international conservation NGOs (Appendix 2). During the workshop we employed the protocol outlined in TESSA toolkit (Peh et al, 2013; See Box 2 for main steps followed) for the rapid appraisal of ecosystem services. To ensure that all stakeholders understood the site, we also undertook a guided site visit (Plate 1). The objectives of the appraisal were to agree on:
the site boundary and land cover map, with estimated area coverage of each land
cover/land use type
the drivers of change and their relative impact on the habitats and associated ecosystem
services
projected future land cover / land use and ecosystem services changes, based on the
drivers of change
plausible alternative scenarios for future land use
the potential impact of future changes in land cover / land use on the most relevant
ecosystem services
The rapid appraisal exercise provided us with an excellent opportunity to build awareness of the ecosystem services provided by the site and the importance of their measurement. It also provided us with an opportunity to engage diverse stakeholders in capturing the whole range of services that are relevant to Yala Swamp.
Plate 1: Stakeholders listen to Drs Rob Field and Paul Muoria during the field visit session of rapid appraisal of ecosystem services provided by Yala Swamp.
9
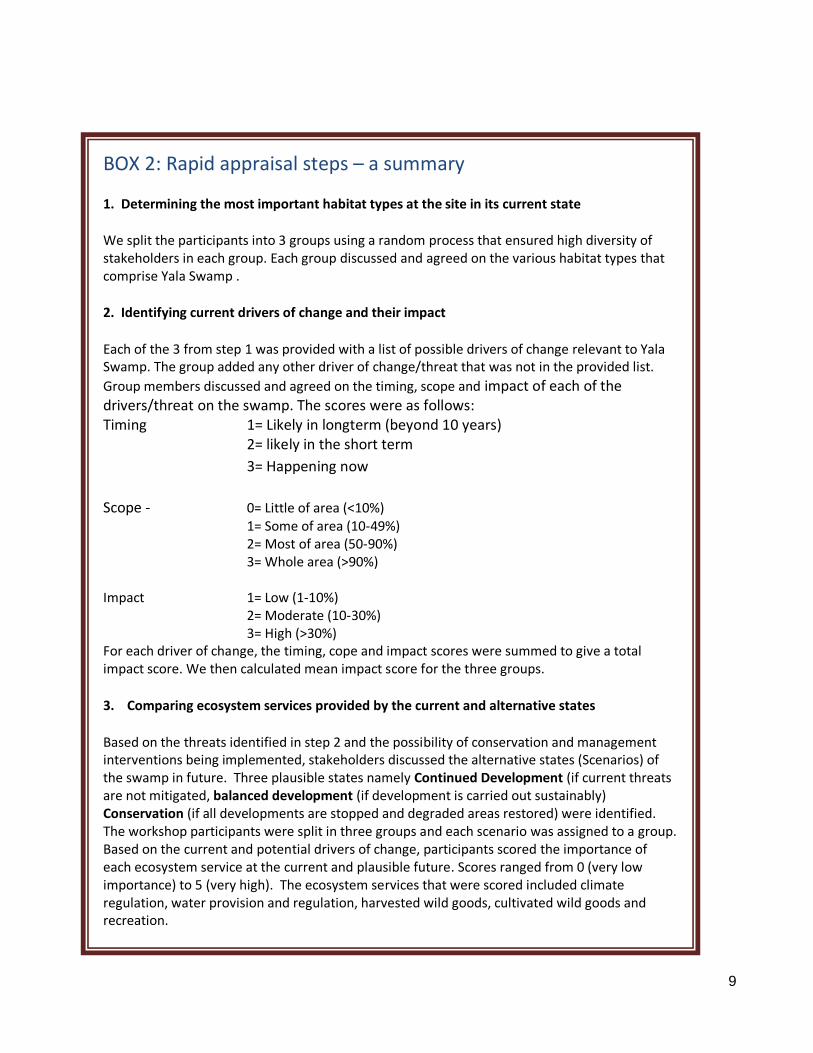
BOX 2: Rapid appraisal steps – a summary
1. Determining the most important habitat types at the site in its current state
We split the participants into 3 groups using a random process that ensured high diversity of stakeholders in each group. Each group discussed and agreed on the various habitat types that comprise Yala Swamp .
2. Identifying current drivers of change and their impact
Each of the 3 from step 1 was provided with a list of possible drivers of change relevant to Yala Swamp. The group added any other driver of change/threat that was not in the provided list.
Group members discussed and agreed on the timing, scope and impact of each of the drivers/threat on the swamp. The scores were as follows: Timing 1= Likely in longterm (beyond 10 years)
2= likely in the short term
3= Happening now
Scope - 0= Little of area (<10%) 1= Some of area (10-49%)
2= Most of area (50-90%) 3= Whole area (>90%) Impact 1= Low (1-10%) 2= Moderate (10-30%) 3= High (>30%) For each driver of change, the timing, cope and impact scores were summed to give a total impact score. We then calculated mean impact score for the three groups.
3. Comparing ecosystem services provided by the current and alternative states
Based on the threats identified in step 2 and the possibility of conservation and management interventions being implemented, stakeholders discussed the alternative states (Scenarios) of the swamp in future. Three plausible states namely Continued Development (if current threats are not mitigated, balanced development (if development is carried out sustainably) Conservation (if all developments are stopped and degraded areas restored) were identified. The workshop participants were split in three groups and each scenario was assigned to a group. Based on the current and potential drivers of change, participants scored the importance of each ecosystem service at the current and plausible future. Scores ranged from 0 (very low importance) to 5 (very high). The ecosystem services that were scored included climate regulation, water provision and regulation, harvested wild goods, cultivated wild goods and recreation.
10
2.2 Results
2.2.1 Current land use/Land cover types
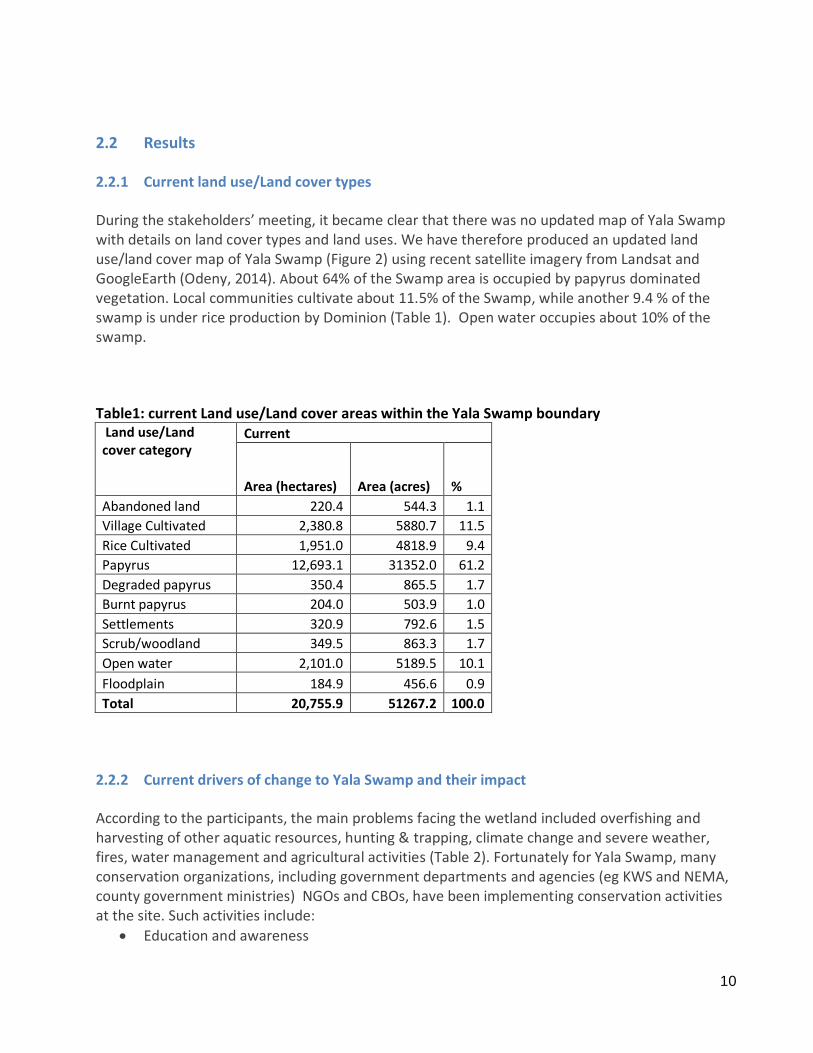
During the stakeholders’ meeting, it became clear that there was no updated map of Yala Swamp with details on land cover types and land uses. We have therefore produced an updated land use/land cover map of Yala Swamp (Figure 2) using recent satellite imagery from Landsat and GoogleEarth (Odeny, 2014). About 64% of the Swamp area is occupied by papyrus dominated vegetation. Local communities cultivate about 11.5% of the Swamp, while another 9.4 % of the swamp is under rice production by Dominion (Table 1). Open water occupies about 10% of the swamp.
Table1: current Land use/Land cover areas within the Yala Swamp boundary Land use/Land cover category
Current
Area (hectares) Area (acres) %
Abandoned land 220.4 544.3 1.1
Village Cultivated 2,380.8 5880.7 11.5
Rice Cultivated 1,951.0 4818.9 9.4
Papyrus 12,693.1 31352.0 61.2
Degraded papyrus 350.4 865.5 1.7
Burnt papyrus 204.0 503.9 1.0
Settlements 320.9 792.6 1.5
Scrub/woodland 349.5 863.3 1.7
Open water 2,101.0 5189.5 10.1
Floodplain 184.9 456.6 0.9
Total 20,755.9 51267.2 100.0
2.2.2 Current drivers of change to Yala Swamp and their impact
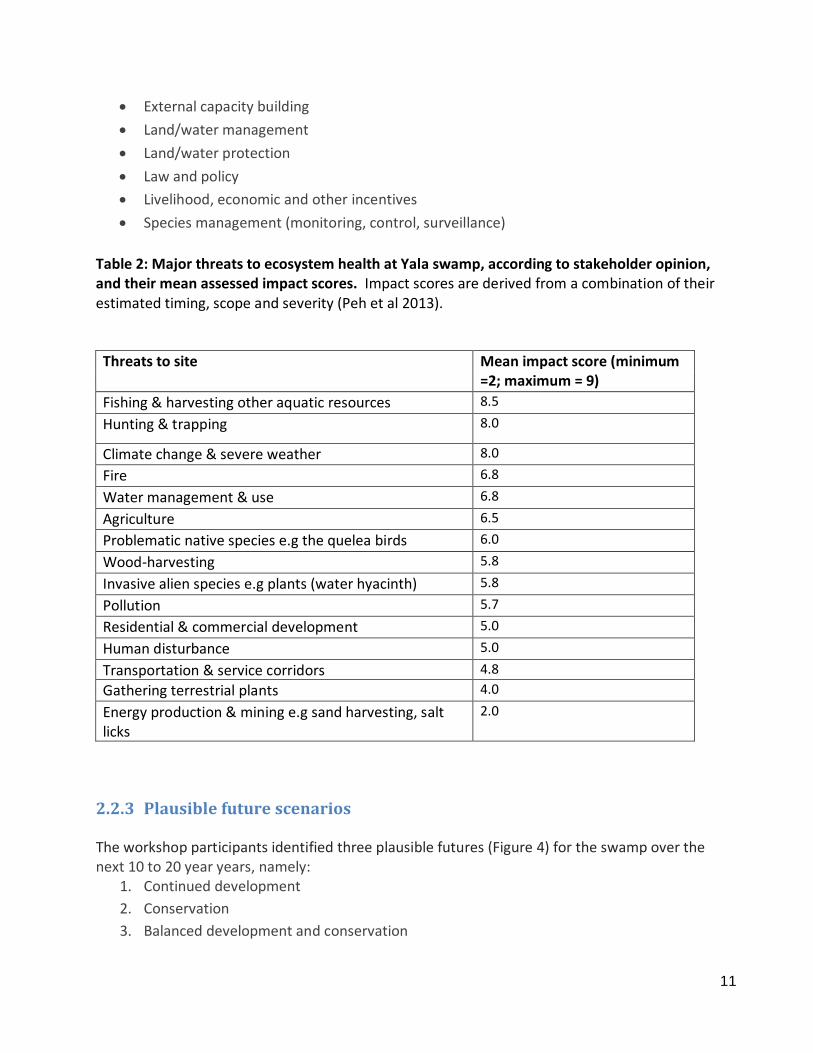
According to the participants, the main problems facing the wetland included overfishing and harvesting of other aquatic resources, hunting & trapping, climate change and severe weather, fires, water management and agricultural activities (Table 2). Fortunately for Yala Swamp, many conservation organizations, including government departments and agencies (eg KWS and NEMA, county government ministries) NGOs and CBOs, have been implementing conservation activities at the site. Such activities include:
Education and awareness
11
External capacity building
Land/water management
Land/water protection
Law and policy
Livelihood, economic and other incentives
Species management (monitoring, control, surveillance)
Table 2: Major threats to ecosystem health at Yala swamp, according to stakeholder opinion, and their mean assessed impact scores. Impact scores are derived from a combination of their estimated timing, scope and severity (Peh et al 2013).
Threats to site Mean impact score (minimum =2; maximum = 9)
Fishing & harvesting other aquatic resources 8.5
Hunting & trapping 8.0
Climate change & severe weather 8.0
Fire 6.8
Water management & use 6.8
Agriculture 6.5
Problematic native species e.g the quelea birds 6.0
Wood-harvesting 5.8
Invasive alien species e.g plants (water hyacinth) 5.8
Pollution 5.7
Residential & commercial development 5.0
Human disturbance 5.0
Transportation & service corridors 4.8
Gathering terrestrial plants 4.0
Energy production & mining e.g sand harvesting, salt licks
2.0
2.2.3 Plausible future scenarios
The workshop participants identified three plausible futures (Figure 4) for the swamp over the next 10 to 20 year years, namely:
1. Continued development
2. Conservation
3. Balanced development and conservation
12
Continued development Scenario
Stakeholders felt that is no measures are taken, the Dominion Farms Limited would continue draining more swamp area for rice production. This would lead to water levels falling at the swamp edge implying that more swamp area would be accessible for food production by the local community. Stakeholders expected that this lead to a decrease in the climate regulation function of the swamp due to drainage, vegetation loss and oxidation of carbon rich soils. A sharp decline in the amount of harvested wild goods including fish, papyrus, thatching grass and firewood would also be expected due to habitat degradation and conversion to agricultural land. However, participants anticipated that the there would be an increase in water flow regulation as irrigation infrastructure is improved. The production of cultivated goods was expected to increase as more land is reclaimed for agricultural production. According to the stakeholders, there would be improved accessibility to the area and better tourism facilities leading to increased recreational use of the swamp.
Conservation Scenario
If a conservation pathway were adopted for the swamp, degraded areas would be restored to natural or semi-natural vegetation, farming activities would be restricted to approximately currently occupied areas and land use conversion would be curtailed. Under these circumstances, climate regulation, water service provision, erosion control, harvested wild goods and aesthetic value of the wetland would be maximised (Figure 4). However, agricultural production would increase only marginally.
Yala Swamp under a balance of uses
This scenario would be achieved if a pathway which balances human development needs and ecosystem conservation is adopted. This would involve setting aside some areas of the swamp for food production (both by Dominion Farms Limited and by the local community) and other areas for biodiversity conservation. Extractive use of natural resources including papyrus, thatching grass, fuel wood and fish would be controlled while non-extractive uses of the swamp , for example recreation, are prompted. Stakeholders were of the opinion that adopting a balanced development and conservation pathway would result in an increase in regulatory (climate change, water flow regulation, soil erosion) functions of the swamp. There would also be an increase in recreational use of the wetland, but a decline in the amount of harvested goods, both wild and cultivated, from the swamp (Figure 4).
2.2.3 Outcome of the Stakeholder workshop
The workshop participants concluded that the Yala Swamp is important in the provision of the following ecosystem services
Global and local climate and air quality regulation
13
Water services
Harvested wild goods
Cultivated goods
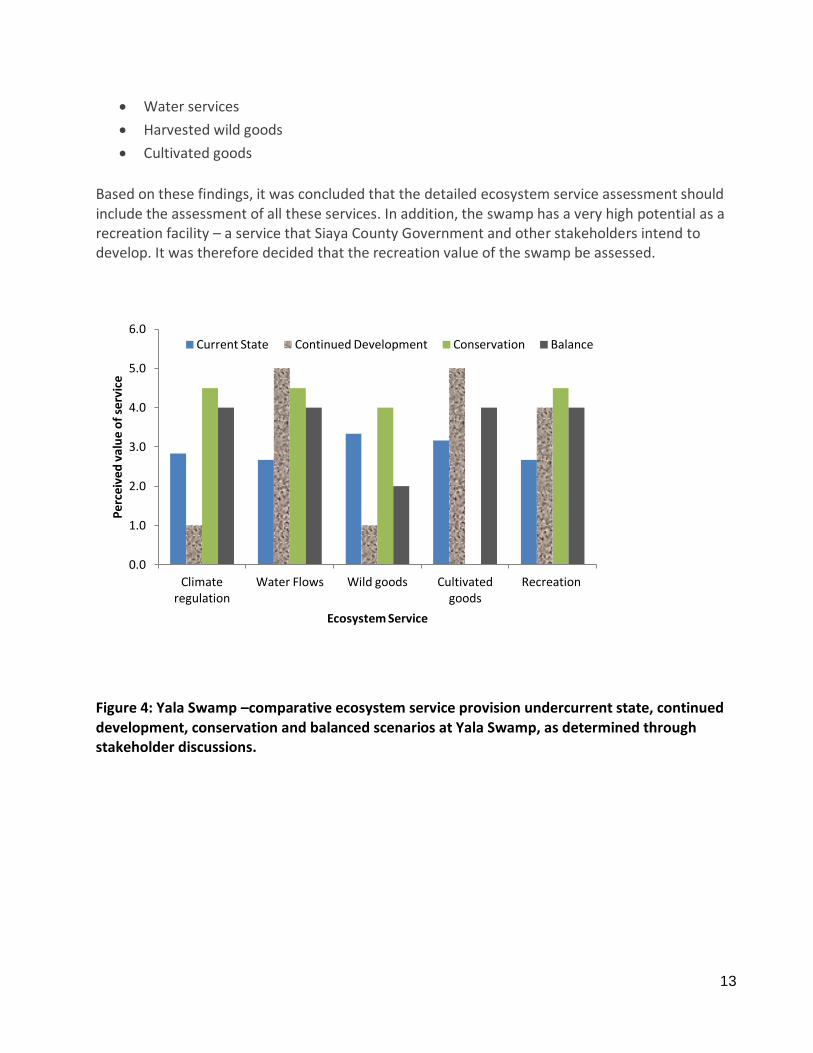
Based on these findings, it was concluded that the detailed ecosystem service assessment should include the assessment of all these services. In addition, the swamp has a very high potential as a recreation facility – a service that Siaya County Government and other stakeholders intend to develop. It was therefore decided that the recreation value of the swamp be assessed.
Figure 4: Yala Swamp –comparative ecosystem service provision undercurrent state, continued development, conservation and balanced scenarios at Yala Swamp, as determined through stakeholder discussions.
0.0
1.0
2.0
3.0
4.0
5.0
6.0
Climate regulation
Water Flows Wild goods Cultivated goods
Recreation
Per
ceiv
ed v
alu
e o
f se
rvic
e
Ecosystem Service
Current State Continued Development Conservation Balance
14
3.0 DETAILED ECOSYSTEM SERVICE ASSESSMENT
3.1 Introduction
During the rapid appraisal workshop stakeholders agreed that a detailed assessment of the climate regulation, cultivated crops, harvested goods, recreation and water provision and regulation services provided by Yala Swamp be conducted. This assessment was conducted between October 2014 and June 2015. We based our assessment on the possible future scenarios identified by stakeholders during the rapid appraisal namely continued development, balanced development and conservation. We have left out the conservation scenario because it is politically difficult to achieve in a region of rapidly expanding human population. We have assumed that the changes below will occur between 2014 and 2040, though the figures presented for services provided in 2040 are point estimates for 1 year of land-uses in a steady state, and not cumulative between 2014 and 2040.
3.1.1 Land Use Land Cover Changes in Future Scenarios
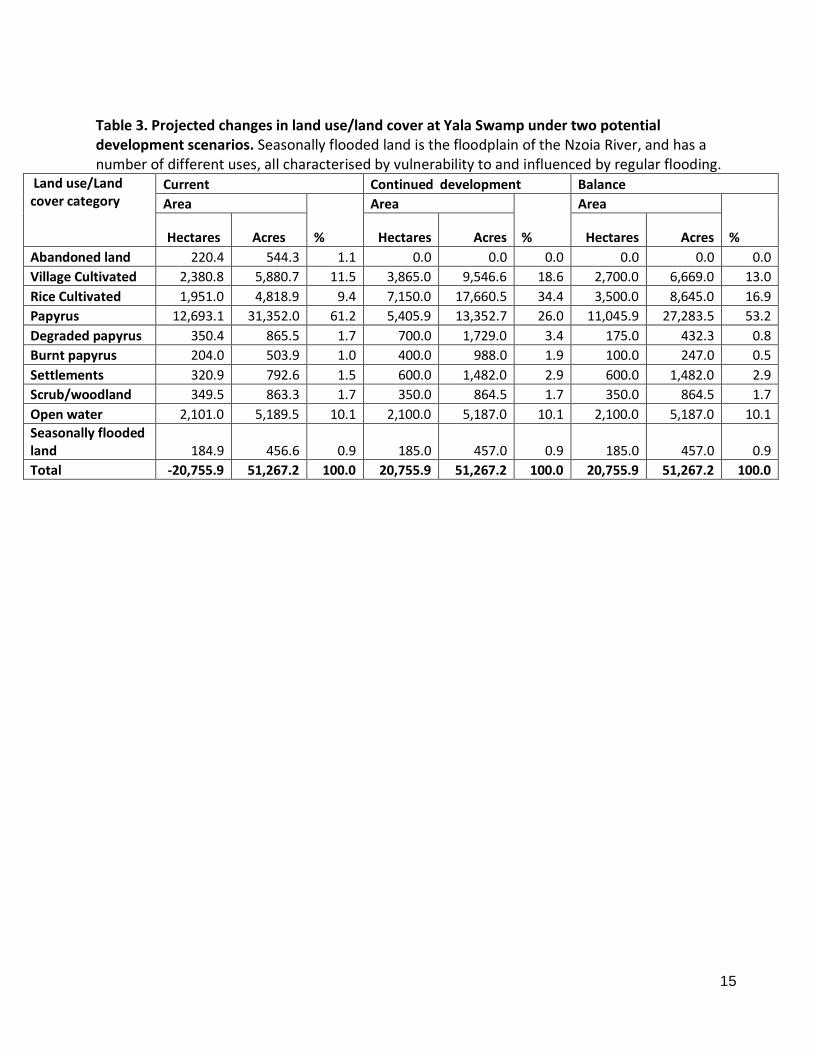
The consequences of these different scenarios for land use are summarised in Table 3 and Figure 5. These areas are not intended as spatially explicit zonings, but for comparative purposes we have assigned approximate locations and sizes of future land-uses, which reflect likely development pathways and land-use changes between 2014 and 2040, but which also make spatially sensible assumptions about future water flows and conservation and farming land-uses. These assumptions have led us to assign the relative areas presented in Table 3 to each land use within the two future scenarios detailed below. It is assumed that land currently under a particular agricultural or community land use will remain in that use in both future scenarios, and that no anthropogenic land use will be favoured over another.
Continued development The area of village cultivated fields increases in the northern area to the furthest extent of current degradation/burning/clearing. The area of rice cultivation/commercial farming increases from the south to meet the southern edge of village fields and westwards to the furthest extent of disturbance, sandbar and settlements. Lakes are excluded. Lake Kanyaboli remains, but is isolated from Lake Victoria. Area of abandoned land is zero - all land is used. The area of water and woody habitats remains unchanged. Areas of settlements and land in the process of conversion (degraded and burnt papyrus) doubles as human population increases. Balanced conservation and development Areas under cultivation increase but allow a corridor of papyrus/swamp between northern village cultivation and southern rice cultivation to maintain connection of Lake Kanyaboli to Lake Victoria. Settlement size doubles, but land under conversion halves. There is no abandoned land - all land is either in production or returned to swamp vegetation. Area of water and woody habitats remains unchanged.
15
Table 3. Projected changes in land use/land cover at Yala Swamp under two potential development scenarios. Seasonally flooded land is the floodplain of the Nzoia River, and has a number of different uses, all characterised by vulnerability to and influenced by regular flooding.
Land use/Land cover category
Current Continued development Balance
Area
%
Area
%
Area
% Hectares Acres Hectares Acres Hectares Acres
Abandoned land 220.4 544.3 1.1 0.0 0.0 0.0 0.0 0.0 0.0
Village Cultivated 2,380.8 5,880.7 11.5 3,865.0 9,546.6 18.6 2,700.0 6,669.0 13.0
Rice Cultivated 1,951.0 4,818.9 9.4 7,150.0 17,660.5 34.4 3,500.0 8,645.0 16.9
Papyrus 12,693.1 31,352.0 61.2 5,405.9 13,352.7 26.0 11,045.9 27,283.5 53.2
Degraded papyrus 350.4 865.5 1.7 700.0 1,729.0 3.4 175.0 432.3 0.8
Burnt papyrus 204.0 503.9 1.0 400.0 988.0 1.9 100.0 247.0 0.5
Settlements 320.9 792.6 1.5 600.0 1,482.0 2.9 600.0 1,482.0 2.9
Scrub/woodland 349.5 863.3 1.7 350.0 864.5 1.7 350.0 864.5 1.7
Open water 2,101.0 5,189.5 10.1 2,100.0 5,187.0 10.1 2,100.0 5,187.0 10.1
Seasonally flooded land 184.9 456.6 0.9 185.0 457.0 0.9 185.0 457.0 0.9
Total -20,755.9 51,267.2 100.0 20,755.9 51,267.2 100.0 20,755.9 51,267.2 100.0
16
17
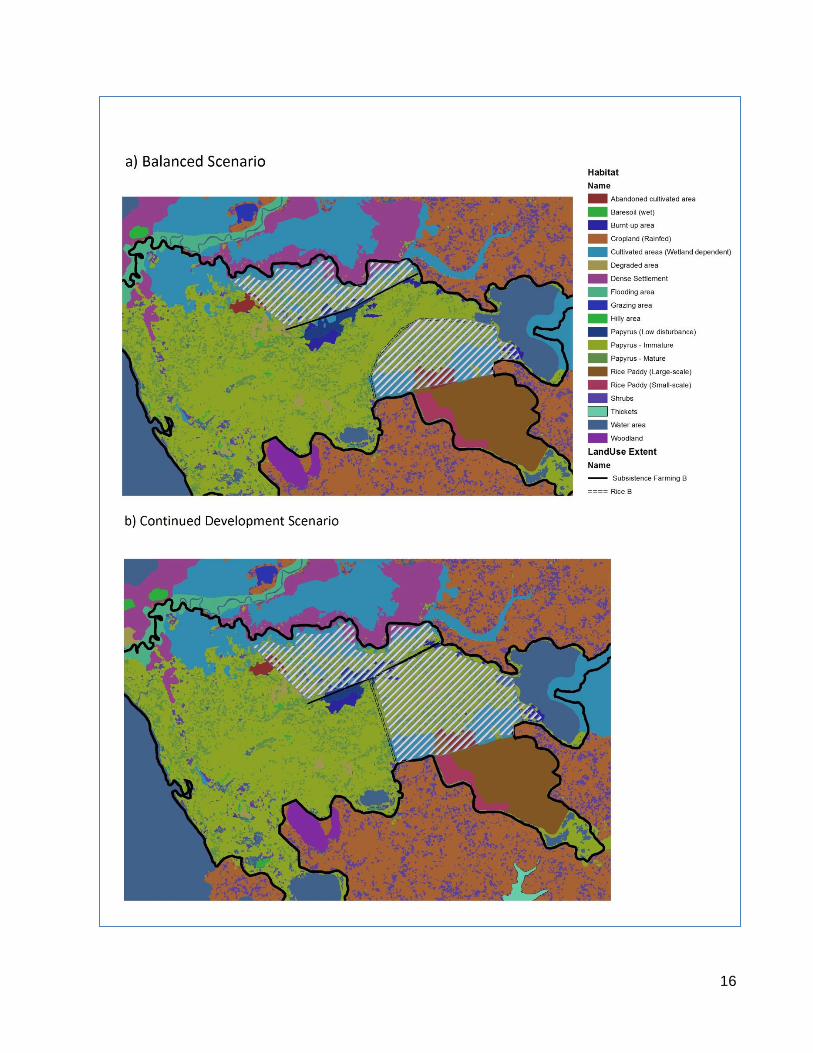
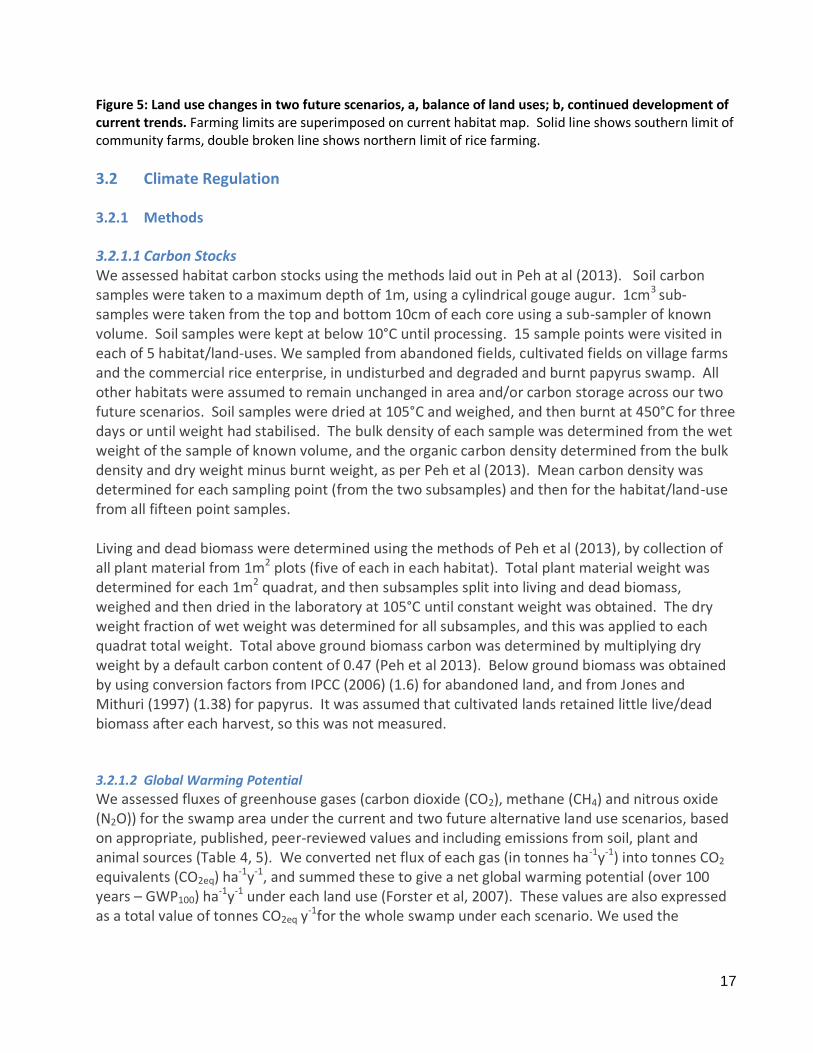
Figure 5: Land use changes in two future scenarios, a, balance of land uses; b, continued development of current trends. Farming limits are superimposed on current habitat map. Solid line shows southern limit of community farms, double broken line shows northern limit of rice farming.
3.2 Climate Regulation
3.2.1 Methods
3.2.1.1 Carbon Stocks We assessed habitat carbon stocks using the methods laid out in Peh at al (2013). Soil carbon samples were taken to a maximum depth of 1m, using a cylindrical gouge augur. 1cm3 sub-samples were taken from the top and bottom 10cm of each core using a sub-sampler of known volume. Soil samples were kept at below 10°C until processing. 15 sample points were visited in each of 5 habitat/land-uses. We sampled from abandoned fields, cultivated fields on village farms and the commercial rice enterprise, in undisturbed and degraded and burnt papyrus swamp. All other habitats were assumed to remain unchanged in area and/or carbon storage across our two future scenarios. Soil samples were dried at 105°C and weighed, and then burnt at 450°C for three days or until weight had stabilised. The bulk density of each sample was determined from the wet weight of the sample of known volume, and the organic carbon density determined from the bulk density and dry weight minus burnt weight, as per Peh et al (2013). Mean carbon density was determined for each sampling point (from the two subsamples) and then for the habitat/land-use from all fifteen point samples. Living and dead biomass were determined using the methods of Peh et al (2013), by collection of all plant material from 1m2 plots (five of each in each habitat). Total plant material weight was determined for each 1m2 quadrat, and then subsamples split into living and dead biomass, weighed and then dried in the laboratory at 105°C until constant weight was obtained. The dry weight fraction of wet weight was determined for all subsamples, and this was applied to each quadrat total weight. Total above ground biomass carbon was determined by multiplying dry weight by a default carbon content of 0.47 (Peh et al 2013). Below ground biomass was obtained by using conversion factors from IPCC (2006) (1.6) for abandoned land, and from Jones and Mithuri (1997) (1.38) for papyrus. It was assumed that cultivated lands retained little live/dead biomass after each harvest, so this was not measured.
3.2.1.2 Global Warming Potential
We assessed fluxes of greenhouse gases (carbon dioxide (CO2), methane (CH4) and nitrous oxide (N2O)) for the swamp area under the current and two future alternative land use scenarios, based on appropriate, published, peer-reviewed values and including emissions from soil, plant and animal sources (Table 4, 5). We converted net flux of each gas (in tonnes ha-1y-1) into tonnes CO2 equivalents (CO2eq) ha-1y-1, and summed these to give a net global warming potential (over 100 years – GWP100) ha-1y-1 under each land use (Forster et al, 2007). These values are also expressed as a total value of tonnes CO2eq y-1for the whole swamp under each scenario. We used the
18
standard convention of positive values indicating net atmospheric warming. Ranges for all values were calculated using the published uncertainties for each flux additively.
3.2.1.3 Soil and vegetation gas fluxes
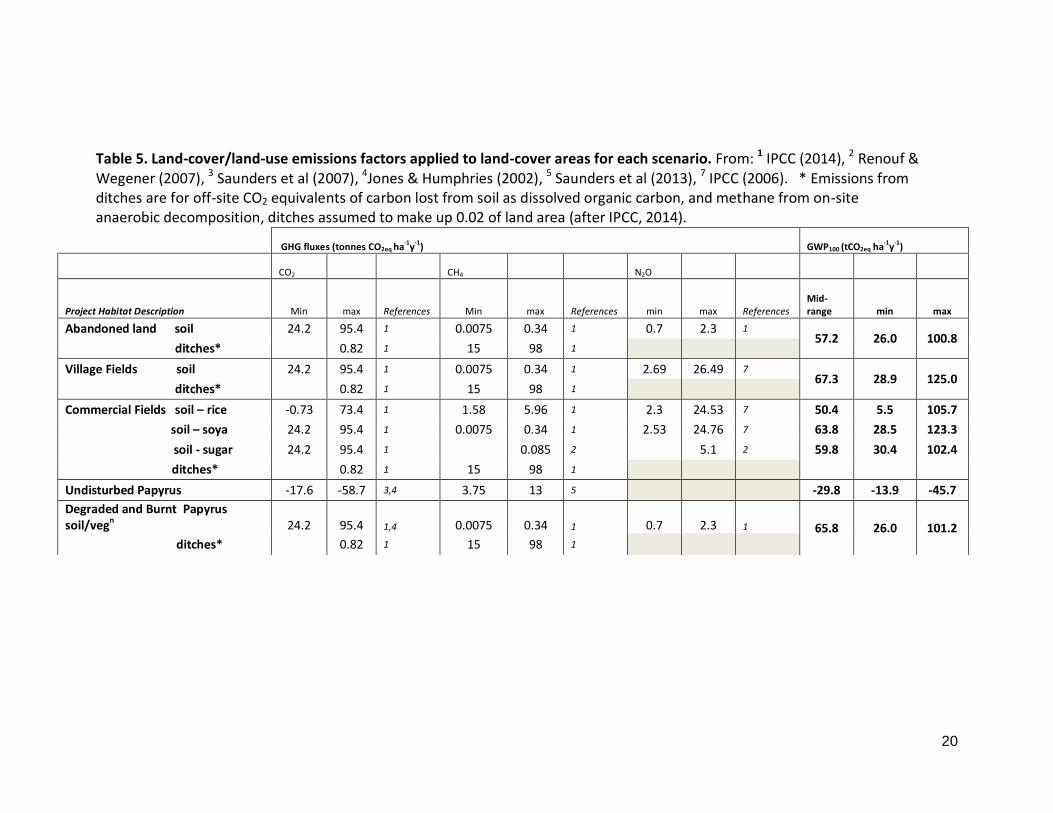
We estimated total net swamp GWP100 using the emissions factors for CO2, CH4 and N2O reported by IPCC (2006, 2014) for farmed land uses, and Jones & Muthuri (1997), Saunders et al. (2007, 2012, 2013) and Jones & Humphries (2002) for natural and semi-natural papyrus habitats. We accounted for soil emissions of CO2 from organic soil aerobic decomposition from tilled land on village fields and commercial rice fields, using the Tier 1 emissions factors given in the Wetlands Supplement of IPCC Volume 4 (2014) (Table 6). We also obtained methane emissions factors (from anaerobic soil decomposition or aerobic methanotrophy) for dry tropical cropland on organic soils (village fields and commercial farming) and rice cultivation (commercial farming) from this source. We used the appropriate emissions factors for CO2 and CH4 from this source for abandoned land (fallow land), where available, or that for tropical cropland where no fallow land values was available. For all drained swamp soils, we also accounted for losses of methane from drainage ditches (assumed at 0.02 of total land-use area (IPCC 2014)) and losses of Dissolved Organic Carbon (DOC) through drainage (IPCC 2014). N2O emissions from land use (cropping and fertiliser use) and livestock were calculated using the Tier 1 methods from IPCC (2006), accounting for organic and mineral fertiliser inputs, crop type and yields, soil type and crop residue management. For sugar-cane growing, emissions factors were taken from Renouf & Wegener (2007). Crop types, yields and areas cultivated on village fields were scaled up proportionally from the results of livelihood questionnaires of the 60 of 300 farmers questioned who farmed land within the swamp boundary. A similar scaling factor was applied to livestock numbers declared by these respondents (see below).
Emissions of CO2 and CH4 from papyrus dominated natural and semi-natural habitats within the swamp were accounted for. We neglected N2O fluxes from these habitats as there is little published information available (Saunders et al 2013). It should be noted however, that nitrous oxide fluxes from emergent wetland plants may be influenced by the nitrate concentration status of the waters surrounding them, and that serious agricultural or human pollution of waters may ameliorate wetland GHG mitigation potential (de Klein and van der Werf 2013). For undisturbed papyrus we used the range of CO2 and methane flux values reported by Saunders et al (2007, 2012, 2013), Jones & Humphries (2002) and Jones & Muthuri (1997) respectively.
3.2.1.4 Livestock gas fluxes
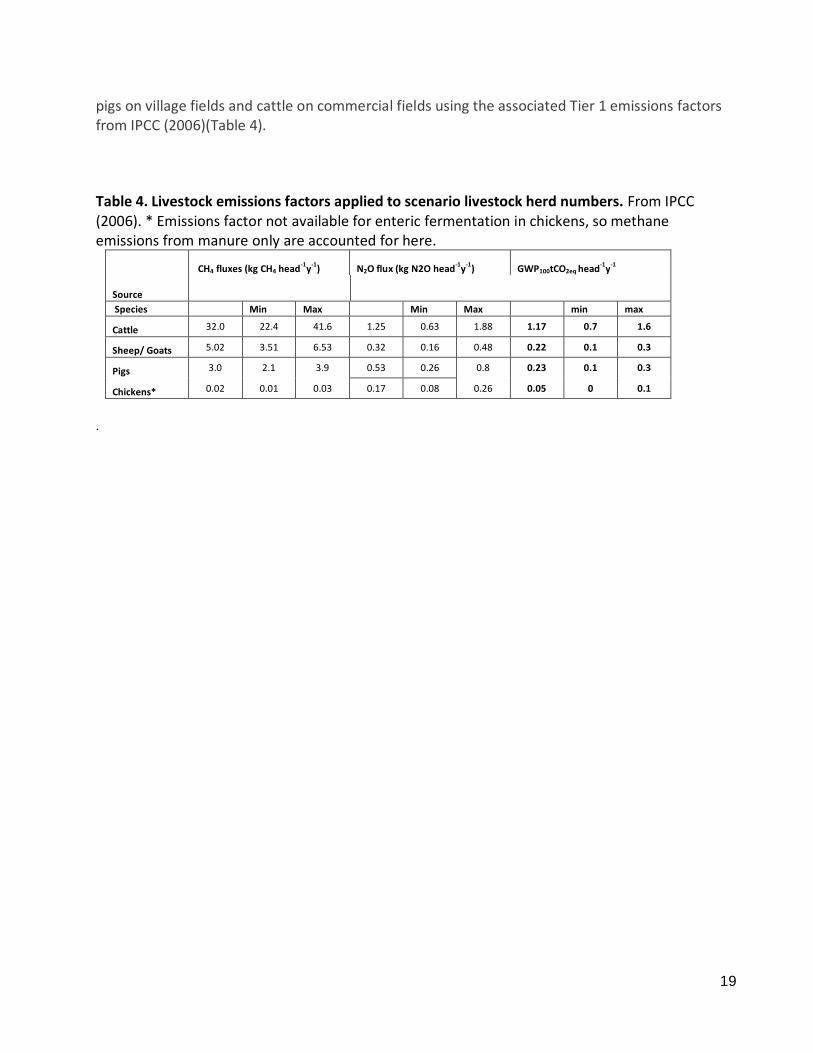
The emissions from livestock grazing farmed habitats in the swamp were accounted for using the Tier 1 emissions factors presented by IPCC (2006). We accounted for the methane emissions from enteric fermentation and manure, and the N2O emissions from manure of cattle goats, sheep and
19
pigs on village fields and cattle on commercial fields using the associated Tier 1 emissions factors from IPCC (2006)(Table 4).
Table 4. Livestock emissions factors applied to scenario livestock herd numbers. From IPCC (2006). * Emissions factor not available for enteric fermentation in chickens, so methane emissions from manure only are accounted for here.
Source
CH4 fluxes (kg CH4 head-1
y-1
) N2O flux (kg N2O head-1
y-1
) GWP100tCO2eq head-1
y-1
Species
Min Max Min Max
min max
Cattle 32.0 22.4 41.6 1.25 0.63 1.88 1.17 0.7 1.6
Sheep/ Goats 5.02 3.51 6.53 0.32 0.16 0.48 0.22 0.1 0.3
Pigs 3.0 2.1 3.9 0.53 0.26 0.8 0.23 0.1 0.3
Chickens* 0.02 0.01 0.03 0.17 0.08 0.26 0.05 0 0.1
.
20
Table 5. Land-cover/land-use emissions factors applied to land-cover areas for each scenario. From: 1 IPCC (2014), 2 Renouf & Wegener (2007), 3 Saunders et al (2007), 4Jones & Humphries (2002), 5 Saunders et al (2013), 7 IPCC (2006). * Emissions from ditches are for off-site CO2 equivalents of carbon lost from soil as dissolved organic carbon, and methane from on-site anaerobic decomposition, ditches assumed to make up 0.02 of land area (after IPCC, 2014).
GHG fluxes (tonnes CO2eq ha
-1y
-1) GWP100 (tCO2eq ha
-1y
-1)
CO2
CH4
N2O
Project Habitat Description Min max References Min max References min max References Mid-range min max
Abandoned land soil 24.2 95.4 1 0.0075 0.34 1 0.7 2.3 1 57.2 26.0 100.8
ditches*
0.82 1 15 98 1
Village Fields soil 24.2 95.4 1 0.0075 0.34 1 2.69 26.49 7 67.3 28.9 125.0
ditches*
0.82 1 15 98 1
Commercial Fields soil – rice -0.73 73.4 1 1.58 5.96 1 2.3 24.53 7 50.4 5.5 105.7
soil – soya 24.2 95.4 1 0.0075 0.34 1 2.53 24.76 7 63.8 28.5 123.3
soil - sugar 24.2 95.4 1
0.085 2
5.1 2 59.8 30.4 102.4
ditches*
0.82 1 15 98 1
Undisturbed Papyrus -17.6 -58.7 3,4 3.75 13 5
-29.8 -13.9 -45.7
Degraded and Burnt Papyrus soil/vegn 24.2 95.4 1,4 0.0075 0.34 1 0.7 2.3 1 65.8 26.0 101.2
ditches*
0.82 1 15 98 1
21
3.2.2 Results
3.2.2.1 Carbon Storage
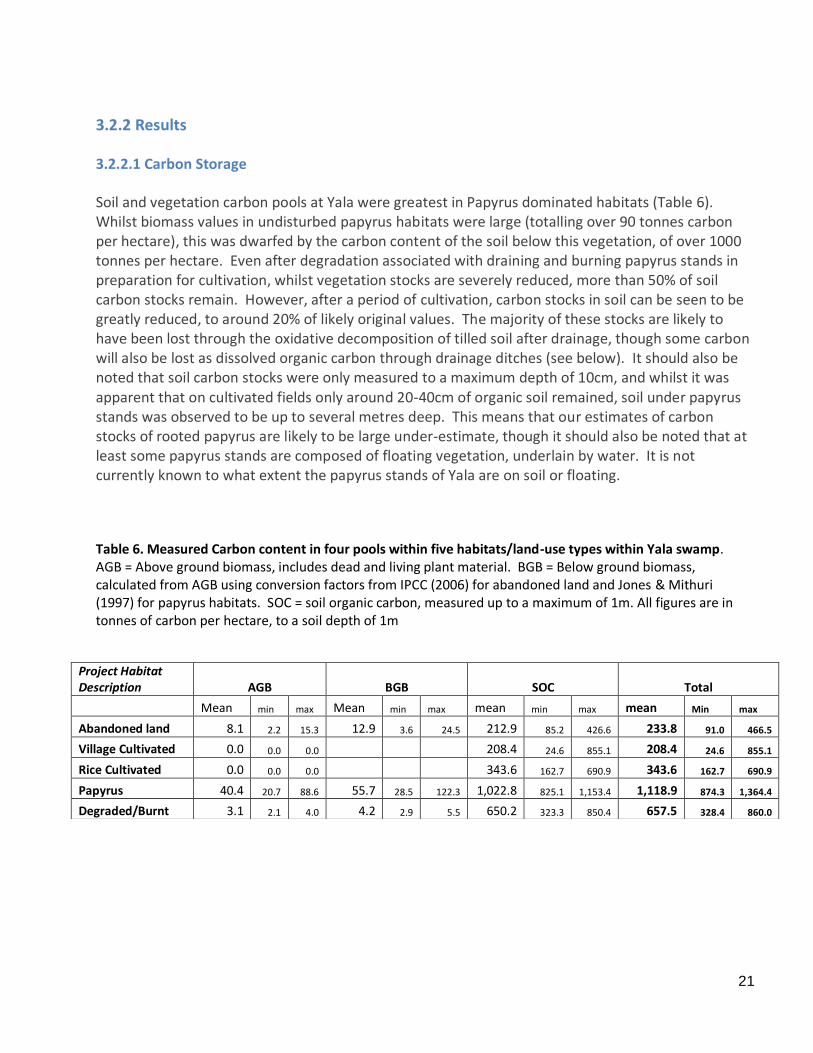
Soil and vegetation carbon pools at Yala were greatest in Papyrus dominated habitats (Table 6). Whilst biomass values in undisturbed papyrus habitats were large (totalling over 90 tonnes carbon per hectare), this was dwarfed by the carbon content of the soil below this vegetation, of over 1000 tonnes per hectare. Even after degradation associated with draining and burning papyrus stands in preparation for cultivation, whilst vegetation stocks are severely reduced, more than 50% of soil carbon stocks remain. However, after a period of cultivation, carbon stocks in soil can be seen to be greatly reduced, to around 20% of likely original values. The majority of these stocks are likely to have been lost through the oxidative decomposition of tilled soil after drainage, though some carbon will also be lost as dissolved organic carbon through drainage ditches (see below). It should also be noted that soil carbon stocks were only measured to a maximum depth of 10cm, and whilst it was apparent that on cultivated fields only around 20-40cm of organic soil remained, soil under papyrus stands was observed to be up to several metres deep. This means that our estimates of carbon stocks of rooted papyrus are likely to be large under-estimate, though it should also be noted that at least some papyrus stands are composed of floating vegetation, underlain by water. It is not currently known to what extent the papyrus stands of Yala are on soil or floating.
Table 6. Measured Carbon content in four pools within five habitats/land-use types within Yala swamp. AGB = Above ground biomass, includes dead and living plant material. BGB = Below ground biomass, calculated from AGB using conversion factors from IPCC (2006) for abandoned land and Jones & Mithuri (1997) for papyrus habitats. SOC = soil organic carbon, measured up to a maximum of 1m. All figures are in tonnes of carbon per hectare, to a soil depth of 1m
Project Habitat Description AGB BGB SOC Total
Mean min max Mean min max mean min max mean Min max
Abandoned land 8.1 2.2 15.3 12.9 3.6 24.5 212.9 85.2 426.6 233.8 91.0 466.5
Village Cultivated 0.0 0.0 0.0
208.4 24.6 855.1 208.4 24.6 855.1
Rice Cultivated 0.0 0.0 0.0
343.6 162.7 690.9 343.6 162.7 690.9
Papyrus 40.4 20.7 88.6 55.7 28.5 122.3 1,022.8 825.1 1,153.4 1,118.9 874.3 1,364.4
Degraded/Burnt 3.1 2.1 4.0 4.2 2.9 5.5 650.2 323.3 850.4 657.5 328.4 860.0
22
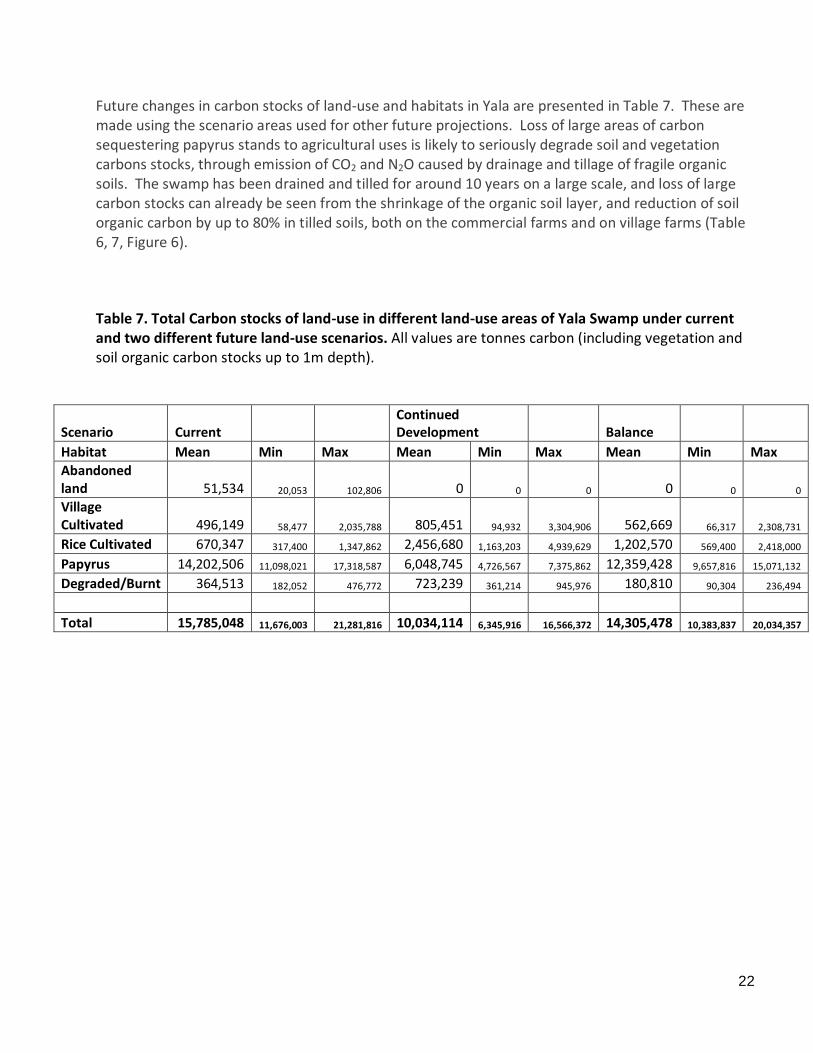
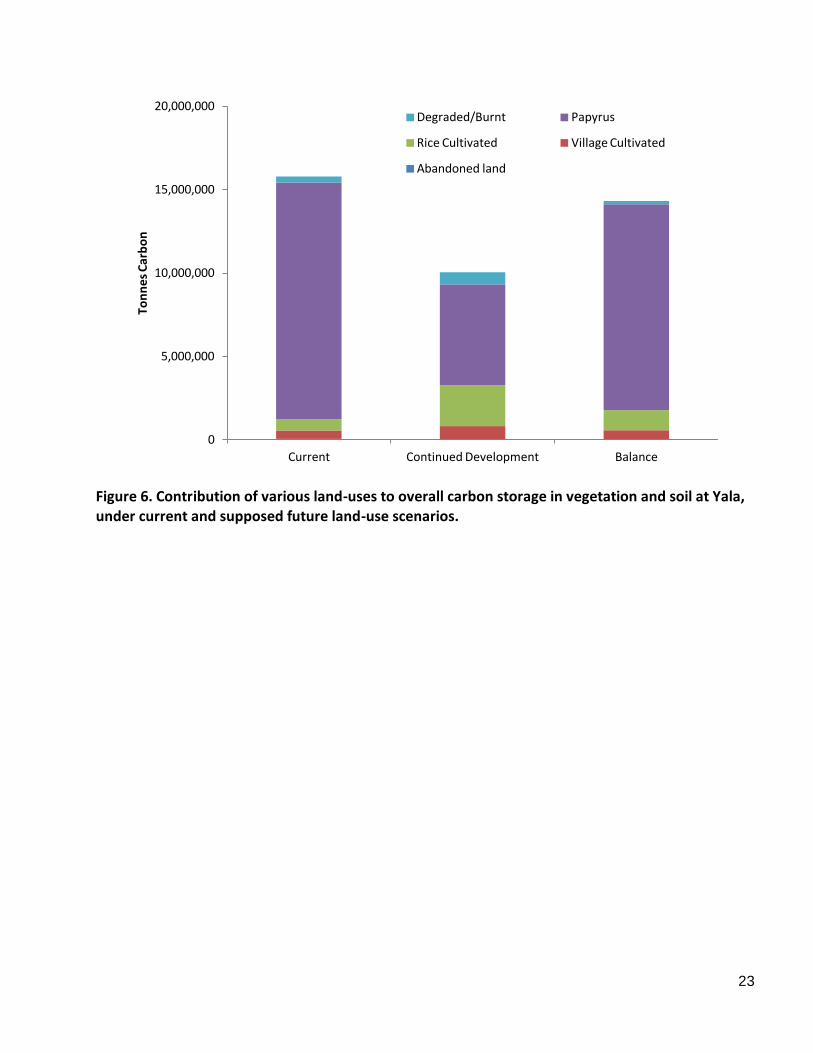
Future changes in carbon stocks of land-use and habitats in Yala are presented in Table 7. These are made using the scenario areas used for other future projections. Loss of large areas of carbon sequestering papyrus stands to agricultural uses is likely to seriously degrade soil and vegetation carbons stocks, through emission of CO2 and N2O caused by drainage and tillage of fragile organic soils. The swamp has been drained and tilled for around 10 years on a large scale, and loss of large carbon stocks can already be seen from the shrinkage of the organic soil layer, and reduction of soil organic carbon by up to 80% in tilled soils, both on the commercial farms and on village farms (Table 6, 7, Figure 6).
Table 7. Total Carbon stocks of land-use in different land-use areas of Yala Swamp under current and two different future land-use scenarios. All values are tonnes carbon (including vegetation and soil organic carbon stocks up to 1m depth).
Scenario Current
Continued Development
Balance
Habitat Mean Min Max Mean Min Max Mean Min Max
Abandoned land 51,534 20,053 102,806 0 0 0 0 0 0
Village Cultivated 496,149 58,477 2,035,788 805,451 94,932 3,304,906 562,669 66,317 2,308,731
Rice Cultivated 670,347 317,400 1,347,862 2,456,680 1,163,203 4,939,629 1,202,570 569,400 2,418,000
Papyrus 14,202,506 11,098,021 17,318,587 6,048,745 4,726,567 7,375,862 12,359,428 9,657,816 15,071,132
Degraded/Burnt 364,513 182,052 476,772 723,239 361,214 945,976 180,810 90,304 236,494
Total 15,785,048 11,676,003 21,281,816 10,034,114 6,345,916 16,566,372 14,305,478 10,383,837 20,034,357
23
Figure 6. Contribution of various land-uses to overall carbon storage in vegetation and soil at Yala, under current and supposed future land-use scenarios.
0
5,000,000
10,000,000
15,000,000
20,000,000
Current Continued Development Balance
Ton
ne
s C
arb
on
Degraded/Burnt Papyrus
Rice Cultivated Village Cultivated
Abandoned land
24
3.2.2.2 Global warming potential
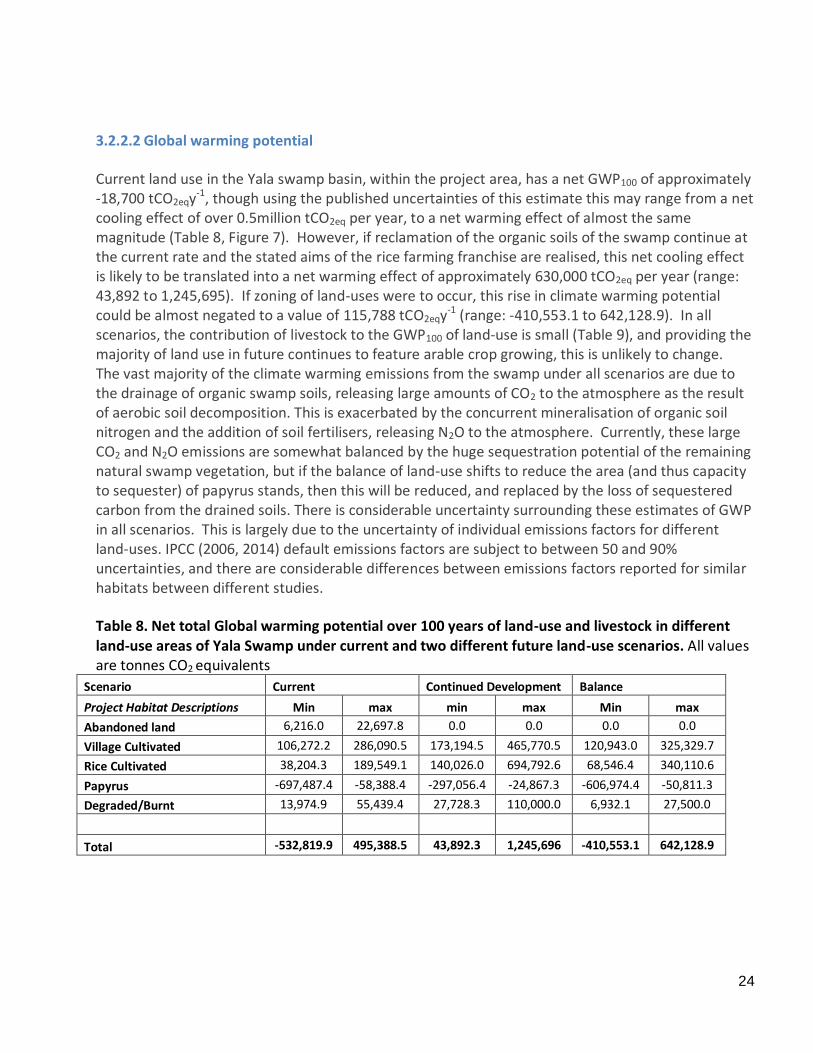
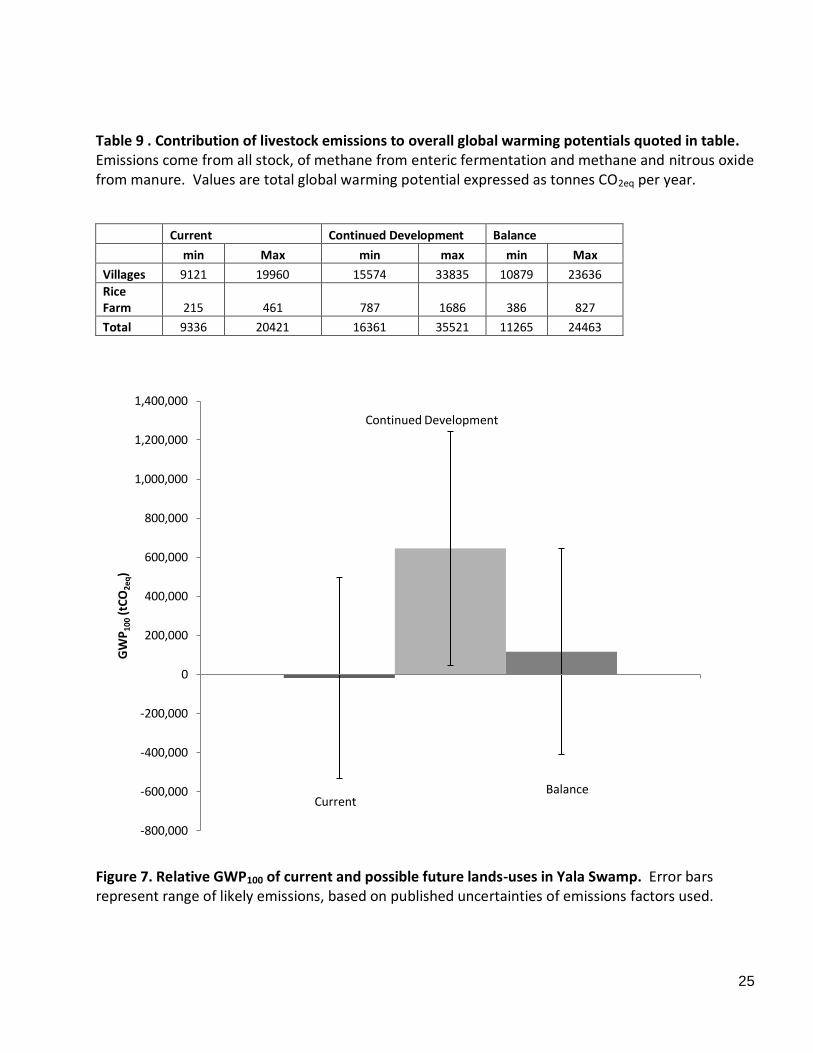
Current land use in the Yala swamp basin, within the project area, has a net GWP100 of approximately -18,700 tCO2eqy-1, though using the published uncertainties of this estimate this may range from a net cooling effect of over 0.5million tCO2eq per year, to a net warming effect of almost the same magnitude (Table 8, Figure 7). However, if reclamation of the organic soils of the swamp continue at the current rate and the stated aims of the rice farming franchise are realised, this net cooling effect is likely to be translated into a net warming effect of approximately 630,000 tCO2eq per year (range: 43,892 to 1,245,695). If zoning of land-uses were to occur, this rise in climate warming potential could be almost negated to a value of 115,788 tCO2eqy-1 (range: -410,553.1 to 642,128.9). In all scenarios, the contribution of livestock to the GWP100 of land-use is small (Table 9), and providing the majority of land use in future continues to feature arable crop growing, this is unlikely to change. The vast majority of the climate warming emissions from the swamp under all scenarios are due to the drainage of organic swamp soils, releasing large amounts of CO2 to the atmosphere as the result of aerobic soil decomposition. This is exacerbated by the concurrent mineralisation of organic soil nitrogen and the addition of soil fertilisers, releasing N2O to the atmosphere. Currently, these large CO2 and N2O emissions are somewhat balanced by the huge sequestration potential of the remaining natural swamp vegetation, but if the balance of land-use shifts to reduce the area (and thus capacity to sequester) of papyrus stands, then this will be reduced, and replaced by the loss of sequestered carbon from the drained soils. There is considerable uncertainty surrounding these estimates of GWP in all scenarios. This is largely due to the uncertainty of individual emissions factors for different land-uses. IPCC (2006, 2014) default emissions factors are subject to between 50 and 90% uncertainties, and there are considerable differences between emissions factors reported for similar habitats between different studies.
Table 8. Net total Global warming potential over 100 years of land-use and livestock in different land-use areas of Yala Swamp under current and two different future land-use scenarios. All values are tonnes CO2 equivalents
Scenario Current Continued Development Balance
Project Habitat Descriptions Min max min max Min max
Abandoned land 6,216.0 22,697.8 0.0 0.0 0.0 0.0
Village Cultivated 106,272.2 286,090.5 173,194.5 465,770.5 120,943.0 325,329.7
Rice Cultivated 38,204.3 189,549.1 140,026.0 694,792.6 68,546.4 340,110.6
Papyrus -697,487.4 -58,388.4 -297,056.4 -24,867.3 -606,974.4 -50,811.3
Degraded/Burnt 13,974.9 55,439.4 27,728.3 110,000.0 6,932.1 27,500.0
Total -532,819.9 495,388.5 43,892.3 1,245,696 -410,553.1 642,128.9
25
Table 9 . Contribution of livestock emissions to overall global warming potentials quoted in table. Emissions come from all stock, of methane from enteric fermentation and methane and nitrous oxide from manure. Values are total global warming potential expressed as tonnes CO2eq per year.
Current Continued Development Balance
min Max min max min Max
Villages 9121 19960 15574 33835 10879 23636
Rice Farm 215 461 787 1686 386 827
Total 9336 20421 16361 35521 11265 24463
Figure 7. Relative GWP100 of current and possible future lands-uses in Yala Swamp. Error bars represent range of likely emissions, based on published uncertainties of emissions factors used.
-800,000
-600,000
-400,000
-200,000
0
200,000
400,000
600,000
800,000
1,000,000
1,200,000
1,400,000
1
GW
P1
00
(tC
O2
eq)
Current
Continued Development
Balance
26
3.3 Cultivated Goods
3.3.1 Methods
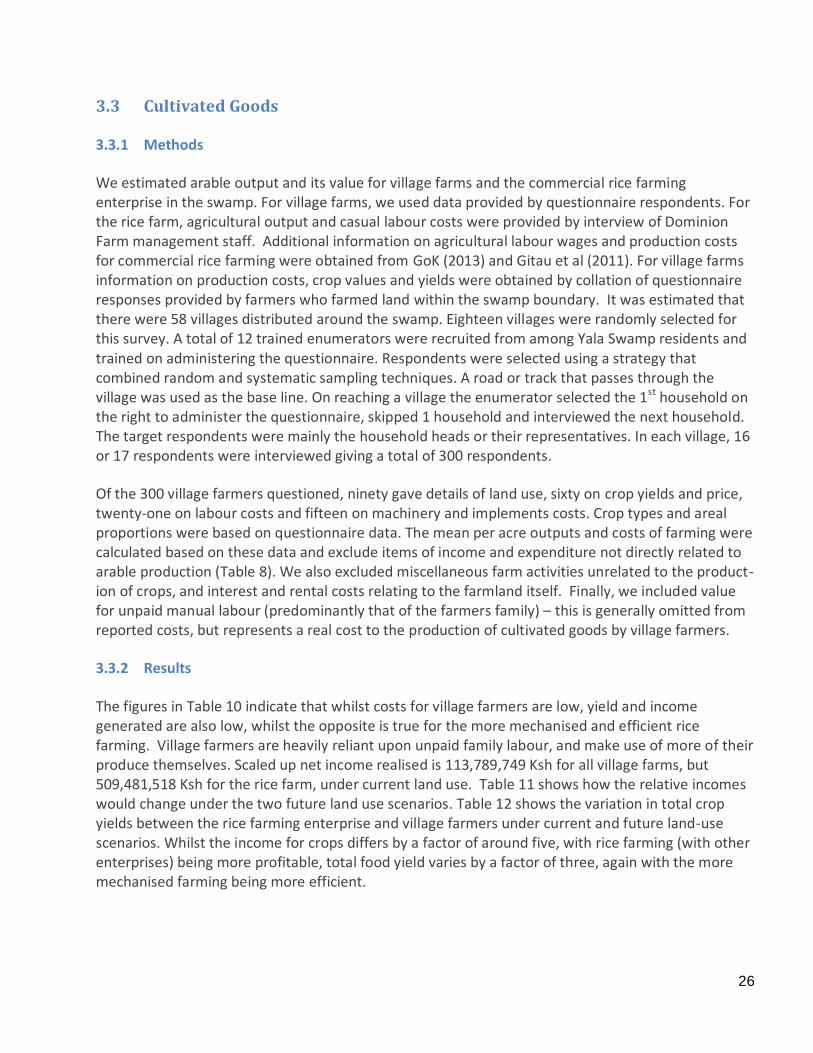
We estimated arable output and its value for village farms and the commercial rice farming enterprise in the swamp. For village farms, we used data provided by questionnaire respondents. For the rice farm, agricultural output and casual labour costs were provided by interview of Dominion Farm management staff. Additional information on agricultural labour wages and production costs for commercial rice farming were obtained from GoK (2013) and Gitau et al (2011). For village farms information on production costs, crop values and yields were obtained by collation of questionnaire responses provided by farmers who farmed land within the swamp boundary. It was estimated that there were 58 villages distributed around the swamp. Eighteen villages were randomly selected for this survey. A total of 12 trained enumerators were recruited from among Yala Swamp residents and trained on administering the questionnaire. Respondents were selected using a strategy that combined random and systematic sampling techniques. A road or track that passes through the village was used as the base line. On reaching a village the enumerator selected the 1st household on the right to administer the questionnaire, skipped 1 household and interviewed the next household. The target respondents were mainly the household heads or their representatives. In each village, 16 or 17 respondents were interviewed giving a total of 300 respondents.
Of the 300 village farmers questioned, ninety gave details of land use, sixty on crop yields and price, twenty-one on labour costs and fifteen on machinery and implements costs. Crop types and areal proportions were based on questionnaire data. The mean per acre outputs and costs of farming were calculated based on these data and exclude items of income and expenditure not directly related to arable production (Table 8). We also excluded miscellaneous farm activities unrelated to the product-ion of crops, and interest and rental costs relating to the farmland itself. Finally, we included value for unpaid manual labour (predominantly that of the farmers family) – this is generally omitted from reported costs, but represents a real cost to the production of cultivated goods by village farmers.
3.3.2 Results
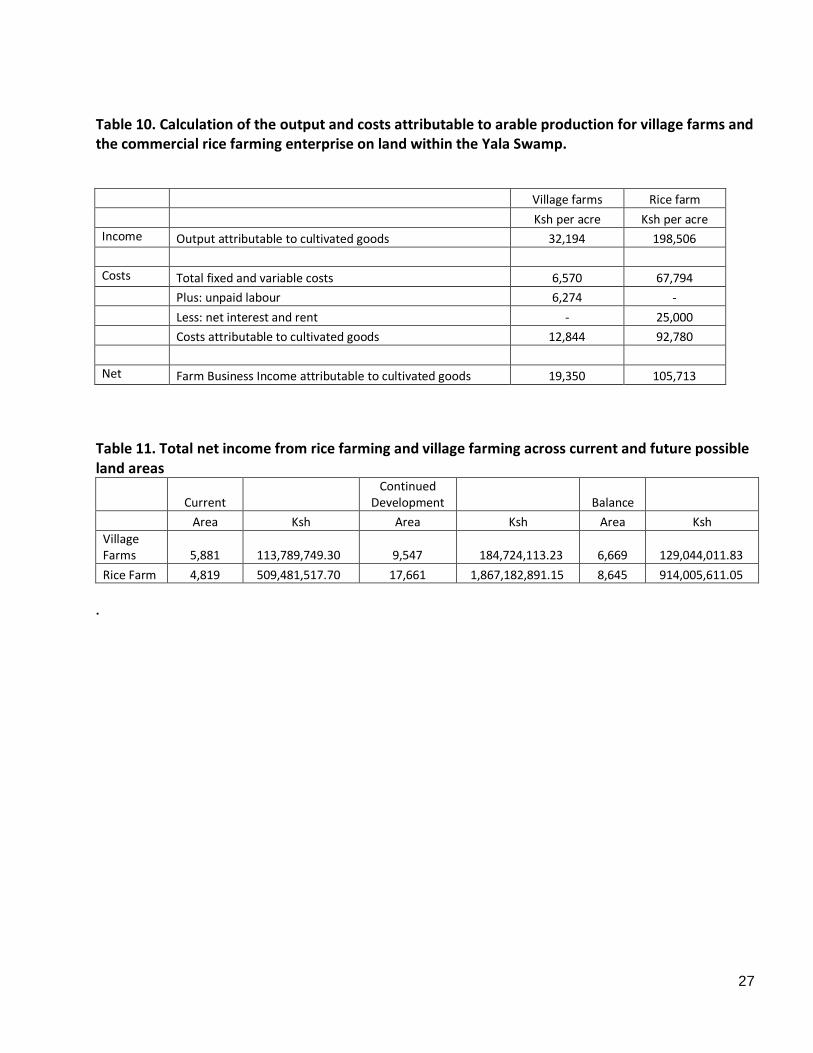
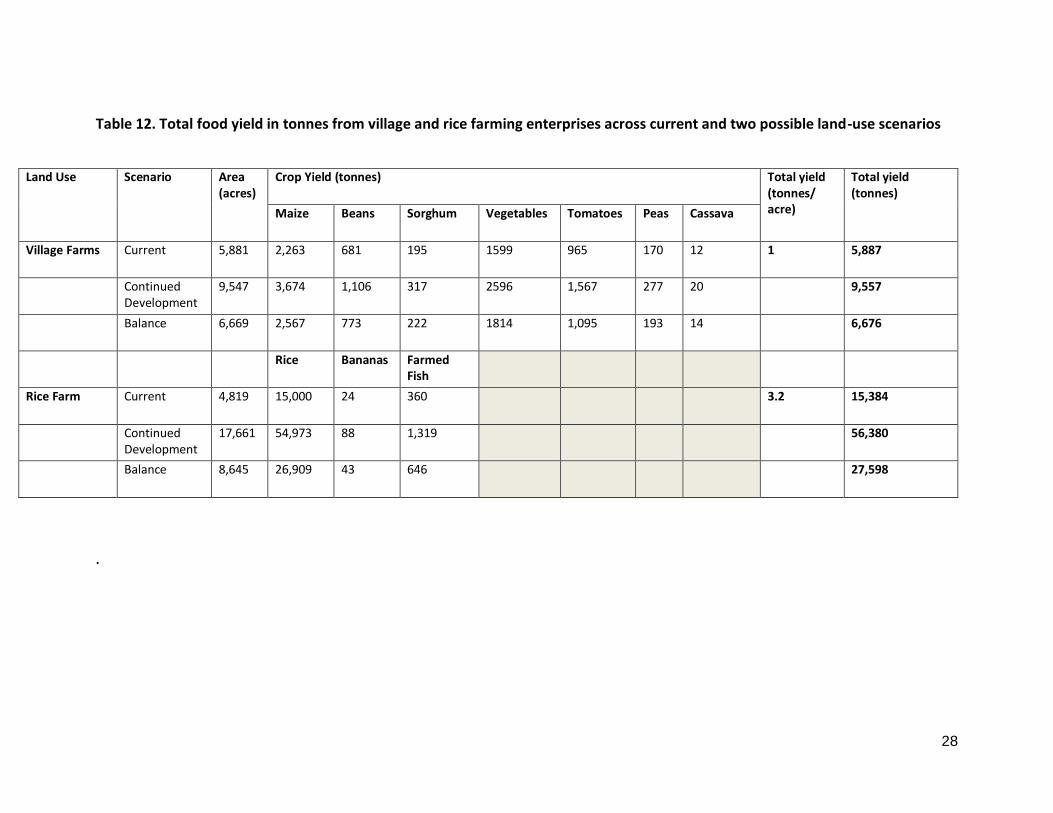
The figures in Table 10 indicate that whilst costs for village farmers are low, yield and income generated are also low, whilst the opposite is true for the more mechanised and efficient rice farming. Village farmers are heavily reliant upon unpaid family labour, and make use of more of their produce themselves. Scaled up net income realised is 113,789,749 Ksh for all village farms, but 509,481,518 Ksh for the rice farm, under current land use. Table 11 shows how the relative incomes would change under the two future land use scenarios. Table 12 shows the variation in total crop yields between the rice farming enterprise and village farmers under current and future land-use scenarios. Whilst the income for crops differs by a factor of around five, with rice farming (with other enterprises) being more profitable, total food yield varies by a factor of three, again with the more mechanised farming being more efficient.
27
Table 10. Calculation of the output and costs attributable to arable production for village farms and the commercial rice farming enterprise on land within the Yala Swamp.
Village farms Rice farm
Ksh per acre Ksh per acre
Income Output attributable to cultivated goods 32,194 198,506
Costs Total fixed and variable costs 6,570 67,794
Plus: unpaid labour 6,274 -
Less: net interest and rent - 25,000
Costs attributable to cultivated goods 12,844 92,780
Net Farm Business Income attributable to cultivated goods 19,350 105,713
Table 11. Total net income from rice farming and village farming across current and future possible land areas
Current
Continued Development
Balance
Area Ksh Area Ksh Area Ksh
Village Farms 5,881 113,789,749.30 9,547 184,724,113.23 6,669 129,044,011.83
Rice Farm 4,819 509,481,517.70 17,661 1,867,182,891.15 8,645 914,005,611.05
.
28
Table 12. Total food yield in tonnes from village and rice farming enterprises across current and two possible land-use scenarios
Land Use Scenario Area (acres)
Crop Yield (tonnes) Total yield (tonnes/ acre)
Total yield (tonnes)
Maize Beans Sorghum Vegetables Tomatoes Peas Cassava
Village Farms Current 5,881 2,263 681 195 1599 965 170 12 1 5,887
Continued Development
9,547 3,674 1,106 317 2596 1,567 277 20 9,557
Balance 6,669 2,567 773 222 1814 1,095 193 14 6,676
Rice Bananas Farmed Fish
Rice Farm Current 4,819 15,000 24 360 3.2 15,384
Continued Development
17,661 54,973 88 1,319 56,380
Balance 8,645 26,909 43 646 27,598
.
29
3.4 Harvested Wild Goods
3.4.1 Methods
We estimated the amount of wild harvested goods (firewood, thatch grass, papyrus, fish, bush meat, wild fruits, and livestock fodder) using data provided by 300 respondents who reside near the swamp. The mean value of fish and firewood harvest was based on local market prices whereas the mean prices per bundle of papyrus and thatch grass were based on the value quoted by the respondents. The questionnaire data were also used to estimate production cost (cost of household and hired labour and the cost of equipment) for papyrus, firewood, and thatch grass. The production cost of fish harvested from the site was estimated from data available in Abila & Othina (2006) that suggest a catch effort of 57.3% of the value of the fish caught using the gillnet method. Since most of the firewood, papyrus and thatch grass is harvested from the periphery of the papyrus area, the potential harvest change in different future scenarios will depend on changes in access to the swamp periphery. Although the amount of open waters will remain constant, wild caught fish production might decrease in the development scenario due to potential pollution from agrochemicals coupled with failure of the filtering function of papyrus vegetation. However, it is difficult to estimate the quantity of decline in the amount of harvested goods in the future. We therefore used qualitative analysis to depict this decline.
3.4.2 Results
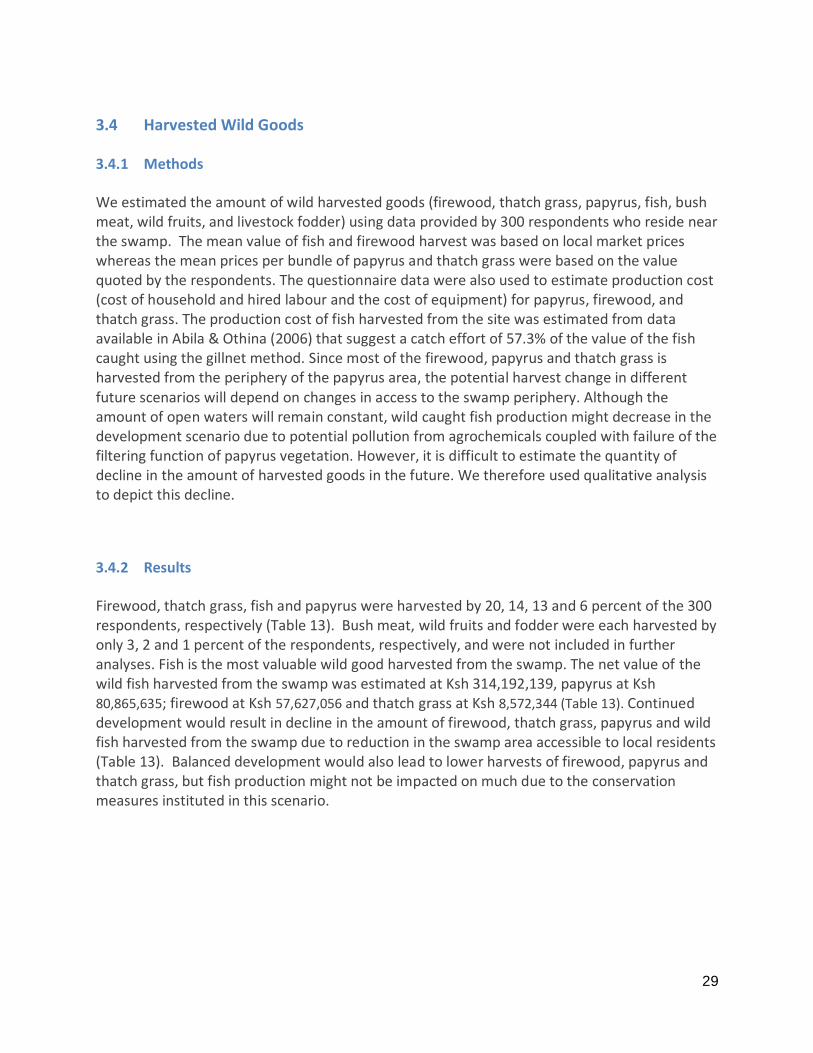
Firewood, thatch grass, fish and papyrus were harvested by 20, 14, 13 and 6 percent of the 300 respondents, respectively (Table 13). Bush meat, wild fruits and fodder were each harvested by only 3, 2 and 1 percent of the respondents, respectively, and were not included in further analyses. Fish is the most valuable wild good harvested from the swamp. The net value of the wild fish harvested from the swamp was estimated at Ksh 314,192,139, papyrus at Ksh 80,865,635; firewood at Ksh 57,627,056 and thatch grass at Ksh 8,572,344 (Table 13). Continued development would result in decline in the amount of firewood, thatch grass, papyrus and wild fish harvested from the swamp due to reduction in the swamp area accessible to local residents (Table 13). Balanced development would also lead to lower harvests of firewood, papyrus and thatch grass, but fish production might not be impacted on much due to the conservation measures instituted in this scenario.
30
Table 13: The value of fish, papyrus, firewood and thatch grass harvested from Yala Swamp.
In the Table, means decrease in service, Means either no decrease or slight decrease in service
Product N Respondents who harvest
Quantity harvested
Mean price (Ksh)
Value of product for 300 respondents (Ksh)
Total value (for all residents) in different Scenario (Ksh.)
Number Percent Gross value
Production cost
Net value Current state
Continued development
Balanced
Wild harvested Fish
300 40 13.33 34,408Kg 300 10,322,400 5,914,735 4,407,665 314,192,139
Papyrus products
300 17 5.67 14,062 Bundles
216 3,034,580 2,014,391
1,020,189 80,865,635
Firewood 300 59 19.67 34,329 Head loads
75 2,574,638 1,847,660 727,015 57,627,056
Thatch grass
300 42 14.00 22,396 Bundles
139 3,122,044 3,013,897 108,147 8,572,344
31
3.5 Water provision, Flood Regulation and Water Quality Regulation Services
3.5.1 Methods
We used a questionnaire adapted from Peh et al (2013) to interview 300 respondents living near the Yala Swamp boundary, to obtain information on the importance of the swamp in water provision and flood and water quality regulation. As outlined in the general approach and Figure 3, the swamp-dependent population is estimated at 120,087 individuals. Given that the mean household size is 5.05 (Nature Kenya, 2011), this translates into 23,780 households. We used this figure to calculate the total water consumption by swamp-dependent residents.
3.5.2 Results
3.5.2.1 Current water provision services to the local community
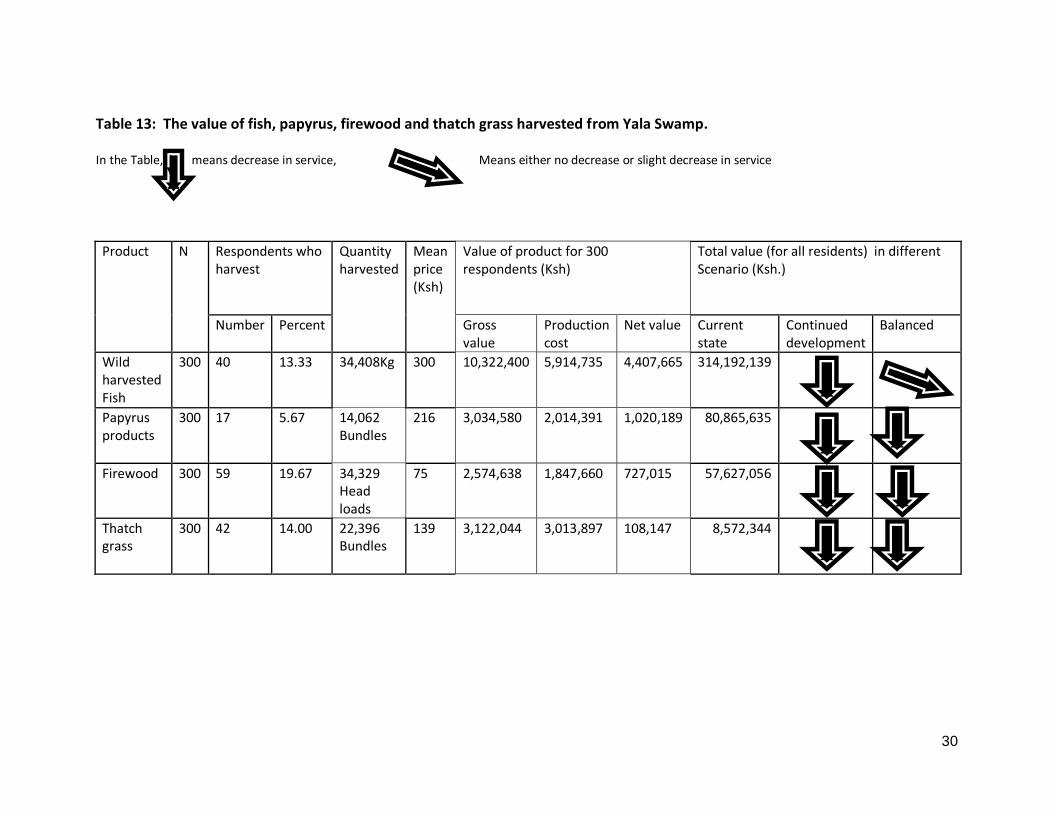
Nearly all the respondents interviewed obtained water from various sources within the swamp including Lake Kanyaboli, canals within the swamp, rivers, boreholes, and dams. Only 6 (2%) of the respondents had access to piped water and only 1 of these respondents relied solely on piped water. The most important water sources for most residents were Lake Kanyaboli, bore holes near the swamp, Yala River, wells, and canals (Table 14). The mean water consumption among the respondents was 87.8 litres per day (n=300, s.e.=7.2). Assuming that water consumption was uniform among the residents within 5 Km from the swamp boundary, this translates to 2,089.1 m3 per day or 762,523.6 m3 per year for all the swamp residents. The estimated current spending on drinking water by all the local residents was Ksh 11,150,000. Dominion Farms limited is licensed to abstract 350m3 per day (or 127,750 m3 per year) for rice production but we could not confirm the actual amount that the farm uses. We therefore assumed that the farm only abstracts the licensed quantity. Based on a price of Ksh 0.75 per 1 m3, then Dominion farms spends Ksh 95, 812.50 per year on water.
Table 14. The most important water sources for Yala Swamp Residents
Water source
Most important water supply source
No of respondents Percent of respondents
Lake Kanyaboli 89 29.7
Borehole 87 29.0
River Yala 49 16.3
Well 31 10.3
Canal 20 6.6
Rain water 8 2.7
River Nzoia 8 `2.7
Yala Swamp 5 1.7
Mahuru dam 3 1.0
Total 300 100.0
32
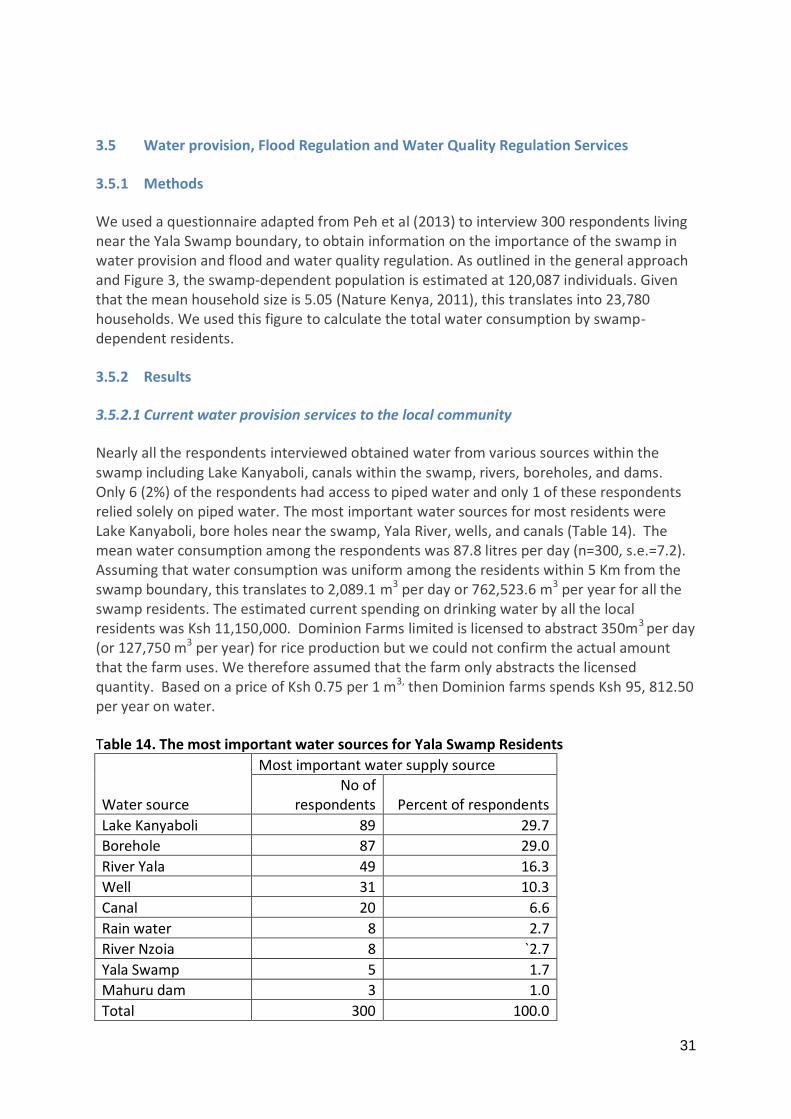
Table 15: Water provisioning by Yala Swamp for domestic and irrigation needs. Yala River mean flow rate is based on a daily flow rate of about 41.1 m3s-1 as reported by JICA (1992).
Amount of water (Cubic metres/per year)
Current Development Balance
Local community 762,524 762,524 762,524
Dominion 127,750 468,177 229,177
Total amount used 890,274 1,024,801 991,701
Yala River mean flow rate 5,400,540 5,400,540 5,400,540
3.5.2.2 Water provision in the alternative states
Continued development Scenario
An increase in rice production by Dominion Farms Limited would lead to increased water use from the current 127,750m3 per year to 468,177 m3 per year (Table 15). However, the mean flow of water from Yala River to lake Victoria is 41.1 m3 s-1 (JICA) which translates to 5,400,540m3 per year. This means there will still be enough water for domestic use even when agricultural production increases. However there is a need to confirm the impact of increased agricultural activities with consequent use of agrochemicals on the water quality and on the ability of remaining papyrus vegetation to filter pollutants. In addition, many other developments are planned both at Yala Swamp and upstream (JICA 2013). For example the proposed Nandi Hills Multi-purpose Dam in the Upper Yala is expected be in the operation stage by 2030. The dam is designed to generate about 45MW of hydro electric power and also supply water for irrigating about 15,000ha of sugarcane in the Kano plains of Nyando basin in Kisumu County and also supply water for domestic and industrial use. Other planned developments include improvement of urban and rural water supply and sewerage facilities for Bondo, Siaya towns and other urban centres.
Balanced development scenario
In this scenario, there will be enough water for domestic use so long as adequate measures are taken to control pollution from agrochemicals and restore degraded habitats. Therefore water consumption by the local residents will be as in the current state (Table 15). However, increased rice production by Dominion Limited will lead to increased water use from the current 127,750 to 229,177m3 per year.
3.5.2.3 Flooding
Forty five percent of our respondents had experienced flooding during the previous 5 years. Indeed, major floods have been experienced in the low-lying parts of the Lake Victoria basin including the Yala River floodplain in the years 1937, 1947, 1951 and 1957-1958, 1961, 1963, 1968, 1975, 1977; 1978 and 1979, 1997-1998, 2002 and 2003. Because most of the
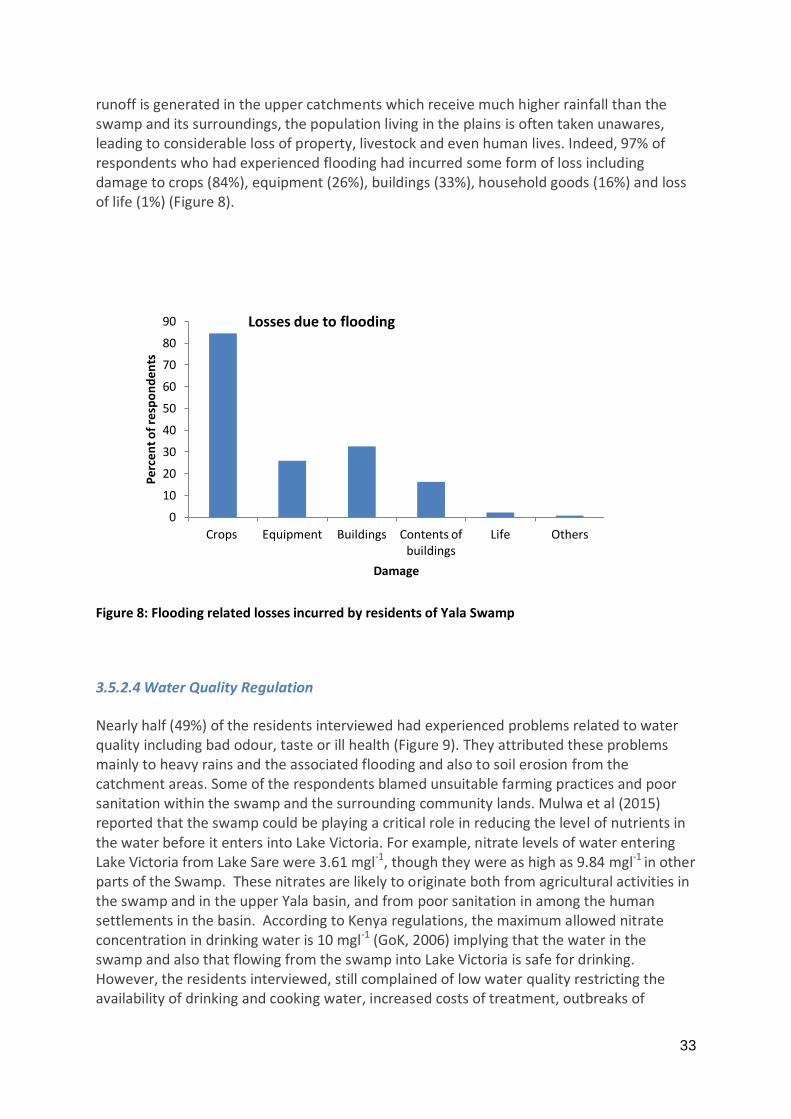
33
runoff is generated in the upper catchments which receive much higher rainfall than the swamp and its surroundings, the population living in the plains is often taken unawares, leading to considerable loss of property, livestock and even human lives. Indeed, 97% of respondents who had experienced flooding had incurred some form of loss including damage to crops (84%), equipment (26%), buildings (33%), household goods (16%) and loss of life (1%) (Figure 8).
Figure 8: Flooding related losses incurred by residents of Yala Swamp
3.5.2.4 Water Quality Regulation
Nearly half (49%) of the residents interviewed had experienced problems related to water quality including bad odour, taste or ill health (Figure 9). They attributed these problems mainly to heavy rains and the associated flooding and also to soil erosion from the catchment areas. Some of the respondents blamed unsuitable farming practices and poor sanitation within the swamp and the surrounding community lands. Mulwa et al (2015) reported that the swamp could be playing a critical role in reducing the level of nutrients in the water before it enters into Lake Victoria. For example, nitrate levels of water entering Lake Victoria from Lake Sare were 3.61 mgl-1, though they were as high as 9.84 mgl-1 in other parts of the Swamp. These nitrates are likely to originate both from agricultural activities in the swamp and in the upper Yala basin, and from poor sanitation in among the human settlements in the basin. According to Kenya regulations, the maximum allowed nitrate concentration in drinking water is 10 mgl-1 (GoK, 2006) implying that the water in the swamp and also that flowing from the swamp into Lake Victoria is safe for drinking. However, the residents interviewed, still complained of low water quality restricting the availability of drinking and cooking water, increased costs of treatment, outbreaks of
0
10
20
30
40
50
60
70
80
90
Crops Equipment Buildings Contents of buildings
Life Others
Per
cen
t o
f re
spo
nd
en
ts
Damage
Losses due to flooding
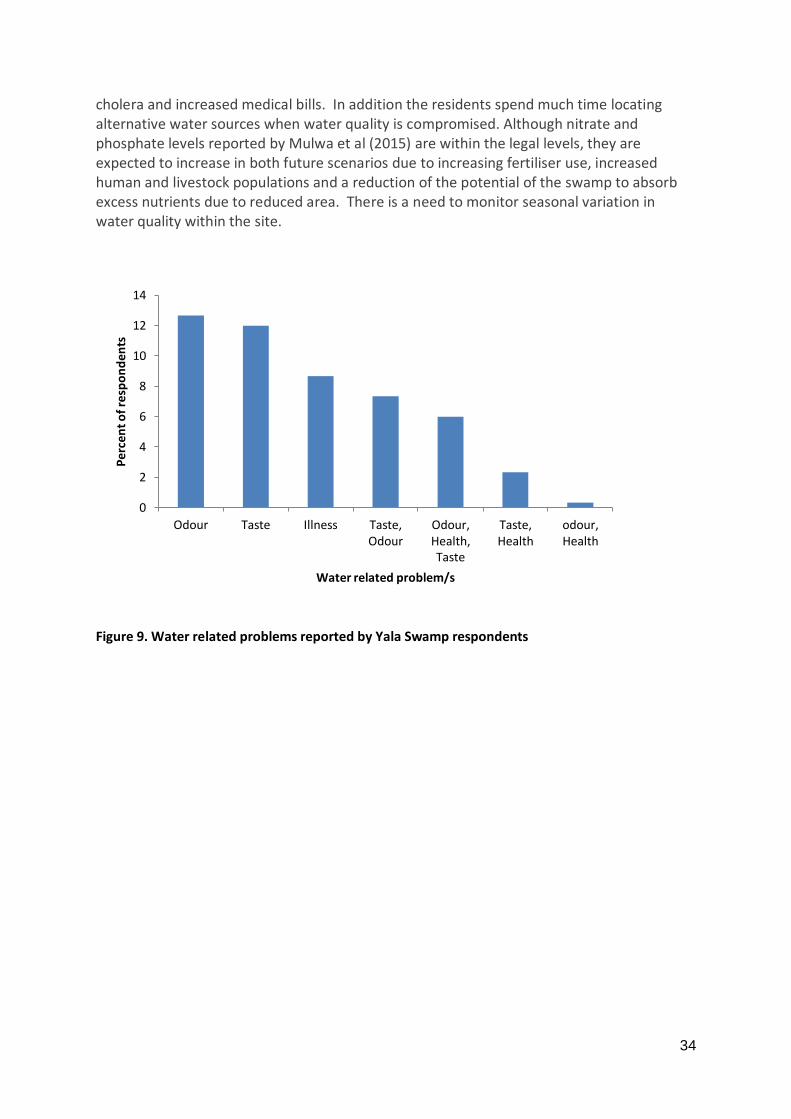
34
cholera and increased medical bills. In addition the residents spend much time locating alternative water sources when water quality is compromised. Although nitrate and phosphate levels reported by Mulwa et al (2015) are within the legal levels, they are expected to increase in both future scenarios due to increasing fertiliser use, increased human and livestock populations and a reduction of the potential of the swamp to absorb excess nutrients due to reduced area. There is a need to monitor seasonal variation in water quality within the site.
Figure 9. Water related problems reported by Yala Swamp respondents
0
2
4
6
8
10
12
14
Odour Taste Illness Taste, Odour
Odour, Health, Taste
Taste, Health
odour, Health
Per
cen
t o
f re
spo
nd
en
ts
Water related problem/s
35
3.6. Nature Based Recreation
3.6.1 Methods
Nearly all visitors access Yala Swamp through Dominion Farms Limited. We therefore partnered with Dominion Farms Limited to interview all the visitors to the swamp for a period of six months (October 2014 to March 2015) using a questionnaire adapted from the TESSA Toolkit (Peh et al 2013). Visitors only provided information on the amount of money spent at the site. National visitors also did not indicate the amount of money spent while travelling to the site. We assumed that number of visits to the swamp from October 2014 to March 2015 was representative of a typical 6 month period.
3.6.2 Results
We interviewed 58 respondents (28 international and 30 national) who represented groups or individual visitors to the swamp. There were a total of 68 international visitors who were from diverse countries including North America, Europe and the rest of Africa. Yala Swamp received a total of 1024 national visitors over the survey period. These comprised 22 groups of school and college students and 55 other individuals.
National and international visitors spent Ksh 585,100 at Yala Swamp from October to March 2015 (Table 16). This translates into an annual spend of Ksh 1,170,200. All visitors would come back to the site if the conservation status were improved. Further, all the international visitors would still visit the site even if the status quo remains, but 3 respondents representing the national visitors would not visit the site unless there is improvement in the conservation status. Therefore, the annual local spending by international visitors would remain unchanged if the status quo remains but would decline by 10% for national visitors unless conservation measures were taken. No visitor (national or local) would come back to the site if the continued development path was followed, implying that income from recreation would decline to zero if the whole site is converted to other land uses (Table 17, Figure 10). However, this finding needs to be treated with caution because only a fraction of the swamp will be drained even in the development scenario, implying that there will still be some space for biodiversity, the key tourism attraction to the site.
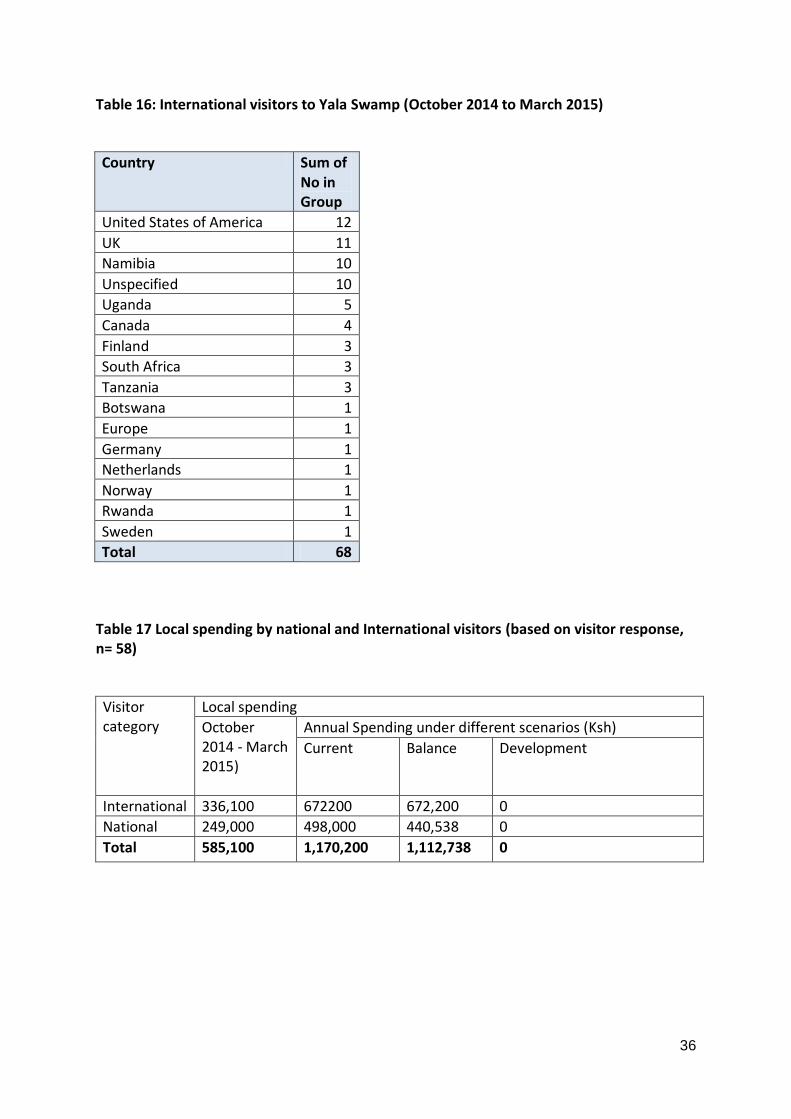
36
Table 16: International visitors to Yala Swamp (October 2014 to March 2015)
Country Sum of No in Group
United States of America 12
UK 11
Namibia 10
Unspecified 10
Uganda 5
Canada 4
Finland 3
South Africa 3
Tanzania 3
Botswana 1
Europe 1
Germany 1
Netherlands 1
Norway 1
Rwanda 1
Sweden 1
Total 68
Table 17 Local spending by national and International visitors (based on visitor response, n= 58)
Visitor category
Local spending
October 2014 - March 2015)
Annual Spending under different scenarios (Ksh)
Current Balance Development
International 336,100 672200 672,200 0
National 249,000 498,000 440,538 0
Total 585,100 1,170,200 1,112,738 0
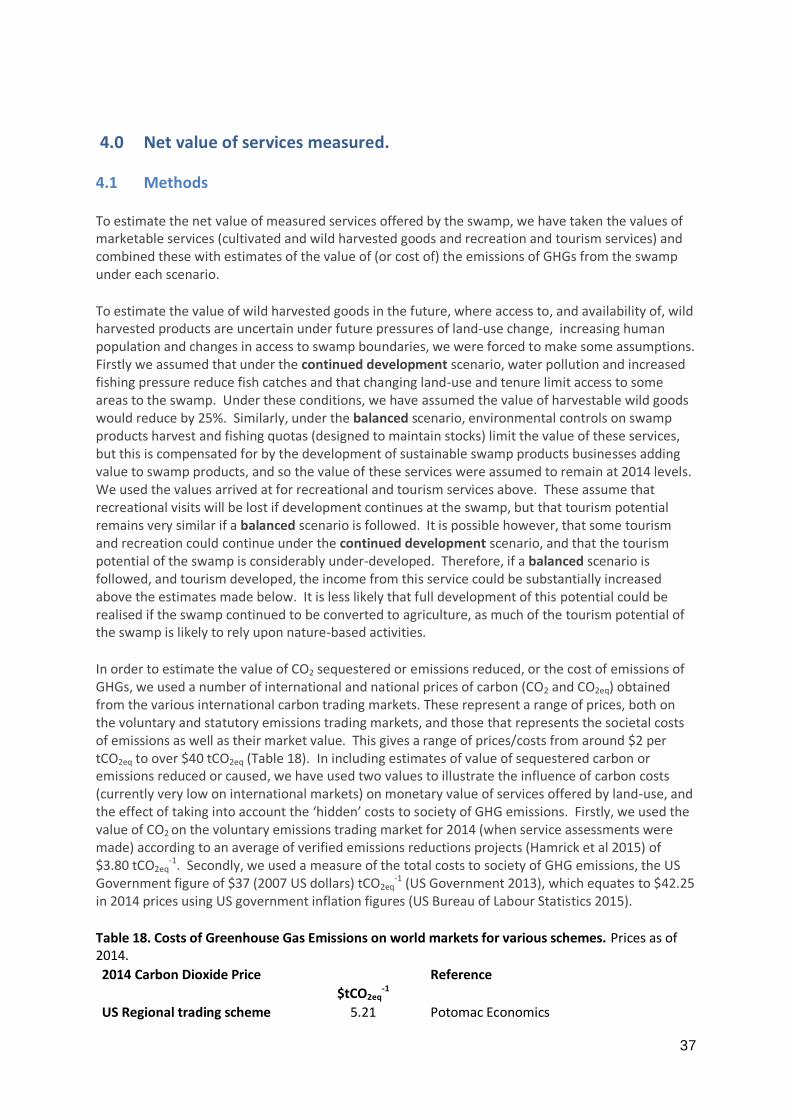
37
4.0 Net value of services measured.
4.1 Methods
To estimate the net value of measured services offered by the swamp, we have taken the values of marketable services (cultivated and wild harvested goods and recreation and tourism services) and combined these with estimates of the value of (or cost of) the emissions of GHGs from the swamp under each scenario.
To estimate the value of wild harvested goods in the future, where access to, and availability of, wild harvested products are uncertain under future pressures of land-use change, increasing human population and changes in access to swamp boundaries, we were forced to make some assumptions. Firstly we assumed that under the continued development scenario, water pollution and increased fishing pressure reduce fish catches and that changing land-use and tenure limit access to some areas to the swamp. Under these conditions, we have assumed the value of harvestable wild goods would reduce by 25%. Similarly, under the balanced scenario, environmental controls on swamp products harvest and fishing quotas (designed to maintain stocks) limit the value of these services, but this is compensated for by the development of sustainable swamp products businesses adding value to swamp products, and so the value of these services were assumed to remain at 2014 levels. We used the values arrived at for recreational and tourism services above. These assume that recreational visits will be lost if development continues at the swamp, but that tourism potential remains very similar if a balanced scenario is followed. It is possible however, that some tourism and recreation could continue under the continued development scenario, and that the tourism potential of the swamp is considerably under-developed. Therefore, if a balanced scenario is followed, and tourism developed, the income from this service could be substantially increased above the estimates made below. It is less likely that full development of this potential could be realised if the swamp continued to be converted to agriculture, as much of the tourism potential of the swamp is likely to rely upon nature-based activities.
In order to estimate the value of CO2 sequestered or emissions reduced, or the cost of emissions of GHGs, we used a number of international and national prices of carbon (CO2 and CO2eq) obtained from the various international carbon trading markets. These represent a range of prices, both on the voluntary and statutory emissions trading markets, and those that represents the societal costs of emissions as well as their market value. This gives a range of prices/costs from around $2 per tCO2eq to over $40 tCO2eq (Table 18). In including estimates of value of sequestered carbon or emissions reduced or caused, we have used two values to illustrate the influence of carbon costs (currently very low on international markets) on monetary value of services offered by land-use, and the effect of taking into account the ‘hidden’ costs to society of GHG emissions. Firstly, we used the value of CO2 on the voluntary emissions trading market for 2014 (when service assessments were made) according to an average of verified emissions reductions projects (Hamrick et al 2015) of $3.80 tCO2eq
-1. Secondly, we used a measure of the total costs to society of GHG emissions, the US Government figure of $37 (2007 US dollars) tCO2eq
-1 (US Government 2013), which equates to $42.25 in 2014 prices using US government inflation figures (US Bureau of Labour Statistics 2015).
Table 18. Costs of Greenhouse Gas Emissions on world markets for various schemes. Prices as of 2014.
2014 Carbon Dioxide Price Reference
$tCO2eq
-1 US Regional trading scheme 5.21 Potomac Economics
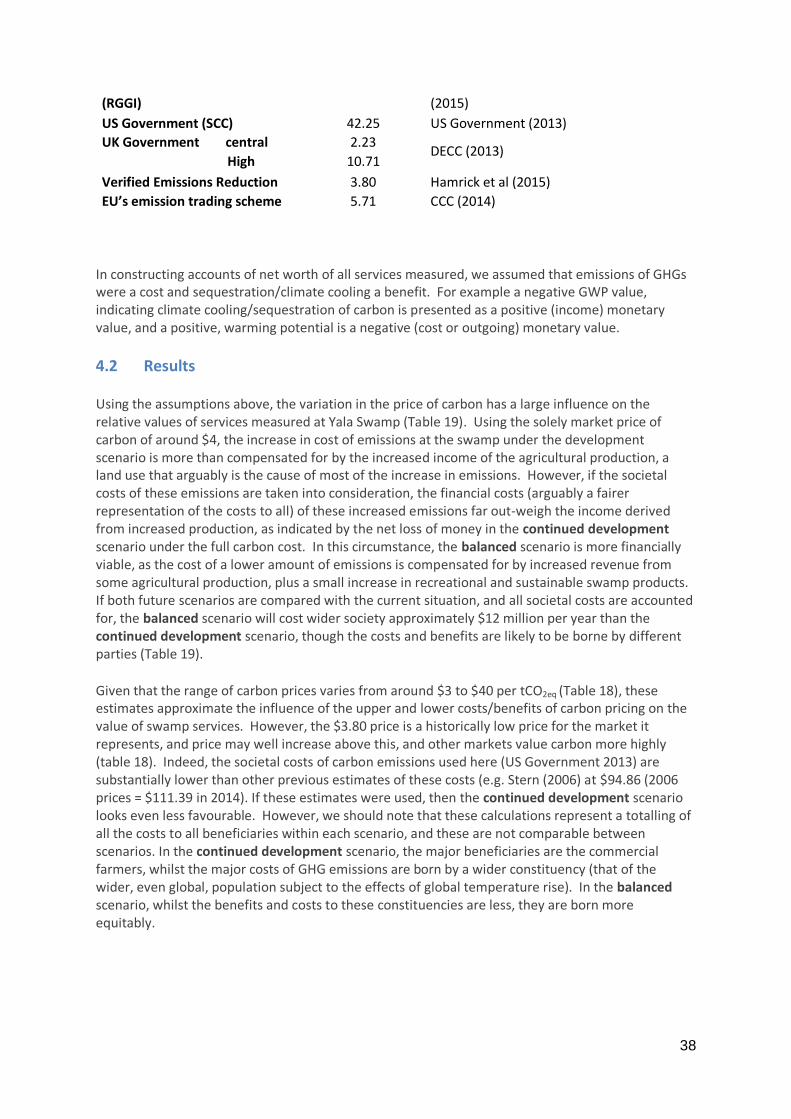
38
(RGGI) (2015)
US Government (SCC) 42.25 US Government (2013)
UK Government central 2.23 DECC (2013)
High 10.71
Verified Emissions Reduction 3.80 Hamrick et al (2015)
EU’s emission trading scheme 5.71 CCC (2014)
In constructing accounts of net worth of all services measured, we assumed that emissions of GHGs were a cost and sequestration/climate cooling a benefit. For example a negative GWP value, indicating climate cooling/sequestration of carbon is presented as a positive (income) monetary value, and a positive, warming potential is a negative (cost or outgoing) monetary value.
4.2 Results
Using the assumptions above, the variation in the price of carbon has a large influence on the relative values of services measured at Yala Swamp (Table 19). Using the solely market price of carbon of around $4, the increase in cost of emissions at the swamp under the development scenario is more than compensated for by the increased income of the agricultural production, a land use that arguably is the cause of most of the increase in emissions. However, if the societal costs of these emissions are taken into consideration, the financial costs (arguably a fairer representation of the costs to all) of these increased emissions far out-weigh the income derived from increased production, as indicated by the net loss of money in the continued development scenario under the full carbon cost. In this circumstance, the balanced scenario is more financially viable, as the cost of a lower amount of emissions is compensated for by increased revenue from some agricultural production, plus a small increase in recreational and sustainable swamp products. If both future scenarios are compared with the current situation, and all societal costs are accounted for, the balanced scenario will cost wider society approximately $12 million per year than the continued development scenario, though the costs and benefits are likely to be borne by different parties (Table 19).
Given that the range of carbon prices varies from around $3 to $40 per tCO2eq (Table 18), these estimates approximate the influence of the upper and lower costs/benefits of carbon pricing on the value of swamp services. However, the $3.80 price is a historically low price for the market it represents, and price may well increase above this, and other markets value carbon more highly (table 18). Indeed, the societal costs of carbon emissions used here (US Government 2013) are substantially lower than other previous estimates of these costs (e.g. Stern (2006) at $94.86 (2006 prices = $111.39 in 2014). If these estimates were used, then the continued development scenario looks even less favourable. However, we should note that these calculations represent a totalling of all the costs to all beneficiaries within each scenario, and these are not comparable between scenarios. In the continued development scenario, the major beneficiaries are the commercial farmers, whilst the major costs of GHG emissions are born by a wider constituency (that of the wider, even global, population subject to the effects of global temperature rise). In the balanced scenario, whilst the benefits and costs to these constituencies are less, they are born more equitably.
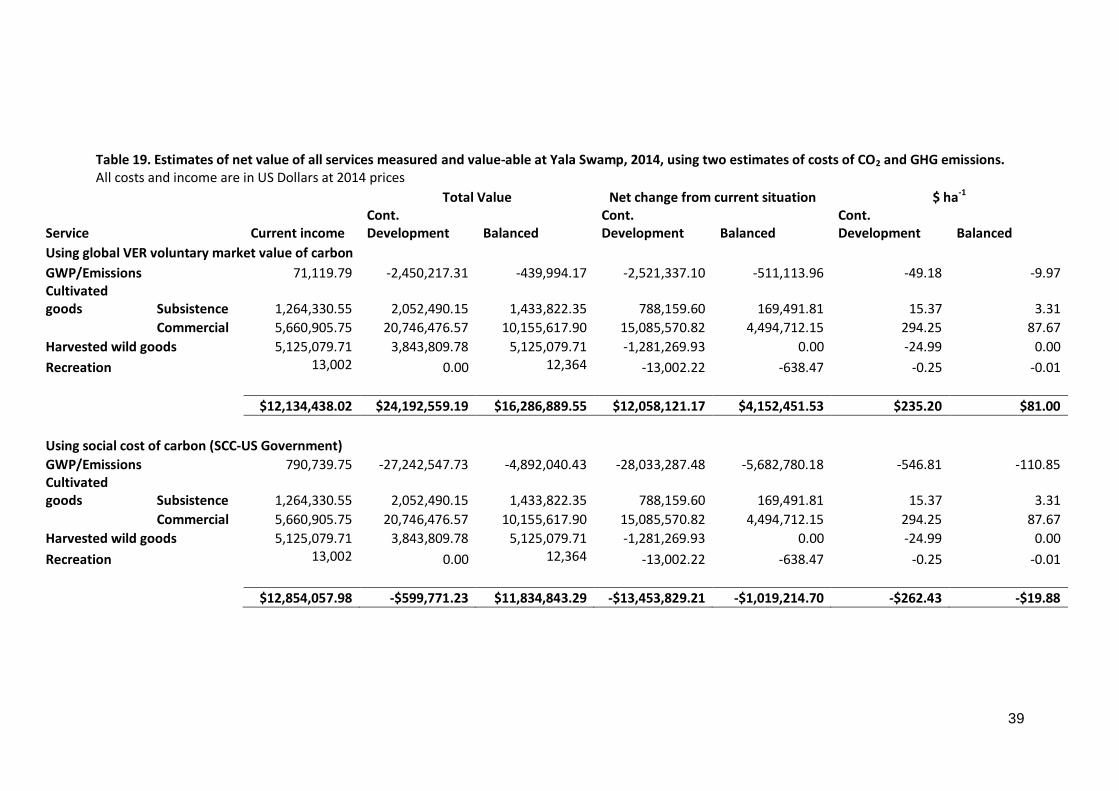
39
Table 19. Estimates of net value of all services measured and value-able at Yala Swamp, 2014, using two estimates of costs of CO2 and GHG emissions. All costs and income are in US Dollars at 2014 prices
Total Value Net change from current situation $ ha-1
Service
Current income Cont. Development Balanced
Cont. Development Balanced
Cont. Development Balanced
Using global VER voluntary market value of carbon GWP/Emissions 71,119.79 -2,450,217.31 -439,994.17 -2,521,337.10 -511,113.96 -49.18 -9.97
Cultivated goods Subsistence 1,264,330.55 2,052,490.15 1,433,822.35 788,159.60 169,491.81 15.37 3.31
Commercial 5,660,905.75 20,746,476.57 10,155,617.90 15,085,570.82 4,494,712.15 294.25 87.67
Harvested wild goods 5,125,079.71 3,843,809.78 5,125,079.71 -1,281,269.93 0.00 -24.99 0.00
Recreation 13,002 0.00 12,364 -13,002.22 -638.47 -0.25 -0.01
$12,134,438.02 $24,192,559.19 $16,286,889.55 $12,058,121.17 $4,152,451.53 $235.20 $81.00
Using social cost of carbon (SCC-US Government) GWP/Emissions 790,739.75 -27,242,547.73 -4,892,040.43 -28,033,287.48 -5,682,780.18 -546.81 -110.85
Cultivated goods Subsistence 1,264,330.55 2,052,490.15 1,433,822.35 788,159.60 169,491.81 15.37 3.31
Commercial 5,660,905.75 20,746,476.57 10,155,617.90 15,085,570.82 4,494,712.15 294.25 87.67
Harvested wild goods 5,125,079.71 3,843,809.78 5,125,079.71 -1,281,269.93 0.00 -24.99 0.00
Recreation 13,002 0.00 12,364 -13,002.22 -638.47 -0.25 -0.01
$12,854,057.98 -$599,771.23 $11,834,843.29 -$13,453,829.21 -$1,019,214.70 -$262.43 -$19.88
40
5.0 Discussion Our estimates of relative GWP had very large error bars (Figure 7). This is due to large uncertainty inherent within tier 1 or 2 estimates (IPCC 2006). Although different habitats differ from one-another by an uncertain degree, we assumed that these uncertainties are unbiased to or from certain land-uses. We therefore do not think that this had implications on our results for various scenarios
Dominion appears highly profitable compared to village farming. This is probably realistic, given the economies of scale and better technologies available to Dominion, and thus higher yields per input, area etc, but we believe our estimates of costs of management for dominion are incomplete, as we had to estimate costs of labour, rent, electricity and water from national averages. We also had no estimate of costs and overheads on machinery and buildings which we are likely to be substantial based on the amount and sophistication of machinery Dominion owns and uses. Thus our estimate of Dominion’s net profit is likely to be high, therefore exaggerates the benefits of agricultural production at the expense of other ecosystem services. The recreation value of the swamp was very low in spite of the swamp’s rich biodiversity, attractive landscape features and scenery in the papyrus wetland ecosystems with aesthetically pleasing environments and a suitable micro-climate are key tourist attractions to the site. Visitors to the swamp can enjoy diverse activities including bird and other wildlife watching, sport fishing, boat riding, outdoor sports and the rich culture of the Luo ethnic community. Lake Kanyaboli, the only gazetted national reserve in Siaya County, is found within Yala Swamp. In spite of these attractions, tourism sector in Siaya County is poorly developed. For example, the county has no classified hotels and even the existing 89 unclassified hotels have limited bed capacity (County Government of Siaya, 2013). Other challenges facing the tourism sector in Siaya County include limited capacity of tourism service providers, limited marketing and poor tourism support infrastructure. Development of the tourism sector can promote biodiversity and ecosystem conservation while enhancing income from the swamp. We therefore recommend that tourism stakeholders including the local community, county and national governments, civil society organizations and the private sector work together to mitigate the challenges that limit the realization of the swamp’s recreation potential.
Unlike agricultural production and climate regulation which are expected to be directly proportional to the area, other services including recreational and cultural value of habitat are not. However there is probably a threshold over (or under) which attitudes will change e.g. wetland – if it disappears completely, respondents will not visit, though if a small amount remains they may do so. However, it is important to note that avian biodiversity and abundance on rice fields and around fish ponds can be very high and still attract many bird watchers. Thus, even if tourism/recreation is likely to reduce somewhat if Continued Development occurs, this can be compensated through increased investment/development in tourism.
While estimating the value of ecosystem services in the continued development scenario, we assumed that any change in the quantity of each service will depend mainly on changes
41
in areas under cultivation by the local community and by Dominion Farms Limited. For example water demand for all sectors within Yala River Basin is expected to increase sharply in future due to need for irrigation, domestic and industrial and fish ponds water needs. Other planned developments upstream such as the proposed Nandi Hills Multi-purpose dam and inter-basin water transfer to boost irrigated sugarcane farming in Nyando Basin of Kisumu County will definitely have impacts on the provision of ecosystem services at Yala Swamp. In addition, Dominion Farms Limited has proposed to establish a 5,000 acres sugar cane plantation and a sugar mill in the swamp (Dominion Farms Limited, 2015). Local farmers will be encouraged to start commercial sugar cane farming). If this proposal is approved by NEMA it will change the business case presented in this study.
The balance sheet of all ecosystem service values presented in this study needs to be used with caution due to the following reasons. First, we might have underestimated the business costs for Dominion Farms Limited implying that we might have overestimated the company’s net income. Secondly, there was high uncertainty around GHG estimates. The wide range of values and costs of carbon in world markets further complicates the balance sheet. For example, in 2014, carbon values ranged from around 2 to 42 US $tCO2eq
-1, (Table 18). Other issues relate to uncertainty around the relationship between changes in habitat size and recreation/tourism use in future scenario and the unaccounted-for services including water which is not easily quantified and others not covered by toolkit including cultural services and pollination.
42
6.0 CONCLUSIONS AND RECOMMENDATIONS
Our results demonstrate that Yala Swamp has a very high realized and potential monetary and non-monetary value.
1. It stores over 15 million tonnes of carbon, about 90 % of which is in the papyrus vegetation areas. This is a great benefit to the global, national and local community. The swamp is a nationally important carbon sink contributing to mitigating global climate change. It contributes significantly to the Kenya’s cooling capacity while at the local level, Siaya County Government and the local community can benefit by tapping into the voluntary carbon market to sell these carbon credits. Current land-uses are approximately climate neutral, with emissions being balanced by sequestration (within large uncertainty limits).
2. Current private benefits include more than Ksh 110 million ($1.25 million) net income to subsistence farmers and Ksh 510 million ($5.5 million) net income to commercial rice farming per year.
3. Currently, harvested wild goods are estimated at another Ksh 450 million ($5 million) per annum. Recreation and tourism income is very small by comparison, but there seems to be potential to increase this. Water services are likely to be worth a large amount but have not been formerly quantified here due to lack of available information and methodological difficulties.
4. The continued development pathway will substantially reduce carbon storage in the swamp but lead to increased cultivated food production by both Dominion Farms Limited and local subsistence farmers and cash croppers. Net income from commercial rice farm would increase to an estimated Ksh 1.87 billion ($20 million) annually and local private farming income would increase to about Ksh 184 Million ($2 million).
5. However, more greenhouse gases, particularly CH4 from livestock and periodically wet rice paddies and CO2 from oxidising dry organic soil would reduce the climate regulation function of land use in the continued development scenario to a net climate warming of approximately 600,000 tCO2eq per year. This equates to an annual cost to society of at least $2 million at current CO2 market prices, or over $27 million if all societal costs of emissions are accounted for.
6. There would be reduced amounts of wild goods available for harvesting (net value approximately $3.8 million) and a reduction in the recreation value of the site under continued development. The swamp’s ability to regulate water quality and flow would decline, leading to increased costs for drinking and cooking water in the area, and potentially reduced wild fish harvests.
7. If development at Yala followed a balanced scenario between subsistence and commercial interests, balanced with biodiversity conservation and sustainable swamp use, private and commercial agriculture could still net approximately Ksh 130 million ($1.4 million) and Ksh 900 million ($10 million) annually, whilst maintaining wild harvests valued at Ksh 450 million ($5 million), though more sustainably harvested.
8. These substantial incomes would be balanced against a net increase of $4 million costs to society as a result of increased GHG emissions from land-use and land-use change, more than $20 million less than continued development.
9. These estimated figures are illustrative only, because of the large number of assumptions made about future development and land-use, and the large
43
uncertainties of some estimates, particularly greenhouse gas emissions. However, there is little reason to believe that any of these assumptions favour one path or another, so the relative differences illustrated are likely to be valid, and serve to demonstrate the relationships between costs and benefits to different society members under different land-use scenarios.
10. Although it is a critical ecosystem service, cultivated food production is also the primary driver of change at Yala Swamp. The communities residing around the swamp depend heavily on crops produced within it. However, it is Dominion Farms Limited that gets more financial benefits from crop production in the swamp. The majority of these benefits accrue to the company’s employees and less to the wider swamp community. This will be exacerbated in the continued development scenario.
11. The site provides water to nearly all local residents and also supports irrigated agricultural activities. In addition, it regulates water entering Lake Victoria, therefore contributing to the quality of Lake Victoria water and the water that flows into the Nile. Therefore the water purification service of the swamp is important to the local people, to residents of Lake Victoria basin and also the Nile Basin.
12. Lake Kanyaboli is particularly critical as a refuge for endemic and endangered fish. It is also gazetted as a National Reserve. Further development of agricultural activities is a big threat the lake’s survival and to the survival of the fishing industry that it supports. It is important to ensure that enough water flows through the lake to maintain its ecological integrity.
This study has demonstrated that following a continued development pathway would lead to an increase in agricultural production but a reduction in the swamp’s potential to regulate climate, supply wild goods and to attract tourists and a net cost to society of over $12 million compared to the balanced scenario (more than $240 per hectare). Other services that are likely to decline in the continued development scenario include the water quality improvement potential and the swamp’s biodiversity value. We suggest that development policies adopt the balanced scenario and use following strategies to compensate for the reduced agricultural potential:
a. Develop innovative Payment for ecosystem Services (PES) mechanisms including exploring the likelihood of tapping into the voluntary carbon markets;
b. Forge partnerships with the private sector to assist in the conservation and management of Yala Swamp;
c. Develop a Land Use Plan for Yala Swamp accompanied by a Strategic Environmental Assessment to ensure that all ecosystem services provided by the swamp are adequately recognized and protected;
d. Develop the tourism potential of Yala Swamp by training more local tour guides and investing in tourism infrastructure and in marketing;
e. Reducing the dependency on harvested wild goods by supporting local community fish ponds, and by supporting value addition and marketing of papyrus products.
We recommend that further studies be conducted on the hydrology of Yala Swamp including the geomorphology of the basin, water balance and the importance of the swamp in flood and water quality regulation.
44
REFERENCES 1. Abila, R. O. and Othina, A. (2006). What is the socio-economic value of the wetlands
fisheries? The case of Yala Wetland in Kenya.
http://www.oceandocs.org/bitstream/handle/1834/1493/WLCK-178-
185.pdf?sequence=1&isAllowed=y
2. BirdLife International (2015) Important Bird Areas factsheet: Yala swamp complex.
http://www.birdlife.org (Accessed on 30/04/2015).
3. CCC (2014). Meeting Carbon Budgets – 2014 Progress Report to Parliament. Committee on
Climate Change July 2014. London.
4. de Klein, JJM. & van der Werf, A K. (2014) "Balancing carbon sequestration and GHG
emissions in a constructed wetland." Ecological Engineering, 66: 36-42.
5. Dominion Farms Limited (2015) Environmental and social impact assessment (ESIA) study
report proposed sugarcane plantation and processing mill for Dominion Farms Limited in
Siaya County. www.nema.org
6. DECC (2013) Updated short-term traded carbon values used for UK public policy
appraisal.Department of Energy & Climate Change. London.
7. Forster, P., V. Ramaswamy, P. Artaxo, T. Berntsen, R. Betts, D.W. Fahey, J. Haywood, J. Lean,
D.C. Lowe, G. Myhre, J. Nganga, R. Prinn, G. Raga, M. Schulz and R. Van Dorland. (2007)
Changes in Atmospheric Constituents and in Radiative Forcing. In: Climate Change 2007: The
Physical Science Basis. Contribution of Working Group I to the Fourth Assessment Report of
the Intergovernmental Panel on Climate Change. Solomon, S., D. Qin, M. Manning, Z. Chen,
M. Marquis, K.B. Averyt, M.Tignor & H.L. Miller (eds.). Cambridge University Press,
Cambridge, United Kingdom and New York, NY, USA.
8. Gitau, R., Mburu, S. & Mathenge, M. K. (2011). Trade and Agricultural Competitiveness for
Growth, Food Security and Poverty Reduction: A Case of Wheat and Rice Production in
Kenya. Tegemeo Institute, Egerton University. Nairobi.
9. GoK (2010) Schedule-lake Kanyaboli National Reserve.
http://www.kenyalaw.org/LegalNotices/pop_ln.php?file=492
10. GoK (2013). Regulation of Wages (General) (Amendment) Order, 2013.
11. GoK (2006). Environmental Management and Coordination, (Water Quality) Regulations
2006.http://www.nema.go.ke/images/documents/water_quality_regulations.pdf
12. Hamrick, K, Goldstein, A, Peters-Stanley, M & Gonzalez, G (2015). Ahead of the curve: State
of the voluntary carbon markets 2015. Forest Trends’ Ecosystem Marketplace. Washington
DC.
13. IPCC (2006) 2006 IPCC Guidelines for National Greenhouse Gas Inventories,
Prepared by the National Greenhouse Gas Inventories Programme, Eggleston H.S.,
Buendia L., Miwa K., Ngara T. & Tanabe K. (eds). IGES, Japan.
14. IPCC (2014) 2013 Supplement to the 2006 IPCC Guidelines for National Greenhouse Gas
Inventories: Wetlands, Hiraishi, T., Krug, T., Tanabe, K., Srivastava, N., Baasansuren, J.,
Fukuda, M. and Troxler, T.G. (eds). IPCC, Switzerland.
15. JICA (1992) National water Master Plan. Ministry of Water, Kenya
16. JICA (2013). Development of the National Water Master Plan 2030. Workshop on Report.
JICA , Nairobi, Kenya
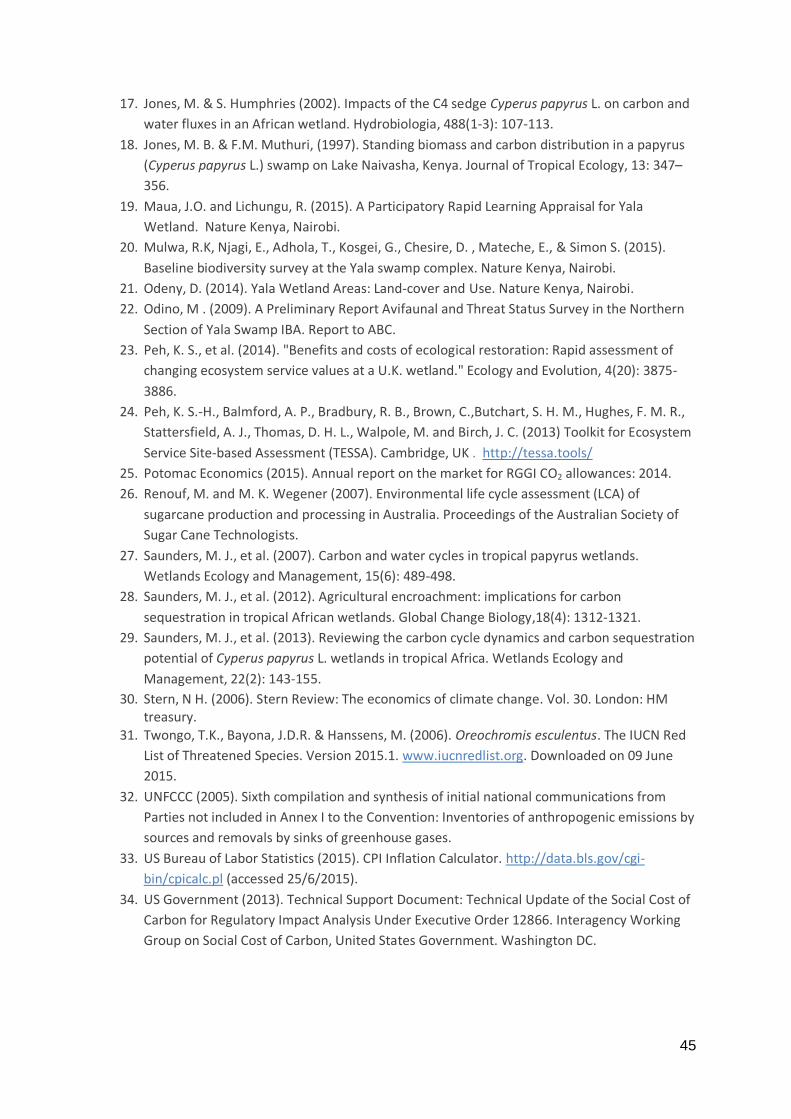
45
17. Jones, M. & S. Humphries (2002). Impacts of the C4 sedge Cyperus papyrus L. on carbon and
water fluxes in an African wetland. Hydrobiologia, 488(1-3): 107-113.
18. Jones, M. B. & F.M. Muthuri, (1997). Standing biomass and carbon distribution in a papyrus
(Cyperus papyrus L.) swamp on Lake Naivasha, Kenya. Journal of Tropical Ecology, 13: 347–
356.
19. Maua, J.O. and Lichungu, R. (2015). A Participatory Rapid Learning Appraisal for Yala
Wetland. Nature Kenya, Nairobi.
20. Mulwa, R.K, Njagi, E., Adhola, T., Kosgei, G., Chesire, D. , Mateche, E., & Simon S. (2015).
Baseline biodiversity survey at the Yala swamp complex. Nature Kenya, Nairobi.
21. Odeny, D. (2014). Yala Wetland Areas: Land-cover and Use. Nature Kenya, Nairobi.
22. Odino, M . (2009). A Preliminary Report Avifaunal and Threat Status Survey in the Northern
Section of Yala Swamp IBA. Report to ABC.
23. Peh, K. S., et al. (2014). "Benefits and costs of ecological restoration: Rapid assessment of
changing ecosystem service values at a U.K. wetland." Ecology and Evolution, 4(20): 3875-
3886.
24. Peh, K. S.-H., Balmford, A. P., Bradbury, R. B., Brown, C.,Butchart, S. H. M., Hughes, F. M. R.,
Stattersfield, A. J., Thomas, D. H. L., Walpole, M. and Birch, J. C. (2013) Toolkit for Ecosystem
Service Site-based Assessment (TESSA). Cambridge, UK . http://tessa.tools/
25. Potomac Economics (2015). Annual report on the market for RGGI CO2 allowances: 2014.
26. Renouf, M. and M. K. Wegener (2007). Environmental life cycle assessment (LCA) of
sugarcane production and processing in Australia. Proceedings of the Australian Society of
Sugar Cane Technologists.
27. Saunders, M. J., et al. (2007). Carbon and water cycles in tropical papyrus wetlands.
Wetlands Ecology and Management, 15(6): 489-498.
28. Saunders, M. J., et al. (2012). Agricultural encroachment: implications for carbon
sequestration in tropical African wetlands. Global Change Biology,18(4): 1312-1321.
29. Saunders, M. J., et al. (2013). Reviewing the carbon cycle dynamics and carbon sequestration
potential of Cyperus papyrus L. wetlands in tropical Africa. Wetlands Ecology and
Management, 22(2): 143-155.
30. Stern, N H. (2006). Stern Review: The economics of climate change. Vol. 30. London: HM treasury.
31. Twongo, T.K., Bayona, J.D.R. & Hanssens, M. (2006). Oreochromis esculentus. The IUCN Red
List of Threatened Species. Version 2015.1. www.iucnredlist.org. Downloaded on 09 June
2015.
32. UNFCCC (2005). Sixth compilation and synthesis of initial national communications from
Parties not included in Annex I to the Convention: Inventories of anthropogenic emissions by
sources and removals by sinks of greenhouse gases.
33. US Bureau of Labor Statistics (2015). CPI Inflation Calculator. http://data.bls.gov/cgi-
bin/cpicalc.pl (accessed 25/6/2015).
34. US Government (2013). Technical Support Document: Technical Update of the Social Cost of
Carbon for Regulatory Impact Analysis Under Executive Order 12866. Interagency Working
Group on Social Cost of Carbon, United States Government. Washington DC.
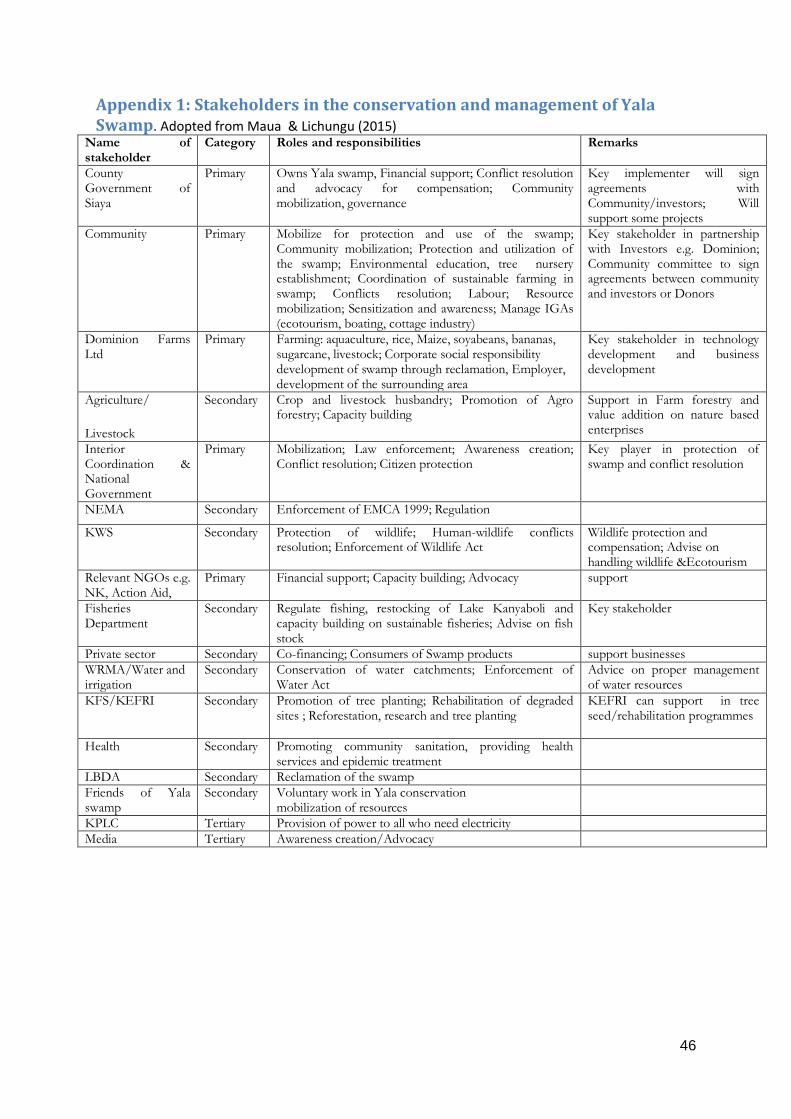
46
Appendix 1: Stakeholders in the conservation and management of Yala Swamp. Adopted from Maua & Lichungu (2015)
Name of stakeholder
Category Roles and responsibilities Remarks
County Government of Siaya
Primary Owns Yala swamp, Financial support; Conflict resolution and advocacy for compensation; Community mobilization, governance
Key implementer will sign agreements with Community/investors; Will support some projects
Community Primary Mobilize for protection and use of the swamp; Community mobilization; Protection and utilization of the swamp; Environmental education, tree nursery establishment; Coordination of sustainable farming in swamp; Conflicts resolution; Labour; Resource mobilization; Sensitization and awareness; Manage IGAs (ecotourism, boating, cottage industry)
Key stakeholder in partnership with Investors e.g. Dominion; Community committee to sign agreements between community and investors or Donors
Dominion Farms Ltd
Primary Farming: aquaculture, rice, Maize, soyabeans, bananas, sugarcane, livestock; Corporate social responsibility development of swamp through reclamation, Employer, development of the surrounding area
Key stakeholder in technology development and business development
Agriculture/
Livestock
Secondary Crop and livestock husbandry; Promotion of Agro forestry; Capacity building
Support in Farm forestry and value addition on nature based enterprises
Interior Coordination & National Government
Primary Mobilization; Law enforcement; Awareness creation; Conflict resolution; Citizen protection
Key player in protection of swamp and conflict resolution
NEMA Secondary Enforcement of EMCA 1999; Regulation
KWS Secondary Protection of wildlife; Human-wildlife conflicts resolution; Enforcement of Wildlife Act
Wildlife protection and compensation; Advise on handling wildlife &Ecotourism
Relevant NGOs e.g. NK, Action Aid,
Primary Financial support; Capacity building; Advocacy support
Fisheries Department
Secondary Regulate fishing, restocking of Lake Kanyaboli and capacity building on sustainable fisheries; Advise on fish stock
Key stakeholder
Private sector Secondary Co-financing; Consumers of Swamp products support businesses
WRMA/Water and irrigation
Secondary Conservation of water catchments; Enforcement of Water Act
Advice on proper management of water resources
KFS/KEFRI Secondary Promotion of tree planting; Rehabilitation of degraded sites ; Reforestation, research and tree planting
KEFRI can support in tree seed/rehabilitation programmes
Health Secondary Promoting community sanitation, providing health services and epidemic treatment
LBDA Secondary Reclamation of the swamp
Friends of Yala swamp
Secondary Voluntary work in Yala conservation mobilization of resources
KPLC Tertiary Provision of power to all who need electricity
Media Tertiary Awareness creation/Advocacy
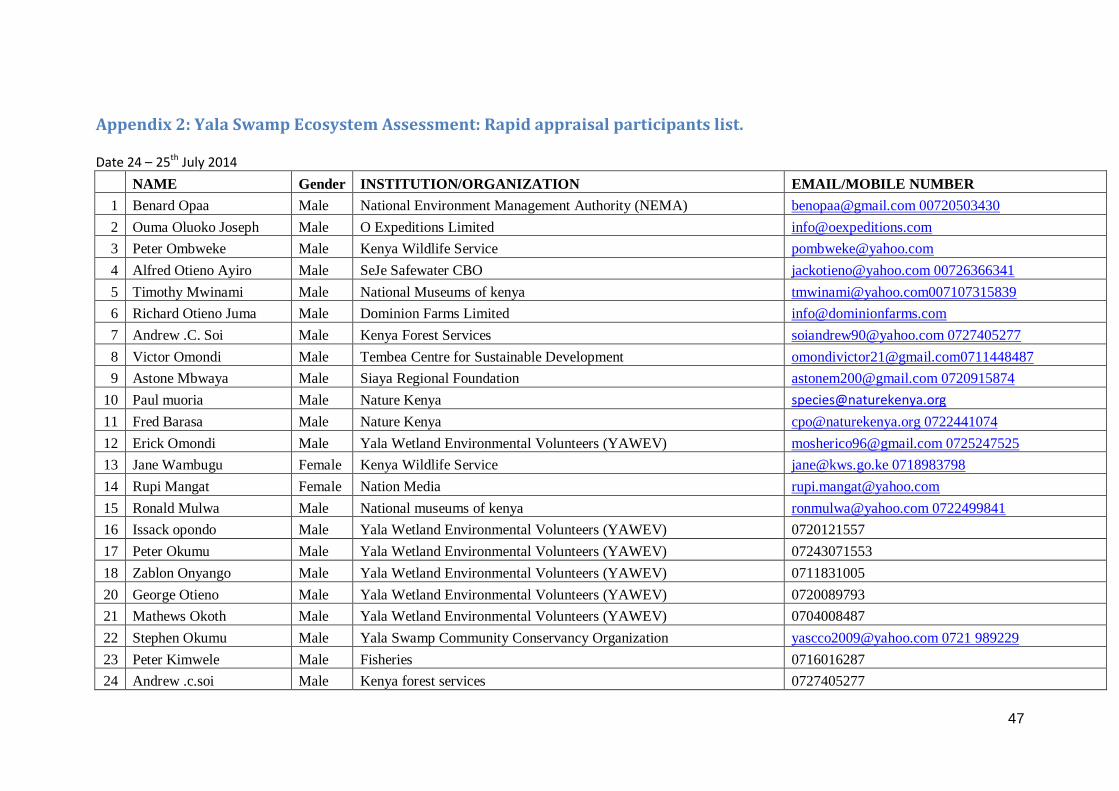
47
Appendix 2: Yala Swamp Ecosystem Assessment: Rapid appraisal participants list.
Date 24 – 25th July 2014
NAME Gender INSTITUTION/ORGANIZATION EMAIL/MOBILE NUMBER
1 Benard Opaa Male National Environment Management Authority (NEMA) [email protected] 00720503430
2 Ouma Oluoko Joseph Male O Expeditions Limited [email protected]
3 Peter Ombweke Male Kenya Wildlife Service [email protected]
4 Alfred Otieno Ayiro Male SeJe Safewater CBO [email protected] 00726366341
5 Timothy Mwinami Male National Museums of kenya [email protected]
6 Richard Otieno Juma Male Dominion Farms Limited [email protected]
7 Andrew .C. Soi Male Kenya Forest Services [email protected] 0727405277
8 Victor Omondi Male Tembea Centre for Sustainable Development [email protected]
9 Astone Mbwaya Male Siaya Regional Foundation [email protected] 0720915874
10 Paul muoria Male Nature Kenya [email protected]
11 Fred Barasa Male Nature Kenya [email protected] 0722441074
12 Erick Omondi Male Yala Wetland Environmental Volunteers (YAWEV) [email protected] 0725247525
13 Jane Wambugu Female Kenya Wildlife Service [email protected] 0718983798
14 Rupi Mangat Female Nation Media [email protected]
15 Ronald Mulwa Male National museums of kenya [email protected] 0722499841
16 Issack opondo Male Yala Wetland Environmental Volunteers (YAWEV) 0720121557
17 Peter Okumu Male Yala Wetland Environmental Volunteers (YAWEV) 07243071553
18 Zablon Onyango Male Yala Wetland Environmental Volunteers (YAWEV) 0711831005
20 George Otieno Male Yala Wetland Environmental Volunteers (YAWEV) 0720089793
21 Mathews Okoth Male Yala Wetland Environmental Volunteers (YAWEV) 0704008487
22 Stephen Okumu Male Yala Swamp Community Conservancy Organization [email protected] 0721 989229
23 Peter Kimwele Male Fisheries 0716016287
24 Andrew .c.soi Male Kenya forest services 0727405277
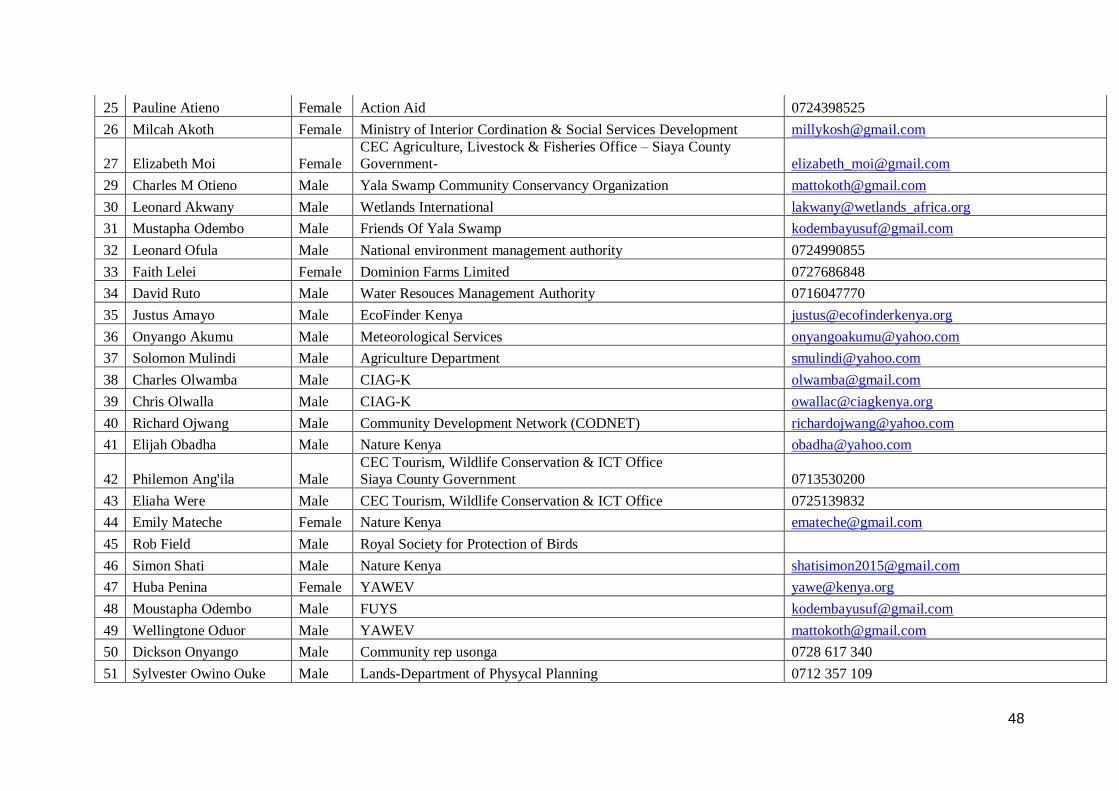
48
25 Pauline Atieno Female Action Aid 0724398525
26 Milcah Akoth Female Ministry of Interior Cordination & Social Services Development [email protected]
27 Elizabeth Moi Female
CEC Agriculture, Livestock & Fisheries Office – Siaya County
Government- [email protected]
29 Charles M Otieno Male Yala Swamp Community Conservancy Organization [email protected]
30 Leonard Akwany Male Wetlands International lakwany@wetlands_africa.org
31 Mustapha Odembo Male Friends Of Yala Swamp [email protected]
32 Leonard Ofula Male National environment management authority 0724990855
33 Faith Lelei Female Dominion Farms Limited 0727686848
34 David Ruto Male Water Resouces Management Authority 0716047770
35 Justus Amayo Male EcoFinder Kenya [email protected]
36 Onyango Akumu Male Meteorological Services [email protected]
37 Solomon Mulindi Male Agriculture Department [email protected]
38 Charles Olwamba Male CIAG-K [email protected]
39 Chris Olwalla Male CIAG-K [email protected]
40 Richard Ojwang Male Community Development Network (CODNET) [email protected]
41 Elijah Obadha Male Nature Kenya [email protected]
42 Philemon Ang'ila Male
CEC Tourism, Wildlife Conservation & ICT Office
Siaya County Government 0713530200
43 Eliaha Were Male CEC Tourism, Wildlife Conservation & ICT Office 0725139832
44 Emily Mateche Female Nature Kenya [email protected]
45 Rob Field Male Royal Society for Protection of Birds
46 Simon Shati Male Nature Kenya [email protected]
47 Huba Penina Female YAWEV [email protected]
48 Moustapha Odembo Male FUYS [email protected]
49 Wellingtone Oduor Male YAWEV [email protected]
50 Dickson Onyango Male Community rep usonga 0728 617 340
51 Sylvester Owino Ouke Male Lands-Department of Physycal Planning 0712 357 109

49