xviii international symposium - Symorg 2022
363
SYMORG 2022 BELGRADE, JUNE 11-14, 2022 (HYBRID) XVIII INTERNATIONAL SYMPOSIUM SUSTAINABLE BUSINESS MANAGEMENT AND DIGITAL TRANSFORMATION: CHALLENGES AND OPPORTUNITIES IN THE POST-COVID ERA BOOK OF ABSTRACTS EDITORS: Marko Mihić, Ph.D. Sandra Jednak, Ph.D. Gordana Savić, Ph.D. BELGRADE, 2022
-
Upload
khangminh22 -
Category
Documents
-
view
4 -
download
0
Transcript of xviii international symposium - Symorg 2022

SYMORG 2022 BELGRADE, JUNE 11-14, 2022
(HYBRID)
XVIII INTERNATIONAL SYMPOSIUM
SUSTAINABLE BUSINESS MANAGEMENT AND DIGITAL TRANSFORMATION: CHALLENGES AND
OPPORTUNITIES IN THE POST-COVID ERA
BOOK OF ABSTRACTS
EDITORS:
Marko Mihić, Ph.D. Sandra Jednak, Ph.D. Gordana Savić, Ph.D.
BELGRADE, 2022

ii

iii
PUBLISHER University of Belgrade – Faculty of Organizational Sciences
Jove Ilića 154, Belgrade, Serbia www.fon.bg.ac.rs
DEAN OF FACULTY OF ORGANIZATIONAL SCIENCES
Milan Martić, Ph.D.
DESIGNED BY Pavle Milošević
Sandro Radovanović Nikola Zornić
Vukašin Brković Milan Okanović
PRINTING
NEWPRESS, Smederevo
ISBN: 978-86-7680-411-5 Tiraž: 50
YEAR 2022
CONFERENCE ORGANIZER
University of Belgrade – Faculty of Organizational Sciences ________________________________________________________________________ CIP - Kаталогизација у публикацији Народна библиотека Србије, Београд 005.8(048) 658:[007:004(048) INTERNATIONAL Symposium Sustainable Business Management and Digital Transformation: Challenges and Opportunities in the Post-COVID Era (18 ; 2022 ; Beograd) Book of abstracts / XVIII International Symposium Sustainable Business Management and Digital Transformation: Challenges and Opportunities in the Post-COVID Era, SYMORG 2022, Belgrade, June 11-14, 2022; editors Marko Mihić, Sandra Jednak, Gordana Savić; [conference organizer Faculty of Organizational Sciences]. - Belgrade: Faculty of Organizational Sciences, 2022 (Smederevo: Newpress). - XIII, 349 str.: ilustr. ; 21 cm Tiraž 50. - Bibliografija uz pojedine radove. - Registar. ISBN 978-86-7680-411-5 а) Предузећа -- Пословање -- Апстракти б) Предузећа -- Пословање -- Информациона технологија -- Апстракти COBISS.SR-ID 68451849

iv
PROGRAM COMMITTEE SymOrg 2022
Mihić Marko, Chair, University of Belgrade – Faculty of Organizational Sciences, Serbia
Abrudan Denisa, West University of Timisoara – Faculty of Economics and Business Administration, Romania
Anagnostopoulos Achilleas, University of Thessaly – Business & Economic Sciences School, Faculty Teaching Fellow, Department of Business Administration, Greece
Aničić Nenad, University of Belgrade – Faculty of Organizational Sciences, Serbia
Aristovnik Aleksander, Chair of Economics and Public Sector Management, Faculty of Public Administration, Ljubljana, Slovenia
Begičević Ređep Nina, University of Zagreb – Faculty of Organization and Informatics, Croatia
Berber Nemanja, University of Novi Sad – Faculty of Economics in Subotica, Serbia
Bogdanović Zorica University of Belgrade – Faculty of Organizational Sciences, Serbia
Bogojević Arsić Vesna, University of Belgrade – Faculty of Organizational Sciences, Serbia
Ćorić Nino, University of East Sarajevo – Faculty of Philosophy, Republic of Srpska, Bosnia and Herzegovina
Čudanov Mladen, University of Belgrade – Faculty of Organizational Sciences, Serbia
Damnjanović Vesna, University of Belgrade – Faculty of Organizational Sciences, Serbia
Delibašić Boris, University of Belgrade – Faculty of Organizational Sciences, Serbia
Despotović-Zrakić Marijana, University of Belgrade – Faculty of Organizational Sciences, Serbia
Dragović Ivana, University of Belgrade – Faculty of Organizational Sciences, Serbia
Eftimov Ljupco, SS.Cyril and Methodius University in Skopje, Faculty of Economics, Macedonia
Filipović Jovan, University of Belgrade – Faculty of Organizational Sciences, Serbia
Fišer Šobot Sandra, University of Novi Sad – Faculty of Law, Serbia
Horvat Zvezdan, Adizes Institute Worldwide, Serbia
Ignjatović Jelena, Faculty of Sciences and Mathematics, University of Niš, Serbia
Ilić Bojan, University of Belgrade – Faculty of Organizational Sciences, Serbia
Janković Marija, University of Paris Saclay, Centrale Supélec, Industrial Engineering Department, France
Jaško Ondrej University of Belgrade – Faculty of Organizational Sciences, Serbia
Jednak Sandra, University of Belgrade – Faculty of Organizational Sciences, Serbia
Jeremić Veljko, University of Belgrade – Faculty of Organizational Sciences, Serbia
Kostić-Stanković Milica, University of Belgrade – Faculty of Organizational Sciences, Serbia
Kragulj Dragana, University of Belgrade – Faculty of Organizational Sciences, Serbia
Krstajić Božo, Ph.D, University of Montenegro, Faculty of Electrical Engineering, Montenegro
Kuljanin Goran, Ph.D, DePaul University – Driehaus College of Business, Department of Management & Entrepreneurship, USA
Kundrotas Virginius, Adizes Graduate School, USA; Baltic Management Development Association, Lithuania
Lazarević Saša, University of Belgrade – Faculty of Organizational Sciences, Serbia
Lečić Cvetković Danica, University of Belgrade – Faculty of Organizational Sciences, Serbia
Levi Jakšić Maja, University of Belgrade – Faculty of Organizational Sciences, Serbia
Lukács Eszter, Széchenyi István Egyetem University, Hungary
Luković Ivan, University of Belgrade – Faculty of Organizational Sciences, Serbia
Marković Aleksandar, University of Belgrade – Faculty of Organizational Sciences, Serbia
Martić Milan, University of Belgrade – Faculty of Organizational Sciences, Serbia
Miladinović Igor, University of Applied Sciences, FH Campus Wien, Austria
Miladinović Slobodan, University of Belgrade – Faculty of Organizational Sciences, Serbia

v
Milisavljević Bojan, University of Belgrade – Faculty of Law, Serbia
Minelgaité Inga, University of Iceland – School of Social Sciences, Faculty of Business Administration, Iceland
Nikolić Aleksandra, University of Sarajevo – Faculty of Agriculture and Food Sciences, Federation of Bosnia and Herzegovina
Nowacka Anna, Mazovian State University in Płock, Poland
Peško Igor, University of Novi Sad – Faculty of Technical Sciences, Serbia
Petrović Dejan University of Belgrade – Faculty of Organizational Sciences, Serbia
Petrović Nataša, University of Belgrade – Faculty of Organizational Sciences, Serbia
Podbregar Iztok, University of Maribor – Faculty of Organizational Sciences, Slovenia
Popović Vladimir, University of Belgrade – Faculty of Mechanical Engineering, Serbia
Rangel Henriques Pedro, University of Minho, Portugal
Săvoiu Gheorghe, University of Pitesti – Faculty of Economic Sciences and Law, Romania
Schefer-Wenzl Sigrid, University of Applied Sciences, FH Campus Wien, Austria
Simić Dejan, University of Belgrade – Faculty of Organizational Sciences, Serbia
Slović Dragoslav, University of Belgrade – Faculty of Organizational Sciences, Serbia
Štavljanin Velimir, University of Belgrade – Faculty of Organizational Sciences, Serbia
Štarchoň Peter, Comenius University Bratislava, Faculty of Management, Slovakia
Steingartner William, Technical University of Kosice, Slovakia
Stojanović Milica, University of Belgrade – Faculty of Organizational Sciences, Serbia
Stošić Biljana, University of Belgrade – Faculty of Organizational Sciences, Serbia
Suknović Milija, University of Belgrade – Faculty of Organizational Sciences, Serbia
Tarabasz Anna, Curtin University Dubai, UAE
Tekavčič Metka, University of Ljubljana, School of Economics and Business, Slovenia
Tomaž Kern, University of Maribor – Faculty of Organizational Sciences, Slovenia
Tomić Zoran, University of Mostar, Bosnia and Herzegovina
Vasiljević Dragan, University of Belgrade – Faculty of Organizational Sciences, Serbia
Vranić Valentino, Slovak University of Technology – Faculty of Informatics and Information Technologies, Slovakia
Vujošević Mirko, University of Belgrade – Faculty of Organizational Sciences, Serbia
Vukmirović Dragan, University of Belgrade – Faculty of Organizational Sciences, Serbia
Vuković Danilo, University of Belgrade – Faculty of Law, Serbia
Zioło Magdalena, PhD, University of Szczecin, Poland
Žarkić-Joksimović Nevenka, University of Belgrade – Faculty of Organizational Sciences, Serbia

vi
ORGANIZING COMMITTEE SymOrg 2022
Sandra Jednak, co-chair, University of Belgrade – Faculty of Organizational Sciences, Serbia
Gordana Savić, co-chair, University of Belgrade – Faculty of Organizational Sciences, Serbia
Maja Glogovac, member, University of Belgrade – Faculty of Organizational Sciences, Serbia
Lena Đorđević-Milutinović, member, University of Belgrade – Faculty of Organizational Sciences, Serbia
Jovan Krivokapić, member, University of Belgrade – Faculty of Organizational Sciences, Serbia
Milica Latinović, member, University of Belgrade – Faculty of Organizational Sciences, Serbia
Milan Okanović, member, University of Belgrade – Faculty of Organizational Sciences, Serbia
Sandro Radovanović, member, University of Belgrade – Faculty of Organizational Sciences, Serbia
Pavle Milošević, member, University of Belgrade – Faculty of Organizational Sciences, Serbia
TECHNICAL COMMITTEE SymOrg 2022
Biljana Tošić, member, secretary, University of Belgrade – Faculty of Organizational Sciences, Serbia
Anđelija Đorđević, member, University of Belgrade – Faculty of Organizational Sciences, Serbia
Miloš Parežanin, member, University of Belgrade – Faculty of Organizational Sciences, Serbia
Dejana Nikolić, member, University of Belgrade – Faculty of Organizational Sciences, Serbia
Nikola Zornić, member, University of Belgrade – Faculty of Organizational Sciences, Serbia
Vukašin Brković, member, University of Belgrade – Faculty of Organizational Sciences, Serbia
Filip Furtula, member, University of Belgrade – Faculty of Organizational Sciences, Serbia
Marija Meršnik, member, University of Belgrade – Faculty of Organizational Sciences, Serbia
Aleksandra Stojiljković, member, University of Belgrade – Faculty of Organizational Sciences, Serbia
Dejan Markovski, member, University of Belgrade – Faculty of Organizational Sciences, Serbia
Bojana Ivanović Bovan, member, University of Belgrade – Faculty of Organizational Sciences, Serbia
Aleksandra Vojovodić, member, University of Belgrade – Faculty of Organizational Sciences, Serbia
Ivan Aleksić, member, University of Belgrade – Faculty of Organizational Sciences, Serbia

vii
FOREWORD We are very pleased to present the Book of Abstracts of the XVIII International Symposium of Organizational Sciences – SymOrg 2022. With 140 contributions by authors from 19 different countries, XVIII International Symposium of Organizational Sciences – SymOrg 2022 successfully sets the high level for future conferences. The topic of SymOrg 2020, “Sustainable Business Management and Digital Transformation: Challenges and Opportunities in the Post-COVID Era”, attracted researchers from different institutions, both in Serbia and abroad. This year, more than 300 scholars and practitioners authored and co-authored scientific and research articles that had been accepted for publication in the Book of Abstracts. All the contributions to the Book of Abstracts are classified into the following 13 key topics:
Blockchain Technology in Business and Information Systems Business Analytics Creativity, Innovation and Sustainable Management Digital Operations and Logistics Management Digital Transformation of Financial Industry Digital Transformation of Public Administration E-Business Ecosystems Evidence-Based Public Policy Making in the Post-COVID Environment LEAN Business Systems – Structures, Processes and Models Managing Digital Transformation Projects under Discontinuity Managing Human Resources in the Post-COVID Era Rethinking Marketing and Communication in the Post-COVID Era Quality Management and Standardization in Digital Transformation Era.
The participation of numerous domestic and international authors and the diversity of topics justify our efforts to organize the Symposium. As SymOrg is traditionally at the intersection of academy and business, we believe that this year’s meeting will bring about many in-depth discussions, contribute to prospective partnerships, and build stronger business and academic networks. We also believe that meeting will contribute to the exchange of knowledge, research results and experience among industry experts, research institutions and faculties, which all share a common interest in contemporary organizational sciences. We are very grateful to our distinguished keynote and plenary speakers: Ana Draskovic, Aleksander Aristovnik, Manuel Mazzara, Basant Agarwa and Priyanka Harjule. Also, special thanks to moderators for organizing the panels and workshops in the fields of higher education, business, supply chain, doctoral research studies and student engagement and sustainability. The Faculty of Organizational Sciences would like to express its gratitude to the Ministry of Education, Science and Technological Development and all the partners and individuals who have supported and contributed to the organization of the Symposium. We are particularly grateful to the contributors and reviewers who made this issue possible. But above all, we are especially thankful to the authors and presenters for making SymOrg 2022 a success! Belgrade, June 6, 2022 Marko Mihić, Ph.D.
Sandra Jednak, Ph.D. Gordana Savić, Ph.D.

viii
ACKNOWLEDGEMENT The Program, Organizing and Technical Committees of the XVIII International Symposium of Organizational Sciences – SymOrg 2022 wishes to sincerely thank all the institutions and individuals who, through personal engagement and constructive action, helped in the Symposium organization. We particularly wish to thank our sponsors: The Ministry of Education, Science and Technological Development, The Republic of Serbia; Springer Nature, Huawei, Galeb Group, Comtrade Group, TX services, Banca Intesa, Ernst & Young, HTEC Group, MSG Global, Manpower Group, Coca-Cola HBC, Yettel, Zlatiborac and Newpress. They have significantly contributed to the organization and realization of the Symposium.
ix
TABLE OF CONTENT
FOREWORD ...................................................................................................................................................................... vii
ACKNOWLEDGEMENT .................................................................................................................................................... viii
INVITED LECTURES – SHORT ABSTRACTS .................................................................................................................. 1
SUSTAINABILITY AND DIGITAL AFTER COVID – WHAT IS THE DIRECTION AND THE PACE OF THE CHANGE ..... 2
DIGITAL TRANSFORMATION OF PUBLIC ADMINISTRATION DURING AND AFTER COVID-19 PANDEMIC: SOME THEORETICAL AND EMPIRICAL INSIGHTS .................................................................................................................... 3
EDUCATION AFTER COVID-19 (“HUMANITY AND MACHINES: THE FUTURE OF EDUCATION”) ............................... 4
THE ROLE OF ARTIFICIAL INTELLIGENCE FOR THE SUSTAINABLE BUSINESS IN THE POST COVID-19 WORLD . 5
APPLICATIONS OF INTELLIGENT OPTIMIZATION TECHNIQUES IN SUSTAINABILITY ............................................... 6
BLOCKCHAIN TECHNOLOGY IN BUSINESS AND INFORMATION SYSTEMS ............................................................. 7
SMART CONTRACTS AND THEIR IMPACT ON SUPPLY CHAIN MANAGEMENT ......................................................... 8
ETHEREUM REQUEST FOR COMMENT FOR FRACTIONAL OWNERSHIP OF NON-FUNGIBLE TOKENS .............. 10
MANAGING CONSISTENCY LEVELS IN DISTRIBUTED SYSTEMS .............................................................................. 13
IMPLEMENTATION OF SMART CONTRACTS FOR PAYMENT TRANSACTIONS ON THE ETHEREUM PLATFORM 15
THE RELATIONSHIP BETWEEN THE CURRENCIES OF OLD AND MODERN TIMES ................................................. 18
BLOCKCHAIN-BASED SOLUTIONS FOR IOT: A SURVEY ............................................................................................. 20
ON THE USE OF SCHEDULED CONSENSUS IN BUSINESS APPLICATIONS ............................................................. 22
BIOMETRIC AUTHENTICATION MODEL IN ELECTRONIC PAYMENT SYSTEM BASED ON BLOCKCHAIN TRANSACTIONS .............................................................................................................................................................. 24
A METHODOLOGICAL APPROACH FOR CONVERTING RELATIONAL TO GRAPH DATABASES ............................. 26
OVERVIEW OF NON-FUNGIBLE TOKEN SYSTEMS ..................................................................................................... 29
A COMPARATIVE ANALYSIS OF THE HUMAN RESOURCES MODULE IN OPEN-SOURCE ERP SYSTEMS ........... 31
BLOCKCHAIN IN IDENTITY MANAGEMENT - A SURVEY ............................................................................................. 34
ANALYZING THE IMPACT OF PHYSICAL OPTIMIZATION ON DATABASE QUERIES ............................................. 38
BUSINESS ANALYTICS .................................................................................................................................................. 41
ENVY-FREE FAIR STUDENT DROPOUT PREDICTION ................................................................................................. 42
CREDIT RATING PREDICTION USING MACHINE LEARNING ALGORITHMS: S&P500 COMPANIES ........................ 44
SALES FORECASTING IN RESTAURANTS USING COMPUTATIONAL INTELLIGENCE ............................................. 46
THE IMPACT OF MISSING VALUES ON CORPORATE CREDIT RATING PREDICTION PERFORMANCE .................. 48
DATA-CENTRIC MACHINE LEARNING IN CRYPTO MINING DETECTION ................................................................... 50
GENERALIZATION CAPABILITIES OF ARTIFICIAL NEURAL NETWORKS AS AN INDICATOR OF A CRISIS ............ 52
DEVELOPMENT OF THE STRATEGIC GAMES SIMULATIONS PLATFORM ................................................................. 55
DOES OWNERSHIP STRUCTURE AFFECT BANK PERFORMANCE IN THE COVID-19 PANDEMIC PERIOD? EVIDENCE FROM CROATIA ........................................................................................................................................... 57
BUSINESS PERFOMANCE OF POSTAL OPERATORS ................................................................................................. 60
ANALYTICAL MODELING OF GRADUATED ECONOMISTS’ EMPLOYMENT ................................................................. 64
ANALYSIS OF THE DETERMINANTS OF GRADUATES EMPLOYABILITY ................................................................... 67
SIMULATION MODELS IN THE FUNCTION OF CENSORED DEMAND MANAGEMENT OF HIGHER EDUCATION PROCESSES IN THE ERA OF DIGITALIZATION ............................................................................................................ 70
ONLINE VS HYBRID TEACHING - COMPARISON OF STUDENTS' PERFORMANCE ON PRE-EXAM OBLIGATIONS .......................................................................................................................................................................................... 72

x
FUZZY LINEAR FRACTIONAL PROGRAM STRICTLY BASED ON EXTENSION PRINCIPLE USING LINEAR MODELS .......................................................................................................................................................................................... 74
BLOCKCHAIN: APPLICATION OF MACBETH METHOD FOR RANKING CRYPTO PROJECT FACTORS ................... 76
CREATIVITY, INNOVATION AND SUSTAINABLE MANAGEMENT .............................................................................. 79
THE ROLE OF SMES IN THE SUSTAINABLE ENERGY TRANSITION .......................................................................... 80
SUSTAINABLE COST MANAGEMENT OF RENEWABLE ENERGY COMPANIES ........................................................ 82
IS PROFIT IMPORTANT TO THE SUSTAINABLE MANAGEMENT OF SOCIAL ENTERPRISE? CASE OF CROATIA . 84
USING SAP ACTIVATE METHODOLOGY IN THE IMPLEMENTATION OF S/4 HANA TECHNOLOGY ........................ 86
POSSIBILITIES OF APPLICATION OF PROCESS INNOVATIONS IN THE CUSTOMS SYSTEM ................................. 88
SUSTAINABLE MANAGEMENT OF SERBIAN AGRICULTURAL FAMILY HOLDINGS .................................................. 90
A MODEL FOR FINANCING INNOVATION IN SMART COMMUNITIES ......................................................................... 92
DIGITALIZATION AND SUSTAINABLE ECONOMIC DEVELOPMENT IN EUROPEAN COUNTRIES ............................ 94
FRAMEWORK FOR INNOVATION AND SUSTAINABLE MANAGEMENT- SYSTEMS THINKING MODELS................. 96
DRIVING INNOVATION THROUGH INTRA-ORGANIZATIONAL CO-CREATION PLATFORM ................................... 100
DOCUMENTATION AND CONFIGURATION MANAGEMENT SYSTEMS FOR R&D PROJECTS ............................... 103
APPLYING THE FUZZY ANALYTIC HIERARCHY PROCESS TO EVALUATION OF THE R&D PROJECTS .............. 106
PRODUCT-SERVICE SYSTEM IN TELECOMMUNICATIONS INDUSTRY ................................................................... 110
IMPROVING THE METHODOLOGY OF INNOVATION PROJECTS PORTFOLIO MANAGEMENT ............................. 112
SUSTAINABLE MANAGEMENT THROUGH DIGITAL SERVITIZATION ....................................................................... 114
DEVELOPING SMART TOURISM AS A STRATEGIC APPROACH TO TOURISM CHALLENGES IN THE POST-COVID ERA ................................................................................................................................................................................. 116
DEVELOPMENT OF FLOOD RISK ASSESMENT MODEL ............................................................................................ 118
SHARING ECONOMY AND SUSTAINABLE DEVELOPMENT GOALS ......................................................................... 120
DIGITAL OPERATIONS AND LOGISTIC MANAGEMENT ........................................................................................... 123
DIGITALIZATION OF AUTOMATED GUIDED VEHICLES KEY PERFORMANCE INDICATORS ................................. 124
AN APPROACH TO SUPPORT SMALL MEDIUM-SIZE COMPANIES IN PLANNING AND MANAGING DISTRIBUTION ROUTES ......................................................................................................................................................................... 126
SPREADSHEET-BASED SHADOW IT: CASE OF SERBIA ........................................................................................... 128
MOTIVATIONAL ELEMENTS OF INTRODUCTION AND USE OF INTELLIGENT SYSTEMS THROUGH THE PARADIGM OF NEW ELECTRIC MOBILITY IN EUROPE AND BEYOND .................................................................... 131
WATER TRAFFIC MANAGEMENT SYSTEMS IN PORTS FOR THE NEEDS OF MANAGEMENT IN PORT LOGISTICS ........................................................................................................................................................................................ 134
CONSTRUCTIVE HEURISTIC FOR OPEN SHOP PROBLEM WITH RECIRCULATION .............................................. 136
TOWARDS A CONCEPTUAL FRAMEWORK OF LOGISTICS 4.0 ................................................................................ 139
WOMEN'S ENTREPRENEURSHIP - MEASURES FOR THE DEVELOPMENT: CASE STUDY OF REPUBLIC OF SERBIA ........................................................................................................................................................................... 142
DIGITAL TRANSFORMATION OF FINANCIAL INDUSTRY ......................................................................................... 145
GREEN BONDS .............................................................................................................................................................. 146
TRADITIONAL VERSUS CONDITIONAL EVALUATION OF PORTFOLIO PERFORMANCE: LITERATURE REVIEW 149
INFLUENCE OF DIGITAL SKILLS AND AUTOMATION ON DIGITISATION IN RETABVIL BANKING ......................... 151
DIGITAL TRANSFORMATION OF BANKING BUSINESS IN SERBIA CAUSED BY COVID-19 PANDEMIC ................ 153
CUSTOMER PREFERENCES TOWARDS DIGITAL BANKING SERVICES IN SERBIA ............................................... 155
DIGITAL TRANSFORMATION IN CAR INSURANCE – INSURTECH AS A NEW MARKET TREND ............................ 157

xi
VALUE OF DIGITAL SUSTAINABILITY .......................................................................................................................... 160
MICROFINANCE FOR THE SMEE SECTOR: A BIBLIOMETRIC REVIEW ................................................................... 162
NON-FINANCIAL REPORTING AND SUSTAINABLE DEVELOPMENT IN PUBLIC SECTOR ORGANIZATIONS ....... 164
DIGITAL TRANSFORMATION OF PUBLIC ADMINISTRATION ................................................................................... 167
THE CHALLENGES OF E-GOVERNMENT IN (POST) COVID CRISIS IN SERBIA ...................................................... 168
USE VALUE OF OPEN DATA IN SERBIA ...................................................................................................................... 170
REFORM OF TAX ADMINISTRATION IN SERBIA – THE ROADMAP FOR THE EFFECTIVE DIGITAL TRANSFORMATION THROUGH THE PARADIGM SWITCH ........................................................................................ 173
IMPACT OF DIGITALIZATION ON PUBLIC PROCUREMENT PERFORMANCES IN SLOVENIA ................................ 175
DIGITALIZATION OF THE FINANCIAL MANAGEMENT AND CONTROL SYSTEM IN THE PUBLIC SECTOR: THE CASE OF WESTERN BALKAN COUNTRIES ................................................................................................................ 177
E-BUSINESS ECOSYSTEMS ........................................................................................................................................ 179
REINFORCING SMALL-SCALE PRODUCERS VIA INNOVATIVE BUSINESS MODELS: A CASE OF NATURAL FOOD AND DRINKS PRODUCTS IN SERBIA .......................................................................................................................... 180
DESIGNING A BLOCKCHAIN-BASED E-BUSINESS SYSTEM FOR TRACKING HONEY PRODUCTION ................. 184
E- FISCALIZATION- EXPERIENCES AND ANALYSIS IN SMALLER COMPANIES ...................................................... 186
DIGITAL MARKETING IN THE PROMOTION OF A NEW FASHION BRAND ............................................................... 188
CROWDSOURCING AND IOT-BASED OPEN INNOVATIONS IN INCREASING SAFETY ON RAILWAYS ................. 190
TESTING READINESS FOR THE INTRODUCTION OF CROWDSOURCING SERVICES IN SECONDARY HEALTHCARE INSTITUTIONS ...................................................................................................................................... 192
STUDENTS’ PERCEPTION OF MANUAL AND AUTOMATED GRADING OF PROGRAMMING ASSIGNMENTS....... 194
A SILABBIZ DSL FOR BUSINESS LOGIC SPECIFICATION ......................................................................................... 196
QUALITY-BASED ANALYSIS OF SHIFTING TO NATIVE MICROSERVICE SOFTWARE ARCHITECTURE ............... 199
TESTING AS A VALIDATION METHOD FOR FUNCTIONAL REQUIREMENTS OF A SOFTWARE SYSTEM ............ 203
EVIDENCE-BASED PUBLIC POLICY MAKING IN POST-COVID ENVIRONMENT ..................................................... 207
DOES EQUAL PAY WORK FOR WOMEN IN SERBIA? THE EXPERIENCE DURING THE COVID-19 PANDEMIC .... 208
DID COVID-19 RELIEF PROGRAMS REANIMATE ZOMBIE COMPANIES? ................................................................ 211
THE IMPACT OF THE COVID CRISIS ON MACROECONOMIC INDICATORS OF EU MEMBER STATES ................ 213
DEMOGRAPHIC CHANGES IN THE CONTEXT OF THE CROATIAN PENSION SYSTEM .......................................... 215
SHRINKING POPULATIONS AND SUSTAINABLE SOCIO-ECONOMIC DEVELOPMENT: IS THERE A WAY OUT FROM THE PITFALL? .................................................................................................................................................... 217
LEAN BUSINESS SYSTEMS – STRUCTURES, PROCESSES AND MODELS ........................................................... 221
KEY PERFORMANCE INDICATORS IN INDUSTRIAL HUMAN-ROBOT COLLABORATION ....................................... 222
IMPLEMENTING LEAN MANUFACTURING TOOLS: THEORY AND PRACTICE ......................................................... 224
IMPLICATIONS OF LEAN IN CONTEXT OF NON-REPETITIVE MANUFACTURING ON LENSES OF LEAN: A REVIEW ........................................................................................................................................................................................ 226
MEASURING THE SUCCESS OF LEAN ORGANIZATIONS THROUGH TRIPLE BOTTOM LINE FRAMEWORK ....... 228
LEAN PLANNING - THE IMPORTANCE OF CHOOSING THE ESTIMATION TECHNIQUE THAT WILL FIT PROJECT NEEDS ............................................................................................................................................................................ 230
MANAGEMENT AND EMPLOYEE INFLUENCE ON LEAN TRANSFORMATION ......................................................... 232
IMPROVING PROFITABILITY WITH CONTINUOUS IMPROVEMENT ......................................................................... 234
COMPARATIVE STUDY OF SPECIAL EVENT SPONSORSHIP IN PRE-COVID-19 AND POST-COVID-19 ERA ....... 237
THE INFLUENCE OF ENVIORNMENTAL FACTORS CHANGE ON THE DIGITAL TRANSFORMATION PROCESS . 239

xii
THE IMPORTANCE OF EMPLOYEES FOR THE IMPLEMENTATION OF ORGANIZATIONAL CHANGES DURING THE PANDEMIC ..................................................................................................................................................................... 241
TELEWORK AFTER THE COVID-19: PERCEPTIONS IN RELATION TO OWNERSHIP, INDUSTRY AND SUPPORT ........................................................................................................................................................................................ 243
MANAGING DIGITAL TRANSFORMATION PROJECTS UNDER DISCONTINUITY ................................................... 245
KEY ROLE OF HIGH-TECH BUSINESS INCUBATORS SUSTAINABLE GOVERNANCE IN THE POST-COVID ERA 246
THE FUTURE IS ALREADY HERE: DO WE NEED TO UPSKILL DIGITAL PROJECT MANAGERS? .......................... 248
DIGITAL TRANSFORMATION LEADING THE WAY ...................................................................................................... 250
FEASIBILITY ASSESSMENT OF DIGITAL TRANSFORMATION PROJECTS IN AGRICULTURE ............................... 252
EDTECH PROJECTS: DISRUPTIVE INNOVATION IN HIGHER EDUCATION ............................................................. 254
MEASURING THE SUCCESS OF DIGITAL TRANSFORMATION PROJECTS............................................................. 256
DIGITAL TRANSFORMATIONS AND SOFTWARE SOLUTIONS IN THE FIGHT AGAINST THE CORONA VIRUS IN THE DEFENSE SYSTEM ............................................................................................................................................... 258
DIGITALISATION OF CONSTRUCTION INDUSTRY IN SERBIA – NEW BUIDLING OF THE FACULTY OF ORGANISATIONAL SCIENCES CASE STUDY ............................................................................................................. 260
MANAGING HUMAN RESOURCES IN POST-COVID ERA .......................................................................................... 263
WORKING FROM HOME, WORK-RELATED ATTITUDES, WORK-LIFE BALANCE AND EMPLOYEE WELL-BEING – IMPLICATIONS FOR HRM IN THE POST-COVID ERA ................................................................................................. 264
THE EFFECTS OF PERCEIVED ORGANIZATIONAL SUPPORT ON EMPLOYEES WELL-BEING IN POST COVID ERA ........................................................................................................................................................................................ 266
BURNOUT SYNDROME AMONG PRIMARY HEALTH CARE EMPLOYEES DURING COVID-19 PANDEMIC............ 268
STUDENTS DIGITAL COMPETENCIES DURING ONLINE LEARNING: ARE THEY READY FOR THE POST-COVID ERA? ............................................................................................................................................................................... 270
STUDENTS’ PERCEPTIONS OF PERSONAL BRANDING IN GREECE: IMPACTS ON CAREER ACHIEVEMENT ASPIRATIONS ................................................................................................................................................................ 272
THE IMPACT OF PERCEIVED JOB INSECURITY ON MILLENNIAL WORKERS' ORGANIZATIONAL COMMITMENT ........................................................................................................................................................................................ 274
ENHANCEMENT OF THE ACTIVITY EFFECTIVENESS IN THE PRODUCTION WORKSTATIONS THROUGH HUMAN RISK FACTORS ANALYSIS ........................................................................................................................................... 276
THE IMPORTANCE OF CANDIDATES 'ATTITUDES TOWARDS THE FAIR IMPLEMENTATION OF THE SELECTION PROCESS FOR EMPLOYER BRANDING ..................................................................................................................... 278
DEVELOPING FRAMEWORK FOR MEASURING CAREER TRANSITION READINESS ............................................. 280
PERSONAL ETHICS PERCEPTION AND ITS RELATION TO THE EXPECTED PROPERTIES OF A GOOD LEADER ........................................................................................................................................................................................ 282
BOARDS’ INVOLVEMENT IN CEO SUCCESSION: A CASE STUDY ANALYSIS ......................................................... 285
„EVERYTHING IS A PROJECT”: PROJECTIFICATION IN WORK-LIFE CONTEXT OF WOMEN TOP MANAGERS .. 287
THE ROLE OF HR IN ORGANISING HACKATHON AS AN EMPLOYER BRANDING TOOL ....................................... 288
AUDITOR'S PERCEPTION OF STRESS DURING THE COVID19 IN THE REPUBLIC OF SERBIA ............................ 290
QUALITY MANAGEMENT AND STANDARDIZATION IN DIGITAL TRANSFORMATION ERA .................................. 293
MEASURING PERCEIVED SERVICE QUALITY USING SERVQUAL IN HOSPITALITY INDUSTRY ........................... 294
IMPLEMENTATION OF ISO 22301 STANDARD FOR BUSINESS CONTINUITY AND QUALITY ASSURANCE IN FOOD INDUSTRY ...................................................................................................................................................................... 296
QUALITY MANAGEMENT PERCEPTION IN STUDENT ORGANIZATIONS ................................................................. 300
ADVANTAGES AND EFFECTS ON QUALITY OF THE ONLINE MODEL OF EDUCATION IN PRIMARY SCHOOLS . 302
INTERNATIONALIZATION AS THE FOUNDATION FOR SUSTAINABLE BUSINESS MANAGEMENT ....................... 304

xiii
ASSESSMENT OF ENTREPRENEURIAL COMPETENCES OF INDUSTRIAL ENGINEERING STUDENTS: POST-COVID19 RESULTS ....................................................................................................................................................... 306
RETHINKING MARKETING AND COMMUNICATION IN POST-COVID ERA .............................................................. 309
EMPLOYER BRANDING STRATEGY: UNIVERSITY AND INDUSTRY COLLABORATION ......................................... 310
DIGITAL PERFORMANCE OF LEADING FASHION BRANDS ...................................................................................... 312
THE APPLICATION OF SOCIAL MARKETING IN ART INSTITUTIONS COMMUNICATION ....................................... 314
THE EFFECTS OF COMMUNICATION DURING THE PANDEMIC ON PUBLIC OPINION AND TRUST IN THE INSTITUTIONS OF THE SYSTEM ................................................................................................................................. 316
CHANGES IN MARKETING PERFORMANCE MEASUREMENT DUE TO THE COVID-19 PANDEMIC – EVIDENCE FROM CEE ..................................................................................................................................................................... 318
CHALLENGE MANAGEMENT IN FILM INDUSTRY CAUSED BY COVID-19: OVERCOMING SOLUTIONS ............... 320
COMMUNICATION PERSPECTIVE OF LOBBYING FOR PRE-SCHOOL EDUCATION: CASE OF SERBIA ................ 322
THE INFLUENCE OF AUGMENTED REALITY TECHNOLOGIES IN POST-COVID BUSINESS COMMUNICATION . 324
THE IMPORTANCE OF MARKETING ACTIVITIES IN CREATIVE INDUSTRIES IN POST COVID ERA ..................... 326
VISIBILITY, FAVORABILITY AND EFFECTIVENESS OF SOCIAL MARKETING CAMPAIGNS – WHAT DRIVES BEHAVIOR CHANGE? ................................................................................................................................................... 328
DATA-DRIVEN CHANGES IN CORPORATE COMMUNICATION IN THE POST-COVID ERA ..................................... 330
RESHAPING THE COMMUNICATION STRATEGY OF ENERGY COMPANIES IN THE POST-COVID TIME - CASE STUDY "ELEKTROMREŽA SRBIJE AD" ........................................................................................................................ 332
POST-CRISIS REPUTATION MANAGEMENT – THE EFFECT OF DIFFERENTCRISIS COMMUNICATION STRATEGIES ................................................................................................................................................................. 334
RETHINKING GLOBAL RETAIL STRATEGY IN POST COVID ERA ............................................................................. 336
COMMUNICATIONS MANAGEMENT IN HEALTHCARE INSTITUTIONS: ANALYSIS OF INTERNAL PUBLIC ATTITUDES BEFORE AND AFTER THE COVID-19 PANDEMIC .................................................................................. 338
CONSUMERS’ BEHAVIOR ACCCORDING TO GENERATION SEGMENTS ............................................................... 340
THE IMPACT OF GENERATION Z CONSUMER LIFESTYLES ON ONLINE SHOPPING DURING CORONA CRISIS 342
PRO-ENVIRONMENTAL PURCHASING BEHAVIOR: EXPLORING MOTIVATION DRIVING GEN Y AND GEN Z...... 344
AUTHOR INDEX ............................................................................................................................................................. 346


1
INVITED LECTURES – SHORT ABSTRACTS

2
SUSTAINABILITY AND DIGITAL AFTER COVID – WHAT IS THE DIRECTION AND
THE PACE OF THE CHANGE
Ana Draskovic European Bank for Reconstruction and Development, UK
*Corresponding author, e-mail: [email protected]
COVID pandemic had multiple effects on humanity and brought some irreversible changes. We are all more aware than ever of the importance of our environment and our eco-systems, but we also learned that sustainability is not just another cost to the business, it is an immense opportunity as well. Overnight we all turned into digital experts as well, delivering our work on-line which changed the way many businesses now operate and significantly increased demand for digital solutions everywhere, from SMEs to blue chip companies, across the globe. My presentation will try to shed more light on opportunities sustainability and digital are offering and provide some case studies and examples of how different countries and different companies are embracing this change.

3
DIGITAL TRANSFORMATION OF PUBLIC ADMINISTRATION DURING AND AFTER
COVID-19 PANDEMIC: SOME THEORETICAL AND EMPIRICAL
INSIGHTS
Aleksander Aristovnik University of Ljubljana – Faculty of Public Administration
*Corresponding author, e-mail: [email protected]
The COVID-19 pandemic has significantly reshaped administrative relations and put emphasis on the digital transformation of public administration that is urgently needed to support a sustainable recovery from the pandemic crisis and future sustainable development in the post-pandemic era. Indeed, in unprecedented circumstances like the COVID-19 crisis, public services cannot be suspended and must then be delivered online, relying on the available digital technology. Accordingly, public administration has faced the pressing need to assess its current digital technological capabilities while also having to rapidly deal with technological adoption and solution implementation. In other words, the COVID-19 pandemic may be considered an accelerator of digitalization in the delivery of public services. In the presentation, I will present a bibliometric analysis of recent literature and findings from our international empirical study about the impact of the Covid-19 pandemic on the digitalization of public administration. Furthermore, a theoretical framework for measuring the digital transformation of public administration organizations in the post-pandemic era will be presented and empirically tested on selected public institutions.

4
EDUCATION AFTER COVID-19 (“HUMANITY AND MACHINES: THE
FUTURE OF EDUCATION”)
Manuel Mazzara Institute of Software Development and Engineering,
Innopolis University, Russia *Corresponding author, e-mail: [email protected]
The year 2020 has brought life-changing events for many and affected numerous professional sectors. Education has been one of those fields heavily impacted, and institutions have almost worldwide switched to forms of online education, which has become a common practice. With a fourth industrial revolution happening in front of our eyes, some elements of the existing education system are showing themselves as outdated. However, despite the realization that online teaching is here to stay, frontal classes are a millennia-old practice that cannot be entirely replaced without neglecting human nature. Instead, old and new can coexist, and humanity and machines can cooperate for societal development. In this talk, I present the past, present, and future of education, what we have learned by the experience of teaching online, and how we see and are getting ready for future developments in the field.

5
THE ROLE OF ARTIFICIAL INTELLIGENCE FOR THE SUSTAINABLE
BUSINESS IN THE POST COVID-19 WORLD
Basant Agarwal Indian Institute of Information Technology Kota, India
*Corresponding author, e-mail: [email protected]
The COVID-19 pandemic has significantly reshaped administrative relations and put emphasis on the digital transformation of public administration that is urgently needed to support a sustainable recovery from the pandemic crisis and future sustainable development in the post-pandemic era. Indeed, in unprecedented circumstances like the COVID-19 crisis, public services cannot be suspended and must then be delivered online, relying on the available digital technology. Accordingly, public administration has faced the pressing need to assess its current digital technological capabilities while also having to rapidly deal with technological adoption and solution implementation. In other words, the COVID-19 pandemic may be considered an accelerator of digitalization in the delivery of public services. In the presentation, I will present a bibliometric analysis of recent literature and findings from our international empirical study about the impact of the Covid-19 pandemic on the digitalization of public administration. Furthermore, a theoretical framework for measuring the digital transformation of public administration organizations in the post-pandemic era will be presented and empirically tested on selected public institutions. The importance of AI and Machine Learning leads us to believe that governments must foster trust in these technologies in order to address future health issues and accomplish the SDGs related to good health and wellbeing. Employers have more reason than ever to hunt for methods to substitute workers with robots, and recent evidence suggests that the same is happening at a rapid rate. The emergence of AI and its increasingly broad impact across various sectors necessitates a review of its impact on achieving the SDGs. According to a new survey “AI in a Post-COVID-19 World” released by The AI Journal, 72 percent of CEOs are optimistic about the role of AI in the future, with the top expectation being that it will improve business operations by up to 74 percent. Also, 55 percent CEOs believe that AI will aid in the development of new business models, and 54 percent believe that AI will enable the development of new products and services. As organizations become more reliant on AI-based systems, the Explainable Sustainable AI was born out of the necessity for deployment of sustainable AI solutions reinforced with human-understandable explanations. In this talk, I will be presenting how AI can contribute to achieving SDGs, why AI matters for sustainable businesses and what’s the real value of AI for a business, how businesses are adopting AI technologies, although AI has already been around in the past, why today is the right time to use AI for growth of businesses, and finally, how we can utilize AI for a business.

6
APPLICATIONS OF INTELLIGENT OPTIMIZATION TECHNIQUES IN
SUSTAINABILITY
Priyanka Harjule Malaviya National Institute of Technology Jaipur (MNIT), India
*Corresponding author, e-mail: [email protected]
As per the current research trends applications of optimization techniques in sustainability have proven to be topics with diverse concepts, elements, and aspects and are the driving force towards attaining the sustainable development goals. The primary objective of optimization techniques is to improvise the overall sustainable management by satisfying the objective functions. Therefore, applications of optimization techniques and algorithms are significant and important to achieve the sustainable development. As per the literature, sustainability is defined to be the technology that meets today’s needs without jeopardizing the future generations’ ability to meet their own needs. One of the most important tools to achieve sustainability is Optimization. Mathematically optimization is defined as the selection of the best element with respect to some criterion/restrictions. It is a search process to find the optimum solution for a given network parameters using all feasible solutions. The complex nature of many real-life problems calls for applications of optimization methods to obtain a sustainable solution. Intelligent optimization algorithms are crucial for obtaining solutions to such kinds of problems. Classical optimization methods cannot be used for several complex scientific problems that require solutions with accurate computations and appropriate time. Powerful intelligent optimization techniques based on the natural phenomenon are used in order to design artificial computational methods for solving complex optimization problems. These are called metaheuristic methods. In this talk I will provide an overview of metaheuristic optimizers used in various disciplines for attaining sustainable solutions. I will also provide case studies in which optimization methods are used for managing various issues related to social sciences in post COVID-19 era specifically in India.

7
BLOCKCHAIN TECHNOLOGY IN BUSINESS AND INFORMATION
SYSTEMS
8
SMART CONTRACTS AND THEIR IMPACT ON SUPPLY CHAIN MANAGEMENT
Dušan Mitrović*1, Ivan Milenković
1, Dejan Simić
1
1University of Belgrade – Faculty of Organizational Sciences *Corresponding author, e-mail: [email protected]
OBJECTIVE
Development of blockchain technology has enabled the existence of reliable decentralized systems, where all saved data is immutable, traceable and transparent (Antonopoulos & Wood, 2018). For the last decade and even further in the past, blockchain technology has attracted significant attention from both academia and business entities. The most well known application of blockchain technology is for developing cryptocurrencies such as bitcoin (Nakamoto, 2008) and ethereum (Buterin, 2014). However, the potential of blockchain technology is much bigger, as the cryptocurrencies are only one of the possible use cases. Blockchain technology brings disruption to various industries. Potentially, various types of problems can be solved by application of blockchain technology, especially in the areas of finance, trade and supply chain management (Khan et al, 2021). The area of our interest in this paper, supply chain management, is a process consisting of several activities which are required for product or service delivery to the end user (Lummus & Vokurka, 1999). All producers, distributors, consumers and all transactions between them are the building blocks of this process. Supply chain management begins with simple raw materials and ends with the delivery of the final product to end users (Stadtler & Kilger, 2008). Because of the large number of participants and transactions, this process can become very complex, with various problems and drawbacks. Providing traceability, transparency and trust between participants in such a complex process can be a real challenge. Traditional systems for supply chain management struggle with these issues (Law, 2017). The use of blockchain for supply chain management has potential to mitigate these issues (Omar et al, 2020).
METHODOLOGY
Smart contracts are computer programs saved on the blockchain network, whose instructions are automatically executed when certain conditions are satisfied (Antonopoulos & Wood, 2018). This makes them essentially digital contracts, where obligations of all parties are stored in program code, and which are autonomously carried out when obligations defined by the contract are fulfilled. Smart contracts have the potential to reduce the complexity of supply chain management and provide a single source of information to all participants, thereby increasing the trust between participants of a supply chain (Tapscott D. & Tapscott A., 2016). The goal is to provide in a simple and accessible way the traceability of each product, where its voyage can be followed step by step through a supply chain. Therefore, for each product in the supply chain, participants can have the answer to questions about what, where and when happened with the product. Based on these assumptions, we have created a basis of a prototype system for supply chain management support. Prototype consists of smart contracts written in Solidity programming language (Solidity Team, 2022).
RESULTS
We have created a prototype of the tracking system to support the supply chain management system, based on blockchain technology and use of smart contracts. In favor of a simpler and more practical solution, we

9
have used a simplified supply chain model by grouping all participants into suppliers and consumers in just a few levels. As shown on Figure 1, each time one of the participants receives a product, information about the receiving and the details of the product itself are recorded on the blockchain network using a smart contract. Also, every time the product is sent to another participant, details of that transaction are being written on the network. All participants can follow the flow of products through the supply chain, as well as check the dynamics that each of the participants perform in their activities.
Figure 1: Platform overview
CONCLUSION
By using innovative blockchain technology and smart contracts, we have shown that they can respond to existing challenges in the field of supply chain management in a simpler and more reliable way than traditional technologies. Although smart contracts implemented for this purpose in our use case are simple, they clearly show that such platforms have the potential to easily provide transparency, traceability and increase trust between chain participants. The subject of our further research will certainly be the more advanced applications of blockchain and smart contracts in this area. Such applications can lead to further automatization of transactions between participants in the supply chain and the creation of a more reliable and efficient system.
Keywords: blockchain, smart contracts, supply chain management
REFERENCES
[1] Antonopoulos, A., Wood, G. (2018). Mastering Ethereum. O’Reilly Media, Inc. [2] Buterin V. (2014). Ethereum: A Next-Generation Smart Contract and Decentralized Application Platform.
https://ethereum.org/en/whitepaper/ [3] Khan, S. N., Loukil, F., Ghedira-Guegan, C., Benkhelifa, E., & Bani-Hani, A. (2021). Blockchain smart contracts:
Applications, challenges, and future trends. Peer-to-peer Networking and Applications, 14(5), 2901-2925. [4] Law A. (2017). Smart Contracts and their Application in Supply Chain Management. MIT. [5] Lummus, R., Vokurka, K. (1999). Defining supply chain management: a historical perspective and practical
guidelines. Industrial Management & Data Systems. [6] Nakamoto S. (2008). Bitcoin: A Peer-to-Peer Electronic Cash System.Retrieved from:
https://bitcoin.org/bitcoin.pdf [7] Omar, I. A., Jayaraman, R., Salah, K., Debe, M., & Omar, M. (2020). Enhancing vendor managed inventory
supply chain operations using blockchain smart contracts. IEEE Access, 8, 182704-182719. [8] Solidity Team. (2022). Solidity Programming Language. https://soliditylang.org/ [9] Stadtler H., Kilger C. (2008). Supply chain management and advanced planning: Concepts, models, software
and case studies. Springer. [10] Tapscott D., Tapscott A. (2016). How Blockchain Will Change Organizations. MIT Sloan

10
ETHEREUM REQUEST FOR COMMENT FOR FRACTIONAL OWNERSHIP OF
NON-FUNGIBLE TOKENS
Miroslav Stefanović*1, Đorđe Pržulj
1, Darko Stefanović
1
1University of Novi Sad – Faculty of Technical Sciences
*Corresponding author, e-mail: [email protected]
OBJECTIVE
During the last several years, significant efforts have been put into applying blockchain technology to fields other than cryptocurrency. Currently, one of the main focuses are non-fungible tokens (NFTs). NFTs are intended to represent unique items, like physical property, virtual collectibles, or even “negative value” assets such as loans or burdens. NFTs are implemented through the creation of smart contracts. Smart contracts represent computer programs that are coded and entered into the blockchain and governed by the same rules that apply to all blockchain transactions. Smart contracts allow assets to be automatically transferred according to some predefined rules (Buterin, 2022). The largest blockchain network that was created for the purpose of developing smart contracts/distributed applications is Ethereum. Ethereum had a hash rate of over 1,000,000 GH/s at the time of writing this paper (Etherscan, 2022). In the last couple of years, there has been a surge in the number of smart contracts created for managing NFTs in the Ethereum ecosystem. In mid-2019 around 2,500 smart contracts for managing NFTs existed, while in 2021 that number was 19,000 (Coin Metrics, 2021). Most of the NFTs on the Ethereum network were created by implementing ERC (Ethereum Request for Comment) 721 interface. ERC-721 defines a standard set of APIs, that smart contracts should implement. In this way, created NFTs could be used by other applications too, such as wallets or decentralized exchanges. UML class diagram representing ERC-721 is shown in Figure 1.
Figure 1: UML class diagram representing ERC-721
Although ERC-721 provides the basic functionality needed for applications to manipulate NFTs, one area that is missing is the possibility of fractal ownership. ERC-721 is a solution for a “happy path” where every NFT is owned by only one entity, while in reality, especially when thinking of physical property, it is often owned by multiple entities.
To facilitate this need, the authors propose a new ERC that would solve the problem of fractional ownership.

11
METHODOLOGY
According to (UN Department of Economical and Social Affairs, 2020), 10 out of 12 leading countries in e-government are specifically referencing the application of blockchain technology in this field. An example of the application of NFT in e-government is demonstrated in (Stefanović, Pržulj, Ristić, Stefanović, & Nikolić, 2022) where a smart contract application for managing land administration system transactions is proposed. Real estate transactions represent a real-life example where often multiple entities own a share of ownership in real estate. Following use cases of real estate transfers were recognized as cases that are not supported by ERC-721 “out of the box”:
- multiple entities could share in the ownership;
- entities might have different shares of ownership;
- entities having a share of ownership could transfer less than their share of ownership to another
entity.
It is safe to assume that there is a need to support similar use cases in other domains that deal with physical properties, and even in cases of virtual properties. Based on the concrete implementation of a smart contract and interface presented in (Stefanović, Pržulj, Ristić, Stefanović, & Nikolić, 2022), a proposal for a new ERC with a support fractional ownership of NFTs has been created.
RESULTS
UML class diagram representing new ERC proposal is shown in Figure 2.
Figure 2: UML class diagram representing the new ERC proposal is shown in Figure 2
In the proposed solution, most of the function declarations have been changed:
- balanceOf function now accepted additional parameter representing specific token;
- ownersOf function replaces ownerOf function and returns a collection of addresses representing
token owners;
- safeTransferFrom functions have additional parameter representing the share of ownership;
- approve function has an additional parameter representing the share of ownership; and
- Transfer and Approval events now also have parameters representing a share of ownership.
Example of smart contract that was implemented following this new ERC proposal could be found at address 0xDc7919cbd85ea93370c642d937c9E87DecFa7674 (https://ropsten.etherscan.io/address/0xDc7919cbd85ea93370c642d937c9E87DecFa7674) (Stefanović et al. 2022).
CONCLUSION
By adding a new ERC to Ethereum ecosystem that would have support for fractional ownership of NFTs, the process of creation of smart contracts would be simplified. Currently, the most common methods for

12
developing fractional NFTs are implementing smart contracts that do not “abbey” to any ERC standards or implementing two smart contracts, one that implements ERC-721 to represent NFTs and the other implementing ERC-20, a standard for fungible tokens, to represent ownership. The first proposition creates a problem of interaction with other applications, while the second adds additional complexity to the application.
Keywords: blockchain, Ethereum, smart contract, non-fungible tokens, Ethereum Request for Comment
REFERENCES
[1] Buterin, V., A Next-Generation Smart Contract and Decentralized Application Platform, Retrieved from ethereum.org: https://ethereum.org/en/whitepaper/
[2] Etherscan. (2022, 04 14). Ethereum Network Hash Rate Chart. Retrieved from Etherscan: https://etherscan.io/chart/hashrat
[3] Coin Metrics. (2021, 02 17). Coin Metrics. Retrieved from Coin Metrics: https://cmtv.coinmetrics.io/ [4] UN Department of Economical and Social Affairs. (2020). E-Government Survey 2020 - Digital. New York:
United Nations. [5] Stefanović, M., Pržulj, Đ., Ristić, S., Stefanović, D., & Nikolić, D. (2022). Smart Contract Application for
Managing Land Administration System Transactions. IEEE Access.

13
MANAGING CONSISTENCY LEVELS IN DISTRIBUTED SYSTEMS
Milica Škembarević*1, Slađan Babarogić
1, Olga Jejić
1
1University of Belgrade – Faculty of Organizational Sciences
*Corresponding author, e-mail: [email protected]
OBJECTIVE
One of the main effects of digital transformation in recent years is the amount of data that needs to be stored, processed, and accessed by various people across the world. The high demand for systems that would satisfy the modern market’s needs (especially during and after the COVID-19 pandemic) was the reason for implementing and maintaining distributed systems that would adhere to the latest circumstances. As previously mentioned circumstances change quite often so do the challenges that come along with a rapidly growing industry. One of the main challenges that have arisen was to maintain acceptable consistency levels while also keeping other systems’ qualities at tolerable levels and improving overall performance. A system with inconsistent data does not represent the reality in the way it is supposed to and therefore becomes useless and unreliable. It is also known from the CAP theorem that a distributed system can only fully satisfy two out of the following three characteristics: availability, consistency, and tolerance to network partitions (Brewer, 2000). Obviously if the system is being used in the business environment it needs to perform well in all of the three areas which leads to the implementation of different kind of mechanisms as compensation of the characteristic that is missing. As there is always a trade-off between consistency and other characteristics the purpose of this paper is to convey research on various mechanisms for maintaining acceptable levels of consistency suitable for different situations.
METHODOLOGY
The first step in the research work was to gather information on different ways of maintaining consistency and the principles on which they are based, with special attention to maintaining consistency in distributed databases. This part of the paper consists of a literature review and information was collected from available literature (books, scientific journals, and relevant websites). A starting point for this research were findings from (Kleppmann, 2017; Van Steen & Tanenbaum, 2017; Rafiqul Zaman, 2015). Afterward, a qualitative analysis of these approaches identifies their strengths and weaknesses, risk areas, and potential improvements. Based on the literature, conclusions on good practices for using the studied approaches are also drawn. After that, a study example is presented in the Apache Cassandra database. Apache Cassandra is an open-source, distributed, decentralized, elastically scalable, highly available, fault-tolerant, tuneably consistent, row-oriented database (Hewitt, 2011). The study example involves the presentation and evaluation of the implementation of one of the ways to maintain consistency in the distributed database. The main research questions are the following:
• In which way is maintaining consistency in a distributed system different from a non-distributed system and what are the main principles on which they are based?
• What are the potential advantages and disadvantages and in which situations is it convenient to use or avoid each of these mechanisms of maintaining consistency?
• Is it possible to tune consistency in a distributed system based on the customers’ needs?
RESULTS
The results of this research are descriptions of different ways of maintaining consistency used in distributed systems and providing a critical review of them that serves as a relevant guideline for people interested in this fast-growing field. The comparison between gossip protocol, quorum-based protocols, and anti-entropy protocols is made, along with an analysis of different consistency models and the areas in which their use is suitable for both distributed and non-distributed systems. Special attention was paid specifically to distributed

14
database Apache Cassandra and an explanation was given on maintaining consistency for both data and metadata. Different angles of Cassandra’s mechanisms for maintaining consistency (which include gossip protocol implementation, read repair mechanisms, and use of a Merkle tree combined with SSTables for the purpose of anti-entropy) are given with explanation and analyzed. This paper aims to provide a systematic, critical, and up-to-date overview of existing mechanisms for maintaining consistency and guidance on potential improvements within the research area.
CONCLUSION
The results acquired through this research can be used as a starting point for the understanding of different consistency mechanisms and which one would suit better for a specific situation as well as describing diverse techniques for tuning consistency levels based on the customers’ and market’s requirements. Furthermore, the paper gives practical advice, recommendations, and trade-offs among various consistency levels in distributed systems combined with the aforementioned mechanisms. A possible direction of future research could be implementing described mechanisms in a specific field or domain (such as cryptocurrencies).
Keywords: consistency, distributed systems, NoSQL databases
REFERENCES
[1] Brewer, E. (2000). Towards robust distributed systems. In PODC, 7(10.1145), 343477-343502. [2] Kleppmann, M. (2017). Designing Data-Intensive Applications. O'Reilly Media, Inc. [3] Van Steen, M., & Tanenbaum, A. S. (2017). Distributed Systems, 3rd ed. distributed-systems.net. [4] Rafiqul Zaman, K. (2015). Distributed Computing: An Overview. International Journal of Advanced Networking
and Applications, 7(1), 2630. [5] Hewitt, Е. (2011). Cassandra: The Definitive Guide. O'Reilly Media, Inc.

15
IMPLEMENTATION OF SMART CONTRACTS FOR PAYMENT
TRANSACTIONS ON THE ETHEREUM PLATFORM
Srđan Tripković*1, Dejan Simić
1
1University of Belgrade – Faculty of Organizational Sciences *Corresponding author, e-mail: [email protected]
OBJECTIVE
This paper aims to show advantages and possibilities of use of blockchain and smart contracts in modern day business world in particular for the payment transactions in the process of buying and selling books. The main motive for the study was to present simple smart contract and show how it makes the trade of books simpler.
METHODOLOGY
Ethereum blockchain platform is used to showcase the use of smart contracts. For coding of smart contracts is used Solidity programming language which is the most popular language for the development of smart contracts at the moment. Remix IDE is used as development environment. One smart contract with all the necessary functionalities is made. The aforementioned smart contracts contains functions, structures, variables and events. The main part of the smart contract are events. After finished development, the smart contract is tested by using automated test coded in JavaScript. After the successful testing the smart contract can be deployed to the Ethereum blockchain where it is publicly visible. Due to the current aim of the research being PoC (Proof of Concept), testing in the real world environment is planned to be conducted in the next phase of the research.
RESULTS
Table 1: Comparison of traditional electronic payment systems and payment systems based on blockchain and smart contracts
Traditional Blockchain
Centralized data storage Can be tampered with
Distributed data storage Cannot be tampered with
Small amount of manual inspection
Completely automated
Low efficiency High efficiency
Many intermediaries Point-to-point transmission
Higher transaction costs Lower transaction costs
More time consuming Less time consuming
Complex clearing process Distributed ledger
Easy to leak personal information of users
Use of asymmetric encryption makes personal information more secure
Not safe enough Good safety
The implemented smart contract worked as intended. The whole process is finished faster and more reliably

16
Re-entrancy
Gas limits and loops
Integer overflow and
underflow
Denial of service with
throw
Source code vulnerabilities
Timestamp dependancy
Unchecked calls
Transaction ordering
dependancy
Using send
than in more traditional ways of buying books, mainly in the way that it is almost impossible for buyer not to pay after receiving the book or for buyer to receive money and don’t send the book as these actions are automatically done through the transaction on the Ethereum blockchain. The whole process was shown to be rather fast and the smart contract versatile. As a result of the research it becomes clear that the use of blockchain and smart contracts in this specific case brings improvements as it utilizes blockchain’s trustless system and thus solves one of the main concerns in traditional systems. The decentralization, non-tampering, traceability and other characteristics of the blockchain also allow for the better digital rights management (DRM). Furthermore, comparison of blockchain based payment systems and traditional electronic payment systems is shown in Table 1. There were also Solidity source code vulnerabilities that were encountered throughout the research. These are shown in Figure 1.
Figure 1: Solidity source code vulnerabilities
CONCLUSION
Ethereum and Solidity proved to be reliable choice of development tools. When implemented in the case of books trading they bring advantages such as decentralization, fewer transaction costs, automation. Smart contracts allow for automated payments when the specifically defined condition is fulfilled. This in return brings a sense of security as there is no way for any of the sides not to act according to what is expected of them. They eliminate the need for third party mediators which in turn reduces costs of transaction.
Keywords: smart contract, blockchain, Ethereum, transaction
REFERENCES
[1] Casino, F., Dasaklis, T. K., & Patsakis, C. (2019). A systematic literature review of blockchain-based applications: Current status, classification and open issues. Telematics and Informatics, 36, 55-81. DOI: 10.1016/j. tele.2018.11.006.
[2] Guo, Y., & Liang, C. (2016). Blockchain application and outlook in the banking industry. Financial Innovation. DOI: 10.1186/s40854-016-0034-9.
[3] Huang, Y. X., Wang, B., & Wang, Y. G. (2020). MResearch on Ethereum Private Blockchain Multinodes Platform. In: 2020 International Conference on Big Data, Artificial Intelligence and Internet of Things Engineering (ICBAIE) (pp. 369-372).
[4] Khan, S. N., Loukil, F., Ghedira-Guegan, C. et al. (2021) Blockchain smart contracts: Applications, challenges, and future trends. Peer-to-Peer Networking and Applications, 14, 2901-2925. DOI: 10.1007/s12083-021-

17
01127-0 [5] Bach, L. M., Mihaljevic, B., & Zagar, M. (2018). Comparative analysis of blockchain consensus algorithms. In
2018 41st International Convention on Information and Communication Technology, Electronics and Microelectronics (MIPRO) (pp. 1545-1550). DOI: 10.23919/MIPRO.2018.8400278
[6] Lu, Y. (2019). The blockchain: State-of-the-art and research challenges. Journal of Industrial Information Integration, 15(April), 80-90. DOI: 10.1016/j. jii.2019.04.002
[7] Živadinović, M., Milenković I., & Simić, D. (2017). Using Ethereum smart contracts for creating new crypto currencies. Infotech.
[8] Nakamoto, S., (2008). Bitcoin: a peer-to-peer electronic Cash system. bitcoin.org/bitcoin.pdf [9] Buterin, V. (2014). Ethereum: A Next-Generation Smart Contract and Decentralized Application Platform.
Retrieved from: ethereum.org/669c9e2e2027310b6b3cdce6e1c52962/Ethereum_White_Paper_-_Buterin_2014.pdf.
[10] Wang, Q., Huang, J., Wang, S., Chen, Y., Zhang, P., & He, L. (2020). A Comparative Study of Blockchain Consensus Algorithms. Journal of Physics: Conference Series. 1437. 012007. DOI: 10.1088/1742- 6596/1437/1/012007.
[11] Xianyun G. (2021). Smart Payment Contract Mechanism Based on Blockchain Smart Contract Mechanism. Scientific Programming, 2021, Article ID 3988070. Retrieved from: DOI: 10.1155/2021/3988070
[12] Zhang, S., Yang, Y. G. (2018). The Foundation and Application of Blockchain Technology. Journal of Information Securyity Research, 4: 575-580.
[13] Zheng, Z., Xie, S., Dai, H. N., Chen, W., Chen, X., Weng, J. & Imran, M. (2019). An Overview on Smart Contracts: Challenges, Advances and Platforms. Future Generation Computer Systems, 105. DOI: 10.1016/j.future.2019.12.019.
[14] Zheng, Z., Xie, S., Dai, H. N., Chen, X., & Wang, H. (2018). Blockchain challenges and opportunities: a survey, International Journal of Web and Grid Services, 14(4), 352-375.

18
THE RELATIONSHIP BETWEEN THE CURRENCIES OF OLD AND MODERN
TIMES
Nikola Cvetković*1, Aleksandar Đoković
1
1University of Belgrade - Faculty of Organizational Sciences
*Corresponding author, e-mail: [email protected]
OBJECTIVE
In recent years we have witnessed the increasing use and application of cryptocurrencies such as Bitcoin, Ethereum, Cardano and others on the global market. Unlike traditional currencies which are government backed and derive their value from that endorsement, cryptocurrencies are not covered by any centralized institution. This paper examines if there is an impact of the values of traditional currencies on the value of cryptocurrencies and if the value of cryptocurrencies can be predicted by the values of the traditional ones.
METHODOLOGY
In order to examine the relationship between cryptocurrencies and traditional currencies, data on the values of crypto and traditional currencies for the previous 365 days were taken and the average value of the currency on that day was used. Data for the four cryptocurrencies, Bitcoin (BTC), Ethereum (ETH), Cardano (ADA) and Ripple (XRP) which are the four most popular cryptocurrencies at the time of writing is collected. Also, values for the four traditional currencies such as Euro (EUR), Swiss Franc (CHF), Pound Sterling (GBP) and Japanese Yen (JPY) were collected. All dataset values are presented in the US dollar (USD). In order to analyze data and relations between currencies, Pearson Correlation and Forward Stepwise Regression method were used in this study.
RESULTS
For the analysis of the collected data, IBM SPSS 24 (IBM Corp, 2016) statistical software package was used. In order to examine the relationship between each cryptocurrency and traditional currencies, Pearson Correlation was used since the sample size is large (n>30). Correlation coefficients between currencies are displayed in the Table 1. Table 1: Correlation coefficients between cryptocurrencies and traditional currencies
Correlations EUR CHF GBP JPY
BTC -.193* .199* -.279* -.148* ETH -.452* .226* -.411* -.380* ADA .240* -0.026 .187* .313* XRP .350* -0.183* .099 .318*
Based on the obtained results, we can see that there is a significant statistical relationship between all currencies except between ADA and CHF (sig. 0.369> 0.005) and XRP and GBP (sig. 0.101> 0.005). When examine displayed correlation coefficients, we can see that the highest correlation exists between ETH and EUR (r = -.452) and ETH and GBP (r = -.411), which means that with the increase of EUR or GBP, ETH value decreases and vice versa. Also, the interesting thing is that the correlations between CHF and BTC and CHF and ETH are the only positive coefficients, which means that with increasing CHF value, the values of BTC and ETH increase. When it comes to BTC we can see that the correlation coefficients are slightly lower compared to ETH, which means that traditional currencies generally have a greater impact on ETH compared to BTC. On the other hand, when it comes to ADA and XRP as currencies with significantly lower

19
values, we can see that the sign of the correlation coefficients is reversed compared to BTC and ETH (EUR, GBP and JPY have a positive correlation, while CHF is negative). To answer the research question if the cryptocurrency values can be determined using the values of traditional currencies, multiple linear regression was conducted while each of the four cryptocurrencies was taken as the dependent variable, while traditional currencies are used as independent variables (predictors). The Forward Stepwise Regression method was used, in which predictors are inserted into the model at every step, by adding variables which causes improvement of the current model (Kovačić, 1994). As the first dependent variable BTC has been selected. Based on the obtained results, the only variable that entered the regression model was GBP but the percentage of the explained variance of was very low at 7.8% based on which we can conclude that the value of BTC cannot be predicted using traditional currencies and depends on the different indicators. When it comes to the ETH, slightly better results were obtained. In the first step of regression EUR entered the model and explained 20.4% of total variance, while in the second step CHF has been added to the model which increased the total variance explained to 21.6%. As for the ADA, two variables entered the model, JPY and CHF with the total explained variance of 11.2%. In case of XRP, variables entered the model were EUR, GBP and CHF, where the total explained variance is 24.1%. A summary of the regression models are shown in Table 2. Table 2: Summary of linear regression models using Forward method
Dependent Variable
Variables Entered
R R Squared Sig. F Change
BTC GBP .279 .078 .000 ETH EUR, CHF .226 .216 .033 ADA JPY, CHF .131 .120 .014 XRP EUR, GBP, CHF .254 .241 .046
CONCLUSION
Based on the obtained results, we can conclude that there is a relationship between the value of traditional and cryptocurrencies, but the influence of traditional currencies on the value of cryptocurrencies is very small. When it comes to BTC and ADA, we see that their price almost does not depend on the value of traditional currencies, while the value of ETH and XRP can be predicted by a model that explains a little more than 20% of the variance. The obtained results open many possibilities for further research related to examining the impact of other indicators that can be included in the model in order to increase the success of the model and definition of the model in order to maximize the value of the portfolio by investing in cryptocurrencies and traditional currencies.
Keywords: regression, multivariate analysis, cryptocurrency
REFERENCES
[1] Andrada-Félix, J., Fernandez-Perez, A., & Sosvilla-Rivero, S. (2020). Distant or close cousins: Connectedness between cryptocurrencies and traditional currencies volatilities. Journal of International Financial Markets, Institutions and Money, 67, 101219.
[2] IBM Corp. Released 2016. IBM SPSS Statistics for Windows, Version 24.0. Armonk, NY: IBM Corp. [3] Kovačić, Z. J. (1994). Multivarijaciona analiza. Beograd: Univerzitet u Beogradu, Ekonomski fakultet. [4] Kurka, J. (2019). Do cryptocurrencies and traditional asset classes influence each other?. Finance Research
Letters, 31, 38-46. [5] Yahoo Finance. Price, value, news and history (2022). Retrieved April 15, 2022. Retrieved from:
finance.yahoo.com/

20
BLOCKCHAIN-BASED SOLUTIONS FOR IOT: A SURVEY
Maja Miljanić*1, Bojan Jovanović
1
1 University of Belgrade – Faculty of Organizational Sciences *Corresponding author, e-mail: [email protected]
OBJECTIVE
Internet of Things (IoT) uses a well-known centralized architecture. This architecture consists of
sensing/perception layer, networking layer, middleware layer, application layer, and business layer (Pavithran et al., 2020). Devices (sensors) detect and collect data from the environment and send them to
the middleware layer (Edge) through the network. Edge nodes can preprocess large amounts of data before
transferring them to the central servers in the cloud (Li et al., 2018). The middleware sends the
collected data to the back-end services (application layer) where the data is further processed, stored, and
integrated with smart applications. (Pavithran et al., 2020).
A Blockchain is an immutable, append-only ledger maintained by a peer-to-peer network, where the network
needs to reach a consensus on the transactional data stored on the ledger (Lo et al., 2019). Blockchain can
be consulted openly and fully, allowing access to all transactions that have occurred since the first
transaction of the system, and can be verified and collated by any entity at any time (Reyna et al., 2018).
The goal of this paper is a systematic review of existing articles on both generic and domain-specific
Blockchain-based solutions for IoT. Various Blockchain-based solutions to several IoT problems were
presented in published papers using different architectures, different Blockchain infrastructures and
consensuses. IoT can be improved in different areas using Blockchain: decentralization, autonomy,
reliability, and security. Decentralization involves transition from a centralized to a distributed architecture that will bypass one of centralized systems’ main vulnerabilities - single point of failure. Autonomy implies
direct communication between IoT devices without involvement of any servers (Reyna et al., 2018).
Enhanced security and reliability are the results of Blockchain's key features - decentralization and
immutable data.
METHODOLOGY
We reviewed and analyzed published scientific papers concerning the integration of two concepts - Internet
of Things and Blockchain. Blockchain infrastructures used in integration with IoT are presented with their
advantages and disadvantages, as well as their role in IoT systems, and the way they solve different
problems in IoT systems. Proposed architectures and topologies are described and compared.
RESULTS
Blockchain for IoT can be applied in various fields including supply chain management, healthcare, weather predictions, and food safety (Pavithran et al., 2020).
Analyzed solutions use different Blockchain technologies, for example Ethereum, Hyperledger and IOTA.
Some papers claim permissioned Blockchains, especially Hyperledger Fabric, to be the best Blockchain
technology for integration with IoT (Pavithran et al., 2020; Lo et al., 2019).
Reviewed architectures include IoTChain (Bao et al., 2018), FogBus (Tuli et al., 2019), Blockchain-based Proxy Re-Encryption Scheme (Manzoor et al., 2019), A software defined fog node based distributed Blockchain cloud architecture for IoT (Sharma et al., 2018), as well as domain-specific solutions for smart homes, supply chain management, smart cities, healthcare, and others.

21
CONCLUSION
Major vulnerabilities of IoT systems include single point of failure due to centralized architecture, data
privacy and integrity. Blockchain and IoT integration imposes certain challenges – privacy and security,
limited computational power of IoT devices, identity management, and interoperability among IoT platforms (Pavithran et al., 2019; Lo et al., 2019). Existing solutions succeeded to overcome many of the listed
vulnerabilities and challenges, leaving room for further research, considering that both IoT and Blockchain
are very popular technologies that will most likely last.
Keywords: IoT, Blockchain, Internet of Things, identity management
REFERENCES
[1] Bao, Z., Shi, W., He, D., & Chood, K. K. R. (2018). IoTChain: A three-tier blockchain-based IoT security architecture. arXiv preprint arXiv:1806.02008. DOI:10.1016/j.future.2018.05.046
[2] Li, H., Ota, K., & Dong, M. (2018). Learning IOT in edge: Deep learning for the internet of things with Edge Computing. IEEE Network,32(1), 96-101. DOI:10.1109/mnet.2018.1700202
[3] Lo, S. K., Liu, Y., Chia, S. Y., Xu, X., Lu, Q., Zhu, L., & Ning, H. (2019). Analysis of Blockchain Solutions for IOT: A systematic literature review. IEEE Access,7, 58822-58835. DOI:10.1109/access.2019.2914675
[4] Manzoor, A., Liyanage, M., Braeke, A., Kanhere, S. S., & Ylianttila, M. (2019). Blockchain based proxy re- encryption scheme for secure IOT Data sharing. 2019 IEEE International Conference on Blockchain and Cryptocurrency (ICBC). DOI:10.1109/bloc.2019.8751336
[5] Pavithran, D., Shaalan, K., Al-Karaki, J. N., & Gawanmeh, A. (2020). Towards building a blockchain framework for IOT. Cluster Computing,23(3), 2089-2103. doi:10.1007/s10586-020-03059-5
[6] Reyna, A., Martín, C., Chen, J., Soler, E., & Díaz, M. (2018). On blockchain and its integration with IOT. challenges and opportunities. Future Generation Computer Systems,88, 173-190.
[7] Sharma, P. K., Chen, M., & Park, J. H. (2018). A software defined fog node based distributed blockchain cloud architecture for IOT. IEEE Access,6, 115-124. DOI:10.1109/access.2017.2757955
[8] Tuli, S., Mahmud, R., Tuli, S., & Buyya, R. (2019). FogBus: A Blockchain-based lightweight framework for Edge and fog computing. Journal of Systems and Software, 154, 22-36. DOI:10.1016/j.jss.2019.04.050

22
ON THE USE OF SCHEDULED CONSENSUS IN BUSINESS
APPLICATIONS
Boris Damjanović*1, Dragan Korać
2, Negovan Stamenković
3
1University of Union – Nikola Testa
2University of Banja Luka – Faculty of Natural Sciences and Mathematics
3University of Pristina – Faculty of Sciences and Mathematics
*Corresponding author, e-mail: [email protected]
OBJECTIVE
In business applications, there is often a need for all nodes to initiate an action at the same time. In this article, we will deal with the development of a consensus algorithm that should ensure the scheduling of an event in the near future.
METHODOLOGY
In this article, we consider the possibilities of reaching a scheduled consensus of all nodes participating in the vote. If we represent a computer network using a graph, we consider two cases: a complete graph and a connected cyclic graph. Two phases - prepare and commit and multi-round voting are used to develop non-uniform consensus algorithm to schedule some transaction in near future. In boath phases, each node that receives a packet containing the transaction, scheduled time, and voting status array, records transaction and scheduled time and merges and records the voting status in its own array (called homeArray) in its memory. If the scheduled execution time of the transaction expires during the execution of any phase of the algorithm, transaction is canceled by all nodes. Then binary exponential delay is used to increase the delay interval, so the algorithm starts working again from the beginning.
RESULTS
This paper presents a non-uniform distributed consensus algorithm to schedule the execution time of some transaction. This algorithm can be used in a business application to schedule some change to an asset or to schedule a change on a server that has its own clients, like POS terminals .
CONCLUSION
We have presented a non-uniform distributed consensus algorithm to schedule the execution time of some transaction. As shown, this algorithm can be used in some business applications where there is a need to establish a consensus on the simultaneous start of a transaction.
Keywords: blockchain, consensus, algorithm, distributed computing
REFERENCES
[1] Andoni, M., Robu, V., Flynn, D., Abram, S., Geach, D., Jenkin, D., . . . Peacockd, A. (2019). Blockchain technology in the energy sector: A systematic review of challenges and opportunities. Renewable and Sustainable Energy Reviews, Volume 100, 143-174.
[2] Antonopoulos, A. (2015). Mastering Bitcoin, UNLOCKING DIGITAL CRYPTOCURRENCIES. Sebastopol, CA: O’Reilly Media, Inc.

23
[3] Arnold, R., & Longley, D. (2021). Continuity: A deterministic Byzantine fault tolerant asynchronous consensus algorithm. Computer Networks, Volume 199.
[4] Barbosa, C. (1996). An Introduction to Distributed Algorithms. Cambridge, Massachusetts: The MIT Press, . [5] Benisi, N., Aminian, M., & Javadi, B. (2020). Blockchain-based decentralized storage networks: A survey.
Journal of Network and Computer Applications. [6] Bondy, J., & Murty, U. (1982). GRAPH THEORY WITH APPLICATIONS. New York • Amsterdam • Oxford:
NORfH-HOLLAND. [7] Buterin, V. (2013). Ethereum White Paper - A NEXT GENERATION SMART CONTRACT & DECENTRALIZED
APPLICATION PLATFORM. [8] Damilare , P., Je , S., Jamil , N., & Alawida , M. (2021). Blockchain Consensus: An Overview of Alternative
Protocols. Symmetry 13, no. 8:. [9] Fischer, M., Lynch, N., & Paterson , M. (1985). Impossibility of Distributed Consensus with One Faulty Process.
Journal of the ACMVolume 32Issue 2, 374–382. [10] Hu, C., Kim, H., & Hou, J. (2005). An Analysis of the Binary Exponential Backoff Algorithm in Distributed MAC
Protocols. Report No. UIUCDCS-R-2005-2599 .
[11] Karajovic, M., Kim, H., & Laskowski, M. (2019). Thinking Outside the Block: Projected Phases of Blockchain. Australian Accounting Review.
[12] Kaushik, A., Choudhary, A., Ektare, C., & Thomas, D. (20187). Blockchain – Literature Survey. 2017 2nd IEEE International Conference On Recent Trends in Electronics Information & Communication Technology (RTEICT).
[13] Lu, Y. (2018). Blockchain: A Survey on Functions, Applications and Open Issues. Journal of Industrial Integration and ManagementVol. 03, No. 04.
[14] Nakamoto, S. (2008). Bitcoin: A Peer-to-Peer Electronic Cash System. [15] Novo, O. (2018). EEE Internet of Things Journal, vol. 5, no. 2,, 1184-1195. [16] Pahlajani, S., Kshirsagar, A., & Pachghare, V. (2019). Survey on Private Blockchain Consensus Algorithms. 1st
International Conference on Innovations in Information and Communication Technology. IEEE. [17] Panarello, A., Tapas, N., Merlino, G., Longo, F., & Puliafito, A. (2018). Blockchain and IoT Integration: A
Systematic Survey. Sensors 2018, 18(8).
[18] Puthal, D., Mohanty, S., Yanambaka, V., & Kougianos, E. (2020). PoAh: A Novel Consensus Algorithm for Fast Scalable Private. ArXiv.
[19] SAYADI, S., BEN REJEB, S., & CHOUKAIR, Z. (2018). Blockchain Challenges and Security Schemes: A Survey. Seventh International Conference on Communications and Networking (ComNet). IEEE.
[20] Tel, G. (2001). Introduction to Distributed Algorithms. Cambridge University Press. [21] Van Renesse, R. (2019). Asynchronous Consensus Without Rounds. ArXiv. [22] Vukolć, M. (2016). The Quest for Scalable Blockchain Fabric: Proof-of-Work vs. BFT Replication. Open
Problems in Network Security. Springer. [23] Wattenhofer, R. (2014). Principles of Distributed Computing. Zurich: ETH Zurich. [24] Wattenhofer, R. (2017). Distributed Ledger Technology: The Science of the Blockchain, Second Edition.
CreateSpace Independent Publishing Platform. [25] Wilson, R. (1996). Introduction to Graph Theory Fourth edition. Longman.

24
BIOMETRIC AUTHENTICATION MODEL IN ELECTRONIC PAYMENT SYSTEM BASED
ON BLOCKCHAIN TRANSACTIONS
Nenad Badovinac*1, Dejan Simić
1
1University of Belgrade – Faculty of Organizational Sciences *Corresponding author, e-mail: [email protected]
OBJECTIVE
By applying the PKI infrastructure, blockchain transactions are protected against forgery by adding a digital signature. A user needs to keep his Private Key on a software or hardware token that should be available to him/her at the time of signing the blockchain transaction. Blockchain technology enables the operation of payment systems without the need of a third-party payment verifier. In the paper Je-Gyeong Jo et al: “Biometric Digital Signature Key Generation and Cryptography Communication Based on Fingerprint” a biometric private key creation model serves to digitally sign a blockchain transaction. The synthesis of Blockchain technology, which removes the obligation to have a third-party transaction validator from the electronic payment model, and biometric technology, enables the signing of a blockchain transaction without tokens, improving the existing payment card systems. Three contributions have been made in this paper. First, it has been shown that blockchain transactions can be digitally signed with biometrically generated PKI keys. Second, a comparative analysis of the biometrically based digital signature models described in the available literature is presented, and finally a biometric authentication model in electronic payment systems without a third-party transaction validator using biometrically signed blockchain transactions is presented.
METHODOLOGY
The blockchain network enables instant money transfer without banking intermediaries (Aneesh et al., 2021). Blockchain technology is used to authenticate electronic payment users using the PKI digital signature infrastructure (Godfrey-Welch et al., 2018). In the scientific paper (Oday, 2020), the FIBS scheme and biometric data are applied in the process of digital signing of blockchain transactions. After researching the available literature, digital signature models that use the FIBS scheme and biometric data in the process of creating private and public keys were analyzed. After the analysis, Table 1 was created, which presents the characteristics of newer models of biometrically based digital signatures.
RESULTS
Blockchain technology can be implemented in innovative electronic payment systems that use a biometric, instead of the conventional PKI infrastructure model (Oday, 2020). Table 1 shows FIBS schemes and their cryptographic techniques and characteristics. The analyzed models enable a digital signature that is used to create a blockchain block in an electronic payment transaction (Godfrey-Welch et al., 2018).
Table 1: Comparative analysis of biometric authentication models with FIBS scheme
Autors Cryptographic technique and characteristics
Shan et al., 2021. The model uses bilinear pairing and a Fuzzy extractor. Safety is based on the Diffie Hellman (CDH) problem.
Xiaojun et al., 2017. The model is impenetrable in ROM environments and EU-ACMIA identity attacks. Oday et al., 2020. The model uses bilinear pairing. Effective in message attack.
Kenta et al., 2019. The model uses the Diffie – Hellman key exchange protocol. Applies the Hamming distance used in IRIS biometric characteristics.
Yanhua et al., 2019. The model is impenetrable in ROM environments and SU-sID-CMA identity attacks.

25
In the paper (Shan et al., 2021) a comparison of two FIBS models was made. The characteristics of the first is that it tolerates the error using the Lagrange polynomial, while the second with the Fuzzy extractor corrects the error. The paper shows that their model has the lowest communication costs than other models that are compared. The authors suggest that their schemes be implemented in environments where computing resources are limited. The authors (Xiaojun et al., 2017) present their FIBS scheme that can be applied in a post-quantum cryptographic communication environment in which the fingerprint and iris are used. The authors in (Oday et al., 2020) present their model that uses multimodal biometrics to increase security. The authors in their FIBS scheme presented in (Kenta et al., 2019) use the PKI function of revoking a certificate and reissuing it. The authors in (Yanhua et al., 2019) presented their FIBS scheme and show that it is the fastest of those available in the scientific literature to date.
CONCLUSION
The results of the research of FIBS schemes show their characteristics that will be used in the implementation of the Biometric authentication model of electronic payment based on blockchain transactions. For different electronic payment systems, such as POS device, ATM machine or Mobile payment, it is necessary to choose the variant of the FIBS scheme, which will show the best security and speed performance in a given environment. This will enable a stronger user experience with the new electronic payment model with biometrically digitally signed blockchain transactions.
Keywords: Blockchain, digital signatures, biometric digital key, electronic payment.
REFERENCES
[1] Aneesh, Z., Grilo, A., & Nodehi, T. (2021). The value proposition of blockchain technologies and its impact on Digital Platforms, Department of Mechanical and Industrial Engineering at NOVA School of Science and Technology, Universidade Nova de Lisboa, Portugal. DOI: 10.1016/j.cie.2021.107187
[2] Godfrey-Welch, D., Remy L., & Jared L. (2018). Blockchain in Payment Card Systems. Southern Methodist University, Dallas, Texas 75205
[3] Kenta, T., Takahiro, M., Takao, M., Goichiro, H., & Masakatsu, N. (2019). Signature schemes with a fuzzy private key, International Journal of Information Security. DOI: 10.1007/s10207-019-00428-z
[4] Oday, A. H.n, Ansam, A. A., Saad, M. D., Zulaiha, A. O., Sabrina, T., & Yasmin, A. L. (2020). Towards a Secure Signature Scheme Based on Multimodal Biometric Technology: Application for IOT Blockchain Network, 12, 1699; DOI: 10.3390/sym12101699
[5] Shan, X., You L., & Hu, G., (2021). Two Efficient Constructions for Biometric-Based Signature in Identity-Based Setting Using Bilinear Pairings. DOI: 10.1109/ACCESS.2021.3057064.
[6] Xiaojun, Z., Chunxiang, X., & Yuan, Z. (2017). Fuzzy identity-based signature scheme from lattice and its application in biometric authentication, Ksii Transactions on Internet and Information systems, 11(5), 2762. DOI: 10.3837/tiis.2017.05.025
[7] Yanhua, Z., Yupu H., Yong, G., Yifeng, Y., & Huiwen, J. (2019). Efficient fuzzy identity-based signature from lattices for identities in a small (or large) universe. Journal of Information Security and Applications, 47. DOI: 10.1016/j.jisa.2019.04.012

26
A METHODOLOGICAL APPROACH FOR CONVERTING RELATIONAL TO GRAPH
DATABASES
Stefan Krstović*1, Ognjen Pantelić
1, Ana Pajić Simović
1
1University of Belgrade – Faculty of Organizational Sciences *Corresponding author, e-mail: [email protected]
OBJECTIVE
Graph databases are better for data containing many relationships, and are most common with social networks and similar information systems. Many systems that would benefit from using graph databases do not utilize them. This paper aims to increase their adoption rate by streamlining the migration process. The main question answered in this paper is which steps should be taken to reliably and consistently transfer data from a relational DBMS (DataBase Management System) to a graph DBMS. A demonstration of the transfer is provided, along with a comparison between queries in the two environments. Microsoft Access is used to manage the relational database, while Neo4j and the Cypher query language are used for the graph database. The approach can be used by institutions and companies to make their information systems better suited to their work areas.
METHODOLOGY
The starting point was developing a theoretical approach to transferring data between the systems. Previous research, notably by Virgilio, Roberto & Maccioni (2013) influenced this development phase. The approach was refined by applying the proposed steps to the Northwind demo database from Microsoft (Microsoft, 2019). Afterwards, all of the data was migrated. The database overview is provided in Figure 1.
Figure 1: The overview of the database used
The last step was to compare the queries between the two systems to determine the superior simplicity, efficiency and clarity of graph queries.

27
RESULTS
The approach discovered can be divided into 3 major sections: 1. Preparing the initial database. This step brings the database into a desired state and helps discover
its characteristics, primarily how the entities relate to one another and which dependencies exist.
2. Loading and properly connecting the data in the graph system. The dependencies and relationships discovered during the previous step should be used to determine how the connections should be implemented in the graph database. The join table (which stores the many-to-many relationship data between two tables) can be swapped for a set of relationship entities in the graph DBMS. Entities of the same type can have varying attributes without the need for separation, unlike in the RDBMS.
3. Optimizing the resulting graph database. Some artefacts that remain in the system are redundant after the conversion and should be removed to reduce bloat and minimize the chance for future mistakes. These include join tables and foreign key attributes (as their function is performed by the relationship entities).
The SQL queries are more complex, difficult to write and error-prone. Their Cypher equivalents are simpler, as the relationship patterns required can be described through ASCII art, rather than JOIN statements. The more tables required for the query, the higher the discrepancy. In addition, the user can easily request a graphical representation of the results, so insights can be inferred at a glance. Figure 2 is an example of how buyers and the products they bought, connected by the orders, could be represented graphically.
Figure 2: A graphical representation of buyers and the products they bought
CONCLUSION
The steps laid out previously provide a clear path to migrating data between the two systems. Unlike the approaches described in other literature (Virgilio et al., 2013; Ramachandran, 2015) which outline a more general procedure, this paper defines specific recommendations for dealing with different cardinalities and removing redundancies. The limitation of this study, which will be addressed in future work is the automation of the migration process, so that the user could provide only the minimum necessary information, and a software tool could take care of the rest.
Keywords: relation, graph, database, conversion

28
REFERENCES
[1] Virgilio, R., Maccioni, A., Torlone, R. (2013). Converting relational to graph databases. First International Workshop on Graph Data Management Experiences and Systems. DOI: 10.1145/2484425.2484426.
[2] Lazarević, B., Marjanović Z., Aničić N., Babarogić S. (2016). Baze podataka (Databases). Faculty of organizational sciences, University of Belgrade.
[3] Microsoft. (2019). Get the sample databases for ADO.NET code samples. Retrieved from docs.microsoft.com/en-us/dotnet/framework/data/adonet/sql/linq/downloading-sample-databases (Accessed 1.2.2022)
[4] Lutkevich B., Biscobing J. (2021). Relational database. Retrieved from searchdatamanagement.techtarget.com/definition/relational-database (Accessed 4.2.2022)
[5] IBM Cloud Education. (2021). Structured vs. Unstructured Data: What’s the Difference? Retrieved from: www.ibm.com/cloud/blog/structured-vs-unstructured-data (Accessed 3.2.2022)
[6] Neo4j. (n.d.). Model: Relational to Graph. Neo4j Developer. Retrieved from: neo4j.com/developer/relational-to-graph-modeling/ (Accessed 25.1.2022)
[7] Ramachandran, S. (2015). GRAPH DATABASE THEORY, Comparing Graph and Relational Data Models. LambdaZen.
[8] Ugander, J., Karrer, B., Backstrom, L., & Marlow, C. (2011). The anatomy of the Facebook social graph. arXiv preprint arXiv:1111.4503.
[9] Codd E. F. (1970). A relational model of data for large shared data banks. Commun. ACM 13, 6 (June, 1970), pp. 377-387. DOI: 10.1145/362384.362685
[10] Foote K. (2017). A brief history of database management. Dataversity. Retrieved from www.dataversity.net/brief-history-database-management/

29
OVERVIEW OF NON-FUNGIBLE TOKEN SYSTEMS
Jelica Stanojević*1, Uroš Šošević
1, Velimir Štavljanin
1
1University of Belgrade – Faculty of Organizational Sciences
*Corresponding author, e-mail: [email protected]
OBJECTIVE
By applying the ideas behind the blockchain to the aspects beyond the replacement of physical money with digital currencies, the development of digital business in the market of various goods is accelerated. The COVID19 pandemic has accelerated digitalization in all industries, which also affects the need to ensure the uniqueness and proof of ownership of digital assets (Popescu, 2021). Ethereum, as one of the most popular blockchain implementations, has contributed to the expansion of decentralized applications (DApps), especially through the concept of smart contracts. Non-fungible token (NFT) is based on the mentioned concepts and in contrast to cryptocurrencies (e.g. Bitcoin, Ethereum), which represent fungible tokens where each coin has the same value as the other, it is a type of crypto token whose value is unique, and therefore not mutually fungible. Significant growth of the NFT Market was observed in 2021 compared to the previous year, when the number of total active wallets increased drastically and at the beginning of 2022 their number was over two and a half million (NonFungible Corporation, 2022). Ethereum is still the main blockchain for NFTs with 76% of total market volume in Q1 of 2022, followed by Ronin with 19%, Flow 5% (NonFungible Corporation, 2022) and Solana which is starting to take over the market due to lower fees and energy consumption compared to others (Howell, 2022). Currently, main drivers of NFT adoption are games and metaverses like CryptoKitties, The Sandbox, AxieInfinity or, Decentraland. This basic usage of NFTs is also expanding to some new use cases, such as proving ownership of digital and non-digital goods like arts, collectibles, audio and video recordings. It is important to mention that NFTs are also being used to represent the ownership of signatures, legal documents and event tickets (e.g. EXIT and Coachella Festival collections) (Ethereum Community, 2022) which give special benefits to their holders and even access to events. Based on their increasing importance and usage, it can be concluded that there is a need for analysis and systematization of concepts that are powering the implementation of NFT systems.
METHODOLOGY
Methodology that was used includes the analysis of scientific and professional literature concerning the technical aspects of blockchain and NFT systems, as well as the official documentation of existing blockchain protocols. Taking into account the host of NFTs, crypto space, analyzing relevant Twitter accounts and Discord communities was included in the methodology. The building blocks of NFT systems and the technologies needed for their implementation are identified and described. Possible system design patterns, protocols used, ecosystem participants and their interaction are also presented.
RESULTS
The key building blocks of an NFT system are blockchain, storage system, and web application. In its essence the NFT system is actually a blockchain-based application (Wang et al., 2021). Even though it is possible to store NFT metadata on-chain, so that external storage component is not mandatory, expensive cost and blockchain storage limits cause that many projects use off-chain storages which can be distributed like IPFS, Pinata or Filecoin (Bamakan et al, 2021) or centralized like Amazon S3 (Das et al., 2022). Ethereum is the main blockchain behind NFT and has introduced standards that are crucial for

30
understanding and development of Ethereum NFTs, like Token Standard ERC-20, Non-Fungible Token Standard ERC-721 and Multi Token Standard ERC-1155. Within the systematization of the NFT ecosystem anatomy by Das et al. (2022), previously defined building components can be observed. Creators can upload their work to an external hosting service, create NFT and offer it on the NFT market through a web application from which transactions are sent to smart contracts on their behalf. Possible design patterns of the NFT paradigm defined by Wang et al. (2021) are:
● top-down, in which at first digitized NFT data is stored on an external database by the creator and then NFT is generated through the appropriate smart contract transaction,
● bottom-top, in which the NFT template is firstly prepared through a smart contract based on which each user can create their own unique NFT so that after bidding for it he can adjust its additional functionality.
Users of this system can be grouped as creators, sellers which aren't mandatory and buyers/owners of NFT, but the buyer in the bottom-up pattern can also be the creator because of the way NFT is generated. The Ethereum community has published a tutorial (Mudgil, 2021) for the creation of NFT and its deployment on the Ropsten test network. The steps correspond to the top-down approach described by Wang et al. (2021). Bamakan et al. (2021) define a layered framework for working with patents based on NFTs. Layers include storage, authentication, verification, blockchain, and application. In the field of online gaming Muthe et al. (2020) propose a protocol for the decentralization of gaming infrastructure which supports the concept of decentralized NFT management in the manner that NFTs are bound to in-game objects through metadata. (Regner et al., 2019) created a prototype of the NFT event ticketing system in which the tickets themselves are NFTs.
CONCLUSION
NFT systems are a relative novelty in the crypto space, which has felt a significant expansion in 2021, so the academic community has begun to slowly analyze and systematize them. As it is in its rise, the field of NFT systems has the potential for further research of possible use cases with focus on real-world problems.
Keywords: Non-fungible token, Blockchain, Smart contracts, DApps
REFERENCES
[1] Bamakan, S. M. H., Nezhadsistani, N., Bodaghi, O., & Qu, Q. (2021). A Decentralized Framework for Patents and Intellectual Property as NFT in Blockchain Networks [Preprint]. In Review. DOI:
https://doi.org/10.21203/rs.3.rs-951089/v1 [2] Das, D., Bose, P., Ruaro, N., Kruegel, C., & Vigna, G. (2022). Understanding Security Issues in the NFT
Ecosystem. ArXiv:2111.08893 [Cs]. Retrieved from arxiv.org/abs/2111.08893 [3] Ethereum Community. (2022, March). Non-fungible tokens (NFT). Retrieved March 9, 2022, Retrieved from:
ethereum.org/en/nft/ [4] Howell, I. (2022, April 7). Everything You Need to Know About the Solana Blockchain and NFTs. Retrieved April
27, 2022. from nftnow.com/guides/everything-you-need-to-know-about-the-solana-blockchain-and-nfts/ [5] Mudgil, S. (2021, April 22). HOW TO WRITE & DEPLOY AN NFT. Retrieved April 10, 2022. Retrieved from
ethereum.org/en/developers/tutorials/how-to-write-and-deploy-an-nft/ [6] Muthe, K. B., Sharma, K., & Sri, K. E. N. (2020). A Blockchain Based Decentralized Computing And NFT
Infrastructure For Game Networks. 2020 Second International Conference on Blockchain Computing and Applications (BCCA), 73–77. Antalya, Turkey: IEEE. DOI: https://doi.org/10.1109/BCCA50787.2020.9274085
[7] NonFungible Corporation. (2022). Yearly NFT Market Report 2021. [8] Popescu, A.-D. (2021). Non-Fungible Tokens (NFT) – Innovation beyond the craze. 5th International
Conference on Innovation in Business, Economics and Marketing Research, 66, 6. [9] Regner, F., Schweizer, A., & Urbach, N. (2019). NFTs in Practice – Non-Fungible Tokens as Core Component
of a Blockchain-based Event Ticketing Application. 17. [10] Wang, Q., Li, R., Wang, Q., & Chen, S. (2021). Non-Fungible Token (NFT): Overview, Evaluation, Opportunities
and Challenges. ArXiv:2105.07447 [Cs]. Retrieved from arxiv.org/abs/2105.07447

31
A COMPARATIVE ANALYSIS OF THE HUMAN RESOURCES MODULE IN OPEN-
SOURCE ERP SYSTEMS
Milica Masal*1, Srđa Bjeladinović
1
1University of Belgrade – Faculty of Organizational Sciences *Corresponding author, e-mail: [email protected]
OBJECTIVE
The paper aims to analyse the open-source ERP systems as a support process for selecting an appropriate solution and its HR (Human Resources) module. The activities in the HR business function are: job posting, selecting, training, evaluating performance and rewarding employees (Ghag, 2012). The ERP alternatives chosen for comparison are Odoo, Dolibarr and ERPNext. The paper's contribution reflects the definition of criteria and sub-criteria of comparison, practical testing of use cases in the HR module, application of the AHP (Analytic Hierarchy Process) method, presentation of achieved results and sensitivity analysis.
METHODOLOGY
The comparative analysis of selected ERP systems used the AHP method in the Expert Choice tool. It is a
method of multidimensional decision-making based on a mutual comparison of alternatives according to
defined criteria using the Saaty scale (Saaty, 1980).
In the first step, the defined problem model included the specification of the goal and all relevant criteria.
After that, sub-criteria were added. In the next step, a comparison of couples of items for each hierarchy
level was performed. Calculating alternatives' local priorities concerning defined criteria with sub-criteria were
the next step. Conduction of the sensitivity analysis of the solution was, to check the stability and reliability of
the results (Lapaš, 2016) was the final step.
The chosen combination of criteria and given assessments have a foundation in the analysis of criteria and
their importance by authors in the field (Fougatsaro, 2009; Wang & Wang, 2014), experiential work with
selected ERP systems and practically conducted functional tests of HR modules of each ERP. Gathered
results present one possible outcome of the application of the AHP method. The criteria with sub-criteria
selected in this paper are:
Modularity and functionality (existence and functionality of the sub-module employees, costs, leisure,
recruitment, attendance)
Customer support (quality and availability of documentation, community activity)
Interoperability (availability and supported file extensions for upload and download)
User-friendliness and ergonomics (ease of use, user interface, internationalisation)
Costs (free sub-modules of the human resources module, purchase and use costs per user per
month, implementation costs)
Security (password security, secure client communication, regular security check (audit), URL
access ban)
Grades were given based on practical tests, a detailed study of the manufacturer's documentation and
research by the mentioned authors.

32
RESULTS
Figure 1 shows how important is each criterion compared to others. Figure 1 b) shows the criterion weight.
a) b)
Figure 1: a) Criteria importance compared to each other b) Criterion weight
According to the stated criteria, Odoo represents the first choice with a weight of 0.412. ERPNext took
second place with a weight of 0.377. The third-place took the Dolibarr with a weight of 0.211. Figure 2
provides an overview of Performance sensitivity analysis showing the behaviour of alternatives against all
criteria. The X-axis contains criteria, and Y-axis includes alternatives.
Figure 2: Performance sensitivity analysis of alternatives by criteria
In addition, Dynamic, Gradient, head-to-head, and 2D sensitivity analyses have shown the stability and
reliability of the obtained results.
CONCLUSION
Considering a single criterion, the ERPNext achieved the best result in HR module modularity and functionality and costs. At the same time, Odoo has the best customer support, security, user-friendliness and ergonomics. For the criterion of Interoperability, all three alternatives achieved equally good results. Based on all the criteria and the defined weights, the analysis outcome showed that a complete solution is Odoo ERP, followed by ERPNext. Due to the lack of an adequate sample, the average implementation time did not take part as a criterion. Its inclusion in the analysis is a possible direction for further research.
Keywords: ERP, human resources module, comparative analysis, AHP

33
REFERENCES
[1] Fougatsaro, V. (2009). A Study of Open Source ERP Systems. [Master thesis, School of Management, Blekinge Institute of Technology, Blekinge].
[2] Ghag, N. (2012). Enterprise Resource Planning & HRM. [Symbiosis International University, India]. [3] Lapaš, T. (2016). Komparativna analiza poslovnih informacijskih sustava otvorenog koda. [Diplomski rad,
Sveučilište u Zagrebu, Fakultet organizacije i informatike, Varaždin] Repozitorij Fakulteta organizacije i informatike.Retriewed from: repozitorij.foi.unizg.hr/islandora/object/foi:977
[4] Saaty, T. (1980). The analytic hierarchy process. McGraw Hill, New York.
[5] Wang, S. & Wang, H. (2014). A Survey of Open Source Enterprise Resource Planning (ERP) Systems. International Journal of Business and Information, 9(1), 1-28. DOI: 10.6702/IJBI.2014.9.1.1

34
BLOCKCHAIN IN IDENTITY MANAGEMENT - A SURVEY
Bojan Marčeta*1, Marija Bogićević Sretenović
1
1University of Belgrade – Faculty of Organizational Sciences *Corresponding author, email: [email protected]
OBJECTIVE
The purpose of this paper is to show the possibilities of applying blockchain technology in identity management. Although secure information exchange is possible through centralized systems, there are still concerns about the protection of confidential data of individuals. Bearing in mind that we leave different information about ourselves and about our activities on the Internet on daily basis and that this data is collected without our knowledge, it is clear that we need to focus our attention on protecting the digital identity of each individual (Rathee & Singh, 2021). To achieve the security and privacy of scattered digital identities of individuals, it is necessary to authenticate and verify the digital identities of individuals. Management and verification of digital identities is perhaps the most important area of application of blockchain technology. According to official data, in 2017, 16.7 million people in the United States were victims of identity theft, which resulted in financial damage for of 16.8 billion dollars (König et al., 2017). Millions of people around the world have been threatened by leaks of data containing the personal information of individuals. Online authentication systems are still based on centralized databases managed by third parties who can manipulate the same data without the user's permission (Moyle et al., 2017). The possibility of identity theft creates a sense of anxiety requiring urgent application of highly effective identity management systems. More safe methods of storing and exchanging sensitive data need to be developed. The application of blockchain technology can help solve the mentioned issues which are present in centralized systems. The majority of today's population has some form of digital identity as a result of a significant amount of time spent online. Traditional methods for identity and access management are designed to be convenient for
service providers, but not for the users themselves, who are forced to remember a large number of passwords to access different services. In research papers, there is a categorization of identity management systems into three groups: isolated IdM, federated IdM, and Central IdM (Bogićević et al., 2014; Einterz et al,
2014).
Blockchain technology is known for its security. Due to the lack of a centralized location where data is stored,
the blockchain is resistant to cyber-attacks. In addition, this technology records all transactions between the owner of the identity and the company, which guarantee full transparency at all times. Blockchain technology
gives individuals the freedom to establish an encrypted identity that can be quickly and easily accessed through mobile applications which can be used for authentication when needed (Decentralized Digital Ledger) (Czarnuch & Mihailidis, 2011). Blockchain involves creating a public, verifiable and open record of
transactions that can be accessed by anyone.
Since DLT (Digital Ledger Technology) provides consensus, transparency, and integrity of transactions, it is
clear which benefits this technology can bring if applied in identity management. These are: (a) decentralization; (b) tamper-resistant; (c) cost-saving; (d) user control; (e) inclusiveness. (Dunphy & Petitcolas, 2018) state that all proposals for the application of DLT-based identity management
systems can be divided into two categories:
self-sovereign identity - an identity owned and controlled by its owner without the need to rely on any external administrative authority and without the possibility of identity theft. Examples are Sovrin,
uPort, and OneName;

35
decentralized trusted identity - an identity provided by a centralized service that verifies the identity of users based on existing trusted credentials (eg passports) and records DLT authentications for
later validation by third parties. Examples are ShoCard, BitID, ID.me, and IDchainZ.
METHODOLOGY
The most important features of the uPort, Sovrin, and ShoCard systems are briefly described below. uPort (Lundkvist et al., 2017) is a decentralized, open-source identity management framework that aims to provide a “decentralized identity for all”. It is used for next-generation decentralized IdM applications on Ethereum DLT and traditional centralized applications such as email and banking. uPort identity is supported by interactions between Ethereum smart contracts. Ethereum is the platform most commonly used in blockchain applications (Liu et al., 2020). Triggered smart contracts are executed on the EVM (Ethereum Virtual Machine) which is installed on each Ethereum node. Each uPort identity consists of a controller and a proxy; two smart contract templates created by uPort. uPort does not have a central server and does not authenticate the owner of uPortID. This leaves the possibility of unauthorized access to local authentication methods on the user's mobile device. Commercial applications can publish their uPortID, but uPort does not provide a public directory for searching uPortIDs based on search criteria (Ali et al., 2016).
Figure 1: An overview of key elements of uPort (Dunphy & Petitcolas, 2018)
Sovrin (Tobin et al., 2017) is a decentralized open-source identity network built on an approved DLT. Sovrin is public, but it contains only trusted institutions, which are called stewards - which can be banks, universities, governments, etc. The Sovrin non-profit foundation ensures the management of stewards and their compliance with a legal agreement called the Sovrin Trust Framework. Sovrin provides the code base for the Hyperledger Indy project. Sovrin allows the user to generate as many identifiers as necessary to maintain contextual separation of identities for privacy purposes. Each identifier is unrelated and is controlled by a different asymmetric key pair. A key element of the architecture is the Sovrin ledger. Users communicate with Sovrin through a mobile application and control software agents acting on their behalf to facilitate interaction with other agents online. Agents are network endpoints that are always available. The mobile application also helps users to manage cryptographic keys, which are stored on the user's mobile device. As in uPort, Sovrin offers a key recovery mechanism that relies on the user to select a set of trustees. Sovrin aims to enable users to fully control all aspects of their identity. Each user can choose the attributes about himself that he keeps, which he wants to share with a trusted party (Khovratovich & Law, 2017). The biggest challenge Sovrin developers have yet to solve is user experience, which implies a problem with acceptance because the system is difficult to understand. ShoCard (Satybaldy et al., 2020) provides a trusted identity that uses DLT to associate user IDs, and existing trusted credentials (e.g., passport, driver’s license), and additional identity attributes together through cryptographic hashes stored in Bitcoin transactions. The primary use cases of ShoCard are identity verification in online and face-to-face interaction. ShoCard uses Bitcoin as a timestamping service for signed cryptographic hashes of user identity data which are mined in the Bitcoin blockchain. ShoCard includes a

36
central server as an essential part of its scheme. This server mediates the exchange of encrypted identity information between the user and the trusted party. Scanning IDs and QR codes are the dominant paradigm of interaction in the ShoCard user experience. The biggest problem in applying ShoCard is the fact that the waiting time to settle a transaction would be one hour on average. Below is a brief overview of the possibility of applying blockchain technology in education systems. Namely, with the appearance of the COVID-19 pandemic, there were significant changes in the way of teaching which primarily refers to the complete transition to an online learning environment. This emphasizes the issue of security risks, which includes the possibility of misuse of sensitive data. For that reason, it is necessary to pay additional attention to the security of data and the distance learning systems themselves. (Luminita, 2011) emphasizes integrity, access control, non-repudiation, and availability as key characteristics of such systems. As a possible solution to the problem of data protection in the online educational environment. (Donghyeok, 2021) introduced an untact education system based on blockchain. This system consists of an LMS server, a blockchain server, and a client application that students can access via PC or mobile phone. Students and teachers learn through the LMS server and each student has their dedicated blockchain. The idea is to collect certain data about students and their activities after each completed lesson and write it in the appropriate blockchain. The data entered in the blockchain are masked student face data, logs on student activities during the class, information about student behavior during the class obtained by video analysis, and data on final success or grade. All data is encrypted and stored on a blockchain server, and due to the very nature of blockchain, it is not possible to change it. This model, in addition to protecting sensitive data, also enables the teacher to react in real-time thanks to the analysis of student behavior if undesirable behavior is detected.
CONCLUSION
Solutions for strengthening user authentication through the application of blockchain technologies were presented, to prevent fraud and unauthorized access to data of great importance. The mentioned solutions confirm the possible integration of identity management and blockchain technologies. This is an area of research facing major challenges in addressing digital identity flaws.
Keywords: blockchain, digital identity, identity management
REFERENCES
[1] Ali, M., Nelson, J., Shea, R., & Freedman, M. J. (2016). Blockstack: A Global Naming and Storage System Secured by Blockchains. 15.
[2] Bogićević, M., Milenković, I., & Simić, D. (2014). Identity Management – A Survey. In M. L. Jakšić, S. B. Rakočević, & M. Martić (Eds.), Innovative Management and Firm Performance (pp. 370-384). London: Palgrave Macmillan UK. DOI: 10.1057/9781137402226_19
[3] Czarnuch, S., & Mihailidis, A. (2011). The design of intelligent in-home assistive technologies: Assessing the needs of older adults with dementia and their caregivers. Gerontechnology, 10(3), 169-182. DOI:
10.4017/gt.2011.10.3.005.00 [4] Donghyeok, L. (2021). A Blockchain-based Untact Education System for the Post-COVID-19 Era. İlköğretim
Online, 20(3).DOI: 10.17051/ilkonline.2021.03.75 [5] Dunphy, P., & Petitcolas, F. A. P. (2018). A First Look at Identity Management Schemes on the Blockchain. [6] Einterz, S. F., Gilliam, R., Chang Lin, F., McBride, J. M., & Hanson, L. C. (2014). Development and Testing of
a Decision Aid on Goals of Care for Advanced Dementia. Journal of the American Medical Directors Association, 15(4), 251-255. DOI: 10.1016/j.jamda.2013.11.020
[7] Khovratovich, D., & Law, J. (2017). Sovrin: Digital identities in the blockchain era. 5.
[8] König, A., Francis, L. E., Joshi, J., Robillard, J. M., & Hoey, J. (2017). Qualitative study of affective identities in dementia patients for the design of cognitive assistive technologies. Journal of Rehabilitation and Assistive Technologies Engineering, 4, 205566831668503.DOI: 10.1177/2055668316685038
[9] Liu, Y., He, D., & Obaidat, M. S. (2020). Blockchain-based identity management systems: A review. 37. [10] Luminita, D. C. (2011). Information security in E-learning Platforms. Procedia - Social and Behavioral
Sciences, 15, 2689-2693.DOI: https://doi.org/10.1016/j.sbspro.2011.04.171 [11] Lundkvist, D. C., Heck, R., Torstensson, J., Mitton, Z., & Sena, M. (2017). Uport: a platform for self- sovereign
identity. 17.
[12] Moyle, W., Arnautovska, U., Ownsworth, T., & Jones, C. (2017). Potential of telepresence robots to enhance social connectedness in older adults with dementia: An integrative review of feasibility. International Psychogeriatrics, 29(12), 1951-1964.DOI: 10.1017/S1041610217001776
[13] Rathee, T., & Singh, P. (2021). A systematic literature mapping on secure identity management using blockchain technology. Journal of King Saud University - Computer and Information Sciences,

37
S1319157821000690.DOI: 10.1016/j.jksuci.2021.03.005 [14] Satybaldy, A., Nowostawski, M., & Ellingsen, J. (2020). Self-Sovereign Identity Systems: Evaluation
Framework. In M. Friedewald, M. Önen, E. Lievens, S. Krenn, & S. Fricker (Eds.), Privacy and Identity Management. Data for Better Living: AI and Privacy (pp. 447-461). Cham: Springer International Publishing. DOI: 10.1007/978-3-030-42504-3_28
[15] Tobin, A., Reed, D., Windley, F. P. J., & Foundation, S. (2017). The Inevitable Rise of Self-Sovereign Identity.
24.

38
ANALYZING THE IMPACT OF PHYSICAL OPTIMIZATION ON DATABASE QUERIES
Mina Nikolić*1, Srđa Bjeladinović
1
1University of Belgrade – Faculty of Organizational Sciences *Corresponding author, email: [email protected]
OBJECTIVE
Today's institutions produce and process large amounts of data daily, which is additionally increased by second-generation Internet services (Bjeladinovic et al., 2020). Approximately 2.5 quintillion bytes of data are generated every day. This paper aims to show the influence of different optimization techniques on the queries performance in systems that deal with a large amount of new data daily (Almeida et al., 2019). The average query cost and execution time are performance indicators used in this research. The benchmarking before and after optimization took place. That follows the analysis of the results.
METHODOLOGY
Figure 1 presents a bank model. It was a base for applying physical database optimization techniques (Kamatkar et al., 2018). For this model, a large amount of data (hundreds of thousands of records) was generated using PL/SQL to simulate work with a daily amount of data in the bank. The observed data was stored in Oracle 18c DBMS on a remote database server to simulate the access of bank users to a remote server.
Figure 1: Conceptual diagram of the bank model
Queries of different types, shown in Table 1, have been created. The next step was to benchmark the queries initially and gather their costs and execution times. After that, the physical database optimization was applied, including adding partitions and indices with selected methods (Table 1), to enhance the performance of the selected queries (Auzinš et al., 2018). The last step was to conduct control benchmarking.
A remote connection to the database server was established using Oracle SQL Developer(Wu & Cheng, 2020). Both initial and control benchmarking were performed using the EXPLAIN PLAN(Sharma & Nelson, 2017). Each query was executed ten times in both phases, and averages were calculated. Usage of average test results provides more realistic insight because the influence of other background processes on the server is reduced. Figure 2 shows the average query execution time in seconds as a performance indicator before and after applying the optimization techniques.

39
Table 1: Executed queries
Query number
Query type description Method
Query_1 SELECT_with_JOIN_and_WHERE Horizontal_partitioning
Query_2 SELECT_with_WHERE,_string_manipulation function,_conversion_function _and_ORDER BY
Function-based_index_scan
Query_3 SELECT_with_multiple_JOINs_and_WHERE Range_index_scan Query_4 SELECT_with_aggregate_function_and_WHERE Range_index_scan Query_5 SELECT_with_WHERE Index_join
Query_6 SELECT_with_an_aggregate_function,_GROUP_BY, subquery_and_WHERE
Range_index_scan
Query_7 SELECT_with_an_aggregate_function,_JOIN, GROUP_BY_and_ORDER_BY
Fast_full_index_scan
Before optimization After optimization
0.06
0.04
0.02
0
Query 1 Query 2 Query 3 Query 4 Query 5 Query 6 Query 7 Different queries
Figure 2: Average execution time (sec.) of queries before and after optimization
Figure 3 shows the average queries execution cost as a performance indicator before and after applying the optimization techniques.
Before optimization After optimization
250
200
150
100
50
0
Query 1 Query 2 Query 3 Query 4 Query 5 Query 6 Query 7
Different queries
Figure 3: Average execution cost of queries before and after optimization
RESULTS
Based on the gathered results, the percentage of performance improvement was calculated using the following formula, where c represents the percentage of relative change, x1 represents results after optimization, and x2 represents result before optimization:
(1)
Table 2 shows the percentage improvements in the average execution time and the average execution cost for each query.
0.0511 0.057
0.051 0.043
0.024
0.047 0.048 0.042
0.0232 0.021 0.027 0.027 0.027 0.025
204 197 201 200 201 190
10 3 21 5 13 2 49
24
Ave
rage
exe
cuti
on
cos
t A
vera
ge e
xecu
tio
n t
ime
(sec
.)

40
Table 2: Percentage improvements after optimization
Query_number Per_cent_of_Average_Execution_Time
Improvement
Per_cent_of_Average_Execution Cost_Improvement
Query_1 54.60 70.00 Query_2 63.16 3.43
Query_3 47.06 89.55 Query_4 44.19 97.50 Query_5 42.55 84.62 Query_6 43.75 5.47 Query_7 40.48 51.02
Certain queries achieved noticeable performance improvement after applying optimization methods. The most improved average execution time was for Query_2 (63.16%). The most significant cost reduction was for Query_4 (97.50%).
CONCLUSION
This research shows the importance of database optimization and how significantly it can contribute to institutions that work with a large amount of data. The obtained results can be helpful as an indicator of possible benefits and can serve as potential suggestions for introducing optimization techniques in other banks. In the future, the research may extend to other types of organizations. Also, for further development, logical database optimization techniques can be applied, leading to additional improvements.
Keywords: database, physical optimization, benchmarking, data
REFERENCES
[1] Almeida, F., Silva, P., & Araújo, F. (2019). Performance analysis and optimization techniques for oracle relational databases. Cybernetics and Information Technologies, 19(2), 117-132. DOI: 10.2478/cait-2019-0019
[2] Auzinš, A., Eiduks, J., Vasilevska, A., & Dzenis, R. (2018). Object-Relational Database Structure Model and Structure Optimisation. Applied Computer Systems, 23(1), 28–36. https://doi.org/10.2478/acss-2018-0004
[3] Bjeladinovic, S., Marjanovic, Z., Babarogic, S. (2020): A proposal of architecture for integration and uniform use of hybrid SQL/NoSQL database components. Journal of Systems and Software, vol. 168, October 2020,
110633. DOI:10.1016/j.jss.2020.110633 [4] Kamatkar, S. J., Kamble, A., Viloria, A., Hernández-Fernandez, L., & Cali, E. G. (2018, June). Database
performance tuning and query optimization. In International Conference on Data Mining and Big Data (pp. 3-11). Springer, Cham.
[5] Sharma, H. K., & Nelson, M. S. (2017). Explain Plan and SQL Trace the Two Approaches for RDBMS Tuning. Database Systems Journal BOARD, 31.
[6] Wu, H., & Cheng, C. (2020, October). Research on Search Optimization Based on Oracle Database. In Journal of Physics: Conference Series 1648(4) (pp. 042047). IOP Publishing.

41
BUSINESS ANALYTICS

42
ENVY-FREE FAIR STUDENT DROPOUT PREDICTION
Sandro Radovanović*1, Boris Delibašić
1, Milija Suknović
1
1University of Belgrade – Faculty of Organizational Sciences
*Corresponding author, e-mail: [email protected]
OBJECTIVE
Algorithmic decision-making influences everyday life by proposing and automating decisions. Although these models are in general more accurate and reduce the time for decisions, they might result in an unfair decision. The decision might discriminate a person or a group of persons based on the properties that are inherited (e.g. gender or skin color) or appropriated (e.g. religion). Therefore, one would like to ensure that unfairness is mitigated or eliminated. However, eliminating unfairness must come with a cost of lower prediction accuracy. (Menon & Williamson, 2018) Using machine learning algorithms in educational settings is rapidly increasing. A common application is a dropout prediction (Radovanović et al., 2021), where one would like to predict whether a student will finish the course. If not, the decision-maker can intervene and generate dropout prevention policies. In this paper, we join the efforts of two tasks, predicting the dropout and eliminating unwanted discrimination with regards to gender. We adopt an envy-free point of view on fairness, where every individual prefers the outcome of the algorithm designed for that individual’s gender to the outcome of the algorithm designed for the other genders. Using envy-freeness as a fairness metric in machine learning is novel we propose a penalization function for envy that might occur in the logistic regression model. With the penalization term in the goal function, we aim to reduce unwanted discrimination at the cost of achieving lower accuracy. However, since the dataset is divided by gender, we can expect that predictive performance is not going to drop significantly, or drop at all (Globus-Harris et al., 2022).
METHODOLOGY
Envy-freeness is a concept originating from economic theory within the division of resources field. To define envy, we use the utility function that explains the satisfaction of the individual. In this paper, a utility function is defined as the probability that the individual obtains the desired resource (Radovanović et al., 2022). We can define the envy-freeness of the classification model as (1):
(1)
where for every individual the utility with the model designed for the gender of the individual denoted is greater than the utility of the same individual with the model designed for the gender of any other
individual denoted . In other words, envy exists if
. Since envy, as defined
above, is a non-convex function, we use in-parts linear approximation and append it to the logistic loss as a penalization function with a controllable hyper-parameter . The model is presented in (2).
(2)
where are coefficients associated with the attributes, which are controlled variables.

43
The proposed method is applied to the Open University Learning Analytics dataset (Kuzilek et al., 2017), which describes the interaction of the students with the virtual learning environment and relates them with the outcome of the study process. We are interested in predicting student dropout, more specifically the situation where a student fails to pass the course or withdraw from the course. The courses last for one semester and we are interested in making predictions based on the first sixty days of the interaction with the course materials and taking tests. The data is prepared as in (Radovanović et al., 2021). Envy is observed if an individual is better off when the predictive model for another gender is applied.
RESULTS
The experiments are conducted using five-fold cross-validation and we present the average area under the curve (AUC) and accuracy as measures of predictive accuracy, and percentage of envious individuals and disparate impact as measures of fairness. The proposed method (EF-LR) is compared to logistic regression (LR) and gender-specific logistic regressions (GS-LR). We selected the using a validation set, such that the value of envy is equal to zero. The results are presented in Table 1 with the best performances denoted in bold letters. As we can observe, GS-LR and the proposed EF-LR are better in terms of predictive accuracy, where EF-LR had better AUC, but lower accuracy. However, if we observe fairness metrics we can see that the proposed method reduces envy and improves disparate impact. These results indicate that it is possible to improve predictive performance as well as improve fairness. Table 1: Predictive performance and fairness measures
Algorithm AUC Accuracy Envy [%] Disparate impact
LR 0.754 ± 0.059 0.639 ± 0.094 - 0.780 ± 0.196 GS-LR 0.762 ± 0.055 0.644 ± 0.110 0.076 ± 0.051 0.680 ± 0.194 EF-LR 0.766 ± 0.054 0.641 ± 0.093 0.000 ± 0.000 0.784 ± 0.192
CONCLUSION
This paper proposes and applies envy-free penalization for the student dropout prediction. The results suggest that fairness can be achieved without the sacrifice of predictive performance. Envy-free is a compelling notion of fairness since it is based on the preferences of every individual and because it incorporates both the group notion of fairness and the individual notion of fairness, thus allowing inspection of fairness from multiple points of view. The proposed method must have at least two predictive models, thus it is more complex than the existing fairness in-processing approaches (Caton & Haas, 2020).
Keywords: Algorithmic decision-making, Algorithmic Fairness, Envy-free, Student Dropout Prediction
ACKNOWLEDGMENTS
This paper is the result of the project ONR - N62909-19-1-2008 supported by the Office of Naval Research, the United States: Aggregating computational algorithms and human decision-making preferences in multi-agent settings.
REFERENCES
[1] Caton, S., & Haas, C. (2020). Fairness in machine learning: A survey. arXiv preprint arXiv:2010.04053. [2] Globus-Harris, I., Kearns, M., & Roth, A. (2022). Beyond the Frontier: Fairness Without Accuracy Loss. arXiv e-
prints, arXiv-2201. [3] Kuzilek, J., Hlosta, M., & Zdrahal, Z. (2017). Open university learning analytics dataset. Scientific data, 4(1), 1-
8. [4] Menon, A. K., & Williamson, R. C. (2018, January). The cost of fairness in binary classification. In Conference
on Fairness, Accountability and Transparency (pp. 107-118). PMLR.
[5] Radovanović, S., Delibašić, B., & Suknović, M. (2021). Predicting dropout in online learning environments. Computer Science and Information Systems, 18(3), 957-978. DOI: 10.2298/CSIS20092003R
[6] Radovanović, S., Jovanović, M., Delibašić, B. & Suknović, M. (2022). Learning fair, envy-free machine learning models, YuInfo 2022 (pp. in press).

44
CREDIT RATING PREDICTION USING MACHINE LEARNING ALGORITHMS:
S&P500 COMPANIES
Jana Krstović1, Pavle Milošević*
2, Ivana Dragović
2
1KPMG d.o.o.
2University of Belgrade – Faculty of Organizational Sciences
*Corresponding author, e-mail: [email protected]
OBJECTIVE
Corporate credit scoring has become a very important task as the credit industry has been experiencing significant growth rate during the past few decades (Lee et al., 2002). A critical step in the credit granting process usually refers to a detailed financial analysis of the creditworthiness of a company or individual. Credit scoring models have become very important since the credit industry can benefit from improving cash flow, hedging credit portfolios, lowering the threatening risks and making essential decisions (Hsieh, 2005). Therefore, it is of the highest importance to develop prediction models with high accuracy. In this abstract, we deal with a problem of credit rating prediction of S&P500 companies for 2019 based on data from 2017 and 2018. Namely, we analyze the prediction performances of two most commonly used machine learning algorithms for this purpose: neural network (NN) and support vector machine (SVM).
METHODOLOGY
Neural networks are modeled on the principle of neural activities of the biological human brain. Artificial NN is an algorithmic procedure for transforming inputs into desired outputs using highly interconnected networks of very simple processing elements, neurons (Hagan, 2014). Layered architecture, a vast number of neurons and nonlinear functions in them makes NN a very powerful prediction algorithm. Therefore, NNs are widely used for credit rating prediction, e.g. (Golbayani et al., 2020; Zhao et al., 2015). In our experiment, 6 NNs with different architecture and transfer functions are trained by the Levenberg-Marquardt learning algorithm. More precisely, in this experiment we varied the number of layers (from one to two layers), the number of neurons per layer (from 10 to 30) and transfer functions (ReLU or sigmoid). Support vector machine uses a simple model to implement nonlinear classification of input vectors into a high-dimensional feature space (Boser et al., 1995). Namely, a linear model created in the new space performs a non-linear decision boundary in the original space by creating an optimal separating hyperplane that maximizes separation between decision classes. This algorithm and its versions, e.g. support vector regression (SVR), are successfully used for prediction in various financial problems, e.g. (Trafalis et al., 2000; Jaramillo et al., 2017). Since the problem is observed as a regression, SVR was used with different kernel functions (radial basis function (RBF) and sigmoid). Also, we varied values of hyper-parameter C.
RESULTS
The dataset used in this research is collected via web scraping (Rakićević, 2020) and consists of data on 245 large international companies from various fields of business. Each company is described by 17 attributes that refers to the most important financial indicators of liquidity and performance, e.g. net income, debt ratio, current ratio, etc. The model output, i.e. company’s credit rating, is assessed using Moody ratings scale. In this research, the observed problem is defined as a regression, since numerical values are assigned to each of the rating categories.

45
The training process for NN models lasted 100 epochs, with an early stopping condition to avoid overfitting. As the dataset is considered as a time series that is relatively short, we used a holdout method for splitting data. The training process was repeated 20 times due to the stochastic nature of neural networks. Also, we used SVR with RBF and sigmoid kernel functions and varied values of hyper-parameter C from 1 to 5 with 0.5 step. The results of models that proved to be the best are shown in Table 1. Table 1: Prediction results using NN and SVR
NN (10*10 neurons, sigmoid) SVR (RBF, C=2.5)
MSE 0.79 1.06 RMSE 0.89 1.03
CONCLUSION
As far as NN is concerned, the number of layers has no significant effect on predictive power. However, the best results are obtained with а two layer neural network and sigmoid activation function. On the other hand, the optimal value of parameter C for SVR is in the middle of the observed interval. Experimental results show that the best NN model has notably lower predicting errors compared to SVR. Thus, despite NN being a black-box model, the chosen architecture seems to be better fit for this particular problem than SVR. In further work, we aim to enhance the prediction performance by extending our dataset.
Keywords: credit rating, neural network, support vector regression, S&P500
REFERENCES
[1] Boser, B. E., Guyon, I. M., & Vapnik, V. N. (1992, July). A training algorithm for optimal margin classifiers. In Proceedings of 5th Annual Workshop on Computational Learning Theory (pp. 144-152), ACM.
[2] Golbayani, P., Florescu, I., & Chatterjee, R. (2020). A comparative study of forecasting corporate credit ratings using neural networks, support vector machines, and decision trees. The North American Journal of Economics and Finance, 54, 101251.
[3] Hagan, M., Demuth, H., Beale, M., & DeJesus O. (2014). Neural Network Design, 2nd
ed. Martin Hagan.
[4] Jaramillo, J., Velasquez, J. D., & Franco, C. J. (2017). Research in financial time series forecasting with SVM: Contributions from literature. IEEE Latin America Transactions, 15(1), 145-153.
[5] Lee, T. S., Chiu, C. C., Lu, C. J., & Chen, I. F. (2002). Credit Scoring Using the Hybrid Neural Discriminant Technique. Expert Systems with Applications, 23, 245-254.
[6] Hsieh, N. C. (2005). Hybrid mining approach in the design of credit scoring models. Expert Systems with Applications, 28(4), 655-665.
[7] Rakićević, A. (2020). Adaptivni fazi sistem za algoritamsko trgovanje: Interpolativni bulov pristup (Doctoral dissertation, Univerzitet u Beogradu, Fakultet organizacionih nauka).
[8] Trafalis, T. B., & Ince, H. (2000, July). Support vector machine for regression and applications to financial forecasting. In Proceedings of the IEEE-INNS-ENNS International Joint Conference on Neural Networks 6 (pp. 348-353). IEEE.
[9] Zhao, Z., Xu, S., Kang, B. H., Kabir, M. M. J., Liu, Y., & Wasinger, R. (2015). Investigation and improvement of multi-layer perceptron neural networks for credit scoring. Expert Systems with Applications, 42(7), 3508-3516.

46
SALES FORECASTING IN RESTAURANTS USING COMPUTATIONAL INTELLIGENCE
Milica Zukanović*1, Aleksandar Rakićević
1, Ivana Dragović
1
1 University of Belgrade – Faculty of Organizational Sciences *Corresponding author, e-mail: [email protected]
OBJECTIVE
Sales forecasting is one of the important inputs for a successful restaurant procurement management system. It is influenced by a large number of factors: certain time of year, weather conditions, location, economic situation, demographic characteristics, previous restaurant business, etc. In most restaurants, prediction is made based on the intuition and experience of the manager (Lasek et al., 2016). For solving this business- related problem have been developed many methods in machine learning and statistics. The main purpose of this research is to identify attributes that affect the procurement process and to predict sales using different computational intelligence models.
METHODOLOGY
Neural networks (NNs) are widely applied for sales forecasting (Yang & Sutrisno, 2018). Hence, the proposed model is based on NN, which is used to extract knowledge from sales data – knowledge of customer needs and expectations. We use network configurations with two hidden layers and ten neurons per layer, nine different transfer functions and five train algorithms in accordance with MathWorks research (2016). To validate our forecasting results, we use support vector machine (SVM) as a benchmark technique. SVMs were analysed by Seyedan and Mafakheri (2020) for demand forecasting. In this study, we use SVM with Gaussian and linear kernel functions. The input data consists of two years (20 months) of real restaurant daily sales data. Further, the input set also includes environmental data: temperature, precipitation, reservations, event, holiday and certain time of the week/year (Tanizaki et al., 2019). Therefore, our data set consists of nine input factors, four outputs and 611 daily observations – in total 7,943 data points. RESULTS
The best results of the evaluation are given in Table 1. The performance of the forecasting models was measured using mean squared error (MSE) and mean absolute error (MAE).
Table 1: Comparison of the models’ performance
Transfer function Error
Neural network (10x10) SVM
Train algorithm: BFGS quasi-Newton backpropagation
Kernel function
Linear
Carbonated Soft Drinks
satlins MSE 7.3377 65.4059
MAE 2.0851 5.8207
Juice softmax MSE 6.7549 5.9141
MAE 2.0468 1.9224
Water softmax MSE 382.4917 344.7785
MAE 15.0767 14.0319
Beer satlins MSE 114.6067 78.3280
MAE 6.5172 5.8545

47
CONCLUSION
The primary goal of our research is to develop a procurement management model for restaurants based on computational intelligence forecasting technique. The purpose of this study is to point out the possibility for improving restaurant efficiency. The contribution is the model that can be used to optimize ordering and help restaurant managers to reduce errors which can lead to higher costs and guests’ dissatisfaction. Nine features were identified and included in the model. Two various prediction methods were applied. Regarding forecasting performance, SVM outperformed NN models. Future work will address implementation of the proposed model into a real data restaurant procurement system.
Keywords: neural network, computational intelligence, sales forecasting, procurement management, support vector machine
REFERENCES
[1] Lasek, A., Cercone, N., & Saunders, J. (2016). Restaurant sales and customer demand forecasting: Literature survey and categorization of methods. Smart City, 360, 479-491. DOI: 10.1007/978-3-319-33681-7_40
[2] MathWorks®. (2016). Choose a Multilayer Neural Network Training Function. [3] Seyedan, M., & Mafakheri, F. (2020). Predictive big data analytics for supply chain demand forecasting:
methods, applications, and research opportunities. Journal of Big Data, 7(1), 1-22. DOI: 10.1186/s40537-020-00329-2
[4] Tanizaki, T., Hoshino, T., Shimmura, T., & Takenaka, T. (2019). Demand forecasting in restaurants using machine learning and statistical analysis. Procedia CIRP, 79, 679-683. DOI: 10.1016/j.procir.2019.02.042
[5] Yang, C. L., & Sutrisno, H. (2018, January). Short-term sales forecast of perishable goods for franchise business. In 2018 10th International Conference on Knowledge and Smart Technology (KST) (pp. 101-105).
IEEE. DOI: 10.1109/KST.2018.8426091

48
THE IMPACT OF MISSING VALUES ON CORPORATE CREDIT RATING PREDICTION PERFORMANCE
Milica Zukanović*1, Pavle Milošević
1, Ana Poledica
1
1 University of Belgrade – Faculty of Organizational Sciences *Corresponding author, e-mail: [email protected]
OBJECTIVE
Corporate credit rating assessment is an attractive field of research for both the academic and business community during past decades. Because of companies’ privacy and data protection as well as human errors, missing values are a common problem when dealing with credit ratings prediction (Paleologo et al., 2010). This may be considered as one of the major issues leading to incorrect results. Thus, the aim of this study is to determine the impact of missing values on predicting credit rating of S&P500 companies. Traditionally, credit ratings are assessed using econometric models (Hsu et al., 2017). Recently, researchers are developing various credit rating models based on computational intelligence methods (Hsu et al., 2017; Li et al., 2020; Wallis et al., 2019). In this research, corporate credit ratings are predicted using two well- known machine learning (ML) methods: artificial neural networks (NN) and support vector machines (SVM).
METHODOLOGY
Experiment is based on a three-year real-world dataset of companies that are on the S&P500 list. Based on a detailed literature review (Li et al., 2020), 40 features are identified and then used in the modelling process to predict companies’ ratings. Before assessing ratings, it is necessary to deal with missing values. The most problematic attribute is interest expenses with 23% of missing values, which is included in other financial ratios in the model.
In this study, we used 4 imputation methods: mean/median, multi imputation, SVM and clustering based using Fuzzy C-Means (FCM). Multi imputation and SVM are common multivariate imputation methods, while mean/median imputation may be found as the simplest one and therefore it is frequently used. The main idea of imputation with FCM is grouping data in the same variable as FCM to get the centroid value of each variable and to calculate the distance between each lost data with each cluster (Aristiawati et al., 2019). The influence of the observed methods is evaluated through a NN and SVM prediction performance. The experiment flow is given in Figure 1.
Figure 1: Corporate credit rating prediction: The research flow
RESULTS
The results of the evaluation are given in Table 1. Gray cells indicate the best results for ML model setup, while the best results for handling missing data are bold.
Based on Table 1, it can be seen that the FCM imputation produces the best results in general. Furthermore, the NN model with two layers and ten neurons per layer proved to be the most efficient.
Dataset Analysis of
missing values
Data imputation/remova
l
Credit rating prediction
Evaluation of data imputation/credit
prediction methods

49
Table 1: Results of handling missing data and ML techniques
Methods for dealing missing
values
Error
Neural network SVM
Number of hidden layers, neurons and activation function
Kernel function
10x10 30 Gaussian
Polynomial
logsig tansig logsig tansig
Mean/median MSE 0.0169 0.0180 0.0192 0.0292 0.1422 0.2452
Multi imputation MSE 0.0148 0.0156 0.0217 0.0264 0.0209 0.2452
SVM MSE 0.0155 0.0207 0.0231 0.0277 0.1422 0.2452
FCM MSE 0.0132 0.0132 0.0129 0.0145 0.0177 0.1948
CONCLUSION
This research aimed to analyze the impact of missing values on credit rating prediction using NNs and SVMs. Namely, 4 diverse methods for handling missing values were applied. FCM shows best results on the basis of mean squared error (MSE) analysis among all methods in this use case. Meanwhile, the results indicated that NN obtained better performance than SVM. In future work, we aim to incorporate more details about specific companies, i.e. industry classification, in order to enhance prediction performance. Moreover, other ML algorithms could be considered, as well as various feature selection.
Keywords: corporate credit rating, missing values, fuzzy C-means, neural network, support vector machine
REFERENCES
[1] Aristiawati, K., Siswantining, T., Sarwinda, D., & Soemartojo, S. M. (2019, December). Missing values imputation based on fuzzy C-Means algorithm for classification of chronic obstructive pulmonary disease (COPD). In AIP Conference Proceedings 2192(1) (pp. 060003). AIP Publishing LLC. DOI: 10.1063/1.5139149
[2] Hsu, F. J., Chen, M. Y., & Chen, Y. C. (2017). The human-like intelligence with bio-inspired computing approach for credit ratings prediction. Neurocomputing, 279, 11-18. DOI: 10.1016/j.neucom.2016.11.102
[3] Li, J. P., Mirza, N., Rahat, B., & Xiong, D. (2020). Machine learning and credit ratings prediction in the age of fourth industrial revolution. Technological Forecasting and Social Change, 161, 120309. DOI: 10.1016/j.techfore.2020.120309
[4] Paleologo, G., Elisseeff, A., & Antonini, G. (2010). Subagging for credit scoring models. European journal of operational research, 201(2), 490-499. DOI: 10.1016/j.ejor.2009.03.008
[5] Wallis, M., Kumar, K., & Gepp, A. (2019). Credit rating forecasting using machine learning techniques. In Managerial Perspectives on Intelligent Big Data Analytics (pp. 180-198). IGI Global. DOI: 10.4018/978-1-
5225-7277-0.ch010

50
DATA-CENTRIC MACHINE LEARNING IN CRYPTO MINING DETECTION
Sofija Krstev*1, Dragoljub Krneta
1
1Dwelt d.o.o
*Corresponding author, e-mail: [email protected]
OBJECTIVE
In emerging world where financial transactions tend to move into crypto currencies, there are more and more transactions every single day, each of them requiring validation process to happen. According to MoneySupermarket (MoneySupermarket, 2022), a financial website that does research on crypto transactions, each transaction made with Crypto-currency requires 100 kWh of energy in order to be propagated and validated. The background of this consumption is due to blockchain technology behind crypto currencies which uses processing resources to propagate and validate transactions (O'Dwyer & Malone, 2014). The interest for individuals and legal entities that do mining activities has risen since 2020, when increase of such activities has been noticed. Energy suppliers in Bosnia and Herzegovina had concluded that those kinds of activities are not according to basic energy regulations (Regulatorna komisija za energetiku, 2019). In line with that, new pricelist or supply conditions should apply for them. The goal of this analysis was to find entities of interest that are suspects to crypto-currency mining using the consumption historical data.
METHODOLOGY
Since definition of the challenge aligns with the problem of detecting outliers, the methodology of defining algorithm for detecting crypto-currency mining aligns with the machine learning best practices in solving similar challenges (Statistical approach to anomaly detection in time series data and similarity approaches). Since results of standard approach was not satisfying and no convergence to fewer number of cases was made, the approach was focused on data-centric approach. Data-centric AI is the discipline of systematically engineering the data used to build an AI system (Ng, 2022). The concept was introduced by Andrew Ng in 2020, and it created an shift in implementations of great number of machine learning challenges. Since a lot of domain knowledge could be applied in detecting mining, data-centric approach seemed to be the right methodology in preprocessing steps in order to get better results.
RESULTS
From the starting point of 65 000 metering points, final model gave 60 metering points that are suspect to crypto mining, from which 5 were true positive case. No record of not detected cases was found until present day.
CONCLUSION
Data-centric approach to developing machine learning algorithms showed great significance in solving the problem of detecting outliers, crypto currency mining suspects. Applying the domain knowledge in preprocessing data has multiple advantages, one of many being lowering the possibility of mislabeling in familiar data or familiar domain specifics.

51
Keywords: cryptocurrency mining, machine learning, outlier detection, data centric AI
REFERENCES
[1] Kroll, J. A., Davey, I. C., & Felten, E. W. (2013). The Economics of Bitcoin Mining, or Bitcoin in the Presence of Adversaries. In The Twelfth Workshop on the Economics of Information Security. Washington.
[2] Madhuri, G. S., & Ran, M. U. (2018). Anomaly Detection Techniques Causes and Issues. International Journal of Engineering & Technology, 449-454.
[3] MoneySupermarket. (2022, 4 13). Crypto Energy Consumption. Retrieved from MoneySupermarket: www.moneysupermarket.com/gas-and-electricity/features/crypto-energy-consumption/
[4] Narayanan, A., Bonneau, J., Felten, E., Miller, A., & Goldfeder, S. (2016). Bitcoin and Cryptocurrency Technologies: A Comprehensive Introduction. Woodstock: Princeton University Press.
[5] Ng, A. (2022, 4 3). Retrieved from Data centric AI: datacentricai.org/ [6] O'Dwyer, K. J., & Malone, D. (2014). Bitcoin Mining and its Energy Footprint. In IET Irish Signals & Systems
Conference 2014 and 2014 China-Ireland International Conference on Information and Communications Technologies (pp. 280-285).
[7] Regulatorna komisija za energetiku. (2019, 5). Opšti uslovi snabdjevanja električnom energijom. Retrieved from reers.ba/wp-content/uploads/2019/05/OU_precisceni_tekst_okt2012.pdf
[8] Vries, A. d. (2018). Bitcoin's Growing Energy Problem. Joule, 2(5), 801-805.

52
GENERALIZATION CAPABILITIES OF ARTIFICIAL NEURAL NETWORKS AS AN
INDICATOR OF A CRISIS
Tijana Matejić*1, Filip Vasić
1, Đorđe Mihailović
1
1Akademija strukovnih studija – Šumadija
*Corresponding author, e-mail: [email protected]
OBJECTIVE
The paper demonstrates a new conceptual framework for assessing structural break in bankruptcy risk in a situation of sudden crisis outbreak, such as COVID-19. The assessment is made through the evaluation of changes in generalization capabilities of 1120 MLP Artificial Neural Networks (hereinafter ANN) which were prepared for predicting the bankruptcy risk of 100 hotel companies in the Republic of Serbia in the period 2018-2021. Bankruptcy analysis in, strongly affected by the COVID-19 crisis, Hotel Industry is particularly important because this industry is characterized by: high values of fixed assets to current assets ratio; limited sales power of estates, and the fact that theTourism and Travel sector in the Republic of Serbia is an important sector with a high development rate in the past (Marinkovic & Stevanovic, 2021). In addition, bankruptcies are extremely expensive in the industry, where the assets of hotel companies are sold at a very low value (usually 10-30% of the market value) while, at the same time, reorganizations, as an alternative, are hardly feasible in the country (Mizdrakovic, 2015). The set of the measures of government support to the private companies in the form of deferral of liabilities and liquidity loans granted in 2020 and 2021 are yet to be defrayed and with the lagging nature of the bankruptcy (Dun & Bradstreet Worldwide Network, 2020) have postponed full negative effects of the criris. At the same time, to the best of our knowledge, there is a serious gap in the scientific literature that deals with the assessment of the impact of the COVID-19 crisis on the bankruptcy risk of the companies. The following hypotheses have been tested in the paper:
H1. Changes in the generalization capabilities of ANNs are a good indicator of structural changes in the Hotel Industry;
H2: The structural changes in bankruptcy risk in the industry have happened in 2020; H3: ANNs have debatable applicability in forecasting bankruptcy risk in 2021.
METHODOLOGY
The paper uses data for the period [2015, 2020] on the sample of 100 non-bankrupt hotel companies which are listed on the website of the Agency for Business Registers in 2022, and at the time of writing, no financial statements for 2021 are available. The EM Altman's Z”-Score model, is s used as an indicator of the risk of bankruptcy as it has been confirmed to be decent in bankruptcy prediction when applied in periods of a financial crisis (Ashaf et al., 2019) and as it has been used by two previous studies engaged in the bankruptcy analysis in the same industry in the country (Milašinović et al., 2019; Mizdraković et al., 2015). The ANNs presented in this paper are time-delay time-series ANNs (TDNN) for forecasting the bankruptcy risk zones of the companies in the particular years of the analyzed period, which implement input time-series vectors of data from the previous years. Although TDNNs have been reported to be successful for prediction and classification (Khansa & Liginlal, 2011; Jha & Sinha, 2014; Shao & Lin, 2019) this concept has not been previously used to predict bankruptcy. Trained ANNs are grouped into 28 models that combine different input parameters, including: indicators of the Altman model, market factors and internal factors of the company.

53
The generalization capabilities of ANNs have attracted significant attention from the scientific public (e.g., Li et al., 2005; Wu & Liu, 2009; Neyshabur et al., 2017) and represent the ability of trained ANNs to generalize well from learning data to new unseen data, but have also not been previously used in assessing the level of structural changes at the industry level. The paper interprets the changes in the accuracy of the ANNs, i.e. the generalization errors of the ANNs, with unchanged ANNs configuration factors, as indicators of structural changes that have occurred in the industry in the year of analysis, whereby it is assumed that a year with minor structural change will have a smaller generalization error. Time-series model of ANNs accuracies, allows the accuracy of ANN in assessing the firm's risk zone in the year of prediction - t ( ) to be expressed as the sum of: (1) expected accuracy based on trend data from the previous period ( ), (2) changes in accuracy of ANNs due to differences in zonal formation patterns in the previous period and the year of the analysis- t, i.e. changes in the general circumstances of the industry ( ), and (3) intrinsic errors ANN - which are product of randomness in the choice of observations for training and test set when studying networks, as well as noise in the sampled measurements. Based on this model, the ANN generalization error in the prediction year t ( can be expressed as:
(1)
Since is a stationary variable and the generalization errors are mutually compared among years to
establish changes, it can be assumed that and therefore the generalization error can be equated with the effect of structural change in year - t.
RESULTS
Table 1: Generalization errors in the period 2018-2020 and in 2021
FP=1 FP=2 FP=1 FP=2 FP=1 FP=2 2018 75% 76.8% 74.8% 79.3% +0.2% -2.5% 2019 78.4% 86.1% 77.4% 82.2% +1% +3.9% 2020 82.7% 85.7% 64.3% 67% +18.4% +18.7% 2021 75.2% 74.4% / / / / The results, shown in Table 1, were validated by the Bai-Perron test and the analysis of the correlation coefficients between the errors and the series of Relative Strength trending indicators, which varied from 0.84 to 1, indicating that generalization errors describe well the trend data on bankruptcy risk indicators.
A significantly larger generalization error was achieved in the case of 2020 which is almost 20 times larger than the error achieved in 2019, and 92 times higher than in 2018, indicating that the COVID-19 crisis has made the structural change in bankruptcy risk and significantly increased it in 2020 and the following years. Accordingly, the applicability of ANNs in forecasting the bankruptcy risk in 2021, for which data on are not still available is vague.
CONCLUSION
The paper shows that generalization errors can be used as an indicator of the structural change in the bankruptcy risk in ex-post analyses, that changes in 2020 in the Hotel Industry in the Republic of Serbia were almost 20 times greater than in 2019 so that the usability of the ANNs in 2021 is vague. The paper contributes to the field of business analysis in times of crisis and provides insight into the importance of governmental support and the adaptation of internal business policies of hotel companies to new working conditions. The limitations of the study stem from the limitations of Altman’s Z ”-Score model, sample limitations, and the number of trained ANNs.
Keywords: bankruptcy risk, artificial neural networks, hotel industry, generalization error.

54
REFERENCES
[1] Ashraf, S., Félix, E.G. S., & Serrasqueiro, Z. (2019). Do Traditional Financial Distress Prediction Models Predict the Early Warning Signs of Financial Distress?. Journal of Risk and Financial Management, 12(2), 55. DOI: 10.3390/jrfm12020055
[2] Dun & Bradstreet Worldwide Network (2020). Global Bankruptcy Report 2020. Retreived from: www.dnb.com/content/dam/english/economic-and-industry-insight/global-bankruptcy-report-for-2020.pdf (accessed March 25
st, 2022).
[3] Jha, G.K, Sinha, K. (2014). Time-delay neural networks for time series prediction: An application to the monthly wholesale price of oilseeds in India. Neural Computing & Applications, 24, 563-571. DOI: 10.1007/s00521-012-1264-z
[4] Khansa, L., & Liginlal, D. (2011). Predicting stock market returns from malicious attacks: A comparative analysis of vector autoregression and time-delayed neural networks. Decision Support Systems, 51, 745-759. DOI:
10.1016/j.dss.2011.01.010 [5] Li, Y., He, W., & Yang, H. (2005). Study on evaluation ways of feed-forward neural networks generalization
ability. In Information Optics and Photonics Technology, 5642 (pp. 457-459). SPIE. DOI: 10.1117/12.574709 [6] Marinković, G., & Stevanović, S. (2021). Performance changes of the tourism sector in the crises. In 5th
international thematic monograph: Modern Management Tools and Economy of Tourism Sector in Present Era (pp. 425-439). Association of Economists and Managers of the Balkans; Faculty of Tourism and Hospitality, Belgrade.
[7] Milašinović, M., Knežević, S., & Mitrović, A. (2019). Bankruptcy forecasting of hotel companies in the Republic of Serbia using Altman’s Z-score model. Hotel and Tourism Management, 7, 87-95. DOI: 10.5937/menhottur1902087M
[8] Mizdrakovic, V., Knezevic, G., & Stanic, N. (2015). Bankruptcy Risk Exposure of Serbian Hotels in the Period 2008-2012. In Sitcon 2015 - International Conference in Tourism. Singidunum University, Belgrade.
[9] Shao Y.E., & Lin S. C. (2019). Using a Time Delay Neural Network Approach to Diagnose the Out-of-Control Signals for a Multivariate Normal Process with Variance Shifts. Mathematics, 7(10), 959. DOI: 10.3390/math7100959
[10] Wu, X. X., & Liu, J. G. (2009). A new early stopping algorithm for improving neural network generalization. In 2009 Second International Conference on Intelligent Computation Technology and Automation, 1, (pp. 15-18).
IEEE. DOI: 10.1109/ICICTA.2009.11 [11] Neyshabur, B., Bhojanapalli, S., McAllester, D., Srebro, N. (2017): Exploring generalization in deep learning. In:
Advances in Neural Information Processing Systems 30: Annual Conference on Neural Information Processing Systems 2017, 4-9 December 2017. (pp. 5949–5958). Long Beach, CA, USA. DOI: 10.48550/arXiv.1706.08947

55
DEVELOPMENT OF THE STRATEGIC GAMES SIMULATIONS PLATFORM
Ognjen Nikolić*1, Marija Kuzmanović
1
1University of Belgrade – Faculty of Organizational Sciences * Corresponding author, e-mail: [email protected]
OBJECTIVE
Active learning is considered a necessary condition for acquiring deep knowledge and skills, especially when it comes to studying business decision theory in an interactive and highly competitive environment. Moreover, the correlation between learning through simulation games and student achievement has been confirmed by a number of research studies (Vlachopoulos & Makri, 2017; Fox et al., 2018). This paper deals with the development of a platform for simulating strategic interactions, focusing primarily on models of strategic games that are studied within game theory courses. The platform is currently in its alpha phase and is being developed with three main goals: motivating students to participate more actively in the course, helping students to better understand the material, and creating a framework for studying strategic interaction of individuals. First two goals rely on the basis of game-based learning and its positive effects on learning discussed by (Thatcher, 1990; Kačavenda-Radić et al., 2011). Third goal will be a subject of future work. Main functionality of the platform is the possibility of real-time simulation of strategic games between players, both those played in pairs and in groups, upgrading the current solution which could only simulate the game between the player and the computer. This is especially interesting in multistage games, where the player can see the outcome of the previous iteration and thereby choose his/hers next actions. The platform is to be used as a tool in teaching, where the simulations would be given before, during and after the lectures, to both prepare the discussion, but also to evaluate the impact of the lessons on the students’ achievements.
METHODOLOGY
Nine strategic games and the concept of a game solution (Nash Equilibrium), as well as quizzes and surveys were implemented as part of the platform (Kuzmanović, 2017). Project methodology used in development was Agile Software Development, with the process of specifying, designing, developing, and testing one functionality at a time, and thereby continuously upgrading the platform (Highsmith & Cockburn, 2001). Frameworks for code development were .NET Core 3.1 (Microsoft, 2021) for the back-end and React v17.0.2 (Facebook, 2021) for the front-end, with Rest API application programming interface. Database and web service were stored on Azure (Microsoft, 2021), and Netlify (Netlify, 2022) was used for the client service. Other tools that were used were SendGrid (Twilio, 2021) for mail services and Sentry (Functional Software, Inc. 2022) for automatic error logging.
CONCLUSION
After implementing the most important functionalities the platform was released for validation. Tested on 10 participants with different professional and academic experience and without prior knowledge of game theory, the platform gave successful results. Most of the participants cited that it was fun for them to compete with other players, think strategically about their actions to get the best payoff in the end, and asked to be included in the next phase of testing. Some of the participants engaged in the discussion afterwards about their actions and wanted to find out what would be the best strategies and expected outcomes, or Nash equilibria. Future research will focus on using the platform within the course "Introduction to Game Theory" and measuring its impact on student engagement and performance as well as generated interest in a deeper study of the theory of strategic interactions. Students’ behavior data, collected through simulations, quizzes and surveys, can be further used to define players' profile in terms of the level of their strategic reasoning, as

56
well as to develop a framework for predicting one's strategic abilities.
Keywords: game theory, simulation, game-based learning, strategic reasoning
REFERENCES
[1] Facebook Inc. (2021). React Documentation. Retrieved from React v17.0.2: reactjs.org/docs/getting- started.html
[2] Fox, J., Pittaway, L., & Uzuegbunam, I. (2018). Simulations in entrepreneurship education: Serious games and learning through play. Entrepreneurship Education and Pedagogy, 1(1), 61-89.
[3] Functional Software, Inc. (2021). Sentry for .NET Documentation. Retrieved from Sentry Documentation: docs.sentry.io/platforms/dotnet/
[4] Highsmith, J., & Cockburn, A. (2001). Agile software development: The business of innovation. Computer, 34(9), 120-127.
[5] Kačavenda-Radić, N., Nikolić-Maksić, T., & Ljujić, B. (2011). Alternativni pristupi obrazovanju odraslih-učenje bazirano na računarskoj igri. Inovacije u nastavi, 24(3), 19-29.
[6] Kuzmanović M. (2017). Teorija igara. Belgrade: Faculty of Organizational Sciences. [7] Microsoft Inc. (2021). ASP.NET Core Documentation. Retrieved from Microsoft Documentations:
docs.microsoft.com/en-us/aspnet/core/?view=aspnetcore-5.0 [8] Microsoft Inc. (2021). Azure Documentation. Retrieved from Microsoft Documentations: docs.microsoft.com/en-
us/azure/?product=featured [9] Netlify (2022), Netlify Documentation. Retrieved from Netlify Documentation: docs.netlify.com [10] Thatcher, D. C. (1990). Promoting Learning through Games and Simulations. Simulation & Gaming, 21(3), 262–
273. [11] Twilio Inc. (2021). SendGrid Documentation. Retrieved from SendGrid: docs.sendgrid.com [12] Vlachopoulos, D., & Makri, A. (2017). The effect of games and simulations on higher education: a systematic
literature review. International Journal of Educational Technology in Higher Education, 14(1), 1-33.

57
DOES OWNERSHIP STRUCTURE AFFECT BANK PERFORMANCE IN THE COVID-19 PANDEMIC PERIOD? EVIDENCE FROM
CROATIA
Katerina Fotova Čiković*1, Damira Keček
1, Joško Lozić
1
1 University North, Republic of Croatia *Corresponding author, e-mail: [email protected]
OBJECTIVE
Commercial banks are undoubtedly the most crucial institutions in the financial system and the country’s economic development and this is especially true in developing countries with underdeveloped financial systems. Banks’ crucial intermediary function of transferring the publics' deposits and savings in the business sector once more shows that „banks are the main channel for savings and the allocation of credit” (Sufian & Kamarudin, 2016). Thus, bank efficiency is crucial for economic stability and development. It is therefore intensively researched and the Data Envelopment Analysis (hereafter DEA) is one of the main nonparametric methodologies employed for efficiency evaluation.
The measurement of bank efficiency has become an even greater imperative in the COVID-19 pandemic. Even though the Croatian banking sector in 2020 has been highly liquid and capitalized, it is important to conclude on the impact the crisis 2020 year had on the banking sector. Interestingly, the banking sector is dominated by foreign-owned banks that possess a total share in total bank assets of around 90.2% (HNB, 2019). The objective of this paper is to investigate and explore the relationship between bank ownership and performance (i.e. efficiency) before and after the COVID-19 pandemic in a sample of 20 Croatian commercial banks in the period from 2015 to 2020. The interconnection between these variables is examined with the use of a dynamic data envelopment analysis (DEA) framework. In other words, the relative efficiency of Croatian banks is measured in order to determine whether the ownership structure impacts the bank efficiency in the crisis period. The main hypothesis revolves around the notion that foreign banks are in general more efficient than domestic banks. This is a subject that is very contemporary and needs to be looked into. However, to the best of the authors’ knowledge, there is not a study covering this subject regarding the Croatian banking sector. Therefore, the findings of this paper would contribute to the literature regarding different applications of DEA in banking and would bring new insights to practitioners, bank management and bank stakeholders altogether.
METHODOLOGY
The envelopment form of the output-oriented BCC DEA model is given in (1)–(5): (Cooper et al. 2007):
(1)
subject to
(2)
(3)
(4)
(5)

58
where ηB is a scalar. The input data for DMUj (j = 1, …, n) are (x1j,x2j,…,xnj), and the output data are (y1j,y2j,…,ynj); the data set is given by two matrices X and Y, where X is the input data matrix, and Y is the output data matrix, λ is a column vector and all its elements are non-negative, while e is a row vector and all its elements are equal to 1 (Cooper et al., 2007; Cvetkoska & Barišić, 2017). The empirical study includes two input and two output variables for the DEA model as shown in Table 1. Table 1: Selected input and output variables for the window DEA model.
Character of variable Variables Specification of the variables
INPUT interest expenses (I1)
non-interest expenses (I2) Expenses on fees and commissions
General administrative expenses and depreciation
Expenses on value adjustments and provisions
Other operating expenses
OUTPUT interest revenues (O1)
non-interest revenues (O2) Income from fees and commissions
Other operating income
RESULTS
In this study, the dynamic DEA window analysis approach has been implemented. The sample consists of 20 commercial banks (n=20), six years are considered (k=6), the length of the window is 3 years (p=3), and the number of windows is 4 (w=k-p+1=6-3+1=4). In each window, there are 60 banks (n x p), and the number of “different” banks is 180 (60 banks x 3 windows). Every window covers 3 years (for example, window 1 covers 3 years as follows: 2015, 2016 and 2017; window 2 covers data for 2016, 2017 and 2018; and so on), as presented in Table 2 below:
Table 2: Windows in the DEA window analysis model.
window 1 2015 2016 2017
window 2 2016 2017 2018
window 3 2017 2018 2019
window 4 2018 2019 2020
The findings reveal that the bank ownership in the Croatian banking sector does not represent a key determinant in the efficiency of banks, but rather the bank size. These findings are supported by previous studies.
CONCLUSION
The findings do not support the main hypothesis and the notion that foreign banks outperform and are more efficient than domestic banks in Croatia in the observed period. Moreover, this empirical study shows that the bank size has a crucial impact on the banks’ efficiency, which is in line with previous studies. This study is, however, not without limitations. Namely, the COVID-19 pandemic has impacted economies from early 2020 until 2022. This study reveals the first impact of COVID-19 on banks’ efficiencies in the year 2020 only. A further investigation is required with all the pandemic years to get more specific and relevant results.

59
The used methodology and the findings of this empirical research could be of interest to academic members, bank management and policymakers.
Keywords: bank ownership, relative efficiency, data envelopment analysis, window DEA, Croatia.
REFERENCES
[1] Andries, A. M. & Ursu, S. G. (2016). Financial crisis and bank efficiency: An empirical study of European banks. Economic Research–Ekonomska istraživanja, 29(1), 485-497.
[2] Cooper, W., Seiford, L. & Tone, K. (2007). Data Envelopment Analysis: A Comprehensive Text with Models, Applications, References and DEA-Solver Software, 2nd ed.; Springer Science-i-Business Media, LLC: New York, NY, USA.
[3] Cvetkoska, V. & Barišić, P. (2017). The efficiency of the tourism industry in the Balkans. In Proc. of the Faculty of Economics in East Sarajevo, 14: 31-41. DOI:10.7251/ZREFIS1714031C
[4] Davidovic, M., Uzelac, O. & Zelenovic, V. (2019). Efficiency dynamics of the Croatian banking industry: DEA investigation. Economic Research–Ekonomska Istraživanja, 32(1), 33-49. DOI:
10.1080/1331677X.2018.1545596 [5] HNB (2019). Banks bulletin no. 32, Retrieved from: hwww.hnb.hr/documents/20182/2868711/ebilten-o-
bankama-32.pdf/3a0e4fc0-e413-49da-2a9b-3c9fc0ff0b84 (accessed March 09th, 2022).
[6] Neralić, L., & Gardijan Kedžo, M. (2019). A Survey and Analysis of Scholarly Literature in DEA Published by Croatian Researchers: 1978 – 2018. Zagreb International Review of Economics & Business, 22(1), 93-106. DOI: 10.2478/zireb-2019-0014
[7] Pervan, M., Pelivan, I. & Arnerić, J. (2015). Profit persistence and determinants of bank profitability in Croatia. Economic Research–Ekonomska Istraživanja, 28(1), 284-298. DOI: 10.1080/1331677X.2015.1041778
[8] Savić, G., Radosavljević, M. & Ilievski, D. (2012). DEA window analysis approach for measuring the efficiency of Serbian banks based on panel data. Journal for Theory and Practice Management, 65, 5–14
[9] Sufian, F. & Kamarudin, F. (2016). Determinants of efficiency in the Malaysian banking sector: Does bank origins matter? Intellectual Economics, 10(1), 38-54.
[10] Tuškan, B. & Stojanović, A. (2016). Measurement of cost efficiency in the European banking industry. Croatian Operational Research Review, 7(1), 47-66. DOI: 10.17535/crorr.2016.0004

60
BUSINESS PERFOMANCE OF POSTAL OPERATORS
Nataša Čačić*1, Dajana Milić
1, Dragana Šarac
1
1University of Novi Sad – Faculty of Technical Sciences
*Corresponding author, e-mail: [email protected]
OBJECTIVE
The market of courier and postal services, on the global level, is characterized by the dominant presence of requests for transfer of goods and documents, which is especially visible during the COVID-19 pandemic, where restrictions on human movement greatly burdened the postal system and emphasized it's importance. In this market, competition is expressed between courier and postal operators, where the process of market liberalization has contributed to a diverse offer and better services. The business performance of postal operators in the world of electronic commerce (Ralević et al., 2014) is very important because they require fast, reliable, secure communication in the process of delivering items in the last mile. It has been noticed that many postal operators cannot respond to these requests. Measuring the business performance of postal operators (Pierleoni & Gori, 2013; Ralević et al., 2020; Blagojević et al., 2020) is of great importance for the economic development of each country. The aim of this paper is to present the business performance of 5 observed postal operators through the analysis of 15 ratio numbers (Hodžić & Gregović, 2014), in order to get a true picture of the current situation in the competitive market in the Republic of Serbia.
METHODOLOGY
The methodology of this paper implies, that on the basis of business performance, participants in the market of courier and postal services of Republic of Serbia are ranked. The analysis included five courier and postal operators. The work was realized in two steps. The first step involves determining the business performance of the observed operators. In this consideration, 15 ratio numbers were taken into account for the criteria. After that, the method of multicriteria analysis PROMETHEE (Paunović, 2007) in MCDM - Windows Aplication for mild optimization is used. Three types of generalized criteria were used in this application: ordinary linear criterion, quasi-criterion and linear preference criterion. In order to minimize and maximize the criteria, determine the weighting coefficients, the threshold of indifference and preferences, the opinions of experts in the field were taken into account. The results are presented in the form of ranks of observed postal and courier operators according to their business performance.
RESULTS
In Table 1 a list of used ratio numbers and their values is given for each observed operator. Figures 1, 2, 3, 4 present the procedure for obtaining the rank of competitive operators in the market of postal and courier services in the Republic of Serbia. According to the set values, the results of the current situation on the market of postal and courier services were obtained. As the best positioned operator in terms of business performance is the operator 3. After him, the second place is occupied by operator 2, then operator 4 and 5. The last place in the competition is occupied by operator 1, which has the weakest business performance among the observed postal and courier operators.

61
Table 1: Ratio values
RATIO NUMBERS POSTAL OPERATORS
1 2 3 4 5
General liquidity ratio (ROL)
0,64 1,04 1,77 1,20 1,07
Reduced liquidity ratio (RRL)
0,52 1,01 1,77 1,18 1,06
Net working capital (NOS)
-200799 29 966 210 170 151 455 424 115
Customer turnover ratio
(KOK) 16,04 17,68 10,27 11,33 4,62
Inventory turnover ratio
(KOZ) 67,64 137,93 197,62 289,1 103,54
Supplier turnover ratio (KOD)
9,21 12,64 12,61 23,21 7,73
Fixed asset turnover ratio
(KOSI) 4,43 4,50 14,85 1,88 6,23
Turnover ratio of total business assets (KOUPI)
2,97 1,81 3,15 1,4 2,25
Debt ratio (RZ) 27,5% 9,29% 4,23% 45,8% 15,47%
Ratio of capital structure (RSK)
91,82% 11,91% 6,02% 112,14% 38,48%
Ratio of long-term debts to long-term sources
(ODDPDI)
39,5% 9,78% 5,57% 44,31% 23,67%
Coverage indicator (PP)
31,73 29,16 17,49 39,84 7,12
Gross profit rate (SBD)
5,67% 6,13% 0,85% 6,19% 3,56%
Business profit rate (SPD)
8,88% 14,22% 1,67% 19,17% 2.51%
Net profit rate (SND)
4,77% 7,71% 1,85% 13,9% 2,14%
Figure 1: Multi criteria attributes table

62
Figure 2: Preference functions
Figure 3: Middle value, standard deviation, variance
Figure 4: Ranks and flow for each observed operator
CONCLUSION
The contribution of the paper is a model that can be used by independent regulatory agencies in Serbia (Ratel) in the analysis of the efficiency of postal and courier operators as well as in making decisions on the future regulation of the observed market. Based on previous research, this way of comparing postal and courier operators has not been noticed yet.
Keywords: market, postal and courier services, ratio numbers, promethee
ACKNOWLEDGMENT
This research has been supported by the project "Development of innovative solutions with the aim of improving the field of traffic and transport".
REFERENCES
[1] Ralević, P., Denda, N., & Dobrodolac, M. (2014). Measuring the efficiency of e-commerce functioning considering public postal operators. IPoCC - International Postal and e-Communications Conference. Retrieved from www.researchgate.net/publication/346659734_MEASURING_THE_EFFICIENCY_OF_E-COMMERCE_FUNCTIONING_CONSIDERING_PUBLIC_POSTAL_OPERATORS
[2] Pierleoni, M. R., & Gori, S. (2013). Efficiency analysis postal operators: comparison between the United States and Europe. In Reforming the postal sector in the face of electronic competition. Edward Elgar Publishing, 261-276. ISBN 978 0 85793 579 3
[3] Ralević, P., Dobrodolac, M., Švadlenka, L., Šarac, D., & Đurić, D. (2020). Efficiency and productivity analysis of universal service obligation: a case of 29 designated operators in the European countries. Technological and Economic Development of Economy, 26(4), 785-807. DOI: 10.3846/tede.2020.12062

63
[4] Blagojević, M., Ralević, P., & Šarac, D. (2020). An integrated approach to analysing the cost efficiency of postal networks. Utilities Policy, 62, 101002. DOI: 10.1016/j.jup.2019.101002
[5] Hodžić, N., & Gregović, N. (2014). Ratio indicators of the financial position of the company. Jurnal of Economic challenges, 6, 92-105.
[6] Paunović, G. (2007). Market model of multicriteria ranking of postal services. XXV Symposium of new technologies in postal and telecommunication traffic-PosTel. 191-200.

64
ANALYTICAL MODELING OF GRADUATED ECONOMISTS’
EMPLOYMENT
Filip Peovski*1, Predrag Trpeski
1, Igor Ivanovski
1, Violeta
Cvetkoska1
1 University in Skopje – Faculty of Economics * Corresponding author, e-mail: [email protected]
OBJECTIVE
Successful entrance into the labor market is crucial for young graduates. HEIs are directly involved in producing adequate labor supply. Our main goal is to model the two labor market segments (employment and self- employment) in North Macedonia from the perspective of graduate economists.
According to Smith, McKnight, and Naylor (2000), in a UK study, approximately 19% of male graduates were unemployed or inactive for six months after graduation, compared to 14% of female graduates; studying business administration has a negative impact on unemployment; and having a lower social class background increases the likelihood of being unemployed or inactive. Rudakov and Roshchin (2019) show that GPA points have a significant impact on bachelor graduates' monthly wages in Russia. Garcia and Ulloa (2018) show evidence that graduates of private HEIs in Mexico earn higher salaries and have more job stability than graduates of public schools, but the latter experience faster labor market integration. The weak link between universities and employers, as well as heavy theoretical approaches, may hinder market matching (Olo, Correia & Rego, 2022), alongside the lack of career agencies (Monteiro, Almeida & Garcia-Aracil, 2021).
By applying ML techniques and AI visualization, we build upon these findings and contribute to a unique treatment of this topic for a small and developing economy, as it’s the first research of such format in North Macedonia. We enrich the labor market literature and provide recommendations for policy creators and HEIs.
METHODOLOGY
The primary data was obtained through an email-distributed questionnaire to a total of 1,307 graduates enrolled in the period between 2014 and 2018 and graduated throughout the 2017–2021 period. A final sample size is 245. The questionnaire accounted for several segments, supplying information on:
Individual characteristics such as age, gender, place of birth, and total family income,
HE information such as study program, year of study, average GPA, informal education type,
individual perception of competencies achieved in the study program,
Labor market participation through indicators such as employment status, longevity of unemployment after graduation, number of applications, geographic region of work, and sector,
data on workplace satisfaction, salary, and determinants of first employment waiting times.
Responses have been analyzed through ML logistic regression and cluster analysis algorithms, followed by AIvisualization. We used PowerBI as the main analytical tool.

65
RESULTS
Acquired results are analyzed into two segments: descriptive statistics and ML modeling estimates. 68.62% of the respondents were females, and 46% were born in Skopje. Graduates on average finish their four-year bachelor program in 4.41 years, while with a grading system of 5-10, 45.5% of the students graduate with an average GPA below 8.
Figure 1: Distribution of graduates from Skopje by household income
Through a ML logistic regression algorithm, we found that family income significantly affects graduate unemployment, with a 2.24 times higher likelihood in cases of family income under 30,000 MKD. If the age is 24 or less, the unemployment likelihood increases 1.78 times. On the contrary, coming from a higher social background raises the probability of employment by 1.55 times.
Figure 2: Key factors influencing unemployment
Cluster analysis controlled for status being employed, irrespective of sector, and defined three segments. In the first, 100% were employed, with independent factors being male, total family income above 80,000, and not having a bachelor's degree in e-business. In the second, 91.3% were employed, had a bachelor’s in accounting and auditing, had informal education, and came from families with a total monthly income below 80,000. Finally, cluster 3 consists of 90% of respondents being employed, female, having a bachelor’s in financial management, and coming from a higher-income class family.

66
CONCLUSION
The study of graduated economists’ employment indicates that coming from a higher social background raises chances of a higher employability prevalence as well as a higher average GPA and specific undergraduate programs such as accounting or finance. Recent graduates face market mismatch compared to their older colleagues, but we believe that this is due to lower rates of practical experience. We should keep in mind that having a larger sample of respondents may alter results. Transforming study programs into practical, competence-driven processes in the near future should provide a better answer to tackling the crippling problem of high youth unemployment in the Balkan states, such as North Macedonia.
Keywords: labor market, gradate employment, analytics, machine learning (ML)
REFERENCES
[1] Garcia, F. M. & Ulloa, P. Y. M. (2018). Working Conditions of Graduates from Higher Education Institutions in Mexico, Revista Electronica De Investigacion Educativa, 20(3), 56-68. DOI: 10.24320/redie.2018.20.3.1644
[2] Monteiro, S., Almeida, L. & Garcia-Aracil, A. (2021). It's a very different world: work transition and employability of higher education graduates. Higher Education, Skills and Work-Based Learning, 11(1), 3-19. DOI: 10.1108/HESWBL-10-2019-0141
[3] Olo, D., Correia, L., & Rego, C. (2022). How to develop higher education curricula towards employability? A multi- stakeholder approach. Education + Training, 64(1), pp. 89-106. DOI: 10.1108/ET-10-2020-0329
[4] Rudakov, V. & Roshchin, S. (2019). The impact of student academic achievement on graduate salaries: the case of a leading Russian university. Journal of Education and Work, 32(2), 156-180. DOI:
10.1080/13639080.2019.1617839 [5] Smith, J., McKnight, A. & Naylor, R. (2000). Graduate employability: Policy and performance in higher education
in the UK. The Economic Journal, 110(464), 382-411. www.jstor.org/stable/2566136
67
ANALYSIS OF THE DETERMINANTS OF GRADUATES EMPLOYABILITY
Kristijan Kozheski*1, Vesna Bucevska
1, Aleksandra Janeska-Iliev
1
1 Ss. Cyril and Methodius University in Skopje – Faculty of Economics *Corresponding author, e-mail: [email protected]
OBJECTIVE
Having a university degree does not guarantee employment, hence finding and then keeping a job, especially for young people is a major issue in most economies. In the segment of Higher education institutions (HEI) everywhere around the globe pressure is growing to produce employable graduates (Grotkowska et al, 2015; Mok et al., 2016). Obtaining a complete and integrated picture of the conditions and tendencies in the labor market should inevitably be accompanied by an analysis of employability of the young, highly educated workforce. Considering that, analyse of the characteristics of graduates (young students who are in their final year of studies), as well as the factors that affect their integration in the labor market, are gaining importance as a result of increased mobility and competitiveness in the labor market. They have raised great research interest and therefore have been included in this research paper. Employability is about being capable of getting and keeping fulfilling work (Hillage & Pollard, 1998). In this context higher education institutions (HEI) worldwide have been under pressure to produce employable graduates (Grotkowska et al, 2015; Mok et al., 2016). Higher education institutions (HEI) contribute to external benefits by providing young workers with an opportunity to invest in human capital rather than being unemployed, stimulate the local economy and drive productivity spillovers (Hermannsson, Rosario, & Marcello, 2021). The objective of this paper is to determine the basic factors that affect the employability of students before graduation. Research is based upon the sample consisted of the students of Faculty of Economics – Skopje, who are in their final year of studies. The questionnaire distributed includes well designed and structured questions, so that it provided solid foundation for information to be obtained related to their demographic, economic characteristics, as well as their average grade, and their opinion about their future goals. Most of the information is based on the student’s own perception, so student self-perceived employability is considered. In this light employability of graduates has taken more importance in recent years due to the grim economic situation, growth, and an increasingly competitive global labor market. The self-perception is a critical component of employability; to comprehend the term employability, an assessment of this vital component and its elements is required. Apart from examining and understanding the students’ perceptions of their prospect of success in the graduate labour market the objective of this paper is to examine the main influence of various factors related to this field of study considering the Macedonian economy.
METHODOLOGY
For the purpose of this research, direct and indirect methods have been applied. In order to collect primary data, for the needs of the research, a questionnaire was created which was distributed to fourth year students. The questionnaire consists of 25 questions that are divided into several logical areas: First, demographic and economic characteristics of students; Second, questions related to the choice of the study program and the achieved success in studying; Third, questions about their views on the introduction of practical teaching in the educational process; Fourth, questions related to their goals; Fifth, issues related to continuing the study within the postgraduate studies; Sixth, questions related to choosing a job. The total number of respondents who answered the questionnaire is 200 students. Additionally, in order to examine the integration in the labor market, ie the probability of their employment after graduation, as a function of the average success, family income, place of residence, and whether during the studies they had any form of employment applied is an econometric analysis using Binary Logistic Regression.

68
14%
9%
5%
8 - 8.5
8.51 - 9
9.01 - 9.5
9.5 - 10
70% 2%
below 8
23% 39%
30.000 - 50.000
14% 50.001 - 80.000
above 80.000
24% below 30.000
RESULTS
Most of the respondents come from families with a monthly income between 30,000 - 50,000 MKD - 39%, while 24% of students emphasized that their family has an income of 50,000 - 80,000 MKD. It should be noted that about 23% of fourth year students come from families with a monthly income lower than 30,000 mkd. In terms of the success that students have achieved during their studies, 70% of students have achieved an average success of below 8, while only 7% of students have achieved an average success above 9. The basic research findings indicate the fact that there is a statistically significant positive relationship between employability after graduation and the realization of some form of employment during the study. Hence, the basic hypothesis is confirmed that students who during their studies have achieved some kind of integration in the labor market, are significantly more likely to be employed immediately after graduation. The level of income in the student's family also has a statistically significant positive correlation on their likelihood of employment after graduation. The place of residence, although it increases the probability of employment of students, still does not show a statistically significant relationship. Given the fact that about 53% of students come from Skopje, but also the increased mobility among the population are part of the factors that lead to the statistically insignificant coefficient of residence.
Figure 1. Distribution of 4th year students according to the achieved average success (%)
Figure 2. Distribution of 4th year students according to family income (in MKD denars, %)
CONCLUSION
At a time of increasing labor mobility, Higher Education Institutions (HEIs) have the task of producing employable graduates, on which to base the growth of human capital in developing countries. In this context, based on the sample of the students who are the subject of analysis in this paper, it can be concluded that about 50% of them have established some kind of work engagement in parallel with their studies. Hence, the

69
integration of the labor market during the studies, in addition to providing financial benefit for students, allows them to gain the necessary experience and skills, which facilitates the employment process after graduation. This statement is confirmed by the fact that students who had some form of employment during their studies are more likely to be employed immediately after graduation. Student family income is also one of the factors that have a statistically significant, positive impact on the likelihood of employment immediately after graduation. Regarding the place of residence, it can be concluded that it does not show a statistically significant relationship. However, such a coefficient is considered justified given the increased mobility of the population, as well as the small geographical distance.
Table 1: Results form Binary Logistic Regression model Variable Coefficient Std. Error z-Statistic Prob.
C 0.837680 0.604901 1.384822 0.1661
Average grade -0.974985 0.490678 -1.987016 0.0469
Employment 0.973888 0.397149 2.452202 0.0142
Income 1.93E-05 8.34E-06 2.309099 0.0209
Residence 0.232592 0.415704 0.559515 0.5758
The results of the research are an initial direction, based on which it is optimal to conduct additional research.
Keywords: labor market, graduation students, possibility of employment, determinants of employability
REFERENCES
[1] Celine S., Dominic, M. Savitha Devi, M. (2020) Logistic Regression for Employability Prediction, International Journal of Innovative Technology and Exploring Engineering, 9(3), 271-2477.
[2] Grotkovska, G., Wincenciak, L., & Gajderowicz, T. (2015). Ivory-tower or Market-oriented Enterprise: The Role of Higher Institutions in Shaping Graduate Employability in the Domain of Science. Higher Education Research and Development, 869-882.
[3] Hermannsson, K., Rosario, S., & Marcello, G. (2021). The Effect of Higher Education on Youth Unemployment in European Regions During a Period of Economic Instability. Journal of Education Finance, 477-495.
[4] Hillage, J., & Pollard, E. (1998). Employability: Developing a Framework for Policy Analysis. London: Department for Education and Employment.
[5] Mok, K., Wen, Z., & Dale, R. (2016). Employability and Mobility in the Valorisation of Higher Education Qualifications: The Experiences and Reflections of Chinese Students and Graduates. Journal of Higher Education Policy and Management, 264-281.
[6] Oancea, Bogdan and Pospisil, Richard and Dragoescu, Raluca, A (2016), Logit model for the estimation of the educational level influence on unemployment in Romania, MPRA Paper No. 81719.
[7] Tengku Mohamed, T.S. & Lee, M. H. (2021) Robust Logistic Regression for Graduate’s Employability from Public Universities in Malaysia. MATEMATIKA: MJIAM, 37(1), 33-43, Penerbit UTM Press.

70
SIMULATION MODELS IN THE FUNCTION OF CENSORED DEMAND MANAGEMENT OF HIGHER EDUCATION PROCESSES IN
THE ERA OF DIGITALIZATION
Mirjana Landika*1, Nina Uremović
1, Jana Aleksić
1
1Pan-European University “Apeiron”
*Corresponding author, e-mail: [email protected]
OBJECTIVE
The higher education institution, Pan-European University "Apeiron" Banja Luka, did not find itself in this situation due to the possession of a platform called LDL (long distance lerning), but whose potential has not been fully exploited. This platform includes hours of recorded teaching material supplemented by written documents, which allow students who are not present in the classroom to master the teaching materials provided by the subject syllabus. The hypothetical framework of the research refers to placing the service on a neglected market segment with the possibility of achieving a satisfactory profit and expanding business in this direction. The methodological framework of the research refers to the application of mathematical simulation models in the process of demand forecasting, which we've marked as censored demand, and refers to the possibility of placing products on the diaspora marketing segment, which includes profiles educated in health, sports, economic, information and traffic engineering.
METHODOLOGY
The mathematical simulation model enables an experiment on a virtual business system, which does not require any concrete actions, but enables the calculation of management consequences that are reliably mapped from a virtual to a real business system. The variables structure in the mathematical simulation model refers to the service price, as an input variable, the service demand as a random variable and sales revenue as a criterion output variable in the mathematical simulation model. The value of the random variable, in the planned and conducted research procedure, which is the demand for the described services, is obtained by adequate prognostic methods, which in this case are long-term development tendency - trend and Delphi method. Future demand is not easy to detect, and it cannot be the result of the past events analysis, because there are qualitative aspects that significantly affect it.
RESULTS
The conducted procedure indicates that the following sales revenues are obtained from selling the access to the distance learning platform (Long Distance Learning), and in relation to the proposed business strategies, it enables the sales revenue shown in the following table. From the table it is clear that it is best to choose the first strategy, because increasing the volume of activities is not enough to provide an increase in revenue that would economically justify the benefits provided by the mentioned strategy.

71
Table 1. Results of mathematical simulation (Landika et al., 2022)
Strategy Average annual realization Average annual revenue
Rule 1 54.000 16.200,00
Rule 2 56.700 15.946,88
Rule 3 59.400 16.017,21
CONCLUSION
Placing an existing product on the market segment of the highly educated diaspora with a business mood within the professional activity in the field of native language for people educated in a non-native language is an area of censored demand for higher education institution. The sample size, the empirical distribution estimation and the modeling procedure enable a high degree of credibility of the modeling results on a specific task. The modeling process shows a concrete monetary contribution to the budget of the higher education institution, which is expressed by the interval of projected revenues from 15,946.88 - 16,200.00 monetary units, and in accordance with the chosen strategy of market share. The chosen development direction has a specific monetary justification but requires investments in marketing activities that would bring the offer closer to potential customers.
Keywords: econometric methods, education, factor demand, factor productivity, management, Monte Carlo, resampling, simulation
REFERENCES
[1] bhinfodesk. (2018). BH DIJASPORA. Retrieved from bhdinfodesk.com/2018/12/14/gdje-zivi-najobrazovanija-bh-dijaspora/
[2] Hrvatsko_iseljeništvo (2022). Wikipedija. Retrieved from hr.wikipedia.org/wiki/Hrvatsko_iseljeni%C5%A1tvo [3] Landika, M., & Mikić, Đ. (2011). Modeliranje upravljačke simbioze prirodnih i ekonomskih entiteta u funkciji
održivog razvoja. In ICASD (pp. 72-75). Banja Luka: Panevropski univerzitet "Apeiron". [4] Landika, M., & Račić, Ž. (2020). Modelske predikcije stvarne tražnje u okviru uslužne djelatnosti. ESCA World
Bilten, 51-63. [5] Landika, M., Sredojević, V., & Bojanić, R. (2017). Simulations models in the function of optimization of strategic
selection of foring market competetives. In Knowlege based sustainable economic development (pp. 109 - 115). Beograd: Faculty of Buisiness Studies, Podgorica Monte Negro, and other.
[6] Landika, M., Uremović, N., & Aleksić, J. (2022). Istraživanje i analiza. Banja Luka: Panevropski univerzitet "Apeiron".
[7] Srpska dijaspora (2021). Wikipedija. Retrieved from sh.wikipedia.org/wiki/Srpska_dijaspora [8] Uremović, N., & Tatarević, S. (2020). Mogućnosti za poboljšanje obrazovanja odraslih u Republici Srpskoj.
Sportske nauke i zdravlje, X(2), 143-159.

72
ONLINE VS HYBRID TEACHING - COMPARISON OF STUDENTS'
PERFORMANCE ON PRE-EXAM OBLIGATIONS
Milan Radojičić*1, Milica Maričić
1, Veljko Uskoković
1
1University of Belgrade – Faculty of Organizational Sciences *Corresponding author, e-mail: [email protected]
OBJECTIVE
The aim of the study is to examine whether there is a difference in student motivation and success in pre-exam obligations in terms of how teaching is conducted. Due to the corona virus pandemic, all teaching at the Faculty of Organizational Sciences in the summer semester of 2021 took place online, while in the summer semester of 2022, teaching were held on a hybrid model. The hybrid model implied that lectures are conducted in online teaching while exercises in direct teaching model. The assumption we want to test is whether students achieve better results in the hybrid teaching model. Recent papers on similar topics usually compared pre-pandemic performance with performance during the pandemic (Chisadza et al., 2021; Clark et al., 2021; Dwijuliani et al., 2021; Engelhardt et al., 2021; Nazempour et al., 2022). Novelity of this paper is that it compares performance during the pandemic with post-pandemic performance.
METHODOLOGY
The analysis includes the results of students achieved in the first seven pre-exam obligations in Statistics course, during 2021 and 2022. Pre-exam obligations are fulfilled continuously during the semester. Every week, students take tests related to the material learned previous week. The tests are taken online and in those first seven weeks it was possible to score a maximum of 16 points. The analysis includes methods of descriptive and inferential statistics. Due to the large sample, it was possible to use parametric tests. The results were obtained and interpreted using the IBM SPSS software package.
RESULTS
The total number of students who took pre-exam obligations from the first seven tests in 2021 is 964, or 83.75% of the total number of students registered for the course. For 2022, that number is 1057, or 87.72%. This result indicates that the activity of students on pre-exam obligations has increased with the change of teaching model. This was confirmed with the Chi-square Test of Independence (with the Yates's correction for continuity), which showed the existence of a statistically significant relationship of low effect size between student activities on pre-exam obligations and teaching model. The average number of points earned on pre-exam obligations during online teaching model was 13.17 (with a standard deviation of 3.58), while for the hybrid teaching model it was 10.57 (with a standard deviation of 3.45). The Independent Samples T-Test showed the existence of a statistically significant difference of moderate effect size (Cohen's d = 0.12) in the achieved points on pre-exam obligations in relation to the teaching model. During online teaching model students scored significantly more points on average. The obtained result is the opposite of what was expected. Table 1 shows the average number of points earned per test. It is obvious that even according to individual tests, it did not happen that a better result was achieved during hybrid teaching model.

73
Table 1: Average points per tests
Teaching model
Test I Test II Test III Test IV Test V Test VI Test VII
Online 2.74 2.64 1.85 1.74 1.85 1.85 1.73 Hybrid 2.71 2.46 1.81 0.67 1.24 1.43 1.41
CONCLUSION
The obtained result may indicate that performance of students is better in online teaching model. However, it is important to emphasize that this analysis did not take into account the factor of time for test submission or the number of test variations. Time for test submission was shortened by a third in 2022, while the number of test variations was twice as high as in 2021. Possibly this change is a hidden factor of influence that has significantly contributed to the weaker results in 2022. This should be examined in future works.
Keywords: online teaching, hybrid teaching, students’ performance
REFERENCES
[1] Chisadza, C., Clance, M., Mthembu, T., Nicholls, N., & Yitbarek, E. (2021). Online and face‐to‐face learning:
Evidence from students’ performance during the Covid‐19 pandemic. African Development Review, 33, S114-
S125. [2] Clark, A. E., Nong, H., Zhu, H., & Zhu, R. (2021). Compensating for academic loss: Online learning and student
performance during the COVID-19 pandemic. China Economic Review, 68, 101629. [3] Dwijuliani, R., Rijanto, T., Nurlaela, L., & Basuki, I. (2021). Increasing student achievement motivation during
online learning activities. Journal of Physics: Conference Series, 1810(1), 12072.
[4] Engelhardt, B., Johnson, M., & Meder, M. E. (2021). Learning in the time of Covid-19: Some preliminary findings. International Review of Economics Education, 37, 100215.
[5] Nazempour, R., Darabi, H., & Nelson, P. C. (2022). Impacts on Students’ Academic Performance Due to Emergency Transition to Remote Teaching during the COVID-19 Pandemic: A Financial Engineering Course Case Study. Education Sciences, 12(3), 202.

74
FUZZY LINEAR FRACTIONAL PROGRAM STRICTLY BASED ON EXTENSION
PRINCIPLE USING LINEAR MODELS
Bogdana Stanojević*1, Milan Stanojević
2
1Mathematical Institute of the Serbian Academy of Sciences and Arts
2University of Belgrade – Faculty of Organizational Sciences
*Corresponding author, e-mail: [email protected]
OBJECTIVE
In the recent literature on fuzzy fractional programming the extension principle was involved in evaluating the elementary operations on fuzzy numbers but it was neglected when the solution concept was formulated, even thought that the extension principle was created to generalize the crisp mathematical
concepts to concepts compatible with the fuzzy set theory.
Any partial neglecting of the extension principle within optimization in fuzzy environment may have twofold
negative consequences on the fuzzy solutions: (i) it moves the solutions out of their proper bounds; and (ii) it distorts their shapes. Following the ideas presented by Stanojević et al., 2021 and Diniz et al., 2021, we
aim to revitalize the extension principle within linear fractional optimization with fuzzy numbers. This paper presents some theoretical results about constructing optimal values to the class of full fuzzy linear fractional programming (FF-LFP) problems having parameters described by trapezoidal fuzzy
numbers. We propose linear optimization models for finding the endpoints of the optimal α-cuts thus obtaining the entire shape of the optimal objective function fuzzy value. Our approach is conceived to fully
comply to the extension principle which is not the case of the approaches introduced in (Das et al., 2017, Kaur & Kumar, 2017, Ebrahimnejad et al., 2018; Loganathan & Ganesan, 2021).
METHODOLOGY
To define a solution concept based on the extension principle, first we have to accordingly define the
membership function of the optimal objective value, and then to proceed to formulate the mathematical models able to derive them. So far, Stanojević & Stanojević, 2021 introduced a solution approach based on
the extension principle to full intuitionistic fuzzy transportation problem. Using the endpoints of the coefficients’ α-cuts we derive the corresponding endpoints of the objective function’s α-cut, and through optimization we obtain the endpoints of the optimal objective values intervals
for each value of the parameter α. For initial maximization (minimization) FF-LFP problems we have to solve two stage min-max (max-min) problems to derive the final left (right) endpoints. We overcome this
issue by replacing the inside maximization (minimization) problems with their dual ones.
Figure 1: The fuzzy sets of optimal objective values for the example introduced by Kaur & Kumar, 2017

75
RESULTS
Our numerical results confirm the theoretical findings, and show that the ranges of the fuzzy optimal objective values derived by our approach are narrower than those derived by approaches from the
literature (see Figure 1). This is due to the proper employment of the extension principle in all steps of the solution approach. A narrower optimal objective fuzzy value means a more precise result, i.e. a better
model to an uncertain result.
CONCLUSION
Our novel solution approach is able to numerically describe the membership functions of the fuzzy set
value and fuzzy set solution to FF-LFP problems. The approach is effective since involves linear optimization models, and is more precise than other approaches from the literature since provides narrower fuzzy numbers as fuzzy optimal objective values.
We plan to conduct more experiments on a wider class of problems in order to prove that the extension principle is crucial and must be respected in the formulation of any solution concept to an optimization problem in fuzzy environment.
Keywords: linear fractional programming, fuzzy numbers, extension principle, linear optimization models
REFERENCES
[1] Das, S.K., Mandal, T., & Edalatpanah. S.A. (2017). A new approach for solving fully fuzzy linear fractional program-ming problems using the multi-objective linear programming. RAIRO-Oper. Res., 51(1), 285-297. DOI: 10.1051/ro/2016022
[2] Diniz, M.M., Gomes, L.T., & Bassanezi. R.C. (2021). Optimization of fuzzy-valued functions using Zadeh's extension principle. Fuzzy Sets and Systems, 404, 23-3). DOI: 10.1016/j.fss.2020.07.007
[3] Ebrahimnejad, A., Ghomi, S.J., & Mirhosseini-Alizamini. S.M. (2018). A revisit of numerical approach for solving linear fractional programming problem in a fuzzy environment. Applied Mathematical Modelling, 57, 459-473. DOI: 10.1016/j.apm.2018.01.008
[4] Kaur, J., & Kumar, A. (2017). A novel method for solving fully fuzzy linear fractional programming problems. a. Journal of Intelligent & Fuzzy Systems , 33(4), 1983-1990. DOI: 10.3233/JIFS-151993 [5] Loganathan, T., & Ganesan. K. (2021). Solution of fully fuzzy linear fractional programming problems – A
simple approach. IOP Conf. Ser.: Mater. Sci. Eng., 1377, 012040. DOI: 10.1088/1757-899X/1130/1/012047. [6] Stanojević, B., Stanojević, M., & Nădăban, S. (2021). Reinstatement of the Extension Principle in Approaching
Mathematical Programming with Fuzzy Numbers. Mathematics, 9, 1272. DOI: 10.3390/math9111272 [7] Stanojević, B., & Stanojević, M. (2021). Approximate membership function shapes of solutions to intuitionistic
fuzzy transportation problems. International Journal of Computers Communications Control, 16(1), 4057. DOI: 10.15837/ijccc.2021.1.4057

76
BLOCKCHAIN: APPLICATION OF MACBETH METHOD FOR RANKING
CRYPTO PROJECT FACTORS
Minja Marinović*1, Milena Popović
1, Bisera Andrić Gušavac
1
1University of Belgrade – Faculty of Organizational Sciences
*Corresponding author, e-mail: [email protected]
OBJECTIVE
In recent years, there has been a big growth of crypto projects around the world. All of this is due to the blockchain technology which became a real game changer in software development as well as in business progress. That is the reason why blockchain technology is more present than any time before. The aim of this paper is to define a list of most important factors to consider in case of planning to invest in crypto projects. In order to do that, authors gathered the list of factors which are good to be considered before possible investment. All given factors are evaluated by the experts from this area, where authors conducted a study, and experts made they decisions based on previous experience and their knowledge. For evaluation of gathered results, authors used the MACBETH (Measuring Attractiveness by a Categorical Based Evaluation Technique) method to quantify and rank the factors by their importance. Given results showed ranked list of factors with their importance.
METHODOLOGY
Blockchain is definite a spine of the cryptocurrency since its acting as a secured decentralized system for documenting and recording transactions (Nofer et al., 2017). This fact is more than enough for researchers and teams to find application in almost every industry nowadays. Cryptocurrencies get their value on the basis of the scale of community involvement, demand, usability and a lot more factors. MACBETH is a decision-making subject based multiatributive method for obtaining weighting coefficients of criteria based on qualitative assessments of experts. This method is proposed by Bana e Costa thirty years ago (Bana e Costa et al., 1994). So far, this method has more than 200 scientific papers in international journals (SCOPUS, 2022). MACBETH method has become a powerful quantitative analytical tool for measuring and evaluating the weight coefficients of the factors.
RESULTS
The idea of this research is to identify the most important factors that affects some crypto project. Results of survey conducted in the Republic of Serbia, among the experts in blockchain technology showed that some of them are definitely more important than the others. Survey had 15 factors divided in four clusters based on type of affection. Since this field is still new and the fact that is hard to find a real expert, only 13 respondents filled the survey. The questionnaire was divided into two parts. First was to rank and evaluate the clusters by attractiveness, and the second one was to rank (Saaty, 1977) and evaluate factors in every cluster. Results showed that the three most important factors which are influencing projects are team and community around the project (including advisors, tech team and their social network profiles), usability od their token (if applicable) and their vision (long term vision of the project and its impact in the future). Authors also defined criterions that directly and indirectly affect its final price. Some of them even include the project impact on environment and the fact that whole crypto industry is using more electric energy than usual, but this criterion showed its still not effecting the price in such way.
77
CONCLUSION
Cryptocurrencies are wildly volatile, and we all are aware of it. This can be the main reason for possible investment in crypto projects. Each investor should independently evaluate every project before any decision. Authors are aware that there are some limits of applicability of the results, since this technology is still quite new. Recommendations for further research include real case application and testing on selected crypto projects.
Keywords: blockchain, crypto projects, MACBETH method
REFERENCES
[1] Bana e Costa, C. A., & Vansnick, J. C. (1994). MACBETH—An interactive path towards the construction of cardinal value functions. International transactions in Operational Research, 1(4), 489-500.
[2] Nofer, M., Gomber, P., Hinz, O., & Schiereck, D. (2017). Blockchain. Business & Information Systems Engineering, 59(3), 183-187. DOI: 10.1007/s12599-017-0467-3.
[3] Saaty, T. (1977). A scaling method for priorities in hierarchical structures, Journal of Mathematical Psychology, 15(3), (pp 234-281). DOI: 10.1016/0022-2496(77)90033-5.
[4] SCOPUS, (2022). (www.scopus.com/home.uri), accessed 25.04.2022.

78

79
CREATIVITY, INNOVATION AND SUSTAINABLE MANAGEMENT

80
THE ROLE OF SMES IN THE SUSTAINABLE ENERGY TRANSITION
Wellington Alves *1, Paula Ferreira
2, Julio César
3
1University of Minho – Escola Superior de Tecnologia e Gestão
2University of Minho – School of Engineering
3Federal University of Pernambuco
*Corresponding author, e-mail: [email protected]
OBJECTIVE
Over the past decades, academics, governments, and companies have increasing concerns regarding the urgency for a sustainable energy transition. Nonetheless, in the industrial sector, the adoption of renewable energy solutions tends to experience significant barriers and obstacles. Technical and economic aspects are the main challenges faced by companies when implementing these initiatives, especially for Small-medium-sides enterprises (SMEs) (Meijer et al., 2019). Climate change boons us with the unpredictable task of meeting the increasing energy needs of the modern society while reducing greenhouse gas emissions produced by primary energy of the industrial sector. Since SMEs are key drivers for economy and industries in many countries worldwide, they can be used to enable the transition to sustainable energy systems (Ali et al., 2010; Meijer et al., 2019). Having in mind the role of SMEs on contributing to a sustainable energy transition, this research attempts to contribute to analyze barriers and drivers faced by SMEs in this path, resorting to the case of a SMEs operating in t in the clay extraction and processing in Brazil.
METHODOLOGY
This research draws on a case-study approach, involving qualitative data from the current literature which focus on sustainable energy transition for SMEs, and quantitative data from an extractive industry in Brazil, which was used in order to illustrate the objective of this research. Data from the selected company was analyzed in the light of the implementation of photovoltaic (PV) system to reduce the amount of electricity purchased from the grid and improve security of supply. In doing so, the research first draws on literature review and then proceeded with the application of the case study.
RESULTS
This research aimed to shed light upon the barriers and drivers of SMEs in the sustainable energy transition. From the literature review, a set of barriers faced for SMEs regarding the implementation of sustainable energy systems were identified. The results presented in Table 1 shows that the company has an important role on creating direct and indirect jobs for local community as well to economic development of Buíque which is the city where the company is located. In the city of Buíque, the industrial sector is an important sector of the economy, it represents about 2,3 % of the GDP, followed by Farming (58,6%), Public administration (58,6%) and Services sector (26,1%). From the energy perspective, the results put in evidence an illustration of the energy need for the company, showing that the operations of the company are powered by three main sources of energies, namely diesel, electricity, and woods. The results showed that these companies are in the early stages regarding the implementation of green technologies specially those ones related to renewable energy systems. This is particularly relevant for companies operating in less developed regions and lacking the required knowledge and resources to engage in this transition.

81
CONCLUSION
This research provides a first attempt to analyze barriers and opportunities of the potential applications of green technologies for energy systems in SMEs, as well its contribution for the transition for a sustainable energy. The results from the empirical analyses carried out, showed economic benefits can be the most positive impact from implementation of renewable energy systems for these companies. On the other hand, challenges such as the high costs associated with implementation of these systems, as well the lack technologies and technical support, persist as the main barriers faced by those. Findings from this research call academics to explore the role of SMEs from different sectors on contributing for a sustainable energy transition and to improve regional wellbeing. Also, there is a need to understand the involvement of all actors such governments, universities, and research centers on supporting these companies on bridging the gap between small industries activities and sustainable energies systems.
ACKNOWLEDGEMENTS
This work has been supported by national funds through FCT- Fundação para a Ciência e Tecnologia through project UIDB/04728/2020 and UIDB/00319/2020 (Ferreira).
Keywords: SMEs, mining, sustainable energy, Brazil
REFERENCES
[1] Ali, M. H., Wu, B., & Dougal, R. A. (2010). An overview of smes applications In Power And Energy Systems. Ieee Transactions On Sustainable Energy, 1(1), 38-47. Doi: 10.1109/Tste.2010.2044901
[2] Meijer, L. L. J., Huijben, J. C. C. M., Van Boxstael, A., & Romme, A. G. L. (2019). Barriers and drivers for technology commercialization by smes in the Dutch sustainable energy sector. Renewable And Sustainable Energy Reviews, 112 (June 2018), 114-126. Doi: 10.1016/J.Rser.2019.05.050
[3] Stephenson, E., Doukas, A., & Shaw, K. (2012). Greenwashing Gas: Might A ‘Transition Fuel’ Label Legitimize Carbon-Intensive Natural Gas Development?. Energy Policy, 46(2012), 452-459. DOI: 10.1016/J.Enpol.2012.04.010

82
SUSTAINABLE COST MANAGEMENT OF RENEWABLE ENERGY COMPANIES
Nemanja Backović*1, Bojan Ilić
1
1University of Belgrade – Faculty of Organizational Sciences
*Corresponding author, e-mail: [email protected]
OBJECTIVE
The paper analyzes the cost efficiency of renewable energy sources in terms of their energy efficiency and impact on investment in the energy sector. The focus is on a modern approach to cost analysis and the economic importance of relevant cost monitoring methods, given that fossil fuel exploitation still has an immense impact on climate change processes. In this paper, efforts are being made to examine the cost structure in the field of renewable energy sources, in order to highlight the challenges that investors face in terms of the business performance of power plants. Starting from microeconomic analysis, the impact of renewable energy sources on general economic indicators is determined, with an emphasis on the restructuring of the energy sector. The importance of the cost in the field of renewable energy for the development of various business aspects is emphasized, with special reference to the nature of costs and their dynamics. The paper examines how the control of total costs affects the sustainability of the power plant's operations, its long term overall business results and the efficiency of renewable energy deployment.
METHODOLOGY
In business practice, it is important to understand the relevance of costs to the company (Milićević & Ilić, 2014). Empirical research has shown that a continuous program of cost reduction over time can become the core of the company's competence, as a relevant factor in the survival of the company in the face of competitive pressures (Ilić & Milićević, 2009). The method of cost analysis for the use of renewable energy sources that is used mostly in this paper is the LCOE (Levelized Cost of Energy) method. LCOE is the present value of the total costs of construction and operation of the power plant during its economic use, converted into an equal amount of electricity generated by the power plant, expressed in W/h (watt/hour) (International Renewable Energy Agency (IRENA), 2020; Papapetrou & Kosmadakis, 2022). LCOE is the most efficient tool for ranking different energy sources by cost efficiency and for benchmarking (Abdelhady, 2021). Although the LCOE method omits “what-if” analysis of the changes as a static measure of cost comparison, with the help of stochastic simulation methods and sensitivity analysis it provides a very precise insight into the flow of costs and risk management, especially for a short period of time (Lee & Zhong, 2014). An important stimulus is technological progress for modern energy generation, as the robustness and risk of distortion in the system are still highlighted (Aldersey-Williams et al., 2019).
RESULTS
The paper gives an insight into comparative analysis of costs for renewable energy companies. Results indicate that the current cost trends have a positive impact on business performance, stimulating further investments in renewable energy. It is shown that in the long run vital renewable sources of energy will be economically feasible. The aspects of doing contemporary business within the circular economy are also important, as findings indicate relevance for the sustainable eco-system model. Within the paper significant findings related to cost management are presented, giving a useful implication for the research framework.

83
CONCLUSION
It can be concluded that the cost management of energy companies in the field of renewable energy sources and their development are innovative processes of creating advantages and unique competencies, based on flexible adaptation to market conditions. High dependence of the energy company on energy policy forms an adaptable organizational structure of management with a specific approach, based on the knowledge and necessary skills of managers, in order to achieve optimal business performance.
Keywords: cost management, renewable energy, business sustainability, business performance
REFERENCES
[1] Abdelhady, S. (2021). Performance and Cost Evaluation of Solar Dish Power Plant: Sensitivity Analysis of Levelized Cost of Electricity (LCOE) and Net Present Value (NPV). Renewable Energy, 168, 332-342. DOI: 10.1016/J.RENENE.2020.12.074.
[2] Aldersey-Williams, J., Ian D. B., & Strachan, P. A. (2019). Better Estimates of LCOE from Audited Accounts – A New Methodology with Examples from United Kingdom Offshore Wind and CCGT. Energy Policy, 128, 25-35. DOI: 10.1016/J.ENPOL.2018.12.044.
[3] Ilić, B., & Milićević, V. (2009). Menadžment Troškova – Strategijski Okvir. Beograd: Univerzitet u Beogradu, Fakultet organizacionih nauka.
[4] International Renewable Energy Agency (IRENA). 2020. Renewable Power Generation Costs in 2020. [5] Lee, C. W., & Zhong, J. (2014). Top down Strategy for Renewable Energy Investment: Conceptual Framework
and Implementation. Renewable Energy, 68, 761-773. DOI: 10.1016/J.RENENE.2014.03.015. [6] Milićević, V., & Ilić, B. (2014). Ekonomika Poslovanja. Beograd: Univerzitet u Beogradu, Fakultet organizacionih
nauka. [7] Papapetrou, M., & Kosmadakis, G. (2022). Chapter 9 - Resource, Environmental, and Economic Aspects of
SGHE. In Salinity Gradient Heat Engines, Woodhead Publishing Series in Energy, edited by A. Tamburini, A. Cipollina, and G. Micale (pp. 319-353). Woodhead Publishing.

84
IS PROFIT IMPORTANT TO THE SUSTAINABLE MANAGEMENT OF SOCIAL ENTERPRISE? CASE OF
CROATIA
Ivana Bilić*1
1University of Split – Faculty of Economics, Business and Tourism
*Corresponding author, e-mail: [email protected]
OBJECTIVE
(Gupta et al., 2020) revealed five key areas where social entrepreneurship has been researched in SSCI journal articles: 1) social elements; 2) innovation; 3) human resources; 4) business strategy and value creation, and 5) challenges faced by social entrepreneurship. The main focus was on strategy, value creation, performance, marketing, and business models. Even social component is inevitable (Gupta et al., 2020, Rey-Martí et al., 2016, Renko, 2013); general business characteristics such as innovations, creativity, business strategy, human resources, and profitability are essential for sustainable survival and growth of any social enterprise (Miller et al., 2012; Roberts & Woods, 2005). In nature, entrepreneurship has profit as a motivator for a sustainable social business venture in the same market. Furthermore, primary research efforts regarding social entrepreneurship were related to its social mission. Before, in Croatia, as a form of social entrepreneurship, the 'coop' was the only form of social entrepreneurship observed solely as 'social.' The main objective of this paper is to research the perception of the business students regarding essential business principles of social entrepreneurship, such as sustainability, growth, development, and profit. Along with the primary objective, a supportive one was to raise the students' awareness that the main business principles for any profit business are the ones that need to be incorporated into social entrepreneurship.
METHODOLOGY
The research was conducted on the sample of business students at the University of Split, Faculty of Economics, Business and Tourism, from March-May 2022 in an online form. The main goal was to examine if the students observed 'social' businesses as sustainable and profitable. Standard Likert five-point scale was used (1 – Strongly disagree; 2 – Disagree; 3 – Neither agree nor disagree; 4 – Agree, and 5 – Strongly agree). Survey questions have been formulated to explore students' attitudes regarding social entrepreneurship. The main focus was on the profitability of the social venture and the role of profit in the sustainable development of the social enterprise.
RESULTS
The preliminary survey reveals that 50% of respondents think social enterprise must be profitable (Figure 1), while only 27% think that social entrepreneurs can achieve good earnings from the business. Furthermore, 42% of respondents think profitability is necessary to survive and fulfill the social mission (Figure 2). In comparison, 54% profitability is necessary for the future development of social enterprise, while 43% think it is essential to be competitive in the market.

85
Figure 1: Social enterprise must be profitable
Figure 2. Social entrepreneurship must be profitable to survive and fulfill the mission
CONCLUSION
Preliminary results showed that students generally understand the role of profit in business, with a positive attitude towards entrepreneurship. Lack of knowledge regarding social entrepreneurship is evident, and this survey showed an apparent lack of knowledge about social entrepreneurship. Furthermore, most of the respondents were female, 78.4%, and up to 20 years old, 55.7%. The main conclusion of the research is that the student feels confident about the general business knowledge but unsure about the knowledge about social entrepreneurship. Suggestions for future research are about performing the survey on a more extensive research polygon of the Croatian universities. The critical limitation of this research is that the respondents are undergraduate students, and these faculty don’t offer any courses related to social entrepreneurship so far. Suggestions from this paper may be used for the future refreshment of university curricula regarding social entrepreneurship as an integral part of regular entrepreneurship syllabi or as separate courses.
Keywords: social entrepreneurship, sustainability, profitability
REFERENCES
[1] Alonso, A. D., Kok, S., & O’Brien, S. (2020). Profit Is Not a Dirty Word: Social Entrepreneurship and Community Development. Journal of Social Entrepreneurship, 11(2), 111-133. DOI: 10.1080/19420676.2019.1579753
[2] Miller, T., Wesley II, C. L., & Williams, D. E. (2012). Educating the Minds of Caring Hearts: Comparing the Views of Practitioners and Educators on the Importance of Social Entrepreneurship Competencies. Academy of Management Learning and Education, 11(3), 349–370. DOI: 10.5465/amle.2011.0017.
[3] Gupta, P., Chauhan, S., Paul, J., & Jaiswal, P. M., (2020). Social entrepreneurship research: A review and future research agenda. Journal of Business Research, 113, 209–229. DOI:10.1016/j.jbusres.2020.03.032
[4] Renko, M. (2013). Early Challenges of Nascent Social Entrepreneurs. Entrepreneurship Theory and Practice, 37(5), 1045-1069. DOI: 10.1111/j.1540-6520.2012.00522.x.
[5] Rey-Martí, A., D. Ribeiro-Soriano, D., & Palacios-Marques, D. (2016). A Bibliometric Analysis of Social Entrepreneurship. Journal of Business Research, 69(5), 1651–1655. DOI: 10.1016/ j.jbusres.2015.10.033.
[6] Roberts, D., & Woods, C. (2005). Changing the World on a Shoestring: The Concept of Social Entrepreneurship. University of Auckland Business Review, 19(1), 45–51.
1.00% 3.00%
46.00% 38.00%
12.00%
0.00%
20.00%
40.00%
60.00%
1 2 3 4 5
0.00% 4.00%
54.00%
28.00%
14.00%
0.00%
10.00%
20.00%
30.00%
40.00%
50.00%
60.00%
1 2 3 4 5

86
USING SAP ACTIVATE METHODOLOGY IN THE IMPLEMENTATION OF S/4 HANA
TECHNOLOGY
Milica Bradić*1
1University of Belgrade – Faculty of Organizational Sciences *Corresponding author, e-mail: [email protected]
OBJECTIVE
The main purpose of this paper is the presentation of the SAP Activate methodology that is mostly used for the implementation of SAP’s latest enterprise resource planning system, S / 4 HANA technology. As the name of the methodology suggests, the creator of it is one German corporation, called SAP. It deals with the production of software, more precisely solutions for enterprise resource planning, both on-premises and on a cloud. The four main goals of this paper are to describe ERP technology, how it is historically known and currently present, give more insight into SAP, their S/4 HANA technology, as well as show, Activate methodology. The main part of the paper is a detailed case study of the methodology and its use.
METHODOLOGY
Тhe type of methodology that was used was the collection of data from primary sources through a surveying of experts in the field. Interviews were held with four experts, who have decades of experience in working with SAP products. The conversations usually lasted between one and two hours. Although the standard questionary existed, additional questions were often asked. The research took approximately four months. The biggest progress was when the interviews with experts began. The paper is divided into two parts, a theoretical and a case study segment. In addition to Internet sources, books, and articles by many authors, the main resources used were official documents of SAP corporation, such as books, courses, sites, and learning journeys. The final part of the paper, the case study, has the aim of explaining the use of SAP Activate methodology in Serbia and surrounding countries.
RESULTS
Today, the ERP system manufacturing industry represents a market worth approximately 227 billion dollars. No large company can be imagined without it (Enterprise Software, 2021). The benefits of using them are of immense importance for the business and cannot be neglected in the analysis of its success. Therefore, it is crucial which manufacturer and type of system are chosen. At present, SAP represents a leading company in innovation. Their main technology is S/4 HANA (Elbahri et al., 2019). SAP Activate is the main methodology used for S/4 HANA implementation. Created with the Project Management Institute, it represents great progress in project realization and system implementation. It is structured in a way that covers all aspects of execution and represses all well-known problems. With it, the realization is focused more on educating a customer, adjusting the product, and solving obstacles the right way (Denecken et al., 2016). At the end of the research, the discovery was that the methodology achieves its main goals. Those are the following: reducing the time it takes to see the benefits of the implementation, cutting down on all costs and

87
risks, providing flexibility, and the advantage of choosing which type of system can be implemented (SAP Activate Methodology, 2022).
CONCLUSION
There are two benefits of the research. The first one is having relevant resources for content creation. Luckily, many official SAP resources were available, which provided the chance to give up-to-date significant information. The second one is interviewing highly successful and accomplished experts in both SAP and Activate methodology, who were willing to share their knowledge. The main limitation was an abbreviated period for the research. As it was told, the study lasted for four months. Regardless of that, all sections are briefly covered.
Keywords: SAP, Activate, S/4 HANA, methodology
REFERENCES
[1] Denecken, S., Musil, J., & Santhanam S. (2016). SAP Activate: Project Management for S/4 HANA. SAP Press [2] Enterprise Software - Worldwide Statistic Market Forecast. (2021). Retrieved from:
www.statista.com/outlook/tmo/software/enterprise-software/worldwide [3] Elbahri, F. M., Ismael Al-Sanjary, O., Ali, M. A. M., Ali Naif, Z., Ibrahim, O. A., & Mohammed, M. N. (2019).
Difference Comparison of SAP, Oracle, and Microsoft Solutions Based on Cloud ERP Systems: A Review. In IEEE 15th International Colloquium on Signal Processing & Its Applications (CSPA) (pp. 65-70), IEEE. DOI: 10.1109/CSPA.2019.8695976.
[4] SAP Activate Methodology e-book (2022). Retrieved from: saplearninghub.plateau.com/icontent_e/CUSTOM_eu/sap/self-managed/ebook/ACT100_EN_Col13/index.html

88
POSSIBILITIES OF APPLICATION OF PROCESS INNOVATIONS IN THE
CUSTOMS SYSTEM
Sanja Dalton*1, Biljana Stošić
2, Radul Milutinović
2
1EU-CAFAO
2University of Belgrade – Faculty of Organizational Sciences *Corresponding author, e-mail: [email protected]
OBJECTIVE
Globalization, regional integration and, above all, the era of digitalization impose the need for Customs, as an entity of the state administration, to implement process innovations in terms of integration, automation and digitalization. In the case of the Republic of Serbia, which is surrounded by EU member states and/or candidate countries for EU accession, it is necessary to harmonize business operations in line with EU best practices, considering the process healing before its digitalization. The subject of the research in this paper is a possibility of improving the customs system by applying process innovations. The aim of the research is: 1. Research and systematization of the application of innovations in the customs system; 2. Identification and analysis of key segments of the process in the customs system, where it is necessary to implement process innovations in order to improve business performance; and 3. Development of process innovations management guidelines as a proposed solution to identified problems in the existing customs system. The task of the research, given the set goals, is to analyze the possibilities of improving the customs system by applying process innovations. Due to the complexity of the processes in the customs system, there have been no studies that have explored this area from the aspect of building a methodology for process redesign in the customs system, in that respect, the matter presented in the paper has special value, which can be considered a novelty.
METHODOLOGY
The research method primarily consists of systematization of available literature in the field of process innovations in the customs system, as well as the survey and statistical processing of collected data in SPSS program (T-test). Based on the identified problems and bottlenecks in some previous studies of the automated transit procedure, a proposed solution in the form of guidelines for process innovations is developed and tested through a case study of Serbian customs administration. Therefore, the empirical research was conducted through a survey with the customs officers representing internal users of the customs system (41 respondents) and the method of interview with forwarding agents (42 respondents) representing external users of the customs system. The respondents compared the existing computerized system with the system after application of the proposed guidelines for process innovation using the Likert scale in evaluation of predefined criteria related to performance in customs transit procedure.

89
RESULTS
According to data collected through a survey and by method of interview with the respondents and processed in SPSS program (T-test), the perception of both internal and eternal users of the customs system is that the proposed guidelines have a significant impact on improvement of customs transit performance. The significant difference in perception reflects that applying process innovations can improve efficiency, effectiveness and savings in time of customs performance in transit procedure.
CONCLUSION
Considering that the users of the customs system evaluated the predefined criteria related to customs performance better after the application of proposed guidelines for process innovations, the results of empirical research confirm the hypothesis tested in the paper that it is possible to apply process innovations in order to improve the customs transit procedures. The practical value of the research is primarily reflected in the developed guidelines or process innovations based on the case study of the Republic of Serbia, which can be applied in complex systems of bodies of state administration. The limitation of the research is reflected in insufficient variables, taking in the account that the tested variables refer to only one of several customs procedures. Therefore, application of process innovations in other customs procedures may be reserved for future research.
Keywords: process innovations, process innovation management, customs system, digitalization
REFERENCES
[1] Dumas, M., La Rosa, M., Mendling, J., & Reijers, H. A. (2018). Fundamentals of business process management, 2nd ed. Springer Berlin.
[2] OECD & Eurostat. (2018). Oslo Manual 2018: Guidelines for Collecting, Reporting and Using Data on Innovation, 4th ed. The Measurement of Scientific, Technological and Innovation Activities, Paris/Eurostat, Luxembourg.: OECD Publishing.
[3] Salimonenko, E. N., & Stepanov, E. A. (2018). Business-process modelling of basic customs procedures in EAEU.Procedia Social Behaviour Sciences, 328, 53-62.
[4] Stošić, B., & Milutinović, R. (2017). Key Issues to Improve Innovation Project Excellence. In B. L. Moya, M. o. S. de Gracia, & L. F. Mazadiego (eds.), Key Issues for Management of Innovative Projects. Intech Open.
https://doi.org/10.5772/67504 [5] Carinskizakon („Sl. glasnik RS”, br. 18/2010, 111/2012, 29/2015, 108/2016). Deo prvi – OSNOVNE ODREDBE.
Retrieved from: www.carina.rs/lat/Zakoni%20latinicaa/Carinskizakon-lat.pdf

90
SUSTAINABLE MANAGEMENT OF SERBIAN AGRICULTURAL FAMILY
HOLDINGS
Lena Đorđević Milutinović*1, Marko Ćirović
1, Radul Milutinović
1
1University of Belgrade - Faculty of Organizational Sciences
*Corresponding author, e-mail: [email protected]
OBJECTIVE
The devastating impact tangibly felt by the entire humanity due to COVID-19 should not be a surprise since pandemics such as Spain flu, Severe Acute Respiratory Syndrome (SARS), Zika, the Middle East Respiratory Syndrome (MERS), and Ebola are becoming regular assurances (Oruma et al., 2021). Pandemics such as these are something that might be expected in the future as well, and as such are a threat for which human kind must be prepared in the future (Kumari et al., 2021; Pulighe & Lupia, 2020; Workie et al., 2020). This is additionally becoming true and evident within supply chains of farming products, including food processing and storing, distribution and logistics, which are already suffer from very low efficiency and effectiveness, sensitivity to market disruptions and other external factors (Lezoche et al., 2020). Sustainable management of agricultural family holdings (AFH) is in comparison to agricultural holdings held by big corporations, even more under threat. This is especially true in countries with less developed agricultural infrastructure, such as the Republic of Serbia. Agricultural production is not rationally organized, and labor productivity is low. Some of the problems identified within AFHs include: inability to respond to climate change challenges; lack of the data and records on their business activity; lack of the data and records on their natural, human and material resources; resource management; inability to respond to the disruption of distribution chain; lack of decision support systems and business monitoring and planning tools. Consequently, the paper aims to examine requirements of AFHs related to business information and to propose information system (IS) characteristics able to improve the system management. The IS proposal will be based on spreadsheet applications due to the price, availability, flexibility, ease and speed of the system development and modifications. Proposed solution should support sustainable management of AFHs in the Republic of Serbia.
METHODOLOGY
The methodology of the research is based on analyzing publicly available data on family agricultural holdings. The analysis is focused on identifying the current shortcomings in managing AFHs, and providing the help based on the supporting spreadsheet tool. This tool should provide better planning, tracking, usage and management of both, activities and resources used in regular operations of AFHs. The research aims to provide answers to several fundamental questions that would help reaching sustainable management of the AFHs:
What is the essential data needed on AFHs resources that would provide better resource planning? What is the essential data needed on AFHs activities that would provide better activity planning? What are the essential skills and tools needed by AFHs owners that would enable them better tracking of costs, yields, revenues and business results? What kind of spreadsheet tool can be created aligned with the current AFHs owners' knowledge, skills and competencies, which would improve managing of AFHs?
To obtain the answers to these research questions, a survey has been conducted among AFHs. Data gathered through the questionnaire was analyzed and the results are presented within the paper. Representation of the survey sample by the age of the respondents is shown in Figure 1.

91
Figure 2: Age of the survey respondents by percentage
RESULTS
The main findings of the survey depict quite clearly, what kind of support tools the respondents would find useful in managing their AFH. Table 1 presents the insight into what the specific spreadsheet tool should enclose to encourage its usage by the respondents. Table 1: Spreadsheet tool user demands
Groups Number of respondents Percent of respondents
Free of charge usage 15 62,5% Main resource planning 21 87,5% Information security 3 12,5% Traditional table form 4 16,7% Advanced table form Accessibility
1 4,2% 4 16,7%
Layout design Credibility of estimation Easy to use Data presentation
5 20,8% 15 62,5% 16 66,7% 8 33,3%
CONCLUSION
Survey results suggest that the majority of respondents would be ready to use some kind of spreadsheet tool that would help reach the sustainable management of their AFHs. Nevertheless, the survey shows that such a support tool would be much more welcomed if it would be free of charge and easy to use. Secondly, in regards to the respondents’ skills, such a tool should not be too much tech-savvy, or additional training would have to be made available.
Keywords: agricultural family holdings, data-driven sustainable management, spreadsheet application
REFERENCES
[1] Kumari, S., Venkatesh, V. G., Deakins, E., Mani, V., & Kamble, S. (2021). Agriculture value chain sustainability during COVID-19: an emerging economy perspective. The International Journal of Logistics Management, ahead-of-print. DOI: 10.1108/IJLM-04-2021-0247
[2] Lezoche, M., Hernandez, J. E., Díaz, M. D. M. E. A., Panetto, H., & Kacprzyk, J. (2020). Agri-food 4.0: A survey of the supply chains and technologies for the future agriculture. Computers in Industry, 117, 103187. DOI: 10.1016/j.compind.2020.103187
[3] Oruma, S. O., Misra, S., & Fernandez-Sanz, L. (2021). Agriculture 4.0: An Implementation Framework for Food Security Attainment in Nigeria’s Post-Covid-19 Era. IEEE Access, 9, 83592-83627. DOI: 10.1109/ACCESS.2021.3086453
[4] Pulighe, G., & Lupia, F. (2020). Food first: COVID-19 outbreak and cities lockdown a booster for a wider vision on urban agriculture. Sustainability, 12(12), 5012. DOI:10.3390/su12125012
[5] Workie, E., Mackolil, J., Nyika, J., & Ramadas, S. (2020). Deciphering the impact of COVID-19 pandemic on food security, agriculture, and livelihoods: A review of the evidence from developing countries. Current Research in Environmental Sustainability, 2, 100014. DOI: 10.1016/j.crsust.2020.100014
16%
24%
36%
12% 12%
0
0.1
0.2
0.3
0.4
20-30 30-40 40-50 50-60 >60
Nu
mb
er o
f th
e su
rvey
re
spn
den
ts
Age of the survey respondents

92
A MODEL FOR FINANCING INNOVATION IN SMART COMMUNITIES
Patricija Jankovič*1
1AREMA, Academy for logistics and management
*Corresponding author, e-mail: [email protected]
OBJECTIVE
The research is focused on development of public-private innovation financing model for sustainable development in smart communities. It provides a concise overview of relevant studies in the field of financing sustainable development in communities and innovation. The problem of financing public services, which had seriously endangered not only the development of new projects, but also the existing ones, can no longer be tackled by a relatively well-conceived rules and a number of EU programs without providing a model that could help local communities eliminate their problems with ideas, preparation and application of sustainable projects, and focus their efforts on different ways of funding, without which the development of communities cannot be guaranteed.
METHODOLOGY
The most important models of innovation are critically analyzed, considering the hybrid model of open innovation and phase innovation processes as the most suitable for discussion. Previous studies suggest that organization of innovation processes strongly depend on funding. In empirical part, we carried out a survey among municipalities in Slovenia. The data allow us an insight into the period 2005 – 2012 and the period till 2020. Included in survey questions were the number and value of projects by type of funding, the number of professional staff responsible for obtaining funds for investment from EU programs and their experience, the number and value of projects with any form of public-private partnership, the shares of applicable concession of companies with private ownership majority, the number of investment projects, in which municipality acted as one of the partners, and the proportion of these projects. We created frequency analysis and descriptive statistics for more than 230 variables. With analysis of variance the significance of differences in the average of the variables relating to the number, value or proportion of projects with different funding arrangements were tested. As possible influencing factors, we used the region, the number of professional staffs, and the number of more experienced colleagues, the experience of municipalities with public private partnerships, cooperation with other municipalities, educational level of professional staff and experience with innovation. In total of 200 hypotheses were tested for each year. Effects of selected factors in the period often vary from year to year. We have explained the possible causes for the difference in power factor.
RESULTS
The main problem of local governmental organization is not in fragmentation of municipalities, but within discontinuities and un-cooperated acting. Both models of innovation (traditional and open) have demonstrated their efficiency in economy. We evaluated their importance for local communities by which we derived from the necessity of analogy between smart cities and smart communities. Emphasis on sustainable development of smart cities, in terms of population concentration is understandable. But developmental tasks in smaller communities are also complex. The only difference is a small and manageable process, not the importance or the need for implementation of development projects.

93
CONCLUSION
The hybrid model of innovation and funding is based on three substantives lightly different variants, which we named a classic public-private partnership, crowd funding and EU funding. Model creates three different options, both for funding and implementation of the project with participation of public and private partners in various combinations of private and public funding and implementation of innovation projects. Its initial structure is based on close cooperation with users of public services. We upgraded the phase model with public procurement and public private partnership and presented the model in several diagram techniques. Model allows an easily capture of project ideas, assessment of innovation concept adequacy, evaluation of idea feasibility, performance of monitoring and post project evaluation.
Keywords: innovation, smart communities, sustainable development, public private partnership, financing model
REFERENCES
[1] Augenblick, H. (1990). The Build, Operate and Transfer Approach to infrastructure in developing countries. The
World Bank. 51. [2] Bessant, J. (2011). Innovation and Enterpreneurship, 2
nd ed. Wiley E-Text. Hoboken. 4-14.
[3] Blewitt, J. (2008). Understanding sustainable development. Earth scan. London, 21-24. [4] Bohinc, R., & Mužina, A. (2007). In Tičar, B. Zakon o javno zasebnem partnerstvu s pojasnili. Nebra d.o.o.
Ljubljana, 15. [5] Chesbrought, H. W. (2003). The Era of Open Innovation. Massachusetts. MIT Sloan Management reviewSpring.
44(3), 35-41. [6] Chesbrought, H.W. (2003). Open Innovation, The New Imperative for Creating and ProfitingfromTechnology.
Boston. Harward Business SchoolPress, XVII – XXXI, 21-63. [7] Chesbrought, H. W., Vanhaverbeke, W., & West, J. (2006). In Open Innovation: Researching a New Paradigm.
Oxford: Oxford University Press. 1. [8] Cooper, R. G. Product Leadership. Basic Books. USA, 2005, 4-6.

94
DIGITALIZATION AND SUSTAINABLE ECONOMIC DEVELOPMENT IN
EUROPEAN COUNTRIES
Sandra Jednak1, Jelena Minović*
2
1University of Belgrade , Faculty of Organizational Sciences 2 Institute of Economic Sciences
*Corresponding author, e-mail: [email protected]
OBJECTIVE
Global economy is constantly changing towards digital and sustainable economy. Countries worldwide are undergoing digital and sustainable transformation. The rise in using digital technology has been evident during the COVID-19pandemic. The increasing application of new technologies worldwide shows a high level and speed of information and knowledge exchange. Development, adaptation, and application of new technologies benefit almost every area of economy. Technology impacts increase competitiveness, efficiency, productivity, cost reduction, rapid technological change and innovation, new products and services, new jobs, organization of market structures, etc.(Jednak, 2012).
Along with introducing new technology - digital technology, countries try to obtain sustainability and sustainable development. In order to be achieved, each SDG is either under direct or indirect impact of ICT. Therefore, digitalization can lead to achieving sustainable development. However, digitalization is not necessarily sustainable. The unsustainability of new technologies may jeopardize the gains made in the field of digitization and towards a sustainable economy (Van der Velden, 2018).For that reason, various studies have focused on the relationship between sustainable development and digitalization (Esseset al., 2021; Dyatlov et al., 2019; Hosanet al., 2022). European economies are directed towards digital and green transition, namely- twin transition. Their goal is also to strengthen social and economic resilience (European Commission, 2021).The aim of the paper is to show digitalization (D) and sustainable economic development (SED) in EU countries. The paper also analyses the link between digitalization and SED in EU countries for the period 2016–2020 by using correlation analysis. The research questions are as follows: RQ1: What is the progress of digitalization (D) and SED in EU countries? RQ2: What is the relationship between digitalization (D) and SED in EU countries?
METHODOLOGY
We investigate the interrelation between digitalization and sustainable economic development in EU countries by correlation. We used proxy variables for SED: Adjusted net savings (ANS), GDP per capita (GDP), Urbanization (URB),and Renewable energy (REN) (Ziolo et al., 2020), while for the digital transformation, we used DESI (Digital Economy and Society Index). DESI Index is a composite index that measures the progress made by EU countries to both digital economy and society. We analyzed the period between 2016 and 2020 since DESI index and other indicators are available for that period.
RESULTS
The results show that a positive statistically significant correlation coefficient exists between DESI index and all variables of SED (at the level of 1%) in EU countries. Moreover, there is a statistically significant correlation coefficient between GDP per capita and following variables - adjusted net savings, renewable energy, and urbanization. In addition, there is a significant correlation coefficient between adjusted net

95
savings and urbanization. However, there is no correlation coefficient between renewable energy and adjusted net savings, nor between renewable energy and urbanization, at the level of 5%.
CONCLUSION
The paper goal is to demonstrate the way digitization and SED are linked in EU countries. The paper also uses correlation analysis to examine the link between digitalization and SED in EU countries for the period 2016-2020. Our research showed a positive statistically significant correlation coefficient (at the 1% level) between DESI index and all indicators of SED in EU countries. The limitations of this research lie in the fact that some more advanced economic techniques could be used, which will be the subject of some future research.
Keywords: digitalization, sustainable economic development, EU countries
REFERENCES
[1] Dyatlov, S. A., Didenko, N. I., Lobanov, O. S., & Kulik, S. V. (2019, July). Digital transformation and convergence effect as factors of achieving sustainable development. In IOP Conference Series: Earth and Environmental Science (Vol. 302, No. 1, p. 012102). IOP Publishing.
[2] Esses, D., Csete, M. S., & Németh, B. (2021). Sustainability and Digital Transformation in the Visegrad Group of Central European Countries. Sustainability, 13(11), 5833.
[3] European Comission (2022). Towards a green, digital and resilient economy: our European Growth Model. Retrived from ec.europa.eu/commission/presscorner/detail/en/ip_22_1467
[4] Hosan, S., Karmaker, S. C., Rahman, M. M., Chapman, A. J., &Saha, B. B. (2022). Dynamic links among the demographic dividend, digitalization, energy intensity and sustainable economic growth: Empirical evidence from emerging economies. Journal of Cleaner Production, 330, 129858.
[5] Jednak S., (2012). Razvoj ekonomije zasnovane na znanju: mogućnosti i ograničenja, Beograd, Zaduzbina Andrejevic.
[6] Van der Velden, M. (2018). Digitalization and the UN Sustainable Development Goals: What role for design. ID&A Interaction design & architecture (s), (37), 160-174.
[7] Ziolo, M., Jednak, S., Savić, G., & Kragulj, D. (2020). Link between energy efficiency and sustainable economic and financial development in OECD countries. Energies, 13(22), 5898.

96
FRAMEWORK FOR INNOVATION AND SUSTAINABLE MANAGEMENT- SYSTEMS
THINKING MODELS
Tadeja Jere Jakulin*1, Tamara Papić
2
1University of Primorska – Faculty of Tourism Studies Turistica
2Singidunum University
*Corresponding author, e-mail: [email protected]
OBJECTIVE
Innovation and sustainable management encompass various economic sectors, players, and academic disciplines. The complexity of its composition makes it inherently challenging to develop universally acceptable definitions that would help describe it conceptually. The structure has become flatter, more open and more flexible with new interconnections. Contemporary sustainable managerial problems are defined softly, phenomena are mostly uncertain, and demands for fast and integrated decisions exist. Thus, an effective methodological approach tries to master softly structured problems. Here, one encounters Systems Dynamics (SD) and Systems Thinking (ST) methods and tools, which became standard management tools in the 1990s. System Thinking is a method of understanding the connections among the elements in a system. System Thinking tools could provide a conceptual framework and a methodical process that can contribute to developing a sustainable system. Today's organizations decide about fluid, dynamic, complex issues by leveraging communicating decisions and strategies. Visualization of knowledge can be crucial to supporting managers' sustainable decisions. This paper provides an insight into how systems thinking can be used to achieve the desired outcomes for sustainable management. It highlights the System Thinking tools such as System Dynamics, Knowledge Visualization (KV), and Causal Loop Diagramming (CLDs) to provide better cognitive infrastructure and adequate decisional support to the management and to avoid data overload. Systems thinking offers a language for understanding complexity and dynamic change and provides sophisticated modelling technology and connected learning environments. For this paper, Innovation is defined as creating new knowledge, services, products, and processes by using new or existing scientific or technological knowledge that provides a degree of novelty. The Systems Thinking model employs different tools to build holistic perspectives and practices for Innovation and sustainable management.
METHODOLOGY
The paper investigated different tools and how they could help develop sustainable management and innovative business models. Knowledge visualization is used as a central concept with System dynamics (SD) and Causal Loop Diagramming (CLDs). The fundamental knowledge support to both practice and research in business management is the visual representation of plans, processes, strategies, performances, and many other business entities. Figure 1 shows the overview of the most frequently used diagrams in knowledge visualization as supporting tools in management decision making. Figure 2 shows the complexity of natural systems and the main factors contributing to it with the requirements for dealing with complex situations in management and demonstrates how listed requirements can be met with the systems thinking tools, leading to desired outcomes. System dynamics (SD) is founded as a powerful approach to understanding, simulating, analyzing, and predicting fluid, complex and dynamic business processes.

97
One of the critical ways to translate human language into machine-accessible language is diagramming.
Figure 1: Figure name
Figure 2: The framework of Systems Thinking tools that would help achieve desired outcomes that
contribute to sustainable management Causal Loop Diagramming (CLDs) is the System Thinking tool which could be used to illustrate sustainable and innovative systems. The CLDs consider sustainability and Innovation as one of the central concerns and attempt to highlight new concepts on intricate networks of management, business, socio-economic and environmental subsystems. The main goal is to understand how managers could achieve the desired outcomes using the System Thinking approach.
RESULTS
Data sources from Figure 2 were used to create the CLDs to show effective decision support techniques. This qualitative cause-and-effect diagram led to sustainable and Innovation management. One of the well-known simulation modelling techniques is conceptual diagrams, which can unlock the decision-making process in a sustainable direction.

98
Business Model Innovation processes show that SD's diagrams have beneficial effects on decision-making since they improve managers' communication, strategies, knowledge integration, creative thinking, and evaluation of new business models.
Figure 3: Qualitative Causal Loop Model (CLD) in a frame of System Dynamics
Figure 3 shows the CLD model and the influences of the imported parameters, which are creating visible circular causalities (loop) that are highlighted by a loop identifier, positive (reinforcing) or negative (balancing) feedback. CLD does not show what happens but instead shows what will happen if the variables change. Loops in the CLD are essential since they determine the system's behaviour. In this fashion, managers could predict the sustainable outcomes based on the Cause-and-Effect fact interaction.
CONCLUSION
One of the essential things for sustainable management is feedback, especially the so-called balancing loop, which usually comes with a delay. A negative or balancing loop underlighting the system behaviour and allows the management to make sustainable decisions. CLD has the power to unlock the complex systems, sustainability, and innovation managers and entrepreneurs. Further research will discuss quantitative Cause-and-Effect diagrams with the simulation of the created models. Thanks to visual diagrams that act as a knowledge interface between humans and machines, simulation software will be able to perform system behaviour, test and assess the designed service of organizations, and led sustainable decisions.
Keywords: systems thinking, systems modelling, innovation, sustainability, management
REFERENCES
[1] Ammirato, S., Linzalone, R., & Felicetti, A. M. (2021). The value of system dynamics' diagrams for Business Model Innovation. Management Decision, 60(4), 1056-1075. DOi:10.1108/md-02-2021-0172
[2] Anderson, V., & Johnson, L. (2007). Systems thinking basics: From concepts to causal loops. Pegasus Communications.
[3] Banathy, B. H. (2011). Guided evolution of society: A systems view. Springer. [4] Bertalanffy, L. (2015). General system theory: Foundations, development, applications. Braziller.

99
[5] Bosch, O. J., King, C. A., Herbohn, J. L., Russell, I. W., & Smith, C. S. (2007). Getting the big picture in Natural Resource Management-Systems thinking as ‘method’ for scientists, policy makers and other stakeholders. Systems Research and Behavioral Science, 24(2), 217-232. DOI: 10.1002/sres.818
[6] Bosch, O., Maani, K., & Smith, C. (2007). Systems thinking – Language of complexity for scientists and managers.
[7] Burkhard, R. A. (2005). Towards a framework and a model for knowledge visualization: Synergies between information and knowledge visualization. Lecture Notes in Computer Science, 238-255. DOI: 10.1007/11510154_13
[8] Cabrera, D. (2021). What is the first documented use of the term, "systems thinking"?. Journal of Systems Thinking, 4. DOI: 10.54120/jost.v1i1.1383
[9] Capra, F., & Mattei, U. (2015). The ecology of law: Toward a legal system in tune with nature and community. Berrett-Koehler Publishers, Inc.
[10] Checkland, P. (2005). Systems thinking, systems practice: Includes a 30-year retrospective. John Wiley & Sons. [11] Cosenz, F., & Noto, G. (2017). Il dynamic business model: una prospettiva dinamica perla progettazione dei
modelli di business. Rivista Piccola Impresa/Small Business, 2, 9-33.
[12] Dempsey, L. (2021). System archetypes. Fashion for a Finite Planet. Retrieved from www.fashionforafiniteplanet.com/system-archetypes/
[13] Eppler, M. J., & Burkhard, R. A. (2007). Visual representations in Knowledge Management: Framework and cases. Journal of Knowledge Management, 11(4), 112-122. DOI: 10.1108/13673270710762756
[14] Eppler, M. J., & Burkhard, R. A. (2004). Knowledge visualisation: towards a new discipline and its fields of application.
[15] Gharajedaghi, J. (2006). Systems thinking: Managing chaos and complexity: A platform for designing business architecture. Elsevier.
[16] Giordano, R., Mysiak, J., Farmaci, R., & Vurro, M. (2007). An integration between cognitive map and causal loop diagram for knowledge structuring in river basin management. In International conference on Adaptive and Integrated Water Management. Coping with Complexity and Uncertainty (pp. 1345-1362).
[17] Jere Jakulin, T., & Rozman, Č. (2022). Tourism: Systems methodology in special interest tourism. Verlag. [18] Jere Jakulin, T., Rozman, Č., Pažek, K., Kljajić, B. M., Škraba, A., Kofjač, D., & Jakulin, V. (2020). Systems
approach concepts in contemporary society systems thinking, modelling and simulation in science and practice. Verlag.
[19] Kim, D. H. (1994). Systems Archetypes. Pegasus Communications, Inc.
[20] Luban, F. and Hıncu, D. (2009). Interdependency between simulation model development and knowledge management. Theoretical and Empirical Researches in Urban Management, 4(10), 75-85.
[21] Maturana, H. R., & Varela, F. J. (2008). The Tree of Knowledge: The Biological Roots of Human Understanding. Shambhala.
[22] Meadows, D. H., & Wright, D. (2015). Thinking in Systems: A Primer. Chelsea Green Publishing. [23] Pidd, M. (2013). Tools for Thinking: Modelling in Management Science. Wiley. [24] Onggo, S., Soopramanien, D. and Pidd, M. (2006). A dynamic business model for component-based simulation
software. In Perrone, L. F., Wieland, F. P., Liu, J., Lawson, B.G., Nicol, D. M., & Fujimoto, R. M. (Eds). Proceedings of the 2006 Winter Simulation Conference (pp. 954-959).
[25] Sedarati, P., Manuel, F., Serra, D., & Jere Jakulin, T. (2022). Systems approach to model smart tourism ecosystems. International Journal for Quality Research, 16(1), 285-306. DOI: 10.24874/ijqr16.01-20
[26] Sargent, T. J. (2008). Evolution and intelligent design. American Economic Review, 98(1), 123-154. [27] Sterman, J. D. (2000). Business Dynamics: Systems Thinking and Modeling for a Complex World. McGraw-Hill,
Boston, MA. [28] Sterman, J. (2010). Does formal system dynamics training improve people’s understanding of accumulation?.
System Dynamics Review, 26(4), 316-334. [29] Senge, P.M. (1990). The Fifth Discipline: The Art and Practice of the Learning Organization.
Doubleday/Currency, New York, NY. [30] Luban, F., & Hıncu, D. (2009). Interdependency between simulation model development and knowledge
management. Theoretical and Empirical Researches in Urban Management, 4(10), 75-85.

100
DRIVING INNOVATION THROUGH INTRA-ORGANIZATIONAL CO-CREATION
PLATFORM
Milica Jevtic*1, Sanja Marinkovic
2
1Internet Group d.o.o.
2University of Belgrade – Faculty of Organizational Sciences *Corresponding author, e-mail: [email protected]
OBJECTIVE
Organizational performance, competitiveness, and survival are strongly linked to organizational innovation and creativity (Agars et al., 2007; Pundt et al., 2010). Organizations often have untapped human capital and creative potential which could be viewed as determining factors in the company’s success in the market (Galovská, 2015). Employees are a company’s key asset as they are capable of adding value (Galovská, 2015) and, with their ideas and solutions, contribute to the organization’s innovation capabilities (Dedahanov, 2017; Stošić, 2020). Research suggests that knowledge management contributes to an organization’s innovativeness. As high centralization is linked to diminished innovative behavior in employees (Dedahanov, 2017) it is important for organizations to create an inclusive culture and atmosphere where creativity and innovative behavior are encouraged (Chen et al., 2010; Dedahanov, 2017). Innovative employee behavior can be further enhanced by a more decentralized and less formalized structure with a supportive climate where employees feel they can contribute to the innovation process (Chen et al., 2010). It is important to note that employee innovation efforts can be beneficial to both the organization and individual as they increase mastery, and offer opportunities for professional progress and social recognition (Dedahanov, 2017). An intra-organizational co-creation platform could help drive innovation in organizations using existing human capital and potential, improving transparency and collaboration inside the company while removing barriers in communication arising from organizations’ centralized structure (Madsen & Cruickshank, 2022; Homann- Kee Tui et al., 2013). In today’s fast-paced environment where everything changes at an incredible speed, it is essential to simplify and render effortless the participation and involvement of every individual. Setting up a system where everyone could contribute by reporting a problem (even anonymously), suggesting an idea or solution, or taking part in company innovation projects could add to the organization’s innovativeness and help speed up processes, enhance productivity, performance as well as increase company revenue.
METHODOLOGY
By using the Quantitative Strategic Planning Matrix, the company Internet Group performed an evaluation and selection of technology strategies, and identified employee knowledge, expertise, and creativity as key factors in bringing new products to the market (Jevtic et al., 2016). A custom, scalable and comprehensive solution was conceptualized as analysis of currently used solutions, and products available on the market, did not provide satisfactory solutions nor allowed for seamless integration. User testing was performed to validate its viability and efficiency.
RESULTS
The intra-organizational co-creation platform was conceptualized to facilitate innovation, increase collaboration and transparency using existing company resources and human capital. Several iterations of

101
user testing resulted in the following backbone structure (Figure 1) and confirmed the preliminary efficacy and usability of the proposed solution.
Figure 1: Intra-organizational co-creation platform
A points-and-reward system was conceived to adequately reward employee innovation efforts (though a number of benefits) to further enhance organization’s innovation capabilities. The points scale is based on type, status, feasibility of the proposed ideas and scoring of the Digital Product Innovation Model (Jevtic & Marinkovic, 2022) in which ideas feed into after review for effective ranking and prioritization. Employees have the option to publicly display rewards in their company’s profile as form of social recognition or for personal satisfaction (Dedahanov, 2017).
CONCLUSION
The intra-organizational co-creation platform could drive innovation, improve transparency, communication and collaboration inside organizations using existing capabilities, creativity, and potential. Tapping into its in-house resources, motivating employees, rewarding effort and the best ideas, organizations can promote innovation and innovative thinking in all spheres of the business and stay competitive in the market. The conceptualized platform is highly scalable and applicable to companies in a wide range of industries. It provides a comprehensive overview of the innovation ecosystem for efficient knowledge management and insight. Being still in the prototyping phase, practical application and further research is needed to confirm its impact on company’s performance, employee motivation, and organizational innovativeness.
Keywords: innovation, co-creation, intra-organizational innovation, innovation management platform, idea management

102
REFERENCES
[1] Agars, M., Kaufman, J., & Locke, T. (2007). Social Influence and Creativity in Organizations: A Multi-Level Lens for Theory, Research, and Practice. Research in Multi Level Issues, 7. 3-61. DOI: 10.1016/S1475-9144(07)00001-X
[2] Chen, C. J., Huang, J. W. and Hsiao, Y. C. (2010). Knowledge management and innovativeness: the role of organizational climate and structure. International Journal of Manpower, 31(8), 848-870.
[3] Dedahanov, A.T., Rhee, C. and Yoon, J. (2017). Organizational structure and innovation performance: Is employee innovative behavior a missing link?. Career Development International, 22(4), 334-350. DOI:
10.1108/CDI-12-2016-0234 [4] Galovská, M. (2015). Human capital and potential to increase its creativity. Creative and Knowledge Society,
5(2), 1. [5] Homann-Kee Tui, S., Adekunle, A. A., Lundy, M., Tucker, J., Birachi, E. A., Schut, M., ... & Mundy, P. (2013).
What are innovation platforms?. Innovation platforms practice brief. [6] Jevtic, M., Demirovic, R., & Marinkovic, S. (2016). Evaluation and selection of technology strategies using
quantitative strategic planning matrix. In SYMORG 2016 – Symposium Proceedings (pp. 1465-1473) [7] Jevtic, M. & Marinkovic, S. (2022). Digital Product Innovation Model for News Publishers. In 41st International
Conference on Organizational Science Development: Society’s Challenges for Organizational Opportunities (pp.391-401). DOI: 10.18690/um.fov.3.2022.28
[8] Madsen, T. L., & Cruickshank, D. (2022). Introduction: Co-Innovation Platforms. In Co-Innovation Platforms (pp. 1-19). Palgrave Macmillan, Cham.
[9] Pundt, A., Martins, E. & Nerdinger, F. (2010). Innovative Behavior and the Reciprocal Exchange between Employees and Organizations. Zeitschrift fuer Personalforschung. German Journal of Research in Human Resource Management, 24. 173-193. DOI: 10.2307/23279355.
[10] Stošić, B., Milutinović, R., & Trivan, A. (2020). Idea management systems. In 17th International Symposium SymOrg 2020 “Business and Artificial Intelligence” (pp. 125-132).

103
DOCUMENTATION AND CONFIGURATION MANAGEMENT SYSTEMS FOR R&D
PROJECTS
Gökçe Kılıç Öger*1
1Aselsan Inc.
*Corresponding author, email: [email protected]
OBJECTIVE
Documentation and configuration management of research and development (R&D) projects is not a well-studied topic in the literature. By nature, R&D projects are independent projects and accommodate less stuff than which are consists of production processes. This paper intends to indicate the methodology of the documentation system implementation project baseline for the Research and Development projects environment. Drawing upon documentation system developments, we studied configuration management for documentation in Research and Development projects. In that sense, a four-stage process is implemented in a defense industry company’s R&D Management Vice Presidency. We also consider Technology Readiness Levels (TRL). Also, in conclusion, a standardization process is presented for new applicators.
METHODOLOGY
Definitions for the document are many: A piece of paper with writing or drawing on it; An electronic file formed with Word, Excel or PowerPoint; A file containing the best song you have ever heard. Documentation is defined in 1951 (Wikipedia, 2022); “Information and its supporting medium”, as ISO 9000:2000 Quality (Tricker & Sherring-Lucas, 2022) management systems – Fundamentals and vocabulary defines (Robitaille, 2005). Document always contain information only valuable when it is used. Hypertext or hieroglyphs, the basic function has always been the same: “converting information into action” (Craine, 2000). Accurate and effective documentation is a vital tool for reaching any organization’s objectives. To make documents really work for company, a document strategy is needed. It is obvious that, the next step is to understand what documents are important, how they are produced and who cares about how they perform. Technology capabilities stand out as key factors of success during the crisis. Among the biggest differences between the successful companies and all others is talent, the use of cutting-edge technologies, and a range of other capabilities (LaBerge, 2020). Identify the vital few documents in your organization, decide what technologies and processes are used to produce and store them, who are the people who create or maintain them (and on the other hand, need them). Configuration Management System is a system that supports configuration management through effective data assimilation and toolsets that track, aggregate, analyze, and showcase critical information regarding configuration items and configuration items’ relationships. The Configuration Management System may also include information about incidents, problems, known errors, changes and releases. A wide variety of configuration management techniques have been developed to assist in the implementation. Phelan et al. (Phelan et al., 2014) describe several methods as well as potential challenges, which directly motivates the solution proposed here. The findings of Phelan et al (Phelan et al., 2014); the foundation for the manufacturer’s configuration management system is a rule database that contains the rules governing the possible options and packages for a specific vehicle, resulting in a rule-based configuration management system. Concept of Technology Readiness Levels (TRL) was first developed in the USA by NASA. Technology readiness level (TRL) is a system used to estimate technology maturity, and is popular with the US Department of Defense. TRL is based on a scale from 1 to 9, with 9 being the most mature technology.

104
There are nine levels of technology availability. Levels 1 through 6 are technology developments that are carried out as part of research projects (Vishnyakov et al., 2020). Technology Readiness Levels (TRL) are used to assess the maturity of a new technology towards full economic operation. TRLs are often used by governments and other funding bodies to define eligibility criteria (Styring et al., 2015). TRL Chart from the UK House of Commons, Technology and Innovation Centres, Science and Technology Committee is shown in Table 1. Table 1: TRL Chart from the UK House of Commons, Technology and Innovation Centres, Science and Technology Committee (Technology and Innovation Centres, 2022)
TRL LEVELS
TRL 1 Basic principles observed and reported.
TRL 2 Technology concept and/or application formulated.
TRL 3 Analytical and experimental critical function and/or characteristic proof-of-concept.
TRL 4 Technology basic validation in a laboratory environment
TRL 5 Technology basic validation in a relevant environment.
TRL 6 Technology model or prototype demonstration in a relevant environment.
TRL 7 Technology prototype demonstration in an operational environment.
TRL 8 Actual technology completed and qualified through test and demonstration.
TRL 9 Actual technology qualified through successful mission operations.
Research Center is set within the context of the higher education and regional policy drivers that are encouraging universities to become more engaged with regional business innovation (Lambert, 2003; OECD, 2007, 2011). 68% of the organizations studied by the Project Management Institute indicated that they were involved in digital transformation projects in 2020 (Project Management Institute, 2022). Especially Research Centers carry out R&D Projects that consists digital transformation and needs of documentation and configuration management policies. Documentation and configuration management play a crucial role when the R&D projects happens from one organization to another organization. Only documentation and configuration management can provide the knowledge required for R&D engineers from several perspectives.
RESULTS
In order to conduct the research for the purposes of this paper, a primary research technique was used. It has consisted of four phases. The R&D Vice Precedency Documentation and Configuration Management Project Plan is illustrated in Figure 1.
Figure 1: R&D Vice Precedency Documentation and Configuration Management Project Plan

105
CONCLUSION
Using documentation and configuration management, the R&D projects effort can be properly defined, planned, and controlled. The documentation needs are specific for each R&D project. The documentation management issues relate to either neglecting or overdoing documentation. A study of all the issues and practices for documentation management revealed that documentation processes should be tailor made for every R&D project according to the various factors that determine the documentation needs for a project. Project plan which is organized in Ms Project Tool is proposed to implementation of documentation practices in this study.
Keywords: Configuration Management, Documentation Management, Research and Development Projects
REFERENCES
[1] Armstrong, K. (2015). Emerging Industrial Applications, UK Centre for Carbon Dioxide Utilization. Department of
Chemical & Biological Engineering, The University of Sheffield, Sheffield, UK; CO2Chem Network, UK. [2] Craine, K. (2000). Designing a Document Strategy Paperback, Illustrated edition. MC2 Books. [3] Lambert, R. (2003). Lambert Review of Business–University Collaboration, London, HM Treasury. [4] Linacre House, Jordan Hill, Oxford OX2 8DP, 2001 Retrieved from 10.4324_9780080509495_previewpdf.pdf
(accessed January 21st, 2022).
[5] OECD (2007). Higher Education and Regions: Globally Competitive, Locally Engaged, Paris, OECD. [6] OECD (2008). OECD Reviews of Regional Innovation: North of England, UK, Paris, OECD. [7] OECD (2011). Regions and Innovation Policy, Paris, OECD. [8] Parliament.uk, House of Commons, Technology and Innovation Centres - Science and Technology Committee.
Retrieved from www.publications.parliament.uk/pa/cm201011/cmselect/cmsctech/619/61913.htm (accessed May 19
th, 2022)
[9] Phelan, K., Wilson, C. Summers, J. D., & Kurz, M. E. (2014). A case study of configuration management methods in a major automotive OEM. In Proceedings of the 2014 International Design Engineering Technical Conference, Buffalo, NY USA.
[10] Project Management Institute Inc. www.pmi.org (accessed May 19th
, 2022) [11] Robitaille, D. 2005. Document control. Paton Press. California, US. [12] Styring, P., Quadrelli, E. A., & Armstrong, K. (2015). Carbon Dioxide Utilisation: Closing the Carbon Cycle. DOI:
10.1016/B978-0-444-62746-9.00013-X [13] Tricker, R., & Sherring-Lucas, B., ISO 9001-2000 In Brief, Butterworth-Heinemann. [14] Vishnyakov, V., Suleimanov, B., Salmanov, A., & Zeynalov, E. (2020). Fundamentals of Ocean Renewable
Energy, Primer on Enhanced Oil Recovery. Elsevier Inc. DOI: 10.1016/C2017-0-03909-5
[15] Wikipedia, Document Explanation. Retrieved from en.wikipedia.org/wiki/Document (accessed February 21st,
2022).

106
APPLYING THE FUZZY ANALYTIC HIERARCHY PROCESS TO EVALUATION
OF THE R&D PROJECTS
Gökçe Kiliç Öger*1
1Aselsan Inc.
*Corresponding author, email: [email protected]
OBJECTIVE
Decision-makers who participate in research and development (R&D) activities face with the problem of evaluating the performance of R&D projects. Evaluations are often complicated due to absence of a standard way to weigh the importance of the individual dimensions of performance. And fuzzy analytic hierarchy process is generally implemented in an ambiguous environment. The main purpose of this study is to address the evaluation practice of Defense Industry R&D (DIRD) projects, establish a basic framework for evaluation, and implement the exploratory evaluation research under fuzziness. Based on our results, we suggest a supplementary plan to effectively manage DIRD projects. To this end, we propose a methodology based on the extent fuzzy analytic hierarchy process (AHP) with five main attributes; technology readiness level, cost, scope, calendar and investment. An illustrative example is also given. This paper presents the application of fuzzy analytic hierarchy process (AHP) for the R&D Project evaluation. The environment of the R&D area is affected by decision makers of governance and trends and is very sensitive to readiness level, cost, scope, calendar and investment as well publics’ opinions. Due to that, in the process of FAHP, there is a quantitative model to evaluate sequence of the projects. The numerous methods of multi attribute decision making analysis are an excellent approach for application on selecting and sequencing. In this paper, a fuzzy version of the most popular tool for multi attribute decision making method, AHP, is analyzed using five main attributes of R&D projects. The main objective of this paper is to present and analyze the Technology Readiness Level effect on R&D projects in a research results of the level of business information systems (BIS) application in the Defense Industry companies. In addition, the objective is to establish an appropriate application for decision makers. The research results show that TRL is an important attribute for the projects.
METHODOLOGY
The analytic hierarchy process (AHP) method introduced by Saaty (1980) shows the process of determining the priority of a set of alternatives and the relative importance of attributes in a multi-criteria decision-making (MCDM) problem (Saaty, 1980; Wei et al., 2005). The primary advantage of the AHP approach is the relative ease with which it handles multiple criteria and performs qualitative and quantitative data (Kahraman et al., 2004; Meade & Sarkis, 1998). However, AHP is frequently criticized for its inability to adequately accommodate the inherent uncertainty and imprecision associated with mapping decisionmaker perceptions to extract number (Kwong & Bai, 2003; Chan & Kumar, 2007; Lee et al., 2008). It is difficult to respond to the preference of decision-makers by assigning precise numerical values. To improve the AHP method and to determine the relative weight of criteria for risk assessment, this study applies the fuzzy analytic hierarchy process (FAHP) and uses triangular fuzzy numbers to express the comparative judgments of decision-makers. Some calculation steps are essential. Step 1. Establishing the hierarchical structure. Step 2. Calculating the consistency. The consistency index (CI) for each matrix order n using Eq. (1) is computed. Based on CI and random index (RI), the consistency ratio (CR) is calculated using Eq. (2). The CI and CR are defined as follows (Saaty, 1980):

107
(1)
(2)
where n is the number of items being compared in the matrix, is the largest eigenvalue, and RI is a random consistency index obtained from a large number of simulation runs, and it varies upon the order of the matrix (see Table 1). Table 1: Random index (RI) (Saaty, 1980)
N 1 2 3 4 5 6 7 8 9 10 11 12 13 14 15
RI 0 0 0,58 0,90 1,12 1,24 1,32 1,41 1,45 1,49 1,51 1,48 1,56 1,57 1,58
Step 3. Construct a fuzzy positive matrix: A decision-maker transforms the score of pair-wise comparison into linguistic variables via the positive triangular fuzzy number (PTFN) listed in Table 2.
Figure 1: Membership function of triangular fuzzy numbers corresponding to the linguistic scale
In order to perform a pairwise comparison among the parameters, a linguistic scale has been developed. Our scale is depicted in Figure 1 and the corresponding explanations are provided in Table 2. Table 2: The linguistic scale and corresponding triangular fuzzy numbers
Linguistic scale
Explanation Corresponding
triangular fuzzy numbers
The inverse of the corresponding triangular
fuzzy numbers
Equal importance
Two activities contribute equally to the objective
(1, 1, 1) (1, 1, 1)
Moderate importance
Experience and judgment slightly
(1, 3, 5) (1/5, 1/3, 1)
Strong importance
Experience and judgment strongly favor one activity over
another (3, 5, 7) (1/7, 1/5, 1/3)
Very strong importance
An activity is favored very strongly over another; its
dominance demonstrated in practice
(5, 7, 9) (1/9, 1/7, 1/5)
Demonstrated importance
The evidence favoring one activity over another is highest possible order of affirmation
(7, 9, 11) (1/11, 1/9, 1/7)
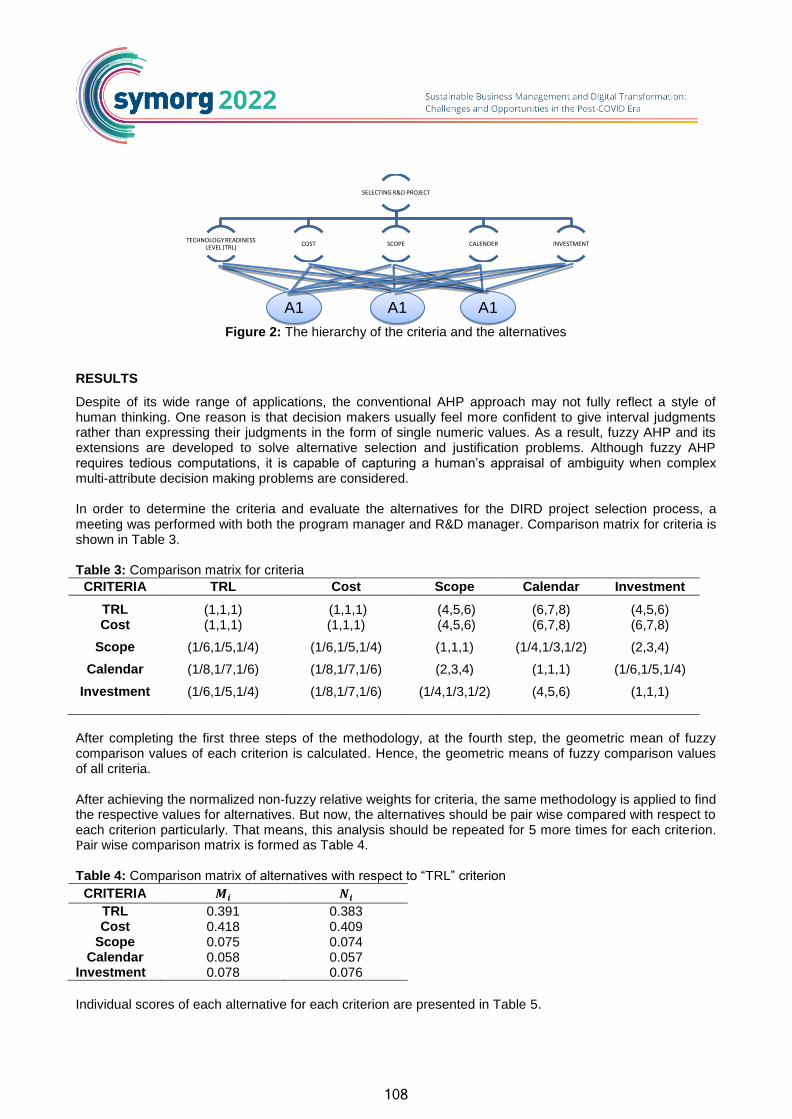
108
Figure 2: The hierarchy of the criteria and the alternatives
RESULTS
Despite of its wide range of applications, the conventional AHP approach may not fully reflect a style of human thinking. One reason is that decision makers usually feel more confident to give interval judgments rather than expressing their judgments in the form of single numeric values. As a result, fuzzy AHP and its extensions are developed to solve alternative selection and justification problems. Although fuzzy AHP requires tedious computations, it is capable of capturing a human’s appraisal of ambiguity when complex multi-attribute decision making problems are considered. In order to determine the criteria and evaluate the alternatives for the DIRD project selection process, a meeting was performed with both the program manager and R&D manager. Comparison matrix for criteria is shown in Table 3. Table 3: Comparison matrix for criteria
CRITERIA TRL Cost Scope Calendar Investment
TRL (1,1,1) (1,1,1) (4,5,6) (6,7,8) (4,5,6) Cost (1,1,1) (1,1,1) (4,5,6) (6,7,8) (6,7,8)
Scope (1/6,1/5,1/4) (1/6,1/5,1/4) (1,1,1) (1/4,1/3,1/2) (2,3,4)
Calendar (1/8,1/7,1/6) (1/8,1/7,1/6) (2,3,4) (1,1,1) (1/6,1/5,1/4)
Investment (1/6,1/5,1/4) (1/8,1/7,1/6) (1/4,1/3,1/2) (4,5,6) (1,1,1)
After completing the first three steps of the methodology, at the fourth step, the geometric mean of fuzzy comparison values of each criterion is calculated. Hence, the geometric means of fuzzy comparison values of all criteria. After achieving the normalized non-fuzzy relative weights for criteria, the same methodology is applied to find the respective values for alternatives. But now, the alternatives should be pair wise compared with respect to each criterion particularly. That means, this analysis should be repeated for 5 more times for each criterion. Pair wise comparison matrix is formed as Table 4. Table 4: Comparison matrix of alternatives with respect to “TRL” criterion
CRITERIA
TRL 0.391 0.383 Cost 0.418 0.409
Scope 0.075 0.074 Calendar 0.058 0.057
Investment 0.078 0.076
Individual scores of each alternative for each criterion are presented in Table 5.
SELECTING R&D PROJECT
TECHNOLOGY READINESS LEVEL (TRL)
COST SCOPE CALENDER INVESTMENT
A1 A1 A1

109
Table 5: Aggregated results for each alternative according to each criterion
CRITERIA Scores of Alternatives with respect to related Criterion
Weights A1 A2 A3
TRL 0.383 0.063 0.272 0.665 Cost 0.409 0.425 0.425 0.151
Scope 0.074 0.629 0.107 0.263 Calendar 0.057 0.149 0.784 0.067
Investment 0.076 0.629 0.107 0.263 TOTAL 0.301 0.339 0.360
Depending on this result, R&D Project 3 has the largest total score.
CONCLUSION
Decisions are made today in increasingly Research and Development environments. In more and more cases the use of experts in various fields is necessary, different value systems are to be considered, etc. In many of such decision-making settings the theory of fuzzy decision making can be of use. Fuzzy group decision making can overcome this difficulty. In general, many concepts, tool and techniques of artificial intelligence, in particular in the field of knowledge representation and reasoning, can be used to improve human consistency and implement ability of numerous models and tools in broadly perceived decision making and operations research. In this paper, DIRD projects were compared using fuzzy AHP. Humans are often uncertain in assigning the evaluation scores in crisp AHP. Fuzzy AHP can capture this difficulty.
Keywords: fuzzy AHP, R&D projects, technology readiness level
REFERENCES
[1] Buckley, J. J. (1985). Fuzzy hierarchical analysis. Fuzzy Sets and Systems, 17(3), 233-247. [2] Chan, F. T. S., & Kumar, N. (2007). Global supplier development considering risk factors using fuzzy extended
AHP-based approach. Omega, 35(4), 417-431. [3] Chang, D. Y. (1996). Applications of the extent analysis method on fuzzy AHP. European Journal of Operational
Research, 95, 649-655. [4] Kahraman, C., & Kaya, İ. (2010). A fuzzy multicriteria methodology for selection among energy alternatives.
Expert Systems with Applications, 37(9), 6270-6281. [5] Kahraman, C., Cebeci, U., & Ruan, D. (2004). Multi-attribute comparison of catering service companies using
fuzzy AHP: The case of Turkey. International Journal of Production Economics, 87(2), 171-184. [6] Kwong, C. K., & Bai, H. (2003). Determining the important weights for the customer requirement in QFD using a
fuzzy AHP with an extent analysis approach. Iie Transaction, 35, 619-626. [7] Lee, H. I., Chen, W. C., & Chang, C. J. (2008). A fuzzy AHP and BSC approach for evaluating performance of
IT department in the manufacturing industry in Taiwan. Expert Systems with Applications, 34(1), 96-107. [8] Saaty, T. L. (1980). The analytic hierarchy process. New York: McGraw-Hill. [9] Van Laarhoven, P. J. M., Pedrycz, W. (1983). A fuzzy extension of Saaty’s priority theory. Fuzzy Sets and
Systems, 11, 229-241.

110
PRODUCT-SERVICE SYSTEM IN TELECOMMUNICATIONS INDUSTRY
Jovana Mihailović*1, Biljana Stošić
2, Radul Milutinović
2
1A1 Serbia d.o.o.
2University of Belgrade - Faculty of Organizational Sciences
*Corresponding author, e-mail: [email protected]
OBJECTIVE
The product-service system represents set of products and services combined to jointly achieve the customers’ needs (Annarelli et al., 2019). Due to digitalization, there is an increasing number of new products, each offering some additional features and services. Added value of integrated product-service system usually lies behind services which are offered with products (Kryvinska & Bickel, 2020; Polova & Thomas, 2020). Literature findings show different motivations for servitization: to create competitive advantage, to improve the quality of customer relationship, to expand portfolio and create new sources of income (Raddats et al., 2016; Bigdeli et al., 2018). In the telecommunications industry, from operator perspective, systems are usually bought from supplier and integrated in the network, where supplier provides maintenance and support for products. This model doesn’t give much flexibility to operator. In the competitive market such as telecommunications, there is a wide range of new digital products (it is not easy to identify which one to choose). Wide market, customer needs, complexity and diversity of products demand new concepts in telecommunications. The objective of the paper is to investigate product-service system and different forms of servitization in telecommunications industry. The relationship between the supplier (the one who develops and offers complete service) and customer (mobile operator) is analyzed. Three different servitization examples are compared and evaluated. Key elements used for studying cases are: ownership of the service, payment model, maintenance and development capabilities. Tested hypotheses are the following:
H1: Servitization can give competitive advantage for the supplier. H2: Servitization leads toward partner relationship between the supplier and the customer. H3: Product service-system can help customer reduce risk and decrease initial investments in the new systems.
The study offers insight into how companies create integrated packets of products and services, shows examples of good practice and confirms some of the motivations for servitization found in literature.
METHODOLOGY
For the purpose of the research, a case study approach in mobile operator company is conducted. The research includes the analysis of a process for supplier selection for one cloud solution. Main method of data gathering is in-depth interviews with employees involved in solution selection process (such as product manager, senior purchasing expert, controlling expert, team manager and solutions director), and these data are to be complemented with materials used in selection process (offers, documentations, manuals).
RESULTS
The results of a case study should confirm that servitization, even though not a new concept in telecommunications industry, is evolving and that there are new forms of product-service system, going
111
beyond services like maintenance. These forms are beneficial for both customer and supplier. This should mean closer collaboration between customer and supplier, moreover collaboration is evolving towards partner relationship. Additionally, fixed price for a service over an agreed period is no longer attractive for customers, and, also, the ownership of a system is not necessarily transferred to customers. Criteria that should be taken into consideration when creating product-service package are: cost reduction, risk and service quality, customer budget, complexity of the system, familiarity of the customer with the system, flexibility of the system and customer necessity to buy the system (or renting a service is enough).
CONCLUSION
Product-service system can be beneficial for both supplier and customer in telecommunications industry. The process of servitization should give competitive advantage for the supplier. Understanding the customer needs, weaknesses and strengths is very important in this process. The findings of this paper should complement the literature for product-service system and should offer concrete inputs for companies in terms of how to better organize their business and gain advantage on the market, based on real-life examples. The paper is basically a case study and being so is aimed to illustrate possible applications of the servitization process. For better understanding of the process, quantitative research might be conducted.
Keywords: product-service system, servitization, telecommunications
REFERENCES
[1] Annarelli, A., Battistella, C., & Nonino, F. (2019). How product service system can disrupt companies’ business
model. In The Road to Servitization (pp. 175-205). Springer, Cham. [2] Kryvinska, N., & Bickel, L. (2020). Scenario-based analysis of IT enterprises servitization as a part of digital
transformation of modern economy. Applied Sciences, 10(3), 1076. [3] Polova, O., & Thomas, C. (2020). How to perform collaborative servitization innovation projects: the role of
servitization maturity. Industrial Marketing Management, 90, 231-251. [4] Raddats, C., Baines, T., Burton, J., Story, V. M., & Zolkiewski, J. (2016). Motivations for servitization: the impact
of product complexity. International Journal of Operations & Production Management. [5] Ziaee Bigdeli, A., Baines, T., Schroeder, A., Brown, S., Musson, E., Guang Shi, V., & Calabrese, A. (2018).
Measuring servitization progress and outcome: the case of ‘advanced services’. Production Planning & Control, 29(4), 315-332.

112
IMPROVING THE METHODOLOGY OF INNOVATION PROJECTS PORTFOLIO
MANAGEMENT
Aleksandar Miletić*1, Biljana Stošić
2, Radul Milutinović
2
1University of Defence – Military academy
2University of Belgrade – Faculty of Organizational Sciences *Corresponding author, e-mail: [email protected]
OBJECTIVE
During the 4th Industrial Revolution, innovation was seen as a key factor in creating competitive advantage. At the beginning of this century, the focus of innovation management and innovation projects has shifted to innovation project portfolio management -IPPM (Meifort, 2015), which becomes a tool for the survival and success of the company in the market, as well as for business operations and debt. So far, there are relatively few empirical studies on the application of IPPM and its results (Cooper & Sommer 2020; Kock & Gemunden, 2016), but also the fact that there is not yet a universal IPPM method that can link effective innovation portfolio management with the company's business success. Most often, the methods used by companies in this area are different combinations of techniques and tools to better match innovation projects with available resources. Balancing expected return with investment and risk allows companies to explore the best opportunities for success and future development and represents a learning effort to achieve results and reach the goals set by the innovation and business strategy (Gupta, Phaal & Probert, 2015). Strategic decision making in the IPPM process faces important challenges, such as avoiding the trap of “too many projects”, which can lead to inadequate resource allocation to individual innovation projects, and a lack of relevant data on which to base strategic decisions. It must also be emphasized that unsuccessful management of the early stages has a highly negative impact on the outcomes of the overall IPPM process (Cooper & Sommer, 2020). All of this calls for improving the existing methodology used in the IPPM process to assess the list of active projects efficiently and continuously. Accordingly, the existing approaches, methods, tools and techniques used to manage the IPPM process are examined. It also identifies the main features of the process, as well as the activities and parameters that have an impact on the management of the innovation portfolio and, consequently on a more efficient implementation of the innovation and business strategy.
METHODOLOGY
The following methods were used in the study of the problem: collection, study, analysis and systematization of the available literature and the results of empirical studies in the field of portfolio management of innovation projects. The data analysis itself was conducted, both at the level of primary sources - studies conducted by the authors during their previous scientific research work, and at the level of secondary sources -previously conducted studies on innovation portfolio management. Through the method of comparative analysis of existing results, the main challenges in managing the portfolio of innovation projects were identified, for which the existing methodology does not provide adequate solutions. The identification of the main challenges and the improvement of the existing methodology for innovation portfolio management was done through methods of analysis, comparison, benchmarking and case study. The research covers different areas and disciplines - the field of innovation management would be explored with the application of knowledge from project management, strategic management, knowledge

113
management, optimization methods, multi-criteria decision making, etc. This interdisciplinary approach to the problem should improve the methodology for the management of the innovation portfolio, which will have a relevant theoretical and practical basis.
RESULTS
The success of innovation project portfolio management is based on the achievement of its main objectives, each of which requires the application of specific tools and techniques. An optimal innovation portfolio, containing the right number of balanced projects, leads to profit maximization. This is a long-term goal of organizations that create a systematic approach to innovation management. Short-term success in innovation portfolio management is possible without a systematic approach, but in the long run, it is difficult to maintain and carries incomparably more uncertainty and risk. Innovation itself changes both the form and the content of modern businesses, so improving the methodology to achieve the expected results in innovation portfolio management is a dynamic and continuous process. First of all, it is necessary to know that it is essential for companies to use a systematic approach. Companies that are not aware of this fact risk run the risk of drowning in the modern, turbulent business world. The innovation portfolio management framework must take into account all the specifics of a company's business at a given moment.
CONCLUSION
The process of making strategic decisions in innovation portfolio management, such as selecting and prioritizing innovation projects, evaluating them, allocating resources, and even making extremely unpopular decisions such as freezing or stopping projects, must use a mix of tools and techniques that are more comprehensive and complex than those used in managing a portfolio of traditional projects. The overall framework for innovation portfolio management can be the same, but must include systematization and structuring of the process to a degree that does not limit the organization's flexibility and ability to respond to internal and external changes and maintain a strategic focus on innovation strategy. This means that the proposed improvement of the existing methodology of portfolio management of innovation projects is mainly reflected in the significant adaptation to the specificities of each company, as they differ significantly in terms of the strategic goals they want to achieve and the resources and capabilities they have.
Keywords: innovation, innovation projects, innovation portfolio, methodology
REFERENCES
[1] Cooper, G. R., & Sommer, F. A. (2020). New product portfolio management with agile. Research Technology Management, 63(1), 29-38. DOI: 10.1080/08956308.2020.1686291
[2] Gupta, N., Phaal, R., & Probert, D. (2015). Balancing the innovation portfolio: concepts and practice. PDMA Annual Research Forum at Anaheim. California, US
[3] Kock, A., & Gemuenden, G. H., (2016). How Strategic Orientation Moderates the Relationship between Innovation Portfolio Management and Success. R&D Management Conference 2016 “From Science to Society: Innovation and Value Creation at Cambridge, UK
[4] Meifort, A., (2015). Innovation Portfolio Management: A Synthesis and Research Agenda. Creativity and Innovation Management, 25(2), 251-269. DOI: 10.1111/caim.12109
[5] Stošić, B., & Milutinović, R. (2017). Key Issues to Improve Innovation Projects Excellence. In: Key issues for Management of Innovation Projects, InTech (pp. 25-43).
[6] Ulrich, L. (2014). Innovation portfolio management: enhancing new product performance. Performance, 6(4), 32-39.

114
SUSTAINABLE MANAGEMENT THROUGH DIGITAL SERVITIZATION
Maja Miloradov*1, Nenad Simeunovic
1, Ugljesa Marjanovic
1
1University of Novi Sad, Faculty of technical sciences
*Corresponding author, e-mail: [email protected]
OBJECTIVE
In recent years, when almost all companies are in a period of digital transformation, which involves the widespread use of digital technologies, especially the Internet of Things, a new research trend dedicated to servitization is emerging. This is precisely due to the mass use of digital technologies in manufacturing industries and servicing itself (Paiola et al., 2021). Digital transformation combines digitalization and servitization as two different trends in the industry. Digitization refers to the increasing application of digital technologies in order to connect companies, systems, people, products and services (Coreynen et al., 2017). In recent academic literature, changes through digitization, circular economy, and servitization are very rarely discussed. This trend is present although such changes lead to companies effectively reducing waste and facilitating sustainability, as well as defining different business capabilities and models. In many cases, it will be necessary to formulate new ways of organizing and working. Such requests stem from external influences, ie mainly from the company's environment and changes in the inter-organizational network. By implementing business models that take into account the aforementioned changes in the company's environment, companies can reap a number of benefits and take advantage of new opportunities in terms of shared responsibility, sustainability, improved service quality, profitability and risk sharing. New types of ecosystems lead to increased capacity and provide a wider set of resources, so that more affiliated organizations with their common knowledge and skills better respond to the growing and complex challenges of sustainability and management of such business (Parida & Wincent, 2019). There are multiple advantages of the phenomenon related to digital servitization, which relate to the environment and society. Some of these benefits are: delivering value to society as a whole, reducing environmental impact, building sustainable production processes and reducing energy consumption (Paschou et al., 2020). There is great importance in presenting the importance of servitization for sustainability, ie for the management of sustainable business, but despite this, this research area is still insufficiently researched in the literature (Paiola et al., 2021). This paper aims to fill such research gaps by answering the following research question:
What makes digital servitization an influential factor in terms of sustainable business and its management?
METHODOLOGY
The methodology used in the research is a systematic review of the literature. This way of research follows certain steps that complement each other. Scopus and Web of Science online databases were used to find and analyze the literature. Keywords such as Servitization, Sustainability and Digital Transformation were used in the search. The focus of the research was journal articles more than conference papers, with a focus on papers that provide in addition to theoretical and certain practical implications.
RESULTS
This paper looks at the changes that companies face when servicing in the age of digital transformation. In addition to the changes, technologies that contribute to digital servitization and confirm the impact on the

115
management of a sustainable system mentioned in the research question were also noticed.
CONCLUSION
The connection of digital servitization with individual digital technologies has been identified, pointing out the importance of their application in order to achieve the highest possible level of sustainability. This paper also has certain limitations, it does not identify which technology in digital servitization is best used in order to achieve efficient and effective management of sustainable business, which could be the subject of future research.
Keywords: servitization, digital transformation, sustainability, sustainable business management
REFERENCES
[1] Coreynen, W., & Matthyssens, P., & Van Bockhaven, W. (2017). Boosting Servitization through Digitization: Pathways and Dynamic Resource Configurations for Manufacturers. Industrial Marketing Management, 60, 42-53. DOI: 10.1016/j.indmarman.2016.04.012
[2] Paiola, M., Schiavone, F., Grandinetti, R., & Chen, J. (2021). Digital Servitization and Sustainability through Networking: Some Evidences from IoT-Based Business Models. Journal of Business Research, 132, 507-516.
DOI: 10.1016/j.jbusres.2021.04.047. [3] Parida, V., & Wincent, J. (2019). Why and How to Compete through Sustainability: A Review and Outline of
Trends Influencing Firm and Network-Level Transformation. International Entrepreneurship and Management Journal, 15(1), 1-19. DOI: 10.1007/s11365-019-00558-9.
[4] Paschou, T., Rapaccini, M., Adrodegari, F., & Saccani, N. (2020). Digital Servitization in Manufacturing: A Systematic Literature Review and Research Agenda. Industrial Marketing Management, 89, 278-292. DOI: 10.1016/j.indmarman.2020.02.012.
116
DEVELOPING SMART TOURISM AS A STRATEGIC APPROACH TO TOURISM
CHALLENGES IN THE POST-COVID ERA
Vuk Mirčetić*1, Marko Mihić
1
1University of Belgrade – Faculty of Organizational Sciences *Corresponding author, e-mail: [email protected]
OBJECTIVE
The contemporary complex and interconnected world became even more challenging due to the COVID-19 pandemic (Mirčetić et al., 2021). Despite a plethora of notable studies concerning the COVID-19 pandemic impact in many sectors, there is a particular theoretical gap regarding the interconnection between the pandemic and acceleration of digital transformation in tourism that strategic leaders can use to improve a strategy in similar crises. The motivation for this paper arose from the need to narrow the research gap and present a summary of perspectives on how the COVID-19 pandemic boosted digital transformation and its usage in tourism. The paper focuses on the possibility to comprehend potential positive aspects of a tremendous negative corona virus impact on tourism and highlights practical and managerial benefits from pandemic-enabled digital advancements. The negative impact of crises on tourism can be best observed in the number of international arrivals. The SARS epidemic in 2003 caused 2 million or 0.4% fewer international arrivals, the global economic crisis in 2009 caused 37 million or 4.0% less international arrivals, while the COVID-19 pandemic resulted in 1,059 million fewer international arrivals in 2020, which is 72.48% less than in 2019 (World Tourism Organisation, 2021a), and the loss of more than 62 million tourism jobs (World Travel and Tourism Council, 2021a). The COVID-19 pandemic has also caused a descent in Tourism Direct Gross Domestic Product, consequently compels decreases in Tourism's Share of World Gross Domestic Product and International Tourism Export Revenues in 2020 (World Tourism Organisation, 2021b), which implies that the COVID-19 pandemic had the most significant negative impact on tourism hitherto. Uncertainty and insecurity have increased worldwide due to the virus's severity, border closures, and frequent regulation changes (World Travel and Tourism Council, 2021b). In addition to economic issues, tourists are globally concerned about health risks. Stakeholders should have an agile approach (Bjelica et al., 2020), reevaluate risk-reduction strategies, develop innovative digital technologies (Ercan, 2022) and collaborate to help tourists feel safe.
METHODOLOGY
The interpretive content analysis of secondary sources was used in this article to achieve the paper's objective (Yanov & Schwartz-Shea, 2015). The sources include research papers from prestigious publishers and publications issued by relevant organisations such as the World Tourism Organisation and the World Travel and Tourism Council. Interpretive studies are concerned with the narrative's quality, richness, or qualitative character and strive to identify the source material's meaning and motivation (Herold & Lee, 2017) to understand better the context and how meaning is understood (Laine, 2005). Using interpretive content analysis implies the liberalisation of traditional content analysis coding rules, allowing more flexible and holistically analysing (Ahuvia, 2001). The paper's generalisation is limited because it is essentially narrative.
RESULTS
Digital transformation was already increasing before the pandemic, and the urgency to cope with the pandemic was the additional impetus to boost technological development and adoption. Artificial intelligence, robotics, big data, and the internet of things are examples of cutting-edge digital technology offering new methods for stakeholders in tourism, such as service operations or making the communication process with tourists easier (Ödemiş, 2022). The findings show that developing and implementing smart tourism is a

117
comprehensive and effective method for using boosted digital transformation as a strategic approach in the post-COVID era and future crises. Smart tourism integrates physical and virtual resources, which develops innovative tools and approaches for tourism improvement using technological advancements (Gretzel et al., 2015; Coronel et al., 2022). Additionally, digitalisation improves automated processes while maintaining physical distancing and reducing health risk considerations. Smart tourism includes all stakeholders and develops augmented tourist products to ensure sustainability and address contemporary tourism challenges (Yüksel, 2022).
CONCLUSION
The COVID-19 pandemic has undoubtfully had a devastating effect on tourism. However, it also brought some benefits, and although the COVID-19 pandemic boosted digital transformation and offered new opportunities for coping with crises, it is up to decision-makers to take advantage of these benefits in the post-COVID era. The article's findings showed the opportunity for the international tourism community to work more efficiently to restart tourism and have an effective approach to decision-making in the post-COVID era and future crises, which requires reliable information to guide appropriate policies and development strategies to ensure continuing of sustainable growth of tourism. Therefore, this article emphasises the urge for a multidisciplinary cross-sector strategic approach, including all stakeholders to have an agile approach, adapt to the "new normal", and manage contemporary problems in tourism. The paper recommends analysing strategic leadership approaches of different countries during the pandemic and outlining findings useful to all stakeholders in tourism. Understanding the practical, proactive and effective approaches during crises will have positive practical implications both during and after crises.
Keywords: sustainability, digital transformation, crises, COVID-19, “new normal”
REFERENCES
[1] Ahuvia, A. (2001). Traditional, Interpretive, and Reception Based Content Analyses: Improving the Ability of Content Analysis to Address Issues of Pragmatic and Theoretical Concern. Social Indicators Research 54, 139-
172. DOI: 10.1023/A:1011087813505. [2] Bjelica, D., Mihić, M., & Petrović, D. (2020). Agile project values and youth engagement in the post COVID
transition. XVII International Symposium SymOrg 2020 – Business and Artificial Intelligence (pp. 623-634). Belgrade, Serbia: University of Belgrade, Faculty of Organisational Sciences.
[3] Coronel, M., Papp-Váry, A. F., Pinke-Sziva, I., Berezvai, Z., & Smith, M. K. (2022). Post-Pandemic Re-Positioning in a Cultural Tourism City: From Overtourism to E-Tourism. In L. Oliveira (Ed.), Handbook of Research on Digital Communications, Internet of Things, and the Future of Cultural Tourism. IGI Global, Hershey, USA. DOI: 10.4018/978-1-7998-8528-3.ch023.
[4] Ercan, F. (2022). Accessible Tourism Experiences in Smart Destinations: The Case of Breda (Netherlands). In R. A. Costa, F. Brandão, Z. Breda, & C. Costa (Eds.), Planning and Managing the Experience Economy in Tourism. IGI Global, Hershey, USA. DOI: 10.4018/978-1-7998-8775-1.ch015.
[5] Gretzel, U., Sigala, M., Xiang, Z., & Koo, C. (2015). Smart Tourism: Foundations and Developments. Electron Markets 25, 179-188. DOI: 10.1007/s12525-015-0196-8.
[6] Herold, D., & Lee, K. (2017). The influence of the Sustainability Logic on Carbon Disclosure in the Global Logistics Industry: The Case of DHL, FDX, and UPS. Sustainability, 9, 601.
[7] Laine, M. (2005). Meanings of the term ‘sustainable development’ in Finnish corporate disclosures. Accounting Forum, 29(4), 395-413. DOI: 10.1016/j.accfor.2005.04.001.
[8] Mirčetić, V., Vukotić, S., & Karabašević, D. (2021). Effective Leadership in the COVID-19 Pandemic: Responsible Responses to Crisis. Proceedings of the 10th PAR International Scientific-Professional Leadership Conference “Leadership after COVID-19” PILC 2021 (pp. 430-440). Rijeka, Croatia, May 2021: PAR University
College. [9] Ödemiş, M. (2022). Smart Tourism Destinations: A Literature Review on Applications in Turkey's Touristic
Destinations. In N. Gustavo, J. Pronto, L. Carvalho, & M. Belo (Eds.), Optimizing Digital Solutions for Hyper-Personalization in Tourism and Hospitality. IGI Global, Hershey, USA. DOI: 10.4018/978-1-7998-8306-7.ch007
[10] World Tourism Organisation. (2021a). COVID-19 and Tourism, 2020: A Year in Review. UNWTO, Madrid,Spain. [11] World Tourism Organisation. (2021b). The Economic Contribution of Tourism and the Impact of COVID-19.
UNWTO, Madrid. DOI: 10.18111/9789284423200. [12] World Travel and Tourism Council. (2021a). Travel and Tourism Economic Impact 2021. WTTC, London, UK. [13] World Travel and Tourism Council. (2021b). Lessons learnt during COVID-19. WTTC, London, UK. [14] Yanov, D., & Schwartz-Shea, P. (2015). Interpretation and Method: Empirical Research Methods and the
Interpretive Turn. Routledge. [15] Yüksel, F. (2022). Smart Tourism in Destinations: Can It Be the Way Forward? In In L. Oliveira (Ed.), Handbook
of Research on Digital Communications, Internet of Things, and the Future of Cultural Tourism. IGI Global,
Hershey, USA. DOI: 10.4018/978-1-7998-8528-3.ch003.

118
DEVELOPMENT OF FLOOD RISK ASSESMENT MODEL
Jelena Andreja Radaković*1, Dragana Makajić-Nikolić
1
1University of Belgrade – Faculty of Organizational Sciences
*Corresponding author, e-mail: [email protected]
OBJECTIVE
The main objective of the paper is to show a novel approach to flood risk assessment, combining three different analyses – Event Tree Analysis (ETA), Fault Tree Analysis (FTA), and Dempster-Shafer evidence theory (D-S evidence theory). Risk assessment presents a key stage in the risk management process. It begins with the identification of risks and directly depends on how detailed the potential disasters have been identified (Makajić-Nikolić, 2020). Unfortunately, climate change and floods are a very current problem, both in the whole world and in the Republic of Serbia. Complex topics and phenomena such as natural disasters are the subject of study by many researchers in various scientific fields, and there are numerous studies that deal with the origin and modes of natural disasters, their forecasts and elements exposed directly and indirectly to these hazards, population perceptions and others. Risk assessment research is mainly conducted with an emphasis on prevention and all activities that need to be done before disasters occur. The model presented in this paper creates a “flood life cycle” mapping all possible causes of a flood, all possible outcomes, and lastly the measurement of belief that these events will happen as stated by field experts.
METHODOLOGY
The model presented uses three previously stated analyses:
Fault Tree Analysis is a systematic method used for analysis of the cause of risk using qualitative and quantitative deductive methods (Huang et al., 2016; Hyun et al., 2015).The analysis is based on a graph called the Fault Tree, which models the logical relationships between the observed adverse event and its cause, i.e., provides a graphical representation of the occurrence of an adverse event (Huang et al., 2016).
In Event Tree Analysis, a tree constructed is a visual presentation which will identify and quantify consequences of an adverse event. This analysis provides an inductive approach to consequences probabilities, as it is constructed using advanced logic (Rahman et al., 2018; Clifton & Ericson II, 2005).
Dempster-Shafer evidence theory deals with the epistemic (cognitive) uncertainty of a proposition. The theory is based on two measures: the measure of belief (belief measures) in a particular proposition and the measure of its plausibility (plausibility measures) (Salicone & Prioli, 2018).
Interviews with field experts.
The model proposed encompasses these three analyses into one model showing the “lifecycle of a flood”.
RESULTS
From the review of the literature and comparison of scientific papers on flood risk management, it is noticeable that they were used only from one angle - ranking the risk of cause or effect, and that D-S theory of evidence was used in forms other than those used in this proposed model. In this way, the entire “life cycle of a flood” from all possible causes to all possible consequences is examined. The result of this model

119
is a proposal of measures that simultaneously affect both elements of risk: reducing the probability of primary events (FTA) and mitigating the consequences (ETA).
CONCLUSION
It is evident that floods pose a major threat to people, material goods, infrastructure, the economy and the environment, despite significant developments in event forecasting, disaster management, defense and rescue activities in emergencies. Predicted climate change and urbanization of floodplains will increase the lethality of floods, and precisely because of this, efficient and effective flood management is becoming more and more necessary and urgent. It should be added that an adequate flood risk assessment model, which covers a flood’s entire life cycle, results in opportunities for timely future response to irregular climate events.
Keywords: flood risk, risk assessment, flood life cycle
REFERENCES
[1] Clifton, A. & Ericson II (2005). Hazard Analysis Techniques for System Safety. John Wiley & Sons. [2] Huang, W., Fan, H., Qiu, Y., Cheng, Z., & Qian, Y. (2016). Application of fault tree approach for the causation
mechanism of urban haze in Beijing - Considering the risk events related with exhausts of coal combustion. Science of the Total Environment, 544, 1128-1135.
[3] Hyun, K. C., Min, S., Choi, H., Park, J., & Lee, I. M. (2015). Risk analysis using fault-tree analysis (FTA) and analytic hierarchy process (AHP) applicable to shield TBM tunnels. Tunnelling and Underground Space Technology, 49, 121-129.
[4] Makajić-Nikolić, D. (2020). Disaster Risk Reduction. In: Leal Filho W., Azeiteiro U., Azul A., Brandli L., Özuyar P., Wall T. (eds.), Climate Action. Encyclopedia of the UN Sustainable Development Goals. Springer, Cham. DOI: 10.1007/978-3-319-71063-1_65-1
[5] Rahman, S., Karanki, D. R., Epiney, A., Wicaksono, D., Zerkak, O., & Dang, V. N. (2018). Deterministic sampling for propagating epistemic and aleatory uncertainty in dynamic event tree analysis. Reliability Engineering & System Safety, 175, 62-78.
[6] Salicone, S., & Prioli, M. (2018). Measuring uncertainty within the theory of evidence (Vol. 2020). Springer.

120
SHARING ECONOMY AND SUSTAINABLE DEVELOPMENT GOALS
Nataša Petrović*1, Veljko Jeremić
1, Marko Ćirović
1
1University of Belgrade – Faculty of Organizational Sciences
*Corresponding author, e-mail: [email protected]
OBJECTIVE
Considering ecology and environmental protection is increasingly being accepted as a necessity worldwide, as well as emphasizing the awareness of human complicity in environmental degradation, which sets new types of development with prominent environmental values. “Consequently, the concept of sustainability has received enormous attention from scholars and economists attempting to provide practical solutions” (Rosário & Dias, 2022). The concept or paradigm of sustainability is an idea, process, or strategy related to overcoming an existing situation related to environmental, social, and economic crisis (Borojević et al., 2017). Sustainability is directly related to sustainable development. When it comes to sustainable development it is important to notice that it relies on three pillars: social, economic, and environmental. Hence, it is crucial to introduce sharing economy in these topics, having in mind that “the issue of sustainable development has been of particular importance in the intensively developed theory of the sharing economy” (Lyaskovskaya & Khudyakova, 2021). The aim of this research is to explore the connection between sharing economy and sustainable development, as well as the impact of sharing economy on the achievement of sustainable development goals.
METHODOLOGY
To achieve the research objective, several methods were utilized in this study. Firstly, qualitative methods were used to study the origins of the sharing economy and its ties to sustainability and sustainable development. Secondly, a historical retrospective has been done, which examined the theory of sharing economy primarily in the context of its connections with the concept of sustainable development, as well as the transformation of sharing economy in accordance with the goals of sustainable development.
RESULTS
In the recent period, great attention has been given to the concept of sharing economy not only by the researchers, but also by decision-makers, media, and other stakeholders. “The sharing economy is an umbrella term for a great variety of organizational models that are transforming marketplaces and cityscapes, where goods and services, skills and spaces are shared, exchanged, rented or leased” (Mont et al., 2020). It should be emphasized that digital technologies have greatly contributed to the growth of the sharing economy trend (Frenken & Schor, 2017). When it comes to sustainability it must be noted that sharing economy creates sustainable values (Laukkanen & Tura, 2020), having in mind that sharing economy has contributed to reducing consumption and usage of resources and energy. In that manner sharing economy directly affects the achievement of sustainable development goals, in particular, “SDG 8 (sustainable economic growth); SDG 9 (industry, innovation, and infrastructure); SDG 12 (sustainable consumption and production), and SDG 16 (peaceful and inclusive societies)” (Pérez-Pérez et al., 2021).

121
Figure 1: Theoretical overview of the sharing economy (Karobliene & Pilinkiene, 2021)
Figure 2: SDGs directly linked to the sharing economy
CONCLUSION
In the conclusion of this paper, the authors provide a theoretical approach to the sharing economy and demonstrate that sharing economy has a relevant and significant part in sustainable development. In addition, the obtained results clearly show that sharing economy contributes to the progress towards achieving sustainable development goals. Hence, the research contributes to the growing number of scientific papers about sharing economy and sustainability as well.
Keywords: sharing economy, sustainability, sustainable development, sustainable development goals
ACKNOWLEDGMENT
This research was supported by the Science Fund of the Republic of Serbia, Grant No 7523041, Setting foundation for capacity building of sharing community in Serbia – PANACEA.
REFERENCES
[1] Borojević et al., (2017). Youth Attitudes Towards Goals of a New Sustainable Development Agenda. Problems of Sustainable Development, 12(2), 161-172.

122
[2] Frenken, K., & Schor, J. (2017). Putting the sharing economy into perspective. Environmental Innovation and Societal Transitions, 23, 3-10. DOI: 10.1016/j.eist.2017.01.003
[3] Karobliene, V., & Pilinkiene, V. (2021). The Sharing Economy in the Framework of Sustainable Development Goals: Case of European Union Countries. Sustainability, 13(15), 8312. DOI: 10.3390/su13158312
[4] Laukkanen, M., & Tura, N. (2020). The potential of sharing economy business models for sustainable value creation. Journal of Cleaner Production, 253, 120004. DOI: 10.1016/j.jclepro.2020.120004
[5] Lyaskovskaya, E., & Khudyakova, T. (2021). Sharing Economy: For or against Sustainable Development. Sustainability, 13, 11056. DOI: 10.3390/su131911056
[6] Mont, O., Palgan, Y. V., Bradley, K., & Zvolska, L. (2020). A decade of the sharing economy: Concepts, users, business and governance perspectives. Journal of Cleaner Production, 269, 122215. DOI:
10.1016/j.jclepro.2020.122215 [7] Pérez-Pérez, C., Benito-Osorio, D., García-Moreno, S. M., & Martínez-Fernández, A. (2021). Is Sharing a Better
Alternative for the Planet? The Contribution of Sharing Economy to Sustainable Development Goals. Sustainability, 13(4), 1843. DOI: 10.3390/su13041843
[8] Rosário, A., & Dias, J. C. (2022). Sustainability and the Digital transition: a literature review. Sustainability, 14(7), 4072. DOI: 10.3390/su14074072

123
DIGITAL OPERATIONS AND LOGISTIC MANAGEMENT
124
DIGITALIZATION OF AUTOMATED GUIDED VEHICLES KEY PERFORMANCE
INDICATORS
Diogo Barbosa1, Ângela Silva*
2, Wellington Alves
3
1Instituto Politécnico de Viana do Castelo
2ADiT-LAB, Instituto Politécnico de Viana do Castelo 3CIICESI, Escola Superior de Tecnologia e Gestão
*Corresponding author, e-mail: [email protected]
OBJECTIVE
With the gradual increase in demand in the automotive sector, and since it is an increasingly competitive market, companies must invest in improving their processes. Also, the digital transformation has forced companies to reconsider their operations and processes to gain a competitive advantage (Braglia et. al, 2022). To keep the cost of material handling low and still provide a robust and dynamic supply to the shop floor, automated guide vehicles (AGVs) can be used to move materials from the warehouse to work centers and between workstations (Heger and Voss, 2019). However, the acquisition of automated equipment requires a large amount of investment from the companies, especially SMEs, that’s why this decision needs to be carefully analyzed. Besides that, the performance of the equipment needs to be monitored, so the design and implementation of indicators are crucial for the management and control of the performance of the equipment (Brint et. al, 2021).
In this work, the KPI implementation arose with the interaction of monitoring and measuring the performance inherent to the acquisition of three Automated Guided Vehicles (AGVs), that were outsourced to meet the needs of the automotive assembly lines. Until now, there was no specific and visual way to consult or evaluate the productivity of each of them. This project aims to develop a digital dashboard for AGV key performance indicators, that allow the daily registration and monitorization of the AGV data, and the automatic calculation of the KPI that is user-friendly, visually pleasing, and simple to improve.
METHODOLOGY
The methodological strategy used in this research was the case study, resorting to one SME of the automotive sector located in the northern region of Portugal, which aimed to analyze the AGV performance before making a large investment. For the selection of performance indicators for the AGVs, it was considered that the indicators would have to be directly related to the company’s strategy, validated by the manager. After defining the conditions intrinsic to the KPI, data was collected from an online platform provided by the outsourced company. The data collected through the platform was presented in excel format (.csv), which contained unstructured information, only separated by lines (Figure 1), therefore, there was a need to optimize the adaptation of these data using the Visual Basic for Applications (VBA) programming language.
RESULTS
After extracting the document in CSV format, the Excel tool was used, which, through macros in VBA, allowed the organization of data, making the information available in a structured way, offering a broader view of the data. In this sense, daily performance indicators were initially created, which made it possible to measure the number of tasks completed per shift and per hour of each AGV, as well as the time intrinsic to each task, represented by bar graphs.

125
Figure 1: CSV Document
At a later stage, weekly performance indicators were also included, which allowed for a broader and more detailed notion of each indicator. With this, the following indicators were implemented: 1) Operating time per AGV (min) on each business day; 2) Saturation/occupancy rate; 3) Distribution of the number of tasks per AGV (%); 4) Number of tasks per shift on each working day of the previous week; 5) Uptime per AGV (min) on each shift and working day of the previous week (Figure 2).
Figure 2: Digital Dashboard
CONCLUSION
The main contribution of this work was the development of a digital dashboard of key performance indicators associated with the outsourcing of automated guided vehicles (AGV). This tool makes it possible to analyze, monitor, and measure the productivity of the AGV, allowing access to specific information that can be used to assist the decision-making of top management, namely the logistics manager. The development of this dashboard now enables the creation of new indicators since the information is now structured.
ACKNOWLEDGEMENTS
This work has been supported by national funds through FCT- Fundação para a Ciência e Tecnologia through project UIDB/04728/2020 (Alves) and FCT – Fundação para a Ciência e Tecnologia within the R&D Units Project Scope: UIDB/00319/2020 (Silva). This research was part of a Bachelor thesis of the student Diogo Barbosa.
Keywords: Digital Dashboard, KPI, AGV, Logistics Management
REFERENCES
[1] Braglia, M., Gabbrielli, R., Marrazzini, L., & Padellini, l. (2022). Key Performance Indicators and Industry 4.0 – A structured approach for monitoring the implementation of digital technologies. In Procedia Computer Science 200 (pp. 1626-1635). Elsevier.
[2] Brint, A., Genovese, A., Piccolo, C., & Taboada-Perez, G. (2021). Reducing data requirements when selecting key performance indicators for supply chain management: The case of a multinational automotive component manufacturer. International Journal of Production Economics, 233, 107967.
[3] Heger, J. & Voss, T. (2019). Reducing mean tardiness in a flexible job shop containing AGVs with optimized combinations of sequencing and routing rules. Procedia CIRP 81 (pp. 1136-1141), Elsevier.

126
AN APPROACH TO SUPPORT SMALL MEDIUM-SIZE COMPANIES IN PLANNING AND MANAGING DISTRIBUTION ROUTES
Diogo Costa1, Wellington Alves*
2, Ângela Silva
3
1Instituto Politécnico de Viana do Castelo
2CIICESI, Escola Superior de Tecnologia e Gestão
3ADiT-LAB, Instituto Politécnico de Viana do Castelo
*Corresponding author, e-mail: [email protected]
OBJECTIVE
In the recent decades the current literature has seen an increasing number of research focusing on models for an effective management of the provision of goods in distribution systems. It can be justified due to the increased awareness of governments and companies, regarding to the climate change, and also the need to save costs in global transportation (Moghdani et al., 2021). In transportation services, companies worldwide have been looking for alternatives to offer customers a high level of services, since there is a need for differentiation in companies operating in this sector. In doing, they can ensure that a product will be in the desired location, during the intended day and at the right time required (Lu & Chen, 2021). In the industrial sector the demands of the customer regarding to prices, delivery and product quality, are more and more demanding, if it doesn't exist, it can lead to increasingly higher levels of expense in the operation. Thus, it is necessary to intervene with logistical strategies to ensure that the processes are effective and efficient (Leggieri & Haouari, 2017). In this context, due to the difficulties of Small-medium enterprises (SMEs) on planning and managing distribution routes to delivery their products, which remains an explored area in the academy this research aims to bridge this gap, analyzing the planning and management of routes in a SME, namely flower company, as well to identify problems related to distribution of products in the company, this study attempts then to contribute to discuss the challenge of delivering goods in a sustainable manner.
METHODOLOGY
This research used a case study as a methodological strategy, resorting to an SME located in the northern region in Portugal, to illustrate the difficulties faced on delivering goods in a sustainable manner. In order to achieve the objective proposed, a set of steps were carried out. Firstly, a analyze the main routes for deliveries established by the company was used as source of data. Secondly an evaluation of transport management tools available at company was performed; and a model for optimizing routes, considering inputs for the Routes control software used in the company was proposed.
RESULTS
From the research conducted a set of problems were identified. Regarding the analysis of the previous routing zones (1), an identification of problems in the software used by the company was identified. It was related to the incorrect location of the customer's delivery in the software, which caused constrains on optimizing routes scenarios to delivery locations, since the software assumed different places from the real delivery locations.

127
Then the analysis of the department of the distribution and the respective optimization of routes was developed manually (2), without distinction or restriction, which would certainly lead to the optimization of extra costs. For this regard, to obtain a clearer and more objective analysis, an analysis in the Wavemaps software was performed, and the results showed the potential gains that the company would have between using a software to optimization the routes instead of doing manually. The analyses performed showed that, when planning and managing resorting to the WaveMaps, it would be possible to reach an estimated value of 3 196,19 € /year.
CONCLUSION
This research proposes an analyses of distribution routes in a flower company, and a set of practices were proposed in order to minimize problems caused during the transportation of the products cos delivered by the company. A summary of the main problems related to distribution were identified, and a set of solutions to face those problems was proposed. The implementation of the proposed solutions, such as introduction of the coordinates of all customers in the PHC software, creation of new distribution zones, and implementation of the routes control in software with the new distribution zones for the optimization of routes, allowed to the company reduce the time to perform this task by about 60%.
ACKNOWLEDGEMENTS
This work has been supported by national funds through FCT- Fundação para a Ciência e Tecnologia through project UIDB/04728/2020 (Alves) and FCT – Fundação para a Ciência e Tecnologia within the R&D Units Project Scope: UIDB/00319/2020 (Silva). This research was part of a Bachelor thesis of the student Diogo Costa.
Keywords: small-medium enterprises, distribution, logistics
REFERENCES
[1] Leggieri, V., & Haouari, M. (2017). A practical solution approach for the green vehicle routing problem. Transportation Research Part E: Logistics and Transportation Review, 104, 97-112. DOI:
10.1016/j.tre.2017.06.003 [2] Lu, B., & Chen, Z. (2021). Live streaming commerce and consumers’ purchase intention: An uncertainty
reduction perspective. Information & Management, 58(7), 103509. DOI: 10.1016/j.im.2021.103509 [3] Moghdani, R., Salimifard, K., Demir, E., & Benyettou, A. (2021). The green vehicle routing problem: A
systematic literature review. Journal of Cleaner Production, 279. DOI: 10.1016/j.jclepro.2020.123691

128
SPREADSHEET-BASED SHADOW IT: CASE OF SERBIA
Lena Đorđević-Milutinović*1, Lazar Raković
2, Slobodan Antić
1
1University of Belgrade – Faculty of Organizational Sciences
2University of Novi Sad – Faculty of Economics
*Corresponding author, e-mail: [email protected]
OBJECTIVE
The contemporary business world, characterized by market volatility, related to COVID-19 pandemic, war, migration, environmental disasters, and other disruptions on one side, and digitalization and automation revolution trends on the other, imposes a number of challenges to companies on a daily basis. Not just winning the competition, but even survival in today's market means continuous improvement and process optimization, as well as constant innovation and sustainability. Furthermore, big data analysis and data-driven decision-making are not only imperative but also a necessity for a large number of companies. In response to numerous demands, companies develop new strategies, but also supporting information systems have to be developed (Rakovic et al., 2020). It is not surprising that IT labor market cannot satisfy companies’ needs. Moreover, IT departments constantly struggling and trying to respond to all the needs of managers, but also their colleagues. In addition, what about micro and SMEs without IT support? One of the answers to all of the above-mentioned is Shadow IT and end-user development occurrence. Shadow IT enables faster data analysis, user-friendly interface, location-independency, and taking the advantage over classic ERP software (Rakovic et al., 2020). These systems do not require organizational approval of the company board. Employees combine different “puzzle parts” and create their own individually made system. However, that involves a major risk. The more application software are used, the more difficult is to control them. Many papers reference spreadsheets as one of the most common form of end-user programming and their relation to shadow IT. The existence of spreadsheet shadow IT topic in literature spans more than a decade. Nevertheless, when it comes to Serbia, this topic is not analyzed and present enough. Based on all the above discussed, the purpose of the paper is reflected in the answers to the following research questions:
What is shadow IT and does it exists in Serbia?
What is the most commonly occurring form of shadow IT in Serbia?
What are the risks of shadow IT?
How Spreadsheet engineering education influences shadow IT occurrence and handling?
METHODOLOGY AND RESULTS OUTLINE
Answers to the defined research questions will be obtained by conducting a systematic literature review and if necessary empirical research in which end-users and experts from different business units and industries, working in companies operating in Serbia, will be consulted. Within the research process, the following citation and research databases will be searched: Web of Science, Scopus, SpringerLink, AIS digital library, IEEE Xplore, Google Scholar, and ACM Digital Library. Due to the limitation of the abstract length, Table 1 presents some of the initial search results of Google Scholar. Preliminary analysis of search results shows that spreadsheet models and applications represent one of the most commonly occurring forms of shadow IT in Serbia. The industry, companies’ official information system, type, and the reason for spreadsheet shadow IT system existence are also considered in Table 1.
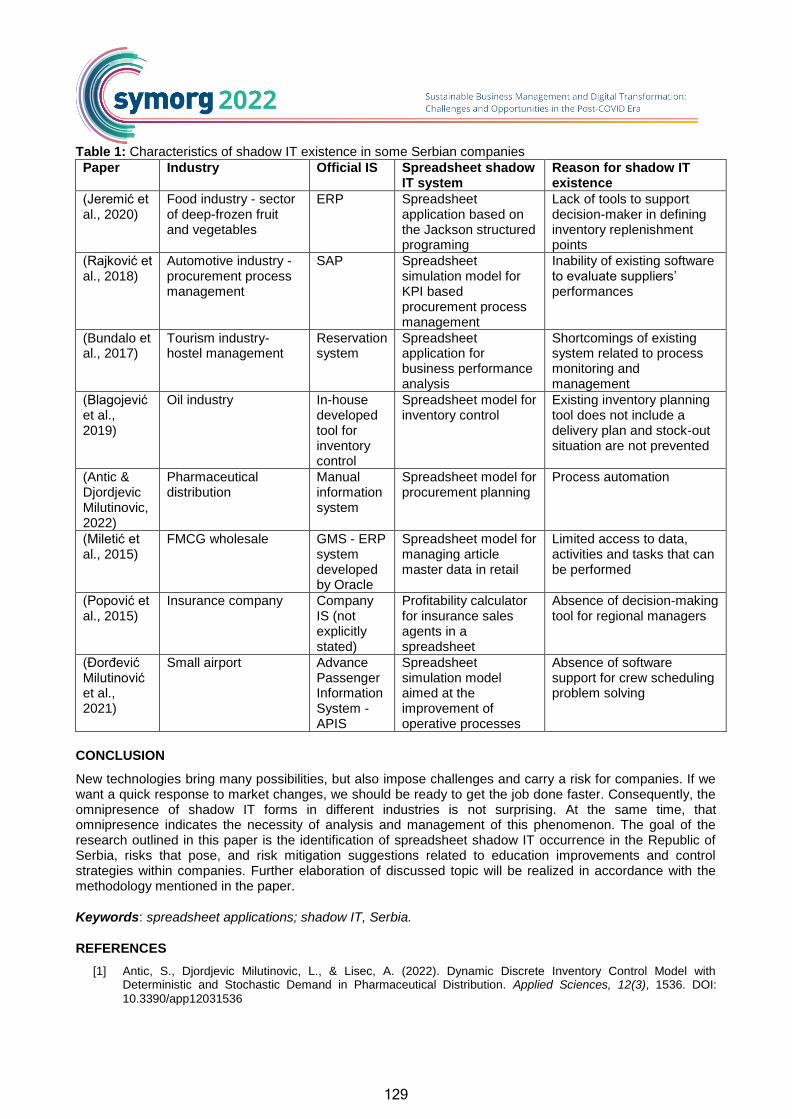
129
Table 1: Characteristics of shadow IT existence in some Serbian companies
Paper Industry Official IS Spreadsheet shadow IT system
Reason for shadow IT existence
(Jeremić et al., 2020)
Food industry - sector of deep-frozen fruit and vegetables
ERP Spreadsheet application based on the Jackson structured programing
Lack of tools to support decision-maker in defining inventory replenishment points
(Rajković et al., 2018)
Automotive industry - procurement process management
SAP Spreadsheet simulation model for KPI based procurement process management
Inability of existing software to evaluate suppliers’ performances
(Bundalo et al., 2017)
Tourism industry-hostel management
Reservation system
Spreadsheet application for business performance analysis
Shortcomings of existing system related to process monitoring and management
(Blagojević et al., 2019)
Oil industry In-house developed tool for inventory control
Spreadsheet model for inventory control
Existing inventory planning tool does not include a delivery plan and stock-out situation are not prevented
(Antic & Djordjevic Milutinovic, 2022)
Pharmaceutical distribution
Manual information system
Spreadsheet model for procurement planning
Process automation
(Miletić et al., 2015)
FMCG wholesale GMS - ERP system developed by Oracle
Spreadsheet model for managing article master data in retail
Limited access to data, activities and tasks that can be performed
(Popović et al., 2015)
Insurance company Company IS (not explicitly stated)
Profitability calculator for insurance sales agents in a spreadsheet
Absence of decision-making tool for regional managers
(Đorđević Milutinović et al., 2021)
Small airport Advance Passenger Information System - APIS
Spreadsheet simulation model aimed at the improvement of operative processes
Absence of software support for crew scheduling problem solving
CONCLUSION
New technologies bring many possibilities, but also impose challenges and carry a risk for companies. If we want a quick response to market changes, we should be ready to get the job done faster. Consequently, the omnipresence of shadow IT forms in different industries is not surprising. At the same time, that omnipresence indicates the necessity of analysis and management of this phenomenon. The goal of the research outlined in this paper is the identification of spreadsheet shadow IT occurrence in the Republic of Serbia, risks that pose, and risk mitigation suggestions related to education improvements and control strategies within companies. Further elaboration of discussed topic will be realized in accordance with the methodology mentioned in the paper.
Keywords: spreadsheet applications; shadow IT, Serbia.
REFERENCES
[1] Antic, S., Djordjevic Milutinovic, L., & Lisec, A. (2022). Dynamic Discrete Inventory Control Model with Deterministic and Stochastic Demand in Pharmaceutical Distribution. Applied Sciences, 12(3), 1536. DOI:
10.3390/app12031536

130
[2] Blagojević, B., Antić, S., & Djordjevic Milutinovic, L. (2019). Spreadsheet model for inventory management in oil industry. Зборник радова In Proceedings of the XII Conference of Business and Science SPIN ’19 (pp. 369-
376), November 7-8, 2019, Faculty of organizational sciences, Belgrade, Serbia. [3] Bundalo, S., Đorđević, L., & Antić, S. (2017). Spreadsheet application for tracking and improving hostel
services. Info M, 16(64), 26-32. [4] Đorđević Milutinović, L., Makajić-Nikolić, D., Antić, S., Živić, M., & Lisec, A. (2021). Control model for ground
crew scheduling problem at small airports: case of Serbia. Transport, 36(3), 235-245. DOI: 10.3846/transport.2021.15369
[5] Jeremić, U., Đorđević Milutinović, L., & Antić, S. (2020). Spreadsheet application for inventory control of frozen fruit based on structured design. In Proceedings of the XVII International Symposium SYMORG “Business and Artificial Intelligence” (pp. 18-25), September 7-9, 2020, Faculty of organizational sciences, Belgrade, Serbia.
[6] Miletić, D., Antić, S., & Djordjevic Milutinovic, L. (2015). Spreadsheet model for managing article master data in retail. In Proceedings of the X Conference of Business and Science SPIN ’15 (pp. 288-295), November 5-6, 2019, Faculty of organizational sciences, Belgrade, Serbia.
[7] Popović, J., Djordjevic Milutinovic, L., & Antić, S. (2015). Spreadsheet simulation model for sales performance measuring. In Proceedings of the X Conference of Business and Science SPIN ’15 (pp. 296-303), November 5-6, 2019, Faculty of organizational sciences, Belgrade, Serbia.
[8] Rajković T., Lečić-Cvetković, D., Đorđević, L., & Mijalkov, Z. (2018). KPI Based Model for Improvement of Procurement Process Management. In Proceedings of the XIII Balkan Conference on Operational Research BALCOR 2018 (pp. 334-341), 25-28. May, 2018, Belgrade, Serbia.
[9] Rakovic, L., Duc, T. A., & Vukovic, V. (2020). Shadow IT and ERP: Multiple Case Study in German and Serbian Companies. JEEMS Journal of East European Management Studies, 25(4), 730-752. DOI: 10.5771/0949-6181-2020-4-730

131
MOTIVATIONAL ELEMENTS OF INTRODUCTION AND USE OF
INTELLIGENT SYSTEMS THROUGH THE PARADIGM OF NEW ELECTRIC MOBILITY
IN EUROPE AND BEYOND
Patricija Jankovič*1, Sašo Murtič
1, Albert Zorko
2
1AREMA
2University of Novo Mesto – Faculty of Information Studies
*Corresponding author, email: [email protected]
OBJECTIVE
The global economic situation has forced Europe, and the European Union in particular, to seek new technologies, modern systems and intelligence to change the forms of movement and mobility. There is a growing need to modernize Europe's infrastructure with intelligent systems that would allow new mobility to be introduced and eliminate combustion vehicles over time. Europe is developing forms of mobility that would help it to be independent of the energy that needs to be imported, while at the same time seeking to maintain a clean environment, which should help to sustain climate change. It is this European orientation towards modern mobile systems that has led us to try to identify new forms of movement in this scientific research task, through the understanding of digital change and the introduction of intelligent systems, which is supposed to be a new paradigm of mobility. We were looking for motivational elements to use the new electric mobility. The research had to go through many records, studies, scientific findings, and through reading, reviewing and finding appropriate solutions, identifying individual systems that offer different mobility. The aim was to obtain data through numerous projects, through numerous scientific researches, through national records and statistical statements, which show motivational elements that should convince buyers or drivers of current motor, gas or hybrid vehicles to opt for a new form of electric mobility.
METHODOLOGY
Through the research, we collected, reviewed, analyzed, measured, studied and evaluated data related to the new paradigm of electric mobility, and looked for interconnections, strengths and weaknesses, which we used as a basis for timeline review of processed data for the past and future wishes. The methods are described in the article.
RESULTS
The objective of the research was to find models of movement, mobility and transport through the European guidelines and through numerous green mobility development projects, whose emissions do not affect the environment and do not affect living space and climate change. We sought and studied models of introducing green mobility that we knew in the past, but not in all its current elegance and capabilities, which can be recognized and seen today in the aesthetics of elegance of many electric vehicle models representing intelligent systems. We focused our research on the well-known factors that promote the use of electric mobility in Europe and beyond. The automotive industry has identified co-financing opportunities, which it has used for new products, making competition in the electric vehicle market very fierce, with the current technological surplus in research on individual components and forms of electric battery charging,

132
driving time and number of journeys. kilometers per charging unit. Through recognizable information, published data and characteristics of individual forms of electric vehicles, we wanted to identify the motivational elements of the individual's decision to introduce and use electric mobility.
Figure 1: Energy consumption by type of vehicle after 100km
Electric vehicles have a strong impact on the fifth-generation industrial revolution, which significantly directs the development of industry and society as consumers, everything goes into a greater coexistence of natural and artificial intelligence, so it is expected that individual tests.
Figure 2: Numbers of electrical vehicles in Slovenia
CONCLUSION
Everything is being modernized, everything is changing, so it is understandable that the company is financially and materially ready for measures of industrial development, expansion and mass use of electric mobility or electric vehicles. The question is whether Europe, as well as the world, has enough renewable resources to ensure secure and adequate electrification and energy supply.
Table 1: Energy consumption by type of vehicle after 100 km
factors Fossil Fuel Vehicles (ICE)
Hybrid Vehicle Combination (PHEV)
Electric vehicle (EV)
Type of operation
Otto petrol engine A combination of Otto and an electric vehicle
Electric motor
Kategorija vozila
Lower middle class An example is the Toyota Prius
Lower middle class
Consumption per 100 km
Acceptable use of 6 l of petrol per 100 / km
The combination uses gasoline electricity 4.3 liters of gasoline per 100 / km
About 15 kWh ≈ 2.5 Le (which is eligible for 2.5 l of fuel equivalent)
Cost per 100 / km
6,00 € 4,30 € 2,5 €
Eligible relationship to EV
3 (2,40 : 1)
2 (1,72 : 1)
1
Source: prepared by the authors, adapted for the e-world, 2020b

133
Keywords: intelligent systems, electric mobility, modern infrastructure, models of movement
REFERENCES
[1] A. L. (2015). Pečjakov metron 7 potolkel nov rekord z enim polnjenjem. Spletni portal Žurnal24 zurnal24.si, Feniks media, d.o.o., 19. junij 2015. Retrieved from www.zurnal24.si/avto/pecjakov-metron-7-potolkel-nov-rekord-z-enim-polnjenjem-252014 (8. 6. 2020).
[2] A. L. (2017). Avto je moralo gasiti 35 ljudi. Spletni portal Žurnal24 – zurnal24.si, Feniks media, d.o.o., 24. oktober 2017. Retrieved from www.zurnal24.si/avto/avstrija-35-gasilcev-v-boju-z-gorecim-avtom-299110 (2. 6. 2020).
[3] A. L. (2019). Bo vsak električni avto potreboval svoj bazen? Spletni portal Žurnal24 – zurnal24.si, Feniks media, d.o.o., 4. april 2019. Retrieved from www.zurnal24.si/avto/bo-vsak-elektricni-avto-potreboval-svoj-bazen-gasenje-elektricni-avto-325569 (8. 6. 2020).
[4] Al. Ma. (2019). Razvili baterijo za polnjenje električnega avtomobila v desetih minutah. MMC RTV SLO, STA, 4. november 2019. Retrieved from www.rtvslo.si/znanost-in-tehnologija/razvili-baterijo-za-polnjenje-elektricnega-avtomobila-v-desetih-minutah/503946 (10. 9. 2020).
[5] Aleksič, Jure (2008). Kratka zgodovina električnega avtomobila. Spletna revija Mladina, 4. december 2008. Retrieved from www.mladina.si/45593/kratka_zgodovina_elektricnega_avtomobila/ (7. 6. 2020).
[6] Anderson, Curtis Darrel & Anderson, Judy (2005). Electric and Hybrid Cars: A History. Jefferson, North Carolina: McFarland & Company, Inc.
[7] Avant car (2020). Pogosta vprašanja – Zmogljivosti. Avant car Ljubljana. Retrieved from www.avantcar.si/sl/elektricna-mobilnost/pogosta-vprasanja/zmogljivosti/#pogosta-vprasanja (3. 6. 2020).

134
WATER TRAFFIC MANAGEMENT SYSTEMS IN PORTS FOR THE NEEDS OF
MANAGEMENT IN PORT LOGISTICS
Patricija Jankovič*1, Sašo Murtič
1, Andrej Raspor
1
1AREMA
*Corresponding author, email: [email protected]
OBJECTIVE
Water, sea, lake and river transport in the world are demanding and at the same time the most widespread form of transport, where water infrastructure plays an important role and enables the transport of goods to all continents and countries. The interconnection of water with road or rail infrastructure flows through ports located in areas in the space that allows it, with the port being a window to the world of each country, while an area where many operations are carried out to carry out port activities. Water transport management systems in ports for the needs of management and logistics in port activities represent a research area where we looked for possibilities and naughtiness of individual forms and models of intelligent systems that would accelerate the activity. The purpose was to find useful intelligent water transport management systems in ports, which should serve as management in logistics, in seaports for the organization of safe navigation and movement of ships. Ports are gradually developing their activities according to the requirements and needs of maritime transport in terms of the number of ships and cargo arriving, and success is shown through the number of operations performed, the amount of transshipment, embarkation or disembarkation, which is reflected in the added value of goods and financial flows. The sea and the land are two infrastructural phenomena that connect and provide opportunities for integration into international trade, while the sea (conditionally lakes and rivers) is often a window into the world, where ports organize large movement (transport) of cargo, goods, capital or, in the case of a passenger, the transport of passengers (embarkation or disembarkation) to different places. Since sea or water routes in the world represent the basic infrastructure through which about 65% of goods in international trade are transported (Zelenika & Plavić, 2007), it is necessary to maintain, equip and introduce intelligent systems in safe navigation to ensure better information. Intelligent systems perform the tasks of monitoring ships for the needs of safe navigation and give logistics and management information systems the impetus for the organization of work, preparation of individual logistics tasks, operations and procedures necessary for the successful operation of ports. The quantities of goods transported reflect international trade in goods, international trade, and the number of transports performed (Dichirico, 2018; Arora, 2012). Through the harmonious organization of navigation, entry or exit into the port, through the improvement of embarkation or disembarkation, through numerous transshipments, warehousing, inland port transport and through in-port operations, quality systems of economic operations, management and successful logistics are reflected.
METHODOLOGY
We used methods of studying and assessing individual forms of water traffic management systems in ports for the needs of management and logistics in port activities. We used the method of statistical data processing, through which we determined the number and form of intelligent systems used in general in production and logistics around the world, for which we presented graphs that express this. We could not avoid the method of studying the historical facts of the development of editing and storing data on sea routes and ship information systems, we also used the method of studying individual data, especially in the part where we looked for evidence of the quality of individual cases of intelligent systems. the basis for deciding which systems to present.

135
RESULTS
Ports and organizations involved in the reception of ships, transshipment, loading, stowage, maritime maneuvering and maritime traffic management systems in and in front of the port are constantly studying information, information and management systems, thus trying to ensure maximum ship throughput, maximum safety and performance of all stakeholders in the port. In this particular case, we found that the Galileo navigation system is suitable for the safe regulation of water transport in ports, which we considered to be a newer form of intelligent systems. We summed up Cvahte, which consists of three satellites orbiting the planet Earth. The satellites are connected to 34 earth stations, which are located in space to receive and transmit data without interruption at all times. There are 4 more control centers, vinegar is installed around the world (Cvahte, 2010). We have recognized that the Galileo navigation system is useful in all phases of the sea and in all weather conditions, as it allows tracking and identification of vessels, ensures the organization of maritime safety and information, and provides information to all vessels at sea. In conjunction with the use of distributed transmitters on the ground, navigation allows tracking of ships and cargo on ships at all times (Cvahte, 2010).
Figure 1: Ship and cargo tracking
CONCLUSION
The system includes several different intelligent systems (which we will list), which are connected to the satellite network and allow to cover every part of the waterways at sea, lakes or rivers. These interconnections also provide measurable data in a specific port, which can be used to measure the number of arrivals or departures of ships, the number of operations performed and other data that are not the subject of research. Our research methodology was adapted to the technological development of intelligent systems for the organization of maritime transport because we adapted the research to the research needs of intelligent systems and the research field (Wilamowvski & Irvwin, 2018).
Keywords: port logistics, management systems, water transport, navigation system
REFERENCES
[1] Arora, V. (2012). Maritime transport: Shipping undergoes sea change. [online] 7.1.2021 Retrieved from www.geospatialworld.net/article/maritime-transport-shipping-undergoes-sea-change.
[2] Cvahte, T. (2010). Evropski satelitsko-navigacijski sistem Galileo in možnosti uporabe v prometu. Diplomsko delo. Maribor: Univerza v Mariboru, Fakulteta za gradbeništvo.
[3] Dichirico, A. (2018). Il trasporto Overseas, analisi ed ottimizzazione dei costi: un caso aziendale. Magistrsko delo. Padova: Università degli studi di Padova, Scuola di ingegneria.
[4] Eurostat, 2015 Glossary: Deep sea shipping. [online] 7.1.2021 Retrieved from syr.us/5Gz [12..01.2021]. [5] Friščić, M. (2009). Inteligentni transportni sistemi v pomorskem prometu. Diplomsko delo. Celje: Univerza v
Mariboru, Fakulteta za logistiko. [6] Galileo (satelitska navigacija). U: Wikipedija, prosta enciklopedija Retrieved from sl.wikipedia.org. [7] Zelenik, R., & Pavlić, S.H. (2007), Upravljanje logističkim mrežama, Ekonomski fakultet u Rijeci, Sveučilište u
Rijeci, Znanstvena knjiga, IQ PLUS d.o.o Kastav, 233-263.

136
CONSTRUCTIVE HEURISTIC FOR OPEN SHOP PROBLEM WITH RECIRCULATION
Petar Lakčević*1, Ognjen Anđelić
1, Zoran Rakićević
1
1University of Belgrade – Faculty of Organizational Sciences *Corresponding author, e-mail: [email protected]
OBJECTIVE
There are many organizations where the production process takes up a central role when it comes to production and services planning. This is primarily the case when a large variety of products (or services) are manufactured in small quantities. In these situations, successful scheduling is of great importance to delivering products on time, given all the constraints that may exist in a production shop, e.g. production setup, number of work centers, due dates, release dates, importance of certain orders or products, number of machines, product flow, etc. Most common production setups are job and flow shops (Pinedo, 2009). In a job shop setup, each product or job has its own unique production path and processing times (Heizer et al. 2017). On the other hand, in a flow shop setup, every product has the same production path, only the processing times differ. One generalisation of a job shop that arises from the practical needs of many production and service systems is what happens when an order in which a product is processed is irrelevant, as long as all the operations are performed. This type of production setup is referred to as an Open shop (OS) setup. OS scheduling problem has a broad range of applications across different sectors (Ahmadian et al., 2021; Bai &
Tang, 2016). Examples of many real applications are in: patient medical, physical and laboratory exams, cars, trucks and airplanes reparation task scheduling in a specialized workshops and garages, university educational programme and workplace training scheduling, truck scheduling, robot scheduling, etc. A classic open shop problem is characterized by job independence, where each product and each machine is available right from the start, at time 0. Each machine can process maximum one job at a time, and no process on a machine can be interrupted. Transportation times between machines are non-existent, and buffers between machines have infinite capacity. The goal of scheduling is to minimize the makespan. According to the notation proposed and widely accepted by Graham et al. (1979), this characterization of the problem can be classified as Om||Cmax. However, this characterization often doesn’t correspond with many practical situations, where certain limitations may exist. To that effect, we explore a situation where a product or a service may be subject to multiple visits to the same workcenter, i.e. recirculation. The objective of this paper is to propose an algorithm that presents a specialised constructive heuristic, intended for solving open shop problems with recirculation, that are very frequently in wide scope of real planning cases.
METHODOLOGY
The proposed scheduling problem that we consider is open shop problem with recirculation. For performance criteria of a successful schedule, we used the most common, which is the minimization of makespan – Cmax, i.e. the maximum completion time of all jobs. The considered problem can be notified and classified as Om|recrc|Cmax. For three or more workstations, or three or more jobs, with varying processing times, open-shop scheduling is NP-hard (Ahmadian et al., 2021). In order to solve the proposed problem, the approach of developing a constructive heuristic was taken. Constructive heuristics generate only one permissible solution to the problem which, by applying appropriate intelligent rules, should be close to the optimum (Krčevinac et al., 2004). Such heuristics are defined through one or more scheduling rules (Pinedo, 2009). Constructive heuristics play a key role to the success of any algorithm and can guarantee to build up an excellent quality solution (Naderi et al., 2010). The same authors further explain that almost all

137
metaheuristics which have shown good performance in finding solutions, start from an effective constructive heuristic. The constructive heuristic which we propose works as follows. Given the recirculation aspect of the proposed problem, a new abstraction is introduced, where besides a product and a machine we have a Job that represents processing of one product on one machine with a defined execution time. Input to the algorithm containing information about number of machines, products, and processing times is inserted as a string. Using this information, the machine with highest load is identified. Then, the initial solution is based on scheduling the identified machine with all jobs first, which introduces a new set of constraints when further sequencing and scheduling remaining machines. Thus, further machines will have larger and larger sets of constraints, which will make it impossible to sequence them without idle time, where a machine isn’t loaded and is simply waiting for a job to become available, so it can be processed and the machine can be put to work. After the initial sequencing is complete and a schedule is obtained, an optimization will be performed, with the idea of adding idle time to some of the machines in order to further reduce this time on other machines, making this a net positive effect. This process is influenced by many constraints that exist either because of the nature of the problem or because they are neccessary in order to obtain better results based on the inital result. Proposed constructive method could be called shifting idle time heuristic/algorithm.
RESULTS
In this paper we used a pseudo-random example, with processing times of up to 10 time units, with 3 machines and 4 products. Following the previously explained methodology, we obtained the following solution:
M1: P1, P3, P4;
M2: P2, P1, P3, P4;
M3: P2, P1, P3.
This solution is presented in Figure 1, in the form of the Gant chart.
Figure 1: Gant chart of an initial solution
It can be seen that the value for the criteria of Cmax is 32. Performing the optimization explained in the methodology section, the next set of results is obtained:
M1: P1, P3, P4;
M2: P2, P1, P4, P3;
M3: P3, P2, P1.
This better solution is presented in Figure 2, also in the form of the Gant chart.
Figure 2: Gant chart of an optimized solution
Machine/Time 1 2 3 4 5 6 7 8 9 10 11 12 13 14 15 16 17 18 19 20 21 22 23 24 25 26 27 28 29 30 31 32
M1
M2
M3
P4
P2 P1 P3
P1 P3 P4
P2 P1 P3
Machine/Time 1 2 3 4 5 6 7 8 9 10 11 12 13 14 15 16 17 18 19 20 21 22 23 24 25
M1
M2
M3 P1
P3 P4
P4 P3
P3 P2
P1
P2 P1

138
Based on these results, the value for the criteria of Cmax is 25, which represents an improvement of around 22% in comparison to the initial solution, which was obtained using a simple scheduling rule of assigning jobs to the machine with the highest load first, preferring jobs with longest processing times.
CONCLUSION
The dominant criteria function for Open Shop in literature is Cmax. In this paper we present constructive heuristic which can help production planners find better solutions according to the makespan criteria than following the above-mentioned simple rules. We have a reasonable basis to believe that the algorithm can potentially generate better solutions in cases where a greater difference between processing times of jobs is present. Also, the increase in the number of jobs seems to usually have an influence on the number of possible optimization routes. In the future work, the process of solving OS problem can be improved using a multi-criteria approach.
Keywords: scheduling, open shop, constructive heuristic, algorithm, production planning
REFERENCES
[1] Ahmadian, M. M., Khatami, M., Salehipour, A., & Cheng, T. C. E. (2021). Four decades of research on the open-shop scheduling problem to minimize the makespan. European Journal of Operational Research, 295(2), 399-426.
[2] Bai, D., & Tang, L. (2013). Open shop scheduling problem to minimize makespan with release dates. Applied Mathematical Modelling, 37(4), 2008-2015.
[3] Bai, D., Zhang, Z. H., & Zhang, Q. (2016). Flexible open shop scheduling problem to minimize makespan. Computers & Operations Research, 67, 207-215.
[4] Graham, R. L., Lawler, E. L., Lenstra, J. K., & Kan, A. R. (1979). Optimization and approximation in deterministic sequencing and scheduling: a survey. In Annals of discrete mathematics (Vol. 5, pp. 287-326). Elsevier.
[5] Heizer, J., Render, B., Munson, C., & Sachan, A. (2017). Operations management: sustainability and supply chain management, 12
th ed. Pearson Education.
[6] Jacobs, F. R. & Chase, R. B. (2018). Operations and Supply Chain Management, 15th
ed. McGraw-Hill Education.
[7] Krčevinac, S., Čangalović, M., Kovačević-Vujičić, V., Martić, M., Vujošević, M.(2004). Operaciona istraživanja. Beograd: Fakultet organizacionih nauka.
[8] Liaw, C. F. (2000). A hybrid genetic algorithm for the open shop scheduling problem. European Journal of Operational Research, 124(1), 28-42.
[9] Naderi, B., Ghomi, S. F., Aminnayeri, M., & Zandieh, M. (2010). A contribution and new heuristics for open shop scheduling. Computers & Operations Research, 37(1), 213-221.
[10] Naderi, B., & Zandieh, M. (2014). Modeling and scheduling no-wait open shop problems. International Journal of Production Economics, 158, 256-266.
[11] Pinedo, M. (2009). Planning and scheduling in manufacturing and services, 2nd
ed. Springer (New York). [12] Rahmani Hosseinabadi, A. A., Vahidi, J., Saemi, B., Sangaiah, A. K., & Elhoseny, M. (2019). Extended genetic
algorithm for solving open-shop scheduling problem. Soft Computing, 23(13), 5099-5116.

139
TOWARDS A CONCEPTUAL FRAMEWORK OF LOGISTICS 4.0
Teodora Rajković*1, Dragan Vasiljević
1, Danica Lečić-Cvetković
1
1 University of Belgrade – Faculty of Organizational Sciences
*Corresponding author, e-mail: [email protected]
OBJECTIVE
The application of modern technologies of Industry 4.0 increases the efficiency of manufacturing and service enterprises, as well as logistics processes and activities. It affects the development of Logistics 4.0 as an emerging concept of Industry 4.0 that is using different digital solutions to transform logistic processes digitally. The aim of this paper is to define the concept, role and structure of the digital logistics system within the concept of Industry 4.0, as well as to assess the impact of its implementation. This paper defines the criteria to compare traditional logistics and Logistics 4.0 and presents the structure of Logistics 4.0 technologies connection divided by integrated logistics system processes, as well as an influence of the application of certain Logistics 4.0 technologies on the observed criteria. The purpose of this paper is to outline the advantages of a Logistics 4.0 concept and the application of modern technologies in the digital logistics system, which improves logistics processes and activities. This paper has significant value for all who work in logistics and strive to apply the concept of Logistics 4.0.
METHODOLOGY
The applied research and methodological approach is a hybrid type. It implies consideration of the role, functioning and requirements that are placed before logistics systems in a digital environment. Also, it implies analysis of current scientific and expert literature dealing with information technologies and software support of logistics processes.
RESULTS
The main result of this paper is a contribution in the form of the Logistics 4.0 model (Figure 1) that presents the structure of Logistics 4.0 technologies connectivity divided by integrated logistics system processes: procurement, production and distribution.
Figure 1: The structure of Logistics 4.0 technologies connection divided by integrated logistics system
processes
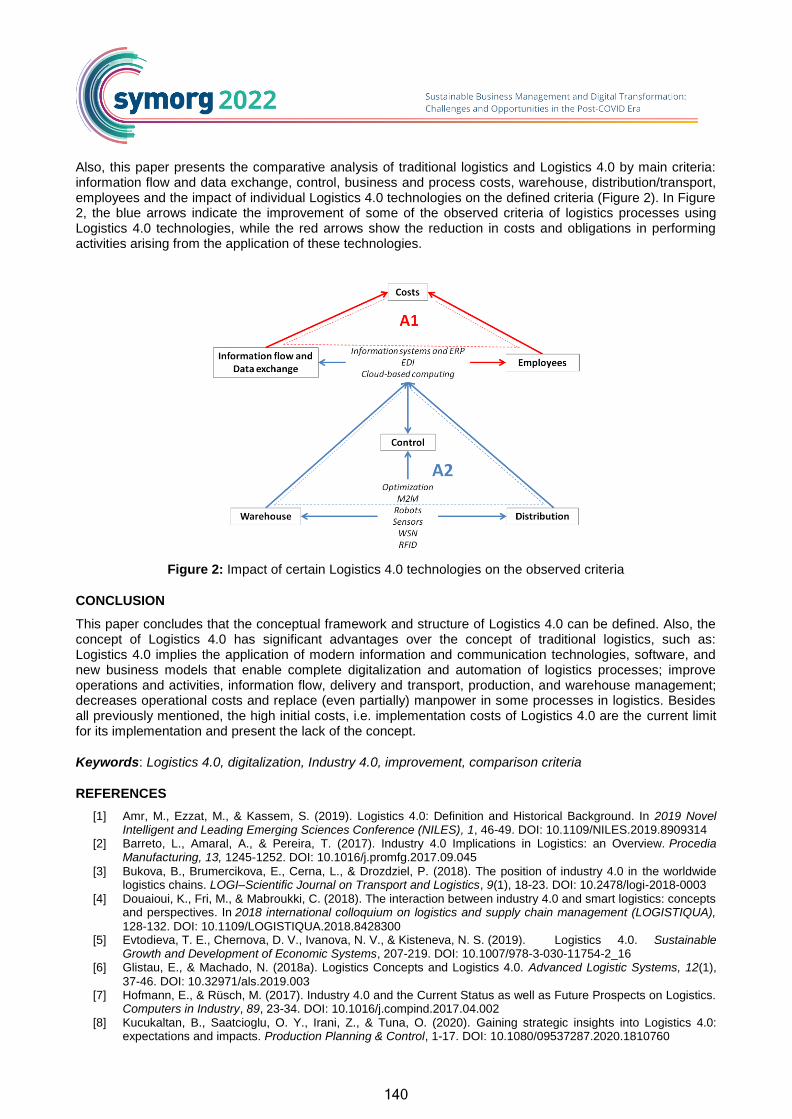
140
Also, this paper presents the comparative analysis of traditional logistics and Logistics 4.0 by main criteria: information flow and data exchange, control, business and process costs, warehouse, distribution/transport, employees and the impact of individual Logistics 4.0 technologies on the defined criteria (Figure 2). In Figure 2, the blue arrows indicate the improvement of some of the observed criteria of logistics processes using Logistics 4.0 technologies, while the red arrows show the reduction in costs and obligations in performing activities arising from the application of these technologies.
Figure 2: Impact of certain Logistics 4.0 technologies on the observed criteria
CONCLUSION
This paper concludes that the conceptual framework and structure of Logistics 4.0 can be defined. Also, the concept of Logistics 4.0 has significant advantages over the concept of traditional logistics, such as: Logistics 4.0 implies the application of modern information and communication technologies, software, and new business models that enable complete digitalization and automation of logistics processes; improve operations and activities, information flow, delivery and transport, production, and warehouse management; decreases operational costs and replace (even partially) manpower in some processes in logistics. Besides all previously mentioned, the high initial costs, i.e. implementation costs of Logistics 4.0 are the current limit for its implementation and present the lack of the concept.
Keywords: Logistics 4.0, digitalization, Industry 4.0, improvement, comparison criteria
REFERENCES
[1] Amr, M., Ezzat, M., & Kassem, S. (2019). Logistics 4.0: Definition and Historical Background. In 2019 Novel Intelligent and Leading Emerging Sciences Conference (NILES), 1, 46-49. DOI: 10.1109/NILES.2019.8909314
[2] Barreto, L., Amaral, A., & Pereira, T. (2017). Industry 4.0 Implications in Logistics: an Overview. Procedia Manufacturing, 13, 1245-1252. DOI: 10.1016/j.promfg.2017.09.045
[3] Bukova, B., Brumercikova, E., Cerna, L., & Drozdziel, P. (2018). The position of industry 4.0 in the worldwide logistics chains. LOGI–Scientific Journal on Transport and Logistics, 9(1), 18-23. DOI: 10.2478/logi-2018-0003
[4] Douaioui, K., Fri, M., & Mabroukki, C. (2018). The interaction between industry 4.0 and smart logistics: concepts and perspectives. In 2018 international colloquium on logistics and supply chain management (LOGISTIQUA),
128-132. DOI: 10.1109/LOGISTIQUA.2018.8428300 [5] Evtodieva, T. E., Chernova, D. V., Ivanova, N. V., & Kisteneva, N. S. (2019). Logistics 4.0. Sustainable
Growth and Development of Economic Systems, 207-219. DOI: 10.1007/978-3-030-11754-2_16 [6] Glistau, E., & Machado, N. (2018a). Logistics Concepts and Logistics 4.0. Advanced Logistic Systems, 12(1),
37-46. DOI: 10.32971/als.2019.003 [7] Hofmann, E., & Rüsch, M. (2017). Industry 4.0 and the Current Status as well as Future Prospects on Logistics.
Computers in Industry, 89, 23-34. DOI: 10.1016/j.compind.2017.04.002 [8] Kucukaltan, B., Saatcioglu, O. Y., Irani, Z., & Tuna, O. (2020). Gaining strategic insights into Logistics 4.0:
expectations and impacts. Production Planning & Control, 1-17. DOI: 10.1080/09537287.2020.1810760

141
[9] Tang, C. S., & Veelenturf, L. P. (2019). The Strategic Role of Logistics in the Industry 4.0 Era. Transportation Research Part E: Logistics and Transportation Review, 129, 1-11. DOI: 10.1016/j.tre.2019.06.004
[10] Wang, K. (2016). Logistics 4.0 Solution-New Challenges and Opportunities. In 6th
International Workshop of Advanced Manufacturing and Automation, 68-74. DOI: 10.2991/iwama-16.2016.13
[11] Witkowski, K. (2017). Internet of things, big data, industry 4.0–innovative solutions in logistics and supply chains management. Procedia Engineering, 182, 763-769. DOI: 10.1016/j.proeng.2017.03.197
142
WOMEN'S ENTREPRENEURSHIP - MEASURES FOR THE DEVELOPMENT:
CASE STUDY OF REPUBLIC OF SERBIA
Tamara Čurović1, Danica Lečić-Cvetković
1, Teodora Rajković*
1
1University of Belgrade – Faculty of Organizational Sciences
*Corresponding author, e-mail: [email protected]
OBJECTIVE
Entrepreneurship is the initiator of the development of the national economy of each country, and entrepreneurial activities are important for job creation, poverty reduction and unemployment, especially for countries in development such as the Republic of Serbia. Entrepreneurship is a social function of creating new values, through a creative combination of business resources (Omerbegović-Bijelović, 2010). Although the world's population is approximately 50 [%] women, they have lower rates of participation in entrepreneurship worldwide because they face many social and cultural constraints than men (GEM, 2019). Despite the growing number of women-led business and a significant increase in initiatives, policies and resources designed to promote and develop women’s entrepreneurship, the gender gap in entrepreneurship persist (Vossenberg, 2013). According to the Agency for Business Registers of the Republic of Serbia (APR, 2020) in 2020, out of a total of 279 035 active entrepreneurs, 33 [%] are women entrepreneurs, while in 2011, according to (Babović, 2012), was only 25.8 [%]. Also, it is interesting to note that only in 22.6 [%] of companies, women are directors or legal representatives (APR, 2020). The paper presents the characteristics, motivational factors and barriers to women's entrepreneurship. Based on that, measures for stimulating women's entrepreneurship in the Republic of Serbia are proposed. The objective of the research is to identify personal traits that characterize successful women entrepreneurs, as well as motivational factors and barriers that have the greatest impact on the start of entrepreneurial activity. The purpose of the research is to suggest measures to overcome the perceived barriers, to use the motivation, creativity and competencies of women entrepreneurs, and to encourage the economic development in the Republic of Serbia by empowering women and encouraging entrepreneurial initiatives. The problem of research is the gender gap in entrepreneurship, expressed through different dimensions of women's entrepreneurship, which are insufficiently researched. The research in this paper starts from general hypothesis H(0): Women's entrepreneurship is characterized by specifics, it is driven by various motives and challenges. General Hypothesis is decomposed into four special hypotheses.
METHODOLOGY
The theoretical part of the paper presents the definitions, functions and tasks of entrepreneurship, as well as the specifics of women's entrepreneurship. In addition, the personality traits that characterize a woman entrepreneur are presented. Finally, the motivational factors of women entrepreneurs are presented, as well as the challenges they encounter as women and as entrepreneurs. The empirical part of the paper involves research conducted by the method of field research. Combinations of interview and questionnaire techniques, conducted on respondents, women entrepreneurs, were used for the research. The results of the research should contribute to a better understanding of the internal features and motivational factors of successful women entrepreneurs, as well as the barriers they encounter at the beginning of the entrepreneurial activity, to encourage further development of women entrepreneurial initiatives by overcoming them. In the discussion part of the paper, analytical and synthetic methods were used, as well as comparative analysis and deductive methods.

143
RESULTS
The research was conducted on a sample of 67 respondents, owners of SMEs in a wide range of business areas. The results of the research show that the basic hypothesis of the research has been confirmed, i.e. women entrepreneurs have a specific set of characteristics that are a prerequisite for successful entrepreneurship. The results of the research also show that the women entrepreneurs from the sample are primarily entrepreneurs of chance, driven by motives such as the need for independence, self-realization, flexible working hours, etc. Although they face several barriers that affect the establishment of enterprises and the development of their SMEs, they confirm that by adequate measures the barriers can be overcome and encourage the development of women's entrepreneurship. Business policy measures of special importance for the business context of the Republic of Serbia are tax relief and business education for entrepreneurship.
CONCLUSION
By applying the measures for improving women's entrepreneurship presented in this paper, with the active participation of various stakeholders in the Republic of Serbia, the conditions and perspectives of women's entrepreneurship can be changed and improved.
Keywords: Women's entrepreneurship, motivation, characteristics, barriers, stimulative measures
REFERENCES
[1] APR (2020). Representation of women in the ownership structure of economic entities, Retrieved from www.apr.gov.rs/infografike.4320.html?infoId=55.
[2] Babović, M. (2012). Baseline study on women’s entrepreneurship in Serbia. Belgrade: The United Nations Development Programme in Serbia.
[3] GEM (2019). Global Entrepreneurship Monitor – 2019/2020 Global Report. Retrieved from www.gemconsortium.org/report/gem-2019-2020-global-report.
[4] Omerbegović-Bijelović, J. (2010). Entrepreneurship and SME management. In Fundamentals of Operations Management, Belgrade: FON.
[5] Vossenberg, S. (2013). Women Entrepreneurship Promotion in Developing Countries: What explains the gender gap in entrepreneurship and how to close it. Maastricht School of Management Working Paper Series, 8(1), 1-
27.

144

145
DIGITAL TRANSFORMATION OF FINANCIAL INDUSTRY

146
GREEN BONDS
Stella Suljić Nikolaj*1, Bojana Olgić Draženović
1, Denis Buterin
2
1University of Rijeka – Faculty of Economics and Business
2Polytechnic of Rijeka
*Corresponding author, e-mail: [email protected]
OBJECTIVE
Green bonds are relatively new financial tool issued for the purpose of financing environmentally friendly or socially responsible projects: renewables, water, energy efficiency, bioenergy, and low-carbon transport (Campiglio, 2016). According to Banga (2019), issuing of green bonds is important for investors and policy makers. The fundamental disadvantage of green bonds from the point of view of investors, is the underdevelopment of the market green bonds and accordingly lower liquidity (Maltais & Nykvist, 2020). The green bond market was created by the initiative of multilateral banks that encouraged market development to support the process of financing green and socially responsible projects. Climate Awareness Bond is the first green bond issued in 2007 from the European Investment Bank worth € 600 million. Next year, in 2008, the World Bank began selling green bonds by issuing $ 300 million (OECD, 2014). Green bonds come in six different forms as a: Corporate bond, Project bond, Asset-backed security (ABS), Supranational, sub-sovereign and agency (SSA) bond, Municipal bond, and financial sector bond. The objective of this paper is to highlight the characteristics, purpose of the issue and to display the presence of green bonds in the context of climate change that affect the financial sector as a systemic risk. The paper will highlight the prospects for the development of green bonds in the world, with special emphasis on Europe. It will test the scientific hypothesis of this paper about the role of the state in the formation of the regulatory framework that is indispensable for the further development of the green bond market.
METHODOLOGY
The research conducted is based on secondary data collected from the Climate Bonds Initiative database, capital markets regulators, and the International Capital Market Association. We applied statistical techniques to provide an overview of the course and characteristics of green bond representation by world regions with special emphasis on the representation of green bonds in Europe.
Figure 1: Financing with green bonds on a global level, according to the purpose of use,
from 2014 to 2021
0
100
200
300
400
500
600
2014 2015 2016 2017 2018 2019 2020 2021
mlr
d $
Energy Buildings Transport Water Waste Land Use Industry ICT Unspecified A&R

147
Previously highlighted statistics of the use of green bonds in the world, shows that green bonds are mostly issued to finance energy projects, followed by ecological construction and sustainable transport.
Figure 2: Annual issue of green bonds by regions of the world, from 2014 to 2021
According to the presented statistical data, green bonds are the most represented in Europe. Therefore, the chart below provides data on the representation of green bonds in individual European countries.
Figure 3: Total number of green bond issues in European countries in 2021
Based on the presented data, it can be notice that the largest share of green bonds is issued by more developed European countries with developed capital market. This confirms that countries with underdeveloped capital markets are significantly less involved in green bond issuance (Banga, 2019).
RESULTS
An analysis of the representation of green bonds indicates an underdeveloped green bond market in the world. This form of financing appeared during the financial crisis in 2008 and in those years was considered insufficiently secure financing. But after the financial crisis, the issuance of green bonds has increased as
0
100
200
300
400
500
600
2014 2015 2016 2017 2018 2019 2020 2021
Val
ue
of
isu
ed g
reen
bo
nd
s in
bln
$
Africa Asia-Pacific Europe Latin America North America Supranational
0 10 20 30 40 50 60 70
FRANCE
NETHERLANDS
ITALY
NORWAY
DENMARK
IRELAND
SWITZERLAND
BELGIUM
RUSSIA
SERBIA
UKRAINE
HUNGARY
LATVIA
LITHUANIA
bln $

148
climate conditions warn us of the need for sustainable financing. Despite the increase in the issuance of green bonds, they are still underrepresented in underdeveloped capital markets.
CONCLUSION
Although there is a need to finance environmentally sustainable projects around the world, green bonds are unequally represented in the world. The reason for this is the underdeveloped capital market of some countries. On the other hand, it should be noted that the use of this form of financing depends on the legal framework. To avoid this problem, governments should set up a regulatory framework and thus influence the increase in green bond issues and ultimately the development of capital markets.
Keywords: environment, Europe, regulation, capital market
REFERENCES
[1] Banga, J. (2019). The green bond market: a potential source of climate finance for developing countries. Journal of Sustainable Finance & Investment, 9(1), 17-32. DOI: 10.1080/20430795.2018.1498617
[2] Campiglio, E. (2016). Beyond Carbon Pricing: The Role of Banking and Monetary Policy in Financing the Transition to a Low-carbon Economy. Ecological Economics, 121: 220-230. DOI: 10.1016/j.ecolecon.2015.03.020.
[3] Climate bonds initiative (2022). Interactive Data platform. Retrieved from www.climatebonds.net/market/data/ [4] Hanfa, (2022). Održivo financiranje. Retrieved from www.hanfa.hr/upozorenja-hanfe/odr%C5%BEivo-
financiranje/#section12 [5] International Capital Market Association (2021). Green Bond Principles. Retrieved from
www.icmagroup.org/sustainable-finance/the-principles-guidelines-and-handbooks/green-bond-principles-gbp/ [6] Maltais, A., & Nykvist, B. (2020). Understanding the role of green bonds in advancing sustainability. Journal of
Sustainable Finance & Investment, 34(2), 286-317.DOI: 10.1080/20430795.2020.1724864 [7] OECD (2014). Green bonds: Mobilising the debt capital markets for a low-carbon transition, policy perspectives.
Retrieved from www.oecd.org/environment/cc/Green%20bonds%20PP%20%5Bf3%5D%20%5Blr%5D.pdf

149
TRADITIONAL VERSUS CONDITIONAL EVALUATION OF PORTFOLIO
PERFORMANCE: LITERATURE REVIEW
Vesna Bogojević Arsić*1
1University of Belgrade – Faculty of Organizational Sciences
*Corresponding author, e-mail: [email protected]
OBJECTIVE
Portfolio performance evaluation is complex and is always ex post because is trying to determine if the expected performance has been achieved or not. Investors and portfolio managers are interested in measuring their portfolio’s performances, so a number of different measurements were created and used. The aim of the paper is to present literature review of portfolio performance measures, both, traditional and conditional. These measures enable portfolio managers and investors to find an appropriate performance measure that can be used for reliable portfolio performance assessment and decision-making. The paper presented the systematic literature review of portfolio performance evaluation measures and included the findings published in referenced journals over the period of last 5-10 years.
METHODOLOGY
The research has been done by using WoS and Scopus data basis of articles and studies over the period 2021-2020. The aim was to provide information about the possibilities and frequency in different portfolio performances measures to portfolio managers of financial institutions, mutual funds, individual investors and academic researches. Having in mind that it would be impossible to give adequate portfolio performance evaluation literature overview, the analysis started from conventional articles in this field. Table 1 provide brief summary of the portfolio performance measures researched and analyzed and made clear differentiation between traditional and conditional performance measures.
RESULTS
Paper showed the evaluation in portfolio performance evaluation, pointed out that the key change has been made in conditional performance measures applications which main users had been mutual funds, exchange-traded funds and hedge funds. In addition, the literature review indicates the direction in which we could expect the further development of portfolio performance measures.
CONCLUSION
In past five to ten years, interest for adequate performance measures has increased, especially within the mutual and exchange traded funds. The paper considers the key measures of portfolio performance and classifies those measures on traditional and conditional ones. Traditional measures are influenced by capital asset pricing model and their main disadvantage is the assumption of constant risk over the entire evaluation period. Opposite to this, conditional measures allowing the portfolio risk and return to vary over time. Some empirical studies showed that conditional performance measure improved the way the investors understand portfolio management. The paper offers detail analysis of portfolio performance measures and their application in the futures.

150
Table 1: Overview of portfolio performance measures Traditional performance measures Definition Number of articles
2012-2021 Sharpe ratio Standard deviation of total portfolio
return or standard deviation of portfolio return in excess of risk-free rate.
186
Modigliani-Modigliani ratio (M2 ratio) Sharpe ratio multiple standard deviation of any benchmark market index, while adding the risk-free return.
87
Treynor ratio Portfolio beta relative to market index proxy.
54
Jensen’s alpha Portfolio beta relative to market index proxy or portfolio betas relative to multiple risk factors.
67
Information ratio Standard deviation of portfolio return in excess of return to tracking error.
35
Sortino ratio Downside risk measure (e.g., semivariation of portfolio returns).
28
Omega ratio Probability weighted ratio of gains versus losses for some threshold return target.
19
Treynor & Muzuy measure Measures market timing ability based on assumption that portfolio manager will generate a return that has a convex relation to the market.
13
Merton & Henriksson measure Treynor & Muzuy measure is replaced by a put option payoff.
5
Conditional performance measures Conditional alpha Difference between an excess return
of a fund and return realized through attempting to match the variability in fund’s risk over time by trading on the basis on specific variables.
109
Conditional beta Beta varying over time with the variations in risk and market premium.
55
Conditional market timing measures: - Ferson & Schadt model Fund return in excess of so-called
cash instrument. 34
- Christopherson, Ferson & Glassman model
Measures time-varying conditional alpha which can be used for abnormal performance detection if the performance varies with the state of the economy.
63
Keywords: portfolio evaluation, traditional measures, conditional measures
REFERENCES
[1] Alkhazali, O. M. (2020). Conditional Beta - evidence from emerging stock market. Multinational Finance Journal, 24(1/2), 93-117.
[2] Andreau, L., Matallin-Saez, J. C., & Sarto, J. L. (2018). Mutual fund performance attribution and market timing using portfolio holdings. International Review of Economics and Finance, 57, 353-370. DOI: 10.1016/j.iref.2018.02.003
[3] Jones, C. S., & Mo, H. (2021). Out-of-sample performance of mutual fund predictors. Review of Financial Studies, 34(1), 149-193 .DOI:10.1093/rfs/hhaa026
[4] Osinga. A. J., Schauten, M. B. J., & Zwinkels, R. C. J. (2021). Timing is money: the factor timing ability of hedge fund managers. Journal of Empirical Finance, 62, 266-281. DOI: 10.1016/j.jempfin.2021.04.007
[5] Tchamyou, V. S., & Asongu, S. A. (2017). Conditional market timing in the mutual fund industry. Research in International Business and Finance, 42, 1355-1366. DOI: 10.1016/j.ribaf.2017.07.072

151
INFLUENCE OF DIGITAL SKILLS AND AUTOMATION ON DIGITISATION IN
RETABVIL BANKING
Umesh Kothari*1, A. Seetharaman
1
1SP Jain School of Global Management
*Corresponding author, e-mail: [email protected]
OBJECTIVE
Consumers execute service processes digitally; alternating between offline and online channels frequently (Graupner et al., 2021). Besides competition, improving banking efficiency, launching various solutions and improving the customer experience are key drivers for digitalization. Banks are having difficulty implementing digitisation programs and are falling behind on their goals. According to Deloitte 2021 survey, banks are continuing to build on digital banking momentum and should humanise the banking experience, irrespective of the customer interaction channel. This paper examines gaps in previous literature and analyses two independent variables influencing digtisation in retail banks. This is a systematic literature review on studies of the influence of digital skills and automation on digitisation in retail banking. Digital abilities are becoming increasingly important in the workplace. Understanding what skills people lack and how to best supply them can help guide efforts to train and retrain job seekers for the modern workplace (Hecker & Loprest, 2019). Banks distribute products using technology-enabled systems and applications. Retail banking can be digitalized with the help of Internet of Things connectivity, leading to creation of new channels (Ramalingam & Venkatesan, 2019).
RESEARCH QUESTIONS AND OBJECTIVES
Below are the research questions
How to identify criteria to determine the need for digital skills in successfully implementing digitisation in retail banking?
How does automation influence digitisation in retail banking and what is the relationship between automation and digitisation?
The study objectives are -
To assess the impact of digital skills in digitization in retail banking.
To ascertain the influence automation in digitization in retail banking.
PROPOSITION
Proposition.1: Digital Skills positively influences digitisation in retail banking in the UAE resulting in digital competency as an outcome. Proposition.2: Automation positively influences digitisation in retail banking in the UAE resulting in cyber security as an outcome.
METHODOLOGY
The findings were examined through a study of articles published between 2017- 2020. The studies' stated objectives, and solutions were mapped, and research gaps, prospective areas for future investigation are

152
recognized from indexed journals. A meta-analysis (Rousseau et al. 2008) was done on the information and data acquired considered. Figure 1 below shows the proposed research framework.
Figure 1: Research Framework
RESULTS
There is a strong link between digital skills and digitalization in retail banking. Banks should imrove their digital capabilities which would aid in the digitization process (Das & Chaudhuri, 2020). Many papers highlighted that, as part of retail banks' digitization efforts, automation is critical to improving customer experience. The automation of digitisation will lead to the resolution of cyber security challenges enabling digitisation by retail banks (Ebrahim et al., 2021). This research is based on a qualitative assessment of review articles that focus on retail banking information available on various web sources, with a particular focus on digitisation. The paper points out that there are various advantages to digitalization, especially in digital skills and automation, which retail banking should explore.
CONCLUSION
To rethink banking in a post-pandemic world, an emphasis on digital transformation is vital, not only focusing on disruptive technologies but also delivering an experience to customers through digitally skilled staff. The findings should support retail banks by easing their pressure in implementing digitisation goals aiding their journey to excel in a dynamic industry.
Keywords: automation, information technology, optimisation, digitisation, digital skills
REFERENCES
[1] Das, S., & Chaudhuri, B. (2020, December). In Technology We Trust? Human Skills & Intermediaries in Digital Retail Banking. In IFIP Joint Working Conference on the Future of Digital Work: The Challenge of Inequality (pp.
281-294). Springer, Cham. [2] Ebrahim, R., Kumaraswamy, S., & Abdulla, Y. (2021). FinTech in Banks: Opportunities and Challenges.
Innovative Strategies for Implementing FinTech in Banking, 100-109. [3] Graupner, E., Trenz, M., & Maedche, A. (2021). When does digital matter? Analysing customers' preference for
digital processes. International Journal of Electronic Business, 16(2), 118-146. [4] Hecker, I., & Loprest, P. (2019). Foundational Digital Skills for Career Progress. Urban Institute. [5] Ramalingam, H., & Venkatesan, V. P. (2019, October). Conceptual analysis of Internet of Things use cases in
Banking domain. In TENCON 2019-2019 IEEE Region 10 Conference (TENCON) (pp. 2034-2039). IEEE. [6] Rousseau, D. M., Manning, J., & Denyer, D. (2008). Evidence in Management and Organizational Science:
Assembling the Field’s Full Weight of Scientific Knowledge Through Syntheses. Academy of Management Annals, 2(1), 475-515.
Digitisation in retail banking
Digital Skills
Automation
Digital Competency
Cyber security

153
DIGITAL TRANSFORMATION OF BANKING BUSINESS IN SERBIA CAUSED
BY COVID-19 PANDEMIC
Željko Spasenić*1, Slađana Sredojević
2, Slađana Benković
1
1University of Belgrade – Faculty of Organizational Sciences
2Association of Serbian Banks
*Corresponding author, e-mail: [email protected]
OBJECTIVE
The importance of digital transformation (DT) for banks has been recently stressed by many researchers. The main benefits of digitalization are associated with greater economies of scale and cost savings that digital bank may exhibit compared to traditional branching network (Le & Ngo, 2020). However, financial institutions hesitate to intensively digitalize their business and tend to rely on a historic and expensive IT infrastructure (Brandl & Hornuf, 2020).Contrary to traditional banks there are new, innovative market participants with a multi-channel approach that offer new products and services to customers in a variety of ways (Diener & Špacek, 2021). Faced with strong and growing competition banks are forced to become more digitally mature. Apart from market competition, the COVID-19 pandemic (COVID)has evolved to be strong external driver for digitalization in many industries (Amankwah-Amoah, 2021).Inspired by the increasing scholarly interest in DT during COVID, the objective of this study is to examine how COVID is driving the digitalization of Serbian banking industry. We expect that DT of Serbian banks is intensified during COVID and conjecture the following:
H0: DT during COVID has changed the business model of Serbian banks.
METHODOLOGY
Following the approach of Stalmachova et al. (2021) and Kotarba (2018) we used management tool of Business Model Canvas (BMC) to map and analyse the changes of banking business in Serbia caused by digitalization during COVID. Based on literature review we described BMC building blocks (Osterwalder & Pigneur, 2010) and identified the key elements of BMC that may be affected by DT (Baskerville et al., 2020; Stalmachova et al., 2021; Stefanovic et al., 2021). To identify the nature and the extent of business changes a survey was conducted. The survey consisting of 55 questions related to BMC building blocks has been prepared in Google forms and sent to banks managers by Association of Serbian Banks as leading industry organization. In total, managers from 10 out of 23 banks responded to questioner.
RESULTS
Communication channels were the most affected by DT during COVID and evolved from traditional communication channels (branches) to digital channels such as website, social networks, and online applications. Employees and IT infrastructure turn to be most important resources while physical assets (branches, offices, car fleet etc.) become less important. The extent of changes varies between banks depending on their pre-COVID business model. COVID had no significant influence on key activities, customer segmentation, cost structure and revenue stream. Overall, the research results show that COVID has pushed forward DT although the importance and benefits of DT were recognized by banks before pandemic. This is consistent with recent research of Marcu (2021).

154
CONCLUSION
DT is an effective tool for banks to mitigate external risks and negative effects of potential crises similar to crises caused by COVID. Our study showed that banks become aware that business model based on physical assets and conventional communication channels is not sustainable in changing market environment. The future research should focus on the development of roadmaps for DT of specific processes and quantification of DT success.
Keywords: digitalization, transformation, technology, commercial banks, business model Canvas
REFERENCES
[1] Amankwah-Amoah, J., Khan, Z., Wood, G., & Knight, G. (2021). COVID-19 and digitalization: The great acceleration. Journal of Business Research, 136, 602-611.
[2] Baskerville, R., Capriglione, F., & Casalino, N. (2020). Impacts, Challenges and Trends of Digital Transformation in the Banking Sector. Law and Economics Yearly Review Journal-LEYR, Queen Mary University, London, UK, 9(part 2), 341-362.
[3] Brandl, B., & Hornuf, L. (2020). Where did FinTechs come from, and where do they go? The transformation of the financial industry in Germany after digitalization. Frontiers in Artificial Intelligence, 3, 8.
[4] Diener, F., & Špacek, M. (2021). Digital Transformation in Banking: A Managerial Perspective on Barriers to Change. Sustainability, 13(4), 2032.
[5] Kotarba, M. (2018). Digital transformation of business models. Foundations of Management, 10(1), 123-142. [6] Le, T. D., & Ngo, T. (2020). The determinants of bank profitability: A cross-country analysis. Central Bank
Review, 20(2), 65-73. [7] Marcu, M. R. (2021). The impact of the covid-19 pandemic on the banking sector. Management Dynamics in the
Knowledge Economy, 9(2), 205-223. [8] Osterwalder, A., & Pigneur, Y. (2010). Business model generation: a handbook for visionaries, game changers,
and challengers (Vol. 1). John Wiley & Sons.
[9] Stalmachova, K., Chinoracky, R., & Strenitzerova, M. (2021). Changes in Business Models Caused by Digital Transformation and the COVID-19 Pandemic and Possibilities of Their Measurement—Case Study. Sustainability, 14(1), 127.
[10] Stefanovic, N., Barjaktarovic, L., & Bataev, A. (2021). Digitainability and Financial Performance: Evidence from the Serbian Banking Sector. Sustainability, 13(23), 13461.

155
CUSTOMER PREFERENCES TOWARDS DIGITAL BANKING SERVICES IN SERBIA
Slađana Barjaktarović Rakočević*1, Siniša Milošević
2, Nela Rakić
1
1University of Belgrade – Faculty of Organizational Sciences
2Commission for Protection of Competition
*Corresponding author, e-mail: [email protected]
OBJECTIVE
Digitalization has been affecting financial services industry significantly. Introducing innovative technology solutions in financial services industry has been necessity for financial institutions to keep pace with new business models and players in the financial service arena. Actually, outbreak of COVID-19 pandemic caused social distancing and moved all financial activities online, making faster digitalization of financial products and services. Digital banking does not have physical location offering financial products and services, unlike other technology driven banking services (Sha & Mohammed, 2017). Digital leaders are those financial institutions that offer a wide range of functionalities for their customers and compelling user experience (Deloitte, 2018). There are studies that have presented results that digitalization has a positive impact on the performance of banks (Do et al., 2022). This paper deals with effects of digitalization in banking industry form the customers perspectives. One of the main advantages of digital banking services is to improve quality and efficiency of the offered services and products. The objective of this paper is to examine what are the incentives for the customers to use digital banking products and services and what is customers experience. In order to achieve paper objective, authors have relied on research model from Pavithra & Geetha (2021) and set factors that mostly influence customers experience in digital banking services. Those factors comprise: low costs of doing digital banking services, functionalities of digital banking channels, and time saving of doing digital banking services. This research gives feedback on customers perceptions of digital banking settings, and also identify opportunities for customers experience improving.
METHODOLOGY
For the purpose of this research, authors have used empirical survey in Serbia. It has been created an online questionnaire to reveal customer experiences. Participants in this survey were people with the bank account who regularly use digital banking services. The respondents were offered 5-point Likert scale about digital banking services usage experience. Convenience sampling was used for collecting the responses from the digital banking service users. The questionnaires were issued to more than 180 participants. The research is descriptive in nature. It is focused on identifying the level of customers’ experience. Apart from that, the research examines how mentioned factors influencing the customers’ experience.
RESULTS
The results of this research depict that the customers’ experience about digital banking services in Serbia. According to examined factors we can conclude that all of them have positive effects on customers’ experience with average grade of more than 4.

156
The respondents feel that using digital banking services are beneficial for them in many ways. Customers agree that digital banking services save their time and cost sand high average grade. They state that current applications have very good functionalities. Generally, it can be concluded that the digital banking services are becoming ubiquitous and convenient in Serbia. Table 1. Grading of factors influencing customers’ experience in Serbia
Factors influencing customers’ experience Average grade
Low costs >4
Functionality >4
Time saving >4
CONCLUSION
The users of digital banking services in Serbia are influenced by the factors such as low costs of doing digital banking services, functionalities of digital banking channels, and time saving. The findings of this research are relevant to banks that intend to enter the digital banking industry as well as to improve their existing digital banking services and customer experience. This could increase financial access for the unbanked population across Republic of Serbia. Further research will focus on connections between the level of customer experience in digital banking services and customer satisfaction. Those findings would suggest future directions banks should perform to further develop their digital banking services.
Keywords: digitalization, banking industry, financial service customers, customer satisfaction
REFERENCES
[1] Deloitte (2018). EMEA Digital Banking Maturity 2018. Retrieved from www2.deloitte.com/cz/en/pages/financial-services/articles/digital-banking-maturity-emea.html (accessed March 7th, 2022).
[2] Do, T. D., Pham, H. A., T., Thalassinos, E. I., & Le, H. A. (2022). The Impact of Digital Transformation on Performance: Evidence from Vietnamese Commercial Banks. Journal of Risk and Financial Management, 15: 21. DOI: 10.3390/jrfm15010021
[3] Mbama, C., I., & Ezepue, P. O. (2018). Digital banking, customer experience and bank financial performance: UK customers’ perceptions. International Journal of Bank Marketing, 36(2), 230-255. DOI: 10.1108/IJBM-11-2016-0181
[4] Pavithra, C. B., & Geetha, K. (2021). Factors affecting customers’ perception towards digital banking services. Turkish Journal of Computer and Mathematics Education, 12(11), 1608-1614.DOI: 10.17762/turcomat.v12i11.6091
[5] Sha, N., & Mohammed, S. (2017). Virtual banking and online business. Banks and BankSystems,12(1), 75-81. DOI: 10.21511/bbs.12(1).2017.09
[6] Windasari, N. A., Kusumawati, N., Larasati, N., & Amelia, R. P. (2022). Digital-only banking experience: Insights from gen Y and gen Z. Journal of Innovation & Knowledge, 7(2),100170. DOI: 10.1016/j.jik.2022.100170.
https://www2.deloitte.com/cz/en/pages/financial-services/articles/digital-banking-maturity-emea.html

157
DIGITAL TRANSFORMATION IN CAR INSURANCE – INSURTECH AS A NEW
MARKET TREND
Dorana Tomac*1, Jasmina Dlačić
1, Veljko Dmitrović
2
1University of Rijeka – Faculty of Economics and Business
2University of Belgrade – Faculty of Organizational Sciences *Corresponding author, e-mail: [email protected]
OBJECTIVE
The insurance industry has always been a conservative part of the financial industry (Grgić et al., 2020). The nature of the insurance business necessitates intermediaries: agents and brokers. Insurers use a different distribution channel but deny that most policies are sold by agents. Customers still believe in the relationship between agents and them (Ricgmond, 2004). Very often, the sales process starts online but ends offline in conversation with an agent. Therefore, online insurance sales are possible with uniform and simple products. Travel insurance and car insurance, especially liability insurance for car owners, are good examples (Klapkiv et al., 2018). Liability car insurance is mandatory. In 2021, more than 25% of the total premium in Croatia is for compulsory car owner’s liability (Hrvatski ured za osiguranje, 2022). This insurance is strictly regulated by law and is also very uniform. Therefore, it is very suitable for online sales. Most insurance companies in Croatia have the possibility of online sales. Some of them offer the option to just start the insurance process and go through the process with an agent, while others offer a continuous online process. Technology is evolving quickly. Car insurance is slowly embracing new megatrends (Khakifirooza et al., 2021). One of such trends is Insurtech. Insurtech is a combination of the terms - insurance and technology. Insurtech uses technology to monitor insureds and personalized insurance policies. In car insurance, this trend manifests itself through telematics. Telematics collects relevant information about the driver’s driving behavior and style, and this information is used to calculate premium (Milanović et al., 2020). Telematics-based insurance is generally divided into categories: Pay How You Drive, Pay How Much You Drive, and Pay as You Drive (Khakifirooza et al., 2021). Depending on the category, telematics collects data on speed, brake use, driving time, driving distance, use of mobile phone while driving, etc (Milanović et al., 2020). Different insurance companies have different goals and different programs, like discount for good drivers, payment per route, insurance on-demand, just to point the dominantly used ones among insurance companies. Hence, insurtech through implementation of telematics brings a completely new perspective to the insurance industry where focus is on using technology in providing superior value to the customer i.e., insurer. The research questions based on previous are:
1. is it possible to buy car insurance online from some insurance companies in Croatia? 2. are there insurance companies in Croatia use telematics?
The aim of this paper is to investigate the state of implementation of new technologies (such as online insurance purchase and telematics) in insurance companies in Croatia. The propose from this research is a better understanding of insurtech and an approach to use it in the process of digital transformation.

158
METHODOLOGY
The study used the analysis of the insurance company's website, which served as the starting point for purchasing a car insurance policy. All data were collected from the official website of the ten insurances companies and from three official websites of secondary brands and websites specialized in the sale of insurance. Research was done in end of April 2022. The analysis is based on three aspects:
(1) The criteria for information search were: It is important to clearly group products into logical categories and enables users to search quickly, especially if the user is interested in buying (Cvitanović, 2021). Therefore, in the category of information, it was analyzed whether the user has the possibility to get in one “click” from the home page to the product page. The product web page has to have all relevant information about the product but at least covers, the insured sum, deductible in casco.
(2) Criteria for online sales were: Is it possible to purchase a policy online? (3) The criteria for telematics were: Does the insurance company have one?
RESULTS
Research covers car insurance: mandatory car liability insurance and comprehensive (casco) insurance and use of telematics. Research results are presented in Table 1.
Table 1: Digitalization of car insurance in Croatia; Source: Authors’ research Insurance Company
Obligatory car liability insurance Casco insurance Telematics
Information Online sales Information Online sales
ADRIATIC INSURANCE
partially implemented
form for proposal partially implemented
not implemented
ALLIANZ CROATIA
partially implemented
fully implemented partially implemented
fully implemented
CROATIA INSURANCE
fully implemented
fully implemented partially implemented
form for proposal
EUROHERC INSURANCE
partially implemented
not implemented partially implemented
not implemented
GENERALI INSURANCE
partially implemented
form for proposal partially implemented
form for proposal
GRAWE CROATIA
partially implemented
form for proposal partially implemented
form for proposal
HOK INSURANCE
partially implemented
fully implemented only from app
fully implemented
fully implemented only from app
TRIGLAV INSURANCE
partially implemented
fully implemented only renewal
partially implemented
not implemented
UNIQA INSURANCE
implemented partially
form for proposal partially implemented
form for proposal
Pay when you drive: Uniqa Smart casco The more you drive, the more you pay
WIENER INSURANCE VIENNA INSURANCE GROUP
partially implemented
form for proposal partially implemented
form for proposal
LAQO by Croatia insuance
partially implemented
fully implemented fully implemented
fully implemented
Pay how much you drive & Pay how you drive: LAQO Prevent
As direct partially implemented
fully implemented partially implemented
not implemented
Insured me partially implemented
fully implemented not implemented
not implemented
Compare not implemented
fully implemented not implemented
partially implemented

159
Car liability insurance takes a better position in the implementation process of insurtechs. It is a compulsory insurance, that is fully regulated and that is one reason why a full online sales process is possible. Selling comprehensive (casco) insurance online is riskier, which is why the insurance company only introduces a form for the application. Only Laqo and Uniqa use telematics. Laqo is the secondary brand of Croatia insurance and the first 100% digital insurance product on the Croatian insurance market. Laqo is a pioneer of telematics on the Croatian insurance market.
CONCLUSION
Insurtech is a new market trend in the Croatian car insurance market. Telematics programs have various purposes. At the same time, insurance companies collect data for future sales but also data related to driver behavior. Through different programs they personalize premiums and offer some bonus prices, but at the same time, they also improve traffic culture. The limitations of the research are seen in small sample and the focus on the Croatian insurance market. Future research can focus on the region, but also can research customer satisfaction and changes in driving habits.
Keywords: car insurance, market trends, online distribution, telematic, insurtech
ACKNOWLEDGEMENT
This paper has been supported by the University of Rijeka under the project number ZIP-UNIRI-130-8-20.
REFERENCES
[1] Cvitanović, P. L., (2021) Analiza taktika digitalnog marketinga odabranih društava za osiguranje u Hrvatskoj. Hrvatski časopis za osiguranje, 4, 101-117.
[2] Hrvatski ured za osiguranja (2022). Tržište osiguranja IV kvartal 2021. Retrieved from huo.hr/hr/statistika [3] Khakifirooza, M., Fathib, M., Wuc, J., & Yu, K. (2021). The Key Factors to Promote the Pay-As-You-Drive
Insurance inTaiwan. Journal of Insurance Issuses, 44(2), 1-33. [4] Klapkiv, J., Klapkiv, L., & Zuranda, N. (2018). Online distribution of insurance of civil liability of owners of
vehicles, the experience of Poland, opportunities of Ukraine. Baltic Journal os Economic Studies, 4(1). DOI: 10.30525/2256-0742/2018-4-1-195-201
[5] Mihelja Žaja, M., Milanović Glavan, Lj., & Grgić, M. (2020). Digitalna tehnologija kao čimbenik razvoja kanala distribucije u osiguranju. Hrvatski časopis za osiguranje, 3, 191-214.
[6] Milanović, N., Milosavljević, M., Benković, S., Starčević, D., & Spasenić, Ž. (2020). An Acceptance Approach for Novel Technologies in Car Insurance. Sustainability, 2020, 12. DOI: 10.3390/su122410331
[7] Ricgmond, D. R. (2004). Insurance Agent and Broker Liability. Tort Trial ˛Insurance Practice Law Journal, 40(1), 1-58.

160
VALUE OF DIGITAL SUSTAINABILITY
Milica Latinovic*1
1University of Belgrade – Faculty of Organizational Sciences
*Corresponding author: [email protected]
OBJECTIVE
The quest for the portfolio that offers the highest return was always like the quest for the Holy Grail. Nowadays, among the most popular strategies implemented in that pursuit are ESG investing strategies. Investors seek to invest in companies that offer them returns that are twofold. Investors screen the market for the companies that offer them not just financial return, but socially responsible return as well. Furthermore, recent research show that “twin transformation companies”, or companies that combine sustainability with digital technologies are two and a half times more likely to become the strongest performing companies (Accenture, 2020). Hence, that makes them perfect candidates to contribute to superior portfolio return. Companies seek new ways to become more sustainable, and investors are trying to value those efforts. Companies from consumer-related industries are pressured by consumers to pay more attention to sustainability. In other industries pressure to become more sustainable comes from regulators or investors (Accenture, 2020). Advanced digitalization brings fundamental changes into society. Digitalization enables new pathways for achieving sustainability goals and making corporate strategy more socially responsible (Brenner & Hartl, 2021; Pan et al., 2022). Digital transformation can be achieved through the transformation of company’s processes, transformation of a business model, domain transformation, and/or cultural transformation. In order for a new business model to be value increasing, company should be aware of the value enhancing factors. When developing digital networking business model, workforce and its competences play an important role (Trabert et al., 2022). If companies want to be successful in digital transformation, they must pay attention to the changes in the business surroundings as well, where the pace of the changes of customer preferences has the greatest impact (Li, 2022). Various digital solutions can increase companies’ sustainability, like: public cloud computing, Internet of things, artificial intelligence (AI) and remote work. Public cloud computing can decrease emissions of green-house-gasses (GHG). By outsourcing their IT requirements companies can reduce hardware costs. Consequently, outsourcing means less energy consumption. Internet of things, through sensors and smart devices can also reduce energy consumption. AI can increase optimization and reduce waste creation. Pressure to be more sustainable is not the only challenge companies’ face. Environmental and pandemic crises together with digitalization brought higher tensions into multinational enterprises (MNE). Organization of productive work is changing, along with MNE structure and coordination of activities. Moreover, consumer and investor expectations are changing which have further implication on value creation and business models (George & Schillebeeckx, 2022). Pandemic introduced the need for the new virtual business models, and digital technologies proved that they can facilitate just that, and reduce GHG emissions. Looking back at the ESG investing strategies, we can see that investors are mainly concerned with their environmental aspect, and the ways companies can adapt and mitigate climate change (Bloomberg, 2021). Therefore, it is import to recognize that companies can reduce energy usage and increase their sustainability with digital technologies. Thus, by choosing companies that incorporate digital technology investors can address the socially responsible part of the return, as well as financial one.
METHODOLOGY
In this manuscript we are going to implement systematic literature review approach, in order to discover what are the theoretical and empirical findings related to the value creation potential of digital sustainability. Moreover, we implement case study approach and investigate ESG and value properties of a sample of “twin transformation” companies.

161
RESULTS
Main results show that the qualification of employees and the rate of change of the customer preferences can increase organizational value. Furthermore, “twin transformations” are value and sustainability increasing.
CONCLUSION
When screening for potential ESG investments, investors should investigate internal and external value increasing factors, which can help them generate financial as well as digitally sustainable return.
Keywords: ESG investing, digitalization, sustainability, value
REFERENCES
[1] Accenture (2020). The European Double-up: A twin strategy that will strengthen competitiveness, Retrieved from www.accenture.com/us-en/insights/strategy/european-double-up, Accessed on 25th of May, 2022
[2] Brenner, B., & Hartl, B. (2021). The perceived relationship between digitalization and ecological, economic, and social sustainability, Journal of Cleaner Production, 315, 128128. DOI: 10.1016/j.jclepro.2021.128128
[3] George, G., & Schillebeeckx, S. J. D. (2022). Digital transformation, sustainability, and purpose in the multinational enterprise. Journal of World Business, 57, 101326. DOI: 10.1016/j.jwb.2022.101326
[4] Li, L. (2022). Digital transformation and sustainable performance: The moderating role of market turbulence. Industrial Marketing Management, 104, 28-37. DOI: 10.1016/j.indmarman.2022.04.007
[5] Pan, S. L., Carter, L., Tim, Y., & Sandeep, M. S. (2022). Digital sustainability, climate change, and information systems solutions: Opportunities for further research. International Journal of Information Management, 63, 102444. DOI: 10.1016/j.ijinfomgt.2021.102444
[6] Trabert, T., Beiner, S., Lehmann, C., & Kinkel, S. (2022). Digital value creation in sociotechnical systems. Procedia Computer Science 200, 471-481.
[7] Bloomberg (2021). 10 best green energy stocks in 2021 according to asset managers. Retrieved from www.bloomberg.com/news/articles/2021-11-11/10-best-green-energy-stocks-in-2021-according-to-asset-managers?utm_medium=cpc_search&utm_campaign=NB_ENG_DSAXX_DSAXXXXXXXXXX_EVG_XXXX_XXX_Y0469_EN_EN_X_BLOM_GO_SE_XXX_XXXXXXXXXX&gclid=EAIaIQobChMIhvPGgMG59wIV-YxoCR3G5Q7dEAAYASAAEgI5G_D_BwE&gclsrc=aw.ds Accessed on 29th of April, 2022

162
MICROFINANCE FOR THE SMEE SECTOR: A BIBLIOMETRIC REVIEW
Miloš Milosavljević*1, Željko Spasenić
1, Vesna Damnjanović
1
1University of Belgrade – Faculty of Organizational Sciences
*Corresponding author, e-mail: [email protected]
OBJECTIVE
Limited access to credits by small and medium size enterprises and entrepreneurs (SMEEs) is a major barrier for the development of small-scale ventures and the growth of an economy. Microfinance institutions (MFI) are seen by both scholars and practitioners as a viable alternative for financing SMEEs. As specified in Hermes and Hudon (2018), MFIs are aimed at “improving the access of the poor to financial services while at the same time being financially sustainable”. In this manner, MFIs should complement traditional loan-providing financial intermediaries in enabling comprehensive access to finance. The Serbian national Strategy for the support to SMEEs recognized MFIs as an important backbone for the second pillar of the strategy “Access to Finance” (Government of the Republic of Serbia, 2015). Contrary to the other countries in the region, Serbia has failed to introduce MFIs as financial intermediaries which could contribute to the larger access to finance to “underprivileged” SMEEs. Supranational bodies and global regulators noted that the national goals for the introduction of microfinance organizations have not been implemented in the previous strategic period (EC, 2020). The main reason for the neglection of MFI is the heavy regulation based on the supervision of the banking sector by the National Bank of Serbia. Thereafter, Serbia lacks any real evidence on the potential extension of access to finance of the SMEE sector as fostered by MFIs. This paper aims to collect the evidence on the importance of MFIs for the access to finance of SMEEs (MFI-A2F). The objective of this paper is to provide a comprehensive bibliometric review the microfinance institutions in providing access to finance. Thus, the evidence-base from the concurrent scholarly literature can be used to discuss any further steps for the inclusion of MFIs in the financial system of Serbia. The main research questions set in this paper are:
RQ1. How propulsive are scholarly publications in MFI-A2F field?
RQ2. How multidisciplinary are MFI-A2F publications?
RQ3. What are the main institutions, funding agencies and countries conducting/facilitating/supporting research in MFI-A2F field?
RQ4. What are the main sub-areas of research within the field of MFI-A2F?
METHODOLOGY
This paper follows a four-step bibliometric analysis approach defined in Bortoluzzi et al. (2021). Step 1. Needs assessment – as defined in the Objectives section of this abstract, Step 2. Selection of database and keywords – a) WoS database was used due to its
comprehensiveness and the vast geographical distribution of papers, b) a Boolean taxonomy for keywords was as follows: “Access to finance” OR “Access to financing” AND “Microfinance” OR “Microfinancing” OR “Microfinance institutions”,
Step 3. Manual screening of the papers - After manual inspection of all the papers generated as delineated above, the total of 3,637 publications were included in the sample., and
Step 4. A bibliometric overview of the collection of publications. Additionally, the sampled publications were entered into WoSviewer for subsequent analysis and visualization.

163
RESULTS
In the following section, the main results are described. As for the RQ1 – the field of MFI-A2F is highly propulsive as indicated in Figure .
Figure 1: Publications by year (1997-2022)
As for the RQ2 – the field of MFI-A2F is relatively interdisciplinary field, dominated by social sciences (Figure ).
Figure 2: Multidisciplinary of MFI-A2F research
CONCLUSION
This paper extends the concurrent body of knowledge in the MFI-A2F field by providing bibliometric overview of this research filed with a sample of 3,637 publications. The results indicate that this field has a high propulsion, great geographic diversity, elements of multidisciplinary. The findings can be used for shaping the policies related to the regulation and facilitation of MFIs in Serbia.
Keywords: microfinance institutions; access to finance; small and medium size enterprise; Serbia.
REFERENCES
[1] Bortoluzzi, M., Correia de Souza, C., & Furlan, M. (2021). Bibliometric analysis of renewable energy types using key performance indicators and multicriteria decision models. Renewable and Sustainable Energy Reviews, 143, 110958. DOI:10.1016/j.rser.2021.110958
[2] EC (2020). 2019 SBA Fact Sheet. Retrieved from ec.europa.eu/neighbourhood-enlargement/system/files/2019-11/sba-fs-2019_serbia.pdf, accessed: May 11, 2022.
[3] Government of the Republic of Serbia (2015). The Strategy for support SME, entrepreneurship and competitiveness in the period 2015 -2020, Retrieved from www.pravno-informacioni-sistem.rs/SlGlasnikPortal/eli/rep/sgrs/vlada/strategija/2015/35/1/reg, accessed: May 11, 2022.
[4] Hermes, N., & Hudon, M. (2018). Determinants of the performance of microfinance institutions: a systematic review. Journal of Economic Surveys, 32(5), 1483-1513. DOI:10.1111/joes.12290
0
100
200
300
400
500

164
NON-FINANCIAL REPORTING AND SUSTAINABLE DEVELOPMENT IN PUBLIC SECTOR ORGANIZATIONS
Josip Čičak*1
1University of Rijeka – Faculty of Economics and Business
*Coressponding author, e-mail: [email protected]
OBJECTIVE
According to United Nations Resolution (2015), which is in fact Agenda for sustainable development all organizations and especially public sector organizations should promote sustainable development. The 2030 Agenda for Sustainable Development consists of seventeen Sustainable Development Goals (SDGs) which can be grouped into five areas of critical importance for humanity and the planet (five Ps): People, Planet, Prosperity, Peace, Partnership. Authors (Guarini et al., 2021, Bebbington & Unerman, 2018) and organizations (UCLG CIB, 2018) state that public sector organizations are most important in achieving SDGs. Role of public sector organizations (PSOs) in achieving SDGs is crucial because PSOs should adopt strategies, policies and measures to SDGs but also PSOs should find resources and coordinate actions of other stakeholders in the process, especially civil society organizations and real sector organizations. When it is about reporting about SDGs actions and achievements I see non-financial reporting as proper tool for disclosures. Non-financial reporting (NFR) is regulated at the level of the European Union through the EU Directive 2014/95/EU. Directive 2014/95/EU prescribes mandatory non-financial reporting for large public-interest companies with more than 500 employees. Furthermore, provisions on the categorization of undertakings have been transposed from EU legislation to the legislation of the Member States. When it is about non-financial reporting in public sector there is no such regulation except the fact that non-financial reporting regulation in the EU covers state owned enterprises which fits to Directive 2014/95/EU rules. Despite the fact that regulation do not cover public sector organizations there are examples of public sector organizations which have voluntary implemented non-financial reporting frameworks. The objective of the paper is to present literature review of the non-financial reporting and sustainable development in public sector organizations. This paper adds to existing literature of non-financial reporting and sustainable development in public sector organizations which is novelty due to novelty of the both issues. Research questions are: RQ1 Is there academic literature which covers non-financial reporting as framework for SDGs measurement in public sector organizations? RQ2 Which non-financial framework provides the best framework for reporting about SDGs achievement in public sector? RQ3 Which information should be presented about SDGs in non-financial report?
METHODOLOGY
This paper is divided into seven sections. After a brief introduction, the theoretical background of non-financial reporting in the public sector and sustainable development issue is presented, followed by legislative framework for non-financial reporting in the EU and explanation of SDGs. In section five the study is carried out with the description of research questions and methodology. The sixth section presents the results of the conducted research. The last section gives concluding remarks. This paper is review paper so it does not have any mathematic or statistic part but it provides insight into SDGs and non-financial reporting as tool by which public sector organizations could measure achievement and inform all stakeholders about results in the very important part of their role in the community.

165
RESULTS
The main findings of the study can be divided into three groups. Every group of results relate to each research question. Firstly, there is literature about both issues but there is also literature which directly connects non-financial reporting and sustainable development, although related to the novelty of the topic literature exists only in few recent years. The paper gives brief review about literature in the field. Secondly, there are different frameworks for non-financial reporting, and among those frameworks it can be highlighted GRI Standards (2016) and IR Framework (2021) which can suite for SDGs reporting in public sector organizations. Thirdly, paper brings info how it should be reported about SDGs inside of non-financial reports.
CONCLUSION
United Nations Resolution (2015), i.e. Agenda for sustainable development provided SDGs which can be grouped into five areas of critical importance for humanity and the planet (five Ps): People, Planet, Prosperity, Peace, Partnership. Those goals should be measurable and the key pillars in achievement of the goals are public sector organizations. Although there are frameworks for non-financial reporting and there is regulation about non-financial reporting in the EU, non-financial reporting is still on the voluntary basis when we talk about public sector organizations. It can be concluded that need for the achievement of SDGs will provide bigger voluntary use of non-financial reporting I public sector organizations and at the end it can be expected that it will become mandatory in a moment of time. Summarize and discuss the main findings of the research. Address its practical benefits as well as limitations of your study.
Keywords: non-financial reporting, sustainable development, public sector organizations
REFERENCES
[1] Bebbington, J., & Unerman, J. (2018). Achieving the United Nations Sustainable Development Goals: an enabling role for accounting research. Accounting, Auditing & Accountability Journal, 31(1), 2-24.
[2] Directive 2014/95/EU. Retrieved from: eur-lex.europa.eu/legal-content/EN/TXT/?uri=CELEX%3A32014L0095, (accessed January 31
st, 2022).
[3] GRI Standards (2016). GRI Retrieved from: www.globalreporting.org/how-to-use-the-gri-standards/gri-standards-english-language/ (accessed 1 May 2022).
[4] Guarini, E., Mori, E., & Zuffada, E. (2021). New development: embedding the SDGs into city strategic planning. Public Money and Management, 41(6), 494-497.
[5] IIRC (2021), The international framework. Retrieved from: https://www.integratedreporting.org/wp-content/uploads/2021/01/InternationalIntegratedReportingFramework.pdf (accessed 1st May 2022).
[6] United Nations (2015). Resolution adopted by the General Assembly on 25 September 2015. Transforming our world: the 2030 Agenda for Sustainable Development.
[7] UCLG CIB 2018. Sustainable Development Through Local Action- Sustainable Development Goals and Local Government Associations. United Cities and Local Government Capacity and Institution Building Working Group.

166

167
DIGITAL TRANSFORMATION OF PUBLIC ADMINISTRATION

168
THE CHALLENGES OF E-GOVERNMENT IN (POST) COVID CRISIS IN SERBIA
Željko Bolbotinović1, Stefan Radojičić
1, Dragan Vukmirović*
1
1University of Belgrade – Faculty of Organizational Sciences
*Corresponding author, e-mail: [email protected]
OBJECTIVE
The specific objectives of this paper are as following:
Identify e-Government implementation challenges in Serbia in general.
Discusses e-Government implementation challenges in post COVID-19 era
Discusses implications and develop recommendations considers the challenges of e-government development in Serbia.
The following research hypotheses are formulated:
Hypothesis H1: “There is no significant progress in a development and implementation of e-government in Serbia, as result of Impact of COVID-19 pandemic”
Hypothesis H2: “Strategic framework for e-government development in Serbia needs to be redefined in line with the next normal”
Hypothesis H11: Stockholder behavior in the field of E-government in Serbia are correlated with changes in other behaviors during the COVID-19 pandemic
Hypothesis H12: Stockholder behavior in the field of E-government in Serbia correlated with global changes in consumer behavior during the COVID-19 pandemic.
METHODOLOGY
In the research, we combined literature review and empirical research about usage of information and communication technologies in the Republic of Serbia, conducted according to the standardized methodology of EUROSTAT, which enables comparability (RSO, 2021). The results before the pandemic (2019), 2020 and 2021 are compared. The goal was to investigate the differences using vertical, horizontal and regional comparisons.
RESULTS
The literature review indicates the lack of transparency and changing terms and conditions for personal data use in fighting COVID-19 stand out as the most significant challenges (Li et al., 2022). The question is what will happen in the future with the used emerging technologies and collected data, especially when the private sector is involved (Mhlanga, 2022; Zhao et al., 2021). In Serbia, only 2.5% of online population concerns about security and protection of personal data when using e-government services and 35.8% of them restricted or refused access to their geographical location (RSO, 2021). Vertically research: Compared to the period before COVID-19 pandemic, the number of e-government users increased by 2.5 percentage points (Table 1). Table 1: Internet and E-government users in Serbia (M – millions and %) (RSO, 2021)
Serbia 2019 2020 2021
Online population 4.08 M 4.12 M 4.24 M 77.4 78.4 81.2
Use the e-government 37.5 37.0 40.0

169
Most users use e-government services for obtaining information from public authorities' websites (37%), downloading official forms (26.0% and only 20.6% for sending completed forms). Horizontally research: Percentage of Internet users that have bought/ordered goods or services over the Internet are presented in Figure 1
Figure 1: The time of last buy/order goods or services over the Internet (%) (RSO, 2021)
Regional research: The latest comparative Eurostat data, 44% of citizens in EU reported that they used some of e-government services in 2019 (Eurostat, 2020). Serbia ranks 32
nd among 36 European countries
according the maturity score (eGovernment Benchmark, 2021).
CONCLUSION
Having in mind the main results of the research presented in this paper, we can conclude that the crisis has not accelerated the digital transformation of governments in Serbia and the hypotheses are confirmed. Strategic recommendations:
Implement situational analysis of society and economy for harmonization and adjustments the priorities defined in the Public administration reform strategy and E-government development program and accompanying action plans
Redefine the regulatory framework Practical recommendation
Further work on strengthening public-private-academic partnership in the direction of developing skills necessary for the development and implementation of services, as well as education and promotion between stockholders.
Sectoral analysis (by stockholders) to reduce the digital divide and the difference between the percentage of services intended for companies and the citizens.
Keywords: e-government, COVID-19, Serbia, research
REFERENCES
[1] eGovernment Benchmark 2021 (2021). Capgemini, Sogeti, IDC and Politecnico di Milano for EC. Retrieved from www.capgemini.com/wp-content/uploads/2021/10/eGovernment-Benchmark-2021-Insight-Report.pdf. (accessed April 21
st, 2022).
[2] Eurostat (2020). E-Government. European Commission Eurostat. Retrived from ec.europa.eu/eurostat/web/products-eurostat-news/-/edn-20200307-1 (accessed April 21
st, 2022).
[3] Li, V. Q. T., Ma, L., & Wu, X. (2022). COVID-19, policy change, and post-pandemic data governance: a case analysis of contact tracing applications in East Asia. Policy and Society, 2022, 1-14 DOI: 10.1093/polsoc/puab019.
[4] Mhlanga D. (2022). The Role of Artificial Intelligence and Machine Learning Amid the COVID-19 Pandemic: What Lessons Are We Learning on 4IR and the Sustainable Development Goals. International Journal of Environmental Research and Public Health, 19(3), 1879. DOI: 10.3390/ijerph19031879.
[5] RSO (2021). Usage of information and communication technologies in the Republic of Serbia, 2021. Statistical Office of the Republic of Serbia. Retrieved from www.stat.gov.rs/en-us/oblasti/upotreba-ikt/. (accessed April 21
st, 2022).
[6] Zhao, J., Ahmad, Z., K. Khosa, S.K., Yusuf, M., Alamri, O. A., & Mohamed S. M. (2021). The Role of Technology in COVID-19 Pandemic Management and Its Financial Impact. Complexity, 2021. Article ID 4860704. DOI: 10.1155/2021/4860704.

170
USE VALUE OF OPEN DATA IN SERBIA
Tatjana Stojadinović1, Ilija Antović*
2, Saša Lazarević
2
1Medicines and Medical Devices Agency of Serbia
2University of Belgrade – Faculty of Organizational Sciences *Corresponding author, e-mail: [email protected]
OBJECTIVE
The framework of e-government in Serbia is a set of regulations that must be followed in all e-government projects (Stojadinovic et al., 2010). One of the most important projects is the open data initiative. The main focus of the paper is the use of open data by state authorities and government agencies in the Republic of Serbia. From the first open data initiatives, there are great expectations regarding the integration of open data sets provided by various state administration bodies (Gajic et al., 2020) and the use of this data for achieving benefits of citizens, as well as commercial effects (Stojadinovic et al., 2016; Stojadinovic et al., 2018). NHS England and GovLab at the New York University jointly announced the era of open data in health and social services (Verhulst et al., 2017), which highlight the importance of secure data and information exchange between clinicians, patients and the public, supporting patients and citizens to take more control over their health and Care and full engagement in designing local services and developing a flawless digital record in all care settings, based on open standards. The aim of this paper is to research the principles and good practice in open data implementation, and the value of using open data through a case study and present the results from the Open Data Initiative. The paper analyzes the first five state institutions that opened their data sets on the national open data portal of the Republic of Serbia. This study confirms previous research on the importance of open data, and the challenges and benefits for government, which is the basis for the development of good e-government in the Republic of Serbia. What this study highlights and contributes to, in addition to confirming the previous studies, are the main lessons in terms of: the importance of actors who drive and realize open data initiatives, and the ability to overcome challenges in the opening of data, as well as the issue of private and public actors, together with the way a certain division of work is made when e-services or applications based on open data are developed as part of a channel strategy.
METHODOLOGY
This research is based on a qualitative case study of the project 2015-2019 with the aim of developing a national open data platform in Serbia - UNDP and applying it to government. The project includes several actors: the Open Data Working Group in Serbia, representatives of UNDP and the World Bank as project initiators, representatives of the Office of the Government of the Republic of Serbia for Information Technology and Electronic Administration, representatives of state institutions and public agencies that intend to take the lead role in Region and encourage the development of the state. The data studied in this paper are focused on the data of the first five state institutions that opened their data sets on the portal of open data of the Republic of Serbia. By connecting all three levels of open data system, strong links are established between all stakeholders that are necessary to ensure sustainability. Levels are: political and regulatory / top-down, the level of individual institutions-middle-out and the level of demand for data and innovative uses / bottom-up.

171
RESULTS
Table 1: The results of the research
Activities Findings Results
Launching of an open data initiative
-open data working group meetings
-readiness of decision makers in launching the initiative
- Adopted Strategy for the development of electronic government in the Republic of Serbia for the period 2015-2018
-Action Plan for the implementation of the international initiative Partnership for Open Government in the Republic of Serbia for 2016 and 2017 adopted
-inclusion of Serbia in several international rankings of data openness
-Draft Assessment Document of Serbia's readiness for open data was prepared
-December 2015, a general agreement was reached in Serbia on the launch of the initiative to open data
-2016. A working group for open data of Serbia was formed in 2006, where 5 state bodies opened their data sets
-2016. The national open data portal of Serbia was launched in
-2016. years of preparations for the development of a legal framework for open data
Challenges for the open data initiative
-free use, sharing, combining, embedding data
-better results of public services in areas such as health, pharmacy, education, environmental protection…
-economic growth, strengthening new markets, companies and jobs
-responsibility and good governance
-fight against corruption
-development of e-pharmacy
-development of e-health
-development of e-government
-integration of e-government, e-health and e-pharmacy
Expected activities and opportunities related to the open data initiative
-intern benefits
-use by citizens and companies
-reduction of administrative burden
-saves and more efficient business
-competitions, open conferences, workshops and hackathons
-formation of data sets and their connection in order to improve data quality
-development of web and mobile applications
-development of the open data portal of Serbia
-opening drug data sets
-mixing data sets of related institutions in health and pharmacy
-increasing the use value of open data
CONCLUSION
Based on the research in this paper, it can be concluded that open data guarantees greater transparency of the work of state bodies, stimulates efficiency in government and beyond, and enables citizens, companies and organizations to use public information several times for different purposes. Open data strengthens entrepreneurship, influencing the development of innovative products and services, providing alternatives for decision-making in management, planning and science, and contributing to the creation of a knowledge-based economy. In addition, open data creates added value for authorities, including better public services, reducing the burden on public administration and increasing cooperation with citizens, businesses and

172
organizations. A centralized provision that relates to open data provides an efficient profit for public sector bodies and improves the quality of data.
Keywords: open data, e-government, public administration, e-services
REFERENCES
[1] Stojadinovic, T., Radonjic, V., & Radenkovic, B. (2010). E-Business in the Regulation of Medicines in Serbia. Drug Information Journal, 44(2), 177-187. DOI: 10.1177/009286151004400209
[2] Gajić, M., Antović, I., Jovanović, S., & Miličević, A. (2020). Projektovanje Metaregistra državne uprave zasnovano na Observer softverskom paternu. In XXIV Međunarodna konferencija Informacione tehnologije (IT).
[3] Verhulst, S., Noveck, B., Caplan, R., Brown, K., & Paz, C. (2017). The Open Data Era in Helath and Social Care, GOVLAB. Retrieved from thegovlab.org/nhs/
[4] Stojadinovic, T., Vanevski, I., & Radovanovic, Lj. (2016). E-services in regulation on medicines and medical devices. In Symposium Proceedings of XV International symposium SymOrg2016 Reshaping the Future Through Sustainable Business Development and Enteproureship (pp. 415-422).
[5] Stojadinovic, T., & Antovic, I. (2018). Digital Transformation in Pharma Industry. In Symposium Proceedings of XVI International symposium SymOrg 2018 (pp.980-987).

173
REFORM OF TAX ADMINISTRATION IN SERBIA – THE ROADMAP FOR THE
EFFECTIVE DIGITAL TRANSFORMATION THROUGH THE PARADIGM SWITCH
Goran Radosavljević*1, Mihajlo Babin
1, Miloš Erić
1
1Belgrade Metropolitan University – FEFA
*Corresponding author, e-mail: [email protected]
OBJECTIVES
In this paper, we estimate likelihood of digitalization, growth of the IT sector and economic development in general affecting genuine transformation of the national tax administration (TA) in Serbia, as well as potential effects of said transformation on public finance, private sector and taxpayers. Although not an isolated endeavor in digitalization of public services, reform of tax administration does represent a specific challenge as it uses big data and information collected in real time from taxpayers and develops models to target those who, according to historical and live information, represent a higher risk of non-compliance. Conclusions of the study point out to at least three positive outcomes of those reforms, including enhancing effectiveness of tax compliance, improving taxpayer services and reducing compliance burden. Overall financial effects on the budget are positive, both in terms of increased tax revenue due to increased compliance, as well as reduced costs due to digitalization.
METHODOLOGY
We will start from the Digital Maturity Index (DMI) developed by OECD with aim to evaluate, in a standardized form, the current level of digitalisation of the TA in the OECD countries. We will use the data from that model to compare level of digitalisation of the TA in Serbia with the advanced EU countries and the region. Analysis is based on the premise that TA is organization that consumes data to produce digital services based on information that allow citizens to easily and equitably comply with their tax obligations. DMI consists of six main blocks and uses thirteen indicative attributes. This index not only evaluate the progress achieved by a specific TA at a given time, but also provides a roadmap for those responsible for tax collection to advance the digital transformation process. The implementation of this index allows us to diagnose TA strengths and gaps to be closed to foster a digital transformation that will bring the expected efficiency gains.
MAIN FINDINGS
The comparative analysis with the advanced EU countries tax administrations provided clear insights that the digital transformation of the Tax Administration of Serbia can be defined as asymmetric. Namely, the entire IT infrastructure has been successfully developed and all pre-requisites for the complete digital transformation are in place. However, lagging behind of the Serbian Tax Administration in comparison to the advanced EU countries relies within the non-alignment of numerous complicated legal procedures with the available IT infrastructure. Therefore, the data exchange, aggregation and generation of relevant business and client friendly reporting is still in the rudimentary phase in numerous areas. The paper argues that the next phase of the Tax Administration of Serbia digital transformation has to be based on a tailor-made approach without replication of models and solutions from the advanced EU

174
countries. The proposed paradigm switch from the process-oriented traditional approach towards the outcome-oriented leads to enhanced efficiency and effectiveness of the tax collection process and decreases unnecessary and unproductive costs of companies and citizens and consequently leads to the enhanced productivity and competitiveness of the Serbian economy.
REFERENCES
[1] Ernst & Young (2016). Tax administration is going digital: Understanding the challenges and opportunities. Retrieved from www.ey.com/Publication/vwLUAssets/EY-tax-administrationis-going-digital-understanding-the-challenges/%24FILE/ EY-tax-administration-is-going-digital.pdf
[2] Grossová, I. (2018). Mandatory e-communication - an opportunity to transform taxpayers’ experience. In M. Silva Pinto, Á. Kővágó, & M. Crawford (eds.), Impact of digitalisation on the transformation of tax administrations (pp. 29-31). Budapest: Intra-European Organisation of Tax Administrations.
[3] ICAEW (2016). Digitalisation of tax - International perspectives. London: ICAEW Information Technology Faculty.
[4] IRS (2018). Safeguarding taxpayer data: A guide for your business. Retrieved from www.irs.gov/pub/irs-pdf/ p4557.pdf
[5] IRS (2019). Tips for tax preparers on how to create a data security plan. Retrieved from www.irs.gov/newsroom/tipsfor-tax-preparers-on-how-to-create-a-data-security-plan
[6] Janssen, M., Estevez, E., & Janowski, T. (2014). Interoperability in big, open, and linked data-organizational maturity, capabilities, and data portfolio. IEEE Computer, 44-49.
[7] Jarmin, R., & O’Hara, A. (2016). Big data and the transformation of public policy analysis. Journal of Policy Analysis and Management, 35(3), 715-721.
[8] Kleven, H. J., Knudsen, M. B., Kreiner, C. T., Pedersen, S., & Saez, E. (2011). Unwilling or unable to cheat? Evidence from a tax audit experiment in Denmark. Econometrica, 79(3), 651-692.
[9] Larkin, C., Sanders, M., Andresen, I., & Algate, F. (2018). Testing local descriptive norms and salience of enforcement action: A field experiment to increase tax collection. DOI: 10.2139/ssrn.3167575.
[10] Moorthy, J., Lahiri, R., Biswas, N., Sanyal, D., Ranjan, J., Nanath, K., & Ghosh, P. (2015). Big data: Prospects and challenges. Vikalpa - The Journal for Decision Makers, 40, 74-96.
[11] OECD (2016). Advanced analytics for better tax administration: Putting data to work. Paris: OECD Publishing. [12] OECD. (2016a). Technologies for better tax administration: A practical guide for revenue bodies. Paris: OECD
Publishing. DOI: 10.1787/9789264256439-en. [13] OECD. (2020). Tax administration 3.0: The Digital Transformation of Tax Administration. OECD Publishing. [14] OECD (2022). Digital Transformation Maturity Model. OECD Tax Administration Maturity Model Series. [15] Peirats, V. (2018). Information security and data protection in the Spanish tax agency. In IOTA, Improving tax
governance and ensuring data security (pp. 10-14). Budapest: Inter-European Organisation of Tax Administrations.
[16] PricewaterhouseCoopers (2016). How blockchain technology could improve the tax system. Retrieved from pdf.pwc. co.uk/how-blockchain-could-improve-the-tax-system.pdf
[17] The Office for IT and e-Government. (2019). CERT, Digitalising public administration. Retrieved from www.ite.gov.rs/ tekst/en/27/cert.php

175
IMPACT OF DIGITALIZATION ON PUBLIC PROCUREMENT PERFORMANCES IN
SLOVENIA
Sašo Matas1, Predrag Jovanović
2, Milan Radojičić*
2
1Public Procurement Directorate, Republic of Slovenia
2University of Belgrade – Faculty of Organizational Sciences *Corresponding author, e-mail: [email protected]
OBJECTIVE
Electronic procurement is recognized as a potentially powerful lever for upgrading public procurement performances in both scientific papers as well as in the EU documents. Key public procurement performances are: competition, economy and “value for money” that considers the total benefit of the procurement for the society. This paper aims to investigate if there is a relation between E-procurement on one side and competition, economy and “green” procurement on the other. In other words, does E-procurement have positive impacts on the three key procurement performance indicators and are they significant as the EU policy makers assume? Finally, this research examines the effects of public procurement “horizontal policies”.
METHODOLOGY
E-procurement is expected to increase transparency and reduce transactional costs, thus lowering the administrative burden on bidders and stimulating them to compete for government contracts. Higher number of bids results in the more intensive competition that enables more favorable purchases for contracting authorities. Advanced procurement techniques such as framework agreements are more easily applied with support of E-procurement that results in cost savings and an increase of the economy of public procurement. In the past few years there has been surge of green procurement. Digitalization of procurement function is perceived as an instrument that would support the uptake of green public procurement by reducing transaction costs. In Slovenia, the new Public Procurement Portal started to operate on April 1
st, 2018 designed to meet all the
EU requirements regarding E-procurement set in Directive 24/2014. The authors will examine changes in competition on the public procurement market, then in the public procurement economy and in green transformation in the periods before and after E-procurement is established. The research would cover each type of procurement procedures as well as all procurement procedures in Slovenia in the period April 1
st
2016 to March 31st 2018, with approximately 13 thousand public procurements in total as well as additional
13 thousand procurements in the period April 1st 2018 to March 31
st 2020.
Types of procedures covered by this research are: open procedure, restricted procedure, negotiated procedure without prior notice, negotiated procedure with prior notice, small value purchase. Key public procurement performance indicators included in this research are: number of bids submitted per procurement, number of framework agreements, number of green procurements, and number of contract awards to small and medium-sized enterprises.
RESULTS
One of the expected results of the study is to find out if E-procurement is a significant tool for promoting competition, economy, and “value for money”. Moreover, the paper will put more light on limitations of the concept when a single tool such as E-procurement is expected to contribute in achieving multiple goals.

176
According to Tinbergen rule, each goal requires at least one instrument or tool. That means one tool should not be expected to achieve multiple goals. Research findings would be useful to policymakers when designing sectorial policies including public procurement ones. The area where the tool (E-procurement) has the highest impact should be considered as target for that instrument. Table 1: Public procurement performance indicators prior and after E-procurement introduction Groups Number of bids Number of
framework agreements
Number of green procurements
Number of contracts awarded to SMEs
Open procedure Restricted procedure Negotiated procedure without prior notice
Negotiated procedure with prior notice
Small value purchases
CONCLUSION
The paper will explore the significance of E-procurement as a tool for promoting competitiveness, economy and sustainability. Introducing E-procurement puts additional requirements to bidders who are used to conventional form of bids submission. Thus, some of them, primarily small entrepreneurs, may decide to cease participating in public procurement procedures and turn to private consumers. The effects would be weakening of competition and reducing the share of small and medium-sized enterprises in the public procurement market. Although the research analyzes 26 thousand contracts awarded in the four-year period from April 1st 2016 to March 31st 2020, it is limited to a single country. Furthermore, it explores the influence of one tool on several goals at the country level. Further research should distinguish between the central and local levels and explore potential differences in effects.
Keywords: E-procurement, transaction costs, green procurement, framework agreements, horizontal policies
REFERENCES
[1] Badell, D., & Rosell, J. (2021). Are EU Institutions Still Green Actors? An Empirical Study of Green Public Procurement. Journal of Common Market Studies, 59(6), 1555-1572. DOI: 10.1111/jcms.13204
[2] Baltrunaite, A. (2020). Political contributions and public procurement: Evidence from Lithuania. Journal of the
European Economic Association, 18(2). DOI: 10.1093/jeea/jvz016
[3] Cudanov, M., Jovanovic, P., & Jasko, O. (2018). Influence of the Public Procurement Procedure Type on the Duration of Public Procurement, Lex Localis - Journal of Local Self-Government, 16(2), 361-378. DOI: 10.4335/16.2.361-378
[4] EC (European Commission) (2022). Internal Market, Industry, Entrepreneurship and SMEs. Retrieved from ec.europa.eu/growth/single-market/public-procurement_en
[5] EC (European Commission) (2017). Making public procurement work in and for Europe, Retrieved from eur-lex.europa.eu/legal-content/EN/TXT/HTML/?uri=CELEX:52017DC0572&from=EN
[6] Jovanovic, P., Delibasic, B., & Cudanov, M. (2022). Organizational Archetypes in Public Procurement, Lex Localis - Journal of Local Self-Government, 20(1), 101-127, DOI: 10.4335/20.1.101-127(2022)
[7] Lundberg, S., & Marklund, P-O. (2018). Green public procurement and multiple environmental objectives, Economia e Politica Industriale, 45. DOI: 10.1007/s40812-017-0085-6
[8] Matas, S. (2018). Effects of the use of electronic auctions on public procurement efficiency. In Proceedings from XVI international symposium, Doing business in the digital age: challenges, approaches and solutions.

177
DIGITALIZATION OF THE FINANCIAL MANAGEMENT AND CONTROL SYSTEM IN THE PUBLIC SECTOR: THE CASE OF
WESTERN BALKAN COUNTRIES
Vesna Novaković*1 Mirjana Milovanović
2 Dragan Gligorić
3
1Pan-European University "APEIRON" – The Faculty of Business Economics
2 Banja Luka College
3, University od Banja Luka – The Faculty of Economics
*Corresponding author, e-mail: [email protected]
OBJECTIVE
This paper considers the optimization of working processes within public sector trough digitalization of the financial management and control system. The aim of this paper is to try to give an answer on the problem question: "What are the advantages of digitization of financial management and control systems in the public sector?" We defined the hypothesis by stating that the digitization of the system of financial management and control in the public sector contributes to a more efficient use of budget funds. We will focus our research on the existing level of digitization as well as on the existing legal solutions and bylaws on financial management and control systems in these states, respectively: Serbia, Croatia, Montenegro, Republic of Srpska and the Federation of Bosnia and Herzegovina. The conclusions will be focused on the possibilities of improving the FMC system in the Republic of Srpska and the Federation of BiH through digitalization.
METHODOLOGY
The methodology that will be used in this research is based primarily on the analytical and empirical method. The research we will conduct aims to collect and analyze data on the degree of digitization of the FMC system in the public sector of: the Republic of Croatia, the Republic of Serbia, Montenegro, the Republic of Srpska and the Federation of Bosnia and Herzegovina. The collected data will be analyzed in detail, in order to prepare a comparative overview of the level of development of FMC system in these countries.
RESULTS
The level of development of public financial controls in the public sector of the Republika Srpska differs significantly from the level of their development in the neighboring Republic of Croatia, or in the Republic of Serbia. In the Republic of Srpska, the PIFC is still accepted to some extent as a formal, legal obligation in most public sector institutions, without substantial application. The Central Harmonization Unit within Ministry of finance in the Government of Republic of Srpska, through the internal audit registers and the financial management and control registers, directs the greatest degree of improvement to strategic documents, emphasizing the need for staff strengthening of the Central Harmonization Unit itself. Progress in this area is reflected in the monitoring and comparison of the number of submitted reports of both internal audits and financial management and control.
CONCLUSION
The development of business in all economic activities, including the public sector, depends on the degree of digitalization of business processes. Special emphasis on the process of digitalization of business processes is placed after the last crisis caused by the pandemic "Covid-19", when the very way of conducting business processes required a greater degree of digitalization. As the research showed, the established system of internal financial controls is the basis for economical, efficient and effective use of budget funds. In the

178
Republic of Croatia, the system of internal financial controls is clearly linked to the development of the budget system and public administration reform. They focused on the future development of the PIFC system in terms of quality control of internal audit, as well as linking and developing the exchange of information and examples of good practice. However, the Republic of Srpska and the Federation of BiH still face a number of substantial reforms with the acceptance of the PFIC system as a basis for quality governance. Further development requires a greater degree of digitization, quality and continuous training not only of coordinators for financial management and control and internal auditors, but also training of managers of public entities. Keywords: digitalization, business process management, public administration, public internal financial control, Western Balkan countries
REFERENCES
[1] Instruction on the manner of establishing and implementing the system of financial management and control, Official Gazette of Republic of Srpska, no. 99/17, (2017). Retrieved. from www.vladars.net/sr-SP-Cyrl/Vlada/Ministarstva/mf/OM/harmonizacija/Pages/default.aspx#collapsible0
[2] Law on the System of Internal Financial Controls in the Public Sector of the Republic of Srpska, Official Gazette of Republic of Srpska, no. 91/16, (2016).
[3] Operta, E. (2013). Javni menadžment lokalne uprave u funkciji razvoja lokalne zajednice. Tranzicija, 32, 155-167.
[4] Padula, A. (2013). An Innovative Public Value Chain to Improve Public Services. International Journal of Advances in Management and Economics, 2(5), 85-94.
[5] Rulebook on the content of the report and the manner of reporting on the system of financial management and control, Official Gazette of Republic of Srpska, no. 1/22, (2022).
[6] Veledar, B., Letica, M. (2020). Challenges in Implementing the Concept of Public Internal Financial Controls in the Public Sector of Bosnia and Herzegovina, In Proceedings of the ENTRENOVA - ENTerprise REsearch InNOVAtion Conference (pp. 187-194),

179
E-BUSINESS ECOSYSTEMS

180
REINFORCING SMALL-SCALE PRODUCERS VIA INNOVATIVE BUSINESS
MODELS: A CASE OF NATURAL FOOD AND DRINKS PRODUCTS IN SERBIA
Dušan Barać*1, Vukašin Despotović
1, Teklehaimanot Embaye
1
1University of Belgrade – Faculty of organizational sciences, *Corresponding author, e-mail: [email protected]
OBJECTIVE
Modern e-business ecosystems imply a plethora of relations, processes, roles and technical solutions. This creates a lot of complexity to small businesses and force them to redefine business models. This paper portrays an ecommerce ecosystem that includes all the processes from field to the customers’ homes where web store plays the main role. The idea is to enhance small producer’s business employing digital channels, such as: web site, social networks, messaging apps, Google, email and others. The B2C web portal “Natural tastes (Ukusi prirode in Serbian)” implements aggregator model and enables listing of the products, buying, and promotion of the natural products from different small-scale producers. In addition, the portal provides several common services, such as: product rating, comments, social network sharing, chatbot, wish list, newsletter subscription, etc. The same corpus of products can be ordered via additional digital channels. Accordingly, the portal provides an offering that has uniform quality and price, even though it is offered by different partner providers. Further, the model tries to resolve the biggest issue small businesses have, not only in our region, but worldwide – delivery. After initial analysis, we came to conclusion that key problem they are dealing with is how to deliver the products to customers, considering the fact that they produce natural food and drinks. At the moment, due to not having time and money to do it on their own, small producers mainly uses delivery companies. However, this solution doesn’t take specifics of their products into account: sensitive packaging, temperature, fast delivery, the places were products have to be picked up, prices, etc. The situation with Covid-19 further fueled the need to improve this part of the business and made huge pressure on delivery service companies. We established particular delivery services for the products from web store. In addition, the model is flexible in the way that the producers can sell their products using their own channels, but can choose the products to be delivered via Natural tastes delivery service. Warehousing the products is another issue as well. As the majority of the clients are from big cities, while the production is far away in mountains or fields, storing products and whole process is extremely challenging. In this way the small producers can entirely focus on what they are best in – production, while the parts they are not familiar with by default, can be outsourced to the partner on digital channels. On the other hand the model establishes trust with consumers and provide easy access, cost-effectiveness, and time-saving services. Finally, we try to foster social responsibility and make a strong impact on the healthy food and life. Only fully natural and healthy products could be the part of the ecosystem.

181
METHODOLOGY
Digital Transformation offers a lifeline and increased marketing channel for small-scale producers and small businesses changes the consumer value creation and co-creation process in general (Mandviwalla & Flanagan, 2021; Matarazzo et al., 2021; Tayibnapis et al., 2021). The proposed method is an aggregator business model. An aggregator business is essentially an intermediary that utilizes information and communication technology (ICT) to connect producers with consumers (Sembiring Meliala, et al., 2019). Small-scale producers are most of the time neglected and their adoption of e-commerce is greatly impacted by the socioeconomic condition of the area they live in as analyzed by (Liu et al., 2020). As analyzed in (Kieti et al., 2021) the value and usage of digital technologies for small-scale producers is ensured by aggregator platforms in contract to fragmented digital services. Aggregator businesses have emerged to shorten the long distribution chain while increasing profits for producers as studied in (Jahroh & Meliala, 2021). The efficiency of ICT enhanced aggregator agribusinesses has been demonstrated by comparing with traditional aggregator agribusinesses in the vegetable value chain as studied in (Meliala et al., 2020). This model in general has the potential to bring improved livelihood for small-scale producer considering a number of other factors like transportation, market-based cold storage, and distribution as indicated by (Cooper et al., 2021). As illustrated in Figure 1, Ukusi Prirode’s proposes a comprehensive model of ecommerce ecosystem that includes aggregation of small-scale producers, logistics strategies (Horizons et al., 2020), online platform, digitalization, market-based warehousing facility, analytics services and integrated payment systems. Product and marketing channel diversification is said to have contributed to the economic success of small-scale agricultural producers involved in short food supply chains as surveyed by (Benedek et al., 2021). The authors found out that farm gate sales were among the most important marketing channels while the importance of channels that were based on digital resources and home delivery are increasing. This paper strives to adjust and implement the model of ecommerce ecosystem for small-scale producers.
Figure 1: Ukusi Prirode’s comprehensive model of ecommerce ecosystem
We provide a detailed description of the whole ecosystem: participants, relationships, information management, software solutions included and many others. We describe both the content and features. Next figure illustrates the home page of the portal.

182
Figure 2: Home page
The research will include analysis of the webstore in the period of last two years. These are the main data that are analyzed:
Purchases
Visits
Users’ activities
User related data The results will be based on the described dataset.
CONCLUSION
Conclusion will include discussion of the results as well as the implications for both academia and practice. In addition, we will describe future directions in further development of the portal.
Keywords: ecommerce ecosystem, webstore, innovative business models, digital transformation
REFERENCES
[1] Benedek, Z., Fertő, I., Galamba Marreiros, C., Aguiar, P. M. de, Pocol, C. B., Čechura, L., … Bakucs, Z. (2021). Farm diversification as a potential success factor for small-scale farmers constrained by COVID-related lockdown. Contributions from a survey conducted in four European countries during the first wave of COVID-19. PLOS ONE, 16(5), e0251715.
[2] Cooper, G. S., Shankar, B., Rich, K. M., Ratna, N. N., Alam, M. J., Singh, N., & Kadiyala, S. (2021). Can fruit and vegetable aggregation systems better balance improved producer livelihoods with more equitable distribution?. World Development, 148, 105678. DOI: 10.1016/j.worlddev.2021.105678
[3] Horizons, E., Conference, O., & Management, I. (2020). A Comprehensive Approach to E-commerce Platforms Targeted at Local Producers and Communities, (May).
[4] Jahroh, S., & Meliala, J. S. (2021). Impacts of Aggregator Business on Farmers’ Income. Jurnal Manajemen & Agribisnis, 18(2 SE-Articles), 168. DOI: 10.17358/jma.18.2.168

183
[5] Kieti, J., Waema, T. M., Ndemo, E. B., Omwansa, T. K., & Baumüller, H. (2021). Sources of value creation in aggregator platforms for digital services in agriculture - insights from likely users in Kenya. Digital Business, 1(2), 100007. DOI: 10.1016/j.digbus.2021.100007
[6] Liu, M., Zhang, Q., Gao, S., & Huang, J. (2020). The spatial aggregation of rural e-commerce in China: An empirical investigation into Taobao Villages. Journal of Rural Studies, 80, 403-417. DOI: 10.1016/j.jrurstud.2020.10.016
[7] Mandviwalla, M., & Flanagan, R. (2021). Small business digital transformation in the context of the pandemic. European Journal of Information Systems, 30(4), 359-375. DOI: 10.1080/0960085X.2021.1891004
[8] Matarazzo, M., Penco, L., Profumo, G., & Quaglia, R. (2021). Digital transformation and customer value creation in Made in Italy SMEs: A dynamic capabilities perspective. Journal of Business Research, 123, 642-656. DOI:
10.1016/j.jbusres.2020.10.033 [9] Meliala, J., Hubeis, M., Jahroh, S., & Maulana, A. (2020). The Role of Online Aggregators in The Vegetable
Value Chain. Jurnal Manajemen & Agribisnis, 17(2 SE-Articles), 185. DOI: 10.17358/jma.17.2.185 [10] Sembiring Meliala, J., Hubeis, M., Jahroh, S., & Maulana, A. (2019). Aggregator Business as an Intermediary in
Agriculture: A Literature Review, (Seabc 2018), 56-64. DOI: 10.5220/0008436800560064 [11] Tayibnapis, A. Z., Wuryaningsih, L. E., & Gora, R. (2021). Medium, Small and Medium Enterprises and Digital
Platforms. South Asian Journal of Social Studies and Economics, 10(2), 10-19. DOI: 10.9734/sajsse/2021/v10i230258

184
DESIGNING A BLOCKCHAIN-BASED E-BUSINESS SYSTEM FOR TRACKING
HONEY PRODUCTION
Petar Lukovac*1, Aleksa Miletić
1, Božidar Radenković
1
1University of Belgrade – Faculty of Organizational Sciences
*Corresponding author, e-mail: [email protected]
OBJECTIVE
Increased awareness in importance of organic food and its impact on human health brings out new challenges that consumers face in the market when making their decision whether or not to buy natural products. Since organic products usually cannot be easily distinguished from conventional ones, lack of information about the origin of the product is the main obstacle for gaining customers trust. Using blockchain technologies could provide transparent and non-editable information about the origin of the product and its journey to the end-user. This paper gives an example of blockchain-based system for tracking the process of organic honey production. Focus will be put on individual producers and consumers, but system can be expanded to include different stakeholders, such as distributors and retailers (Radenković et al., 2021).
METHODOLOGY
Product development techniques are used for developing software system for tracking honey production from individual producers to end-users. This approach is based on Open Product Management Workflow and shown through selected phases of this methodology with focus on strategy, innovation and business component (Lemser, 2021).
Figure 1: Software architecture, adapted from (Pranto et al., 2021)

185
Figure 1 shows the software architecture in the example of tracking honey production. Customers can scan QR code of the product and access the web application via their user devices such as smartphones or tablets. In application they can find all the information regarding production of honey, its origin and distribution. All the data is stored in the cloud data storage, and can be viewed by the end-user. In all segments of the supply chain, information is collected using IoT devices and sent to the blockchain network. Data is regularly checked for violation.
RESULTS
In the current stage of development we present the initial business model for our system shown in Table 1, using business model canvas (Osterwalder & Pigneur, 2010). We divided our model in nine key segments covering internal and external influences. The key is in developing a blockchain-based platform that provides additional information about product origin and quality, which in turn gives us opportunity to price our products higher, and also give more value to our key partners. Table 1: Business Model Canvas
Key Partners -Beekeepers Association -Individual beekeepers
Key Activities -Platform development -Generating smart contract
Value Proposition -Give detailed information about origin and production conditions -Maximize trust in organic honey products
Customer Relationship -Providing all necessary information so users can access it anytime, anywhere
Customer Segments -Customers -Beekeepers -Producers -Distributors
Key Resources -Web platform -Blockchain oriented software -Data from IoT devices
Channels -Web application -Product packaging
Cost Structure -Development and maintenance -IoT infrastructure
Revenue Streams -Honey sales (products with certificate of origin and quality)
CONCLUSION
Blockchain-based e-business system for tracking honey production will provide all the necessary information about the origin production and delivery of organic honey to our customers. It will increase trust in products labeled organic because of non-editable and fact-checked information. Users will be able to see that the products used in the making of honey, such as organic beeswax, extracted honey wax, organic honeycomb, also have organic origin. Proposed e-business system should provide an adequate data for determining whether all of the required conditions are met. In addition, proposed smart contracts in the blockchain-based e-business system for tracking honey production will decrease risk in the realization of transactions among stakeholders, lessen administration costs and improve the efficiency of business processes (Radenković et al., 2021; Van Hilten et al., 2020).
Keywords: e-business, blockchain, honey production, smart agriculture, software product development
REFERENCES
[1] Lemser, F. (2021) Strategic Product Management according to Open Product Management Workflow [2] Osterwalder, A. & Pigneur, Y. (2010) Business Model Generation: A Handbook for Visionaries, Game
Changers, and Challengers. [3] Pranto, T. H., Noman, A. A., Mahmud A., & Haque, A. B. (2021). Blockchain and smart contract for IoT enabled
smart agriculture. PeerJ Computer Science 7:e407. DOI: 10.7717/peerj-cs.407 [4] Radenković, B., Despotović-Zrakić, M., Bogdanović, Z., Barać, D., Labus, A., & Naumović, T. (2021) A
blockchain system for monitoring food supply chain. In International Scientific conference Sustainable development of rural areas.
[5] Van Hilten, M., Ongena, G., & Ravesteijn, P. (2020). Blockchain for organic food traceability: case studies on drivers and challenges. Frontiers in Blockchain, 43.

186
E- FISCALIZATION- EXPERIENCES AND ANALYSIS IN SMALLER COMPANIES
Miloš Mijić*1, Branko Ćebić
2, Miloš Živković
2
1Academy of Applied Studies Šabac,
2Academy of Applied Studies Western Serbia
*Corresponding author, e-mail: [email protected]
ABSTRACT
The development of society and science dictates certain changes in the business of economic entities. In accordance with the changes and needs of modern society in Serbia, the Ministry of Finance and the Tax Administration have decided to apply a new model of fiscalization, which is regulated by the Law on Fiscalization. This Law, with the recently adopted amendments, began to apply from November 1, 2021, with a transitional period until April 30, 2022. (Unija, 2021). The goal of applying the new fiscalization model is: eliminating the shortcomings of the existing fiscalization model; more efficient control of all deliveries of goods and provided retail services; providing conditions for better control of taxpayers by the Tax Administration. This Law has expanded the list of activities that have the obligation to record retail trade through an electronic fiscal device. (Unija, 2021) E-fiscalization, as a process of digitalization of the old fiscalization system, implies the complete elimination of the use of the classic fiscal cash register and the introduction of new software and electronic solutions. This makes business much easier, but there are also new challenges that need to be overcome in order to adapt to the new system in time. (Katalog, n.d.) The new fiscalization model will result in a reduction in taxpayers' operating costs, eliminate unnecessary administration, and thus create a better business environment. Also, the new fiscalization model will contribute to the reduction of the gray economy and reduce the possibility of abuse. (Ministarstvo finansija Republika Srbija, 2021) The introduction of any novelty in any sphere of life and work has its good and bad sides, so it takes time to fully implement it in the already established flows. Also, this model of fiscalization encounters dissatisfaction with the resistance of some users. For this reason, this paper will conduct a survey of small entrepreneurs on their satisfaction with the new fiscalization model. Such examinations can contribute to solving the problems that taxpayers encounter in practice. They can be the subject of consideration and broader analysis. Identifying the advantages and disadvantages of the new fiscalization model and their comprehensive analysis, a solution can be reached to the satisfaction of all stakeholders. Harmonizing all the pros and cons will produce a valid model that will benefit all stakeholders.
Keywords: fiscalization, business entities, electronic fiscal device, fiscal invoice, customer satisfaction
REFERENCES
[1] Unija. (2021, December). U: Zakon o fiskalizaciji (drugi deo), Retrieved from unija.com/sr/zakon-o-fiskalizaciji-
drugi-deo/, (accessed April 24st, 2022).
[2] Katalog. (n.d.). U: Šta je E-Fiskalizacija?, Retrieved from www.ka.rs/e-fiskalizacija, (accessed April 24th
, 2022). [3] Ministarstvo finansija Republika Srbija, (2021, september 09). U: Novi model fiskalizacije u Republici Srbiji,
Retrieved from mfin.gov.rs/sr/aktivnosti-1/novi-model-fiskalizacije-u-republici-srbiji-1, (accessed April 24th
2022). [4] PC Press (2022, march 16). U: eFiskalizacija – prilika za razvoj malih biznisa, Retrieved from
pcpress.rs/efiskalizacija-prilika-za-razvoj-malih-biznisa/ (accessed May 5th
, 2022) [5] Svet kompjutera (2022, february 01). U: eFiskalizacija: Dileme u praksi, Retrieved from
www.sk.rs/arhiva/clanak/30654/efiskalizacija-dileme-u-praksi-put-u-nepoznato (accessed May 5th
, 2022)

187
[6] Pantheon (n.d.). U: Elektronska fiskalizacija (Koje su prednosti novog modela fiskalizacije?), Retrieved from www.datalab.rs/elektronskafiskalizacija/?gclid=EAIaIQobChMIDI69TU9wIVUflRCh22PAqaEAMYAiAAEgL7S_D_BwE , (accessed May 5
th, 2022)
[7] mts (2021, December). U: Šta je e-fiskalizacija i po čemu se razlikuje od dosadašnje?, Retrieved from mts.rs/Poslovni/Korisnicka-zona/Cesta-pitanja/eFiskalizacija/opste-informacije/a93746-Sta-ukljucuje-korisnicka-podrska-mts-Tvoj-svet.html (accessed May 5
th, 2022)
[8] Gecić Law (n.d.). U: Poresko pravo, Retrieved from geciclaw.com/sr/practices/poresko-pravo/ (accessed May 5
th, 2022)
[9] 24 SEDAM (2021, September). U: Mušterije kao poreska inspekcija: Uz QR kod svaki račun na proveri, Retrieved from 24sedam.rs/biznis/finansije/79875/musterije-kao-poreska-inspekcija-uz-qr-kod-svaki-racun-na-proveri/vest (accessed April 24
th, 2022)
[10] Minimax (2021, decembar 22). U: Prednosti i mane fiskalizacije za mala preduzeća, Retrieved from www.minimax.rs/blog-prednosti-i-mane-fiskalizacije-za-mala-preduzeca/ (accessed April 24
th, 2022)
[11] ЗАКОН О ФИСКАЛИЗАЦИЈИ, („Службени гласник РС“, брoj 153/20) у примени од 01/01/2022, Одредбе члана 4. став 3, члана 5. став 4, члана 6. став 10, члана 7. став 2, члана 8. ст. 4. и 6, члана 9. став 6. и члана 10. став 2. се примењују од 29. децембра 2020. године. Retrieved from budiefiskalizovan.gov.rs/wp-content/uploads/2021/09/Zakon-o-fiskalizaciji.pdf (accessed May 5
th, 2022)

188
DIGITAL MARKETING IN THE PROMOTION OF A NEW FASHION
BRAND
Milica Simić1, Marijana Despotović-Zrakić
1, Aleksandra Labus*
1
1University of Belgrade – Faculty of Organizational Sciences
*Corresponding author, e-mail: [email protected]
OBJECTIVE
The digital world has become an integral part of almost every industry, including fashion. Applying digital marketing in the fashion industry enhances brand recognition, enables access to the global market of customers and other stakeholders, and achieves engagement of customers in product development (Rathnayaka, 2018). Digital marketing can be defined as a form of direct marketing that connects the buyers with the sellers electronically using websites, social media, emails, mobile applications, etc. (Kotler & Armstrong, 2010; Rathnayaka, 2018; Purwar, 2019). It enables easier and faster multichannel communication with customers and other stakeholders, and the promotion of products or services in a timely, relevant, personal and cost-effective manner (Baines et al., 2013). In a world of fashion, where the environment is very dynamic and turbulent, it is important to meet customers’ needs and to customize fashion products according to them. That is where fashion marketing plays a major role because it operates through the whole supply chain of the fashion system (Purwar, 2019). By appearing on the Internet, the fashion companies interact with customers in a more effortless and inexpensive way and establish with them a deeper relationship based on trust (Lorenzo-Romero et al., 2020; Hagberg et al., 2016). It is very important to use omnichannel communication so that the customer does not feel alienated when using one of them. By implementing an omnichannel strategy, a fashion company can simultaneously meet customers’ expectations and make a profit by tailoring its resources to different channels depending on needs and opportunities (Rye, 2019; Lorenzo-Romero et al., 2020). The main aim of this research is the development of a methodological approach for the promotion of a new fashion brand based on a digital marketing strategy. This method should enable easier creation of the recognition of new fashion brands in the online market, reach the target audience, connect with stakeholders using omnichannel communication, and gain competitive advantages.
METHODOLOGY
This paper presents the development of a methodological approach for the promotion of a new fashion brand based on a digital marketing strategy (Figure 1). The proposed methodological approach has the following steps:
1. Identifying a need for a new fashion brand in the digital market. It includes market research, competitive analysis and market segmentation.
2. Defining and implementing an internet marketing plan for a fashion brand. It includes defining an Internet business plan and a fashion brand digital marketing strategy.
3. Business results analysis includes analysis of data from the web site using various tools, RFM analysis (Recency, Frequency, Monetary value), digital marketing metrics and KPIs, and monitoring of revenues using the ROI method.

189
Identifying a need for a new fashion brand in digital market
Market research Competitive analysis Market segmentation
Internet marketing plan for fashion brand
Internet business plan Fashion brand digital marketing strategy
Digital marketing techniques
Omnichannel marketing strategy
Internet media plan
Business model canvas
Value proposition canvas
Revenue model
SWOT analysis
Project managment team
Risk management Digital payment
system
CRM strategy
Loyalty programs
Web presence
Visual identity (logo, color, font,
photography style)
Web site
Electronic store
Financial analysis
Mission and vision SMART goal
Defining target audience
SEO Email marketing
Affiliate marketing
Social media marketing
Mobile marketing
Video marketing
Viral marketingContent
marketing
Business result analysis
RFM analysis Web site analytics Digital marketing metrics and KPIs ROI
Figure 1: Methodological approach for the promotion of a new fashion brand based on a digital marketing strategy
RESULTS
The proposed methodological approach expects as a result simpler process of introducing a new fashion brand to the online market and the implementation of a digital marketing strategy. The method can be adapted and applied in the introduction and promotion of any fashion brand. Analyzing the effects of online appearances and the application of digital marketing should provide a starting point for the improvement of customer and stakeholder relationship management, fashion brand development, and defining future promotional strategies.
CONCLUSION
This paper presents a methodological approach that indicates the strategies and techniques of digital marketing that can be used to promote a new fashion brand in order to create its visual identity and recognizability, as well as achieve the goals of electronic business. Future directions of research will be related to the implementation and evaluation of the proposed methodological approach for the introduction of a new fashion brand to the online market.
Keywords: digital marketing, fashion industry, fashion marketing, omnichannel marketing, social media
REFERENCES
[1] Baines, P., Fill, C., & Page, K. (2013). Essentials of marketing. Oxford University Press. [2] Hagberg, J., Sundstrom, M., & Egels-Zandén, N. (2016). The digitalization of retailing: an exploratory
framework. International Journal of Retail & Distribution Management, 1-16. [3] Kotler, P., & Armstrong, G. (2010). Principles of marketing. Pearson Education. [4] Lorenzo-Romero, C., Andrés-Martínez, M. E., & Mondéjar-Jiménez, J. A. (2020). Omnichannel in the fashion
industry: A qualitative analysis from a supply-side perspective. Heliyon, 6(6), e04198. [5] Purwar, S. (2019). Digital Marketing: An Effective Tool of Fashion Marketing. In Proceedings of 10th
International Conference on Digital Strategies for Organizational Success (pp. 992-997). [6] Rathnayaka, U. (2018). Role of digital marketing in retail fashion industry: A synthesis of the theory and the
practice. Journal of Accounting & Marketing, 7(2), 1000279. DOI: 10.4172/2168-9601.1000279
[7] Ryu, M. H., Cho, Y., & Lee, D. (2019). Should small-scale online retailers diversify distribution channels into offline channels? Focused on the clothing and fashion industry. Journal of Retailing and Consumer Services, 47, 74-77.
190
CROWDSOURCING AND IOT-BASED OPEN INNOVATIONS IN INCREASING
SAFETY ON RAILWAYS
Nenad Stanisavljević1, Danijela Stojanović*
2, Zorica Bogdanović
3
1Infrastructure of Serbian Railways 2Institute of Economic Sciences
3 University of Belgrade – Faculty of Organizational Sciences
*Corresponding author, e-mail: [email protected]
OBJECTIVE
Through the conducted research and analysis, the authors aimed to propose an approach for implementing the concept of open innovation in the context of railway industry, based on crowdsourcing. The proposed approach is expected to provide prototypes of Internet of things solutions for certain situations on the railway, which endanger traffic safety. Until now, there have been almost no attempts to use crowdsourcing and open innovations to find prototype solutions for characteristic situations in which traffic safety is endangered, although traditional technical-technological solutions were extremely expensive and did not bring the expected positive results. The development of Internet of things enables a wider community to take part in identifying problems and proposing solutions, which gives railway companies a possibility to look for solutions outside of traditional innovation sources. Based on body of knowledge in the field of open innovations, the authors analyze the possibilities for applying crowdsourcing-based open innovations in railway industry, with all limitations, challenges and development directions.
METHODOLOGY
Students from the Faculty of Organizational Sciences (FON) in Belgrade participated in the research. FON students were first presented with certain situations from railway traffic, which create difficulties and problems in terms of safety and consequences when it comes to the functioning and operation of this transport system, as well as the negative connotations they cause in public, which together causes damage. The students then, divided into groups, chose one topic from the offered areas, ie a problem for which, based on research and analysis, they should offer a prototype of a solution based on open innovations, which has not been applied on Serbian railways so far. In addition, students were asked to develop their solutions using the workflow of product management, as well as to propose the marketing plans for the services they developed. The research was conducted in the period March - June 2022.
RESULTS
The paper will present open innovations proposed by FON students, as prototype solutions for certain situations on the railway, with the aim of increasing safety and reducing harmful consequences in this traffic system. The authors also present the limitations and challenges that students encountered during the research. Possibilities for the practical application of student open innovations that came up during this research, including financial and technical-technological aspects, will also be presented. Finally, based on specific cases and research results, the authors analyze the possibilities of further and wider application of open innovations in solving other problems in the functioning and operation of "Serbian Railway Infrastructure" and transport railway companies.

191
CONCLUSION
The current application of traditional solutions for the mentioned examples of endangering safety in railway transport is possible, but extremely expensive and requires large investments, so there is no traffic, technical-technological or economic justification for their realization. At the same time, even where the most complex and expensive technological solutions have been applied (when it comes to, for example, road crossings), the expected positive solutions for solving the mentioned problems have not been achieved. Therefore, the very attempt to come up with new solutions for the first time, through open innovations, to find new solutions for the characteristic situations of railway traffic safety, represents a significant step forward in solving them. In addition, the conducted research showed that this way of solving problems in railway traffic is characterized by greater technical and technological innovation, broader and more original insights, as well as a larger number of possible solutions, with significantly less financial resources required. Even in situations when open innovations are proposed as solutions only at the local (and not at the global level), this type of solving characteristic situations on the railway is certainly a technical-technological novelty and business refreshment. Open innovations can not only contribute to at least partially successful overcoming of the stated characteristic situations on the railway, but also open possibilities for completely different further directions of business and functioning of "Serbian Railway Infrastructure" and railway carriers in passenger and freight transport.
Keywords: crowdsourcing, open innovation, railways, internet of things, security
REFERENCES
[1] Cruz, P., & Astudillo, H. (2020). Toward a Maturity model for Assessment od Organization Readliness in Implementig and Deploying on Open Innovation Platform. In Proceedings of the 16th International Symposium on Open Collaboration (pp. 1-4).
[2] Santoro, G., Vorntis, D., Thrassou, A. & Dezi, L. (2018). The Internet of Things: Building a knowledge management system for open innovation and knowledge management capacity. Technological Forecasting & Social Change, 136, 347-354.
[3] Sarić, Ž., Obradović, V., Bogdanović, Z., Labus, A., & Mitrović, S. (2022). Crowd-based open innovation in telco operators: readiness assessment for smart city service development. Serbian Journal of Management, 17(1), 179-196.
[4] Von Geibler, J., Piwowar, J., & Greven, A. (2019). The SDG – Check: Guiding Open Innovation towards Sustainable Development Goals. Technology Innovation Management Review , 9(3), 20-37.
[5] Wang, Y. M., Wang, Y. S., & Wang, Y. Y. (2021). Exploring the determinants of university students’ contribution intention on crowdsourcing platforms: a value maximization perspective. Interactive Learning Environments DOI: 10.1080/10494820.2021.1890619

192
TESTING READINESS FOR THE INTRODUCTION OF CROWDSOURCING
SERVICES IN SECONDARY HEALTHCARE INSTITUTIONS
Miroslav Kendrišić1, Tamara Đorđević*
1, Dušan Višnjić
1
1University of Belgrade – Faculty of Organizational Sciences
*Corresponding author, e-mail: [email protected]
OBJECTIVE
The subject of this research is examining the readiness for introducing crowdsourcing services in secondary healthcare institutions. The focus of the research is on the analysis, definition, and implementation of different models of crowdsourcing to improve the quality of the current healthcare system. Surveying patients in secondary health institutions, the results will provide a full picture of readiness for implementing crowdsourcing models like crowd wisdom, crowdfunding, crowd voting and crowdsensing in secondary healthcare institutions. Crowd wisdom aggregates collective intelligence and collaboration among medical experts to collaboratively solve medical cases. For example, CrowdMed platform uses the crowd wisdom model for collaboration among an interdisciplinary team of medical experts with an aim to provide knowledge and skills for saving lives (Krafft, 2014). Crowdfunding is the practice of funding a project or enterprise by collecting small amounts of money from numerous people, typically via online platforms. In universal healthcare systems, medical crowdfunding is a viable option to finance alternative, complementary, experimental and scientifically poorly supported therapies not financed by the health insurance fund. Further analysis of the most common diseases and disorders listed in crowdfunding campaigns might provide guidance for national health insurance funds in extending their list of funded medical interventions (Lublóy, 2020). Crowd voting allows stakeholders to express their opinion and desire through an online platform, too. This helps medical institutions to gain insight into the opinion of many people in an easy and efficient way. Delegating the right to participate in the solution of minor local problems, authorities make strategic decisions on their own, without relying on the resources of a “smart crowd”. This simulation allows the government to reduce citizens’ dissatisfaction and increase the loyalty of citizens to the municipal authorities, as a whole, particularly their activities (Arkhipova & Starshinova, 2021). Crowdsensing has numerous applications in healthcare, from wearable sensors to remote monitoring of the elderly, medical device networking, and in creating a healthcare network infrastructure. Combined with many metrics that can be recorded it will provide a better picture of your health status which in turn will allow doctors to make a better diagnosis (Sayrafian et al., 2021).
METHODOLOGY
The research methodology used in this paper includes various scientific methods. The general scientific one used is data collection by surveying patients in secondary healthcare institutions. The questionnaire is testing readiness for the adoption of crowdsourcing systems in secondary healthcare institutions. The obtained results will be analyzed using statistical methods to draw objective conclusions about what

193
crowdsource models - crowd wisdom, crowdsensing, crowd voting, or crowdfunding should be implemented in secondary healthcare institutions.
RESULTS
In this research we examined the patients’ readiness to use crowdsourcing services in secondary healthcare institutions. In the context of crowdfunding, we tested if patients are ready to donate money for necessary equipment such as various appliances, beds and other needed resources. Crowd voting, a democratic way of making important decisions, is one of the possibilities that would help patients to express their needs and to participate in initiatives for improving healthcare services. Furthermore, we tried to examine patients’ readiness to share their health data collected over the phone and other wearable devices with doctors, and get a professional opinion. This will be implemented through a crowdsensing services.
CONCLUSION
Through this research, we examined readiness for implementing crowdsourcing services in secondary healthcare institutions. The main survey was conducted at secondary healthcare institutions, where the respondents were patients of all age groups. Crowdsourcing is rapid, low cost, and can collect a huge amount of information from a large number of people. What may pose a risk in this solution is that the existing healthcare system needs to be adapted and changed in order to be compatible with the new crowdsourcing system.
Keywords: healthcare, crowd wisdom, crowdfunding, crowd voting, crowdsensing
REFERENCES
[1] Arkhipova, E. B., & Starshinova, A. V. (2021). Crowd voting via online platforms as a way of citizens’ public participation in the development of municipalities (The active citizen case, Moscow). Вестник Томского государственного университета, 470, 103-107.
[2] Krafft, R. (2014). The power of crowd wisdom in solving difficult medical cases. Knight Foundation. Retrieved
from knightfoundation.org/articles/power-crowd-wisdom-solving-difficult-medical-cases/ [3] Sayrafian, K., Ambroziak, S. J., Bajic, D., Berbakov, L., Correia, L. M., Cwalina, K. K., ... & Turbic, K. (2021). IoT
for healthcare applications. In Inclusive Radio Communications for 5G and Beyond (pp. 221-252). Academic Press.
[4] Lublóy, Á. (2020). Medical crowdfunding in a healthcare system with universal coverage: an exploratory study. BMC Public Health, 20(1), 1-20.

194
STUDENTS’ PERCEPTION OF MANUAL AND AUTOMATED GRADING OF PROGRAMMING ASSIGNMENTS
Tatjana Stojanović*1, Saša Lazarević
1, Ilija Antović
1
1 University of Belgrade – Faculty of Organizational Sciences
*Corresponding author, e-mail: [email protected]
OBJECTIVE
Since the start of the pandemic, demand for online courses is growing as many schools and universities had to adjust their courses to be online. To reduce workload, teachers tend to automate the grading process using software for grading. Grading should be objective and consistent and it should provide feedback on students work (Ahoniemi et al., 2008). Systems for automated grading are mostly test-based, which means that students` solutions are tested against different cases and results are calculated based on which cases the testing solution has passed. Other grading solutions include sketching synthesis and error statistical modelling, pattern matching and others (Aldriye et al., 2019). Using automated grading system reduces the workload of teachers, but it also ensures objectivity of grading, possibility of giving assignments more frequently and other (Stojanović & Lazarević, 2021). However, it is questionable how the students perceive such grading system. The goal of this work is to determine students’ experience with an automated grading system and whether students feel that automated grading is beneficial for them as it is for teachers.
METHODOLOGY
This survey has been conducted in an undergraduate introductory programming course in the C programming language. With a large number of students enrolling the course each year, workload regarding grading is very high. In order to assess students’ perception of grading, they were given a questionnaire to fill out. The survey has been conducted in the first year of using software for automated grading, hence students who have experienced manual grading in this course earlier were included. Students who had been graded both manually and automatically were the most representative group for the research because they were familiar with advantages and disadvantages of both grading systems. However, all students could fill out the questionnaire. The questionnaire was answered by 108 students of which 65 students have been graded both manually and automatically on this course, 40 students were graded only automatically, while 3 were graded only manually. The questionnaire contained two parts – items about their grade and if they were graded automatically and/or manually and items about their experience regarding the grading process which included closed and open questions. Closed questions and statements were based on the Likert scale.
RESULTS
Most of the students believe that their knowledge is not being fairly graded (mean value = 2.451) when an
automated grading system is being used. Over 53% of students have expected more points than they have had, over 42% have expected as many points as they have had, while around 4% have got more points than they have expected. Students have said that the speed of grading is one of the biggest benefits of using automated grading, while a smaller number of students have pointed out objectivity as one of the benefits. Students have graded positively that they have had access to their code and the report with a list of test cases so that they know which tests have their function passed (mean value = 3.31), but they have reported that they were not able to determine what their mistakes were alone (mean value = 2.67) and that they need additional help from teachers (mean value = 4.47). Students have said that having prior experience with automated grading systems would help them perform better on test (mean value = 4.14).
1 The maximum mean value is 5.0 and the minimum mean value is 1.0

195
Students believe that their knowledge is not being graded correctly, because their solutions may be partially correct, but they don’t get partially graded. While each function has one or many test cases with each test case being graded, students do not perceive that as a partial grading. For example, a common mistake that causes a function not to be partially graded is an endless loop which happens when a student forgets to add a step, even though the rest of the code could be correct. These kinds of mistakes cannot be graded when using a test-based grading system, because none of the test cases would be passed. This makes students believe that test-based grading is too strict. Students` attitude towards manual grading is more positive because teachers would partially grade function with such errors.
CONCLUSION
Students mostly have a negative opinion about automated grading because of formalism and the inability of test-based systems to partially grade code. However, using test-based grading systems may motivate students to be more precise and to test their code more often. Students report that gaining almost immediate results is a benefit, but they fail to understand what other benefits they gain. With automated grading being used, it is important to provide good feedback, which will help students understand their code better and also make even less workload on teachers. Information about which test case a function has passed may not be enough for some students to fix their code and some of them will need further guidance from a teacher to understand what their mistakes were. In order to help students to better understand the process of grading they need to have a possibility of working with the system beforehand. Using an automated grading system with a good feedback system may bring many benefits for both lecturers and students. While some students still need guidance from a lecturer, with less time spent on repetitive tasks like grading, lecturers can spend more time working with these students focused on the problems they have.
Keywords: e-learning, automated grading, students` perception, automated assessment tool
REFERENCES
[1] Ahoniemi, T., Lahtinen, E., & Reinikainen, T. (2008). Improving pedagogical feedback and objective grading. In Proceedings of the 39th SIGCSE technical symposium on Computer science education (pp. 72-76). DOI: 10.1145/1352322.1352162
[2] Aldriye, H., Alkhalaf, A., & Alkhalaf, M. (2019). Automated Grading Systems for Programming Assignments: A Literature Review. International Journal of Advanced Computer Science and Applications, 10(3). DOI:
10.14569/IJACSA.2019.0100328 [3] Daradoumis, T., Marquès Puig, J. M., Arguedas, M., & Calvet Liñan, L. (2019). Analyzing students' perceptions
to improve the design of an automated assessment tool in online distributed programming. Computers & Education, 128, 159-170. DOI: 10.1016/j.compedu.2018.09.021
[4] Lee, H. H. (2021). Effectiveness of Real-time Feedback and Instructive Hints in Graduate CS Courses via Automated Grading System. In Proceedings of the 52nd ACM Technical Symposium on Computer Science Education (SIGCSE '21) (pp. 101-107). DOI: 10.1145/3408877.3432463
[5] Sánchez, M., Kinnunen, P., Flores, C., & Velázquez-Iturbide, J. A. (2014). Student perception and usage of an automated programming assessment tool. Computers in Human Behavior, 31, 453-460. DOI: 10.1016/j.chb.2013.04.001
[6] Stojanović, T., & Lazarević, S. (2021). Automated grading assignments in programming – advantages, problems and effects on learning. E-Business Technologies Conference Proceedings, 1(1), 100-104.

196
A SILABBIZ DSL FOR BUSINESS LOGIC SPECIFICATION
Vojislav Stanojević*1, Siniša Vlajić
1, Dušan Savić
1
1University of Belgrade – Faculty of Organizational Sciences
*Corresponding author, e-mail: [email protected]
OBJECTIVE
The hearth and soul of every software product is business logic. Although the main part of business logic is part of middle layer, it can be also a part of storage as well as FE part of the application (Cemus et al., 2015). In this paper, we will focus on business logic in FE part of the application. More to the point, we have developed SilabBiz domain specific language for business logic specification and we created a set of transformations for generating fully functional application BE (SpringBoot Rest services) + FE (Angular application). This paper will focus on a set of language constructs/transformations to generate FE part of application (Angular). In our previous work (Antović et al., 2012; Savić et al., 2015), we presented an approach of doing specification in different levels of abstractions. The starting point of our previous work is specification of domain concepts (e.g. Domain model). SilabBiz provides a set of predefined validators for putting a set of constraints for each attribute. In addition, one can specify a set of possible states for each entity and then add validators for each state/attribute pair. We will show that constraints defined in this way are very important for transformation of specification to FE executable code. It is important to note that SilabBiz language offers specification on platform independent level (PIM). Therefore, we can provide multiple transformations not just one (SpringBoot + Angular) proposed at the beginning of the paper.
The main objective of this paper is to show that SilabBiz DSL is sufficient for creating proper requirements specification in order to generate fully functional Angular application, which includes business logic related to user input validation. Application will provide CRUD operation for selected entities. Although here we did keep our language constructs regarding FE specification simple we are working on SilabBiz extension which will include findings from our previous work (Antović et al., 2012).
METHODOLOGY
In order to prove our work we will conduct a case study. For the research purpose, we will do a case study on invoicing system. Plan is to use SilabBiz for requirements specification and to generate Angular application from it. We will compare line of codes for both specification and generated application in order to see if there are benefits. We already did a research regarding importance of code quality analysis (Milić et al., 2017), and it application in learning process. Therefore, we will do static code quality analysis using Sonarqube system in order to check quality of generated code.
RESULTS
From the specification, we did model-2-code transformation. As a result, we have Angular application supported with angular material UI library. Application code has feature driven structure. All features are lazy loaded in order to speed up application loading time. Figure 1 shows the look of Angular application. You can see that generated application included user input validation. For each entity, we have to pages. One that shows all items in a table and another one that used for adding/changing the record. As already said, there are transformations that have produced both SpringBoot Rest application as well as DB DDL scripts.

197
Figure 1: Generated Angular application
One of the main motives for this work was to keep code consistency throughout the application, keeping code quality on good level. Regarding code quality analysis, we got good results. As already said, we used SonarCube software for code analysis. You can find summary results in a table below. Table 1: Statistics
Metric Value
Lines of code 1455 Number of bugs 0 Code smells 22 Security Hotspots 0
For specification which have no more than 100 lines of code we have produced 1455 lines of Angular code. Even though Sonarcube did find some code smells overall grade is A. The good point is that most of this code smells repeats in each feature. It will be very easy to correct these code smells. One correction in transformation (template) will appear in lot of places. Figure 2 shows SonarQube overall report.
Figure 2: SonarQube report
CONCLUSION
The research paper focuses on SilabBiz DSL for business logic specification. Most important aspect of this paper is related to model-2-code transformations specifically ones related to FE code generation. The aim of this paper was to show that SilabBiz DSL based specification is sufficient for generating FE application.

198
From less than 100 lines of code, we have produced more the 1400 lines of functional Angular application. As said, most of this specification is also used for generation of Rest API (SpringBoot) as well as DB creation scripts. When we consider this, it is more than obvious that SilabBiz DSL is good tool for building a UI prototype. Our aim to develop functional prototype was more than successful. We incorporated all well know best practice solutions. Therefore, we think that it can help especially youngsters to speed up development and to give them confidence how to proceed further. In our paper (Sekulić et al., 2015) we were writing of the way one can improve learning process and this is tool can be used in learning process as well as to speed up software development.
Keywords: DSL, business logic, constraints, angular, code quality
REFERENCES
[1] Cemus, K., & Černý, T., & Donahoo, M. J. (2015). Automated Business Rules Transformation into a Persistence Layer. Procedia Computer Science. 62. DOI: 10.1016/j.procs.2015.08.391.
[2] Savić, D., Vlajić, S., Lazarević, S., Stanojević, V., Antović, I., Milić, M., & Rodrigues da Silva, A. (2015). Use Case Specification Using the SILABREQ Domain Specific Language. Computing and Informatics Journal, 34(4), 877-910.
[3] Sekulić, G., Antović, I., Vlajić, S., Lazarević, S., Savić, D., Stanojević, V., & Milić M. (2015). Conceptual Model of Software Architecture in Instruction Java Web Frameworks. International Journal of Engineering Education, 31(1(A)), 1-14.
[4] Antović, I., Vlajić, S., Milić, M., Savić, D., & Stanojević, V. (2011). Model and software tool for automatic generation of user interface based on use case and data model, IET Software, 6(6), 559-573. DOI: 10.1049/iet-sen.2011.0060
[5] Milić M., Vlajić S., Antović I., Savić D., Stanojević V., & Lazarević S. (2017). Software Quality Standards and Lean Approach in Teaching and Learning Programming. International Journal of Engineering Education, 33(4), 1345-1360.

199
QUALITY-BASED ANALYSIS OF SHIFTING TO NATIVE MICROSERVICE
SOFTWARE ARCHITECTURE
Denis Kužner*1, Miloš Milić
1, Siniša Vlajić
2
1University of Belgrade – Faculty of Organizational Sciences *Corresponding author, e-mail: [email protected]
OBJECTIVE
One of the important decisions that need to be made in a software development process is related to software architecture design. At the highest level of abstraction, the architecture of a system describes its main components, as well as the way in which they are interconnected (Hasselbring, 2018). A well-established software architecture has a significant long-term impact on the overall system success, including its performance, quality and ease of maintenance (Hasselbring, 2018). Microservice architecture has emerged in response to certain limits of monolithic applications, offering exceptional agility and providing the ability to embrace shorter release cycles and upgrades that are necessary to maintain business competitiveness (Tapia et al., 2020). The main idea behind this architecture is to create small, highly scalable, individually manageable units that interact with each other (Levcovitz et al., 2016). Since a wide range of technologies is available, it is very important to choose the ones that will meet the user needs on the best possible way. Accordingly, there are many different approaches and technologies used in the implementation of the microservice systems. In addition, various frameworks and virtual machines can be applied in order to improve the quality of software architecture design. (Vermeer, 2021) This paper presents GraalVM Native Image technology whose main feature is Ahead-of-Time (AOT) compilation of source code which results in creating standalone, native platform executable, called a native image. Native image build process statically analyzes bytecode to determine all reachable program elements necessary for the immediate execution of the application (Yuhala et al., 2021). Accordingly, the main goal of this paper is implementation of microservice software architecture using native and non-native technologies, as well as the quality-based analysis of developed software systems. The purpose of the research is to consider differences between Native and Non-Native microservice software architectures in the context of quality metrics. As a result, the research will present recommendations for the application of native software technologies.
METHODOLOGY
In order to make a quality-based analysis of native and non-native microservice software architecture possible, for the research purposes are developed software systems on the same case study of Football Fantasy game. The software architecture of the described system is shown in the Figure 1. In addition, the figure depicts following decomposed microservices: football-fantasy-parser-service, football-fantasy-stats-service, football-fantasy-team-service, football-fantasy-user-service, football-fantasy-service, and football-fantasy-gateway. Software systems are developed by using Spring Boot and Spring Cloud frameworks. Spring Cloud Netflix Eureka module is used for implementation of the microservices central registry. It provides discovery mechanism that allows services to easily find and communicate with each other. The Gateway API is implemented using the Spring Cloud Gateway module. Also, each microservice has its own MySQL
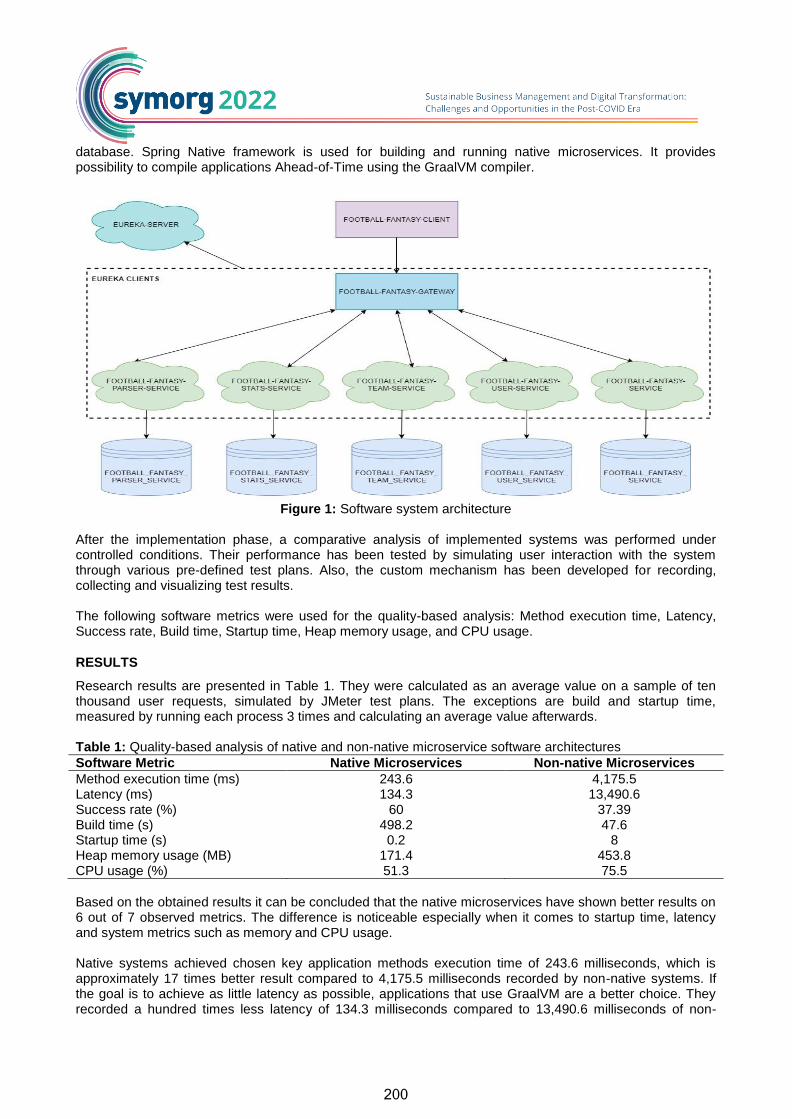
200
database. Spring Native framework is used for building and running native microservices. It provides possibility to compile applications Ahead-of-Time using the GraalVM compiler.
Figure 1: Software system architecture
After the implementation phase, a comparative analysis of implemented systems was performed under controlled conditions. Their performance has been tested by simulating user interaction with the system through various pre-defined test plans. Also, the custom mechanism has been developed for recording, collecting and visualizing test results. The following software metrics were used for the quality-based analysis: Method execution time, Latency, Success rate, Build time, Startup time, Heap memory usage, and CPU usage.
RESULTS
Research results are presented in Table 1. They were calculated as an average value on a sample of ten thousand user requests, simulated by JMeter test plans. The exceptions are build and startup time, measured by running each process 3 times and calculating an average value afterwards. Table 1: Quality-based analysis of native and non-native microservice software architectures
Software Metric Native Microservices Non-native Microservices
Method execution time (ms) 243.6 4,175.5 Latency (ms) 134.3 13,490.6 Success rate (%) 60 37.39 Build time (s) 498.2 47.6 Startup time (s) 0.2 8 Heap memory usage (MB) 171.4 453.8 CPU usage (%) 51.3 75.5
Based on the obtained results it can be concluded that the native microservices have shown better results on 6 out of 7 observed metrics. The difference is noticeable especially when it comes to startup time, latency and system metrics such as memory and CPU usage. Native systems achieved chosen key application methods execution time of 243.6 milliseconds, which is approximately 17 times better result compared to 4,175.5 milliseconds recorded by non-native systems. If the goal is to achieve as little latency as possible, applications that use GraalVM are a better choice. They recorded a hundred times less latency of 134.3 milliseconds compared to 13,490.6 milliseconds of non-
201
native applications. When it comes to rate of successfully executed requests, non-native systems achieved low result of 37.39% while native systems recorded 60% success rate. Build time and startup time are the metrics that are directly influenced by the choice of virtual machine. Native applications achieved very fast average startup time of 0.2 seconds compared to 8 seconds of non-native applications, which is 40 times better result. Obtained results were expected due to different compile methods of observed systems. The reason for the slower build time of applications that use GraalVM is Ahead-of-Time compilation which takes much longer because all classes and libraries necessary for immediate application execution are compiled in advance. (Yuhala et al., 2021) On the other hand, non-native applications achieved 10 times better results with average result of 47.6 seconds compared to 498.2 seconds recorded by native systems, which is expected due to the Just-in-Time compilation. When it comes to the system metrics like heap memory and CPU usage, native microservices achieved 2.6 times less heap memory usage and approximately 1.5 times less CPU usage. Hence, GraalVM Native Image presents the right choice in situations where limited resources are available.
CONCLUSION
The research subject of this paper includes quality-based analysis of native and non-native microservice applications. Accordingly, the paper presented their characteristics with the comparison on the concrete case study. Heavy build process of native applications, which is based on Ahead-of-Time compilation, caused them to achieve better results in all observed metrics except the build time, compared to non-native applications. This result certainly was expected due to the fact that Just-in-Time compiler during the application runtime does not have to use CPU and memory resources for compilation processes that have already been performed during the build time (Yuhala et al., 2021). In this way, a larger amount of system resources is made available to the application during its execution, noticeably enhancing its performance. Furthermore, fast startup and small footprint can make native applications a good choice for running in container or cloud environment (Pahl, et al., 2020). Additionally, they can be very helpful in limited system resources circumstances. Based on the previously presented results, it can be concluded that native and non-native software architectures are related to the software quality. On the other hand, end-users of the application are commonly unaware of the applied software architecture, but are interested in various aspects of software quality (e.g. performance, usability) (Bourque & Fairley, 2014). Taking into account that the software architecture typically directs the software development process (Bourque & Fairley, 2014), companies, software architects, and software teams need to consider the importance of quality attributes and software metrics for the software system being developed. The research was limited in the examined case study and applied software quality metrics. In this context, further research should consider additional software systems and metrics, as well as different programming languages. In addition, further research could consider additional microservice frameworks (e.g. Helidon, Quarkus, Micronaut) that can be integrated with the GraalVM (Šipek et al., 2019).
Keywords: software architecture, microservices, native image, graal-vm, quality analysis
REFERENCES
[1] Bourque, P., & Fairley, R. E. (eds.) (2014). Guide to the Software Engineering Body of Knowledge (SWEBOK (R)): Version 3.0. IEEE Computer Society Press.
[2] Hasselbring, W. (2018). Software architecture: Past, present, future. In Gruhn, V. & Striemer, R. (ed.). The Essence of Software Engineering (pp. 169-184). Springer, Cham.
[3] Levcovitz, A., Terra, R., & Valente, M. T. (2016). Towards a technique for extracting microservices from monolithic enterprise systems. In 3rd Brazilian Workshop on Software Visualization, Evolution and Maintenance (VEM) (pp. 97-104).
[4] Pahl, C., Jamshidi, P., & Zimmermann, O. (2020). Microservices and containers. Software Engineering 2020.

202
[5] Šipek, M., Mihaljević, B., & Radovan, A. (2019, May). Exploring aspects of polyglot high-performance virtual machine GraalVM. In 2019 42nd International Convention on Information and Communication Technology, Electronics and Microelectronics (MIPRO) (pp. 1671-1676). IEEE.
[6] Tapia, F., Mora, M. Á., Fuertes, W., Aules, H., Flores, E., & Toulkeridis, T. (2020). From monolithic systems to microservices: A comparative study of performance. Applied Sciences, 10(17), 5797.
[7] Vermeer, B. (2021). JVM Ecosystem Report 2021, 5. Retrieved from res.cloudinary.com/snyk/ image/upload/v1623860216/reports/jvm-ecosystem-report-2021.pdf, (accessed April 15
th, 2022).
[8] Yuhala, P., Ménétrey, J., Felber, P., Schiavoni, V., Tchana, A., Thomas, G., Guiroux, H., & Lozi, J. P. (2021, December). Montsalvat: Intel SGX shielding for GraalVM native images. In Proceedings of the 22nd International Middleware Conference (pp. 352-364).

203
TESTING AS A VALIDATION METHOD FOR FUNCTIONAL REQUIREMENTS OF A
SOFTWARE SYSTEM
Miloš Nikić*1, Saša Lazarević
1
1University of Belgrade – Faculty of Organizational Sciences
*Corresponding author, e-mail: [email protected]
OBJECTIVE
Nowadays it is nearly impossible to live without a use of software. Range of software usage is enormously wide. Variety of software applications can be seen in banking, telecommunications, traffic, education, production systems, and as well in Internet functionality. Every simple device, lately released, can have multiple processors. These processors can be used for processing data of current location, for paying with credit cards or even for measuring heart beats per minute. Although, they are used for various purposes, they all have one thing in common. That is, they all run software. Expectations of end users from these devices, is that they are working without errors, but those scenarios are not feasible. Error detection, and software malfunctioning removal increases software quality and reliability. According to the Boehm’s first law: “Faults are usually introduced during the requirements gathering and analysis and design phase, cost to remove them increases in later phases”. When talking about faults, it is necessary to point out difference between verification and validation. Verification is process of evaluating the software to determine whether the products of a given development phase satisfy the conditions imposed at the beginning of that phase. On the other hand, validation represents set of activities that are focused on evaluating the software during or at the end of the development process to determine whether it satisfies specified requirements.
METHODOLOGY
Developed software system is based on monolithic application, meaning that system modules are tightly coupled. Coupled modules can not exist on their own, because all of them are interconnected and dependent on each other. Since all the functionalities are grouped together, change of any system component would result in changing the whole application. Three tier architecture provides solid abstraction over the software system. One of the powerful features of the layered architecture pattern is the separation of concerns among components. Components within a specific layer deal only with logic that pertains to that layer. Furthermore, layers are isolated, meaning that changes made in one layer of the architecture generally do not impact or affect components in other layers (Richards, 2021). Testing each software system layer (3-tier architecture) separately gives us confidence that each part of system is working as intended. For functional requirements validation, it is important that all layers are cooperating without any faults. Since the validation is related to the end user testing, malfunction of any layer would result in unintended system behavior. Primary focus in this paper is on verification method, although both verification and validation are equally important. Verification process is tightly coupled to the technical part of software development lifecycle, whereas validation relates to end users.

204
Figure 1: Difference between verification and validation (source: https://www.plutora.com/blog/verification-
vs-validation)
RESULTS
Before validating that the software system meets functional requirements specification, it must pass verification process. This verification process is consisted of number of different testing techniques that can be measured. This paper focus will be on code coverage, total number of tests, number of successful and unsuccessful tests. Exhaustive software system testing is not feasible due to complexity of system itself and complex test cases. As a result, it is mandatory to determine which part of software system should and which part should not be tested. Table 1: Analysis results of application layer
Metric name (scenario)
Number of successful tests (covered lines of code)
Number of unsuccessful tests (uncovered lines of code)
Total number
% (successful / total) * 100
Execution time (s)
Number of tests / / 126 / 2,9 Code coverage (autogenerated code included)
2240 7602 9842 ~23 /
Code coverage (autogenerated code not included)
1912 12 1924 ~99 /
Code coverage by tests is one of the most important metrics in the verification process. Based on code coverage, system can develop sufficient confidence level regarding code quality. Considering results from above table, it can be seen how including autogenerated code into account can affect results. Results drastically changed from 23% to 99%, when autogenerated code was not included into analysis. In Table 2, there is analysis of number of lines of code for both implementation component and corresponding test suite. Table 2: Comparative analysis of source and test suite code
Name of component Implementation component
Test suite of implementation component
Difference Difference (%)
CommentsService 37 158 121 76,58 FriendsService 74 211 137 64,93 GroupsService 292 1117 825 73,86 PhotosService 95 241 146 60,58 UsersService 134 657 523 79,60
Total 1065 3861 2796 72,42
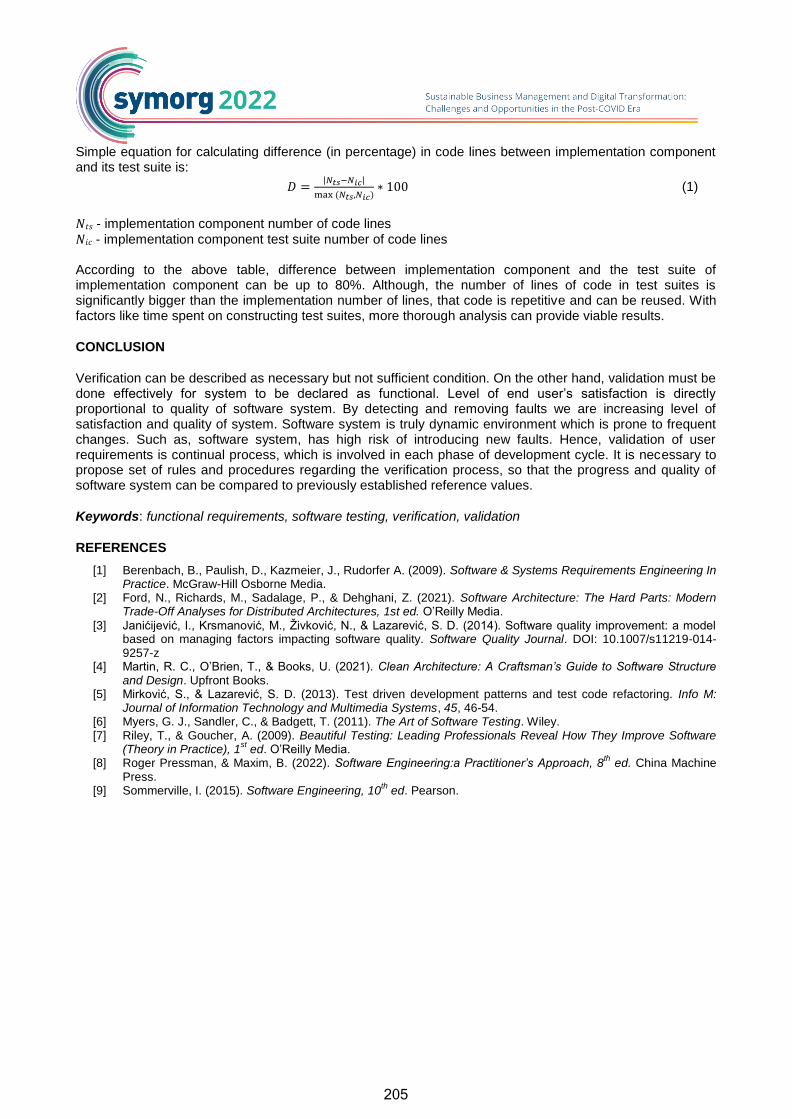
205
Simple equation for calculating difference (in percentage) in code lines between implementation component and its test suite is:
(1)
- implementation component number of code lines
- implementation component test suite number of code lines According to the above table, difference between implementation component and the test suite of implementation component can be up to 80%. Although, the number of lines of code in test suites is significantly bigger than the implementation number of lines, that code is repetitive and can be reused. With factors like time spent on constructing test suites, more thorough analysis can provide viable results.
CONCLUSION
Verification can be described as necessary but not sufficient condition. On the other hand, validation must be done effectively for system to be declared as functional. Level of end user’s satisfaction is directly proportional to quality of software system. By detecting and removing faults we are increasing level of satisfaction and quality of system. Software system is truly dynamic environment which is prone to frequent changes. Such as, software system, has high risk of introducing new faults. Hence, validation of user requirements is continual process, which is involved in each phase of development cycle. It is necessary to propose set of rules and procedures regarding the verification process, so that the progress and quality of software system can be compared to previously established reference values.
Keywords: functional requirements, software testing, verification, validation
REFERENCES
[1] Berenbach, B., Paulish, D., Kazmeier, J., Rudorfer A. (2009). Software & Systems Requirements Engineering In Practice. McGraw-Hill Osborne Media.
[2] Ford, N., Richards, M., Sadalage, P., & Dehghani, Z. (2021). Software Architecture: The Hard Parts: Modern Trade-Off Analyses for Distributed Architectures, 1st ed. O’Reilly Media.
[3] Janićijević, I., Krsmanović, M., Živković, N., & Lazarević, S. D. (2014). Software quality improvement: a model based on managing factors impacting software quality. Software Quality Journal. DOI: 10.1007/s11219-014-9257-z
[4] Martin, R. C., O’Brien, T., & Books, U. (2021). Clean Architecture: A Craftsman’s Guide to Software Structure and Design. Upfront Books.
[5] Mirković, S., & Lazarević, S. D. (2013). Test driven development patterns and test code refactoring. Info M: Journal of Information Technology and Multimedia Systems, 45, 46-54.
[6] Myers, G. J., Sandler, C., & Badgett, T. (2011). The Art of Software Testing. Wiley. [7] Riley, T., & Goucher, A. (2009). Beautiful Testing: Leading Professionals Reveal How They Improve Software
(Theory in Practice), 1st ed. O’Reilly Media.
[8] Roger Pressman, & Maxim, B. (2022). Software Engineering:a Practitioner’s Approach, 8th ed. China Machine
Press. [9] Sommerville, I. (2015). Software Engineering, 10
th ed. Pearson.

206

207
EVIDENCE-BASED PUBLIC POLICY MAKING IN POST-COVID
ENVIRONMENT

208
DOES EQUAL PAY WORK FOR WOMEN IN SERBIA? THE EXPERIENCE DURING
THE COVID-19 PANDEMIC
Kosovka Ognjenović*1
1Institute of Economic Sciences
* Corresponding author, e-mail: [email protected]
OBJECTIVE
The gender wage gap has a central place in explaining the pattern of wages determination for many countries. This is well documented in research studies. Relevant recent studies for industrialized countries include, for instance, Kaya (2021) and Olivetti & Petrongolo (2016), and for transitional countries, Blunch (2018), etc. The extent and structure of gender differences in wages began to occupy the attention of economists as the participation of women in the labor force in developed economies increased. The first empirical studies on gender pay gaps use a theoretical wage model that primarily determines wages due to the impact that human capital factors, such as education and work experience, have on their trend during an individual's life cycle. This model explains the movement of the part of the total difference in the wages of men and women, which is formed under the influence of the observed characteristics. However, part of the gender wage gap cannot be explained by the contribution of the observed characteristics and is the result of the possible impact of discrimination. According to the basic concept of measuring the pay gap, gender differences in wages are perceived through differences in the observed characteristics and the effect that results from different wage structures, including potential effects of discrimination. This concept of measuring gender wage gaps has served many authors to develop empirical models and decompose the gender wage gap (Kaya, 2021; Ognjenović, 2021; Blunch, 2018; Olivetti & Petrongolo, 2016). At the beginning of the crisis caused by the covid-19 pandemic, empirical studies have emerged to show that women and men in the labor market are not equally affected by this crisis (ILO, 2021; Ognjenović, 2021; Alon et al., 2020; SeCons, 2020). Given the fact that women are over-represented in locked-down sectors (HORECA industries, administration, education, and alike), but also in the sectors that were key to fighting the covid-19 pandemic (like health care and commerce), the question arises as to (I) whether wage losses have resulted in an increase or decrease in the gender wage gap, and (II) whether it has been accompanied by discrimination. There are still no studies for Serbia that address gender wage gaps during the covid-19 pandemic.
METHODOLOGY
The primary data sources for the analysis of gender wage differences in Serbia during the covid-19 pandemic are the two complementary surveys on the income and living conditions and the labor force. In order to get a picture of the development of the gender wage gap in the period before the covid-19 pandemic, the results of previous studies will be used, as well as the results of the structure of earnings survey. The methodological concept of measuring wage differences and exposing the potential effect of market discrimination is based on the approach developed by Ángeles et al. (2011). This approach enables the assessment of the maximum wage and, based on the difference between the actual and potential wage, determines the individual efficiency in the labor market. The Covid-19 pandemic had a moderate effect on the results of men and women in the Serbian labor market. However, women's participation in the labor market has decreased in absolute and relative terms. A significant proportion of unemployed women have excluded themselves from the labor market and become inactive. It was also characteristic of the female workforce that unemployment did not move only towards inactivity. Still, a part of the unemployed turned into employment, which preserved the employment rate of
209
women during the first year of the covid-19 pandemic. Therefore, the gender employment gap has been slightly reduced from 14.7 to 14.5 percentage points in 2020 (Statistical Office of the Republic of Serbia, 2021). This is also indicated by the figures shown in the chart below (Figure 1).
Figure 1: Labor force participation and employment rates (%) in Serbia
RESULTS
Before the covid-19 pandemic, Serbia had been on an excellent path to reducing the disparity between men's and women's wages, and a legal framework had been adopted that enabled this. However, the pay gap remains significant (Table 1). According to Eurostat's methodologically similar the structure of earnings survey, the gender wage gap in Serbia increased slightly before the covid-19 pandemic (Statistical Office of the Republic of Serbia, 2020). This may, to some extent, be influenced by a slight increase in the discrepancy between men's and women's wages in the public sector, working hours redistribution in favor of more working hours for men, and the type of employment contract. Although the gender wage gap in Serbia is smaller compared to the EU-27 average of 14.4 percent in 2018, it is still more significant than in some former transition countries in Central and Eastern Europe. Table 1: Gender wage gap in Serbia
Country 2014 2018
Serbia 8.7 9.6
Source: Unadjusted gender pay gap extracted from the structure of earnings survey that excludes public administration, defense, and compulsory social security. Leaving the labor force of low-skilled women and employment in part-time jobs or jobs that offer a reduced package of social benefits increases women’s vulnerability. This gives rise to practical implications for public policies that may be reflected in the later position of women in the labor market or through their recognition by the pension and social system as potential beneficiaries. Socio-economic measures provided to support the hardest-hit economic sectors, including those in which women are over-represented, aim to maintain balanced employment and prevent job losses due to greater exposure to the infection. The preliminary results show that the gender wage gap correlates with the economic sector while isolating discriminatory patterns in wages determination requires further attention.
CONCLUSION
In the Central and Eastern European countries, the gender wage gap was even more critical, as it was assumed that the transition to a market would affect the poorer position of women in the labor market and deepen gender wage differences. However, the results of empirical studies have not led to a single conclusion. In some countries, the relative position of women was improved, not only because the market discourages discriminatory behavior but also because of the structural changes that followed privatization and the opening of economies. Although there is a trend of wage convergence, thanks to the improved observed characteristics of women, gender differences in wages remain deeply rooted, both in post-transition and old European countries (Blunch, 2018; Olivetti & Petrongolo, 2016). Consequently, the trend of gender differences in wages is explained by the higher representation of women in certain economic or ownership sectors, segregation by occupation, or the changed structure of the female labor force due to the dropout of low-skilled women. When it comes to countries aspiring to EU membership, including Serbia and
0
10
20
30
40
50
60
70
Men Women Men Women
2019 2020
Activity rate
Employment rate
210
other Balkan countries that are not part of the Union, compliance with the acquis communautaire and full implementation of regulations that prohibit discrimination and prevent the deepening of gender inequalities in the labor market is expected. However, women in the EU continue to strive for greater representation in decision-making positions (Kresal, 2021). Comprehension of the scope and structure of the gender wage gap and the potential impact of discrimination in determining women's wages is crucial because it can negatively affect the economic well-being of employed women and their career advancement and women's decision to join the workforce. Situations caused by global crises, such as the current health crisis, can further worsen the position of already vulnerable categories in the labor market and open space for the growth of those sectors and occupations due to technological advancement resilient to lock-down measures.
Keywords: covid-19, female labor force participation, gender wage gap, Serbia
REFERENCES
[1] Alon, T., Doepke, M., Olmstead-Rumsey, J., & Tertilt, M. (2020, April). The impact of COVID-19 on gender equality. NBER Working Paper 26947. Retrieved from www.nber.org/system/files/working_papers/w26947/w26947.pdf (accessed March 31
st, 2022)
[2] Ángeles, Díaz, M., & Sánchez, R. (2011). Gender and potential wage in Europe: a stochastic frontier approach. International Journal of Manpower, 32, 410-425. DOI: 10.1108/01437721111148531
[3] Blunch, N.H. (2018). Just like a woman? New comparative evidence on the gender income gap across Eastern Europe and Central Asia. IZA Journal of Development and Migration, 8(11). DOI: 10.1186/s40176-017-0119-x
[4] ILO (2021, October). An uneven and gender-unequal COVID-19 recovery: Update on gender and employment trends 2021. Retrieved from www.ilo.org/wcmsp5/groups/public/---ed_emp/documents/publication/wcms_824865.pdf (accessed March 31
st, 2022)
[5] Kaya, E. (2021). Gender wage gap trends in Europe: the role of occupational skill prices. Forthcoming in International Labour Review. DOI: 10.1111/ilr.12338
[6] Kresal, B. (2021). Gender pay gap and under-representation of women in decision-making positions: UWE Decisions of the European Committee of Social Rights. ERA Forum, 22, 311-325. DOI: 10.1007/s12027-021-00664-8
[7] Ognjenović, K. (2021). Gender wage gap in Serbia: inheritance and sources of the wage gap. Stanovništvo, 59,
123-141. DOI: 10.2298/STNV2102123O [8] Ognjenović, K. (2021). Prilagođavanje tržišta rada u Srbiji novim uslovima izazvanim COVID-19 krizom. In:
Poslovanje u periodu pandemije – izazovi i šanse (pp. 18-37). Belgrade: Institute of Economic Sciences. [9] Olivetti, C., & Petrongolo, B. (2016). The evolution of gender gaps in industrialized countries. Annual Review of
Economics, 8, 405-434. DOI: 10.1146/annurev-economics-080614-115329 [10] SeCons. (2020). Uticaj COVID-19 pandemije i mera za njeno sprečavanje na zaposlenost i uslove rada žena i
muškaraca u Srbiji. Retrieved from www.secons.net/files/publications/113-publication.pdf (accessed March 31st,
2022) [11] Statistical Office of the Republic of Serbia. (2020). Structure of Earnings Survey. Bulletin 664. Retrieved from
publikacije.stat.gov.rs/G2020/Pdf/G20205664.pdf (accessed March 31st, 2022)
[12] Statistical Office of the Republic of Serbia. (2021). Labour Force Survey 2020. Bulletin 671. Retrieved from publikacije.stat.gov.rs/G2021/Pdf/G20215671.pdf (accessed March 31
st, 2022)

211
DID COVID-19 RELIEF PROGRAMS REANIMATE ZOMBIE COMPANIES?
Branko Radulović*1,2
, Stefan Dragutinović2
1University of Belgrade – Faculty of Law
2 Balkan Center for Regulatory Reform (BCRR)
*Corresponding author, e-mail: [email protected]
OBJECTIVE
We assess the initial impact of the COVID-19 induced crisis on the Serbian corporate sector and the effects of the state’s economic relief programs. Providing relief measures to otherwise insolvent firms or “Zombie companies” (Barlevy, 2003; Banerjee & Hofmann, 2018; Caballero et al., 2008; McGowan et al., 2018; Schivardi et al., 2017; Storz et al., 2017) – has been shown to hamper economic growth through the misallocation of credit and the suppression of competitive forces . This paper makes two key contributions. First, we fill a gap in the empirical literature concerning “Zombie companies” in the Serbian corporate sector. Second, we seek to assess the impact of COVID-19 relief measures to give policymakers fresh insights into potential solvency issues in the Serbian corporate sector that may occur as the effects of relief measures are gradually phased out.
METHODOLOGY
We use quantitative analysis to assess the initial effects of the Covid-19 pandemic-induced crisis and the effects of economic relief programs, and the Serbian companies' aggregated financial statements from 2016 to 2020. Furthermore, we constructed a sample of 380 large companies in 2020 to identify those whose debt is at risk of defaulting (DaR), the presence of zombie companies, and their potential impact on the corporate sector liquidity and commercial banks' balance sheets. Following recent literature, we define a company’s debt at risk of defaulting based on the Interest Coverage (ICR) and Current Liquidity ratios (CLR) (Banerjee & Hofmann, 2020; IMF, 2020). We define a zombie company as a company whose DaR in at least two consecutive years.
Furthermore, we distinguish “pure” zombies. Pure zombie companies satisfy all the criteria to be considered zombie companies after adjusting the ICR and CLR ratios for the connected legal entities' financial expenses and short-term financial liabilities. The rationale for this distinction is that such zombie do not pose a serious threat to the domestic financial system as they exposure to domestic financial and corporate entities is low. To better understand the anatomy of Zombie companies, we first estimate total factor productivity using the control function approach and GMM estimator. More specifically, we use the following Cobb-Douglas production technology for a company (i) at a time (t) (Wooldridge, 2009):
(3)
Where Yit represents the log of company’s output (operating revenue reduced by the value of subsidies); lit and mit are the logarithms of the freely variable inputs of labor and the intermediate input (costs of materials and energy); kit is the logarithm of the state variable capital; it is a normally distributed idiosyncratic error term and the random component (ωit) is the unobserved technical efficiency parameter. Finally, we compare Zombie companies’ features and performance by observing sample averages of corresponding indicators and their statistical significance and predict the probability of switching the status from a Non-zombie to Zombie company.

212
RESULTS
Our paper is the first to provide estimates of total economic relief provided to the Serbian corporate sector. The total financial assistance to the Serbian economy provided by the Government of Serbia in 2020 and 2021 amounted to RSD 748.1 billion (EUR 6.4 billion), which equals around 13.6% of Serbian GDP in 2020 computed at current prices . Less strict epidemiology measures for containing the spread of the SARS-CоV-2 virus in combination with sound pre-crisis macroeconomic position and extensive financial support measures have resulted in better than initially expected results for Serbian companies on the aggregate level in 2020. In 2020, we found 59 (35 private sector and 23 state and/or LSG companies) zombies out of 380 large companies in the Serbian corporate sector, representing a 15.7 % decrease from the previous year (70 companies). State and/or LSG-owned zombie companies account for app. 40 % of all identified zombie companies, depending on how zombie companies are defined. Our data indicate that Serbian large zombie enterprises were on average 26.3% less productive than their non-zombie peers during the analyzed period. We estimate that the COVID-19 pandemic has reduced the TFP of Serbian large companies in 2020 on average by 3.4%. Furthermore, we find that zombie companies in general are benefiting from the subsidies policy. In the period between 2016 and 2019 almost half of all subsidies were allocated to the large zombie companies alone. However, their share was substantially reduced in 2020.Differences between non-zombie companies and zombie companies are statistically significant in all categories of size, competitiveness, profitability, and productivity. Results show that, financial institutions have an accommodating role in the creation of zombie companies.
CONCLUSION
The state support programs came with a high financial cost. The fiscal deficit grew from -0.2 % to 8.0 % of GDP and the public debt from 52.7% to 57.8% of GDP in 2020. Companies’ exposure to the banking sector as of December 31st, 2020, compared to December 31st, 2019, corresponds to about 9.4% of Serbian GDP in 2020 at current prices. Although the full effect of the COVID-19 induced crisis did not transpire into companies’ financial statements for 2020, it is expected that this impact will be fully visible in the 2021 and 2022 financial statements. Another aftermath of the COVID-19 pandemic is a more pronounced deterioration of Serbian human capital compared to countries with more severe mobility restrictions imposed to curb the spread of the SARS-CoV-2 virus. Once a company becomes a zombie, there is a high probability that it will remain that way for the foreseeable future, showing continued structural productivity, and profitability deficiencies and debt unsustainability. Furthermore, we show that state and/or LSG ownership and low productivity play an essential role in creating zombie companies Moreover, we also found an indication of banks’ behavior that could be explained by the “evergreening” of zombie companies’ loans.
Keywords: zombie companies, COVID-19, debt-at-risk, relief measures
REFERENCES
[1] Banerjee, R., & Hofmann, B. (2020). Corporate zombies: Anatomy and life cycle. BIS Working Papers, 882. [2] Barlevy, G. (2003). Credit Market Frictions and the Allocation of Resources over the Business Cycle. Journal of
Monetary Economics, 50(8), 1795-1818. [3] Caballero, R., Hoshi, T., & Kashyap, A. (2008). Zombie lending and depressed restructuring in Japan. American
Economic Review, 98(5), 1943-1977. [4] IMF, 2020. Country Report No. 20/270 Republic of Serbia August 2020, Washington, D.C.: International
Monetary Fund (IMF). [5] McGowan, A., Andrews, M., & Millot, V. (2018). The walking dead: Zombie firms and productivity performance in
OECD countries. Economic Policy, 33(96), 685-736. [6] Schivardi, F., Sette, E., & Tabellini, G. (2017). Credit misallocation during the European Financial Crisis. BIS
Working Papers, 669. [7] Storz, M., Koetter, M., Setzer, R., & Westphal, A. (2017). Do we want these two to tango? On zombie firms and
stressed banks in Europe. ECB Working Papers, 2104. [8] Wooldridge, J. M. (2009). On estimating firm-level production functions using proxy variables to control for
unobservables. Economics Letters, 104(3), 112-114.

213
THE IMPACT OF THE COVID CRISIS ON MACROECONOMIC INDICATORS OF EU
MEMBER STATES
Miloš Parežanin*1, Milica Bulajić
1, Dragana Kragulj
1
1University of Belgrade – Faculty of Organizational Sciences
*Corresponding author, e-mail: [email protected]
OBJECTIVE
The Next Generation EU Recovery Fund represents a watershed moment in the EU's economic policy coordination. Member states must demonstrate how they propose to address the challenges mentioned in the European Semester's country-specific recommendations (CSRs) using its primary instrument, the Recovery and Resilience Facility (RRF). In the years before the outbreak of COVID-19, the Semester had been fading in popularity, with CSR implementation rates decreasing and public awareness waning (Bokhorst, 2022; Vanhercke & Verdun, 2022). The impact of the crisis has not affected all sectors of the EU27 economy equally. The tourism, transport, automotive and textile industries were the most affected, while the digital and healthcare industries performed well (De Vet et al., 2021). The purpose of the paper is to try to answer research questions: 1) How the COVID pandemic affected the macroeconomic indicators of EU member states; 2) Is there a statistically significant difference in the value of indicators before and after the COVID pandemic; 3) Are there differences in the degree of impact on indicators and is it possible to group countries accordingly; 4) Have the economic policy measures taken by the national governments of the member states and the EU mitigated the consequences of the economic crisis?
METHODOLOGY
The macroeconomic indicators for the 27 EU member states in the period from 2015 to 2021 were analyzed. The following macroeconomic indicators were selected: GDP growth, inflation, unemployment rate and public debt. (IMF, 2022). Descriptive statistics, t-test, ANOVA and cluster analysis were applied to the mentioned data set. The period before and during the COVID crisis was analyzed separately, in order to examine the statistically significant impact on macroeconomic variables. The obtained results were compared with similar studies on the impact of the COVID-19 crisis on the EU27 and the countries of the Western Balkans (Capello & Caragliu, 2021; Bodroža & Lazić, 2021).
RESULTS
GDP fell in 2020 compared to the previous period in all observed countries except Ireland. Inflation recorded the highest growth in 2021, while unemployment increased slightly compared to the period before the COVID pandemic. Public debt has a tendency to increase in 2020 and 2021. Based on these results, the time interval is divided into two subperiods: the period before the COVID pandemic from 2015 to 2018 and the period after the outbreak of the pandemic 2020 to 2021. Due to the discontinuity caused by the outbreak of the COVID pandemic, 2019, in which macroeconomic indicators have a similar tendency as in the years preceding it, was left out of the analysis. Based on the average values for the two subperiods, the paired t-tests show a significant statistical difference in all observed variables. Based on the values of the variables, EU members can be divided into four groups of countries. As Greece showed the worst results among the observed countries, both before
214
and after the outbreak of the pandemic, it is alone in one of the four identified clusters. At a higher level of hierarchical grouping, countries can be divided into two groups.
CONCLUSION
The COVID pandemic has affected the economies of all EU member states, as evidenced by the macroeconomic indicators presented. The economic measures taken both by the individual governments of the member states and at the EU level have partially alleviated the crisis in 2021. Due to trade relations with the EU, similar effects of the crisis are expected on the countries of the Western Balkans (Bulajić et al., 2010).The full effects of the current economic crisis will be seen in the years to come.
Keywords: European Union, COVID, macroeconomic indicators, multivariate data analysis.
REFERENCES
[1] Bodroža, D., & Lazić, M. (2021). Economic Impact of the COVID-19 Pandemic on Western Balkan Countries. Economic Analysis: journal of emerging economics, 54(21), 30-40.
[2] Bokhorst, D. (2022). The Influence of the European Semester: Case Study Analysis and Lessons for its Post‐Pandemic Transformation. JCMS: Journal of Common Market Studies, 60(1), 101-117. DOI:
10.1111/jcms.13266 [3] Bulajić, M., Kragulj, D., & Jednak, S. (2010). Macroeconomic flows in CEFTA countries. In Computational
Intelligence in Business and Economics (pp. 533-540).
[4] Capello, R., & Caragliu, A. (2021). Regional growth and disparities in a post‐COVID Europe: A new normality scenario. Journal of Regional Science, 61(4), 710-727.
[5] De Vet, J. M., Nigohosyan, D., Ferrer, J. N., Gross, A. K., Kuehl, S., & Flickenschild, M. (2021). Impacts of the COVID-19 Pandemic on EU Industries (pp. 1-86). Strasbourg, Francuska: European Parliament.
[6] IMF (2022). World Economic Outlook Database. Retrieved from www.imf.org/en/Data [7] Vanhercke, B., & Verdun, A. (2022). The European semester as Goldilocks: macroeconomic policy coordination
and the recovery and resilience facility. JCMS: Journal of Common Market Studies, 60(1), 204-223. DOI: 10.1111/jcms.13267

215
DEMOGRAPHIC CHANGES IN THE CONTEXT OF THE CROATIAN PENSION
SYSTEM
Denis Buterin1, Bojana Olgić Draženović*
2, Vesna Buterin
2
1The Polytechnic of Rijeka 2University of Rijeka – Faculty of Economics and Business
*Corresponding author, e-mail: [email protected]
OBJECTIVE
In recent decades, the Croatian pension system has undergone numerous reforms and changes, but its functioning is still characterized by insufficient revenues, relatively high contributions, and relatively low pensions. Moreover, the pension level is often perceived as so low that it does not allow beneficiaries to earn a decent living. The dissatisfaction stems from the fact that among today's pension recipients there is a prevailing view that they have taken care of themselves during their working lives by paying contributions into the pension system, which is a consequence of not understanding how the inherited system of generational solidarity works. Moreover, due to the unfavorable demographic situation in Croatia, this system will increasingly run into difficulties, and it will not be possible to repair it or secure its financing in this form. The seemingly surprisingly worrying results of the 2021 census are only the expected consequence of long-term population aging, depopulation, low birth rate and negative net migration. In a broader sense, the consequences will be visible in the pension system, but also in the negative impact on the labor market and the health care system. Therefore, it seemed reasonable to investigate possible economic policy measures to mitigate the effects of an aging population. Most of the studies dealing with the pension system in Croatia refer to the analysis of the capitalized savings in the second and third pillars of the pension system, as well as to the prediction of the future development of funding problems in the first pillar or the intergenerational solidarity. Our contribution is to complement the existing literature by showing the ways to eliminate the negative consequences of population aging in order to promote demographic renewal and the possible increase of pension income.
METHODOLOGY
Demographic trends in Croatia have been unfavorable for several decades, and after Croatia joined the EU, a wave of large-scale emigration began (Ivanda, 2017). One of the most important indicators of population structure by age and aging rate is the age dependency ratio of the elderly. The age dependency ratio is expressed by the number of elderly people per hundred working-age people and shows the utilization of the working-age contingent with the post-working-age contingent. Chart 1 shows changes in the age dependency ratio and estimates of these changes in the future. According to the 2011 population census, there were 26.4 people of working age for every 100 residents. By 2021, it is estimated that the labour force will already be burdened with 33.4 elderly people, about 26.5 percent more than in 2011, and an estimate for 2041 suggests that the system will be completely unsustainable due to high age dependency.

216
Figure 1: Movement of the age dependency coefficient
RESULTS
The empirical findings support the need for policy measures aimed at mitigating the effects of population aging. These policies can take the form of active labour market policies or legal reforms that delay retirement by penalizing early retirement and providing stricter eligibility criteria and incentives for employment above the threshold age (Žokalj, 2017). In this study, we propose some measures for active employment policies aimed at increasing labour force participation and employment rates to reduce the high burden of demographic change in Croatia. We also present some novelties in legislative reforms aimed at preventing early retirement and increasing labour force participation by subsidizing employers who hire citizens older than 65, but most importantly, economic policies that promote demographic renewal.
CONCLUSION
This paper provides insights into the composition and comparative relevance of the demographic effects that explain the difficulties in the functioning of the Croatian pension system. The unfavourable situation of the pension system, with its declining revenues, will put additional pressure on pension expenditures, which must be reflected both in the level of pensions and in the search for other sources of revenue. For all these reasons, a radical or profound change in the functioning of the Croatian pension system is needed. There are a number of possible solutions for a permanent increase in labour productivity and post-retirement employment opportunities. Nevertheless, an active, innovative and long-term approach by a number of institutions can mitigate or even reverse the detrimental impact of demographic trends on the system of intergenerational solidarity in Croatia.
Keywords: demography changes, pension system, age dependency ratio, Croatia
REFERENCES
[1] Ivanda, K. (2017). Demografija Hrvatske: stanje, zablude i perspektive. Političke analize, 8(31), 10-15.
[2] Vukorepa, I. (2015). Lost between Sustainability and Adequacy: Critical Analysis of the Croatian Pension System's Parametric Reform. Revija za socijalnu politiku, 22(3), 279-308. DOI: 10.3935/rsp.v22i3.1307
[3] Werding, M., Primorac, M. (2018). Old-age provision in transition: The case of Croatia. Journal of Pension Economics and Finance, 17(4), 576-593. DOI: 10.1017/S1474747217000166
[4] Žokalj, M. (2016). The impact of population aging on public finance in the European Union. Financial Theory and Practice, 40(4), 383-412. DOI: 10.3326/fintp.40.4.2
50,0
40,0
30,0
20,0
10,0
0,0
census census census census census assess. assess. 1981 1991 2001 2011 2021 2031 2041

217
SHRINKING POPULATIONS AND SUSTAINABLE SOCIO-ECONOMIC
DEVELOPMENT: IS THERE A WAY OUT FROM THE PITFALL?
Danilo Vuković*1
1University of Belgrade – Faculty of Law
*Corresponding author, e-mail: [email protected]
OBJECTIVE
Serbian population is shrinking for decades now. All demographic scenarios point out to future depopulation. This will pose a list of social, economic and policy challenges, from the size of the labor market and pressures on welfare state to unbalanced regional and demographic development. Up to now, the government responded with pronatalist measures while recently it had widened it with targeted housing policies. The objective of this paper is to provide a complex and more nuanced policy paradigm and interventions to address demographic changes ahead of Serbian and many other European societies.
METHODOLOGY
Working on a new UNDP and UNFPA Human Development Report, a multidisciplinary group of scientists agree that the demographic future will still be marked by the need to develop new immigration, labor market and social inclusions policies as well as a more balanced regional development. Drawing on various policy and scientific fields, including demography, sociology of family, labor market and migrations etc., this article offers a new approach in tackling demographic changes.
RESULTS
The new policy paradigm will require a shift from number of inhabitants as a primary policy target, to the issue of “quantity and quality”, that is, an approach that would treat each citizen, among the decreasing poll of them, as a more “valuable resource”. This is the underlying idea of the approach Human Development Report argues, an approach that has been a feature of emerging mainstream thinking among demographers faced with depopulation in the European context. As an editor of the Report, in this article/presentation I demonstrate how the policy approach was developed and how it proposes mainstreaming demographic issues and policy coordination across sectors, highlighting two themes of the conference: Covid-19 and the digitalization.
CONCLUSION
After a two-year pandemic that has radically changed social, as well as individual life, we are gradually entering a period of new challenges to sustainable development in the post-pandemic world. The pandemic brought to light the issues that our economically progressive and technologically advanced civilisation used to ignore, from the biological vulnerability of individuals and societies, to the fragility of the acquired political and civil liberties. At the same time, it rediscovered how strong the ability to adapt is, for both people and institutions, as well as the economy, politics and entire societies. In addition to relatively short-lived and strong shocks, such as the pandemic, our societies are facing quiet changes that are equally difficult, if not more difficult to respond to: from environmental and climate challenges, through digitalisation and erosion of trust in institutions, to demographic changes. They

218
represent a less dramatic, but equally complex test of resilience and adaptability, on which future sustainable development will depend. One of the key such challenges will be balanced demographic development.
Keywords: population dynamics, depopulation, human development, public policy
REFERENCES
[1] Ahlburg, D., & Cassen, R. (2008). Population and Development, in: Dutt, Amitava K. and Jaime Ros (eds.) International Handbook of Development Economics. Cheltenham, UK : Edward Elgar, pp. 316-327.
[2] Antonić, B. (2021), Urbani i prostorni aspekti depopulacije, u: Izveštaj o ljudskom razvoju [3] Arandarenko, M. (2010). Politička ekonomija nezaposlenosti, u: The Political Economy of Unemployment”], in:
Arandarenko, M., Prasčević, A. i Cvejić, S. (ur.) Ekonomsko–socijalna struktura Srbije: učinak prve decenije tranzicije, Beograd: Naučno društvo ekonomista, 71-86.
[4] Arandarenko, M. (2021), Migracije i tržište rada, u: Izveštaj o ljudskom razvoju [5] Arandarenko, M., Aleksić, D., & Lončar, D. (2021). Expansion of direct investment and resilience of Serbian
labour market: A regional and sectoral perspective. Ekonomika preduzeća, 69(3-4), 203-216.
[6] Baizan, P., Arpino, B., & Delclós, C. E. (2016). The effect of gender policies on fertility: The moderating role of education and normative context. European Journal of Population, 32(1), 1-30.
[7] Batog, C. et al. (2019). Demographic Headwinds in Central and Eastern Europe. International Monetary Fund. European Department. Departmental Paper Series No. 19/12. Washington D.D.; International Monetary Fund,
[8] Beunen, R., Meijer, M., & De Vries, J. (2020). Planning strategies for dealing with population decline: Experiences from the Netherlands. Land Use Policy, 93, [104107].
[9] Blagojević-Hjuson, M. (2014). Transformacija roditeljstva: poluperiferijska perspektiva. Sociologija, 56(4), 383-402.
[10] Brinton, M. C., & Lee, D. J. (2016). Gender-role ideology, labor market institutions, and post-industrial fertility. Population and Development Review, 405-433.
[11] Coleman, D., & Rowthorn, R. (2013). Population Decline—Facing an Inevitable Destiny?, u: Ann Buchanan and Anna Rotkirch eds. Fertility Rates and Population Decline. Palgrave Macmillan, London, 82-101.
[12] Coleman, D., & Rowthorn, R. (2011). Who's afraid of population decline? A critical examination of its consequences. Population and development Review, 37, 217-248
[13] Gauthier, A. H. (2013). Family Policy and Fertility: Do Policies Make a Difference?, u: Ann Buchanan and Anna Rotkirch eds. Fertility Rates and Population Decline. Palgrave Macmillan, London, 269-288.
[14] Golić, R., & Joksimović, M. (2017). Regionalization of Serbia as an instrument of balanced regional development and reduction of regional inequalities. Zbornik radova-Geografski fakultet Univerziteta u Beogradu 65-1a, 209-226.
[15] Harper, S. (2013). Falling Fertility, Ageingand Europe’s Demographic Deficit, u: Ann Buchanan and Anna Rotkirch eds. Fertility Rates and Population Decline. Palgrave Macmillan, London, 221-230.
[16] Head, B. W. (2008). Wicked problems in public policy. Public policy, 3(2), 101-118. [17] Knil, K., & Tosun, Dž. (2021). Javne politike: novi uvod. Beograd: Dosije studio, Univerzitet u Novom Sadu i
SeConS. [18] Head, B. W., & Alford, J. (2015). Wicked problems: Implications for public policy and management.
Administration & Society, 47(6), 711-739. [19] Holzmann, R. (2002) Can investments in emerging markets help to solve the aging problem?. Journal of
Emerging Market Finance, 1, 215-241. [20] Hospers, G. J., & Reverda, N. (2014). Managing population decline in Europe's urban and rural areas. Springer,
2014. [21] Hospers, G. J., & Reverda, N. (2014). Managing population decline in Europe's urban and rural areas. Springer. [22] www.mdpp.gov.rs/doc/strategije/Strategija-podsticanja-radjanja-2018.pdf [23] Joksimović, M., & Golić, R. (2017). Indicators of Regional Inequality in Serbia. Collection of Papers - Faculty of
Geography at the University of Belgrade 65 (1a): 227-249 [24] Kostić, S. (2017). Kako poreski sistem diskvalifikuje obrazovanje u Srbiji? Mons br. 2, www.mons.rs [25] Lutz, W. (2014). A Population Policy Rationale for the Twenty-First Century. Population and Development
Review, 40(3), 527-544
[26] Lutz, W. (2014). Epilogue: With Education the Future Looks Different, u: Wolfgang Lutz, William P. Butz, and Samir KC (eds.) World Population And Human Capital In The Twenty-First Century. Oxford University Press
[27] Lutz, W., & Gailey, N. (2020). Depopulation as a Policy Challenge in the Context of Global Demographic Trends. Belgrade: UNDP,
[28] Malmberg, B., Lindh, T., & Halvarsson, M. (2008). Productivity consequences of work-force aging: Stagnation or Horndal effect?. Population and Development Review, 34(Supp.), 238-256.
[29] Matković, G. (2021). Izazovi starenja, u: Izveštaj o ljudskom razvoju [30] Myrskylä, M., & Margolis, R. (2014). Happiness: Before and after the kids. Demography, 51(5), 1843-1866. [31] Nikitović, V. (2019). U susret regionalnoj depopulaciji u Srbiji. Beograd: Institut društvenih nauka [32] Nikitović, V. (2018). Značaj političkog odgovora za demografksu budućnost Srbije, u: Kostić, Vladimir, Slavica
Đukić Dejanović, & Mirjana Rašević (ur.) Ka boljoj demografskoj budućnosti Srbije. Beograd: SANU i Institut društvenih nauka, 210-221.

219
[33] Nikitović, V. (2021), Složena priroda depopulacije u Srbiji: najnoviji podaci i trendovi, u: Izveštaj o ljudskom razvoju.
[34] Nikitović, V., Arsenović, D., Sekulić, A., & Bajat, B. (2019). Is the Second Demographic Transition a useful framework for understanding the spatial patterns of fertility change in Serbia at the beginning of the 21st century?. AUC GEOGRAPHICA, 54(2), 152-167
[35] Nikolić, I., Bajec, J., & Pejin Stokić, Lj. (2018). Zaposlenost u svetlu bržeg ekonomskog razvoja, u: Кostić, Aleksandar (ur.) Ekonomija: zaposlenost i rad u Srbiji u XXI veku, Beograd: SANU, 227-251.
[36] Nussbaum, M. (2006). Education and democratic citizenship: Capabilities and quality education, Journal of Human Development, 7(3), 385-295
[37] Pavlović Babić, D. (2021). Obrazovanje, humani kapital i depopulacija, u: Izveštaj o ljudskom razvoju [38] Peters, B. G. (2017). What is so wicked about wicked problems? A conceptual analysis and a research
program. Policy and Society, 36(3), 385-396. [39] Petrović, J. (2021). Prirodno okruženje, klimatske promene i depopulacija u Srbiji, u: Izveštaj o ljudskom razvoju [40] Poper, K. (1993). Otvoreno društvo i njegovi neprijatelji, knj. I&II, Beograd: BIGZ [41] Rašević, M. (2018). Kriza rađanja u Srbiji: noviji uvidi, u: Kostić, Vladimir, Slavica Đukić Dejanović i Mirjana
Rašević (ur.) Ka boljoj demografskoj budućnosti Srbije, Beograd: SANU, 24-52 [42] Rašević, M., & Đukić Dejanović, S. (2018). Politički odgovor na demografske izazove, u: Kostić, Aleksandar (ur.)
Zaposlenost i rad u Srbiji u XXI veku. Beograd, SANU: 73-93 [43] SeConS (2018). Namenski transferi. Beograd: SeConS [44] SeConS (2019). Assessment of the current state and needs for social services in five counties (Srem, South
Banat, Mačva, Kolubara, and Zlatibor). Report prepared for Deutche Gesellschaft für Internationale Zusammenarbeit (GIZ) under the “Social Services for Vulnerable Groups” Project. Belgrade: SeConS
[45] SeConS&Dornier (2019). Gender Equality in Transport in Serbia. Belgrade: SeConS&Dornier Consulting. Retrieved from www.secons.net/files/publications/111-publication.pdf
[46] Heckman, J. J. (2007). Skill Formation and the Economics of Investing in Disadvantaged Children, Science, 312(5782), 1900-1902.
[47] Sobotka, T. (2011). Reproductive Decision Making in a Micro-Macro Perspective (REPRO). Synthesis and Policy Implications. European Demographic Research Papers. Vienna: Austrian Academy of Sciences. Retrieved from www.oeaw.ac.at/fileadmin/subsites/Institute/VID/PDF/Publications/EDRP/edrp_2011_01.pdf
[48] Stamenković, M., & Savić, M. (2017). Measuring regional economic disparities in Serbia: Multivariate statistical approach. Industrija, 45(3), 101-130.
[49] Stamenković, Ž. (2021). Depopulacija i javno zdravlje, u: Izveštaj o ljudskom razvoju [50] Stanojević, D. (2021). Odgovor na izazov depopulacije iz perspektive porodičnog života - da li je moguće
povećanje fertiliteta?, u: Izveštaj o ljudskom razvoju [51] UN (2019). World Population Prospects. Highlights. New York: United Nations [52] UN (2021). Global Population Growth and Sustainable Development. New York: United Nations. Retrieved from
www.un.org/development/desa/pd/sites/www.un.org.development.desa.pd/files/undesa_pd_2022_global_population_growth.pdf
[53] UNDP (1990). Human Development Report. Oxford University Press [54] Uvalić, M., & Bartlett, W. (2021). Regional disparities and regional development policies in Serbia. Belgrade:
Friedrich Ebert Stiftung. [55] Van Dalen, H. P., & Henkens, K. (2011). Who fears and who welcomes population decline?. Demographic
Research, 25, 437-464.
[56] Vuković, D. (2017). Da li obrazovni sistem u Srbiji "radi" za neku decu, a protiv druge?. Mons br. 2, [57] Vuković, D. (2017). Preoblikovanje neoliberalizma. Socijalna politika u Srbiji. Novi Sad: Mediterran [58] Živanović, Z., & Gatarić, D. (2017). Differences in regional development on the territory of the Republic of
Serbia. Bulletin of Geography. Socio-economic Series, 35(35), 145-154.

220

221
LEAN BUSINESS SYSTEMS – STRUCTURES, PROCESSES
AND MODELS

222
KEY PERFORMANCE INDICATORS IN INDUSTRIAL HUMAN-ROBOT
COLLABORATION
Carlo Caiazzo*1, Snežana Nestić
1, Marija Savković
1
1University of Kragujevac – Faculty of Engineering
*Corresponding author, e-mail: [email protected]
OBJECTIVE
The modern business environment has imposed the need for continuous measurement and performance management to improve overall efficiency and achieve competitive advantages. Advanced Industrial Revolution 4.0 (IR4.0) technologies have benefited in many companies through reduced production costs, increased efficiency and productivity, and improved product quality. Collaborative robots (cobots), as one of the most innovative technologies of Industry 4.0, have been increasingly used during various phases of the assembly process. Cobots take on detailed, dangerous and strenuous activities and, in this way, create a safer and more efficient workplace, enhancing productivity (Galin et al., 2020). As a result, human-robot collaboration (HRC) has gone beyond the traditional concept of performing assembly tasks in manufacturing systems. Research studies have confirmed that collaborative activities may improve the efficiency and productivity of companies with a positive impact on improving the health of workers (Papanastasiou et al., 2019; Zanchettin et al., 2019). However, despite the wide potential of cobots, their improper usage has led to losses and waste in terms of efficiency and costs, reducing operator satisfaction and confidence. To successfully overcome these challenges, there is a need to identify, select and systematize the main key performance indicators (KPIs) related to HRC to enhance effectiveness, efficiency, productivity, competitiveness, and processes times. Specifically, it is crucial not only to consider economic and organizational performance, but also workplace safety and health performance. Thus, the research of KPIs in HRC contributes further to improving the performance management of HRC. The motivation for this research to find the proper KPIs in the design of an HRC according to different aspects of the business.
METHODOLOGY
Dynamic changes in the modern business environment caused by the advanced technologies impose the need to adopt KPIs for long-term effective management of HRC effects. These KPIs consider the efficiency of the HRC itself and the economic efficiency and effectiveness of a HRC solution. The monitoring of defined performance indicators should provide complete information about the observed phase and improvement of the planning phase management (Rajković et al., 2020). Recent studies have recommended considering the appropriate measurement of performance for an efficient HRC as an inadequate usage may be contrary to the goals and strategies of the company (Zimmermann 2017; Chromjakova et al., 2021). This paper provides a systematic classification and comparative analysis of KPIs related to HRC in manufacturing systems from several research papers.
RESULTS
The research paper focuses on the review of KPIs in a HRC environment. Considered KPIs are classified according to general, economic, workplace safety, and ergonomics aspects and are presented in Table 1.
CONCLUSION
This paper presents an overview of KPIs applied to HRC in manufacturing systems. It needs to be clear that there is not a defined set of general KPIs for each company, but KPIs are determined according to the

223
company’s goals. The performance optimization of the robotic cell is a continuous process. Future research directions will be focused on the choice and detailed analysis of proper KPIs related to safety and ergonomics aspects in HRC. Table 1: KPIs in HRC
Authors General aspects Economic aspects
Workplace safety aspects
Ergonomics aspects
Papanastasiou et al. (2019)
Workstation cycle time
Return Of Investment
(ROI)
Left and right side–cycle deviation
Operators’ average saturation level
Zimmermann (2019)
Job Execution Time; Actuation Latency; Pose Travel Time.
Cost of Robot Energy
Consumption
Position Accuracy; Position;Repeatability.
Galin et al. (2020)
The implementation time of a task;
Energy expended by the robot
Speech and physical contact;
The pathtrail of the robot
Emotional and cognitive
components of behavior;Visual perception of a
robot by a human Zanchettin (2019)
Accuracy of the operator
Time required to perform the
task
Rate of assistance given by the robot
Value of displacement
from the ergonomic
posture Chromjakova et al. (2021)
Availability of a continuous
production flow by “human-cobot” workplace;Lead
Time; Data complexity
index
System incident reaction time
Human-cobot ethical cooperation
factor
Keywords: performance measurement, KPIs, IR4.0, HRC, cobot
REFERENCES
[1] Chromjakova, F., Trentesaux, D., & Kwarteng, M. A. (2021). Human and Cobot Cooperation Ethics: The Process Management Concept of the Production Workplace. Journal of Competitiveness.
[2] Galin, R. R., Meshcheryakov, R. V., Kamesheva, S., & Samoshina, A. (2020). Cobots and the benefits of their implementation in intelligent manufacturing.
[3] Papanastasiou, S., Kousi, N., Karagiannis, P., Gkournelos, C., Papavasileiou, A., Dimoulas, K., Baris, K., Koukas, S., Michalos, G., & Makris, S. (2019). Towards seamless human robot collaboration: integrating multimodal interaction. The International Journal of Advanced Manufacturing Technology, 1-17.
[4] Rajković, T., Đorđević Milutinović, L., & Lečić-Cvetković, D. (2020). Spreadsheet Model for Determining Adequate Performance Indicators of Production Management. Management:Journal Of Sustainable Business And Management Solutions In Emerging Economies, 25(3), 13-22. DOI: 10.7595/management.fon.2020.0011
[5] Zanchettin, A. M., Lotano, E., & Rocco, P. (2019). Collaborative Robot Assistant for the Ergonomic Manipulation of Cumbersome Objects. 2019 IEEE/RSJ International Conference on Intelligent Robots and Systems (IROS),
6729-6734. [6] Zimmermann, T. A. (2017). Metrics and Key Performance Indicators for Robotic Cybersecurity Performance
Analysis. National Institute of Standards and Technology. DOI: 10.6028/NIST.IR.8177

224
IMPLEMENTING LEAN MANUFACTURING TOOLS: THEORY AND PRACTICE
Nelson Areias1, Wellington Alves*
2, Jorge Garcia
3
1Instituto Politécnico de Viana do Castelo
2CIICESI, Escola Superior de Tecnologia e Gestão, Politécnico do Porto 3ADiT-LAB, Instituto Politécnico de Viana do Castelo and INESC TEC
*Corresponding author, e-mail: [email protected]
OBJECTIVE
Logistics activities are well-known as part of supply chain management which is that is responsible for planning, implementing, and controlling, in an efficient and effective way, the flows of goods, services, and related information, from the point of origin to the point of origin, in order meeting customer requirements and needs. Nonetheless, due to the possibility to minimize costs through its operations, these activities can be considered as strategic for several industrial sector, which means that there is a need to companies operate in efficient manner, avoiding then any type of waste in their activities (Rushton et al., 2022). According to Maware et al., (2021) and Rushton et al., (2022), nowadays, companies ranging from services to production have increasingly recognized the importance to well manage their supply chains, since it can bring a competitive advantage, and provide more agility and flexibility in responding to expectations in an everchanging global market. Due to this challenge task, namely to manage activities in the different levels of the supply chain, the Lean Manufacturing philosophy pop up as an approach which can support companies on dealing with the existing resources expenditures, focusing on getting economic value to customers through eliminating any waste in the activities. This philosophy has been widely implemented in several industries to improve performance and competitiveness (Primo et al., 2021). Having in mind the importance of Lean Manufacturing, this study proposes the use of a set of practices to be considered when implementing the Six S, these practices tend to contribute to improve efficiency in the activities of a Portuguese company.
METHODOLOGY
In this research a case study was used as a methodological strategy, and the case of a company operating in the northern region in Portugal was selected to illustrate the theory and practice on developing good practices to support the implementation of Six S tool in the company. This methodology allowed to understand the differences between the theoretical and practical approach on implementing it, and also the motivation of the company to implement the proposed tool in detail, enabling a richer understanding of the reasons behind its implementation.
RESULTS
Results from the case study showed that despite the analyzed company do not have the SIX S tool officially implemented, they already have in practice the fundamentals of the approach, namely the routine of trying to keep the work areas clean and organized as possible, having informative displays in the production work area, the use of visual management tools such as signs, labels and adhesive marking tapes to identify work areas, walkways, and storage places. Yet, the presented practices are not fully documented and standard, which is difficult to the company to manage and asses the benefits of it. In this context, to support the official implementation of Six S (6S), in this research a set of activities were proposed and developed. Activities such as red tags to support sorting,

225
a 6S audit planning worksheet to produces informative graphics on planned and performed audits; checklists for 6S audits, referring to each type of work area (office, production, and warehouse); and a spreadsheet for the results of each area with the elaboration of an evolution graph were developed as presented in Figure 1.
Figure 1: Action plan for implementing Six S tool
Figure 1 illustrates the action plan with information on implementing each 6S, it was developed aiming to support the implementation and maintenance of the tool, which will serve as the central base from for the next standardize the tool in the company, since all informative resources needed related to Six S are now well establishing. The proposed action plan will support the company and employees to improve efficiency in areas such as production.
CONCLUSION
In this research a set of good practices to implement a Lean manufacturing tool was developed and proposed to be used by a Portuguese company. Due to complexity and variety of activities developed by the company, as well the challenges faced by managers to organize the activities in efficient way, an action plan for 6S implementation was developed through a dashboard tool, and a set of practices was proposed. From the many methodologies and lean tools available, the Six S approach was selected to be implemented due to its contribution to be easily implemented, and also to draw the company an overview of the activities developed. The work developed contributed to support the company on implementing an official version of the 6S approach (safety was considered in all steps inf the implementation), and the efficiency of the company are now measured considering information from the implemented approach. This work aimed to build the first attempt on considering the Lean Thinking in the company, and the results showed that as it is when standardizing the 6S tool, it can contribute to better measure and understand the efficiency in the production activities in the light of a well-know approach as Lean Thinking.
ACKNOWLEDGEMENTS
This work has been supported by national funds through FCT- Fundação para a Ciência e Tecnologia through project UIDB/04728/2020 (Alves). This research was part of intership report of the student Nelson Areias.
Keywords: lean manufacturing, Six S, Portugal
REFERENCES
[1] Maware, C., Okwu, M. O., & Adetunji, O. (2021). A systematic literature review of lean manufacturing implementation in manufacturing-based sectors of the developing and developed countries. International Journal of Lean Six Sigma. DOI: 10.1108/IJLSS-12-2020-0223
[2] Primo, M. A. M., DuBois, F. L., de Oliveira, M. de L. M. C., Amaro, E. S. D. de M., & Moser, D. D. N. (2021). Lean manufacturing implementation in time of crisis: the case of Estaleiro Atlântico Sul. Production Planning & Control, 32(8), 623–640. DOI: 10.1080/09537287.2020.1747655
[3] Rushton, A., Croucher, P., & Baker, P. (2022). The handbook of logistics and distribution management: Understanding the supply chain. Kogan Page Publishers.
Company
A

226
IMPLICATIONS OF LEAN IN CONTEXT OF NON-REPETITIVE MANUFACTURING ON
LENSES OF LEAN: A REVIEW
Ivan Tomašević*1, Dragoslav Slović
1
1University of Belgrade - Faculty of Organizational Sciences
*Corresponding author, e-mail: [email protected]
OBJECTIVE
Lean was derived from observing business practice, meaning that research (both early and recent) is phenomenon-driven rather than theory-driven (Cusumano et al., 2021). Lean theory is mainly developed through observation of practice. As practice often comes from case-specific reports, it is difficult to distill a common theory that will be universally applicable and unambiguous. This ambiguity is amplified when these reports come from contexts different to the one lean was originally devised in, i.e. repetitive manufacturing with limited variability. This often stems from the fact that many ‘non-lean’ phenomena are observed differently in a specific environment. Recent articles spurred the debate of what (or if there) is a good lean theory (e.g. Åhlström et al., 2021; Browning & De Treville, 2021). Hopp & Spearman (2021) proposed their view of lean theory based on four lenses of lean, namely process lens, flow lens, network lens, and organizational lens. The aim of this paper it to test if this view of lean is good enough to cover lean implementation in a complex manufacturing environment, i.e. non-repetitive manufacturing.
METHODOLOGY
For the purpose of this research, the authors followed a systematic literature review procedure as proposed by Tranfield et al. (2003). For research, two abstract and citation databases were used, namely Scopus and Web of Science. The search was limited to articles and articles in press published in English in peer-reviewed international journals. Authors used two sets of keywords in order to capture the heterogeneity of both lean and non-repetitive manufacturing. The following search criterion was used: ‘lean’ OR ‘Toyota Production System’ OR ‘TPS’ OR ‘World Class Manufacturing’ OR ‘WMC’ AND ‘job shop’ OR ‘make to order’ OR ‘engineer to order’ OR ‘high mix low volume’ OR ‘high variety’ OR ‘non-repetitive’. The search yielded 296 articles, reduced later to 126 articles through various phases of filtering.
RESULTS
The results show that different lenses of lean are covered to a different extent in the context of non-repetitive manufacturing. The process lens is discussed the most, as lean is often equated with value creation through waste elimination. The contextualization of both value and waste is lacking, as different things are valued in repetitive and non-repetitive manufacturing (this also holds for waste as a negation of value). Companies often pursue efficiency through waste elimination, mainly by assimilating characteristics of a non-repetitive manufacturing system to the ones of repetitive manufacturing. Within these efforts, effectiveness is often overlooked, as it is in Hopp & Spearman (2021), although it is often highly valued by customers in non-repetitive manufacturing. Flow lens is discussed to a lesser extent, surprising as variability is inherent in non-repetitive manufacturing. As strategic variability is a source of competitive advantage among non-repetitive manufacturers, choosing the appropriate buffering option is a very important managerial task. However, buffer management is rarely addressed in the literature. Network lens remains under-addressed, as only few authors recognize the importance of wider systems thinking, i.e. extending lean initiatives outside the shop floor. Organizational lens remains un-addressed, as none of the authors focus on organizational transformation needed for lean transformations to be sustainable.
227
CONCLUSION
The view of lean as proposed by Hopp & Spearman (2021) describe underlying mechanisms that might facilitate both the way lean is understood and implemented in non-repetitive manufacturing environment, as it can elevate lean implementation above reductionist approach of waste elimination. Thatis often achieved through assimilation of non-repetitive manufacturing systems to repetitive ones in order to facilitate waste elimination. While the results confirm the stance that waste and value should be contextualized, they also suggest that efficiency might not be the sole goal of lean, as specificities of non-repetitive manufacturing stress the importance of effectiveness as equal part of value as perceived by customer. In addition, inherent variability in supply and demand, as well as in the ways of connecting one with the other, require addressing buffer management as the component of lean highly significant on non-repetitive environment.
Keywords: lean, non-repetitive manufacturing, lean theory, lenses of lean
REFERENCES
[1] Åhlström, P., Danese, P., Hines, P., Netland, T. H., Powell, D., Shah, R., Thürer, M., & Van Dun, D. H. (2021). Is lean a theory? Viewpoints and outlook. International Journal of Operations & Production Management.
[2] Browning, T. R., & De Treville, S. (2021). A lean view of lean. Journal of Operations Management, 67(5), 640-
652. [3] Cusumano, M. A., Holweg, M., Howell, J., Netland, T., Shah, R., Shook, J., Ward, P., & Womack, J. (2021).
Commentaries on “The Lenses of Lean”. Journal of Operations Management, 67(5), 627-639. [4] Hopp, W. J., & Spearman, M. S. (2021). The lenses of lean: Visioning the science and practice of efficiency.
Journal of Operations Management, 67(5), 610-626. [5] Tranfield, D., Denyer, D., & Smart, P. (2003). Towards a methodology for developing evidence‐informed
management knowledge by means of systematic review. British Journal of Management, 14(3), 207-222.

228
MEASURING THE SUCCESS OF LEAN ORGANIZATIONS THROUGH TRIPLE
BOTTOM LINE FRAMEWORK
Milena Gatić*1, Barbara Simeunović
1, Ivona Jovanović
1
1University of Belgrade – Faculty of Organizational Sciences
*Corresponding author, e-mail: [email protected]
OBJECTIVE
This paper aims to investigate the possibilities for adopting Triple bottom line (TBL) framework in Lean organization. The TBL framework, proposed by Elkington (1998), is used to track and report sustainability indicators related to Corporate Social Responsibility (CSR). As a framework, TBL includes an economic bottom line (profit), an environmental bottom line (planet) and a social bottom line (people). As Elkington (1998) explains, the traditional measure (net profit) is not valid enough for measuring companies' success. As Lean has proven itself as one of the most successful approaches for organising company operations (Kirin et al., 2022; Knol et al., 2018), it is interesting to explore how all three aspects of sustainability are tied to lean practices. According to Simeunović et al. (2012), lean represents a systematic approach to identifying and eliminating elements not adding value to the process. However, a lack of reporting is found when researching the implementation of sustainability throughout lean organizations. This study aims to fill the gap of research scarcity surrounding sustainability indicators in lean organizations, and examine if and how can TBL be used as a framework for lean organizations to track their sustainability aspirations.
METHODOLOGY
According to Fischl et al (2014) a systematic literature review contributes to the relevance and rigour of research. As a result, a systematic literature evaluation was carried out in order to answer the following research question: If and how could lean practices be tied to Triple bottom line framework? Several keyword combinations were used to find as many relevant publications as available. All of the keywords have to do with sustainability and lean, but because of the nature of the topic, three sets of keyword combinations were used: (1) lean (environment, pollution, waste, energy efficiency) related to first P of TBL – Planet; (2) lean (financial, profit, KPI’s) related to second P – Profit; (3) lean (people, HR, culture, leadership) related to the third P– People. The study criteria attempted to eliminate papers that were not directly relevant to the research issue. The search was limited to abstracts, keywords and titles. Scopus database was used in search for related published papers. The final sample contained 87 articles that were examined in detail. To mitigate subjectivity, papers were reviewed by multiple researchers, and results were regularly cross-checked (Tomašević et al., 2020).
RESULTS
Among the analyzed articles, 7 consider all three bottom lines of TBL, and 87% of articles focus on one or two sides of the TBL in lean context. Profit bottom line was considered in 69% of articles. When exploring profit, costs, quality, waste reduction, productivity and ROI were taken into considerations. Nearly 47% of papers at least mention metrics related to planet (environmental bottom line) and were focused on waste

229
elimination, energy efficiency and pollution. However, less than 20% of papers included social aspect (people) of TBL. These papers refer to the health and safety of workers, their teamwork and development.
CONCLUSION
Main goal of this paper was to examine if lean organizations could use TBL framework to trace their sustainability aspirations. This research shows that two of three pillars, planet and profit, are completely aligned with lean organization’s principles, which could give lean organizations advantage in changing, CSR oriented, markets. On the other hand, although insufficiently researched, the people pillar doesn’t yield the same positive results as the previous two. This leads to a contradiction because the core of lean are continuous improvement, respect for people and teamwork. Thus, social aspects of lean organizations and their reporting through TBL framework should be the subject of additional research.
Keywords: lean, TBL, profit, planet, people
REFERENCES
[1] Elkington, J. (1998). Accounting for the triple bottom line. Measuring Business Excellence, 2(3), 18-22. DOI: 10.1108/eb025539
[2] Fischl, M., Scherrer-Rathje, M., Friedli, T. (2014). Digging deeper into supply risk: a systematic literature review on price risks. Supply Chain Management: An International Journal, 19(5/6), 480-503. DOI: 10.1108/scm-12-2013-0474
[3] Kirin, S., Vučetić, I., Vasojević, N., Kirin, S. (2022). Lean Tools for Improving the Teaching Process in Serbia - Empirical Research. Management. Journal Of Sustainable Business And Management Solutions In Emerging Economies, 27(1), 1-10. DOI: 10.7595/management.fon.2020.0013.
[4] Knol, W. H., Slomp, J., Schouteten, R. L. J., Lauche, K. (2018). Implementing lean practices in manufacturing SMEs: testing “critical success factors” using Necessary Condition Analysis. International Journal of Production Research, 56(11), 3955-3973. DOI: 10.1080/00207543.2017.141958
[5] Simeunović, B., Stojanović, D., Tomašević, I., Radović, M., Slović, D. (2012, September). Lean Implementation in Transitional Countries: Case of Serbia. In International Conference - IS2012: Innovation for Sustainability, Universidade Lusiada.
[6] Tomašević, I., Stojanović, D., Slović, D., Simeunović, B., Jovanović, I. (2020). Lean in High-Mix/Low-Volume industry: a systematic literature review. Production Planning & Control, 32(12), 1004-1019. DOI: 10.1080/09537287.2020.178209

230
LEAN PLANNING - THE IMPORTANCE OF CHOOSING THE ESTIMATION
TECHNIQUE THAT WILL FIT PROJECT NEEDS
Nikola Vojtek*1, Bojan Smuđa
2
1Daon d.o.o.
2Shared Mobility d.o.o.
*Corresponding author, e-mail: [email protected]
OBJECTIVE
One of the main challenges that companies are facing in the last few years is resource allocation and planning. Since the majority of companies introduced the remote working practice, nowadays it is even harder to achieve excellence in operational results and to deliver the requirements to the customers and stakeholders in a timely manner and meet acceptance criteria. Some mishaps that are even more highlighted in the remove environment could be: poor initiation, wrong estimation, lack of clear objective, failure to communicate properly and everything done by one individual. When it comes to the estimation errors, using irrelevant or inaccurate analogies and historical data generates inaccurate estimates, as well as complexity of issues being estimated (Kolychev & Bezmenskii, 2018). Project estimation techniques help project managers accurately estimate essential elements, such as cost and scope, within their projects. In Agile IT operations, these techniques can be used to properly plan for resource allocation. In the book Agile Estimating and Planning (2005), Mike Cohn is explaining the philosophy of agile estimating and planning and using the real-world examples and case studies, he provides the guidelines and shows how to get the job done. Following this path of one of the main contributors in agile and scrum domain, the first objective of this paper is to review the existing estimation techniques that are widely used by companies for project management. One of the main challenges that companies and teams are facing in the last few years is that planning is totally detached from reality (Usman et al., 2014). Failures happen on the first step when the reason why we do something is not understood and we do something just like all the others are doing it. Simply said, many companies are trying and tending to simply copy approach or methodology and to apply it to its operations. As highlighted by Trippa and Armstrong (2018) companies are combining the practices from several agile methodologies to serve their needs, operations and specific situations. Considering this, the second objective of this paper is to highlight pros and cons of the chosen estimation techniques and provide use cases for which the techniques could be a good fit.
METHODOLOGY
The main objective of this research was to analyze the usage of the existing estimation techniques and how they are applied in project management. This is achieved by collecting and reviewing different papers that describe practical and theoretical application of estimation techniques in different domains, and by highlighting use cases and specific scenarios.
CONCLUSION
The main findings of this research are: (1) covering both relative (arbitrary) and absolute (real) estimation techniques that are mostly used is agile, scrum and project management context; (2) pointing out size and

231
accuracy metrics which are mostly applied; (3) defining what are the most important drivers when it comes to making a decision which estimation technique should be used. Although this review is not final, it can be considered as a valid guide to explore the opportunities and possibilities, as well as how existing estimation techniques could be used for managing projects and achieving excellence in operational results and in delivery of the requirements to the requested parties. In conclusion of this paper, fields for further research were identified.
Keywords: estimation techniques, scrum, project management
REFERENCES
[1] Cohn, M. (2005). Agile Estimating and Planning. Upper Saddle River, NJ: Pearson Education. [2] Kolychev, V., & Bezmenskii, N. (2018). Estimation of the tasks complexity for large-scale high-tech projects
using Agile methodologies. Procedia Computer Science, 145, 266-274. DOI: 10.1016/j.procs.2018.11.057. [3] Sutherland, J. (2015). Scrum: The Art of Doing Twice the Work in Half the Time. Crown Business Publications. [4] Trippa, J. F., & Armstrong, D. J. (2018). Agile Methodologies: Organizational Adoption Motives, Tailoring, and
Performance. Journal of Computer Information Systems, 58(2), 170-179 [5] Usman, M., Mendes, E., Neiva, F., & Britto, R. (2014). Effort Estimation in Agile Software Development: A
Systematic Literature Review. ACM International Conference Proceeding Series. DOI: 10.1145/2639490.2639503.

232
MANAGEMENT AND EMPLOYEE INFLUENCE ON LEAN TRANSFORMATION
Ivona Jovanović*1, Dragana Stojanović
1, Milena Gatić
1
1University of Belgrade – Faculty of Organizational Sciences
*Corresponding author, e-mail: [email protected]
OBJECTIVE
Due to the expanded transformation of Lean approach, the decisions of management within a company have an immense impact on companies goals and desired results. This research aims to investigate the set of initiatives which contribute the most on fulfillment of Lean goals and which can lead to the success of lean transformation program in companies. This set of factors was measured through two perspectives: initiatives of management and initiatives of employees for Lean transformation. An online questionnaire was used to collect information from participants about the success of Lean approach in their company. The respondents were also asked to signify different aspects of additional factors, such as ownership structure, company size and industry. The results highlight the importance of strong management support for Lean transformation and announcing the role to each employee in the transformation. Also, the results have shown that the expectation for Lean success is most influenced by the respect of management to company goals, strategies and priorities concerning the lean transformation. This study recognizes key problems within lean transformation and can help practitioners identify and overcome obstacles in Lean transformation and quickly respond to challenges. Lean transformation can be defined as the organization's effort to embrace Lean to achieve continuous improvement, reduce costs, increase efficiency, and improve value for the consumer by eliminating anything that does not contribute to creating value to a customer (Marshall, 2014). One of the characteristics of Lean transformation is that the costs are relatively low and that improvements are achieved primarily through better use of resources that the company already has. Also, it embraces an organizational transformation throughout the company (Harmon, 2010). According to researches’ opinions in this field (Stojanović et al., 2019; Kirin et al., 2022), Lean implementation in Serbia represents a successful method for process improvement for various manufacturing and service companies, and also educational institutions. Despite that there is much empirical research on how Lean affects on effectiveness and efficiency of the company, there has been a deficiency of practical studies about Lean transformation success in companies. Therefore, this approach could be interesting for companies operating in transition economies with limited resources. Also, this study represents a continuation of previous research, which examined the impact of key process improvement factors on the fulfilment of organizational goals.
METHODOLOGY
This study aims to investigate the influence of different management and employee initiatives on the success of Lean transformation, and which initiatives assure that companies can achieve desired results. This research was conducted to investigate which key indicators contribute to the fulfillment of Lean goals and whether the Lean transformation met employees expectations. Two questions related to this research were defined:
1. Which management and employees initiatives contribute the most to success of Lean transformation in companies?
2. Which management and employees initiatives have a positive impact on fulfillment of Lean transformation goals in companies?

233
In order to answer on these questions, an online questionnaire was conducted. This was a part of expanded research about Business process management and Lean transformation practice. The proposed model is presented in the Figure 1.
Figure 1: Proposed model of the key factors for Lean transformation
RESULTS
The research was completed by analyzing the data from the questionnaire, where 82 answers were received. Spearman-rho correlation test was used to determine whether there is a correlation between the degree of management and employee initiatives with the degree of fulfilment of Lean transformation goals and the degree of the success of Lean transformation. According to the results, the key indicators for the success of Lean transformation are support form management with budget, resources and activities, so as the ability of management to identify and overcome obstacles to Lean transformation. The results show that management initiatives have a higher impact on Lean transformation than employee initiatives.
CONCLUSION
The results can contribute to our understanding of how companies use their resource and people for Lean transformation and effectively improve their performance and be more successful. The findings of this research are presented through practical recommendations for companies that want to be more successful in achieving the success of Lean Transformation. Future research could include different statistical tools for data analysis and other variables to obtain a broader picture of Lean transformation.
Keywords: lean transformation, success, employees, management
REFERENCES
[1] Harmon, P. (2010). The Scope and Evolution of Business Process Management. Handbook on Business Process Management, 1, 37–81.
[2] Kirin, S., Vučetić, I., Vasojević, N., & Kirin, S. (2022). Lean Tools for Improving the Teaching Process in Serbia - Empirical Research. Management: Journal Of Sustainable Business And Management Solutions In Emerging Economies, 27(1), 1-10. DOI: 10.7595/management.fon.2020.0013
[3] Marshall, D. A. (2014). Lean Transformation: Overcoming the challenges, managing performance, and sustaining success. Theses and Dissertations--Marketing and Supply Chain.
[4] Stojanović D., Jovanović I., Slović D., Tomašević I., & Simeunović B. (2019). BPM Adoption in Serbian Companies. Business Process Management: Blockchain and Central and Eastern Europe Forum. Lecture Notes in Business Information Processing, 361, 324-327.
Management
initiatives
Employees
initiatives
The success of Lean
transformation
C
1
C
2
C
3
C
4
C
5
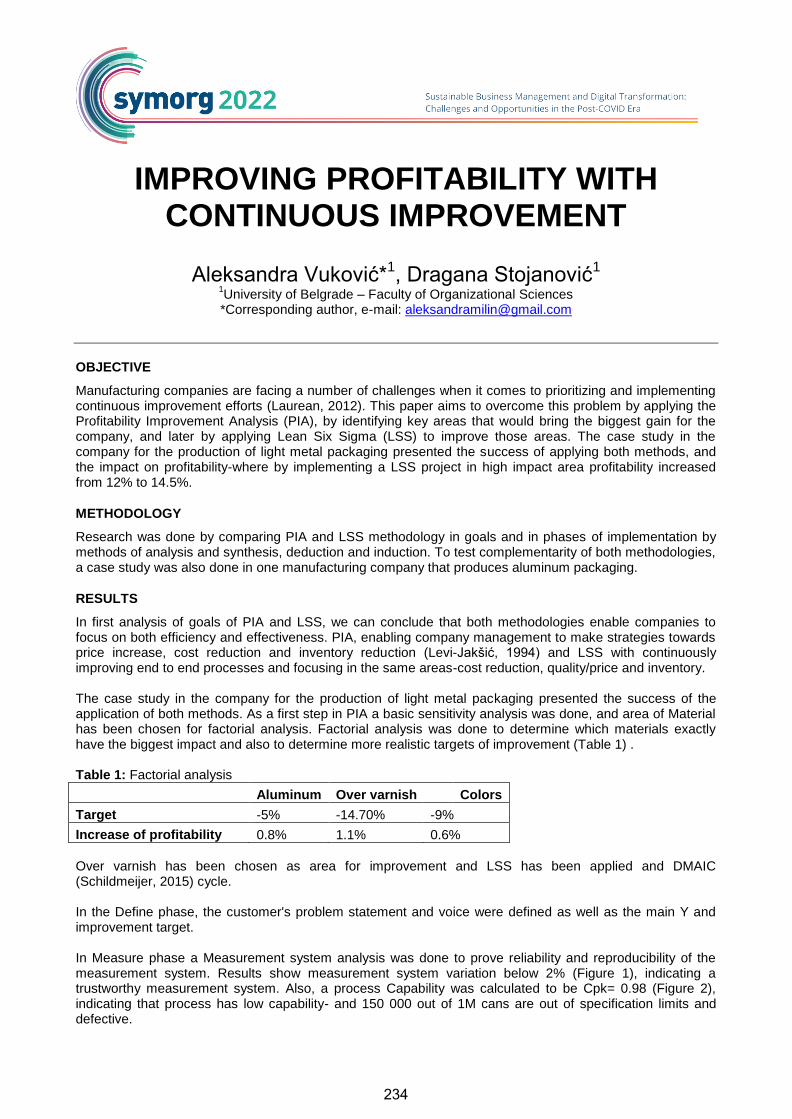
234
IMPROVING PROFITABILITY WITH CONTINUOUS IMPROVEMENT
Aleksandra Vuković*1, Dragana Stojanović
1
1University of Belgrade – Faculty of Organizational Sciences *Corresponding author, e-mail: [email protected]
OBJECTIVE
Manufacturing companies are facing a number of challenges when it comes to prioritizing and implementing continuous improvement efforts (Laurean, 2012). This paper aims to overcome this problem by applying the Profitability Improvement Analysis (PIA), by identifying key areas that would bring the biggest gain for the company, and later by applying Lean Six Sigma (LSS) to improve those areas. The case study in the company for the production of light metal packaging presented the success of applying both methods, and the impact on profitability-where by implementing a LSS project in high impact area profitability increased from 12% to 14.5%.
METHODOLOGY
Research was done by comparing PIA and LSS methodology in goals and in phases of implementation by methods of analysis and synthesis, deduction and induction. To test complementarity of both methodologies, a case study was also done in one manufacturing company that produces aluminum packaging.
RESULTS
In first analysis of goals of PIA and LSS, we can conclude that both methodologies enable companies to focus on both efficiency and effectiveness. PIA, enabling company management to make strategies towards price increase, cost reduction and inventory reduction (Levi-Jakšić, 1994) and LSS with continuously improving end to end processes and focusing in the same areas-cost reduction, quality/price and inventory. The case study in the company for the production of light metal packaging presented the success of the application of both methods. As a first step in PIA a basic sensitivity analysis was done, and area of Material has been chosen for factorial analysis. Factorial analysis was done to determine which materials exactly have the biggest impact and also to determine more realistic targets of improvement (Table 1) . Table 1: Factorial analysis
Aluminum Over varnish Colors
Target -5% -14.70% -9%
Increase of profitability 0.8% 1.1% 0.6%
Over varnish has been chosen as area for improvement and LSS has been applied and DMAIC (Schildmeijer, 2015) cycle. In the Define phase, the customer's problem statement and voice were defined as well as the main Y and improvement target. In Measure phase a Measurement system analysis was done to prove reliability and reproducibility of the measurement system. Results show measurement system variation below 2% (Figure 1), indicating a trustworthy measurement system. Also, a process Capability was calculated to be Cpk= 0.98 (Figure 2), indicating that process has low capability- and 150 000 out of 1M cans are out of specification limits and defective.

235
In the Improve phase, a Potential Failure Mode and Effect Analysis (Rowlands, 2005) was done and shows that main cause of variation is Over varnish. A hypothesis test – Multiple regression Figure 3 was done to validate these factors. An 89% variation is explained with the next three factors: Time of stirring the mixture, amount of water; knife distance. Using the Multiple regression model and equation a set of recommended values for these factors was calculate Figure 4. as shown.
Figure 1: Gage R&R study
Figure 2: Process Capability
Figure 3: Multiple regression

236
Figure 4: Optimizing factors
Team of the company came up with list of improvements which was prioritized and next improvements were implemented:
1. Flow meter for precise measurement of amount of water
2. Timer which will enable precise measurement time of stirring the mixture
3. Mechanical improvements of the knives that will mistake-proof the distance setting after knife
cleaning, so there will be only one option for distance of the knives.
After implementing these improvements Process Capability improved to 1.43 and over varnish reduction was significant- from 1.1kg per 1M cans to 0.8kg per 1M cans. Control plan was created with specification limits and control mechanisms in order to maintain this improvement.
CONCLUSION
An impact to Profitability was calculated in order to validate this case study: it increased from 12% to 13.1% which shows a direct impact to profitability. This shows that both methodologies work together towards the same goal, and can bring a significant improvement in manufacturing environment. Main conclusions are that PIA and LSS:
1. Can make an impact to lowering inventory and material expenses
2. Both methodologies are effective and efficient
3. Both methodologies can enable a company to use resources better and focus on areas that have the
biggest impact to the profitability and company.
Keywords: lean Six Sigma, PIA, manufacturing
REFERENCES
[1] Laurean, A. (2012). Critical succes factors for the implementation of Lean Six Sigma. International Journal of Lean Six Sigma, 274-283.
[2] Levi-Jakšić, M. (1994). Profitabilnost proizvodnje. Belgrade: Fakultet organizacionih nauka. [3] Rowlands, G. M. (2005). The Lean Six Sigma Pocket Tool book: A quick reference guide to nearly 100 tools for
improving process quality, 5peed, and complexity. New York: McGraw-Hill. [4] Schildmeijer, R., & Suijkerbuijk, P. (2015). Six Sigma in Practice. Rotterdam: The Lean Six Sigma Company.

237
COMPARATIVE STUDY OF SPECIAL EVENT SPONSORSHIP IN PRE-COVID-19
AND POST-COVID-19 ERA
Djurdjina Veljković1*
1University of Belgrade – Faculty of Organizational Sciences
*Corresponding author, e-mail: [email protected]
OBJECTIVE
Special events are experiences, lasting from a few hours to a few days, carefully designed do influence those who attend it (Silvers, 2012). Regardless of type and size of the special event, resources are one of the key factors for organizing it. Only a small number of special event organizations have a sustainable income to found the events they organize (Matthews, 2008). A huge economic, marketing and tourism significance of special events has attracted the attention of the corporate, governmental and social sectors. Corporate special event sponsorship is an effective marketing strategy that companies often use to build their brand image, reach more consumers, or overcome the challenges of modern business such as fragmented markets and advertising constraints (Sotiriadis, 2013). However, due to the measures caused by COVID-19 pandemic such as social distancing and quarantine, the special events industry suffered great losses because of inability to hold events, which made it impossible to sponsor special events (Davies, 2021). This new situation has shifted life to a digital environment and the only way to hold events became in digital format, which made sponsors worry about the effectiveness of special events as a tool for communicating with stakeholders (Porpiglia et al., 2020). In this paper will be considered the efficiency of special event sponsorship in digital era compared to special events before the pandemic, and how the pandemic changed the way the special events industry works.
METHODOLOGY
The methodology in this paper is based on a comparison of special event sponsorship case studies before and after the pandemic using extant research materials. Also, in this paper are considered sponsorships of major special events pre-COVID-19, such as the Olympics, and the way special events are held during and after the pandemic (Coburn et al., 2016; Kölking et al., 2016). The marketing power of special events in digital format and possible benefits for sponsors are explored as well (Pinzaru et al., 2020). Besides that, the paper incorporates the authors’ experiences related to sponsoring special events, the manner in which the new situation was handled and the challenges that occurred while providing sponsorships for special events organized during the pandemic.
RESULTS
This study confirmed the initial hypothesis that the new situation has drastically changed the special events industry and the benefits that sponsors could have, as well as consumer behavior in general. The pandemic has caused the prioritization of the need of consumers and companies and the mass digitalization of all aspects of life (Pinzaru et al, 2020). However, the digital environment has opened up new possibilities for holding special events and potentially reaching a much larger number of consumers, due to overcoming limitations such as the possible number of event visitors. Also, digital platforms have enabled the continuation of the sponsorship initiative outside the

238
real event, which develops an attraction that goes beyond only those who attend the events (Koronios, et al., 2020).
CONCLUSION
The special events industry is slowly recovering with the use of digital channels. However, human contact and emotions are almost impossible to reproduce through online platforms, so it is necessary to carefully manage sponsorship and create an experiential marketing strategy to enable long-term, mutually beneficial cooperation with sponsors (Porpiglia et al., 2020).
Keywords: event management, sponsorship, creative industry, covid-19 pandemia, digitalization
REFERENCES
[1] Almeida, F., Santos, J. D., & Monteiro, J. A. (2020). The challenges and opportunities in the digitalization of companies in a post-COVID-19 World. IEEE Engineering Management Review, 48(3), 97-103.
[2] Bowdin, G., Allen, J., Harris, R., McDonnell, I., & O'Toole, W. (2012). Events management. Routledge. [3] Coburn, A., & McCafferty, P. (2016). The Real Olympic Games: Sponsorship, Schools, and the Olympics—
the Case of Coca-Cola. Taboo: The Journal of Culture and Education, 15(1), 5. [4] Davies, K. (2021). Festivals post COVID-19. Leisure Sciences, 43(1-2), 184-189. [5] Getz, D., & Page, S. J. (2019). Event studies: Theory, research and policy for planned events. Routledge. [6] Giordani, P. E., & Rullani, F. (2020). The Digital Revolution and Covid-19. Department of Management,
Università Ca'Foscari Venezia Working Paper, (6). [7] Koronios, K., Dimitropoulos, P., Travlos, A., Douvis, I., & Ratten, V. (2020). Online technologies and sports:
A new era for sponsorship. The Journal of High Technology Management Research, 31(1), 100373. [8] Kostić-Stanković, M., Filipović, V., Vlastelica,T., (2020) Odnosi s javnošću, FON, Beograd [9] Kölking, L., van der Waal, G., & van Dalen, W. (2016). Heineken all over. Linked in, 12. [10] Matthews, D. (2008). Special event production. Elsevier's science, Burlington. [11] Pinzaru, F., Zbuchea, A., & Anghel, L. (2020). The Impact of the COVID-19 Pandemic on Business. A
preliminary overview. Strategica. Preparing for Tomorrow, Today, 721-730. [12] Shamsol, N. I., Wee, H., & Yusoff, N. M. (2017). Brand equity and event image: Moderating effect of
sponsorship. Tourism, Hospitality and Culinary Arts, 125. [13] Stieler, M., Germelmann, C. C., & Walliser, B. (2019). Rationality and emotionality of sponsorship
negotiations: Managerial approaches to sponsorship decision-making. Marketing Review St. Gallen, 36(6), 44-51.

239
THE INFLUENCE OF ENVIORNMENTAL FACTORS CHANGE ON THE DIGITAL
TRANSFORMATION PROCESS
Milan Jovanović1, Ivan Todorović*
1, Ondrej Jaško
1
1University of Belgrade – Faculty of Organizational Sciences *Corresponding author, e-mail: [email protected]
OBJECTIVE
We can never fully prepare for what is to come, we can only adapt (Hoffer, 2006). Creating an organization that is able to successfully adapt to change is the basis of a contingent approach to organizational design (Jaško et al., 2017). The authors cite “unfreeze” as the first phase of change management (Lewin, 1951) or developing awareness of the necessity and identification of the need for change (Kotter, 2012), after which resistance is reduced and the necessary change is implemented so that eventually the changed state becomes a new state of organization in future (Jovanović, 2006). Thompson (1967) considered that one of the key characteristics of the environment on which a rational structural solution depends is the impact of variability, i.e. stability of the environment on the organization. His research was followed by Lawrence and Lorsch (1986), who cited uncertainty as a complex characteristic of the environment, i.e. the level of uncertainty that the environment causes. In his hypotheses of adapting the organization to the situation, Henry Mintzberg (1983) stated that effective design of the organization implies adjusting its parameters to the situation. Although digitalization has been a current global topic for years, many organizations have not started their digital transformation because they lacked the main driver of such change – necessity. No radical technological improvements have taken place since 2019, yet many organizations have largely digitized their processes and mainly switched to online regime, especially in term of internal and extermal communication (Tornjanski et al., 2020). Sales processes have increasingly strengthened their distance sales capacity, so personal contact with the customer is no longer necessary. The total number of online transactions for the purchase of goods and services over the Internet in the Republic of Serbia in 2020 was about 64% higher than in 2019, and in 2021 by as much as 150% higher than in 2019, while the value of online transactions has increased even more (National Bank of Serbia, 2022). This could mean that organizations hadn’t only temporarily adapted to the way of business during the crisis caused by the COVID-19, but many of them fulfilled Mintzberg's extended configuration hypothesis and implemented changes in the organization's design. This paper will analyze examples of the impact of changes in environmental factors caused by the COVID-19 on the acceleration of the digital transformation process within the organization.
METHODOLOGY AND RESULTS
As the subset of digital transformation we will observe the possibility of remote work in large companies that are generally used to having employees present in their offices and so-called 9-17 working time. The paper shows the examples of companies from Serbia that have implemented online work methods before the COVID-19 pandemia and the cases of Serbian companies that have introduced such a model during the crisis. The results show that the implementation of the remote working model has been drastically fastened during the lockdown period due to the enviornmental changes. Furthermore, the companies have kept such possibility after the crisis. The proces of digital transformation in this area, as an example of internal change that could obviously been implemented earlier, was significantly accelerated under the pressure of global external changes.

240
CONCLUSION
In Serbia, the general level of digital literacy before the pandemic was very low. A survey conducted in 2019 showed that large number of citizens in Serbia still paid their utility bills physically, although global trends were in favor of the use of non-cash payment methods (Todorović et al., 2019). Moreover, a considerable percentage of respondents did not even know about such possibility. However, the past crisis has shown that the population can keep up with the digital transformation and that social environmental factors are ready to act on the internal parameters of the organization and their configuration. Now, some organizations that have not yet strategically determined and redesigned for digital business have a unique opportunity to adapt to environmental factors and rationalize operations by reducing unnecessary costs, primarily related to human and infrastructure resources.
Keywords: organizational design, digital transformation, contingency theory, structuring organization, change management
REFERENCES
[1] Hoffer, E. (2006). The Ordeal of Change. Hopewell Publications. [2] Jaško, O., Čudanov, M., Jevtić, M., & Krivokapić, J. (2017). Organizacioni dizajn: pristupi, metode i modeli.
Belgrade: Faculty of Organizational Sciences. [3] Jovanović, P. (2006). Upravljanje promenama. Belgrade: YUPMA. [4] Kotter, J. P. (2012). Leading Change. Harvard Business Press. [5] Lawrence, P. R., & Lorsch, J. W. (1986). Organization and Environment: Managing Differentiation and
Integration. Harvard Business School Classics. [6] Lewin, K. (1951). Field Theory in Social Science. New York: Harper and Row. [7] Mintzberg, H. (1983). The Structure in Fives: Designing Effective Organizations. Prentice-Hall. [8] National Bank of Serbia. (2022). Retrieved from: www.nbs.rs. [9] Thompson, J. D. (1967). Organizations in Action: Social Science Bases of Administrative Theory. New York:
McGraw-Hill. [10] Todorović, I., Komazec, S., Krivokapić, J., & Jaško, O. (2019). Zašto građani Srbije i dalje plaćaju račune na
šalteru? SPIN19 (pp. 359-367). Belgrade: Faculty of Organizational Sciences. [11] Tornjanski, V., Petrovic, D., & Nesic, S. (2020). Effectiveness of knowledge transfer between project team
members in digitally disrupted organizations. Management: Journal of Sustainable Business and Management Solutions in Emerging Economies, 25(2), 1-14. DOI: 10.7595/management.fon.2018.0034

241
THE IMPORTANCE OF EMPLOYEES FOR THE IMPLEMENTATION OF
ORGANIZATIONAL CHANGES DURING THE PANDEMIC
Jovan Krivokapić*1, Đorđe Lazić
1, Milan Jovanović
1
1University of Belgrade – Faculty of Organizational Sciences
*Corresponding author, e-mail: [email protected]
OBJECTIVE
Organizations are forced to adapt to a lot of external factors in order to maintain or improve their business performances. This adjustment is a continuous process, and it is based on the organization's long-term strategy, but also on the current impulses that affect it. The COVID-19 pandemic has taken most organizations by surprise, so the traditional planned change models have failed to provide an adequate response (Choflet et al., 2021). In these new circumstances it was necessary to react quickly to redefine key processes without major consequences. That mainly meant changing the focus of daily activities and finding new ways of their implementation that were expected to maintain business continuity. This paper will provide an overview of relevant research findings and conclusions regarding the role and importance of employees' involvement in organizational changes in the crisis caused by the coronavirus.
METHODOLOGY AND RESULTS
The working environment has been transformed practically overnight due to the pandemic (Gašić & Berber, 2021), and that fact has brought various challenges in both business and social spheres (Khanal et al., 2021). Given the limitations and epidemiological measures that were brought in virtually all countries of the world, organizations were forced to adapt to the needs and requirements of key stakeholders. In these conditions the key role was played by the IT infrastructure, which enabled work from home instead of offices, which was a very good solution in many business industries, and it showed that innovative ways of working are not so bad alternatives, even though traditionalist organizations and industries were sceptical regarding that topic. In addition, the pressure that employees felt because they had to take care of their own and their family's health on the one hand, and to participate in the implementation of organizational changes that came with the pandemic on the other hand, made it difficult to find adequate answers to the crisis. Recent studies show that a key role in such processes was played by a well-developed internal two-way communication system that has put employees in the centre and enabled them to understand their roles and responsibilities in this new situation (Sun et al., 2021) and that in such circumstances the organizations that have clearly defined rules and where the authority was respected have fared significantly better (Spicer, 2020). Changes based on employees' motivation and their willingness to take the initiative gave better results and created preconditions for new models and work methods within the organization (Junnaid et al., 2020). Also, the employees’ perception regarding the support provided by the organization during the implementation of organizational changes in such conditions significantly affected the performance they achieved (Fachriansyah et al., 2021), which might be very important conclusion from a practical point of view because it is an indicator of the direction that the management should choose in similar situations.
CONCLUSION
The COVID-19 pandemic has brought unexpected and sudden problems to many industries and forced them to think and act differently, step out of their comfort zone and stop relying solely on proven solutions.

242
Organizations had to look for new ways of working, and employees were expected to contribute not only to the application of these new methods but also to their development. Although such situations are not pleasant in themselves since they bring different types of pressures, they have shown that there is a completely different range of activities and resources that organizations can focus on. Industries that relied on online sales or delivery of goods have seen a multiple increase in performance during the pandemic, as expected. Besides, the organizations in other business sectors that have been reluctant to take advantage of virtual work have also shown significant improvements. Although the pandemic is not fully over yet, various research findings indicate that despite returning to the traditional way of working many organizations choose to maintain some innovative approaches that proved good during the crisis. A specific communication system that allowed employees to understand their role in this crisis and get intensively involved in finding a solution was crucial in overcoming the resistance to change and fear of uncertainty that the pandemic has brought.
Keywords: organization, COVID-19, organizational change, the role of employees
REFERENCES
[1] Choflet, A., Packard, T., & Stashower, K. (2021). Rethinking organizational change in the COVID-19 era. Journal of Hospital Management and Health Policy, 5.
[2] Fachriansyah, R., Yuliati, U., & Riyanto, D. W. (2021). The Effect of Organizational Support Perception, Organizational Change, and Organizational Culture on Employee Performance of PT. Pegadaian Malang During COVID-19. Jurnal Manajemen Bisnis dan Kewirausahaan, 1(3), 188-198.
[3] Gašić, D., & Berber, N. (2021). The Influence of Flexible Work Arrangement on Employee Behavior During the COVID-19 Pandemic in the Republic of Serbia. Management: Journal of Sustainable Business and Management Solutions in Emerging Economies, 26(3), 73-88.
[4] Junnaid, M. H., Miralam, M. S., & Jeet, V. (2020). Leadership and Organizational Change Management in Unpredictable Situations in Responding to Covid-19 Pandemic. International Transaction Journal of Engineering, Management, & Applied Sciences & Technologies, 11(16). DOI: 10.14456/ITJEMAST.2020.322
[5] Khanal, P., Bento, F., & Tagliabue, M. (2021). A scoping review of organizational responses to the covid-19 pandemic in schools: A complex systems perspective. Education Sciences, 11(3), 115.
[6] Spicer, A. (2020). Organizational culture and COVID-19. Journal of Management Studies, 57(8), 1737-1740. [7] Sun, R., Li, J. Y. Q., Lee, Y., & Tao, W. (2021). The role of symmetrical internal communication in improving
employee experiences and organizational identification during COVID-19 pandemic-induced organizational change. International Journal of Business Communication, 23294884211050628.

243
TELEWORK AFTER THE COVID-19: PERCEPTIONS IN RELATION TO
OWNERSHIP, INDUSTRY AND SUPPORT
Mladen Čudanov*1, Aleksandra Cvetković
1, Gheorghe Savoiu
2
1 University of Belgrade – Faculty of Organizational Sciences
2 University of Pitesti – Faculty of Economic Sciences and Law
*Corresponding author, e-mail: [email protected]
OBJECTIVE
This study aims to provide insight into perceptions of telework and the differences related to different ownership, industry, and level of organisational support. During the oil crisis, telework was introduced as an activity that "includes all work-related substitutions of telecommunications and related information technologies for travel" (Niles, 1998). Telework gained importance during the COVID-19 pandemics (Conteras et al., 2020; Buomprisco et al., 2021; Cvetkovic et al., 2021; Gašić & Berber, 2021; Ngyen, 2021). As we can expect the trend to stay after the pandemic has passed, we can learn from the past two years experience and focus on important factors of telework. Our study analyses perceptions regarding the company's ownership, which was researched before (Bajzikova et al., 2016) and during (Ngyen, 2021) the pandemic. Similar to that are specificities of the industry. Most importantly, our focus is on factors that can influence the perception of telework benefits or problems, like employee education and security, which are deemed important (Mihajlovic et al., 2021).
METHODOLOGY
Our research is focused on telework data gathered during the COVID-19 pandemic. We have gathered responses from 197 participants with the two-parts questionnaire. First set of questions was focused on the socio-economic data, and the second part was focused on telework perceptions. Using the control questions we have eliminated uncareful responses by comparing weekly differences of work from office and telework, bearing in mind that total work should be 4-6 days per week. After eliminating 31 uncareful response data, we based our research on 166 valid responses. Kolmogorov-Smirnov test indicates that: variable Benefits of Working from Office follow a normal distribution, D(166) = 0.942, p = 0.338; control variable Benefits of Teleworking follow a normal distribution, D(166) = 1.227, p = 0.098; and variable Problems of Teleworking follow a normal distribution, D(166) = 1.228, p = 0.098. Our sample size is fairly large, and t-test becomes increasingly robust to violation of normality assumptions in larger size samples (Sawilowsky & Blair 1992), but we have still focused our analysis on variables with normal distribution.
RESULTS
According to our data, 131 employees working in the privately-owned sector (M=3.65, SD=0.99) compared to 35 employees from the state-owned sector (M=2.89, SD=1.16) have significantly higher perception of telework benefits t(164)= 3.895, p<0.001. Regarding different industries, we have selected three clusters. The 74 employees working in industries related to culture, education, science, healthcare, administration, public administration, military and the police (M=2.44, SD=0.91), compared to 37 employees working in mining, production, construction, arts and crafts industries (M=2.86, SD=0.96) have lower perception of telework problems t(109)= -2.241, p=0.027.

244
Employees who feel that organisation has provided enough support in telework education, 83 in total (M=2.43, SD=0.94), compared to the employees who do not feel that organisation has provided enough support in telework education, the same group size of 83 (M=2.80, SD=0.86) have a significantly lower perception of telework problems t(164)= -2.597, p=0.01. It needs to be noted that the group who felt that the organisation has provided enough support in telework education chose answers of 4 and 5 on the Likert scale for that question (agree and strongly agree), while the second group chose answers 1, 2 and 3 (strongly disagree, disagree and neither agree nor disagree). The 131 employees who do not feel concerned regarding organisation support for private data safety during telework (M=3.67, SD= 0.98) compared to 35 employees that feel concerned (M=2.85, SD=1,15) have a significantly higher perception of telework benefits t(164)= 4.202, p<0.001. Further, 131 employees that do not feel concerned regarding organisation support for private data safety during telework (M=2.54, SD= 0.90 compared to 35 employees that feel concerned (M=2.92, SD=0.94) have a significantly lower perception of telework problems t(164)= -2.247, p=0.26. Finally, we need to note that the group that does not feel concerned chose answers "I do not feel concerned" or "I do not feel concerned at all" for that variable.
CONCLUSION
Our research shows that privately-owned sector employees are more open to telework than state-owned organisations since there are higher perceptions of telework benefits. This can further increase the productivity gap between those two sectors since telework can be more efficient and provide better employee satisfaction. As expected, knowledge-based industries perceive less telework problems than labour/capital intensive industries. Practical implications of our study can come from factors where organisations can improve the perception of telework among their employees. Those satisfied with the support given in telework education have ~17% higher perception of telework benefits. Even more important factor is solving the concern for data safety. Employees that do not feel concerned perceive ~29% more benefits of telework and ~16% less problems of telework. Interestingly, our research found no difference in benefits of office work in either group. It might be caused by employees focusing on telework during the COVID-19 pandemics. The further main limitation of our study is that sample is limited to South-Eastern Europe region and that groups, compared with the t-test do not have same sizes.
Keywords: telework, remote work, problems benefits, ownership, industry, telework support
REFERENCES
[1] Bajzikova, L., Sajgalikova, H., Wojcak, E., & Polakova, M. (2016). How far is contract and employee telework implemented in smes and large enterprises?(Case of Slovakia). Procedia-Social and Behavioral Sciences, 235, 420-426.
[2] Buomprisco, G., Ricci, S., Perri, R., & De Sio, S. (2021). Health and telework: new challenges after COVID-19 pandemic. European Journal of Environment and Public Health, 5(2). DOI: 10.21601/ejeph/9705.
[3] Contreras, F., Baykal, E., & Abid, G. (2020). E-leadership and teleworking in times of COVID-19 and beyond: what we know and where do we go. Frontiers in Psychology, 3484.
[4] Cvetković, A., Čudanov, M., & Săvoiu, G. (2021). Benefits and Problems of Telework During The Covid-19 Pandemic: Factors of Age, Gender and Telework Intensity. Econophysics, Sociophysics and other Multidisciplinary Sciences Journal ESMSJ, 10(1), 23-30.
[5] Gašić, D., & Berber, N. (2021). The Influence of Flexible Work Arrangement on Employee Behavior During the COVID-19 Pandemic in the Republic of Serbia. Management: Journal Of Sustainable Business And Management Solutions In Emerging Economies, 26(3), 73-88. DOI: 10.7595/management.fon.2021.0026
[6] Mihailović, A., Cerović Smolović, J., Radević, I., Rašović, N., & Martinović, N. (2021). COVID-19 and Beyond: Employee Perceptions of the Efficiency of Teleworking and Its Cybersecurity Implications. Sustainability, 13(12), 6750.
[7] Nguyen, M. H. (2021). Factors influencing home-based telework in Hanoi (Vietnam) during and after the COVID-19 era. Transportation, 48(6), 3207-3238.
[8] Nilles, J.M. (1988) 'Traffic Reduction by Telecommuting: A Status Review and Selected Bibliography', in Transportation Research, 22A(4), 301-317
[9] Sawilowsky, S. S., & Blair, R. C. (1992). A more realistic look at the robustness and Type II error properties of the t test to departures from population normality. Psychological Bulletin, 111(2), 352-360. DOI: 10.1037/0033-2909.111.2.352

245
MANAGING DIGITAL TRANSFORMATION PROJECTS
UNDER DISCONTINUITY

246
KEY ROLE OF HIGH-TECH BUSINESS INCUBATORS SUSTAINABLE
GOVERNANCE IN THE POST-COVID ERA
Anđelija Đorđević*1, Marko Mihić
1
1University of Belgrade – Faculty of Organizational Sciences
*Corresponding author, e-mail: [email protected]
OBJECTIVE
The goal of the paper is to study what can support and encouragement of business incubators do in the terms of creating sustainable entrepreneurial ecosystem in the post pandemic environment. There are many authors that address social and economic benefits that derive from accelerators (Erasmus, 2018; Torun et al., 2018), but a certain lack of academic literature can be noticed if we factor in a COVID-19 scenario and the post-COVID era. Different stakeholders can benefit from different values that can be driven by high-tech oriented start-ups and their innovative contributions, but there are also many challenges and risks to be overcome (Stosic at al., 2017; Thobekani & Sebenzile, 2021; Lin-Lian et al., 2021).
METHODOLOGY
To examine mentioned observations, authors have performed an interpretive content analysis of secondary sources that is based on previously conducted research, relevant industry reports, a review of top tier academic literature and many articles on the business incubation management (Jach et al., 2020; Kukić et al., 2020; Matijević & Šolaja, 2020; Djordjevic & Mihic, 2021). The goal is to illuminate existing sources and relevant case studies, to obtain greater understanding of the context and qualitative aspect of the narrative. This approach implies flexible framework and research design that put emphasis on narrative, so results should be regarded in this light since generalization is partially limited.
RESULTS
Paper addressed mainly high-tech start-ups incubated in business accelerators and their impact on different functions in society. Even before pandemic business incubators had number of significant and diverse roles in economic environment, but with the COVID-19 disruption even more emphasis was put on examining benefits that can come from this type of organizations (Adnan et al. 2020). Pandemic have accelerated digital transformation and pushed traditional managerial methods into creative and innovative realm. This is especially significant for organizations like business incubators and their strategic importance in upturn of business landscape in this new context. Results can undeniably conclude that the value of sustainable governance of accelerators (Cavalcanti, 2018; Arsic & Mihic, 2020) could be found in rise of entrepreneurial skills and mindset (which are both essential in ambiguous situations such as this one), developing contemporary and innovative solutions for traditional challenges, creating disruptive business and revenue models and advancement of society in general. (McIver-Harris et al., 2020; Thobekani & Sebenzile, 2021; Lin-Lian et al., 2021).
CONCLUSION
Despite consequences that COVID-19 inflicted to business ecosystem as a whole, there is a wide window of potential benefits to be utilized by further developing business incubators and high-tech start-ups within them. There are multiple functions to exploit from this symbiosis and the end goal is to achieve more sustainable entrepreneurship ecosystem. This could be accomplished by many different models, but all of them demand questioning of traditional views and implementation of contemporary perspective on critical success and failure factors.

247
Keywords: high-tech start-ups, business incubator, sustainability, COVID-19 scenario, performance management
REFERENCES
[1] Adnan A. I., Yildirim, S. E., & Eyamba, P. (2020). Impact of Business Incubators’ Facilities on Entrepreneurial Ecosystem Creation: A Case of Business Incubator in Jordan. Journal of Management and Sustainability, 10, 189-196.
[2] Arsić, S., & Mihic, M. (2020). Integral Model of Management Support: Review of Quantitative Management Techniques. In N. Mitrovic, M. Milosevic, & G. Mladenovic, Advances in Computational and Experimental Approaches in Materials Science and Engineering (pp. 250-264). Cham: Springer.
[3] Cavalcanti, A. (2018). A Method for Documenting the Goals and KPIs of Accelerators and Startups. Ottawa, Ontario, Canada: Carleton University.
[4] Djordjevic, A., & Mihic, M. (2021). Strategic Importance and Sustainable Governance of High-Tech Business Incubators: Evidence from Serbia. Current Problems in Experimental and Computational Engineering (pp 199–221). Lecture Notes in Networks and Systems, vol 323. Springer, Cham.
[5] Erasmus+ Programme of the European Union. Critical Success and Failure Factors of Business Incubation in HEI. (2018)
[6] Jach, K. H., Černevičius, T., Kovačević, M., Batston, S., Mandić, V., Marinković, M., Uus, I. (2020). Study on the current situation of BIs in the Republic of Serbia. GFA Consulting Group GmbH, Belgrade : Maxnova.
[7] Kukić, Z., Kuzman, T., & Kovač, A. (2020). Startup Scanner. Belgrade: Digital Serbia Initative.
[8] Lin-Lian, C., De Pablos-Heredero, C., & Montes-Botella J., Value Creation of Business Incubator Functions: Economic and Social Sustainability in the COVID-19 Scenario. Sustainability, 2021, 13, 6888. DOI:
10.3390/su13126888 [9] Matijević, M., & Šolaja, M. (2020). ICT in Serbia - At a Glance. Novi Sad, Serbia: Vojvodina ICT Cluster. [10] McIver-Harris, K., & Tatum, A. (2020). Measuring Incubator Success During a Global Pandemic: A Rapid
Evidence Assessment. The Tenth International Conference on Engaged Management Scholarship. DOI: 10.2139/ssrn.3687712
[11] Stosic, B., Mihic, M., Milutinovic, R., & Isljamovic, S. (2017). Risk identification in product innovation projects: new perspectives and lessons learned. Technology Analysis & Strategic Management, 29 (2), 133-148.
[12] Thobekani, L., & Sebenzile, K. (2021). Technological perspectives of a balanced scorecard for business incubators: Evidence from South Africa. Problems and Perspectives in Management, 19(4), 40-47.
[13] Torun, M., Peconick, L., Sobreiro, V., Kimura, H., & Pique, J. (2018). Assessing business incubation: A review on benchmarking. International Journal of Innovation Studies 2, 91-100.

248
THE FUTURE IS ALREADY HERE: DO WE NEED TO UPSKILL DIGITAL PROJECT
MANAGERS?
Zorica Mitrović*1, Dragan Bjelica
1, Tea Borozan
1
1University of Belgrade – Faculty of Organizational Sciences
*Zorica Mitrović, e-mail: [email protected]
OBJECTIVE
The Fourth Industrial Revolution has changed the way organizations do their business, resulting in projectized and digitalized business environment that demand new and higher level of digital skills to face the complex reality (Cabeças & Marques da Silva, 2020). As this revolution continues to develop, approximately 30% of the total work relates to the project work (Schoper et al., 2018) and the digital competences rise on the list as one of top fifteen competencies needed in the future (Marnewick & Marnewick, 2021). For example, digital teamwork and digital attitude seems to be a key part of digital competency among youth (Pérez-Mateo et al., 2014). Accordingly, Sánchez-Valero et al., (2017) use of DIYLab project endorsed by engagement and students’ learning experience through the co-creation of the materials and learning opportunities from the same materials. Furthermore, over the last decade, there has also been a considerable amount of research into application of artificial intelligence tools in field of project management requiring from project managers to upskill in order to successfully manage projects (Mitrovic et al., 2020). These facts emphasize the importance of the rising question do the future project managers have adequate digital skills or whether the digital gap is widening which is hampering their way in increasing competitive advantage. Hence, the purpose of this paper is to examine the current digital abilities of future project managers and to determine if there is a gap between skills that students are being taught and the ones which are needed in companies.
METHODOLOGY
The empirical study was carried out with students admitted to Bachelor's and Master's degree programs in Project Management as academic field of study at University of Belgrade. The purpose of the study was to establish the proficiency level of digital competence of the future project managers using self-assessment tool developed as part of a project on Digital Competence, launched by European Commission (Ferrari, 2013). The tool is based on The Digital Competence Framework 2.0 that identifies more than 20 key components of competence in 5 areas: information and data literacy, communication and collaboration, digital content creation, safety and problem solving (Vuorikari, 2016).
RESULTS
The proficiency level of future project managers' digital competences depends on the digital resources and tools used in the learning process, using different platforms to communicate and collaborate with teachers as well as their peers and in creating digital content as part of assignments. From the analysis of the results, it is clear that most of the respondents in all competence areas self-assess their knowledge and skills at intermediate or advanced level. This confirmed the readiness of future project managers to be engaged in the type of work as needed in the digital economy.
CONCLUSION
By confirming that future project managers do have satisfactory level of digital competences, the authors raise the question on specific project managers’ digital competencies needed to manage projects that are digital or implemented in highly digitalized environment. Finally, it is proposed as a future research agenda to develop a digital competence framework specifically for project managers.
249
Keywords: digital competences, project managers, digital projects
REFERENCES
[1] Cabeças, A., & Marques da Silva, M. (2020). Project management in the fourth industrial revolution. Revista Internacional de Tecnologia, Ciencia y Sociedad, 9(2), 79-96. DOI: 10.37467/gka-revtechno.v9.2804
[2] Ferrari, A. (2013). DIGCOMP: A Framework for Developing and Understanding Digital Competence in Europe. European Commission, Joint Research Centre, Institute for Prospective Technological Studies DOI: 10.2788/52966
[3] Marnewick, C., & Marnewick, A. (2021). Digital intelligence: A must-have for project managers. Project Leadership and Society, 2, 100026. DOI: 10.1016/J.PLAS.2021.100026
[4] Mitrović, Z., Rakićević, A., Petrović, D., Mihić, M., Rakićević. J & Jelisić, E. (2020). Systems Thinking in Software Projects-an Artificial Neural Network Approach. IEEE Access, 8, 213619-213635. DOI: 10.1109/ACCESS.2020.3040169
[5] Pérez-Mateo, M., Romero, M., & Romeu-Fontanillas, T. (2014). Collaborative construction of a project as a methodology for acquiring digital competences. Comunicar, 21(42), 15-23. DOI: 10.3916/C42-2014-01
[6] Sánchez-Valero, J. A., Arrazola-Carballo, J., & Calderón-Garrido, D. (2017). El proyecto DIYLab (Do It Yourself in Education: Expanding Digital Competence to Foster Student Agency and Collaborative Learning). Cultura y Educacion, 29(4), 871–878. DOI: 10.1080/11356405.2017.1383637
[7] Schoper, Y. G., Wald, A., Ingason, H. T., & Fridgeirsson, T. V. (2018). Projectification in Western economies: A comparative study of Germany, Norway and Iceland. International Journal of Project Management, 36(1), 71-82. DOI: 10.1016/J.IJPROMAN.2017.07.008
[8] Vuorikari, R., Punie, Y., Gomez, S.C., Van Den Brande, G. (2016). DigComp 2.0: The Digital Competence Framework for Citizens. Update Phase 1: the Conceptual Reference Model, JRC Working Papers JRC101254, Joint Research Centre.

250
DIGITAL TRANSFORMATION LEADING THE WAY
Ljubomir Drakulevski1, Dimitar Jovevski*
1, Ognen Firfov
1
1Ss. Cyril and Methodius University in Skopje – Faculty of Economics *Corresponding author, e-mail: [email protected]
OBJECTIVE
The new digital era has raised the bar for everybody, and recent pandemic challenges have tangled the already very great complexity the way business is done. Diversified alleys of discussions emerge in this segment but still very commonly argued by scholars is perspectives of productivity. Although the number of papers on Digital Transformation evolved over time, it was only after 2014 that their numbers increased significantly (Reis et al., 2018). This academic article refers to relevant scientific work on various levels stressing and engaging the context of Macedonia. The elements of digital transformation considered in the research involve aspects related the volume of information and communication, aspects of the business modelling and improving business processes. The significant challenge is to integrate “digital” into the DNA of the business models. This is essential for success of any company and it is becoming a critical management issue (Horlacher & Hess, 2016). The Digital Transformation success relays strongly on the process and operations management changes and as with any IT-enabled change, it is not enough to bring the IT to the organization (Benjamin & Levinson, 1993; Dreme et al., 2017). In this line this research efforts is aiming at contributing towards this area raising questions and offering some potential answers in the segment of digital transformation in North Macedonia.
METHODOLOGY
Research has been conducted among 200 Macedonian companies from various sectors. In the first round questionnaires were sent out to 295 potential respondents - representatives of companies and the questionnaire was fully answered by representatives of 97 companies and institutions, or about 33.8%. In the second round of questions, the questionnaire was sent out to 267 potential respondents - representatives of enterprises in which most have already answered the first round of questions, and the second 78 respondents participated (76 in full, 2 partially), or about 28.4%. The first round of gathering data was connected to two questionnaires. The first questionnaire entailed mixed set of questions closed and some open-ended answers/comments, For 22 questions there were multiple-choice options. Respondents had options for additional comments on 8 questions, and there was one fully descriptive question. The second questionnaire was a classic questionnaire with closed questions, containing 9 questions. Respondents did not have the option of additional qualitative comments in the second questionnaire. The second part relying more on data from interviewing various employees, included questions related to the application of technologies and the time gap between the impact perceived in companies. The Impact on organizational innovation and potential change in organizations due to the use of the Internet and ICT were part of the questionnaire, as well as the potential impact on employees and the changing the needs of companies for different types of employees due to the use of Internet and Internet/intranet applications.
RESULTS
Quantitative research performed has been involving management representatives of companies related to the influence of the Internet on productivity, as well as for the respective organizational changes and business models. Confirmation for the urgency to consider the importance of such a research effort is that at a large scale (over 90%) it is believed that the use of the Internet seriously changes the ways of working, or that much faster spread of information through companies and corporations by using Internet seriously

251
impacts productivity (over 81%). Moreover, more than 78 % have an opinion that due to much easier collaboration with clients using Internet technologies, productivity is increased, or that increases the efficiency of operations, and seriously positively affecting potentially productivity.
CONCLUSION
The analysis provided implication that digital transformation involving more profound changes of the process, hence understanding how initiate the digital transformation as a long-term commitment for the company. The relationship between productivity and digital transformation is complex and this has been greatly implied by literature. However, this research effort has aimed to disclose some of these relationships from various but symbiotic perspectives. In summary, most companies believe that the changes related to the use of the Internet occur because of the internally perceived benefits of the change in communication with customers and partners and because of the opportunities with this change to reorganize processes and be more efficient and productive in the medium term of several years.
Keywords: digital transformation, productivity, management, organization, internet
REFERENCES
[1] Atkinson, D. R. (2007). Boosting European Prosperity through the Widesperead use of ICT, The Information Technology & Innovation Foundation.
[2] Brennen, J. S., & Kreiss, D. (2016). Digitalization, in Jensen, K.B., Rothenbuhler, E.W., Pooley, J.D. and Craig, R.T. (Eds), The International Encyclopedia of Communication Theory and Philosophy, Wiley-Blackwell, Chichester, pp. 556-566.
[3] Eggers, J. P., & Park, K. F. (2018). Incumbent adaptation to technological change: The past, present, and future of research on heterogeneous incumbent response. Academyof Management Annals, 12(1), 357–389
[4] Fornefeld, M., Delaunay, G., & Elixmann, D. (2008). The Impact of Broadband on Growth and Productivity. A study on behalf of the European Comission (DG Information Society), Micus.
[5] Genzorova, T., Corejova, T., & Stalmasekova, N. (2019). How digital transformation can influence business model, Case study for transport industry. Transportation Research Procedia, 40, 1053-1058.
[6] McKinsey & Company (2001). Mapping global capital markets, McKinsey Global Institute, 2011 [7] Reis, J., Amorim, M., Melão, N., & Matos, P. (2018, March). Digital transformation: a literature review and
guidelines for future research. In World conference on information systems and technologies (pp. 411-421).
Springer, Cham.

252
FEASIBILITY ASSESSMENT OF DIGITAL TRANSFORMATION PROJECTS IN
AGRICULTURE
Dejan Petrović1, Petar Stanimirović*
1, Aleksandar Vratonjić
Gligorijević2
1University of Belgrade – Faculty of Organizational Sciences
2TeleGroup d.o.o.
*Corresponding author, e-mail: [email protected]
OBJECTIVE
The United Nations, as the leading international organization that brings member country governments to cooperate in the fields of international law, global security, economic development and social equality, has defined 17 sustainable development goals to reduce poverty and hunger in the world, healthy life, better and more accessible education, environmental protection, etc. One of the ways to achieve the set goals is the digital transformation of society (United Nation, 2022). Digital transformation projects in certain areas are not simple, and therefore it is necessary to draw conclusions with great care and adequate feasibility assessments of their implementation. There are significant challenges in determining all the effects of these projects, because in addition to quantitative, easily measurable, there are also qualitative effects that are very difficult to measure in money (Mihic et al., 2012). Traditional methods of feasibility assessment do not take into account qualitative effects, which can significantly affect the abandonment of digital transformation projects, which are extremely important and can be very successful (Mihic et al., 2014; Chen, 2001). The aim of this paper is to research and analyze the way in which digital transformation projects in the field of agriculture can be measured and evaluated. The basic specificity of agricultural production in relation to other branches of the economy is that agricultural production largely depends on climatic conditions and the quality of the land itself. This is a consequence of the fact that in agricultural production the climate is difficult to predict. Also, the climate is something on which the whole agricultural production depends, much more than in other branches in which it mostly affects indirectly, and the profitability of growing a crop directly depends on the place of cultivation. Better climatic conditions and land means higher yield, and therefore the production will be more profitable. Furthermore, the specificity of agricultural production is that the time period from the beginning of the investment to the arrival of the first results is much longer than in other branches of the economy. In addition, the total income is not evenly distributed over the months, but arrives once a year, or in very short intervals.
METHODOLOGY
Interpretive analysis was used to obtain the results of this research. It is a methodology that leads to research results by interpretation and inductive conclusion based on different theoretical concepts and considerations of other authors in existing sources dealing with the same or similar topics as the research conducted (Bhattacherjee, 2012). which are called secondary sources (Vartanian, 2011). Secondary sources used in this research were scientific papers written on the topic of digital transformation and project success. Also, the method of case study analysis was used to study the specific real situation and present the evaluation of the project named AgroLIFE.
RESULTS
Making a feasibility study and feasibility assessing of a digital transformation project in agriculture is a complex undertaking, but it allows the investment decision maker to consider all possibilities, all aspects that affect an investment and thus decide whether the investment is profitable or not. In addition to the effects that such investments directly bring, it is necessary to measure indirect effects and effects that contribute to

253
increasing the value of total business. It is necessary to identify critical success factors, opportunities to improve business activities and assess the benefits and costs that the organization or individual will face in applying the target technology. Feasibility analysis and assessment should help decision makers to identify business benefits that justify the use of resources and consider possible risks during change. Analyses should be conducted quickly given the speed of market movements and changes. In the project Digitization of Municipal Land Management implemented by GIZ ORF MMS and BFC SEE, the results of the situation analysis in Bosnia and Herzegovina and Montenegro show that agricultural production on publicly owned land leased to farmers is poorly controlled and not managed on planned way. In order to improve municipal land management, TeleGroup, together with its subsidiary Greensoft, has developed a unique IT platform - AgroLIFE - for automatic management of agricultural production for all land types. The case study presents a feasibility assessment of this software that allows agronomists and farm owners to efficiently plan, organize and manage agricultural production, while increasing yields, total revenues and reducing operating costs.
CONCLUSION
The profitability of an investment depends on many factors such as: the current market situation, competitors, technology development, market development, development opportunities in a market as well as the financial and social evaluation of a particular project. When talking about the cost-effectiveness of a project, it is important to analyze everything that a project implies, but also to take into account the indicators that are specific to projects related to digital transformation. The effects of the digital transformation project in agriculture that can be easily measured in money are savings resulting from process improvement and direct increase in yield, while qualitative effects that can be difficult to measure in money can be increased customer satisfaction, availability, relevance and timeliness of information and increased efficiency business along the supply chain. Based on the feasibility analysis of the digital transformation project and the implementation of AgroLife software, we can conclude that similar, but also other digital transformation projects in agriculture are easily assessed in terms of selected financial indicators. We can also conclude that this justification grows with the introduction of qualitative effects. This means that excluding such effects when evaluating digital transformation projects in agriculture can lead to wrong conclusions and rejection of these projects only because their most significant effects are difficult to measure in money. Wrong rejections of these projects can be great mistake because they can be very significant in terms of economic viability and contribution to society which is the primary goal of digital transformation in agriculture.
Keywords: digital transformation, agriculture, feasibility assessment, measuring quantitative and qualitative effects of projects
REFERENCES
[1] Bhattacherjee, A. (2012). Social Science Research: Principles, Methods, and Practices. Tampa: University of South Florida.
[2] Chen, I. J. (2001). Planning for ERP systems: analysis and future trend. Business Process Management Journal, 7(5), 374-386.
[3] Fasal (2022). Retrieved from fasal.co [4] Mihić, M., Petrović, D., & Vucković, A. (2014). Comparative analysis of global trends in energy sustainability.
Environmental Engineering and Management Journal, 13(4), 947-960. [5] Mihić, M., Petrović, D., Vučković, A., Obradović, V., & Đurović, D. (2012). Application and Importance of Cost-
Benefit Analysis in Energy Efficiency Projects Implemented in Public Buildings: The Case of Serbia. Thermal Science, 16(3), 915-929.
[6] Murphy, E. K., & Simon, J. S. (2002). Intangible benefits valuation in ERP projects. Information Systems Journal, 12, 301-320.
[7] United Nation (2022). The 17 Goals of Sustainable Development. Retrieved from sdgs.un.org/goals [8] Vartanian, T. (2011). Secondary Data Analysis. Oxford: Oxford University Press.
254
EDTECH PROJECTS: DISRUPTIVE INNOVATION IN HIGHER EDUCATION
Milan Đorđević1, Teodora Slavinski*
2, Dragan Bjelica
2
1Proctorio Inc.
2University of Belgrade – Faculty of Organizational Sciences
*Corresponding author, e-mail: [email protected]
OBJECTIVE
Since 2012, U.S. Universities have entered into public-private partnerships with companies in the EdTech industry. EdTech is widely considered to be the most important factor shaping higher education for paid and accredited programs, providing “any time, any place, any way, any pace” education (Cohen, 2022). It is recognized as the disruptive innovation (Thomas & Nedeva, 2018), which became central topic especially during the Covid-19 pandemic, when new tools and approaches became visible with a novel way of working, studying, and collaborating in the education. As Jordan et al. (2021) pinpointed that remote learning is set to become more important component in higher education in future, this article strives to present how innovation meets market readiness initiated by an urgent need for a new solution in the education sphere, following the case of Proctorio, as one of the leaders in online education and online proctoring. Proctorio’s advantage and innovation are in unlimited scalability of SaaS solution, with almost real-time speed processing of AI-powered tests validation and examination, which helps in providing multiple benefits for learners (Luckin & Cukurova, 2019). Proctorio’s business tend to actively participate in the achievement of SDG goals as it tends to ensure inclusive and equitable quality education and to promote lifelong learning opportunities for everyone (United Nations, 2015) by providing their services. This paper seeks to address EdTech project implementation as a disruptive innovation, as well as to promote the development of new business models in higher education following the case of Proctorio.
METHODOLOGY
A methodology used here relies on the business indicators’ comparison using the case of Proctorio. The main research intention was to observe the growth in numbers indicating collaborating institutions which decided to implement remote-learning and remote-examining modalities using online assessment solutions before, during, and after the Covid-19 outbreak. Case study also examines changes in the volume of student exams proctored by online AI-powered solutions in order to support their educational and regulatory needs. Data sample represents the period since the company's inception in 2013 as one of the first startups in the US in the newly created EdTech industry, until April 2022.
RESULTS
First partnerships with early adopters such as the University of Houston and the University of Colorado, Denver in 2014 are considered one of the first private-public partnerships in the EdTech online proctoring niche. Steady growth and adoption continued until 2020, when Proctorio experienced three-digit year-over-year growth in exams proctored from April 2019 to April 2020 and the company proctored more than 20 million exams across the globe (Proctorio, 2022). This growth continued and, through April 2022, the company has proctored more than 60 million exams in total, with a current number of 3.5 million active users weekly.
CONCLUSION
Even though innovative products existed on the market, there were not many early adopters in the traditional educational industry willing to change their way of working and operating. Necessity and need created an
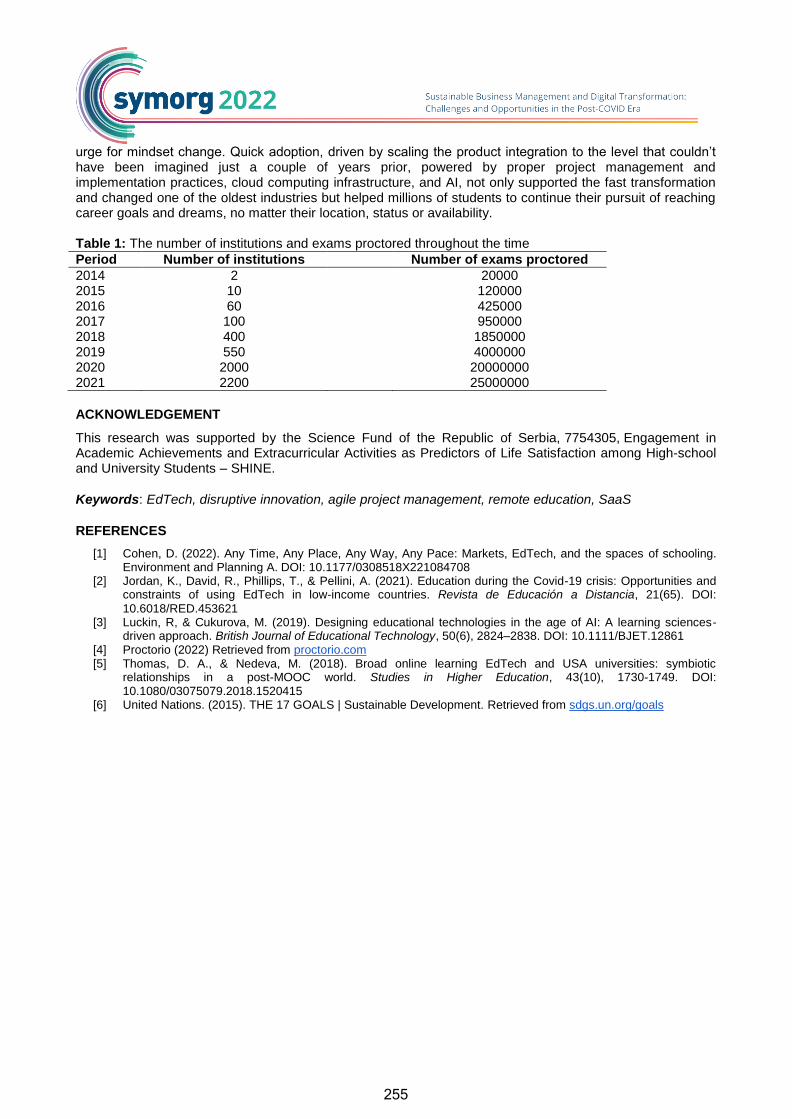
255
urge for mindset change. Quick adoption, driven by scaling the product integration to the level that couldn’t have been imagined just a couple of years prior, powered by proper project management and implementation practices, cloud computing infrastructure, and AI, not only supported the fast transformation and changed one of the oldest industries but helped millions of students to continue their pursuit of reaching career goals and dreams, no matter their location, status or availability. Table 1: The number of institutions and exams proctored throughout the time
Period Number of institutions Number of exams proctored
2014 2 20000 2015 10 120000 2016 60 425000 2017 100 950000 2018 400 1850000 2019 550 4000000 2020 2000 20000000 2021 2200 25000000
ACKNOWLEDGEMENT
This research was supported by the Science Fund of the Republic of Serbia, 7754305, Engagement in Academic Achievements and Extracurricular Activities as Predictors of Life Satisfaction among High-school and University Students – SHINE.
Keywords: EdTech, disruptive innovation, agile project management, remote education, SaaS
REFERENCES
[1] Cohen, D. (2022). Any Time, Any Place, Any Way, Any Pace: Markets, EdTech, and the spaces of schooling. Environment and Planning A. DOI: 10.1177/0308518X221084708
[2] Jordan, K., David, R., Phillips, T., & Pellini, A. (2021). Education during the Covid-19 crisis: Opportunities and constraints of using EdTech in low-income countries. Revista de Educación a Distancia, 21(65). DOI:
10.6018/RED.453621 [3] Luckin, R, & Cukurova, M. (2019). Designing educational technologies in the age of AI: A learning sciences-
driven approach. British Journal of Educational Technology, 50(6), 2824–2838. DOI: 10.1111/BJET.12861 [4] Proctorio (2022) Retrieved from proctorio.com [5] Thomas, D. A., & Nedeva, M. (2018). Broad online learning EdTech and USA universities: symbiotic
relationships in a post-MOOC world. Studies in Higher Education, 43(10), 1730-1749. DOI: 10.1080/03075079.2018.1520415
[6] United Nations. (2015). THE 17 GOALS | Sustainable Development. Retrieved from sdgs.un.org/goals

256
MEASURING THE SUCCESS OF DIGITAL TRANSFORMATION PROJECTS
Dejan Petrović1, Zorica Mitrović
1, Petar Stanimirović*
1
1 University of Belgrade – Faculty of Organizational Sciences
*Corresponding author, e-mail: [email protected]
OBJECTIVE
Digital transformation is today's reality that creates huge opportunities, but at the same time represents a great threat to many companies. Current changes in the environment as a result of the Corona virus pandemic have additionally accelerated the digital transformation of society, which began a long time ago. Digital transformation projects represent the implementation of ICT systems that combine the concepts of artificial intelligence, ERP systems and the Internet of Things (Ziyadin et al., 2019). Adequate implementation of such systems brings significant effects for organizations and society. These effects are long-term and affect the replacement of the traditional business model with completely new and innovative models based on information and communication technologies (Pihir et al., 2018). However, digital transformation projects are not always successful. Furthermore, it is not always easy to assess their success. This hypothesis is supported by the fact that there is no significant amount of scientific literature that deals with this topic. Therefore, the idea of the paper is to investigate and analyze models for evaluating the success of digital transformation projects, to identify a comprehensive list of critical success factors of such projects based on literature reviews and to connect these success factors with project success dimensions.
METHODOLOGY
Several approaches and methods were used during the conduction of paper's research and analysis of the obtained results. The definition method was applied for the purpose of determining the elements of multidimensional concept of success and individual dimensions of success of digital transformation projects. Also, this method was applied for defining the primary and important features, as well as the specific characteristics of digital transformation projects. A systematic approach was used to define an integrated model of critical success factors, which included methods of analysis and synthesis to define groups of critical success factors, their relations, as well as relations with the success dimensions of digital transformation projects. The classification method was applied to classify critical success factors within groups defined by a balanced framework of critical success factors. Certain relations between critical success factors, as well as between critical success factors and dimensions of success are abstracted for the purpose of defining an integrated model of critical success factors.
RESULTS
Based on the conducted research and analysis, it can be concluded that the success of digital transformation projects must include the analysis of three dimensions: the success of the project management process, the success of the project product and business and strategic success of the project. The success of the project management process is a dimension that measures the project management process output efficiency within internal limits, which are measured in a temporal sense during the project life cycle (Mitrovic et al, 2020; Mikovic et al, 2020). Project product success is a dimension that uses short-term focused indicators of the project management process outputs effectiveness which are used to measure success within the externally defined expected benefits of stakeholders. The business and strategic success of a project is a dimension that uses long-term focused outcome measures to measure success, which include business efficiency and strategic effectiveness, thus including internal focus on business processes and external focus on future potential. Based on the research, it was developed an analytical-synthetic methodological framework for measuring a set of critical success factors and it was defined a multidimensional concept of success in line

257
with the principles of the systems thinking approach (Mitrović, 2021). Figure 1 shows a list of grouped success factors and their relationship to the success dimensions of digital transformation projects.
Figure 1: Factors and dimensions of digital transformation projects success
CONCLUSION
The multidimensional success construct of digital transformation projects should have contained a set of the following features: output measures and outcome measures; efficiency measures and effectiveness measures; measures with internal and external focus; measures with short-term and long-term focus. Accordingly, the success of a digital transformation project can be measured through three different dimensions, namely: the success of the project management, the success of the digital transformation project product and the strategic business success. These dimensions directly depend on the success factors that are grouped into 5 groups, namely: project management process factors, customer factors, digital transformation process factors, team factors and organizational factors, which are ranked in order of importance from most important to least important.
Key words: digital transformation, project success factors, project success dimensions
REFERENCES
[1] Bhattacherjee, A. (2012). Social Science Research: Principles, Methods, and Practices. Tampa: University of South Florida.
[2] Gollner, J. A., & Baumane-Vitolina, I. (2016). Measurement of ERP-Project Success: Findings from Germany and Austria. Inzinerine Ekonomika-Engineering Economics, 27(5), 498–508.
[3] Miković R, Petrović D, Mihić M, Obradović V., & Todorović M. (2020). The integration of social capital and knowledge management – The key challenge for international development and cooperation projects of nonprofit organizations. International Journal of Project Management, 38(8), 515-533.
[4] Mitrović, Z. (2021). Integretaed model of critical Success factors for software projects, doctoral tesis. Faculty of Organizational Sciences, Belgrade.
[5] Mitrović, Z., Rakićević, A., Petrović, D., Mihić, M., Rakićević. J., & Jelisić, E. (2020). Systems Thinking in Software Projects - an Artificial Neural Network Approach. IEEE Access, 8, 213619-213635.
[6] Pihir, I.; Tomičić-Pupek, K., & Furjan, M. T. (2018). Digital Transformation Insights and Trends. In Central European Conference on Information and Intelligent Systems (pp. 141-149). Varaždin: Faculty of Organization and Informatics Varaždin.
[7] Ziyadin, S.; Streltsova, E.; Borodin, A., & Kiseleva , N. (2019). Assessment of Investment Attractiveness of Projects. Sustainability, 11, 2544, 1-16.

258
DIGITAL TRANSFORMATIONS AND SOFTWARE SOLUTIONS IN THE FIGHT AGAINST THE CORONA VIRUS IN THE
DEFENSE SYSTEM
Spasoje Mučibabić1, Zoran Obradović*
2, Goran Vukadinović
3
1University of Defense – School of National Defense
2University of Defense – Military Academy
3Serbian army
*Corresponding author, e-mail: [email protected]
OBJECTIVE
The global Corona virus pandemic, which hit humanity in early 2020, revealed a number of weaknesses in health system regulation, both at the level of individual countries and at the level of regional and global health organizations, as well as shortcomings in preventive health care and public information. consequences of a pandemic. The aim of this paper is to analyze the response to the threat to state security caused by the pandemic and to propose the principles on which to design a system that will effectively respond to similar threats in the future. The changes were necessary and urgent, and in some countries radical. During the pandemic, there was no country in the world that did not face unpredictable challenges to security threats, and the response of the countries was with varying degrees of success, measured by the number of infected, cured and deceased and the degree of economic and social stability. The stability of all systems was threatened, and the consequences were enormous and for some systems catastrophic and still present. The pandemic is still not over and no country has yet declared an end. Most of the changes were in health systems, which were first improved at the beginning of the pandemic, and in some countries the collapse of the health system caused radical changes in the organization and digital transformation of the protection system with the application of new software solutions. Digital transformations and software solutions in the fight against coronavirus in the defense system will be the focus of work, with special emphasis on the functioning of the military health system, as well as the tertiary health care system in the Ministry of Defense of the Republic of Serbia. The transformation of the system and the adaptation to the new circumstances in the conditions of the pandemic have led to the development of numerous software solutions in the Ministry of Defense. The solutions refer to the adjustment of the organization for the effective keeping of records of sick and deceased, monitoring the course of the disease, analysis of the effects of the proposed therapy, organization of vaccination and its effects and timely informing the public.
METHODOLOGY
The methodological approach to the research will be based on the analysis of the content of documents, comparative analysis of quantitative indicators and functional synthesis.
RESULTS
The results of the research will be presented in the form of a proposal of principles that will be the basis for responding to future similar risks, mainly within the competence of the Ministry of Defense.

259
CONCLUSION
The obtained research results can be applied to the design of a health care system that will be able to effectively perform tasks in a pandemic.
Keywords: digital transformations, software solutions, pandemic, health care system, defense system.
REFERENCES
[1] Byttebier, K., (2022). Covid-19 and Capitalisam. New York: Springer International Publishing. [2] Jovanović, D. (2021). Vreme korone. Beograd: Vukotić Media. [3] Kremergord, P. (2021). Digitalna transformacija. Beograd: Kovačnica priča. [4] Milenković, M., & Nikolić. J. (2021). Adaptacija vojnih i civilnih organa novom bezbednosnom okruženju.
Beograd: Beogradski centar za bezbednosnu politiku. [5] Mučibabić, S. (2020). Kako se Srbija suočila sa pandemijom, Pečat. Retrieved from
www.pecat.co.rs/2020/05/kako-se-srbija-suocila-s-pandemijom/ (accessed June 01st,
2022) [6] Panarin, I. (2019). Hibridni rat: teorija i praksa. Beograd: Udruženje Milutin Milanković. [7] Pešić, M., (2021). Dnenvik korona ratnika. Beograd: Nova poetika. [8] Rodžers, D. (2021). Vodič kroz digitalnu transformaciju. Beograd: Finesa. [9] Yassine, M. (2022). Advances in Information, Communication and Cybersecurity. New York: Springer
International Publiching. [10] Zbornik radova, (2019). Primena digitalizacije u kulturi i nauci. Beograd: Institut za uporedno pravo. [11] Zhpineg, F. (2021), Busines Inteligence and Information Technology. New York: Springer International
Publiching.

260
DIGITALISATION OF CONSTRUCTION INDUSTRY IN SERBIA – NEW BUIDLING
OF THE FACULTY OF ORGANISATIONAL SCIENCES CASE STUDY
Željko Zugić*1, Sandra Nedeljković
1
1 Government of Republic of Serbia – Public Investment Management Office
*Corresponding author, e-mail: [email protected]
OBJECTIVE
Construction industry is slower compared to other industries when it comes to adapting to new technologies. The investments of the construction industry in information technologies amount less than one percent of revenues. Despite the Fourth Industrial Revolution, the construction industry still needs time to adjust. (Public) Investor have realized the benefits of digitalization and BIM technology is increasingly demand. The Strategy of Scientific and Technological Development of the Republic of Serbia emphasizes that budget support for research is also realized through the project "Research and Development in the Public Sector". This support includes investments in revitalizing public sector research and development in Serbia, including the modernization of existing research capacities and infrastructure. The Council of Ministers for Innovative Entrepreneurship and Information Technologies supports projects for the construction and development of Science and Technology Parks, expanding the capacity of faculties that implement study programs in the field of IT and strengthening the capacity of scientific research institutes. One of the most important newly built facilities is New Building of Faculty for Organizational Sciences, where the innovative BIM approaches have been tested in order to digitalize the project management and construction implementation process.
METHODOLOGY
The construction of a new building of the Faculty of Organizational Sciences (FON) of the University of Belgrade, as one of the first public capital project where BIM technologies are implemented in Republic of Serbia is used as a case study for research of all the benefits of digital transformation of construction sector in Serbia. The experiences of another similar projects has been evaluated. It was detected that BIM is considered the most representative digital technology and information aggregator in construction globally. While it promises to modernize construction, its adoption has created new challenges, particularly around leadership, communication and collaboration. The impact of digital does not only pertain to technological aspects and operational improvements but also implicate commitment and trust (Liu et al., 2016) and affects coordination (Bryde et al., 2013) and collaboration (Barlish & Sullivan, 2012). The review of the implications of digital transformation with regards to professionals, projects and organizations in public facilities sector has been made. All the advantages of using for during planning, designing, and construction on this educational facility as a unique case study has been observed. The verification of the constructed and equipped new learning spaces (Tanic et al., 2020) has been performed, in order to fulfill the requirements the most advanced digitalization trends in education.
RESULTS
The integrated 6D project management using BIM (Liu et. al., 2016) in combination with the advanced construction management applied on this project provided the excellent results and prompt completion of the building despite the actual turbulences in construction industry, lack of labor and material supply.

261
The applied approaches on new building of Faculty of Organizational Science, University of Belgrade represents ideal basis for energy savings and less expenses on facility management. In case of realization of idea for long term - fully implementation of the BIM software solutions, the faculty representatives will be less stressed by dealing with building management that will have positive effects on the quality of the lectures and scientific results.
CONCLUSION
After the successfully completed construction project by using BIM technology, the further steps should be to establish system, using smart cloud technology and integrating data (Pavon et al., 2020) with Computerized Maintenance Management System (CMMS), for both existing and new building that will be significant tool for:
Creating achievable deferred maintenance strategies
Maintaining existing systems and installing new equipment
Balancing investments in new versus existing building space
Determining where to renovate, repurpose or replace the part for both existing and newly built facility Although most of the reviewed sampled studies examine the impact of digital transformation at a project level, the future recommendations and proposed remedies focus on organizational and ecosystem levels of public facilities such as new building of Faculty of Organizational Science, University of Belgrade.
Keywords: digitalization, construction industry, building information management (BIM), facility management and maintenance
REFERENCES
[1] Barlish, K., & Sullivan, K. (2012). How to Measure the Benefits of BIM – A Case Study Approach. Automation in Construction, 24, 149-159. DOI: 10.1016/j.autcon.2012.02.008
[2] Bryde, D., Broquetas, M., & Volm, J. M. (2013). The project benefits of building information modelling (BIM). International Journal of Project Management, 31(7), 971-980.
[3] Poirier, E. A., Forgues, D., & Staub-French, S. (2017). Understanding the impact of BIM on collaboration: a Canadian case study. Building Research & Information, 45(6), 681-695. DOI: 10.1080/09613218.2017.1324724
[4] Liu, Y., Van Nederveen, S., & Hertogh, M. (2016). Understanding effects of BIM on collaborative design and construction: An empirical study in China. International Journal of Project Management, 35(4), 686-698. DOI:
10.1016/j.ijproman.2016.06.007 [5] Pavon, R. M., Arcos Alvarez, A. A., & Alberti, M. G. (2020). BIM-Based Educational and Facility Management of
Large University Venues. Applied Sciences, 10, 7976. DOI: 10.3390/app10227976 [6] Tanic M., Nikolic V., & Žugić. Ž. (2020). The spatial model of the classroom and its immediate surroundings: a
variety of learning spaces. Current Science, 118(9), 1354-1364.

262

263
MANAGING HUMAN RESOURCES IN POST-COVID
ERA

264
WORKING FROM HOME, WORK-RELATED ATTITUDES, WORK-LIFE
BALANCE AND EMPLOYEE WELL-BEING – IMPLICATIONS FOR HRM IN THE POST-
COVID ERA
Biljana Bogićević Milikić*1, Ana Aleksić Mirić
1, Nebojša Janićijević
1
1University of Belgrade – Faculty of Economics and Business *Corresponding author, e-mail: [email protected]
THEORETICAL BACKGROUD
The use of flexible working arrangements is only one of the many available strategies that provides the employer with opportunities to improve their own ability to attract and retain talented employees through various ways of organizing work (either in terms of work location or employee work schedule). Among the various flexible practices, working from home (WFH) has become particularly important in the last years due to the outbreak of the COVID 19 virus. Companies had to adapt quickly and find new, flexible forms of organization in order to achieve their goals and social roles, while providing the necessary level of health care for employees and clients. Thus, WHF has proven to be not only an important business strategy for attracting and retaining talent, but also a key strategy for ensuring the health and safety of employees. WHF means a work arrangement in which the employee fulfils the key tasks and essential responsibilities of his job while staying at home, using information and communication technology (ICT) (ILO, Employers' Guide to Working From Home in Response to the Outbreak of COVID-19 Geneva: International Labour Office, 2020).
PURPOSE OF STUDY
Numerous studies suggested that employees are willing to abandon their current job for another one that offers WHF opportunity (Prasad et al., 2020; Molino et al., 2020). However, different studies reveal controversial evidence regarding the influence of WHF on work-related attitudes, employee well-being and work-life balance. On one hand, there is strong support for claiming that WFH brings a number of benefits to the employees, such as improved job satisfaction and work-life balance, more flexibility to work and enhanced employee engagement (Grant et al., 2013), as well as less stress and better well-being (Prasad et al., 2020). On the other hand, there is an evidence that WHF may lead to poor well-being and work-life balance and dramatically increased work overload and workplace pressure (Barber & Santuzzi, 2015; Molino et al., 2020; Tietze & Musson, 2005; Charalampous et al., 2019), which can negatively affect job performance (Grant et al., 2019). In this paper we search for a better understanding of the relationhip between WHF, work-related attitudes (namely job satisfaction and organizational commitment), work-life balance and employee well-being.
METHOD
We undertook research among 2,171 employees in different industry sectors in Serbia during 2021. The research started in March 2021, when many organizations in Serbia have already introduced WHF as a work practice. The sample included only respondents who have experienced WHF since the beginning of the COVID 19 pandemic in Serbia. We investigate the influence of different moderators of these relationships including the following: age, length of service, marital status, education level, gender, type of job, hierarchical position, number and age of children, size of the organization, industry sector and previous experience in WFH. To measure variables Job Satisfaction (JS), Organizational Commitment (OC), Work-life balance
265
(WLB) and employee well-being (EWB) we used instruments which yielded high internal consistency in the previous research (Warr et al., 1979; Meyer et al., 1993; Hayman, 2005; WHO 5-item well-being scale - WHO-5, respectively). Statistical analysis was performed using t-test for testing equality of means, z-test for testing equality of proportion, hi-square test and some nonparametric tests to confirm the results obtained using parametric tests. For numerical variables we used t-test for testing equality of means. As the answers offered in the questionnaire follow Likert item logics, like 1-Completely disagree, 2–Disagree, 3-Neither agree or disagree, 4-Agree, 5-Completely agree, results of the test have been checked by the application of non-parametric tests.
FINDINGS
Preliminary findings signify: lack of previous experience in applying WHF; increase in the length of working hours; some resistance to WHF; most employees would choose a balance in which office work dominates, but there is also WHF, at least one day a week; majority of employees report feeling cheerful and moody, calm and relaxed and active and energetic, when WHF, while slightly different results are recorded in the field of physical well-being; overall work-life balance is not interrupted. More detailed results will be included in the final paper.
THEORETICAL CONTRIBUTION AND PRACTICAL IMPLICATIONS
We belive that the research findings will contribute to theory building in providing better understanding of the employees` standpoint when WHF the multilevel nature of organizations. Research findings generate new knowledge about COVID-19 pandemic’s impact on organizations and workforce, whereby it will contribute to their readiness to respond to some future evolving, unpredictable threats. Results may be found useful for the stakeholders of organizations, including owners, managers, and employees, as well as public policy-makers and academia.
Keywords: working from home, work-related attitudes, work-life balance
REFERENCES
[1] Barber, K. L., & Santuzzi, A. M. (2015). Please respond ASAP: Workplace tele pressure and employee recovery. Journal of Occupational Health Psychology, 20(2), 172-189.
[2] Charalampous, M. et al.(2019). Systematically reviewing remote-workers' wellbeing at work: A multidimensional approach. European Journal of Work and Organizational Psychology, 28(1), 51-73.
[3] Grant, C. A. et al. (2013). An exploration of the psychological factors affecting remote e‐worker's job
effectiveness, wellbeing and work‐life balance. Employee Relations, 35(3), 527-546.
[4] Grant, C. A. et al. (2019). Construction and initial validation of the e-work life scale to measure remote e-working. Employee Relations, 41(1), 16-33.
[5] Hayman, J. (2005). Psychometric Assessment of an Instrument Designed to Measure Work Life Balance. Research and Practice in Human Resource Management, 13(1), 85-91.
[6] Meyer, J., Allen, N., & Smith, C. (1993). Commitment to organizations and occupations: Extension and test of a three-component conceptualization. Journal of Applied Psychology, 78(4), 538-551.
[7] Molino, M. et al. (2020). Wellbeing costs of technology use during Covid-19 remote working: An investigation using the Italian translation of the technostress creators scale. Sustainability, 12(15), 5911.
[8] Prasad, D. K. et al. (2020) Organizational climate, opportunities, challenges and psychological wellbeing of the remote working employees during COVID-19 pandemic: A general linear model approach with reference to information technology industry in Hyderabad. International Journal of Advanced Research in Engineering and Technology (IJARET), 11(4), 372-389.
[9] Tietze, S., & Musson, G. (2005). Recasting the home-work relationship: A case of mutual adjustment?. Organization Studies, 26(9), 1331-1352.
[10] Warr, P., Cook, J., & Wall, T. (1979). Scales for the measurement of some work attitudes and aspects of psychological well-being. Journal of Occupational Psychology, 52(2), 129-148.

266
THE EFFECTS OF PERCEIVED ORGANIZATIONAL SUPPORT ON
EMPLOYEES WELL-BEING IN POST COVID ERA
Andrea Malović*1, Valentina Marković
1
1University of Belgrade – Business Performance Management *Corresponding author, e-mail: [email protected]
OBJECTIVE
According to the Theory of Organizational Support (OST: Eisenberger, Huntington, Hutchinson, & Owl, 1986), in order to meet socio-emotional needs and assess the benefits of increased work effort, employees form a general perception of the extent to which the organization values their contributions and cares for their well-being. Perceived organizational support refers to the perception of employees about the extent to which the organization values their contribution and cares about their well-being. The experience of organizational support increases the sense of commitment of employees to help the organization achieve its goals, their affective commitment to the organization, and their expectation that improved performance will be rewarded. The behavior of the employer, which supports and strives for employee development, such as providing useful feedback or being available to discuss certain challenges in the workplace, encourages employees to reshape the boundaries of their jobs. When this situation is monitored, then the opportunities for job creation are greater if there is high perceived organizational support. Perceived organizational support provides emotional support, positive self-esteem, approval, and belonging (Lee & Peccei, 2007), all of which improve work engagement (Zacher & Winter, 2011). The World Health Organization defines burnout syndrome as "a condition caused by chronic stress at work." Burnout at work is characterized by emotional exhaustion, lack of energy, physical fatigue, psychological illness, pessimism, anger, depression, and lack of individual success. Emotional exhaustion is associated with excessive and exhaustive work commitments that employees set for themselves, and the existence of feelings that they are emotionally "individual" and exhausted from work. One of the psychological results of major stress is job burnout which suggests the status of exhaustion. This problem is followed by being pessimistic about the values of others work and losing the feeling of being valuable (Gorji, 2018). Several recent studies have found an increased level of burnout in health care professionals exposed to the pandemic. At the opposite, some studies found that burnout level could be lower in physicians who actively fought with the virus (Mion et al., 2021).
METHODOLOGY
Data collection was realized in the form of an online survey in Montenegro. The online survey had three parts. The first part was the scale of Perceived Organizational Support and they answered on a 5-point Likert scale. The second part was the scale of the Burnout Assessment Tool. The original scale has 36 questions and 5 subscales. The 5 subscales were mental exhaustion, mental distance, cognitive exhaustion, emotional exhaustion, and secondary symptoms. The third part were questions about themselves. Each individual in the sample agreed to fill out the survey under the above conditions. We had 201 (65 male and 136 female) respondents and all of them were employed.
RESULTS
Our main hypothesis was perceived organizational support is connected with burnout of employees (Table 1).
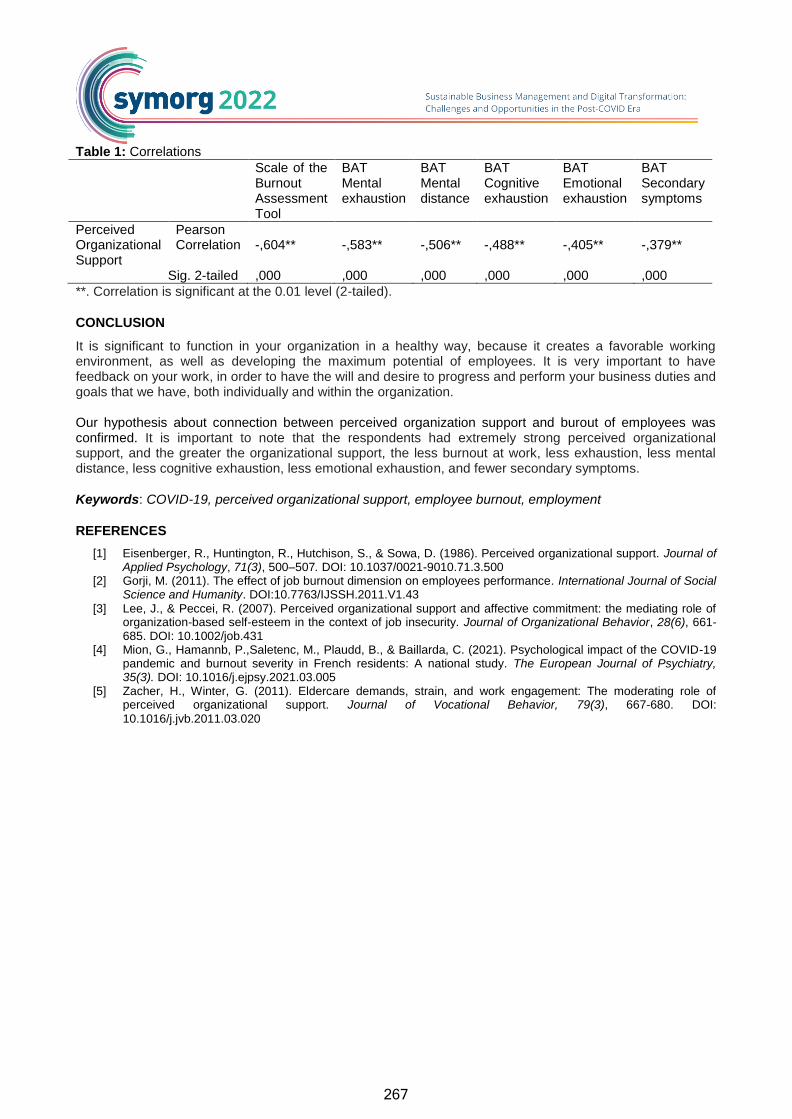
267
Table 1: Correlations
Scale of the Burnout Assessment Tool
BAT Mental exhaustion
BAT Mental distance
BAT Cognitive exhaustion
BAT Emotional exhaustion
BAT Secondary symptoms
Perceived Organizational Support
Pearson Correlation -,604** -,583** -,506** -,488** -,405** -,379**
Sig. 2-tailed ,000 ,000 ,000 ,000 ,000 ,000
**. Correlation is significant at the 0.01 level (2-tailed).
CONCLUSION
It is significant to function in your organization in a healthy way, because it creates a favorable working environment, as well as developing the maximum potential of employees. It is very important to have feedback on your work, in order to have the will and desire to progress and perform your business duties and goals that we have, both individually and within the organization. Our hypothesis about connection between perceived organization support and burout of employees was confirmed. It is important to note that the respondents had extremely strong perceived organizational support, and the greater the organizational support, the less burnout at work, less exhaustion, less mental distance, less cognitive exhaustion, less emotional exhaustion, and fewer secondary symptoms.
Keywords: COVID-19, perceived organizational support, employee burnout, employment
REFERENCES
[1] Eisenberger, R., Huntington, R., Hutchison, S., & Sowa, D. (1986). Perceived organizational support. Journal of Applied Psychology, 71(3), 500–507. DOI: 10.1037/0021-9010.71.3.500
[2] Gorji, M. (2011). The effect of job burnout dimension on employees performance. International Journal of Social Science and Humanity. DOI:10.7763/IJSSH.2011.V1.43
[3] Lee, J., & Peccei, R. (2007). Perceived organizational support and affective commitment: the mediating role of organization-based self-esteem in the context of job insecurity. Journal of Organizational Behavior, 28(6), 661-685. DOI: 10.1002/job.431
[4] Mion, G., Hamannb, P.,Saletenc, M., Plaudd, B., & Baillarda, C. (2021). Psychological impact of the COVID-19 pandemic and burnout severity in French residents: A national study. The European Journal of Psychiatry, 35(3). DOI: 10.1016/j.ejpsy.2021.03.005
[5] Zacher, H., Winter, G. (2011). Eldercare demands, strain, and work engagement: The moderating role of perceived organizational support. Journal of Vocational Behavior, 79(3), 667-680. DOI:
10.1016/j.jvb.2011.03.020

268
BURNOUT SYNDROME AMONG PRIMARY HEALTH CARE EMPLOYEES DURING
COVID-19 PANDEMIC
Maja Matejić1, Jelena Anđelković Labrović
2*
1Health Center "Dr Milutin Ivković"
2University of Belgrade - Faculty of Organizational Sciences
*Corresponding author, e-mail: [email protected]
OBJECTIVE
Since the beginning of the COVID-19 pandemic, health workers have worked in difficult conditions. Limited resources, longer shifts, sleep and / or work-life balance, and occupational hazards associated with exposure to COVID-19 patients have contributed to adverse psychological outcomes among healthcare professionals in terms of post-traumatic stress disorder, insomnia, anxiety, and depression (Jianbo, 2020). Despite the emergence of new vaccines, there is significant uncertainty about how long the SARS-COV2-2 pandemic will last (Hu, 2020). The whole situation related to the pandemic has led to mass burnout, which further results in the intention to leave the profession, which would eventually lead to chaotic consequences and a potential collapse of the health system (Jianbo, 2020). Maslach and Jackson (2018) defined burnout syndrome as multidimensional stress syndrome consisting of mental fatigue-emotional exhaustion and negative perceptions and feelings towards clients and patients-depersonalization. According to the World Health Organization and the definition from 2019, burnout is a syndrome which occurs as a result of chronic stress in the workplace which has not been successfully managed. Namely, one of the causes of burnout syndrome is setting too high demands in front of a person who does not have enough resources to fulfill them. Symptoms such as fatigue, frequent headaches, exhaustion, insomnia and gastrointestinal disorders, as aspects of the physical manifestation of burnout syndrome. It seems to be that health workers are especially exposed to burnout risk (Shanafelt, 2003). In a study (Schanafelt et al., 2012) that compared burnout frequency between American physicians and a population control sample, it is shown that burnout symptoms occurred within 37.9% physicians, compared to 27.8% in control population. Report provided by Medscape on burnout syndrome and suicide for 2020 reported burnout rate of about 43%, which is still quite similar to 46% reported in 2015 and 39.8% in 2013. Athens et al. (2015) examining burnout syndrome showed that nurses and doctors in primary health care are most susceptible to perceived stress, similarly to a lower level of well-being.
METHODOLOGY
The aim of this study was to investigate whether SARS-COV2-2 pandemic has resulted in high level of burnout among healthcare workers and general hypotheses was set supposing that symptoms of burnout syndrome are present in health care workers employed in primary health care. The questionnaire was created for data collection consisting of two parts: the questionnaire on general socio-demographic data of respondents and the CBI-Copenhagen Burnout Inventory (Wood et al., 2020). The research was conducted during 2021, in which 200 health workers employed at the Health Center "Dr Milutin Ivković" in Belgrade participated.
RESULTS
General results show that the burnout of health workers who participated in this study is moderate, and the percentages of subscales show that high burnout exists on a personal level and on a professional, although it is shown that healthcare workers burnout is not connected to working with patients. Additionally it is shown

269
that the level of burnout among healthcare workers is connected with working role, working environment and changes at the workplace.
CONCLUSION
The data obtained in this study clearly indicate the need for the future research on this topic. It would be interesting to examine the general satisfaction of health workers and how much burnout affects its level. Specifically, for this situation it would be of great importance to promote the mental well-being of health workers exposed to COVID-19, and to take concrete measures to protect against further burnout.
Keywords: COVID-19, burnout, healthcare workers
REFERENCES
[1] Jianbo, L. S. M. (2020). Factors Associated With Mental Health Outcomes Among Health Care Workers. JAMA Network Open, e203976. DOI: 10.1001/jamanetworkopen.2020.3976
[2] Hu, D. (2020). Frontline nurses' burnout, anxiety depression, and fear statuses and their associated factors during the COVID-19 outbreak in Wuhan China: a large-scale crosssectional study. EClinicalMedicine, 100424. DOI: 10.1016/j.eclinm.2020.100424
[3] Maslach, C., & Jackson, S. E. (2018). The measurement of experienced burnout. Journal of Organizational Behavior, 2(2), 99-113. DOI: 10.1002/job.4030020205
[4] Shanafelt, T. D. (2003). The well-being of physicians. The American Journal of Medicine, 114(6), 513-519. DOI: 10.1016/S0002-9343(03)00117-7
[5] Shanafelt, T. D. (2012). Burnout and satisfaction with work-life balance among US physicians relative to the general US population. Archives of Internal Medicine, 172(18), 1377-1385. DOI: 10.1001/archinternmed.2012.3199
[6] National Report 2020 (2020). Retrieved on 15 Octeber 2021. Retrieved from Medscape: www.medscape.com/slideshow/2020-lifestyle-burnout-6012460
[7] Atanes, A., Andreoni, S., Hirayama, M. S., Montero-Marin, J., Barros, V. V., Ronzani, T. M., ... & Demarzo, M. M. (2015). Mindfulness, perceived stress, and subjective well-being: a correlational study in primary care health professional. BMC Complementary and Alternative Medicine, 15(1), 1-5. DOI: 10.1186/s12906-015-0823-0
[8] Wood, B. A., Guimaraes, A. B., Holm, C. E., Hayes, S. W., & Brooks, K. R. (2020). Academic librarian burnout: A survey using the Copenhagen Burnout Inventory (CBI). Journal of Library Administration, 60(5), 512-531. DOI: 10.1080/01930826.2020.1729622

270
STUDENTS DIGITAL COMPETENCIES DURING ONLINE LEARNING: ARE THEY
READY FOR THE POST-COVID ERA?
Ivona Živković*1, Ivana Kužet
1, Nikola Petrović
1
1 University of Belgrade – Faculty of Organizational Sciences *Corresponding author, e-mail: [email protected]
OBJECTIVE
The main motivation for dealing with the topic of digital competencies among students came up after mass transition to online learning, as a result of the COVID 19 pandemic. The aim of this research was to provide insight into the level of digital competencies among students from the different fields of study, and how they see the support of their professors in the process of developing digital competencies during online learning. For both students and professors, online learning was a particularly challenging process. Although the online environment has benefits such as collaborative learning and online exams and assessments (Marcelo & Yot-Dominiguez, 2019), teachers and students use only a limited number of digital tools. Korkmaz and Toraman in their research explained problems which professors had, such as internet connection problems, lack of educator-student interaction, lack of student motivation (Korkmaz & Toraman, 2020). On the other hand, today’s new generation of students is seen as “digital natives,” more digitally attuned and adept (Peimani & Kamalipour, 2021). In the online learning environment, researchers confirmed advanced level of digital skills among students, because of their previous experience with online learning platforms (Kovačević et al, 2021), or experience in digital informal learning (Heidari et al., 2021).
METHODOLOGY
For the purposes of this paper, we have designed a questionnaire which consisted of two sets of questions. The first set of questions has 22 statements related to the self-assessment of digital competencies, based on a digital competence framework (Carretero et. al., 2017), including 5 areas of competencies: information and data literacy, communication and collaboration, content creation, security and problem-solving in the digital environment. The second set of questions includes 10 statements referring to students’ perceptions about professors’ readiness to work in the digital environment and their support in the development of digital competencies among students. The sample consisted of 691 respondents, mostly from the first year of study, from different faculties: Faculty of Organizational Sciences (73%), Faculty of Transport and Traffic engineering (16%), Faculty of Medicine (4%), Faculty of Philology (4%) and Faculty of Agriculture (3%).
RESULTS
The results indicate that students have the most developed digital competencies related to communication and collaboration, followed by problem solving. Less developed competencies are from the area of information and data literacy and safety. The lowest level of digital competence is related to digital content creation (see Table 1). When it comes to students’ assessment of professors’ readiness to work in the digital environment and their support in the development of digital competencies among students, the average score was 3,58 (on a scale 1-5). The highest average value was measured for the statement that professors use different platforms for communication with students (4,62), and lowest value was measured for the statement that professors draw students' attention to the dangers of using digital technologies (2,52).

271
Table 1: Average score for digital competencies on a scale 1-5
Area of competencies Mean St. Deviation
Information and data literacy 3,957 0,699
Communication and collaboration 4,368 0,470
Digital content creation 2,996 0,847
Safety 3,725 0,786
Problem solving 4,039 0,698
CONCLUSION
In the Post-Covid era, we expect an elevated level of digital competences among young people entering the work environment, especially in the field of communication and collaboration. On the other hand, there is a question about their interpersonal competencies, face-to-face communication, and teamwork in the absence of live interaction. The suggestion for future research is to examine the level of interpersonal competencies among students who only had experience with an online learning environment.
Keywords: digital competencies, Covid 19, student perception of professors’ support
REFERENCES
[1] Carretero, S., Vuorikari, R., & Punie, Y. (2017). DigComp 2.1: The Digital Comeptence Framework for Citizens
with Eight Proficiency Levels and Examples of Use. European Union: Brussels, Belgium
[2] Heidari, E., Mehrvarz, M., Marzooghi, R., & Stoyanov, S. (2021). The role of digital informal learning in the
relationship between students' digital competence and academic engagement during the COVID-19
pandemic. Journal of Computer Assisted Learning, 37(4), 1154-1166.
[3] Korkmaz, G. & Toraman, Ç. (2020). Are we ready for the post-COVID-19 educational practice? An investigation
into what educators think as to online learning. International Journal of Technology in Education and Science,
4(4), 293-309.
[4] Kovačević, I., Labrović, J. A., Petrović, N., & Kužet, I. (2021). Recognizing Predictors of Students’ Emergency
Remote Online Learning Satisfaction during COVID-19. Education Sciences, 11(11), 693.
[5] Marcelo, C., & Yot-Domínguez, C. (2019). From Chalk to Keyboard in Higher Education Classrooms: Changes
and Coherence when Integrating Technological Knowledge into Pedagogical Content Knowledge. Journal of
Further and Higher Education, 43(7), 975-988. DOI: 10.1080/0309877x.2018.1429584
[6] Peimani N., & Kamalipour H. (2021). Online Education in the Post COVID-19 Era: Students’ Perception and
Learning Experience. Education Sciences, 11(10), 633. DOI: 10.3390/educsci11100633

272
STUDENTS’ PERCEPTIONS OF PERSONAL BRANDING IN GREECE:
IMPACTS ON CAREER ACHIEVEMENT ASPIRATIONS
Achilleas Anagnostopoulos*1, Sophia Koustas
2, Ivana Kovačević
3
1University of Thessaly
2Southern New Hampshire University
3University of Belgrade – Faculty of Organizational Sciences
*Corresponding author, e-mail: [email protected]
INTRODUCTION
Personal branding is a concept that during the last decade gained tremendous interest in marketing as well as in the organisational behaviour literature. It has been recognized as an important career competence to achieve success in the contemporary work environment. Personal brand is a set of characteristics of an individual (attributes, values, beliefs, etc.) rendered into a differentiated narrative and imagery with the intent of establishing a competitive advantage in the minds of the target audience (Gorbatov, 2018). In higher education, students build knowledge and skills (employability) in order to elevate their marketability. On the other hand, the contemporary employment environment and increased amount of flexible work arrangements require individuals to become much more market-oriented (Manai & Holmlund, 2015).
PURPOSE
The purpose of the research was to investigate the way Greek university business students perceive personal branding as a tool for job recruitment. In addition, we focus on students’ perceptions of both traditional and internet/social media personal branding methods. Therefore, the literature suggests that individuals are more likely to engage in personal branding when they perceive a career-related benefit. Thus, we would also like to study whether students who may engage more in personal branding have strong intentions of career achievement aspirations. Such attitude is encapsulated in the concept of career achievement aspiration by Gregor and O’Brien (2016). The aforementioned authors suggested achievement, leadership, and educational factors of career aspiration, but, given the diversity of career experiences where individuals may apply personal branding, we focused on career achievement as well as educational aspiration.
DESIGN/METHODOLOGY/APPROACH
The main aim of this study was to examine the positive relationship between students who engage in personal branding and achieve greater career achievements. We also used gender, age, year of study, and city size as control variables to examine if they approach personal branding differently. The study, still in progress, based on 100 questionnaire surveys will be collected in April-May2022 among the bachelor's and master's students of the Faculty of Business & Economic Science at the University of Thessaly in Greece. We follow the steps of Gorbatov et al (2019) who developed and measured personal branding by the 18-item scale based on three factors (strategic, differentiated, and technologically savvy). Moreover, we explore students’ usage of traditional and novel ways to be noticed by future employers based on Delonia et al (2020) paper. Therefore, in order to approach students’ career achievement aspirations, we used the revised instrument Career Aspiration Scale-Revised (CAS-R) constructed by Gregor and O’Brien (2016).
273
FINDINGS
Since data collection is still ongoing, preliminary findings show that in personal branding students from the first year are not focused on the development of their own brand in contrast to students in the fourth year, who try to build their personal brand as they are more aware how to create it. Moreover, “primary” results indicate that it is still important for students to use more traditional personal branding methods (interviewing, resumes, and referrals) to get hired than using internet/social media ones.
RESEARCH AND PRACTICAL LIMITATIONS/IMPLICATIONS
Our study has a limited scope, it needs to be expanded to the students of more diverse majors and possibly different universities and different countries to obtain an overall picture.
Keywords: personal branding, career aspiration, recruitment
REFERENCES
[1] Minor-Cooley, D., & Parks-Yancy, R. (2020). The Power of the Brand: Personal Branding and Its Effect on Job Seeking Attributes. Journal of Internet Commerce, 19(3), 241-261, DOI: 10.1080/15332861.2020.1777028
[2] Gorbatov, S, Khapova, S. N., & Lysova, E: (2019). Get Noticed to Get Ahead: The Impact of Personal Branding on Career Success. Frontiers in Psychology. DOI: 10.3389/fpsyg.2019.02662
[3] Gregor, M. A., & O’Brien, K. M. (2016). Understanding career aspirations among young women. Journal of Career Assessment, 24, 559-572. DOI: 10.1177/1069072715599537
[4] Manai, A., & Holmlund, M. (2015). Self-marketing brand skills for business students. Marketing Intelligence and Planning, 33, 749-762. DOI: 10.1108/MIP-09-2013-0141

274
THE IMPACT OF PERCEIVED JOB INSECURITY ON MILLENNIAL WORKERS'
ORGANIZATIONAL COMMITMENT
Ivana Jolović1, Nemanja Berber*
2
1University of Novi Sad – Faculty of Technical Sciences
2University of Novi Sad – Faculty of Economics in Subotica
*Corresponding author, e-mail: [email protected]
OBJECTIVE
The coronavirus-caused economic downturn has spurred mass layoffs, involuntary part-time engagements, and fixed-term employment. Simultaneously, a number of worldwide workers felt unhealthy work-related pressures, faced job insecurity, and developed anxiety. The youngest among them, caught by the global crisis for the first time in their workplaces, proved to be an equally or even more psychologically and economically vulnerable cohort than their colleagues of older age (Huang et al., 2021). Their attitude and tolerance towards an organization not capable of protecting its workforce integrity is an issue worth examining. Hence, the research aims to examine organizational commitment as a short-term consequence of job insecurity (Tian et al., 2014), and as a crucial determinant of young employees’ allegiance to the organization. The main research hypothesis assumes that perceived job insecurity has a negative, statistically significant impact on the organizational commitment of millennial workers, and it is set based on previous studies regarding former and more mature labor market participants (Lee & Jeong, 2017; Shoss, 2017; Furåker & Berglund, 2015). Contribution to the latest knowledge could be recognized in the innovative scrutiny of attitudes developed by workers in ascending phase of their careers who are expected to dominate the global labor market in the years to come.
METHODOLOGY
The research is built on current empirical knowledge extracted from literature closely related to employees’ perceived job insecurity and its connection to organizational commitment as a successive work attitude. A survey was undertaken on 99 millennial generation representatives employed in the Republic of Serbia via an online questionnaire. The primary data was collected during 2021 and subsequently processed in SmartPLS statistical software by employing the disjoint two-stage approach. For estimation of higher-order constructs, five lower-order constructs and 25 indicators were engaged. The first higher-order construct - perceived job insecurity, included quantitative and qualitative job insecurity; while affective, continuous, and normative organizational commitment were encompassed by organizational commitment as the second higher-order construct. The following graphs illustrate a two-stage research model’s design.
Figure 1: Overview of the research model according to the disjoint two-stage approach, I stage

275
Figure 2: Overview of the research model according to the disjoint two-stage approach, II stage
RESULTS
The obtained research results unveiled the existence of a negative statistically significant impact of perceived job insecurity on the organizational commitment of millennial generation employees (β=-0.551, t=8.359, p=0.000). These findings support the proposed main research hypothesis. The practical implications of research bring to light perhaps the most important challenge human resource management will have to deal with - younger employees’ concern about losing their jobs (or its features) in given organizations and the commitment loss that originates from it. Namely, in the short run, job insecurity has the capacity to decrease organizational commitment, which further possesses the potential of growing into long-term implications affecting both the individual and the organization (employee’s mental well-being and withdrawal behavior, respectively).
CONCLUSION
Amidst economic disruption triggered by the Coronavirus pandemic, the workforce’s exposure to job insecurity has increased. The millennial generation’s position in the labor market was especially exacerbated. This rising generation exits the pandemic with the mixed emotions, being pretty stressed but empowered with the lessons from the job certainty and organizational stability endeavor. The research has found that the millennials’ job insecurity perception has a negative effect on the organizational commitment this cohort manifests. The lack of organizational commitment can be problematic since it comes alongside numerous, often inconceivable consequences - declining productivity, low employee morale and devotion, higher absenteeism, and, ultimately, irrepressible turnover. The essence of research limitations is placed within the fact that only millennials employed in the Republic of Serbia were covered by the study, not providing a basis for drawing conclusions regarding the global state. In terms of research quality, a modest number of respondents should also be noted. Nevertheless, research provides a strong foundation for understanding the complexity of the relations between millennials’ job insecurity and organizational commitment and can serve as an inspiration for future research. Regarding directions for further research, the scientific community should pursue to shed light on job insecurity’s effects towards job satisfaction and, consequently, turnover intention of the millennial generation, as this can be recognized as an important research path.
Keywords: job insecurity, organizational commitment, millennials, COVID-19, PLS-SEM
REFERENCES
[1] Furåker, B., & Berglund, T. (2015). Job Insecurity and Organizational Commitment. Revista Internacional de Organizaciones, 13, 163-186. DOI: 10.17345/rio13.163-186
[2] Huang, G., Zhang, Y., Zhang, X., & Long, L. (2021). Job Insecurity, Commitment and Proactivity Towards the Organization and One’s Career: Age as a Condition. Human Resource Management Journal, 31(2), 532-552.
DOI: 10.1111/1748-8583.12322 [3] Lee, S. H., & Jeong, D. Y. (2017). Job Insecurity and Turnover Intention: Organizational Commitment as
Mediator. Social Behavior and Personality: An International Journal, 45(4), 529-536. DOI: 10.2224/sbp.5865 [4] Shoss, M. K. (2017). Job Insecurity: An Integrative Review and Agenda for Future Research. Journal of
Management, 43(6), 1911-1939. DOI: 10.1177/0149206317691574 [5] Tian, Q., Zhang, L., & Zou, W. (2014). Job Insecurity and Counterproductive Behavior of Casino Dealers: The
Mediating Role of Affective Commitment and Moderating Role of Supervisor Support. International Journal of Hospitality Management, 40, 29-36. DOI: 10.1016/j.ijhm.2014.03.005

276
ENHANCEMENT OF THE ACTIVITY EFFECTIVENESS IN THE PRODUCTION
WORKSTATIONS THROUGH HUMAN RISK FACTORS ANALYSIS
Aleksandar Aleksić*1, Danijela Tadić
1, Dragan Milanović
2
1University of Kragujevac – Faculty of Engineering,
2University of Belgrade – Faculty of Mechanical Engineering
*Corresponding author, e-mail: [email protected]
OBJECTIVE
Companies all over the world are striving to improve their business performances, and at the same time, reduce costs where it is possible. Simultaneously, the rapid technological and legal changes in industrial companies, lead to an increase in the significance of activity effectiveness enhancement in the production processes and risk analysis (Pan et al., 2019). The motivation for this research comes from the fact that there are no research papers that the problem of activity effectiveness through RFs ranking by using combining MCDMs in a type-2 fuzzy environment (Komatina et al., 2021). By using the proposed model, it can be assumed that the requirements of the new comprehensive standard ISO 45001 are fit. The research question is how to increase the productivity of operators at workstations in production while determinig the rank HRF so those could be eliminated or decreased? The objective of this research may be interpreted as the integration of AHP (Saaty, 2013), ARAS (Zavadskas & Turskis, 2010), and type 2 fuzzy sets (Mendel, 2017) for enhancement of the activity effectiveness in the production workstations through human risk factors analysis. The novelty of the research is presented through the proposed approach where HRFs are assessed in an exact manner taking in account all existing uncertainties.
METHODOLOGY
In this research (Figure 1), HRFs are treated according to (Komatina et al., 2021).
Figure 1: The two stage fuzzy model for enhancement of the activity effectiveness in the production
workstations through human risk factors analysis
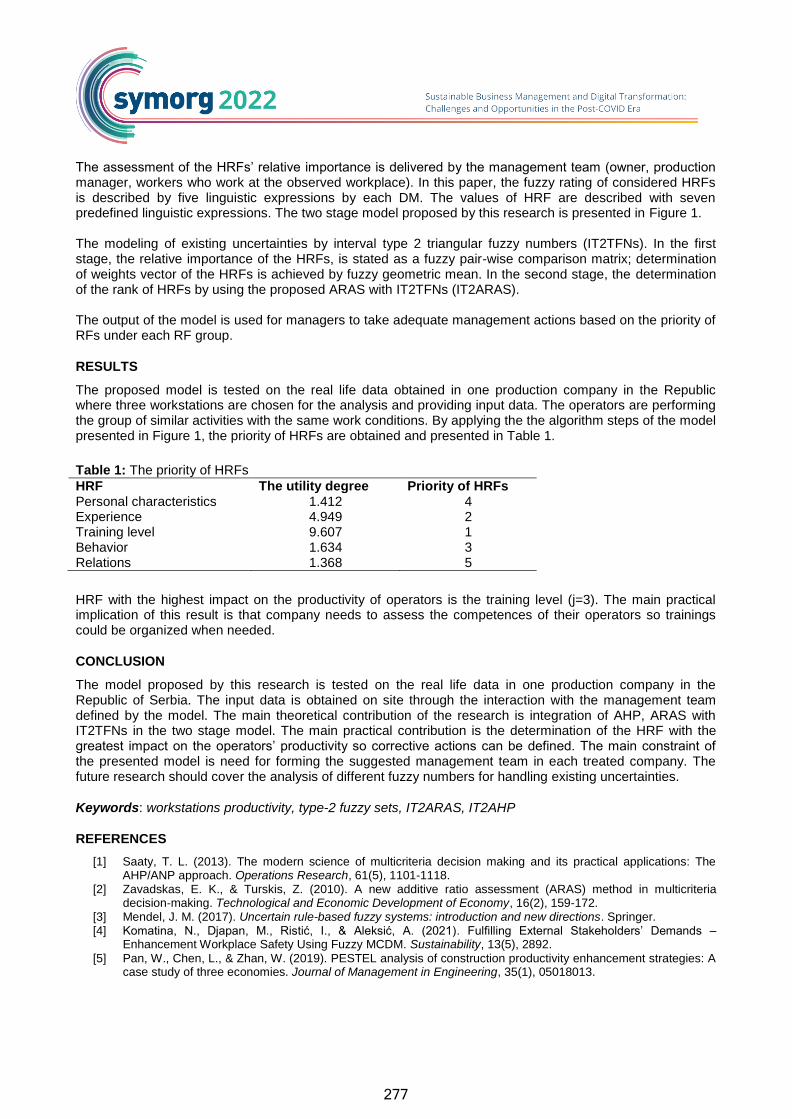
277
The assessment of the HRFs’ relative importance is delivered by the management team (owner, production manager, workers who work at the observed workplace). In this paper, the fuzzy rating of considered HRFs is described by five linguistic expressions by each DM. The values of HRF are described with seven predefined linguistic expressions. The two stage model proposed by this research is presented in Figure 1. The modeling of existing uncertainties by interval type 2 triangular fuzzy numbers (IT2TFNs). In the first stage, the relative importance of the HRFs, is stated as a fuzzy pair-wise comparison matrix; determination of weights vector of the HRFs is achieved by fuzzy geometric mean. In the second stage, the determination of the rank of HRFs by using the proposed ARAS with IT2TFNs (IT2ARAS). The output of the model is used for managers to take adequate management actions based on the priority of RFs under each RF group.
RESULTS
The proposed model is tested on the real life data obtained in one production company in the Republic where three workstations are chosen for the analysis and providing input data. The operators are performing the group of similar activities with the same work conditions. By applying the the algorithm steps of the model presented in Figure 1, the priority of HRFs are obtained and presented in Table 1.
Table 1: The priority of HRFs
HRF The utility degree Priority of HRFs Personal characteristics 1.412 4 Experience 4.949 2 Training level 9.607 1 Behavior 1.634 3 Relations 1.368 5
HRF with the highest impact on the productivity of operators is the training level (j=3). The main practical implication of this result is that company needs to assess the competences of their operators so trainings could be organized when needed.
CONCLUSION
The model proposed by this research is tested on the real life data in one production company in the Republic of Serbia. The input data is obtained on site through the interaction with the management team defined by the model. The main theoretical contribution of the research is integration of AHP, ARAS with IT2TFNs in the two stage model. The main practical contribution is the determination of the HRF with the greatest impact on the operators’ productivity so corrective actions can be defined. The main constraint of the presented model is need for forming the suggested management team in each treated company. The future research should cover the analysis of different fuzzy numbers for handling existing uncertainties.
Keywords: workstations productivity, type-2 fuzzy sets, IT2ARAS, IT2AHP
REFERENCES
[1] Saaty, T. L. (2013). The modern science of multicriteria decision making and its practical applications: The AHP/ANP approach. Operations Research, 61(5), 1101-1118.
[2] Zavadskas, E. K., & Turskis, Z. (2010). A new additive ratio assessment (ARAS) method in multicriteria decision‐making. Technological and Economic Development of Economy, 16(2), 159-172.
[3] Mendel, J. M. (2017). Uncertain rule-based fuzzy systems: introduction and new directions. Springer. [4] Komatina, N., Djapan, M., Ristić, I., & Aleksić, A. (2021). Fulfilling External Stakeholders’ Demands –
Enhancement Workplace Safety Using Fuzzy MCDM. Sustainability, 13(5), 2892.
[5] Pan, W., Chen, L., & Zhan, W. (2019). PESTEL analysis of construction productivity enhancement strategies: A case study of three economies. Journal of Management in Engineering, 35(1), 05018013.

278
THE IMPORTANCE OF CANDIDATES 'ATTITUDES TOWARDS THE FAIR
IMPLEMENTATION OF THE SELECTION PROCESS FOR EMPLOYER BRANDING
Ranka Bodiroža1, Jelena Anđelković Labrović*
2, Mladen Čudanov
2
1Greiner Packaging d.o.o.
2University of Belgrade – Faculty of Organizational Sciences
*Corresponding author, e-mail: [email protected]
OBJECTIVE
The aim of the research is 'to examine how the candidate's perception of a fair selection process affects the employer's brand. Procedural justice deals with the fairness of the processes through which information is collected and how it is used when making a decision (participation, reduction of uncertainty, interpersonal treatment and quality of two-way communication, as well as job-relatedness relative effects and relationships between selection characteristics and job attachment (Macan et al., 1994; Gilliland, 1995; Smither et al., 1993). Many studies have tended to support Gilliland's (1993) model, that is, to show the relationship between candidates' reactions to procedures used in selection and selection outcomes (e.g., perceptions of fairness of selection) and how those outcomes then affect employer branding (Macan, 2005; Macan et al., 1994; Bauer et al., 2001; Cropanzano et al., 2007). In this regard, in addition to researching the effectiveness of the selection method, it examined which dimensions of the fairness of the conducted selection process affect the employer's image.
METHODOLOGY
Two main hypotheses were stated. First, it was assumed that there is a connection between the selection method and the dimensions of procedural fairness. The second hypothesis was to check whether candidates who perceive the selection process and methods as procedurally fair will have a more positive perception of the employer brand. Base on Madigan and Macan work (2005) questionnaire was construsted focusing on 4 procedural rules that are assumed to be related to the fair selection process. Research was conducted online and 103 respondants participated.
RESULTS
In the conducted research, two significant predictors were singled out related to employer branding: the dimensions of the connection between selection methods and work and the quality of two-way communication.
CONCLUSION
It was shown that a more positive attitude towards employer branding was associated with a more positive assessment of the method's connection with work and a more positive assessment of the quality of two-way communication. It can be concluded that interviews and aptitude tests are considered equally effective methods, and the dimensions of procedural fairness that affect this assessment are precisely the dimensions of participation and job commitment. When it comes to assessing procedural fairness, the factor that most influences respondents 'later intentions to accept an offer and recommend a company or re-apply for a job is respondents' assessment that the selection process was job-related. In addition, the factor related to the

279
respondents' perception that there was reciprocity in communication during the selection, also affects the later branding of the employer. Our results are in line with the research of Miles & McCamey (2018) who find that positive candidate experience is correlated with the positive employer brand. Further, Folger et al. (2021) relate procedural justice during the selection process with the employer attractiveness, but fail to determine relations between the digital selection methods and procedural justice of the selection process.
Keywords: employer branding, employee selection process, procedural justice, candidate attitudes
REFERENCES
[1] Bauer, T. N., Truxillo, D. M., Sanchez, R. J., Craig, J. M., Ferrara, P., & Campion, M. A. (2001). Applicant Reactions to Selection: Development of the selection procedural justice scale (SPJS). Personnel Psychology, 54(2), 387-419.
[2] Cropanzano, R., Bowen, D. E., & Gilliland, S. W. (2007). The management of organizational justice. Academy of Management Perspectives, 21(4), 34-48.
[3] Folger, N., Brosi, P., Stumpf-Wollersheim, J., & Welpe, I. M. (2021). Applicant Reactions to Digital Selection Methods: A Signaling Perspective on Innovativeness and Procedural Justice. Journal of Business and Psychology, 1-23. DOI: 10.1007/s10869-021-09770-3
[4] Gilliland, S. W. (1995). Fairness of the applicant's perspective: Reactions to employee selection procedures. International Journal of Selection and Assessment, 3, 11-19.
[5] Gilliland, S. W., & Hale, J. (2005). How do theories of organizational justice inform just employee selection practices? In J. Greenberg & J. A. Colquitt (Eds.), Handbook of organizational justice: Fundamental questions about justice in the workplace (pp. 411-438). Mahwah, NJ: Erlbaum.
[6] Hausknecht, J. P., Day, D. V., & Thomas, S. C. (2004). Applicant reactions to selection procedures: An updated model and meta‐analysis. Personnel Psychology, 57(3), 639-683.
[7] Macan, T. H., Avedon, M. J., Paese, M., & Smith, D. E. (1994). The Effects of Applicants' Reactions to Cognitive Ability Tests and an Assessment Center. Personnel Psychology, 47, 715-738.
[8] Madigan, J., & Macan, T. H. (2005). Improving applicant reactions by altering test administration. Applied HRM Research, 10(2), 73-88.
[9] Miles, S. J., & McCamey, R. (2018). The candidate experience: Is it damaging your employer brand?. Business Horizons, 61(5), 755-764. DOI: 10.1016/j.bushor.2018.05.007
[10] Smither, J.W., Reilly, R.R., Millsap, R.E., Pearlman, K., & Stoffey, R.W. (1993). Applicant reactions to selection procedures. Personnel Psychology, 46, 49-76.

280
DEVELOPING FRAMEWORK FOR MEASURING CAREER TRANSITION
READINESS
Ivana Kovačević*1, Ivana Kužet
1, Mateja Manojlović
1
1University of Belgrade, Faculty of organizational sciences
*Corresponding author, e-mail: [email protected]
OBJECTIVE
The concept of career witnessed a transformation from a lifelong project toward transitional occupational states. Guan and colleagues (Guan, et al., 2018) say that to cope with the “increasingly globalized economy, fast technological advancement and changing organizational structures” that resulted in “shifts into more flexible employment relationships and less predictable career patterns”, one must develop strategies that would help him manage threats in career. Actually, the tendency to change more jobs in the career is seen as the trademark of the millennial generation (Ivanovic & Ivancevic, 2019). Consequently, employability becomes a key word for the contemporary workforce and adaptability the main coping mechanism when facing with intraorganizational, interorganizational or interprofessional career transitions including changes in tasks and positions. Our goal is to create a framework for developing an instrument to measure readiness for a shift in career path and engage in acquiring competencies for being employable at the current workforce market. We aim to identify potentials to adapt to change (not only organization, position, job, but the whole occupational domain), while becoming concurrent at the market that requires competencies that are not still in the arsenal of personal/professional assets.
METHODOLOGY
We critically analyze a considerable number of different concepts for assessing capacities for a career change (CTI - The Career Transition Inventory, Fernandez et al., 2008; CAAS - Career Adapt-Abilities Scale, Savickas & Portfeli, 2012; SCRI-Student Career Readiness Index: Dodd et al., 2021) and it was found that some of the indicators could be good predictors of transition readiness (Ghosh, et al., 2019). Nevertheless, none of the instruments we came across did fully satisfy our needs. They are prevalently focusing on first career choice or covering typical career transition situations, not explicitly including the situations when choosing a career shift is not a voluntary option and means a necessity for developing quite new competencies from the “scratch.”
RESULTS
We defined and theoretically justified that predictors of someone`s excellence in facing the immense career shift in adult ages might include competencies as: (1) openness to change – referring to willingness and flexibility to embrace change (indicating interest in new things, easy adaptation to new work situation, readiness for change, especially if these experiences are likely to increase knowledge); (2) eagerness for continuous learning - the orientation toward learning new things even in the absence of any external rewards, with distal learning goals; (3) confidence in achieving personal goals – meaning setting personal goals and confidence in achieving success even when there are obstacles to overcome; (4) persistence for long period of time, in striving to complete the task; (5) independence/working with others; (6) work under pressure indicating the possibility of working in the environment with limitations and distractions which are often outside of control (such as resources, task difficulty, time pressure) and still achieving goals, and finally (7) problem-solving considering indicators of ability to think logically on the material in relevant domain.

281
CONCLUSION
This paper offers a theoretical framework for developing and empirically evaluating instruments that operationalize indicators of a person's readiness to make a considerable shift in their career. It should be able to cover different situations of career transitions and to assess one`s capacities to adapt to new skills acquired while expecting to transfer them to the job in a new career. As the purpose of the instrument is for the selection in the situation of prequalification and as support tool for counseling in career transitions, we identified seven potential indicators of career shift readiness expected them to be predictors of new career adaptability. Although some of these indicators might sound like personal traits or abilities, they are rather seen as personal attitudes in concrete situations.
Keywords: career transition, readiness to change, adaptability, employability
REFERENCES
[1] Dodd, V., Hanson, J., & Hooley, T. (2021). Increasing students’ career readiness through career guidance: measuring the impact with a validated measure. British Journal of Guidance & Counselling, 1-13.
[2] Fernandez, A., Fouquereau, E., & Heppner, M. J. (2008). The Career Transition Inventory: A psychometric evaluation of a French version (CTI-F). Journal of Career Assessment, 16(3), 384-398.
[3] Ghosh, A., Kessler, M., Heyrman, K., Opelt, B., Carbonelli, M., & Fouad, N. A. (2019). Student veteran career transition readiness, career adaptability, and academic and life satisfaction. The Career Development Quarterly, 67(4), 365-371.
[4] Guan, Y., Arthur, M. B., Khapova, S. N., Hall, R. J., & Lord, R. G. (2018). Career boundarylessness and career success: A review, integration and guide to future research. Journal of Vocational Behavior, 110, 390-402.
[5] Ivanovic, T., & Ivancevic, S. (2019). Turnover intentions and job hopping among Millenials in Serbia. Management: Journal of Sustainable Business and Management Solutions in Emerging Economies, 24(1), 53-63.
[6] Savickas, M. L., & Porfeli, E. J. (2012). Career Adapt-Abilities Scale: Construction, reliability, and measurement equivalence across 13 countries. Journal of Vocational Behavior, 80(3), 661-673.

282
PERSONAL ETHICS PERCEPTION AND ITS RELATION TO THE EXPECTED PROPERTIES OF A GOOD LEADER
Dejan Marinčič1, Maja Đurica
2, Miha Marič*
1
1University of Maribor – Faculty of Organizational Sciences 2Belgrade Business and Arts Academy of Applied Studies
*Corresponding author, e-mail: [email protected]
OBJECTIVE
The paper studies the relation between personal ethics perceptions and the expected properties of a good leader among students. This research is important because it builds upon self-assessments and anticipations of Gen-Z, which is currently entering the job market. Ethics is an integral part of our lives, as it is implicitly present in the daily activities of the individual, because it deals with what is morally good and bad (Singer, 2021). Aluchna and Mikolajczyk (2013) found that ethical attitudes and potential ethical dilemmas are key aspects for understanding an individual’s decision-making process. The subject of ethics is important in interpersonal relationships; as our decisions are based on personal ethics, we believe that so are our expectations from others.
METHODOLOGY
Therefore, we ask a research question, how do students perceive their own personal ethics and how it relates to the properties they expect in a good leader. The survey was conducted using an anonymous online questionnaire that included two sets of questions. The first set covered questions about the ethics of the individual, and the second set included questions about the expected qualities of a good leader. 242 undergraduate students from all over Slovenia were included in the research, of which 115 men and 127 women participated in the research. The average age of the respondents was 21.76 years, which means that they are representatives of Gen-Z. Data collection took place from March 2020 to April 2022. Respondents rated their agreement with the given statements on a five-point scale.
RESULTS
Figure 1 shows us the average value of the respondents' answers in the self-assessment of ethics. As a starting point for the preparation of the questionnaire, we started from a questionnaire compiled by Tenbrunsel et al. (2003). There were 10 statements in this set, the respondents rated this set with a five-point scale, which means 1 (I do not agree at all) and 5 (I strongly agree). Figure 2 shows us the average value of the respondents' assessment of the expected properties of a good leader.
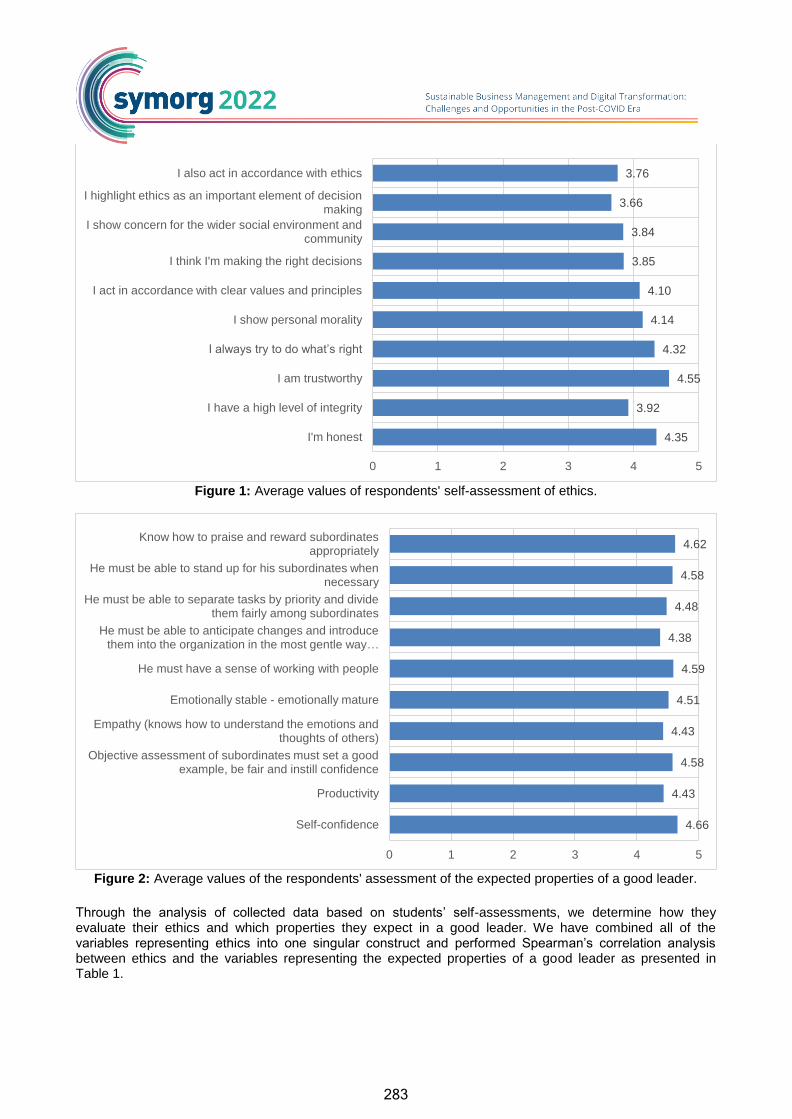
283
Figure 1: Average values of respondents' self-assessment of ethics.
Figure 2: Average values of the respondents' assessment of the expected properties of a good leader.
Through the analysis of collected data based on students’ self-assessments, we determine how they evaluate their ethics and which properties they expect in a good leader. We have combined all of the variables representing ethics into one singular construct and performed Spearman’s correlation analysis between ethics and the variables representing the expected properties of a good leader as presented in Table 1.
4.35
3.92
4.55
4.32
4.14
4.10
3.85
3.84
3.66
3.76
0 1 2 3 4 5
I'm honest
I have a high level of integrity
I am trustworthy
I always try to do what’s right
I show personal morality
I act in accordance with clear values and principles
I think I'm making the right decisions
I show concern for the wider social environment and community
I highlight ethics as an important element of decision making
I also act in accordance with ethics
4.66
4.43
4.58
4.43
4.51
4.59
4.38
4.48
4.58
4.62
0 1 2 3 4 5
Self-confidence
Productivity
Objective assessment of subordinates must set a good example, be fair and instill confidence
Empathy (knows how to understand the emotions and thoughts of others)
Emotionally stable - emotionally mature
He must have a sense of working with people
He must be able to anticipate changes and introduce them into the organization in the most gentle way …
He must be able to separate tasks by priority and divide them fairly among subordinates
He must be able to stand up for his subordinates when necessary
Know how to praise and reward subordinates appropriately

284
Table 1: Spearman’s correlation analysis between ethics and the variables representing the expected properties of a good leader.
CONCLUSION
Through our research, we have found that the self-assessments of ethics among Gen-Z does in fact influence their expectations regarding their future leader’s properties, which is in line with previous researches. In today’s increasingly global business environment, organizations are renewing their efforts to raise standards of ethical business conduct (McCann & Holt, 2009). Research shows that self-reflective and morally responsive leaders can be ethical (Brown & Trevino, 2006), with thinking that helps with self-awareness and ethical behaviour (Akrivou et al., 2011). Awareness and self-reflection can be key to increasing moral rules based on leaders ’decisions (Buzzanell & Fyke, 2013).
Keywords: leadership, HRM, ethics, organization, students
REFERENCES
[1] Akrivou, K., Mo, S., & Papalois, E. (2011). The sound of silence – A space for morality? The role of solitude for ethical decision making. Journal of Business Ethics, 102(1), 119-133. DOI: 10.1007/s10551-011-0803-3
[2] Aluchna, M., & Mikolajczyk, O. (May 2013). Ethical dilemmas of young economists: The case of Warsaw School of Economics students. Social Responsibility Journal, 9(2), 298-315. DOI: 10.1108/SRJ-06-2011-0012
[3] Brown, M., & Trevino L. (2006). Ethical leadership: A review and future directions. The Leadership Quarterly, 17(6), 595-616. DOI: 10.1016/j.leaqua.2006.10.004
[4] Buzzanell, M. P., & Fyke P. J. (2013). The ethics of conscious capitalism: Wicked problems in leading change and changing leaders. Human Relations, 66(12), 1619-1643. DOI: 10.1177/0018726713485306
[5] McCann, J., & Holt, R. (2009). Ethical leadership and organizations: An analysis fo leadership in the manufacturing industry based on the perceived leadership integrity scale. Journal of Business Ethics, 87(2), 211-220. DOI: 10.1007/s10551-008-9880-3
[6] Singer, P. (2021). Ethics. Encyclopedia Britannica. Retrieved from www.britannica.com/topic/ethics-philosophy (accessed April 1st, 2022).
[7] Tenbrunsel, A. E., Smith-Crowe, K., & Umphress, E. E. (2003). Building Houses on Rocks: The Role of the Ethical Infrastructure in Organizations. Social Justice Research, 16(3), 285-307. DOI:
10.1023/A:1025992813613
Ethics
Correlation Coefficient Sig. (2-tailed)
Self-confidence ,161* 0,012 Productivity ,221** 0,001 Objective assessment of subordinates must set a good example, be fair and instil confidence ,290** 0,000 Empathy (knows how to understand the emotions and thoughts of others) ,279** 0,000 Emotionally stable - emotionally mature ,188** 0,003 He must have a sense of working with people ,225** 0,000 He must be able to anticipate changes and introduce them into the organization in the most gentle way possible ,308** 0,000 He must be able to separate tasks by priority and divide them fairly among subordinates ,250** 0,000 He must be able to stand up for his subordinates when necessary ,264** 0,000 Know how to praise and reward subordinates appropriately ,254** 0,000

285
BOARDS’ INVOLVEMENT IN CEO SUCCESSION: A CASE STUDY ANALYSIS
Tihona Bozhinovska*1, Ljupcho Eftimov
1
1Ss. Cyril and Methodius University in Skopje – Faculty of Economics
*Corresponding author, e-mail: [email protected]
OBJECTIVE
Management succession and particularly CEO succession is an issue that has been the research focus of numerous studies in the past few decades. According to SpencerStuart 2021 Board Index, developing a board succession strategy represents one of the top three nominating/governance committee priorities. Anticipating the possible departures of the individuals in the key leadership positions is one of the most important aspects of developing a proper strategy for managing CEO succession processes. The process of CEO succession is complex and particularly important for board members since it requires making decisions that have a far-reaching consequence on organizational performance and its strategic direction. Considering the organizational implications of CEO succession, the research question addressed in this study is how the CEO succession process is implemented. Therefore, the paper aims to make a short literature review on CEO succession as an important board decision and to describe the process in a case of a Macedonian company.
METHODOLOGY
In order to understand the CEO succession process, first we make a short literature review, and afterward, two case studies describing the process in a Macedonian company are presented. The literature review is focused on identifying the phases of the CEO succession process. In the second part, the study focuses on the CEO succession in a Macedonian joint-stock company from the pharmaceutical industry that has had two CEO successions in a short period of time (in the last three years). The criteria for selecting this cases is the differences between them. Namely, in the first case the processor has had voluntarily left the position Management Board President and CEO. In the second case the CEO has been removed from the position with a decision of the Supervisory Board after a several months of intensive power struggles within the organization.
RESULTS
The literature review was important for understanding the phases of the CEO succession and understanding the types of CEO succession identified in the conceptual studies. Berns и Klarner (2017) have identified three phases of the CEO succession process: the first phase called pre-succession phase refers to candidates’ preparation and evaluation, the second phase refers to the CEO change event, whi le the third phase is called post-succession phase and includes the evaluation of the new CEO performances. The implementation of each phase largely depends on the relations between board members and the CEO. Namely, in a situation in which there is a collaboration between the CEO and board members and their interests are overlapping (e.g., they favor the same candidate) the process is smoothly implemented. On the other hand, when the CEO and board members have opposite interests and when the incumbent CEO sees the succession process as a threat, he/she may even counteract, delay or sabotage the process, especially in the pre-succession phase. Several authors have identified different types of CEO successions (Bearns and Klarnet, 2017, Shen and Canella, 2002, Friedman and Oak, 1995). In this paper we are particularly interested in the similarities and differences between the relay succession and the CEO turnover. According to Santora (2004), the relay succession may have positive impact on the overall organizational performances if: the company’s pre-succession performance wasn’t very good, the level of instability in the in the firms’ industry after succession was high and the level of strategic instability in firm after succession was also high (p. 158). Shen and

286
Cannella (2002) have argued that in cases of CEO dismissal, non-CEO inside directors have crucial role. Additionally, they emphasized that although power struggles within the organization and the boards may increase the level of instability, they also usually lead to strategic changes that can improve organizational performances. Liu and Atinc (2019) have implied that CEOs’ motivation for strategic changes depends on the boards and predecessor role in the succession process. Therefore, understanding the influences of the board members and the CEO incumbent in the succession process is significant for predicting the overall organizational performances in the successors’ mandate. The case study analysis has helped understand the following issues regarding the CEO succession: the possible influence of the CEO dismissal on the process and the impact of the power struggles on the governing structure and the overall organizational reputation. In the first case study in which the predecessor has voluntary step down, and actively participated in the pre-succession phase, the process of CEO succession was not challenging for the board members and did not cause any disruption in the organizational internal environment. On the other hand, in the second case, in which the CEO has been removed after a power struggle, the implementation of the second phase of the CEO succession process was longer, the pressure for the whole management team was higher and significant changes in the governing structures have been made.
CONCLUSION
According to the described case studies, it can be concluded that the way the CEO incumbent leaves determines the course of the CEO succession processes. In conditions where the CEO or the Management Board President is dismissed with a supervisory board decision, the process takes longer and leads to a change of the entire top management team.
Keywords: succession, CEO, boards’ involvement, decision
REFERENCES
[1] Berns, K. V. D., & Klarner, P. (2017). A Review of the CEO Succession Literature and a Future Research Program. Academy of Management Perspectives, 31(2), 1-68.
[2] Friedman, S. D., & Olk, P. (1995). Four ways to choose a CEO: Crown heir, horse race, coup d'etat, and comprehensive search. Human Resource Management, 34(1), 141-164.
[3] Liu, X., & Atinc, G. (2021). CEO Succession, reference setting and post-succession strategic change. Management Decision, 59(2), 258-284.
[4] Santora, J. C. (2004). Passing the baton: Does CEO Repay succession work best?. Academy of Management Perspectives, 18(4), 157-159.
[5] Shen, W., & Cannella, A. A. (2002). Power Dynamics within top management and their impacts on CEO dismissal followed by inside succession. Academy of Management Journal, 45(6), 1195-1206.

287
„EVERYTHING IS A PROJECT”: PROJECTIFICATION IN WORK-LIFE
CONTEXT OF WOMEN TOP MANAGERS
Inga Minelgaite1,
Halla Margrét Hinriksdóttir*1
1University of Iceland – School of Business *Corresponding author, e-mail: [email protected]
Projectification is driven by a variety of factors and attributed mainly to changing environment. Societies are becoming more globalized, technology is developing at a faster rate than it ever has, and businesses have embarked on the continuous pursuit of harvesting a greater output with omitting lesser input, otherwise known as ephemeralization. Projectification is evident in all levels as research suggests projectification may be seen in societies, public sectors, and within the life of the individual (Lundin et al., 2016; Jensen et al., 2016), yet it might be argued that projectification in personal life is significantly understudied. Work-life balance can have a substantial impact on people's mental and physical well-being (Haar et al., 2014; Lowe, 2005). Furthermore, research reveals that work-life balance is important for both businesses and economies (Boushey, 2016; Buddahpriya, 2005). According to the OECD work-life balance index, Iceland places 33rd out of the 40 countries included in the index (OECD, n.d.). This qualitative research aims at gaining insight into Icelandic women’s top managers’ experience of increasing projectification in context of work and personal life environments. The sample for this study consisted of eight women ranging in age from 30 to 62. Based on the eight interviews, this research investigates the following research topic in order to begin to close this gap in the literature: What are women top-manager’s experience on projectification in both their careers as well as their private lives? The findings of this study demonstrated that project structures and project work are becoming increasingly present in modern business practices, even among those that do not identify as project-based organizations with projects at the core of the operation. The results indicated projectification taking place in women’s organizations, mainly through the formalization of project management practices. The unjust division of labor in the participants’ households, particularly the tasks that fell under third shift projects, was identified based on research results. This research provides specific insights that might serve as bases for crafting more socially sustainable work and life environments for women top managers.
Keywords: projectification, ephemeralization, complexity, women, top management, Iceland
REFERENCES
[1] Boushey, H. (2016). Finding Time: The Economics of Work-Life Conflict. DOI: 10.4159/9780674968608 [2] Buddhapriya, S. (2005). Balancing Work and Life: Implications for Business. Indian Journal of Industrial
Relations, 41(2), Shri Ram Centre for Industrial Relations and Human Resources, 233-247. [3] Haar, J. M., Russo, M., Sune, A., & Ollier-Malaterre, A. (2014). Outcomes of work-life balance on job
satisfaction, life satisfaction and mental health: A study across seven cultures. Journal of Vocational Behavior, 85(3). DOI: 10.1016/j.jvb.2014.08.010
[4] Jensen, A., Thuesen, C., & Geraldi, J. (2016). The projectification of everything: Projects as a human condition. Project Management Journal, 47(3), 21-34.
[5] Lowe, G. S. (2005). Control over time and work-life balance: An empirical analysis. Graham Lowe Group. [6] Lundin, R. A., & Norbäck, M. (2016). Projectification in the Media Industries. In: Lowe, G., Brown, C. (eds.)
Managing Media Firms and Industries. Media Business and Innovation. Springer, Cham. DOI: 10.1007/978-3-319-08515-9_21
[7] OECD. Work-life balance. OECD Better Life Index. (n.d.). Retrieved October 26, 2021, from www.oecdbetterlifeindex.org/topics/work-life-balance/

288
THE ROLE OF HR IN ORGANISING HACKATHON AS AN EMPLOYER
BRANDING TOOL
Katarina Jovanović Čorlija*1, Tatjana Jovanović
2
1University of Belgrade – Faculty of Organizational Sciences 2University Union – Nikola Tesla – Faculty of Management
*Corresponding author, e-mail: [email protected]
OBJECTIVE
As overall candidate’s market has become highly competitive, and we are discussing new terms like the great resignation (Tessema et al., 2022). It has become critical to use different employer branding strategies and tools to reach the targeted audience, especially during challenging economic times according to Figurska & Matuska (2013). One of the events used for this purpose is organizing hackathons as described to Lara & Lockwood (2016). Hackathon could be defined as “short-term events at which participants work in small groups to ideate, develop and present a solution to a problem” (Flus & Hurst, 2021). Hosting a hackathon is perceived as a way to establish relationship with students or experts from the market and at the same time providing fresh view that could generate new business ideas and innovation (Rys, 2021). Most studies are focused on exploring hackathons as a phenomenon (Briscoe & Mulligan, 2015) used in education (Fattah et al., 2021), innovation (Briscoe & Mulligan, 2015) and civic activism (Cwikel & Simhi, 2021). Based on participants background we find classification on classic/IT, free and mix hackathons (Rys, 2021). Authors are focused on the perspective of organizing corporate hackathon by HR and its role as employer branding tool. There is limited research investigating the role of HR (human resources department) in the preparation and organization of hackathon. The paper aimed to present case study of such preparation within international company X and thus some phases will be described and discussed in detail.
METHODOLOGY
From the perspective of the methodology used, this research is a descriptive-analytical study. Data for the research was collected from international company X (company known to authors) operating globally with significant presense in West Balkans. Presented data was collected from company documents like offers, correspondence, project plans and other internal documents during 2022. Starting point will be examining possibility to organize hackathon by using phases described in the planning kit by Nolte et al. (2020) and analysing benefits and limitation of this approach in the particular case from HR perspective.
RESULTS
The study used qualitative techniques to analyze hackathon from the new perspective with focus on HR role in preparation of corporate hackathon. Authors aimed to describe in details preparation phases and open discussion for further research on measuring effects of hackathon as employer branding tool. The hackathon described in the study was planned as mixed (Rys, 2021) with teams with IT and business analytics background. The objective of the hackathon was to find a solution that will help predict future product demand trends in different countries all over the globe. The purpose from HR perspective was to create awareness of the company X brand among experts in the market by communicating technology used in the company and type of challenges solved by the company X.
CONCLUSION
Although based on limited dataset and single hackathon event the study was able to describe in depth preparation phases and significant challenges and opportunities brought in front of HR. The paper was

289
aiming to describe hackathon from HR perspective and show potential for using hackathon as employer branding tool. Several findings of this study warrant further discussion, such as further connection to other employer branding tools and measuring overall impact on external and internal employer branding. Additionally, it would be interesting to explore difference in usage of hackathon in different industries.
Keywords: hackathon, HR, employer branding
REFERENCES
[1] Briscoe, G., & Mulligan, C. (2015). The hackathon phenomenon. [2] Cwikel, J., & Simhi, M. (2021). Using the Hackathon Model in Social Work Education. Social Work Education, 1-
14. [3] Fattah, L., Gabrilove, J., & Bradley, F. (2021). Evaluating the impact of a health hackathon on collaborative
team science: a Social Network Analysis (SNA). Journal of Clinical and Translational Science, 5(1). DOI: 10.1017/cts.2020.46
[4] Figurska, I., & Matuska, E. (2013). Employer branding as a human resources management strategy. Human resources management & Ergonomics, 7(2).
[5] Flus, M., & Hurst, A. (2021). Design at hackathons: New opportunities for design research. In Design Science. DOI: 10.1017/dsj.2021.1
[6] Lara, M., & Lockwood, K. (2016). Hackathons as Community-Based Learning: A Case Study. TechTrends, 60(5), 486-495. DOI: 10.1007/s11528-016-0101-0
[7] Nolte, A., Pe-Than, E. P. P., Affia, A. A. O., Chaihirunkarn, C., Filippova, A., Kalyanasundaram, A., ... & Herbsleb, J. D. (2020). How to organize a hackathon – A planning kit. arXiv preprint arXiv:2008.08025.
[8] Rys, M. (2021). Invention Development. The Hackathon Method. Knowledge Management Research & Practice, 1-13.
[9] Tessema, M. T., Tesfom, G., Faircloth, M. A., Tesfagiorgis, M., & Teckle, P. (2022). The “Great Resignation”: Causes, Consequences, and Creative HR Management Strategies. Journal of Human Resource and Sustainability Studies, 10(1), 161-178.

290
AUDITOR'S PERCEPTION OF STRESS DURING THE COVID19 IN THE REPUBLIC
OF SERBIA
Nemanja Jakovljević *1 Veljko Dmitrović
2
1University of Belgrade – Faculty of Economics
2 University of Belgrade – Faculty of Organizational Science
*Corresponding author, e-mail:[email protected]
OBJECTIVE
Covid19 has exposed the obsolescence and shortcomings of several audit procedures (Castka & Searcy, 2021). It has profiled itself as a global threat to health, which among other things, negatively affects the amount of stress in a large number of people around the world. Stress can be defined as a feeling of overload or inability to cope with mental pressure (Ebzeeva & Polyakova, 2022). The research aims to examine the degree of perception of the amount of stress caused by the Covid19 on persons engaged in the audit profession in the Republic of Serbia. The initial hypothesis is that Covid19 influenced the general level of perception of the problems of stress and mental health, and increased the amount of stress that respondents experience every day in the implementation of business and private activities.
METHODOLOGY
The research was conducted by creating and distributing a questionnaire contained 10 questions, to examine the degree of perception of the amount of stress caused by the Covid19 on persons engaged in the audit profession on the degree of perception of experiencing stress during the Covid19. The questionnaire was completely anonymous. The collected 109 answers were used exclusively for analysis, and the target group of respondents was persons engaged in the planning and in the implementation of audit engagement who are employed in external audit firms or internal audit departments in the Republic of Serbia. The answers to the questionnaire were analyzed using descriptive statistics.
RESULTS
An adjusted Cohen`s perceived stress scale (Cohen et al., 1994) was used for the research. The main result of the research is that Covid19 worsened the general level of experience of stress and mental health and that 48% of auditors in the Republic of Serbia believe that Covid19 worsened their mental health, increased workload and increased stress during daily planning and implementation of business and private obligations.
CONCLUSION
After the pandemic, reforms in the audit profession may be necessary (Hay et al., 2021). According to the authors (Kaka, 2021), the Covid19 affected the way financial reports were prepared and auditors hired. When we consider this fact together with the general pandemic environment, which included an emergency and the application of the concept of self-isolation, then it should not be surprising that a high percentage of auditors believe that the Covid19 increased stress during work tasks. These results suggest that the pandemic could accelerate the process of digitalization of audit processes and procedures, which in the long run would reduce the time of executive actions and the degree of audit risk, thus creating space to reduce the amount of stress in the audit profession.
Keywords: auditor; audit; Covid19; stress

291
REFERENCES
[1] Castka, P., & Searcy, C. (2021). Audits and COVID-19: A paradigm shift in the making. Business Horizons. DOI: 10.1016/j.bushor.2021.11.003
[2] Cohen, S., Kamarck, T., & Mermelstein, R. (1994). Perceived stress scale. Measuring Stress: A Guide for Health and Social Scientists, 10(2), 1-2.
[3] Ebzeeva, E., Y., & Polyakova O. A. (2022). Medical Council. DOI: 10.21518/2079-701X-2022-16-2-127-133 [4] Hay, D., Shires, K., Dyk, D., V. (2021). Auditing in the time of COVID – the impact of COVID-19 on auditing in
New Zealand and subsequent reforms. Pacific Accounting Review, 33(2), 179-188. DOI: 10.1108/PAR-09-2020-
0155 [5] Kaka, E. J. (2021). Covid-19 and Auditing. Journal of Applied Accounting and Taxation, 6(1), 1-10. DOI:
10.30871/jaat.v6i1.2311

292

293
QUALITY MANAGEMENT AND STANDARDIZATION IN DIGITAL
TRANSFORMATION ERA

294
MEASURING PERCEIVED SERVICE QUALITY USING SERVQUAL IN
HOSPITALITY INDUSTRY
Milica Vuksanović*1, Mladen Đurić
1, Ana Kićanović
1
1University of Belgrade – Faculty of Organizational Sciences
*Corresponding author, e-mail: [email protected]
OBJECTIVE
Recognizing that high satisfaction leads to great customer loyalty, companies today strive for complete customer satisfaction. The conducted research examines the perception of users about the quality of coffee shop services in Serbia by using the SERVQUAL quality model. This model measures the difference between user expectations of service quality and their perceptions of the actual performance of the service provider, which consists of 5 dimensions accoring to RATER model: Reliability, Assurance, Tangibles, Empathy and Responsiveness. The survey was conducted on a sample of 120 users of coffee shop services in the Republic of Serbia. The results implied some gaps between user expectations and user perceptions. The largest gap appeared within the "Аssurance" dimension.
METHODOLOGY
In order to collect data, a questionnaire based on five dimensions of quality according to Parasuraman (1988) was used, namely: Reliability, Assurance, Tangibles, Empathy and Responsiveness. For each question, out of a total of 19, respondents answer from two angles, from the perspective of expectations and from the perspective of their perceptions about the quality of coffee shop services. Users defined their statements using the Likert scale (Stepanov, 2016). The characteristics of the respondents sample are: gender, age group, level of education and occupation, and gender of respondents will be shown in the following figure (Figure 1: Gender of respondents). It can be seen that the majority of respondents in this survey are women and participate with 68%, while a smaller number of men, which is actually one third of the respondents and they participate in the survey with 32%.
Figure 1: Gender of respondents
Table 1 shows the dimensions of coffee shop service quality with an average assessment of expectations and perceptions. The gap in the quality of coffee shop service was obtained by reducing customer expectations about the quality of cafe service by assessing the perception of the quality of cafe service.

295
Therefore, the largest gap appeared within the dimension "Assurance" (-0.38), and the smallest gap within the dimension "Empathy" (-0.03). Table 1: SERVQUAL dimensions of coffee shop service quality - average assessment of expectations and perceptions
Dimensions of service quality in coffee shops
Expectations
Perceptions SERVQUAL
grade
Rank
Tangibles 6,12 5,95 -0,17 2
Reliability 6,25 5,94 -0,31 3
Responsiveness 6,00 5,68 -0,32 4
Assurance 6,35 5,97 -0,38 5
Empathy 5,02 4,99 -0,03 1
Total SERVQUAL gap
5,95 5,71 -0,24
RESULTS
The results of the research on the perception of users on the quality of coffee shop service indicate that the quality of the gap between the perceived quality of service and customer expectations is evident in terms of quality dimensions. The overall gap in the quality of coffee shop services is negative, so it can be said that the quality of service is insufficient and needs to be improved. Based on the obtained results, the dimension "Empathy" has the greatest impact on user satisfaction (it has the smallest gap between expectations and user perception), while the greatest impact on dissatisfaction has the dimension "Assurance". Respondents rated all dimensions mostly negatively, although individual ratings are high, which means that users' expectations are higher than their perceptions, unavoidable quality and perceptions are unavoidable.
CONCLUSION
This research pointed out the numerous advantages of the SERVQUAL quality model, as well as that in the first place attention should be focused on the dimension "Assurance", more precisely its attribute "Kindness of employees to customers". Therefore, it is proposed to apply the management philosophy and to focus on the respondent, because this is the only way to reduce this gap.
Keywords: service quality, SERVQUAL, perception, customer satisfaction
REFERENCES
[1] Edvardsson, B., Johnson, M.D., Gustafsson, A., & Strandvik, T. (2000). The effects of satisfaction and loyalty on Products and growth: products versus services. Total Quality Management, 11(7), 917-927.
[2] Filipović, Ј., & Đurić, М. (2009). Basics of quality. Faculty of Organizational Sciences, Belgrade, Republic of
Serbia. [3] Gotlieb, J. B., Grewal, D., & Brown, S. W. (1994). Consumer satisfaction and perceived quality: complementary
or divergent constructs?. Journal of Applied Psychology, 79(6), 875-883 [4] Parasuraman A, Zeithaml V. A, & Berry L. L. (1985). A Conceptual of Service Quality and its Implications for
Future Research, Journal of Marketing, 49(Fall), 41-50. [5] Parasuraman, A., Zeithaml, V.A., & Berry, L.L. (1988). SERVQUAL: A Multiple-Item scale for Measuring
Consumer Perceptions of Service Quality. Journal of Retailing, 64(1), 12-37. [6] Rotar J. L., & Kozar M. (2017). The Use of the Kano Model to Enhance Customer Satisfaction. Organizacija,
50(4), 337-351. [7] Saulina, A., R., & Syah T. Y. R. (2018). How Service Quality Influence of Satisfaction and Trust Towards
Consumer Loyalty in Starbucks Coffee Indonesia. International Advanced Research Journal in Science, Engineering and Technology, 5(10), 11-19
[8] Sekulić, D., & Mandarić, M. (2013). Quality of Services as a Determinant of Customer Satisfaction in the Hotel industry. Marketing, 44(3), 231-246.
[9] Stepanov, S. (2016). Service quality model of business systems. Doctoral dissertation, University of Business Academy in Novi Sad, Faculty of Applied Management, Economics and Finance in Belgrade
[10] Vazquez, R., Bosque, I. A. Rodrimguez-Del., Diaz, A. M., & Ruiz, A. V. (2001). Service quality in supermarket retailing: identifying critical service experiences. Journal of Retailing and Consumer Services, 8, 1-14.

296
IMPLEMENTATION OF ISO 22301 STANDARD FOR BUSINESS CONTINUITY
AND QUALITY ASSURANCE IN FOOD INDUSTRY
Danijel Stošić*1, Mladen Đurić
1, Olga Radovanović
1
1University of Belgrade – Faculty of Organizational Sciences
*Corresponding author, e-mail: [email protected]
OBJECTIVE
This paper will analyze the quality assurance and requirements of the ISO standard 22301 Business continuity management system, as well as their application in the food industry. The paper will determine the most important factors of quality and business continuity in relation to potential key processes, as well as the relevant measures that the organization should establish and implement. The most important processes which may affect on business continuity are: food safety and quality, environmental protection, occupational safety and health, fire protection, energy management, supplier evaluation, human resource management, IT security and crisis situation. In the final part, the work will present in research that will determine the most effective risk mitigation procedures for the company's business, as well as quality assurance in events that could cause significant business interruptions. Also, the research should provide guidelines regarding the ways in which, by ensuring the quality and continuity of business, it is possible to demonstrate a commitment to continuous improvement and advancement of the organization.
Figure 1: Areas of quality assurance and business continuity in the food industry
(source: own research inspired by ISO, 2015 a) The development of a lasting business must aim not only the common issues, specific to the current activity. The modern management systems quantify the potential action of certain new categories of factors, too,
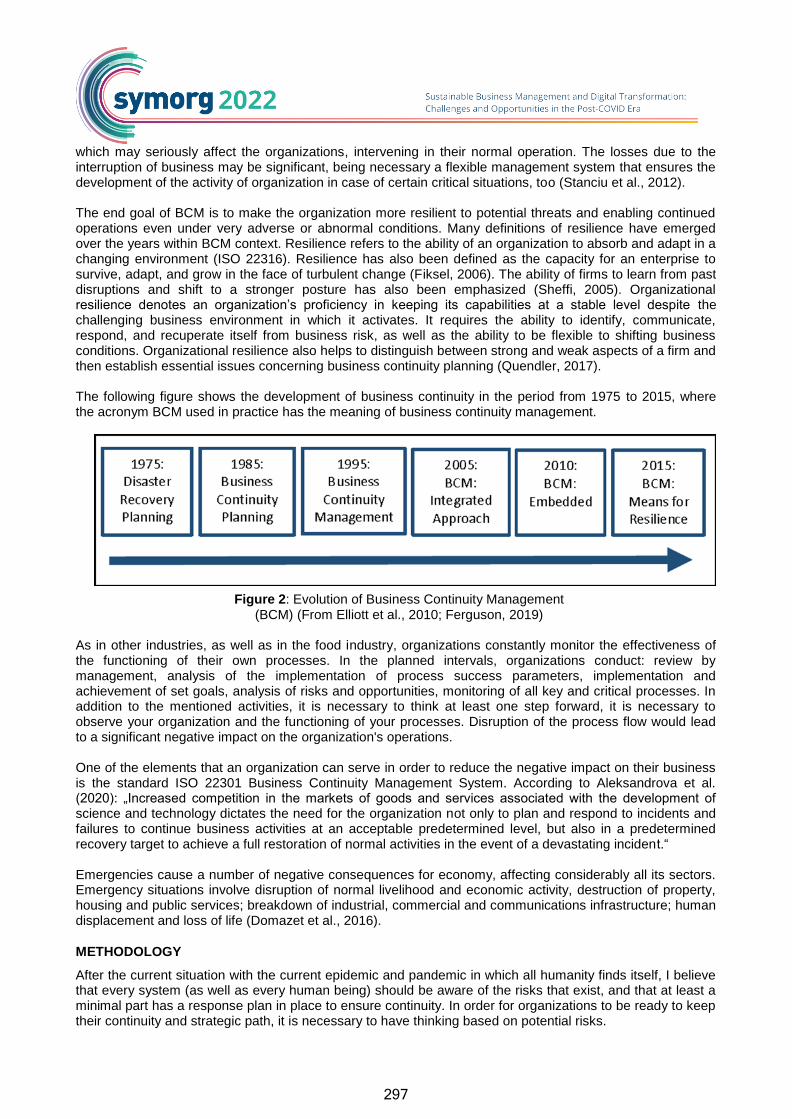
297
which may seriously affect the organizations, intervening in their normal operation. The losses due to the interruption of business may be significant, being necessary a flexible management system that ensures the development of the activity of organization in case of certain critical situations, too (Stanciu et al., 2012). The end goal of BCM is to make the organization more resilient to potential threats and enabling continued operations even under very adverse or abnormal conditions. Many definitions of resilience have emerged over the years within BCM context. Resilience refers to the ability of an organization to absorb and adapt in a changing environment (ISO 22316). Resilience has also been defined as the capacity for an enterprise to survive, adapt, and grow in the face of turbulent change (Fiksel, 2006). The ability of firms to learn from past disruptions and shift to a stronger posture has also been emphasized (Sheffi, 2005). Organizational resilience denotes an organization’s proficiency in keeping its capabilities at a stable level despite the challenging business environment in which it activates. It requires the ability to identify, communicate, respond, and recuperate itself from business risk, as well as the ability to be flexible to shifting business conditions. Organizational resilience also helps to distinguish between strong and weak aspects of a firm and then establish essential issues concerning business continuity planning (Quendler, 2017). The following figure shows the development of business continuity in the period from 1975 to 2015, where the acronym BCM used in practice has the meaning of business continuity management.
Figure 2: Evolution of Business Continuity Management (BCM) (From Elliott et al., 2010; Ferguson, 2019)
As in other industries, as well as in the food industry, organizations constantly monitor the effectiveness of the functioning of their own processes. In the planned intervals, organizations conduct: review by management, analysis of the implementation of process success parameters, implementation and achievement of set goals, analysis of risks and opportunities, monitoring of all key and critical processes. In addition to the mentioned activities, it is necessary to think at least one step forward, it is necessary to observe your organization and the functioning of your processes. Disruption of the process flow would lead to a significant negative impact on the organization's operations. One of the elements that an organization can serve in order to reduce the negative impact on their business is the standard ISO 22301 Business Continuity Management System. According to Aleksandrova et al. (2020): „Increased competition in the markets of goods and services associated with the development of science and technology dictates the need for the organization not only to plan and respond to incidents and failures to continue business activities at an acceptable predetermined level, but also in a predetermined recovery target to achieve a full restoration of normal activities in the event of a devastating incident.“ Emergencies cause a number of negative consequences for economy, affecting considerably all its sectors. Emergency situations involve disruption of normal livelihood and economic activity, destruction of property, housing and public services; breakdown of industrial, commercial and communications infrastructure; human displacement and loss of life (Domazet et al., 2016).
METHODOLOGY
After the current situation with the current epidemic and pandemic in which all humanity finds itself, I believe that every system (as well as every human being) should be aware of the risks that exist, and that at least a minimal part has a response plan in place to ensure continuity. In order for organizations to be ready to keep their continuity and strategic path, it is necessary to have thinking based on potential risks.

298
During July and August 2021, a research was conducted on the application of the ISO 22301 standard for ensuring the quality and continuity of business in the food industry. The survey method was used to collect data. Respondents in the food industry were sent a written questionnaire via e-mail and via the social network Linkedin. The questionnaire was filled out by employees in the sectors of production, quality control, development, quality systems, techniques and the like, who are in the positions of technologists, engineers, specialists and technicians in food industry organizations. Also, the questionnaire was filled out by consultants, technical experts and auditors engaged in consulting and certification companies in the field of food industry. The questionnaire consists of 13 open and closed questions.
RESULTS
The questionnaire completed by 57 respondents. Out of 57 respondents, only 13 of them stated that their organization has implemented the standard ISO 22301 Business Continuity Management System.
Figure 3: Percentage presentation of the structure of the implemented standard ISO 22301 in food
organizations The top 5 risks identified in the food industry are presented below. Table 1: The top 5 risks
1. Fire 2. Pandemics/ epidemics
3. Break energy sources (electricity, water)
4. Earthquake 5. IT attack
CONCLUSION
The conclusion contains of a review of various literature, including scientific literature, as well as on the basis of conducted research. The final part of this paper is a study that will show whether and to what extent organizations implement quality assurance and business continuity, what is their current way of working, and how they can respond if unwanted and unplanned emergencies occur. After reviewing different literature, including scientific literature, as well as after research, it can be concluded that quality assurance paired with business continuity is one of the most important elements of a successful organization within the food industry through the application of standard ISO 22301 Business Continuity Management System.
Keywords: ISO 22301, quality assurance, business continuity, food industry

299
REFERENCES
[1] Aleksandrova, S., Aleksandrov, M., & Vasiliev, V. (2020). Business Continuity Management System. Quality Management and Certification Moscow Aviation Institute (National Research University). Moscow, Russia.
[2] Domazet, S., Radović, V., & Cvijanović, D. (2016). Challenges of increasing competetiveness of serbian agroindustry in the process of mitigation of emergency situation. Ekonomika poljoprivrede, 63(3), 767-779.
[3] Elliott, D., Swartz, E. & Herbane, B. (2010). Business Continuity Management: A Crisis Management Approach, 2nd ed. Routledge, London and New York, NY.
[4] Ferguson, C. S., Assessing the KING IV Corporate Governance Report in relation to business continuity and resilience. Journal of Business Continuity & Emergency Planning, 13(2), 174-185.
[5] Fiksel, J. (2006). Sustainability and Resilience: Toward a Systems Approach, Sustainability: Science, Practice and Policy, 2(2), 14-21.
[6] ISO (2015). ISO 9001: Quality management systems – Requirements. International Organization for Standardization (ISO).
[7] ISO (2020). ISO 22301: Security and resilience – Business continuity management systems. International Organization for Standardization (ISO).
[8] ISO (2018). ISO 22316: Security and resilience – Organizational resilience – Principles and attributes. International Organization for Standardization (ISO).
[9] Quendler, E. (2017). Organizational resilience: building business value in a changing world. Journal for International Business and Entrepreneurship Development, 10(2), 101-119.
[10] Sheffi, Y. (2005). The Resilient Enterprise: Overcoming Vulnerability for Competitive Advantage. Cambridge,
MA: MIT Press. [11] Stanciu, S., Stancius, N., Dimitrascu, L., Nistor, C., & Sirbu, R. (2012). Modern Approach to Business Continuity
Management in Food, 71-74.

300
QUALITY MANAGEMENT PERCEPTION IN STUDENT ORGANIZATIONS
Sara Dimitrijević1, Jelena Ruso*
1, Isidora Milošević
2
1University of Belgrade – Faculty of Organizational Sciences
2University of Belgrade – Technical Faculty in Bor
*Corresponding author, e-mail: [email protected]
OBJECTIVE
Over the past twenty years many governments, economies of many countries, and especially universities have realized the importance of entrepreneurial activities for the growth and development of the economy (Belás et al., 2017; Purwana et al., 2018). However, the transformation from student to entrepreneur is highly challenging (Nielsen & Gartner, 2017). Therefore, the university context provides consistent access to equipment, infrastructure, laboratories, and recent scientific publications (Beyhan & Findik, 2018) to develop student entrepreneur skills. Moreover, student involvement in extracurricular activities significantly enhances leadership and managerial skills. Through various teaching and non-teaching activities within higher education, students get acquainted with most quality management concepts and issues without always being aware of them. These concepts can include leadership, customer focus, strategic planning, process management, resource management, or supplier management. However, the challenge follows when students have the opportunity to recognize and put such concepts into practice still during their studies. Student organizations represent a fruitful venue where students can gain a range of practical skills and get opportunities to navigate complex policies and power dynamics within the institution (Kezar et al., 2017). Therefore, the paper aims to find out whether and to what extent the quality management concepts are recognized and applied in the work of student organizations as a prerequisite for enhancing entrepreneurial skills. There is an assumption that students' perceptions differ depending on the management level in the organization.
METHODOLOGY
Since quality management concepts are generic, they can be applied in any kind of organization (for-profit/non-profit, production/service). Therefore, the study will be carried out among students of the University of Belgrade – members of student organizations. The questionnaire was based on Oliveira et al. (2017) model, consisting of 24 questions linked to six fields (Table 1). Apart from descriptive statistics, some basic statistical tests will be utilized to analyze and present the results.
Table 1: Questionnaire structure Questionnaire topics
Leadership Customer focus Strategic planning Suppliers management Process management Human resource management
RESULTS
The results indicate that students are aware of the application of quality management concepts and that they are widely used in student organizations. However, the results show that the perception of the application of these QM elements is not equally valued by all members.

301
CONCLUSION
Quality management enables many organizations to better organize their processes to achieve higher quality outputs (Guzmán & Domínguez, 2022; Psomas & Antony, 2017; Psomas et al., 2014). In the student organizations, high-quality results are reflected in the implementation of projects that stimulate entrepreneurial abilities, such as searching for sponsors, networking, public speaking, and working in a team (Sansone et al., 2021; Padilla-Angulo, 2017). Therefore, the quality management application is crucial for every organization, including student organizations. To the best of the authors' knowledge, based on the literature review, QM application in student organizations has not been researched, which fulfills the literature gap. Based on a detailed analysis, the results can serve the student and academic community as well as policy-makers to actively initiate, support, and participate in the student organizations' work to shape entrepreneurial skills through the application of QM concepts. Some of the research limitations can be observed in the sample size and focusing on the population of one university. Hence, the future research will be extended to all universities in Serbia, both private and public, including faculties’ and firms’ perceptions of student organization quality outcomes.
Keywords; quality management, student organization, higher education
REFERENCES
[1] Belás, J., Sopková, G., Čepel, M. & Kotásková, A. (2017). The quality of business environment and university student Entrepreneurship - comparison of the Czech and the Slovak Republic. Sociálno-Ekonomická Revue, 3, 34-43.
[2] Beyhan, B., Findik, D. (2018). Student and graduate entrepreneurship: ambidextrous universities create more nascent entrepreneurs. Journal of Technologic Transfer, 43, 1346-1374. DOI: 10.1007/s10961-017-9590-z
[3] Guzmán, B. V. R., & Domínguez, O. F. C. (2022). Benefits on productivity indicators after quality management implementation: evidence in the dairy industry. International Journal of Productivity and Performance Management (ahead-of-print).
[4] Kezar, A., Acuña Avilez, A., Drivalas, Y., & Wheaton, M. M. (2017). Building social change oriented leadership capacity among student organizations: Developing students and campuses simultaneously. New Directions for Student Leadership, 2017(155), 45-57. DOI: 10.1002/yd.20249
[5] Nielsen, S. L. & Gartner, B. (2017). Am I a Student and/or Entrepreneur? Multiple Identities in Student Entrepreneurship. Education + Training, 59(2), 135-154. DOI: 10.1108/ET-09-2014-0122
[6] Oliveira, G. S., Corrêa, J. E., Balestrassi, P. P., Martins, R. A., & Turrioni, J. B. (2019). Investigation of TQM implementation: empirical study in Brazilian ISO 9001-registered SMEs. Total Quality Management & Business Excellence, 30(5-6), 641-659. DOI: 10.1080/14783363.2017.1328273
[7] Padilla-Angulo, L. (2019). Student associations and entrepreneurial intentions. Studies in Higher Education, 44(1), 45-58. DOI:10.1080/03075079.2017.1336215
[8] Psomas, E., & Antony, J. (2017). Total quality management elements and results in higher education institutions: The Greek case. Quality Assurance in Education, 25(2), 206-223. DOI: 10.1108/QAE-08-2015-0033
[9] Psomas, E., Vouzas, F., & Kafetzopoulos, D. (2014). Quality management benefits through the “soft” and “hard” aspect of TQM in food companies. TQM Journal, 26(5), 431-444. DOI: 10.1108/TQM-02-2013-0017
[10] Purwana, D., Suhud, U., Fatimah, T., & Armelita, A. (2018). Antecedents of secondary students’ entrepreneurial motivation. Journal of Entrepreneurship Education, 21(2), 1-7.
[11] Sansone, G., Ughetto, E., & Landoni, P. (2021). Entrepreneurial intention: An analysis of the role of student-led entrepreneurial organizations. Journal of International Entrepreneurship, 19(3), 399-433. DOI: 10.1007/s10843-
021-00288-6

302
ADVANTAGES AND EFFECTS ON QUALITY OF THE ONLINE MODEL OF EDUCATION IN PRIMARY SCHOOLS
Maja Glogovac*1, Tatjana Krsmanović
2, Bojana Dančula-Dejanović
2
1University of Belgrade – Faculty of Organizational Sciences
2Primary school Ratko Mitrović
*Corresponding author, e-mail: [email protected]
OBJECTIVE
There is an indication that the education system at the all levels will move towards application of online model in the future to the extent it is possible, as a response to new trends in Industry 4.0 era. This has led to the greatest uncertainty in the primary education system because of the previous lack of experience and limited technical possibilities (Mushtaque et al., 2021). On the other hand, the model of online education requires application of a various information and communication technology resources (Gupta & Gupta, 2020). Confronting the unknown and unstable elements in the school system requires reacting quickly, thinking ahead, exploring the experiences of other institutions and, most importantly, maximizing the possible positive effects on its’ quality. By analyzing the advantages and effects on the quality of online models of education, it could be concluded which aspects of online teaching could be utilized to upgrade and improve the traditional way of teaching. Accordingly, the aim of this paper is to identify the most important advantages and positive effects of the online model of primary education in Serbia, for both teachers and pupils.
METHODOLOGY
Aiming to explore factors that could be utilized as advantages and bring positive effects on the quality of online education, the related research question is: “What are the most important advantages of the online model of educations in primary schools in Serbia”. Advantages of technical and motivational types are considered and effects on the quality of online education are considered. To fulfill the aim of the paper, the 4-grade scale questionnaire was conducted among both teachers and pupils from V to VIII grade in primary schools in Serbia. The survey encompassed five schools from which 162 correctly filled questionnaires were exploited, representing the response rate of about 15%.
RESULTS
Findings indicate some advantages that are perceived as significant, as presented in Table 1. Also, positive effects on the quality of online education regarding the development of information literacy; more regular feedback from teachers on student work; and organization of time are found out. Table 1: Advantages of the online model of education in primary schools in Serbia Type Advantage Mean value
Technical advantages
Modern work equipment
3,02
Adequate space for undisturbed work 3,02 Online platform possibilities
Existence of tools for creating interactive content
2,95
Existence of tools for quick retrieval of information 3,07 Existence of tools for simultaneous mutual work 3,04 Quick sharing and exchange of learning materials 3,27 Constant access to multimedia content 3,20 Possibility of applying innovative learning methods 3,16
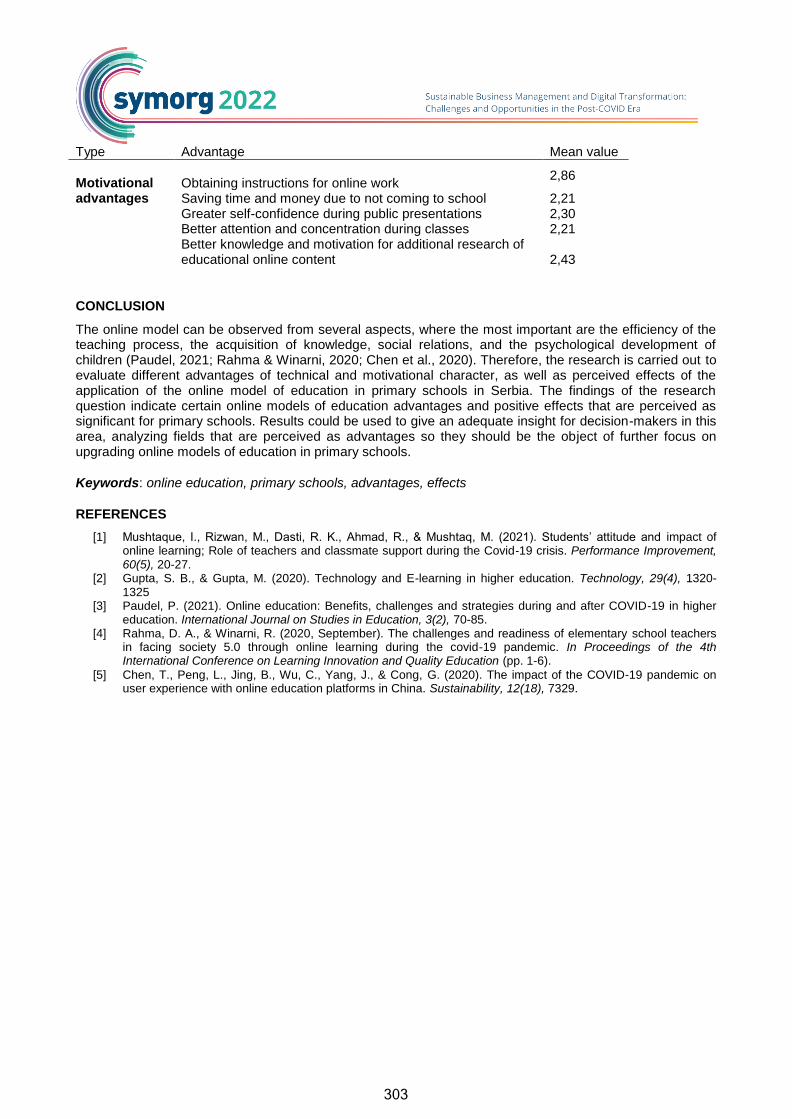
303
Type Advantage Mean value
Motivational advantages
Obtaining instructions for online work
2,86
Saving time and money due to not coming to school 2,21 Greater self-confidence during public presentations 2,30 Better attention and concentration during classes 2,21 Better knowledge and motivation for additional research of educational online content
2,43
CONCLUSION
The online model can be observed from several aspects, where the most important are the efficiency of the teaching process, the acquisition of knowledge, social relations, and the psychological development of children (Paudel, 2021; Rahma & Winarni, 2020; Chen et al., 2020). Therefore, the research is carried out to evaluate different advantages of technical and motivational character, as well as perceived effects of the application of the online model of education in primary schools in Serbia. The findings of the research question indicate certain online models of education advantages and positive effects that are perceived as significant for primary schools. Results could be used to give an adequate insight for decision-makers in this area, analyzing fields that are perceived as advantages so they should be the object of further focus on upgrading online models of education in primary schools.
Keywords: online education, primary schools, advantages, effects
REFERENCES
[1] Mushtaque, I., Rizwan, M., Dasti, R. K., Ahmad, R., & Mushtaq, M. (2021). Students’ attitude and impact of online learning; Role of teachers and classmate support during the Covid‐19 crisis. Performance Improvement, 60(5), 20-27.
[2] Gupta, S. B., & Gupta, M. (2020). Technology and E-learning in higher education. Technology, 29(4), 1320-1325
[3] Paudel, P. (2021). Online education: Benefits, challenges and strategies during and after COVID-19 in higher education. International Journal on Studies in Education, 3(2), 70-85.
[4] Rahma, D. A., & Winarni, R. (2020, September). The challenges and readiness of elementary school teachers in facing society 5.0 through online learning during the covid-19 pandemic. In Proceedings of the 4th International Conference on Learning Innovation and Quality Education (pp. 1-6).
[5] Chen, T., Peng, L., Jing, B., Wu, C., Yang, J., & Cong, G. (2020). The impact of the COVID-19 pandemic on user experience with online education platforms in China. Sustainability, 12(18), 7329.

304
INTERNATIONALIZATION AS THE FOUNDATION FOR SUSTAINABLE
BUSINESS MANAGEMENT
Biljana Tošić*1, Ivana Mijatović
1, Nedeljko Živković
1
1University of Belgrade – Faculty of Organizational Sciences *Corresponding author, e-mail: [email protected]
OBJECTIVE
Contemporary organizations are expected to act sustainably and follow an ambitious set of sustainable development goals (SDGs), aimed at addressing different economic, social, and environmental challenges. Despite showing several overlaps, sustainability differs from sustainable development as it seems to be more measurable (Park, 2018). Accordingly, contemporary organizations are being pushed toward becoming more sustainable (Denicolai et al., 2021). Classifying organizations as (un)sustainable in today’s global economy means understanding the relationship between a firm’s internationalization and its sustainable development (Gómez-Bolaños et al., 2022). This study aims at stressing the significance of internationalization as the foundation for sustainable business management. To date, sustainability literature has largely focused on large multinational enterprises (MNEs) and multinational corporations (MNCs), especially multinationals from more developed economies, such as the USA (Lartey et al., 2021). Only a few studies addressed multinationals from emerging economies and the differences between emerging and developed economies (Gómez-Bolaños et al., 2022). Additionally, only a few studies addressed small and medium-sized enterprises (SMEs) (Denicolai et al., 2021) and explored what drives micro, small and medium-sized enterprises toward sustainability (Cantele & Zardini, 2020). Aiming to fill such a significant yet underestimated sustainability literature gap, we present the following hypothesis:
[1] Organizations from emerging countries are not focused on exporting; [2] Organizations from developed countries seem to be formally committed to exporting; [3] Organizations from developed countries seem to be exporting to psychologically close countries; [4] Organizations from developed countries seem to be more experienced in dealing with
psychologically close countries and ready to export to more psychologically distant countries; [5] Organizations from developed countries seem to be ready to export to additional countries,
presumably ending with the organization no longer being solely an exporter; [6] Organizations from developed countries seem to be born global so their future export activities are
usually to a large extent influenced by the organization’s behavior shortly after the establishment;
METHODOLOGY
A survey method was used to collect data from owners and managers of SMEs and large organizations from Serbia and Germany. To collect data, LinkedIn was used as one of the social networking sites (SNSs) most suitable for business networking. To date, a total of 307 completed surveys were collected from owners, managers, or key employees from different sectors and educational backgrounds from Serbia and Germany (Table 1). Table 1: Sample Characteristics
Country of Origin Frequency Percentage
Serbia 192 62,5
Germany 115 37,5
Total: 307 100,0

305
RESULTS
Our findings confirmed that organizations from a developed country like Germany seem to be born global (e.g. are internationalized shortly after the establishment, see Figure 1). These organizations are formally committed to exporting, even if it is only on an experimental basis or only to psychologically close countries (countries that have the same culture or are at the same stage of economic development as the country of the exporting organization). These organizations are more experienced in dealing with psychologically close countries and are ready to export to countries that are more psychologically distant, even additional countries (e.g. some form of a foreign sales subsidiary or a foreign sales brunch may be added to exporting activities). Contrary, organizations from an emerging country like Serbia may fill some unsolicited orders from abroad, but do not seem interested in exporting. This seems to suggest that organizations from emerging countries, compared to organizations from more developed countries, might need some capacity-building support to fully benefit from the foreign market while contributing significantly to the sustainable business management.
Figure 1: Main results
CONCLUSION
The conventional Uppsala model of business internationalization characterized by small and gradual steps toward the foreign market, the psychological proximity (as in geographical, cultural, and economic terms), and the risk-averse strategy is no longer viable. Due to advances in digital technologies and changing market conditions, organizations are being encouraged to overcome previous constraints and expand foreign sales shortly after the establishment. Compared to their counterparts from developed economies, organizations from emerging economies still remain cautious when it comes to entering foreign markets and facing new challenges abroad. To become more sustainable, these organizations might need capacity-building support aimed at exploring business internationalization as the foundation for the sustainable business management.
Keywords: business internationalization, sustainable business management, sustainable development
REFERENCES
[1] Cantele, S., & Zardini, A. (2020). What drives small and medium enterprises towards sustainability? Role of interactions between pressures, barriers, and benefits. Corporate Social Responsibility and Environmental Management, 27(1), 126-136. DOI: 10.1002/csr.1778
[2] Denicolai, S., Zucchella, A., & Magnani, G. (2021). Internationalization, digitalization, and sustainability: Are SMEs ready? A survey on synergies and substituting effects among growth paths. Technological Forecasting and Social Change, 166, 120650. DOI: 10.1016/j.techfore.2021.120650
[3] Gómez-Bolaños, E., Ellimäki, P., Hurtado-Torres, N. E., & Delgado-Márquez, B. L. (2022). Internationalization and environmental innovation in the energy sector: Exploring the differences between multinational enterprises from emerging and developed countries. Energy Policy, 163. DOI: 10.1016/j.enpol.2022.112867
[4] Lartey, T. A., Amankwah-Amoah, J., Danso, A., Adomako, S., Khan, Z., & Tarba, S. Y. (2021). Environmental sustainability practices and offshoring activities of multinational corporations across emerging and developed markets. International Business Review, 30(5), 101789. DOI: 10.1016/j.ibusrev.2020.101789
[5] Park, S. B. (2018). Multinationals and sustainable development: Does internationalization develop corporate sustainability of emerging market multinationals?. Business Strategy and the Environment, 27(8), 1514-1524. DOI: 10.1002/bse.2209

306
ASSESSMENT OF ENTREPRENEURIAL COMPETENCES OF INDUSTRIAL
ENGINEERING STUDENTS: POST-COVID19 RESULTS
Marko Orošnjak*1, Nebojša Brkljač
1, Velibor Karanović
1
1University of Novi Sad – Faculty of Technical Sciences *Corresponding author, e-mail: [email protected]
OBJECTIVE
The paper is set to investigate the entrepreneurial competences of Industrial Engineering students. The study’s main objective includes investigating the consequences of the learning outcome of industrial engineering students during and after the COVID19 pandemic. The learning outcome considered is the level of entrepreneurial competence level. The entrepreneurial level is defined by the EntreComp reference framework (Council of the European Union, 2018), which is also used as a research instrument (López-Núñez et al., 2022). Since the teaching classes are held over meeting platforms (e.g., Microsoft Teams, ZOOM, Skype), we found it interesting to observe the effect of students’ entrepreneurial levels. A literature review provided significant insights on the matter of entrepreneurial thinking of engineers, even to the extent that special online courses were formed to improve the entrepreneurial thinking of engineers (Philbin, 2020). Considering the elements of entrepreneurial competences (knowledge, skills, and attitudes), the observation of students’ performance in the previous semesters shows a lack of knowledge of how to transfer ideas into actions and develop better attitudes characterised by a sense of initiative and pro-activity to achieve objectives. In that sense, the students are empowered during the semester through new digital content that can provoke their entrepreneurial thinking, problem-solving, and self-initiative. We, therefore, test the effect of entrepreneurial competencies level by measuring the effect before and after the semester during a specific course. There are different methods of measuring entrepreneurial competences present in the literature (Gianesini et al., 2018). However, the 8-level progression model given by the EntreComp framework was used, and the effect was tested using Fold Change (FC) and Wilcoxon-rank sum (WRS) test, in addition to the Partial Least Squares discriminant analysis (PLS-DA) that is used for visualising the effect of change.
METHODOLOGY
The study uses the EntreComp Reference Framework developed by JRC (Joint Research Centre) as a research instrument. The research instruments investigate and measure the progression level of 3 competency areas: “Ideas and Opportunities”, “Resources”, and “Into Action”. Each area consists of 5 competencies alongside an 8-progression level model, with 442 possible outcomes. The authors translated the EntreComp survey and sent the survey over Microsoft Teams platform during the teaching of the courses in the winter semester of 2021. Over the semester, the students were stimulated to understand better entrepreneurial thinking, knowledge, and skills required. At the first surveying time, the response rate was 67.5% of the group of 83 students, and at the final stage, the response rate was 37.4%. The combination of FC and WRS is used to measure the effect of change by using a volcano plot (Figure 1). The FC describes the quantitative change between initial and final measurement, which can be upgraded (+)

307
or downgraded (-) in values, meaning the effect is positive or negative. The combination of WRS (considering p-value) will contribute to statistically significant change results.
RESULTS
After evaluating the effect by utilising the change ratio, i.e., Fold Change (FC), we can see that the change between initial and final results obtained 9 EntreComp threads were changed by measuring initial and final values. The FC threshold is set as 1.2, i.e., 20% of change up to or downregulated. Due to space limitations, for understanding threads’ acronyms, the reader is referred to DOI: 10.5281/zenodo.6508495.
Table 1: The FC results of individual threads of EntreComp Framework SNPI GA MANRIS ICSO DEF UND BERES EYN GET FC 1.42 1.27 1.26 1.25 1.24 0.81 0.82 1.22 1.22 log2FC 0.50 0.35 0.34 0.32 0.32 -0.29 -0.28 0.28 0.28 By observing individual threads, it can be observed that SNPI (sharing and protecting ideas) has the highest overall improvement at the end. However, including WRS (p-value < 0.05), the results show that only Guide Actions (GA) resulted in a statistically significant improvement of all threads (Figure 1), even though measurements of other threads also showed a slight improvement in overall progression level.
Figure 1: Volcano plot of FC and WRS test
Given the obtained results, we also use PLS-DA for visualisation and exploration purposes. The principal components (PCs) or latent variables (LVs) of PLS-DA show 38.7% of the variation in the first two LVs. The PLS-DA 3D plot (Figure 2) shows the classification of initial and final measurements of progression level given the competences’ threads. Aside from depicting the effect of the variation between initial and final values of threads (classification), the PLS-DA is also used to explore the latent threads that have contributed most to the classification, i.e., the effect of change. For this purpose, the specific VIP (Variance importance in projection) score is used (eq.1):
(1)
where F is the number of latent variables of the PLS model, the J is the number of X variables; w i is the PLS-weight calculated by the percentage explained with Y variance (SSY) considering specific LV.

308
Figure 2: PLS-DA 3D results of latent variables (components)
The VIP score of each thread considered in the PLS-DA model that contributes to the discrimination (separation) of the class labels are GA (Guide Action), MANRIS (Manage Risk), and SNPI (Share and protect ideas) are the highest. Hence, it suggests that as a result of empowering the entrepreneurial thinking of industrial engineering students, we have reinforced their “Vision”, “Valuing ideas”, and “Coping with uncertainty, ambiguity and risk” competences. However, there is a slight decrease in the “Motivation and perseverance” competence, suggesting a lack of seeing the effect of practical problem solving and the results of their ideas being transformed into actions.
CONCLUSION
The paper evaluates the entrepreneurial competences of industrial engineering students during the COVID-19 pandemic. The results obtained show that the GA thread of the “Vision” competence shows statistically significant improvement in the initial and final survey results. Although there is a significant improvement in “Valuing ideas” and “Creativity” competences, it is a result of a slight improvement (<5%) of all threads (predictors) measured by the EntreComp reference framework. As a result of improving the entrepreneurial thinking of industrial engineering students, there is a drop in motivation and perseverance competence, suggesting the downgraded effect of online teaching.
Keywords: entrecomp framework, covid-19, entrepreneurial competences, partial least squares, fold change, industrial engineering
REFERENCES
[1] Council of the European Union (2018). Key competences for lifelong learning: A European Reference Framework. Official Journal of the European Union, 2, 7-13.
[2] Gianesini, G., Cubico, S., Favretto, G., & Leitão, J. (2018). Entrepreneurial Competences: Comparing and Contrasting Models and Taxonomies. Studies on Entrepreneurship, Structural Change and Industrial Dynamics, 13-32. DOI: 10.1007/978-3-319-89336-5_2
[3] López-Núñez, M. I., Rubio-Valdehita, S., Armuña, C., & Pérez-Urria, E. (2022). EntreComp questionnaire: a self-assessment tool for entrepreneurship competencies. Sustainability, 14(5), 1-14. DOI: 10.3390/su14052983
[4] Philbin, S. P. (2020). Entrepreneurial skills for engineers – Insights from the development of an online course. In ASEM 41st International Annual Conference Proceedings ‘Leading Organizations through Uncertain Times’.

309
RETHINKING MARKETING AND COMMUNICATION IN POST-
COVID ERA

310
EMPLOYER BRANDING STRATEGY: UNIVERSITY AND INDUSTRY
COLLABORATION
Vesna Damnjanović*1, Marija Trivanović
2
1University of Belgrade – Faculty of Organizational Sciences
2Coca Cola Hellenic d.o.o.
*Corresponding author, e-mail: [email protected]
OBJECTIVE
Changing demographics and pandemic conditions have given rise to increasingly competitive at talent management markets, where competition for good undergraduate students is strong. An employer branding strategy allows companies to communicate, support and engage top talent students during their studies to ensure higher talent acquisition and retention after graduation..Passive learning and ex catedra traditional teaching and becoming one of the biggest problem at higher educational institutions. (Lapoule & Lynch, 2018). In dynamic time, the business school mission is to put students in the centre and provide them active case learning opportunity to improve practical knowlege, problem solving and other management skills which will prepare them for the future career (Damnjanovic et al., 2017). The aim of this paper is to present an innovative approach of strategic partnership and employer branding strategy between Coca-Cola Hellenic and the University of Belgrade, Faculty of Organizational Sciences. The paper raises two research questions:
1. How Coca Cola Hellenic become top 1 employer among chosen students’ group and how many students are interested in doing a real case project and going on an internship with managers?
2. What is successful social media communication strategy in building employer branding with generation Z?
Strategic partnership beetwen university and inustry is exrermly important. Collaboration of FOS and Coca Cola Hellenic provides access to cases from real life, executive guest lecture, internship with mentorship, case competition, company visit, access to topics related to bachelor, master and doctoral thesis. Employer branding innovative strategy for generation Z (Pandita, 2021) is important task for every company. The main results of adeqaute employer branding should provide: employer awareeness and preference among young population and engage them to become active brand ambassadors of case project company at Linkedin, social media network (Anđelković Labrović et al., 2021) and students recommendation. Successful communication of the employer's brand on social networks is important for the attractiveness of the employer (Barjaktarević et al., 2021).
METHODOLOGY
For this purpose, Sales Management course was chosen as a best practice example. We use quantitative and qualitative methodology in order to provide responses to research questions. We also made joint program and mentorship for both side, university and company.
RESULTS
A total of 66 undergraduate students from the Faculty of Organizational Sciences chose to take the Sales Management as elective course. 57 students (86.33%) in 12 teams took part in the development of a real case project: Launch New sparkling water Rosa of as a way of partial exams, while 30 students (45.45%)

311
agreed to go on a one-week sales field internship with company managers to learn how to negotiate and position a new product in the on-trade sales channel HoReCa segment. Referring the respond to research question 2 majority of students published their internship status on LinkedIn page as a business social media channel. The successful communication strategy to talent students pull should be developed using omnichannel marketing strategies and combination of offline communication: during live learning courses at faculty and digital communication channels: Microsoft Team platforms, social media strategy and personalized message.
CONCLUSION
The paper emphazies the role of professor and industry representative of developing and use of active learning method: real case study project at undegraduate study university course. The main benefits for HEI is promoting students engagement and improving business school reputation. The main benefits for case company is employer branding possiblities including: building better perception of company image among young generation, guest lectures from company and direct communication opportunity - interaction with students, innovative ideas as a results of case solving project and possibilities to select and recruit students. It is important to note that the image and reputation of the successful employer for generation Z is built through WOM friends reccomentation and eWOM (Linkedin) communication strategies. The study provides guideline for marketing, communication and human resource management practicioners (industry experts) and business schools (professors and students) for applying strategy of developing innovative employer brand strategy among generation Z.
Keywords: employer branding strategy, case study project, student engagement, university and industry partnership, Faculty of Organizational Sciences
REFERENCES
[1] Lapoule P., & Lynch R. (2018). The case study method: exploring the link between teaching and research. Journal of Higher Education Policy and Management, 40(5), 485-500. DOI: 10.1080/1360080X.2018.1496515
[2] Damnjanovic, V., Stavljanin, V., & Bogdanoska Jovanovska, M. (2018). Student Case Competition as a Talent Recruitment Tool – Employee Branding for Companies. International Journal FENESTRA, 4(1), 72-90.
[3] Pandita, D. (2021). Innovation in talent management practices: creating an innovative employer branding strategy to attract generation Z. International Journal of Innovation Science, ahead-of-print. DOI: 10.1108/IJIS-
10-2020-0217 [4] Anđelković Labrović, J., Kovačević, I., Damnjanović, V., & Cicvarić Kostić, S. (2021, September). Employer
Branding Framework Using Social Media for Attracting Talents. E-business Technologies Conference Proceedings, 1(1), 70-73.
[5] Barjaktarović, S, Cicvarić Kostić, S., & Kostić-Stanković, M. (2021). Komunikacija brenda poslodavca u oglasima za posao. Marketing, 52(4), 225-234. DOI: 10.5937/mkng2104225B

312
DIGITAL PERFORMANCE OF LEADING FASHION BRANDS
Natalija Eferica*1, Slavica Cicvarić Kostić
1, Milan Okanović
1
1University of Belgrade – Faculty of Organizational Sciences
*Corresponding author, e-mail: [email protected]
OBJECTIVE
Technological development, globalization, and the rise of purchasing power have caused the growth of the fashion industry and competition within it. Creating strong brands in this industry, both in offline and online environments is sine qua non to stay competitive in the contemporary environment (Siddiqui, 2022). It is important that companies let voice to be heard in digital environment and that they manage their digital presence wisely (Cicvarić Kostić & Štavljanin, 2020).
Fashion branding is pivotal in building a distinctive image of a product, and it is beneficial for both customers and brands (Jafariyan & Nayebzadeh, 2021). In addition, digital channels are suitable for fashion companies as they allow them a plethora of opportunities to present and promote their brands and to communicate with customers, communities, and other stakeholders. Digital communications enable the company to get closer to customers and understand them better, add value to products, expand distribution channels and increase sales by running digital marketing campaigns, using digital channels (Chaffey & Smit, 2017). This paper aims to explore the literature to identify specifics of online branding in the fashion industry, and to identify the basic principles of successful digital presence and performance of fashion brands. The results of the research could be valuable to fashion companies that strive to develop and manage their brands in the online environment. The purpose is to get insights into best practices of the most valuable fashion brands in order to other brands can benefit from applying a successfully evidenced approach.
METHODOLOGY
The paper comprises the analysis of relevant theoretical frameworks, and both quantitative and qualitative analysis of online activities and performance of leading fashion brands (nine in total) according to Interbrand’s list of the best global brands for the year 2020 (Interbrand, 2021). The analysis includes the number and type of digital channels used, relevant metrics, as well as the content that these brands post. For a better understanding of each brand, general information and brand history are also provided. Digital channels included in the analysis are brands’ websites, social media profiles and channels and branded apps. The metrics for websites were obtained from “Official Measure of the Digital World”, available at similarweb.com, and used by both practitioners and academics (Skopeliti & Stamou, 2019). These metrics include website traffic origin, average monthly visits, average visit duration, number of pages per visit, and bounce rate. Social media insights were obtained from brands owned social media profiles, as well as from Hypeauditor platform. Metrics vary across the platforms analyzed and most frequently include the number of followers/subscribers, reactions, and the number of content pieces published.
RESULTS
Based on existing literature and both qualitative and quantitative analysis of the digital presence of leading fashion companies, several principles for the successful digital presence of fashion brands have been identified, from suggestions regarding potential of various digital channels that can be used, over frequency of posting, to recommendations regarding content adapted to the media and trends. Based on the research, these principles have been proven to lead to better digital performance.
313
CONCLUSION
The paper identifies principles for building a brand presence in online environment. The analysis included multiple cases analysis, and all selected cases explore the same phenomena. The successful practices of the most valuable fashion brands are explored, and this empirical reality allows other brands from the industry to use them as guidelines for building a strong online brand. The paper brings some novelties to the literature in the domain of fashion online branding, but also has limitations that can serve as opportunities for further research. The paper analyzes only the most valuable brands, so it could be extended to more brands from the industry. In addition, future research can focus on in-depth analysis of available data regarding digital presence and metrics in order to determine more valuable insights (for example, what type of content is evidenced to be most effective and others).
Keywords: online branding, fashion brands, digital communication channels, digital performance
REFERENCES
[1] Chaffey, D., & Smith, P. R. (2017). Digital Marketing Excellence: Planning, Optimizing and Integrating Online Marketing, 5
th ed. Oxon, UK: Routledge.
[2] Cicvarić Kostić, S., & Štavljanin, V. (2020). Brend menadžment: Kreiranje prepoznatljive vrednosti. Beograd:
Fakultet organizacionih nauka. [3] Hypeauditor (2022). Retrieved from hypeauditor.com/ [4] Interbrand (2021). Best Global Brands. Retrieved from interbrand.com/best-global-brands/ [5] Jafariyan, H., & Nayebzadeh, S. (2020). Analyzing the Intellectual Paradigm of Fashion Branding in
International Research. International Journal of Information Science and Management (IJISM), 19(1), 59-74. [6] Siddiqui, K. (2022). Brand equity trend analysis for fashion brands (2001-2021). Journal of Global Fashion
Marketing, 1-18. DOI: 10.1080/20932685.2022.2032792 [7] Similarweb (2022). Retrieved from https://www.similarweb.com/ [8] Skopeliti, A., & Stamou, L. (2019). Online Map Services: Contemporary Cartography or a New Cartographic
Culture?. ISPRS International Journal of Geo-Information, 8(5), 215-243. DOI: 10.3390/ijgi8050215

314
THE APPLICATION OF SOCIAL MARKETING IN ART INSTITUTIONS
COMMUNICATION
Radmila Janičić*1, Mirjana Gligorijević
2
1University of Belgrade – Faculty of Organizational Sciences
2University of Belgrade – Faculty of Economics
*Corresponding author, e-mail: [email protected]
OBJECTIVE
The paper presents theoretical and practical aspects of the application of social marketing in art institutions. The focus of the paper is on developing theoretical aspects of social marketing in an art institution in order to develop a theoretical approach to the application of social marketing in art institution positioning in the art marketplace, as well as in order to develop communication with an audience of the art institutions, as well in order to raise awareness about some social problems through programs that present art institutions. The theoretical part of the paper is based on modern literature in the field of social marketing approach in communication and positioning of art institutions. The key hypothesis of the paper is that the application of social marketing in art institutions improves communication with the audience and makes a platform for better positioning of the art institutions. The special aspect of the paper is strategies of social marketing in art institutions in order to better communicate with the audience and strengthen the position of the art institutions. In the empirical research, the paper will present case studies about the implementation of the application of social marketing in art institutions. The empirical research will include results of questionnaire research about the impact of the application of social marketing in art institutions' communication. The research in the paper will be qualitative and quantitative. The empirical research will analyze the impact of experience marketing, emotional marketing and traditional social marketing strategies implementation in raising awareness about the art institutions, communication of the art institutions with the audience and positioning of the art institutions. In the case studies, the paper will present good examples of the application of social marketing in raising awareness about art institutions. The paper presents modern ways of developing art institutions. The paper will analyze the impact of social media applications on raising awareness about art institutions. Presented case studies are Museum Louvre, Museum Tate Modern, and Exhibition "Loving Vincent", about the work and life of Vincent Van Gogh, exhibition "500 years of genius", about work and life of Leonardo de Vinci, examples of the publishing institutions. The paper will present the work of art and cultural institutions, like "The House of Beautiful Business", the work of literature publishing house "Booka", work of "Budva, City of Theatre". The paper's focus is the application of social marketing in art institutions' communication. The paper will present in-depth interviews with artists and art managers about applying social marketing to art institutions' communication.
METHODOLOGY
The methodology in the paper is based on quantitative and qualitative analysis. Quantitative analysis includes focus groups with artists and art managers of the art institutions about applying social marketing in art institutions' communication. Also, qualitative analysis in the paper includes in-depth interviews with artists, public audiences and art managers about the impact of social marketing on art institutions' communication. In quantitative analysis, a questionnaire for the public audience about art's experience in communication with art institutions will be done. The questionnaire will be processed in the program SPSS. The paper will present the results of the analysis of the statement of the public audience about art
315
institutions' communication and the impact of social marketing on raising art institutions' communication. All focus group results, in-depth interviews, and questionnaires will be presented and analyzed in the paper.
RESULTS
The paper's results will clearly define the application of social marketing in art institutions' communication. The focus group, in-depth interviews, and questionnaire research will answer the application of social marketing in art communication in the post COVID era. The results will show new ways of applying social marketing in art institution communication and networking with public audiences and stakeholders. The results will emphasize that social media are important in art institutions' communication with the public audience. The art institutions have social media profiles to better two-way communication with the public audience.
CONCLUSION
The paper has a theoretical and practical contribution to the theory of the application of social marketing in art institutions' communication. The special contribution of the paper is quantitative and qualitative analysis of impact of the social market on the development of art institutions' communication. The application of social marketing in art institutions' communication could improve the connection with the public audience and analyze the public audience's needs and wishes to develop better art programs and make the connection with a more public audience. Also, the application of social marketing in art institutions' communication could impact on better positioning of the art institutions. The case studies in the paper present a good application of social marketing in the development of the art institutions' communication. The empirical research in the paper will improve social marketing strategies to find better and more ways to communicate with the public audience and better position the art institutions and their art programs.
Keywords: social marketing, art institutions, marketing strategies, experience marketing, public audience.
REFERENCES
[1] Belch, G., & Belch, M. (2012). Advertising and Promotion – An Integrated Marketing Communications Perspective. New York: McGraw-Hill.
[2] Blakeman, R. (2006). Integrated Marketing Communication. Toronto: McMillan. [3] Janičić, R., & Žugić, J. (2018). Challenge of Communications in Art’s Projects. Journal of Media Dialogue,
32(11). [4] Ćorović, B., & Janičić, R. (2018). A Challenge of Holistic Marketing in Artistic Projects. Journal of Marketing,
Serbian Marketing Association, 49/2, 105-112. [5] David, P. (2005). Integrated Marketing Communication. Toronto: Elsevier Inc. [6] Filipović, V., & Janičić, R. (2021). Strateški marketing. Beograd: FON. [7] Larry, P. (2008). Strategic Integrated Marketing Communication. Toronto: Elsevier Inc. [8] Kennet, C. (2008). Integrated Advertising, Promotion and Marketing Communication. New York: Prentice Hall. [9] Kevin, R. (2004). The Future Beyond Brands - Love marks. New York: Power House Books.

316
THE EFFECTS OF COMMUNICATION DURING THE PANDEMIC ON PUBLIC
OPINION AND TRUST IN THE INSTITUTIONS OF THE SYSTEM
Dragan Janković1, Jovanka Vukmirović
1, Aleksandra Vukmirović
*2
1 University of Belgrade – Faculty of Organizational Sciences
2Belgrade Business and Art Academy of Applies Studies
*Corresponding author, e-mail: [email protected]
OBJECTIVE
Public opinion represents the attitude of the majority on issues of wider social significance at a given time. The media holds a special importance for the formation of public opinion and trust in the institutions of the system during the Covid19 pandemic. The Covid19 pandemic surprised the world, a huge number of people were infected, which exceeded the capacities of the health systems of even developed countries. The Government of the Republic of Serbia, the Ministry of Health and the Crisis Staff, respecting the recommendations of the World Health Organization, tried to manage the crisis and reduce the effects of the spreading disease. From the beginning, the pandemic was accompanied by countless sensationalist announcements that caused serious confusion in public opinion. The more attractive, unverified they are – the faster the informal content spread and had a stronger influence on public opinion, and the dissemination of news becomes viral.
METHODOLOGY
The central part of the paper presents the methodology of public opinion research in Serbia on a representative sample of 1,000 adult respondents, conducted in the second quarter of 2021. The results of the research were analyzed in the context of a set of demographic variables (gender, age, level of education, employment status, financial status, urbanity of the environment) in order to identify differences in attitudes between segments of the public. Also, the results of research from relevant secondary research are presented in order of comparison and reliability of the conclusions. General scientific methods of analysis and synthesis, abstraction and concretization, inductive - deductive method, content analysis methods and statistical methods were used in the preparation of the paper. In the experimental part of the paper, desk research methods were applied, as well as methods for the realization of primary research. The results of the research are presented in the textual, tabular and graphical form.
RESULTS
The results of the online research, conducted nearly a year after the World Health Organization announced the spread of a new coronavirus (Washington, March 5, 2021) in Canada, USA, Australia, France, Germany, Japan, Russia and the United Kingdom, by the company "Ipsos“ are presented in this paper in order of better understanding of behavior of the population in Serbia. Ipsos published the main findings of its research that the population of six of the eight major countries has less confidence in the ability of their governments than last year. Also, public is losing trust in global health officials and politicians in genera. On average, three in ten adult respondents in eight countries believe the
317
media is exaggerating the scale of the Covid19 outbreak. Doctors and local health workers are more trusted than at the beginning of the crisis.
CONCLUSION
According to the data of the Statistical Office of the Republic of Serbia in the period January - November 2021, the number of live births was 56,648 (0.1% more than in the same period in 2020) while the number of deaths was 123,492 (25,859 or 26,5% more compared to the same period 2020). According to the official data of the Institute of Public Health Milan Jovanović Batut, from the beginning of the pandemic until April 20. 2022, the total number of people suffering from coronavirus in Serbia is 2,006,353, and a total of 15,991 citizens died. Vital statistics, primarily the ratio of the number of live births and deaths in the period 2020-2021 indicate that the epidemic of the coronavirus has the scale of a catastrophe that has yet to end. In an environment where the majority of the population (78.9%) is concerned about the risk of infection and trust in the institutions of the system is low, it is necessary to design activities to improve media communications, especially in identifying and preventing viral effects and spreading untruths, fake news and half-information which endanger the health and lives of a large number of citizens.
Keywords: public sector, public opinion research, pandemic, strategic communications.
REFERENCES
[1] Aaker, D. A., Kumar, V., Leone, R. P. & Day, G. S. (2016). Marketing Research, 12th
ed, Wiley. [2] Devkota, R. (2020). Quota Sampling Mathstopia. Retrieved from www.mathstopia.net/sampling/quota-sampling [3] Filipović, V. & Kostić-Stanković, M. (2014). Public Relations, Faculty of Organizational Sciences University of
Belgrade. [4] Hood, C. (2010). The Blame Game: Spin, Bureaucracy, and Self-Preservation in Government. Princeton, NJ:
Princeton University Press. [5] Ipsos (2021). What Worries the World February 2021. Retrieved from www.ipsos.com/sr-rs/what-worries-world-
february-2021 [6] Ipsos (2021). One-year global public loses confidence institutions. Retrieved from www.ipsos.com/sr-
rs/Covid19-one-year-global-public-loses-confidence-institutions [7] Matijašević, M. (2019). Public Opinion Research in the Public Sector. Master's Thesis, Faculty of Organizational
Sciences, University of Belgrade, Belgrade. [8] Mihailović, D. (2012). Methodology of Scientific Research. Faculty of Organizational Sciences, University of
Belgrade, Belgrade. [9] Vilkoks, D., Kameron, G., Olt, F., & Ejdži, V. (2006). Public Relations: Strategies and Tactics. Faculty of
Economics University of Belgrade, pp. 214-217. [10] Vukmirović, J., & Vukmirović, D. (2016). Marketing Research. Belgrade Business School of Applies Studies.

318
CHANGES IN MARKETING PERFORMANCE MEASUREMENT DUE TO
THE COVID-19 PANDEMIC – EVIDENCE FROM CEE
Tijana Jugović*1, Velimir Štavljanin
1
1 University of Belgrade – Faculty of Organizational Sciences
*Corresponding author, e-mail: [email protected]
OBJECTIVE
Performance measurement (PM) is one of the top priorities in times of crisis such as the Covid-19 pandemic. During the pandemic, company managers additionally activate marketing and application of digital media, which become primary for communication and attracting customers. Given the fact that marketing is becoming one of the priority areas of business in the era of the pandemic, managers are interested in measuring marketing performance. The aim of this paper is to identify marketing indicators used by managers before the Covid-19 pandemic and changes in the choice of marketing indicators as a result of the pandemic's impact on companies' operations.
METHODOLOGY
The research in this paper was conducted in the hotel sector of Bosnia and Herzegovina before and during the Covid-19 pandemic. Managers from 34 winter tourism hotels participated in the research. The research was conducted in two phases. In the first phase of the research, a review of relevant literature was performed and a list of key marketing metrics used by hotel managers was created. In the second phase, empirical research was conducted on the levels of implementation of marketing metrics and managers' attitudes on the usefulness of marketing metrics before the Covid-19 pandemic and during the pandemic.
RESULTS
The results of the research have shown changes in the structure of marketing performance measurement. At the time of the pandemic, hotel managers relied heavily on non-financial marketing metrics, while the application of financial marketing metrics was declining. Also, the results have shown that at the time of the Covid-19 pandemic, the gap between the level of application of marketing metrics and the achieved financial results of hotels was widened even further in relation to the period before pandemic. The results of the research showed that there were also changes in the attitudes of managers about the importance of marketing metrics in business planning, management and control. Managers' attitudes on the importance of non-financial marketing metrics are more positive in relation to non-financial marketing metrics during the Covid-19 pandemic.
CONCLUSION
The results of this research can be the basis for the development of marketing PM in the hotel sector during a crisis within the CEE region. The limitations of this research are the sample size, as well as the analysis of only a group of marketing metrics. The development of different groups of metrics would enable better analysis and consideration of the causal consequences within the hotel business process.
Keywords: performance measurement, marketing metrics, hotel industry, Bosnia, COVID-19

319
REFERENCES
[1] Delahaye, P. K. (2007). Measuring Public Relationships. KD Paine & Parners Berlin. New Hampshire. [2] Davis, J. A. (2007). Measuring marketing: 103 Metrics Every Marketer Needs. John Willey & Sons: Singapore. [3] Farris, P. W., Neil, T. B., Pfeifer, P. E., & Reibstein, D. J. (2016). Marketing Metrics: The Manager's Guide to
Measuring Marketing Performance. Pearson Education, Inc. Upper Saddle River: New Jersey. [4] Fatima, T. & Elbanna, S. (2020). Balanced scorecard in the hospitality and tourism industry: past,present and
future. International Journal of Hospitality Management, 91, 102656. [5] Lai, I. K. W. & Wong, J. (2020). Comparing crisis management practices in the hotel industry between initial and
pandemic stages of COVID-19. International Journal of Contemporary Hospitality Management, ahead-of-print. DOI: 10.1108/IJCHM-04-2020-0325
[6] Lim, S. T., Preis, M. W., Lee, C.-K., Mangematin, V., & Kim, M. J. (2020). The influence of open innovation activities on non-financial performance in the cultural tourism content industry. Current Issues in Tourism, 1-5.
DOI: 10.1080/13683500.2020.1754356 [7] Magnini, V. P., Crotts, J. S. & Calvert, E. (2020). The increased importance of competitor benchmarking as a
strategic management tool during COVID-19 recovery. International Hospitality Review, ahead-of-print. DOI: 10.1108/IHR-08-2020-0044
[8] Neuburger, L. & Egger, R. (2020). Travel risk perception and travel behaviour during the COVID-19 pandemic 2020: a case study of the DACH region. Current Issues in Tourism, 1-14. DOI: 10.1080/13683500.2020.1803807
[9] Phillips, P. (2005). Performance Measurement Systems in Tourism, Hospitality, and Leisure Small Medium-Sized Enterprises: A Balanced Scorecard Perspective. Journal of Travel Research, 44(2), 201-211.
[10] Radygina E.G. & Oshkordina A.A. (2020). Organization of Accommodation Facilities During the Pandemic: How to Stay Hospitable While Complying with Sanitary Requirements. Advances in Social Science, Education and Humanities Research, 486, 326- 330.
[11] Rust, R. T., Ambler, T., Carpenter, G. S., Kumar, V., & Srivastava, R. K. (2004). Measuring Marketing Productivity: Current Knowledge and Future Directions. Journal of Marketing, 68, 76-89.
[12] Sainaghi, R., Phillips, P., & Corti, V. (2013). Measuring hotel performance: Using a balanced scorecard perspectives’ approach. International Journal of Hospitality Management, 34, 150-159. DOI: 10.1016/j.ijhm.2013.02.008
[13] Tien-Chin, W. & Shu-Li, H. (2020). Benchmarking tourist hotels performance for strategies development. Current Issues in Tourism, 23, 1-18. DOI: 10.1080/13683500.2020.1718065
[14] Uddin, S., Popesko, B., Papadaki, Š. & Wagner, J. (2021). Performance measurement in a transitional economy: unfolding a case of KPIs. Accounting, Auditing & Accountability Journal, 34(2), 370-396. DOI:
10.1108/AAAJ-11-2019-4231 [15] Wadongo, B., Odhuno, E., Kambona, O., & Othuon, L. (2010). Key performance indicators in the Kenyan
hospitality industry: a managerial perspective. Benchmarking: An International Journal, 17(6), 858-875. [16] Zigan, K., & Zeglat, D. (2010). Intangible resources in performance measurement systems of the hotel industry.
Facilities, 28(13/14), 597-610.
320
CHALLENGE MANAGEMENT IN FILM INDUSTRY CAUSED BY COVID-19:
OVERCOMING SOLUTIONS
Milica Kostić-Stanković1, Dejana Nikolić*
1
1University of Belgrade – Faculty of Organizational Sciences *Corresponding author, e-mail: [email protected]
OBJECTIVE
One of the industries that has slowed significantly due to the COVID-19 pandemic is the film industry (Hall & Pasquini, 2020). Earnings from total film and television production have fallen by 97.8% since the beginning of the "covid era", leaving much of the industry's production kits, agents, publicists and analysts out of work overnight (Johnson, 2020). On the other hand, large cinema chains, such as Cinemark theaters AMC, have declared a drop in revenue or were on the verge of declaring bankruptcy (Szlai & Vlessing, 2020). Due to the closure of cinemas, a list of delayed production series and films has begun to form. The COVID-19 pandemic and the blockade of everyday life have changed everyone’s lifestyle, affecting consumption patterns, media use, consumer behavior, marketing trends, and these changes are likely to remain long-term (Brindha, Jayaseelan & Kadeswaran, 2020). The short-term impact of COVID-19 was felt immediately, due to widespread isolation and social distancing measures around the world. Therefore, companies must explore feasible marketing innovations to survive the crisis. What is certain is that corporate communication and marketing in general changed immediately as restrictions were introduced (Argenti, 2020). Marketing in the creative industries, especially in the film industry, is very specific. It is consumer-focused, the product is based on tangible and intangible benefits, it is colored by cultural significance, and it essentially exists to meet the needs of the market (Ulker-Demirel & Yildiz, 2020). The COVID-19 pandemic has strongly affected the film industry. However, there is a belief that quarantine can actually help in watching movie premieres on television. This can be interpreted as a light at the end of the tunnel of the pandemic era - for the film industry. The aim of this paper is to summarize and highlight all the challenges faced by the film industry during the pandemic, as well as possible solutions to overcome all the problems in that context.
METHODOLOGY
Considering the subject of the research as well as the topic of the paper, the research methodology is based on the literature review, and in addition to this method, a comparative method is used to compare the specifics of different marketing strategies of companies belonging to film industry, as well as their presented marketing solutions to overcome all challenges. During the pandemic, interesting researches were conducted in the film industry related to importance of different marketing elements. Having that in mind, it is interesting to present a comparative analysis of the conducted research on this topic.
RESULTS
The authors pay special attention to various researches and came up with interesting results. For example, they highlighted the importance of the research on the topic which genres were most popular during the COVID-19 era and how interest in certain genres changed during this pandemic (Clark, 2020). For example, the film "The First Ladies of Gospel" debuted during quarantine, which actually made it easier for viewers to watch it. And, according to Nielsen Meida Research, the same film had 2.7 million views, which made it the best-rated original film on television since 2016. In less than a week, the film had more than 10 million views,

321
thanks to promotions via television and social media (Battles, 2020). The attendance of digital platforms for watching movies in the same period increased by 65% compared to last year. The biggest jumps in certain film genres during the pandemic era were measured in the categories of animation and sports, as well as horror and thrillers. Sports films experienced a dramatic increase of 33% in sales, suggesting that audiences had an increased need for this type of content (Clark, 2020). Also, Gorman (2020) wrote an extensive article on how habits of watching movies through online channels change during a pandemic (Gorman, 2020). A survey of viewers of four different streaming platforms showed that viewers discovered new genres during the pandemic that they did not prefer before. These genres include documentaries, comedy and science fiction.
CONCLUSION
Filmpulse (2020) pointed out that there are striking differences between countries in terms of the most watched genre during the pandemic. For example, Germany was the only country where comedy was in the top three most represented genres, while countries such as France, the United States, Italy, had thrillers, mysteries, science fiction and apocalyptic films in the highest ranks (Ulker- Demirel & Yildiz, 2020). The main conclusion of this paper is that citizens of different countries are probably fighting the COVID-19 virus in different genres. Definitely, genre is one of the most influential factors in terms of making decisions about watching movies. Knowing this, marketing activities should take into account the typical behavior of fans of different genres, in order to adequately communicate with their audience and achieve the desired viewership of films.
Keywords: film industry, film genre, marketing activities, behavior change, communication.
REFERENCES
[1] Argenti, P. A. (2020). Communicating through the coronavirus crisis, Harvard Business Review Website. [2] Battles, M. (2020). The use of social media for the promotion of movies during COVID-19. Retrieved from
thelrangle.com/2020/05/18/the-use-of-social-media-for-the-promotion-of-movies-during-covid-19/ (accessed 14 December 2021).
[3] Brindha, D., Jayaseelan, R., & Kadeswaran, S. (2020). Covid-19 Lockdown, entertainment and paid off video-streaming platforms: A qualitative study of audience preferences. Mass Communicator: International Journal of Communication Studies, 14(4), 12-16.
[4] Clark, T. (2020). Horror, disaster, and sports: Exclusive data reveals what movies audiences have watched during the pandemic, Business Insider. Retrieved from www.businessinsider.com/top-movie-genres-watched-in-pandemic-horror- family-disaster-sports-2020-7 (accessed 5 December 2021).
[5] Filmpulse (2020). How curfew and social distancing affect the film genre and streaming. Retrieved from filmpulse.info/study-corona-virus-covid-videostreaming/ (accessed 23 January 2022).
[6] Gorman, D. (2020). Netflix, Disney+, Amazon Video & Hulu: how are streaming habits changing?, GlobalWebIndex. Retrieved from blog.globalwebindex.com/trends/streaming-habits-coronavirus/ (accessed 18 December 2021).
[7] Hall, S., & Pasquini, S. (2020). Can there be a fairy-tale ending for Hollywood after COVID-19?, World Economic Forum. Retrieved from www.weforum.org/agenda/2020/07/impact-coronavirus-covid-19-hollywood- global-film-industry-movie-theatres/ (accessed 1 December 2021).
[8] Johnson Jr, M. (2020). Hollywood Survival Strategies in the Post-COVID 19 Era. DOI: 10.33767/osf.io/2nzhj. [9] Szalai, G., & Vlessing, E. (2020). Cinemark Swings to $170M Quarterly Loss, Takes 419.5M Charge for Job,
Theatre Cuts, The Hollywood Reporter. Retrieved from www.hollywoodreporter.com/news/cinemark-swings-quarterly-loss-takes-charge- job-theater-cuts-1305594.
[10] Ulker-Demirel, E., & Yildiz, E. (2020). The Effects of Audience’s Attitudes on Actor, Character, Movie and Product Placement on the Brand Attitude. Istanbul Business Research, 49(2), online first.

322
COMMUNICATION PERSPECTIVE OF LOBBYING FOR PRE-SCHOOL EDUCATION: CASE OF SERBIA
Jelena Krstović*1
1Corpo Public Affairs d.o.o.
*Corresponding author, e-mail: [email protected]
OBJECTIVE
The relevance of lobbying has been increasing in contemporary environment, not only for companies, but also for non-profit organizations (Fisar et al., 2017). As the necessity of this „mean of promoting interests within society“ (Zak, 2016) is obvious, more attention should be paid on analysing approaches and strategies that may be applied. Even though lobbying in many countries has just been regulated (Serbia as well in 2018/2019), both academics and practitioners still argue and try to develop acceptable methods and prevent unacceptable methods in lobbying (Vyrva, 2021). This paper aims to discuss professional approach to lobbying as a multilevel communication between a company or an organization and the government, but also other key stakeholders, on specific interest, and to provide evidence of successful lobbying on a case of pre-school education in Serbia. Based on Edward Freeman’s Theory of Stakeholders, every organization operates through a range of relationships with different groups of stakeholders. One of them is government and other decision-making authorities who create and shape institutional environment where an organization does business (Zak, 2016). According to Friedman and Miles (2002) government is regarded as a stakeholder with whom relationships are necessary, but these relationships are incompatible in terms of ideas and interests. This puts a light on lobbying, as a necessary activity of corporate communications for creating sustainable relationships between the organization and the government representatives and institutions. One of the basic tasks of corporate communications in this domain is to observe and understand legislation related to the organization's operations. A proactive approach implies monitoring the activities of legislative bodies and agencies in order to familiarize in advance with relevant issues. In this way, the organization can plan its policy and lobbying tactics in the direction of adapting or influencing decisions concerning its business. The paper will analyze appropriate approaches to lobbying, together with clarification of all important perspectives, and particular attention will be put on communication perspective. It will analyze the worldwide practices that can be introduced locally. Specifics of local environment will be clarified as well. The paper will present a case study to describe the operational model for lobbying on example of pre-school education. The case will report on approach used to promote a general good and change of legislative applied by a pre-school institution, together with tactics implemented. Although lobbying is not a brand-new concept, real-life examples and lessons learned remain valuable for its understanding and the paper will contribute to domestic literature in this domain.
METHODOLOGY
Methodology employed in the paper is a case study analysis with the purpose of description a successful real- life example of lobbying for pre-school education in Serbia. Data were collected through literature and relevant legislative analysis, interviews with key stakeholders included in the case presented in the paper and observations of a real-life example.

323
RESULTS
The major result of this paper is evident importance of successful lobbying, particularly regarding the implications that it has to the real business cases, as well as to the sustainable business metrics. The hypothesis that public affairs and lobbying present the overall use of corporate communications, that eventually get the legislative improved for doing business, is confirmed through this paper. The paper presents a case of lobbying and communication for the purpose of introducing subsidies for children enrolled in kindergartens, as well as its practical implications.
CONCLUSION
The main findings of this research show that communications plan, coordinate and support lobbying activities. Reaching the well-regulated and sustainable business environment could be more reachable through professional lobbying. Therefore, findings from this research could put light on lobbying theory and practice and help researchers and practitioners move their agenda forward. The major limitation of the paper is that one case study has been used. Even though the knowledge may be not acceptable for generalisation, it summarizes good paractices and guidlines that can be helpfull for succesfull lobbying.
Keywords: lobbying, communication, pre-school education, Serbia
REFERENCES
[1] Fisar, M., Spalek, J., & Urbanova, D. (2017). Ex-Ante Targeting in Lobbying Strategies: An Experimental Study,.
In Proceedings of the 21st international conference current trends in public sector research (pp. 20-26).
[2] Friedman, A. L., & Miles, S. (2002). Developing stakeholder theory. Journal of Management Studies, 39(1), 1-
21. DOI: 10.1111/1467-6486.00280
[3] Zak, M. (2018). Lobbying - regulation and bureaucracy. In Proceedings of the 16th international conference on
economic policy in the European Union member countries (pp. 414-420).
[4] Vyrva, PA. (2021). Revisiting the Main Ways of Lobbying Regulation as a Security Measure Against Corruption
Lobbying, Tomsk State University Journal, 473, 211-217. DOI: 10.17223/15617793/473/26

324
THE INFLUENCE OF AUGMENTED REALITY TECHNOLOGIES IN POST-COVID BUSINESS
COMMUNICATION
Teodora Lukić*1, Milica Kostić-Stanković
1, Marija Jović
1
1University of Belgrade – Faculty of Organizational Sciences
*Corresponding author, e-mail: [email protected]
OBJECTIVE
In the age of post-COVID, globalization and modernization, market fragmentation and niche marketing, in a dynamic environment, when competition is more frequent and creative, an efficient communication system is necessary for the survival of every company. One of the key motives of every community and organization is the formation and preservation of communication and information cycle between companies and their target groups and stakeholders for mutual notification, information, creating and improving quality relationships based on respect, trust, and loyalty. The primary goal of any type of organization in the communication process with its consumers, stakeholders and the public is to inform them about its offer and business and social activities, which has the ability to meet their requirements, expectations, desires and needs. Therefore, the purpose of integrated business communications of companies is to develop and nurture favorable quality relations of organizations with their wider and narrower social community. A key factor in forming a good image and reputation of an organization is planning, managing, and coordinating a comprehensive process of integrated business communications. Modern digital technologies have incredible potential when it comes to creating and designing marketing and business communication. Augmented Reality (AR) technologies are a very attractive and sophisticated technology that emphasizes the importance of virtual interaction in the implementation of marketing communication. AR is defined as a technological system that transmits computer-generated information to a real environment at the present time. AR technologies offer consumers the opportunity to experience a certain product or service more intensively, realistically, and credibly through a digital empirical component, before buying it. The purpose of AR technology in the implementation of marketing communication is more convincing and relevant determination of product / service characteristics in order to improve knowledge about the product and brand. The interactive determinant of marketing communication implies more intensive user testing of an authentic advertising message, and thus leads to better knowledge of the company and brand and the creation of positive and loyal relationships with consumers. The purpose of this paper is twofold. It primarily aims to present a systematic overview of the complex, interdisciplinary and comprehensive nature of integrated business communications. The second goal is a comprehensive understanding of the impact of AR technology on marketing and business communication, and how AR technologies improve the exchange of information and knowledge, particularly in pot-COVID era. Adequate integration of marketing and business communications is crucial to gaining and maintaining a competitive advantage.

325
METHODOLOGY
The concept of meta-analysis has been applied in this scientific paper. Meta-analysis is a statistical and
analytical method used to obtain an integrated result by summarizing all available and relevant data and
information. This literature review summarizes an integrated approach to communication, which can be
stimulating if the benefits of knowledge sharing are to be fully exploited. Search strategy: The researchers
searched the Kobson, Google Scholar, Emerald, and the Springer database. The retrieval time was set from
the database establishment to April 2022. Keywords retrieved were “Augmented Reality”, “Marketing”, “Post
Covid”, “Business Communication”. This search has no language restrictions or research type restrictions.
Inclusion and exclusion criteria: Inclusion criteria: Related studies on the Augmented Reality and Business
Communication. The influence of augmented reality technologies in post-covid business communication is
expounded in the studies. The specific and complex nature of communication is examined by analyzing
numerous theses and studying and respecting its defined crucial elements. It also explores a
multidisciplinary approach to integrated communications from a business and marketing perspective through
an understanding of the impact of AR technologies. The findings of our study will be pooled and presented in
the results section in the form of narration.
CONCLUSION
AR technologies provide the user with an incredible interactive experience that is not possible with the use of other technological tools. The observed literature indicates that AR technologies have great potential for the development and support of companies' aspirations to promote and market their products and services, strengthen the company's value, image, reputation, and brand. The authors state that Augmented Reality Technologies mean influencing positive relationships between consumers and the brand, encouraging the development of strong perceived experiential value. The application of Augmented Reality Technology in marketing campaigns is a form of experiential marketing, because its main purpose does not arise exclusively from quality product or service promotion but provides a quality interactive experience and a high degree of consumer satisfaction.
Keywords: augmented reality, marketing, business communication, post-COVID
REFERENCES
[1] Bulearca, M. &. (2010). Augmented reality: A sustainable marketing tool. Global Business and Management Research: An International Journal, 2(2), 237-252.
[2] Farley, J. U., & Lehmann, D. R. (1986). Meta-analyses in marketing: generalizations of response models. Lexington books.
[3] Filipović, V., &. Janičić, R. (2010). Strateški marketing. Beograd: FON. [4] Kalla, H. (2005). Integrated internal communications: a multidisciplinary perspective. Corporate
Communications: An International Journal, 302-314. [5] Kostic Stankovic, M. (2011). Integrisane poslovne komunikacije. Beograd: FON. [6] Rauschnabel, P. A. (2019). Augmented reality marketing: How mobile AR-apps can improve brands through
inspiration. Journal of Retailing and Consumer Services, 49, 43-53. [7] Tallman, S. (2003). The significance of Bruce Kogut's and Udo Zander's article, ‘Knowledge of the firm and the
evolutionary theory of the multinational corporation. Journal of International Business Studies, 34(6), 495-497. [8] Van Riel, C. B. (1997). Research in corporate communication: An overview of an emerging field. Management
Communication Quarterly, 11(2), 288-309.

326
THE IMPORTANCE OF MARKETING ACTIVITIES IN CREATIVE INDUSTRIES IN
POST COVID ERA
Dejana Nikolić*1, Ana Langović
2
1 University of Belgrade – Faculty of Organizational Sciences
2 University of Kragujevac – Faculty of Hotel Management and Tourism Vrnjacka Banja
*Corresponding author, e-mail: [email protected]
OBJECTIVE
The aim of this paper is to present in a comprehensive and concise way the changes in the creative industries during the pandemic, with an emphasis on the changes caused by disruptive innovations. Special attention was paid to the importance of managing disruptive changes in the creative industries, in the post COVID era. The first part of the paper gives a brief overview of the concept and importance of marketing activities in creative industries, while the central part deals with disruptive changes and innovations in creative industries and changes in marketing management that impose disruptive innovations during and after the pandemic. Scientific and technological development and technical achievements from the beginning of the last century have conditioned changes in socio-economic processes that are accompanied by constant demands for adaptation to change, which affect the significant transformation of organizational behavior and activities, primarily through the need to acquire and apply new knowledge, innovation and creativity. Unlike earlier times when the success of companies and national economies was measured by the amount of products produced and sold, modern world society turns to gaining a competitive advantage through the concepts of knowledge, innovation and creativity, rapid adaptation and change management (Badaoui et al., 2012). In today's environment, nothing is permanent or predictable - neither market growth, customer demand, product life cycle, rate of technological change or the nature of competition. This is especially true during turbulent times. Exactly such an era is ahead of all of us, it began during and will continue after the COVID-19 pandemic. Creativity and innovation, as the main driving force of creative industries, cause lasting changes in these industries driven by external influences, which is why is marketing management of a particular importance in these industries. This is especially the case when it comes to destructive changes that affect the core capital of these industries, humanity, which is certainly the case with the devastating changes that occur during global pandemics.
METHODOLOGY
Considering the subject of the research as well as the topic of the paper, the research methodology is be based on the literature review, and in addition to this method, a comparative method is used to compare the specifics of different companies belonging to creative industries, as well as presented potential marketing solutions of overcoming all challenges in creative industries during the COVID period.
RESULTS
After a detailed review of the literature and the comparative method it was determined that the pandemic caused significant changes in creative industries. However, adequate adaptation and timely marketing activities can bring huge benefits to both consumers and the creative industries. At first glance, destructive changes have caused a significant decline in effectiveness and profits in these industries, but adequate

327
marketing responses based primarily on digital technologies have brought the creative industries closer to consumers. All this is further facilitated by the fact that intermediaries between producers of creative products and their consumers are less needed today. All of the above has led to a significantly changed economic model in most creative industries (which is not always easy to apply in practice and requires time) which provides the opportunity to build closer relationships with consumers, better knowledge of consumer needs and desires, and thus adapt products consumer (Brydges et al., 2021). Also, this has enabled a greater flow of creative material and consumer ideas that have the effect of wider creative involvement, as consumers can become content creators (Harper, 2020). In other words, the distinction between consumers and content creators in creative industries has become blurred, and the main aspect of these changes in creative industries is that they have enabled consumers to participate in cultural and creative production and sharing, which in turn has transformed the creative industries market.
CONCLUSION
Despite the challenges, it can be concluded that the creative industries are successfully adapting to change, because innovation and creativity are the main inputs in these industries. The power of imagination and the imagination of creative industries, combined with creative practices and adequate marketing activities, which emphasize the importance of consumers and communication with them, make these industries in almost all sectors able to quickly and efficiently adapt to change (Kumar et al., 2021). It is assumed that digital technologies, understanding consumer behavior, then anticipating changes in their behavior will significantly contribute to the focus of marketing experts on innovative forms of communication and timely responses in the post COVID era.
Keywords: creative industries, marketing management, changes, creativity, COVID era.
REFERENCES
[1] Badaoui, K., Lebrun, A. M. & Bouchet, P. (2012). Clothing Style, Music, and Media Influences on Adolescents’ Brand Consumption Behavior. Psychology & Marketing, 29(8). DOI: 10.1002/mar.20544
[2] Brydges, T., Heinze, L., Retamal, M. & Henninger, C. E. (2021). Platforms and the pandemic: A case study of fashion rental platforms during COVID‐19, The Geographical Journal, 187(1), 57-63.
[3] Harper, G. (2020). Creative industries beyond COVID-19. Creative Industries Journal, 13(2), 93-94. [4] Kumar, A., Prakash, G. & Kumar, G. (2021). Does environmentally responsible purchase intention matter for
consumers? A predictive sustainable model developed through an empirical study. Journal of Retailing and Consumer Services, 58, 102270.
328
VISIBILITY, FAVORABILITY AND EFFECTIVENESS OF SOCIAL
MARKETING CAMPAIGNS – WHAT DRIVES BEHAVIOR CHANGE?
Tamara Perić1, Tamara Vlastelica*
2, Vladimir Pavković
3
1Institute for Cultural Development Research
2University of Belgrade – Faculty of Organizational Sciences
3Academy of Applied Studies Belgrade
*Corresponding author, e-mail: [email protected]
OBJECTIVE
The concept of social marketing, management of communication campaigns aimed at changing social behavior, which are most often conducted by public institutions in cooperation with partners from the private or non-governmental sector, has became critically important in global crisis situations such as virus pandemic, economy decline or arm conflicts, that affect general population. Numerous authors emphasized the importance and explained the synergy of two concepts: marketing and the welfare of society. (Levit & Cismaru, 2020; Flaherty et al., 2020; Lahtinen et al., 2020; Lee & Kotler, 2019). Rundle-Thiele et al. (2019) state that social marketing is being used to encourage people to stop existing and often ingrained behaviours, promote the adoption of new unfamiliar behaviours, or persuade people to modify currently existing behaviours. The public expects credible information from government institutions, based on which they can make informed and correct decisions about behavior change, especially after major all-encompassing crises, such as the global COVID-19 pandemic. However, the Edelman Trust Barometer (2022) shows a major global decline in trust in government institutions - since May 2020 when governments were the most trusted institutions until 2022 when governments lack behind business and NGOs. This presents an additional challenge for public institutions to execute efficient social marketing campaigns and calls for re-thinking of communication strategies and tools in this field. The objective of this paper is to define strategic guidelines for planning effective social marketing campaigns based on the content analysis of selected campaigns of public institutions in the Republic of Serbia and public opinion survey on the visibility, favorability and effectiveness of these campaigns.
METHODOLOGY
Preliminary research included the content and media analysis of selected examples of social marketing campaigns of public institutions of the Republic of Serbia. The analysis covered three areas within which media campaigns were implemented: traffic safety („Um na drum“, „Imaš samo jedan put“, „Nikad nemoj“, „Biram život“, „Pažnja sad – Pažljivko“, „Vežite pojas“, „Usporite pored škole“); economy ("Stvarano u Srbiji - budimo čuvarkuće", „Uzmi račun i pobedi“) and public health („Vratimo zagrljaj“ i „Budi superheroj – vakciniši se“). For the purpose of examining the attitudes of citizens about the media campaigns of public institutions, an empirical research was conducted by online surveying of a convenient sample of 179 respondents, in December 2021. The questionnaire consisted of three sets of questions:
1. The respondents’ demographics - gender, age, education, residence;

329
2. General questions about social marketing campaigns - whether the respondents are familiar with
any campaign of public institutions in Serbia and, if so, which campaign they remember and did that
campaign influenced the change of their behavior;
3. Questions related to visibility, favorability and effectiveness of the campaigns from content analysis.
For easier identification, the respondents were shown photos of inserts from
4. promotional videos, posters and banners, in order to associate them with the certain campaign, in
case they did not recognize it only by the title of the campaign.
RESULTS
The research showed that the campaign "Usporite pored škole" was the one seen by the largest number of respondents, had the best average grade and influenced the change in behavior of the largest number of people. The next campaign, according to the percentage of public visibility, is the "Uzmi račun i pobedi" campaign. However, although the parameters, which show the number of people who saw the campaign were extremely high, as well as the relatively good average score, indicating that it was successful, the parameters that represent the change in respondents' behavior were not that positive. The example of the "Vežite pojas" campaign is also very indicative. Although the identification figure of the campaign was a popular political figure at the time, choice of the president as the bearer of the communication message turned out to be ineffective. This leads to the conclusion that the choice of an “endorser” is also a very important success factor of the campaign. The campaigns that recorded the worst result in terms of behavior change were the campaigns that promoted immunization against COVID-19.
CONCLUSION
Based on the research results, conclusions were made about which campaigns were more visible, better perceived and achieved the desired effects, and key recommendations were formulated for improving the process of planning social marketing campaigns of public institutions in the future. Although the creators of media campaigns of public institutions face a number of constraints and specific regulatory norms, they must modify and digitalize form and content of social marketing campaigns and take into consideration changes in public values and expectations from public institutions, especially those of “digital natives”.
Keywords: social marketing, behavior change, public institutions, media campaigns
REFERENCES
[1] Edelman (2022). Edelman Trust Barometar. www.edelman.com/trust/2022-trust-barometer [2] Flaherty, T., Domegan, C., Duane, S., Brychkov, D., & Anand, M. (2020). Systems social marketing and macro-
social marketing: A systematic review. Social Marketing Quarterly. 26(2), 146-166. DOI:
10.1177%2F1524500420925188 [3] Lahtinen, V., Dietrich, T., & Rundle-Thiele, S. (2020), Long live the marketing mix. Testing the effectiveness of
the commercial marketing mix in a social marketing context, Journal of Social Marketing, 10(3), 357-375. DOI: 10.1108/JSOCM-10-2018-0122
[4] Lee, R.N., & Kotler, P. (2019). Social Marketing – Behavior Change for Social Good, SAGE Publications. [5] Levit, T., & Cismaru, M. (2020). Marketing social marketing theory to practitioners. International Review on
Public and Nonprofit Marketing, 17(2), 237-252. DOI: 10.1007/s12208-020-00245-4 [6] Rundle-Thiele, S., David, P., Willmott, T., Pang, B., Eagle, L., & Hay, R. (2019). Social marketing theory
development goals: an agenda to drive change. Journal of Marketing Management, 35(1-2), 160-181. DOI:
10.1080/0267257X.2018.1559871

330
DATA-DRIVEN CHANGES IN CORPORATE COMMUNICATION IN THE
POST-COVID ERA
Anđelina Petrović1
1University of Belgrade – Faculty of Organizational Sciences *Corresponding author, e-mail: [email protected]
OBJECTIVE
The COVID-19 pandemic has affected the businesses across various industries on a global scale, often acting as an accelerator of digital transformation in the workflows of companies, and their corporate communication practices. In the period of short time adaptation, companies had to rapidly digitize the entirety of their business processes, significantly changing the way they communicate. Adapting corporate communications strategies has been demonstrated through increased use of digital channels and the importance of implementing data-driven decision-making processes, in both internal and external communication. This paper will provide an overview of the most significant changes in the way corporate communication is being adapted in the Post-COVID Era, identifying a number of potentially fruitful research themes. One of the most visible effects that pandemic imprinted in digitalization of communication has been shown in the field of data protection and keeping company’s information safe. With the global shift to an online environment during the work-from-home practices, companies migrated their data into cloud, exposing their data to various cybersecurity attacks. As a result, cyber attacks were focused on large companies, taking advantage of the increased security vulnerability to steal their data, generate profits and cause disruption. According to Interpol’s report (COVID-19 Cybercrime Analysis Report, 2020), the unprecedented coronavirus pandemic profoundly affected the global cyberthreat landscape, underlying the importance of keeping the company’s data safe in the Post-COVID Era. The outbreak brought new methods in the remote work practices on a global scale (Newman & Ford, 2021). The shift towards teleworking, has shown an increase in internal digital channels that allow easier communication and organization of work, such as internal company portals for sharing important news and benefit with employees, developing internal VPN (virtual private network) keeping communication flow safe, various video conferencing tools, as well as chat platforms attributing to fast and easy remote work communication. The rise of data has also profoundly affected how companies utilize their data in the area of external communication. Several of key principles of IMC, including consumer insights, data-driven decision making, cross-media integration represent an improved framework for managing communications in digital environment. External digital communication tools such as online analytic tools and CRM platforms, provide direct omni-channel communication, helping companies gather quality insights and target their audience. Specific data sets that are being collected and analyzed through digital channels provide information on customers’ behavior, preferences, thus contributing to the development of the personalized communication approach. Recent survey on digitalization of communication (Gartner, 2019), suggests that more than 29 percent of the entire marketing budget is being directed to digital channels and analytics, forming the largest percentage of investment in the marketing resources budget, pointing out the importance of data analytics and personalized communication in the digital era.
331
The impact that COVID-19 had in many fields has cultivated new approaches in marketing philosophy and generated research in this filed, including the idea that pandemic represents ‘a great opportunity for businesses to shift towards more genuine and authentic communication, and address urgent global social and environmental challenges (He & Harris, 2020). Number of studies explore how companies manage reputational risk and public relations due to COVID-19, with the emphasize o importance for organizations cultivating trustworthy relationships with their publics (Xifra, 2020).
METHODOLOGY
The research methodology of the research incorporates comparative analysis, and information deduction of adequate literature reviews, as well as recent findings in the scope of available research.
CONCLUSION
While being confronted with the pandemic and its post effects, the most successful organizations have put a focus on digitizing and improving their internal and external communicational frameworks on the principles of strategic digital agility across all systems. By implementing various new digital communication tools they were able to create and agile workforce capable to adapt and successfully answer to the changing needs of the global business environment. Within the scope of internal communication, this is most evident in everyday tasks and implementation of new tools that allow for an easier communication between employees, organization of work and delivery of tasks, even when going fully remote. Externally, companies have had to realize the importance of rethinking their comms strategies, personalize communication and develop digital tools that allow them to quickly answer to any unprecedented and crisis situations.
Keywords: data-driven businesses, digital communication, post-covid communication
REFERENCES
[1] COVID-19 Cybercrime Analysis Report - INTERPOL, August 2020. [2] Gartner (2019). The Annual CMO Spend Survey 2019-2020 Research. Retrieved from
www.gartner.com/en/marketing/research/cmo-spend-survey-2019-2020/ [3] He, H., & Harris, L. (2020). The impact of COVID-19 pandemic on corporate social responsibility and marketing
philosophy. Journal of Business Research, 116, 176-182. DOI: 10.1016%2Fj.jbusres.2020.05.030
[4] Newman, S. A., & Ford, R. C. (2021). Five steps to leading your team in the virtual COVID-19 workplace. Organizational Dynamics, 50(1), 100802.
[5] Reinsel, D., Gantz, J., & Rydning, J. (2017). Data Age 2025: The Evolution of Data to Life-Critical. In IDC White Paper.
[6] Xifra, J. (2020). Corporate communication, public relations and reputational risk management in the days of Covid-19. Prof. Inf., 2(29), covidwho-602774

332
RESHAPING THE COMMUNICATION STRATEGY OF ENERGY COMPANIES IN THE POST-COVID TIME - CASE STUDY
"ELEKTROMREŽA SRBIJE AD"
Gordana Raković Rudović*1
1JSC Elektromreža Srbije
1Corresponding author, e-mail: [email protected]
OBJECTIVE
The Covid 19 pandemic has, among other things, affected the economies of states, behaviors and habits of people. Any crisis, and health crisis in particular, requires a quick reaction and finding ways to overcome it (Videnović, 2020.) and adapt. New and unknown circumstances, which included isolation, maintaining physical distance, lockdowns, etc., changed the habits of both employers and employees in companies. And the pandemic itself emphasized the importance of internal and external communication with stakeholders (Santandreu et al., 2021). And because things were changing quickly in the pandemic, the communication with employees had therefore to be prompt, simple and, above all, precise. Based on the given situation in a crisis situation, it was necessary to adjust the primary goal of the distributed messages (Makus, 2020). The public sector in energy industry is one of the most important economic sectors and as such deserves a well-designed public communication strategy. Elektromreža Srbije AD is a transmission system operator in the Republic of Serbia and, with its over 1300 employees, is the only company of its kind in our country (5), and as such, pays special attention to its communication strategy (Raković Rudović, 2018.). For that reason exactly, and partly because of the energy crisis, this company was basing its communication with the public and employees on digital communication during the time of pandemic, which resulted in a larger public presence, but also to a compact and more transparent communication with employees, which will be more elaborated in this paper.
METHODOLOGY
The research methodology in this paper is based on a review of the literature available on this topic, as well as on a comparative analysis of different strategic communications, i.e., different researches on this topic conducted during the Covid 19 pandemic.
RESULTS
By means of comparative analysis, the author came to the results which show that most companies have adapted their communication strategies, mostly in the field of digital communication and significantly in the field of event organization and CSR.
CONCLUSION
It has been unambiguously shown that companies have quickly adapted their business operations to the new situation, as well as their communication strategies. The crisis that has befallen the world has brought a lot of problems in various fields, including communication, but the world has recovered quickly and the recovery can already be seen.
Keywords: communication strategy, crisis, Covid 19, digital communication, energy sector

333
REFERENCES
[1] Calonge D. S., Aguerrebere P. M., Hultberg P., & Connor M. (2021). Were Higher Education Institutions Communication Strategies Well Suited for the COVID-19 Pandemic?. Journal of Education and Learning, 10(4).
[2] Kostić Stanković M. (2011). Integrisane poslovne komunikacije. Beograd: FON. [3] Kotler F. K. & Keller, F. (2017). Marketing menadžment. Datastatus. [4] Makus C. (2020). Health crisis communication of the German Government on Instagram during COVID-19,
bachelor thesis in Communication Science. [5] Raković Rudović G. (2018). Strateška komunikacija u energetskim kompanijama javnog sektora, završni
specijalistički rad, FON, Beograd. [6] Videnović D. S. (2020). Poslovna etika u doba koronavirusa. Tokovi osiguranja, pp. 55. [7] www.pravno-informacioni-sistem.rs/SlGlasnikPortal/eli/rep/sgrs/vlada/drugiakt/2016/88/1

334
POST-CRISIS REPUTATION MANAGEMENT – THE EFFECT OF
DIFFERENTCRISIS COMMUNICATION STRATEGIES
Tamara Vlastelica*1, Dejana Nikolić
2, Jelena Krstić
3
1University of Belgrade – Faculty of Organizational Sciences
2Henkel Srbija d.o.o.
3Economics Institute Belgrade
*Corresponding author, e-mail: [email protected]
OBJECTIVE
Contemporary business environment is characterized by digitalized operations, dynamic development of internet-based technologies, conscious and engaged consumers (Ageeva et al., 2018). Consumers’ expectations are increasing in terms of the products and services quality and prompt availability, financial accountability, social and environmental responsibility of companies (Gupta & Wadera, 2019). They became extremely sensitive to any type of risk and tend to evaluate company’s behavior in time of crisis, which is especially evident in the post-Covid period (Porter Novelli, 2020). Therefore, the challenge is no longer just to build a positive corporate reputation, but also to protect and effectively manage reputational crises (Eckert, 2017). However, the nature of crisis communication has changed, since stakeholders have become more engaged and can directly express their opinion via internet and social media (Rialti et al., 2016). They are no longer just recipients of information, but those who create information as well – the process called “secondary crisis communication” (Johansson, 2019). Such user generated content reaches a larger audience, spreads quickly and cheaply and thus significantly affects corporate reputation (Rantanen et al., 2019). Therefore, communication during and after the crisis more than ever determines the change of reputation and, consequently, consumers’ intentions and behavior. Crises related to product safety in food industry, due to health endangering potential, are extremely intense, generate large scale media coverage and lead to significant secondary crisis communication. The research objective is to determine the effectiveness of various crisis communication strategies, applied during product safety crisis, in preserving the corporate reputation, which is evaluated and measured through the change of attitudes and intentions of consumers.
METHODOLOGY
The research was conducted by online surveying of a convenient sample of 148 respondents, in the period November-December 2021. The questionnaire consisted of four sets of questions. The first set related to respondents’ demographics. The second set of questions concerned the criteria that consumers take into account when making purchasing decisions of food products. Based on the classification used by Statista (2018) and Zia (2017), the list of offered criteria included: taste, price, label, environmental aspect of the product, appearance or functionality of the packaging, brand popularity, advertising, country of origin. The respondents were then presented with three real examples of reputational crises in food industry, which had occurred in Serbia, with a description of implemented communication strategies. Coombs (2019) classification of common crisis communication strategies was used for this purpose. Each company applied different denial strategy, namely Attacking the Accuser, Denial and Scapegoating. Respondents were presented with these cases as hypothetical crises, without revealing brand names, in order to avoid bias.

335
This was followed by a set of questions aimed to determine the impact of the perceived crisis and crisis communication strategy on the change of reputation, i.e. on consumers’ general attitudes towards the brand/company, willingness to continue to buy and consume products after the crisis, willingness to cooperate with or work for the company, trust in advertising messages, willingness to recommend the company's brand or product to others (The RepTrek Company, 2022). Finally, control questions were introduced to determine whether respondents recalled the described crises, as well as whether it affected their responses.
RESULTS
The main finding of the study is that reputation crises significantly affect stakeholders’ attitudes and intentions regarding the company in the post-crisis period. The analysis showed that there are differences in the perception, attitudes and intentions of respondents from different demographic groups. It was found that product taste, price and composition are perceived as the most important factors in making purchasing decisions, which should be considered when defining crisis communication or post-crisis recovery strategies. In terms of the effects of different strategies, the Denial strategy implemented by one of the three companies had the most negative consequence on corporate reputation and proved to be less effective than the Attack the accuser and Scapegoating strategies.
CONCLUSION
Summarize and discuss the main findings of the research. Address its practical benefits as well as limitations Regardless of the type of crisis and applied communication strategy, research results show that attitudes and intentions of consumers would significantly change after company’s confrontation with the crisis. However, there are differences in the intensity and the type of the consequences, depending on the type of crisis and applied strategy and previously established corporate reputation. Knowing the impact of the crisis on different demographic groups, it is possible to define an adequate and effective communication strategy during and after the crisis, which will preserve reputation and reduce the negative impact of the crisis on other business performance indicators.
Keywords: corporate reputation, crisis communication, product safety crisis, consumers behavior, attitudes and Intentions
REFERENCES
[1] Ageeva, E., Melewar, T., & Foroudi, P. (2018). Examining the influence of corporate website favorability on corporate image and corporate reputation: Findings from fsQCA. Journal of Business Research, 89, 287-304.
[2] Coombs, T. (2019). Ongoing crisis communication: planning, managing, and responding. London: SAGE Publications.
[3] Eckert, C. (2017). Corporate reputation and reputation risk: Definition and measurement from a (risk) management perspective. Journal of Risk Finance, 18(2), 145-158.
[4] Gupta, S. S. & Wadera, D. (2019). Awareness and understanding of corporate social responsibility (csr) among Indian consumers. International Journal of Research and Analytical Reviews, 6(2), 570-587.
[5] Johansson, B. (2019). Secondary crisis communication. A question of actual or perceived credibility? Proceedings of the International Crisis and Risk Communication Conference, 2 (pp. 44-46). Orlando, USA.
[6] Porter Novelli (2020). Introducing Porter Novelli's Covid-19 tracker: Insights for a time of crisis. www.porternovelli.com/intelligence/2020/04/14/porter-novelli-covid-19-tracker-insights-for-a-time-of- crisis/
[7] Rantanen, A., Salminen, J., Ginter, F., & Jansen, B. (2019). Classifying online corporate reputation with machine learning: a study in a banking domain. Internet Research, 30(1), 45-66.
[8] Rialti, R., Lamberto, Z., & Caliandro, A. (2016). Social media strategies to protect brand image and corporate reputation in the digital era: a digital investigation of the Eni vs. Report case. Italian Journal of Marketing, 4, 65-
84. [9] Statista (2018). Factors influencing food purchase. www.statista.com/statistics/1021014/factors- influencing-
food-purchase-us-consumers/ [10] The RepTrak Company (2022, March). Global RepTrak Report. ri.reptrak.com/2022-global-reptrak [11] Zia, M. (2017). Impact of Product Attributes on Purchase Decision. Proceedings of the 10th Multidisciplinary
Academic Conference (pp. 42-52). Prague.

336
RETHINKING GLOBAL RETAIL STRATEGY IN POST COVID ERA
Sonja Vučenović*1
, Ksenija Leković1, Sanja Džever
1
1University of Novi Sad – Faculty of Economics *Corresponding author, e-mail: [email protected]
OBJECTIVE
In the changing environment brought by the COVID pandemic, supply flows are becoming unpredictable, logistics are slowing down and bringing higher supply costs for retailers, all of which are changing consumers' shopping habits. Trends that were characteristic of global retailers and market are no longer predictable. At the very beginning of the pandemic, sales facilities were closed and the financial results of the largest brick and mortar retailers were poor. On the other hand, e-retailing is becoming the only option, but supply problems due to the pandemic are slowing down the exchange processes. The aim of this paper is to look at the key financial and market indicators of the largest global retailers and to draw conclusions about the changes brought about by the pandemic. According to Deloitte (2020) retailers should rely on new data sets to assess market conditions and develop their financial and operational plans. Financial indicators of sales revenue, profit margins, return on investment, as well as market indicators of business internationalization will be the subject of comparison with the analyzed retailers in the period before and at the beginning of the pandemic. Deloitte (2022) brings conclusion that retail appears to be on an upward trajectory, with innovation in digital and sustainability as exciting bright spots in the face of the disruption and uncertainty. Based on the above, conclusions will be drawn on the change in the retail strategy, which is increasingly adapted to the changing environment that continues, as shown, after the reduction of risks brought by the COVID pandemic, and due to new risks in the market.
METHODOLOGY
The primary sources of data for this work are the results published by companies, including annual reports, documents and information contained in company press releases, data, presentations or further company websites. Where this is not available, other public domain sources are used, including trade magazine estimates, industry analyst reports, and press interviews.
RESULTS
Based on the results of the comparison of financial and market indicators, it will be the basis for determining a new global strategy of retailers in the post-COVID era that brings new challenges and changes. Schleper et al. (2021) paper concludes with a practice-infused research agenda, which aims to trigger relevant research about the current and potential future crises. The marketing strategy will leverage new digital habits of customers to deliver messages that make customers feel recognized, comfortable and safe in stores and inspired by their favorite retail brand. The study Khaled et al. (2020) highlights the need to be flexible in executing strategic strategies, but retailers need to develop comprehensive action plans, including selecting managers of initiative and defining goals and deadlines. The retail workforce is likely to expect frequent and direct communication and thorough precautions in place to instill confidence and raise morale as teams return to work and lead through uncertainty. A full inventory overview is essential for strategy development and demand matching. Short-term success is likely to depend on maximizing available inventory while redefining the pricing strategy to optimize sales. The model in research Koncar et al. (2021) serve as the basis for defining the set of measures and incentives that competent institutions and FSC management need to undertake, to minimize the impact of indicators that endanger sustainability. Identifying products with high interest and focusing on them that represent the brand. Expectations in stores have shifted to a focus on customer and employee safety, requiring clear and thoughtful communication throughout the store. Visual merchandising and the look of the store that retailers should focus on. The future of store operations is likely

337
to require reduced touch and rotation to focus on shopping safety. The post-COVID period is a time to make technological improvements that will drive growth and allow business to thrive in the new normality.
CONCLUSION
There is no doubt that the COVID-19 pandemic had a huge impact on retail. Retailers of essential goods such as food, groceries, and healthcare are experiencing increased demand opportunities for serving consumers at home, while facing challenges of inventory, supply chain management, delivery, and keeping their facility a safe environment (Roggeveen & Sethuraman, 2020). While retail and digital retailers have managed to turn around more easily and respond more quickly to sudden changes in consumer behavior, retailers focused on the experience and in-store services have struggled to keep up. To manage the situation retailers have turned to service innovation to change their operations to make consumers feel safe while shopping (Pilawa et al., 2022). Relying on experimentation and using experimentation to determine customer needs will help the retailers stand out from the competition every time. Experimenting will highlight customer preferences so they can have an efficient and smooth experience every time they visit, and more importantly, remember it and inspire them to come back again and again as loyal.
Keywords: retail, strategy, post COVID, financial indicators, market indicators
REFERENCES
[1] Deloitte (2020). Post-COVID strategies for retailers: Reopening stores Rethink in-store and online customer experience. Deloitte Touche Tohmatsu Limited DTTL.
[2] Deloitte (2022). Global Powers of Retailing 2022, Resilience despite challenges. Deloitte Touche Tohmatsu Limited DTTL.
[3] Khaled, A. S. D., Alabsy, N. M., Al-Homaidi, E. A., & Saeed, A. M. M. (2020). The impact of the COVID-19 pandemic on retailer performance: empirical evidence from India. Innovative Marketing, 16(4), 129-138. DOI: 10.21511/im.16(4).2020.11
[4] Končar, J., Marić, R., Vukmirović, G., & Vučenović S. (2021). Sustainability of Food Placement in Retailing during the COVID-19 Pandemic. Sustainability, 13(11), 5956. DOI: 10.3390/su13115956
[5] Pilawa, J., Witell, L., Valtakoski, A., & Kristensson, P. (2022). Service innovativeness in retailing: Increasing the relative attractiveness during the COVID-19 pandemic. Journal of Retailing and Consumer Services, 67, 102962. DOI: 10.1016/j.jretconser.2022.102962.
[6] Roggeveen, A. L., & Sethuraman, R. (2020). How the COVID-19 Pandemic May Change the World of Retailing. Journal of Retailing, 96(2), 169–171. DOI: 10.1016/j.jretai.2020.04.002
[7] Schleper, M.C., Gold, S., Trautrims, A. & Baldock, D. (2021). Pandemic-induced knowledge gaps in operations and supply chain management: COVID-19’s impacts on retailing. International Journal of Operations & Production Management, 41(3), 193-205. DOI: 10.1108/IJOPM-12-2020-0837

338
COMMUNICATIONS MANAGEMENT IN HEALTHCARE INSTITUTIONS: ANALYSIS
OF INTERNAL PUBLIC ATTITUDES BEFORE AND AFTER THE COVID-19
PANDEMIC
Marija Zdravković1, Milica Kostić-Stanković*
2, Jelena Krstić
3
1University of Belgrade – Faculty of Medicine
2University of Belgrade – Faculty of Organizational Sciences
3Economics Institute Belgrade
*Corresponding author, e-mail: [email protected]
OBJECTIVE
The direct connection between the planning and systematic realization of institutional communication and the achieved business results has become evident in all spheres of business. Continuous development of a strategic approach to communication in the health sector indicates the growing importance of marketing and public relations for establishing effective communication between health organizations and their target audiences (Wright et al., 2013; Harrington et al., 2022). A strategic approach to communication implies that all activities and flows of communication with target audiences, including external and internal groups, are integrated and harmonized, in order to send consistent messages and achieve the desired effects (Smith, 2020). Strategies for communication of health organizations with all target groups must be carefully planned and adjusted to the characteristics and requirements of each of them, in order to plan management and influence the building of institutional image and reputation (Parvanta & Bass, 2018). A very important segment of communications of health institutions is internal public relations, based on the development of internal communication with employees of all hierarchical levels, in order to create a positive organizational climate and a sense of belonging to the organization, as well as increased motivation implying good results (Đorđević et al., 2015). For the good functioning of communications, it is important to establish a relationship of understanding and cooperation with members of the internal public, having in mind the importance of their attitudes and patterns of behavior and their consequences on the perceived image and reputation of health care institutions in external publics (Vermeir et al., 2015). Achieving influence on individuals and groups from the internal public, through mutual understanding and open, two-way communication, requires a strategic approach to managing communication flows. The basis for communication management is the initially conducted analysis of communication flows and attitudes of all groups of the internal public. In this context, the goal of the research in this paper is to determine the settings of communication management of health care institutions, based on the identified attitudes of the internal public in the period before and after the Covid-19 pandemic.
METHODOLOGY
The paper presents the results of secondary and primary research. Secondary research is the result of collecting, analyzing and presenting contemporary theoretical approaches and empirical research in this field. Based on the results of the literature analysis, the need for this research topic was pointed out, and a questionnaire for primary research was designed.

339
The sample of respondents consisted of 452 respondents, who are employed in public and private health care institutions. Respondents filled out the questionnaire online, in two iterations - 2018 and 2022. The SPSS for Windows 22.0 software package was used for statistical data processing. In comparing the differences between the attitudes of the respondents in the period before and after the Covid-19 pandemic in the same context, a comparative method was applied.
RESULTS
The results indicated different attitudes of employees in health care institutions in the public and private sectors in terms of the importance attached to communication with internal and external groups. A significantly larger number of respondents in private health care institutions than employees in public institutions believe that for a good image and reputation of healthcare institutions it is necessary to have a pre-designed communication strategy with different target audiences. Employees in private health care institutions thought that internal communication affects the achievement of communication goals and creating a better image and reputation of health care institutions in higher percentage than employees of public health care institutions, but public sector employees gave more importance to internal communication in the study after the Covid-19 pandemic. Different views have been identified regarding the efficiency of using available communication channels, and the greater importance given to communication via the Internet and social networks in the post-pandemic period is noticeable. Also, respondents of private institutions, in relation to employees in the public sector, in a higher percentage indicated that more should be invested in communication activities with defined target groups, especially with users of health institutions, recognizing the contribution to improving the image and reputation of health institutions.
CONCLUSION
The results of empirical research indicate that the knowledge and attitudes of employees in public institutions regarding the importance of communication are at a lower level compared to employees in private health care institutions, which indicates that it is necessary to educate employees about the importance of institutional communication, in order to achieve the desired image and reputation of health care institutions. Special emphasis should be placed on the importance of designing communication strategies aimed at specific groups - service users, employees, media, government agencies. It is necessary that the strategies include various channels of communication, especially the Internet and social networks, in order to effectively manage the communication of health care institutions.
Keywords: communication, target groups, internal public, healthcare institutions, image and reputation.
REFERENCES
[1] Đorđević, D., Petrović, D., Vuković, D., Mihailović, D., & Dimić, A. (2015). Motivation and job satisfaction of health workers in a specialized health institution in Serbia. Vojnosanitetski pregled, 72(8), 714-721. DOI: 10.2298/vsp131110055d.
[2] Harrington, N. G., Francis, D.B., & Occa, A. (2022). Theoretical and methodological matters in health communication. In The routledge handbook of health communication (T.L. Thompson & N.G.Harrington,
Editors), 17-32. [3] Parvanta, C., & Bass, S. (2018). Health Communication: Strategies and Skills for a New Era, 1st ed. Burlington,
MA: Jones & Bartlett Learning. [4] Smith, R. D. (2020). Strategic planning for public relations, 6th ed. New York, NY: Routledge.
[5] Vermeir, P., Vandijck, D., Degroote, S., Peleman, R., Verhaeghe, R., Mortier, E., Hallaert, G., Van Daele, S., Buylaert, W., & Vogelaers, D. (2015). Communication in healthcare: a narrative review of the literature and practical recommendations. International Journal of Clinical Practice, 69(11), 1257-1267. DOI: 10.1111/ijcp.12686
[6] Wright, K. B., Sparks, L., & O’Hair, H. D. (2013). Health communication in the 21st century. Oxford, UK:
Blackwell Publishing Ltd.

340
CONSUMERS’ BEHAVIOR ACCCORDING TO GENERATION SEGMENTS
Leposava Zečević1, Radmila Janičić
2, Olgica Stanojević
1
1European University – Faculty for European Business and Marketing,
2University of Belgrade – Faculty of Organizational Sciences *Corresponding author, e-mail: [email protected]
OBJECTIVE
The paper presents a theoretical and practical review of consumer behaviour according to generation segments. The focus of the paper is on the development of the theoretical base of consumer behavior according to generation segments. The theoretical part of the paper is based on contemporary literature in the field of consumer behavior, with special emphasis on target groups that are a part of different generations. The key hypothesis of the paper is that companies should use strategies of adaptation in order to fulfill consumers' needs and wishes. A special focus of the paper is an analysis of a companys’ strategies, in the field of services industries, following consumers' needs, according to generation. In the paper, the analysis is focused on services industries, like healthcare, tourism, hospitality, etc. The analysis is based on working of services industries with consumers that are members of generation X, Y and Z. These generations have different needs, wishes, as well as, different lifestyles. The paper emphasized the importance of experience marketing and emotional marketing on consumers' behavior toward services from a generation's aspect. In the empirical part of the paper are presented case studies about the implementation of modern marketing strategies, which gives opportunities for better positioning in the global marketplace, according to quality of business and work, based on analysis of needs, wishes, lifestyles and behavior of consumers, members of a different generation. The empirical part of the paper is done an in-depth interview with managers of service companies about marketing approach, marketing strategies, implementation of strategies, and marketing control and marketing analysis.
METHODOLOGY
The methodology of the paper is based on qualitative analysis, analysis of the case studies and in-depth interviews with managers of the services companies about work based on the following needs, wishes and lifestyles of consumers of services, according to their generation segments.
RESULTS
The empirical research's results are clear described in the paper. Particular focus is given to the implementation of the results in the work of service companies, according to the needs, wishes and lifestyles of the generation's target groups. The results emphasized that members of the Z generation have needs for quality of services, time of services implementation, needs for using digital and mobile applications, and online communication using social media. The results present that generation Y combine traditional and digital approach. Special attention is given to generation X, which insists on traditional services without using digital applications.
CONCLUSION
The paper presents a theoretical and practical contribution to the field of consumer behavior analysis, from the aspect of membership to one of the groups: generation groups, X, Y, or Z. The special contribution of the

341
paper is creating the new marketing strategies for consumers of X, Y and Z generations, according to their needs, wishes and lifestyle.
Keywords: Consumers’ behavior, services’ companies, marketing strategies, generations X, Y and Z.
REFERENCES
[1] Awasthi, A., & Kumar, V. (2022). Behavioral consequences of verbally expressed and unexpressed customer rage emotions. Journal of Consumer Behavior.
[2] Belch, G., & Belch, M. (2012). Advertising and Promotion-An Integrated Marketing Communications Perspective. New York: McGraw-Hill.
[3] Blakeman, R. (2006). Integrated Marketing Communication. Toronto: McMillan.
[4] David, P. (2005). Integrated Marketing Communication. Toronto: Elsevier Inc. [5] Filipović, V., & Janičić, R. (2021). Strateški marketing. Beograd: FON. [6] Larry, P. (2008). Strategic Integrated Marketing Communication. Toronto: Elsevier Inc. [7] Kevin, R. (2004). The Future Beyond Brands - Love marks. New York: Power House Books. [8] Kotler, Ph., Keller, L. (2016). Marketing Management, 15
th ed. London: Prentice Hall.
[9] Kumbhojkar, N., Menon, A. (2022). Integrated Predictive Experience Management Framework (IPEMF) for Improving Customer Experience: In the Era of Digital Transformation. International Journal of Cloud Application and Computing, 12(1), 13. DOI: 10.4018/IJCAC.2022010107
[10] Maričić, B. (2015). Ponašanje potrošača. Beograd: Ekonomski fakultet.

342
THE IMPACT OF GENERATION Z CONSUMER LIFESTYLES ON ONLINE SHOPPING DURING CORONA CRISIS
Аna Zekavica*1, Jovanka Vukmirović
2, Nemanja Lekić
1
1Belgrade Business and Arts Academy of Applied Studies
2University of Belgrade – Faculty of Organizational Sciences *Corresponding author, e-mail: [email protected]
OBJECTIVE
Generation Z is consists of consumers born after 1995, and we call them real digital natives, because they are used to the daily use of high technology. They use multiple sources of information, integrating virtual and offline experiences. Members of Generation Z are energetic, intelligent, motivated, interested in seeking answers in all areas of life. Their lives are made up of social networks and virtual friends. They grow up in a recession, so Generation Z is made up of new independent thinkers who are searching for the truth, because they know how to use information from virtual and physical reality. As 2020 was marked as the corona year and as some of the measures to combat the pandemic included distancing and locking, it is necessary to analyze how much the lifestyle in the crisis affected online shopping and whether it changed anything compared to the pre-pandemic period, caused coronavirus. The aim of this paper is to identify Generation Z lifestyle factors in the period of the greatest health and economic crisis, so that companies are ready to create an adequate, efficient and personalized marketing strategy.
METHODOLOGY
Data were collected by survey method. The Survey is divided into two parts. The first part deals with general issues (gender, age, region of birth, region in which the respondent lives, urban environment, marital and work status, education, financial status, family size of the respondent), while the second part contains issues that are relate to the lifestyle - Activities, Interests, and Opinions (AIO). Closed-ended questions in the questionnaire from the point of view of measurement are of the scale, ordinal and nominal type. The statements in the second part of the questionnaire were evaluated by the respondents on a scale from 1 to 7, where 1 - I do not agree at all, and 7 - I completely agree. In order to obtain answers to the research questions, descriptive measures, dispersion measures, symmetry measures and correlation analysis were calculated. The data were processed using the SPSS software package.
RESULTS
The results of the research are based on the survey "Consumer profiling based on lifestyle during the COVID-19 pandemic". The research sample was a sample of Generation Z members, with a thoughtful approach - young people studying or nearing the end of their studies. A study of 296 young people to profile them as consumers based on lifestyle, especially during COVID-19. Data collection time November - 2021. It is very important to provide primary data for qualitative analysis, ie. how different groups of online shopping users look at the opportunities offered by information and communication technologies (ICT). It is necessary to analyze whether there is a statistically significant difference in their assessments, attitudes and opinions regarding the general attitude about online shopping.
CONCLUSION
Generation Z live in the era of new technologies, and it is clear that they use online sources of information for real-time communication. Thanks to social networks, they have the opportunity to communicate with people they have never met. In the time of corona virus pandemic when all the people of the world were in lockdown online communication gained enormous importance. This research should point to the fact that the lifestyle

343
of Generation Z fully accepts online shopping, not only in times of crisis when they actually have more space than usual to search for information and knowledge. In the research process, trust proved to be an important factor that conditions online shopping in Generation Z. The results of this research will give clear guidelines to companies for more efficient implementation of STP processes (segmentation, targeting, positioning). Understanding the lifestyles of Generation Z consumers, which have been identified as carriers of digital development, should be an integral part of creating marketing strategies.
Keywords: consumer lifestyle, Generation Z, pandemic, online shopping, COVID-19 / corona virus
REFERENCES
[1] Chen, S., & Chang, T. (2003). A descriptive model of online shopping process: some empirical results. International Journal of Service Industry Management, 14(5), 556-569.
[2] Chusak, C., Tangmongkhonsuk, M., Sudjapokinon, J., & Adisakwattana, S. (2022). The Association between Online Learning and Food Consumption and Lifestyle Behaviors and Quality of Life in Terms of Mental Health of Undergraduate Students during COVID-19 Restrictions. Nutrients, 14, 890.
[3] Citrin, A. V., Sprott, D. E., Silverman, S. N., & Stem, D. E. (2000). Adoption of Internet shopping: the role of consumer innovativeness. Industrial Management & Data Systems.
[4] Donnelly, A. (2008). Playing to the Digital Generation. Marketing. [5] Hoyer, W. D., & MacInnis, D. J. (2010). Consumer Behavior, 5
th ed. Mason, OH: South-Western Cengage
Learning. [6] Larson, L., & Shin, H. (2018). Fear During Natural Disaster: Its Impact on Perceptions of Shopping Convenience
and Shopping Behavior. Services Marketing Quarterly, 39, 293-309.
[7] Lee, H. J., Lim, H., Jolly, L. D., & Lee, J. (2009). Consumer lifestyles and adoption of high-technology products: A case of South Korea. Journal of International Consumer Marketing, 21(2), 153-167.
[8] Mahmudul Hoque, A. S. M. (2018). Digital Device Addiction Effect on Lifestyle of Generation Z in Bangladesh. Asian People Journal, 1(2), 21-44.
[9] Miller, J. (2018). 10 things you need to know about Gen Z. HR Magazine, 50-56. [10] Nguyen, H. D., Leeuw, S., & Dullaert, E. H. W. (2018). Consumer Behaviour and Order Fulfilment in Online
Retailing: A Systematic Review. International Journal of Management Reviews, 20, 255-276. [11] Plummer, J. T. (1974). The concept and application of life style segmentation. Journal of Marketing, 38(1), 33-
37. [12] Wijaya, T., Darmawati, A., Kuncoro, A. M. (2020). e-Lifestyle Confirmatory of Consumer Generation Z.
International Journal of Advanced Computer Science and Applications, 11(10), 27-33.

344
PRO-ENVIRONMENTAL PURCHASING BEHAVIOR: EXPLORING MOTIVATION
DRIVING GEN Y AND GEN Z
Jasmina Dlačić*1
1University of Rijeka – Faculty of Economics and Business
*Corresponding author, e-mail: [email protected]
OBJECTIVE
Trends in consumer behavior indicate that green and ecological behavior (Agnus & Westbrook, 2020; 2022) and environmental conscious consumers should be considered a long-standing trend even in post covid times. Furthermore, environmental protection and sustainable development goals (SDG, 2015) are shaping economies and contributing to the importance of pro-environmental behavior. Consumers pro-environmental behavior can be expressed in diverse ways. Such as energy and water saving, waste and recycling behavior (De Leeuw et al., 2015) or pro-environmental purchasing behavior (e.g., buying eco-friendly or organically grown products) (Schlegelmilch et al., 1996). Furthermore, consumers express their green values through purchasing or consuming such products (Haws et al., 2014). A company to be perceived as the one that cares about environmental protection, and to communicate their ecological and sustainable practices incorporated into their products or services, is experiencing diverse challenges. Among others is the difference between behaviors of Gen Y and Gen Z related to the activities aimed at environmental protection. Hence, purpose of the paper is to research mechanisms that contribute to consumers’ pro-environmental purchasing behavior among Gen Y and Gen Z. Based on this, research question is formed: how consumers’ green values and pro-environmental behavior contribute to pro-environmental purchasing behavior among different generations. METHODOLOGY A structured questionnaire was used to collect the data of 550 respondents during October 2018. An analysis was conducted on a purposive sample of Generation Y and Generation Z. Previously established scales were used for forming questions. Green consumption values use Haws et al. (2014) scale. Pro-environmental behaviour is based on De Leeuw et al. (2015) and general pro-environmental purchasing behaviour on Schlegelmilch et al. (1996). Data analysis used SPSS ver 26.
RESULTS
Analysis used multivariate regression analysis and reliability analysis. Results for general pro-environmental purchasing behavior indicate that scale is reliable (α=0.693) and will be used in subsequent analysis as average scale of three items. To test the stated hypotheses, multivariate regression analysis was applied with pro-environmental purchasing behavior as the dependent variable. The method used in the selection of variables is the Enter method. Results are presented in Table 1 and Table 2. Based on the research results it can be noted that not all green consumer values and not all consumer pro-environmental behaviors contribute equally to the consumer’s pro-environmental purchasing behavior. Differences are noticed between Gen Y and Gen Z consumers.

345
Table 1: Green consumer values
Items Gen Y Gen Z
It's important to me that the products I use do not harm the environment.
β=0.176**
When deciding, I consider the possible impact of my decisions on the environment.
My concern for the environment affects my buying habits. β=0.204**
I'm worried we're spending too much resource on planet Earth. β=0.113*
I would describe myself as an ecologically responsible person.
It is OK for me to make the effort if it contributes to ecologically responsible activity.
β=0.379*** β=0.228***
My decision to recycle is affected whether the people in my household recycle.
β=0.085* β= -0.119**
Note: *** p < 0.001, ** p < 0.05, * p < 0.10; Empty cells indicates that influence is not significant. Table 2: Pro-environmental behavior
Items Gen Y Gen Z
As I wash my teeth, I do not let the tap water running. I always turn the light off when leaving the room.
I think ahead what I will eat, before I open the fridge. β=0.098*
I sort the waste at home whenever it’s possible. β=0.238*** β=0.286***
When printing and writing I use paper on both sides.
At faculty / work, I sort waste in provided recycling bins.
I shower less than 20 minutes.
When I'm feeling cold, I prefer to dress warm clothes rather than to rise the heating temperature.
I read literature about ecological awareness. β=0.268***
I consume products of biological origin. β=0.120** β=0.249***
Note: *** p < 0.001, ** p < 0.05, * p < 0.10; Empty cells indicates that influence is not significant.
CONCLUSION
Research results indicate that consumers’ pro-environmental purchasing behavior is influenced by different factors if generational approach is used. Consumers that belong to Gen Z are advised to be addressed through focusing on their green values, as they are intensively influencing their pro-environmental purchasing behavior than pro-environmental behavior. While for consumers that belong to Gen Y more focus should be put on the pro-environmental behaviors that influence their pro-environmental purchasing behavior.
Keywords: green values, pro-environmental behavior, purchasing behavior, consumers
ACKNOWLEDGEMENT
This work is supported by the University of Rijeka under Grant project number Uniri-drustv-18-235-1399.
REFERENCES
[1] Agnus, A., & Westbrook, G. (2020). Top 10 global consumer trends 2020. Euromonitor International. [2] Agnus, A., & Westbrook, G. (2022). Top 10 global consumer trends 2022. Euromonitor International. [3] De Leeuw, A., Valois, P., Ajzen, I., & Schmidt, P. (2015). Using the theory of planned behavior to identify key
beliefs underlying pro-environmental behavior in high-school students: Implications for educational interventions. Journal of Environmental Psychology, 42, 128-138. DOI: 10.1016/j.jenvp.2015.03.005.
[4] Haws, K. L., Winterich, K. P., & Naylor, R. W. (2014). Seeing the world through GREEN‐tinted glasses: Green consumption values and responses to environmentally friendly products. Journal of Consumer Psychology, 24(3), 336-354. DOI: 10.1016/j.jcps.2013.11.002.
[5] Schlegelmilch, B. B., Bohlen, G. M., & Diamantopoulos, A. (1996). The link between green purchasing decisions and measures of environmental consciousness. European Journal of Marketing, 30(5), 35-55.
[6] SDG (2015). Sustainable development goals. UN Department of Economic and Social Affairs. Retrieved from sdgs.un.org/goals (accessed April 21, 2022)

346
AUTHOR INDEX
Agarwal, Basant 5
Aleksić Mirić, Ana 264
Aleksić, Aleksandar 276
Aleksić, Jana 70
Alves, Wellington 80, 124, 126, 224
Anagnostopoulos, Achilleas 272
Anđelić, Ognjen 136
Anđelković Labrović, Jelena 268, 278
Andrić Guševac, Bisera 76
Antić, Slobodan 128
Antović, Ilija 170,194
Areias, Nelson 224
Aristovnik, Aleksandar 3
Babarogić, Slađan 13
Babin, Mihajlo 173
Backović, Nemanja 82
Badovinac, Nenad 24
Barać, Dušan 180
Barbosa, Diogo 124 Barjaktarović Rakočević, Slađana 155
Benković, Slađana 153
Berber, Nemanja 274
Bilić, Ivana 84
Bjeladinović, Srđa 31, 38
Bjelica, Dragan 248, 254
Bodiroža, Ranka 278
Bogdanović, Zorica 190
Bogićević Milikić, Biljana 264
Bogićević Sretenović, Marija 34
Bogojević Arsić, Vesna 149
Bolbotinović, Željko 168
Borozan, Tea 248
Bozhinovska, Tihona 285
Bradić, Milica 86
Brkljač, Nebojša 306
Bucevska, Vesna 67
Bulajić, Milica 213
Buterin, Denis 146, 215
Buterin, Vesna 215
Caiazzo, Carlo 222
Cesar, Julio 80
Cicvarić Kostić, Slavica 312
Costa, Diogo 126
Čačić, Nataša 60
Čičak, Josip 164
Čudanov, Mladen 243, 278
Čurović, Tamara 142
Ćebić, Branko 186
Ćirović, Marko 90, 120
Cvetkoska, Violeta 64
Cvetković, Aleksandra 243
Cvetković, Nikola 18
Dalton, Sanja 88
Damjanović, Boris 22
Damnjanović, Vesna 162, 310
Dančula-Dejanović, Bojana 302
Delibašić, Boris 42
Despotović, Vukašin 180
Despotović-Zrakić, Marijana 188
Dimitrijević, Sara 300
Dlačić, Jasmina 157, 344
Dmitrović, Veljko 157, 290
Dragović, Ivana 44
Dragutinović, Stefan 211
Drakulevski, Ljubomir 250
Draskovic, Ana 2
Đoković, Aleksandar 18
Đorđević Milutinović, Lena 90, 128
Đorđević, Anđelija 246
Đorđević, Milan 254
Đorđević, Tamara 192
Đurić, Mladen 294, 296
Đurica, Maja 282
Džever, Sanja 336
Eferica, Natalija 312
Eftimov, Ljupcho 285
Embaye, Teklehaimanot 180
Erić, Miloš 173
Ferreira, Paula 80
Firfov, Ognen 250
Fotova Čiković, Katerina 57
Garcia, Jorge 224
Gatić, Milena 228, 232
Gligorić, Dragan 177

347
Gligorijević, Mirjana 314
Glogovac, Maja 302
Harjule, Priyanka 6
Hinriksdottir, Halla Margret 287
Ilić, Bojan 82
Ivanovski, Igor 64
Jakovljević, Nemanja 290
Janevska-Iliev, Aleksandra 67
Janičić, Radmila 314, 340
Janićijević, Nebojša 264
Janković, Dragan 316
Jankovič, Patricija 92, 131, 134
Jaško, Ondrej 239
Jednak, Sandra 94
Jejić, Olga 13
Jere Jakulin, Tadeja 96
Jeremić, Veljko 120
Jevtić, Milica 100
Jolović, Ivana 274
Jovanović Čorlija, Katarina 288
Jovanović, Bojan 20
Jovanović, Ivona 228, 232
Jovanović, Milan 239, 241
Jovanović, Predrag 175
Jovanović, Tatjana 288
Jovevski, Dimitar 250
Jović, Marija 324
Jugović, Tijana 318
Karanović, Velibor 306
Keček, Damira 57
Kendrišić, Miroslav 192
Kićanović, Ana 294
Korać, Dragan 22
Kostić-Stanković, Milica 320, 324, 338
Kothari, Umesh 151
Koustas, Sophia 272
Kovačević, Ivana 272, 280
Kozheski, Kristijan 67
Kragulj, Dragana 213
Krivokapić, Jovan 241
Krneta, Dragoljub 50
Krsmanović, Tatjana 302
Krstev, Sofija 50
Krstić, Jelena 334, 338
Krstović, Jana 44
Krstović, Jelena 322
Krstović, Stefan 26
Kužet, Ivana 270, 280
Kuzmanović, Marija 55
Kužner, Denis 199
Labus, Aleksandra 188
Lakčević, Petar 136
Landika, Mirjana 70
Langović, Ana 326
Latinović, Milica 160
Lazarević, Saša 170, 194, 203
Lazić, Đorđe 241
Lečić-Cvetković, Danica 139, 142
Lekić, Nemanja 342
Leković, Ksenija 336
Lozić, Joško 57
Lukić, Teodora 324
Lukovac, Petar 184
Makajić-Nikolić, Dragana 118
Malović, Andrea 266
Manojlović, Mateja 280
Marčeta, Bojan 34
Marič, Miha 282
Maričić, Milica 72
Marinčič, Dejan 282
Marinković, Sanja 100
Marinović, Minja 76
Marjanović, Uglješa 114
Marković, Valentina 266
Masal, Milica 31
Matas, Sašo 175
Matejić, Maja 268
Matejić, Tijana 52
Mazzara, Manuel 4
Mihailović, Đorđe 52
Mihailović, Jovana 110
Mihić, Marko 116, 246
Mijatović, Ivana 304
Mijić, Miloš 186
Milanović, Dragan 277
Milenković, Ivan 8
Miletić, Aleksa 184
Miletić, Aleksandar 112
Milić, Dajana 60
Milić, Miloš 199
Miljanić, Maja 20
Miloradov, Maja 114

348
Milosavljević, Miloš 162
Milošević, Isidora 300
Milošević, Pavle 44, 48
Milošević, Siniša 155
Milovanović, Mirjana 177
Milutinović, Radul 88, 90, 110, 112
Minelgaite, Inga 287
Minović, Jelena 94
Mirčetić, Vuk 116
Mitrović, Dušan 8
Mitrović, Zorica 248, 256
Mučibabić, Spasoje 258
Murtič, Sašo 131, 134
Nedeljković, Sandra 260
Nestić, Snežana 222
Nikić, Miloš 203
Nikolić, Dejana 334
Nikolić, Dejana 320, 326
Nikolić, Mina 38
Nikolić, Ognjen 55
Novaković, Vesna 177
Obradović, Zoran 258
Oger, Gokce Kilic 103, 106
Ognjenović, Kosovka 208
Okanović, Milan 312
Olgić Draženović, Bojana 146, 215
Orošnjak, Marko 306
Pajić Simović, Ana 26
Pantelić, Ognjen 26
Papić, Tamara 96
Parežanin, Miloš 213
Pavković, Vladimir 328
Peovski, Filip 64
Perić, Tamara 328
Petrović, Anđelina 330
Petrović, Dejan 252, 256
Petrović, Nataša 120
Petrović, Nikola 270
Poledica, Ana 48
Popović, Milena 76
Pržulj, Đorđe 10
Radaković, Jelena Andreja 118
Radenković, Božidar 184
Radojičić, Milan 72, 175
Radojičić, Stefan 168
Radosavljević, Goran 173
Radovanović, Olga 296
Radovanović, Sandro 42
Radulović, Branko 211
Rajković, Teodora 139, 142
Rakić, Nela 155
Rakićević, Aleksandar 46
Rakićević, Zoran 136
Raković Rudović, Gordana 332
Raković, Lazar 128
Raspor, Andrej 134
Ruso, Jelena 300
Savić, Dušan 196
Savković, Marija 222
Savoiu, Gheorghe 243
Seetharaman, A 151
Silva, Angela 124, 126
Simeunović, Barbara 228
Simeunović, Nenad 114
Simić, Dejan 8, 15, 24
Simić, Milica 188
Slavinski, Teodora 254
Slović, Dragoslav 226
Smuđa, Bojan 230
Spasenić, Željko 153, 162
Sredojević, Slađana 153
Stamenković, Negovan 22
Stanimirović, Petar 252, 256
Stanisavljević, Nenad 190
Stanojević, Bogdana 74
Stanojević, Jelica 29
Stanojević, Milan 74
Stanojević, Olgica 340
Stanojević, Vojislav 196
Stefanović, Darko 10
Stefanović, Miroslav 10
Stojadinović, Tatjana 170
Stojanović Tatjana 194
Stojanović, Danijela 190
Stojanović, Dragana 232, 234
Stošić, Biljana 88, 110, 112
Stošić, Danijel 296
Suknović, Milija 42
Suljić Nikolaj, Stella 146
Šarac, Dragana 60
Škembarević, Milica 13
Šošević, Uroš 29

349
Štavljanin, Velimir 29, 318
Tadić, Danijela 276
Todorović, Ivan 239
Tomac, Dorana 157
Tomašević, Ivan 226
Tošić, Biljana 304
Tripković, Srđan 15
Trivanović, Marija 310
Trpeski, Predrag 64
Uremović, Nina 70
Uskoković, Veljko 72
Vasić, Filip 52
Vasiljević, Dragan 139
Veljković, Djurdjina 237
Višnjić, Dušan 192
Vlajić, Siniša 196, 199
Vlastelica, Tamara 328, 334
Vojtek, Nikola 230
Vratonjić Gligorijević, Aleksandar 252
Vučenović, Sonja 336
Vukadinović, Goran 258
Vukmirović, Aleksandra 316
Vukmirović, Jovanka 316, 342
Vuković, Aleksandra 234
Vuković, Danilo 217
Vuksanović, Milica 294
Zdravković, Marija 338
Zečević, Leposava 340
Zekavica, Ana 342
Zorko, Albert 131
Zugić, Željko 260
Zukanović, Milica 46, 48
Živković, Ivona 270
Živković, Miloš 186
Živković, Nedeljko 304