X-ray tomography observation of crack propagation in nuclear graphite
18
X-Ray Tomography of Crack Propagation Hodgkins et al Manchester University X-Ray Tomography Observation of Crack Propagation in Nuclear Graphite 1 A Hodgkins, T.J. Marrow, P. Mummery, B. Marsden and A. Fok Materials Performance Centre, School of Materials, The University of Manchester ABSTRACT X-Ray Microtomography has been used to investigate the mechanisms responsible for rising crack growth resistance with crack propagation (R-curve behaviour) in polygranular nuclear graphite. Tomography can be used to observe changes in the crack shape with propagation, and a side-grooved specimen has been developed to produce the planar, straight fronted crack necessary for fracture toughness measurement. Crack bridging from frictional contact between the fracture surfaces is observed. A zone of reduced X-ray attenuation, attributed to microstructural damage, is also observed around the crack tip and in its wake. These are the first, in-situ, observations of the mechanisms of the R-curve behaviour in nuclear graphites. 1 NOTICE: this is the author’s version of a work that was accepted for publication in Materials Science and Technology. Changes resulting from the publishing process, such as peer review, editing, corrections, structural formatting, and other quality control mechanisms may not be reflected in this document. Changes may have been made to this work since it was submitted for publication. A definitive version was subsequently published in J. Mater Sci. Tech, 22, pp. 1045-1051 (2006), DOI 10.1179/174328406X114126
-
Upload
independent -
Category
Documents
-
view
1 -
download
0
Transcript of X-ray tomography observation of crack propagation in nuclear graphite
X-Ray Tomography of Crack Propagation
Hodgkins et al Manchester University
X-Ray Tomography Observation of Crack Propagation
in Nuclear Graphite1
A Hodgkins, T.J. Marrow, P. Mummery, B. Marsden and A. Fok
Materials Performance Centre, School of Materials, The University of Manchester
ABSTRACT
X-Ray Microtomography has been used to investigate the mechanisms responsible for
rising crack growth resistance with crack propagation (R-curve behaviour) in
polygranular nuclear graphite. Tomography can be used to observe changes in the
crack shape with propagation, and a side-grooved specimen has been developed to
produce the planar, straight fronted crack necessary for fracture toughness
measurement. Crack bridging from frictional contact between the fracture surfaces is
observed. A zone of reduced X-ray attenuation, attributed to microstructural damage,
is also observed around the crack tip and in its wake. These are the first, in-situ,
observations of the mechanisms of the R-curve behaviour in nuclear graphites.
1 NOTICE: this is the author’s version of a work that was accepted for publication in Materials Science
and Technology. Changes resulting from the publishing process, such as peer review, editing,
corrections, structural formatting, and other quality control mechanisms may not be reflected in this
document. Changes may have been made to this work since it was submitted for publication. A
definitive version was subsequently published in J. Mater Sci. Tech, 22, pp. 1045-1051 (2006), DOI
10.1179/174328406X114126
X-Ray Tomography of Crack Propagation
Hodgkins et al Manchester University
INTRODUCTION
Polygranular graphite is used to moderate the fast neutrons released during the fission
reaction in gas cooled nuclear reactors[1]. As a result of the combined effects of fast
neutron irradiation and radiolytic oxidation there is a gradual accumulation of damage
in the graphite[2]. This leads to changes in its dimensions and properties[3] and also to
the generation of stresses which have the potential to initiate fracture[4]. As graphite
plays a structural role within the reactor core, in addition to the role of moderator, it is
of interest to study their fracture behaviour.
Previous studies have demonstrated rising resistance to crack propagation with
increasing crack length in a variety of grades of nuclear graphite[5, 6] A common
measure of this effect is the R-curve; which describes the change in the energy
required to grow the crack, as its length increases[7]. Experimental studies have
demonstrated that variations in specimen geometry[8], the mode of loading and the
initial crack length may produce variations in the shape and magnitude of the R-
curve[9]. To generate the R-curve, test specimens may be loaded repeatedly under
displacement control then unloaded following stable crack propagation, and the data
analysed by a variety of methods[10-12]. There is, at present, no consensus as to which
is the most appropriate to apply to graphite. However both linear elastic GR methods
and elastic plastic JR methods have been used at various times.
The R curve may be defined from first principles, following each successive load
cycle, by equation 1. This is a linear elastic analysis, applied previously to graphite[7],
where W is the work input by external forces and Ue is the stored elastic strain energy.
The projected area of the crack, over which this energy is divided, is determined by
reference to ‘B’, the specimen thickness and δa, the change in crack length. There is

X-Ray Tomography of Crack Propagation
Hodgkins et al Manchester University
therefore an implicit assumption that the crack front is straight and extends
continuously from the tip.
( )aBUWR e
δδ −
= (1)
Inaccuracies in the determination of the crack length are a significant potential source
of errors in R-curves produced by this method however. Optical measurements of the
crack, made at the surface, are the simplest method of determining its length. The
most common alternatives involve measuring the elastic compliance of the
specimen[5, 7] or its electrical resistance[6].
The energy consumed in each load cycle to propagate the crack (W-UE) is determined
directly from the load v displacement curve (Figure 1).
Load
0
B
A
C
DLoadline displacement
Energy consumed by crack propagation
(W – UE) Load cycle: n-1
Energy consumed by crack propagation
(W – UE) Load cycle: n
Energy consumed by crack propagation
(W – UE) Load cycle: n+1
Load
0
B
A
C
DLoadline displacement
Energy consumed by crack propagation
(W – UE) Load cycle: n-1
Energy consumed by crack propagation
(W – UE) Load cycle: n
Energy consumed by crack propagation
(W – UE) Load cycle: n
Energy consumed by crack propagation
(W – UE) Load cycle: n+1
Figure 1 Schematic representation of the area beneath the load v displacement curve
used to determine the energy consumed by crack propagation. The lower edge is
defined by the load line for the subsequent load cycle.
The R-curve behaviour of AGR graphite has been reported previously[6, 13] and
compared with other brittle materials that exhibit R-curves, such as Al2O3 and BeO[14,
X-Ray Tomography of Crack Propagation
Hodgkins et al Manchester University
15]. It was deduced that micro crack formation in a deformation zone, ahead of the
crack tip, and bridging, in the wake, were together responsible for the R-curve in
graphite. Stress induced micro cracks have been observed ahead of a stationary crack
tip in isotropic graphite[16], and it has been shown by re-notching experiments[6] that
the crack wake makes the most significant contribution to fracture resistance.
In the previous reports of graphite’s R-curve in large specimens, an initial rise in
resistance is commonly observed for crack extensions of up to 10 mm (Figure 2 I - II).
The length of the bridging zone (LBr) has been estimated from the period of this rise[13,
16]. This behaviour characterises stage I of the R-curve. Stage III, the final stage of
the R-curve (Figure 2 III - IV) is commonly marked by rapidly falling resistance,
which has been suggested to occur when the length of the deformation zone (LDef) was
of comparable size to the uncracked ligament ahead of the crack tip. The R-curve
resistance is generally stable in stage II (Figure 2 II - III). The extent of crack
propagation in this stable ‘plateau’ region (Equation 2) is often limited to little more
than 10 – 15mm due to the dimensions of the specimen.
( )DefBrPl LLLL +−= (2)
These general observations of the stages of graphite’s R-curve are subject to a number
of qualifications and exceptions:
i. Significant variations are reported in the plateau region in Gilsocarbon
graphite 5 [6]
ii. Significant variations have been reported in the length of stage III of the R-
curve, in Gilsocarbon graphite[5].
iii. Continuously rising resistance has been reported in the ‘plateau’ region in
Gilsocarbon graphite [6].
X-Ray Tomography of Crack Propagation
Hodgkins et al Manchester University
iv. Sharply rising resistance has been reported in SENB specimens in stage III of
the R-curve[17].
v. Continuously falling resistance throughout the test has been observed in
compact tension specimens with a chevron notch [7].
In addition, it has been suggested that the sharp rise that characterises stage I of the R-
curve in Gilsocarbon graphite may be explained by errors in the measurement of the
crack length[18]. Differences in the way the R-curve is produced may be partially
responsible for these variations, and specimen size and configuration effects are not
fully understood, for example.
The aim of the work reported in this paper was therefore to attempt to resolve these
apparent differences in behaviour, through a detailed investigation of the crack
behaviour during fracture toughness testing of polygranular nuclear graphite. X-Ray
Microtomography has been used to look beneath the surface of the specimens, for the
first time enabling in-situ observations of the crack shape and the mechanisms
responsible for the R-curve. Virgin, non-irradiated, non-oxidised, isotropic
Gilsocarbon graphite, which is used to moderate the 2nd generation Advanced gas
reactors (AGR) in the UK, has been selected as a representative material for a coarse
grained polygranular graphite.

X-Ray Tomography of Crack Propagation
Hodgkins et al Manchester University
Ror
JR
(J/m
2 )
I
IIIII
IVRor
JR
(J/m
2 )
I
Fron
t fac
e of
the
spec
imen
Rea
r fac
e of
the
spec
imen
LBrL
LDef
Ror
JR
(J/m
2 )
I
IIIII
IVRor
JR
(J/m
2 )
I
Fron
t fac
e of
the
spec
imen
Rea
r fac
e of
the
spec
imen
LBrL
LDef
Figure 2 The relationship between R-curve behaviour and some postulated
mechanisms.
EXPERIMENTAL METHOD
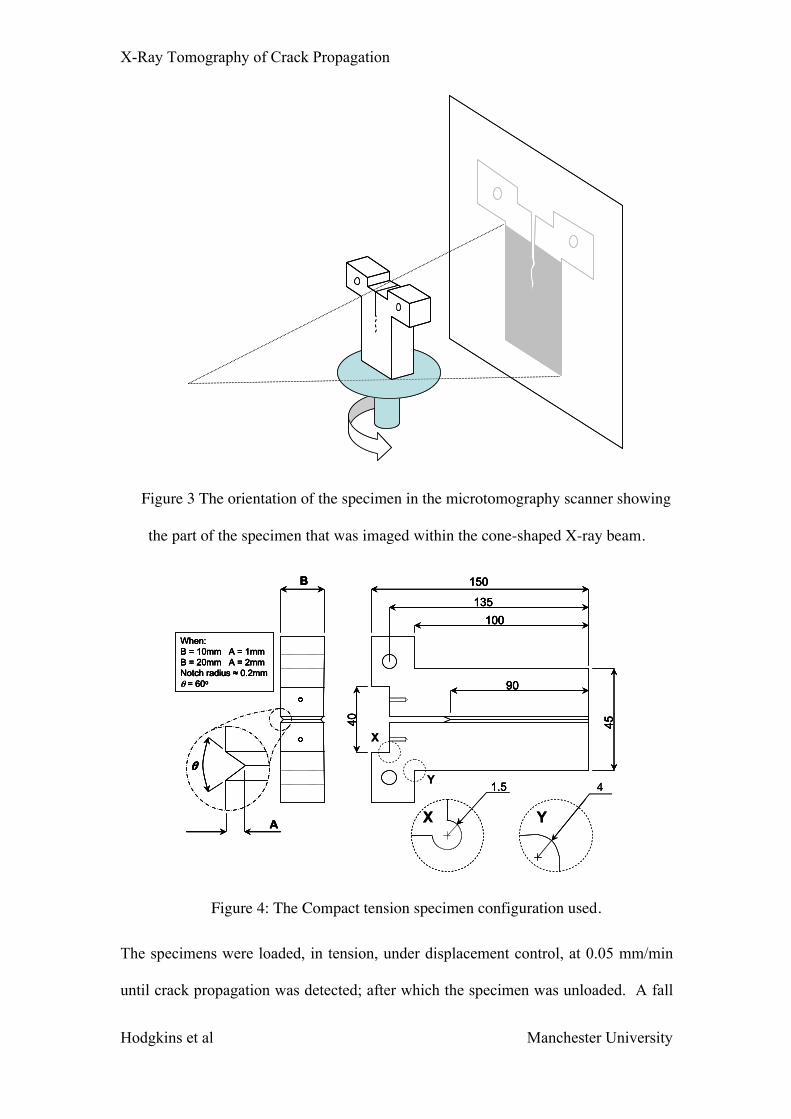
The resolution of laboratory X-ray microtomography is limited by the number of
voxels (three-dimensional pixels)[19] in the 3D sample image, and is therefore
generally determined by the sample size. Modified compact tension (CT) specimens
were used to maximise the spatial resolution of X-Ray Microtomography (Figure 3)
and the thickness, B, (Figure 4) was varied between 10 mm and 50 mm. The effect of
one or two side grooves on crack behaviour was also investigated in 10 mm and 20
mm thick specimens.
X-Ray Tomography of Crack Propagation
Hodgkins et al Manchester University
Figure 3 The orientation of the specimen in the microtomography scanner showing
the part of the specimen that was imaged within the cone-shaped X-ray beam.
A
B 150
135100
90
4540
When: B = 10mm A = 1mmB = 20mm A = 2mmNotch radius ≈ 0.2mmθ = 60o
θ
X
Y 1.5 4
X YA
B 150
135100
90
4540
When: B = 10mm A = 1mmB = 20mm A = 2mmNotch radius ≈ 0.2mmθ = 60o
θ
A
B 150
135100
90
4540
When: B = 10mm A = 1mmB = 20mm A = 2mmNotch radius ≈ 0.2mmθ = 60o
θ
A
B 150
135100
90
4540
When: B = 10mm A = 1mmB = 20mm A = 2mmNotch radius ≈ 0.2mmθ = 60o
θ
X
Y 1.51.5 4
X Y
Figure 4: The Compact tension specimen configuration used.
The specimens were loaded, in tension, under displacement control, at 0.05 mm/min
until crack propagation was detected; after which the specimen was unloaded. A fall
X-Ray Tomography of Crack Propagation
Hodgkins et al Manchester University
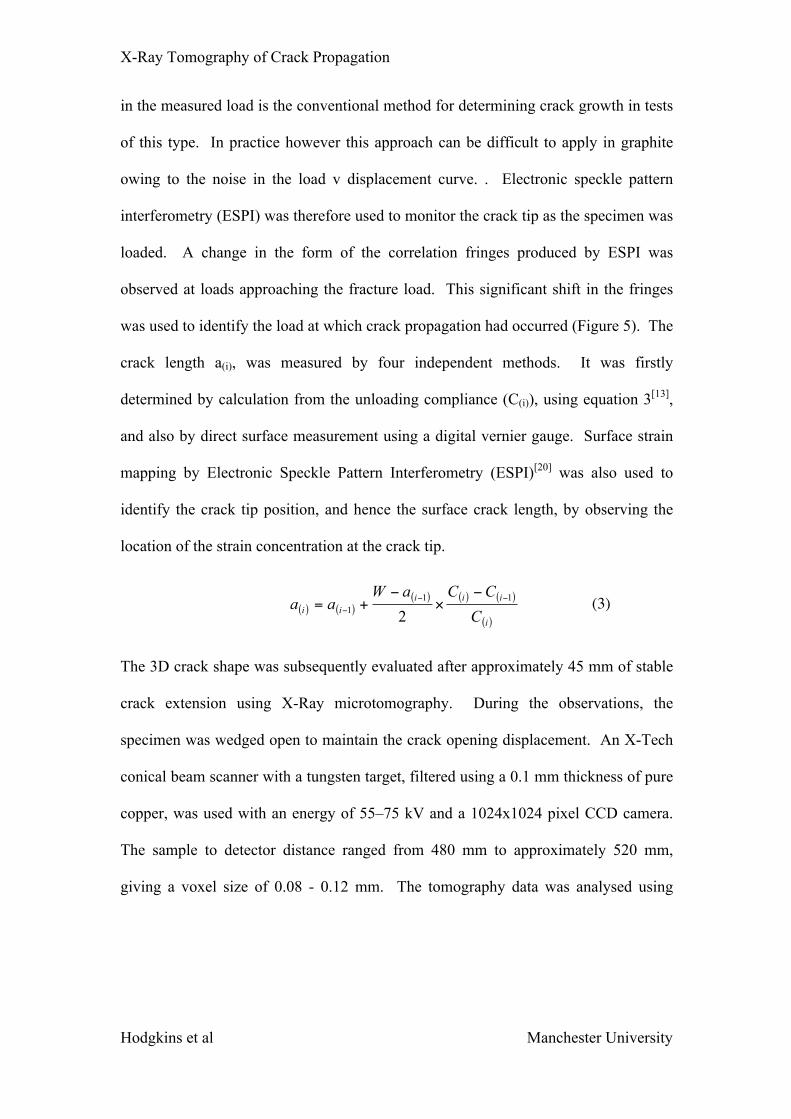
in the measured load is the conventional method for determining crack growth in tests
of this type. In practice however this approach can be difficult to apply in graphite
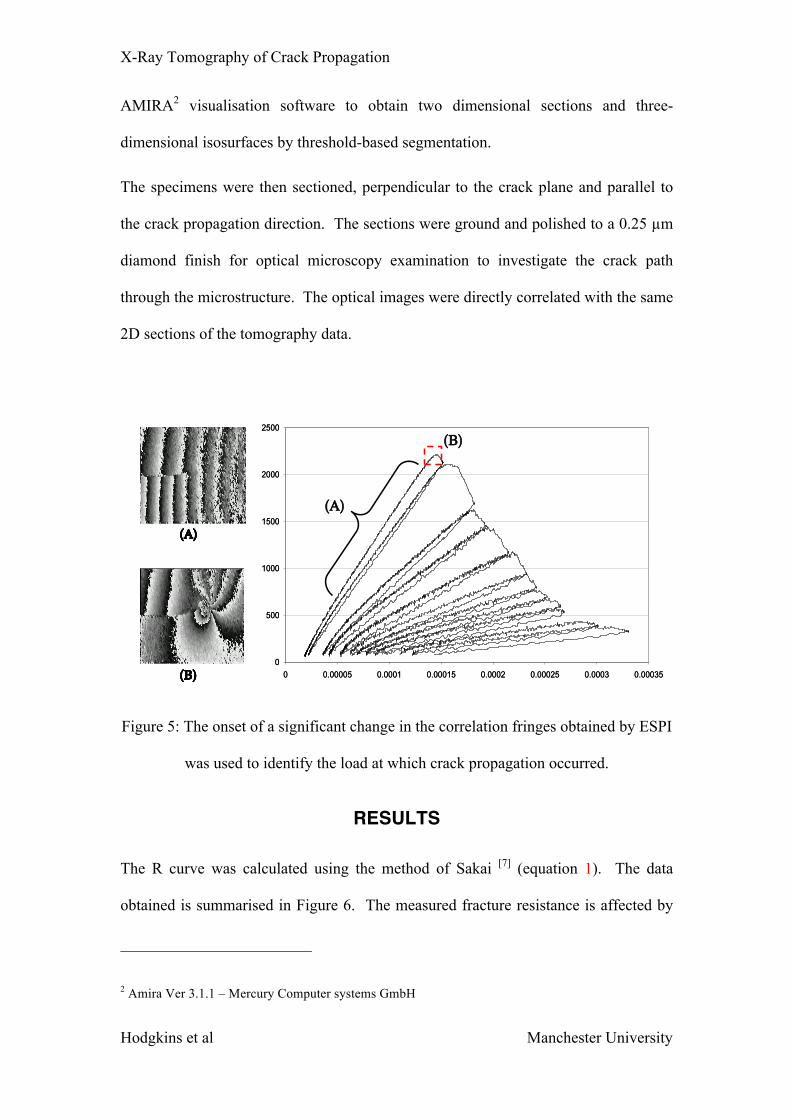
owing to the noise in the load v displacement curve. . Electronic speckle pattern
interferometry (ESPI) was therefore used to monitor the crack tip as the specimen was
loaded. A change in the form of the correlation fringes produced by ESPI was
observed at loads approaching the fracture load. This significant shift in the fringes
was used to identify the load at which crack propagation had occurred (Figure 5). The
crack length a(i), was measured by four independent methods. It was firstly
determined by calculation from the unloading compliance (C(i)), using equation 3[13],
and also by direct surface measurement using a digital vernier gauge. Surface strain
mapping by Electronic Speckle Pattern Interferometry (ESPI)[20] was also used to
identify the crack tip position, and hence the surface crack length, by observing the
location of the strain concentration at the crack tip.
( ) ( )( ) ( ) ( )
( )i
iiiii C
CCaWaa 11
1 2−−
−
−×
−+= (3)
The 3D crack shape was subsequently evaluated after approximately 45 mm of stable
crack extension using X-Ray microtomography. During the observations, the
specimen was wedged open to maintain the crack opening displacement. An X-Tech
conical beam scanner with a tungsten target, filtered using a 0.1 mm thickness of pure
copper, was used with an energy of 55–75 kV and a 1024x1024 pixel CCD camera.
The sample to detector distance ranged from 480 mm to approximately 520 mm,
giving a voxel size of 0.08 - 0.12 mm. The tomography data was analysed using
X-Ray Tomography of Crack Propagation
Hodgkins et al Manchester University
AMIRA2 visualisation software to obtain two dimensional sections and three-
dimensional isosurfaces by threshold-based segmentation.
The specimens were then sectioned, perpendicular to the crack plane and parallel to
the crack propagation direction. The sections were ground and polished to a 0.25 µm
diamond finish for optical microscopy examination to investigate the crack path
through the microstructure. The optical images were directly correlated with the same
2D sections of the tomography data.
0
500
1000
1500
2000
2500
0 0.00005 0.0001 0.00015 0.0002 0.00025 0.0003 0.00035
Load v displacement
0
500
1000
1500
2000
2500
0 0.00005 0.0001 0.00015 0.0002 0.00025 0.0003 0.00035
Load line displacement (mm)
Load
(N)
(Α)
(Β)
(Α)
(Β)
Load v displacement
0
500
1000
1500
2000
2500
0 0.00005 0.0001 0.00015 0.0002 0.00025 0.0003 0.00035
Load line displacement (mm)
Load
(N)
(Α)
(Β)
(Α)
(Β)
(Β)
(Α)
0
500
1000
1500
2000
2500
0 0.00005 0.0001 0.00015 0.0002 0.00025 0.0003 0.00035
Load v displacement
0
500
1000
1500
2000
2500
0 0.00005 0.0001 0.00015 0.0002 0.00025 0.0003 0.00035
Load line displacement (mm)
Load
(N)
(Α)
(Β)
(Α)
(Β)
Load v displacement
0
500
1000
1500
2000
2500
0 0.00005 0.0001 0.00015 0.0002 0.00025 0.0003 0.00035
Load line displacement (mm)
Load
(N)
(Α)
(Β)
(Α)
(Β)
(Β)
(Α)
Figure 5: The onset of a significant change in the correlation fringes obtained by ESPI
was used to identify the load at which crack propagation occurred.
RESULTS
The R curve was calculated using the method of Sakai [7] (equation 1). The data
obtained is summarised in Figure 6. The measured fracture resistance is affected by
2 Amira Ver 3.1.1 – Mercury Computer systems GmbH
X-Ray Tomography of Crack Propagation
Hodgkins et al Manchester University
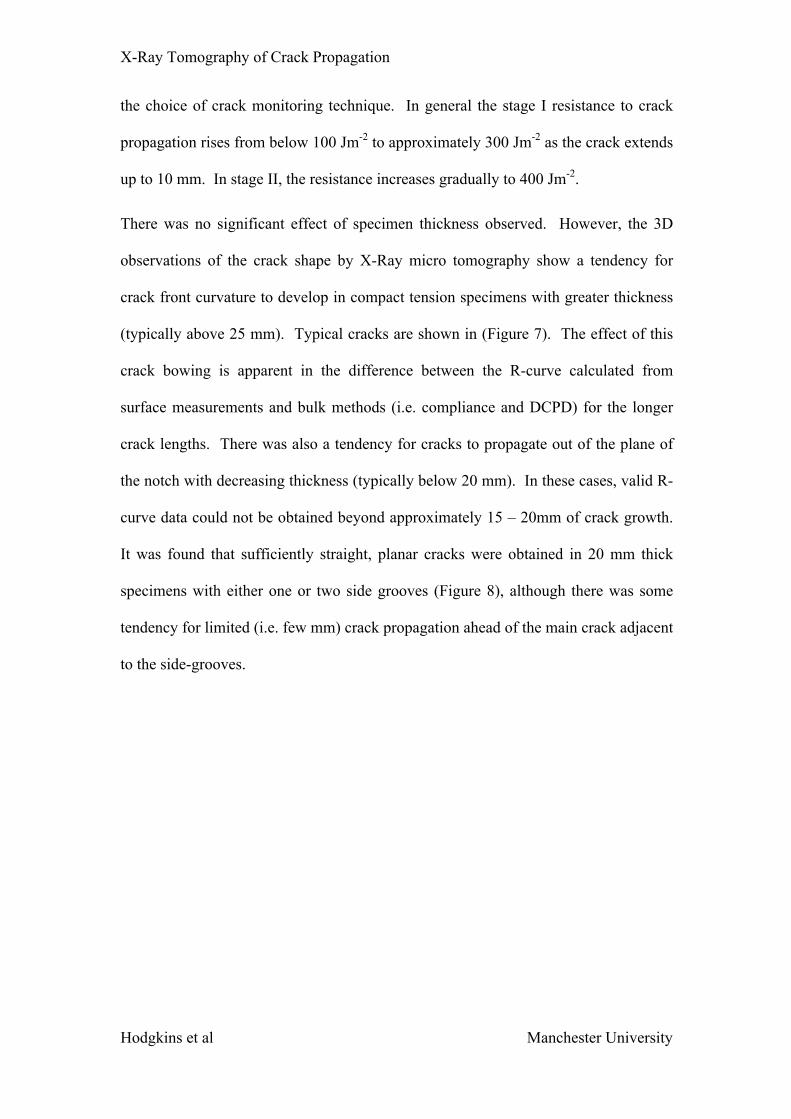
the choice of crack monitoring technique. In general the stage I resistance to crack
propagation rises from below 100 Jm-2 to approximately 300 Jm-2 as the crack extends
up to 10 mm. In stage II, the resistance increases gradually to 400 Jm-2.
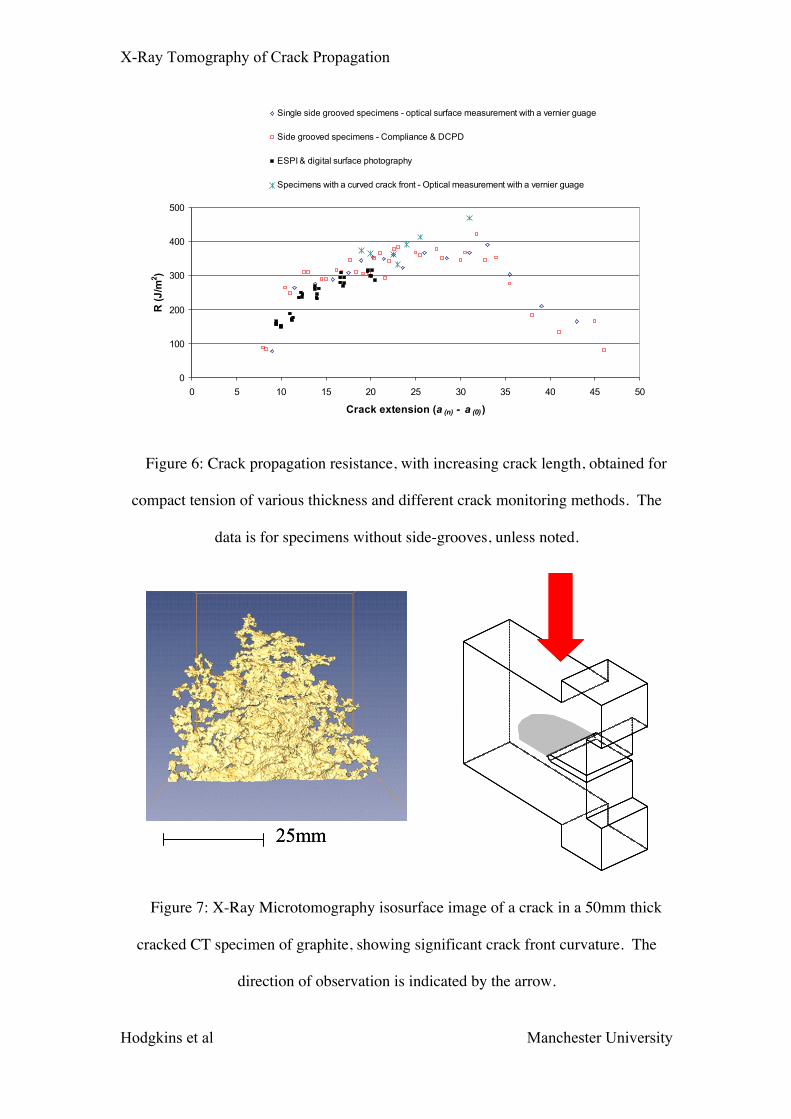
There was no significant effect of specimen thickness observed. However, the 3D
observations of the crack shape by X-Ray micro tomography show a tendency for
crack front curvature to develop in compact tension specimens with greater thickness
(typically above 25 mm). Typical cracks are shown in (Figure 7). The effect of this
crack bowing is apparent in the difference between the R-curve calculated from
surface measurements and bulk methods (i.e. compliance and DCPD) for the longer
crack lengths. There was also a tendency for cracks to propagate out of the plane of
the notch with decreasing thickness (typically below 20 mm). In these cases, valid R-
curve data could not be obtained beyond approximately 15 – 20mm of crack growth.
It was found that sufficiently straight, planar cracks were obtained in 20 mm thick
specimens with either one or two side grooves (Figure 8), although there was some
tendency for limited (i.e. few mm) crack propagation ahead of the main crack adjacent
to the side-grooves.
X-Ray Tomography of Crack Propagation
Hodgkins et al Manchester University
0
100
200
300
400
500
0 5 10 15 20 25 30 35 40 45 50
Crack extension (a (n) - a (0))
R (J
/m2 )
Single side grooved specimens - optical surface measurement with a vernier guage
Side grooved specimens - Compliance & DCPD
ESPI & digital surface photography
Specimens with a curved crack front - Optical measurement with a vernier guage
Figure 6: Crack propagation resistance, with increasing crack length, obtained for
compact tension of various thickness and different crack monitoring methods. The
data is for specimens without side-grooves, unless noted.
25mm25mm
Figure 7: X-Ray Microtomography isosurface image of a crack in a 50mm thick
cracked CT specimen of graphite, showing significant crack front curvature. The
direction of observation is indicated by the arrow.

X-Ray Tomography of Crack Propagation
Hodgkins et al Manchester University
(A)
20mm 20mm
(B) (C)
20mm
(A)
20mm20mm 20mm20mm
(B) (C)
20mm20mm
Figure 8: Examples of crack growth in 20 mm thick compact tension specimens
with (A) no side grooves, (B) a single side groove and (C) double side grooves. . The
direction of observation is indicated by arrows.
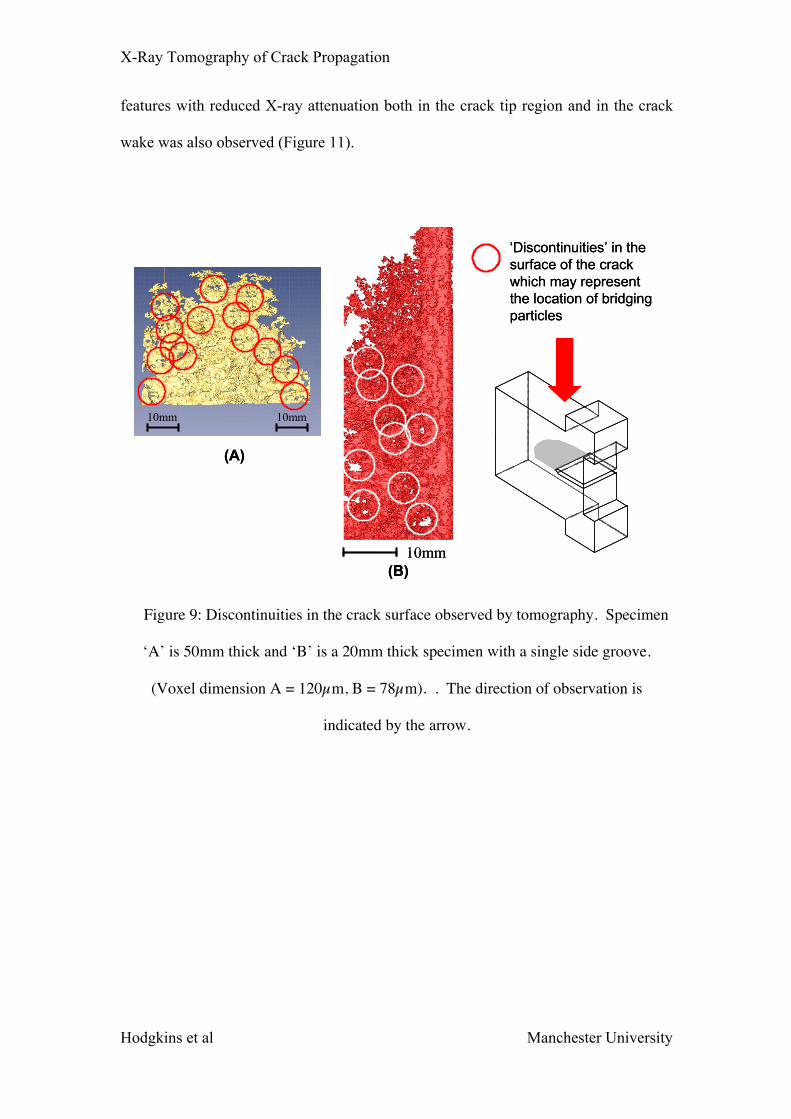
X-ray tomography revealed discontinuities in the resolved crack surface (Figure 9).
In the thicker specimens (30 mm ≤ B ≤ 50 mm) these are concentrated in a region
approximately 10 mm from the observed perimeter of the crack (Figure 9A). In the
thinner specimens (B ≤ 20 mm) isolated discontinuities were also observed, over the
whole crack length (Figure 9B).
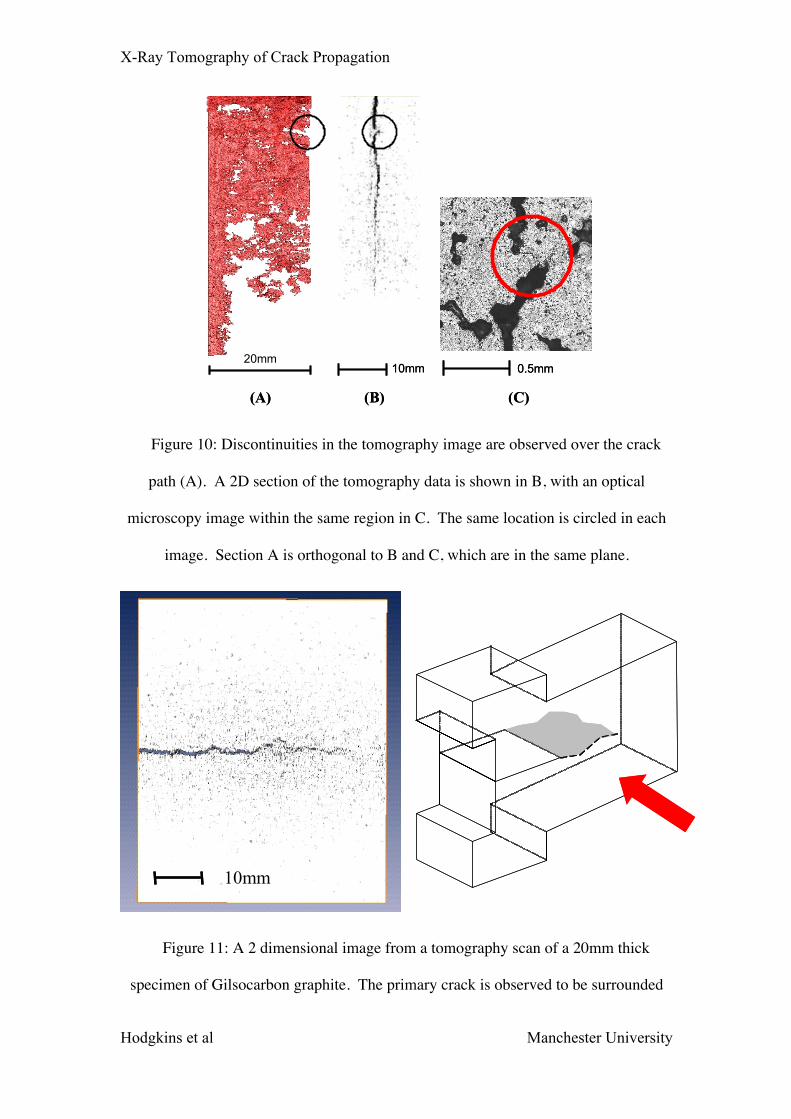
The optical examination did not find any of these discontinuities in the crack, but in
some cases the fracture surfaces were observed to be in contact at the same location as
the tomographically observed discontinuities (Figure 10B & C). A zone containing
X-Ray Tomography of Crack Propagation
Hodgkins et al Manchester University
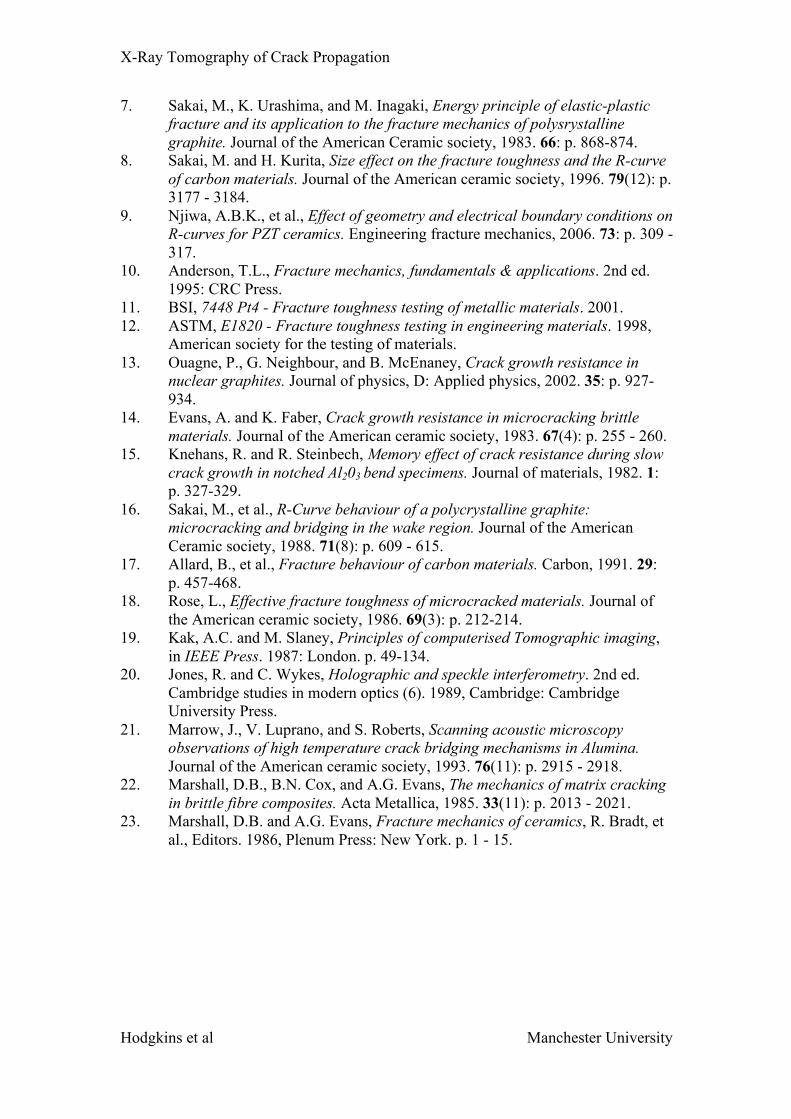
features with reduced X-ray attenuation both in the crack tip region and in the crack
wake was also observed (Figure 11).
(B)
(A)
10mm10mm
‘Discontinuities’ in the surface of the crack which may represent the location of bridging particles
10mm(B)
(A)
10mm10mm
‘Discontinuities’ in the surface of the crack which may represent the location of bridging particles
10mm
Figure 9: Discontinuities in the crack surface observed by tomography. Specimen
‘A’ is 50mm thick and ‘B’ is a 20mm thick specimen with a single side groove.
(Voxel dimension A = 120µm, B = 78µm). . The direction of observation is
indicated by the arrow.
X-Ray Tomography of Crack Propagation
Hodgkins et al Manchester University
0.5mm
(C) (D)
5mm20mm
(A) (B)
10mm 0.5mm
(C) (D)
5mm5mm20mm
(A) (B)
10mm
Figure 10: Discontinuities in the tomography image are observed over the crack
path (A). A 2D section of the tomography data is shown in B, with an optical
microscopy image within the same region in C. The same location is circled in each
image. Section A is orthogonal to B and C, which are in the same plane.
10mm10mm
Figure 11: A 2 dimensional image from a tomography scan of a 20mm thick
specimen of Gilsocarbon graphite. The primary crack is observed to be surrounded

X-Ray Tomography of Crack Propagation
Hodgkins et al Manchester University
by zone of features with low attenuation. . The direction of observation is indicated
by the arrow.
DISCUSSION
The R curve for isotropic Gilsocarbon graphite is characterised by sharply rising
resistance in the first 10 – 15 mm of crack growth (Figure 6). This is followed by a
further, shallower, rise with crack extension. The highest resistance to fracture,
calculated using the observed crack length at the specimen surface, was observed in
thicker specimens. X-ray microtomography was used to determine the crack size and
shape, and agreed with the surface measurements of crack length (Figure 7 & Figure
8). However, the observations also showed that for thicker specimens (>25mm), the
surface measurements of the crack length underestimated the true crack extension due
to crack front curvature (Figure 7). This had the effect of increasing the calculated
apparent resistance for thick specimens in comparison to the thin specimens, which
had a straighter crack front.
Side-grooving in 25 mm thick specimens gave comparable fracture resistance to the
thin specimens (Figure 6). This implies that the actual fracture resistance is not
sensitive to specimen thickness in this range. The discrepancies in the reported
fracture resistance in similar nuclear graphites[5, 6] may therefore be due to differences
in the crack shape, particularly in thicker specimens, which were not observable
without tomography. The results reported here also show that side-grooves to control
the crack shape may be recommended, although further work is required to determine
the maximum specimen thickness to which they could be successfully applied.
X-ray micro tomography provides a 3D map of the variation in X-ray attenuation in
the sample during the fracture test. To the authors’ knowledge, these are the first in-

X-Ray Tomography of Crack Propagation
Hodgkins et al Manchester University
situ observations of crack propagation in graphite. The crack is clearly observed
when the crack opening displacement approaches that of the voxel dimension, which
was typically 80 to 120 µm. Optical microscopy found no discontinuities in the crack,
but some of the discontinuities that were identified by tomography (Figure 10) were
found to correspond to frictional contacts between the crack faces. This is consistent
with the tomography observation of an increase in the density of discontinuities close
to the crack tip where the crack opening displacement is reduced (Figure 9). The
apparent lack of discontinuities at greater distances from the crack tip in the thicker
specimens may be a result of the lower resolution achieved in the tomography scans
of these larger samples, or a difference in the crack opening profile.
Frictional contact mechanisms for R-curve behaviour have been observed in other
materials, such as polycrystalline alumina[21]. Crack bridging by frictional contact is
consistent with previous observations, using re-notching, that crack wake processes
were responsible for a significant fraction of the R-curve behaviour in nuclear
graphite[16]. The observations reported here are consistent with this mechanism,
which is expected to be sensitive to specimen geometry effects on the crack opening.
X-ray tomography also observed a region of reduced attenuation at the crack tip
region and in the wake of the crack (Figure 11). It is suggested that this represents
microcracking, due to heterogeneous deformation in the polygranular microstructure
of the nuclear graphite. Microcracking is a toughening mechanism in some
materials[22, 23], and may therefore also be responsible for significant part of the R-
curve behaviour in nuclear graphite. Further work is in progress, using optical strain
mapping (ESPI) to determine the crack tip strain distribution and X-ray tomography
to determine the crack shape, to confirm the relative contributions of wake and tip
processes.

X-Ray Tomography of Crack Propagation
Hodgkins et al Manchester University
CONCLUSIONS
• Tomography has been used to observe changes in the crack shape with
propagation, and the mechanisms responsible for R-curve behaviour in
polygranular nuclear graphite.
• Bowed cracks develop in CT specimens thicker than 25 mm. The crack tends
to propagate out of the notch plane in specimens thinner than 20 mm. A side-
grooved specimen has been developed to produce the planar, straight fronted
crack necessary for fracture toughness measurement.
• Crack bridging from frictional contact between the fracture surfaces is
observed. A zone of reduced X-ray attenuation, attributed to microstructural
damage, is also observed around the crack tip and in its wake.
ACKNOWLEDGEMENTS
The authors gratefully acknowledge the support of the Health and Safety Executive,
BNFL, Magnox Electric and British Energy Plc. The opinions expressed in this paper
are those of the authors, and do not necessarily reflect those of the research sponsors.
REFERENCES
1. Burchell, T., A microstructurally based fracture model for polygranular graphites. Carbon, 1995. 34(3): p. 297 - 316.
2. Shtrombach, Y., et al., Radiation damage of graphite. Journal of nuclear materials, 1995. 225: p. 273-301.
3. Kelly, B., The theory of irradiation damage in graphite. Carbon, 1976. 15: p. 117-127.
4. Kelly, B.T., D. Jones, and A. James, Irradiation damage to pile grade graphite at 450oC. Journal of Nuclear Materials, 1962. 7(3): p. 279 - 291.
5. Ouagne, P., Fracture Property Changes with Oxidation and Irradiation in Nuclear Graphites, in Materials. 2001, Bath University: Bath.
6. Fazluddin, S., Crack growth resistance in nuclear graphite, in Materials. 2002, University of Leeds: Leeds. p. 252.
X-Ray Tomography of Crack Propagation
Hodgkins et al Manchester University
7. Sakai, M., K. Urashima, and M. Inagaki, Energy principle of elastic-plastic fracture and its application to the fracture mechanics of polysrystalline graphite. Journal of the American Ceramic society, 1983. 66: p. 868-874.
8. Sakai, M. and H. Kurita, Size effect on the fracture toughness and the R-curve of carbon materials. Journal of the American ceramic society, 1996. 79(12): p. 3177 - 3184.
9. Njiwa, A.B.K., et al., Effect of geometry and electrical boundary conditions on R-curves for PZT ceramics. Engineering fracture mechanics, 2006. 73: p. 309 - 317.
10. Anderson, T.L., Fracture mechanics, fundamentals & applications. 2nd ed. 1995: CRC Press.
11. BSI, 7448 Pt4 - Fracture toughness testing of metallic materials. 2001. 12. ASTM, E1820 - Fracture toughness testing in engineering materials. 1998,
American society for the testing of materials. 13. Ouagne, P., G. Neighbour, and B. McEnaney, Crack growth resistance in
nuclear graphites. Journal of physics, D: Applied physics, 2002. 35: p. 927-934.
14. Evans, A. and K. Faber, Crack growth resistance in microcracking brittle materials. Journal of the American ceramic society, 1983. 67(4): p. 255 - 260.
15. Knehans, R. and R. Steinbech, Memory effect of crack resistance during slow crack growth in notched Al203 bend specimens. Journal of materials, 1982. 1: p. 327-329.
16. Sakai, M., et al., R-Curve behaviour of a polycrystalline graphite: microcracking and bridging in the wake region. Journal of the American Ceramic society, 1988. 71(8): p. 609 - 615.
17. Allard, B., et al., Fracture behaviour of carbon materials. Carbon, 1991. 29: p. 457-468.
18. Rose, L., Effective fracture toughness of microcracked materials. Journal of the American ceramic society, 1986. 69(3): p. 212-214.
19. Kak, A.C. and M. Slaney, Principles of computerised Tomographic imaging, in IEEE Press. 1987: London. p. 49-134.
20. Jones, R. and C. Wykes, Holographic and speckle interferometry. 2nd ed. Cambridge studies in modern optics (6). 1989, Cambridge: Cambridge University Press.
21. Marrow, J., V. Luprano, and S. Roberts, Scanning acoustic microscopy observations of high temperature crack bridging mechanisms in Alumina. Journal of the American ceramic society, 1993. 76(11): p. 2915 - 2918.
22. Marshall, D.B., B.N. Cox, and A.G. Evans, The mechanics of matrix cracking in brittle fibre composites. Acta Metallica, 1985. 33(11): p. 2013 - 2021.
23. Marshall, D.B. and A.G. Evans, Fracture mechanics of ceramics, R. Bradt, et al., Editors. 1986, Plenum Press: New York. p. 1 - 15.