WYCKOFF - 1 File Download
26
WYCKOFF METHOD AND CHEAT SHEET www.RisePrecision.com
-
Upload
khangminh22 -
Category
Documents
-
view
1 -
download
0
Transcript of WYCKOFF - 1 File Download

WYCKOFFMETHOD AND CHEAT SHEET
www.RisePrecision.com

www.RisePrecision.com
Richard D. WyckoffRichard Demille Wyckoff (1873–1934) was an early 20th-century pioneer in the technical approach to studyingthe stock market. He is considered one of the five “titans” of technical analysis, along with Dow, Gann,Elliott and Merrill. At age 15, he took a job as a stock runner for a New York brokerage. Afterwards,while still in his 20s, he became the head of his own firm. He also founded and, for nearly two decadeswrote, and edited The Magazine of Wall Street, which, at one point, had more than 200,000 subscribers.
Wyckoff was an avid student of the markets, as well as an active tape reader and trader. He observedthe market activities and campaigns of the legendary stock operators of his time, including JP Morganand Jesse Livermore. From his observations and interviews with those big-time traders, Wyckoff codifiedthe best practices of Livermore and others into laws, principles and techniques of trading methodology, money management and mental discipline.
From his position, Mr. Wyckoff observed numerous retail investors being repeatedly fleeced. Consequently, he dedicated himself to instructing the public about “the real rules of the game” as played by the large interests, or “smart money.” In the 1930s, he founded a school which would later become the Stock Market Institute. The school's central offering was a course that integrated the concepts thatWyckoff had learned about how to identify large operators' accumulation and distribution of stock with how to take positions in harmony with these big players. His time-tested insights are as valid today as they were when first articulated.
This guide provides an overview of Wyckoff's theoretical and practical approaches to the markets, including guidelines for identifying trade candidates and entering long and short positions, analysis of accumulation and distribution trading ranges. Wyckoff's methods can be applied to any freely-traded market in which large institutional traders operate, including commodities, bonds and currencies.

www.RisePrecision.com
Five Step Approach to the Market
Determine the present position and probable future trend of the market.1
The Wyckoff Method involves a five-step approach to the market selection and trade entry, which can be summarizedas follows:
Is the market consolidating or trending? Does your analysis of market structure, supply and demand indicate the direction that is likely in the near future? This assessment should help you decide whether to be in the market at all and, if so, whether to take long or short positions.
Select currencies in harmony with the trend.2In an uptrend, select stocks that are stronger than the market. For instance, look for stocks that demonstrate greater percentage increases than the market during rallies and smaller decreases during reactions. In a downtrend, do the reverse – choose stocks that are weaker than the market. If you are not sure about a specific issue, drop it and move on to the next one.
Select stocks with a “cause” that equals or exceeds your minimum objective3A critical component of Wyckoff's trade selection and management was his unique method of identifying price targets using Point and Figure (P&F) projections for both long and short trades. In Wyckoff's fundamental law of “Cause and Effect,” the horizontal P&F count within a trading range represents the cause, while the subsequent price movement represents the effect. Therefore, if you are planning to take long positions, choose stocks that are under accumulation or re-accumulation and have built a sufficient cause to satisfy your objective.

www.RisePrecision.com
Determine the stocks' readiness to move.4Apply the nine tests for buying or for selling (described below). For instance, in a trading range after a prolonged rally, does the evidence from the nine selling tests suggest that significant supply is entering the market and that a short position may be warranted? Or in an apparent accumulation trading range, do the nine buying tests indicate that supply has been successfully absorbed, as evidenced further by a low-volume spring and an even lower-volume test of that spring?
Time your commitment with a turn in the stock market index.5Three-quarters or more of individual issues move in harmony with the general market, so you improve the odds of a successful trade by having the power of the overall market behind it. Specific Wyckoff principles help you anticipate potential market turns, including a change of character of price action (such as the largest down-bar on the highest volume after a long uptrend), as well as manifestations of Wyckoff's three laws (see below). Put your stop-loss in place and then trail it, as appropriate, until you close out the position.
Wyckoff advised retail traders to try to play the market game as the Composite Man played it. In fact, he even claimed that it doesn't matter if market moves “are real or artificial; that is, the result of actual buying and selling by the public and bona fide investors or artificial buying and selling by larger operators.”

www.RisePrecision.com
Based on his years of observations of the market activities of large operators, Wyckoff taught that:
Wyckoff Price Cycle
The Composite Man attracts the public to buy a stock in which he has already accumulated a sizeable line of shares by making many transactions involving a large number of shares, in effect advertising his stock by creating the appearance of a “broad market.”
One must study individual stock charts with the purpose of judging the behavior of the stock and the motives of those large operators who dominate it.
With study and practice, one can acquire the ability to interpret the motives behind the action that a chart portrays. Wyckoff and his associates believed that if one could understand the market behavior of the Composite Man, one could identify many trading and investment opportunities early enough to profit from them.
According to Wyckoff, the market can be understood and anticipated through detailed analysis of supply and demand, which can be ascertained from studying price action, volume and time. As a broker, he was in a position to observe the activities of highly successful individuals and groups who dominated specific issues; consequently, he was able to decipher, via the use of what he called vertical (bar) and figure (Point and Figure) charts, the future intentions of those large interests. An idealized schematic of how he conceptualized the large interests' preparation for and execution of bull and bear markets is depicted in the figure below. The time to enter long orders is towards the end of the preparation for a price markup or bull market (accumulation of large lines of stock), while the time to initiate short positions is at the end of the preparation for price markdown.

www.RisePrecision.com
Three Wyckoff Laws
The law of supply anddemand determines the
price direction
Wyckoff's chart-based methodology rests on three fundamental “laws” that affect many aspects of analysis. These include determining the market's current and potential future directional bias, selecting the best stocks to trade long or short, identifying the readiness of a stock to leave a trading range and projecting price targets in a trend from a stock’s behavior in a trading range. These laws inform the analysis of every chart and the selection of every stock to trade.
This principle is central to Wyckoff's
method of trading and investing. When
demand is greater than supply, prices
rise, and when supply is
greater than demand, prices fall. The
trader/analyst can study the balance
between supply and demand by
comparing price and volume bars over
time. This law is deceptively simple, but
learning to accurately evaluate supply
and demand on bar charts, as well as
understanding the implications of supply
and demand patterns, takes
considerable practice.
1
The law of causeand effect
It helps the trader and investor set price
objectives by gauging the potential
extent of a trend emerging from a
trading range. Wyckoff's “cause” can be
measured by the horizontal point count
in a Point and Figure chart, while the
“effect” is the distance price moves
corresponding to the point count. This
law's operation can be seen as the force
of accumulation or distribution within a
trading range, as well as how this force
works itself out in a subsequent trend or
movement up or down. Point and Figure
chart counts are used to measure a
cause and project the extent of its effect.
2
The law of effort
The law of effort versus result provides an
early warning of a possible change in trend
in the near future. Divergences between
volume and price often signal a change in
the direction of a price trend. For example,
when there are several high-volume (large
effort) but narrow-range price bars after a
substantial rally, with the price failing to make
a new high (little or no result), this suggests
that big interests are unloading shares in
anticipation of a change in trend.
3

www.RisePrecision.com
Analyses of Trading RangesOne objective of the Wyckoff method is to improve market timing when establishing a position in anticipation of a coming move where a favorable reward/risk ratio exists. Trading ranges (TRs) are places where the previous trend (up or down) has been halted and there is relative equilibrium between supply and demand. Institutions and other large professional interests prepare for their next bull (or bear) campaign as they accumulate (or distribute) shares within the TR. In both accumulation and vdistribution TRs, the Composite Man is actively buying and selling - the difference being that, in accumulation, the shares purchased outnumber those sold while, in distribution, the opposite is true. The extent of accumulation or distribution determines the cause that unfolds in the subsequent move out of the TR.
Wyckoff SchematicsA successful Wyckoff analyst must be able to anticipate and correctly judge the direction and magnitude of the move out of a TR. Fortunately, Wyckoff offers time-tested guidelines for identifying and delineating the phases and events within a TR, which, in turn, provide the basis for estimating price targets in the subsequent trend. These concepts are illustrated in the following four schematics; two depicting common variants of accumulation TRs, followed by two examples of distribution TRs.

www.RisePrecision.com
Analyses of Trading Ranges
ACCUMULATIONSCHEMATIC 1
One objective of the Wyckoff method is to improve market timing when establishing a position in anticipation of a coming move where a favorable reward/risk ratio exists. Trading ranges (TRs) are places where the previous trend (up or down) has been halted and there is relative equilibrium between supply and demand. Institutions and other large professional interests prepare for their next bull (or bear) campaign as they accumulate (or distribute) shares within the TR. In both accumulation and vdistribution TRs, the Composite Man is actively buying and selling - the difference being that, in accumulation, the shares purchased outnumber those sold while, in distribution, the opposite is true. The extent of accumulation or distribution determines the cause that unfolds in the subsequent move out of the TR.
PS
SC
AR
ST
ST in Phase B
ChoCH ChoCH
Spring
LPS
BU/LPS
SOS
Test
Phase A Phase B Phase C Phase D Phase E

www.RisePrecision.com
Wyckoff Events
ACCUMULATION
PS—preliminary support , where substantial buying begins to provide pronounced support after a prolonged down-move. Volume increases and price
spread widens, signaling that the down-move may be approaching its end.
SC—selling climax , the point at which widening spread and selling pressure usually climaxes and heavy or panicky selling by the public is being
absorbed by larger professional interests at or near a bottom. Often price will close well off the low in a SC, reflecting the buying by these large interests.
AR—automatic rally , which occurs because intense selling pressure has greatly diminished. A wave of buying easily pushes prices up; this is further
fueled by short covering. The high of this rally will help define the upper boundary of an accumulation TR.
ST—secondary test , in which price revisits the area of the SC to test the supply/demand balance atthese levels. If a bottom is to be confirmed, volume
and price spread should be significantly diminished as the market approaches support in the area of the SC. It is common to have multiple STs after a
SC.
Test— Large operators always test the market for supply throughout a TR (e.g., STs and springs) and at key points during a price advance. If
considerable supply emerges on a test, the market is often not ready to be marked up. A spring is often followed by one or more tests; a successful
test (indicating that further price increases will follow) typically makes a higher low on lesser volume.
SOS—sign of strength , a price advance on increasing spread and relatively higher volume. Often a SOS takes place after a spring, validating the
analyst’s interpretation of that prior action.
LPS—last point of support, the low point of a reaction or pullback after a SOS. Backing up to an LPS means a pullback to support that was formerly
resistance, on diminished spread and volume. On some charts, there may be more than one LPS, despite the ostensibly singular precision of this term.
BU—”back-up”. This term is short-hand for a colorful metaphor coined by Robert Evans, one of the leading teachers of the Wyckoff method from the
1930s to the 1960s. Evans analogized the SOS to a “jump across the creek” of price resistance, and the “back up to the creek” represented both
short-term profit-taking and a test for additional supply around the area of resistance. A back-up is a common structural element preceding a more
substantial price mark-up, and can take on a variety of forms, including a simple pullback or a new TR at a higher level.

www.RisePrecision.com
NOTE:
ACCUMULATION
Springs or shakeouts usually occur late within a TR and allow the stock’s dominant players to make a definitive test of available supply before a markup
campaign unfolds. A “spring” takes price below the low of the TR and then reverses to close within the TR; this action allows large interests to mislead
the public about the future trend direction and to acquire additional shares at bargain prices. A terminal shakeout at the end of an accumulation TR is
like a spring on steroids. Shakeouts may also occur once a price advance has started, with rapid downward movement intended to induce retail traders
and investors in long positions to sell their shares to large operators. However, springs and terminal shakeouts are not required elements: Accumulation
Schematic 1 depicts a spring, while Accumulation Schematic 2 shows a TR without a spring

www.RisePrecision.com
Analyses of Trading Ranges
ACCUMULATIONSCHEMATIC 2
PS
SC
AR
ST
ST in Phase B
ChoCH ChoCH
LPS
BU/LPS
SOS
LPS
Phase A Phase B Phase C Phase D Phase E

www.RisePrecision.com
Wyckoff Phases
ACCUMULATION
Phase A: Phase A marks the stopping of the prior downtrend. Up to this point, supply has been dominant. The approaching diminution of supply is
evidenced in preliminary support (PS) and a selling climax (SC). These events are often very obvious on bar charts, where widening spread and heavy
volume depict the transfer of huge numbers of shares from the public to large professional interests. Once these intense selling pressures have been
relieved, an automatic rally (AR), consisting of both institutional demand for shares as well as short-covering, typically ensues. A successful secondary
test (ST) in the area of the SC will show less selling than previously and a narrowing of spread and decreased volume, generally stopping at or above
the same price level as the SC. If the ST goes lower than that of the SC, one can anticipate either new lows or prolonged consolidation. The lows of the
SC and the ST and the high of the AR set the boundaries of the TR. Horizontal lines may be drawn to help focus attention on market behavior, as seen
in the two Accumulation Schematics above.
Sometimes the downtrend may end less dramatically, without climactic price and volume action. In general, however, it is preferable to see the PS, SC,
AR and ST, as these provide not only a more distinct charting landscape but a clear indication that large operators have definitively initiated
accumulation.
In a re-accumulation TR (which occurs during a longer-term uptrend), the points representing PS, SC and ST are not evident in Phase A. Rather, in such
cases, Phase A resembles that more typically seen in distribution (see below). Phases B-E generally have a shorter duration and smaller amplitude
than, but are ultimately similar to, those in the primary accumulation base.
Phase B: In Wyckoffian analysis, Phase B serves the function of “building a cause” for a new uptrend (see Wyckoff Law #2 – “Cause and Effect”). In
Phase B, institutions and large professional interests are accumulating relatively low-priced inventory in anticipation of the next markup. The process of
institutional accumulation may take a long time (sometimes a year or more) and involves purchasing shares at lower prices and checking advances in
price with short sales. There are usually multiple STs during Phase B, as well as upthrust-type actions at the upper end of the TR. Overall, the large
interests are net buyers of shares as the TR evolves, with the goal of acquiring as much of the remaining floating supply as possible. Institutional buying
and selling imparts the characteristic up-and-down price action of the trading range.Early on in Phase B, the price swings tend to be wide and
accompanied by high volume. As the professionals absorb the supply, however, the volume on downswings within the TR tends to diminish.
When it appears that supply is likely to have been exhausted, the instrument is ready for Phase C.

www.RisePrecision.com
Wyckoff Phases
ACCUMULATION
Phase C:It is in Phase C that the instrument price goes through a decisive test of the remaining supply, allowing the “smart money” operators to
ascertain whether the stock is ready to be marked up. As noted above, a spring is a price move below the support level of the TR (established in Phases
A and B) that quickly reverses and moves back into the TR. It is an example of a bear trap because the drop below support appears to signal
resumption of the downtrend. In reality, though, this marks the beginning of a new uptrend, trapping the late sellers (bears). In Wyckoff's method, a
successful test of supply represented by a spring (or a shakeout) provides a high-probability trading opportunity. A low-volume spring (or a low-volume
test of a shakeout) indicates that the stock is likely to be ready to move up, so this is a good time to initiate at least a partial long position.The
appearance of a SOS shortly after a spring or shakeout validates the analysis. As noted in Accumulation Schematic #2, however, the testing of supply
can occur higher up in the TR without a spring or shakeout; when this occurs, the identification of Phase C can be challenging.
Phase D: If we are correct in our analysis, what should follow is the consistent dominance of demand over supply. This is evidenced by a pattern of
advances (SOSs) on widening price spreads and increasing volume, as well as reactions (LPSs) on smaller spreads and diminished volumes. During
Phase D, the price will move at least to the top of the TR. LPSs in this phase are generally excellent places to initiate or add to profitable long positions.
Phase E: In Phase E, the instrument leaves the TR, demand is in full control and the markup is obvious to everyone. Setbacks, such as shakeouts and
more typical reactions, are usually short-lived. New, higher-level TRs comprising both profit-taking and acquisition of additional shares
(“re-accumulation”) by large operators can occur at any point in Phase E. These TRs are sometimes called “stepping stones” on the way to even higher
price targets.

www.RisePrecision.com
Analyses of Trading Ranges
DISTRIBUTIONSCHEMATIC 1
AR
BC
PSY
ST
UTUTAD
Test
SOW
LPSY
LPSY
SOW in Phase B
ChoCH
Phase A Phase B Phase C Phase D Phase E
ChoCH

www.RisePrecision.com
Wyckoff Events
ACCUMULATION
PSY—preliminary supply, where large interests begin to unload shares in quantity after a pronounced up-move. Volume expands and price spread
widens, signaling that a change in trend may be approaching.
BC—buying climax, during which there are often marked increases in volume and price spread. The force of buying reaches a climax, with heavy or
urgent buying by the public being filled by professional interests at prices near a top. A BC often coincides with a great earnings report or other good
news, since the large operators require huge demand from the public to sell their shares without depressing the stock price.
AR—automatic reaction. With intense buying substantially diminished after the BC and heavy supply continuing, an AR takes place. The low of this
selloff helps define the lower boundary of the distribution TR.
ST—secondary test, in which price revisits the area of the BC to test the demand/supply balance at these price levels. For a top to be confirmed, supply
must outweigh demand; volume and spread should thus decrease as price approaches the resistance area of the BC. An ST may take the form of an
upthrust (UT), in which price moves above the resistance represented by the BC and possibly other STs before quickly reversing to close below
resistance. After a UT, price often tests the lower boundary of the TR.
SOW—sign of weakness, observable as a down-move to (or slightly past) the lower boundary of the TR, usually occurring on increased spread and
volume. The AR and the initial SOW(s) indicate a change of character in the price action of the stock: supply is now dominant.
LPSY—last point of supply. After testing support on a SOW, a feeble rally on narrow spread shows that the market is having considerable difficulty
advancing. This inability to rally may be due to weak demand, substantial supply or both. LPSYs represent exhaustion of demand and the last waves
of large operators’ distribution before markdown begins in earnest.
UTAD—upthrust after distribution.A UTAD is the distributional counterpart to the spring and terminal shakeout in the accumulation TR. It occurs in the
latter stages of the TR and provides a definitive test of new demand after a breakout above TR resistance. Analogous to springs and shakeouts, a UTAD
is not a required structural element: the TR in Distribution Schematic #1 contains a UTAD, while the TR in Distribution Schematic #2 does not.

www.RisePrecision.com
Analyses of Trading Ranges
DISTRIBUTIONSCHEMATIC 2
AR
BC
PSY
ST
UT in Phase B
LPSY
SOW
LPSY
LPSY
SOW in Phase B
ChoCH
Phase A Phase B Phase C Phase D Phase E
ChoCH

www.RisePrecision.com
Wyckoff Phases
ACCUMULATION
Phase A: Phase A in a distribution TR marks the stopping of the prior uptrend. Up to this point, demand has been dominant and the first significant
evidence of supply entering the market is provided by preliminary supply (PSY) and the buying climax (BC). These events are usually followed by an
automatic reaction (AR) and a secondary test (ST) of the BC, often upon diminished volume. However, the uptrend may also terminate without climactic
action, instead demonstrating exhaustion of demand with decreasing spread and volume; less upward progress is made on each rally before
significant supply emerges. In a redistribution TR within a larger downtrend, Phase A may look more like the start of an accumulationTR (e.g., with
climactic price and volume action to the downside). However, Phases B through E of a re-distribution TR can be analyzed in a similar manner to the
distribution TR at the market top
Phase B: The function of Phase B is to build a cause in preparation for a new downtrend. During this time, institutions and large professional interests
are disposing of their long inventory and initiating short positions in anticipation of the next markdown. The points about Phase B in distribution are
similar to those made for Phase B in accumulation, except that the large interests are net sellers of shares as the TR evolves, with the goal of exhausting
as much of the remaining demand as possible. This process leaves clues that the supply/demand balance has tilted toward supply instead of demand.
For instance, SOWs are usually accompanied by significantly increased spread and volume to the downside.
Phase C: In distribution, Phase C may reveal itself via an upthrust (UT) or UTAD. As noted above, a UT is the opposite of a spring. It is a price move
above TR resistance that quickly reverses and closes in the TR. This is a test of the remaining demand. It is also a bull trap—it appears to signal the
resumption of the uptrend but in reality is intended to “wrong-foot” uninformed break-out traders. A UT or UTAD allows large interests to mislead the
public about the future trend direction and, subsequently, sell additional shares at elevated prices to such break-out traders and investors before the
markdown begins. In addition, a UTAD may induce smaller traders in short positions to cover and surrender their shares to the larger interests who have
engineered this move. Aggressive traders may wish to initiate short positions after a UT or UTAD. The risk/reward ratio is often quite favorable. However,
the “smart money” repeatedly stops out traders who initiate such short positions with one UT after another, so it is often safer to wait until Phase D and
an LPSY. Often demand is so weak in a distribution TR that price does not reach the level of the BC or initial ST. In this case, Phase C's test of demand
may be represented by a UT of a lower high within the TR.

www.RisePrecision.com
Wyckoff Phases
ACCUMULATION
Phase D: Phase D ar rives after the tests in Phase C show us the last gasps of demand. During Phase D, price travels to or through TR support. The
evidence that supply is clearly dominant increases either with a clear break of support or with a decline below the mid-point of the TR after a UT or
UTAD. There are often multiple weak rallies within Phase D; these LPSYs represent excellent opportunities to initiate or add to profitable short positions.
Anyone still in a long position during Phase D is asking for trouble.
Phase E: Phase E depicts the unfolding of the downtrend; the stock leaves the TR and supply is in control. Once TR support is broken on a major SOW,
this breakdown is often tested with a rally that fails at or near support. This also represents a high-probability opportunity to sell short. Subsequent rallies
during the markdown are usually feeble. Traders who have taken short positions can trail their stops as price declines. After a significant down-move,
climactic action may signal the beginning of a re-distribution TR or of accumulation.
RESUMEThe pioneering work of Richard D. Wyckoff in the early twentieth century was centered around the realization that instruments price trends were driven
primarily by institutional and other large operators who manipulate prices in their favor. Many professional traders today use Wyckoff's method, but his
overall approach is still not widely-followed among retail traders, even though his educational efforts were intended to teach the public the “real rules
of the game.” Nonetheless, his stock selection and investment methodology has stood the test of time, largely due to its thorough, systematized and
logical structure for identifying high-probability and highly profitable trades. The discipline involved in this approach allows the investor to make
informed trading decisions unclouded by emotion. Using Wyckoff's method, one can invest in any instrument by capitalizing on the intentions of the
large “smart money” interests, rather than being caught on the wrong side of the market. Attaining proficiency in Wyckoff analysis requires considerable
practice, but is well worth the effort.
Disclaimer: Much of this article was originally written by the Wyckoff Analytics team for the ChartSchool at www.stockcharts.com. This material is reproduced here with the express permission of
StockCharts.com.

www.RisePrecision.com
CHEAT SHEETS
CHANGE OF CHARACTER (ChoCH)
When does a trend change into consolidations?How can we observe this change in enviroment?
“The Creation of a Trend”
PS
SC
AR
ST
ST in Phase B
ChoCH ChoCH
Spring
LPS
BU/LPS
SOS
Test
Phase A Phase B Phase C Phase D Phase E
AR
BC
PSY
ST
UTUTAD
Test
SOW
LPSY
LPSY
SOW in Phase B
ChoCH
Phase A Phase B Phase C Phase D Phase E
ChoCH
Non-trending enviroment Non-trending enviromentTrending enviroment Trending enviroment

www.RisePrecision.com
CHEAT SHEETS
Distinction: Identify your trading opportunity within the price cycle
Who are you as a trader? Investor, swing trader or day trader?
Based on your time frame, you need to identify your tradingopportunities within the current wave structure.
One of the best trading opportunities is to open a position in theoriginal accumulation trading range or in a reaccumulation TR
Original Accumulation TR
Reacumulation TR
Current TR

www.RisePrecision.com
CHEAT SHEETSDistinction: Reaccumulation TR and its characteristics
Alternative labeling of Wyckoff Reaccumulation TRs and examples:
Reaccumulation after decline
- Reaccumulation is a trading range within a continuing uptrend
- Four+ types of Reaccumulation TRs: Reaccumulation after a decline, Reaccumulation with Spring action, Reaccumulation after a shakeout, and Reaccumulation with an uprising structure.
- Reaccumulation with an uprise is the strongest and has higher highs / higher lows
- Usually, any shakeout and/or decline action before Reaccumulation will have a local smaller distribution pattern (cause and effect)
- Initial Shakeout/Decline is less pronounced during Reaccumulation than before Accumulation
- Volume: Reccumulation usually has less supply than Accumulation
-The maximum swing of TR (highest to lowest point): Reaccumulation TR is usually tighter compared with an Accumulation TR
- Weakest among reaccumulation types
- Decline usually starts from a small local
distribution pattern
- It can have different variations of
the TR (see the structure of the
next 3 formations)
Reaccumulation with Spring action
- Flat or sloping down formation
- It can potentially have a few lower lows with
a spring being the lowest point of the TR
- Leading stocks can exhibit shortterm
weakness after strength in this formation
Reaccumulation after shakeout
-Absorption of supply happens in the TR
without violation of support
- Usually and depending on a position of the
market, this pattern exhibits strength
Reaccumulation with uprise
- Strongest among reaccumulation types
-This structure will exhibit higher highs /
higher lows
- Sometimes can be confused with a topping
TR
PSY
PSY PSY PSY
AR
AR
AR
Resistance
ST
Local SC
Shakeout ST Area Shakeout ST Area Shakeout
ST Area
Creek CreekLPS
SoS
LPS
SoS
LPS
LPS
LPS
LPS
SoS
SoSSoS
LPS
SoS
Jump across the creek Jump across the creek
Jump across the creek
Spring
ResistanceAR Resistance AR Resistance
ST Area
Creek LPS
Sos
SoS
LPS
Support
Jump across the creek
BC
BC BC BC
www.RisePrecision.com
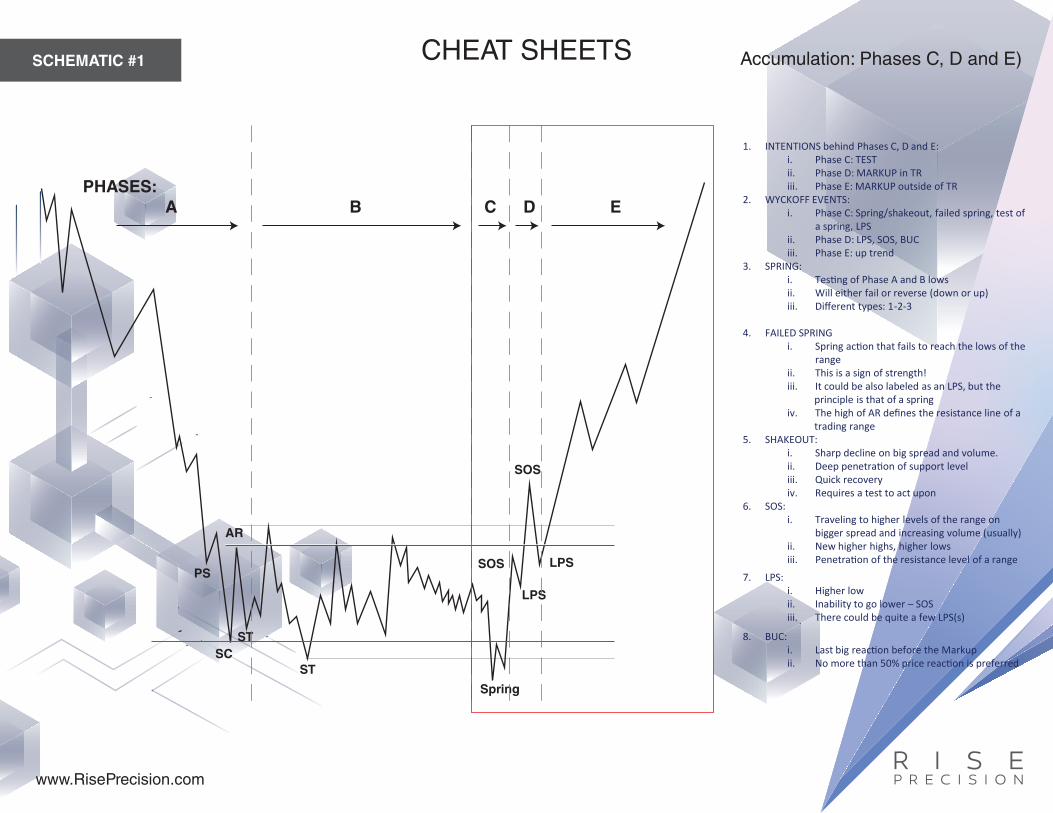
CHEAT SHEETS Accumulation: Phases C, D and E)SCHEMATIC #1
PS
PHASES:A B C D E
SC
AR
ST
ST
Spring
LPS
LPS
SOS
SOS
1. INTENTIONS behind Phases C, D and E:i. Phase C: TESTii. Phase D: MARKUP in TRiii. Phase E: MARKUP outside of TR
2. WYCKOFF EVENTS:i. Phase C: Spring/shakeout, failed spring, test of
a spring, LPSii. Phase D: LPS, SOS, BUCiii. Phase E: up trend
3. SPRING:i. Tes�ng of Phase A and B lowsii. Will either fail or reverse (down or up)iii. Different types: 1-2-3
4. FAILED SPRINGi. Spring ac�on that fails to reach the lows of the
rangeii. This is a sign of strength!iii. It could be also labeled as an LPS, but the
principle is that of a springiv. The high of AR defines the resistance line of a
trading range5. SHAKEOUT:
i. Sharp decline on big spread and volume.ii. Deep penetra�on of support leveliii. Quick recoveryiv. Requires a test to act upon
6. SOS: i. Traveling to higher levels of the range on
bigger spread and increasing volume (usually)ii. New higher highs, higher lowsiii. Penetra�on of the resistance level of a range
7. LPS: i. Higher low
Inability to go lowerii. – SOSiii. There could be quite a few LPS(s)
8. BUC: i. Last big reac�on before the Markupii. No more than 50% price reac�on is preferred
www.RisePrecision.com
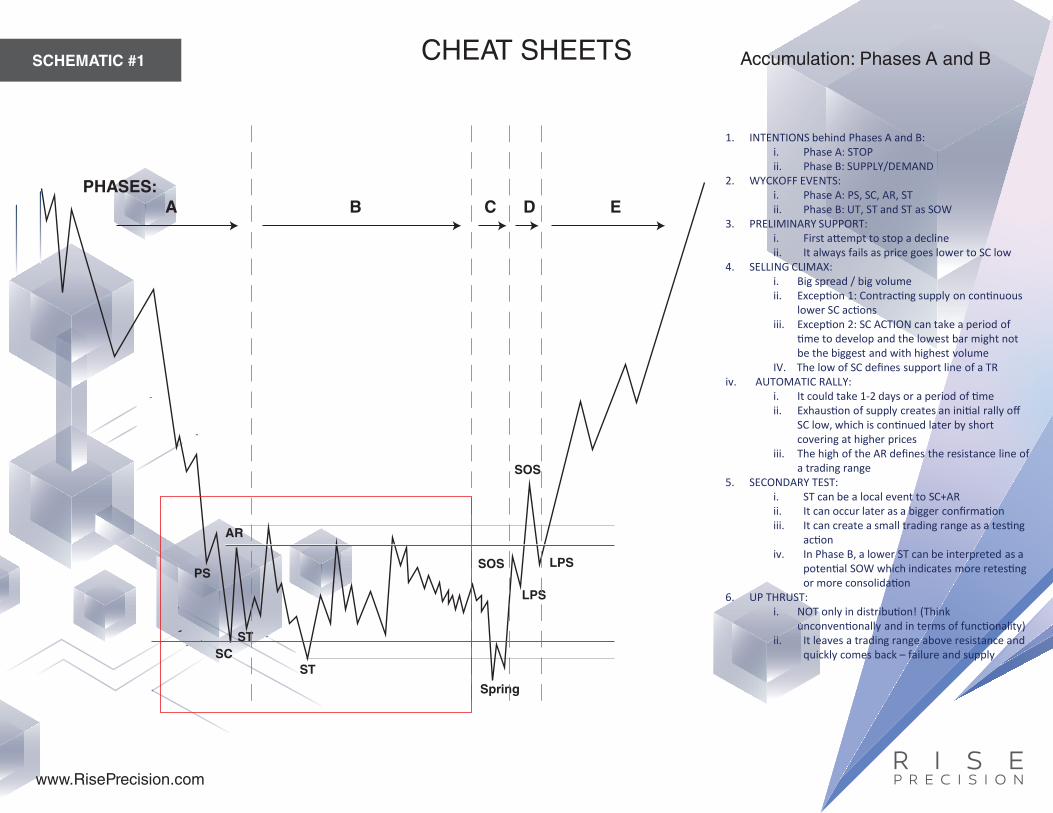
CHEAT SHEETS Accumulation: Phases A and BSCHEMATIC #1
PS
PHASES:A B C D E
SC
AR
ST
ST
Spring
LPS
LPS
SOS
SOS
1. INTENTIONS behind Phases A and B:i. Phase A: STOPii. Phase B: SUPPLY/DEMAND
2. WYCKOFF EVENTS:i. Phase A: PS, SC, AR, STii. Phase B: UT, ST and ST as SOW
3. PRELIMINARY SUPPORT:i. First a�empt to stop a declineii. It always fails as price goes lower to SC low
4. SELLING CLIMAX:i. Big spread / big volumeii. Excep�on 1: Contrac�ng supply on con�nuous
lower SC ac�onsiii. Excep�on 2: SC ACTION can take a period of
�me to develop and the lowest bar might not be the biggest and with highest volume
IV. The low of SC defines support line of a TRiv. AUTOMATIC RALLY:
i. It could take 1-2 days or a period of �meii. Exhaus�on of supply creates an ini�al rally off
SC low, which is con�nued later by short covering at higher prices
iii. The high of the AR defines the resistance line of a trading range
5. SECONDARY TEST:i. ST can be a local event to SC+ARii. It can occur later as a bigger confirma�on iii. It can create a small trading range as a tes�ng
ac�oniv. In Phase B, a lower ST can be interpreted as a
poten�al SOW which indicates more retes�ng or more consolida�on
6. UP THRUST: i. NOT only in distribu�on! (Think
unconven�onally and in terms of func�onality)ii. It leaves a trading range above resistance and
quickly comes back – failure and supply

www.RisePrecision.com
CHEAT SHEETS Distribution: Phases A and BSCHEMATIC #2
PHASES:
A B C D E1. INTENTIONS behind Phases A and B:
i. Phase A: STOPii. Phase B: SUPPLY/DEMAND
2. WYCKOFF EVENTS:i. Phase A: PSY, BC, AR, STii. Phase B: UT and SOW
3. PRELIMINARY SUPPLY:i. First a�empt to stop an advanceii. It always fails as price goes higher to BC high
4. BUYING CLIMAX:i. Big spread / big volumeii. Excep�on1: Series of consecu�ve up bars, but
not necessarily on big spread and higher volumeiii. Some�mes BC ac�on is more visible on higher
�me frame (Daily-Weekly-Monthly)iv. The high of BC defines resistance line of a
trading rangeiv. AUTOMATIC REACTION:
i. It could take 1-2 days or a period of �meii. Exhaus�on of demand creates an ini�al decline
off BC highiii. which is con�nued later by covering of long
posi�ons at lower pricesiv. The low of AR defines the support line of a
trading range5. SECONDARY TEST:
i. ST can be a local event to SC+ARii. and can occur later as a bigger confirma�on iii. It can create a small trading range as a tes�ng
ac�on6. UP THRUST:
i. It leaves a trading range above resistance and quickly comes back – failure and supply
7. MINOR SOW: i. Indica�on of poten�al supplyii. Possible retest of lows in the future
PSY
BC
AR
ST
UT as ST
LPSY
SOW
MSOW
LPSY

www.RisePrecision.com
CHEAT SHEETS Distribution: Phases C, D and ESCHEMATIC #2
PHASES:
A B C D E
PSY
BC
AR
ST
UT as ST
LPSY
SOW
MSOW
LPSY
1. INTENTIONS behind Phases C, D and E:i. Phase C: TESTii. Phase D: MARKDOWN in TRiii. Phase E: MARKDOWN outside of TR
2. WYCKOFF POINTS:i. Phase C: UTAD, Failed UT, test of UTAD, high
LPSYii. Phase D: LPSY, MSOWiii. Phase E: downtrend
3. UPTHRUST AFTER DISTRIBUTION:i. Test of the upper boundaries of a rangeii. Price travels out of the range and can stay
there for some �meiii. Draws a lot of public following
4. Test of UTAD:i. Failed rally a�er UTADii. It looks like a healthy pause in a rally, but fails
right a�erwards5. Failed UT (Roman):
i. Upthrust ac�on with an inten�on to create UTAD
ii. Always fails to advance above the higher range point – SOW
iii. It can have a test as UTADiv. It can be also labeled as high LPSY
7. MAJOR SOW: i. One of the characteris�cs for high probability
Wyckoff setupii. It can be iden�fied by increasing volume,
spread, velocity and price penetra�oniii. Usually will produce a new lower lowiv. It could be a second, third or fourth a�empt to
break the ice and it is the most successful one
8. LPSY: i. Failed rally and lower highii. Lower volume and decreasing spreadiii. It can occur at different levels in a range
signifying strength or weakness