WORT NO - ERIC
357
W079 446 AUTHOR TITLE OtTiTuTioN =sPoNs AGENCY WORT NO DATE NOTE A RS PRICE 15-EdiliP±OfzS STRACT DOCUMENT RESUME VOgler, William H.-; -And Others 1970-71 Evaluation Report Of ESEA CityEduCatiOn Project. San Diego Unified 801i0o, District, Bureau of EieMentaty. and Secondary (DHEW/OE) , Washi ngton, -D.C.. SDUSD-R-110 1_10-44 71 354p. MF-$0.65 0d:7,113416 Bilingual Education; Career Planning; *Community In#01VeMeht;_ _ComMOnity:40i0t.00illikoit4 Disadvantaged Youth; 4-644* ,13#444s; Inner Junior High Minority 00401 *parent Participation; School Pk0#44W0044.017$44,c49,01.!-'041:01.4.44J- coPPeka0101i;17=*a1100iit0:140u4it-04004001-00tEdii **4t-i0Oli"SeJfk:#44-140:11W _ UD 013. 675 (title III) Innet Calif: Education In this Naidatibk_tepOrti, -C-OKSTOOkabie analysis is. ,,,-- devoted to the definition_ of prOgtabi_:_de*-0_4#1:0-A,A4 each of the th-46-6 y4at of funding, as well as an evàluatioii Of third year -objectives Emphases include P:TOiedt_hiStary prior to 100,-7i and lantext _definition -project inpOtS*1-iSdaIand staff resources, and terminal product -evaluations_ of the 1976-111444 funding year. ;-_.4efiAts of -.r-Minai.etiaidation indicate O44 the Inner -City Project Staff, by te end of the second feat. had increased Oakentschool7dOMmullity intetaCtiOn_aohaa_:0-ippiaiaJiiaa_ district ,services in educational areasfound .deficient for adequate Inner City pupil .instruction and guidahce;__ the_Oiaa,7y-a# Inner City Project was instrumental in SuStainin4,:hi0 =-pupil-school-community -icooperation during the-r1_91001= year; (3) A#Ojedt:eff4tS _blade positive changes in parent involvement, English acquisition by pupils -whose native lailguage-mas-JSpahISh-,,-unekduSed-abS6fideki, health: absences, and teacher empathy toward ttOlz, 444,_ (4) project 1- criterion levels fell short of expectations in the areas of secondary - T inekdused absences,-_ health abseildeS- and reading and mathematics achievement. .Conclusions and recommendations for the San Diego city- Schools and other School Districts are pi-waded, as well as appendices. - _ (Author/SB) . V
-
Upload
khangminh22 -
Category
Documents
-
view
0 -
download
0
Transcript of WORT NO - ERIC

W079 446
AUTHORTITLE
OtTiTuTioN=sPoNs AGENCY
WORT NODATE
NOTEA
RS PRICE15-EdiliP±OfzS
STRACT
DOCUMENT RESUME
VOgler, William H.-; -And Others1970-71 Evaluation Report Of ESEACityEduCatiOn Project.San Diego Unified 801i0o, District,Bureau of EieMentaty. and Secondary(DHEW/OE) , Washi ngton, -D.C..SDUSD-R-1101_10-44 71
354p.
MF-$0.65 0d:7,113416Bilingual Education; Career Planning; *CommunityIn#01VeMeht;_ _ComMOnity:40i0t.00illikoit4Disadvantaged Youth; 4-644* ,13#444s; InnerJunior HighMinority 00401 *parent Participation; School
Pk0#44W0044.017$44,c49,01.!-'041:01.4.44J-coPPeka0101i;17=*a1100iit0:140u4it-04004001-00tEdii**4t-i0Oli"SeJfk:#44-140:11W
_ UD 013. 675
(title III) Innet
Calif:Education
In this Naidatibk_tepOrti, -C-OKSTOOkabie analysis is.,,,--devoted to the definition_ of prOgtabi_:_de*-0_4#1:0-A,A4 each of the th-46-6
y4at of funding, as well as an evàluatioii Of third year -objectivesEmphases include P:TOiedt_hiStary prior to 100,-7i and
lantext _definition -project inpOtS*1-iSdaIand staff resources, andterminal product -evaluations_ of the 1976-111444 funding year.
;-_.4efiAts of -.r-Minai.etiaidation indicate O44 the Inner -CityProject Staff, by te end of the second feat. had increasedOakentschool7dOMmullity intetaCtiOn_aohaa_:0-ippiaiaJiiaa_ district,services in educational areasfound .deficient for adequate Inner City
pupil .instruction and guidahce;__ the_Oiaa,7y-a# Inner City Projectwas instrumental in SuStainin4,:hi0 =-pupil-school-community
-icooperation during the-r1_91001= year; (3) A#Ojedt:eff4tS _bladepositive changes in parent involvement, English acquisition by pupils
-whose native lailguage-mas-JSpahISh-,,-unekduSed-abS6fideki, health:absences, and teacher empathy toward ttOlz, 444,_ (4) project
1-criterion levels fell short of expectations in the areas of secondary
- T inekdused absences,-_ health abseildeS- and reading and mathematicsachievement. .Conclusions and recommendations for the San Diego city-
Schools and other School Districts are pi-waded, as well asappendices. -
_
(Author/SB)
.V

1910,11
EVALUATIONIEPIORT -OF-
ESE (TIW,
INNER ty
San Diego-Unified,Schoor DistrictSan Diego, California
U.S. DEPARTMENT OF HEALTH,eoucATION-S.WELFARENATIONAL INSTITUTE OF
EDUCATION-TINS DOCUMENT HAS SEEN, rtrOitoOUCED_EXACTLY AS- RECEIVED FROM
,..- -..THE PERSON OR ORGANIZATION ORIGINATING IT POINTS OF VIEW OR OPINIONSSTATED DO NOT-NECESSARILY' REPRE-SENT OFFICIAL NATiONAL INSTITUTE OFEDUCATION POSITION OR POLICY_
Testing and Evaluation Services DepartmentESEA,EvaluationA:Ugust 1, 1971RSiiiirt No. 110

SUMMARY
The following is an evaluation report of-the 1970,671 Inner City
EdUcation Project of the San Diego -City sehohlo funded under Title III
of the EleMentary and Secondary Eftdation Act of 1965 (PL89 -lo).
Considerable analysis is devoted to the definitidn-of program-development
in eadh'of the three years of funding, as well as-an evaluation Of-thii'd
yearobjectilint_attaintrent. Emphasis_ includes project history prior to
1970-71 and context definitions-project_ inpUts, fiscal and ataffreaources,
and terminal product evaluation -of the 1970 -71 (-final):- funding-year.
Results of terminal nfalUation-Indiditte- that
-..
(1) The 40k;0141*** t nif04--oj 6,andon fU.....nding-
Ye*i 414:0614401-'boii(der4,e-e10nd-J4P__
'two *4==Such-were= -40idienne --inht4ac 66 4doMmunit er-___ . ____4-idtion4Arid--tb)--iii_nt PI#Men stridt7,8erviden educationalareas- instruction=___. , _
`Inner'_ -
Andt1444hheii
(2) The -threat:Year Irdier'-OitY,Priddie0--iiiiiii_inntrUMn/41__In_.43404-irridit_
high p4iI=AdhOta=do -----rdoo- ration=rduring:the 1 04.
year. 1W,=-*Menert,_=a0 school ernOndei_-004-emente ,nach,_other /!v-.. -- __ .- ..-_ ,, -__- , eiOdiisir=to01-10-a0=t400040,==Piimen ser*Iten:-. o._,- - _ _ _
youngsters. pLitheht- -** an entOTIOrkeddloneritogether-thAn-aedOndarYft-tatrAn, parents -f sover dissatisfaction
-. 4 -
ana__naitinaiiiiitailaing:teiiiiiati teacher-=_Eutit--dOliftitY
rePretentatiVea were= -at a- low level -by the ends of the,'-19704M:
Schdol yak'.
(3) Project etforts,rhade fovertf_pOSitiiin changes= in parent= involve -__
itenti English _adifininItiOn by-:PMpila--_Whon-C-natiVe "langnage-Wan-
Spaniah,14nekdUned,:abiendo rates =at 'theelikerity- level,-arteadher empathy tollard- tkoli _p4piisi . .
(4) Project criterion levels fnil _ShOrt of expectations in theareas of nedOndary inekddaki-ahiended, health abitendea, andreading and mathematics adhieveient._
Recommendations include thdae given by school personnel and parents
directly involved,in PAC -PAB activities, And-those cited to assist the
San Diego City Schools and other school districts in decision-making
efforts related to the reviewed Project.
i

INNER CITY EDUCATION
DEMONSTRATION PROJECT (ESEA, Title III)
1740rge V. .Hall
Associate Superintendent
'than, W. Houser
OVer=ail DirectorOompodatoty EdtcatiOnProgratd
IfUief -city Project
Testing and EValUation Services DepartmentEvaluation that
William H. VoglerDirector
Michael J. La BayProgram Evaluator
Stuart B. MacnofskyProgram Evaluator
'Barbara L. feinkeEvil' M. CummingsMarcella S. Maton
Cherita NeedhaM
EVaitatibii toordinator-
.5.
ESEA (Title AB=03 and 0E0tolIoil4hroUgh EVAIUAtor
ESEA (Title I) and AM331-EValuator
Adminiatrative AideIntertediate ClerkIntermediate ClerkIntermediate Clerk
iii

TABLE OF CONTENTS
Page,
SUMMARY.,
LIST OF TART-RS xi
=LIST OF FIGURESXxiii
Chapter
1I. PROJECT HISTORY PRIOR TO-1970-71
1968,-69-
IntroductiOn - _
Pupils and Site6 . .. . .4. _- , ._ ...
__
-19_6940 -_. _. -:. - -a- . -I:, :, .-
inttodtIction.-- - .- . _
Pupils and Sites . 4, 44 4 -4 -
,.Project Advisory Beiitie - oo . . . . . - 4 . 4- . .
Parent Advisory Council.- _ .. . . o . o .o -I _ i _a I it a
1
Goals and Adtivitie6 . oo . oo ii 4-4 ii 12
II. DESCRIPTION OF THE 1970 -71 PROJECT .- . ,191
CONTEXT DEFINITION , 19
The Problem 19
Domain Limits o19
Pupils and Sites 19
Community '22
Supplies 41
Needs AsSessment 41
Learner Needd 41
Parent Needs 44
COmmunity Needs. . 44

Page
PROJECT INPUTS 45
Goals andObjectiVel 45
Orignal Performance Objectives 45
keirised.Performance-Objectives 47
Evaluation Procedures 48
Resources 59
Teaching Faculty, Paraprofessionals and Resourcee Personnel _ 59
Financial Budgei . o . 4 . . . . . . 62A,
III.. TERMINALFRODUCTI,EVAWATION4 ;'
4 ..... ; . . ; 4 .. 6
-ittift18 -AP' Mtdit8iOtc-- . : ,e i ii- - 4- i ,. i 4, -43 -.1 . _ . ii ii io 63
Objective one. . _._ ; . _. _. 44 .- - . i_ii, 4- 63=
Objective two .. a .. ; 76
Objective three- . 4
objeCtiVe tear -97
ObjeCtivetiVe ; ; _ .4 4. 4 c 4
Objective seven .... .. _ 4 4_ 4 Ild
IV. CONCLUSIONS AND RECOMMENDATIONS- 162
Concludiont 162
-Recommendations- 164
For the San Diego city SchoOls 164
For Other School Didtriots 165
V. APPENDICES 167
A. Summary of Special PrograMs,i_Sitiiiteb, Personnel, Mater-ials and Equipment in Inner City Project Schools During1968-69 and 1969-70 School Mara 167
B. Descriptive Summary of Elementary ESL Evaluation,Instruments Circulars and- Questionnaire Results 199
C. Summary of the Social-Emotional Climate Index Clabsi-
fidatiOns by John Withall, Ph. P. 219

D. Specimen Copy, Inner City Prok,lt Newsletter
(June, 1971)
Page
223
E. Sample Information Packet used bY PAC in-Fl ads
Allocation 228
F. 1970-71 Inner City Process Evaluation Questionnaire 233
G. Letters. of Introduction used-in SecUring Information
from Site Personnel 244
H. Job Orientation and/Or Training Sessions for Para-
profesSiOnals by School, as given -by the-Site
Principal 255
I. Definition of Special Programs; Services, --Personnel,
Materials and t4UiPlient'im.Inner-City Proje4-Sohools
from-i9althroUgh:1911:-. a-4_ *, -*- -=257
J. End=i5f=tear QUeStiOnnaireSAthd-interVieW=Ueations. 274-
vii

LIST OF TABLES
Table Page
1. Listifig of Activities Conducted DUring The 1968-69School Year. If OOOOOOOOOOOOOOOO 8
2. Enrichment and Auxiliary Services Provided-by the1968769 Inner City ProjeOt
9
3. Enrollment and Ethnic Percents for 1969 -70 Inner citySchools OOOOOOO _ 11
4. Ehrollment and Ethnic PercentS for inner City SohOole(1969- 1971)-
5. District Pupil Ethnic Dititributiont, PretObbol Through-Grade 12, 1965 =1970 . OO OO - -- =Ai it-
-6. Aid for Dependent Children _(AFDC) .EleMa:entry-:Fhpil, Count
a- a: -;- - :4_ `a-
7. Juirehiler-Arteriti31. C*1Mesas =.Darin the Interval November -i976---throhgh_4anUary, 1971._ . .0 OOOO :-_-: OOOO 40
20
Eleientary-Scheel Parent-AdVidOrY,COUnCil_and-ihner-City-PrOject IndtrUctionalElhipMent4Mitei.from September; 1970-te-MaY, 1973.= _ di- . OO 4
9. Secondary School- Parent AdvisOry-Coundii, and Inner -City Projett7-7,'InatrUdtional EqUipment/Miteriaii=EXpendithreSfrumSepteMber,-1970-to-May,-1.971 43
10. Log of Goal- Activity Definition 49
1l. Testing schedule for 1970-71 Inner-,City-Project
-12, Paraprofessional Staff Funded Under the 1970-71 Inner CityProject O 000000 000 . 00000 00000 60
13. Number of PAC and PAB Members in Attendance at 1969-70 and1970..71 PAC and PAB Meetings-- 64
14. Lbcal Newspaper Coverage of Inner City Activities froMSeptember, 1968 through -May, 1971 66
15. Necessity of Parent InvolVehent for SucCessful Instructionof Inner City Youngsters, AS PerceiVed by Inner CityClassroom Teachers. 000 oo _ , . . 0000000000 67
16. Worth of Parent InVolvement for Defining the Teacher's Rolein the SChools,,EIS Perceived by Inner City ClatarootTeaChers ,
67
58
viii

Table Page
17. Extent of School-Parent-Community Involvement During the
1970-71 School Year (compared to 196748), as Perceived
by riementary School Personnel 68'
18. Extent of School-Parent-Coimunity Involvement During the1970-71 School Year (compared to 1967 -68), as Perceived
by Secondary School Perionnel - ; 69-
19. Inner City ProjeCt Need Priorities, as Perceived by- 1970-71Parent_AdVitiory Board_Nibere (November, 1970)_ 4, ... . 72
20. Degree of Satisfaction Expressed -by Parents of Elementary
Pupils Attending Inner City SohOole in-A.104_1971, AsMeasured by U.S. MAil-Q0ettionnaire_Reihrno ._-:- . :.. . . . 73
21. Degree Of SatiSfactionfExpredsedV--Pirente-Of sOmidoy--Pupils Attending in 3.9 -="0:
Measured by U S _- Mail-,Questionnaire> ; e iiiii.:--- . -.. -6. - . 74
22. DeScriptionof,I.0051.46r0Ohnelteh00 iriCtiOn0During th97641:;SOI601 fear arcev -eitity:Classroom -teiChiiiii ._ ii -6- Ai 4:4 .. - ___ -4 E'r, - i 75
23. English as a Second- Language_CO,YHOOTest Scores-frokInfter,City -ESL Classes_;_ NoOeMberi, 1970-And juhef
24. One Year-LOngitUdinal Analysis oritsL-Pugi Englishand Langhage tkills,AcquieitiOkin Inner-=Citi-PrOjectSchools, kb- Defined aby- `Their -RespettilieTeatherti: -_ 79=
25. Grade Point Averages Of SecondarY PuOild,in-SOCisOtUdieg,MatheMatics, and Science dant* it-Inner City and = District
minus Inner City Clasnroome for-the Seeond HoleSter, 1971. 80
26. Effects -of -the 1970-71:0L /Bilingual Progrimuon;PuPil i hub)
and Achievement, as.PerceivedI4vgiemehteryahOOLPt anel
in Inner City Schools. 4 82
27. Comparison of Counseling Ratios, Selected Large SchoOlSystems in the U.S. 84
28. Adequacy of Counseling SerVidenin_Inner City SecondarySchools, as Perceived by School Personnel
29. Perception of Inner City- Project Helpfulness in DefiningEdudational-and-Pertionil-Student1ProbleMo, as Expressed_by Inner City Elementary SohoOl PerbOnhel 88
30. Perception of Inner City Project Helpfulness in DefiningEducational-And Personal Student"PrOblems, Os-EXPreiniedby Inner City Secondary SchOol Personnel 89
31. -1969-70 versus 1970-71 Excuted and UneXcused Absences of
Third, Fourth, Fifth and Sixth Grade Pupils Attending Their
Respective, Schools for Two Contecutive Years 90
ix

Table
32.
33.
34.
35.
36.
37.
38.
39
40.
41.
42.
43.
44.
45.
Page
1969-70 versus 1970-71 Excused and-Unexcused Absences ofGrade 8, 9, 11, and 12 Pupils Attending Their RespectiveSchools for Two Consecutive Years
Longitudinal Survey of Total Excused and'Total UneXcused
Absences of Inner CitrPupilt Attending Their RespectiveSchools for Two Consecutive Years 921:-
Longitudinal Survey of Frequendy.and Percent of Increased(+), Decreased (-) and 4table,(0) Excused and DnexcueedAbsence Rates of Inner City EleisentarY PUpilis-AttendingTheir Respective Schools for Two Consecutive Tear.- 94
Perceived Absence -Rates of EleMentary Pupils Or-1970-71 (cop-pared.to-1969-..70)-,418.Ekpreided by- Inner ElementarySchJol_Personnel_,_ imo-o-w-iyAvAl-41 . 98
.
Extetit_Of _Pupil _Services -ProVided,bt-the210Oor_City-:ProjeCttry Choi*
a a- _ -- - .- - - -c -* _ 99
&tent Of Pupil :Ser-iidet--Provided 'by-the-Inner-City-City
Staff, at PerCeilied by--Inner City Secondary Sahool-
PerSonnel .... ..... 44,4,4voilei4 '4ie-io 4 - 106
DetcriptiVe-SumMary-Of Experience of-inner-City-TeachersInterviiked- 1b2
Worth Of- Parent Involvement in Asaisting Teachers- to Define- -- ,.-
-Pupil-Needt, as Perceived by Inner City-Clamsroom-Teechers 103
Definition of Pupil Attithdet-ToWard SChool, As Perceived byInner.City ClitedrOol Teachers; OA, _0.0 OA, 00000 .40 103
Effectivenesii of Parent Advisory_ Councils, as Perceived byClassroom To-adhere-Frog Ihner City Schools 105
1970-71 Inner City Teacher Talk Data 106
1970-71 Inner City Teacher Ta/k Analysis 107
StatiStical Screen of=1970o71 Cooperative Pr/Mary AchievementTeat Results in Reeding and Mathemitics_for Grade One Pupilsat Burbank Elementary School 113
Statistical Screen of 1970-71 Cooperative Primary AchievementTest Retults in -Reading_and Matheiitics for Grade One Pupilsat Crockett Elementary'SChOol 114
46. Statistical Screen Of 1970-71 Cooperative Primary AchievementTest ReaUlta- in Reading and Mathematics for Grade.One.Pupilsat LoWell Elementary School 115

Table Page
47. Statistical Screen of 1970-71 Cooperative Primary AchievementTeat Results in Reading and Mathematics for Grade One-Pupilsat Sherman Elementary School 116
48. Longitudinal Survwg of Endi.of.--Year Reading and MathematicsAchievement of Second Grad*--Pupils-=_Enr011ed at_-Buitaiik -Schoolfor Two Consecutive Years, as Meatuied by-the-Co OperativePrimary Tests 0 oo 117
49. Longitudinal Survey of End-of-Year :Reading= and: MathetaticaAchievement of Second Grids- PUPiliv'EiirOlied --at 'CrockettSchool for Two- COnsecUtive-Iiiite,_ ad-Meisiured by theCooperative -Primary_ _4- . -4 - - _ .118
-4
50. Longitudinal Survey of Eiid-Of4esit_4Roadittrand=-__ Mathematics-Achievement of ,SecOnit-GrOde=--_-,Pfipile- 011' a 0011- School-for Tigo=tOneetaitiVe,-Yelia, eits-=-Me-iteOr
_ .
Prima* -Tedid.- 4- .; . r._ . 4- 119
ear },Readiai51. Longitudirsal-IStiOey:-OAChievemeist.=of-- SeCoiiSchoOl for O;OOlifieciitiveCooperative -PriteakY-Ttete4
athenatics
Safari As_-:-Meatai a-4- Ai, - - -s- -- 120
52. Longitudinal Survey of Reading AchievementPupils Enrolled' at _Crodkett SchisoleIn 1AchieVementlieet844 4-4 4-*--146 4 4:4
-Or -Grade--aiid-_--Dirfiank=
the Stanford121-_- 411-
53. Longitudinal Survey of =Reading Aohieiteinifixt_O-UThitd -Grade-Pupils -Enrolled atLowell_ SohoOl.-Durint,197041 -and Nuf-bank4roOkatt 'Sdhools-in 1 the,Stanford= AchieVeMent-Teeitti 4- 123
54. Longitudinal Survey of _Reading =A-Chievement `of i_Third Grade
Pupils Enrolled = at Sherman- School DOring -1970=71._ and -Ail-tank-Crockett SChoOla i_ n 19691-70, as Ka by the SteinfOfdAchievement -Testa .125
55. Longitudinal Survey of-Mathematios -AChiefeMent of Third GradePupils Enrolled it Login school During-1970-71 and Thirblink-Crockett SchOolt in 1969-70, as Measured by the StanfordAchievement Tests -- 127
56. Longitudinal Stirifey of Mathematics Achievement Of -Third GradePdpilt Enrolled It Lowell School Duriag 1970-71 and BUrbank-Crockett Sthoolt in 1969 -70, as Neaaured by the StanfordAchievement Teets 129
5 ?. Longitudinal Survey Of Mathematics AchieVement of Third GradePupils Enrolled= at Sherman School During- 1970-71 and Burbank-Crockett Schools in 1969-7p, as Measured by the StanfordAchievement Tests 131
zi

Table
58. Longitudinal Survey of Reading Achievement of Fourth GradePupils Enrolled at Logan School for Wo Consecutive Years,as Measured by the Stanford Achievement Tests 133
59. Longitudinal Survey of Reading Achievement of Poiirth*GradePupils Enrolled at Lowell School fOrTwo*Ceiaiticutive Tears,
as Measured by the Stanford_Achievement-Usts 135
60. Longitudinal Survey of Reading Achievement of Fourth Grade1")upils Enrolled at Sherman- School for Two Consecutive-Years,as Measured by the Stanford-Achievement Tests. ***** 137
61. Longitudinal Survey of Mithematics-Achievellett of FourthGrade Pupils,Enrolled:at Loga*Icheol_forlito-COASecutiveYears, as-MettUred *-the-StinfOr4=Adhletement-Tiati-. 139
62. Longitudinal_SurVeyef-MathelatiCsiAchievelentet-PeurthGrade-Pupils-EarelleCat; Lowell School ;Or-SOZOOniiiiiCutivelute' ke,MeieUrit:Wihi"-- 141
63. LongitUdine/iSuriey -MitheletieivA eVement-,OrrenGrade Pupils oiled at ESherikUiiSchool for TwO Coss.cutiv.Tare, as -Met. rieMent--'Teeta. 143
64. Longitudinal Survey ofitaihelatice Achievement ok-FifthGrade Pupila-Entolled_at-Legen.,=SChool:fer*o_-CenitoUtive
Years, is Meature414 th Sttor SfldCTaSiTeit1. . 4 145
65.- Longitudinal SurVey ofitithesaties AthieVement,of-FifthrGrade_
Pupils Enrolled it ShereenSchti011et-TWO-ConeecutiVe-Years, it MetsUred:by the_Stinferdeind OBS-TeetS., _.
66. Longitudinal. Survey of Methematics-Achisiesmeit of FifthGrade Pupils Enrolled itiLdwill-Seheol:for-__Twei.ConsecUtiveYears, siaMeasured by the Stinfortind CTBS-Tests 147
67. Longitudinal Survey -of ReadingrAchieeeient of FifthGrade Pupils Enrolled it-Logan_Schooltor Two-Consecutivefears, as Measured by the Stanford and CTBS-Titte. 148
68. Longitudinal Survey of Reading Achievement of FifthGrade Pupils Enrolled-at Lowell-School for Two-4ensecutiveYears, as Measured by the Stanford and_CTBS Teets 149
69. Longitudinal Survey of Reeding Achievement of FifthGrade Pupils Enrolled at Sherman Scheel for Two ConsecutiveYears, as Measured by the StinfOrd,end CTBS Tests 150
70. Statistical Screen of 1970-71 ComprohensiVe Tests of BasicSkills Scores in Reading, Language, and MathematicsAchievement for Sixth Grade Pupils Enrolled at LowellSchool for Two Consecutive Years . 151
xii

Page
71._ =Statistical Screen of 1970-71 Comprehensive Tots Of BasicSkills Scores in Reading, -Language,. and Mathematics Achieve-Ment for Sixth Grade Pupils Eifrolled at Logan- School for
._ .. . .. : a 4, . 152Two Consecutive Years.. .
-72.: Statistical Screen of 1970.71 Comprehensive Tests of --BasicSkills Scores in Reading, 'Language, and MiithatatiaS Achieve-ment for Sixth Grade Pupils Enrolled at SheIli-Ian School forTwo ConSecutive Thera- 153
:';'-.e,-;-__=,_-_- '-t;__ .Statistical Screen of Eighth Grade Reading_ Achievement, asMeasured by the CTBS Reading SUbtette_ .. .'_ ._ . _ 154 i
. ,
i;_,_.= s,:--_ _-'74- Statistical Screen of Eighth Grade Reading Achievement, ae. I-
Measured by the -CTBS_ ilathematioS.-SiiittkiiitS. 4 "-. :e .. -.- _. __. . . 155-- .= -. '----
-1
75;,__ ,CTBS, Arithmetic 'CoinpUtation. Current, #etafaatiron. --44iic.,....
Computation_ . _ ,....,4
tion and Desi-i-etle PixicifeilaaAfoirfenibei- .a970 4, - . . i.- .. .- . . . 156 ii
-..dtBs ,: voCabulao_tut-r*ot,_ Retardation iiiia 4'0. iiiiii-taiiifeci-i5pitilege Aptil, 101 4 i -4 4 4-.4-4 _ 4 4 i;:=4 -4 4-4 4 1,7"
CTBS, Reading Comprehension -darkent eRetardation: ReduatiOn- _
and Desired Profile November,: 1970: . . 158
tatistical Screen of ITED -Scoree of Grade IO pila -fOrTWO -COnbecutiVe Year& 4 - 155
179.- Statistical Screen of ITED Scorea of Grade 12 Piipila -forTwo Consecntive Years 160
A

=
LIST OF FIGURES
FigurePage
1. Inner City Attendance Area, Elementary Schools 4
2. Inner City Attendance Area, Memorial Junior High School . 5"
3. Inner City Attendahce Area, San Diego Senior High_ School 6
4. Inner City Project Office OOO ,- _ _ . . 23
5. Burbank Elementary School25
6. CrOokett Eiementary'SchOol. -_ O ********* 27-
7. Logan tOhdoi ** * *** . 4 29
.
8._ Lowell-. -Eleinentary- -SChOol. .- , a. , '- 31.__
9. Shereari-tieMentatf-SohoOl...._ . ** -4- co- -
10. -Memoriale School - _ .f 35
11. Stith- Diego High- SChdoi * * 4 -4- e- 4_ 4 44o - - 37
12. -Etialuation Cbmpohehta
Withall Index Core Definition168!
xiv
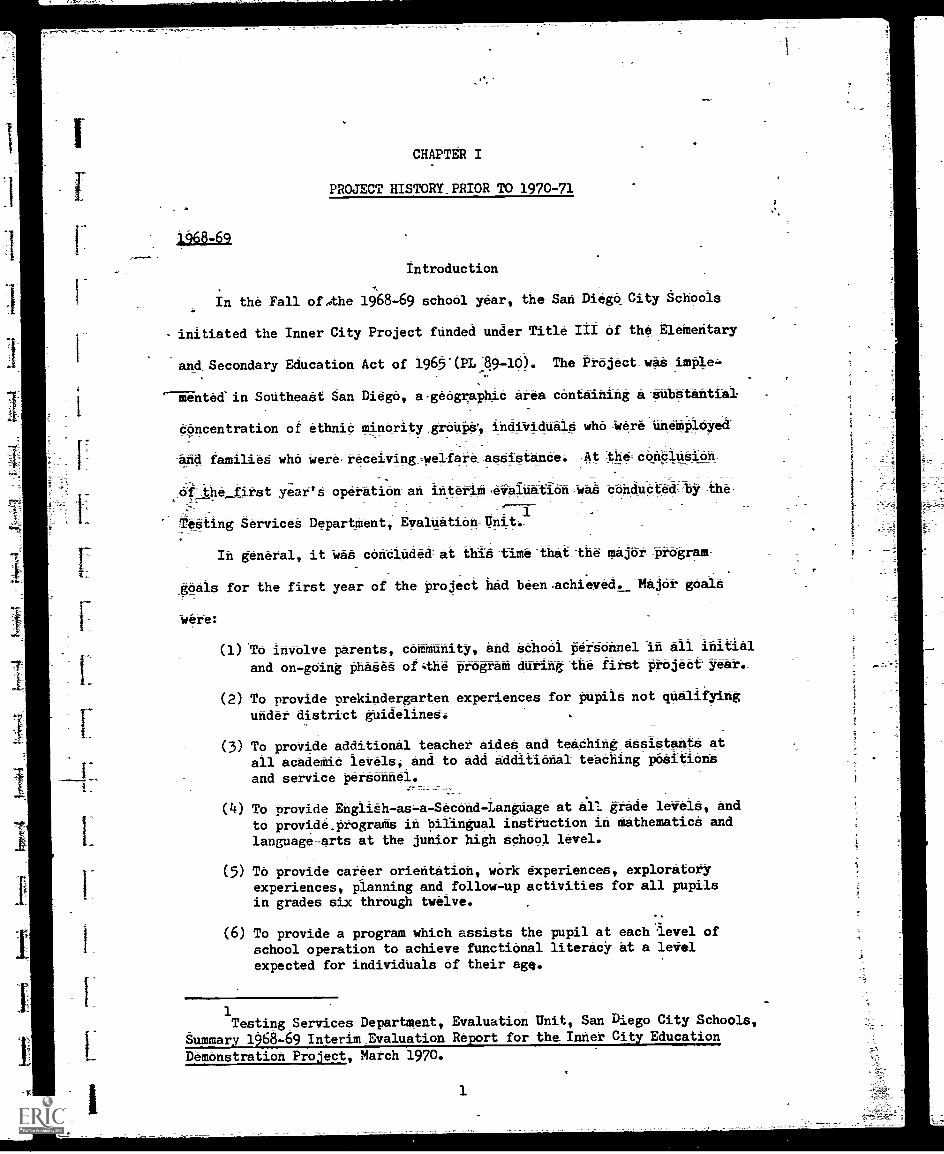
CHAPTER I
PROJECT HISTORY_PRIOR TO 1970-71
1968-69
IntroduCtion
In the Fall of..the 1968-69 school year, the sari Diego City Schools
- initiated the Inner City Project funded under Title III Of theEleMeritary
and_ Secondary Education Adt of 1965-(PL:89-40). The Project_WAS rnpIe=
'-iented-in Sodtheaat San Diego, a-geographid Area containing aatibataittial
concentration of ethnid Minority,grOUPShdiiriddale-who-Were riri6mployed.
_
and families wilds Were,receiiring=461fare-Asdietande:
,_65fT-,itie first year's operation-an interiM-4*aluationWAS-d-Ondudted==bh-e-
Tetting Services Department-;
In general, it was cdritiOdediAt_thie-time-that_the major :program-
_goals for the first year Of the project had _been-Achievedt_IMajdr goalS
were:
(1).TO involve parents, cOMMiiiiityi and sdhool peraohnel in all initial
and on -going phadet of:the program during the first project Year-
(2) To provide prekindergarten-experiences for pupils riotArialliyirig
under district guidelines.
(3) To proVide additiOnAl teadhet Aided and teaching Assistants atall adadetid leVelsi-And to add additiOnAl teaching positions
and service personnel.
(4) To provide Engli&h-as=a-Secohd-Langdage at all grade leVeiS, and
to provide. programs in bilingual instruction in mathematic6 and
language-arts at the junior high school level.
(5) To provide career orientation, work experiences, exploratoryexperiences, planning and_follow-up activities for all pupilsin grades six through twelve.
(6) To provide a program which assists the pupil at each level ofschool operation to achieve functional literacY at a levelexpected for individuals of their age.
1Testing Services Department, Evaluation Unit, San Diego City Schools,
Summary 1968-69 Interim Evaluation Report for the. Inner City Education
Demonstration Project, March 1970.
1

(7) To provide improved and additional counseling services.
(8) To locate, screen and/or prepare appropriate curriculum Materials.
(9) To provide in-service education for staff personnel.
2(10) To evaluate all phases of the program.
The most successful component of the 1968-69 Inner City_ ProgrAM was
found to be parent-school-commynity involvementi.With parents shoWing an
increasingly SatiSfied-attitUde-toward their children's educational pro-
_
gram from January to June,_ 1969._3
The overall recotmendatiil of the interWreport,_baged upon:the
success of this COMponentiwaa that an increase in:-the-nuMbefof,parent=
sdhool=community activities -would Turther_strengthehlan:_alreadyinnoVatiVe
and proMiSiftt Prograd: Further redottendatioird.in the Tiitt :year-eValha-=- _
tion report were directed_ toward the intervicti-Career orientation, and
Counseling activities within each of the participating achoolt. In the
opinion -of the San Diego evaluation unit, it WAS recommended that thede
_4_
activities be expanded to cover More Staff members and pUpilS.
PUpila and_Sitei
There were arproximately 6,600 pupils in the seven elementary and
SeCondary schools served by the Inner City Edudation Demonstration Project
during the first year of funding. Most were from ethnic minority groups
located in a moderately denSe rectangular 1.5 by 0.6 mild area of Southeast
"San Diego.
2Testing Services Department Evaluation Unit, San Diego City Schools,
Summary 1968-69 Interim Evaluation Report for the Inner City Edudation
Demonstration Project, March 9, 1970, pp. 5-6.3Ibid., pp. 8-9.
4Testing Services Department, Evaluation Unit, San Diego City Schools,
Summary 1968-69 Interim Evaluation Report for the Inner City EducationDemonstration Project, Mardh 9, 1970, p. 10.

The total attendance area of the seven schools was bordered on four
sides by freeways and was designateda part of a model cities' revitali-
mation program in 1969. Of all pupils within the district, the greatest
number of non-English speaking youngsters were from this section of the city..
The seven elementary and Secondary schools selected in the.Fall of
1968 to participate in the Inner City Program were:
Elementary Junior High- Senior_High
Burbank_ 'ASMOrlaI "San -Diego
Crockett
-14gEdz
Lowell'Sher-Math
these:-achbols-were:nmone_the,dideat7fOUnk=iii el-OanDiegeHaehboi-
---:aietriet-, -.With :Burbank 15 eing-T:-the,-641eat ,dIeMentary school itow$40i00:
hei.figrthe,soldeat:decondary:66hbotin the-city.
Burbank-- and -Crockett elementary schools enrollte&,2-pupile; Lowell_
Sherman -enrolled- 46 Pupils: logain-eleientary-Seneol-ehrolied- 3=6,
graded yeungatere. Modt pupils leaving Logan, Lowell and Sherian at the-.
termination of grade six entered Memorial junior. t. following school
:Tear. Similarly, the Majority of-inditiduala-'graidating:troil the-ndirth-
gradeat-Mestibrial enterediSen-biego-tigh the-koIloWing September. Fig-urea
1, 2 and 3 show the geOgraphic area in_WhiCh thead_achoOla were leaded.
Program
The program of the 1968-69 Inner City Project consisted of three
Main components which, in turn, were composed of 64 different activities.
The main components were (1) Parent and Community Involvement, (2) Instruc-
tion, and (3) Enrichment and Supportive. Services. While the 64 activities
were assigned to different components for the purposes of program descrip-
tion, in many cases activities consisted of More than one component. This
was particularly true of the Parent and Community Involvement Component.
3

.141
144,
9:#1
0065
::'
-17/
V6s
.
*54.
4A*4
';,40
,*«1
4,4

rl000rl0riI-1rl0(N
.!EfS
S
re7.:
ri
4-34-3-)4->;-1-i
"-,,4M
OM

-1,-
T;;;
;Ir
r","
"41"
'''
fiJ,
.**
Ty)
:'
SA
WD
IEG
O.
SP
OO
LS'
C9,
1; 7
0 .7/ 7
Ass
tzj
CD
CD 0 cr4 0 0
xj CD
mom
Mon
NN
WM
IN11
1111
0IW
O.
1110
1000
1011
1M
O -
011
100
0111
111.
,IM
PM
N.
IMO
lam
moi
"*.ip
,..,H
i',40
4ti,.
1

=-
The main thrust or emphasis of the 1968 -69 Inner City Project-wad
Parent and Cotreunity Involvement. This was the element which was designed"
to make all other activities more meaningful, and the element that gave
direction to many of the activities of other components. It was the Parent
and Community Involvement Component that gave the project a different
emphasis and a different approach from other Elementary-and Secondary
Education Act programs: parent and_community effort helPing-to impleMent
a more effective edUcational program.
The tchool7OOmtnnity relations component of the,,Inhertity-Projeat$
was :designed to inVOlVeparentein_neW,Ahd-Vital roles within, theirYineigh--
borhoOdt. Two; etiVitiet-were_indtalled_to dOOOMpiith-thie purpOdet_:6
Parent Advisory CounOii and the f!Ojedt:AdiiiiiofY4404t41-
Ptirent Advitory Council members were hOitinated_and:didOted by parents
of respective schools. A total of 49-parents served on. the councils.-of
the seven schools the firbt year. 'Conneil,MeMbers were elected for a:Ttert
Of one year, were residentt-Of their school attendance area, and,Werenot
employed by the city schools. In addition, the council Melibert were not
allowed to serve. On more than-one coUncil.
Each council met monthly with the school'- staff- to help plan, iiplement
and evaluate school progratb. Council, members were Paid $10 Per meeting.
Each council was given full responsibility for portions- of the project's
budget which, during the first year of the project; approximated $23 per
pupil. No council monies could be spent withoht Majority approval of the
council. All council meetings were open to the public.
The Project Advisory Board included representatives from each of the
Parent Advisory Councils, plus members from other Organizations represent-
ing ethnic groups within the community. The total number of members plus

the Director of the Inner City Project equalled seventeen. The Project
Advisory Board shared responsibility with the Director on decisions
concerning major components of the program.
The instructional component of the 1968-69 inner City-Project represented
the-area of heaviest staff concentration.,_ Ad can be seen by the list of
activities both at the elementary and secondary levels (see Table 1), much
effort was expended in this initial phate of prolam-deiiigh and implementa-
tion during the project's first year.
The main purpOSSOf most of the activities listed-telow-Wavto=improve
th#,basic academic-skills-of pupild :.hreUgh,progralha that biatmet-the-
*S-dd of children in Southeast San -Diego: Ah analysis -of - activity worth
p#iformed at the conclusion of the.projedt's first year indicated-that
-this purpose had been fulfilled.
TABLE 1
Listing of ActiliitieS_COhducted:During The196869, School_ Year -
Elemehtary Sdhooi Activities
PrekindergartenProgrammed Reading Materials"Reading CenterRedeployment Rending ProgramReteaching of ReadingTuloring ProgramMath ProgramInstructional Concepts Program
Follow- Through Prograih
EMRDedertifidation.antiRedo016yMentT/ttraar
Educitionally,HandiciPPed,Clgatesfor Previous EMR-Clito Pupils
EngliSh-iiii.a.--Second=lianguage
--RedeplOytent KindergartenLanguage Power' Program
Secondary School Activities
Reading Demonstration ProgramSIR -- Decertification and Redeployment ProgramBilingual Instruction in A. Aemic SubjectsComputer Program--Math ClaisesReduction in TrackingEngiish-as-a-Second-LanguageMinority Ethnic-Group Study Program- -Black
and Chicano StudiesTutoring Program
'V^
8

The Enrichment and Supportive Services Component bridged the elementary
and secondary levels and involved those-activities that provided additional
experiences to enrich other program activities, supply additional skills,
and provide additional material and personnel services needed to support
activities in other components. Table 2 shows such services.
TABLE 2
Enrichment and Auxiliary Services Provided by .the1968-69 inner City Project
_
Etiridrunent,-Cvitural. anit.Added ties
WOrk:7Study-_Program:_
sittist-ihledidencePiOgram,-Art-EXhibit-4-61-or_Me--CreaiiVe-
Carder Motivation==NOtth IslandEthnic 7Cultural -Events.And-ActiVitiesStudy Trips-Throughout_CoMittnityMonthly Exchange Visits -- Burbank and De Ann(Performing ArtistsSeizing Class
SWitming Program7-Inattlictional and Recreational_Track Team-4oaching and praotide, extended dayVocational- Education -- Pacific Telephone-Career-
Orientation ProgratParticipation in siXthrgrade School Camp Program
Auxilary Services ActiVities
11; # ,1 11' #
Administrative Intern ProgramAidesInstructional and CommunityClerical Help (additional time)English-as-a-Second-Language Traveling TeachersEquipmentHuman Relations WorkshopInstructional Supplies and Curriculum MaterialsTeacher AssistantsTeacher--Intern ProgramTraining Program for Instructional and Community AidesTrailer RentalEducation Professions Development Act--In-serviceTraining Program
Ethnic Studies Conference
9
1
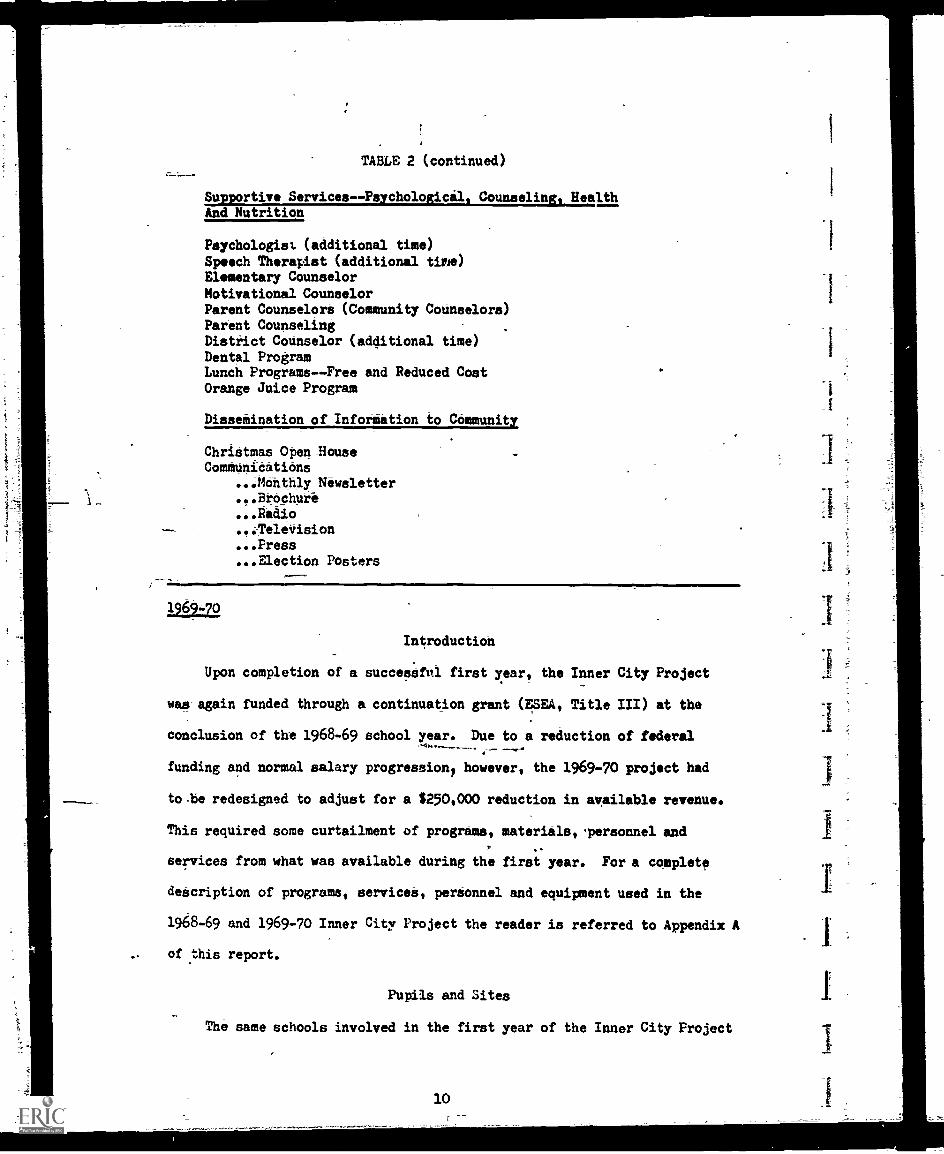
TABLE 2 (continued)
Supportive Services - -Psychological, Counseling, HealthAnd Nutrition
Psychologist (additional time)Speech Therapist (additional time)Elementary Counselor
Motivational CounselorParent Counselort (Community Counselors)Parent CounselingDistrict Codnselor (additional time)Dental ProgramLunch Programs - -Free and Reduced CostOrange Juice Program
DisseMination of Infortition to Community
Christmas Open -HouseComMuniCatiens
...Monthly Newsletter
...Brechuti
...Radio
.fjeleVision
...Press
...Election Posters
1969Z2
Introduction
Upon completion of a successful first year, the Inner City Project
was again funded through a continuation grant (ESEA, Title III) at the
conclusion of the 1968-69 school year. Due to a reduction of federal
funding and normal salary progressions however, the 1969-70 project had
to -be redesigned to adjust for a $250,000 reduction in available revenue.
This required some curtailment of programs, materials,,personnel and
services from what was available during the first year. For a complete
description of programs, services, personnel and equipment used in the
1968-69 and 1969-70 Inner City Project the reader is referred to Appendix A
of this report.
Pupils and Sites
The same schools involved in the first year of the Inner City Project
10

rwere again selected for the second, continuation year. Listed below in
Table 3 are the 1969-1970 Inner City schools and their ethnic breakdown.
TABLE 3
Enrollment and Ethnic Percents for 1969-70 Inner City Schools
School Enrollment
Numberteachers
Ethnic Percents of (N)
Bleck4148)1Surname White Other--
San Diego High 433 105 22% 34% 4o% 4%
Memorial Junior High 156o 98 52% 42% 4% 2%
Lowell Elementary -410 24 7%- 87% 3% 3%
-ShOlen Elementary 931 52 42% 48% -7%
13irbank:Eleientary 371 18 -51%- 4S- :5% 2%
Logan Elementary 719_ 38 -58% 37%- 2% 3%
-Crockett ElementaryTotal
.2516475
:22357
1.81i -2531_.._
.0- A
It becomes appareht, when consulting both the maps and enrollment
statistics of the Southeast Area of the San Diego School System, that
the proportion of pupils with Spanish surnames decreased and the propor-
tion of Blacks increased from West to East within the Inner City Attendance
Area. Since the majority of elementary and junior high school pupils
within the Inner City area and a substantial proportion of "other whites"
outside of Inner City boundary limits eventually attended San Diego High,
this school was the most racially balanced of the seven project schools.
This "ethnic minority shift" at the elementary level and the racial
trilogy at the high school level presented unique instructional problems
for each Inner City School during the 1969-70 school year. For this
reason much of the program had to be defined relative to unique site needs.
11
c.

4
Project Advisory Board and Parent Advisory Council
As was true of the 1968-69 Inner City Project, the 1969-70 Iroject
Advisory Board (PAB) and Parent Advisory Council (PAC) were the major
components of all community involvement activities. PAC members were
elected by secret ballot and, in turn, elected their own school chairmen.
Individual school principals assisted the PAC members in. an advisory role
only. A listing of PAC membership, by school, and the apportionment of
PAB members throughout the Inner City Community was as follows:
Parent Advisory Council Membership
School Number of-Meinberia
S!xn1Piego High 9Memorial Junior High 9Sherman elementary 7Lowell Eleinentary- 5Crockett Plementary 5Burbane eleientary 5Logan Elementary 7
Total k7
Project Advisory Board Apportionment
Organization Number
Burbank Elementary PAC 1Crockett Elementary PAC 1Lowell Elementary PAC 1Logan Elementary PAC 2Sherman Elementary PAC 2Memorial Junior High PAC 2San Diego High PAC 3Business and Industry 1Neighborhood House 1Mexican-American Community 1Negro Community 1Labor 1
Total Tr
Goals and Activities
Ethnic Requirements
NoneNoneNone1 Chicano, 1 Black1 Chicano, 1 Black1 Chicano, 1 Black1 Chicano, 1 Black, 1 Other WhiteNoneNoneMember Chicano FederationMember, Black ConferenceMember, Central Labor Council
The innovative instructional components of the 1969-70 Inner City
12

Project was based upon twelve basic goals unanimously approved by the
members of the Project Advisory Board. Activitiea related to each goal
were specified prior to the second year of the Project and, with few excep-
tions, included the activities previously described for the 1968-1969
school year.
Programs incorporated into the second year's Project were those
found to be most beneficial to pupils. Thus, the experience gained during
the first year of funding was used to maximize the best program conaitiond
available under the second year's restricted budget.
Listed below were the goals and related activities approved by the
Project Advisory Board for the second funding year:
(1) Goal: To secure a high level of schoolparent-dommunityjoint involvement and to clarify the functions of theparticipants as they become involved.
Activities: As was the case in the first year, an electionof Parent Advisory Council and Projedt AftiaOry Boardmen:beta was dondUdtedi The individuals Chosenrepresented parentati'coamunity organizations,_ organizedlabor, business, and representatiVi_ethitic.MinOtitygroups Within the attendance Area of-the School.These representatives met with the project staffregularly during the school yeat.
Each Parent Advisory Council for each Inner CitySchool was given a proportionate amount of moneyto spend during the 1969-1970 school year Likethe total budget, this allotment was cut froth the
1968-1969 level by approximately $40,000 (from$126,000 to $81,951). Three restrictions wereimposed on the spending of these funds:
(1) The PAC members could not pay themselvesa direct salary, stipend or wage.
(2) All spending had to be relative toproject goals and activities.
(3) All spending had to be approved bythe San Diego Board of Education andthe Educational Code of the State ofCalifornia.
These were the only restrictions placed upon the
13

(2)
(3)
expenditure of PAC funds. Council members were
free (by majority vote) to purchase any hardwareor software items and services they felt werebeneficial to their children.
Community aides were also hired by the Inner CityProject to work in the classroom, various schooloffices, and within the community as liaison Agents.
These individuals were provided with in-serviceeducation programs designed to increase their skills,both in the classroom and in the general labormarket at the conclusion of the project.
Goal: To provide part-time aides to work in the cladarooms,_,-'Schoola and community -of the Inner City sChoold.
ActiVities: The-Inner City Project proVided'teadher aides
-and teacher-asaiatanttitd,a-treater-degreedantarget"-scho616.,-as-opposect!Ohi4iikgettopiiikii& The
paraprofessionals -berifed-AndidairOdak(init:Offidea,__ad-4011 a014ithin-theHiiiMiediate4O lhcatfOrt
wad-Made to-imPlOyr=theisbera-,Ote minority- groups
and-persOnd Whd were bilingual:- t,440-antidipated
that theSaindiVidualeWOuld-profido- ea4reatriOdurtof indiVidual instruction -in the claser6om as-well
as simply increasing the number of adults in the Schools.
Goal: To provide preschool educational-services-forren (ages three or four) who neectthete services -but
who would not have been eligible for- participation
in either Head Start or tbe California Unruh Preschool
Program bedause of technical requireientd Of thede
programs.
Activities: Prekindergarten classes were established at
Crockett Elementary school. They included children
not eligible for other preschool programs because
of family income, but available to the type ofinnovative programs offered'by the project.
(4) Goal: To provide operational programs of ESL and bilingualinstruction to meet the needs'of children whose firstlanguage was not English.
Activities: As in the previous year, efforts were madethroughout the 1969- 1970 school year to identifythose pupils who could profit by ESL and bilingualinstruction. Using the ESL Demonstration Projectas a basis for materials and techniques, the InnerCity Project placed the identified pupils insituations necessitating increased English usage.

(5)
In the case of bilingual instruction, certain
courses were taught in both English and Spanish
so that students could master-subject content and,
at the same time, learn English in the separate
ESL Instructional Program.
Goal: To provide programs in career orientation, career
preparation, work experience, and a program of
follow-up and placement for pupils leaving the
Inner City schools.
Activitied: Pupils were provided-with occupational
preparation,..experiencea, and actual job placement
through this phase or the Inner-CitYPtojedt.
(6) Goal: To supplement - the present_coUbseling staff Within-
the tChoelt withA prograla-that,prOVided additional
perSonil and*OtiiiittiOnal-COUbteling,
(7)
(8)
ActiVitiet: An attempt :was;idadeAuring:=the l969 =1970 Odh-odl
year-t6-40dLeUChatiVitioin-= reionWtYpa4if:
counseling_t0,theitChoe:-'added to sohodi staffs -sowould better identity4ith the_..66061--And-deriii=a
higher degree of interest and empathy trot -the
counseling situation.
Goal: To provide health and nutritional services that
support physical well-being-and vigor.
Activities: As in the previous year the dental, lunch and
orange juice programt were continued in the schools.
Goal: To develop and define new materials which more
adequately meet the needs of pupils.
Activities: Throughout the school year the Inner City
Schools (assisted by the Curriculum Services Division-
of the City Schools) defined and utilized instructional
materials thought beneficial to.pupild. The staff
of each school was giVen the opportunity to comment
on instructional worth, as well as participate in
actual material selection and distribution.
(9) Goal: To provide effective in-service education programs
designed to increase the sensitivity of school
personnel toward pupil needs.
Activities: Many in-service activities were held throughout
the school year. The effectiveness of these programs
were judged by participants at the conclusion of each
session.
15

(10) Goal: To increase the use Of minority members in staff and
resource positions so as to strengthen the self-imageof pupils in the minority schools.
Activities: The minority members served on the school staffas aides, assistants and teachers in order to providemodels for pupils to emulate.
Goal: To provide experiendes that will improve the_pupil's knowledge and appreciation of the cultureand contributions of ethnic minorities.
Activities: Throughout "the,adhool year, many field- .trips
and school site perforMandeS-Were provided for theInner City pupil. They included recreational,educational-and:cUltdral enrichment Adtivities,de-signed to both-indreaba=therdhi106414diendaa=01-- -his iMmedinte*rroundings,an&heill),,hia-:relate*ithothei. dhiidrenin-iii_JiettingreMoved,,frd0Woida6=tooth- Other Adtivitie0*Udh-hastheAnatitUtiOnlof Bledk_anU.Chidan0-2StUdied.4t:tha_highilidhool,level were also instituted-in an-attempt to,adhieVethiS goal.
(12) Goal: To measure theadhievement_leVei of pupils servicedby the Inner City PrOject through functional Iiteradymeasures.
Activities: Att attempt web made throughout the School
year by the project staff and parent groups toidentify valid measures of functional literacy.The purpose of such an attetipt was to determineif other procedures besides standardized testingcould be used to measure the academic competencyof the Inner City pupil.
(13) Goal: To evaluate the project in terms of its objectives.
Activities: In the application for continuation5
of funding
for the second year of operation, it was stated thatthe experiences of the first year would be used todiscover strengths and weakhesses in project imple-mentation. It was also stated that Project staffmembers, together with representatives from theInner City Parent Advisory Board and the schooldistrict would implement an adequate project designfor the 1969-1970 school year.
5San Diego City Schools, Application for Continuation Grant forESEA, Title III Project Inner City Education Demonstration ProjectJuly, 1969.
16

Summative evaluation of the preceding goals and related activities
at the conclusion of the 1969-70 school year Inner City Project indicated
that:
(1) The majority of elementary school personnel responding to
evaluation questionnaires-perceived parent-school-community
activities to be effective in helping them work with parents
and pupils.
(2) The majority of secondary perdonnel reapending to evaluation
questionnaires perceived parentr*hool=CoMMUnity activities
leas effective this year (1969-1970)..COMpared to-1968=1969.
_ c"7
(3) Elementary teachers perceived ineredaddarentschool,-community
infoivement fio*_19684060A0_19604070-*10'66-107044eftdefinedItheir'thhOtioneaa-lead.integratedth:the
ty
in 1069-1970-06iiiii41*-06-thifi4100#4,::
(4) The SatiSfadtidh-:ekpreededhy,;dedondarente-dedrea&ed-
frod the first -to. theiaeOndffUndint,e s0A,44-efekoe
was SUbstantially-greater:thamthat4cdaddiatect-With,eieMehtlity'parents returning,theedthe SUrVey
(5) There was considerable deiky in the expenditure ofPAC,funds
during the second fUnding_Year:
(6) The goal of providing effeetifein=service 4dt:dation pirograma
deSigned to increase the sensitivity of school personnel_
toward-pupil needs was_ accomplished'..
(7) The teacher- assistant, community aide- program had been
beneficial to the Inner City schools involved in the'1969-1970
prOject.
(8) Functional literacy measures inherent in the attainment of
goal twelve (to measure the achievement levels of pupils
through functional literacy measures) were not developed.
However, data analysis further indicated that Inner City
pupils did improve their reading ability in the lower elemen-
tary grades but were still substantially below grade level
expectations.
Secondary pupils continued to follow the same pattern of
reading achievement as was found in the projects first year.
Reading achievement continued to approximate national norms
at Q and Qz, and achievement at continued to be substant-
ially below'expectations.
Where gains in reading achievement were noticed, it was
accomplished by either the pupils receiving their first
instruction in reading or by pupils participating in an
intensive reading program at individual sites.
17

(9) The preschool educational services provided by the Inner
City Project at the elementary level were highly success-ful in raising the I.Q. scores of pre-kindergarten youngstersat least two standard errors of measurement.
(10) The ESL and bilingual programs provided througb the InnerCity Project Were moderately successful in meeting the needsof children whose first language waa not English.
(11) Career orientation and work experiences were given to asubstantial number of pupils during the 1969-1970 school
year.
(12) Supplemental counseling Serviced provided through the InnerCity Project were judged to be beneficial to-pupils by
school staff members.
(13) Health and nutritional Service-A-provided through-PACfunding were found .to bS-behetioiai ter-tuPiibin need of
such care.
(14) Staff utiliiation of hardware-and- softWare was-judged al§adequate by staff members during the-Sedond funding year.HoweVer, dissemination Procedured between,and 'thin
schools were defined as in need of improyedent.
Specific recommendatiOns for the 1970-71 funding year centered
upon establishing a more comprehensiVe process and product,evaluation of
the level of parent-school-community invol-Vement during the 1970-71
school year, and a summative evaluation of projeot etfectivenees for"
purposes of adaptive decision - making after federal funding is terminated
at the conclusion of the 1970=71 school year.7
6Testing Services Department Evaluation Unit, San Diego City Schools,
1969-70 Evaluation Report of-ESEA-(Title III) Inner City Education Demon-
stration Project, October 1970, pp.
7Ibid., p. v.
18
r.

Context Definition
CHAPTER II
DESCRIPTION OF THE 1970-71-PROJECT
The.Problem
The purpose of the 1970-71 Inner City Education Project was to main-
tain the high degree of-parent-school-community involvement found during
. the firitt two years of theproject and, at the same time, supplement
district resources within specific Inner City'schooiS in the hope-that
culturally disadvantaged youngStera would improve their-School attendante
and eaadetic performance:
The probledi to beredolved inherent in theabalre purpose-7,4Arti,.1411
(1) improving the level of inVolVement.between pare0S,-the-itohdeleet&
the community, (2) proViding supplemental Ehglish-as-A Second Language
(ESL) and bilingual instruction, (3) providing tupplemental instrUbtional
and counseling services and (4) providing supplemental health and nutritional
services (a). increase the sensitivity and receptiVeness of staff members
to the problems of students and-parents and (b) improve the school
attendance and academic periormance of Inner City youngsters?
Domain Limits,
School Sites and Pupil Population. As was the case with the second
operating-year, the third year Inner City Program served the same seven
school sites and related attendance areas as was originally seleOted in
1968-69. Table 4 gives the ethnic percents and enrollment characteristiis
of the Inner City schools included in the 1969-70 and 1970-71 program.
Figures indicate general stability in both school enrollment and ethnic
definition for the second and third funding year. This is in contrast to
the slight increase in ethnic population the school system had experienced
over the previous five years (see Table 5).
19
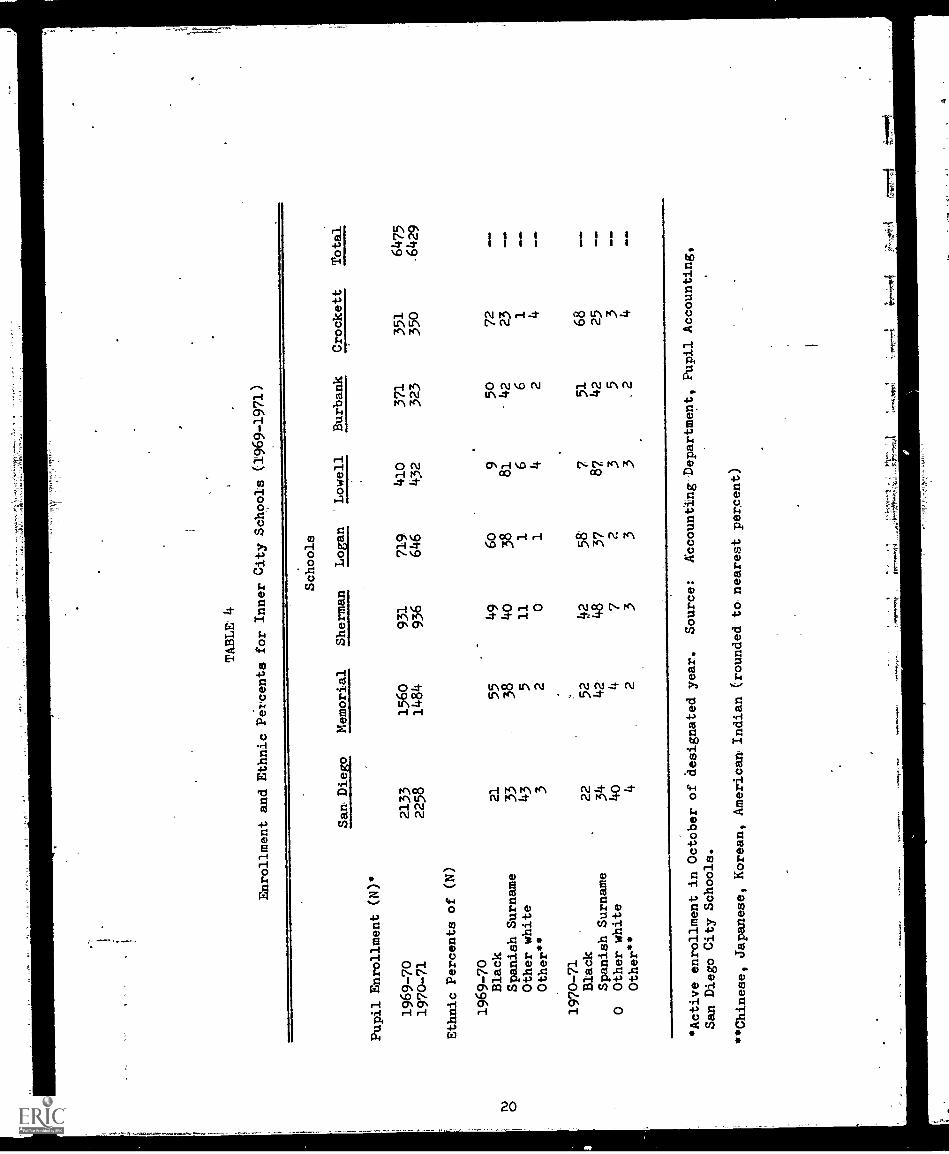
TABLE' 4
Enrollment and Ethnic
Percents for Inner City Schools (1969-1971)
ti o
Pupil Enrollment (N)'
1969-70
1970-71
Ethnic Percents of (N)
1969-70
Black
Spanish Surname
Other white
Other**
1970-71
Black
Spanish Surname
0 Other white
Other**
San Diego
Memorial
Schools
Sherman
Logan
Lowell
Burbank
Crockett
Total
2133
2258
21
33
43 3 22
3440 4
1560
1484
55 38 5 2
5242 4 2
931
936 4940
11 0
42
48 7 3
719
646
60 38 1 1
58
37 2 3
410
432 981 6 4 7 87 3 3
371
323
50
42 6 2
51
42 5.2
351
350
72
23 1 4 68
25 3 4
6475
.6429
1111
1
MO
M..
MO
M..
*Active enrollment in October of
designated year.
Source:
Accounting Department, Pupil Accounting,
San Diego City Schools.
*Chinese, Japanese, Korean, American Indian
(rounded to nearest, percent)

TABLE 5
rare
.01
1111
Vili
District Pupil Ethnic Distributions,
Preschdol Through Grade 12, 1965-1970*
om...
10
Year
Percent
Black
Percent
Spanish Surname
Percent
Other White
Percent
Other
1965-66
10.7
8.6
78.3
2.4
1966-67
11.0
9.3
77.2
2.5
1967-68
11.6
9.8
76.0
2.6
1968-69
11.6
10.1
76.1
2.2
1969-70
12.2
10.5
74,3
3.0
*Source:
Administrative Research Department, San
Diego City Schools
*Chinese, Japanese, Korean, American Indian

Six of the seven school sites were identical to those used during the
1969-70 school year. Burbank elementary school was replaced with a new
structure completed in November, 1970. Other than the Burbank school, no
other structure was extensively altered.
The Adjacent Community. The administrative and community center of
the Inner City Project was located in the Southeast sector of the project
boundary area described in Chapter I of this report. The target area-
served by the center is bent described as a lower-lower to lower-middle
class residential area surrounded -by moderate industry and inter - connective
freeways.
Located between the-"downtown area", the Pacific-Ocean an&bordering
parklands, the familiett of thit SoutheaSt section of-Santlego live in an
area that had approximately five times the number of school pupils
receiving AFDC funding and approxiMately double the number-of juvenile
arrests as the rest of the city. Tables 6 and 7 illustrate thiS deScription.
The city's largest park and recreation area (Balboa) is East of the
Inner City attendance area. Warehouses and small commercial stores
immediately adjacent to downtown San Diego rim the North edge, and due
West lies the Pacific Ocean (with related industry and Naval operations.)
To the South are the city corporation boundarieS and neighboring school
districts that parallel the Mexican border.
Many community groups within the Inner City attendance area continued
to endorse the Inner City Project throughout its three-year history. Among
such groups were:
Black ConferenceBlack Students Council
Citizens Interracial CommitteeCommunity Action CouncilCommunity Opportunity Program it, Education
22


4,4

rwr, ,

f."r
1,...1,;,.
a ., ;,,,,....,A
'-e
1,",:f,..4t
4,
tit
-41
:Nef
4..,
'
.t.
A?
6" {.".
,4,
44.74.;--
;-'24-lr-Z,
.P
ke
gragalOrin.
rt;/4W
34,...,1'. .
i ''.- ....ft
'*t -'''.
%.,,,,,,,..
.!4
u SS
Av
''
ji
I*now
,
tCd.1
!Li CP a
15i3=1,
4".
.0

ols
mum NM MN *IN
r-I0
0
4)4)00
0
0
4 *rani *Nia4 tomm,"4

d-E
tri.t-+
x
11


Ow
t And'4,
Al

Figure 8
Lowell Elementary School
51
jPy Y
ei. 'Yjyt'..».


rrrr

Figure 10
Memorial Junior High School

4414
'40
.
' -7.',V
:V;47--,-,'crol.,,,,N
1,1".
Tv,,,, i-,,,,,-;,,' _.:
.............................4,''))131
'*'.-."-..7
'''''''
''''4
4.1,
",rtt
ttt

AraMMept moR mu EMS UMW UM ems mom n* eon* 10110111110 101110011 aimmi mot MN
alilM0111 t '10 14.!"!!t*/


TA
BLE
6
Aid for Dependent
Children (AFDC) ElementaryPupil Count (Jan,
1970)
Inner City
Pupils
Inner City
Under
School
AFDC
Enrollment
2020
2637
.100
Enr7Cllmen
76.6
Pupils
Under
AFDC
10196
>n -Inner tiity
School
Enrollment
7055
6
100
AFDC
Enrollment
14.3
Determined by relatinc census
track information to
elementary attendance
districts.
Where census and
attendance boundaries
did not coincide, an
estimate determined
the division of
enrollment among
included schools.
Source:
Administrative ResearchDepartment, San Diego
City Schools.

TABLE 7
Juvenile Arrests, Inner City vs non-Inner City School Means
During the Interval November 1970 through January, 1971
Inner City.
Non-Inner City
Elementary
Secondary
Elementary
Secondary
Total arrests
9183
137
1544
Total enrollment
2637
3625
70556
52458
1000(Total Arrests/
Total enrollment)
3.4
50.4
1.9
29.4
Source:
Guidance Dapartment, San Diego City Schools.
School locations based upon the juvenile's
statements at time of arrest.
Note: -no distinction is made between serious and petty offenses.
Based upon Jan. 1, 1970 active enrollment.
Source:
Accounting Department, San Diego City Schools
4

Community Welfare CouncilEconomic Opportunity ProgramMayor's Council on Youth OpportunityMexican-American Youth Association
Model Cities AgencyNeighborhood Youth CorpsSoutheast Ministerial AllianceUrban CoalitionYouth Opportunity Corps
Instructional Supplies. The Inner City Project did not prescribe
instructional supplies. It acted merely as a procurement agency for individ-
ual Parenc Advisory Councils who, in turn, financed teacher-initiated
proposals through committee action. The major portion of instructional
supplies for the seven Inner City schools were the same as those prescribed
by the city board of education. Supplemental supplies purchased through
Inner City basic and PAC funding are given in Tables 8 and 9.
Needs Assessment
Learner needs. An evaluation of the first two years of the Inner
City Program indicated that standardized achievement levels of elementary
pupils in Southeast San Diego continued to be substantially below national
norms at the 25th, 50th, and 75th percentiles. At the secondary level,
reading achievement remained constant and at national norm levels for
Q2and Q
3. However, a decrease of percentile rank at Q1, noticed at the
end of the 1969-70 funding year, indicated that increased emphasis in
motivational counseling for the lower quartile was needed in 1970-71.
Recent Inner City evaluations also have indicated that the prevailing
need for "English as a Second Language (ESL)" and bilingual instruction was
often expressed by school personnel, parents and pupils from Spanish-
speaking households.
Other pupil needs defined through joint school-community effort
prior to Inner City funding were (1) early childhood education for

b
TABLE 8
Elementary School Parent Advisory Council and Inner City
Project Instructional Equipment/Materials
Expenditures from September, 1970 to May, 1971*
Percent
School Equipment/Materials Expenditures of Totals
Burbank Reading/Math Improvement Supplies S 216.09 43.1
(K-2) Film Rental 10.00 0.0***
Misc. Materials** ?75.29 54.9
Total Cost 5-1.38 100.0Total Cost per pupil 1.51
Crockett Reading/Math Improvement Supplies 666.20 51.9
(K-2) Spanish Texts 70.25 5.5
Misc. Materials** 47.96 42.7
Total Cost 12 . 1 100.1**"
Total Cost per pupil 3.81
Logan Reading/Math Improvement Supplies 2976.17 85.5
(3-6) Spanish Texts 146.47 4.2
Black Studies Texts 109.20 3.1
Misc. Materials** 249.54
Total Cost 3481.38 100.0
Total Cost per pupil 5.47
Lowell Reading/Math Improvement Supplies 420.33 45.0
(K-6) Misc. Materials** 514.69 55.0
Total Cost 935.02 100.0
Total Cost per pupil 2.14
Sherman Reading/Math Improvement Cipplies 2215.23 56.5
(K-6) Spanish Texts 722.36 18.4
Misc. Materials** 984.28 25.1
Total Cost 3921.87 100.0
Total Cost per pupil 4.48
*Excludes expenditures for cultural enrichment trips.**Includes expenditures for expendable items only (e.g., straight pins,
gummed stars, masking tape, drawit paper, yarn, flannel board materials).
***Rounded to nearest 1/10 percent.****100> %>100 due to rounding error.
42
4_

TABLE 9
Secondary School Parent Advisory Council and
Inner City Project Instructional Equipment/MaterialsExpenditures from September, 19?0 to May, 1971.'
School Equipment/Materials Expenditures
Percent
of Totals
Memorial Reading/Math Improvement Supplies 412o3o.lo 25.4
(7-9) Black Studies Texts 186.61 2.3
Business Educc.:.ion Texts 114.66 1.4
Cassette Tape Recorder 469.34 5.9
Graphic Arts Supplies 55.80 0.7
Gym Suits 98.60 1.2
Jump Ropes (Physical Education) 138.60 1.7
Photography Equipment/Supplies 349.60 4.4
Safety Glasses (Wood Shop) 363.70 4.5
Soccer Team Uniforms 160.49 2.0
Social Studies Films/Filmstrips 597.45 7.5
Social Studies Games (simulation) 152.78 1.9
Spanish Texts 456.75 5.7
Swim Caps (Physical Education)Miscellaneous Materials**
27.932789.85 330.3
Total Cost 7992.26,99 **,
Total Cost per pupil 5.75
San Diego Reading/Math Improvement Supplies 2743.75 23.6
(10-12) Baseballs and Bats (Baseball Team) 358.85 3.1
Cassette Tapes, Film Rentals and Records 1728.77 14.9
Chicano Federation Newsletter 40.00 0.3
Lease of Bell Boy Paging Units 120.00 1.0
Photographic Supplies 802.41 6.9
Pupil Information Training at Marine
Corp Depot 270.00 2:3
Rental of Olivetti Underwood Programma 101 1163.75 10.0
Service Contract on Programme 101 . 285.00 2.4
Social Studies Gaming Materials 37.88 0.3
Spanish Texts 1915.60 16.5
Swimming Lessons (Physical Education) 850.50 7.3
Miscellaneous Materials" 1292.53 11.1
Total CostTotal Cost per pupil
11609.0 45.81
99.7"'
Excludes expenditures for cultural enrichment trips."Includes expendable items as itemized for elementary schools 21.2s industrial art
supplies.***100)%>100 due to rounding error.
43

children not under preschool federal assistance guidelines, (2) supplemental
career, motivational and personal counseling at the secondary school level
and (3) supplemental health and nutritional services.
Parent needs. The previous two years of Inner City Project activity
provided substantial evidence to support the conclusion that Southeast
San Diego parents desired and supported the efforts of their individual
PAC's. Many parents attended PAC meetings voluntarily throughout the
school year. When questionnaires were sent to samples of parents through-
out the community, the majority indicated that they perceived parent involve-
ment to be an important factor to consider in designing their school's
educational program. Parents stated that an organization, such as a Parent
Advisory Committee, would enable them to both become better acquainted with
their schools and give them the power to finance what they thought to be
important supplements to district programs.
Community needs. In addition to the need of instituting Parent
Advisory Councils school personnel, parents, and community leaders also
decided that a need existed to ir7olve more community people directly
in school functions.
Planning committees also felt that a separate administrative center,
apart from the main administrative education center, should be located
within the target area. Committee members felt that this would encourage
staff personnel and community members to share concerns and suggestions,
as well as provide a convenient meeting place for formal presentations
and school events.
44

Project Inputs
Goals and Objectives
Original performance objectives. The original performance objectives
written in the 1970-71 Inner City proposal were stated as follows:
Objective 1: To improve the level of school-parent-community
involvement so that active participation is increased
to a 25 percent higher level than in the second year
of the project.
Objective 2: To provide operational programs of elementary English
as a Second Language (ESL) instruction and secondary
bilingual instruction in academic areas for students
whose language is not English so that 70 percent of
the elementary students will achieve at a significantly
higher level than a control group of learners not
receiving ESL instruction, as measured by the H-200
Placement Test; and that the Grade Point Average of
secondary students in bilingual classes will signifi-
cantly improve to approximate that of students in
regular classes in the same academic areas.
Objective 3: To provide appropriate motivational, personal, educa-
tional and career counseling so that students receive
proper help with their individual problems from
empathetic and interested counselors, and that the
designated student population will improve their
behaviors toward the school, as measured by pre- and
post-class behavicr and attitude scale.
Objective 4: To provide health and nutritional services that support
physical well-being and vigor so that 75 percent of the
designated population will reduce their previous year's
total days-of absence by 25 to 50 percent due to illness.
To increase sensitivity and receptiveness to the
problems of studentt and parents on the part of staff
members in the schools so that 50 percent or more of
the designated staff members will show positive
attitudinal changes as measured by an acceptable
attitudinal scale, and so that 75 percent or more of
the parents responding will report positive attitudes
toward the schools, as measured by an acceptable
questionnaire distributed to a random sample of the
school's parents.
Objective 5:
Objective 6: To evaluate the objectives of the project, as defined
under the Project.
45

Objective 7: To improve the performance of elementary students in
the basic skills of reading and mathematics and ofsecondary students in their academic classes, so that
60 percent of the elementary designated populationwill show a greater gain as compared to their previousyear of schooling using an acceptable achievement test;and that the lower 25 percent of the senior high schoolpopulation will maintain their previouS reading achieve-ment gains as measured by the ITED; and that the next25 percent of the senior high school population willimprove their achievement over the previous year; andthat the seventh grade will improve their readingachievement so that their distribution of scores onthe ITBS will approximate one-half of the differencebetween their curSent profile and the test profilefor the district.°
Revised performance objectives. The above performance objectives
were written during the Spring, 1970 semester and submitted to the ESEA,
Title III, office prior to the 1970-71 school year. Subsequent program
definition and related evaluation planning during the first months of
1970-71 produced objective modifications. The performance objectives were
not changed. Rather, objective intents were clarified.
After consulting with the Inner City Project staff and representatives
from the State of California Compensatory Education Evaluation Unit, the
following performance objectives were adopted for the 1970-71 year:
Objective 1: To maintain or improve the level of school-parent-community involvement so that 1970-71 attendance byProject Advisory Board and Parent Advisory Committeemembers in their respective meetings does not decreasebelow 75 percent of the level established during the1969-70 school year.
Objective 2: To provide supplemental programs of English as aSecond Language (ESL) and secondary bilingual instruc-tion in academic areas for students whose language isnot English so that (a) zero to K-6 rated Spanish-speaking elementary pupils' will show substantialgains in English proficiency (as measured by the H-200
8San Diego Inner City Project Continuation Grant 1970-71, San Diego
City Schools, April, 1970.
As measured by the ESL Placement Test developed through ESEA (Title III)
funding, September, 1969.

:..
Placement Test), (b) K-6 and above rated pupils will
show substantial English reading and language skills
improvement (as measured by the San Diego Elementary
Reading and Language Skills Check List) and (c) the
grade point average of secondary pupils in bilingual
classes will substantially improve to approximate
that of pupils in regular classes .within the same
school and in the same academic areas.
Objective 3: To provide supplemental motivational, personal, educa-
tional and career counseling so that (a) pupils
perceive that they are being helped with their individual
problems and (b) the truancy and unexcused absence
rates of pupils will substantially decrease below that
of the 1969-70 school year.
Objective 4: To provide supplemental health and nutritional services
that support physical well-being and vigor so that
75 percent of the designated population will reduce
their previous year's absences due to illness by
25-50 percent.
Objective 5: To increase school staff sensitivity and receptiveness
to the problems of pupils and parents so that (a) 50
percent or more of the defined staff members will show
positive attitudinal changes (as measured by the
Withall Social-Emotional Climate Index) and (b) 75
percent or more of parents responding will report
positive attitudes toward the school (as measured by
an attitude survey).
Objective 6: To evaluate the extent of instrumental and consequen-
tial goal attainment of the project, as reflected
through the revised performance objectives of the
project.
Objective 7:
(a) To improve the performance of elementary pupils in the
basic skills of reading and mathematics so that there
will be substantial increase in mean achievement from
October to May, 1971, and that 60 percent of such pupils
will show a greater gain from October to May, 1971 than
from October to May, 1970 (using an acceptable set of
achievement tests).
(b) To improve the performance of junior high school
pupils so that pupils will improve their reading and
mathematics achievement (as measured by the CTBS) to
As measured by the ESL PlE.cement Test developed through ESEA (Title III)
funding, September, 1969.
4?

a degree that will approximate one-half the difference
between the current profile and the test profile for
the district.
(c) To improve the performance of secondary pupils so that
the lower 25 percent of the senior high school popula-
tion will maintain or exceed their previous gain
scores in reading and mathematics achievement (as
measured by the ITED), and that the rest of the
secondary population will maintain the academic levels
established in 1969-70.
Evaluation procedures. Based upon the revised performance objectives
and the activities of the 1970-71 Inner City Program (see Table 10) an
evaluation plan was established. The strategy is pictorially definea n
Figure 12 of this report, and involved context definition, monitoring
procedures, and summative evaluation techniques. The following is an
overview, by objectives, of evaluation criteria and methods used to
evaluate the 1970-71 Inner City Program.
Objective 1: To maintain or improve the level of school-parent-
community involvement so that 1970-71 attendance by
Project Advisory Board and Parent Advisory Committee
members in their respective meetings does not
decrease below 75 percent of the level established
during the 1969-70 school year.
To evaluate the level of school-parent-community involvement measured
in objective 1 community needs, parent expectations and staff responsibili-
ties were defined by the Inner City Project Staff at the beginning of the
1970-71 school year. Job functions of paraprofess:onal and certificated
staff members were monitored throughout the first semester by site admin-
istrators and the Inner City Program Evaluator, using interview and
questionnaire techniques. At the end of the school year terminal question-
naires were distributed to PAC and PAB members, paraprofessional and
certificated staff members, and parents from the community.
PAC and PAB attendance statistics for the 1969-70 and 1970-71 school
48
fi

awn
INN
arm
MIL
nom
Log of Goal-Activity Definition
Activity
Coal 1:
To improve the level of involvement between
parents, the school and the community
la
Project Advisory Board
lb
Parent Advisory Council
lc
Parent Counselors (Logan)
Id
Ethno-Cultural Activities
Is
Communication Circulars
If
Community Aides
1g
Clerical Help
lh
School Workshops
Coal 2:
To provide effective English as a SecondLanguage (ESL) and Bilingual
Initruction
2a
English as a Second Language (ESL)
2b
ESL-Redeployment Kindergarten (Sborman)
2c
Language Power Program (Burbank)
2d
Bilingual Program (Lowell)
Goal 3:
To provide effective motivational, personal,
educational and career counseling
3a
Career Motivation (Logan, Lowell, Sherman)
3b
Elementary Courts,
3c
Work-Study Program (Logan)
3d
Educe", Mentally Retarded Redeployment intoRegular Classrooms (Sherman)
3e
Educationally Handicapped Classes for Children
Previously Identified as EMI (Lowell)
3f
Performing Artists
Goal 4:
To provide adequate health and nutritional
services
4a
Dental Program (Logan)
4b
Free Lunch Program
4c
Reduced Cost Lunch Program
4d
Playground Equipment,
Goal 5:
To increase sensitivity andreceptiveness of staff members in the schools to
the problems of students and parents
5a
Open House Programs
5b
Mew Teacher Orientation
5c
Spanish Instruction for Teachers
5d
Teacher Assistants
Goal 6:
To improve the academic performance of pupils
6a
Field Trips
6b
Teacher Assistants
6c
Tutoring Program
6d
Non-Graded Primary (Logcn)
be
Programmed Beading (Logan, Sherman)
6f
Departmental Program (Logan, Sherman)
6g
Enrichment Classes, Grades 3, 5 and 6 (Logan,
Sherman)
6h
Miller Math (Sherman)
6i
Music and Math (Sherman)
63
Non-graded Primary Classes (Sherman)
6k
Fallett Langusii-Frogram (Lowell)
61
Pilot Proj:e, Social Studies (Lowell)
6m
Redeployne
Reading (Logan, Lowell)
6n
Prekindergarten Program (Crockett, Lowell)
6o
Reteaching Reading (Lowell only)
6p
Reteaching Reading (other schools)
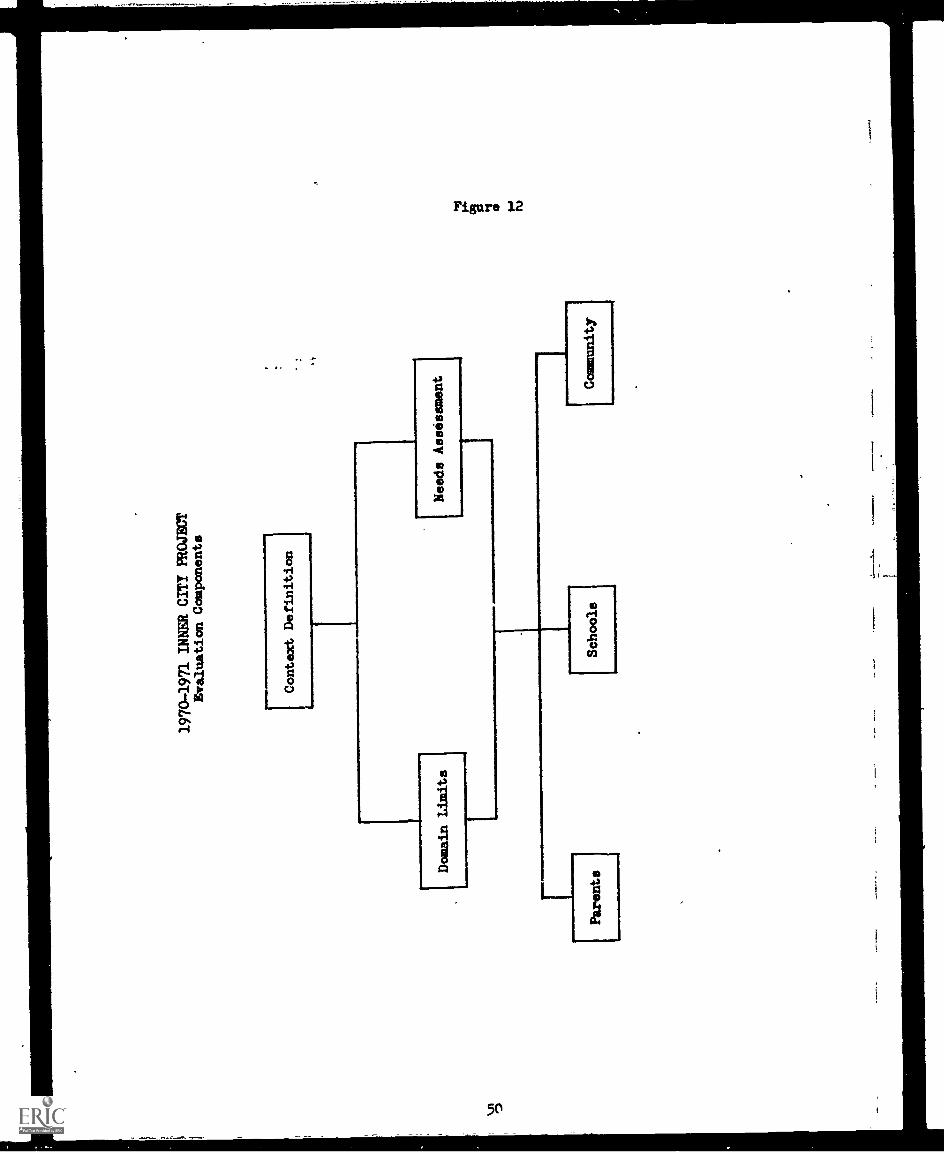
1970-1971 INNER CITY PROJECT
Evaluation Components
{---Context Definition
Domain Limits
1.4
Needs Assessment
Lite
Schools
Community
2 ro

Project Inputs
Goals
Resources
Objectives
criteria
Instrumentation
Parent-School Community
Component
Instructional Services
Component
=11
11.1N
I1Community
Community
Project
Project
Project
Teacher
Coordinators
Aides
Advisory
Advisory
Staff
Orientation
Board
Counsel,
1
&irichment and Supportive
Services Component
in
PInglish
as a
Supplemental
Instruction
Counseling
Services
Health,
Nutritional
Second
Services
Language
Program

Components
[----Program Refinement Techniques
Parent-School-Community
Relations
Instructional Service
Effectiveness
Enrichment and Supportive
Services Effectiveness
Indicators
Parent Advisory Board and
Perceived Effectiveness
Perceived Effectiveness
Parent Advisory Council
by School Staff Members-
by School Staff Members
Member Interaction
0 M.0
fU O et
Monitor and
Feedback
Procedures
Observation and Consultation
by Inner City Staff Members
Anal.Tois of Process
Evaluation Lotivity
Checklist Results and
Informal Interviews by
Inner City Staff
Embers
Analysis of Process
ftaluation Activity
Checklist Results and
Informal Interviews by
Inner City Staff
Members

Product Evaluation
Instrumental knalysia
Parent-School-Community
Component
Instruction
Component
IIII1
I,IIM
IIMM
MM
OM
IMaa
11.
Enrichment and Supportive
Services Component
Consequential AnalyAs
Goal
One
Goa3
Two
Goal
Three
Goal
Four
Goal
Seven
Goal
Five
Goal
Six
a 0
Goal 1:
To improve the level of involvement between
parents, the school and the community.
Goal 2:
To provida effective English as a SecondLanguage (ESL) and BiL.ngual instruction.
Goal 3:
To provide effective motivational, personal,
educational and career counseling.
Goal 4:
To provide adequate health and nutritionalservices that support the physical well-beingand vigor
of children.
Goal 5:
To increase, sensitivity and receptivenessof staff members to the problems of
students and parents.
Goal 6:
To improve the academic performance ofelementary and secondary students.
Goal 7:
To evaluate the 1970-71 Inner CityProject.
a.
-P.

years were also compiled on a monthly basis. Also reviewed were PAC -stall
interaction during budget allocation meetings.
Objective 2: To provide supplemental programs of Englidh as aSecond Language (ESL) and secondary bilingual instruc-
tion in academic areas for students whose language is-
not English so that (a) zero to K-6 rated Spanish-
speaking elementary pupils' will show substantial
tins in English proficiency (as measured by the H-200
r..Acement Test), (b) K-6 and above rated pupils' will
show substantial English reading and language skills
improvement (as measured by the San Diego Elementary
Reading and Language Skills Check List) and (c) the
grade point average of secondary pupils in bilingual
classes will substantially improve to approximate
that of pupils in regular classes within the same
school and in the same academic areas.
To monitor and evaluate this year's Inner City ESL and bilingual in-
struction Elementary ESL Program Information Sheets (see Appendix B) were
send to all. ESL/bilingual teachers in Inner City and :SEA, Title I funded
schools.
With this information received, a method of determining English pro-
ficiency gains and effectiveness indices of paraprofessional help was
defined. Elementary pupils were surveyed with the San Diego City Schools
H-200 ESL Placement Test :end the San Diego City Schools Elementary Reading
and Language Skills Check List (adapted to ESL format) at the beginning and
end of the school year. Both of these instruments are further defined in
Appendix B of this report.
Secondary pupils were not surveyel as extensively. At this level
bilingual classes were observed and grade point averages were secured for
all pupils enrolled in such programs. Since pupils not proficient in
English were exempt from state and district testing, and because the
development of &Si.. testing materials has not progressed beyond the
*As measured by the ESL Placement Test developed through ESE (Title III)
funding, September, 1969.
54

elementary level, no standardized instruments were used at the secondary
level for this evaluation report. This was not considered a shortcoming,
since the majority of pupils in ESL, Inner City classrooms were at the
elementftry lov10.
Objective 3: To provide supplemental motivational, pe sonal, educa-tional and career counseling so that (a) pupils
perceive that they ar:: being helped with their individualproblems and (b) the truancy and unexcused absencerates of pupils will substantially decrease below that
---::of the 1969-70 School year.
As is indicated in objective three, the two methods used to measure the
extent of objective attainment were (a) pupil interviews and questionnaires
and (b) trend analysis of attendance patterns within each of the seven
Inner City schools. Pupil interviews and questionnaires were administered
at the secondary level, while a compilation and analysis of unexcused
absence patterns was conducted at both the elementary and secondary level
throughout the school year.
Objective 4: To provide supplemental health and nutritional servicesthat support physical well-being and vigor so that
75 percent of the designated population will reducetheir previous year's absences due to illness by
25-50 percent.
The measurement of objective attainment concerned with is this objec-
tive was straightforward. Absences due to 'ealth reasons were collected on
every elementary pupil enrolled in Inner City schools for the previous two
years. Descriptive statir,tics were compiled, and an analysis was obtained.
Objective 5: To increise school staff sensitivity and receptivenessto the problems of pupils and parents so that (a) 50percent or more of the defined staff members will showpositive attitudinal changes (as measured by theWithall Social-Emotional Climate Index) 4nd (b) 75percent or more of parents responding will reportpositive attitudes toward the school (as measured byan attitude survey).
55
Parental attitude change was determined through the nse of a U. S.
Mail questionnaire. Current addresses of parents enrolling their children
in elementary and secondary schools were secured, and a random, one-in-
four, sample mailout was conducted. Questionnaires were addressed to the
father with an "Re:" reference of the child's first name typed in the
lower left -hand corner. If the father was not in the home the envelope
was addressed to the mother or relative of the same address as the child
on the school census card. The questionnaire was of the same format as
used for the previous year's evaluation efforts. Thus, baseline response
profiles of parental attitude toward school was defined in this report to
be 1969-70 parent questionnaire responses.
The measurement of school staff sensitivity and receptiveness to
pupil problems was conducted in randomly assigned classrocms. An observa-
tion and interview schedule was defined for a proportionally allocated
random sample of Inner City teachers. Time of day, subject, and grade
level were considered in defining the classrooms to be observed. A
beginning and end-of-year observation period plus an end of year interview
session was scheduled with fifty teachers in this phase of the evaluation.
Using the Withall Social-Emotional Climate Index and recording teacher
statements, learner-centered versus teacher-centered talk was classified
at each of the two visitation periods on a one-to-seven continuum. The
index was defined in each instance as the ratio of the number of weighted
learner-centered statements (categorical ranks one, two and three) to the
total number of weighted statements categorized (categorical ranks one
through seven). A complete description of the Social-Emotional Climate
Index is given in Appendix C of this report. Derivation of specific
indices is presented in Chapter III below.
56

I
I
I
I
i
1
Objective 6: To evalt:_fa the extent of instrumental and consequen-tial goal attainment of the project, as reflected
through the revised performance objectives of the
project.
Objective 7:
(a) To improve the performance of elementary pupils in thebasic skills of reading and mathematics so that therewill be substantial increase in mean achievement fromOctober to May, 1971, and that 60 percent of such pupilswill show a greater gain from October to May, 1971 thanfrom October to May, 1970 (using an acceptable set of
achieiement tests).
(b) To improve the performance of junior high schoolpupils so that pupils will improve their reading andmathematics achievement (as measured by the CTBS) toa degree that will apnroximate one-half the differencebetween the current profile and the test profile for
the district.
(c) To improve the performance of secondary pupils so thatthe lower 25 percent of the senior high school popula-tion will maintain or exceed their previous gainscores in reading and mathematics achievement (asmeasured by the ITED), and that the rest of thesecondary population will maintain the academic levels
established in 1969-70.
These objectives are straightforward and require no further criteria
definition. Chapter III below includes data analysis procedures and
criteria related to both objectives six and seven. Listed in Table 11 are
the standardized tests and administration dates utilized in measuring objec-
tive seven.
57

7_
Table 11: Testing Schedule for 1970-71 Inner City Project
Grade1970-71
Level Test Pre Post
Pre-K Peabody Picture Vocabulary Test Oct. 1-15 May 1-15
Caldwell Preschool Inventory Oct. 1-15 May 1-15
1. Cooperative Primary Tests Jan. 1-15 N sr 1-15
(Reading and Math subtests) Form 12B Fo:m 12A
2 Cooperative Primary Tests, Form 12B
(Reading and Math subtests) Oct. 1223
Cooperative Primary Tests, Form 23A May 1-15
(Reading and Math subtests)
Stanford Pri. II, Form W(Reading and Math subtests) May 15-30
3 Stanford Primary II Oct. 1-15 May 1-15
(Word meaning, Paragraph meaning;Arithmetic Computation and Concepts) Form W Form X
4 Stanford Intermediate I, Form W
(Word meaning, Paragraph meaning;Arithmetic Computation, Concepts and
Applications) Oct. 1-15 May 1-15
5 Comprehensive Tests of Basic Skills
Level 2, Form Q(Reading, Language and Arithmeticsubtests) Oct. 1-15
6 Comprehensive Test of Basic Skills
Level 2, Form Q(Reading, Language and Arithmeticsubtests only) Nov. 1-15 May 1-15
7 Comprehensive Test of Basic Skills
Level 3, Form Q(Reading, Language and Arithmetic
subtests only) Nov. 1-15 April 19-30
Comprehensive Test of Basic Skills
Level 3, Form Q(Reading, Language, and Arithmeticsubtests only) Nov. 1-15 April 19-30
9 Comprehensive Test of Basic SkillsLevel 3, Form Q(Reading, Lanmace and Arithmeticsubtests only; Nov. 1-15 May 3-14
10 Iowa Tests of EducationalDevelopment, Form Y -Nov. 16-24
(Tests 1, 2, 3, 4 and 5)
12 Iowa Tests of EducationalDevelopment, Form X-4 Nov. 16724
(Tests 1, 2, 3, 4 and 5)
58

RESOURCES
Teaching Faculty, Paraprofessionals and Re6ource Personnel. In
general, the majoAty of certificated teachers within Inner City schools
were hired and financed through -egular district funds. Of approximately
360 certificatedteachers in the seven Inner City schools, three senior
high, three junior high-and seven elementary certificated teachers were
financed through the Inner City Program.
Paraprofessional staff positions funded under Inner City are given in
Table 12. This category involved the greatest number of individuals working
with children in the classroom. Basic Inner City funding provided thirty-
nine paraprofessional positions. Parent-pponSored PAC action provided
nineteen more individis in five of the seven schools.
Instructional and Community Aides were selected from the Inner City
community. They were assigned to specific classroom teachers and were re-
sponsible for assisting the teacher in the instructional program and acting
as a liaison between the school and community members.
Instructional and community aide duties included:
(1) Explaining classroom and school activities to parents and other
members of the community.
(2) Supervising students on regularly scheduled buses and on field
trips.
(3) Assisting in the development, preparation, and assembly of
classroom materials.
(4) Assisting in the collection of audio-visual and other instruc-
tional aids.
(5) Operating audio-visual equipment.
(6) Preparing bulletin board displays.
(7) Arranging classroom science and art exhibits.
(8) Taking class attendance.
(9) Assisting in pupils orientation and tutoring.
59

0
;MO
M..
Table 12
Paraprofessional Staff Funded Under the 1970-71 Inner City Project
School
Job Title
Number
Positions s
Total Hours/Week
Assigned to School*
Position
Sponsorship, Inner City
Project (ICP) or Parent
Advisory Council (PAC)
Burbank
Instructional Aide
I30
ICP
Instructional Aide
115
PAC
Instructional Aide Trainee
5102.5
ICP
Teacher Assistant
230
ICP
Sub Total
9177.5
8-ICP, 1-PAC
Crockett
Instructional Aide
10
219.5
9-ICP, 1-PAC
Sub Total
10
219.5
9-ICP, 1-PAC
Logan
Community Coordinator
1.
40
ICP
Community Aide
130
ICP
Instructional Aide
370
ICP
Sub Total
5140
5-ICP
Lowell
Instructional Aide
375
2-ICP, 1-PAC
Instructional Aide Trainee
345
PAC
Student Helper
112
*PAC
Sub Total
7132
2-ICP, 5-PAC
rSi*...Trman
Instructional Aide
6180
ICP
Sub Total
6180.
6-ICP
Memorial
Instructional Aide
130
PAC
Community Aide
6170
PAC
Teacher Assistant
120
PAC
Sub Total
8220
8-PAC
San Diego
Community Coordinator
i40
ICP
Instructional Aide
380
ICP
Community Aide
280
ICP
Community Aide Trainee
11
190
2-ICP, 3-PAC
Teacher Assistant
250.5
1-ICP
1-PAC
Sub Total
13
1,-,.
440.5
9-ICP, 4-PAC
Grand Total
58
1509.5
39.ICP, 19-PAC
*As of March, 1971.
Source:
Inner City Project Office.
imam
'UM
WO
NN
Ole
wat
tIm
mo*
moo
mm
iIm
mw
er!

There was no educational requirement that aides had to meet.. Each
aide did participate in an interview conducted by the project staff and
was provided with inservice training by their individual certificated
teachers.
Teacher assistants differed from community/instructional aides in
professional training and duties. Unlike aides the teacher assistants
were enrolled as students in a cooperating California teacher training
institution and possessed a current "Temporary Teacher Assistant Certi-
ficate" issued h:f the San Diego County Board of Education.
Inner City teacher assistants were responsible for assisting the
classroom teachers in:
(1) Preparing instructional materials for experiment or display.
(2) Correcting papers and tests.
(3) Providing assistance to pupils in individual or group projectsand in individual makeup and home assignments.
(4) Demonstrating for pupils the operation of science equipment.
(5) Assisting pupils in the use of library facilities.
(6) Tutoring pupils in individual music, art and sports activities.
(7) Developing bulletin board materials.
(8) Controlling pupil conduct in the classroom and on school grounds.
(9) Supervising pupil assemblies, excursions, lunch and other "free
periods."
(10) Accomplishing c]erical chores not ordinarily given to aides.
Full-time resource personnel provided by the Inner City Project in-
cluded:
1 - Project Director for Administrative Operation of all sevenInner City schools.
1 - Assistant Project Director.1 - Intermediate Secretary to the Director.1 - Junior Secretary to the Assistant Director.1 - Program Evaluator.1 - Elementary School Counselor.
1 - Community Coordinator.2 - Junior Clerks.
61

1 - Teacher on Special Assignment for Program Information and Com-
munity Coordination.2 - Vice Principals for Pupil-School-Community Relations at San
Diego High School.
All of the above positions were filled with the assistance of the
Personnel Department of the San Diego City School District. Contracts
for the positions were let on a one-year basis.
Financial Budget. Expenditure categories and amounts for the terminal
year of the Inner City Program were basically the same as those of the
previous two years. Monies were alloted to individual parent advisory
committees, as well as budgeted for salaries and services, through the
Inner City Project Office. The extent of this budget prohibits total
inclusion into this report. Interested readers who desire a more com-
plete description than was presented in Chapter I of this report are ad-
vised to review the Budgetary Statement Report for the 1970-71 Inner
City Project on file with the San Diego City Schools.
62

CHAPTER III
TERMINAL PRODUCT EVALUATION
Reealts and Discussion
Objective one: To maintain or improve the level of school-parent-
community involvement so that 1970-71 attendance by Project Advi-
sory Board and Parent Advisory Committee members in their respec-
tive meetings does not decrease below 75 percent of the level es-
tablished during the 1969-70 school year.
A review of Table 13 indicates that objective one was accomplished:
Supplemental evidence supporting the contention that parent-school-
community involvement was extensive in 1970-71 may be further derived
from information related to communication activities, open house activities,
perceptions of the worth of parent groups by school personnel and the ex-
tent of PAC involvement within the third year Inner City Program.
During the three-year period, from 1968-69 through 1970-71, thirteen
issues of the Inner City Newsletter were printed and distributed to parents,
school staff members, community groups, and civic organizations throughout
the city of San Diego. Five issues were printed the first year, and four
issues were published the second and third years. A total of 92,000
copies of the Newsletter were printed during the three-year period. The
last Newsletter to be published is given in Appendix D.
In addition to the Newsletter, two brochures entitled "Of Course I
Care" (12 pages) and "Innovations and Involvement: The Inner City Project
in Review" (24 pages) were also published by the Inner City Project Staff.
Dates of community meetings and FAC voting information were also announced
in news broadcasts by local radio stations in San Diego and Tijuana, Mexico.
Two local television stations devoted broadcast time tc Inner City Project
definition and analysis. Six local newspapers also featured news and
photos of the Project to the extent of over 9,000 column inches (see
Table 14). Other dissemination,activities included a descriptive article
in the August 14, 1970 issue of The Christian Science Monitor and extensive
63

Table 13
Number of PAC and PAP Members in Attendance
at 1969 -70 and 1970-71 PAC and PAB Meetings
School (N)
9/69
n(%)
10/69
n(%)
11/69
n(%)
12/69
n(%)
1/70
n(%)
2/70
n(%)
3/70
n(%)
/!/70
n(%)
5/70
n(%)
6/70
n(%)
Total
nAverage
n/10
.75(n/10)
PAC
Burbank (5)
4( 80)
5(100)
5(100)
5(100)
5(100)
5(100)
5(100)
4( 80)
5(100)
--'
43
4.3
3.2
Crockett (5)
5(100)
5(100)
5(100)
3( 60)
5(100)
5(100)
4( 60)
3( 60)
4( 80)
4( 80)
43
4.3
3.2
Logan (7)
6( 86)
7(100)
7(100)
7(100)
7(100)
7(100)
7(100)
5( 71)
6( 86)
6( 86)
65
6.5
4.9
Lowell (5)
5(100)
5(100)
4( 80)
5(100)
4( 80)
5(100)
5(100)
5(100)
5(100)
5(100)
48
4.8
3.6
Sherman (7)
6( 86)
7(100)
6( 86)
5( 71)
5( 71)
5( 71)
5( 71)
6( 86)
6( 86)
6( 86)
57
5.7
4.3
Memorial (9)
6( 67)
6( 67)
6( 67)
7( 78)
4( 44)
7( 78)
7( 78)
6( 67)
5( 56)
4( 44)
58
5.8
4.3
San Diego (9)
9(100)
9(100)
9(100)
9(100)
8( 88)
8( 88)
9(100)
6( 67)
6( 67)
6( 67)
79
7.9
5.9
PAB (17)
15(88)
11(65)
14(82)
14(82)
11(65)
10(59)
12(70)
10(59)
13(77)
9(53)
119
11.9
8.9
Total
(64)
56(88)
55(86)
56(88)
55(86)
49(77)
52(81)
54(84)
45(70)
50(78)
40(62)512
.__
*No meeting held.
WA
*Ir
Tfl
or,/.
.114
WW
I/40
1.,
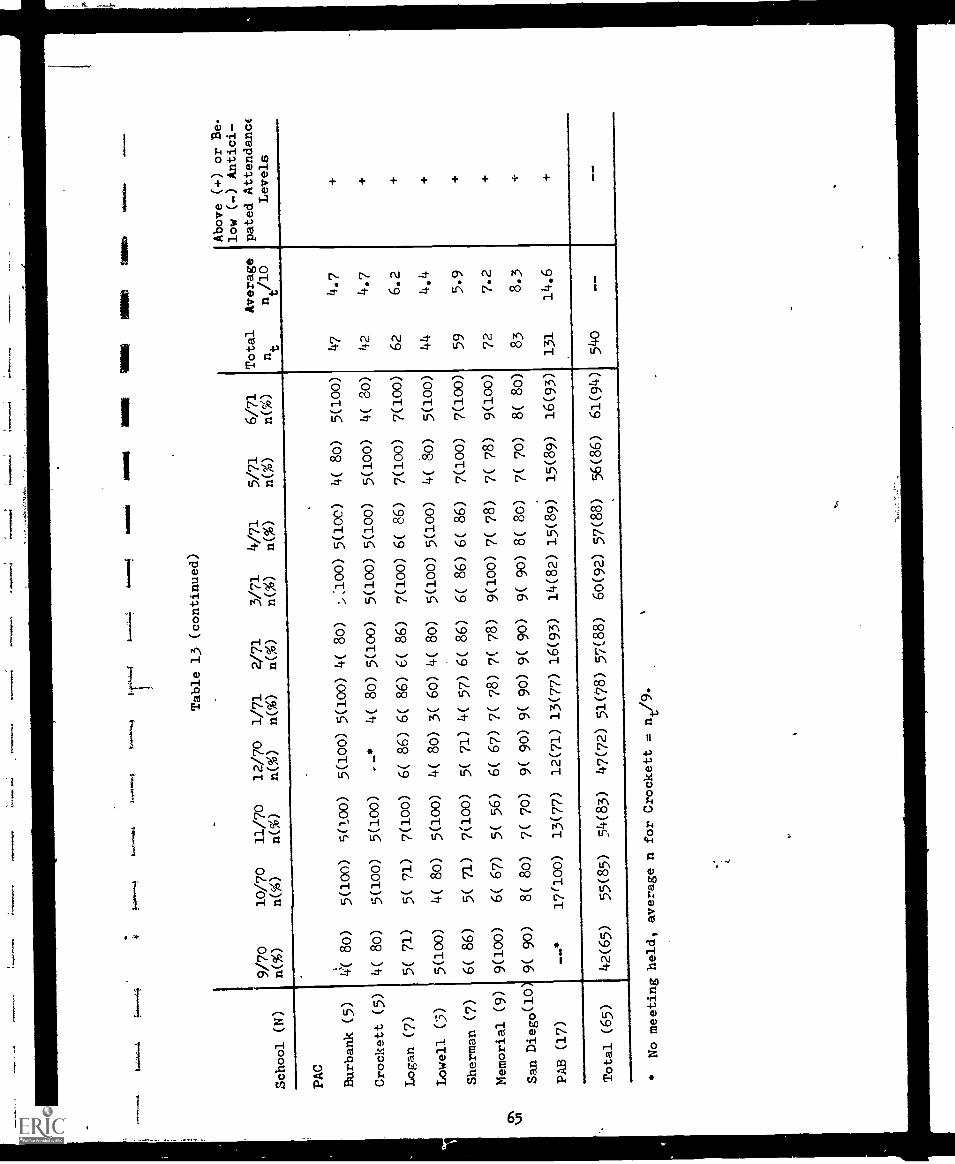
Table 13 (continued)
UM
me
mar
School (N)
9/70
n(%)
10/70
n(%)
11/70
n(%)
12/70
n(%)
1/71
n(%)
2/71
n(%)
3/71
n(%)
4/71
n(%)
5/71
n(%)
6/71
n(%)
Total
nt
Average
nt/10
Above (+) or Be-
low (-) Antici-
pated Attendance
Levels
PAC
Burbank (5)
4;( 80)
5(100)
5(00)
5(100)
5(100)
4( 80)
>,100)
5(100)
4( 80)
5(100)
47
4.7
Crockett (5)
4( 80)
5(100)
5(100)
4( 80)
5(100)
5(100)
5(100)
5(100)
4( 30)
42
4.7
Logan (7)
5( 71)
5( 71)
7(100)
6( 86)
6( 86)
6( 86)
7(100)
6( 86)
7(100)
7(100)
62
6.2
Lowell (5)
5(100)
4( 80)
5(100)
4( 80)
3( 60)
4( 80)
5(100)
5(100)
4( 80)
5(100)
44
4.4
Sherman (7)
6( 86)
5( 71)
7(100)
5( 71)
4( 57)
6( 86)
6( 86)
6( 86)
7(100)
7(100)
59
5.9
Memorial (9)
9(100)
6( 67)
5( 56)
6( 67)
7( 78)
7( 78)
9(100)
7( 78)
7( 78)
9(100)
72
7.2
ON
\J1
San Diego(10)
9( 90)
8( 80)
7( 70)
9( 90)
9( 90)
9( 90)
9( 90)
8( 80)
7( 70)
8( 80)
83
8.3
-i-
PAB (17)
__*
1'7(
1w)
13(77)
12(71)
13(77)
16(93)
14(82)
15(89)
15(89)
16(93)
131
14.6
+
Total (65)
42(65)
55(85)
54(83)
47(72)
51(78)
57(88)
60(92)
57(88)
56(86)
61(94)
540
*No meeting held,
average n
for Crockett = nt/9.

photography activity involving public exhibits of school-related photo-
graphs.
An open house, defined as highly successful by the majority of PAC
members at each of the seven schools, was also held May 2, 1971 at the
Logan School auditorium. Approximately 300 parents and community members Ase,Vet
attended. Displays at the affair emphasized PAC roles and responsibilities
in providing health and nutritional services, and in advising school mem-
bers in pre-kindergarten, kindergarten, chorus, reading, and mathematics
programs. An overview of the open house program and the extent of dis-
semination activities suggest that the Inner City Project staff attempted
and succeeded in involving parent representatives and informed community
members in meaningful activities during the 1970-71 school year.
Table 14
Local Newspaper Coverage of Inner CityActivities from September, 1968 through May, 1971
Publication
No. of articles/photos68-69 69-70 70-71 Total 68-69
Column Inches69-70 70-71 Total
Voice-Viewpoint 23 35 4199
735 1199 1473 3407
S.D. Union 15 19 l0 44 483 780 533 1796
Evening Tribune 26 32 16 74 521 694 982 2197
S.D. Independent 12 12 8 32 281 175 255 711
Staff Bulletin 9 13 6 28 131 343 90 564
Miscellaneous Z 2 12 gi 200 464
Total 92 113 93 298 2351
__22
3221
_224
3567 9139
There is also substantial evidence suggesting that the majority of
school personnel considered such parent-oriented activity to be worthwhile
and functioning. Tables 15, 16, 17 and 18 support this conclusion.
In private interviews with a random sample of classroom teachers
at both the elementary and secondary levels, the majority of teachers
expressed that they thought parent participation activities were necessary
and useful in teaching their Inner City youngsters. Definition of the
ways in which parents assisted teachers included (in rank order of fre-
66
t
Sir

,
1
Table 15
Necessity of Parent Involvement for Successful Instruction of
Inner City Youngsters, as Perceived by Inner City Classroom Teachers
Elementary (n=21)
NotNecessary Necessary Undecided
n (%) n (%) n (%)
17 (81) 3 (14) 1 (5)
Secondary (n=22)Not
Necessary Necessary Undecidedn (%) n (%) n (%)
17 (77) 1 (5) 4 (18)
Table 16
Worth of Parent Involvement for Defining the Teacher's Role
in the Schools, as Perceived by Inner City Classroom Teachers
Elementary (n=21)
Positive Negative Undecided
n (%) n (%) n (%)
19 (90) 1 (5) 1 (5)
11.
67
.1=11
Secondary (n=22)
Positive Negative Undecided
n (%) n (%) n (%)
11 (50) 3 (14) 8 (36)

I
1
Table 17
13xtent of School-rarcant-Community Involvement Durinfr the 1970-71 School Year
(compared to 1967-68), as Perceived by Momentary School Personnel*
Percent Return = 48%
Classroom
Auxiliary
Teacher
Administrators
Counselors
Teachers
Teachers
Assistvtts
n (S)
n (^ ;)
n (%)
nn
Greater than
in 1967-68
3 (100)
59 (80)
3 (100)
Less than
in 1967-68
4 (05)
Nv response
11 (15)
S
r'nmmun4ty
1_
Other**
Total
1i)
n C4)
n (74)
0011
1.11
1M
15 1 4
(75)
(05)
(20)
86 6
1
(80)
(06)
(14)
107
100)
Question asked:
"In your professional opinion, has the 3 year Inner City Project increased the level of
school-lArent-community involvement over what it was during the 19o1-68 school year."
Nurses, cadet-teachers, instructional aides
ImmO
NMI
IMO'
AMIN
L. Imo
ammo
eammo
mom0
mom*
loaa
=Om
ammo
ommo
smog
4

Table 18
Extent of
School-Parent-Community Involvement
During the 1970-71 School
Year
(compared to
1967-68), as Perceived by Secondary
School lersonnel*
Greater than
in 1967-68
Less than
in 1967-68
No response
Percent Return = 50%
Classroom
Auxiliary
Teacher
Community
Administrators
Counselors
Teachers
Teachers
Assistants
Aides
Other**
Total
n (%)
n (%)
nn (%)
n (%)
n (%)
,n (-26)
n
4 (67)
1 (1
7)
1 (1
7)
17 (94)
1 (06)
76 (64)
15 (13)
28 (24)
12 (30)
4 (10)
24 (60)
1(78)
123 (61)
1 (o6)
22 (11)
3 (17)
56 (29)
201 (101)
'Question asked:
"In your professional opinion,
has the 3 year Inner
City Project increased thelevel of
school-parent-community involvement overwhat it was during the
1967-68 school year?"
**Nurses, cadet - teachers,
instructional aides

quency) defining home problems, increasing communication between the parent
in a non-hostile setting, and increasing the pupil's motivation toward
school by letting him know his parent was interested in what he was doing.
When asked: "How would you char e or continue to manage the u-y in which
parents are involved in your school?", the consensus at the elementary and
secondary levels was that the parents in parent aide programs needed more
in-service instruction and that tthe PAC concept should be vigorously sup-
ported by the Board of Education after the final federal funding year.
Further advice, given by school staff members, or how Board-sponsored
PAC'S in this and other school districts should be initiated and maintained
included:
(1) Periodically reminding the Parent Advisory Council members that
they have responsibilities to the total school population.
(2) Conducting an educational campaign to inform the community before
starting new programs.
(3) 134ecking with the community first to see if there is interest
enough in having a Parent Advisory Council.
(4) Setting up standards, duties and exact meeting times for the
councils to meet.
(5) Being positive and involving as many parents as possible.
(6) Letting the parents have the power as well as the authority
to act.
(7) Encouraging teachers to participate with the PAC.
(8) Trusting the intelligence and concern of the advisory council
and do not withhold professional guidance when parents ask for
it.
(9) Having a few practice meetings with PAC and teachers before final
proposals are submitted at the beginning of the first year.
(10) Making sure the parents know the total amount of money they
can spend per category at the beginning of each school year.
(11) Checking to see how many parents have trouble speaking English,
then providing some way at the first meeting to make these
peoples feel they belong and are able to contribute.
70

(12) Holding a paid, week-long workshop for parents of the PAC and
showing them how to organize their meetings, spend their money
according to education code specifications, and relate to others
in the community and the schools.
Reacting to the question of what needs PAC and PAB members should
most be concerned with, the majority of members ranked improving reading
and mathematics scores, improving counseling services and establishing
.parent advisory groups. Table 19 presents these need priorities in detail.
Finally, with regard to parental judgements within the community,
the vast majority of respondents to the U.S. Mail questionnaire referred
to in Chapter II expressed continued satisfaction with their individual
schools with reference to the specific expectation categories shown in
Tables 20 and 21.
Combining these findings it may be concluded that school members,
parents, and community members all perceived their involvement with one
another as useful. Parent respondents to questionnaires and school per-
sonnel in private interviews expressed satisfaction of and support for
the Parent Advisory Council concept, and the majority of respondents who
had direct contact with the Inner City Project staff expressed (in an
interview situation) that they perceived interaction between the community
and the schools to be positiVe (see Table 22).
71

Table 19
Inner City Project Need Priorities, as Perceived by 1970-71Parent Advisory Board Members (November, 1970)
Rank in orderof importance
Drop
Need Priorities n (%)
Keep
n (%)
Abstension
n (%)
1 Improved pupil reading skills 0 (.00) 29 (.97) 1 (.03)
2 Improved counseling services 0 (.00) 29 (.97) 1 (.03)
3 Established PAC in each school 0 (.00) 29 (.97) 1 (.03)
4 Improved pupil mathematics skills 1 (.03) 28 (.93) 1 (.03)
5 Improved community involvement 1 (.03) 28 (.93) 1 ,.03)
6 Established ---) 2 (.07) 26 (.87) 2 (.07)
7 Cultural enrichment trips for pupils 4 (.13) 26 (.87) 0 (.00)
8 Storefront office 4 1.13) 26 (.87) 0 (.00)
9 Cultural and Educational extra-curricular activities 3 (.10) 25 (.83) 2 (.07)
10 Paraprofessional aides in the
classroom 5 (.17) 22 (.73) 3 (.10)
11 ESL program for pupils whose nativelanguage i-: not English 3 (.10) 24 (.80) 3 (.10)
12 Bilingual program for secondary pupils
(Spanish) 3 (.10) 24 (.80) 3 (.10)
13 Prekindergarten classes 2 (.07) 23 (.77) 5 (.17)
14 Inner City Project Newsletter 5 (.17) 23 (.77) 2 (.07)
15 Additional certificated teachers in
the classroom 6 (.20) 23 (.77) 1 (.03)
16 $10 per month per meeting for PABand PAC members 5 (.17) 22 (.73) 3 (.10)
17 Pupil dental aid medical care 7 (.23) 22 (.73) 1 (.03)
18 Free lunch for needy pupils 7 (.23) 22 (.73) 1 (.03)
19 Inservice education for certificated
personnel 6 (.20) 22 (.73) 2 (.07)
20 Instructional materials and supplies 5 (.17) 22 (.73) 3 (.10)
21 Teacher assistants and aides fromthe community 7 (.23) 21 (.70, 2 (.07)
22 Nursing Services 7 (.23) 21 (.70) 2 (.0?)
23 Psychological Services 8 (.27) 20 (.67) 2 (.07)
24 Speech Therapist Services 6 (.20) 20 (.67) 4 (.13)
25 Discretionary funding of teacherprojects by PAC 10 (.33) 19 (.63) 1 (.03)
26 Capital outlay and equipmentpurchase 11 (.37) 16 (.53) 3 (.10)
27 Building remodeling and construc-
tion 13 (.37) 15 (.50) 2 (.07)
--

I
1,
Table
20
Decree of Satisfaction Expressed by Parents ofElementary Pupils Attending
Inner City Schools in May, 1971, as Measured byU.S. Mail Questionnaire Returns
Expectation Categories
Individualized Pupil
Attention
Pupil's Academic
Progress
Pupil's Guidance
Pupil's Motivation
Parent's Welcome to
School
Role Within the
Community
Information Outflow
Percent Return
Burbank,
Crockett
Yes (%)
No (%) Yes (5) No (o)
22 (100) 0 (00) 23 (88) 3 (12)
22 ( 96) 1 (04) 23 (88) 3 (12)
23 (100) o (oo) 24 (92) 2 (08)
2] (100) 0 (CO) 23 (92) 2 (08)
Schools/Satisfaction Categories*
Logan
Lowell
Yes (%) No (5)'
Yes (%) No (%)
39 (85) 7 (15)
39 (98) 1 (02)
41 (89) 5 (11)
39 (95) 2 (05)
41 (87) 6 (13)
39 (98) 1 (02)
37 (82) 8 (18)
37 (90) 4 (10)
Sherman
Total
Yes (%) No (%)
Yes (%) No (%)
74(99) 1 (92)
197 (92)17 (08)
71 (9o) 8 (10)
196 191)19 (09)
72 (90) 8 (10) .199 (92)17 (08)
70 (87) 9 (13)
188 (89)23 (11)
22 (96)
1 (04) 22 (88) 3 (12)
44 (96) 2 (04)
39 (98) 1 (02)
74 (95) 4 (05)
201 (95)11 (05)
23 (100) 0 (00) 22 (85) 4 (15)
41 (89) 5 (11)
38 (93) 3 (07)
69 (86) 11 (14) 1(,
._9)23(11)
23 (10o) o (oo) 20 (77) 6 (23)
4o (87) 6 (13)
37 (90) 4 (10)
67 (86) 11 (14) 189 (88)2/ (12)
28%
31%
31%
41%
37%
34%
'Different n's per school due to "no response" categories.

Table
21
Decree of Satisfaction Expressed by Parents of Secondary Pupils Attending
Inner City Schools in May, 1971, as Measured by U.S. Mail Questionnaire Returns
Expectation Categories
Individualized Pupil At-tanon'
Pupil's Academic Progress
Pupil's Guidance
Pupil's Motivation
Parent''s Welcome to School
Role Within the Community
Information Outflow
Percent Return
Schools/Satisfaction Categories*
Memorial
San Diego
Total
yes (%)
No (%)
Yes (%)
No (%)
Yes (%)
No (%)
79 (88)
11 (12)
51 (76)
i6 (24)
130 (83) 27 (17)
74 (81)
17 (19)
51 (76)
i( (24)
125 (79) 33 (21)
'79 (89)
10 (11)
53 (77)
16 (23)
132 (84) 26 (16)
66 (77)
20 (23)
46 (69)
21 (31)
112 (73) 41 (27)
82 (96)
3 (04)
57 (86)
9 (14)
139 (92) 12 (08)
78 (91)
8 (09)
48 (70)
21 (30)
126 (82) 29 (18)
78 (86)
13 (14)
55 (82)
12 (18)
.133 (84) 25 (16)
22%
3c
25%
*Different n's ner school due to 'no response" categories

I
Table 22
Description of I. C.1=. Personnel-School-Community Interaction
During the 1970-71 School Year, as Perceived by Inner City Classroom Teachers
High Low
Positive Positive
Elementary
Low High
Negative
High
Positive
Secondary
Low HighNegative
No Contact
with I.C.P.
Personnel Negative
No ContactLow with I.C.P.Positive Personnel Negative
n (%) n (%) n (%) n (%) n (%) n (%) n (%) n (%) n (%) n (%)
5 (24) 5 (24) 10 (47) 1 (5) 0 (0) 0 (0) 2 (9) 20 (91) 0 (0) 0 (0)
75
,

Objective two: To provide supplemental programs of English as a
Second Language (ESL) and secondary bilingual instruction in aca-
demic areas for students whose language is not English so that
(a) zero to K-6 rated Spanish-speaking elementary pupils will show
substantial gains in English proficiency, (b) K-6 and above rated
pupils will show substantial English reading and language skills
improvement and (c) the grade point average of secondary pupils
in bilingual classes will substantially improve to approximate that
of pupils in regular classes within the same school and in the same
academic areas.
Tables 23, 24 and 25 present data used to measure the extent of ob-
jective two attainment. Table 23 shows H-200 achievement test scores for
zero to K-6 rated Snanish-speaking youngsters 4n-prektritiergarten, kinder-
garten, lower primary and upper primary classes. It is apparent from
Table 23 that:
(a) The H-200 test defines growth more precisely at the pre-K and.
K level than at the lower and upper primary grades (s increases
with higher grade levels).
(b) The H-200 test has adequate discrimination power only at the
pre-K and K levels (sk's and Q. scores indicate high positive
skewness at pretesting and high negative skewness at posttesting).
(c) For levels where the H-200 test score appears to be a valid
criterion (pre-K and K) pupils substantially gained in English
profiwiency.
Table 24 indicates that K-6 and above-rated pupils (as measured by
the H-200 test) showed substantial English reading and language skills
improvement in the areas of:
(a) Reading interest
(b) Word attack skills
(c) Reading comprehensicn
(d) Confidence in speaking
(e) Oral idea expression
(f) '0!ri.ten idea expression
Substantial growth did not occur in word pronunciation. The majority
of pupils were classified in this category as re5taininc low in confidence
76
a

......
vaa
04,0
A,*
Table 23
English as a Second Language
(ESL) H-200 Test Scores from Inner City
'SL Classes, November, 1970 andJune, 1971
Fre-kindergarten
Pretest
Posttest
Raw
Raw
Score
G.L.E.
Score
G.L.Z.
-
Mean
9.46
PK-3 mo.*
16.62
PK-9 mo.
radian
5.12
PK-2 mo.
17.33
PK-9 mo.
ql
4.12
PK-2 mo.
7.12
PK-3 mo.
.3
Q16.91+
PK-9 mc.
23.35
PK -9 mo.
3
s.
7.13
8.57
n.
13
13
sk
1.69
0.53
Kindergarten
Pretest
Posttest
Raw
Raw
Score
J.L.E.
Score
G.L.E.
6.00
4.94
4.18
6.92
4.o6
23 0.89
PK-2 mo.
PK-2 mo.
PK-2 mo.
PK-2 mo.
61.09
52.20
34.42
95.58
29.71
23 0.84
K-5
mo.**
K-4 mo.
K-3 mo.
K-7 mo.
*PK-3 mo. = the equivalent to the oral
Enzlish proficiency of a monolingualEnglish-speaking
during
his third month (3 mo.) of
nrekindergarten instruction.
**K-5 mo. = the equivalent to the
oral -English proficiency of a
monolingual English-speaking child
during
his fifth month (5 mo.) of kindergarten
instruction (F7eneral ESLcurriculum).
***The H-200 test has an upper limit raw score
of 128, equivalent to K-Q mo.
4

Table 23 (continued)
Mean
Median
ql
Q3
8.
n.
Sk
Pretest
Raw
Score
-----
Lower
rimary
G.L.E.
Pretest
Raw
Score
Upper Primary6)
RawPosttest
Score
G.L.E.
(grades 1,
G.L.E.
2,
3)
iosttest
Raw
Score
(grndes , 5,
G.L.E.
13.31
5.32
3.69
16.75
19.25
75 1.50
PK-6 mo.
PK-2 mo.
PK-1 mo.
PK-9 mo.
i
88.69
102.75
47.38
127.95
42.72
75
-0.75
K-6 mo.
K-7 mo.
K-4 mo.
K-9 mo.***
29.38
7.75
1.34
54.25
31.50
37
/I 1.52
K-2 mo.
PK-3 mo.
1--
K-4 mo.
K-7 mo.
101.00
K-7 mo.
33.42
K-3 mo.
127.18
K-9 mo.
44.97
37
-1.44
***The H-200 test has an upper limit raw scoreof 128, eauivalent to K-9 mo.
f.
1
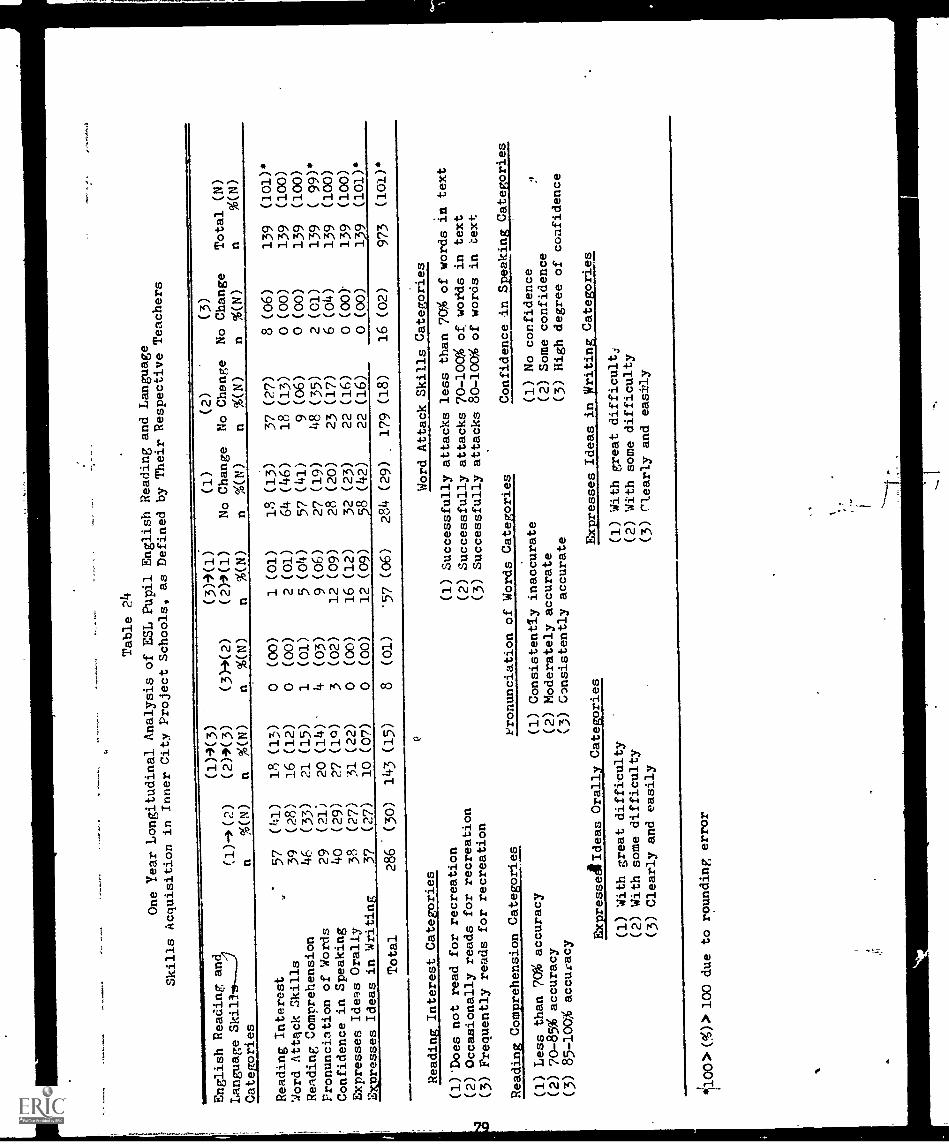
Table 24
One Year Longitudinal
Analysis of ESL Pupil English Readingand Language
Skills Acquisition in
Inner City Project Schools, asDefined by Their Respective
Teachers
English Reading an
Language Skill
Categories
Reading Interest
,
Word Attack Skills
Reading Comprehension
Pronunciation of Words
Confidence in Speaking
Expresses Ideas Orally
Expresses Ideas in Writing
Total
(1)-) (2)
(1)4(3)
(2),(3)
(3)8(2)
(3)i(1)
(04(1)
(1)
No Change
(2)
No Change
(3)
No Change
Total (N)
n%(N)
n%(N)
n%(N)
n%(N)
n%(N)
n%(N)
n%(N)
n%(N)
57
(41)
18
(13)
0(00)
1(01)
18
(13)
37
(27)
8(06)
139
(101)*
39
(28)
16
(12)
0(00)
2(01)
64
(46)
18
(13)
0(00)
139
(100)
46
(33)
21
(15)
1(01)
5(04)
57
(41)
9(06)
0(00)
139
(100)
29
(21)
20
(14)
4(03)
9(06)
27
(19)
48
(35)
2(01)
139
( 99)*
40
(29)
27
(1Q)
3(02)
12
(09)
28
(20)
23
(17)
6(04)
139
(100)
38
(27)
31
(22)
0(00)
16
(12)
32
(23)
22
(16)
0(00)'
139
(100)
3?
(27)
10
(07)
0(00)
12
(09)
58
(42)
22
(16)
0(00)
139
(101)*
286
(30)
143
(15)
8(01)
*57
(06)
284
(29)
179
(18)
16
(02)
973
(101)*
Reading Interest Categories
(1)'Does not read for recreation
(2) Occasionally reads for recreation
(3) Frequently reads for recreation
Word Attack Skills Categories
(1) Successfully attacks less than 70% of words in
text
(2) Successfully attacks 70-1009 of words in
text
(3) Successfully attacks 80-100% of words in
text
Reading Comprehension Categories
Pronunciation of Words Categories
Confidence in Speaking Categories
(1) Less than 70% accuracy
(1)
Consistently inaccurate
(1)
No confidence
(2)
70-85% accuracy
(2)
Moderately accurate
(2)
Some confidence
(3)
85-100% accuracy
(3)Consistently accurate
(3)
High degree of confidence
Expressel Ideas Orally Categories
Expresses Ideas in ylriting Categories
(1)
With great difficulty
(1) With great difficult;
(2)With some difficulty
(2)
With some difficulty
(3)Clearly and easily
(3)Clearly and easily
4i1001>(%)> 100 due to rounding error
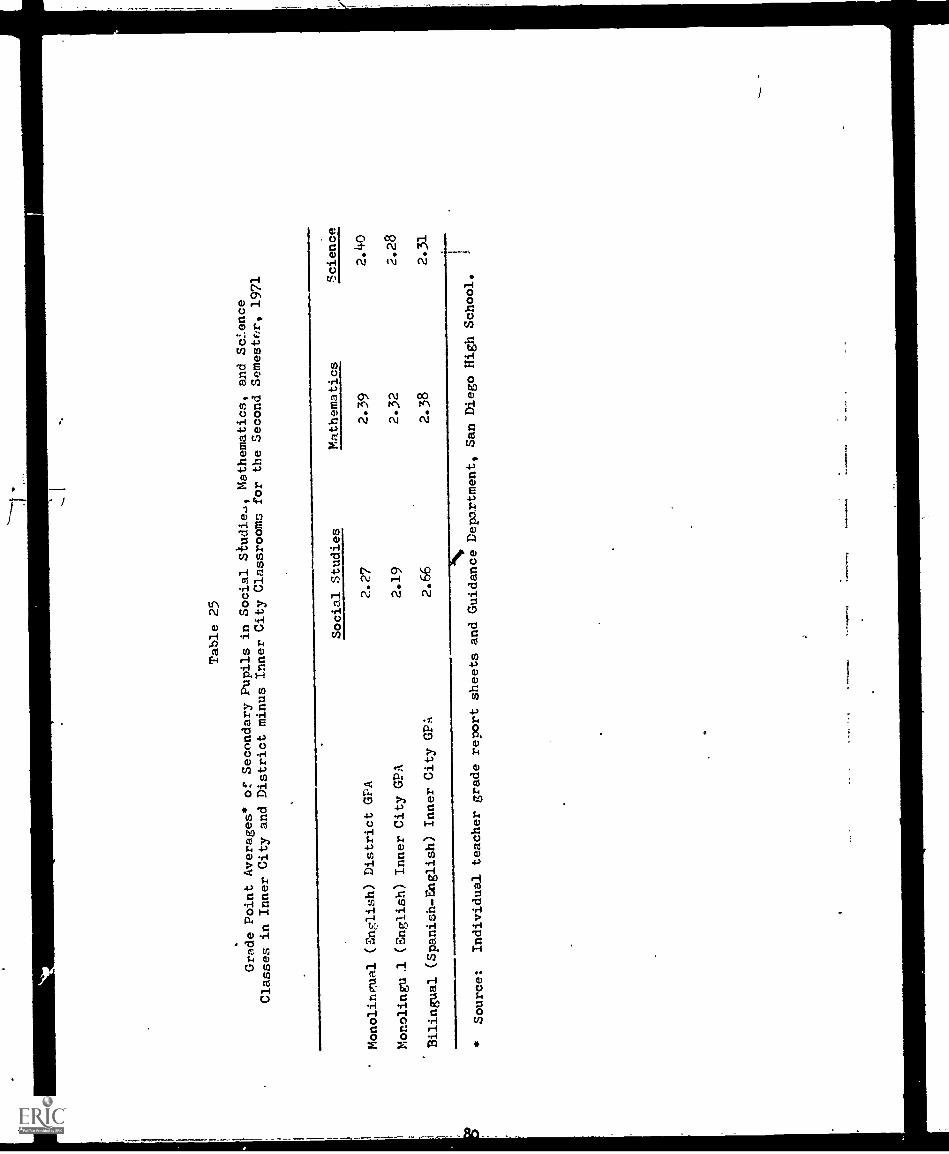
Table 25
Grade Point Averages* of Secondary
Pupils in Social Studie.,, Mathematics,
and Science
Classes in Inner City and District
minus Inner City Classrooms for the
Second Semestfx, 1971
Social Studies
Mathematics
Science
Monolinrual (English) DistrictGPA
2.27
2.39
2.1+
o
Monolingul (English) Inner City GPA
2.19
2.32
2.28
Bilingual (Spanish-English) Inner CityGPA
2.66
2.38
2.31
.*
Source:
Individual teacher grade report sheets andGuidance Department, San Diego High School.
1

throughout the school year.
Table 25 indicates that the grade point averages of pupils in Inner
City-sponsored bilingual classes approximated that of pupils in regular
classes within similar academic areas.
The overall conclusion of this report, based upon the criterion used
to measure the extent of Objective two attainment, is that the ESL objective
of the 1970-71 Inner City Project was accomplished. This conclusion is
further supported by a survey of opinion conducted at the end of the 1970-71
school year. The majority of teachers returning the survey indicated that
the ESL/tilingual program at their school had a positive effect upon
pupil achievement and attitudes. Results of this particular survey are
given in Table ?6. The majority of s.aff members perceived ESL activities
to be .beneficial; and test scores support their consensus.
81

7
Table 26
Effects of the 1=r0-7l :SL./Bilingual Program
A Pupil Attitude
and Achievement,
as terceived by
elementary School Personnel in InnerCity Schools'
Pupil Attitudes
Positive effect
Negative effect
No response
Pupil Achievement
Positive effect
Negative effect
No response
Percent Return = 48%
Classroom
Auxiliary
Teacher
Community
Administrators
Teachers
Teachers
Assistants
Aides
Other"
Total
n (5)
n (%)
n ( 4)
n (%)
n (%)
nn
2 (67)
56 (76)
3 (100)
3 (75)
2 (67)
14 (70)
8o (75)
4 (05)
1 (33)
1 (05)
6 (06)
1 (33)
14 (20)
1 (25)
5 (25)
21 (20)
iarTor)
,--
2 (67)
56 (76)
3 (100)
3 (75)
2 (67)
17 (85)
82 (77)
3 (04)
1 (05)
4 (04)
1 (33)
15 (20)
1 (25)
1 (33)
2 (10)
221122
1o6 (no)
'Question asked:
"Assuming that an ESL/Bilingual pi,,gramexists at your school and that at least someof
your pupils are affected
by such instruction, has theESL/Bilingual program had a positive
or negative effect upon your
pupils' achievements and attitudes?"
"Nurses, cadet-teachers, i_Istructional
aides
fIV

Objective three: To proiide-supplemental motivational, personal,educational-- And career counseling so that (a) pup.J.s perceive thatthey are being helped with their individual problems and .6:0 thetruancy and unexcused absence rates of pupils will substantiallydedreaieteloW that of the 196970 doheol
Through additional federal funding San-Diego senior and Memorial
juniOr high schoola were able to-proiide educational, career, personal,
-and motivational counseling to a greater extent than other, non 6.-tSEA
*no-61a during the 1970-71 year. The number of pupils per counseling
for San Diego and Memorial were 207.6 and 149.5, respectively. these
figures CoMpare lOWer than the average of :35.1_and 419,4-_tor all other
*ii-OtA senior and junior high--schools- in the city. They were also well
Blow the counseling ratios reported* other large-city Sehoo1ayateMs.in_
e-.Spring=611970'(060-tabie
Title III funds -for counseling services atSan Diego -and Memorial were
used to supplement district-furied staff absignments, thus potentially
making more counselors available to pupils at San Diego where-10.1 full=
time positions were supplied by the district, and 0.7 were supported through
Inner City funds. At Memorial 0.7 tulltime positions were supplied by
the district, and 3.6 were funded through ESt1 prograMq;
The counseling activities provided by the 1976-71 ftin0 City Project
included educational, career, personal, and motivational guidance services
to pupils.
Through educational counseling, pupilS received asaiaande in:
(a) defining edUcation goals and in making decisions related to theirgoals,
(b) Securing information covering requirementa of successful per-fortance in different courses of study, promotion, graduation,and college entrance rectuitcnients,
(c) iMMeaidte education Planning (course soheduling-and alteratient)i
(d) Setting personal, edudational performance standards,
(d) meeting-school personnel for individual conferenceS, and
(f) partidipating in specialized educational programs with their parents.
83tt
V.

table-
Comlierisdn of ,COUnteiing, Patidal Selected, Large,_
Schota '440teirit in che1
0,0Unteling RatioCity . OUtiit-tii4OnneiOr)-
portland
betitit
Oade,CoUnty (Miami)
Minneapolis
_St.-Louis
410-004,0-'04Y-
646**
Buffalo
'tot ton
Seattle
dincinnati 410_
San -Diego
:34$
350
377
New Orleans 428
Cleveland 436
Pittdbtrgh 446,
Broward COUnty 466
Milwaukee .48.8
ihdianapoli6 -5016'
Lot Angelet 513
HoUttori 600
New York 704
Source: Albert Schultz, pprition of -Pettonnell Milwaukee Public Schools(May, 10704
84

Career counseling activities included:
(a) information diEdemiziatioril.ta-,pupile and P:rents concerning
.career choices and advanced degree.-requirementS,
-(b) instruction in_the prOper tethbd Of-Tilling-6dt jabapplii=
catione4 def-inition_of ohila:laboidnA other pertinent,legal requirements for etbloyittent in the 0n ! biego',area,
assistance in final job placeMent within'thadOmMunitY, and
(d) field trips to community,agencies and businesses: ii the :ditY.
Personal counseling- concentrated upon:
(a) parent contacts with refer-Ono, to_lardPii behaviOrt and achievementlevels,
-(b) pupil counseling, direOted-EOWard eelf4linder=e!
.
terbitstial:CTOTigelyo_imlilem-qinpiles;a01;_and
(d)- individual-deieians7_,Vith pdpite,Whe-have-SeVere-aOhieVeient--orbehavior problems;_ _and
.
(e) private hearings in cases of pupil Okemptiond, edispensiOni,
eipulsions-And reinetatementS:
MotiVational athindeling duties,incidded:
, .
information-la) adieediihation.With,regar&topdpii.PrOgre00.4ndgoals to parents;_teadhire=and:AsiiiiiietratbiS,--
(b) consultation with teadhere and- the interpretation -of teat:adore-Si
(1?pupil protection in-aMergen0y cases ofeuicide threats, child-_beating, sex ate:idea, etc.,-
(d) COopOrative planning-with laW enfOrcementi, mental health, andfamily bervice organizations,- and
r-
(e) adviSing school Staff and PAC tneMbersOn curricular- matters.
When School personnel were asked -to judge the adequacy of the. abotre-
--described counseling; services provided by the district and the Inner City
Project, infortatiOn in Table 28 was obtained. It is apparent from Table.
:g:that the counseling area judged least adequate by counselors and ciatd--.
room teachers was the career category. Opinionated teachers were split
approximately 50-50 in defining motivational and personal service adequacy.

rrlo
a5a,
SaW
14M
:!\7
14'4
";'"
VP:
1'''''
,,'rr
T,
,Str
:r'r
:or
r- r
apfb
.
4
1r
1,
Adequacy of Counseling Service's
in Inner, City Secondary Schools,, nO Perc.ivedr by School Personnel.'
Personal
Adequate
3(5
0)Inadequate
.
NO response.
3(5
0*),
Educational
Adequate
3 (3
0)Inadequate
No
response
'3
(50)
,;3
't
Career
(67)
,Adequate
4
Inadequate,
2(3
3)I
No response
Administrators '
n '(%
)Motivational
'Adequate
.5 (50'
Inadequate
I(117)'
No response
2-
(33)
1'
Percent Return, =
Cla
ssro
omTeacher
Counselors,
TeaChera
,Assistants
_11
.(%
),
I(%
))
,4)
(50'
.4.
',,-
E/1
5)'5
(12)
,'7
''(3
9-),
'.
'55Y
(4):
,,
,05
:,,'(0
),'1
'(06)
}19
'*(-
16)1
'10
, (.0 2
'91
'(S:0
)55
, :(4
4)i
,ii,
'(28)
'6
:(33
)liE
!,','
'(4
0.)'Y
'':i4
i'(3
5):3
' ''(1
3=7)
1!)t
, ,4:
0' 0
'(38
)i'
''6. 1
(56)
'''5,
13;',
'02)
1,'5
'(2
0')L
.38
i'o
Yi4
,ng
x,'
,i,,,'
(35)
,3,(
171,
',,l6
`,:(
43),
,1'.3
'(32)
(
,,''
I
-'6,:
`(33
).4
5:: ,
,4:0
,)::'
;,,a
(20'
',8,
s(tif
rTh
Or'
("4:
?..)
),,
'.'8
',,(.
tc5,
)'ii.
-;0
2Y'
,2k
,l(,2
4,',
'.)14
,.'C
'5/
(39)
3'(1
7)8;
'NO
8; (
44)
10:
,(56
)'
'Others"
Total
n(Z),
n(%)'
1
7`(3
9)72
'(3
6)'
2-(1
1)'8
8: ,
04).
'09,
0)20
11 83(4
1)71
(35)
47(2
4)20
1 (1
90)
99(4
9)57
(28)
(22)
8,(4
4):
I.(o
b)(5
b),
201
(100
)'
71(3
5),
77(3
8)53
(27)
'20
1 (1
00)1
*Question isked:
"Do, you' feel that your StUdentathaVe receiv4adequate MOtpiational,, personal, educational
and career coUnSe1ing this year:"?..
"Nurses, class advisors, cadet-teachers
hmsr
. s'a
vri4g4
14-4
4.11
W+
:44
4yi
mm
ot
Zik
ute,
,,tk,
..*0.
4444
0.04
1:M
44-,
00.0
,474
44,ti
mis
Maa
,41,
4,,,,
A.1
464i
);(
..,4V
v144
:4,',
;,441
-iii±
.444
R0,
1440
144.
4.41
1,'"
4

C01161141464 and administrators voided the.lease-opposition te_piietea*,
,e9ttailiag activity. ThaSsajority of opinion6-0Pre604A-14-peradnnel iii
thee, two areas appeared to be satisfied with present counsbling activities.
Counselors did state,"howeverhat-dareer counseling was in need of-i*"I
prolisient.
Supplementally, the majority of opinianated-fdlaeatooth-teachera and
their college undergraduate testher assistants diso,judged'cateet counseling
to be inadequate. Pititt critical Of this area We're teathenassidtantili
Classroom teachers and assistants were approximately equally split in their
opihions concerning the other three categories. *cd-afiked to define the
worth of the Inner City Project in-defifiing4fipil,needb so th&t,adequate
counseUng could be attempted the inàjorit of oinionáted staff felt that
Wiiii§-,:holpfd1-,666:-Table9f7Afid-3151-.
Unfortunately,, the pupil intèiviès that iyiefiritheatiiedi to .measure
attitudes of counselees toward their -- own- program =_W-at;:tiOt dOndfidted: 'A
prObortionallyaii6Cated::dample-of_166;14apila*adrain,and *Itched with_
parents who received the U.S. Mail terminal evè.luati{oh queationnaire.
However, end-of-year eaMiniStratiVe_duties-prohibited=aite-edMinittratore
from carrying out the ihterViewS4 as planned-.
Considering dfiek&USect,Absende rates of Children and young adults who
had been in their respective-inner City dohools Ibt twO consecutive years,
Tables 31 and 32 indicate-that tOtal unexcused absences increased in most
sdhoOld within most grade leveld.
Table 33 entries are-read Se follows:
Pupils in grade 2 at Burbank elementary school in 1970-71 who attendedthe same school in 1969-70 increased their total unexcused absencesby 14% (froth 178 to 203) from 1969-70 to 1970-71.
Similarly, the data group in the lower tight-hand corner of Table 33
indicates that:
Grade 12 pupils attending San Diego High School for two consecutive
years increased their total unexcused absence rates 0.4% from 1969-70
to 1970-71.
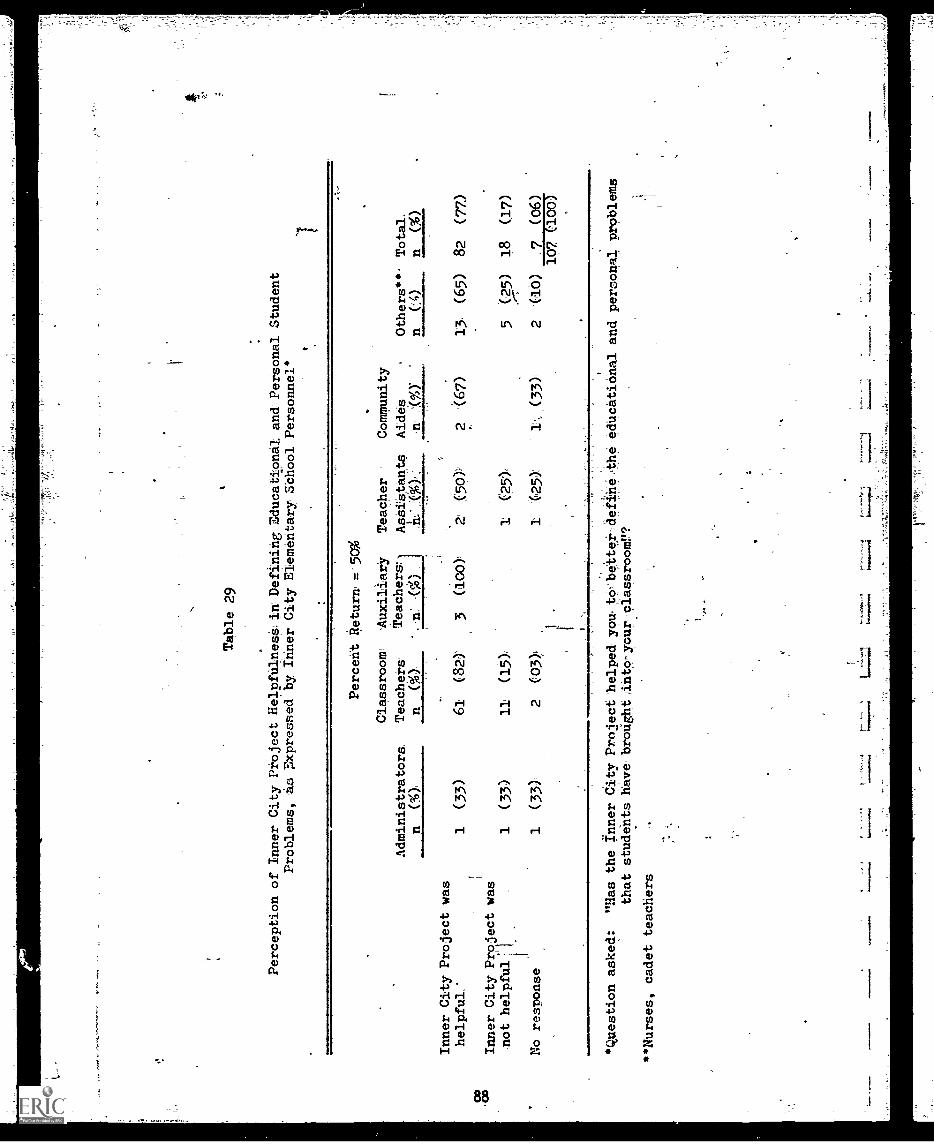
Table 29
Perception of Inner City Project HeIpfulness.in Defining Educational and Personal Student
Problems, as Expressed by Inner City Elementary School Personnel
Percent 'Return, ='50%
Classroom
Auxiliary
Teacher
Community
n(%/
Teachers
Teachem)
, ln."
i(%)
.
Assistants .,Aides
n ,(0,
.11..A%),.'
,n
,,(,..g
nC.4)
n(%)
Others**- Total.
Administrators,
Inner City Project was
helpful'
1(33)
61
(82)
3(100)'
2 (5a
(67)
13
(65)
82
(77,)
[
Inner City Project was
not helpful'
1(33)
11
(15)
1(25)
5(25)
18
(17)
No response
1(33)
2(03 )
1(25)
(33)
2(10)
7(06)
ToTTE557
*question asked:
"Has the Inner City Project helped you,to, better-define the educational and personal problems
that students have broUght.into-your classroom!'?
**Nurses, cadet teachers 1
,I
qv

03
,I.*
*14
1110
1.11
1.1.
1,14
Table
30
Perception! of Inner City Project Helpfulness in Defining Educational and Personal Student
Problems, as Expressed by Inner City Secondary School Personnel*
I
percent Return = kat
Classroom
Teacher
Administrators.
Counselors
Teachers
,Assistants
Others**
n ( g)
n (g)
n (%)
n (70
nTotal
n (%)
Inner City Project was helpful
2 (33)
6 (33)
62 (52)
15 (38),
11 (61)
96
(48)
Inner City Project was not helpful
3 (17)'
45, (38)
14 (35),
.2 (11)
64
(32)
No response
4,(67)1
9,(50)
12 (10)
11 (28)
5 (28)
41
(20)
201
100)
Question asked:
"Has the Inner City Project helped you, to betterdefine, the educationaland personal
problems that students have brought into your classroom"?
Nurses, class advisors, cadet teachers
ti

Table 31
1969-70 versus 1970-71 Excused andUnexcused Absences of Third, Fourth, Fifth and Sixth
Grade Pupils Attending Their Respective Schoolsfor Two Consecutive Years
Total n pairs = 978
1969-70 1970-71
Total Total. Total Total
Unexcused Exdueed Une.r.duied
442 2318 WI709 ,2400 786
589 2711412_ _a2lik W
,.
23,2o' --9673 a8o8-.
2.37 9.89 2.87
Excused
Grade 3 1814Grade 4 2229Grade 5 1373Grade 6
Total
1816,
7792n/Total 7.97
.
Table 32
1969-70-versua 1970-71 Excused and .
Unexcused Absences of.Grade 81_9111, and 12PUpild Attending Their ReapeCtive_Scoolefor
TWO ConSedutiVe YearS
Total n pirs = 1684
1969-70Total_ Total
Excused Unexcused
1970-7lTotal . Total
accused Unexcused
Grade 8 . 41o4 1783 5096 2843
Grade 9 4231 2692 4356 2042
Grade 11 6686 1623 8145 2630
Grade 12
Total
5617 1391, 6820 .2222
9565.210638 7489 24417n/Total 12.25 4.44 14.50 5.68
90

Table 34 considerS individual pupil increases, as opposed to gross
totals. The upper-left entry in Table 34 states that:
Of 86 grade 2 pupils attending Burbank elementary school for twoconsecutive.years, 34% increased, 29% decreased, and 37% remainedstable with reference to their unexcused absences.
The lower-left data grouping should read:
Of 479 grade,12 pupils attending San High School for two consecutiVe years, 57%-increased, 25% decreased and 18%:remaihed stablewith reference to their unexcused absences.
When Table- 34 is reviewed it is apparent that, although there was
an-actual increase in total unexcused absenceS at the elemehtary level,
the majoritY-Of-eiementary plPi16.*AnOt:inbreaSe tiSir unexcused
absences from-1969=10 tb-1970471. Exceptions: -are_ follUday,Atitrsde
ItherMah)--and when .pupils change e-AbhOdS at =grade
therMai).
At the secondary leVel, Table 34 indicates substantial unexcused
absence rate increases at most -Grade lovels-(the exception veiilg grade 9
at Memorial).
It may -be assumed, therefore, that -when the Inner City Program:46a
in existence the majority of elementary pupils,:had-leSS unexCuSed-abSonc40:
in 1969-70 than in 1970=71. Chronic-trUants, those elementary pupils con=-
tributing -most to -the totals,repreSented in Table 33, appear to have in
creased their absence totals during the laSt two school years.
At the secondary level, it appears that (with theekceition of grade 9)
the majority of pupils increased, rather than decreaSed, their unexcused
absences over the last two school years. Percent increases and frequency
tabulations indicate that this observed increase was not due to isolated
Chronic truants, but rather to the student bodies as a whole.
In summary, with reference to objective three, evidehce indicates
that the majority of school personnel perceived the 1970-71 counseling
91

Table 33
Longitudinal,Survey of Total Excused '
Total Unexcuaed Ab5enceth
411tending
Grade 2
1969-70
1970-71
% increase(*) or decrease(...)
Grade 3
1969-70
1970-71
% increase(+) or decrease(-)
Grade 4
1969-70
1970-t71'
% increase(+)' or decrease(-)
Grade
519
69-7
019
70-7
1% increase(*) or decr;ase(-)
Grade 6
1969-70
197o-71
% increase(+) Or decrease(-)
Grade
7.19
69-7
019
70-7
1% increase(+) or decrease( ..)
Burbank
Crockett
Total
Total
,
Total
Total,
EXCU;
Unex.
Excu.
Unex.,
827
822
-01
178'
571
203
''
747
+14
+31
'Grade 7 pupils attended Memorial Junior High in 1970-71.
44Ft
rAt1
15'
v .4
Oni
rOor
t
219
112
-49
Logan
Lowell
Total Total
Tot
alTotal
Eimi.
Una*.
Excu.
Unex.
1014
1172
+1
1012
1149.
414
8,7
,14
92 470'
215
232
+08
.334
'
238,
-29
362
+50
744,
262
864
241
1055
3612111
'962
+44
'417
0'
305
344
+13
82 57-3a
228
2430
0)
37+
36
397
51
'
407
202
+03
+29
6
391
105
420
+07
91-14
371
44,5
7613
4+
S5+
250
223
51
'521
273.
' 413
4+
431
0., 4
4 4
4 44
44, '
44,4
44,
4,44
,4 4
-.4
:44,
,td
ukt4
V14
,,,,
Sherman
Total
EXcu.
Total
Unex.
761
255
694
311
-09
+22
632
203
846
288
+34
+42
820 :
324
844
346
+03
+07
6o5
243
799
306
+32
+30
701
274
804
311
+15
+14
517
206
842
429
+63
44.o8
Irt
ifif
fif

of'
Table
33(continued)
Grade
819
69-7
019
70-7
1%
increase(+) or decrease(-)
Grade.9
.19
69-7
019
70-7
1%
increase(*) or decrease
(.4
Grade 11
Memorial
Tot
alTotal
Excu.
Unex.,
San Diego
Total
Total
Excu.
Unex.
41°4
1783
5o96
2843
+24.2
59.4
4231
2692
4356
,202
:+
2945
.
1969-70
6686
1623
1970
-71
83.4
526
3o%
increase(*) or decrease(-)
+21.8
+62.o
Gra
des4
P.19
69-7
o56
1713
913.
971
.,6
820
2050
% ir
krease(+) or decrease(-)
+47
.4. -

Table 34
Longitidinal Survey of Frequency and Percent of Increased WI Decreased (.) and
Stable (0)
Excused and Unexcused Absence Rates of Inner City Elementary Pupils Attending Their RespectiveSchools
for Wo Consecutive Tears
Grade 2
Burbank
3x.
Unex.
n ( %)
n 0)
Crockett
Ex.
Unex.
n (IQ
n (%)
Logan
Ex.
Unex.
n CI>)
n (Y,,
Lowell
Ex.
Unex.
n (%)
n (')
Sherman
Ex.
UMW!.
n (%)
n C4)
4138
(48)
(44)
2925
(3'.)
(29)
47 (59)
25 (31)
1939
(24)
(49)
19 (48) 11
17 (42) 14,(28)
(35)
33 (46) 36 (43)
4o (48) 29 (35)
1..
7(08)
32
(37)
V(10)
22
(28)
4 (10) 15
(38)
5 (0
6) 1
8 (2
2)Grade 3
63 (53) 36 (30)
1? (55) 13
(42)
54 (58) 55 (59)
43 (36) 38 (32)
13 (42)
8(26)
32 (34) 18 (19)
013 (11) 45 (58)
1 (03) 10
(32)
7 (08) 20 (22)
Grade 4
70 (57) 36 (30)
21`(49) 17
(4o)
40 (44) 43 (47)
44 (36) 47 (39)
17 (40)
9(.
42 (46) 34 (37)
08 (07) 39 (32)
5 (12) 17
(4o,
9 (10) 14 (15)
Grade 5
86 (66) 54 (41).
22 (45) 19
(39)
51 (66) 36 (47)
10 (08) 43 (33)
21 (43) 11
(22)
20 (26) 25 (32)
035 (27) 34 (26)
6 (12) 19
(39)
6 (03) 16 (21)
Grade 6
49 (54)-29 (32)
26 (57) 23
(50)
46 (54) 38 (45)
34"(37) 31 (34)
17 (37)
4(09)
32 (38) 31 (36)
08 (09) 31 (34)
3 (07) 19
(41)
7 (08) 16 49)
Grade
.
71 (64) 74 (67)
25 (78) 25
(78)
49 (7o) 42 (6o)
30 (27) 17 (15)
5 (16)
6(19)
18 (26) 19 (27)
010 (09) 20 (18)
2 (06)
1(03)
3 (04)
9 (13)
11.
Total+
41
(43)
29
(34)
47 (59)
19
(24)
339 (59)229 ('40)
13o (54)108
(45)
278 (56)250 (50)
-38
(44)
25
(29)
25 (31)
39
(49)
161 (28)176*(31)
90 (37) 52
(22)
184 (37)156 (31)
07
(08)
32
(37)
8 (1o)
22
(28)
w74 (13)169 (29)
21 (09) 81
(34)
37 (07) 93.(19)
:Irade 7 pupils attended nitmorial JdniOr Digh in,19?441.'
0110
0110
01$1
1:=
471
10,4
141
6,14
1-

Jo,4
1,11
4,14
,1,
tege
4i44
.0*
r".4
'[
Table, 34
,contintled),
777
:r7-1
,f4:4Awm.
MOW
Memorial,
Siiiii Diego
Ex.
Unex.,,
Ex.,
Unex.
n, 0'0
n1,(%)
,n00!
n (%)
Grade 8,
202 (59)
182 (53)
u8
(33),
0,
23 (on
la (14)
Grade 9
146. 081
Iok (35)
-133, (4),
162 ,f,59
022(08)
35, '(11)'
Grade 11
0
Grade 12
0
311 ,(55)f
350 (62)
202Y,(36)
112' ,(20),
'4"°0 '
99.(18)
,288
'F(0)
271 (57)
1541(32/
121 (25)
37'010)
8.7(18)
.

services (although lacking adequacy in some areas) to be geneaily help-
ful to and needed by pupils. Also, actual unexcused absence and truancy
rates of pupils at the secondary level,(truancy data was found to Approx-
imate unexcused absence figures at all grade leVeld) increased, rather
than decreased as expected.
At the elementary level, where minimal formal counteling services
Were provided, the majority Of pupils either dec:eased or remained stable
-in their unexcused absences:, RoWeVet, it was noticed that More unexcused
-41ihdences were concentrated, with iedt pupils is 1970,71-thititAn_1969=_70.
bhjeCtivethree, therefore, cannot defined{ ad=attained-,Whe$ the
:counseling tetVicetticOMPonent,of-cthe- y.:--tojedt-_-WatAM50,4CtiVe.-
There is _a poStibilityi-hoWeVet, that otkolit:OAd:06hooi_iiitOt&otiat,-
the eiementaty level-contributed to the elementary atduce decline (see-
Tables 15, 16 and 17): Becabse of all the multi=faceted activitied and
parent groups contributing to the elementary Inner City program, it is
impossible to isolate true cause -and- effect relationshipt. A11 -that may
be inferred is that (1) elementarV children did not mist School more for
,unexcused reasons in 1970 -71 than in 1969 -70, (2) secendary pupils did show
a sharp increase in unexcused absence ratee: and (3) since Objective three
relates secondary counSeling Services to unexcused absencerates, it must
be stated that objective three was not attained. The above note concerning
the elementary program, however should be kept in mind. Indeed, if parent-
school-community interaction is considered the most important of the six
measureable objectives by other school agencies, it should be kept upper-
most in mind.
The increase in unexcused absence rates may possibly be due to bettercounseling in that these absences went undetected in past years.
96

Objective fOUr: To proVide _sUppleniental health and nutritional ser-
vices that-support phySi6a1 Vell-beirig and-Vigor to- that- 75 percent
of the designated population will reduce their previous year's -ab-
sence due to illness by- -25-50%. -
Although the majority of school persiorthel thought health absences to
be stable or on the decline, and although these same educators thought
that the Inner City Project mrovided services consistent with instruction
(see Tables 33, 34, and 35), Tables 3i and 32 in-did-ate that the majority of
Inner City yOUrigatert who attended-their respective ,schbOld in 196940
and 1970-71 were absent- -from school because of health- reasons to -a
greater extent in the -third sopposed: to the :second): = funding_ year.
is true- :for=-=four- of the lite eie:MefitarY _schools=ancL:tke_ two secoadaiy-
zWith_the criteria= used ==to measure: Object ve =.fours t- may_be
conClUdeds from the preiiininary analysis defined tabreg
this objective- was -not attained. In chi-) 6 1- at-lid-grade reVei, did
50 percent of the defined population reduce their previous year's atten-
danoe.
attained.
re cited in Objective 4 was, obviously,_ also not
97

Ta$e, 35t
Perceived Absence Rates of Elementary Pupils for 1970-71 (compared to 1969-70),
as Expressed by Inner City Elementary School Personnel*
Excused
Higher than 1969-70
Administrators
n(%),
The same as 1969:-70
2(67)
Lower than 1969-70
:
No response
1(33)
Unexcused
Higher than 1969-70
The same as 1969 -70
2(67Y
Lower than 1969-70
No response
1(33)
Percent Respon6e, =50741
Classroom
Auxiliary
Community'
Teacher
Teachers
n(%)
Teachers
n(%);
AideS,
nl, ',06,
'Assistants
n(%)
Others Total
n
1
5 ,
CO?)
t2'
46
(62):
,,...._.
.2'
(50),
'9,.
19'
(26)
'3
4(05),
3,
(100
3, 0100
2(50)'
6
3(q4)
30' (40
3o,
(40),
11
(15)
(%)
n(%)
1(10)'
(45)"
(15)
(30)
7'
59 22
19
(07)'
(55)'
(21)''
.(18),
107
(101):
1C25)'
2(1o)
6,
(06):
8'
('40)
140'
(37)
1(25)1
2(10)
35
(31) ,
3 (100
(j260):i
2' Oa
8 (40 28f
(26
11'07 (2:00)'
*question asked:
"In, your'estimationi, has the 'excused (due tO,,i011Unexcused,(all, other), absences 'of
pupils within your classroominCreabedi.ydecreaSed(Maine&the-setme this:year as
compared to absence rates withihrYpui..-4a6sio0ivdiirinthe119694704earnT
Nurses, cadet teachers
moo
Omm0
SO*4
t'!"04
'0,t1M4
ito#4
oimIS
most
Pim am
"4,
A/

1111111111
444
illat
oaN
Table 36
Extent of Pupil Services Provided by, the InnerCity
Project Staff,
as Perceived by Inner City Elementary School Personnel!
NM MIN
Services were asked
and provided
Services were asked
but not provided
Services were not asked
No response
Percent Return = 50%
Classroom
Auxiliary
Teacher
Community
Administrators
Teacher&
Teachers.
Assistants
Aides
Other"
Total
n(%)
n(%)
n,
(%)
n -0%),
3(100)
38
(51)
5 MO
1(25)
2(03)
3Z
(43/
3 (75)
z(%)
n(%)
n(%)
2 1.
(67)°
(33>
9
11
(45)
(55)
56 3
46
(52).
(03)
(43)
2(0)1
2,, (02)
107 (100)
*Question asked:
"In your opinion, has 'the Inner- City Project Staff provided services, that were
of benefit
to you in working with your InnerOity pupils"?
**Nurses, cadet teachers,
r

Table 37'
Extent of Pupil Services Provided by the Inner City
Project Staff,
as Perceived by Inner 'City Secondary SChoOi Personnel*
Services were
provided
Services were
not provided
asked and
asked but
Services were not asked
No response
Percent RetUrn = 48%
.Classroom
'Administrators
Counselors
'Teachers
n(%)
n(%)
6(100)
Teacher
Assistants
n(%)
Others**
Total
n(%)-
n
13
(72)
56
( 47)
9(22)
11
(61)
95
(47)
3(ö
2),
3(0
1)
.4
(22)
52
(44)fr
26'
(65)
14
(22)
86(4
3)
1(0
6), ,
8(0
7)v
5(1
2),
3(1
7),17
(08)
201 (100)
4,
*Question asked:
"In your opinion, has theInner City ,Piojedt Staff'proide& services that, were of benefit
to you in working with your.Inner City pupils"?
**Nurses, class-advisors,, cadet teachers
,ov
r.11
0.1.
41W.IVOrerit
iM3
i±1.
7:;#
01WWI
ANIS
MINIS

Objective five: To increase school staff sensitivity and receptiveness
to the problems of pupils and i6arehta so that (a) 50 percent or more of
the defined staff members will show positive attitudinal-changes'(as
measured by the Withall Social-EMotional Climate Index) and (b) 75
percent or more Of parehtt-responding will report .positive attitudestoward the school (as measured by an attitude autvey).
4-
Part (b) of Objective five has been briefly diScuased_with reference
to Objective one-attainment above. As stated, part _(b)- of Objective five
was achieved at both the elementary and secondary levela. Tables 20 and
21 indicate that over 75% of the parents of elementary pupils returning
questionnaires were satisfied with the ãy in Which-the schools were
educating their children and serving-asSocial_ligenta.Withinthe-dommUnitY.
The majority of Sedondary-parehts-held-diMilaf-Viewa. In only two
instances (San Diego patentS-cOmtenting:_ihrtheAegtee-of motivation the
School instilled in their children and'thaadhoOra-_rOie within the com
munity) did the degred-of-Stiafeetibh-Tali beloW,7%.
In interviews dor-id-hated With a tandOmAltplatif eXPSriendeateacheta
who had spent substantial time inatrUotingInner-City:phpila (see Table
304=85% of the elementary and! 100% of tha:Seddhdaryiteachers felt_ that
parent involvement was necessary for instruction and for defining pupil
Elementary teachers also indicated 100% agreement that their pupils
had positive attitudes toward school. Only 27% of secondary teachers in-
terviewed expressed the-Sate response. Tables 37 and 38 describe these
finClings.
When these same teachers were asked to judge the effectiveness of
their individual Parent Advisoty Councils, the majority of elementary
teachers stated they were effective to very effective in providing them
with instructional supplies (see Appendix E for a sample of the infor-
mation packets used by PAC's functioning in this capacity), providing
pupils with auxiliary services, sand representing the community in matters
101

Table 38
Descriptive Summary .of Experience of Innef City Tenchers Interviewed
Statistic Eletentary Sedondaryn
21 22' -.
Mean years experience as a teacher* 9.5 8.4---Median years experience as a teacher* 10.5 r77,-;,45-
Range years experience as a teacher 2-24 1-25
Mean years assigned to present schoO1 4.6 4.7
Median years assigned'to present school 3:2 5.0-
Range years assigned to preSent school 1-15 1--25
*If a teacher taught for more than one semester of a in year,_the entire year was used to calculate experience.
102

Table 39
Worth of Parent Involvement in Assisting Teachers to Define Pupil Needs,_as Perceived by Inner City Classroom Teachers
Elementary (n=21) Secondary (q=22)
Positive Negative Undecided Positive Negative Undecided
n(%) n(%) n(%) n( %) n(%) n(%)
18(85) 1(5) 2(10) 22(100) 0(0) 0(0),
Table 40
Definition of,Pupil Attitudes Toward School, as Perceived
by Inner City-Classroom Teachers
Elementary (n=21) Secondary (n =22)
Positive Negative Undecided PositiVe NegatiVe Undecided
n(%) n(%) n(%) n(%) n(%) n(%)=
21(100) 0(o) o(o) 6(27) 11(50) 5(23)-

directly related to the school program. Table 41 presents these details.
In contrast, the majority of secondary teachers felt that their PAC
was too distant from them and were able to define effectiveness in only
one of four categories. Secondary teachers defined P1C procurement of in-
structional supplies as effective to very effective, but could not rate
PAC activities in the other three categories listed in Table '41 for lack
of personal contact. Overall it can be concludea from thiS and other questions
asked in the interviews that the degree of contact between parent And teacher
-appears to have been substantially leSs for secondary (as opposed to ele--Mentary) teachers in activities within the classroom, and in_the community._
Whefi the same random sample of teachers used for interview purposes
Were obserVed teaching in the classroom during the first and second sem-
-ester of 1970-71 (with time of day, subject area and .grade level consi-
dered in the stratified sampling procedures) significantly more elementary
teachers substantially increased their "learner centeredness" from the
beginning-to the-end of the school year than did secondary teachers. Tables
42 and 43 support this finding.
It should be netted that, although more elementary teachers were found
to increase their "learner centeredness" (as defined by the Withall
technique) than secondary teachers, the correlation and mean-median statistics
indicate overall stability of the construct being measured for half of
the teacher: observed.
In other words, it appears that both elementary and secondary
"learner centered" teachers continued, in approximately 50% of the cases,
to be learner-centered throughout the year. However, in 21 instances
where there was substantial increase or decrease in such:staff-pupil
104

ill11
111
.mm
4
Table 41
Lffectiveness of Parent Advisory Councils,
as Perceived by Classroom Teachers
From Inner City Schools
Categories
Elementary (n=21)
Very
No
Ineff.
Contact
nn (%)
Very
Effect.
Effect.
Ineff.
n (%)
n (%)
n (%)
1.
12 (57)
3 (14)
2.
12 (57)
4 (19)
3.
5 (24)
4 (19)
4.
9 (43)
5 (24)
3 (14)
2 (10)
3 (14)
3 (14)
Category definitions:
Very
Effect.
n
Sedondary (n=22)Very
No
Effect.
Ineff.
Ineff.
Contact
n (%),
n.(%)
n (%)
n ( %)
o (o)
3 (14)
8 (36)
5 (23)'
o (o)
3 (14)
4 (18)
6 (27)
1 (5)
8 (38)
2 ( 9)
2 ( 9)
1 (5)
3 (14)
8 (36)
oo)
(1) Providing instructional supplies needed by theschool.
(2) Providing auxiliary services needed by the
pupils.
(3) Assisting you to implement innovative instruction in
the
classroom.
(4) Representing, the community in matters directlyrelated to
the school program.
o (o
)o
(o)
(5)
a. (
5)
o (0).
9 (41)
o (o)
12 (55)
o (0)
17 (77)
o (0)
13 (59)

Table 42
1970-71 Inner City Teacher Talk Data
First First Second Second
Semester Semester SemesterFirst Sereater elementary Secondary Index
School Teacher Index Score Rank Rank Score Rank
SemesterElementary
rival-at .1. .26 23
Crockett 2 .29 21Crockett 3 .43 16Burbank 4 .41 17Burbank 5 .60 9Burbank 6 .56 11Sherman 7 .27 22Sherman 8 .61 7.5Sherman- 9 .52 14Sherman 10 .34 18Sherman 11 .74 4Sherman 12 .69 6Sherman 13 .31 20Sherman 14 .50 15Lowell 15 .61 7.5Lowell 16 .71 5Lowell 17 .54 13Lowell 18 .82 2Logan 19 .32 19Logan 20 .55 12Logan 21 .13 24Logan 22 .57 10Logan 23 .98 1Logan 24 .75 3Memorial 25 .26 --Memorial 26 .30 --Memorial 27 .16 --Memorial 28 .65 --Memorial 29 .07 --Memorial 30 .71 --Memorial 31 .74 --Memorial 32 .54 --
Memorial 33 .72 --Memorial 34 .54 --Memorial 35 .81 --Memorial 36 .53 --San Diego 37 .80 --San Diego 38 .21 --San Diego 39 .47 --San Diego 40 .53 --San Ziego 41 .54 --San Diego 42 .86 --San Diego 43 .76 --San Diego 44 .56 --San Diego 45 .22 --San Diego 46 .45 --
0.
ItiOW.
Left I.C. --.56 14.5
.59 12
.57 13
.56 14.5
.31 20
.46 18Left Dist. --
.63 1173- 7.5.74 6
.71 10
.38 19
.70 9 "
.53 17
.83 3
.73 7.5
.77 4
16.85 2
Second Index
Semester Gain(+)Secondary orRank Loss(-).
-.25 21Left Dist. --
.94 1
.73 518 .40 -- 15.517 .17 -- 18.521 -.27 -- 228 .72 -- 4.5
22 .06 -- 207 .76 -- 25 .72 -- 4.5
11 .40 -- 15.56 .79 -- 1
11 .59 -- 82 .68 -- 6
13.5 .54 -- 9.53 ,.51 IM dab 11
20 .03 -- 2115 .38 -- 1713.5 .54 -- 9.511 .43 -- 141 .75 -- 34 .50 -- 129 .48 -- 1319 .17 -- 18.516 .60 -- 7
a/MIMEO&
*Based upon substantial gains or losses defined as one standard error of measurementbetween first and second semester index scores, blocked on elementary and secondaryleveld. (See Table for detailed analysis r.d derivation).
106

Table 43
1970-71 Inner City Teacher Talk Analysis
VDesbriptive Statistics
First Semester Second Semester
110.
Exipl Mean Median di I12
Cn, Mean rn Median
2
Elementary 12.51 24 .52 .55 .21 Elementary 12.61 21 .60 .52 .24
Secondary 11.43 22 .52 .54 .23 Secondary 9.44 22 .43 .51 .27
Total 23.94 46 .52 .54 Totaltelementary = 0.62
22.51 43 .52 .51
(?secondary = 0.80
r
Standard Errors of Measurement
Elementary r = .70'xi x2
Secondary r = .86'X1x2
Elementary smen3X1 X2 = .2432(.55) = .1338 Cv. .14
Secondary smens
X1X2= .2680(07) = .991 4:4 .10
Substantial Gain/Loss Summary
Elementary Secondary
10 (+) 2 (+)
2 (-) 9 (-)
Chi Square Analysis
Freauencies Proportions
Secondary 2 9 11E
Total 12
+
11 21 Total .57
- Total
Secondary
+ . Total
Elementary 10 2 12 Elementary
1.00
Chi Square = (21)(75.5)2/17424
= 6.87Chi Square (1, .01) = 6.64
I
Probability Statement
The probability that the observed gains at the elementary level and
losses at the secondary level appeared by chance, when in fact.the proportion
of gains and losses at the elementary and secondary level were actually equal,
is less trim one percent.
"Rank order and rroduct moment correlations were judged sufficiently close to
justify applying standard error theory to the data.
10?

Withall Index. Score Definition
x1
(Y1) ) + x
2(Y2) + + x7 (Y )
Index Score = -3
( E x . /3) (7g Y4)i=1
Note:
where xl, x2...x7 = categorical weightings
end Yi, Y2...Y7 = number of teacher-statements per category.--
Since x1= 3, x
2= 2, x
3= 1,
= 0, x5 = .1, x6 = -2 and x7 =
the above equation reduces to
3Y1 2Y2 +."-2Y6Index Score =
72 (-6 Yi)
i=1
Withall Categories:
(1) Learner-Supportive Statements(2) acceptant or clarifying statements(3) 1Tob1em-Structuring Statements(4) Neutral Statements
(5) Directive Statements(6) Reproving, Disproving or Disparaging Statements(7) Teacher- Supportive Statements
Weight Designatiohs:
Categories Weights1 . 32 23 14 05 -16 -27 -3
108

relations in the classroom, significantly more elementary teachers in-
creased their learner-centeredness, as opposed to secondary teachers.
Also, the survey shows that significantly more secondary teachers
increased in teacher-centeredness, when compared to elementary totals.
It appeai:s,'then, that school staff empathy toward parents and pupils .3as
most evident at the elementary. level. Approximately half of the Inner
City teaching staff (both elementary and secondary) continued to be
moderately learner-centered in the classroom and rated their relation-
ships with PAC members and parehts as cooperative and effective. Of the
other half, elementary teachers appeared to have had greater contact with
parents and became more pupil-centered while secondary teachers were less
involved with-parent-6 and became More teacher-centered as the 1970-71
school year progressed. Overall, Objective five apears to have been
attained, with teachers more receptive to pupil and involved more with
parent activities at the elementary rather thah at the Secondary level.
It should be stressed that the above conclusion says nothing about
the teaching competency of teachers used to evaluate this section of
the Inner City Program. As W. James Popham stated in the June, 1971
issue of Phi Delta Kaman (pg. 599): 'iRating of teaching skill, whether
supplied by administrators, pupils or a visiting mother-in-law, are
notoriously ilia( rate."
There is cle r and abundant evidence to suggest that different in-
structional techniques, such as the pupil-centered inquiry (Socratic)
method or the teacher-centered lecture 'method, can be used to promote
identical instructional goals.
The observatica technique used to evaluate the extent of Objective
five attainment was applied merely to analyze instructional activities
9This conclusion also should be noted in discussing elementary
unexcused absence rate findings.
109

and rapport between teacher and pupil. It was. not employed to define
an index of teaching effectiveness. Any data derived from the Withall
measure only describes seven categories of teacher talk. The inference
that teacher talk and teacher empathy toward pupils are related was
presumed. The inference that teacher talk defines good teaching was not
considered.
Objective seven; (a) To improve the performance.of elementarypupils in the basic skills of reading and mathematics so that there willbe substantial increases in mean achievemeht from Odtober to May,1971, and that 60 percent of such pupils- will show a greater gainfrom October to May, 1971, than from October to MaY, 1970 (using anacceptable set of achievement tests).
(b) To improve the performance of jubj-Pe'lliz4 894P0,1- pupils thatpupild-will improve their reading and Mathematids achieVement (atmeasured by the CTBS) to a degree that will approximate one -half =thediffer.Ince between the current profile and -the test profile for thedistrict.
(c) To improve the performance of Secondary pupils so that the lower25 percrmt of the senior high school population will maintain or .
exceed their previous gain scores in reading and matheMatics achieve-ment (as measured by the ITED), and that the rest of the secondarypopulation will_maintain the academic levels established in 1969-70.
Objective seven was written assuming that analysis could be accomplished
by using the San Diego City Schools pupil'data bank and related computer
retrieval assistance. This assumption was in error.
As a result, the information tsed to measure the extent of Objective
seven attainment and contained in Tables 44 through-73 had to be secured
without computer data processing assistance. This precluded measuring
Objective seven exactly as stated. Instead, a comparable tactic was used
that (in the judgement of the Inner City Program Evaluator) was equivalent
to the analysis originally proposed, and yet allowed hand calculations to
be made in place of data bank follow-up of pupil achievement.
The tactic used consisted of isolating all pupils in Inner City
schools who had been at their schools for two consecutive years and who
110

had taken appropriate achievement test batteries needed to conduct a
two-year longitudinal survey. Octobek 1970 to May, 1971 gains were com-
pared to October, 1969 to May, 1970 gains for these pupils, grouped by
grade within schools.
Since the school district changed tests between grade levels, such
comparison of yearly gains were made relative to natiCnal.norms. Thus,
pupils in the Inner City Program for two years weFe isolated and their
achievement leVels compared internally 'by calculating if they were gaining
or losing their relative position on national norms established during the
1969-70 school year.
The descriptive statistical procedure utilized to mea5ffre the extent
of objective seven attainment involVed mean, medianig1-('6 percentile
within the group), Q3 (75 percentile within the group), standard deviation,
number of pupils within the groups, and Coefficient of skewneds statistics.
With these measures it was possible to obtain a "statistical picture" of
achievement gains or loses that was equally effective in determining the
extent of improved performance as was the original technique defined in
objective seven,part (a). Parts (b) and (c) were originally written to
be used with a descriptive technique and did not need to be altered.
Therefore, instead of determining whether 60% or more of Inner City
elementary pupils showed greater gains in 1969-70 than in 1970-71, the
following analysis determined (1) whether or not the mean, median, Q1
and Q3
score of the,grouped pupils gained ground on the comparable
norming group figures Nile rank), (2) how many months of achievement
(grade level equivalent) level gain the pupils accomplished relative to
themselves, and (3) the degree of high and low score shifts within the
group that occurred from'1969-70 to 1970-71.
111
Interested readers may want to study Tables 44 through 73 in detail.
For those.desiring an overall summary of results, the following is given:
Grade one; Tables 44, 45, 46 and 47 indicate that pupils rankfavorably with their peers across the nation_in reading achievement,
but are below expectations in mathematics achievement. The exceptions
are Lowell pupils (Table 46), who show highest gains and rankings in
mathematics and subnorm levels in reading. This is understandable,since most of these pupils are from Spanish-speaking homes, and Lowellrecently intensified their mathematics curriculum. Coefficient ofskewneds figures indicate a shift in distribution from negative topositive skewness (morejoupils with extreme high scores than extremelow scores) at most schoolS in reading, and mixed skewness patterns
in mathematics.
Grade two; Tables 48, 49, 56-aid_5iindicate relative stability inreading and mathertaticS adhieVement for mostipalii18-4-_;Sudh_161-reld
are,belOw national norms. Ecception is-dt'SherMan-00061 where
pupils Are noticeably .improving: in -reading:lnd-Oathehiatida:and-*.proximate national norm `levels. Pupils at the other -Schools; are falling
behind their nationalPeeta-andi,-on-the-ailerage,-,tain17606h-:thonthaachievement for ten months =Of instruction:
Grade three; Tables 52, 53, 54, 55, 66 and 57 indidate that (1) wordmeaning scores declined relative to national norms_ in two of three
schools and academic growth (as measured in G.L.t.) in word meaning
was substantially greater in 1969-70 than in 106-71 within allschools, (2) these pupils also fell Ihrther behind-their peers in
the norming samples from 1969-70 to 1970-71 in teats dedigne& to
measure their ability to comprehend paragraph content, (3) arithmetic'
computation and concept scores also dedlined in:percentile-rank, with
computation scores showing the largest drop, ,(4) overall, thirdgrade test scores indicate that less academic growth occurred from1970-71 than from 1969-70 in reading and mathematics for the majority
of Inner City Youngsters. Final 1970-71 scores indicate that thesepupils are substantially below national norm groups.
Grade four; Tables 58, 59, 60, 61, 62 and 63 indicate that (1) pupils
increased their abilities to comprehend word and paragraph meaningsmore in 1970-71 than in 1969-70, but such growth was not sufficient to
bring such pupils up to national norms, (2) there was general sta-bility in mathematics achievement for the majority of pupils from
1969-70 to 1970-71. The achievement scores during these two years(with the exception of Lowell) were subdtantially below national
averages.
Grade five; Available test scores presented in Tables 64, 65, 66,
67, 68, and 69 indicate increasing achievement levels in readingand mathematics substantially below national norms during testing
intervals. Such increases were substantially below the totalmonths instruction given to the pupils from 10/69 to 10/70.
112

f""I'"11
Img4-1
MUM
Table 44
Statistical Characteristics of 1970-71
Cooperative Primary Achievement
ITest,Results in Reading and Mathematics for
Grade One Pupils at
Burbank Elementary School
Raw
Score
Reading Achievement
Pretest*
.Posttest*
Grade
%ile
Raw
Grade
Equiv.
Rank
_...,....___
Score
Equiv.
%ile
Rank
Raw
Score
Mathematics Achievement
Pretest
Posttest
Grade
%ile
Raw,
Grade
Enuiv.
Rank
Score
Equiv.
%ile
Rank
Mean
12.42
1.2
527.97
2.0
72
20.37
1.1
232.60
1.6
34
Median
13.80
1.3
926.83
2.0
69
18.73
1.0
332.42
1.6
34
01
6.25
1.0
119.25
1.6
30
16.71
1.0
126.69
1.3
15
Q. 3
17.54
1.5
25
35.50
2.5
89
22:62
1.2
738.55
2.0
49
s.
6.44
9.52
5.16
7.48
n.
96
96
96
96
Sk**
-.32
.25
.96
.43
*Pretest = Cooperative Primary 12B AdministeredJanuary, 1971.
Posttest = Cooperative Primary 12A AdministeredMay, 1971.
Pretest derived scores (grade equiv. and
%ile ran.r)
upon
norms.
--Coefficient of skewness =
fr,(Q3- Q2) - (Q
- Q1) /
(0
Qi)/?
uaing raw scores.
Sk-
2,
aFor a symmetrical
distribution Sk=0.00.
Positive Skindicates positiva,skewness.
Positiveskbwness, in' turn, indicates that
the number of extreme high achievement scores,is greater than the number of
extreme low achievement scores.

Table 45
Statistical. Characteristics of 1970-71CopperaP4171#chievement;
TeSt Results in Reading' and Mathethatida fOr'drade°One-Plipils at
Crockett 21ementary School
.
Reading Achievement
Pretest*
Posttest*
Raw
Grade
96ile
Raw
Grade
Ale
Score
Equiv.
Rank
Score
Equiv.
Rank
Mean
15.66
1.4
20
25.15
1.9
60
Median
16.40
1.4
20
23.40
1.8
51
Q1
12.79
1.1
517.61
1:5
25
0 318.42
1.6
25
31.81
2.2
82
s.
4.73
8.65
n.
79
79
sk**
-.57
.37
Mathematics Achievement
Pretest
Posttest
Raw
Grade.
%ile
Raw
Grade
%ile
Score
Equiv.
Rank
Sdore
Equiv.
Rank
24.09
La'
932.57
1.6
34
24.00
1.1
(9''
32.75
1.6
34
ii
18.47
11.0
227.691
1.4
20
27.81
1.3
16
37.92
2.0
62
7:23'
7.50
79
,79
-.4a
.02
*Pretest = Cooperative Primary 12B administered January, 1971.
Posttest = Cooperative Primary 12A administered May, 1971.
Pretest derived scores (grar equiv. and' %ile ranic),
norms.
sk
= Coefficient of skewness =
(t),
- Q ) - (Q
-/
.(9; -
mains raw scores.
For a symmetrical
32
2'41
3distribution Sk=0.00.
Positive S. indiWes positive skewness..
Positive skewness, in turn, indicates that
the number of extreme
high achievementscores is greater than the,number of extreme low achievement scores.
Wm."
Pert
immi
Mrd
imma
for.454
00,0
0.10810
*40110
Ja 1
,14
',440
.te.
144,
4,1,
44,4
,041
.';:a
'def
a-fr
.,t4a
4 44
,11,
'4,,b
,446
;141
4:4:
44.1
01.1'

hum
.%V
avaa
gia4
.44
4
Table;
Statistical Characteristics of 1970-71 Cooperative Primary Achievement
Test Results in Reading and Mathematics for Grade One Pupils at
Lowell Elementary School
Reading Achievement
Mathematics Achievement
Pretest*
Posttest
Pretest
Posttest
Raw
Grade
%jle
Raw
Grade
%ile
Raw.
Grade
%ile
Raw
Grade
%ile
Score
Equiv.
Rank
Score
Equiv.
Rank
Score
Eauiv.
Rank
Score
Eouiv.
Rank
Mean
11.85
1.1
420.19
2.1
25
19.42
1.0
237.62
2.0
60
Median
13.83
1.2
719.50
"1.6
30
17.83
1.0
237.50
2.0
60
I-,
'1
n7.00
1.0
117.88
1.5.
25
13.00,
1.0
134.00
1.7
40
..n
Q3
16.66
1.5
19
22.25
1.8
44
25.33
1.3
13
43.25
2.5
81
s.
5.59
4.18
7.95
5.88
n.
26
,
25
26
26
-.92
.98
.43
.55
Pretest = Cooperative Primary 12B administered January, 1971.
Posttest = Cooperative Primary 12A administered May, 1971.
Pretest derived scores (grrde equiv. and ' %ile railk)tased moon loring norms.
sk
.11
= Coefficient of skewness =
(Q3 - Q2) - (Q2
- Q..)
/ (Q
- Q1)/2 using raw scores.
For a symmetrical
3:
distribution Sk=0.00.- Positive Sk
indicates positive skewness.,
Positive skewness, in turn, indicates that
the number of extreme
high schievement scores is greater than the, number of extreme low achievement scores.
I

Table 47
Statistical Characteristics of 1970-71 Cooperative Primary Achievement
Test Results in Reading and Mathematics for Grade One Pupils at
Sherman Elementary School
Reading Achievement
Pretest*
Raw
Grade
%ile
Score
Equiv.
Rank
Mean
21.49
1.8
Median
19.17
1.7
14.42
1.3
Q3 S. n.
S **
28.60
10.46
90
.66
2.0
Posttest*
Raw
Grade
%ile
Score
Equiv.
Rank
55
27.76
2.0
39
24.25
1.8
10
18.81
1.6
72
37.33
2.5
10.39
90
.83
72
55
30
90
Mathematics Achievement
Pretest
Raw
Grade
%ile
Score
Equiv.
Rank
28.93
1.4
21
27.28
1.3
17
21.42
1.1
4
36.00
1.8
49
9.84
90
Posttest
Raw
-.trade
Score
E.-.: iv.
%ile
Rank
34.63
1.8
44
35.33
1.8
44
28.33
1.3
19
42.20
2.3
75
9.44
90 -.02
Pretest = Cooperative Primary 12B administered January, 1971.
Posttest = Cooperative Primary 12A Administered May, 1971.
Pretest derived scores ( grre equiv. and '%ile rtlk)
ed upon
ring norms.
s = Coefficient of skewness =
(Q 3
-Q2)
- (Q2
a- QL) / (Q
-Q1)/22Jusing, raw scores.
For a symmetrical
o.
distribution S
=0.00.
Positive Sk indicates positive skewness.
Positive skewness, in turn, indicates that
the number of extreme
high achievement scores is greater than the number of extreme low achievement scores.

Table 48
..14,
14/1
414
Lvngitudina1Survey or End-of-Year Reading and MathematicsAchievement of
Second Grade Pupils Enrolled. atBurbank School for Two Consecutive Years, as
Measured by the Cooperative Primary Tests.
i.444
1.04
611
4140
4
Reading Achievement
1970*
1971
Raw
Grade
%ile
Raw
Grade
%ile
Score
E2Ria
Rank
Score
Equiv.
Rank
Mean
21.45
1.7
39
20.66
2.2
29
Median
20.62
1.7
39
19.88
2.1
25
17.41
1.5
19
16.15
1.7
12
ql Q 3
24.08
1.8
55
24.25
2.5
40
s.
5.77
5.86
n.
53
53
Sk
0.08
0.16
Mathematics Achievement
1970
1971
Raw
Grade
%ile
Raw
Grade
%ile
Score
Equiv.
Rank
Score
Equiv.
Rank
34.43
1.7
40
27.30
2.3
36
35.75
1.8
49
26.38
2.3
28
29.56
1.4
24
22.15
1.8
15
39.18'
2.1
65
31.75
2.9
57
6.61
6.87
53
53
-0.57
0.24
1970 reading and mathematics group scores obtained
from May, 1970 testing using Cooperative Primary12-A.
1971 reading and mathematics group scores obtained
fromMay, 1971 testing using Cooperative Primary
23-A.

Table 49
Longitudinal Survey of End-of-Year Reading and Mathematics
Achievement of
Second Grade Pupils Enrolled at Crockett School for Two Consecutive
Years, as
Measured by the Cooperative Primary Tests.
.111
011
Reading Achievement
1970*
1971'
Raw
Grade
%ile
Raw
Grade
%ile
Score
Equiv.
Rank
Score
Esuixt
Rank
Mean
23.39
1.8
55
23.63
2.5
40
Median
21.50
1.8
44
21.25
2.2
29
411
16.29
1.4
14
18.79
2.0
21
Q27.75
2.0
72
25.81
2.7
48
3
8.
8.02
7.89
n.
63
63
Sk
0.18
0.60
IMI1
111.
111-
Mathematics AChievement
1970
1971
Raw
Grade
%ile
Raw
Grade
%ile
Score
Equal
Rank
Score
EAmat
Rank
33.27
1.6
36
27:51
2.4
38
32.38
1.5
32
26.94
2.3
38
28.45
1.3
19
22.65
1.9
18
38.75
2.1
(65
30.11
2.6
45
7.20
6.43
63
63
0.47
-0.03
*1970 reading and mathematics groupscores obtained from May, 1970 testing using Cooperative Primary 12-A.
1971 reading and mathematics group scores obtained fromMay, 1971 testing using Cooperative Primary 23-A.
t1,;
.141
10+04

,`"
Table 50
Lakitudinal Survey of End-of-Year Reading and
Mathematics Achievement of
Secdhd Grade Pupils Enrolled at Lowell School
for Two Consecutive Years, as
Measured by the Cooperative Primary Tests.
Reading Achievement
Raw
Score
1970*
Grade
Equiv.
%lie
Rank
Raw
Score
1971*
Grade
aula
%ile
Rank
Mean
19.23
1.6
30
21.88
2.3
32
Median
18.00
1.5
25
23.00
2.4
36
Qi
15.88
1.4
14
20.00
2.1
25
Q3
21.75
1.8
44
25.88
2.7
48
8.
4.38
6.55
Mathematics Achi-wement
Raw
Score
1970
Grade
Equiv.
%ile
Rank
Raw
,
Score
1971
Grade
Eouiv.
%ile
Rank
34.96
1.8
42
27.35
2.3
41
34.50
1.7
4o
26.50
2.3
34
29.00
1.4
29
23.00
1.9
18
40.00
2.2
70
30.25
2.6
46
6.63
6.97
n.
26
26
26
26
sk
0.67
-0.04
0.00
0.07
1970 reading and mathematics group scores obtained fromMay, 1970 testing, using Cooperative Primary 12-A.
1971 reading and mathematics group scores obtained
from May, 1971 testing using Cooperative Primary 23-A.

Table 51
Longtudinal Survey of. End-of-Year Reading and Mathematics Achievement of
Seconc' GrRde,Pupils Enrolled at Sherman School for Two Consecutive Years, as
Measured by the Cooperative Primary Tests.
1
Reading Achievement
Mathematics Achievement
1970*
1971*
1970
1971
Raw
Grade
%ile
Raw
Grade
%ile
Raw
Grade
%ile
Raw
Grade
%ile
Score
Isuill
Rank
Score
Equiv.
Rank
Score
Equiv.
Rank
Score
Equiv.,
Rank
Mean
23.15
1.8
51
28.56
3.0
56
36.23
1.8
49
30.78
2.8
50
Median
22.50
1.8
44
26.38
2.7
48
36.30
1.8
49
28.50
2.4
4o
qi
18.83
1.6
30
20.06
2.1
25
32.83
1.6
36
24.50
2.0
19
Q3
27.75
2.0
72
38.08
3.9
82
40.50
2.2
70
38.50
3.5
80
8.
7.04
11.12
6.27
8.93
n.
60
6o
"60
60
sk
0.58
1.15
0.19
0.86
1970 reading and mathematics group scores obtained from May, 1970 testing sing Cooperative Primary 12-A.
1971 reading and mathematics group scores obtained from May, 1971 testing sing Cooperative Primary 23-A.
iN040
OW*
MIMI
OOP

4114
11,-
imas
",'.
Table 52
Longitudinal Survey of Reading Achievement of Third Grade Pupils
Enrolled at Logan School During 1970-71 and Burbank-Crockett Schools in 1969-70,
as Measured by the Stanford Achievement Tests'
Word Reading (Meaning)
1969-70
Pretest
Posttest
Raw
Grade
%ile
Raw
Gkade
%ile
Score
alat
Rank
Score
Enuiv.
Rank
Mean
17.76
1.7
18
14.44e
2.5
24
Median
16.80
1.6
11
14.13
2.5
24
(21
13.42
1.4
410.22
1.9
10
R3
21.15
1.8
26
17.56
2.8
44
a.
6.82
5.18
n.
59
59
Sk
0.26
-0.13
Word Meaning
1970-71
Pretest
Posttest
Raw
Grade
%ile
Raw
Grade
%ile
Score
IAllimt
Rank
Score
aaat
Rank
15.19
2.6
20
20.54
3.1
22
14.88
2.6
20
19.60
3.0
18
10.63
2.0
816.44
2.7
8
'20.31
3.0
44
23.31
3.5
30
5.87
6.19
59
59
0.24
0.16
'1969-70 pretest achievement scores based on Stanford Primary .I (X) administered 10/69.
1969-70 posttest achievement scores based on Stanford Primary II (W) administered 5/70.
1970 -71 pretest achievement scores based on Stanford Primary II (W) administered 10/70.
1970-71 posttest achievement scores based on Stanford Primary II,(X) administered 5/71.
4

.4.4
4.44
4,4
Table 52 (continued)
Raw
Score
Pretest
t*Grade
Equiv.
Paragraph Meaning
1969-70
%ile
Raw
Rank
Score
Posttest
Grade
s_adv.
%ile
Rank
Raw
Score
Paragraph Meaning
1970-71
Pretest
Grade
%Ile
Raw
Equiv.
Rank
Score
Posttest
Grade
Equiv.
%ile
Rank
Mean
16.03
1.9
36
21.14
2.2
18
22.75
2.4
16
31.56
2.9
14
Median
13.40
1.8
26
20.25
2.1
16
23.33
2.4
16
32.00
2.9
14
al10.47
1.7
18
14.38
1.8
613.45
1.8
423.88
2.5
8
0 318.92
?.l
50
26.31
2.5
24
29.56
2.8
32
38.13
3.2
28
8.
'7.56
9.54
9.84
11.09
n.
59
59
59
59
Sk
0.61
0.03
-0.44
-0.28
1969-70 pretest achievement scores based on Stanford Primary I (X) admin4stered 10/69.
1969-70 posttest achievement scores based on Stanford Prima"-j II (4) administered 5/70.
1970-71 pretest achievement scores based on Stanford Primary II (W) administered 10/70.
1970-71 posttest achievement scores based on Stanford Primary II (X) administered 5/71.
$40.
1111
MB

"1r
Table 53
Longitudinal Survey of ReadingAchievement of Third Grade
Pupils
Enrolled at Lowell School During
1970-71 and Burbank-CrockettSchools in 1969-70,
as Measured by the Stanford AchievementTests*
%),1
Mean
Median
Q1
Q3
s.
n.
S k
Word Reading (Meaning)
1969-70
Pretest
Posttest
Raw
Grade
%ile
Raw
Grade
Score
Equiv.
Rank
Score
Equiv.
%ile
Rank
Raw
Score
Pretest
Grade
Equiv.
Word Meaning
1970-71
Posttest
'tale
Raw
Grade
Rank
Score
Equiv.
%ile
Rank
8 Y 4
26
17.24
17.33
14.25
19.88
3.94
25
-0.19
1.6
1.6
1.5
1
11
11 8
18
16.40
15.00
9.63
20.08
8.02
25
-0.05
2.7
2.6
1.9
3.0
38
30
10
56
12.56
11.00
8.25
16.25
6.27
25
-0.62
2.3
2.0
1.8
2.7
12 8 4
26
17.40
17.67
12.75
22.25
6.46
25
-0.10
2.7
2.7
2.3
3.3
*1969-70 pretest achievement
scores based on Stanford Primary I (X)
administered 10/69.
1969-70 posttest achievement
scores based )11 Stanford Primary II (W)
administered 5/70.
1970-71 pretest achievement
scores based on Stanford Primary II (W)
administered 10/70.
1970-71 posttest achievement
scores based on Stanford Primary II (X)
administered 5/71.

,,KA
Hlu
,441
1,,
Table 53 (continued')
Raw
Score
Pretest
Grade
Equiv.
Paragraph Meaning
1969-70
Posttest
'One
Raw
Grade
Rank
Score
Equiv.
7iile
Rank
Raw
Score
Paragraph Meaning
1970-71
Pretest
Grade
94ile'._
Raw
Equiv.,
Rank'
Score
Posttest
Grade
Equiv.
°hie
Rank
Mean
12.48
1.5
417.92
2.0
12
18.32
2.1
10
28.12
2.7
12
Median
11.38
1.5
417.25
2.0
12
16.75
2.0
828.00
2.7
12
- ruQ1
7.75
1.4
211.13
1.7
411.75
1.7
218.13
2.0
2
Q3
16.38
1.6
822.25
2.3
22
26.94
2.6
24
37.25
3.2
28
s.
6.09
9.10
8.96
10.11
n.
25
25
25
25
Sk
0.32
-0.20
0.68
-0.06
1,41
1
'1969-70 pretest achievement
scores based on Stanford Primary I (X) administered 10/69.
1969-70 posttest achievementscores based on Stanford Primary,II (W) administered 5/70.
1970-71 pretest achievement scores basedon Stanford Pirmary II (W) administered 10/70.
1970-71 posttest achievement scores based
on Stanford Primary II (X) administered 5/71.

NNW WM
Table 54
Longitudinal .purvey of Reading Achievement of Third Grade Pupils
Enrolled at Sherman School During 1970-71 and Burbank-Crockett Schools in 1969-70,
as Measured by the Stanford Achievement Tests'
Word Reading (Meaning)
1969-70
Pretest
Posttest
Raw
Grade
%ile
Raw
Grade
%ile
Score
Equiv.
Rank
Score
Equiv.
Rank
Mean
17.45
1.6
11
14.64
2.6
30
Median
16.00
1.6
11
14.00
2.5
24
qi
111.50
1.4
49.90
1.9
10
21.50
1.8
26
20.75
3.1
60
q3 6.
7.07
6.63
n.
56
56
Sk
0.20
0.49
Word Meaning
1970-71
Pretest
Posttest
Raw
Grade
%ile
Raw
Grade
%ile
Score
Equiv.
Rank
Score
Equiv.
Rank
13.73
2.5
24
17.11
2.7
38
8.50
1.8
617.50
2.8
44
12.00
2.1
16
11.75
2.1
16
19.00
2.9
50
22.50
3.3
66
6.26
6.72
56
56
0.67
-0.14
'1969-70 pretest achievement scores based on Stanford Primary I (X) administered 10/69.
1969-70 posttest achievement scores based on Stanford Primary II (W) administered 5/70.
1970-71 pretest achievement scores based on Stanford Primary II (W) administered 10/70.
1970-71 posttest achievement scores based on Stanford Primary II (X) administered 5/71.
$1,
10 4
11,
1J1
o

Table 54 (continued)
Paragraph Meaning
1969-70
Raw
Score
Pretest
Grade
Equiv.
%ile
Rank
Raw
Score
Posttest
Grade
Equiv.
Ale
Rank
Mean
15.04
1.6
821.86
2.3
22
Median
11.94
1.5
42n.50
2.1
16
IQ'
9.21
1.4
214.50
1.8
6
Q3
20.50
1.7
16
30.50
2.8
44
s.
8.73
9.89
Raw
Score
19.96
16.00
10.83
27.00
11.43
Paragraph Meaning
Pretest
Grade
Equiv.
1970-71
%ile
Rank
Raw
Score
Posttest
Grade
Equiv.
%ile
Rank
2.1
10
28.30
2.7
12
1.9
626.50
2.6
11
1.7
218.50
2.0
2
2.6
24
37.00
3.2
28
11.91
n.
56
56
56
56
Sk
1.03
0.50
0.72
0.27
*1969-70 pretest achievement scores based on Stanford Primary I (X) administered 10/69.
1969-70 posttest achievement scores based on Stanford Primary II,(W) administered 5/70.
1970-71 pretest achievement scores based on Stanford Primary II (W) administered 10/70.
1970-71 posttest achievement scores based on Stanford Primary II (X) administered 5/71.

Table 55
Longitudinal Survey of Mathematics Achievement of Third Grade Pupils
Enrolled at LoganSchool During 1970-71 and Burbank-Crockett Schools in 1969-70,
as Measured by the Stanford Achievement Tests.*
1969-70
Total Arithmetic
Pretest
Raw
.Grade
Score
Equiv.
%ile
Rank
Computation
Posttest
"Raw
Grade
Score
Equiv.
%Ile
Rank
Raw
Score
Concepts
Posttest
Grade
Equiv.
%Ile
Rank
Mean
31.90
1.7
23
18.98
2.7
36
13.14
2.4
24
Median
32.75
1.7
23
18.67
2.7
36
12.00
2.3
16
G,
25.08
1.5
11
14.65
2.4
20
9.89
1.9
8e
r
Q3
s.
40.13
10.71
1.9
38
24.13
8.14
2.9
50
16.13.
4.95
2.6
32
n.
5959
59
Sk
-0.0
40.30
0.65
*1969-70 pretest achievement scores based on Stanford Primary T (X) adminidtered 10/69.
Note:
Only one score
1969-70 posttest achievement scores based on Stanford Primary II (W) administered 5/70.
is derivable from
this subtest.

Table 55 (continued)
1970-71
Raw
Score
Pretest
Grade
Equiv.
Computation
%ile
Rank
Raw
Score
Posttest
Grade
Equiv.
%lie
Rank
Raw
Score
Pretest
Grade
Equiv.
Concepts
vile
Raw
Rank
Score
Posttest
Grade
Equiv.
%ile
Rank
Mean
18.22
2.6
20
26.05
3.0
14
13.37
2.4
16
18.97
2.7
20
Ntv coMedian
20.13
2.7
24
26.75
3.0
14
12.55
2.3
12
18.33
2.7
20
qi
11.38
1.9
4'
21.88
2.7
69.94
1.9'
612.79
2.3
6
Q3
23.81
2.9
38
32.63
3.6
32
16.13
2.6
24
24.25
3.2
34
s.
8.42
8.91
5.04
7.93
n.
59
59
59
59
sk
-0.82
0.19
0.96
0.07
1970-71 pretest achievement scores based on Stanford Primary II (W) administered 10/70.
1970-71 posttest achievement scores based on Stanford Primary II
(X) administered 5/71.
MIN
IIMO
MIMI
tow.
imse.
*04

OM
loom
Orm
a.us
imas
w
Table 56
Longitudinal Survey of Mathematics Achievement of Third Grade Pupils
Enrolled at Lowell School During-1970-71 and Burbank-Crockett Schools in 1969-70,
as Measured by the Stanford Achievement Tests.*
1969-70
Total Arithmetic
Pretest
Raw
Grade
Score
Equiv.
("ale
Rank
Computation
Posttest
Raw
Grade
Score
Equiv.
%ile
Rank
Raw
Score
Concepts
Posttest
Grade
Equiv.
%ile
Rank
I-0
Mean
34.16
1.7
23
21.32
2.8
44
16.36
2.6
32
Median
35.00
1.7
23
22.00
2.8
44
16.25
2.6
32
Q1
22.75
1.5
11
17.13
'2.6
28
11.25
2.1
10
Q3
42.75
2.0
44
26.42
3.0
56
21.25
3.1
58
s.
11.18
7.97
5.68
n.
25
2525
Sk
-0.45
-0.10
0.00
*1969-70 pretest achievement scores based on Stanford Primary I (X) administered 10/69.
Note:
Only one score
1969-70 posttest achievement scores based on Stanford Primary II (W) administered 5/70.
is derivable from
this subtest.

1-.
Table 56 (continued)
1970
-71
Raw
Score
Pretest
Grade
Equiv.
Computation
%ile
Raw
Rank
Score
Posttest
Grade
Equiv.
%ile
Rank
Raw
Score
.....,
Pretest
Grade
Equiv.
Concepts
'ale
Raw
Rank
Score
Posttest
Grade
Equiv.
%ile
Rank
Mean
22.80
2.9
38
30.28
3.3
22
13.16
2.4
16
20.80
3.1
32
Median
21.25
2.8
32
30.75
3.4
24
12.63
2.4
16
19.00
2.9
26
Qi
18.13
2.6
20
23.92
2.8
10
9.25
1.7
412.92
2.4
8
Q3
26.42
3.o
44
37.25
3.8
44
15.88
2.6
24
28.25
4.1
56
s.
6.65
10.27
5.53
8.29
n.
25
25
25
25
Sk
0.50
-0.05
-o.o4
0.83
'1970-71 pretest achievement scoresbased on Stanford Primary II
(W) administered 10/70.
1970-71 posttest achievement scoresbased on Stanford Primary II
(X) administered 5/71.
min
aM
OM

1;44
Table 57
Longitlinal survey of Mathematics Achievement of Third Grade Pupils
Enrolled at Sherman &chool During 1970-71 and Burbank-Crockett Schools in 1969-70,
as. Measured by the Stanford Achievement Tests.'
;
1969-70
t-s
1/4,
1
Total Arithmetic
Pretest
Raw
Grade
Score
Eauiv.
?ale
Rank
Computation
Posttest
Raw
Grade
Score
Equiv.
56ile
Rank
Raw
Score
Concepts
Posttest
Grade
Equiv.
Rank
Mean
31.77
1.7
23
19.25
2.7
36
14.32
2.5
24
Median
31.50
1.7
23
18.50
2.6
28
13.17
2.4
20
Q1
26.00
1.5
11
14.50
2.3
18
10.00
1.9
8
o3
37.50
1.8
3o
24.50
2.9
50
19.50
3.o
54
s.
8.4n
7.08
5.91
n.
56
56
56
3k
0.09
0.40
0.67
1969-70 pretest achievement scores based on Stanford rrimary I (X) administered 10/69.
Note:
Only one score
1969-70 posttest achievement scores based on Stanford Primary II (W) administered 5/70.
is derivable from
this subtest.

Table 57(continued)
1970-71
Raw
Score
Pretest
Grade
Equiv.
Computation
%ile
Raw
Rank
Score
Posttest
Grade
EalLa
%ile
Rank
Raw
Score
Pretest
Grade
Equiv.
Concepts
%ile
Rank
Raw
Score
Posttest
Grade
Eaaat
file
Rank
Mean
17.38
2.6
20
25.64
3.0
14
13.09
2.4
16
18.91
2.7
20
Median
18.17
2.6
20
27.50
3.1
16
11.79
2.3
12
18.00
2.7
20
Q1
13.50
2.3
11
20.75
2.7
69.00
1.7
412.50
2.2
4
Q 321.83
2.8
32
30.83
3.4
24
,16.83
2.7
32
24.50
3.2
34
s.
5.60
7.90
6.23
7.91
n.
56
56
56
56
Sk
-0.24
-0.68
0.58
0.17
`1970,-71 pretest achievement scores based on Stanford Primary II (W) administered 10/70.
1970-71 posttest achievement scores based on Stanford Primary II (X) administered 5/71.
low
n67.
41,";gettA
for.
memo
j

Table 58
Longitudinal Survey of Reading Achievement of Fourth Grade Pupils Enrolled
at Logan School For Two Consecutive Years, as Measured by the Stanford Achievement Tests
1969-70
Word Meaning*
Pretest
Posttest
Raw
Grade
%ile
Raw
Grade
%ile
Score
Equiv.
Rank
Score
Equiv.
Rank
1970-71
Pretest
Posttest
Raw
Grade
%ile
Raw
Grade
%ile
Score
Equiv.
Rank
Score
Equiv.
Rank
Mean
14.28
2.5
16
18.28
2.8
11
9.02
3.1
Vit
12.85
3.6
16
i-s
!
Median 13.17
2.3
12
17.83
2.8
11
8.38
3.0
14
13.10
3.6
16
\A
Qi
10.25
1.9
614.50
2.5
45.75
2.7
88.5o
3.o
6
Q3
18.00
2.8
34
23.50
3.6
36
12.00
3.5
3o
16.70
4.1
3o
8.
5.90
5.93
4.86
5.58
n.
60
60
60
60
Sk
0.49
0.26
0.32
-0.12
*1969 pretest scores obtained from Stanford Primary II (W) administered 10/69.
1970 posttest scores obtained from Stanford Primary II (X) administered 5/70.
1970 pretest scores obtained from Stanford Intermediate I (W) administered 10/70.
1971 posttest scores obtained from Stanford Intermediate I (W) administered 5/71.

4r
Table 58 (continued)
Paragraph Meaning'
Raw
Score
Pretest
Grade
Equiv.
1969-70
%ile
Raw
Rank
Score
Posttest
Grade
Equiv.
%ile
Rank
Raw
Score
Pretest
Grade
Equiv.
1970-71
%ile
Rank
Raw
Score
Posttest
Grade
Equiv.
%ile
Rank
Mean
22.20
2.3
14
29.92
2.8
14
15.75
2.8
12
18.701
3.1
10
Median
18.50
2.0
829.10
2.7
12
15.00
2.8
12
17.33
2.9
6
Q1
11.50
1.7
220.00
2.2
410.83
2.4
512.50
2.5
2
Q 331.50
2.9
36
39.25
3.3'
32
20.83
3.4
28
23.50
3.8
28
a.
12.22
11.28
7.29
8.27
n.
60
60
60
60
Sk
0.60
0.25
0.33
0.04
'1969 pretest scores obtained from Stanford Primary II (W) administered 10/69.
1970 posttest scores obtained from Stanford Primary II (X) administered 5/70.
1970 pretest scores obtained from Stanford Intermediate I (W) administered 10/70.
1971 posttest scores obtained from Stanford Intermediate I (W) administered 5/71.
1101
01*N
MI
IMM
O11
1111
0Immo
Mew
Omni
MIMS
IMMOMO MO
IMO

Table 59
Longitudinal Survey of Reading Achievement of Fourth Grade Pupils Enrolled
at Lowell School For Two Consecutive Years, as Measured by the Stanford Achievement Tests
Word Meanings
1969-70
1970-71
Pretest
Posttest
Raw
Score 2ta
:da
Rank
Equiv.
Ouiv.
Rank
%ile
Grade
Raw
Grade
Mean
15.67
2.7
26
19.27
2.9
14
51
Median
15.81
2.7
26
19.43
2.9
14
Q12.53
2.3
1?
17.13
2.7
81
Q3
17.88
2.8
34
22.08
3.3
26
8.
4.18
4.22
n.
33
33
33
33
Sk
-0.45
0.14
0.21
-0.75
Raw
Score
Pretest
Grade
FiOuiv.
%ile
Raw
Score
Posttest
Grade
Equiv.
i1e
Rank
9.21
3.1
18
13.48
3.6
16
8.38
3.0
14
14.00
3.7
20
5.92
2.7
89.06
3.1
8
11.42
3.3
26
16.25
3.9
26
4.62
4.58
1969 pretest scores obtained from Stanford Primary II (W) administered 10/69.
1970 posttest scores obtained from Stanford Primary II (X) administered 5/70.
1970 pretest scores obtained from Stanford Intermediate I (W) administered 10/70.
1971 posttest scores obtained from Stanford Intermediate I (W) administered 5/71.

1969-70
Table 59 (continued)
Paragraph Meanings
Pretest
Posttest
Raw
Grade
Nile
Raw
Grade
%ile
Score
Eauiv.
Rank
Score
Eallsit
Rank
Mean
23.48
2.4
14
30.82
2.9
16
Median
25.33
2.5
20
31.33
2.9
16
91
16.13
1.9
123.92
2.5
8
Q3
30.88
2.9
50
37.38
3.2
28
s.
8.65
8.67
n.
33
33
Sk
-0.50
-0.20
1970-n
Raw
Score
Pretest
Grade
Sallimt
?ale
Rank
Raw
Score
Posttest
Grade
Equiv.
%ile
hank
17.21
2.9
16
23.82
3.8
22
16.75
2.9
16
23.25
3.7
20
12.31
2.5
619.55
3.2
12
21.25
3.4
28
27.38
4.1
30
6.27
6.01
33
33
0.00
0.11
1969 pretest scores obtained from Stanford Primary II ('.1) administered 10/69.
1970 posttest scores obtained from Stanford Primary II (X) administered 5/70.
1970 pretest scores obtained from:Stanford Intermediate I (W) administered 10/70.
1971 posttest scores obtained from Stanford Intermediate I (W) administered 5/71.
mlo
.wal
1
mam
est
mWow
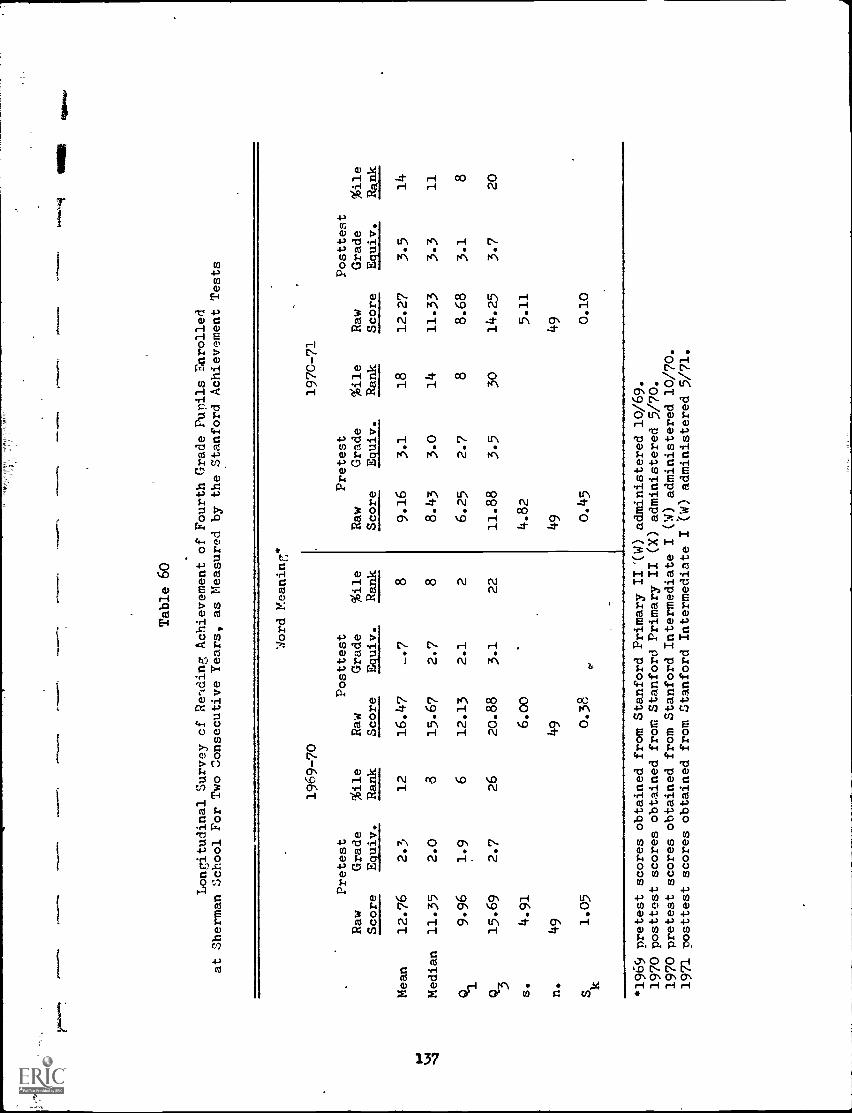
Table 60
Longitudinal Survey cf Re-iding Achievement of Fourth Grade Pupils Enrolled
at Sherman School For Two Consecutive Years, as Measured by the Stanford Achievement Tests
Word Meaning*
Raw
Score
Pretest
Grade
Equiv.
1969-70
%ile
Rank
Posttest
Raw
Grade
Score
Equiv.
%ile
Rank
Pretest
Raw
Grade
Score
Equiv.
1970-71
%ile
Rank
Raw
Score
Posttest
Grade
Equiv.
%ile
Rank
Mean
12.76
2.3
12
16.47
-.7
89.16
3.1
18
12.27
3.5
14
Fa
kJo
.3
Median
11.35
2.0
815.67
2.7
88.43
3.0
14
11.33
3.3
11
Qi
9.96
1.9
612.13
2.1
26.25
2.7
88.68
3.1
8
Q3
15.69
2.7
26
20.88
3.1
22
11.88
3.5
30
14.25
3.7
20
s.
4.91
6.00
4.82
5.11
n.
49
49
49
49
Sk
1.05
0.38
0.45
0.10
*1969 pretest scores obtained from Stanford Primary HU) administered 10/69.
1970 posttest scores obtained from Stanford Primary II (X) administered 5/70.
1970 pretest scores obtained from Stanford Intermediate I (W) administered 10/70.
1971 posttest scores obtained from Stanford Intermediate I (W) administered 5/71.

Table 60 (continued)
Paragraph Meaning'
Raw
Score
Pretest
Grade
falla
1969-70
Ale
Rank
Raw
Score
Posttest
Grade
Equiv.
Ale
Rank
Raw
Score
Pretest
Grade
Equiv.
1970-71
%ile
Rank
Raw
Score
Posttest
Grade
Equiv.
ale
Rank
Mean
19.06
2.1
10
28.02
2.7
12
17.47
2.9
16
21.45
3.4
14
f+
Median
15.63
1.9
628.00
2.7
12
17.00
2.9
16
20.13
3.2
11
VI,
Q1
11.13
.1.7
219.75
2.2
412.58
2.6
815.13
2.8
8
Q.4
25.25
2.5
20
35.25
3.1
23
21.69
3.6
32
26.88
4.1
28
s.
10.21
10.40
7.15
,.
'8.46
n.
49
49
49
49
Sk
0.73
-0.13
0.06
0.30
1969 pretest scores obtained from Stanford Primary II (W) administered 10/69.
1970 posttest scores obtained from Stanford Primary II (X) administered 5/70.
1970 pretest scores obtained from Stanford Intermediate I (W) administered 10/70.
1971 posttest scores obtained from Stanford Intermediate I (W) administered 5/71.
imam;
0101MM
*MOO
11000,
Imam
telly/41i
Ommliq
i410141

WIN
* 4
0,11
io1-
.414
4
Table 61
Arrimmo,!,
WINUM
MIMS
INNIS
11111111M
Rum
Longitudinal Survey of Mathematics Achievement of Fourth Grade Pupils Enrolled
at Logan School For Two Consecutive Years, as Measured by the Stanford Achievement Tests
Computation
)-4 w .0
Mean
Median
Q1 3
s.
n. Sk
Raw
Score
Pretest
Grade
Equiv.
1969-70
%ile
Rank
Raw
Score
Posttest
Grade
Equiv.
pile
Rank
Raw
Score
Pretest
Grade
Equiv.
1970-71
%ile
Rank
Raw
Score
Posttest
Grade
Equiv.
%ile
Rank
16.47
16.50
11.83
21.25
7.49
60 0.00
2.5
2.5
2.0
2.8
14 14 6
32
24.83
24.67
17.00
33.75
9.50
60 0.21
2.9
2.9
2.4
3.6
11
11 4
32
7.25
6.67
4.36
10.00
3.65
60 0.36
2.9
2.9
2.2
3.5
8 8 2
22
10.52
10.30
5.67
13.83
4.97
60
-0.27
3.6
3.5
2.7
3.9
10 8 2
18
*1969 pretest scores obtained from Stanford Primary II (W) admiristered 10/69.
1970 posttest scores obtained from Stanford Primary II (X) administered 5/70.
1970 pretest scores obtained from Stanford Intermediate I (W) administered 10/70.
1971 posttest scores obtained from Stanford Intermediate I (W) administered 5/71.

Table 61 (continued)
Concepts
1969
-70
Pretest
Posttest
Raw
Grade
%ile
Raw
Grade
%ile
Score
Equiv.
Rank
Score
Equiv.
Rank
Mean
12.70
2.4
16
17.02
2.6
14
Median
10.25
1.9
614.75
2.5
10
l8.13
1.6
210.83
2.1
3
n15.25
2.6
24
23.50
3.2
34
.3
s.
6.25
8.39
n.
60 0.81
6o 0.
75
1970-71
Pretest
Posttest
Raw
Grade
%ile
Raw
Grade
%ile
Score
Equiv.
Rank
Score
Equiv.
Rank
7.98
2.7
14
9.32
3.o
10
7.33
2.5
10
8.5o
2.7
6
5.88
2.3
65.83
2.3
2
9.7o
3.3
26
11.25
3.6
18
3.28
4.54
6o
6o
0.48
0.00
1969 pretest scores obtained from Stanford
Frimary II CO administered 10/69.
1970 posttest scores obtained from
Stanford Primary II (X) administered 5/70.
1970 Pretest scores obtained from StanfordIntermediate I (
administered 10/70.
1971 postt?st scores obtained fromStanford Intermediate I (W) administered
5/71.
1"q"
-/Y
4000
014,
0010
,00

Table 62
Longitudinal Survey of Mathematics Achievement
of Fourth Grade Pupils Enrollee
at Lowell School For Two
Consecutive Years, as Measured by
t4e Stanford Achievement Tests
Computation*
1969
-70
1970-71
Pretest'
Posttest
Pretest
Posttest
Raw
Grade
%ile
Raw
Grade
'Ale
Raw
Grade
'Ale
Raw
Grade
%ile
Score
Equiv.
Rank
Score
Equiv.
Rank
Score
Equiv.
Rank
Score
Equiv.
Rank
----
Mean
22.15
2.8
32
3%00
3.6
32
9.85
3.5
22
15.15
4.0
20
1-0
Median 21.88.
2.8
32
35.00
3.7
4o
9.27
3.3
16
14.67
4.o
20
qi
18.55
2.7
24
27.52
3.1
16
8.52
3.3
16
11.68
3.7
12
25.42
3.0
44
39.38
3.9
50
12.88
3.8
4o
18.38
4.4
32
Q3
s.
4.72
9.41
4.13
5.98
n.
33
33
33
33
Sk
0.06
-0.47
1.13
0.21
*1969 pretest scores obtained from StanfordPrimary II (W) administered
10/69.
1970 posttest scores obtained from
Stanford Primary II (X) administered
5/70.
1970 pretest scores obtained from
Stanford Intermediate I (W), administered
10/70.
1971 posttest scores obtained from
Stanford Intermediate I (W) administered
5/71.
rift

Table 62 (continued)
Concepts*
Raw
Score
Pretest
Grade
Equiv.
1969
-70
%ile
Rank
Raw
Score
Posttest
Grade
Equiv
%ile
Rank
Raw
Score
Pretest
Grade
Equiv.
1970-71
%ile
Rank
Raw
Score
Posttest
Grade
Equiv.
%ile
Rank
Mean
12.06
2.3
12
21.00
2.9
26
10.06
3.3
26
13.70
4,6
42
1edian
12.00
2.3
12
22.00
3.0
28
10.88
3.6
34
13.33
4.3
32
ql
8.63
1.7
415.25
2.5
10
7.92
2.7
14
8.58
3.0
lo
n3
15.38
2.6
24
25.88
3.4
42
12.65
4.3
54
18.25
5.4
64
s.
4.16
6.33
3.77
5.37
n.
33
33
33
33
sk
0.00
-0.54
0.50
0.04
1969 pretest scores obtained from Stanford Primary II (W) administered
10/69.
1970 posttest scores obtained from Stanford Primary II
(X) administered 5/70.
1970 pretest scores obtained from Stanford Intermediate I
(W)administered 10/70.
1971 posttest scores obtained from Stanford Intermediate I
(W) administered 5/71.
t.rdw
.ft
me.
goo"
iiraisoi
tffliff.
MI*
OM ISM
Mew
WIA
lgo

t
Table 63
am,
MO
N11
1111
116
.10
Longitudinal Survey of Mathematics Achievement of Fourth Grade Pupils Enrolled
at Sherman School for Two Consecutive Years, as Measured iv the Stanford Achievement Tests
Computation*
Raw
Score
Pretest
Grade
Equiv.
1969
-70
96ile
Rank
Raw
Score
Posttest
Grade
Equiv.
'Mae
Rank
Raw
Score
Pretest
Grade
Equiv.
1970-71
%ile
Raw
Rank
Score
Posttest
Grade-
Equiv.
%ile
Rank
Mean
14.92
2.4
12
23.35
2.8
10
8.82
3.3
16
13.43
3.8
16
Median
13.75
2.3
11
22.75
2.8
10
8.2o
3.1
11
12.56
3.8
16
Q,
10.31
1.9
416.63
2.4
45.38
2.5
49.06
3.3
6
Q3
19.75
2.7
24
29.25
,
3.2
20
11.88
3.7
34
17.75
4.4
32
s.
6.57
10.43
4.27
5.56
n.
49
49
49
49
sk
0.54
0.06
0.26
0.39
*1969 pretest scores obtained from Stanford Primary II (W) administered 10/69.
1970 posttest scores obtained from Stanford Primary II (X) administered 5/70.
1970 pretest scores obtained from Stanford Intermediate I (W) administered 10/70.
1971 posttest scores obtained from Stanford Intermediate I (W) administered 5/71.

Table E3 (continued)
Concepts*
Raw
Score
Pretest
Grade
Equiv.
1969-70
%ile
Rank
Postest
Raw.
Grade
Score
Equiv.
%ile
Rank
Raw
Score
Pretest
.Grade
Equiv.
1970-71
%ile
Rank
Mean
12.84
2.4
16
17.45
2.6
14
7.92
2.7
14
Median
11.00
2.1
815.33
2.5
10
7.20
2.5
10
gi
9.15
1.7
411.31
2.1
34.95
2.2
.5
Q 315.42
2.6
24
21.88
3.0
28
10.94
3.6
34
s.
5.27
8.29
4.35
n.
49
49
49
sk
0.78
0.48
0.16
1969 pretest scores obtained from Stanford Primary II (W)
administered 10/69.
1970 posttest scores obtained from Stanford Primary II (X)
administered 5/70.
1970 pretest scores obtained from Stanfora Intermediate I (4)
administered 10/70.
1971 posttest scores obtained from Stanford Intermediate I (W) administered 5/71.
Raw
Score
11.02
9.00
6.75
13.38
6.16
49 0.64
Posttest
Grade
Equiv.
%ile
Rank
3.6
18
3.0
10
2.5
4
4.3
32

Table 64
Longitudinal Survey of Mathematics Achievement of Fifth Grade Pupils Enrolled
Logan School for Two Consecutive Years, as Measured by the Stanford and CTBS Tests
I-1
4r
%.n
Mean
Median
Qi
Q3 s. n. Sk
Pretest
Raw
Grade
Score
Computation*
1969-70
Posttest
%ile
Raw
Grade %ile
Rank
Score Equiv. Rank
Computation*
1970
Raw
Grade %ile
Scorer:::::.
Rank
Concepts*
1969-70
Pretest
Posttest
Raw
Grade vile
Raw
Grade %ile
Score Eauiv. Rank
Score Equiv.-Rank
8.16
7.43
5.08
10.75
3.95
43
.34
3.1
2.9
2.5
5.6
11 8
10
28
10.98
10.60
8.75
13.31
3.51
43
.38
3.6
3.6
3.3
3.8
10
10 6
16
24.00
24.00
18.25
29.25
7.52
43 -.09
4.2
4.2
3.6
4.7
23 23
11 38
7.12
7.20
5.38
9.31
2.89
43
.10
2.5
2.5
2.2
3.0
10 10 5
22
8.63
8.08
6.44
10.75
3.02
43
.24
3.0
2.7
2.3
3.6
6 2 12
Concepts*
1970
Pretest
Raw
Grade %ile
Score Equiv. Rank
13.37 3.8
12.75 3.1
9.08 2.6
16.63 4.7
5.08
43
.06
26
24
10
39
*1969-70 Computation scores obtained from the Stanford Intermediate I (W) administered 10/69 and 5/70.
1969-70 Concepts scores obtained from the Stanford Intermediate I (W) administered 10/69 and 5/70.
1970 Computation and Concepts scores obtained from the Comprehensive Tests of Basic SkillsII(Q) administered 10/70.
Note:
A Spring, 1971 posttest was not administered at grade 5 because there is presently no alternative form of the
CTBS (II) battery and the pupils under study are scheduled for identical testing in Fall, 1971.

Table 65
Longitudinal Survey of Mathematics Achievement of Fifth Grade Pupils Enrolled at
Sherman School for Two Consecutive Years, as Measured by the Stanford and CTBS Tests
Computation*
1969-70
Computation*
1970
Pretest
Posttest
Pretest
Raw
Grade %ile
Raw
Grade %ile
Raw
Grade %ile
Score Equiv. Rank
Score Equiv. Rank
Score Equiv. Rank
Mean
6.44 2.7
611.76 3.7
12
19.57 3.8
13
Modian
6.57 2.9
812.00 3.7
12
20.25 3.8
15
Q1
3.88 2.2
27.56 3.1
414.92 3.3
6
Q3
8.25 3.1
11
15.19 4.0
20
23.65 4.2
23
s.
3.25
4.47
5.21
n.
41
41
41
Sk
-.46
-.33
-.44
Concepts*
Concepts
1969-70
1970
Pretest
Posttest
Pretest
Raw
Grade %ile
Raw
Grade pile
Raw
Grade %ile
Score Equiv. Rank
Score Equiv. Rank
Score Equiv. Rank
6.78 2.5
10
8.49 3.0
10
14.24 4.0
29
6.63 2.5
lo
8.00 2.7
614.88 4.2
31
4.92 2.2
56.56 2.5
411.25 2.8
18
9.19 3.o
22
10.46 3.3
12
16.47 4.6
39
2.52
3.13
4.59
41
41
41
.4o
.26
.78
*1969-70 Computation scores obtained from the Stanford Intermediate I (W) administered 10/69 and 5/70.
1969-70 Concepts scores obtained from the Stanford Intermediate I (W) administered 10/69 and 5/70.
1970 Computation and Concepts scores obtained from the Comprehensive Tests of Basic Skills II (Cl) administered 10/70.
.Note:
A Spring, 1971 posttest was not administered at grade 5 because there is presently no _ternative form of the
CTBS (II) battery and the pupils under study are scheduled for identical testing in Ftll, 1971.
F.fr±4,4

Table 66
Longitudinal Survey of Mathematics Achievement of Fifth Grade Pupils Enrolled at
Lowell School for Two Consecutive Years, as Measured by the Stanford and CTBS Tests
Mit
Computation*
1969-70
Computation
1970
Pretest
Posttest
Pretest
Raw
Grade %ile
Raw
Grade %ile
Raw
Grade %ile
Score Equiv. Rank
Score Equiv. Rank
Score Equiv. Rank
Mean
11.69 3.7
34
16.27 4.1
24
28.38 4.6
35
ts:-
Median 12.90 3.8
40
14.50 4.0
20
28.00 4.6
34
.3
Qi
7.00 2.9
812.00 3.7
12
22.00 4.0
18
Q3
15.67 4.1
50
21.75 4.9
.49
36.00 5.4
65
s.
5.03
6.98
7.76
n.
26
26
26
.72
,.98
.33
Sk
Concepts'
1969-70
Concepts*
1970
Pretest
Posttest
Pretest
Raw
Grade %ile
Raw
Grade %ile
Raw
Grade %ile
Score Equiv. Rank
Score Equiv. Rank
Score Equiv. Rank
8.54 3.0
22
8.90 3.0
22
6.00 2.3
6
10.63 3.6
34
3.37
12.62 4.3
32
15.65:4.5
10.83 3.6
18
15.00 4.2
8.00 2.7
611.00 3.4
17.88 5.4
64
20.67 5.6
5.58
5.49
26
26
26
.51
1.04
.35
35
32
17
59
1969-70 Computation scores obtained from the Stanford Intermediate I (W) administered 10/69
and 5/70.
1969-70 Concepts scores obtained from the Stanford Intermediate I (W) administered 10/69
and 5/70.
1970 Computation and Concepts scores obtained from the Comprehensive Tests of Basic Skills II (q)administered 10/70.
Note:
A Spring, 1971 posttest was not administered at grade 5 because there is presentlyno alternative form of the
CTBS (II) battery and the pupils under study are scheduled for identical testing in Fall,
1971.

Table 67
Longitudinal Survey of Reading Achievement of Fifth Grade Pupils Enrolled at
Logan School for Two Consecutive Years, as Measured by the Stanford and CTBS Tests
Word Meaning'
1969-70
Pretest
Posttest
Raw
Grade %ile
Raw
Grade %ile
Score Equiv. Rank
Score Equiv. Rank
Mean
11.33 3.3
26
30
14
44
Median 11.88 3.5
S;
c7.65 3.0
Q3
.14.58 3.8
s.
5.08
n.
43
Sk
-0.44
14.35 3.7
20
15.25 3.8
23
9.38 3.1
8
18.63 4.6
42
5.99
43
-0.54
Vocabulary'
1970
Pretest
Raw
Grade %ile
Score Equiv. Rank
19.81 4.2
20.75 4.3
15.25 3.5
24.56 5.0
6.64
43
-0.36
30
33
19 46
Paragraph Meaning'.
1969-70
Pretest
Posttest
Raw
Grade %ile
Raw
Grade
'Idle
Score Eouiv. Rank Score Equiv. Rank
21.05 3.4
20.38 3.4
16.42 2.8
24.75 3.9
1 '6.8o
43 -0.1
4
28
28
12
44
Comprehension'
1970
Pretest
Raw
Grade %ile
Score Equiv. Rank
22.60 3.7
20
19.44 3.7
27
22.80 3.7
20
17.67 3.9
25
15.25 2.8
513.19 3.2
12
28.13 4.2
34
24.75 5.0
40
8.33
3.95
43 0.45
43 -0.3
4
'Word Meaning scores obtained from the Stanford Intermediate I (W)
administered as pretest 10/69 and posttest 5/70.
Vocabulary scores obtained from the Comprehensive Tests of Basic Skills II (Q)administered 10/70.
Paragraph meaning scores obtained from the Stanford Intermediate I (W)administered as pretest 10/69 and posttest 5/70.
Comprehension scores obtained from the Comprehensive Tests of Basic SkillsII (Q) administered 10/70.
Note: A Spring, 1971 posttest was not administered at grade 5 because
there is presently no alternative form of the
CTBS (II) battery and the pupils under study
are scheduled for identical testing in the Fall, 1971.
4r4
,

....
Table 68
Longitudinal Survey of Reading Achievement of Fifth Grade Pupils Enrolled at
Lowell School for Two Consecutive Years, as Measured by the Stanford and CTBS Tests
Raw
Score
Word
Pretest
Grade
Equiv.
Meaning*
1969-70
%ile
Rank
Posttest
Raw
Grade Pale
Score Enuiv. Rank
Vocabulary'
1970
Pretest
Raw
Grade %Ile
Score Enuiv. Rank
Pretest
Raw
Score
Paragraph Meaning'
1969-70
Posttest
Grade Ale Raw
Grade %ile
Eouiv. Rank
Score Ecuiv. Rank
Comprehension*
1970
Pretest
Raw
Grade
;Vile
Score Eouiv. Rank
Mean
8.96
3.1
18
13.54
3.7
20
18.73 4.o
2717
.04
2.9
16
22.04
3.6
18
21.77
4.5
32
Median
8.50
3.1
18
12.50
3.6
16
18.50
3.9
2715.50
2.8
12
21.50
3.6
18
21.174.3
35
i-04r
Q5.75
2.7
88.75
3.1
815.003.5
1813.25
2.6
8ic R8 2.8
515.25
3.5
17
Q3
11.33
3.3
26
17.33
4.1
3o
21.75
4.5
3619.00
3.1
22
27.00
4.1
30
26.00
5.1
44
s.
4.97
5.71
5.98
6.19
8.16
7.30
n.
26
26
2626
26
26
Sk
0.03
0.25
-0.0
70.78
-0.21
-.20
Word Meaning scores obtained from the Stanford Intermediate I (W) administered
as pretest 10/69 and posttest 5/70.
Vocabulary scores obtained from the Comprehensive Tests of Basic Skills
II (q) administered 10/70.
Paragraph meaning scores obtained from the Stanford Intermediate I(W) administeredas pretest 10/69 and posttest 5/70.
Comprehension scores obtained from the Comprehensive Tests of Basic Skills II (q)
administered 10/70.
Note:
A Spring, 1971 posttest was not administered at grade 5 because there is
presently no alternative form of the
CTBS (II) battery and the pupils under study
are scheduled for identical testing in the Fall, 1971.

Table 69
Longitudinal Survey of Reading Achievement of Fifth Grade Pupils Enrolled at
Sherman School for Two Consecutive Years, as Measured by the Stanford and CTBS Tests
Word Meaning
1969-70
Pretest
Posttest
Raw
Grade
%ile
Raw
Grade %ile
Score Equiv. Rank Score Equiv. Rank
Mean
8.10 3.0
14
10.50 3.2
10
Median
7.75 3.0
14
10.20 3.2
10
01 3
s.
n.
C.
5.88 2.7
10.42 3.2
3.07
41 0.33
8(7.82 3.0
6
22
14.65 3.8
23
3.90
41 0.61
Vocabulary
1970
Pretest
Raw
Grade %ile
Score Equiv. Rank
17.90 3.9
18.00 3.9
14.81 3.5
22.19 4.5
5.42
41 0.27
24
25
17
38
Paragraph Meaning
1969-70
Pretest
Posttest
Raw
Grade Ile Raw
Grade
%114
Score Equiv. Rank
Score alta Rank
14.80 2.8
12
19.98 3.2
10
14.25 2.7
11
18.67 3.1
8
7.25 2.1
114.56 2.8
3
18.25 3.0
14
24.19 3.8
23
6.30
6.78
41
41
-0.55
0.29
Comprehension'
1970
Pretest
Raw
Grade %ile
Score Equiv., Rank
20.83 4.0
33
21.00 4.0
34
15.75 3.4
l'
26.69 4.8
46
7.0
41 0.08
Word Meaning scores obtained from the Stanford Intermediate I (W) administered as rretest 10/69 and posttest 5/70.
Vocabulary scores obtained from the Comprehensive Tests of Basic Skills II (0 administered 10/70.
Paragraph meaning scores obtained from the Stanford Intermediate I (W) administeredas pretest 10/69 and posttest 5/70.
Comprehension scores obtained from the Comprehensive Tests of Basic Skills II (c) administered 10/70.
Note:
r Spring,, 1971 posttest was not administered at grade 5 because there is presently no alternative form of the
.:CBS (II) battery and the pupils under study are scheduled for identical testing in the Fall, 1971.
i-tor4
'efa
se.4

ra
$114
1i.i1
.611
.4.44
fie...44
Table 70
Statistical Characteristics of 1970-71 Comprehensive Tests of Basic Skills Scores in
Reading, Language, and Mathematics Achievement for Sixth Grade Pupils Enrolled at Lowell School
for Two Consecutive Years
Total Reading*
Pretest
Posttest
Raw
Grade
';;ile
Raw
Grade
%ile
Score Equiv. Rank
Score Eauiv. Rank
Mean
46.64
6.7
ho
44.59
6.
47
Median 46.50
6.7
58
43.50
6.4-
45
1-&
.n r
'1
37.67
5.7
43
32.75
5.7
34
03
57.00
9.c
79
55.67
7.8
69
s.
12.00
13.07
n.
22
22
Sk
0.17
0.72
Total Language*
Pretest
Posttest
Raw
Grade %ile
Raw
Grade
%ile
Score Equiv. Rank
Score 7!3auiv. Rank
50.18
7.0
65
51.63
7.3
6o
54.0o
7.6
74
52.25
7.3
6o
48.00
6.?
60
44.00
6.1
41
57.25
8.2
79
62.00
9.3
82
11.18
1?.94
22
22
0.67
0.06
Total Arithmetic*
Pretest
Posttest
Raw
Grade
%ile
Raw
Grade
%ile
Score Eauiv. Rank
Score Equiv. Rank
55.86
6.3
65
60.95
7.3
61
57.90
7.0
!69
59.5o
7.1
59
45.00
5.R
450.75
6.4
44
65.0o
7.7
80
78.00
8.9
87
14.11
17.44
22
22
-1.54
-0.04
*Pretest scores based upon CTBS, Level 2 (form Q) administered October, 1970.
Posttest scores based upon CTBS, Level 2 (form 0 administered May, 1971.

Table 71
Statistical Characteristics of 1970-71 Comprehensive Tests of Basic Skills Scores in
Reedinp:, Lan-uace, and Mathematics Achievement for Sixth Grade
i,ogan School
for Two Consecutive Years
Tot.1
:'retest
Posttest
Raw
Grade
'Ale
Raw
Grade
Score .]ouiv. l!ank
Score 21ouiv. Rank
Mean
44.5c
6.5
548.715
6.9
53
i-b
Median 43.00
6.3
53
49.13
6.9
55
33.5P7
5.2
35
38.54
5.F,
36
355.35
7.7
76
58.38
".1
72
s.
13.83
14.86
n.
73
73
Sly
-0.20
-0.19
Total Langunr;e*
!'retest
)-orsttest
-dew
Grade
ile
Raw
°ride
Score
:dank
Score 'ouiv. Rank
School failed to test, usinc.
tie CTS:;, Language Subtests
Total trithmetic*
}retest
iosttest
Raw
Grqde
file
Raw
Grade
;ile
Score Eauiv. -lank
Score ::auiv. Rank
54.3'
6.6
(2
61.70
7.4
63
56.00
6.8
65
61.:5
7.3
6i
41.92
5.5
39
6.2
40
65.08
7.7
80
74.8?
8.6
84
15.20
15.71
73
73
-0.43
0.06
Pretest scores based upon CTBh', Level ? (form Q) administered October, 1970.
Posttest scores bred upon CBS, Level 2 (form
administered May, 1971.

Table 72
Statistical Characteristics of 1970-71 Comprehensive Tests of Basic Skills Scores in
tanguar:e, and Mathematics 'achievement for sixth Grade Atpils hrolled :It Sherman School
for Two Consecutive Years
Total Reading*
Pretest
Posttest
Raw
Grade
,ile
Raw
Grade
;ale
Score Equiv. Rank
Score Euuiv. Rank
Mean
4'1.76
6.9
63
53.33
7.4
63
Median 47.13
6.7
60
51.00
7.2
59
Qi
34.38
5.2
35
43.42
6.3
43
Q3
60.75
8.6
85
66.75
9.6
88
s.
15.41
15.82
n.
55
55
Sk
0.07
-0.22
Total Language*
1restst
Posttest
Raw
Grade
;ale
Raw
Grade Ale
Score Enuiv. Rank
Score Eouiv. Rank
47.64
6.1
,60
52.75
7.4
62
49.00
6.2
62
53.88
7.5
65
40.75
5.4
44
43.25
6.0
39
54.63
6.7
75
66.13 10.2
89
12.89
15.38
55
55
-0.38
-0.14
Total Arithmetic*
Pretest
Posttest
Raw
Grade
?ale
Raw
Grade
;ale
Score Eouiv. Rank Score Eouiv. Rank
59.71
7.2
72
66.09
7.7
70
61.75
7.3
75
69.00
8.o
75
47.08
6.0,,
49
53.25
6.5
47
73.13
8.4
89
79.63
9.0
90
16.28
16.42
55
55
-0.26
-0.39
Pretest scores based upon
Level 2 (form (,1) administered October, 1970.
Posttest scores based upon C-7.2, level 2 (form :;,)
administered May, 1971.

--.11
Table 73
Statistical Characteristics of Eighth Grade Reading Achievement,as Measured by the CTBS Reading Subtexts
Graie C retest Statistical Screen
C7R:; 'Aninistation Date:5ubtest 10/2E/70-11/2/70Scores(level 3, IZaw Ale Sdale
form Score Rank Score
Post-test Statistical Screen
Administration Date:4/26/71-5/3/71
Raw ile Scale
:;core G.L.E. Rank Score
VocabularyMean 18.20 6.0 21 469
Median 17.22 5.8 19 458
Q1 12.11 4.6 8 414
c.3 ?3.25 7.1 35 502
s. 7.59n 290
ComprehensioMeanMedian
Q1Q3
s.
n
19.90 5.1 17 455
18.56 4.9 15 447
13.74 3.9 7 403
2r,-.76 6.8 34 507
8.0990
Total Re-AinMean 38.00 5.7 18 455,Median -4c.50 5.4 16 447
1H).05 4.2 6 398
rs 47.86 6.9 32 4967
so)
14.51n 290
20.08 6.6 23 480
19.30 6.4 20 47213.95 5.1 lo 433
25.91 7.9 4o 524
7.95290
21.86 5.6 19 472
21.07 5.4 17 46314.47 3.9 10 403
28.04 7.3 47 525
8.71290
41.87 6.2 19 471
9.50 5.9 16 467.).84 4.8 8 4,1
53.83 7.7 36 521
15.37290
154

Table 74
Statistical Characteristics of Eighth Grade Mathematics Achievement,
as Measured by the CTBS Mathematics Subtests
Grade 8CTBS;;ubtest
Scores(level 3,form 0
Pretest Statistical Screen
Aministration Date:10/26/70-11/2/70
Raw Cale Scale
Score G.I.-- Rank Score
Post-test Statistical Screen
Administration Date:4/26/71-5/3/71
Raw Sc le
Score Rank Score
ComputationMean 22.80 6.0 20 454 25.04 6.3 20 466
Median 21.28 5.7 16 441 23.05 6.o 16 454
"t116.23 4.7 7 400 17.46 5.0 7 400
(13 28.04 6.8 32 484 31.75 7.6 35 484
s. 9.06 10.07
n 262 262
ConceptsMean 14.33 5.9 20 452 16.00 6.8 23 472
Median 14.18 5.9 20 452 15.42 6.5 20 46210.25 4.5 8 404 11.86 5.4 11 43o
Q317.41 6.9 31 482 20.34 8.o 4o 514
s. 5.19 5.84n 262 262
ApplicationMean 8.6E 5.9 21 464 c.88 6.5 21, 478
Median 7.84 5.4 13 449 9.08 6.1 20 464
qln,
5.6511.38
4.56.6
931
414492
6.55
13.335.37.9
124o
433519
S,. 4.14 4.42
n 265 265
TotalMean 45.7 5.9 19 449 50.50 6.3 18 465
Median 42.00 5.5 15 435 46.93 6.o 15 452
`,1 33.11 4.6 7 399 36.44 5.0 7 412
Q3 5.42 7.o 33 486 6.42 7.5 32 501
s. 1C.53 18.07
n 26? 262
1.

4
Table 75.
SAN DIEGO CITY SCHOOLS
TESTING ANO EVALUATION SERVICES
MEMORIAL JUNIOR HIGH SCHOOL
GRADE 8
COMPREHENSIVE TESTS OF BASIC SKILLS, FORM 0, LEVEL 3, ARITHMETIC COMPUTATION
CURRENT
RETARDATION REDUCTION AND DESIRED PROFILES
NOVEMBER, 1970
RA, SCORE
iMTERvALS
20%
25*
30%
45%
50%
55%
75%
95%
CURRENT. CR. 8
RETARcATION
RETARDATION
RETAROATION
RETAROATION
RETAROATION
RETAROATION
RETAROATION
RETAROATION
DISTRIBUTION
REDUCTION
REDUCTION
REDUCTION
REOUCTION
REDUCTION
REOUCTION
REOUCTION
REOUCTION
DESIRE()
DiSTRI8uTiCh
gg
gN
%N
Zr
LI
Ng
1-3
0--
0--
00
00
--
00
--
0--
0
4-0
0--
0--
0--
0--
0--
0--
0--
0--
0--
0--
7 -9
15
4.2
12
3.4
12
3.4
11
3.1
9.5
82.2
82.2
51.4
3.0
2.6
10-12
20
7.3
21
5.9
20
5.6
19
5.3
16
4.5
14
3.9
13
3.6
92.5
41.1
3.0
13-15
47
13.1
39
10.9
37
10.4
35
9.6
29
8.1
27
7.6
25
7.0
17
4.8
92.5
72.0
16-18
60
16.8
50
14.0
47
13.1
45
12.6
37
10.3
35
9.8
32
9.0
22
0.2
13
3.6
10
2.6
19-21
45
12.6
39
10.9
38
10.6
36
10.1
32
9.0
30
8.4
29
8.1
23
6.4
17
4.8
16
4.5
22-24
43
12.0
38
10.7
37
10.4
36
10.1
32
9.0.
30
8.4
29
8.1
24
6.7
19
5.3
18
5.0
25-27
42
11.8
38
10.7
37
10.4
36
10.1
33
9.3
31
8.7
30
8.4
26
7.3
22
6.2
21
5.9
25-30
24
6.7
24
6.7
24
6 .7
24
6.7
24
'16.7
25
7.0
25
7.0
25
7.0
25
7.0
25
7.0
31-33
15
4.2
17
4.8
17
4.8
18
5.0
19
5.3
20
5.6
21
5.9
23
6.4
25
7.0
25
7.0
34-36
61.7
13
2.2
92.5
92.5
11
3.1
11
3.1
12
3.4
14
3.9
16
4.5
16
4.5
37-39
15
4.2
18
5.0
18
5.0
19
5.3
21
5.9
.22
6.2
22
6.2
25
7.0
27
7.6
28
7.8
43-42
12
3.4
18
5.1
20
5.6
21
5.9
26
7.3
28
7.8
29
8.1
35
9.8
41
11.5
43
12.0
43-4:
72.0
18
5.0
20
5.6
23
6.5
31
8.7
34
9.5
36
10.1
47
13.2
57
16.0
60
16.8
46-48
0--
17
4.8
21
5.9
25
7.0
37
10.3
42
11.8
46
12.9
62
17.4
79
22.1
83
23.3
TOTAL
357
357
357
357
357
357
,357
357
357
357
mEAK
20.65
24.92
25.58
26.31
28.49
29.39
30.02
32.93
35.79
30.55
S.Q.
8.40
10.72
11.05
11.31
11.83
11.90
11.93
11.59
10.54
10.08
SPRING NORMS
6/15/71 8T
:Hei
t`ba
x,

ZAN Dr/..10 CITY ZCRC01.53
MTING AND W,11.r.TICN STRV/CEZ
14:110RIAL JUNIOR urea SCHOOL
CR,D1.; 8
Comnrehe43ive Tests of Basic Skills, Vocabulary
Currant
Retardation Reduction and Desired ...rofiles
April, 1971
oaseelle
4
204
P5.6
30%
45%
5o%
554
756
95%.
R.pe Score
Arr.:1,1t ;Ir. 8
Retardation
Retardation
Retardation
Retardation
Retardation
Retardation
Retardation
Retardation
Desired
:atervals
ZAO.ri:ution
Reduction.
Reduction
Reduction
Reduction
Reduction
Reduction
Reduction
Reduction
Distritution
tN
-,4
II
%N
%N
%N
% ,.
N;4
N%
N%
)4
...
1-3
0-_
0--
0--
0_..
0-..
0--
0--
0_,..
0--
0--
4-6
11
3.7
93.0
93.0
82.7
72.3
62.0
62.0
41.3
20.6
2.7
7-9
29
9.7
?4
8.1
27.7
22
6.4
17
37.4
19
5.7
16
5.3
12
4.0
72.3
62.0
10-1'
40
13.4
34
11.4
33
11.1
31
10.4
27
9.1
25
8.4
24
8.1
18
6.0
13
21
4.4
11
3.7
8.4
13-15
34
12.g
33
11.1
32
10.4
31
10.4
28
9.4
27
9.1
25
7.0
16
5.3
1;
7.4
22
5.0
Fr
16-12
46
15.4
41
13.8
39
13.1
38
12.8
34
11.4
32
10.7
31
10.4
26
8.7
20
8.1
2?
6.4
VI
19-1
31
10.4
?9
9.7
29
9.4
27
8.7
24
7.4
....,
9.7
28
9.1
?6
8.7
26
2?-."4
44
14.8
41
13 8
40
13.4
40
13.4
37
12.4
37
12.4
36
12.1
33
11.1
30
10.1
29
9.7
75-P7
:1
7.1
13
8.1
24
8.1
25
8.4
26
8.7
27
9.1
28
9.4
31
lo..4
31
10.4
7.7
24
9.4
31
10.4
34
11.4
35
11.9
?...3::
I°
6.o
2?
7.4
23
7.7
25
8.4
27
7.4
24
31-'k
93.0
15
5.0
1C
6.0
22
9.1
28
8.4
31
10.4
37
12.4
38
12.8
34-iA.
62.0
13\
4.4
lc
5.3
1;
5.7
pa
7.4
24
8.1
26
8.7
33
11.1
40
13.4
42
14.1
51.7
1?
4.0
14
4.7
16
5.3
21
7.0
23
8.1
31
10.4
38
12.8
40
2.7
37-11
40
00
--
20.7
?0.7
20.7
41.3
47.7
214
1.3
62.0
82.7
Total
298
208
298
298
298
298
-298
298
298
298
Vela
1Q.'?
?0.13
20.5?
21.03
3.").
7.'9
8.70
6.87
,8.99
22.32
22.94
9.34
9.32
23.30
25.10
9.33
9.24
26.91
27.40
8.73
8.57
Tab
le 7
7

fabl
e ??
SAN olEGC CITY SCHOOLS
TESTING AN0 EVALUATION SERVICES
MEMORIAL JUNIOR HIGH SCHOOL
GRADE 8
COMPREHENSIVE TESTS OF BASIC SKILLS, LEVEL 3, FORM Q, REAOING COMPREHENSION
CURRENT
RETARDATION REDUCTION ANO DESIRED PROFILES
NOVEMBER, 1970
RAV SCORE
INTERVALS
20%
25%
30%
45%
50%
55%
75%
. 95%
CURRENT GR. 8
RETAROATION
RETAROATION
RETARCATION
RETAROATION
RETAROATION
RETAROATION
RETAPOATION
RETAROATION
DISTRI %UTION
REDUCTION
REOUCTION
REDUCTION
REDUCTION
REDUCTION
REDUCTION
PEoUCTION
REDUCTION
OESIREO
DISTRITILTION-
Ng
14
g1
1t
1N
Ng
1g
Ng
N1
N*
1-3
0--
-0
--
0--
0--
0...
..0
--
0--
0--
0--
o--
4-6
92.4
71.9
71.9
51.S
51;3
41.1
41.1
2.5
1.3
0--
7-9
26
6.9
21
5.5
20
5.3
19
5.0
16
4.2
14
3.7
13
3.4
92.4
41.1
3.8
10-12
48
12.7
,40
10.5
38
10.0
36
9i
30
7.9
28
7.4
26
6.9
18
4.7
10
2.6
62.1
13-15
61
16.1
51
13.5
49
12.9
46
12.
39
10.3
36
9.5
34
9.0
24
6.3
14
3.7
12
3.2
16-18
54
14.2
47
12.4
44
11.0
43
11.4
37
9.8
35
9.2
33
8.7
26
6.9
18
4.7
16
4.2
19-21
43
11.3
38
10.0
37
9.8
36
9.5
32
8.4
31
8.2
31
8.2
26
6.9
21
5.5
20
5.3
22-24
35
9.2
35
9.2
35
9.2
35
9.2
35
9.2
35
9.2
35
9.2
35
9.2
35
9.2
35
9.2
25-27
43
11.3
40
10.5
39
10.3
38
10.0
36
9.5
35
9.2
34
9.0
31
8.2
28
7.4
27
7.1
28-30
18
4.8
23
6.1
24
6.3
26
6.9
29
7.7
31
8.2
32
8.4
37
9.8
42
11.1
43
11.3
I-6
31-33
22
5.8
29
7.7
31
8.2
33
8.7
38
10.0
40
10.6
42
11.1
49
12.9
56
14.8
58
15.3
km
34-J6
13
3.4
22
5.8
24
6.3
26
6.9
32
8.4
35
9.2
37
9.7
45
11.9
54
14.2
56
14.8
Co
37-39
61.6
15
4.0
17
4.5
19
5.0
26
6.9
26
7.4
30
7.9
39
10.3
48
12.7
50
13.2
4c-42
1.3
82.1
10
2.6
12
3.2
17
4.5
19
5.0
20
5.3
27.
7.1
34
9.0
36
9.5
43-45
0--
3.8
41.1
51.3
71.9
82.1.
82.1.
11
2.9
14
3.7
15
4.0
TOTAL
379
379
379
379
379
.379
379
379
379
379
MEAN
19.22
21.52
22.07
22.73
24.30
24.99
25.42
27.65
29.91
30.63
S.D.
7.94
9.20
9.45
9.57
9.90
-9.90
9.87
9.56
8.69
8.46
SPRING NORMS
6/15/71
81

Table 78
Statistical Characteristics of ITED* Scores of Grade 10 Pupils for Two Consecutive Years
1-a
."1
q)
Mean
October,
Reading
Percentile
Rank**
1969
Mathematics
Percentile
Rank
November,
Reading
Percentile
Rank
1970
Mathematics
Percentile
Rank
56
47
5o
46
Median
43
40
43
39
23
20
18
26
69
64
66
64
s7.03
5.21
7.13
4.94
n636
636
557
557
ITED = Iowa Tests of Educational Development (Form Y4).
* Mid-percentile interval score.

410
Table 79
Statistical Characteristics ofIND* Scores of Grade 12 Pupils for Two Consecutive Years
I-4
cr. 0
Mean
October,
Reading
Percentile
Rank**
1969
Mathematics
Percentile
Rank
November,
Reading
Percentile
Rank
1970
Mathematics
Percentile
Rank
50
50
48
48
Median
46
48
44
46
411
24
20
.24
18
e3
68
70
68
7o
89.96
6.65
9.54.
.6.90
n641
641
504
5o4
ITED = Iowa Tests of Educational Development
(Form Y4).
" Mid-percentile interval score.
'410
.44:
.1:

Grade six; Available test scores presented in Tables 70, 71, and72 inuicate impressive growth comparable to national norm expecta-tions from 10/70 to 5/71 in reading, language and arithmetic achieve-ment. Coefficient of skewness'indices show variable shifts withindistributions, but such shifts were of minimal extent.
Grade eight; Tables 73, 74, 75, 76, and 77 indicate that pupilsdid not improve their reading and mathematics achievement to a de-gree that would approximate one-half the difference between thecurrent profile and the test profile of the district. In depthanalysis further shows that greater instruction gain occurred withhigh achievers compared to low achievers in reading comprehensionand arithmetic computation.
Grade ten; Table 78 indicates that the lower 25 percent of thepupils improved their relative norm positions in mathematics butdeclined in reading achievement from 1969 to 1970.
Grade twelve; Table 79 indic-tes that the lower 25 percent of thepupils remained approximately stable in their relative norm positionsin reading and mathematics from 1969 to 1970:
As a general concluding statement, it may be stated that the long-
itudinal survey of achievement considered above indicates that pupils
are achieving close to national norms in reading and mathematics competency
areas at grades one, six, ten and twelve. At grades three and four where
a measure of achievement growth gains from 1969-70 to 1970-71 was available,
analysis further indicated that 1970-71 gains equalled or exceeded 1969-70
gains at grade three in word meaning and grade four in word meaning,
arithmetic computation, and arithmetic concepts.
A decline in achievement gains were found at grade three in paragraph
meaning. 'ithmetic computation and arithmetic concepts. Unfortunately,
because of the varied ESEA testing schedule Established by the San Diego
City Schools, a complete analysis of achievement growth gains could not
be made at the other grade levels. Considering objective seven, it
may be concluded from the above discussion that only part (c) was achieved.
,161

CHAPTER IV
CONCLUSIONS AND RECOMMENDATIONS
Conclusions
It may be appropriate at this time to briefly define priorities. As
originally written, the first year Inner City Program was planned to:
(1) involve parents, community, and school personnel,
(2) provide pre-kindergarten services,
(3) provide para-professional and certificated personnel,
(4) provide ESL/Bilingual instruction,
(5) provide supplemental counseling services,
(6) provide curricular materials and in-service education,
(7) to evaluate first year activities.
The emphasis, then, during the firs'v year was parent-school-:community
involvement and the planninglas well as4the providing of services defined
desirable for the inner city child.
Goals for the second year of Innei City Project activity included:
(1) securing a high level of school-parent-community involvement and
(2) providing essentially the same services defined during the firstyear.
Thus, the emphasis of 1969-70 implementation and program administration
relied heavily upon first year formative planning. It is apparent that
the Inner City Project staff, by the end of the second funding year, had
committed their energies and funds to the basic goals of increasing
parent-school-community rapp'rt and supplementing district services in
educational areas found deficient for adequate Inner City pupil in-
struction and guidance.
It is quite impossible to separate these two functions. Legal and1
social definitions charge the public schools with the responsibility
162

of assisting parents and legal guardians in educating their youth in a
socially-acceptable manner. Problems arising from this distinct role
within a diverse social context are, to be sure, complex. But the fact,
remains that parents (through a public educational agency) by definition,
have the responsibility of properly educating their children for the
future. To carry out this function requires both adequate parent aware-
ness and maximum parent-school-community cooperation.
The three year Inner City Project undoubtedly achieved the objective
of sustaining high parent-school-community cooperation. PAC members and
school personnel have complemented each other's roles as they have pro-
vided supplemental services to Inner City children. They appeared to
work closer together at the elementary, as opposed to the secondary,
level. But overall it may be concluded that dissatisfaction and mis-
information between parent, teacher and community representatives were at )
a low level by the end of the 1970-71 school year.
Their.efforts seem to have made overt, positive changes in parent
involvement, English acquisition by pupils whose native language was
Spanish, unexcused absence rates at the elementary leveljand te...cher
empathy toward their pupils.
In other areas, notably secondary unexcused absences, health absences
at both levels, and reading and mathematics achievement (with the excep-
tions cited in Chapter III) criterion levels fell short of expedtations.
Thus, evidence from this report indicates that strong "social
contact" has been established between the neighborhood schools and the
community of Southeast San Diego through efforts of the Inner City Program,
An audit of services budgeted and delivered further indicates that such
services were sueplied to the satisfaction of parents, school personnel,
PAC, and PAB members. However, as much in evidence is the fact that,
163

where PAC activities were the strongest (eleme .c achievement
levels and health absence rates here contrary .aatired expectations.
The three-year Inner City Project has brought th, schools and the
community closer together. But as of thie date. it ,t produced im-
provement in the two defined variables discussed abou, )verall, there
appears to have been established a cohesive concern for the education of
children from the Southeast San Diego area. Such concern has already
produced positive results in the areas cited above. It has not decreased
health absence rates appreciably nor has it improved academic skills
acquisition, as measured by-thF'gtandardized test results, to the level
desired.
Recommendations
Much of the recommendations by parents and school perswInel for im-
plementation of a project similar to the Inner City Program have already
been given. Additional recommendations, relating to the overall evaluation
effort and findings included in tl7is report, are divided into two parts.
The first recommendations are for decision-making efforts within the San
Diego City Schools. The seconVset are for the benefit of other school
districts who are contemplating the development of formal parent parti-
cipation bodies similar to the ones described in this report.
San Diego City Schools
(1) The PAC organization within each school as it existed at thetermination of the Title III program should be continued. Parents
have expressed increased satisfaction with their efforts through-
out the school year. Many indicated they would serve on PAC's
without the $10 monthly allowances (see Table 19). Parent repre-
sentatives also expressed satisfaction in working with individual
principals and teachers. They were most enthusiastic when
planning programs and-events. Most parents agreed that teachers
should determine their own needs and priorities, with parents
assisting where they could.
(2) The paraprofessional staff assignments should be continued in
the schools. The February, 1971 Mid-Year Inner City Evaluationfound that paraprofessional aides in the classroom was thehighest rated program component of the third year Inner City
164

Program. Teachers and parents cited many instances where pupilswere provided with more care than would have been possible
without teacher assistants, parent aides and other communityhelp.
(5) If it is desired that PAC's participate in funds allocation,the ri4 should be one person, hired full-time, to oversee all. peeitures and act as r liaison between the 1-AC's and EducationCentk nersonnel.
Cbnseling services at Memorial should be reviewed, with closerattention to attendance problems during the articulation yearbetween the 6th and 7th grad-s being made prior to the firstsemeste:' ov the 1971-72 school year.
(5) Inner city PAC, FAB and Project Staff Members should be brourtttogether at once during the 1971 -72- school year to discusswith and n'Ivise new PAC and staff members in other. schools.
These in.3ividuals spent a lot of time planning and refinin animpressive community effort. Their expertise should not belost simly because of reassignments or the fact that theirchildren are no longer in schbol.
(6) Additional .!.;SL funds should be sought to purchase instructionalsupplies. In reviewing the present ESL Curriculum in mostschools it was apparent that, where H-200 lessons were beingused, H-200 materials were absent. Teachers had to make mostof their instructional supplies. This decreased the amount oftime they had available for their pupils.
Other School Districts
(1) PA:gin pzeliminary planning of how your parent advisory croupwill be chosen and how they will function at least one schoolyear prior to implementation. Sucl planning should include arepresentative teacher from each school, all principals andspecific auxiliary personnel (e.g., a representative fromBudget Plannilv and Control, one from interested communityacacias, a few from parent groups and other school operationadministrators),
(2) Define and approve all final responsibility and authority def-initions concerning the parent groups with the supplementalapproval of respective teacher's organizations, administrativecouncils and, of course, the board of education.
(7,) Jurin- ne Planning stage, contact other school districts whonave hnd similar parent group representation. The socirl climateof Southeast Diego may or may not correspond wit}; othercities. l'ivlish-as-a-Second..Language instruction is a deep
165
tj
concern in Southern California. Accordingly, parent groups :Irestrongly opinionated over this issue. Other cities may havedifferent pupils needs.
If needs nre ensily identified they can act as strong motivatingforces in securinr community action. Other school districtscan give I/AA:11)1e advice on how to capitalize-on such needsand, nt the same time, how to avoid over-reactions within thecommunity.
('-) Publicin.e your efforts. Hire on,, full-time to
snturnte the immediate community and surrounding -irens withnnnouncements of future events and examples of pupil progress.
(7) It ha 3 been noted in San Diego that parents will not be responsible
in attendim- meetings, meeting with. teachers and working in theclassrool.. unless their roles are clearly defined and they have
a firm understandinr of responsibilities. The adage: "Delegateauthority commensurate with responsibility" has been found tobe advantageous in workin with both parents and professionalcolleagues.
(6) Parent-school-community interaction should be of mutual value.If internal PAC discussion over details inhibits decision-makingat regular meetings, or if the school principal is constantlycalled upon by PAC members or community groups to arbitratediscussions between faculty and parents, it is time to reevaluatepriorities and redefine roles.
A mid-year review of objectives, followed by an open house orfaculty tea may prove useful to alleviate tension. In SanDiego there was a mid-year evaluation, followed by an openhouse, individual parent-faculty meetings at individual schools,and appreciation parties for principals and staff memberssponsored by PAC's. Whatever the vehicle of expression, scheduleit officially into your calendar of events. It is a necessary,but not sufficient, part of any parent-school-community inter-action effort.
166
Inner City ProjectTitle III)
APPENDIX A
Summary of.Special Programs, Services, Personnel, Materialsand Eouipment in Inner City Project Schools During
1968-1969 and 1969-1970 School Years

SAN
DIE
GO
CIT
Y S
CH
OO
LS
INN
ER
CIT
Y P
RO
JEC
T
SUM
AR
Y O
F SP
EC
IAL
PR
OG
RA
MS,
SE
RV
ICE
S, P
ER
SON
NE
L,
MA
TE
RIA
L A
ND
EQ
UIP
ME
NT
IN I
NN
ER
CIT
Y P
RO
JEC
T S
CH
OO
LS
1968
-69
and
1969
-70

tom
1111111111
IlsIN
ino*
Number!
Program
Burbank
Crockett
4
LoganLowell
Sherman'Ner!orial
San Diego
Funding Source
8'Clerica3 Help (Additional time
k
xx
xx
ESEA Title
Inner City Project
9'Computer Program--Math Glasses
Inner City Project
lommunications
Xx
xx
Inner City Project
;Dental Program
xx
Inner City Project
;District Counselor
i(Additional time)
xInner City Project
1-0
ON
Educable Mentally Retarded --
`o
Decertification Program
xDistrict
11'
:Educable Mentally Retarded
Classes--Redeployment into
Regular Classrooms
xNo additional funds
Education Professions Development
Act (EPDA)--Inservice Training
Program
xEducation Professions
Development Act
16
.Educationally Handicapped Classes
for Children Previously Identi-
,Pied as Educable Mentally
Retarded (Experiniental)
xNo additional funds
N11
03;S
b

II
1
Number
Program
IBurbank CrockettLoganA4welliSherman Merlorial
1
17
Elemenxary Counselor
!i
Ix
; 1
!
I
T--
!18
.Ehglish As a Second Language
xx
19
English As a Second Language--
Redeployment Kindergarten
20
English As a Second Language--
Traveling Teachers
xx
-4-
San Diego
Funding Source
Inner City Project
District
xx
ESEA Title I
Inner City Project
Inner City Project
District
21
022
Ethnic Studies Conference
(October 2-5)
xForeign Policy Association
Ethno-Cultural Events and
Activities
23
Equipment
21
Field Trips
5Follow-Through Program
xx
xx
xx
xx
xx
xx
x
xx
xInner City Project
American Federation of
Musicians
xx
xDistrict
Reading Demonstration Project
Inner City Project
xx
xDistrict
Reading Demonstration Project
Inner City Project

Number
-)rogram
26
Human Relations Workshop
27
Instructional Concepts Program
28
Instructional Supplies and
Curriculum Materials
29
age Power Program
30
Lunch Program--Free
31
Lunch Program--Reduced Cost
32
Miller Math Program
.33
Minority Study Program--Blacl;
and Chicano Studies
34
Monthly Exchange Visits- -
Burbank And De Anza Schools
35
Motivational Counselor
Ars
ollM
G
T 1
Burbank,Crockett
--
Logan
LowellShermanorial
San Diego
Funding Source
xx
xx
; ;
xx
Inner City Project
xx
-F
xFree for Inner City Schools
xx
xx
xx
DiL
-ot
Reading Demonstration Project
Inner City Project
District
ESEA Title I
Inner City Project
SB -28
AB-1331
xx
xx
XInner City Project
xx
xx
XDepartment of Agriculture
xMath Specialist Program
Department of Education
Inner City Project
xx
District
Inner City Project
x--
-Inner City Project
xx
ESEA Title I
Inner City Project

'Aumber
?rogram
BurbankCrockett
Logan
Lci,ell
Sherman
'f.e..criallan
Diet()
Funding Source
3b
OranL'e Juice Procram
*x
Inner City Project
37
Orientation for New Teachers
(L'ept. 3 -!, 1969)
xx
xx
xx
xInner City Project
38
Parent Advisory Councils
xx
xx
xx
xInner City Project
39
Parent Counselors
(Community Counselors)
xx
ESEA Title I
Inner City Project
0
1.4
Parent Counseling
xx
'
Reading Demo. Project
Inner City Project
-...,3
tv
14L
Participation in Sixth Grade
Camp Pr:gram
xInner City Project
Performing Artists
xx
xx
xx
xESEA Title I
Inner City Project
Local 325 American Federatior
of Musicians
43
Pre-Kindergarten Programs
(AB 1331)
xx
xx
AB 1331
ilh
Pre-Kindergarten Programs
(Inner City Project)
xx
Inner City Project
..

t!
.....
Nunoe r
L45
i46
148
149
50 51 52 53 514
55
Progian
iurDan.:
':rockett
LcganLcll ShemaL .-crial San Diego
Funding Source
Programmed Heading Materials
xListrict
Inner City Project
Project Advisory Board
(Inner City Project)
xx
x-
x
xInnar City Project
Psychologist (Additional Time)
Inner City Project
Reading Center (ESEA Title I)
EEA Title I
Reading Demonstration Pr
Reading Demonstration Projec
Redeployment Reading Program
No additional funds
Reduction in Tracking
s.
Inner City Project
Reteaching of Reading
xDistrict
ESEA Title I
Inner City Project
Sewing Class
Inner City Project
Spanish Instruction for Teachers
Xx
x
xDistrict
Inner City Project
Inner City Project
Speech Therapist (Additional Time

Number
Program
Burbank
Crockett
LoganLovell
1
Sherman `MemorialSan Diego
Funding Source
56
Swimming
Programs-Instructional
and Recreational
.
xx
DistriA
Inner CityProject
Si
Teacher Assistants
xx
xDistrict
.ESFA Title I
reading DemonstrationProject
Inner CityProject
58
Teacher-InternProgram
x-
No additional
funds
59
Track Team
xInner CityProject
1-
-.3
4:- 60
Trailer Re Lai
x.
Inner CityProject
61
Training Programfor Instructional
and CommunityAides
xx
xx
Inner City
Project
62
Tutoring Programs
xx
xx
No additionalfunds
63
Vocational Education
Pacific
Telephone Career
OrientationProgram
xDistrict
Vocational
Education Act
6t
Work-Study Program
xx
Inner City
Project
:
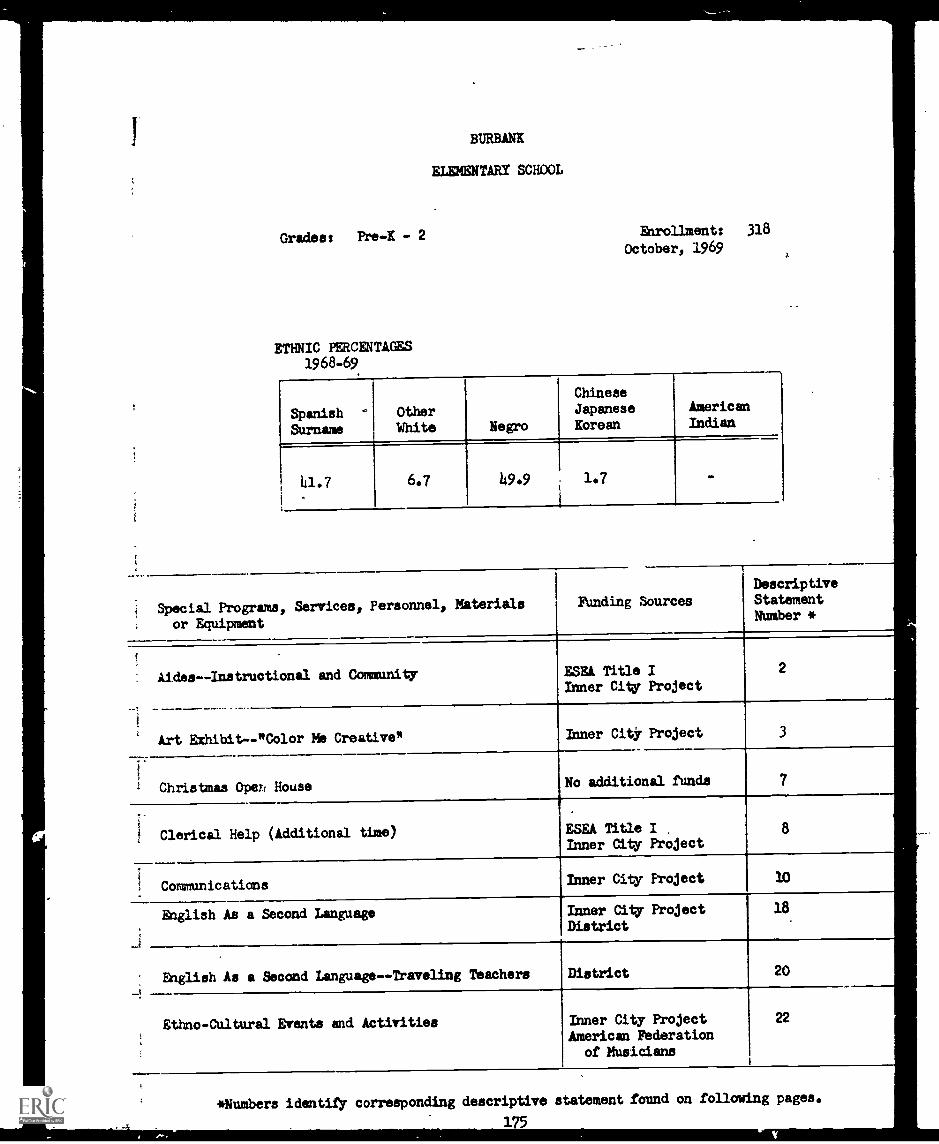
BURBANK
ELEMENTARY SCHOOL
Grades: Pre -K - 2
ETHNIC PERCENTAGES1968-69
Enrollment: 318
October, 1969
Spanish °
Surname
OtherWhite Negro
Chinese
JapaneseKorean
AmericanIndian
41.7 6.7 49.9 1.7 -
Special Programs, Services, Personnel, Materials FUnding Sources
or Equipment
DescriptiveStatementNumber
Aides--Instructional and Community ESEA Title IInner City Project
2
Art Exhibit -- "Color Me Creative* Inner City Project 3
Christmas °pep House No additional funds 7
Clerical Help (Additional time) ESEA Title I .
Inner City Project8
CoramunicationsInner City Project 10
English As a Second Language Inner City ProjectDistrict
18
English As a Second Language -- Traveling Teachers District 20
Ethno-Cultural Brenta and Activities Inner City ProjectAmerican Federation
of Musicians
22
*Numbers identify corresponding descriptive statement found on following pages.
175

BURBANK, Page 2
Special Programs, Services, Peroonnel, Materialsor Equipment
Ftnding SourcesDescriptiveStatemer,Number
Equipment DistrictReading Demonstration
ProjectInner City Project
23
Field Trips DistrictReading Demonstration
ProjectInner City Project
24
I26Human Relations Workshop Inner City Project
Instructional ConceptsConcepts program Free for InnerCity Schools
27
11
Instructional Supplies and Curriculum Materials DistrictReading Demonstration
ProjectInner City Project
28
Language Power Prorzram DistrictESEA Title IInner City ProjectSB.28AB-1331
29
11
II
Lunch Program -Free Inner City Project
Department ofAgriculture
30
II
31Lunch P'-'gram -- Reduced Cost
Monthly Exchange Visits--Burbank & De Anza Schools Inner City Project
Orientation for New Teachers(September 3-4, 1969)
Inner City Project 37
Parent Advisory Councils Inner City Project 38
Performing Artists
.
.
ESEA Title IInner city ProjectAmerican Federation of
&laicize=
42
176

BURBANK, Page 3
Special Programs, Services, Personnel, Materialsor Equipment
Funding Sources
Pre-Kindergarten Programs(AB-1331)
DescriptiveStatementifteber
AB-1331 43
Project Advisory BoardI(Inner City Project)
Reteaching of Reading
Inner City Project 1 46
DistrictESEA Title IInner City Project
52
ISpanish Instruction for Teachers
Teacher Assistants
Trailer Rental
1
1
I
District 54Inner City Projc,'.
DistrictESEA Title I
Reading DemonstrationProject
Inner City Project
57
177
)rner City Project 60

Grades: Pre - 2
ETHNIC PERCENTAGES1968-69
SpanishSurname
23.0
OtherWhite
CROCEE1T
ILININTART SCHOOL
Enrollments 390October, 1969
Negro
ChineseJapanese AmericanNorman Indian
1.2 72.1 3.7 GS
Special Programs, Service°, Personnel, Materialsor Equipment
AidesInstructional and Community
Art Utibit--"Color Me Creative'
Christmas Open House
Clerical Help (Additional time)
Communications
English As a Second Language
Funding Sources
ESEA Title IInner City Project
Inner City Project
No additional fUnds
ESEA Title IInner City Project
Inner City Project
ESEA Title IInner City Project
DescriptiveStatementNumber *
2
3
7
8
10
18
*Numbers identify corresponding descriptive statement found on following pages.
178

CROCIETT, 'page 2
,..,,,iL.---,,-.._--
. .
Pr rams, Services, Personnels-Materialsor Equint
_ _
Funding SourcesDesorigiVeStatement-Niiiii,*.:-
--iiii--=AO_:-* aecendtLenguage--Tratelisig teachers District 20
:i.±.
__3,,,,,
tf--
---,..
--' 6--, -*Oral ifrienta and Activities-- " - '
Inner City ProjectAmerican Federation of
. Musicians
22
District .
Reading -DekonstratienProject
Inner City Project
23
_.,
,-e.:1 _ if* .,,..._.__
District-iiiiii4g:_ipiriitEtititi'litied_
TrojeCt;_Inner City 'iiiiiijeat
-4
--.
.
iiW4Tkireugh Progran-
.
25..
z-_
i-i_:'
,
' litions--Workahop.
Inner City -Project 26ti---,_ --
',- fiCtienal Concepts Program_ -..__..__ Free for,- Inner
City Schools27
.
.
t:_,
.
instructional and Curriculum Materials_ --r --7 -, ------
_
District- ._
Reading DeronatrationProject .
Inner City Project
28.
_
--.- 01.-free--Fre e Inner City Project 30
IH
:t,_ -_ -___ .__ .--___,_ProgramReduced Cost Department.of
Agriculture31
.
[
-ieniatidh for New Teadhers-iptekber 3-14, 1969)
Inner City Project 37
---tfOisory Colt:wile . Inner City Project 38...._._
7 _kg* Artists
--:,
ESEA Title IInner City Project
American FederationOf _Mnsitiiits
42
179

Amding,Sontceo,
Inner City Project
Project Ad:40y Board(Matti City: rojeCt)
Reteaching of aeaciim
Inner City Project
-S0eniah Inetkat Oh fot -feat-Oho-I*

Grades: 3 - 6
ETHNIC PERCENTAGES1968-69
LOGAN
IIEMENTA47 SCHOOL
Enrollment: 741
October, 1969
Spaish1Wrnamd
Othet_ -White Negro
ChineseJapaneseKorean-
AmericanIndian
3802 0.9 -59.6
.
1.3 -
Spetii4 Programs, Setvices, Petsonnell Materials I Funding Sources
atjoiidipment
DescriptiveState-MatNutsber-*
AideS=Insttuttional and Community ESEA Title IInner City Ptoject
2
Art Ekhibit--"Color Me CreatiVe" Inner City Project 3
araet MotivatiOnirips to North Island
Christmas Open House
Inner City Project 6
No additional funds 7
Clerical Help (Additional time) ESEA Title IInner City Project
8
-!Communications Inner City Project 10
*NdAbers identity corresponding descriptive statement found on following pages.
181

LOGAN, Page 2
Special Programs, Services, Personnel, Materialsor Equipment
Funding SourcesDescriptiveStatementNumber
Dental Program Inner City Project 10
,.:.,
Educable Mentally RetardedDecertificationProgram
District 13
English As a Second Language ESKA Title IInner City Project
18i
English Aa a Second Language -- Traveling Teadhers District 20
Ethno-Cultural Everts and Activities Inner City ProjectAmerican Federationof Musicians
22
1
-
Equipment DistrictReading Demonstration
ProjectInner City Project
23
Field Trips DistrictReading Demonstration
ProjectInner City Project
24
_ .-
Human Relations Workshop Inner City Project 26
Instructional Supplies and Curriculum Materials DistrictReading Demonstration
ProjectInner City Project
28
Lunch Program - Free . Inner City Project 30
Lunch Program--Reduced Cost Department of Agriculture 31
I,
Miller Math Program Math Specialist ProgramDepartment of EducationInner City Project'
1
32
Orange Juice Program Inner City Project 36 I

.
Special Programa, Services, Personnel, Materials
or Equipment
Funding SourcesDescriptiveStatementNumber
Orientation for New Teachers ,
(September 3-, 1969)
Inner City Project 37
Parent Advisory Councils Inner City Project 38
Parent Counselors (Community Counselors) ESEA Title IInner City Project
39
Parent Counseling Reading DemonstrationProject
Inner City Project
40
Performing Artists ESEA Title IInner City ProjectAmerican Federation of
Musicians
142
Pre-indergarten Programs (AB-1331) AB-1331 43
Programmed Reading Materials DistrictInner City Project
45
Project Advisory Board (Inner City Project) Inner City Project 46
Psychologist (Additional time) Inner City Project 47
Redeployment Reading Program No additional !kinds 50
Reteaching of Reading DistrictESEA Title IInner City Project
52
Spanish Instruction for Teachers DistrictInner City Project
54
Teacher Assistants DistrictESEA Title IReading Demonstration
ProjectInner City Project
57

Special Programs, Services, Personnel, Materialsor Equipment
Track Team
Training Program for Instructional andCommunity Aides
-1-Logan, Page 4
Aniding SourcesDescriptiveStatementNumber
Inner City Project 59
Inner City Project 61
Tutoring Programs No additional funds 62
184

WWELL
ELEMENTARY SCHOOL
Grades: Pre-K - 6 Enrollment: 460
October, 1969
ETHNIC PERCENTAGES1968-69
Spanish Other
Surname White Negro
ChineseJapaneseKorean
AmericanIndian
80.8 6.2 8.7 141 3.2
Special Programs, Services, Personnel, Materials
or Equipment
Funding Sources
DescriptiveStatementNumber *
AidesInstructional and Community DistrictInner City Project
2
Art Exhibit--"Color Me Creative" Inner City Project 3
Career Motivation - -Trips to North Island Inner City Project 6
Christmas Open House No additional funds 7
Clerical Help (Additional time) ESEA Title IInner City Project
8
CommunicationsInner City Project 10
Educable Mantall Retarded --Decertification ProgramDistrict 13
*Numbers identify corresponding descriptive statement found on following pages.
185

LOWELL, Page 2
Special Programs, Services, Personnel, Materialsor Equipment
Funding SourcesDescriptiveStatementNumbers
Educationally Handicapped Classes for ChildrenPreviously Identified as Educable MentallyRetarded (Experimental)
No additional funds 16
English La a Second Language ESEA Title IInner C:t.ty Project
18
Ethno-Cultural Events and Activities Inner City ProjectAmerican Federation
of Musicians
22
Equipment DistrictReading DemoL,uration
ProjectInner City Project
23
Field Trips DistrictReading Demonstration
ProjectInner City Project
24
Human Relations Workshop Inner City Project 261
instructional Concepts Program Free for Inner CitySchools
27
Instructional Supplies and Curriculum Materials DistrictReading Demonstration
ProjectInner City Project
28
Lunch Program--Free Inner City Project 30
Lunch Program--Reduced Cost Department ofAgriculture
31
Orientation for New Teachers(September 3-4, 1969)
Inner City Project 37
Parent Advisory Councils Inner City Project 38
186
, . ...
.

LOWELL, Page 3
>pecial Programs, Services, Personnel, Materialsor Equipment
Funding SourcesDescriptiveStatementNumbers
Participation in Sixth -Grade Camp Program Inner City Project 41
Performing Artists ESEA Title IInner City ProjectAmerican Feaeratian
of Musicians
42.
Pre - Kindergarten Programs AB-13:-..
(AB-1331)
L3
Pre-Kindergarten Programs Inner City Project 44
Project Advisory Board inner City Project
(Inner City Project)
46
Redeployment Reading Program No additional funds 50
Reteaching of Reading DistrictESEA Title IInner City Project
52
Spanish Instruction for Teachers DistrictInner City Project
54
Teacher Intern Program No additional funds 58
Training Program for Instructional andCommunity Aides
Inner City Project 61
Tutor-in.7 Programs No additional funds 62

SHERMAN
ELEMENTARY SCHOOL
Grades: Pre-K - 6
ETHNIC PERCENTAGES1968 -69
Enrollment: 937October, 1969
SpanishSurname
OtherWhite Negro
ChineseJapaneseKorean
AmericanIndian
40.3 10.6 48.8 ., -
Special Programs, Services, Personnel, Materialsor Equipment
Funding SourcesDescriptiveStatementNumber *
AidesInstriction and Community ESEA Title I I 2
Inner City Project
Art Exhibit--"Color Me Creative" Inner City Project 3 1
Career Motivation- -Trips to North Island
Christmas Open House
Inner City Project I 6
Inner City Project J 7
Clerical Help (Additional time) ESEA Title IInner City Project
8
Communications Inner City Project 10
Educable Mentally Retarded -- Decertification Program District 13
Numbers identify corresponding descriptive statement found on following pages.
188

SHERMAN, Page 2
!Special Programs, Services, Personnel, Materialsor Equipment
Funding Sources
DescriptiveStatementNumbers
Educable Mentally Retarded Classes -- Redeployment
into Regular Classrooms,
Elementary Counselor
No additional funds 14
District 17
]
Inner City Project
English As a Second Language ESEk Title IInner City Project
18
English As a Second Language -- Redeployment
Kindergarten Inner City Project 19
Ethno-Cultural Events and Activities
Equipment
Inner City ProjectAmerican Federation
of Musicians
22
DistrictReading DemonstrationProje-t
Inner City Project
23
Field Tripe
Follow-Through Program
Human Relations Workshop
DistrictReading Demonstration
ProjectInner City Project
24
Instructional Concepts Program
Inner City Project
Free to Inner CitySchools
25
26
27
Instructional Supplies and Curriculum Materials DistrictReading Demonstration
ProjectInner City Project
28
Lunch Program- -Free 1Inner City Project 30
189

Special Programs, Services, Personnel, Materialsor Equipment
Lunch Program--Reduced Coat
Miller Math Program
_
Funding Sources
SHERMAN, Page 3
Deecrip tire
StatementNumbers
Department of Agriculture 31
Math Specialist ProgramDept. of EducationInner City Program
32
Orientation for New Teachers(September 3-14, 1969)
Inner City Project 37
Parent Advisory Councils Inner City Project 38
Performing Artiste, ESEA Title IInner City ProjectAmerican Federation ofMusicians
42
Programmed Reading Materials Districtloner City F'oject
145
Project Advisory Board(Inner City Project)
Inner City Project 146
Reading Center (ESEA Title I) ESEA Titiezi 48
Redeployment Reading Program o additional funds 50
Re teaching of Reading DistrictESEA Title IInner City Project
52
Spanish Instruction for Teachers WstrictInner City Project
514
&riming Programs -- Instructional and
Recreational
Teacher Aeaiatants
DistrictInner City Project
56
DistrictESEA Title IReading Demonstration
Project
Inner City Project
57
190

Special Programs, Services, Personnel, Materialsor Equipment
Tfttoring Program
Work -Stuct Program
193.
SHERMAN, Page 4
DescriptiveStatementNumbers

MEMORIAL
JUNIOR HIGH SCHOOL
Gradeat 7 - 9
ETHNIC PERCENTAGES1968-69
e
Enrollment: 1515October, 1969
SpanishSurname
OtherWhite Negro
ChineseJapaneseKorean
AmericanIndian
37.9 5.4 54.7 1.7 0.3
Special Programs, Services, Personnel, Materialsor Equipment
Funding SourcesDescriptiveStatementNumbers *
Aides, Instructional and Community ESEA Title IInner City Project
2
Art Exhibit--"Color Me Creative" Inner City Project 3
Bilingual Instruction in Academic Subjects Inner City Project 5
Career Motivation--Trips to North Island Inner City Project 6
Christmas Open House No additional funds
Communications Inner City Project
7
10
Dental Program lime/. City Project 11
*Numbers identify corresponding descrip
193
statement found on following pages.

MEMORIAL, Page 2
Special Programs, Services, Personnel, Materialsor Equipment
Funding SourcesDescriptiveStatementNumbers
District Counselor (Additional time) Inner City Project 12
English As a Second Language ESEL Title IInner City Project
Ethno-Cultural Brenta and Activities Inner City ProjectAmerican federation
of Musicians
18
22
Equipment District
Reading DemonstrationProject
Inner City Project
23
Field TripsDistrict
Reading DemonstrationProject
Inner City Project
2i
Human Relations Workshop Inner City Project 26
Instructional Supplies and Curriculum Materials District
Reading DemonstrationProject
Inner City Project
28
Minority Study Program--Black and ChicanoStudies
DistrictInner City Project
33
Motivational CounselorESEA Title IInner City Project
35
Orientation for New Teachers(September 3-4, 1969)
Parent Advisory Councils
Inner City Project
Inner City Project
37
38
Parent Counselors (Community Counselors) ESE/. Title I
Inner City Project39
194

MEMORIAL, Page 3
Special Programs, Services, Personnel, Materialsor Equipment
Funding SourcesDescriptiveStatementNumbers
Parent Counseling Reading DemonstrationProject
Inner City Project
40
Performing Artiste ESEA Title IInner City ProjectAmerican Federation of
Musicians
42
Project Advisory Board(Inner City Project)
Inner City Project 46
Psychologist (Additional time) Inner City Project 47
Reading Demonstration Project Reading DemonstrationProject
49
Spanish Instruction for Teachers DistrictInner City Project
&riming Programs -- Instructional and
Recreational
DistrictInner City Project
56
Teacher Assistants DistrictESEA Title IReading DemonstrationProject
Inner City Project
57
Ttitoring Programs No additional funds 62
Work-Study Program Inner City Project 64
195
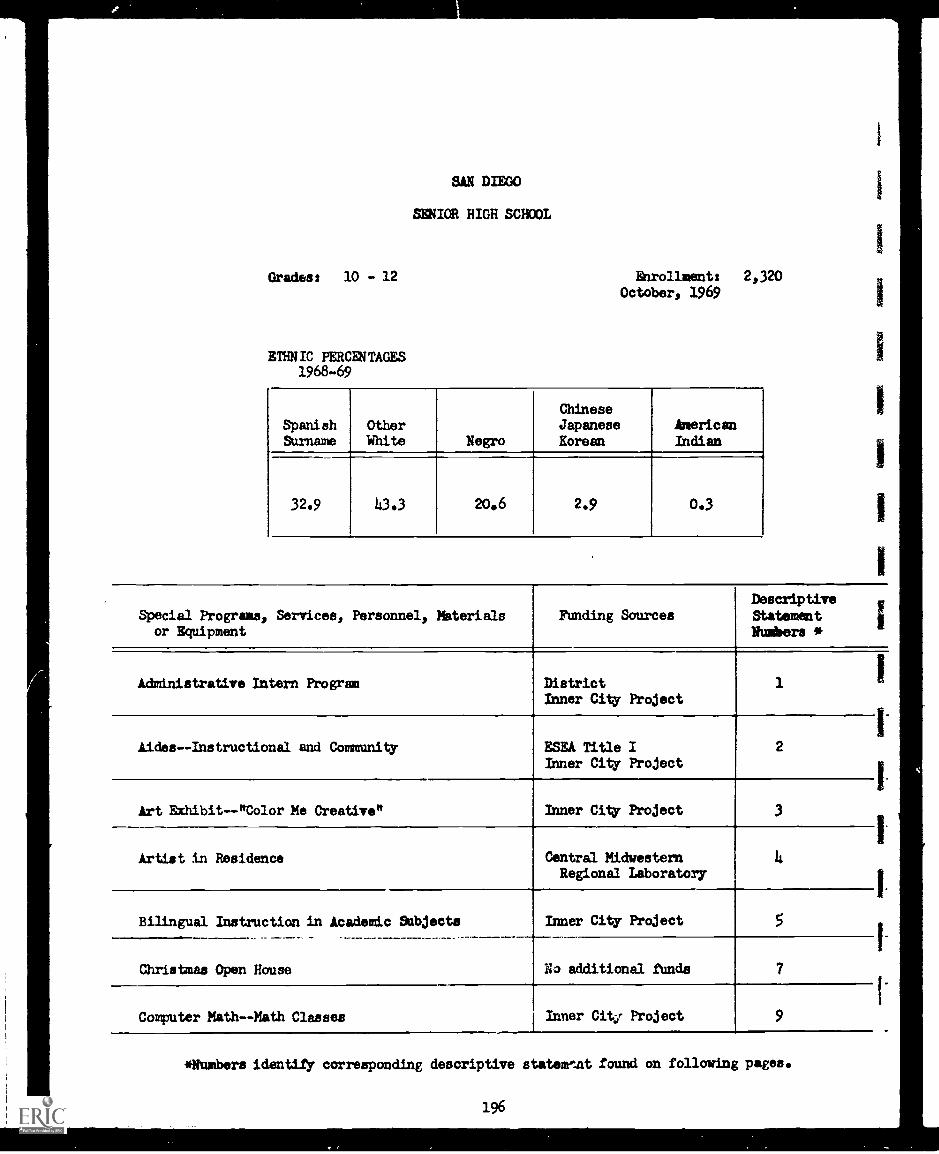
SAN DIEGO
SENIOR HIGH SCHOOL
Grades: 10 - 12
ETHNIC PERCENTAGES1968-69
Enrollment: 2,320October, 1969
SpanishSurname
OtherWhite Negro
ChineseJapaneseKorean
AmericanIndian
32.9 13.3 20.6 2.9 0.3
Special Programs, Services, Personnel, Materialsor Equipment
Funding SourcesDescriptiveStatementNumbers *
Administrative Intern Program DistrictInner City Project
1
Aides--Instructional and Community ESEA Title IInner City Project
2
Art EXhibit--"Color Me Creative" Inner City Project 3
Artist in Residence Central MidwesternRegional Laboratory
14
Bilingual Instruction in Academic Subjects
Christmas Open House
Inner City Project 5
Na additional funds 7
Computer Math--Math Classes Inner Cit.' Project 9
*Numbers identify corresponding descriptive statemtat found on following pages.
196

SAN DIEGO, Page 2
Special Programs, Services, Personnel, Materials
or Equipment
Phnding Sources
DescriptiveStatementNumbers
Communications Inner City Project 10
Dental Program Inner City Project 11
Education Professions Development Act (EPDA)-- ,
Inservice Training Program
Education ProfessionsDevelopment Act
15
English As a Second Language ESEA Title IInner City Project
18
Ethnic Studies Conference(October 2-51 1969)
Foreign PolicyAssociation
21
Etbno- Cultural Events and Activities Inner City ProjectAmerican Federation of
Musicians
22
Equipment DistrictReading Demonstration
ProjectInner City Project
23
,
Field Trips DistrictReading Demonstration
ProjectInner City Project
24
Human Relations Workshop Inner City Project 26
Instructional Stpplies and Curriculum Materials DistrictReading Demonstration
ProjectInner City Project
28
Minority Study Program. -Black and Chicano
Studies
DistrictInner City Project
33
Motivational Counselor ESEA Title IInner City Project
35
Orientation for New Teachers(September 3-4, 1969)
Inner City Project 37

SAN DIEGO, Page 3
Special Program., Services, Personnel, Materials
or 'equipment
Funding Sources
DescriptiveStatementNumbers
Parent Advisory CouncilsInner City Project 38
Performing ArtistsESEA Title IInner City ProjectAmerican Federation
of Musicians
42
J
Project Advisory Board(Inner City Project)
Inner City Project 46
Reduction in TrackingInner City Project 51
Spanish Instruction for Teachers DistrictInner City Project
54
Swimming Programs --Instructional and
Recreational
DistrictInner City Project
56
Teacher AssistantsDistrictESEA Title IReading Demonstration
ProjectInner City Project
57 1
Vocational Education --Pacific Telephone Career
Orientation Program
DistrictVocational EducationAct
63I
j
Work-Study ProgramInner City Project 64
198
I
I
Appendix B
Descriptive Summar:- of Elementary ESL Evaluation. InstrumentsCirculars and qes'ionnaire Results.
199
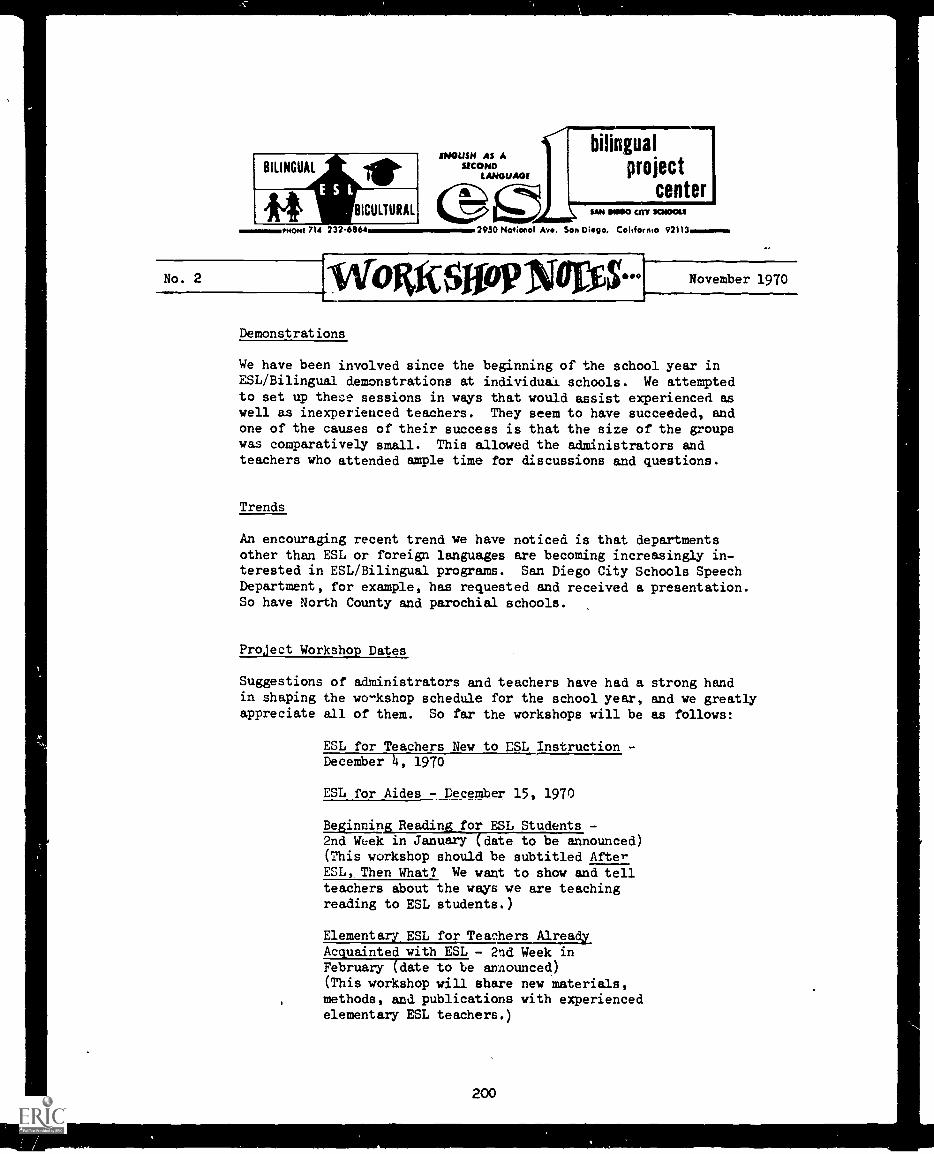
BILINGUAL
BICULTURAL
MONS 714 232 6864
ENGLISH AS ASECOND
LANGUAGE
bilingualproject
centerSAN MOO OTT SC 40014
2930 National Ave. Son Diego, California 92113
Wolift$116PNANXDemonstrations
November 1970
We have been involved since the beginning of the school year inESL/Bilingual demonstrations at individual schools. We attemptedto set up these sessions in ways that would assist experienced aswell as inexperienced teachers. They seem to have succeeded, andone of the causes of their success is that the size of the groupswas comparatively small. This allowed the administrators andteachers who attended ample time for discussions and questions.
Trends
An encouraging recent trend we have noticed is that departmentsother than ESL or foreign languages are becoming increasingly in-terested in ESL/Bilingual programs. San Diego City Schools SpeechDepartment, for example, has requested and received a presentation.So have North County and parochial schools.
Project Workshop Dates
Suggestions of administrators and teachers have had a strong handin shaping the wo-kshop schedule for the school year, and we greatlyappreciate all of them. So far the workshops will be as follows:
ESL for Teachers New to ESL Instruction -December 4, 1970
ESL for Aides - December 15, 1970
Beginning Reading for ESL Students -2nd Week in January (date to be announced)(This workshop should be subtitled AfterESL Then What? We want to show and tellteachers about the ways we are teachingreading to ESL students.)
Elementary ESL for Teachers AlreadyAcquainted with ESL - 2nd Week inFebruary (date to be announced)(This workshop will share new materials,methods, and publications with experiencedelementary ESL teachers.)
200

WORKSHOP NOTES (Cont.)
Advanced Reading for ESL Students - 2.d Weekin March (date to be announced)
Secondary ESL for Teachers Already Acquaintedwith ESL - 2nd Week in April (date to be announced)This workshop will share new materials, methods,
and publications with experienced secondary ESLteachers.)
Please save space on your schedule for the workshops that pertainto you. We will keep you posted in Workshop Notes on dates to beannounced.
Other ESL Bilingual Meetings
ACTFL - November 26-29, 1970, Los Angeles (Bilingual section to beheld)
AATSP - December 28-30, 1970, San Francisco (Bilingual section tobe held)
TESOL - March 3-6, 1971, New Orleans (ESL/Bilingual Education Asso-ciation)
ESL/Bilingual AssociationHoliday 'Festival - December 5, 1970Swap Shop - January 30, 1971ESL Birthday Party- March 5, 1971Teacher Exchange - April 24, 1971Spring Dinner Meeting - May 21, 1971
Can we help you with materials? Ccmunity involvement? Testing?
Establishing an ESL program in your school? Cultural awareness?
Come in or call 232-6864, Monday through Friday from 8:00 'o 5:00.
W'rkshop Coordinator - Mary T. Crawford
201
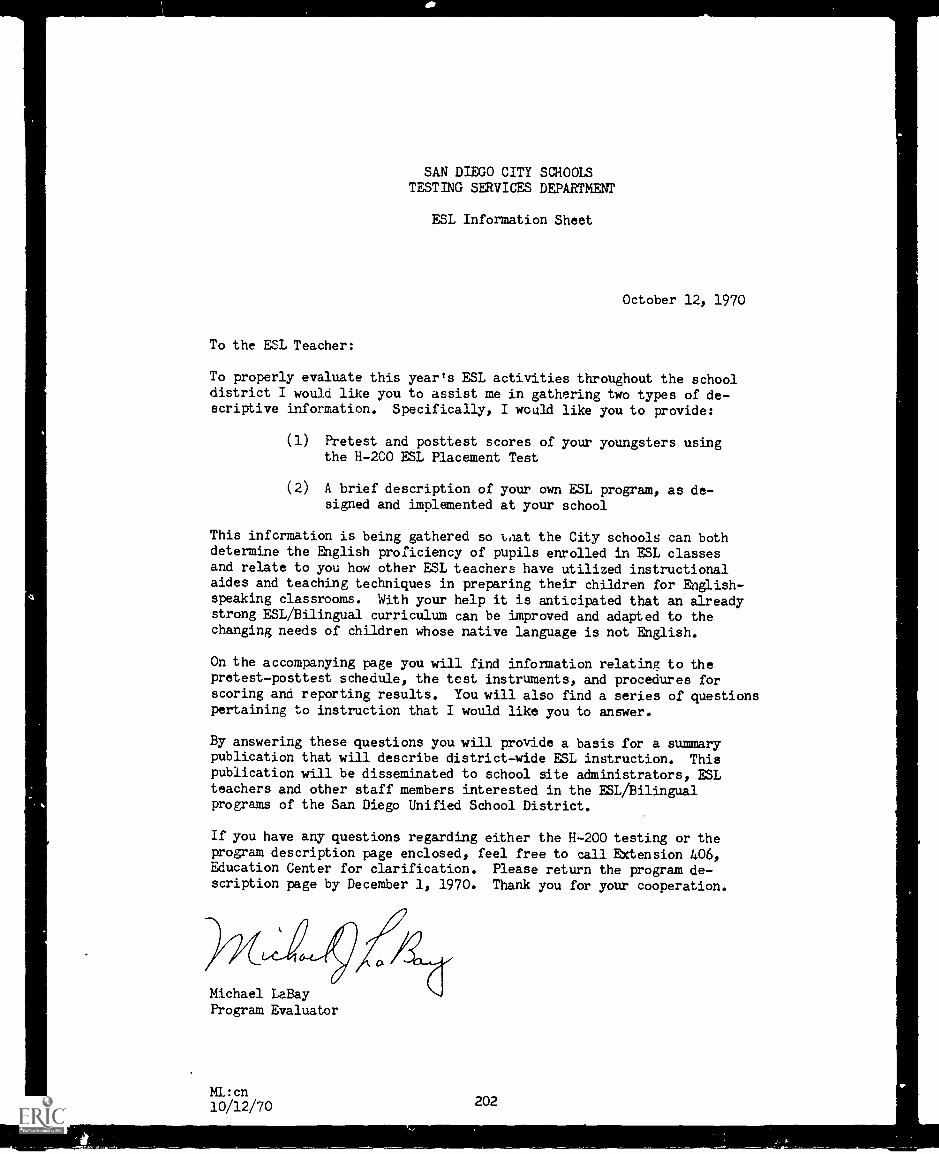
SAN DIEGO CITY SCHOOLSTESTING SERVICES DEPARTMENT
ESL Information Sheet
To the ESL Teacher:
October 12, 1970
To properly evaluate this year's ESL activities throughout the schooldistrict I would like you to assist me in gathering two types of de-scriptive information. Specifically, I would like you to provide:
(1) Pretest and posttest scores of your youngsters usingthe H-200 ESL Placement Test
(2) A brief description of your own ESL program, as de-signed and implemented at your school
This information is being gathered so LAat the City schools can bothdetermine the English proficiency of pupils enrolled in ESL classesand relate to you how other ESL teachers have utilized instructionalaides and teaching techniques in preparing their children for English-speaking classrooms. With your help it is anticipated that an alreadystrong ESL/Bilingual curriculum can be improved and adapted to thechanging needs of children whose native language is not English.
On the accompanying page you will find information relating to thepretest-posttest schedule, the test instruments, and procedures forscoring and reporting results. You will also find a series of questionspertaining to instruction that I would like you to answer.
By answering these questions you will provide a basis for a summarypublication that will describe district-wide ESL instruction. Thispublication will be disseminated to school site administrators, ESLteachers and other staff members interested in the ESL/BilingualprogrAms of the San Diego Unified School District.
If you have any questions regarding either the H-200 testing or theprogram description page enclosed, feel free to call Extension 406,Education Center for clarification. Please return the program de-scription page by December 1, 1970. Thank you for your cooperation.
j4A2/16Michael LaBayProgram Evaluator
ML:cn10/12/70
202

PROGRAM DESCRIPTION PAGESAN DIEGO ESL PROGRAMS
Directions: Below you will find (1),pretest-posttest informationand (2) ESL program statements. Please read the infor-mation given in (1) and furnish your own answers under
(2).
(1) Pretest-Posttest Information
By now your principal should have given you a copy of the ESL
Placement Test (H-2001 Level 1), a sample of the structured H-200
answer sheet and an ESL student roster. Enclosed with this "de-
scription page" should be enough student answer sheets and rosters
for your class.
The Evaluation Unit would like you to follow the directions given
in the "Directions and Rationale for ESL Center Placement Test"
section of the test booklet found in Pages 1 through 4, and then
pretest each of your children prior to November 13, 1970.
Because the ESL Placement Test is given on an individual basis
it is important that the classroom teacher give each test. This
is necessary because the pupil must feel "at ease" during the
testing period in order for his achievement score to be valid.
The best possible nethod of testing would be for the classroomteacher to test a few children each day and, using the ESL
Placement Test, ask each child the series of questions required
as part of normal classroom routine. (Some teachers have foundindividual testing within small modular groups to work well in
this regard.)
You will find, in reading the directions for test administration,
that the test manual has been written for a testor removed from
the classroom. Therefore, it is not important to follow all the
directions of this section. You know your children better then
anyone, and your introductory remarks should be what you think
is appropriate.
When all children have been tested please complete the class
roster to the best of your ability and return it to Testing
Services, B-4, Education Center, along with the Program De-
scription Page below. Early in May, 1971, you will be givenanother ESL Placement Test for each of your pupils to be used
for the posttesting, May 17-May 28. As soon as the ESL summary
publication has been prepared you will receive a copy through
your principal. And when all posttest scores are recorded atthe testing center a measure of achievement gain for your class
will be made available to you on request.
203

(2) ESL Program Statements
Name
School Grade Level
Please describe your ESL Program with referrence to how you groupchildren for instruction, what materials and equipment you havefound beneficial to instruction, and how you think the programcould be improved.
204

Please describe any pre-service or in-service activities sponsored
by the schools in which you have participated, indicating approx-
imate dates and worth.
Please indicate if you hate been using a teacher assistant or
community aide to help you in the classroom.
Have a teacher assistant
Have a community aide
7f ycl> have been using an assistant or aide please state how they
are 110.1.
Thank you for your efforts.
Michael LaBayProgram EvaluatorB-4, Education Center
MI:cn10/12/70
205

SAN DIEGO CITY SCHOOLSEDUCATION CENTER
PARK AND EL CAJON DOULEVARDS
STUDENT SERVICES DIVISION
Testing Services
4100 NORMAL STREETSAN DIEGO, CALIFORNIA 92103
Please complete this sheet and return to the above address by June 4, 1971.
Teacher
Principal
Grade
School
Student's Name May, 1971H-200 test score
Regular GradeEquivalent*
1.
2.
3.
4.
5.
6.
7.
8.
9.
10.
11.
12.._
13.
14.
15.
16.
206

Student's Name May, 1971H-200 test score
Regular GradeEquivalent*
17.
18.
19.
20.
21.
22. ---
23.
24.
25.
*Please refer to page 4 of H-200 test booklet
207

SAN DIEGO CITY SCHOOLSTesting Services DepartmentINNER CITY EVALUATION UNIT
To the ESL Teacher:
Many of you have discussed with me the possibility of gathering supple-mental teacher judgement data to augment that obtained from the H-200testing during the Fall and Spring semesters of this present schoolyear. The consensus reached was that, because many children answeredall questions correctly during the H-200 pretesting, and since the H-200test itself does not accurately reflect achievement except when it iscorrelated with the H-200 course sequence, it may be advantageous toassess academic gains through a supplemental teacher judgement measure.
Therefore, to more accurately assess the gains you are making with yourchildren, please indicate on the enclosed form the present level ofreading and language skills that each of your pupils possess. In theSpring other forms will be sent to you for each of your pupils. Inthis way, we will have comparative data on all youngsters, irrespectiveof their H-200 scores. Please send your checklist to Testing Services,along with your ESL Information Sheet and H-200 data. If you have anyproblems feel free to call Mike LaBay, Testing Services, EducationCenter (Extension 406) for clarification.
A /
)1(c:Lii ./11Michael J. LaDayrProgram Evaluator
ML:cn11/3/70
208

0
4
II

SAN DIEGO CITY SCHOOLSEDUCATION CENTER
PARK AND EL CAJON BOULEVARDS
STUOENT SERVICES DIVISION
4100 NORMAL STREETSAN DIEGO. CALIFORNIA 92103
The enclosed memo has been distributed to the Director of the Inner CityProject and various ESL specialists within the district. Admitting thatthe results are based upon volunteer respondors who perhaps have needsdifferent from other non-responsive ESL teachers, I hope this briefsurvey will assist in your communication with colleagues.
Teachers who did not respond to the ESL Program Information Sheet arenot receiving the memo. If you or they feel that I have not adequatelyexpressed a collective opinion shared between you, please feel free tocall this to my attention.
Thank you for your efforts so far in my ESL evaluation activities. Iwill be mailing you an H-200 roster for posttest purposes May 1, 1971.The roster will include a listing of your pupils who did not fully completethe H-200 pretest. For those children who "peaked" on the pretest, onlya Reading and Language Skills Check List analysis will be required. TheCheck Lists mailed to you will also have pupil names typed in theappropriate spaces.
Michael LaBayProgram EvaluatorInner City Project
210

I
SAN DIEGO CITY SCHOOLSEDUCATION CENTER
PARK BOULEVARD AT EL CAJON
SAN DIEGO 3. CALIFORNIA
DATE: January 12, 1971
MEMO TO: Houser
via: Pogleru'""FROM: La Bay
SUBJECT ELEMENTARY ESL PROGRAM DESCRIPTION SUMMARY
The following is a descriptive summary of elementary ESL teacher responses
to questions asked in preparation of this year's Inner City Evaluation
Report.
A total of eight teachers assigned to Inner City elementary schools
(Lowell and Sherman) and two teachers presently at Balboa Elementary
(for quasi-control) were asked to provide the ESL program information
as part of the context definition phase preceeding terminal Inner City
evaluation efforts. Their responses have been grouped into specific
categories for cursory inspection. Whenever responses could not be
grouped, individual teacher comments have been included. Concluding
statements follow the collectivized teacher opinions.
B:pc
14-
cc: Hal Wingard
211

Summary:
Elementary ESL Program Statements
1.
Please describe your E3L Program with reference to how you group children for instruction,
what materials and equipment you have found beneficial to instruction, and how you think
the program could be improved.
I.C. Parochial
Instructional Groupings
I.C. (Sherman, Lowell)
Non-I.C. (Balboa)
Pull-out or
Pull-out or
Criteria
No. Pupils
Self-contained
Criteria
No.
Pull-out or
No. Pupils
Self-contained
Criteria
Pupils
Self-contained
formal
ability to
Ability to
grade level
14
Pull-out
speak English
49
Pull-out
speak English
27
Self-contained
11.200 pretest
ability to
ability to
scores
8Pull-out
speak English
57
Pull-out
speak English
24
Self-contained
ability to
speak English
11
Self-contained
ability to
speak English
20
Self-contained
ability to speak
English; previous
experience in school;
age
14
Self-contained

Materials and Equipment Beneficial to Instruction
I. C., Parochial
I.C. (Sherman, Lowell)
Non-I.C. (Balboa)
H-200 drills
H-200 materials
Teacher-made materials
Peabody Kits
Teacher-made materials
Audio-visual materials
used to build basic
vocabulary
H-200 materials
H-200 materials
Teacher-made materials
Long. development games
-Miami Linguistics"
(teacher-made)
Mexican Textbooks
Audio-visual equipment
H-200 materials
Teacher-made materials
H-200 materials
Materials compiled by
Velia Snyder
NH-200 materials
\ .14
"Introducing English"
Audio-visual equipment

Expressed Needs for Program Improvement
I.C., Parochial
Supplemental H-200 materials
Spanish-English Dictionaries
for primary level
Gaming materials to augment
H-200 drills
I.C. (Sherman, Lowell)
Lower teacher/pupil ratio (15/1)
Limitation of 2 grade levels/teacher
Arithmetic books in Spanish
Stronger bilingual emphasis
One full-time aide per teacher
Non-I.C. (Balboa)
Better communication between
bilingual teachers
Teacher aides in the
classroom
A correlated course of study
(presently both teachers
of Balboa state that they
have little sequential
instructional outlines)
2.
Please describe any pre-service or in-service activities sponsored by the schools in which you
have participated, indicating approximate dates and worth.
I.C., Parochial
ESL Workshops were very
helpful
I.C. (Sherman, Lowell)
ESL Workshops were
very helpful
Non-I.C. (Balboa)
No comments

3.
Please indicate if you have been using a teacher assistant or
community aide to help you in the
classroom.
If you have been using a teacher assistant or community aide
Indicate how they are used.
I.C., Parochial
One school has a community
aide.
She is used in
making home calls, translate
notes to parents and assist
in small learning groups.
The other school has neither a
teaching assistant or community
aide.
vi
I.C. (Sherman, Lowell)
One school has two teaching
assistants and two community
aides (Sherman).
The teachers
utilize the teacher assistants
as tutors and in small instruc-
tion groups.
The community aides
are used in making home calls, for
translation activities and in a
community-school liason role.
The other school (Lowell) has
one community aide who assists
in preparing materials for
instruction.
Non-I.C. Dalboal
Both classrooms have a
teacher assistant.
The teacher assistant
is used to prepare materials
and for English drills.

4. Additional pertinent comments deemed worthy of consideration (edited):
"I would like to have more communication with bilingual teachers.I had talks with some. It seems to me that we all have a differentway of working with the children, even though the principles andgoals are the same."
"Ideally the (ESL) program would be better if I were able to havethe children for longer than I do. But, in view of the large numberof children in San Diego who need help, I.feel that my programfunctions pretty well."
"We have found milk and cookies to be a good learning experience.We use them as a learning technique for table manners, vocabularybuilding and sentence structure."
"I believe this (pull-out, as opposed to self-contained program) isbetter than a self-contained classroom situation because when they(monolingual, Spanish or bilingual, Spanish-English youngsters)are not together, they do not tend to lapse into their mother tongueand they get to hear English sounds of peers."
"Myny students are strictly monolingual, Spanish-speaking. The programis a joke. Nothing has been delivered to me to develop a cohesiveprogram. My experience is my only source. Resources, materials,assistance, books, equipment ... have been denied me.
I realize that some items are not available. I also know that someare. However, they may as well not be available. For instance,monies are available for teacher aides. My aide comes only for twohours in the morning, although full-time aides for this specialproject are available. They are being used for other services thatare not part of the program.
In addition, we have two grade levels. We have no curriculum normaterials. We have to make our own.
Now, you be the judge. Please tell me how this program could reachits objectives -- to get these students ready for regular classroomas soon as possible. "Those" in charge of the program don't careand don't foster progress. A waste,of teaching talent is expanded.We have to let go of teaching and guidance; we have to spend ourtime on non-essentials. It is a pity as this service is urgentlyneeded and much could be done."
216

Conclwaions:
From this limited survey of teacher opinions on the current status ofthe ESL program (as of December, 1970) the following conclusions maybe drawn:
1. ESL instruction is moderately diversified among the classroomsinterviewed. Teachers are not required to follow any one specifiedcurriculum. Some teachers fault the schools for this. The majoritydo not and prefer to use their own materials found useful throughexperience.
2. Where H-200 materials are used, they are used most effectivelyin the ESL classroom when the entire "H-200 kits" are available.Teachers who use H-200 curricular guides stated that they foundplanning much more difficult when accompanying materials couldnot be obtained by their school.
3. The majority of teachers surveyed indicated that the worth ofa successful ESL program should be based upon the degree towhich a youngster comprehends when he is placed in an English-speaking classroom. However, they also state that they have notfound one standardized instrument useful for either groupingpupils for instruction or validly predicting success in theEnglish-speaking classroom. Up to this point, each teacherrelies on his own definitions of their pupils' ability tospeak English.
4. The majority of teachers who use the H-200 placement test fordiagnostic purposes and to measure achievement gain feel thatit should be given only if H-200 materials and lessons areconjunctively utilized. Their opinion is that the test is veryspecific to its own lesson outline and, for this reason, shouldbe used with caution in predicting the success of lower elementaryEnglish-speaking abilities.
5. As was stated above, the only rationale used in predicting theacademic success of a sixth grade pupil has been the elementaryteachers' individual estimation of the pupil's ability to speakEnglish. There are indicatios, however, that such estimatesare not given to junior high school personnel when the sixthgrade pupil enters the seventh grade.
6. ESL workshops sponsored by the Bilingual Center have beenhighly valued by the ESL teachers, both as a disseminationdevice for materials and as a host for professional discussionsof techniques.
7. Overall, the ESL program at the elementary level is consideredby most teachers surveyed to be a moderate success. Mostteachers agree that federally-funded programs have assistedInner City schools to adequately staff ESL classes with teacherassistants and community aides. The majority opinion is thatthese individuals have been helpful in the preparation of
217

materials and in parent-teacher-child relations. If parapro-
fessionals had not been assigned to these classrooms, it isprobable that the existing ESL materials furnished by the CitySchools would be inadequate for the present level of instruction.If the elementary ESL program is to be reviewed and improved inthe near future, the teachers involved in this study feel thatfirst considerations should be given to (1) the purchase ofsupplemental H-200 materials (or a similar, complete ESL programpackage), (2) the continued use of in-service workshops and(3) the reduction of class size to 15 pupils per teacher.

I
APPENDIX C
Summary of the Social-Emotional Clim e Index Classificationsby
John Withall, Ph. D.

Criteria of Teacher-Statement Categories
1. LEARNER SUPPORTIVE statements or questions
These are teacher-statements or questions that express agreementwith the ideas, actions or opinions of the learner, or that commend orreassure the learner. Agreement is frequently expressed by a monosyl ,bicresponse such as "Yes," "Right," "Uhuhuh," and the like. Commendation orreassurance may be stated in terms of:
a. class-accepted criteria or goalsor
b. the private goals and subjective criteria of the teacher.
The dominant intent of these statements or questions is to praise,encourage or bolster the learner.
2. ACCEPTANT or CLARIFYING statements or questions
These are teacher-statements or questions which either:
a. accept, that is, evidence considerable understanding by theteacher of,or
b. clarify, that is, restate clearly and succintly in the teacher'swords
the ideational or the feeling content of the learner's_statement. Thedominant intent of these teacher-responses is to help the learner to gaininsight into his problem, that is, define his "real" problem and itssolution in more operational terms.
3. PROBL7M-STRUCTURING statements or questions
Problem-structuring responses by the teacher offer facts or ideasor opinions to the learner about
a. phenonema
b. procedures
in a non-threatening and objective manner. These r- sponses contain NOelement of advising or recommending the aolgption of ertain ideas orprocedures. Problem-structuring responses are fre4 ly posed asquestion; which seek further information from the lee er about theproblem confronting him; or they may be statements which offer infor-mation to the learner about his problem. The learner is free toaccept or to reject in part or in entirety the facts or opinions thatare presented to him. Problem-structuring responses may be questionswhich the teacher asks (1) to f,rther increase her own understandingof what the learner has said, or (2) to increase the precision of thelearner's statement of the problem. Problem-structuring responses
220

of
are problem-centered rather than either teacher or learner-centered;
nevertheless, they do tend to sustain the learner by facilitating hisproblem-solving activities.
4. NEUTRAL statements evidencing no supportive intent
These statements are neither teacher-susta ling, nor learner-sustaining nor problem-centered. They constitute a small percentageof the total teacher-responses. These responses include statementsin which the teacher: (1) questions herself aloud; (2) repeats ver-batim a statement that the learner has just made; (3) uses a politeformality, et cetera. Statements having to do with administrat veprocedure--the room in which the class will meet, the hour at wh.--;11a conference will occur--(especiallj after consensus has been achieved),fall into this category.
5. DIRECTIVE statements or questions
These are teacher-statements or questions which advise thelearner regarding a course of action or his future behavior and whichnarrowly limit his choice or offer no choice. These statements recom-mend to the learner the facts or procedures that the teacher proffershim. These statements or questions convey the impression to the learnerthat the teacher expects and hopes that he will follow her promptingand that, she will approve if he does. The intent of these responsesis to have the learner take up the teacher's point of view and pursuea course of action that she advocates.
6. REPROVING, DISAPPROVING or DISPARAING statements or questions
By mean: of these statements a teacher may express complete orpartial disapproval of the ideas, behavior, and, to her, personalityweaknesses of the learner. The teacher's internalized societal valueslargely eater into these responses. By means of these statements someteachers believe they are fulfilling their responsibility of incul-cating in young people society's standards of acceptable and desirablebehavior and achievement. The intent of these statements is:
a. to represent to the learner societal values as the teacher seesthem;
b. to admonish the learner for unacceptable behavior and to deterhim from repeating it in the future;
c. to impress on the learner the fact that he has not met thecriteria for successful achievement which the teacher accepts.
7. TEACHER-SUPIORTIVE statements or questions
These are statements or questions in which the teacher refers toherself and exnresses a defensive attitude, or refers to her nresentor past interests, activities or possessions with the purpose of reassuring
I
1 221

herself and of confirming her position or her ideas in the eyes of thosearound her. The dominant intent of these teacher-responses is to assert,to defend or to justify the teacher. Statements in which the teacherperseverates on an idea, a belief or a suggestion would fall in thiscategory. By "perseveration" is meant a persisting in, a reiteration of,and rigid advocacy of an idea or oninion by the teacher desrite additionaldata being presented to her which calls for a re-examination of theoriginal idea or opinion.
i
222

Appendix D
Specimen Copy, Inner City Project Newsletter
(June, 1971)
223

_./
4111111PAA
\/II
gob

Page 2
Polishing shoes is only one of a variety of interesting acti-vities in a Burbank School pre-kindergarten class. Srella Smithworks on shoes with the help of her teccher Mrs. MargaretGoodwin.
NINMAINIMIMEMOOMMMINI~Allo
Bo lear zapatos es solo una de to variedad de activIdadesinteresanies, en uno close de Pre-kindergarten de to EscuelaBurbank. Stella Smith trabala en los zapatos, con to ayuda desu maestro, Sra. Margaret Goodwin.
A welding protect in a metal shop class at Memorial JuniorHigh captures the interest of students, from left: LawrenceDavis, Lawrence Smith, Sergio Vasquez, Eddie Rodriguez,Dominic Monreal, Mr. Witt, aide; and Anthony Gee. Shopteacher is Dan Naylor.
Un proyecio de soldadura, en una close de taller de metales,en Ia Escuela Secundaria Junior Memorial, ca to I intern delos estudiantes; de Ia izquierda: Lawrence Davis, LawrenceSmith, Sergio Vasquez, Eddie Rodriguez, Dominic Monreal,Sr. Witt, ayudante; y Anthony Gee. Si maestro de taller esDan Naylor.
Rev. Oxley Honors"Inner City" Group
Dear Friends:
As the curtain falls on act three ofan enjoyable venture I can feel theloneliness of the days ahead. We havespent three fruitful years together inthis new experience i n Inner Cityeducation.
I have been honored in each of theseyears with the chairmanship of theProject Advisory Board--a great group- -and my gratitude and pleasure cannot beexpressed in this brief message.
We have shown the nation thatcommunity education centers can befunctional and harmonious. We hope thatthe community concern and participationin the affairs of our schools will be anever ending task.
In behalf of the Project Board, I wishto express appreciation to all who haveparticipated in the Inner City Project- -the parents, students, school staffs,community representatives and the Projectstaff.
My prayer is that God will concern thehearts and minds of those who are inpositions of power to terminate, to usethat same power to start a similarventure in the fall of 1971.
Respectfully yours,Rev. James H. Oxley
S fly
ajrKfAL
These eager readers in Mrs. Ruth Bohan's first grade class atCrockett School benefit from the latest materials and equip-ment. Seated is Joanne Salvia and standing, at the left,Carol Cabrera with Nenita Mortero.
Estos ansiosos lectores, de la close de primer grado de IaSra. Ruth Bohan, n Ia Escudo Crockett, se benefician canlos mss modrnos materiales y equipos. Sentada, sta JoanneSalvia, y de pie, a to izquierda, Carol Cabrera can NenitaMortara.
4
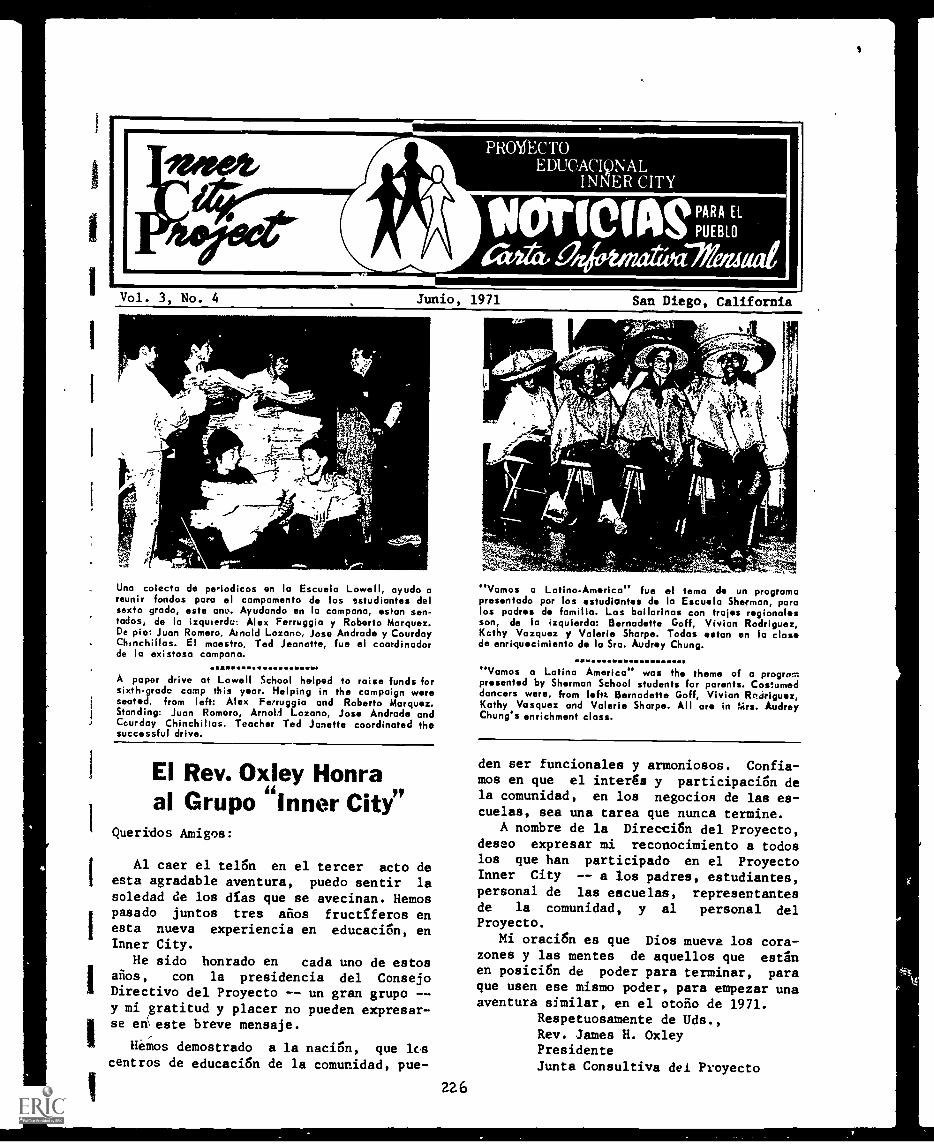
be
PRO\ECTOEDUCACI9NAL
INNER CITY
t1OTICIAS PARA EL
PUEBLO
ar ktlna WeaVol. 3, No. Junio, 1971 San Diego, California
iX
Anr
I
4 Ni
Una colecta de petiodicos en Ia Escuela Lowell, oyudo areunir fondos pare el campamento de los estudiantes delsexto grodo, site ano. Ayudando on la campana, *sten son-tados, de Ia izquierdc: Alex Ferruggia y Roberto Marquez.De pie: Juan Romero, Arnold Lozano, Jose Andrade y CourdayChinchillas. El maestro, Ted Jeanette, fue el coardinodorde Ia existosa campana.
A paper drive at Lowell School helped to raise funds forsixth-grade camp this year. Helping in the campaign wereseated, from left: Alex Ferruggia and Roberto Marquez.Standing: Juan Romero, Arnold Lozano, Jose Andrade andCcurday Chinchillas. Teacher Ted Janette coordinated thesuccessful drive.
El Rev. Oxley Honraal Grupo "Inner City"
Queridos Amigos:
Al caer el ter& en el tercer acto deesta agradable aventura, puedo sentir lasoledad de los dfas que se avecinan. Memospasado juntos tres afios fructfferos eneste nueva experiencia en educacign, enInner City.
He sido honrado en cads uno de estosafios, con la presidencia del ConsejoDirectivo del Proyecto un gran grupo --y mi gratitud y placer no pueden expresar-se en este breve mensaje.
Hellos demostrado a la nacign, que loscentros de educacign de la comunidad, pue-
226
"Vamos a Lotino-Americo" fue el temo de un progromapresentado por los studiontes de Ia Escuttla Sherman, parelos padres de familia. Las ballerinas con trajos regionalesson, de to izquierda: Bernadette Goff, Vivian Rodriguez,Kathy Vazquez y Valerie Sharpe. Todas triton en la closede enrioucimiento de Ia Sra. Audrey Chung.
"Vomos a Latino America" was the theme of a programpresented by Sherman School students for parents. Costumeddancers were, from lefts Bernadette Goff, Vivian Rodriguez,Kathy Vasquez and Valerie Sharpe. All are in Mrs. AudreyChung's enrichment class.
den ser funcionales y armoniosos. Confia-mos en que el interims y participaciOn dela comunidad, en los negocios de las es-cuelas, sea una tares que nunca termine.
A nombre de la Direccign del Proyecto,deseo expresar mi reconocimiento a todoslos que han participado en el ProyectoInner City -- a los padres, estudiantes,personal de las escuelas, representantesde la comunidad, y al personal delProyecto.
Mi oracign es que Dios mueva los cora-zones y las mentes de aquellos que estgnen posici6n de poder pare terminar, parsque usen ese mismo poder, pars empezar unaaventura similar, en el otofio de 1971.
Respetuosamente de Uds.,Rev. James H. OxleyPresidente
Junta Consultiva del Proyecto

Page 4
rT:Zr:
r
Estas presidentes anteriores de PTA, d Burbank-Crockett-Logan, fueron honrades en un programa rodents de "Founders'Day". Las dames fueron presentados por la Sra. Macy LesJackson, presidents actual, Ia ultimo a to derecha. En [lima,de la izquierda, estpn: Sra. Fisher, Sra. Simmons, Sra. Bolivar,Sra. Williams, Sra. Hunn, Sra. Bell, Sra. Thornton y Sra.Grundy.
These past presidents of the Burbank-Crockett-Logan PTAwere honored at a recent Founders' Day program. The ladieswere introduced by Mrs. Macy Lee Jackson, current president,at the far right. In line, from the left, are: Mrs. Fisher,Mrs. Simmons, Mrs. Bolivar, Mrs. Williams, Mrs. Nunn, Mrs.Bell, Mrs. Thornton and Mrs. Grundy.
Aprenda Inglis Gratis en TV
CLASES GRATISInglis Como Segundo LenguajeSal6n de Clase de TV, Canal 8
Cada Viernes en la maiiana 6:30 a 7:00 A.MEmpezando el 11 de Junio, por diet
Para inscribirse llame alTel. 233-0181, Ext. 55
o escriba aSALON DE CLASE DE TV
835 12th. Ave.San Diego, Calif. 92101
(No se cobra por matricula o materiales)
semanap
Learn EnglishFree On TVFREE CLASSES
"English As A Second Language"TV Classroom, Channel 8
Every Friday morning, 6:30 to 7:00 a.m.Starting June 11, for ten weeks
To register call 233-0181, ext. 55or write to
TV CLASSROOM835 12th Avenue
San Diego, Calif. 92101(No charge for registration or materials)
IL
rr
Una conferencia Informal acerca del catalogo de tarjetas,tuvo lugar n al Centro de Recursos do Aprendizaje, en IaEscuela Secundaria San Diego, (Bibliotsca). Las partici-pantes son, de Ia izquierda: Sra. Arenas, Sra. Garcia, ayu-dantes do Ia comunidod, del Proyscto inner City; Sra. Hpton,empleada; Sandi Wistr, studiant voluntaria; y Sra. Pabst,bibliotecaria. No rtratada: Teresa Martinez, ayudant deinstruction.
An informal confrnc is held around the card catalog at theSan Diego High "Learning Resource Center" (library). Parti-cipants are, from left: Mrs. Arenas, Mrs. Garcia, Inner CityProject community aides; Mrs. Hepton, clerk: Sandi Wester,student volunteer; and Mrs. Pabst, librarian. Not pictured:Teresa Martinez, instructional aide.
222
FEL /2\IERANO
Apoye au Consejo Consultivode Padres de Familia
Esto s uno publican& del proycto "Inner City"Escuolos do Ia ciudod do Son Diego, 234.7945
Henry Nakasone, Editor;Sra. Loretto Burke, Sra. Rosario Marquez, Troductoros
This is a publication of the Inner City PrefectSan Diego City Schools, 234.7915
Henry Nakasone, Editor;Mrs. Loretto Burke, Mrs. Rosario Marquez, Translators
4
Inner City Project2952 National AvenueSan Diego, California 92113

Appendix E
Sample Information Packet used by PAC in funds allocation
228

SAN DIEGO HIGH SCHOOL PARF,NT ADVISORY COUNCIL
100% budget allocation, 1970-71: 515,291.00
CateaoryAmounts spent Cate7oryor encumbered totals
200. Instruction
Supplies $ 921.44
Books 757.18
Equipment rental 1,163.75
Service policy 285.00
Audio-visual (film rental & purchase) 566.77
Other Expense:
Marine Encampment 270.00
Track Meet 100.00
Swimming., lessons 850.50
Conference (registration) 25.00
400. Health
$ 4,939.64
Dental consultants 600.00
Nurse's assistant (Community Aide) 2,160.00
Mileage for nurse's assistant 200.00
2,960.00
500. Transportation
Bus tokens 100.00
Bus transportation 1,547.00
1,647.00
600. Plant Operation
Telephone 158.10
158.10
229
Total 9,704.74
100% budget 15 291.00
BALANCE AT 12/3/70 5 5,586.26

SAN DIEGO HIGH SCHOOL PARENT ADVISORY COUNCIL
Final Budget Figures, 1970-71
FIGURES IN PARENTHESES INDICATE AMOUNTS SPENT OR ENCUMBERED TO DATE
Supplies (3921.44)
Books (3757.18)
Equipment Rental (11,163.75)
Service Policy (3285.00)
Audio Visual (>56(.77)
Other Expenses
Marine Encampment (1270.00)Track Meet Expenses (1100.00)Swimming Lessons (3850.50)
Conference registration (125.00)
Nurse's Assistant (52160.00)
Mileage for Nurse's Assistant (1200.00)
Dental Consultants (3600.00)
TransportationBus tokens (5100.00)
Field Trips (11,547.00)
Telephones (1158.10)
Tickets
Performers & Consultants
1,163.75
285.00
1,220.50
2,160.00
200.00
600.00
158.10
TOTAL 15,291.00
230

AGENDA
PARENT ADVISORY COUNCIL.December 3, 1970
I. C',LL TO ORDER AND INTT SUCTIONS
II. NEW BUSINESS
A. PROPOSALS
1. Proposal 430 - Mrs. Glenn - Learning Packets for Tutorial Program
2. Proposal #31 - Coach Harris - football tickets
Proposal #32 - Coach Todd - film
4. Proposal #33 - Mr. Lopez (Mr. Gamboa) - tickets to Misa Criolla
5. Proposal #34 - Mr. Gamboa - translator
B. APPROVAL OF MIPUTES
C. FAC RECOMMENDATION TO S.D.H.3. ADMINISTRATION AND FACULTY
D. CONSIDERATION OF PROPOSALS
E. FINAL BUDGET FIGURES
III. OLD BTU NESS
A. DISCUSSION OF DISTRIBUTION CENTER FOR MATERIALS PURCHASED WITH
PAC FUNDS (OR ALTERNATIVE)
B. FOLLOW-"P ON PAPERBACKS
233.
*

.1"
PROIOSAL TO IAR_NT ADVISORY COUNCIL OF INNER CITY PROJECT #32San Diego Big. School
A. INFORMATION FOR IDENTIFICATION PURPOSES:
1. NAME OF PERSON SUBMITTING PROPOSAL: Gary Todd
2. DEPARMENT: Boys' Physical Education DATE: November 24, 1970
B. tROPOSAL:
Would like to obtain a Korney Jump Rack for Physical education testing
of all boys, and three sets of film for purposes of instruction in the
Basketball program.
1. PURPOSE OF PROPOSAL:
Will provide students with a means of measuring their jumping ability
and provide some self-motivation to improve in this area. We have no
way of testing our students in this area of physical fitness at the
present time. All boys at SDHS will be affected. The film will help
tremendously in fielding a better Basketball team at San Diego High.
2. WHi IS NEEDED?
One Korney Jump Rack kA., 339.95
Three sets of Super 8 mm film Cs 330.00 a set
TOTAL: 129.95
3. WHO WILL PRESENT PROPOSAL AT PAC MEETING?
Gary Todd
a. TIME NEEDED:
Approximately 5 minutes
232

1970-71 Inner City Process Eva)uation tuestionnaire

SAN DIEGO CITY SCHOOLSEDUCATION CENTER
PARK AND EL CAJON BOULEVARDSSAN DIEGO 3, CALIFORNIA
STUDENT SERVICES DIVISION
Testing Services
Dear Inner City Staff Member:
As you probably know you are one of approximately three hundred teachersinvolved in this year's Inner City Project. Because you continually work -
with the same individual children and young adults who are supposed to ben-efit from the services provided through Inner'City Project funding, you andyour pupils are in the best position to evaluate program worth.
Therefore, would you please take ten minutes from your busy schedule to in-dicate on the enclosed checklist your opinion of activity effectiveness re-lative to the objectives of this year's program. I have tried to make the
directions explicit, but I also realize that there are always problems incommunication whenever someone writes to instead of talks with anothercolleague. If you experience problems of any kind feel free to call 298-4681,
Extension 406 for clarification
Once again, your opinions are an integral part of the 1970-71 evaluationeffort. Without knowing what educators think of this program' the InnerCity Project staff will have to resort to secondary sources far removed
from the classroom. I'm sure you will agree that this is less desirable
than utilizing your professional opinions.
S.ncerely,
Michael LaBa-,
Program Evaluator
P.S. The 1969-70 Inner City Evaluation has been published and is availa-ble through your school principal.
ML:cn10/29/70
234

SAN DIEGO CITY SCHOOLSTesting Services DepartmentINNER CITY EVALUATION UNIT
PRCGRAM QUESTIONNAIRE
To the School Staff:
Enclosed is a checklist to be used during the 1970-71 school year inmonitoring the effectiveness of activities associated with the InnerCity Program. The time of completion is approximately six minutes.
You will find that each activity is stated with reference to a specificgoal. You are asked to judge the effectiveness of each activity accordingto whether you feel it is beneficial in helping the district attain thesegoals.
If you have been associated with any of the activities listed, simplycheck the "Involved" column and one of the five categories which bestrepresents your opionion of its effectiveness.'
If you have not been involved in the activity, please check the "Not In-volved" column and leave the appropriate response category row blank.
You will notice that many activities are specific to certain schools. Ifa school is identified uller the activity category please evaluate itseffectiveness only if you are from that school.
The checklist is anonymous. It will in no way be used to evaluate individualperformance. The checklist will be distributed and analyzed by the ProgramEvaluator, Inner City Project. Your responses will be classified onlyaccording to role within your school. Results will be tabulated in condensedform, then given to the project staff as an aid in defining potential pro-blems.
Through this diagnosis it is hoped that your expertise will be used mosteffectively in identifying both positive and negative aspects of the pro-gram. Please return the enclosed checklist by January 15, 1971.
Thank you for your efforts.
Michael LaBayProgram EvaluatorInner City Project
Approved:
ML:cn
235

SAN DIEGO CITY SCHOOLSTesting Services DepartuentINNER CITY EVALUATION UNIT
Please indicate your role within the school.
administrator
counselor
classroom teacher
auxiliary teacher
teacher assistant
other: please identify position
Directions: If you have been associated with any of the activities listed,check the "Involved" column and one of the five categories which best represents your opinion of its effectiveness.
If you have not been involved in the activity, please check the "Not Involved"column and leave the am ro iate res onse cate ory row blank.
If you know that the activity is not longer fanctioning in your school, pleasedraw a line through the activity.
If you feel that you cannot convey your opinion of an activity through thechecklist, feel free to use the "comment" section provided for each of thesix goals.
236

Goal 1: To improve the level of involvenent betweens4 parents, the school, and the community.
I
I
I
Involved Not Involved Activities
I(1) Project Advisory Board
(2) Parent Advisory Council
1 (3) Parent Counselors (Logan,Memorial)
I
(4) -_-__ Ethno -Cultural Activities
(5) Communication Circulars
I(6) Community Aides
(7) Clerical Help
1 (8) School Workshops forTeachers, Students andCommunity (San Diego)
Comments:
Degree of Effectiveness
237

Goal 2: To provide effective English as a SecondaryLanguage (ESL) and Bilingual Instruction.
Involved Not Involved Activities
(1) English as a Second Language(ESL)
(2) ESL- Redeployment Kindergarten(Sherman)
(3) Bilingual Instruction in AcademicSubjects ;San Diego, Memorial)
(4) Language Power Program (Burbank)
(5) Elementary Bilingual Program(Lowell)
Comments:
Degree of Effectivenes-
238

I
I
I
I
1%1)
2)
':3)
(4)
:5)
6)
7)
:8)
(9)
LO)
(11)
Goal 3: To provide effective motivational, personal,educational and career counseling.
Involved Not Involved
Comments:
Degree of Effectiveness
Activities
Career Motivation Activities (Logan, Lowell,
Sherman, Memorial)District Counselor (Memorial)
Elementary Counselor
Motivational Advisors (Memorial, San Diego)
Work-Study Program (Logan, Memorial, SanDiego)
Educable Mentally Retarded (Sherman)Redeployment into Regular Classrooms
Educationally Handicapped Classes for ChildrenPreviously Identified as EMR (Lowell)
Black and Chicano Studies Program (Memorialand San Diego)
Performing Artists
Counseling Expansion Program (San Diego)
Reduction in Tracking (San Diego)
^cs
4.%"/_411,^cs
4% 04.%"/ AN.
239

IND
NO.
Goal'4: To provide adequate health and nutritional services
that support the physical wellbeing and vigor ofchildren.
Involved Not Involved Activities
Comments:
Dental Program (Logan, Memorial,San Diego)
Lunch Program (Free)
Lunch Program (Reduced Cost)
Swimming Program (Memorial,San Diego)
Telebinocular and Titmus VisionTesting (Memorial)
Playground Equipment (Crockett,Logan)
Degree of Effectiveness
240

Goal 5: To increase sensitivity and receptiveness to the problemsof students and parents on the part of staff members in
the schools.
Involved Not Involved Activities
Comments:
Administrative Intern (San Diego)
Open House Programs
New Teacher Orientation
Spanish Instruction for Teachers
Teacher Assistants
Teacher Development Program-Social Studies (San Diego)
Training Program for Instruc-tional and Community Aide(Memorial)
Degree of Effectiveness

Goal 6: To improve the academic performan'e of elementaryand secondary students.
Degree of Effectiveness
Involved Not Involved Activities 4 00
Field Trips
Teacher Assistants
Tutoring Program
Math Computer Program(San Diego)
Multimedia Center (San Diego)
Nova Project (San Diego)
Project English (San Iliego)
Black and Chicano Stuo.:sProgram (Memorial, San Diego)
Non-Graded Primary Program(Iogan)
Programmed Reading Materials(Logan, Sherman)
Departmental Program - SixthGrade (Logan, Sherman)
Enrichment Classes - Grades 3,5, 6 (Logan, Sherman)
Miller Math (Sherman)
Music and Math Program (Sherman)
Non-Graded Primary Classes(Sherman)
Follett.. Language Program
(Lowell)Pilot Project - Social Studies
(Lowell)
9).
(z)

Conttd. Goal 6: To improve the academic performances of elementaryand secondary students.
Involved Not Involved Activities
(18) Redeployment Reading(Logan, Lowell)
(19) Prekindergarten (Crockett,
Lowell)
(20) Reteaching Reading (Lowell
only)
(21) Reteaching Reading (Other
Schools)
Comments:
Degree of Effectiveness
Please use the enclosed envelope to return your checklist to Testing Services,
Education Center, B-4.
243

1
1
Appendix G
Letters of introduction used in securing information from
site /Nersonnel
244

SAN DIEGO CITY SCHOOLSEDUCATION CENTER
PARK AND EL CAJON BOULRVAROSSAN DIEGO 3. CALIFORNIA
STUDENT SERVICES DIVISION
Testing Services
November 25, 1970
As part of this year's Innef City Project evaluation your class has beenrandomly selected as one of fifty other individual classes to participatein a visitation and interview schedule. The object of the class visit isto ascertain the extent of teacher-pupil interaction within each of theclassrooms. The objective of the interview schedule is to give you achance to state your views on certain aspects of the 1970-71 Inner CityProject.
This information, together with semester activity checklist forms, stan-dardized test scores, grade point averages and end-of-year staff question-naires results will be the heart of this year's Title III evaluation.
It should be stressed that the job of Program Evaluator is to evaluate theextent of project goal attainment, not to evaluate instructional technique.All visitations will be conducted with this qualification and with theapprovul of your Principal. Visitations will be conducted discretely andin a manner that will not interrupt classroom routine. The informationobtained from such visits will consist of interaction profile indices,and will not be used in any way to define teaching competence.
Enclosed you will find a visitation schedule. Please n,te the time anddate of your two class visits (the end-of-year interview date will bediscussed at the time of the first interview.) If there is a conflict,and your class will not be available on the dates indicated, please con-tact Mike LaBay, Extension 406, Education Center by November 27, 1970.
Thank you for your cooperation.
Michael LaBayProgram EvaluatorInner City Project
ML:cn
11/6/7021+5

SAN DIEGO CITY SCHOOLSEDUCATION CENTER
ARK AND EL CAJON BOULEVARDSSAN DIEGO 3. CALIFORNIA
STUDENT SERVICES DIVISION
Testing Services
November 11, 1970
Since your school has activities funded under the 1970-71 ESEA TitleIII Project, there are a few tasks that the Inner City Office must per-form within your school as part of its third year evaluation. Mostof these tasks will be accomplished by Michael LaBay, the Inner CityProject Evaluator. However, one phase of the evaluation specificallyrequires your assistance.
As part of the context evaluation, it would be most helpful if youwould furnish the following information:
(1) An itemization of your Community Coordinator, CommunityAices, Teacher Assistant, and Teacher Aide positions withreference to:
(a) Names and assignments
(b) The number of hours per week that the individual in(a) has been assigned to your school
(2) A description of any job orientation and/or training sessionsfor paraprofessional staff members that have been or will beheld at your school site this year. This description shouldinclude:
(a) Type of activity
(b) Number of participants and their positions
(c) Dates of the meeting
246
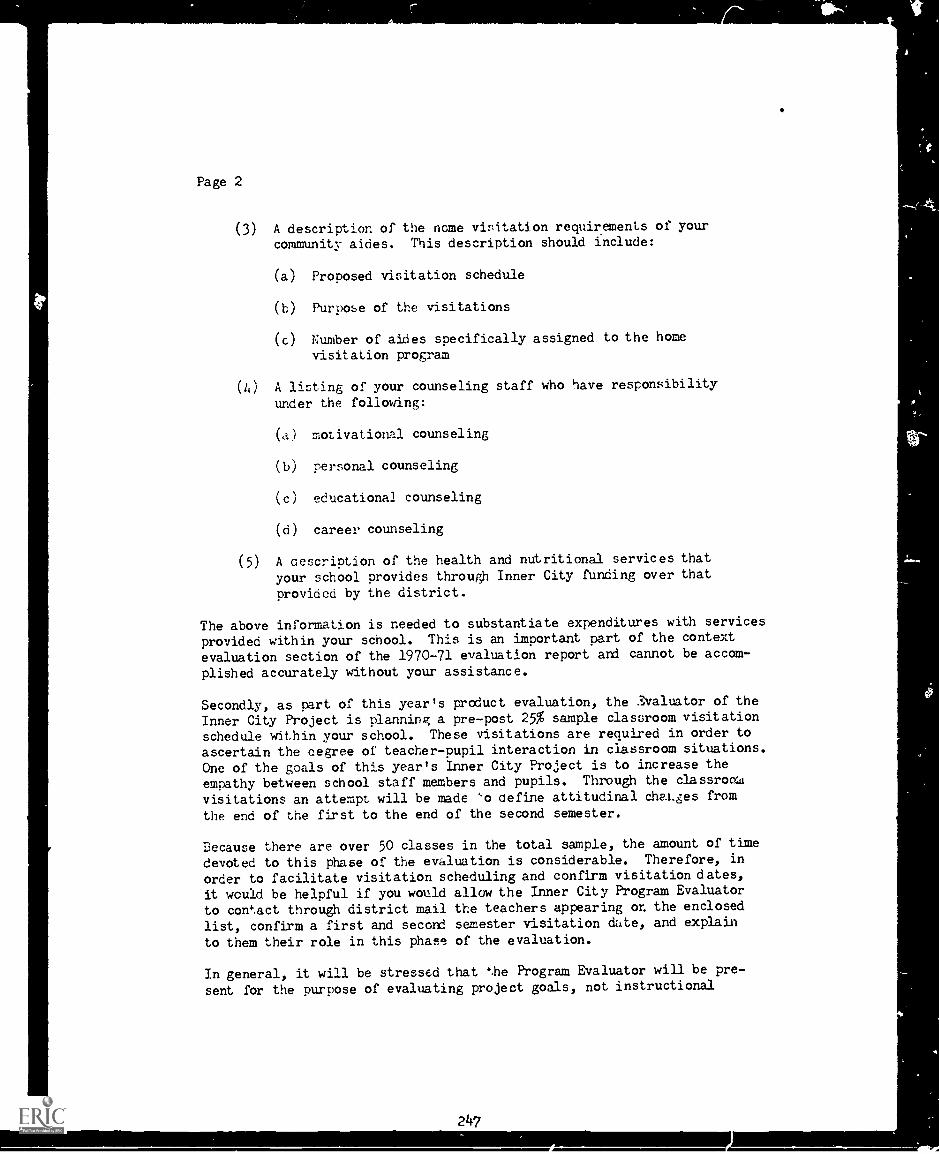
(3) A description of the nome visitation requirements of yourcommunity aides. This description should include:
(a) Proposed visitation schedule
(b) Purpose of the visitations
(c) Number of aides specifically assigned to the home
visitation program
(4) A listing of your counseling staff who have responsibility
under the following:
(a) motivational counseling
(b) personal counseling
(c) educational counseling
(d) career counseling
(5) A aescription of the health and nutritional services that
your school provides through Inner City funding over that
provided by the district.
The above information is needed to substantiate expenditures with services
provided within your school. This is an important part of the context
evaluation section of the 1970-71 evaluation report and cannot be accom-
plished accurately without your assistance.
Secondly, as part of this year's product evaluation, the valuator of the
Inner City Project is planning a pre-post 25% sample classroom visitation
schedule within your school. These visitations are required in order to
ascertain the cegree of teacher-pupil interaction in classroom situations.
One of the goals of this year's Inner City Project is to increase the
empathy between school staff members and pupils. Through the classrooms
visitations an attempt will be made 'o define attitudinal changes from
the end of the first to the end of the second semester.
Because there are over 50 classes in the total sample, the amount of time
devoted to this phase of the evaluation is considerable. Therefore, in
order to facilitate visitation scheduling and confirm visitation dates,
it would be helpful if you would allow the Inner City Program Evaluator
to contact through district mail the teachers appearing or. the enclosed
list, confirm a first and second semester visitation date, and explain
to them their role in this phase of the evaluation.
In general, it will be stressed that the Program Evaluator will be pre-
sent for the purpose of evaluating project goals, not instructional
247

Page 3
technique. Each teacher will be told the purpose of the visits, andwill be assured that:
(1) All visitations will be conducted by the Program Evaluator,Michael LaBay.
(2) The classroom observer will be discretely seated in ttseclassroom for approximately twenty minutes, and till notinterrupt classroom routine.
(3) The information obtained from such visits will consist ofinteraction profile indices, and will not be used in any wayto define teaching competence.
The descriptive information from your office and the class visitationswill be supplemented with semester activity evaluation forms, stan-dardized test scores, C.P.A. data and end-of-year staff questionnaires.If you have any questions regarding your part in the evaluation pleasecontact Mike LaBay, Extension 406, Education Center.
Please return the enclosed Principal Information Sheets to Mike LaBay,Testing Services, Bungalow 4, Education Center, by November 24, 1970.
Michael J. LaBayProgram EvaluatorInner City Project
Approved:
Norman HouserDirectorInner City Project
ML:cn11/5/70
246

PRINCIPAL INFORMATION SHEETInner City Project
(1) Itemization of Community Coordinator, Community Aide, Teacher Assis-tant and Teacher Aide positions.
NameNumber hours/week
Title assigned to the school
249

(2) Job orientation and/or training sessions for paraprofessionals.
Type ofActivity
Number ofParticipants
Positions of MeetingParticipants Dates
I
1

(3) Home visitation requirements of Community Aides.
Visitation Schedule
Purpose of the Visitations
251

(3) Home visitation requirements of Community Aides. (cont'd)
Number of Community AidesSpecifically Assigned to the Visitation Program
252

(4) Counseling staff definition:
Name
253
Responsibility (Motivational,
personal, educationalor career counseling)

(5) Health and nutritional services definition.
Service Itemization
The classroom visitation schedule, as defined in context of the 1970-71Inner City Evaluation has been approved for implementation.
Name Date
254

-r
Appendix H
Job Orientation and/or Training Sessions for Paraprofessionals
by School, as given by the site principal
255

School
Total Number of
Tyoes of Activities
participants
Positions of
Participants
Meeting Dates
Burbank
Workshop: Overview of Program
11
Teacher aides
9/22
/70
Teacher trainees
Teacher assistants
Workshop: Oper-ttion of A-V equipment
10
Teacher assistants
9/23
/70
Workshop: Creative Language Program
11
Teacher assistants
10/6
/70
Workshop: Listening; Center
11
Teacher assistants
10/1
3/70
Workshop: Small group instruction
10
Teacher as
10/2
0/70
Workshop: :',upplement-11 Instructional
.ides
11
Tekher assistants
10/2
7/70
Crockett
Wori,shor: Orientation
3?
Instructional aides
9/15
/70
'Jorkshop: Cri -intation
36
Instructional :11-xs
9/22
/70
/orkshop: TnsLructional Traini--
itInsr,ructional aides
9/PV
70riorkshop: Instructional l'raiain-
36Instructional ,Ades
10/1
9/7n
Logan
InforruaL meeting s with participating
teachers and site administrators on
teaching techniaues and community
relations
5,nstructional aides
unscheduled
Lowell
Tour of Facilities
3Instructional aides
9/22/70
Informal meetings on an individual
3Instructional aides
basis
3Instructional aloe
trainees
unscheduled
aStudent helper
Sherman
No information given by the principal
Memorial
General 0-ientation
8Community aides
9/11
/70
General Orientation
4Teacher assistants
9/13
/70
Instructional workshop
12
Instructional Workshop
6Teacher assistants
9/24
/70
Instructional Workshop
6Community aides
10/1
/70
an Diego
Crientation to school program by the
supervising office and department heads
13
All Paraprofessionals
unscheduled

Appendix I
Definition of 3pecial Programs, Services, Personnel,Materials and ,:.;quipment in Inner,City Project Schools
from 1968 through 1971
257

SN DIEGO CITY SCHOOLSINNER CITY PROJECT
D1'INITIONOF
SPECIAL PROGR\MS, SERVICES, PERSONNEL, MATERIALS 'AND 17.\UIPMENTIN
INNER CITY PROJECT SCHOOLSFROM 1968 THROUGH 1971
1. Additional Staff. During all three years of the Inner City Project,all seven of the Inner City schools received various types and amountsof staffing above district formulr. In some cases it amounted to extradays of psychological or nursing service, and in other instances addi-tional full-time teachers, advisors, administrators or clerks wereassigned to the schools.
2. Administrative Intern Program. A-reement between the San Diego CitySchools and an institution of higher education permitted candidatesfor administrative credentials to serve in an administrative capacitywhile completing work on the state credential. San Diego High hadtwo such interns from different ethnic minorities serving as viceprincipals. One of these completed the program and became one of thefirst in the State to receive an administrative credential in thismanner. This process made it possible to move able members of ethnicminorities into leadership positions more quickly than was previouslythe case. The salary of one intern was covered entirely by innerCity funds and the other was funded by Inner City and the district.
3. Aides - Instructional and Community. The Inner City schools hiredmany people indigenous to the community to serve as instructionaland community aides. Because of language and culture, many of theseaides identified well with minority students. More than 470,000 waspaid to some 90 aides during the first year cf the project. Becauseof a curtailed project budget, the number of aides employed by InnerCity funds dropped to between 50 and 60 during the second and thirdyear.
4, Art Exhibit - "Color Me Creative." From March 24-29, 1969, the FiestaRoom of he May Company, Mission Valley, was the setting for an ex-hibit . tudent art and a phcto montage representing the seven InnerCity Project schools. Live student art demonstrations were alsofeatured. Teachers brought their classes to the exhibit and latertoured the shopping center. For many students, it was a first visitto the center. Total visitor count was 1,020 adults and 568 students.The exhibit was an excellent medium for telling the Inner City storyto the public. The response to the show was highly enthusiastic onthe part of the students, teachers, parents and the public. An educa-tional TV station (Channel 15) filmed and featured the exhibit ontheir weekly program "San Diego At Large." Joseph Nyiri, districtart resource teacher, coordinated and mounted this successful artexhibit.
5. Artist in Residence Program. This unique program at San Diego HighSchool provided a professional artist of recognized stature to work
258

with groups of students, lecture, and provide inservice education for
art teachers.
6. Bilingual Instruction in Academic Subjects. Some very able students
arrive in this country with very limited ability in the English lan-
guage. So that, while learning English, they do not fall behind in
other academic courses, the Inner City Project increased the course
offerings in which the teacher provides instruction in both Spanish
and English. San Diego Hi0 offered bilingual instruction in chemistry,
general math, algebra, U.S. History, biology, science problems
American government and Chicano studies. In addition, high school
textbooks written in Spanish were Provided for classes in physics,
typing, geometry, bookkeeping, electricity and first aid. Bilingual
teacher assistants were assigned in strategic sections where teachers
did not speak Spanish.
Memorial Junior Hirh School had bilingual instruction in seventh- and
ninth-grade Chicano studies, ungraded social studies, reading, and
beginning and intermediate matn and English. Funds for books written
in Spanish came largely from the Inner City budget. A bilingual
teacher assistant was also assigned to help the teacher in the area of
home economics.
Lovell Elementary School had bilingual instruction in social studies,
grades 4, 5, and 6.
7. Bilingual Program (Elementary). All pupils--grades PreK, K, and 1,
and some second grade pupils were given instruction in both Spanish
and English. In some classes, teachers exchanged pupils for instruc-
tion in the second language. In other cases, instruction was given
bilingually in a self-contained situation.
8. Career Motivation (Trips to North Eland). From December 12, 1968,
through April 4, 1969, the entire class of ninth graders of Memorial
Junior High (450 boys and girls) toured the Naval Air Station and
Naval Air Rework Facility, North Island. Visits were made in weekly
groups of 35-40. Last year approximately 425 ninth graders were
involved in the same program from October 21 through February 18,
1970.
In a pilot program during the 1968-69 school year, two sixth grade
classes, one each from Lowell and Sherman, took trips to North Island,
separate from the junior high group. Because this experiment looked
promising, last year all sixth graders fr:-111 Lowell, Sherman and Logan
were included in the North Island experience.
Goals of the program were: (1) to expose students to the vast in-
dustrial command and provide an understanding of the various occupations
and skills required to qualify for employment; (2) to encourage students
to remain in school and to prepare themselves to be employable indivi-
duals in the future; and (3) to stress equal employment opportunities.
The Navy provided bus transportation and guides at no charge. During
1968-69, the North Island Association, an employee organization,
provided lunches. Last year lunches were provided through Memorial'S
Parent Advisory Council.
259

The career motivation trips to North Island continued during- the thirdyear of the rroject in the same way as they were conducted during theprevious year.
9. Clerical Help (Additional Time). Recognizing greater work loads fortne office staff in schools' additional Federal and State programs,schools have requested the services of additional part-time or full-time clerks. In many instances, clerks have provided library servicesfor book collections rurchased with ESEA funds.
10. Computer Program - Math Classes. This program incorporated the useof a high speed electric calculator (Programme 101 Olivetti Underwood)in various mathematics classes. The calculator promoted the under-standinr of equations through student initiative in the programmingprocess. Teachers involved students and classes in the program accordingto their preference.
11. Communications. Information about the projt_ct was disseminated throughthe following media:
Monthly Newsletter - Five issues were printed and distributed in1968-69 and four issues in 1969-70. Each issue (four pages) was inEnglish and Spanish. Total copies circulated totaled 72,000 as ofJanuary 1, 1971. They were distributed to parents, school staff,community groups, Education Center personnel, out-of-town inquiries,and walk-in public.
Brochure - The brochure "Of Course I Care" detailed the first yearaccomplishments and activities of the seven Parent Advisory Councilsand the Project Advisory Board. Eight thousand copies of the brochure,printed in English and Spanish, had the same distribution as theNewsletter.
Radio - Radio spot announcements, repeated over a period of threeweeks, were made on KOGO, KITT, and KSON urging parents to vote inthe parents council elections. The open houses were also announced.For the 1970-71 year station XEBG in Tijuana, Mexico, agreed to h.akeSpanish announcements of interest to Spanish-speaking parents, usingnews copy translated in the Inner City office and sent to the station.
Television - The Sun Up program on Channel 8 TV made several announce-ments urging a turnout of voters fox:-the parent council elections.Over the three years of the project's operation, the project has beenon Channel 8 and Channel 10 TV frequently.
Press - For the two-year period 1968-70, the following newspapers andmiscellaneous publications have featured news and photos pertainingto people and events in the project:
PublicationNumber of Articles/Photos1968-69 1969-70 Total
Column168 -69
Inches
TotalVoice & Viewpoint Yews 23 35 56'- 736 1199 1934San Diego Union 15 19 34 483 780 1263Evening Tribune 26 32 58 521 694 1215San Diego Independent 12 12 24 281 175 456Staff Bulletin 9 13 22 131 343 474Misc. Publications 7 2 200 30 230
Totals 92 113 205 2351 3221 5572
260

The Inner City :roject received international exposure in the August 11,,
1970, issue of "The Christian Scienc, " full-page spread
featured a photo of the Burbank Parent ':il, accompanied
by a descriptive article of San Diego'
zlecion posters - Fosters (in Engliz: Zpanish) fox the 1969-70
parent council elections were distributed to schools, and displayed
in strategic spots in the community, .J1 superlarkets, grocery stores,
churches, Neignborhood
12. Counseling Expansion Program. Full-time co were assigned at
each grade level to augment the tradition') hour advisors.
The motivational advisor time for minority stuoents was doubled during
the third year of the project over that of the second year. Four ad-
visors (two Chi c,no and two Black) served three hours per day in this
capacity. Thch of the two ethnic groups included a male and a female
advisor. One ::our wrs also added to the scholarship advisor's time.
13. Derirtmentll !rorrar. This was a program at Zhormln Elementary School
for sixth rrnde nurils. The students were redeployed for instruction
in basic subjects of math, language and reading. Each teacher se)ected
one of these ar,ns ,nd taurnt all three pupil groups in that subject
area. This 3recarli7,ation rermitted teachers to work in the subjects
of gre,itent interest and competence.
14. Dental Prorram. 1:trents felt that there were many students in the
Inner City nroject who had neeu of dental care. N- les of dentists
were processed by the school health department and ae Bo7Ird of Edu-
cation, and scnool nurses made referrals as necessary. During 1968-
69, the Loran iireht ,dvisory Council provided 4360, San Diego 3600,
and Memorial nearly i';000 for dental care. The Parent Advisory
Councils recognized the worth of the program and are continuing with
it.
15. District Counselor (Additional Time). Because of the accentuated
problems in Inner City schools, it was even more important to have
competent, professional people who were able to make home calls and
counsel with target students and parents. Because of this, an
additional district counselor, was assigned to Memorial during the
1970-71 school year.
16. lnschool Resource Teacher. This resource teacher assisted all teachers
of ESEA Title I target students in the selection of materials, coordin-
ltion of workshops and inservice education.
17. Educable Mentally Retarded--Decertification Program. In the spring
of 1969, the Exceptional Child Services Department undertook to sur-
vey the ethnic composition of classes for the educable mentally re-
tarded in grades 3, 6 and 9. An effort then was made to reduce to
a more normal distribution the percentage of minority children in
these classes. Using evaluation reports prepared at the school site,
a central committee studied these reports and made recommendations
for decertification as educable mentally retarded fci children pre-
sently in r-rades 4, 7 and 10. It was recognized that assistant had
to be given to these children who were decertified until such time
261
4

as the student was able to function independently. This was accom-plished through th.a use of teacher assistants. In a "center school",teachers provided needed supportive instruction in addition to theinstruction in the regular classroom.
18. Educable Mentally Retarded Classes--Redeployment 4nto Regular Classrooms.This program attempted to provide opportunities for EMR students towork for a portion of the day in regular grade classrooms. For somestudents this ammounted to two or three hours per day. Teachers ofEMR classes provided instruction for small groups of children inbasic skills areas. Children floa: regular classes also participatedin an enrichment program taught by the teacher of the EMR classroom.Children sere selected for participation in the program by a committeeof teachers. Evaluation of the progress of each child was also di-rected by this committee.
J.). Education Professions Development Act (EPDA)--Inservice Training Program.During the second year of the project, this year-round inservicetraining program involved the principals and ten teachers each fromBalboa and Knox elementary schools and San Diego High. The focus wason improving instructional methods, human relations and communityrelations. The program included similar training for paraprofessionalsand auxiliary personnel from each of these schools.
20. Educationally Handicapped Classes for Children Previousl IdentifiedAs Educable Mentally Retarded Experimental . In this experimentalprogram, children previously identified as ed-cable mentally retardedwere decertified by a central committee after receiving evaluationsfrom the school. The purpose of the educationally handicapped classeswas to provide remedial instruction which may have been caused by alanguage deficiency problem. From this program, children then weremoved into regular classrooms.
219 Elementary Counselor. Under the direction of the principal, theelementary counselor assumes responsibility for the pupil personnelservices at the school. Assistance is given to the pupils, parentsand teachers in helping pupils make better use of the educationalexperience and in providing counseling and direction that improve thepupils' relationships to the school. Pilot projects in four ele-mentary schools are very positive in the evaluation of the counselor'sservices.
22. 'English As a Second Language. In these classes, children whose nativelanguage is other than English, were given systematic instruction inlearning to understand and speak English. The class organizat.onvaried from a total self-contained situation to various types of pull-out programs where children from regular classrooms worked with theESL teacher.
23. English As a Second Language--Redeployment Kindergarten. This programwas different from other English As a Second Language Classes in thatchildren with little or no English language facility were pulled to-gether for 120 minutes of kindergarten instruction each day. Develop-ment of traditional kindergarten concepts were handled in both Englishand Spanish along with concentrated instruction in English languagedevelopment. The rest of the daily time allotment was scheduled inthe regular kindergarten classrooms.
262

24. English As a Second Language Traveling Teachers. Three teaching posi-tions as well as three teaching aides were financed by the district.Each traveling teacher had a number of schools within a given area toservice. Working with small groups of children, the teacher providedinstruction in English. Each ESL teacher also made appropriateparent-school contacts to the non-English-speaking fami' s.
25. Enrichment Class. Pupils were selected for this class on_the'basis ofachievement and potential according to the judgment of teachers, notstandardized tests. The program consisted of curriculum similar tothat used in district gifted classes and enrichment classes.
26. Ethnic Studies Conference (October 2-5, 1969). Held at Gilman HotSprings, sponsored by the Foreign Tolley Association in conjunctionwith the city schools. The purpose of the workshop was to exploreproblems related to Black and Chicano students.
Those attending included staff members from Lincoln and San DiegoHigh Schools, central office, Foreign Policy Association personnel,district social studies resource teachers and students from both highschools.
27. Ethno-Cultural ,vents and Activities. The Netzea Dance Troupe, 23dancer-musicians from the Coapa preparatory school in Mexico City,performed for the project schools in February, 1969, sponsored bythe County.
1968-69. Musical concerts by Black and Chicano artists - -The Rita MossTrio, Mariachis, Travelers, Bruce Davis quintet, and the Contemporary-suartet--all professional groups, performed on a rotating schedule forall project schools in February, 1969. Parent Advisory Councils pro-vided part of the funding. Over one-half of the funding was madepossible through generous grant from the American Federation ofMusicians, Local 325.
'01969-70. Many activities were offered during 1969-70 which involvedour minority students :2s either active participants or interestedviewers. Some of these included the Mexican-American Youth Conferencein September, an Umoja dance, field trips to the Museum of Man to viewa display on Mexico. There were Culture Fairs, assemblies, talentshows, dances and displays.
Black students also had special activities including assemblies, artshows featuring the work of Black artis ts, visits from Black mayorsof the U.S. and special events to commemorate special birthdays im-portant to Black students.
28. Equipment. It has become more and more difficult for the district toinclude funds in the budget for items of equipment. It is importantto provide a concentration of effort for disadvantaged studentsthrough enrichment, individualized instruction, and experimentationwith new and promising equipment and often in greater quantitiesthan district formula allow. Slide viewers, reading and pacingmachines, duplicating equipment, projectors of all kinds, musicalinstruments, listening posts, language masters, bookcases, welding
263

equipment, swing sets, cameras and dozens of other items have beenmade available through Inner City basic and Parent Advisory Council.funds.
29. Field Trips. Field trips paid for by district funds have been severelycurtailed during recent years. Field trips are particularly valuableto students who live in disadvantaged areas. It is fortunate, there-fore, that nearly 3151000 of Inner City and Senate Bill 28 funds wereavailable during the 1968-69 school year to support field trips forstudents in the Inner City schools. Trips have been taken to a widevariety c..f places including the Superior Court, San Onafre NuclearStation, the snow, tide pools, Inner City Art Show at the MissionValley Center, and City Council meetings.
30. Follett LAnguage Program. Sevenprogram during the 1970-71 year.pupils from all grades 1-6. Thedevelopment. The series was notwas being considered.
teachers used the Follett instructionThe classrooms involved includedemphasis was upon oral languagein general use in the district but
31. Follow-Through Program. Ac Crockett and Lerman elemmtary schools.The Snn Diego program has been in operation since September, 1967.-4_ndergarten: 300 minutes, 9:00-2:00 single session; other grades
thin normal district allotments. The curriculum is basic districtwith variations based on small group instruction. Among the goals:
- To enable children from areas of poverty to develop and maintain
learaing skills commensurate with grade-level expectations.- To encourage parental understanding of the role of the school.- To provide health services.
- To raise the level of aspiration of pupils and parents.
32. Girls' Drill Team. Under teacher leadership, a drill team composedof about forty sixth grade girls was organized at Logan ElementarySchool. The team practiced after school hours and has given manyexhibitions of their routines at various schools throughout the dis-trict.
33. Human Relations Workshop. As a part of the inservice education programfor teachers within the Inner City Project, a problem-solving trainingsituation was contracted for with an ethnically integrated managementconsulting firm. Approximately 130 teachers participated in thetraining program held at four times during April and May, 1969, eachworkshop lasting two days. An outcome of the workshops was the de-sirnation of a task force to identify and give priority to identifiedproblems. One outcome of the task force was a preorientation programfor teachers new to the Inner City Project schools. Evaluations ofthe human relations workshop and the preorientation for new teachershave been positive.
In addition, San Diego High School conducted a Summer (1970) Workshopcentered around its own unique problems. Proposals were made to the
264
school as a whole and the group continued to function during the 1971year, involving students, teachers and parents.
34. Instructional Concepts Program. Using a program developed by theSouthwest Regional Laboratory for Educational Research and Development,
young children learned standard English names of concepts that are
important to success in school. The 99 concepts included in the pro-
gram covered dimensions of 'color, size, shape, amounts, position,
equivalence and conjunction. The desired learning outcomes were
classified as concept identification and concept naming. Kindergarten
classes in a number of ESEk schools were involved in the program.Evaluation by the Laboratory disclosed that Inner City children learnmost of the program's concepts.
35. Instructional Supplies and Curriculum Materials. All Inner City schools
received a full portion of district funds for instructional supplies
and materials. Inner City funds provided sizable amounts of additionalfunds to the schools in the project for t1--e same items. During 1968-
69 and 1969-70, over Z34,000 was available from the basic Inner City
funds for this use. During the same period the seven schools havemore than 4171,000 available from Inner City Parent Advisory Council
funds that was used for supplies, books, audio-visual materials, and
other instructional items.
36. Language Power Program. This program was designed to provide a highlyconcentrated, oral, language-centered instructional environment forall pupils and to assist them to function as literate, and well adjusted.Through a carefully nlanned program the teaching staff attempted toimprove the language facility of children, the pupil's self-image,school attitudes to4ard learning, and over-all performance in academicareas.
37. Leadership Development Committee. This was a series of meetings in-
stigated Iv the district superintendent to discuss major problems facedby administrators of disadvantaged area schools and to study possible
solutions to these problems. Principals of 14 elementary and secondary
schools were on the committee.
38. Lunch Program- -Free. With the advent of the reduced cost lunch program
in March, 1969, many parents as well as Parent Advisory Councils, recog-nized the fact that many children would not participate in the lunchprogram even at the reduced price. Funds were provided by Parent Ad-visory Councils to be used in a discretionary manner at the school siteto make it possible for needy children to receive a lunch.
39. Lunch Program--Reduced Cost. Using funds from the Department of Agri-culture, a reduced cost lunch program provided a Type A lunch at a
price of 220. Participation in this program increased dramatically.Parents identified nutrition as a critical nroblem for many of thesechildren.
40. Math and Music Progitm--Grade 3. Children in each of the thirst grade
classes at Logan school were divided into two groups for instrv:tionin math and music. One-half of all these pupils met with one teacher
and two aides for instruction in music. T..e other half remained with
their regular teachers for math instruction.
265

41. Miller Math Program. This project supplied supporting funds to scho,1districts to employ persons well trained in mathematics, usually grad-uate students. Each class in the program received instruction inalgebra and coordinate geometry from a math specialist for 40 minutesper day, four times per week. Because algebra and geometry areprograms considered to be high in status, children described aseconomically disadvantaged were provided instruction in these areasas one means of improving the self-image as well as the developmentof higher mathematical skills.
42. Minority Study Program--Black and Chicano Studies. These courses ofstudy were developed by the district and were taught at the seventhand tenth grades as electives. The central objective of the courseswas to present to two ethnic groups in the historical context of theUnited States from the viewpoint of the minority person. The studiesemphasized the contributions made by members of these ethnic groupsin the development of the country. Those courses were offered atMemorial Junior High and San Diego High schools.
43. Monthly Exchange Visits--Burbank and De Anza Schools. In this project,careful planning between staffs and parents preceeded the actual im-plementation of this program of ethnic integration. Approximately60 children from each school in grades one and two were ir ,olved in anexchange of classrooms during the school year 1968-69. Eight differentexchanges occurred among children who were transported by bus fromtheir home to school and to the exchange school. As a part of theprogram, lunch was provided for ea(n child involved. Faculties fromthe two schools also held joint mcetings to discuss the program. Thisproject was financed entirely by the Parent Advisory Council at Btuz .
bank school.
44. Motivational Advisor. This was either a full-time or part-time posi-tion devoted to counselimg minority students at Memorial Junior Highand San Diego High schools. The intent was to improve achievementand raise goals. The program provided for both individual and groupstudent contacts as a means of arriving a* significant concerns andalternative decisions to student centerea problems. The high schoolprogram also utilized the services of minority students from SanDiego State College who identified easily with high school studentsof the same ethnic background.
43. Multimedia Center. The conversion of the an Diego library into amedia center began in the summer of 1970 with minor structural changesand a weeding process taking place in both textbooks and in thelibrary book collection. The charging desk and attached counterswere removed to the opposite side of the library, thereby opening upthe stacks to student use. Locked doors were removed from the cupboardshousing magazines and making them visible to students. Two microfilmreaders and a university microfilm collection of periodicals pertainingto racial unrest were added to the collection. A college view machinewas made available for student use. Textbooks were checked out directlyto the student from the textbook room which was open five hours a dayfor student convenience. A paperback collection was added for cir-culation as the quickest and least expensive way to update the bookcollection.
266

4b, Nongraded Primary Classes. First and second grade pupils were rede-ployed according to achiever.ent. McGraw Hill programmed reading materials,enrichment math units and lan6uage programs were used in languagesituations. Parents attendd a plannin:; session with teachers onFriday afternoons and assisted wjth the program during the week.
47. Nongraded Program. Pupils in grades 4, C. and 6 parti- ,ated. Thestaff had departmentalized in math and social studies and the studentswere grouped accord.ng to a hievement level. Components of this pro-gram were two reading labs, a language lab, and a library in whichlibrary skills were taught. The labs and the library were maintainedby teachers.
48. Nova Protect. San Diego participated in the Nova Project, a cooperativeeffort between San Diego State College and San Diego _igh School todevelop a more well-reounded program in the preparation of secondaryschool teachers. Emphasis was or the team approach with joint, planningby faculty and :Audents, flexibi7Ity in the use of time, content andmethods, varied car: intensive field experiences, and -a continuityrunning tirot.-h the fall and spring semester of 1970-71.
49. Open *ouse--Tager City. Approximately 160 guest attended nn omen houseon SuLday, December 17,, 1968, fr(111 1:30-4:30 p.m., at the projectoffice on National Avenue. The guests represented the Parent AdvisoryCouncils of the schools, the Pro;..ect Advisory Board, community groupsand individu:,1s, and school personnel. The event was filmed for TV8 ness nnd shown .:hat evening.
During the second year of the project, second open house was held onSunday, April ";, 1970, at the Logan school auditorium. The event wassponsored by the Project Advisory Board and the seven Parent AdvisoryCouncils. It featured demonstrations by students and teachers ofinnovations in teaching. A4-tractive booths displays arranged by eachschool illustrated the accomplishrents of the parent councils. Over300 parents, students and school personnel attended this highly suc-cessful progra TV 8 News showed highlights of the program the sameevening. A t%..fd year open house (similar to those of the first andsecond year) was held on May 2, 1971.
50. Orange Ju4-:e Program. The Logan Schoo.L Parent Advisory Council ex-pressed concern for the need for r'orning nourishment at school. Inconsultation with the school nurse, the council allocated funds for anorange juice program to begin the second semester (February-June, 1969).An average 650 one-pint cartons were consumed daily. Participationwas voluntary, and the juice aas free to any child requestin it.The juice was obtained at cost, for about onehalf he retail price.Parent reaction to the program was favorable, as was teacher reaction.It was generally agreed that the program was not onlj a positive moralefactor but also a definite contribution toward nutri.tional health.
51. Orientation for New Teachers kSetember 3-4, 196 and Septebmer1970). Sixty teacrers, new to the district and or new to Inner CityProject schools, received a two-day orientation each year. Activities
267

included talks qnd djscussions related to ethnic minorities and ex-planations of the Inner City Project. Participants had an opportunityto become acquainted with the community leaders and agencies. Parti-cipants gave strong approval to the worth of the orientation meetings.The group also took a bus tour of the project area.
52. Parent Advisory Councils. The involement of parents and communityis a vital component of the project. To this and, a parent advisorycouncil (PAC) was formed at each participating school. Forty-nineparents served on these councils during 1968-69 and 1969-70 with 50serving during 1 third year of the project. Councils were nominatedand elected by i_rents to serve one-year terms, with re-electionpermitted. Members were paid 410 for attending a monthly meeting.Members were not permitted to be employees of the city schools. Councilshelp plan, im..ement and evaluate school programs. They also controlledthe expenditure of P4C funds which were allotted to the schools on thebasis of about 325 per student enrolled in 1968-69 and, due to a budgetcut, about 314 per student last year. Councils ranged from five tonine members (depending on school population) and reflected an ethnicbalance.
53. Parent Counselors (Community Counselors). Regular certificated teacherswere assigned on a full-time basis to develop school programs thatfostered parent-teacher-school contacts. Information regarding theschool curriculum, classroom programming and assistance to parentsand students with school-related problems were areas of service forthe parent counselor. School personnel evaluated this limited pro-gram very positively.
54. Participation in Sixth Grade School Camp Program. Total participationin the school camp program is very rare in many of the economicallydisadvantaged schoc',:. Recognizing the value of the school camp pro-gram, one Parent Ac ry Council provided funds to many children whootherwise would no d this experience. As a result, thelargest number in the hiss -dry of the school were able to take partin the school camp experience.
55. Performing Artists. In this program funded in part by the localMusicians Union, emphasis was placed on providing cultural experiencesthat employed ethnic minorities within the performing groups, both asa means of improving the self-concept of children and also to provideprograms that are relevant to the real world. Subjective evaluationby the performers, school personnel and students indicated a strongpositive responc..
56. Physical Education Consultant. A full-time physical education consul-tant was assigned to work with teachers in the Inner City elementaryschools. His services helped to keep teachers up to date on currenttrends in elementary education. He also served as a resource personand consultant, provided demonstrations for teachers, and helped themdevelop effective programs.
57. Pilot Project--Social. Studies. One teacher at Lowell Elementary Schoolconducted a pilot program in Ecology for pupils in grades 4, 5 and 6.
268

r.
58. Playground Equipment. To better utilize the blacktop play area of
ogan Elementary School, the Parents Advisory Committee purchased
a basketball Foal installed by the district, for use on the blacktop.
Due to the limited ground space and playground equipment at Crockett
Elementary School, the Parents Advisory Committee purchased two
additional sandboxes, and one set of primary swings giving more
children safe places of play.
59. Prekindergarten Programs (AB 1331). A planned sequential program of
activities for economically disadvantaged children, the present pre-
kindergarten classes developed after the first Headstart programs in
1966. Using additional adult personnel, greater individual attention
was provided to children. Health and nutritional support along with
a high degree of parent participation, cultural enrichment and lan-
guage development were a part of the prekindergarten program.
60. Prekindergarten Programs (Inner City Project). The two classes funded
by the Inner City Project are basically the same as those funded under
AB 1331. Exceptions are found in:
1. economic level is not a condition for enrollment;
2. health and nutritional services are not provided;
3. cultural enrichment activities are not as rich;
4. instruction in English as a Second Language is offered.
Results ..jter two years indicate than, this is a desirable program for
all children regardless of economic level.
61. Programmed Reading Materials. The introduction of programmed reading
materials into the reading program was a result of teachers' needs
to provide sequentially developed materials and to individualize in-
struction for children. Two programs were in use:
1. remedial materials designed to teach decoding skills to
children in grades 3, 4, 5 and 6 using phonics and linguistics
as the program basis;
2. a developmental reading program that teaches decoding skills
to beginning readers in grades 1, 2 and 3. Again phonics
and linguistics are the basis for the program.
62. l'roject Advisory Board (Inner City_Project). A multi-ethnic Project
Advisory Board helped to coordinate the work cr the seven parent ad-
visory councils. The board was made up of representatives from each
of the school councils, numering 12. In addition, five members-at-
large have represented community groups: Chicano Federation, Black
community, Central Labor Council, Urban Coalition, and Neighbor-
hood House. In 1970-71 a representative from Model Cities joined
the board for the first time, bringing its membership up to a total
of 18. The board elected its own officers. Members received '310 per
monthly meeting. Among other functions of the board:
- Making recommendations to the director.
- Evaluating the project.
- Submitting the application for renewal of the project.
- Expenditure of unencumbered funds.
269

63. Project Eng?ish. One phase of the San Diego High School Summer Work-shop was the development of plans for and method of implementation ofan experimental English project this fall. A team of teachers assistedby teacher assistants developed a program involving 600 10th, 11thand 12th grade students. The students were selected at random, andincluded an ethnic balance paralleling the school, and also an achieve-ment distribution involving students below grade, at grade, and thosemeeting standards for accelerated classes in the same proportion asthe school. This experiment will involve the use of large grouplectures, small Froun discussions, small group activities, as well asindividual instruction. The course has been desi!med to allow for moreflexibility in course con'ent to meet individual needs.
64. Psycholo-,ist ('lditional Time). It is imnortant that individual testscores be as accurate as possible and that retesting be done regularly.To help -tudents with r language problem, a full-time additionalMexic-n-',merican, biliAgual psychologist was maid for by the iralerCity l'roj,,ct and asaipned to Memorial Junior High. The 1-arent Advi-sory Council at Logan designated 4:3,000 to be used to employ a part-time Negro psychologist to retest Negro students who had previouslytested and classified as mentally re,arded.
b5. Rend it Home Project. Through Title I funds, target stuaents ntMemo:il were offered a "Read at Home" project. Target student ,
parents and teachers work together to establish a home library withbooks provided by Title I funds. Increased emphasis was placed onthe parents' role in rending.
(6. Reading Center (3:-;,';', Title I). Three classrooms located nt Sherm-rnElement.,ry :school provided intensive remedial rending progrnms forstudents in grades 4, 5 and 6. Pupils were selt,ct ..d for attendanceafter screening tLrough the Baker Diagnostic Reading Clinic eachsummer.
67. Reading Demonstrntion Program (fB Memori-L has completed afourth year of a five -phase rending demonstration program 1:nown bymany as the senate Bill 2? program. State funding; consists of:>?00,000 per year.
68. Rending Eye Camera Testing. A group of 125 students from the RendingDemonstration Yroject classes at Memorial used the camera for adetiilm study of fundamental reading skills by photographing eyemovements.
This on-going study was conducted by Tersonnel from the EducationalDevelopment Center of the University of San Diego. Results indicatethat the reading training in the Center is developing some highlyefficient readers.
69. Redeployment Reading Program. In this experimental reading program,additional instrucAon time was used in conjunction with readinggroups based on achievement. Groups were formed using the totalgrade level enrollment. Achievement groups in reading reduced thespan of achievement levels within a group. A number of schools usedthis anpronch Pt grades 2, 3, 4, 5 and 6.
270

70. seduction in Tracing. San Diego is nn ethnically balanced high
school. The estblishment of many tracks in ncndemic courses, however,
tended to egregnte minority students. In 1969, the number of tracksat the tenTh grade wore reduced, and Inner City funds p-:id the salaries
of severn2 teachers who helped to give inr'ividunl attention to students
who were moves. from slow growls into standard -roues. This program
was extended into the eleventh grade with some success.
71. Rete ink- of leading. This program offered n varied arpronch to
read.: to: for children in grades and 3 who were retarded in their
aeliovement. The instruction focused on the primry childwho had not acnuired the w ,rd recognition and com-rehension skills
which were essa-tial for normal development in reading. Classes were
limited to 10 children with n daily instructional period of 40
minutes in addition to the regular reading progrnm. Additional time
was funded through the use of Inner City Project funds.
72. Rockefeller Counseling, Fro jest. The program was des:Fned for and about
persons en-aged in the counseling function. The development of the"counseling team" was stressed and how it will be able to addressitself more effectively to the needs of the individual student.San Diego High had one administrator and 8 counselors participating inthe four seminars held throughout the year.
73. School image and Communication Committee. This committee was formedat San Diego High School for the purpose of increasing communicationand understandi.ng between the school and the community. Many Inner
City students were involved.
74, Teacher-Student-Community Workshops. A series of Saturday workshops
finlnced by the Inner City Project were held in order to consider anew orgnninntion and program for learning at San Diego High School
for 1971-7;). The staff in concert with the community and studentsmade recommendations for change that resulted in more effective
lenrninF and increased relevancy.
75. Sewinr Class. Using the talents of a teacher assistant, an afterschool class was organized at Logan School for part of the 1969-70
school year to hel- ulper grade girls learn sewing s!dlls. This
ns an outcome of grooming discussions involving the assistant and
older girls nt the school.
76. Spnish Instruction for Teachers. As the result of expressed teacherneed, after school classes were set up at Sax. Diego 'sigh, MemorialJunior High, and Lowell to tech Spanish to teachers who had Spanish-speaking students in their classes. Enrollment was about 50 duringthe first two years, and teachers' requests to continue the classes
indicate their worth. Costs for these classes have been covered byboth district and Inner City funds.
77. Speech Therapist (Additioma Time). Concerned with speech patterns
and their relationship to vocational success, a Parent AdvisoryCouncil established a pr ram to teach standard English to speakerswhose English would by considered non-standard. Care was given so as
not to downgrade the speech pattern and/or self-concept of the child,
271

but rather to indicate that other speech patterns need to be learnedin order to function successfully in the school domain and later invocational and professional programs. Funds were provided to provideadditional speech therapist time to the rhool. The teacher involvedhappened to he quite knowledgeable in this area, and was able to pro-vide an on-going program for a small group of children.
78. Swimming 'Programs - Instructionol and Recreational. For the thirdyear, Memorial Junior High provided swimming instruction for itsstudents during rym classes in pools adjacent to the school. SanDiego High provided seventh period and after-school swimming instructionfor students at the YMCA.
79. Teacher Lssistants. Teacher assistants are college students employedon a part-time basis to rrovide help for teachers. They were moreextsnsively in the secondary schools. Inner City funds paid fornearly V+7,000 worth of such services in 1968-69 and 137,000 wasspent for the same service last year. Teachers generally report thatthe assistance is very valuable, and it is one of the bonusesavid lble in a greater degree to teachers in the Inner City schools.
80. Teacher Development Program - Social Studies. Social studies teachersat San Diego High cooperat,d with teacher training instructors at SanDiego State College in a planned sequence of experiences to developteachers to work in Inner City schools. The college students didtheir pre-cadet and cadet work at the high school while takingspecially designed college courses in social studies the were care-fully coordinated with the high school classes.
81. Telebinocular and litmus Vision Testing. These two pieces of equipment,purchased oy Inner City Project funds, have been very valuable in pro-viding rapid, precise measurements of how well the eyes perform andidentifying visual defects. Four hundred eight 7th graders were testedin the spring of 1970, and 79 defects were discovered. Already thisyear, 25 defects have been found in the 300 tested.
82. Track Team. At Logan School, in an extension of the school day,teachers ond aides provided coaching and practice in track and fieldevents during the spring semesters. This was in preparation forpupil participation in city and county track meets, the Junior Olym-pics and the La Jolla Youth Inc. Invitational Track Meet. The trackteam was snonsored and supported by the school's parent council.
83. Trailer Rental. Additional personnel at Burbank School created pro-blems of space. As a means of alleviating the nroblem, the rentnl ofa mobile unit (office trailer) from a private leasing agent providedspace for numerous small group and conference-type meetings. Re-teaching of reading, speech therapist and district counselor were in-cluded in this use.
84. Training Program for Instructional and Community aides. This programwas confined to instructional aides and community aides working inthe Inner City Project elementary schools. With the hiring of many
272
0

people from the community to work directly in the schools, it becamenecessary to plan and provide a type of training program to giveskills and knowledpc. lagarding the educational program. Two means wereused. A two-day workshop was organized and operated by teachers fromProject schools. Later, an experienced aide from one school was hiredto work directly with the Inner City Project staff to organize nn on-going training program. As a result, a 15 week program was developed.All trainin7 occurred at the Project schools during the school day.
85. Tutoring Proo-rams. Originated two years ago in one school, a tutoringproject by the Faculty Dames of San Diego State College servicedthree schools. In many instances, these tutors had special skillsdue to their own professional training.
In addition, students from Saint Augustine High School provided tutoringservice nt the secondary level. Tutors have also been provided bythe Smith College Slumnae Association and members of the MedicalAuxiliary.
Ninth grade tutors at Yemorial Junior High were assistants in the,g 'c'ievement Center program durinr the second semester 1969-70
and the 1970-71 school year.
86. Vocation-1 - Pacific Telephone Coreer Orientntion Irocram.This prop-ram concentrated on approximately thirty students in businesseducation courses r,t the high school level per year. Consecutiveweek meetings were devoted to orientation, job opnortunities, facilities,on-site tours, specific individual job contact and involvement inmock job interviews.
87. Work-Study program. There is a continuing emphasis on involving min-ority r,ollege students as teacher assistants and in peer counselingsitua'.ions. In 1969 a contract was developed between the Inner CityProject and :;an Diego State College so that three Chicano and threeB1-,ck college students were assigned by arrangement with the Eny,o be student moti7ational counselors at San Diego High. The programwas continued in 1969 on an expanded basis and through a districtcontract with the Work-Study 1-rogram under which the college paid?5 percent of the costs and the Inner City Project 25 percent.
273

vs
Appendix j
End -of -Year Questionnaires and Interview Questions
274
I
I
I
I
I
I
I
1
1
1
i
4

SAN DIEGO CITY SCHOOLSTesting Services DepartmentINNER CITY EVALUATION UNIT
SECCNDARY TEACHER'S QUESTIONNAIRE
Dear Staff Member:
Attached is a short questionnaire covering the basic components of the
Inner City Project. You will notice that only questions directly concernedwith this particular project have been included. Would you please take
time to give us your .. 'nhibited response to the questions asked?
Since we already have your opinion of particular activity effectiveness,all Lhat remains is your global assessment of project worth. As was the
case with the activitiy checklist mailed to you earlier, we do not want
you to sign your name. Simply check your role within the school.
Thank you for your assistance.
a.
Michael LaBayProgram Evaluator
Approved:
George V. Hal,Associate SukrintendentOperation of Schools
ML:cn10/29/70
275

Please indicate your role within the school..
O.
it
it
administrator
,
counsellor
.
classroom teacher
auxiliary teacher
teacher assistant
other: please identify position
276
Oc

1. In your professional opinion, has the 3-year Inner City ProjeCt,in-creased the level of school - patent- community involvement over whatit was during the 1967-68 school year?
Please comment:.
no'
2. Do you feel that your students have received adequate motivational,personal, educational and career counseling this year?
Please comments '
yes
yes
'es
yes
' no ,Motivational
no Personal
Educational
no Career
3. Has the Irsper city Project helped you to better define the educationaland personal problems that students have brought into your classroom?
.yes
Please comment:
no
r.
411 II he wVIIMN N. mom ,
O
277
140
VI

4. In your opinion, has the Inner City Project Staffprovided servicesthat were of bphefit to you in working with your Inner City pupils?
.
The Inner City Projec+ Staff provided Necessaryservices when needed.
The, Inner City Project Staff failed to providethe services asked.
I have nct asked for services and, thus, cannot-answer the question.
5. If another schoOl system represeiltative sought your help'as an .educational cOnsultapt, and irthis school system was interested informulating parent advisory councils-similar to, those of our sch6o10what, would be the best advice you could give?' ,
011111111010,
Please mail the completed form in the self-addreSsed envelope to:
William H. VoglerDirector of Testing ServicesEducation Center4100 Normal StreetSan Diego, California 92103

1:
O
a
1\\
SAN DIEGO CITY SCHOOLS". Testing Services DepartmentINNER CITY EVALUATION UNIT
Parent Questionnaire
t
De:8.r Parent:
W© are interested in having your opinidno of the work yo, schools ard..doingand how it affects your child.' WoUld you please take a few minutes to checkthebox under. each of the followillg questions that comes closest to the way you feel?We would be most grateful for any other comments you wish to make on,the enclosedsheet. Please return both sheets in the encloqed'addressed envelope.
Thank you.
1. Are you satisfied that your child is receivingithe individual attention heneeds frOm the 'school? 4
Yes I no
04
2. Are you satisfied with the progress you.: child is making through school?
yes ,1 I no
3. Are you satisfied that the school is doing its charyour child for the future?
1 1yes no
helping prepare
4. Are4ou satisfied with the way your child feels about school?
1 Iyes
5. Are you satisfied with the welcome you receive when. you visit thd school?
no
tf,
A
yes
6. Are you satisfied that your school is doing the job it should be ilellg?
I yes . no
7. Are you satisfied with the amount of information you receive from the school?
yes
Please use the reverse side of this sheet for a additional comments.
Thank you
279
4

Eatiroado? padres de familia:
Estamos interesados en tenor su opinion acerca del trabajo quo nuestras escuelasestgn llevando a-cabo y de la manero como afpctan a su ,hijo.,Hagan el favor de
ar en el espacio debajo de cada pregunta la actitud que mas representa lo quo
pi sa usted. Les agradeceremos po oualquier otro comentario que usted quisiera
,pacer en la hoja papel incluida. Sfrvase regresar las dos hojas de papel,
Incluidas en el sobro que le enviamos.
47.
k
1. LEst6 Ud. satisfecho de que1.su hijo/hija haya recidido.la atenci6n personal
que el/ella necesita de su Sscuela?
sf
Iluchas gracias.'
II.
2. LEstg satisfecho Ud. con el progreso"escolar que su hijo/hija ha hecho? .
f----1 .f C I no,
, -----
3. LLe parete biers loque'la escuela ha contribuido a la educaci6n de su hijp/
hij en preparalo para,b1 futuro?e,
.
no
4. LQug opiniones le ha comunicado su hijo/hija acerca de 18, escuela y la clase
de trabajo quo hace?
I I no
57, LSe siente Ud. bienvenidg en l_escue1a cuando la visita?
Isf / no
/
6. LEs adacuada y bastante la informaci6n que.la escuela le comunica a Ud.?
I I no
7. LEsfg Ud. satisfecho con lo que viene haciendo la escuela para la edUcaci6n
de su hijo/hija?
no
.1
Por favor use el-otro lado de-este papel para mas explicaciOnas.
1 280
Muchas Gracias.
4..
1

I
SAN DIEGO CITY SCHOOLSTesting and Evaluation Services Department
INNER CITY EVALUA ION UNIT
Parent Advisory Council Questionnaire
Dear Council Member:
Attached is a short questionnaire covering the basic component- of thisyear's Inner'CitY Projec.6. Would you please'take five minutes to giveusyour views on the questions-asked? '
Since you represent all the parents of your school, it is important thatyou return the completed questionnaire to us. We do not want you toSign your name. Simply check your school at the\top'of the page.
Please return yoUr completed questionnaire in the enclosed, stampedenvelope to Testing and Evaluation Servicesay May 14, 1971.. Thank youfor your assistance. Your answer may be in English or Spanish..
Michael IaBayProgram Evaluator
Approved
Norman HweeDirector Inner City Pro e t
ML:cn
3/25/71
281Aro
9

INNEECCITY Ttamtu PlethENT'QUE;STiONNA.146
Please indicate your school.
Burbank 0 Crockett U Logan ElLowellE Sherman Memorial [-..j Si40- Diego
1. In your qpinion, has.the 3-year Inner City Project increased mutual understandingbetween the members of your community and the scho210
Please comment:
Oyes t .C1 no
VIN12. Do you feel that the children of your school have received adequate help in the
following ai.eas? yes. no
a. English'afs a:Second Language (ESL) Instructionb. Counseling,Servicet /c. Health and` lutritional.Services
t.Please comment:
p
q 0.
3. Has theinner City. Project: noYes. .
a. Helped you to know-yaw child better .4 . Ili - _._b. Helped you to Understand how your school operates --c. Help::tyour child to improve his grades in school ......-
d. Help, yon child to improve his attitude toward school. Ili r.t. . .
4. In your opinionl has the Inner City Pr:Oject Sthff provided the help necesirrforyou to properly allocate your PAC funds?
0 yeso.
Please comment:
EJ no .
oft 5. Overall, which of the folllwiuys the lvde.Word_to__40.n_dliscribing the instruc-tional program at your school:
N,
0 excellent IP good,
11I e P
Please comment: 1,,..--; .
fair . p001:'
,m111=1,08.I.Malia..1IIMINIJIM=1/ .Q "
6. If a group of parents in Los Angeles were interested in establisle.ng a Parent AdvisoryCouncil for their school, what do you think would be the best advice you could give?
\
IIIIllawl*MMIII.Mall, /1711
Thank you for your answers. Please mail the completed questionnaire in the enclosedstamped envelops by May 14, 1971..
aML:cn/25/71
I

ESCUELAS DE LA CIUDAD DE SAN DIEGODepartamento de Servicio de Pruehas y Evaluacign
UNIDAD DE EVALUACION DE INNER CITY
'Cuestionario del Consejo Consultivo de Padres de Familia
stimado Miembro del Consejo:
Adjuntamos un corto'cuestionario, que cubre lbacomponentes bgsicos delpresente ano del Proyecto Inner City. tTendrgpd. la amabilidad de. tomercinco minuios pare demos susiwntos de vista gn las Toreiuntaa'que se .>hacen? -
Como Ud. representa a todosimportante que nos devuelvafirme su nombre. Solamentepggina.
`1os.padres de familia de su escuela, 'es muy.el'cuesEionario ya completo. No queremoWquecheque sn'escuela,'en la*parte s!iperior de la
;
Pur favor, devuglvanos su cuestionario completo, en el sobre con estamp1.7lla adjunto, a la OficineTesting and Evaluation services"; pare M$*:- 14, ,'
1971. Gracias po su ayuda. Sus respuestaa pueden ser en Inglgs o enEspariql. /
Michael LaBayEvaluador del Programa
Aprobadc:
No an Houser
Directbk del Proyecto Inner City
ML:rm,3/25/7PA
4 I '

ti
CUESTIONARIO 1970-71 PARA LOS PADRES DE FAMILIADEL PRO ?ECTO INNER CITY. .
Por favar indique Su escuela.
EiBurbank El Crockett Logan EiLowell aSherin.an MeMariS1 ID San Diego
1. En su opini6n, ZHa aumentado el Proyecto Inner City, en estos tres alas, un entendiLmiento mutuo entre los miembras de su comunidad y las eseuelas?
Por favor comente:
! lno,
2. Oree Ud. que los ninos de su escuela han recibid) ayuda adeeeada en las siguientesareas? 71
si no -
a.
b.Instrucci6n de Ing1as como Segundo LenguajeServicio.de Consejeros
(ESL)r
c. ,Servicios de Salud y Nc-rici6n,
Por favor comente:
3. El ProyectoInner City ha:
a. Ayudado a Ud: a conocer' mejor a su hijob. Ayudado' a Ud. a entender camo opra su escuelac. Ayudado a su hijo a msjorar sus grados en la escuelad. Ayudado.a su hijo a.mejorar su actitud hackle su escuela
1
O si v no
-7"
En su opini6n, /Le ha proporcionado el Proyecto Inner City.la ayuda necesaria !aradistribuir propiamente los fondos de su PAC?
Por favor comente:
0110
5. Incluyendo todo, lCual de las siguicntes palabras es la mefor, para.deScribir el pro-grams de instrucciOn.de su escuela?
...
Dexcelente' EJ bUeno
.
.1 'Dregular 0 malo
. ,
Por favor comente:
6. Si un grupo de padres de familia en Los Angeld's, estuvieran interesados enestalecifun Consejo de Padres de Familia pare su escuela, L Cal cree 1.d. que serfael mejorconsejo queUd. pudiera darles?
w
1Oracles pot- sus remillestas. Por favorsnvfe por correo el cuestionario,completo, en el,sobre con estampilla adjuntO, para Mayo 14, 1971 284 ML:cn 3/2

'1
O
Int,erView Questions for Teachers197Q-77. Inner City. Project
I. How many years have you been assigned to this school,?
How many year have you been a teacher?
If more than one year:4
_,Have you noticed any changes'in.pupil attitudes within your school from-
-last year to,this year?
If yes:
11.
S
What do pu,think has caused this to happen?
I
1
. 4

1
'It i r
Page 2
O rr
2. In yotr estimation, how effective is the Parent AdvisoritCouncil trere att_ school with reference to:
. .
(a) providing inStiimpional supplies needed 'by the school.
.. `lb) providing auxiliary se'vices needed by the pupils.-
(c) assisting you to impletent innovative instruction. in the classroom.
(d) representing the cC3pmmity,in ratters directly related to the school
program. f ..t\I . .. '
-(e) other:
7or.
C.
C-+
3 In general, do you think thai parent participation is necessary for thesuccessful -.nstruction of Inh#r City- youngsters. (students)?
yes
AWhy do you feel this : .3.y?
...strit4rtIteste...ratIAS0010,
ddn' , know no
RP
..
286

I
Page34
A:
. .,:.
..
% .
- 4. Do you think.that having parents_ involved in school affairs has increasedtheir understanding of ybur.job-as a teacher? .'.
0 _..
. ,.
..
..
-
,:
o. .
....
Along these same'lines, has this involvement also htlpad.teacher to un-dersttlnd the needs of their pupils?
...
.
. , . .
t .
1
5. How would yo,.. describe the present attii.udes of your pupils toward scho ol?
O
\ I

O
pO
J
Page 4
6. Asa general conclusionl, how would you describe the relationship between;
Inner City.Project personnel, the community and-the sohools during this
past year? .
cti
7. One last item. If you could have complete freedom to change the way that
your pupils are taught or the way tl,at,parents have been involved at
school what would you do ?.

Table
-Co 7Z,12.EC-1-E -6123L.E.5, 011,6 7 5
.,.
. LIST OF TABLES'
Page
1. Listing of 'Activities Conducted During The,1968-69,, School Year,
8
2.' Enrichment and Auxiliary Services Provided by the1968-69 Inner City Project
9
3; Enrollment aid Ethnic Percenta'for 1969-79 Inner CitySchools . *** OOOO OOOO OOOOO 0 . . 11
.4.c.Enrollment and Ethnic. Percents for Inner City Schools(1969-1971)
20
5. District Pupil Ethnic Di6tributions, Preschool Through,Grade 12,1965-1970
21
6. Aid for Dependent Children (AFDC). Eleentary Pupil Conta(4anuary, 1970) 1 0
39
7. Juvenile Arrests, Innr City vs. Non-Inner City SchoolMeans During the Interval November 1970 through
/January, 1971... . . 9 - 40 .I
.
E ures
ooh Parent Advisory Council andProject I ructional Equipment/Materials Xpend
8. Elementa
from Septe ber, 1970 to May, 1971 ;42
Secondary Sch 1 Parent Advisory Council and Inner City ProjectInstructional.Equipment/Materials Expenditures fromSeptember, 1970 to May, 1971
-. . . 43
10: Log of Goal-Activity Definition 49
11. Testing Schedule for 1970-71 Inner City Project, 58
12. Paraprofessioal Staff Funded Under the 1970-71 Inner CityProject. l OOOO O ;a OOO " +4 60
.k13. Number of PO and PAB Members.in Attendance at 1969-70 and
1970-71 PAC and PAB Meetings . 64
14. Local Newspaper Overage of Inner City Activities fromSeptember, 1968 through May, 1971
- 66
15. Necessity of:Parent Involvement for.Successful Instructionof Inner City Youngsters, as Perceived by Inner CityClassroom Teachers.
67,
16. Worth of Parent Involvement'for Defining the Teacher's Role'in the Schools, as Perceived by Inner City ClassrooroTeachers
67
4.
vii

V.
Table Peee
17. Extent of School-Parent-Comalnity Involvement During the1970-71'School Year (comAred to_1967-68), as Perceivedby-Elementary School Personnel
18. Extent of School-Par t-Community.Involvement.DUring the ,
1970 -71 School Year (compared to 1967-68), as Perceivedby Secondary School Personnel. . . . . . 6
19. Inner City Project Need Priorities, as Perceived by 1970-71Parent Advisory Board Members (November, 1970) c /1\ 72
20. Degree of Satisfaction Expressed by Parents of ElementaryPupils Attending Inner City Zchobls in MEIY, 1971,,asMeasured by U.S. Mail.Questionnaire Returns 73
21.. Degree of Satisfaction Expressed.by ParentS of Seconali-y.-Pupils Attending Inner City Sahoolsin May, 1971,Measured by U.S. rail Quiptionnaire Returns.. . .. . . 74
22. Description of I.C.P. Personnel-School-Community Interaction
During the 1970-71 School Year, as Perceived by Inner CityClassroom Teachers 75
23. English as a Second Language (ESL) H-200 Test Scores "romInner City ESL Classes, November, 1970 and June, 1971. . . . 77
24. One Year Longitudinal Analysis of ESL Pupil English Reading' and Language Skills Acquisition. in Inner City ProjectSchools, as Defined by Their Respective Teachers 79
o 1
25. Grade Point Averages of Secondary Pupils in Social Studies,Mathematicst'and Science Classes in Inner City'and'District.minus Inner City Classrooms for the Second Semester; 1971. . 80
26. Effects of the 19 70-71 ESL/Bilingdal Program on Pupil Attitudeand Achievement,.as Perceived by Elementary School PersOnnelin Inner City Schools 82
ti
Comparison of Counseling Ratios, Selected Large SchoolSystems in the U.S. 84
28. Adequacy of Counseling Services in Inner City SecondarySchools, as Perceived by School Personnel 86
29. Perception of Inner City Projec in DefiningEducational and Persorial Student Problems, as'Exprepsedby'Inner City Elementary School Personnel 88
?,
30. Perception of Inner City Viojegt Helpfulness ih DefiningEducational and,Personal Student Problems, as Expressed,by Inner City Secondary Schobi Personnel 89
31. 1969-70 versus 1970-71 Excused ancrUnexcused Absences ofThird, Fourth, Fifth and kixth Grade Pupils Attending Their,
1
. . 4ective Schools for Wo Consecutive Yearts,.. .

Sr'
Table
.32:
Page
-70 versus 1970-71 Excused and _Unexcused Absences of-Gra e 8, 9, 11 and 12 PUDi:s, -Attending Their RespectiveSchools for Two Consecutive fears
33..'Longitf anal Survey of Total Excused and Total UnexcusedAbsenc-sof'Inner City Pupils Attending Their RespectiveSchools.forTwo Consecutive Yeats
-90
192
34. Longitudinal gurvey of FreqUency and Percent of Increased(4)5 5qpreased (L) and'Stable (0) Excused and Unexcused I
Absekce Rates of Inner City Elementary Pupils AttendingTheir Respective SChools for Two Consecutive Years . 94
35. Perceived Absence Rates of Elementary Pupils for,1970-71(-compared to 1969-70), as Expressed \by Inne'bityElementary School Pensorinel 98
..
36. *Extent rof Pupil Services Provided by.the Inner City ProjectStaff, as Perceived by Inc" 'City Elementarx SchoolPersonhel, 99 a
.t , , , ---..,
.
37. Extent of Pupil Services Provided by the Inner City Project ..
Staff, as Perceived by Inner City SeCondary ScWool.,Personnel' - 100I.
d
Descriptive Summary of Experience of Inner City TeachersIntervie4ed $
39. '.1dorth of Parent Involvement inPupil Needs, as Perceived byTeachers .... ... .
102
Assisting Teacherls to DefineInner City Classroom...... 1 . 103
40. gefinition of Pupil Attitudes Toward SchoollAs Perceivedby Inner City Classroom Teachers . . . . . . . 103
41. Effectiveness of Parent Advisory Counerilq, as iercejAred byClassroom Teachers From Inner City Schools- 105
42, 1970-71 Inner City Teacher Talk Data ..... . 106 ,
43. 1970-71 Innel; City Teacher Talk.Analysib 107
44. Statistical CharaCteristics of 1970-7 Cooperative Primary4chievement Test Results.in,Readingland.Mathematics forGrade One *Pupils at Burgank Elementary School 113
45. Statistical Characteristics oT 197,9,71 .Cooperativ4 Primari"Achievement-Test 4512',s in Reading and Mathematics for
!Qrade One Pupilseat Crockett Elementary School .114i
.4
46. Statistical Characteristics Of 1970-71 Cooperative PrimaryAchievement Test-Results in Reading and Mathematics for
. _Grade One Pupils at Lowell Elementary School . , . . . . 115 I
x
16

a
Page
47. Statistical Characteristics of 1970-71 Cooperative PrimaryAchievement Test Results in Reading and Mathematics forGrade One Pupil6 at Sherman Elementary School- 116
48. Longitudinal Survey of End-of-Year Reading and MathematicsAchievement of Second Grade Pupils .Enrolled at BurbankSpool for Two Consecutive Ye'ers, as Measured by theCooperative Primary Tests 117
V ,
49. Longitudinal Survey Of En -of-Year Reading and MathematicsAchi #ement of Second Gr de Pupils Enrolled .at,CrockettSchool for Two Consecuti e Years, as Measured by theCooperative Primary Tests 118
50. Longitudinal Survey of End-of -Year Re4 ading and lathematicsAchievement, of Second Grade Pupils Enrolled at L4rell Schoolfor Two Consecutive Year., as Measured by the Cooperative.Primary Tests
; ..,* 119.
,51. Longitudinal ,S'urveytf End-of-Year Reading and MathematicsAchievement of Second,Grade.Pupils. Enrolled at ShermanSchool for .TwoConsecutive,Years, as Measured by theCooperative ,Primary* Tests
. . 120
52. Longitudinal Survey o Reading Achievement of Third GradePupils Enrolled at gan School During 1970-71'and Burbank-Crockett Schbols in 1969-70, as Measured by the StanfordAchievement Tests
121
53. Longitudinal.Survey of Reading Achievement of Third GradePupils Enrolled at Lowell School for Two Consecutive Years,as Measured by the Stanford Achievement Tests 123
54. Longitudinal. of Reading Achievement of Third Grade .
Pupils Enrolled at Sherman School for Two Consecutive Years,as Measured b, he Stanford Achievement Tests 125
55. Longitudinal urvey of Mathematics Achievement of Third GradePupils Enr led at Logan School During 1970-71 and Burbank-Crockett chools in 1969-70, as Measured -by the StanfordAchievemeit Tests
127
56. Longitudinal Survey of M thematics Achievement of Third GradePupils Enrolled at'Loyell School for Two Consecutive Years,as_Meaaured by the Stanford Achievement Tests ,129
57. Longitudinal Survey of Mathematics Achievement of Third Grade,. Pupils Enrolled at Sherman School for Two Consecutive Years,
as Measured by the Stanford Achievement Tests 131
....

I
TablePage
58. Longitudinal Survey o Reading Achievement of Fourth-GradePupils. Enrolled at Logan School or 'Two Consecutiye Years,as Measured by e Stanford Achievement-Tests \133
59. Longitudinal Survey of Reading.Achievement of Fourth Grade'Pupils Enrolled at Lowell School for Two Consecutive Years,as Measured by:the Stanford Achievement Tests
60. Longitudinal Survey of Reading Achievement of Fourth GradePupils Enrolled at Sherman Schoolfor'Two Consecutive Years,as Measured by the Stanford Achievement Tests 137
. . 135
61. Longitudinal Sury r of Mathematics Achievement of FourthGrade Pupils Enrolled at Logan Schdol for Two Consecutive
. Years, as;Measured by the StanfOrd Achievement Tests . .139
62. Longitudinal Survey of Mathematics Achievement of FourthGrade Pupils Enrolled at Lowell School for Two ConsecutivevYears, as Measured, by the .Stanford Achievement Tests . ;. 141
63.- Longitudinal Survey of Mathematics Achievement ofgFourthGrade Pupil's, Enrolled at%ShermanrSchool for Two Cor. ecutive'rears, as Measured' by the.Stanfdrd Achievement Tests . . 143
Longitudinal Survey of Mathematics Achievement of FifthGrade Pupils Enrolled at Logan School forlTwo ConsecutiveYears, as Measured by th tanford and CTBS Tests... . . 1.45
65. -Longitudinal Survey of Mathematics Achievement of Fifth GradePupils Enrolled at Sherman School for Two ConsecutiveYears, as Measured by the Stanford and CTBS Tests 146
66. Longitudinal SurveyGrade Pupils EnYears, as Measure
67. Longitudinal Sur.yeyGrade Pupils EhrolYears, a.: Measured
. 64.
ofMathematics Achievement of tht Lowell School, for Two Consecutivee Stanford and CTBS Tests. . 147
ding Achievement of Fifthtat Logan School for Two Consecutive
byithe Stanford and CTBS Tests 148
68. Longitudinal Survey of Reading Achievement of FifthGrade Pupils Enrolled at Lowell School' for TwoConsecu veYears, as Measured by the Stanford and GTBS Tests J 149'
69. Longitudinal Survey of Re4ing Achievepent of Fifth.Grade/Pupils Enrolled at Sherman School for Two ConsecutiveYears, as Measured by the Stanford and CTBS Tests 150
70. Statistical Characterist s of 1970-71 Comprehensive Tests ofBasic Skills Scores Rea 2, Language, and MathematicsAchievement for (Ixt4 axadTPUpils Enrolled at Lowell'School for Two onsecutive Years 151
xi i

p
Table Page
71. Statistical Characteristics of 1970771 Comprehensive Testsof Basic Skills Scores in Reading, Language, and Math-ematics Achievement for Sixth Grade Pupils Enrolled at
.Logan School for Two Consecutive Years 152
72. Statistical Characteristics of 1970-71 Comprehensive Testsof Basic Skills Scores in Reading; Language, and Math-'ematics Achievement for Sixth Grade Pu ils Enrolled atSherman School for Two Consecutive Year 153
73. Statistical Characteristics of Eighth Grade eading Achieve-ment, as Measured by the CTBSReading\pubte is 154
4., Statistical Characteristics of Eighth Grae Reading Achieve-. ment, as Measured by the CTBS MathematicS\Subtests 155
75. CTBS, Arithmetic Computation Current, .Retardation Reduc-/' tion and DesiredProfiles November, 1970 156
76. CT Vooabulary Current, RetardPtion Reduction and DesiredP ofilesApril, 1971 . . 1.
77. SI Reading Comprehension Current, Retardaticn Reductionand Desired.Profiles November, 1970.
78. Statistical Characteristics of ITED Scores of Grade TO. Pupils for Two Consecutive Years
79. Statistical Characteristics.of ITED Scores of Grate 12upils for Two Consecutive Years . . . . ... ... 160
0
158
159
c
9

f ;
r
4
e
5992 AINNTER CITY
1
An overall summary Of results follows:
Grade one:. Tables 44, 45, 46 and 47 indicate that pupils rank favorablywith their peers across the nation in reading achievement at Crockettand Sherman but below at Burbank and Lowell and are below expectationsin mathematics achievement at Burbank and Crockett. Coefficient of skew-
ness figures indicate a shift in. distribution from negative to popitixeL-,skewness (more pupils With extreme high, scores than eAtreme low scores)at most schools in reading, and mixed skewness patterns in Mathematics.
Grade two;, Tables 48, 49, 50 and 51 indicate relative stability in read-ing and mathematics achievemefft for most pupils. ,Such-levels are beloW .
national norms. Exception is at Sherman school where pupils are notice-ably ,improving in reading and mathematics.,pd approximate national norm
levels. Pupils at the other schools arefalling behind their national,peers and, on the average, gain seven months. achievement for ten months
of instruction.
Grade three: Tables 52, 53, 54, 55, 56 and 57 indicate that (1) wordmeaning-scores declined relative to national norms in-two of thr e schools
and academic growth (as measured in G.L.E.), in word meaning was s bstan-'daily greater in 1969-70 than in 1970-71 within all schools, (2) thesepupils also fell further behind their peers-in the norming samples from1969-70 to 1970-71 in'tests designed to measure their ability to compre-:hend paragraph content, (3) arithmetic computation and concept scores:also remained the same,or declined in percentile rank; except for LowellwHIch maintained its 1969-70 higher achievement (4:rine 197041, (4) over-all, third grade test scores indicate that less academic growth occurredin 1970-71 than in 1969-70 in reading and mathematics forthe majorityof Inner City youngsters. Final 1970-71 scores-Adicate that these pupilsare substantially below national norm groups except'at Lowell in Concepts:
Grade four; Tables 58, 59, 60, 61, 62 and 63 ,indicate that Npils generallymaintained or slightly improved their October, 1969'.rank in May 11'71, butchanges were not significant except at Sherman (Q3) (gain) and Logan (Q3)
,(loss). '(2 here was general stabi,Ity in mathematics achievement for
the majori pupils from 1969-70 to 1970-71. The achievement scores
during th o years (with the exception of Loliell) were substantially'below nat averages. Logan (Q3.) showed a lops in Computation; Lowell(Q3) a loss in ComiUtation with a gain at Md, 0, Q3 in Concepts; Sherman(Q3) showed a gain in Computation and Concepts.
Grade five; Available test scores prese:Ited in Tables §4, 65, 66, 67, 68and 69 indicate increasing achievnt levels in reading and mathematicswith this achievement being still below national'norm. Such increases wereapproximate or exceeded the number of months instruction given to the pupilsfrom 10/69 to 10/70 with Logan, Lowell, and Sherman significantly exceedingthe number of months instruction Q3 in Concepts; and exceeding in Computa-tion, At other points these schools approximated or.exceeded the elapsed timein Computation and Concepts. Parallel gains were noted at most of thesepoints in reading - significantly at Lowell and Sherman in Comprehension.
112 -

.
Table 44
Statistical Characteristics of 1970-71 Cooperative Primary Achievement
Test Results in Readinand Mathematics for Grade One pUpils at
Burbank Elementary School
Mean
Median
Q1
Q3
s.
n. sk**
Reading Achievement
Pretest*
Raw
Grade
%ile
Raw
Score
'Ecuiv.
Rank.
Score
Posttest'
---.
Grade
uiv.
%ile
Rank
Raw
Score
Mathemtics Achievement
Pretest"
.Posttest
Grade
%ile
Raw
Grade
Ecuiv.
Rank
Score
Ecuiv.
%iie
Rank
12.42
13:80
6.25
17.54
.6.44
95
-0.67.
1.2
1.3
1.0
1:5
5
11 1
25
20.37
18.73
16.71
22.62
5.16
9.5 0.63
1.7
1.6
1.5
1,8
-
30
19 51
22.08
21.29
.. 17.42
26.56
8.21
95 (1,31
1.2.
1.1
1,0
1.3
9 '2 1
20
3.60
,...
32.42
26.69
"38.5%
7.48
0.07
1.6
i.6
1.3
2.1
34.
34
20 68
.
*Pretest = CaTerative Primary 12B Administered January, 1971.
Posttest = Cooperative Primary 12A Administered May, 1971.
Pretest derived scores (grade equiv. and %ile ray
upon Spring norms.
Sk=.Coeffidient of skewness'= [(Q3 - Q 2
)(Q2
Q1)
/(0
-411)/1 using raw scores.
For a symmetrical
"3-
distribution.Sk=0.00.
Positive S1 indicates positive skewness.
Positive skewness, in turn, indicates that
the number of extreme
high achievement scores is greater thank the number of extreme low achievement scores.
V.
7
4

.
Table 45
'
Statistical Characteristics of 197Q-71 Cooperative Primary Achievement
Test Results in Reading and Mathematics for cirade One .Pupils at
Crockett Elementary School.
Reading Achievement
Pretest*
Raw
Grade
Score
Equiv.
%ile
-Rank
Posttest*
Raw
Grade
Score
Equiv.
%ile
Rauk
Mean
35.66
1.5
25
25. l''
2.9
Go
Median
16.40
1.5,
25
.230(0
1.8
51
Q1
12.79
1.2
.
5'17.61
1.5
.o
25'
03
38.42
1.6
25
31.81
2.?
82
s.
4.73
n.
79
Sk**
-0.57
.79 0.
37
)
/a'
Mathematics Achievemqnt
c
Grade
.,
.
Raw
el
:
Rats
Grade
%ile
Pretest
Posttest
%ile
.
Score'
Eallix.
Score
nILiy..
Alank'.
24.09
1.5
:9
32.5
71.6
340
-,4.00
-1.3
j 9
32.5
1.6
.11
18.47
1.0 4
227.69
1.3
20
27.81
1.3
20
37,92:
2,0 ..,
4-
57
7.?3
7.50
'
79-
,79
-0.3
7. ''
:.
0.o.
*Pretest ...= Cooperative 6mary 12B administered January-,°1971.
,
Posttest = Cooperative Primary 12A administered Hay, 1971.
'etest derived rlt-;ores (grare'equiv. and %ile rant)
upon
normS.
Sk
=)efficient of skewfiess =
(Q
-Q
2)- (Q2- Q1B
/(0
-Q
1)/2
Jusing raw scores. 'For a symmetrical
3.
2'3
a--
distribution Sk=0.00.
Positive Sk
indicates positive skewness.
Positive skewness, in turn, indicates that
the number of extreme
high achievement scores is greater than. the number of extreme low achievement scores.
a
A
4
As
clf

. V
Table 46
.Statistical Chardcteristics of 1970-71 Cooperative Primary Achievement
Test Results in Reading and MathematicS for Grade-One Pupils at'
Lowell Elementary School
Reading Achievement
11.,.
.11.
`Mathematics Achievement
Pretest*
Posttest*
Pretest
Posttest '
Raw
Grade
%ile
Raw
Grade
%lie
Raw
Grade
%ild
Raw
Grade
Mae
Score
Ecuiv.
Rank
Score
Eouiv.
Rank
Score
Equiv.
.Rank
Score
&milt.
Rank
,....
Mean
11.85
1.2'
520.39
1.7
35
19.42
1.0
237.62
2.0
"-57
Median
13.83
.3
11
,2-.50
1.7
:35
17.83
1.0
.2
37.50
2.0
57
Qi
7.00
1.0
27.88
1.5
25
13.00
1.0
.1
34.00
1.7
42
Q16.66
1.5
25
22.25
1.8
44
25.33
1.3
9/E3.25
2x..5
81
3
s.
5.59
4.18
7.95
5.88
n.
26
26
26
26
Sk**
-0.83
.0.52
0.43.
0.49
*Pretest = Cooperative Primary 123 administered January, 1971.
.1
Posttest = Cooperative Primary 12A administered May, 1971.
Pretest derived scores (grrde
quiv. and %ile r k)
upon
ncrms.
Sk Coefficient of skewness =
(Q
Q ) - (Q
Q.)" /
(Q
Q)/2 Wsing raw scores.
For
symmetrical
22
3distribution Sk=0.00.
Positi
Sk
indicates positive Skewness.
Positive skewness, in turn,' indicates that
the number of extreme high schi
ement scores is greater than the number of extreme low achievement, scores.
--
aT

able 47
:Statistical Characteristics of 19
-71 Cooperative Primary Achievement
Test ReS:u16 in Reading and Ma hematics for Grade One Pupils 'at
Sherman Elementary School
Reading Achievement
Pret6st*
,
lPosttest*
Raw
Grade
?Ile
Rap ----Grade
Score
Equiv.
Rank
Score
Equiv.
%ile
Rank
* 21.49
1.8
44
27.7
62.0 c
72
Median
19.17
1.
44
24.25
1.8
55
Q1
14.42
1.3
11
18.81
i.6
30
Q3
28.60
2.1
79
37.33
90
s.
10.46
10.39
n.
90
90
4.
0.66
0.83
Mathematics Achievement
:
Pretest
'Raw
Grade
%I.'
Score
Eouiv.
Rk
,-17
28.93
1.4
20
27.28
1.3:
.20
21.42
1.1
-.4
2
36.00
1:8
42
9.84
0.39
Posttest.
Raw
Grade
Score
lEnuir.
.
%lie,
Rank
3k.63
1.8
.'-
42
1
35.33
1.8.
42
26.33
1.3
20
42.20
2.3
.1
.83.
9.44
-0.0n
*Pretest = Cooperative Primary 12B administered January, 1971.
Posttest
= Cooperative Primary 12A Administered May, 1971.
rS = Coeffioient pf skewness =
(00a7
Q )' - (Q
- 04...)..j
111(Q
- Q W2 using raw score's.
`Far 4 symmetrical
'Pretest derived scores (grEde.pquiv. and %Ile rank) eased upon !Trine norms.
k2
21-
31
distribution sk=0.00.
Positive Sk
indicates positive skewness.
Positive skewness, in turn, indicates that.
the mimber of extreme
high achievement score:,: is treater thin the number of extreme low achieveMent scores.

Table 48
Longitudinal Survey of End-of-Year Reading and athematics Achievement of
Second Geode Pupils Enroll Id at Burbank School for Two Consecutive Years, as
)
Measured by
Cooperative Primary Tests.
-_f
Reading Achievement:
4-=
. 1970
1971
Raw
:Grade
%Ile' -
Raw-
Grade
°Voile
Score
Emily.
Rank
Score
Eouiv.
Rank
Mean
21.45
1.7
39
20.66
2.2
29
Median
20.62
1.7
39
19.88
2.1
25
Q1
17.'':
1.5
19
16.1
1.7
12
24.08
1.8
55
24.25
2.5
4o
Q3
;.
5.77
5.86
It
n.
53
k48:
s0
53 0.16
Mathematics Achievement
1970
1971
Raw
Grade
'Voile
Raw,
Grade
;ale
Score
Equiv.
Rank
Score
Equiv.
Rank
34.43
1.7
42
,27..0
2.3
27
.27
29.56
1.4
20
2245 .
1.8
9
39.18
2.1
66
31.
249
.51
35.75.. 1.8
42
26.38
2.3
6.61
53
-0.57
6.87
53 0.2
*1970 reading and mathematics group scores obtained from May, 1970 testing using Cooperative-PrimiZTy 12-A.
1971 reading 'and mathematics group scores obtained from May, 1971 testing using Cooperative Primary 23-A.
ti
.0*

Table 49
Longitudinal Survey of End-of-Year'Reading and MathematicsAchievement of
.Second Grade Pupils Enrolledat CrOckett School for TwoConsecutive Years,qs
Measured by the Coo-i_srative,Primary Tests.
4
Reading Achievement
1970'
,1971'
Raw
Grade
%ile
Raw
Grade
%ile
.Score
Equiv.
Rank
Sc` or'
Fouiv.
Rank
Mean.
25.39. 1.8
51.
23.65
2.5
40
Median
21.50
1.8
44
21.25
2.2
.29
Qi
16.29
10
14
18.79
2.0
21
..
:27.75
2.9,
72
25.81
2.7
.48
Q3
.
s.
8;02
7.89
Aa
..63
'63
Sk.
9.18
0.60
-..
Mathematics Achievement
1970
Raw
Grade
%Ile
Raw
'Score
Equiv.
Rank
scor
-
33..27
1.6
34
27.51
32.38
1.5
,34
26.94
,28.45
1.3
20
22.65
38.75
2.1
68
30.11
1971
Grade
ETILL
:Ale
2.4
17)
2.3
27
1.9
,16
2.6-
40
)7.
204
6.43
634
,63
0.47
-0.3
0.
----
.;
.
*1570 reading and
mathematic;; group. scores
obtained fibm May, 1970 testingusing Cotprative Primary 12-
1971 readi ng and mathematigroup
scor 1 obthined from -May, 1571 testingusing Cooperative Prima* 23-.
:.,
.
.-
*.!
r *1
a.a,
\.
ti
%
J
a.
.a
4s
sla
a

H
Sy 'Table:, 50
Longitud4nal Su-vey of End-of-Year Reading jnd Mathematics Achievement of
Scow.- Gi
e Pupils Enrolled at Lowell School foe Two Consecutive Years, as
Measured by the Cooperative Primary Tests.
Mean
Median
Q2
Q. 3
Raw
Score
1970'
Grade
Eouiv.
19.23
1.r.,
18.00
1.5
15.88
1.4
21.75
1.8
Reading Achievement
Mathematics Achievement
.1971*
1970
Raw
Grade
Raw
%lie
Raw
Grade
%ile
=Rank
Score
Eauiv.
r:____;.;core
Equiv.
Rani,
Score
..30
21%88
2.3
32
34.96
1,8
42
27:35
34..50
1:8
26.50
25
23400
2.4
36
42
-
14
e--;e.e00
2.1
25
29.00
1.4
20
23.00
44
25.88
2.7
..
48
40.00
2.2
68
30.25
s.*
4.3
6.55
6.63
697
n.
26
.'-----"'"-----
26
26
26
8k -
0.56
-0.04
0.00
6.07
.-
-
00
1971
-.Grade
Equiv.
%ile
-Rank
2.3
27
2.3
27
1.9
16
2.6
40
*1970 reading.and mathematics group scores obtained from May,"1970 testing using Coope....tive Primary,12-A.
1971 reading-and mathematics groftp scores obtained from May, 1971 testing using Cooperative Primary 23-A.

10.
cfr
esa4
Table 51..
Longitudinal Survey of End-of-Year Readin
and Mathematics Achievement of.
Second Grade Pupils Enrolled at Sherman School forTwo Consecutive Years, as
Measured by the Cooperative Primary
Tests.
';
Reading Achievement
Mathematics Achievement
1970*
.1971*
1970
1971
Paw
Grade
Nile
Raw
Grade
%ile
Raw
Grade
%ile
Raw
Grade.
%ile
Score
Eouiv.
Rank
Score
Euiv.
Rank
Score
Equiv.
Rank
Score
. null.
Rank
--,--.
,...---
-...-
Mean
Median
Qi
Q3
s.
23.15
22.50
18.83
27.75
7.04
0
1.8
1.8
1.6
2.0
51
28.56
3.0
5636
.23
1.8
142
: 30.78
2.8
.51
51
26,58
2.7
48
36.30
1.8
42
28.50
2.5
37
,
30
2b.06
2.1
.25
32.83
1.6
' 34
24.50
2.1
22
72
38.08
3.9
.82
40.50
2.3
77
38.50
3.6
80
11.12
.6427
N8.
93e
n.
60
-.6o
606o
Sk
0.35
0:60
'4:
r 19
0.86
*1970 reading and mathematicsgroup scores obtained frbm May, 1970 testing
using Cooperative Primary 12-A.
1971 reading and mathematics
group scores obtained from May, 1971 testing using
Cooperative Primary 23-A.
r-s
.

Table 52
nth.
.
Longitudinal Survey of Reading Achievement of Third Grade Pupils
Enrolled at Logan School During 1970-71 and Burbank-Crockett Schools irri969-70,
as Measured by the Stanford Achievement Tests*
Word Reading (Meaning)
1969-70
Raw
S'6ore.
Pretest
'
Grade
Equiv:
%ile
Rank
Raw
Score
Posttest
Grade
Equiv.
Mean
17.76
1.7
18
14.44
2.5
Median
16.80
1.6
11
14.13
2.5
Q1
13.42
1.4
%.
4'
10.22
1.9
Q3
21.15
1.8
26
17.56
2.8
s.
6.82
5.18
n.
59
59
Sk
-0.13
pile
Rank
24
24
-10
44
eord Meaning
1970-71
,Pretest
Raw
Grade
%ile
Raw
Score
Equiv.
Rank
Score
15.19
2.6
20
20.54
14.88
2.6
20
19.60
...s 10.63
2.0
816
.44
20.31
3.0
44
23,31
5.87
c-
-,
6.19
59
59
0.4
0.16
Posttest
Grade
Equiv.
%ile
Rank
3.1
.22
3.0
18
2.7
&
.3.5
30
*1969-70 pretest achievement scores based on Stanford Primary I (X) administeroi 10/69.
1969-70 posttest achievement scores based on Stanford Primary II (W) administered 5/70.
1970-71 pretest achievement Scores based on Stanford Primary.IL(W) administered 10/70.
1970-71 posttest achievement scores based on Stanford Primary II (X) administered 5/71.
CY
'

Table 52 (continued)
Paragraph Meaning
Paragraph /leaning
1969-70
.1970-71
'Pretest
Posttest
Pretest
Posttest
Raw
Grade
%ile
Raw
Grade _-
%ile
Raw
Grade
Nile
Raw
Grade.
%ile
Score
Ehuiv.
Rank
Score.
EQUiV.-
Rank
Score
Equiv.
Rank
Score
Equiv.
Rank
.4.-----
Means.
." 16.03
.1.6
8A
21.14
2.2
18
22.75
:(
Median
13.40
1.6
820.25
2.1
16
23.33
10.47
14.38
*1.8
613.145
Q1.5
4i
Q3
18.92
1.7
16
26.31
2.5
30
29.56
d
2., 4
16
31.56
2.9
16
2.4
16
32.00
2.9
16
1.8
423.88
2.5
8
2.8.
32
38.13
3.2
28
s.
7.56
9.54
9.84'
11.09
.,
.,
n.
59
4'
59.
59-
sk
0.61
0.03
-0.44
59
-0.28
*1969-70 preteit achievement scores based `on Stanford 'Primary
I (N)' L.airiiii-gt'eTed-10/6.94.
1969-70 posttest achievement scores bAsedpn Stanford Primary II(W) administered 5/70.
1970-71 pretest uchievement scores based on_Stanford Primary II -(1.) administered10/70.
1970-71 posttes
achievement scores based on Stanford Primary II ();) administefed 5/71.
%

3.
is
1
Table '53
,Longitudinal Survey of Reading Achievement of Third Grade
Pupils
Enrolled at Lowell School for Two Consecutive Years,
as Measured by the Stanford
Achievement 1'k...its*
Word Reading (Meaning)
Word Meaning
1969-70
1970-71
Protest
Posttest
.N.
Pretest
Posttest
Raw
Grade
%ile
Raw
Grade
'%ile
Raw
Grade
ale
Raw
Grade
%ile
Score
Equiv.
Rank
Score
Equiv,
Rank
Score,
Eguiv..
Rank
Score
Equiv.
Rank
Mean
17.24
1.6
11
16.46
2.7
38
12.56
2.3
12
17;40
2.7
8
Median
17.33
1.6
11
15.00
2.6
30
11.00
2.0
817.67
2.8
,'vl
14.25
1.5
8.
89.63
1.9
10
8,25'
1.8
412.75
2.3
41
.
19.88
1.7
18
20.08
3.0
56
16.25
2.7
26
22.25
3.3
-26
...)
Q3
s.
3.94
'8.02
A6.27
, 6.46
n.
,25
.° :23
25
,,
'25
Sk
-0.19
-0.05
'o.62
:0.07
*1969-70 pretest achievement
scores based on Stanford Primary I (X) administered 10/69.
1969-70 'posttest achievement
scores based on Stanford Primary II
administered 5/70.
1970-71 pretest achievement scores basedon tanford Primary II (W) administered 10/70.
1970-71 posttest achievement scores based
on Stanford Primary II:(X) administered 5/71.
0
O
0

c
Table 53 (continued)
Raw
Score
Pretest
Grade
Eauiv.
Paragraph Meanini,
1969-70
Posttest
%ile
Raw
Grade
Rank
Score
Eaulv.
%ile
Rank
Raw
Score
Paragraph Meanizig
1970-71
Pretest
Posttest
Grade
Raw
Grade
Eouiv.
nc
SCore
Eouiv.
93
%ile
Mean
12.48
1.5
..17.92
2.0
12
18.32
2.0
28.12
2.7
'12
Median
11.38
1.5
417.25
2.0
12
16.75
2.0
828.0o
2.7
12/
7.75
1.4
211.13
1.7
411.75
1.7
2-18.13
2.0
2
Q3
16.38
1.6
822.25
2.3
22
26.94
2.6
24'
37.25
3.2
28
s.
6.09
9.10
8.96
10.11
n.
,25
2525
25
Sk
i0.32
-0.20
0.68
Ito.o6
1969
-70
pretest achievement scores based on Stanford Primary I
X) administered 10/69:
1969
-70
posttest achievement scores based on Stalrford Primary II (W) administered 5/70.
1970-71
pretest achievement scores based on Stanford Pirmary II
(W)
administered 10/70.
1970471
posttest achievement scores based on Stanford Primary II
(X)
administered 5/71.

Table 54
Longitudinal Survey of"Reading Achievement o,J Third Grade Pupils
Enrolled at Sherman School for Two Consecutive Years, as Measumd by ,the Stanford
Achievement Tests*
c
'n
Word Reading (Meaning)
Word Meaning
,1970-71
Raw
Zoom
Pretest
Grade
Equiv.
1969-70
.1
.Posttest
%ile
Raw
Grade.
Rank
Score
Equiv.
%ile-
Rank
..c----
.4
.,Mean
17.45
1.6
11 L.
141:64
-2.6
30
a 0-
11
Median
16*.00
1.6
-11
!14.00
2,5
24
Q11.50
1.4
4.9.90
1.9
10
.
..
Q3
21.50
1.8
26
20.75
_3.1
60
s.
7.67
6.63
Pretest
Posttest
..
%ile
_____
Raw
Grade,
Ray/
Grade
%Ile
Score
Equiv.
Score
Equiv.
Rank
..
13.73
2.5
16
17.11
2.7
6
12:00
42.1
-10'
.17.50
2.8
11
8.50
1.8
.4
11.75
2.1
2
19.00
2.9
40
22.50
3.5
30
6.26'
6.72
n.
56
56
56
,.'
,56
.0.20
0.49
0.67
..
-0.14
Sk
.1.
o*1969-70 pretest achievement scores based on StanfoiaPrImary I (X).administered 10/69.
1969-70 posttest achievement scores based on Stanford Primary II (W) administered 5/70.
1970-71 pretest achievement scores based on Stanford Primary II COY administered 10/70.
1970-71 posttest achievement scores based on Stanford Primary II (X) aftinistered 5/71.

Table *54 (continued`)
.1.6
,4.
a:
`Raw
Score
Paragraph 1969-70
Pretest
Grade
%ile
Eauiv.
Rank
Meaning
Raw
Score
Posttest
Grade
Eouiv.
.1gil
Rank
Raw
Score
Paragraph Meaning
1972-71
Pretest
Grade
%ile
Raw
'Eouiv.
'flank
Score
Posttest
Grade
EouiN.
'%i1e
4
-Rank
.
(r)
Mean
15.04
1.6
821.86
,2.3'
19.96
10
28.30
,2.7.
Median
11.94
1.5
420.50
2.2
18,
16.00
1.9
6'
26.50
2.6
11
Q1
9:21
1.4
2:
1.9
10
10.83
1.7
218.50
.2.1
3
Q3
20.50
1.8
28
3030
2.9
50
27.00
2.6
21'
37.00
3.2
28
s.
8.73
9.89
11.43
11.91
n.
56
56
56
56
k1.03
0.50
0.72
0.27
*1969-70 pretest achievement scores based
on Stanford Pl-imarY I (X).administered 10/69.
1969 -70 posttest achievementscores based on Stanford Primary II (W) administered 5/70.
1970-71 pretest achievement scores based
on Stanford Primary tt (W) admiaitered 10/70.
1970-71'posttest achievement scores based
on Stanford Primary II (X) atiministered 5/71.

'able 55
Longitudinal Survey of Mathematics Achievement of Third Grade Pupils-
Enrolled at Logan School During 1970-71 and Burbank-Crockett
Schools in 1969 -70,
as Measured by the Stanford Achievement Tests.*
1969-70
Total Arithmetic
Computation
Concepts
Pretest
Posttest
Posttest
Raw
Grade
%ile
Raw
Grade
, %die
Raw
Score
Equiv.
Rank
Score
Eeuiv.
Rank
Score
-___-
Mean
31.90
1.7
23
18.98
2.7
36
13.14
Median
32.;5
1.7
23
18.67
'2.7
36
12.00
Qi
25.08
1.5
11
14.65
2.4
20
9.89
Q3
16.13
40.13
1.9
38
24.13
2.9
50
.s.
10.71
8.14
4.95
Grade
%Ile
Rank
-......-
2.4
20
2.3
16
1.9
8
2:6
32
U.
5.9-
59
59
sk
-0.04
0.30
0.65
*1969-22pretest achievement
scores based on Stanford Primary I (X) administered 10/69.
Note:
Only one score
1969=70 posttest achievement
scores based on Stanford Primary IT (V) administered 5/70.
is derivable from
this subter.t.
4$

Table 55 (continued)
t
1970-71
Computation
Pretest
Posttest
Raw
Grade
wile
Raw
Grade
%ile
Score
Equiv.
Rank
Score
Equiv.'
Rank.
mewl
38.22
diali
20.13
11.38
23.81
8.42
59
-0.82
s.
A. Sk
2.6
20
26.05.
3.0
14
2.7
24
26.75
3.0
14
1.9
421.88
2.7
6
2.9
38
32.63
3.6
32
8.91
59 ').19
Concepts
-Pzetest
IPosttest
Raw
Grade
%ile
Raw
Grade
"Zile
Score
Equi.
Rank
Score
Equiv.
Rank
13J7
2.4
?6
1*
12:55
'2.4
16
9.94
1.9
6
16.13
2.6
2
5.04
18.97
2.7
20
18.33
°2.7
20
1-:12:72
'2.3
6
24.25
3.2
34
'7.93
59
0.31
0.07
*1970-71 pretest achievement scores based of Stanford Primary II (W) administered 10/70.
1970-71 posttest achievement score's based on Stanford Primary II (X) administered 5/71.

1,
0Table 56
Longitudinal Survey of Mathematics Achievement of Third Grade Pupils
Enrolled at Lowell School for 'Two Consecutive Years, as Measure&by the Stanford.
Achievement Tests.*
1969
-70
Total Arithmetic
Pretest
Raw
Grade
Score
Eouiv.
ale.
Rank
Computation
Posttest
Raw
Grade
Score
Equiv.
%ile
Rank
Raw
Sdore
Concepts
Posttest
Grade
Eauiv.
%ile
Rank
Mean
34.16
1.7
23
21.32
2.8
44
16.36
2.6
32
Median
35.00
1.7
23
22.00
2.8
44
16.25
2.6
32
Q1
22.75
1.5
11
17.13
2.6
28
11.25
2.1
10
Q3
'42.75
2.0
44
26.42
3.0
56
.21.25
3.1
58
s.
n.
11.18
25
----------
7.97
-25
5.68
25
.4t
,
Sk
-0.45
-0.10
0.00
*1969-70 protest achievemdnt scores based on Stanford Primary I (X) administered 1Q/69.
Note:
Only one score
1
is derivable from
this subtext.
1969-70 posttest achievement scores based on'Stanford Primary II (W) administered 5/70.

ol#0
1.10
N...
4....
.1*.
p...,
,...,.
...1.
..r.e
.,,,r
ol...
....1
4.,,,
q,.,
.., ,,
,,,,n
,r
,,,,F
, . ,
,,,,,,
1,..
- ,,
... e
',./.
A
Table 56 (continued)
Computation
1970
-71
Pretest
Posttest
Raw
Grade
fo'ile
Raw
Grade
%ile
More
Eouiv.
Rank
Score
Equiv.." Rank
Mean
822.0.
2.9
-3
30.28
3.3
22
Median
21.25
2.8
32
30.75
3.4
i
24-
Q,
18.13
2.6
20
23,92
2.8
10
Q3
26.42
3.0
44
37.25
3.8
44
s.
6.65.
10.27
Poncept'S
Raw
Score
Pretest
Grade
Equiv.
wile
wile
Rank
Raw
Score
Posttest
. Grade
Eguiv.
;file
Rank
13.16
2.4
16
20.80
3.1
32
.12.6'
2.4
16
19.00
2.9
.26
9.25
1.7
412.92
2.4
8
15.88
2.6
24
28.25
4:1
56
5.53
8.29
.
n.
25
25
25
25
Sk
0.50
-0.05
-0.04
0.41
,
*1970-71 pretest achievement scores based on Stanford Primary II (W) administered 10/70.
1970-71 posttest achievement scores based on Stanford Primary II (X) administered 5/71.
Vet

1
Table 57
/ s4?
,a
.e
Longitudinal Survey. of Mathematics Achievement of Thix:d Grade Pupils
.
Enrollesi at Sherman School for Two Consecutive Years, as Measured'by the Stanford
Achievement Tests.*
0
Raw
cScorb
1969-70
Total Arithmetic
Computation
..Concepts
Mean
31.77
Median
-31.50
qi
26.00.
Q3
37.50
§.
8.40
n.
56
s009
k
Pretest
'rade
Eauiv.
mile
Rank
1.7
23
1.7
23
1..5
11
1.8
30
Posttest
..
.Posttest
Raw
Grade
%i le
Raw
Grade
%ile
Score
Equiv.
Rank
Score
Equiv.
Rank
r
19./5
2.7
36
14.52
2.6
32
18,50
2.7
36
13.17
2.4
20
1"
1
2.4
10.00
-14.50
2.
20
1.9
8
24.50
3.0
56
19.50
3.o
54
,
7.08.
5.91
56
56
o./ic
r\0.67
*1969-70 pretest achievement scores based on StanfOrd Primary I (X) administered 10/69.
Note:
Only one score
1969-70 posttest achievement scores based
on Stanford Primary II (W) administered 5/70.
is derivable fro
this subtast.

Table
A
0
a1970-71
Computation
\--...../
,
Pretest
Posttest
':Pretest
Raw
Raw
Grade
%.i.le
Raw .
Grade
?Zile
Grade
Score
Equiv
*Rank
Score
Eatja:
. Rank
Score
Equiv.
,P
.a
i
Mean
af.38
2.6
20
25.64
.3.0
i4
13.99
2.4.
41
..,-
edina
1$.1?/?.
6
.'r,*
i3.5O
2.3
321.83
2%8
s.
5.60
.20
27.50
3.1 "
16
11:79.
2.3
1,
.
M
11
20.75*
2.7
69.00
1.7
.
Q32
30.83
3.4
24
16.83
2.7
7.90
6'.23
,7.91
,.
n.
56"
'056
56
.
56
..
,
Concepts
,'-
;13.0
Rank
,-Posttest
Raw
.Grade
..(36ore
2!liv.,
%ile
Rank
i6
,
18.91
2.70
- ?0
12
18.00
2.7
20
4'12.50
2.3
6''
.
32
24 .56
3,3,
38
S-0.68
0.58
.6.17
..
*1970-71 pretestaebievement scores baed on Stanford Primary II 01) administered 10/70.
1970-71 pos,ttpst
c'llievement scoreslibased
on Stanford Primary II (X) administered 5/72-
a.
f
t..
. .v
,4.,
/L.
,'
is
.a
0
41.
.1'..
^.,..
..*,,,
..,..y
,...W
ve1.
....N
.,.

'Table 58
Longitudinal Survey tf Reading Achievement of Fourth Grade Pupils. Enrolled
at Logan School For Two Consecutive Years, as Measured by the Stanford Achievdment Tests
Word Meaninr*
Pretest
Raw
Grade
Score
Equiv.
1969-70
Posttest
;ale
Raw
Grade
Rank
Score
Equiv.
.%6.1e
Rank
Pretest
Raw
Grade
Score,
Equiv.
1970-71.
%ile
Rank
.
Raw
Score
Mean
14.28
2.5
16
18:28.
2:8
31
'9.0
23.
118
12.85
Meaian
13.17
2.3
12
17.83'
2.8'
11
.8.38
3.o
14
13.10
Q,
10
1.9
.6
'14.5o
2.5
45.75
2.7
88.50
Q3
-18.00
2.8
34
23.50
3.6
3632.00
3.5
30
16.70
s.
5,90
5.93
4.86
5.58
n.
60
60
60'
60
Sk
0.49.
0,52
(.32
1969 pretest scores obtained from Stanford Primary II (1) administered 10/69.
1970 posttest scores obtained from Stanford Primary II (X) administered 5/70.
1970 pretest scores obtained from Stanfcrd Intermediate
(W) a
listered 10/70.
1971 posttest scores obtained from Stanford Intermediate
(W)
dministered 5/71.
Posttest
Gltade
%ile
Equiv.
Rank
3.t.
16
3.6
16
'3.o
6
4.i
30
.

0
enable 58 (continued)
Paragraph Meaning*
RAw
Score
Pretest
Grade
pdaLa
1969-70.
' File
Raw
Rank
Score
Poshest
Gra D
Eouiv.
'ale
Rank
Raw
Score
Pretest
Grade
Equiv.
-
1970-71
'ale
Rank -
Raw
Score
Posttest
Grade
Eouiv.
5a)e
Rank
---
-Mean
22.20
2.3
14
29.92
2.8
14
15.75
2.8
12-
18.70
3.1
10
Median
Q1
18.50
-11.50
2.0
3.7s
:
8 2
29.10
20.00
2.7
2.2
12
15.00
10.83
2.8
2.4
12 5
17.33
)2.50
2.9
2.5
6 2ftv
,
23
31.5(7
2.9
36
39.25
3.3
32
20.83
3.4
28
23.50
3.8
22
s.
12.22
11.28
7.29
8.27
pi.
6o
6o
tl?60
6o
Sk
0,60
0.11
0.33
0.24.
*1969 pretest scores obtained from Stanford PrimaryU (W) administered 10/(
1970 posttest scores obtained fromStanford Primary II (X) administei"ed 5/?
1170 pretest scores.Qptained from StanfordInterMediate I (W) administered 10/70.
1991 posttest scores obtained from St4nford
Intermediate I (W) administered 5/71.
. Aa

tt
itp Table 59
Longitudinal Survey of Reading Achievement of Fourth Grade Pupils Enrolled
at Lowell School For Two Consecutive Years, as Measured by the Stanford Achievement Tests
:ord Meaning*
1969-70
1970-71
Raw
Score
Pretest
Grade
Eluiv.
%i/e
Rank
Raw
Score
Mean
15.6?
2.7
26
19.27
Median
15.81
2.7
26
19.43
.Q1
12.53
2.3
12
17.13
Q3
17.88
2.8
.34
22.08
Posttest-
Grade
"Simile
Eouiv.
Rank
2.9
14
2:9
14
2.7
8
3.3
26
Pretest
Raw
Grade
Score
E(uiv:
mile
Rank
Raw
Score
Posttest
Grade
Equiv.
%ile
Rank
9.21
3.1
18
13.48
3.6
16
8.38
3.0
14
14.00
3.7
20
5.92
2.7
89.06
3.1
--
8
11.42
3.3
26
16.25
3.9
26
8.
4.18
4.22
/4-.62.
4.58
n.
33
33
33
..- 33
Sk
r0.45
0.14
0.21
-0.75
*1969'xretest scores obtained from Stanford Primary II (W) administered 10/69.
1970 posttest scores obtaiAbd from Stanford Primary II (X) administered
5/0.
1970 pretest scores obtained from Stanford Intermediate I (W) administered
0/70.
1971 06.sttest scores obtalred from Stanford Intermediate I (W) administered 5/71.
f it

Table 59 (continued)
Paragraph Meaning*
1969-70
1970
-3.
Pretest
Posttest
Pretest
''N.,Posttest
Ia0
Grade
1..:.e
Raw
.Grade
%ile
Raw
Grade
%ile
Raw
'.Grade
%ile
-N
Score
Eouiv.
Rank
Score
Equiv.
RE,nk
Score
Equiv.
Rank
Score
Equiv.
Ran',:
Mean
23.48
2.4
16
.30.82
2.9
16
Median
25.33
2.5
20
31.33
2.9
16
Q1
16.13
1.9
623.92
2.5
8
Q3
30.88
2.9
;37.38
3.2
28
s.
8.65
8.67
.
-(--....-----
17.21
2.9
16
23.82
3.8
-16.75
2.9
16
23.25
3.7
12.31
2.5
.6
19.55
3.2
21.25
3.4
28
27.38
4.1
.6.27
6.01
n.
33
-33
33
-33--
----
Sk
-0.50
-0.20
0.00
0.11
22
20
12
30
*1969 pretest scores obtained from,Stanford Primary TI (W) administered 10/69.
1970 posttest scores obtained from'Stanford Primary II (X) administered 5/70.
1970 pretest scores- btained from Stanford InterMediate I (W) administered 10/70.
1971 posttest s
obtained from Stanford Intermediate I (W) administered 5/71.

1
Table 60
4
Longitudinal. Survey of Reading Achievement of Fourth
rade Pupils Enrolled
at Sherman School For Two Consecutive Years, as Measured b
Stanford Achievement Tests
Word Meaning*.
1969
-70
.1'170-71
Pretest
Posttest
F etest
Posttest
Raw
Grade
%ile
Raw ',
Grade
pile
Raw
Grade
%lie
.Raw
Grade
,
Score
Eouiv.
Rank
Score'
Equiv.
Rank
Score
Emily
Rank
Score
Eouiv.
Rank
Mean
12.76
2.3
12
16.47
2.7
Median
11.35
2.0
815.67
2.7.
Q,
9.96
1.9
612.13
2.1
Q_
"15.69
2.7
26
20.8a
3.1
s.
4.91
6.00
n.
49
49
49
Sk
.1.05
0.38
8 8 2
22
9.16
18
12.27
3.5
14-
8.43
-3.0'
.lip
11.33
3.3
X11
6.25
2.7
88.68
3.1
8-
11.88
3.5
30
14.25
3.7
20
4.82
5.11
49
0.45
0.10
*1969 pretest scores obtained from Stanford Primary II (I) administered 10/69.
1970 posttest scores obtained from Stanford Primary II' (X) administered 5/70.
1970 pretest
cores obtained from Stanford Intermediate I (W) administered 10/70.
1971 posttest scores obtained from Stanford Intermediate I (W) administered 5/71.
.1
(

4
Table 60 (continued)
Paragraph Meaning*
CO
Mean
Median
Q1
Q3
s.
n.
Sic
Raw
Score
Pretest
Grade
Equiv.
1969
-70
%ile
Raw
Rank
Score
Posttest
Grade
Equiv.
'ale
Rank
Raw
'`fie
Pretest
Grade.
Eouiv
,
.197
0-71
1
%ile
Raw
Rank
Score
Posttest
Grade
%ile
Rank
19.06
2.1
10
28.02
2.7
12
15.63
1.9
628.00
2.7
12
11.13
1.7,
219.75
2.2
4,
2';.25
2.5
20
35.25
3.1
23
e
10.21
10.40
49.
0.73
-0.13
17.47
17.00
12.58'
4 21.69
7.15
49, 0.06
2.9
16
---2"1-.1iil
3.4
14
2.9
16*
20.13
3.2
az
2.6
S -.
15.13
2.8
5-
3.6
32
26.88
4.1
.8.46
49 0.30
*1969 pretest scores
1970 posttest scores
1970 pretest scores
1971 posttest scores
obtained from Stanfor
`mart' II (W) administered 10/69.
obtdined from Stan
rd Primary II (X) administered 5/70.
obtained from St
ord Intermedie I (W) administered 10/70.
-obtained from Stanford Intermediate I (W) adMinistered 5/71.
407
"-
leit,40444004.4**A.444...,0.0106 VAJWIOWIlli.h.440.14.4.....141...M.I.bg

Table 61
Longitudinal Suryey of Mathematics Achievement of Fourth Grade PupilsEnrolhd
at Logan School For Two CoPsecutive Years, as Measured by the Stanford'Achievement Tests
Computation*
1969-70
1970-71'
.
Pretest
Posttest
Pretest
Posttest
Raw-
Grade
%ile
Raw
Grade
9Sile
Raw
Grade
M.le
Raw
Grade
%ile
Score
Eouiv.
Rank
Score
!nix:
Rank
Score
LE:211m.
Rank
Score
Equiv.
Rank
Mean
16.47
2.5
- ....._
,14
24.83
2.9
11
7.25
2.9
810.52
3.6
10
"AA
Median .16.50
2.5
14
24.67
2.9
11
6.67
2.9
810.30
3.5
8
ql
11.83
2.0
,6
17.00
2.4,
44.36
2.2
25.67
2.7
:2
Q3
21.25
2.8
32
33.75
3,L6
32
10.00.
3.5
22
13.83
3..9
18
s.
7.49
9.50
3.65
yi"
4.37
n.
6o
6o
6o
6o
sk
0.02
0.17
0.36
-0.
27,E
*1969 pretest scores obtained from Stanford primary II (W) administered 10/69.
1970 posttest scores
tained from Stanford Primary II (X) administered 5/70.
1970 pretest scores '..tained from Stanford Intermediate I (U) adMinistered10/70.
1971 posttest Scores bbtained from Stanford Intermediate I (U) administered
5/71.

Table 61 (continued)
1969
-70
Concepts*
Pretest
Posttest
Prefest
Posttest
Raw
Grade
%ile
Raw.
Grade
%ile
Raw
Grade
%ile
Raw
Grade
%ile
Score
Eouiv.
Rank
Score
Equiv.
Rank
Score
Equiv.
Rank
Score
Equiv.
Rank
Mean
12.70
2.4
16
1
Median
10.?5
1.9
6
01
8.13
1.6
2
17.02
2.6
14
7.98
2.7
14
9.32
3.0
18
.
14.75
2.5
10
7.33
2.5
.1'.1.0
8.50
3.0
10
10.83
2.1
35.88
2.3
65.83'
2.3
,2
Q3
15.25
2494.6
24
23.50
3.2
31f
9.70
3.3
26
11.25
3.6
18
s.
6.25
8.39
3.28
4.54
n.
60
60
60
.
.
.
60
.
Sk
0.81
0.75
.....-
o.48
0.03
*1969 pretest scores obtained from Stanford Primary II () administered 10/69..
1970 posttest scores obtained from Stanford Primary II (X) administered 5/70.
1970 pretest scores obtained from Stanford Intermediate I (W) administered 10/70.
1971 posttest scores obtained from Stanford Intermediate I (W) administered 5/71.
4,

.
Table 62
Longitudinal Survey of Mathematics Achievement of Fourth Grade Pupils Enrolled
at Lowell School For Two Consecutive Years, as Measured by the Stanford Achievement Tests
Computation*
1969
Raw
Score
.
Pretest
Grade
Equiv.
%ile
Rank
Raw
Score
Posttest
Grade
Equiv.
%ile
Rank
. -------
Mean
22.15
32'
33.00
3.6
,32
,2.8
....
Median
21.88
2.8
',32
35.00
3.7
40
Ql
18.55
2.7
'24
27.52
3.1
16
Q3
25.42
3.o
44
39.38
3.9
50
s.
4.72
io
9.41
Raw
Score
Pretest
Grade
Eauiv..
1970
-71
.%ile
Rank
s' Raw
Score
Postteist
Grade
Equiv.
%ile
Rank
9.85
3.5
22
15.15
4.0
20 '
9.27.
3.3
16
14.67
4.0
20
8.52
3.3
16
111.68
3.7
12
12.88
3.8
40
18.38
4.4
32
4.13
_5.98
n.
33
33
,,
33
.33
sk
40.06
-0.52
1.31
0.21
*1969 pretest scores obtained from Stanford Primary II (W) administered 10/69.
1970 posttest scores obtain6d'fromStanford Primary II (X) administered 5/70.
1970 pretest scores obtained, from Stanford Intermediate I (W) administered, 10/70.
1971 posttest scores ootained from Stanford Intermediate I (W) administered 5/71.

O
Table 62 (Continued)
4
1-1
Mean
Median
Q
3
Raw
Score
Pretest
Grade
uiv.
Equiv.
12.-06
12.00
8.63
15.38,
?.3
2.3
1.7
2.6
Concepts*
1969-70
1970-71
--
posttest
%lie
Raw
Grade
%iie
Raw
ouiv.
Rank
Rank
Score
EScore
12
12 4
24'
21.00.
2.9
26'
22.00
3.0
28
15:25
2.5
lo
25.88
3.4
42
10.06
110.88
7.92
12.65
k
Pretest
Grade
Equiv.
file
Rank
Raw
Score.
Posttest
Grade
Eql v.
%lie'
Rank
-----
3.3
26
13.70
.6
,,--42
3.6
74
..,
13,33
--10
32
,2.7
14
.58
3.0
-10
-4.3 .
54
18.25
5.'
64
s.4.
166.33.
3.77
5.37
n.
33
w33
33
33
sk
0.00
-0.54
-0.50
0.04
*1969 pretest scores obtained from Stanford Primary IZ (W) administered 10/69.
1970 posttest scores obtained from Stanford Primary II (X) administered 5/70.
19` pretest scores obtained from Stanford Intermediate I (W) administered 10/70. '
3971 posttest scores obtained from Stanford Interm%liate I (W) administered 5/71.
.

I
Table 63
Longitudinal Survey of Mathematics
Achievement of Fourth Grade Pupils Enrolled
at Sherman School for Two r-n-decutive
Years, as Measured by the Stanford
Achievement Testls
Computation*
Raw
Score
Pretest
Grade
Eouiv..
1969
-70
%ile
Rank
Raw
Score
Posttest
Grade
Equiv.
:idle
Rank
40
Raw
'
Score
Pretest
Grade
Ecuiv.
1970-71
Zile
Raw
Rank
Score
Posttest
.Grade
Equiv.
pile
Rank
.-,
Mean
14.92
2.4
1-
23.35
2.8
10
8.32
3.3
16
13.43
3.8
16Median
13.75
13.75
2,3
11
22.75
2.8
lo'
8.20
3.1
11
12.56
3.8
16
Qi
10.31
1.9
.4
16.63
2.4
45.38
2.5
49.06
3.3
-6
Q3
s.
19.75
6.57
2.7
/24
29.25
10.43
3.2
'20,
11.88
4.27
3.7
34
.75
5:56
4.4
32
n.
49
49
49
49
sk
0.54
0.06
0.26
0.39
*1969 pretest
scores obtained from Stanford Primary II ('1)
administered 10/69.
1970 posttest scores obtained
from Stanford Primary II (X)
administered 5/70.
1970 pretest scores obtained
from Stanford-Intermediate I (V)
administered 10/70.
1971 posttest scores obtained
from Stanford Intermediate I (V)
administered 5/71.
0.
71-

N
Table 63 (continued)
6 Pretest
Raw
Grade
Score
Enuiv.
1969-70
%ile
Rank
Mean
12.84
2.4
16
Median
11.00
2.1
8
Qi
9.15
1.7
4
Q3 -
15.42.
2.6
24
s.
5.27
.--,
n.
_49
'sk
0.82
1970
-71
Porvtest
46. Pretest
Posttest
Raw
Grade
%ile
Raw..., Grade
rile
Raw
Grade
%ile
Score
Equiv.
Rank
Scord
Ecuiv.
Rank
Score
Ecuiv.
Rank
--:..r---
17.45
2.6
14
7.92
2.7
15.33
2.5
10
7.20
2.5
11.31
2.1
34.95
2.2.
21.88
3.0
28
10.94
3.6
14
332
3.6
: 18
10
.9.00
'3.0
10
56.75
.2.5
4
34
013:38
4.3
32
8.29
4.35
-6.16'
49
49
49
0.48
0,50
o.64
.
*1969 pretest scores obtained from StanfordPrimary II ('d) administered 10/69.
1970 posttest scores obtained fromStanford PrimaryII (administered 5/70.
1970 pretest scores obtained from,Stanf
i Intermediate I (W) administered 10/70.
1971 posttest soores obtained from Stailford
Intermediate I (W) administered 5/71.

Table 64
Longitudinal Survey of Mathematics Achievement of Fifth Grade Pupils Enrolled.at
Logan School for Two Consecutive Years, as Measured by the Stanford and CTSS Tests
Computation*
1969-70
Computation*
1970
Pretest
Posttest
Pretest
Raw
Grade. %ile
Raw
Grade %ile Raw
Grade %ile
Score Eouiv. Rank
Score pcluiv. Rank
ScorepEcuiv. Rank
can
8.16 3.1
11
10.98 3.6
10
ledian
7.43 2.9
810.60 3.6
L 15.08 2.5
1,
8.75 3.3
13
10.75 3.6
28
13.31 3.8
L.
35.
1.43 0.34
k
;3.5
143 0.38
24.00 4.2
23
23
10
10.
24.U0 4.2
618.25 3.6
16
3.25.4.7
?.5?
43
-0.09
Concepts*
1969-70
S.
Concepts'
1970
Pretest
Posttest
Pretest
Raw
Grade %ile
Raw_ Grade .%ile
Raw
Grade %13e
Score Eluiv. Rink
Score Ecuiv. Rank
Score Equiv. Rank
7.12 2.5
10
8.63^3.0
]0
13.37 '3.8
25
7.20 2.5
10
8.08 2.7
612.75 3.8
25
5.38 2.2
5
37
9.31 3.0
22
2.89
43 0.15'
6.44 2.3
10.75 3.6
3.02
43 0.
48
29.08 3.0
10
18
16.63 4.7
41
5.08
43 AD:06
'19 9-70 Computation scores obtained frolhe Stanford Intermediate I (W) administered 10/69 and 5/70.
69-70 C,..ncepts scores obtained from the Stanford Intermediate'? (ti) administered 10/69 and 5/70.
1970 Co -utation and Concepts'scores obtained from the Comprehensive Tests of Basic Skills WO administered 10/70.
Note:
A Spring, 1971 posttest was not admirij.stered at grade
because there is presently no alternative form of the
PBS (II-) battery and the pupils -and er study are scheduled for identical testing in Fall, 1971.
9

Table 65
Longitudinal Survey of Mathematics Achievement of Fifth Grade Pupils
Enrollecrat
Sherman School for Two Consecutive years, as Measui-ed by
the Stanford and CTBS Tests
can
6.44 2.7
Med;lau
6.57 2.9
3.88 2.2
8.25 3.1
7.25
Computation*
1969-70
Computation*
1970
Pretest
Posttest
Pretest
Raw
Grade %ile
Raw
Grade %ile
Raw'
Grade %ile
Score Enay. Rank
Score Equiv. Rank
Score EQUiV. Rank
61T.76 3.7
.N12
19.,57 3.8
14
8 --
12.00 3.7
12
20.25 3.8
14
27.56 3.1
414.92 3.3
6
11
15.19 4.(-)
20
23.65 4.2
'23
,s.
4.47"
5.21
'-
n.
41
Sk
-0.46
.41
41
-0.33
-0.44'
Concepts*,
1.
roacepts*
1969-70
1970
Pretest
Posttest
*pretest
.4.
Raw
Grade -1%ile
Raw ,
Grade %ile
Raw
Grade %Ile
Score Enuiv. Rank Score Equiv. Pank
Score Equiv. Rank
-_,...._
6.78 2.5
to
X8.49 3.0
lo
.--
-
6.63 2;5
lo
,8.00 2..7
°'6
4.92 2.2'
56.56 2.5
1,4
.9.19,3.o
- 22
10.46 3.3.
12
..
2..52
.;5.13
41
...
01,40
0.52
'14.24 4.0
28
14.88 4.2, 4
11.25 3.4
17
16.47 4.;5
37
4.59
41
.
-0.78
*1969.70 Computation scores obtained from the Stanford Intermediatd I
(W) administer
:10/69 and 5/70.
1969-70 Concepts scores obtained from the Stanford Intermediate I'(.N) administered 1 /69 and 5/70.
'!
1970-Computation and-Concepts sores obtained from theComprehenaVe Tests of B6.sic Skills II (Q) administered 10/70.
.Note:
A Spring, 1971 posttest was not administered A grade 5
bebaU'se there
presently no blit ?rnative form of.the
CTBS (II) battery and the. pupils under study are 'scheduled for identical
testing. in Fail
-s
,,r, 6
.5cu
e ,,^
41.a
vh,
alb
4
r.
,14
alb

Tabin 66
Longitudinal Survey of Mathematics Achievement of Fifth CI:Ae Pupils Enrolled at
Lowell School for Two Consecutive Years, as Measured by the Stanfordand CTBS Tests
Computation*
1969-70,,
Computation
Concepts*
1970
1969-70
Pretest
Posttest
Pretest'
Raw
Grade %iie
Raw
Grade %ile
Raw
Grade rile
Score nuiv. Rank
Score Enuiv. Rank
Score Enuiv. Rank
Mean
11.69 3.7
34
16.27 4.1
24
28.38 4.6
34
Median 12.90 3.8
40
14.50 4.0
20
28.00 4.6
34
7.00 2.9
812.00 3.7
12
22.00 4.0
18
15.67 4.1
5o
21.75 49
50
36.00 5.4
65
5.03
6.98
7.76
26
26
26
-0.72
0.98
0.29
n.
Concepts*
1970
Pretest
Posttest
Pretest
Raw-
Grade %ile
Raw
Grad:
%ile
Raw
Grade
%.13e
Score Ecuiv. Rank
Score Foul
.Rank
Score Eemi v. Rank
8.56'3.0
22
12.6
4.3
32
15.65 4.5
37
8.90 3.0
22
le-i-83 3.6
18
15.00 4.,
32
6.00 2.3
68.00 2.7
611.0o 3.4
17
10.63 3.6
17.88 5.4
t64
20.67
61
3.37
5.58
5.49
26
26
26
0.51
0,85
0.
*1969-70 Computation scores obtainel from the Stanford Intermediate I (ii) administered 10/60 and 5/70.
1969-70 Concepts scores obtained from the Stanford Intermediate I (W) administered 10/69 aid 5/70.
1970 Computation and Concepts scores obtained frqm the Comprehensive Tests of Basic Skills II (Q) administere 10/70.
Note:
A Spring, 1971 posttest wns not administered at grade 5 because there is presently no alternative form of the
CTBS (II) battery and the pupils undersstudy are scheduled for identical testing,in Fall, 1971.
Po

Table C7
Longitudinal Survey of Reading Achievement of Fifth Grade Pupils Enrolled at--
Logan School for Two Consecutive Yearr, as Measured by the Stanford and CTBS Tests
Word Meaning*
1969-70
Pretest
Posttest
Raw
Grade %ile
Raw
Grade %ile
Score Equiv. Rank
Score Emily. Rank
an
11.33 3.3
26
14.5 3.7
20
ledAn 1l.88 3.5
3o
15.25 3.8
23
7.65 3.0
14
9.38 3.1
8
14.58 3.8
44
18.63 =1,6
42
5.08
5.99
.43
-0.44
43 -0.5
:
Vocabulary*
.Paragraph Meaning*
Comprehension*
1970
1969-70
1970
Pretest
Pretest
Posttest
Pretest
Raw
Grade %ile
Raw
Gmde %ile
Raw
Grade .%ile
Raw
Grade
%ile
Score Equiv. Rank
Score Emily-. Rank
Score Enuiv. Rank
Score Equiv. Rank
19.81 4.2
31
21.05 3.4
28
22.60,3.7
20,
19.44 3.7
26
20.75 4.3,
34
20.88 3.4
28
22.80 3.7
20
17.67 3.6
24
15.25 3.5
18
16.42 2-.
1'
15.25 2.8
513.19 2.9-tli
24.56 5.0
48
24.75 3.9
44
28.13 4.2
34
24.75 4.6
41
6.64
6.8o
8.33
3.95
$43
43
43
43
-0.36
-0.14
.-0.34
0.45
`Word Meaning scores obtained from the Stanford Intermediate I (4i) administered. as pretest 10/69 and posttest 5/70.
Vocabulary scores obtained from the Comprehensive Tests of Basic Skills II (Q) administered 10/70.
Paragraph-meaning scores obtained from the Stanford Int:....r,.eiiate I'M adminisered as pretest 10/69 and posttest 5/70.
`Comprehension scores obtained from the Comprehensive Tests of Basic Skills II (q) administered 10/70.
Note: A Spring. 1971 posttest was not administered at grade 5 because there is prebently no alternative form of the
CTBS (II) ba.tery anZi the plpils under study are scheduled'fOr identical testing in the Fall, 1971.
4

Table 68
Longitudinal Survey of Reading Achievement of Fifth Grade Pupils Enlolled at
Lowell School for Two Consecutive Years, as Measure&by the Stanford and CTI3S Tests
an
Word Meaning*
1969-70
Pretest
Posttest
Raw
Grade
9ale
Paw
Grldc
Score Eeuiv. Rank
Score E0diV. Rank
8.96'3.1
18
13.54 3.7
20
dian
8.5C) 3.1
18
32.50 3.6
--16
5.75 2.7
8
11.33 3.3
4.97
26 0.03
8.75 3.1
8
26
17.33 4.1
30
5.71.
26 0.25
Vocabulary*
1970
Pretest
Raw
Grade
56tle
Score Equiv. Rank
li8.73. 4.0
28
18.50e4.0
. 28
15.00 3.5
18
21.75 4.5
37
5.98
26
-0.07,
Paragraph Meaning*
1969-70.
.Pretest
'osttest
Raw
GrIlde ale Raw
Grade %iie
Score !:ouiv. Rank
Score Ecuiv. Rank
17.0
2.9
15.50 2.8
13.25 2.6
19.00 3.1
6.19
26 J.43
16
1? 8
22
22.04 3.6
21.50 3.6
75.88 2.8
27.00 4.1
8.16
26 -0.21
1970
Pretest
Raw
Grade
%ile
Score Equiv. Rank
18
L1.77 4.1
33
o 18
21.17 4.0
31
5,15.25 3.5
16
.30
2.6.004.7
7.30
26
-0.20
44
lore Meaning scores obtained from the Stanford Intermediate I (W) 'administered as
-,?test 10/69 and poefest 5/70.
rocaoulary scores obtained from the Comprehensive Tests of Basic skills II (Q) adr.
.istered 10/70.
'aragraPh meaning scores obtained from the .Stanford Intermediate I(W) administered as pretest 10/69 and posttest 5/70.
:omprehension scores, obtained from the ComINehenrave Tents of Basic Skills II'(Q) administered 10/70.
cote:
A Spring, 1971 posttest was not admidistered at grade 5 because there is presently no alternative form ofthe
CTBS (II) battery and the pupils under study are Scheduled for identical testing in the Fall, 1971.

Table 69
Longitudinal Survey of Reading Achievement of Fifth
-ade Pupils Enrolled at
Sherman Schools for Two ConsecrAve Years, as Measured by the Ctanford and CTBS Tests
Word Meaning*
Vocabulary*
Paragraph Meaning*
1969-70
1970
'1969,-70
Pretest
Posttest
Pretest
Pretest
Posttest
Pretest
Raw
Grrde %ile
Raw
Grade %ile Raw
Grade %ile
Raw
Grade ale Raw
Grade
%il
Raw
Grade `ale
.
Score Enui1. Rank
Score Equiv. Rank
Score Emily. Rank -oco-re Xnuiv. Rank
Score Enuiv. Ranl
Score Equiv. Rrm!:
omprehension*
1970
an
8.10 3.0
.14
10.50
edian
7.75 3.0
14
10.20
5:88 2.7
87.82
L 510.42'3.2
22
14.65
3.2
10
3.2
10
3.0
6
3.8
*$11
23,.
17.90 3.9
25
14.80 2.8
12
19.98 3.?
10
:10.83 4.0
31
18.00 3.9
25
14.25 2.7
11
14.81 3.5
18
7.25 2.1
1
22.19 4.5
37
18.25 3.0
14
3.07
3.90
5.42
6.30
.41
41
141
'0.3
50.61
0.27-
-0.55
.
1.8.67 3.1
821.00 4.o
31
i 14.56-2.8
315.75 3.4
19
24.19 3.8
23'
26.69 4.9
47
6.78
7.0
41 0.29
0.08
4
Word Meaning scores obtained from the Stanford Intermediate I (W) administered as pretest 10/69 and posttest 5/70.
Vocabulary scores obtained from the Comprehensive Tests of Basic Skills II (Q) administered 10/70.
Paragraph meaning scores obtained from the Stanford Intermediate I (W) administered as pretest 10/69 and posttest 5/70.
Comprehension scores obtained from the Comprehensive Tests of Basic Skills II (q) administered 10/70.
Note:
A Spring, 1971 posttest was not administered at grade 5 becauie there is presently no alternative
form of the
CTBS (II) battery and the pupils. under study are scheduled for identical testing in the Fall, 1971.

Tlable 70
Statistical Characteristics of 1970-71 Comprehensive Tests of Basi
Ski,lls Scores in
Reading, Language, and Mathematics Achievement for Sixth Grade,Pupils Enrolled atLowell School
for Two Consecutive Years
Total Reading*
Pretest
Posttest
Raw
trade
Bile
Raw
Grade 'ale
Score Eauiv. Rnk Score Equiv. Rank
46.64
4.6
25
44.59
4.4
17
.eidan 46.50
4.6
25 )45.50 4.3
16
37.67
3.9
15
37.75
3.9
11
57.00
5.4
39
55.67
5.3
23
12.00
22
.0.17
13.0
7
22 `O.72
Total-Language*
Total Arithmetic*
Pretest
Posttest
Pretest
Posttest
Raw
Grade %iie
Raw
Grade pile
Raw
Grade %ile
Raw
Grade -pile
Score Equiv. Rank
Score Equiv. Rank
Score Eauiv. Rank
Score Eauiv. Rank
50.18
4.9
29
51.63
5.0
24
55.86
4.7
21
60.95
4.9
118
54.00
5.2
35
52.25
5.0
24
57.50
4.8
22
59.50
4.9
17
48.00
4.7
26
44.00
4.3
15
45.00 4.1
11
50.75
4;4
11
57.25
5.5
41
62.00 6.2
43
65.09
5.2
30
78.00
6.3
42
11.18
12.94
1401
17.44
22
22
22
22
-0.5
9,0
17-0
.50
0.72
'retest scores based upon CTBS, Level 2 (form Q) administered October, 19?0.
'osttest scores based upon CTBS, Level 2 (form Q) administered May, 1971.

.Table 71
.
Statistical Characteristics of 197b-71 Comprehensive Tests of Basic
Skills Scores in
Reading, Langlrge, and Mathematics AChievement for Sixth
Grade Pupils Enrolled at Logan School
for Two Consecutive Years
Total Rending*
Pretest
Raw
Grade
;pile
Score 7.:quiv. Rank
Posttest
Raw
Grade %ile
Score Equiv. Rank
xn
44.55
4.4
23
/48.35
4.6
19
licua 43.00
4.3
20
49.13
4.7
20
33.58
3.6
12
38.54
4.0
12
55.38
5.2
35
58.38
5.5
31
131.88
14.86
73
73
0.27
-0.14
Total Language*
Pretest
Posttest
Raw
Grade %ile
Raw
Grade %ile
score Esuiv. Rank
Score Email/. Rank
School failed to test, using*
the CTBS, Language Subtests
Total Arithmetic.*
Pretest
Posttest
Raw
Grade
Raw
Grade
Scor
eEcuiv. Rank
SCOre Equiv.
,pile
Rini:
94.3P.
4.6
19
61.70
5.0
1.
56.00
4.7
21
61.25
4.9
18
41.92
3.9
948.75
4.3
10
65.08
5.2
30
74.88
5.9
35
15.20
15.71
73
'73
-0.43'
0;09
4
retest scores based upon CTBS, Level 2 (form
Q) administered October, 1970.
ostte6t, scores based upon C:BS, Level 2 (form Q) -kdministered May, 1971.
V
3
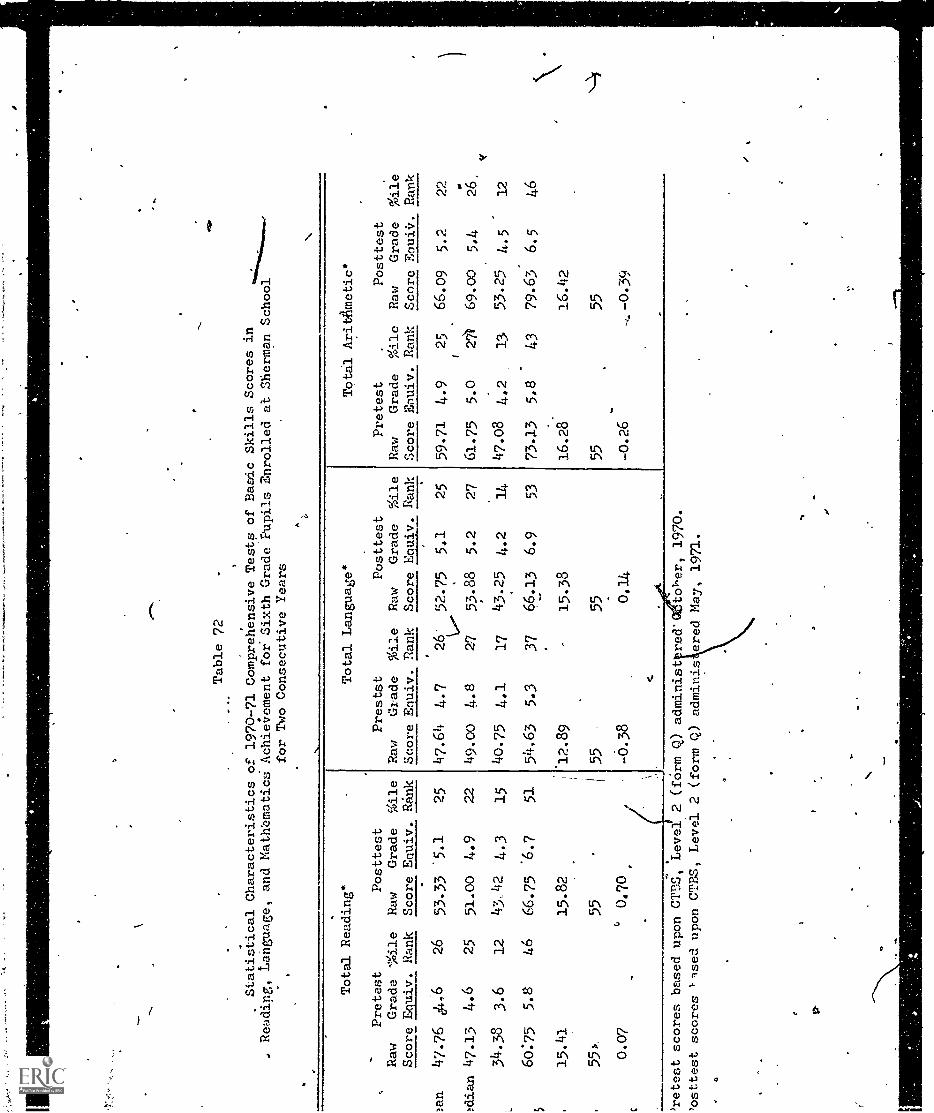
.VP
Table 72
.Statistical Characteristics of 1970-71 Comprehensive Tests of Basic Skills Scores in
. Reading,
Language, and Math'ematicS Achievement foi Sixth Grade Pupils Enrolled at Sherman SchooT.
for Two Consecutive Years
Total Reading*
Pretest
Raw
Grade Idle
Score Equiv. Rank
Posttest
Raw
Grade
%ile
Score Enuiv. Rank
an
47.76
4,6
26
53.33
5.1
25
!dian 47.13
4.6
25
51.00
4.9
22
34.38
3.6
12
43,42
4.3
15
60:75
5.8
46
66.75
.6.7
51
5
15.41
15.82
55 k,
55
0.07
°0.70
Total Language*
Prestst
Posttest
Raw
Grade %ile
Raw
Grade
%ile
Score EQUiV. Rank
Score Enuiv. Rank
47.64
4.7
2' 52.75
5.1
25
49. Co 4.8
27
53.88
5.2
27
40.75
4.1
17
43.25
4.2
14
54.63
5.3
37
66.13
6.9
53
12.8
9
55 -0.3
8
15.3
8
55 0.
14
Total Arithmetic*
Pretest
Raw
Grade
%ile
Score Enuiv. Rank
Posttest
Raw
Grade
%ile
Score Enuiv. Rank
59.71
4.9
25
66.09
5.2
22
61.75
5.0
27)
69.00
5.4
26.
47.08
4.2
13
53.25
4.5
12
73.13
5.8
43
79.63
6.5
46
16.28
16.42
55
55
-o.26
-0.3
9
+4
4
'retest scores based upon CPBS, Level 2 (fOrm Q) administ
'osttest scores 1-1sed upon CTBS, Level 2 (form Q) adminis
red'
toyer, 1970.
ered May, 1971.

a
rfabl e 73
Statistical Characteristics of Eighth Grade Reading AcIrIevement,'as Measured by the CTBS Reading Subtests
Grade 8CTBS
SubtestScares
A
(level 3,,form Q)
VocabularyMeanMedian
Q3
s.
n
ComprehensionMean 19.90 5.1
Median 18.56 4.913.74 3.9
25.76 6.8 .
s. 8,o9n 90
Pretest Statistical Screen
Administration Date:10/26/70=11/2/70
Raw ,ile Scale
Score G.L.E. Rank Score
a
18.20 6.0 21 46517.22 5.8 19 45812.11 4.6 8 414
23.25 7.1 35 502
-7.59290
4
Total,Rcadin2 ,
Mean 38.00 5.7Median 35.50 5.4
, 01126.05 4.2
Q3 47.86 ,6.9
s. 14.51n 90
17 455
15 447
7, - 4034 507
18) 455
16 4476 398
32 496
Post-test Statistical Screen
Administration Date:4/26/71-5/3/71
Raw 'Ale Scale
Scare G.L.E. Rank Score
20.0819.3013.55
25.91
7.95
6.5. 6.25.1
7.7
212910
38
48o472433
524
290
21.86 5.6 18 472
21.07 5.4 15
14.47 3.9 5
.463
403
28.04 7.5 .
0'36 525
8.71290
41.87 I. 19 471'
39.5o .9 16 46329.84 4.7 8 421
53.83 7.5 36 52115.37290

Table 74
Statistical Characteristics of Eighth Grade Mathematics Achievement,
as Measured by the CTBS Mathematics Subtests
Grade 8CTBSSubtestScores(level 3,form 0
Pretest Statistical Screen
Administration Date:
e- 1o/26/70 1/2/70 )
Raw (Ale Scale
Score Rank ScoM
Post-test Statistics_ Screen ,
Administration Date:4/26/71-5/3/71
Raw Scale
Score G.L.E. . Rank Score
COmpwtationMean 22.80 6.o 20 454 25.04 '6.3 19 466
Median 21.28 5.7 16 441 23.05 6.0 15 454
16.23 4.7 7 400 17.46 _5-.0 6 400
Q328.04
9.06
6.8 32- 48), 31.75
10.07
7.6 34./---
484
262 262
ConceptsMean 14.33 5.9 20 16.0( 6,6 21 472Median 14.18 5.9 20 452 15.42 6.2 18 462
0.1
Q3 s%
10.2517.41
4.5
6.9
, 8
31
4o4482
11.8b20.34
5,2
7.8
10
36
43o514
s. 5.19 5.84
n 262 262
ApplicationMrian 8.66 5.9 21 k64 9.88 6,2 21 478
Median
Q1Q3
7.845.65
11.38
5.44,5
6.6
13931
449414492
9.086.55
13.33
5.95,07.5
171035
464
433519
a. 4.14 4.42
n 265 265
TotalMean 45.87 5.9 ?9 449 50.50 6.3 18 465
Median 42.00 5.5 151- 435 46.93 6.0 15 452
Ql 33.17 4.6 7 399 .36.44 5:c 7 412
Q3 58.42 7.0 33 486 63.42 7.5 31 501
s. 16.53 18.07n 262 262

O
Table 75.
SAN DIEGO CITY ,fC.40015
TESTING ANO EYALLIAT
SERVICES
O
NE9ORAL JUNIOR NIGH scaool
GRADE 8
COuPRENENSIvE TESTS OF 8A:1C- SKIMS, FORD Q, LEVEL 3,'ARITNUETIC COUPuTATION
CURRENT
RETARDATION
REDUCTION AND DESIRED PROtiLES
NOVE148tR, 197CP
1SCORE
TERVALS
20%
CURRENT C. 0
KtTARDATION
DiSTRiBuTION
REDUCTION
25%
RETARDATION
REDUCTION,
30%
',
RETAROAT-TON
REDUCTION
45%
50%
RETARDATION
RETARDATION
REDUCTION
REDUCTION
55%
RETARDATION
REDUCTION
75%
RETARDATION
REDUCTION
95%
RETARDATION
REDUCTION
DESIRED
DISTRi8010N
NN -
-
N...lc,'
dN
s'
NN
ag
NLi
Z,
__------
h
1-3
00
10.,
0--
0'0
0--
00
0--
0
1-6
0--
0--
0--
0--
0--
0--
0--
0--
0--
1
O',
--
15
4.2
12
3.4
12
'3.4
iI
3.1
942.,
02.2
6-2.2
51.4
3.8
2.6
D -12
26
7.3
21
.5.9
20
5.6
19
5.3
16
4.5
14
3.9
13
3.6
92.5
41.1
3.8
1-15
47
13.7
39
10.9
37
10.4
35
9.8
29
8.1
27
7.6
25
-
7.0
17
4.8
92.5
72.0
5-10
60
16.8
514.0
47
13.1
45.
12.6
37
10.3
35
9.0
32
9.0
22
6.2
,-.113
3.6
10
2.6
7-21
45
U.S
39
10.9
38
10.6
36
10.1,
32
9.0
30
8.4
29
8.1
23
6.4
17
4.8
16
4.5
?-24
43
12.0
30
10.7
37
10.4
36
10.1
3::
9.5
30
8.4
29
$.1
24
6.7
19
5.3
10
5.0
.
5-27
42
11.8
38
10.7
37
'10.4
36
10.1
33
9.3
31
C.7
30
8.4
26
7.3
22
6.2
21
5.9
9-30
24
6.7
24
5.7
:4
6 .7
24
6.7
24
-0.7
25
7.0
25
7.0
25
7.0
25
7.0
25
7.0
1-33
15
4.2
17
4.8
11
4.6
18
5.0
19
5.3
20
5.6
21
5.9
23
6.4
25
7.0
25
7.0
4-36
31.7
0.
2.2
.9
2.5
92.5
11
3.1
11
.S.1
12
3.4
14
3.9
16
4.5
16
4.5
7-39
3-42
15
12
4.2
3.4
18
18
5,0
5.0
1820
5.0
5.6
149
21
5.3
5.9
2126
t.9
7,3
.22 28
6.2
7.8
22
29
6.2
8.1
25
.35
7.0
9.8
27
71
11.';
43
1
28
7.8
12.0
3-45
G -48
7 0
2.0
--
1817
5.3
4.6
20
21
5.6
5.9
23
25
6,.5
7.0
31
37
8.7
10.5
34
42
9.5
11.8
36
46
10.1_
12.9
*47
62
13.2
17:4
57
79
16.0
22t,11._
...3
16.8
83
23.3
e.
.2TAL
357
357
357
357
357
351
357
357
357
357
(At
20.65
24.92
25.58
..
26.31
28.49
29.39
30.02
32.93
35.79
36.55
.0.
8.40
10.72
11.05
11.31
11.93
11.59
10.54
10.08
SPRING NORMS
/15/71 81
9
ry
O
de"

Table 76
::n y 111: ;
3
CoTnrohe.:1!ve Tevts .11:1111, VoihlryCurr'nt htardltian '4..duction Denir.!: :rofi1en
April, :971
.0?-/
+:r. 8
l'it.tri.-..t1.-)n
204Retardation:toluct.,:r
254getnra.ttion
2o1qction
30.;
Retardation
%Reduction
45;.;
RetardationReduction
50%RetardationReduction
55,4
Retardatl
Reduction.
75RetardationReluctian
1,
95g.
2etardltionPe;:action
Doairee.--'
D.r.nt:1:tt!,In.
02;.
0 % U 5.; :i % V:.
-- 0 -- C) -- 0e-- 0 -- 0 -- 0 -- 0 -- 0 -- 0 -.
4-..,. 11 5. 9 1,.() 9 3.1 8 2.7 7 2.3 C 2.o 6 2.0 4 1.3 2 0.6 ';', .7
r. 24 2.1 ., 7.7 2? 7,.4 19 6.4 17 5.7 16 ,.3 1? 4.0 7 Z.3 ?.'.
10.4- 40 13.., 34 11.- 35 v..) 3. 1054-- 27 9.1 25 8.4 24 81 18 6.0 13 4.4
13-15 34, 12.3 5' 1'...1as 10.4 31 10.4 28 9.4 27 9.1 25 8.4 21 7.0 le 5.3 1 '...:
16-:= 46 15. 41 1i.P. 3) 15.1 3% 12.8 34 11.4 32 10.7 31 10.4 -26 2.7 20 6.7 19 r.z
19-21 3: 1,,.4 29 5.7 29 9.7 28 9.4 27 9:1 26 8.7 26 8.7 24 8.1 2? 7.4 2? 7.4
77-.74 . 44 14.8 41 13 8 40 )5.4 40 13.4 37 12.4 37 12.4 36 12.1 3i 11.1 30 10.1 29 5.7
7.1 23 i.7 24 8.1 24 8.1 25 8.4 26 8.7 i-7 Ifi. 28 9.4 31 10,4 31 10.4
'2-'...;:,o 6.0 2? 7-4 2? 7.4 23 7.7 25 8.4 27 ' 9.1 28 9.4 31 10.4 34 11.4 35 11.9
31-4c 9 3.0 15 5.0 16 5.3 12 6.0 22 7.4 24 8.1 25 8.4 31 10.4 37 12.4 12.8
2.0 13 4.4 1,, 5.0 17 5.7 2? 7,4 24 8.1 26 8.7 33 11.1 40 13.4 42 14.1
37-1-. 5 1.7 1? 4.0 14 4.7 16 5.3 21 7.0 21 7.7 24 8.1 31 10.4 3T 12.8 40 13.4
40 oo -- 2 0.7 2 0.7 2 0.7 4 1.3 '4 1.3 4 1.3 6 2.0 8 2.7 8 2.7
tatal 21= ?.-32 296 298 298 298 295 298 298 298
!'ean 1g.4? 70.11 20.57 21.05- 22.32 22.94 23.30 25.10 26.9')
fq P.70 2.87 3.99 1:34- 9.32 9.33 9..?4 8.73 8.57

%
Tab
le77
SAN vnc CITY ,P"'"070LS
TESTING ANO EVALUAT
SERVICES
UE9GRIAL JUNIOR HIGH SCH001.
GRADE 8
CORPREHENSIVE TESTS cr BASIC SKILLS, LEVEL 3, FORD Q, READING COuPREHEIISION
CsIRRENT
RETARDATION REDUCTION AND OESIREO PROFILES
NOVEuBER. 1970
167
'
a
I SCORE
TERYALS
CURRENT.GA: 0
RETARDATION
OISTRatuTION
REDUCTION
NZC
lt
25%
RETAROATIO-
REDUCTION
Na
30%
RETARDATION
REDUCTION
Ea
45%
RETARDATION
REDUCTION
aa
50%
RETARDATION
REDUCTION
Aa
55%
RETARDATION
REDUCTION
Na
75%
RETARDATION
REDUCTION
va
95%
RETARDATION
REDUCTION
NI
DESIRED
OISTRIFILlicu
N1
1-3
0--
0--
0--
0--
0--
0--
0--
00
--
0
4-6
92.4
71.9
71.0
51.3
51.3
41.1
41.1
2.5
1.3
0--'
7-9
26
6.9
21
5.5
PO
5.3
19
5.0
16
4.2
14
3.7
13
3,A
92.4
41.1
3.6
0-12
40
12,7
40
10.5
38
10.0
36
9.5
- 30
7.9
28
7.4
26
6.9
18
4.7
10
2.6
82.1
7
3-15
61
16.1
51
13.5
49
12.9
46
12.1
39
1C.3
36
9.5
34
9.0
24
6.3
14
3.7
12
3.2
6-10
54
14,2
47
12.4
44
11.6
43
11.4
37
9.0
35
9.2-
33
0.7
26
6.9
10
4.7
76
4.2
9-21
43
11.3
36
10.0
37
9.0
36
S..5
31
0.4
31
,8.2
31
0.2
26
6.9
21
5.5
20
5.3
2-24
35
9.2
'35
9.2
35
9.2
35
. 9.2
35
9.2
35
9.2
35
9.2
35
9.2
35
9.2
35
9.7
5-27
43
11.3
40
10.5
39
10.1
38
10.0
36
9.5
35
9.2
34
9.0
31
0.2
28
/4--:4
27
7.1
0-30
18
4.0
23
6.1
24
6.3
26
6.9
29
7.7
31
8.2
32
8.4
37
9.0
42
11.1
43
11.3
1-33
22
5.0
29
7.7
31
8.2
33
8.7
38
10.0
40
10.6
42
11.1
49
12.9
56
14.0
58
15.3
4-36
13
3.4
22
5.8
24
6.3
'26
6.9
32
8.4
35
9.2
37
9.7
45
1:
954
14.2
56
14.8
7-39
6.
1.6
15
4.0
17
4.5
19
5.0
26
6.9
26
7.4
30
7.9
39
10.3
48
12.7
50
13.2
0-42
1.3
02.1
70
2.6
12
3.2
17
4.5
19
5.0
20
5.3'
27.
7.1
-34
9.0
36
9.5
3-45
0--
3.e
41.1
51.3
71.9
82.1
82-
3.11
2.9
14
3.7
15
4.0
.
rGTAL
379
379
379
379
379
37A
379
379
379
379
MAN
19.22
21.52
22.07
22.73
24.30
24.99
25.42
27.65
29.91
30.63
S.D.
7.94
9.20
9.45
9.57
9.90
9.90
.9.87
9.56
8.69
0.46
.
a
SPRING
NORuS
1/15/71
81
Y

Table 78
Statistical Characteristics of ITED' Scores ofGrat010 Pupils for Two Consecutive Years
...
October, 1969
Rencyn7
Mathenrttics
Percentile
Percentile
Rank"
Rant:
Mean
Median
23
20
69
64
7.03
5.21
.n
622
636
Q1
R3
56
4y
43
*ITED = Iowa Tests of Educational Development (Form Y4).
" Mid-percentile interval score.
November,
Readinc
Percentile
Rank
1970
Ma
ematics
Per -*tile
Ran 47
4340
17
26
65
64
7.13
4.94
557
556

Table 79
Statistical Characteristics of ITU) Scores of
GI7de 12 Pupils for Two/Cpsecutive
Years
V"'
October,
Rcadinc.
Percentile
Rank"
1969
Mathematics
Percentile
Rank
tifIveMber,
Reading
Tercentile
Rank
1970
MathaTltics
PerCentile
Rank
er.
Mean
.53
.48
48
.Median
48
37
43
37
Q1
19
.20
19
16
.11
.- Q3
.\.._
67
70
67
70
s9.96
6.65
9.54
6;90
n520
.529'
480
564
*ITED = Iowa Tests of Educational
Development (Form '(4).
** Mid-perczntilc interval
scor..
!!!
r
V
t4

. II:a 0 \ - r-I r-IC5 't
z Ce CY SO
INNEK CITY
Grade 6: Available test sc res presented in Tables 70, 71, and 72 indicatethat the test achievement of Lowell and Logan in May 1971 was approximatelythe same or sligatiy lcwer in Language and arithmetic, and lower in readingthan October, 1970. Test achieyement at Sherman in May, 1971 was approxi-mately the same or lower in Language and arithmetic than October, 1970, ex-cept for Q3 Language which showed a gain of 16 months and placed Q3 at thenational norm; Q3 in reading was also at norm at Sherman in May, 1971 withthe Median and Ql scores being significantly below grade Coefficient ofskewness indices show variable shifts within distrfutions, birit such shiftswere of minimal extent.
Grade 8: Tables 73, 74, 75, 76, and 77 indicate that pupils did not improvetheir reading and mathematics achievement approximately one-half the differ-ence between the currant and desired district profile. 'Vocabulary Approxi-mated the 20% retardation reduction profile; and both readingcompr:hensionand computation fell between the 20% and 25% retardation reduction profiles.
Grade 10: Table 78 indicates that the lower 25 percent of the pupils improv-ed their relative norm positions in mathematics but declined in reading achieve-ment from 1969 to 1970.
Grade 1t: Table 79 indicates that the lower 25 percent of the pupils remain-ed approximately stable in their relative norm positions in reading and math-ematics from 19.69 to 1970.
In Oonclusf)n, test results were mixed ffom grades one to eight, inclusive.There were some significant gains at several points and grade levels for se-lected schools (Grade 5 - Lowell Sherman)°but overall, schools approximatedprevious achievement. Considering objective seven,, it may be concluded thatonly part C waL achieved which involved the lower 25 percent of pupils at Grades10 and 12.
4