World Film Market Trends - rm .coe. int/C
60
Focus 2006 World Film Market Trends Tendances du Marché Mondial du Film
-
Upload
khangminh22 -
Category
Documents
-
view
1 -
download
0
Transcript of World Film Market Trends - rm .coe. int/C
Focus2006
World Film Market TrendsTendances du Marché Mondial du Film

focus 2006World Film Market TrendsTendances du marché mondial du film

�
Although the term ”globalization ” is carefully avoided by the film community, it nevertheless seems to be the most adapted to describe the evo-lution that the industry has experienced over the past years, an evolution that the Marché du Film is revealing with the phenomenal increase in the Asian and Ibero-American attendance.
This ninth edition of FOCUS sheds essential light on the great movements the film industry is experiencing with the broadening of horizons, the competition of new and huge markets and the stakes involved with digital and piracy issues.
This remarkable work of the European Audio-visual Observatory has been enriched this year with complementary data and a new page setting in order to improve further clarity of reading.
Jérôme PaillardExecutive Director
Bien que le terme « mondialisation » soit soi-gneusement évité par la communauté cinémato-graphique, il parait le mieux adapté pour décrire l’évolution que notre secteur connaît depuis quel-ques années et dont le Marché du Film donne la mesure par la progression phénoménale de la pré-sence asiatique ou ibéro américaine.
Cette neuvième édition de FOCUS apporte un éclairage plus que jamais indispensable pour sentir les grands mouvements que connaît l’industrie du cinéma, à l’heure de l’ouverture et de la concur-rence de nouveaux et immenses marchés et face aux enjeux du numérique et de la piraterie.
Le travail remarquable de l’Observatoire euro-péen de l’audiovisuel s’est enrichi cette année de données complémentaires et d’une nouvelle mise en page afin d’en améliorer encore la lisibilité.
Jérôme PaillardDirecteur Délégué
FOCUS 2006 World Film Market Trends, appears for the ninth consecutive year. We are pleased to collaborate once again with the Cannes Market and value highly our work together.
Wolfgang CLOSSExecutive DirectorEuropean Audiovisual Observatory
The European Audiovisual Observatory was set up in December 1992. It is a public-service body whose mission is to gather and distribute information on the audiovisual industry (film, television, video and multi-media) in Europe. 36 European states are members, along with the European Community represented by the European Commission. The Observatory operates within the framework of an extended partial Agreement of the Council of Europe. It carries out its mission with the help of a network of partners, correspondents and professional organisations. The Observatory provides information on markets, financing and legal aspects of the audiovisual sector.
➦ Internet site (http://www.obs.coe.int)
FOCUS 2006, Tendances du marché mondial du film, paraît pour la neuvième année consécutive. Nous nous réjouissons de cette nouvelle collabora-tion avec le Marché du Film, à laquelle nous por-tons toute l’estime qu’elle mérite.
Wolfgang CLOSSDirecteur exécutifObservatoire européen de l’audiovisuel
Créé en décembre 1992, l’Observatoire européen de l’audiovisuel est un organisme de service public con-sacré à la collecte et à la diffusion de l’information sur l’industrie audiovisuelle (cinéma, télévision, vidéo et mul-timédia) en Europe. 36 Etats européens en sont membres ainsi que la Communauté européenne représentée par la Commission européenne. L’Observatoire fonctionne dans le cadre d’un Accord partiel élargi du Conseil de l’Europe et remplit sa mission avec un réseau de parte-naires, de correspondants et d’organismes profession-nels. L’Observatoire fournit des services d’informations sur les marchés, les financements et le cadre juridique du secteur audiovisuel.
➦ Site Internet (http://www.obs.coe.int)
Editorial
Editor: Susan [email protected], Department for Information on Markets and Financing at the European Audiovisual Observatory

�
focus 2006Introduction 4
World 7
Europe
EuropeanUnion 10
France 20
Germany 22
Italy 24
Spain 26
UnitedKingdom 28
Austria-Benelux-Switzerland �0
Nordiccountries �2
CentralandSouth-EasternEurope �4
RussianFederation �5
USA �6
Canada 40
LatinAmerica 42
Australia 44
Asia 46
China-India 48
Japan 50
SouthKorea 52
Africa-MiddleEast 54
Sources 56
Contents

4
Introduction
Lesseffectiveblockbusters
TakingNorthAmericaandEuropeasawhole,247millionfewerticketsweresoldin2005thanin2004.Oneexplanationmaylieintheweakerroleplayedbyblockbustersinbringinginthecrowds.OnthisNorthAmericanandEuropeanmarket,thenumberoffilmsseenbymorethan50millionpeoplewas7in2001,8in2002,andasteady6fortheyears200�-2005.Thetopsixfilmswereseenby445.2millionpeoplein200�,comparedwith477millionin2004and40�.�millionin2005.WhereastheleadingfilmShrek 2achievedaboxofficeof11�.4millionticketsin2004,Star Wars: Episode III - Revenge of the Sith,whichtoppedthelistin2005,onlybroughtin92million.Thatfigurewasneverthelessbetterthanthe85millionviewersforAttack of the Clones.Similarly,thefourthHarry Potterwasseenbynearly4millionmorepeoplethanthethirdfilm.Theaudienceforfantasyandsciencefictionfilmsseemstobeholdingup,buttheatypicalpublicwhosawThe Passion of the Christ probablydidnotcomebacktothecinemain2005,whileyoungchildrencertainlyspreadtheirviewingoveragreaternumberoffilms.
WeakeningofHollywood’smid-rangemovies
AgaininrelationtothemarketconstitutedbyNorthAmericaandEuropetogether,thereisavisibletrendtowardsadropinthenumberoffilmssellingbetween25and50millionticketsincinemas;therewere16ofthemin2002,1�in200�,12in2004,and11in2005.Thetrendisevenclearerforthethirdcategory,i.e.filmssellingbetween20and25millionticketsincinemas:therewere12in200�,
11in2004,andjust4in2005.Itwouldbeworthanalysingthecharacteristicsofthegenreandthesociologyofthisthirdcategoryindetail,asthisisprobablywherethetrueexplanationfortheseriousdropinnumbersin2005lies.In2005therewerenotenoughfilmsonaparwithFahrenheit 9/11or50 First Dates,bothofwhichattractedspecificseg-mentsofthepublicintocinematheatres.
NorunawaysuccessesamongnationalfilmsinEurope
AlmosteverywhereinEurope,nationalfilmsachievedbettermarketsharesontheirownterritorythanin2004.However,thisismoreareflectionoftherelativeweaknessoftheofferingfromHollywoodthananeffusionofstrongnationalofferings.InFrance,thetop-rankingnationalfilm,Brice de Nice,soldjust4.�milliontickets,littlemorethanhalfthefigureof8.�millionachievedin2004byLes Choristes.InGermany,Die weiße Massai sold2.2millionticketsincinemas,comparedwith9.1millionin2004for(T)Raumschiff Surprise - Periode 1.InItaly,Benigni’slatestfilm,La tigre e la neve,sold2.5millionticketsincinemas,lessthanthe2.7millionforIl paradiso all’improvvisoin2004.SimilarlyinSpain�.5mil-lionticketsweresoldforTorrente 3, El protector,lessthanthe4millionforMar Adentroin2004.IntheUnitedKingdom,theUKFilmCouncilexplainsadropincinemaattendancelesssignificantthanelse-where(-�.8%)bythestrongperformanceofBritishfilms,whichaccountedfora��%marketshare;thisfigureincludes,however,anumberof“inwardinvestment”filmswhosefundamentalBritish-nesshasbeenquestionedbythetradepress.
AspeciesingreaterdangerthantheEmperorpenguin?
Is the cinema-goer becoming an endangered species, more so than the Emperor penguin? Shrinking audiences in cinema theatres constituted a global phenomenon in 2005 – in the United States figures were down 8.7% compared with 2004, and the corresponding figures elsewhere were -11.4% in the European Union, -21.7% in Brazil, -10.2% in Australia, and -5.7% in Japan. On the other hand, audiences grew in South Korea (+5.8%), Russia and, very probably, China. Such a drop in numbers on most of the world’s major markets is naturally worrying, and not easy to analyse.
5
Introduction
Paradoxicalinternationalsuccesses
NationalsuccessesarenotnecessarilythefilmsthataremostsuccessfulonotherEuropeanmar-ketsandoninternationalmarkets,andthiswasparticularlytruein2005.Brice de Nice, Die weiße Massai, La tigre e la neveandTorrente 3, El protectorwerenotwidelydistributedoutsidetheirrespec-tivecountriesoforigin.ThesuccessofEuropeanfilmsinotherEuropeancountriesisprobablylessthaninpreviousyears–only10filmsachievedboxofficesofmorethanonemillionticketsintheEuropeanUnionoutsidetheirnationalmarket,comparedwith12in2004and12in200�.
AmongtheEuropeanfilmsthatcameoutin2005,theonethatwasmostsuccessfulinEuropeoutsideitsnationalmarketwasWoodyAllen’sMatch Point,whichsold2.7millionticketsinEuropein2005evenbeforeitsreleaseintheUnitedKingdomandtheUnitedStates.AlthoughthiswasthemostsuccessfulfilminEurope,itfellbelowthe7.6millionticketssoldin2004inEurope(excludingtheUnitedKingdom)byBridget Jones: The Edge of Reason.ThepleasantsurpriseofaWoodyAllenfilmproducedbytheBBCwassupplementedbytheremarkablesuc-cessesachievedbythreeFrenchfilms(La marche de l’empereur, Transporter 2 andDanny the Dog)inNorthAmerica,wheretheyweretwotothreetimesmoresuccessfulthaninEurope.
Concern
Itisalwaysdifficulttointerpretasignificantdeclineincinemaattendance.Isitmerelyagapcausedbyaweakoffer,orisitinfactthestartofacrisiscausedbyasignificantevolutionincon-sumerhabits?IntheUnitedStates,2005sawfallingnumbersforthethirdyearrunning.Thefiguresavailableforthefirstfewmonthsof2006wouldseemtoindicatethatthistrendiscontinuing,exceptinFrance,whereanumberofsuccessfulnationalfilmshasproducedanupswing.Whatismore,theDVDmarketalsoshowedsignsofslowingdownforthefirsttimein2005.
Atthesametime,video-on-demand(VoD)serviceshavemultipliedandeverythingindicates
thattheunauthorisedexchangeoffilesviatheInternetiscontinuingtoincrease.Thefingerisofcoursepointedatpiracyhere.Itiscommonsensetoarguethatconsumptionfreeofchargeisdamagingtoconsumptionforwhichachargeismade.Commonsensedoesnotalwayscon-stituteproof,however.Thefactthatthedropincinemaattendancehasbeenlesssubstantialincountrieswherebroadbandnetworksarethemostdeveloped(nottomentiontheincreaseinattendanceinSouthKorea,aleadingcountryintermsofnetworks)shoulddiscourageanyonejumpingtoconclusions.AsforthegrowthofVoD,theoperatorsneedtomakemoreofaneffortattransparencyforanaccurateapprecia-tiontobepossible.
Weknowthatpenguins’abilitytosurviveislinkedtotheinstinctthatcausesthemtohuddletogetheratregularintervals…aswellastotheirwillingnesstowalkwhennecessarytojointhegroup.Someyearsarecolderthanothers,andtherenewalofthepopulationismoreuncertain,butthespeciesliveson.Willcinema-goers,amorepuzzlingandunpredictablespecies,demonstratethesamewilltosurvive?
André LangeHead of the Department for Information on Markets and FinancingEuropean Audiovisual Observatory
Who Brings European Filmsto the Big Screen?
VisitusattheMarchéduFilm,Cannes:Riviera,BoothA4
Howtoorder:Orderonlineordownloadorder format:http://www.obs.coe.int/about/orderFormoreinformation:http://www.obs.coe.intTel:+��(0)�[email protected]
Ca.288pages
Edition2006PublicationDate
July2006
Coverprice:
FilmDistributionCompaniesinEurope
ThisnewstudyidentifieskeyplayersforthedistributionofEuropeanfilmsin28Europeancountries:
•Keytopicstreated:
AnalysisofthefilmdistributionsectorinEurope
Marketoverviews
Keyplayers
Marketshares
•Individualcompany profiles:
Contactdetails
Strategies
Europeanfilms distributedand admissions2000-2005
FinancialsituationMorethan100companiesprofiledin28Europeancountries
New Publication!
Pre-publicationOffer
Only 76*
*Offervalidforallordersreceivedbefore
theendofJuly2006
95
EgalementdisponibleenFrançais•AuchinDeutscherhältlich
7
World
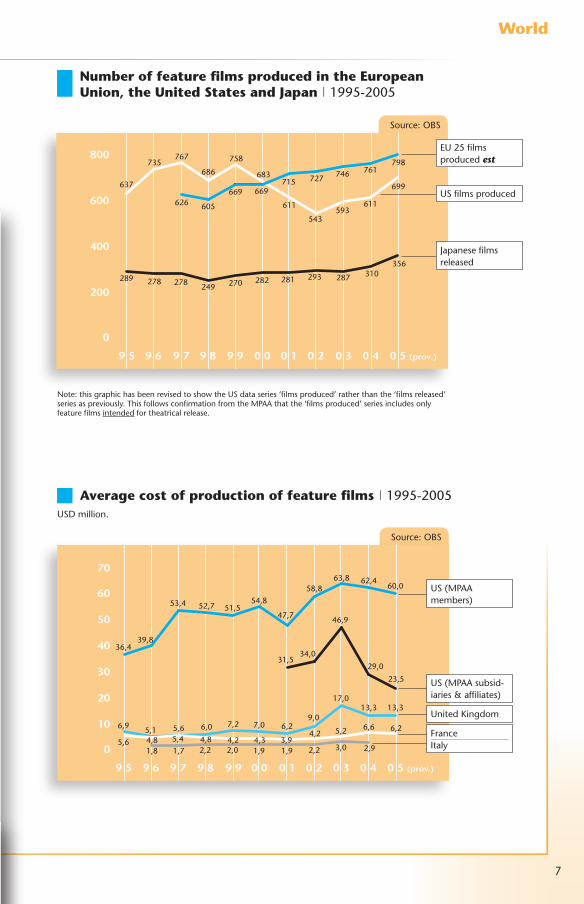
NumberoffeaturefilmsproducedintheEuropeanUnion,theUnitedStatesandJapan|1995-2005
Averagecostofproductionoffeaturefilms|1995-2005USDmillion.
0
70
60
50
40
30
20
10
9 5 9 6 9 7 9 8 9 9 0 0 0 1 0 2 0 3 0 4 0 5 (prov.)
�6,4
6,9
5,6 4,81,8 1,7 2,2 2,0 1,9 1,9 2,2 �,0 2,9
5,4 4,8 4,2 4,� �,94,2 5,2 6,6 6,25,1 5,6 6,0 7,2 7,0 6,29,0
17,01�,� 1�,�
�9,8
5�,4 52,7 51,554,8
47,7
�1,5�4,0
46,9
29,0
2�,5
58,86�,8 62,4
60,0
Source:OBS
US(MPAAmembers)
US(MPAAsubsid-iaries&affiliates)
UnitedKingdom
FranceItaly
0
800
600
400
200
9 5 9 6 9 7 9 8 9 9 0 0 0 1 0 2 0 3 0 4 0 5 (prov.)
7�5767
686
758
68�
611
54�59�
611
6996�7
626 605
669 669715 727 746 761
798
289 278 278 249 270 282 281 29� 287 �10�56
Source:OBS
EU25filmsproducedest
USfilmsproduced
Japanesefilmsreleased
Note:thisgraphichasbeenrevisedtoshowtheUSdataseries‘filmsproduced’ratherthanthe‘filmsreleased’seriesaspreviously.ThisfollowsconfirmationfromtheMPAAthatthe‘filmsproduced’seriesincludesonlyfeaturefilmsintendedfortheatricalrelease.
Who Brings European Filmsto the Big Screen?

8
World
Admissions|1995-2005Inmillions.
Evolutionofaverageticketprices|1995-2005Base100in1995,calculatedinnationalcurrency.
0
1 200
1 600
1 400
1 800
1 000
800
600
400
200
9 5 9 6 9 7 9 8 9 9 0 0 0 1 0 2 0 3 0 4 0 5
126�
72�
166
127 120 141 15� 145 1�5 16� 161 162 170 160
187 211 2�6 244 262 �0� �15 �08 �41 �22
765826
884 870 897999 1005 955 1007
892
1��91�88
1481 1465 14211487
16�91574 15�6
140�
Sources:MPA/OBS/InformaMedia/Eiren
150
130
140
110
100
120
90
9 5 9 6 9 7 9 8 9 9 0 0 0 1 0 2 0 3 0 4 0 5
100
109
114
108
102
105
101101
100
105
118
117
102
124
122
102
125
99
1�01��
1�1
98
1�0
101
1�9
147
1�2
100 99
14�
Source:OBS
US
EU25
EU25: 7,05USDUS: 6,21USDJP: 11,46USD
Japan
EU25: 5,6�USDUS: 4,�5USDJP: 1�,21USD
US
EU25est
SouthAmericaJapan

9
World
Numberofscreens|1995-2005
Worldboxofficetop20|2005USDmillion.
Originaltitle Country NorthAmerican International Total oforigin boxoffice boxoffice 1 StarWarsIII:RevengeoftheSith US �80 468 848 2 HarryPotterandtheGobletofFire(1) GBinc/US 277 5�1 808 � WaroftheWorlds US 2�4 �57 591 4 Madagascar US 19� �40 5�� 5 CharlieandtheChocolateFactory GBinc/US 206 266 472 6 Mr.&Mrs.Smith(1) US 186 282 468 7 TheChroniclesofNarnia(1) US/NZinc 226 202 428 8 KingKong(1) US/NZinc 175 21� �88 9 BatmanBegins US/GBinc 205 166 �7110 Hitch US 178 189 �6711 MeettheFockers(2) US 117 2�0 �4712 FantasticFour US/DE 155 175 ��01� WeddingCrashers US 209 76 28514 Robots US 128 1�� 26115 Constantine US 76 154 2�016 MillionDollarBaby(2) US 99 121 22017 ChickenLittle(1) US 1�2 84 21618 KingdomofHeaven GBinc/DE/ES/US 47 16� 21019 ThePacifier US/CAinc 11� 85 19820 Flightplan(1) US 89 105 194(1) Stillonreleasein2006.(2) 2004release,boxoffice2005only. Source:Variety
0
30 000
35 000
40 000
25 000
20 000
15 000
10 000
5 000
9 5 9 7 9 9 0 1 0 39 6 9 8 0 0 0 2 0 4 0 5
21862
27805
�1865
�7185 �6764 �5786
�8852
2��402619�
27�9728672
1776 1884 2221 2585 2681 2926
Source:OBS
Note:EU25datarevised.
US
EU25est
Japan

10
European UnionPopulation2004 457,2million
GDP2005 1�442billionUSD
1USD 0,82EUR(April2006)
Admissions2005est 892million
Averageadmissions/inhabitant2005est 1,95
Averageticketprice2004 5,68EUR(=7,05USD)
Screens2004est 29077
Screensinmultiplexes(01/01/2005) 1018�
EuropeanUnionproductionvolumeprogressessteadily
Onthebasisofavailabledata,theEuropeanAudiovisualObservatoryestimatesthatatotalof798filmswereproducedinthe25MemberStatesoftheEuropeanUnionin2005,anincreaseof�7filmsinrelationto2004(761films).MostEuropeanUnioncountriesregisteredeitherstableorincreasingproductionvolumewithrecordlevelsattainedinDenmark,Germany,FranceandSpain.Italywastheonlymajormarkettoregisteradecline,withalossofanestimated52filmsbetween2004and2005.AmongthesmallermarketsFinlandshowedasmalldrop,whilstfirstestimatesforBelgiumwouldalsoappeartoshowasmallreductioninoverallvolume.
Admissionsdipunderthe1billionmilestoneoncemore
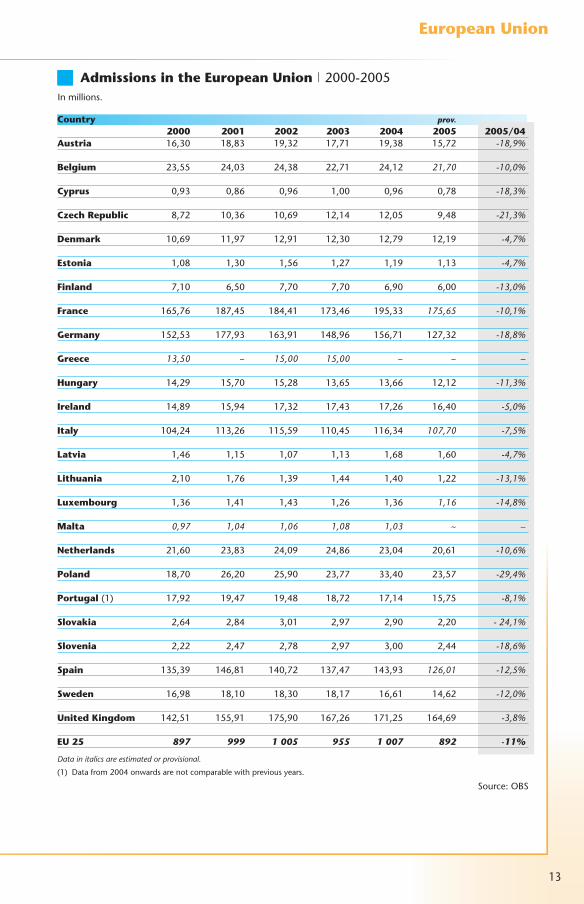
AdmissionsintheEuropeanUnionfellbackunderthe1billionmilestonein2005,withatotalof892millionadmissionsregisteredinthe25membercountries.Thisrepresentsadeclineof11.4%inrelationtothehighpointof2004(1007millionadmissions)andisthelowestlevelofattendancesince1999.
Germany(-18.8%),Spain(-12.5%)andFrance(-10.1%)allreporteddouble-digitdrops,whileexcel-lentresultsforthemonthsofJulyandNovemberinItalyandastrongfinalquarterintheUnitedKingdomallowedthesemarketstoresistsome-whatbetter,withdeclinesof-7.5%and-�.8%respectively.
Amongthemid-sizedandsmallermarketsCyprus,theCzechRepublic,Estonia,Finland,Ireland,Lithuania,theNetherlands,SlovakiaandSwedenallreporteddropsinattendanceforthesecondcon-secutiveyear.Thesteepestdropsamongthemid-sizedmarketswereregisteredinAustria(-18.9%)andtheCzechRepublic(-21.�%)andPolishadmis-sionsfellby29.4%inrelationtotheexceptionaltotalregisteredin2004.LeastaffectedamongthesmallermarketswereDenmark,EstoniaandLatvia,alldownby4.7%,withattendanceinIrelandalsofallingbackbyarelativelylimited5%.
Inresponsetotheincreasingdifficultyinidenti-fyingaplausiblecountryoforiginforinternationalproductions,theEuropeanAudiovisualObservatoryhas,afterconsultation,decidedtoadoptanewapproachinthisyear’sFOCUS.FilmsunderstoodtohavebeenproducedinEurope(orelsewhere)withincomingUSinvestmenthavebeenidenti-fiedherebythemention‘inc’nexttothe‘host’countryinthecountryoforigindetails.
Onthisbasis,provisionalestimatesformarketsharesintheEuropeanUnionin2005showthatEuropeanfilmsachievedamarketshareof24.6%.FilmsproducedinEuropeandbenefitingfromincomingUSinvestmentobtainedamarketshareof1�.�%:examplesoffilmsinthiscategoryareHarry Potter and the Goblet of Fire, Charlie and the Chocolate FactoryandUn long dimanche de fiançailles.Onacomparablebasisthecorrespondingmarketsharefiguresfor2004were25.2%ofadmissionsforEuropeanfilmsand5.9%forfilmsproducedinEuropewithUSinvestment.
Source:OBS
Others2,2%
Marketshares2005est
US59.9%
Europeanfilms24,6%
EURinc-US1�,�%
11
EuropeanUnion
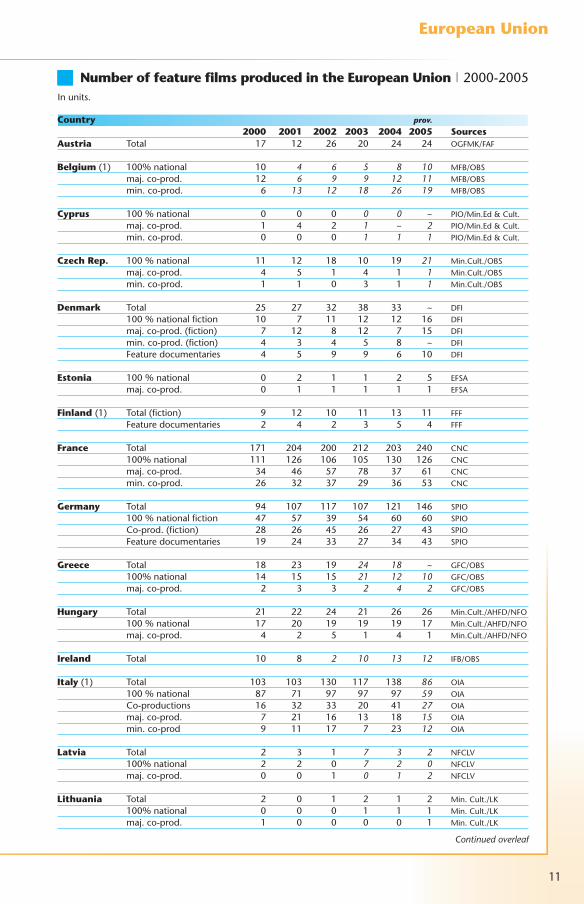
Country prov. 2000 2001 2002 2003 2004 2005 SourcesAustria Total 17 12 26 20 24 24 OGFMK/FAF Belgium(1) 100%national 10 4 6 5 8 10 MFB/OBS maj.co-prod. 12 6 9 9 12 11 MFB/OBS min.co-prod. 6 13 12 18 26 19 MFB/OBS Cyprus 100%national 0 0 0 0 0 ~ PIO/Min.Ed&Cult. maj.co-prod. 1 4 2 1 ~ 2 PIO/Min.Ed&Cult. min.co-prod. 0 0 0 1 1 1 PIO/Min.Ed&Cult. CzechRep. 100%national 11 12 18 10 19 21 Min.Cult./OBS maj.co-prod. 4 5 1 4 1 1 Min.Cult./OBS min.co-prod. 1 1 0 � 1 1 Min.Cult./OBS Denmark Total 25 27 �2 �8 �� ~ DFI 100%nationalfiction 10 7 11 12 12 16 DFI maj.co-prod.(fiction) 7 12 8 12 7 15 DFI min.co-prod.(fiction) 4 � 4 5 8 ~ DFI Featuredocumentaries 4 5 9 9 6 10 DFI Estonia 100%national 0 2 1 1 2 5 EFSA maj.co-prod. 0 1 1 1 1 1 EFSA Finland(1) Total(fiction) 9 12 10 11 1� 11 FFF Featuredocumentaries 2 4 2 � 5 4 FFF France Total 171 204 200 212 20� 240 CNC 100%national 111 126 106 105 1�0 126 CNC maj.co-prod. �4 46 57 78 �7 61 CNC min.co-prod. 26 �2 �7 29 �6 5� CNC Germany Total 94 107 117 107 121 146 SPIO 100%nationalfiction 47 57 �9 54 60 60 SPIO Co-prod.(fiction) 28 26 45 26 27 4� SPIO Featuredocumentaries 19 24 �� 27 �4 4� SPIO Greece Total 18 2� 19 24 18 ~ GFC/OBS 100%national 14 15 15 21 12 10 GFC/OBS maj.co-prod. 2 � � 2 4 2 GFC/OBS Hungary Total 21 22 24 21 26 26 Min.Cult./AHFD/NFO 100%national 17 20 19 19 19 17 Min.Cult./AHFD/NFO maj.co-prod. 4 2 5 1 4 1 Min.Cult./AHFD/NFO Ireland Total 10 8 2 10 13 12 IFB/OBS Italy(1) Total 10� 10� 1�0 117 1�8 86 OIA 100%national 87 71 97 97 97 59 OIA Co-productions 16 �2 �� 20 41 27 OIA maj.co-prod. 7 21 16 1� 18 15 OIA min.co-prod 9 11 17 7 2� 12 OIA Latvia Total 2 � 1 7 3 2 NFCLV 100%national 2 2 0 7 2 0 NFCLV maj.co-prod. 0 0 1 0 1 2 NFCLV
Lithuania Total 2 0 1 2 1 2 Min.Cult./LK 100%national 0 0 0 1 1 1 Min.Cult./LK maj.co-prod. 1 0 0 0 0 1 Min.Cult./LK
NumberoffeaturefilmsproducedintheEuropeanUnion|2000-2005Inunits.
Continued overleaf

12
EuropeanUnion
Country prov. 2000 2001 2002 2003 2004 2005 Sources
NumberoffeaturefilmsproducedintheEuropeanUnion|2000-2005Inunits.
Luxembourg Total 8 10 10 12 13 10 CNA/LFF/OBS 100%national 0 0 1 0 2 1 CNA/LFF/OBS maj.co-prod. ~ ~ ~ 1 1 2 CNA/LFF/OBS min.co-prod. 8 ~ 9 11 10 7 CNA/LFF/OBS Malta Total 0 0 0 1 1 1 MFC/OBS The Total �4 28 29 �� 28 33 NFC/NVF/NVBNetherlands 100%national 27 23 18 21 21 27 NFC/NVF/NVB/OBS(1) maj.co-prod. 3 1 4 3 6 6 NFC/NVF/NVB/OBS Poland Total 22 29 �0 20 20 2� Min.Cult. 100%national 19 27 27 18 17 19 Min.Cult. maj.co-prod. 0 1 0 1 0 2 Min.Cult. min.co-prod. � 1 � 1 � 2 Min.Cult. Portugal Total 1� 17 1� 17 16 ~ ICAM 100%national 4 4 2 6 7 12 ICAM maj.co-prod. 6 10 8 10 5 ~ ICAM Slovakia Total � 4 6 8 � 4 SKFI 100%national 0 2 0 1 2 2 SKFI Co-productions � 2 6 7 1 4 SKFI maj.co-prod. ~ ~ ~ � 0 1 SKFI min.co-prod. ~ ~ ~ 4 1 � SKFI Slovenia Total 5 9 10 7 5 10 SFF 100%national 5 8 9 2 4 7 SFF Co-productions 0 1 1 5 1 � SFF maj.co-prod. ~ ~ ~ 4 0 1 SFF min.co-prod. ~ ~ ~ 1 1 2 SFF Spain Total 98 107 1�7 110 1�� 142 ICAA 100%national 64 67 80 68 92 89 ICAA maj.co-prod. 1� 19 22 16 17 29 ICAA min.co-prod. 21 21 �5 26 24 24 ICAA Sweden Total 44 28 28 �6 42 ~ SFI 100%national 20 16 12 14 22 �1 SFI maj.co-prod. 18 9 9 1� 14 8 SFI min.co-prod. 6 � 7 9 6 ~ SFI United Total 90 8� 84 88 75 78 SFKingdom 100%national 51 52 41 40 28 42 SF maj.co-prod. 1� 12 19 18 19 20 SF min.co-prod. 1� 15 18 21 17 12 SF IncomingUSproduction 11 � 6 5 10 4 SF Otherincomingproduction 2 1 0 4 1 0 SF 100%national 52 51 �7 44 27 �7 UKFCInt. Co-productions ~ ~ 66 99 86 62 UKFCInt. EU25(2) 669 715 727 746 761 798 OBS
Data in italics are estimated.
(1) Revisedseries.(2) Notincludingminorityco-productions,USandforeignproductionintheUnitedKingdom
andfeaturedocumentariesinDenmark,FinlandandGermany.
Continued
1�
EuropeanUnion
Country prov. 2000 2001 2002 2003 2004 2005 2005/04Austria 16,�0 18,8� 19,�2 17,71 19,�8 15,72 -18,9%
Belgium 2�,55 24,0� 24,�8 22,71 24,12 21,70 -10,0%
Cyprus 0,9� 0,86 0,96 1,00 0,96 0,78 -18,3%
CzechRepublic 8,72 10,�6 10,69 12,14 12,05 9,48 -21,3%
Denmark 10,69 11,97 12,91 12,�0 12,79 12,19 -4,7%
Estonia 1,08 1,�0 1,56 1,27 1,19 1,1� -4,7%
Finland 7,10 6,50 7,70 7,70 6,90 6,00 -13,0%
France 165,76 187,45 184,41 17�,46 195,�� 175,65 -10,1%
Germany 152,5� 177,9� 16�,91 148,96 156,71 127,�2 -18,8%
Greece 13,50 ~ 15,00 15,00 ~ ~ –
Hungary 14,29 15,70 15,28 1�,65 1�,66 12,12 -11,3%
Ireland 14,89 15,94 17,�2 17,4� 17,26 16,40 -5,0%
Italy 104,24 11�,26 115,59 110,45 116,�4 107,70 -7,5%
Latvia 1,46 1,15 1,07 1,1� 1,68 1,60 -4,7%
Lithuania 2,10 1,76 1,�9 1,44 1,40 1,22 -13,1%
Luxembourg 1,�6 1,41 1,4� 1,26 1,�6 1,16 -14,8%
Malta 0,97 1,04 1,06 1,08 1,03 ~ –
Netherlands 21,60 2�,8� 24,09 24,86 2�,04 20,61 -10,6%
Poland 18,70 26,20 25,90 2�,77 ��,40 2�,57 -29,4%
Portugal(1) 17,92 19,47 19,48 18,72 17,14 15,75 -8,1%
Slovakia 2,64 2,84 �,01 2,97 2,90 2,20 - 24,1%
Slovenia 2,22 2,47 2,78 2,97 �,00 2,44 -18,6%
Spain 1�5,�9 146,81 140,72 1�7,47 14�,9� 126,01 -12,5%
Sweden 16,98 18,10 18,�0 18,17 16,61 14,62 -12,0%
UnitedKingdom 142,51 155,91 175,90 167,26 171,25 164,69 -3,8% EU25 897 999 1005 955 1007 892 -11%
Data in italics are estimated or provisional.
(1) Datafrom2004onwardsarenotcomparablewithpreviousyears.
Source:OBS
AdmissionsintheEuropeanUnion|2000-2005Inmillions.

14
EuropeanUnion
AdmissionsintheEuropeanUnion|1995-2005Inmillions.
0
40
200
160
80
120
9 5 9 6 9 7 9 8 9 9 0 0 0 1 0 2 0 3 0 4 0 5
1�0,2
90,796,5 102,8
118,410�,5
104,2411�,26
115,59
110,45
116,�4
107,70
1�6,7149
170,115�,6
165,76
187,45 184,41
17�,46
195,��
175,65
Source:OBS
5
10
15
20
9 5 9 6 9 7 9 8 9 9 0 0 0 1 0 2 0 3 0 4 0 5
9,009,82
9,258,4 8,72
10,�610,69
12,14
12,05
9,48
12,0 11,5
1�,7 14,8
17,017,92
19,47 19,4818,72
17,14
15,75
9,25
Source:OBS
0
2
4
6
9 5 9 6 9 7 9 8 9 9 0 0 0 1 0 2 0 3 0 4 0 5
2,9�2,71
2,50 2,6
2,0 2,222,47
2,782,97 �,00
2,44
1,601,68
1,1�1,071,15
1,461,41,41,2�0,961,02
Source:OBS
FranceUnitedKingdom
GermanySpainItaly
PolandBelgiumTheNetherlands
Austria
IrelandPortugalSweden
Finland
LatviaLithuania
LuxembourgEstoniaCyprusMalta
SloveniaSlovakia
GreeceestHungaryDenmarkCzechRepublic

15
EuropeanUnion
BreakdownofEuropeanUnionadmissionsbytheoriginoffilms|2004-2005
Source:OBS/LUMIERENote:‘inc’referstofilmsproducedinEuropewithUSinwardinvestment.
2004
OtherEur2,6% US61,4%
US/EURinc
5,�%
EURinc/US
5,9%
GB4,6%
FR8,8%
DE 4,4%
ES2,4%
IT2,4%
Other2,2%
TotalUS+US/EURinc66,7%
2005prov.
OtherEur2,8% US55,5%
US/EURinc
4,4%
EURinc/US1�,�%
GB4,2%
FR9,6%
DE �,1%
ES2,1%
IT2,9%
Other2,2%
TotalUS+US/EURinc59,9%
16
EuropeanUnion
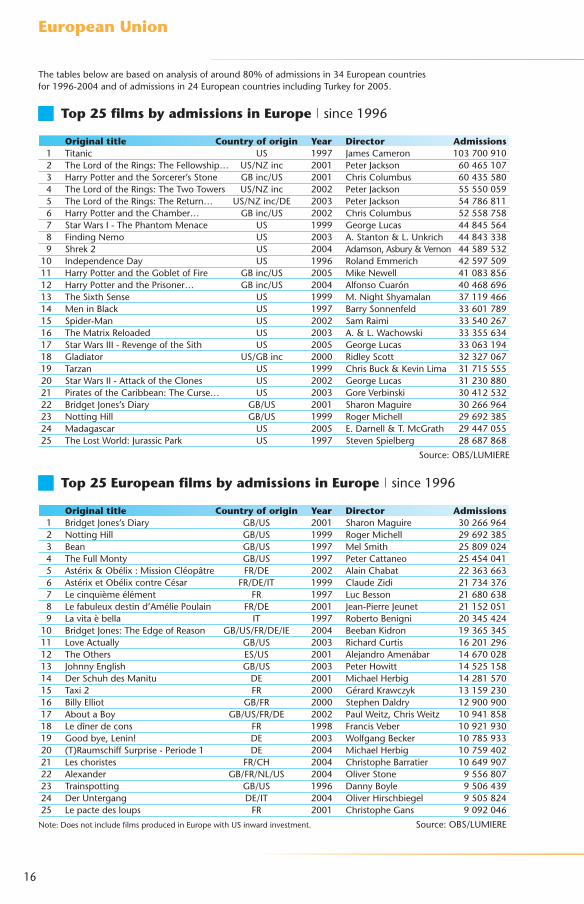
Top25EuropeanfilmsbyadmissionsinEurope|since1996
Originaltitle Countryoforigin Year Director Admissions 1 BridgetJones’sDiary GB/US 2001 SharonMaguire �0266964 2 NottingHill GB/US 1999 RogerMichell 29692�85 � Bean GB/US 1997 MelSmith 25809024 4 TheFullMonty GB/US 1997 PeterCattaneo 25454041 5 Astérix&Obélix:MissionCléopâtre FR/DE 2002 AlainChabat 22�6�66� 6 AstérixetObélixcontreCésar FR/DE/IT 1999 ClaudeZidi 217�4�76 7 Lecinquièmeélément FR 1997 LucBesson 216806�8 8 Lefabuleuxdestind’AméliePoulain FR/DE 2001 Jean-PierreJeunet 21152051 9 Lavitaèbella IT 1997 RobertoBenigni 20�4542410 BridgetJones:TheEdgeofReason GB/US/FR/DE/IE 2004 BeebanKidron 19�65�4511 LoveActually GB/US 200� RichardCurtis 1620129612 TheOthers ES/US 2001 AlejandroAmenábar 146700281� JohnnyEnglish GB/US 200� PeterHowitt 1452515814 DerSchuhdesManitu DE 2001 MichaelHerbig 1428157015 Taxi2 FR 2000 GérardKrawczyk 1�1592�016 BillyElliot GB/FR 2000 StephenDaldry 1290090017 AboutaBoy GB/US/FR/DE 2002 PaulWeitz,ChrisWeitz 1094185818 Ledînerdecons FR 1998 FrancisVeber 109219�019 Goodbye,Lenin! DE 200� WolfgangBecker 107859��20 (T)RaumschiffSurprise-Periode1 DE 2004 MichaelHerbig 1075940221 Leschoristes FR/CH 2004 ChristopheBarratier 1064990722 Alexander GB/FR/NL/US 2004 OliverStone 95568072� Trainspotting GB/US 1996 DannyBoyle 95064�924 DerUntergang DE/IT 2004 OliverHirschbiegel 950582425 Lepactedesloups FR 2001 ChristopheGans 9092046
Note:DoesnotincludefilmsproducedinEuropewithUSinwardinvestment. Source:OBS/LUMIERE
Top25filmsbyadmissionsinEurope|since1996
Originaltitle Countryoforigin Year Director Admissions 1 Titanic US 1997 JamesCameron 10�700910 2 TheLordoftheRings:TheFellowship… US/NZinc 2001 PeterJackson 60465107 � HarryPotterandtheSorcerer’sStone GBinc/US 2001 ChrisColumbus 604�5580 4 TheLordoftheRings:TheTwoTowers US/NZinc 2002 PeterJackson 55550059 5 TheLordoftheRings:TheReturn… US/NZinc/DE 200� PeterJackson 54786811 6 HarryPotterandtheChamber… GBinc/US 2002 ChrisColumbus 52558758 7 StarWarsI-ThePhantomMenace US 1999 GeorgeLucas 44845564 8 FindingNemo US 200� A.Stanton&L.Unkrich 4484���8 9 Shrek2 US 2004 Adamson,Asbury&Vernon 445895�210 IndependenceDay US 1996 RolandEmmerich 4259750911 HarryPotterandtheGobletofFire GBinc/US 2005 MikeNewell 4108�85612 HarryPotterandthePrisoner… GBinc/US 2004 AlfonsoCuarón 404686961� TheSixthSense US 1999 M.NightShyamalan �711946614 MeninBlack US 1997 BarrySonnenfeld ��60178915 Spider-Man US 2002 SamRaimi ��54026716 TheMatrixReloaded US 200� A.&L.Wachowski ���556�417 StarWarsIII-RevengeoftheSith US 2005 GeorgeLucas ��06�19418 Gladiator US/GBinc 2000 RidleyScott �2�2706719 Tarzan US 1999 ChrisBuck&KevinLima �171555520 StarWarsII-AttackoftheClones US 2002 GeorgeLucas �12�088021 PiratesoftheCaribbean:TheCurse… US 200� GoreVerbinski �04125�222 BridgetJones’sDiary GB/US 2001 SharonMaguire �02669642� NottingHill GB/US 1999 RogerMichell 29692�8524 Madagascar US 2005 E.Darnell&T.McGrath 2944705525 TheLostWorld:JurassicPark US 1997 StevenSpielberg 28687868
Source:OBS/LUMIERE
Thetablesbelowarebasedonanalysisofaround80%ofadmissionsin�4Europeancountriesfor1996-2004andofadmissionsin24EuropeancountriesincludingTurkeyfor2005.
17
European Union
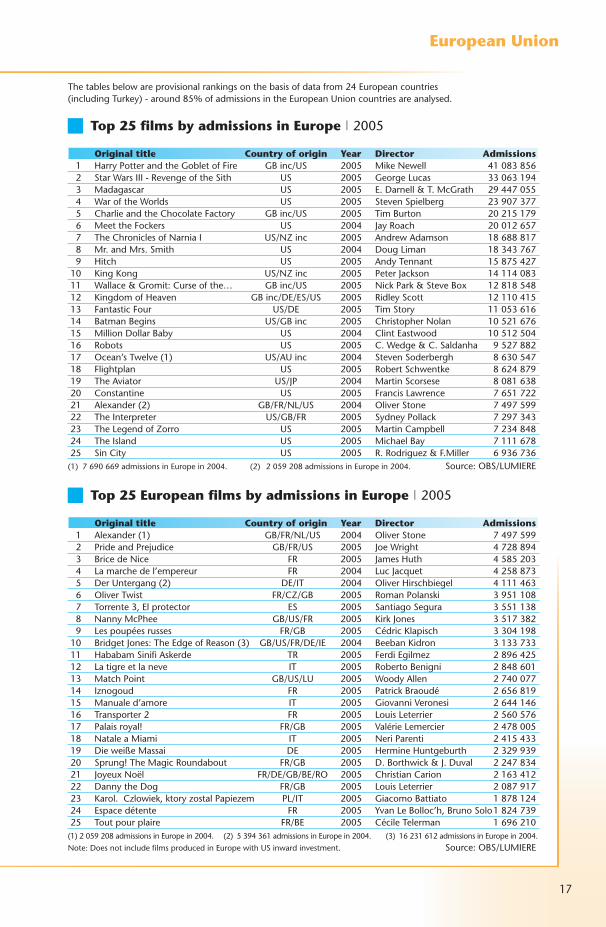
Top 25 films by admissions in Europe | 2005
Original title Country of origin Year Director Admissions 1 Harry Potter and the Goblet of Fire GB inc/US 2005 Mike Newell 41 083 856 2 Star Wars III - Revenge of the Sith US 2005 George Lucas 33 063 194 3 Madagascar US 2005 E. Darnell & T. McGrath 29 447 055 4 War of the Worlds US 2005 Steven Spielberg 23 907 377 5 Charlie and the Chocolate Factory GB inc/US 2005 Tim Burton 20 215 179 6 Meet the Fockers US 2004 Jay Roach 20 012 657 7 The Chronicles of Narnia I US/NZ inc 2005 Andrew Adamson 18 688 817 8 Mr. and Mrs. Smith US 2004 Doug Liman 18 343 767 9 Hitch US 2005 Andy Tennant 15 875 427 10 King Kong US/NZ inc 2005 Peter Jackson 14 114 083 11 Wallace & Gromit: Curse of the… GB inc/US 2005 Nick Park & Steve Box 12 818 548 12 Kingdom of Heaven GB inc/DE/ES/US 2005 Ridley Scott 12 110 415 13 Fantastic Four US/DE 2005 Tim Story 11 053 616 14 Batman Begins US/GB inc 2005 Christopher Nolan 10 521 676 15 Million Dollar Baby US 2004 Clint Eastwood 10 512 504 16 Robots US 2005 C. Wedge & C. Saldanha 9 527 882 17 Ocean’s Twelve (1) US/AU inc 2004 Steven Soderbergh 8 630 547 18 Flightplan US 2005 Robert Schwentke 8 624 879 19 The Aviator US/JP 2004 Martin Scorsese 8 081 638 20 Constantine US 2005 Francis Lawrence 7 651 722 21 Alexander (2) GB/FR/NL/US 2004 Oliver Stone 7 497 599 22 The Interpreter US/GB/FR 2005 Sydney Pollack 7 297 343 23 The Legend of Zorro US 2005 Martin Campbell 7 234 848 24 The Island US 2005 Michael Bay 7 111 678 25 Sin City US 2005 R. Rodriguez & F.Miller 6 936 736(1) 7 690 669 admissions in Europe in 2004. (2) 2 059 208 admissions in Europe in 2004. Source: OBS/LUMIERE
Top 25 European films by admissions in Europe | 2005
Original title Country of origin Year Director Admissions 1 Alexander (1) GB/FR/NL/US 2004 Oliver Stone 7 497 599 2 Pride and Prejudice GB/FR/US 2005 Joe Wright 4 728 894 3 Brice de Nice FR 2005 James Huth 4 585 203 4 La marche de l’empereur FR 2004 Luc Jacquet 4 258 873 5 Der Untergang (2) DE/IT 2004 Oliver Hirschbiegel 4 111 463 6 Oliver Twist FR/CZ/GB 2005 Roman Polanski 3 951 108 7 Torrente 3, El protector ES 2005 Santiago Segura 3 551 138 8 Nanny McPhee GB/US/FR 2005 Kirk Jones 3 517 382 9 Les poupées russes FR/GB 2005 Cédric Klapisch 3 304 198 10 Bridget Jones: The Edge of Reason (3) GB/US/FR/DE/IE 2004 Beeban Kidron 3 133 733 11 Hababam Sinifi Askerde TR 2005 Ferdi Egilmez 2 896 425 12 La tigre et la neve IT 2005 Roberto Benigni 2 848 601 13 Match Point GB/US/LU 2005 Woody Allen 2 740 077 14 Iznogoud FR 2005 Patrick Braoudé 2 656 819 15 Manuale d’amore IT 2005 Giovanni Veronesi 2 644 146 16 Transporter 2 FR 2005 Louis Leterrier 2 560 576 17 Palais royal! FR/GB 2005 Valérie Lemercier 2 478 005 18 Natale a Miami IT 2005 Neri Parenti 2 415 433 19 Die weiße Massai DE 2005 Hermine Huntgeburth 2 329 939 20 Sprung! The Magic Roundabout FR/GB 2005 D. Borthwick & J. Duval 2 247 834 21 Joyeux Noël FR/DE/GB/BE/RO 2005 Christian Carion 2 163 412 22 Danny the Dog FR/GB 2005 Louis Leterrier 2 087 917 23 Karol. Czlowiek, ktory zostal Papiezem PL/IT 2005 Giacomo Battiato 1 878 124 24 Espace détente FR 2005 Yvan Le Bolloc’h, Bruno Solo 1 824 739 25 Tout pour plaire FR/BE 2005 Cécile Telerman 1 696 210(1) 2 059 208 admissions in Europe in 2004. (2) 5 394 361 admissions in Europe in 2004. (3) 16 231 612 admissions in Europe in 2004. Note: Does not include films produced in Europe with US inward investment. Source: OBS/LUMIERE
The tables below are provisional rankings on the basis of data from 24 European countries (including Turkey) - around 85% of admissions in the European Union countries are analysed.

18
EuropeanUnion
Source:MEDIASalles
10
0
20
50
60
30
40
Slova
kia
Esto
nia
Hungary
Latv
ia
Denm
ark
Lithuan
ia
Germ
any
Fran
ce
Poland
Austria
Belgiu
m
United K
ingdom
70
Finlan
d
Swed
en
Czech
Rep
.
Greec
e (2
)
Nether
lands
Italy (1
)
Slove
nia
Portugal
(2)
Irelan
d (2
)
Luxe
mbourg
Spain
7,1
12,6 1�
,614
,1 15,4 17
,918
,018
,2 19,5 20
,1 22,7 24
,1 26,� 27
,0�0
,9 ��,8
��,9 �6
,5 �8,0 41
,7
5�,2 54
,5
65,0
Screensinmultiplexes|2004Screensinmultiplexes(complexesof8screensormore)asapercentagethetotalnumberofscreens.
(1) Screenswithmorethan60daysofactivityperyear.(2) 200�.
Source:MEDIASalles
10
0
20
50
60
30
40
Nether
lands
Italy (1
)
Finlan
d
Fran
ce
Lithuan
ia
Austria
Spain
Slove
nia (2
)
Belgiu
m
80
70
Denm
ark (2
)
Germ
any
Hungary (2
)
Czech
Rep
.
Poland
Esto
nia
Latv
ia
Luxe
mbourg
21,6
�1,8 �5
,141
,942
,5 46,0
51,6 5�
,7 54,7 56
,0 59,�
66,0 67
,�67
,7
76,6 77
,4
70,6
Admissionsinmultiplexes|2004Attendanceinmultiplexes(complexesof8screensormore)asapercentageoftotalcinemaattendance.
(1) Screenswithmorethan60daysofactivityperyear.(2) 200�.
19
EuropeanUnion
Source:OBS
0
600
800
1 200
1 000
400
200
9 6 9 7 9 8 9 9 0 0 0 1 0 2 0 3 0 4 0 5 (prov.)
Sources:OBS
0
80
40
60
20
9 6 9 7 9 8 0 10 09 9 0 5 (prov.)0 3 0 40 2
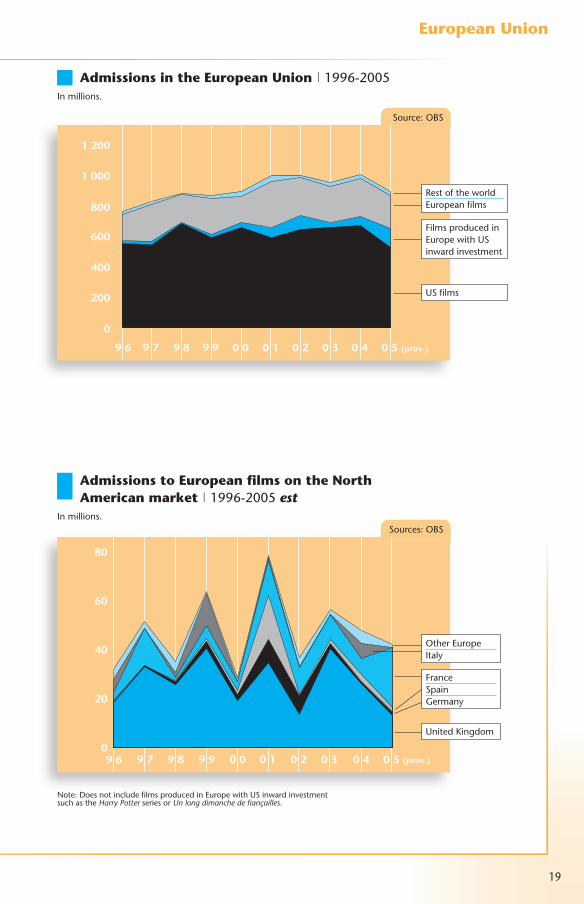
AdmissionsintheEuropeanUnion|1996-2005Inmillions.
AdmissionstoEuropeanfilmsontheNorthAmericanmarket|1996-2005est
Inmillions.
Note:DoesnotincludefilmsproducedinEuropewithUSinwardinvestmentsuchastheHarry PotterseriesorUn long dimanche de fiançailles.
UnitedKingdom
FranceSpainGermany
FilmsproducedinEuropewithUSinwardinvestment
USfilms
RestoftheworldEuropeanfilms
OtherEuropeItaly

20
Population2005 62,7million
GDP2004 2047billionUSD
1USD 0,82EUR(March2006)
Admissions2005 175,65millionprov.
Averageadmissions/inhab.2005 2,80
Averageticketprice2004 5,82EUR(=7,2�USD)
Screens2004 5�02
Screensinmultiplexes2004 �0,9%
Admissionsinmultiplexes2004 51,6%
France
0
160
200
120
40
80
9 5 9 6 9 7 9 8 9 9 0 0 0 1 0 2 0 3 0 4 0 5
97
6�
�4
�2 27�� �2 �1
26�2 �7
29�6
5��0
�946
�5 �446
57
78
�7
61
7486
102115 111
126
106 105
1�0 126
104
125
148 150 145
17216�
18�
167
187
Source:CNC
100 600
700
900
800
1 100
1 000
1 200
1 300200
150
175
125
9 5 9 6 9 7 9 8 9 9 0 0 0 1 0 2 0 3 0 5 (prov.)0 4
1�0,21�6,7
149,�
170,6
15�,6
165,8
187,5 184,4
17�,5
195,�
175,7
690,1726,0
790,2
917,0
824,0
894,0
1021 10�0
996,1
11�4,2
Source:CNC
Numberofofficiallyrecognisedfeaturefilmsproduced|1995-2005
Admissionsandgrossboxoffice|1995-2005
Others17,2%
Marketshares2005est
National�6,8%
US45,9%
‘Frenchinitiative’
100%national
Maj.co-prod.Min.co-prod.
Admissions(millions)
Grossboxoffice(EURmillion)

21212121
France
Top20filmsbyadmissionsinFrance|2005
Originaltitle Countryoforigin Director Admissions 1 HarryPotterandtheGobletofFire(1) GBinc/US MikeNewell 7248158 2 StarWars:EpisodeIII-RevengeoftheSith US GeorgeLucas 7246422 � BricedeNice FR JamesHuth 4�42215 4 CharlieandtheChocolateFactory(1) GBinc/US TimBurton 4150910 5 WaroftheWorlds US StevenSpielberg �905089 6 MillionDollarBaby US ClintEastwood �210799 7 Madagascar(1) US EricDarnell&TomMcGrath �178180 8 Mr.andMrs.Smith US DougLiman 2968850 9 Lespoupéesrusses(1) FR/GB CédricKlapisch 289480�10 Iznogoud FR PatrickBraoudé 249887711 Palaisroyal!(1) FR ValérieLemercier 242�08012 KingKong(1) US/NZinc PeterJackson 22899871� FantasticFour US/DE TimStory 222�59014 Wallace&Gromit:CurseoftheWere-Rabbit GBinc/US NickPark&SteveBox 219�10815 LegendofZorro US MartinCampbell 21�708616 Hitch US AndyTennant 210858117 Lamarchedel’empereur(1) FR LucJacquet 186751818 JoyeuxNoël(1) FR/DE/GB/BE/RO ChristianCarion 184017219 TheChroniclesofNarniaI(1) US/NZinc AndrewAdamson 181�55420 Espacedétente FR YvanLeBolloc’h&BrunoSolo 178716�
(1) Stillonreleasein2006. Source:Lefilmfrançais
Production
ProductionvolumereachedanewrecordinFrancein2005,withatotalof240featuresreceivingofficialrecognition,�7filmsmorethanin2004and28filmsmorethanthepreviousrecordof212filmsin200�.Theincreaseisprincipallyduetoasurgeinthenumberofco-productionsinvolvingFrenchproducers.61filmsweremadeasmajorityco-productionsin2005,24filmsmorethanin2004.Minorityco-productionsalsorosesteeply,passingfrom�6in2004to5�in2005.Amongtheco-productionsamarkedincreaseinthenumberoffilmsproducedundertheEuropeanConventiononCinematographicCo-produc-tionwasnoted(�9in2005,asopposedto25in2004).BelgiumandItalywerethepreferredco-productionpartnersandthenumberofproduc-tionswithCanadashowedasteepincrease(10in2005,1in2004).
TheoverallvolumeofinvestmentinFrenchproductionin2005was9��.7millionEUR,a4.6%increaseonthefigurefor2004.Averagebudgetsperfilmfellbackto4.99millionEUR(5.�4millionEURin2004)butthisfigurestillremainssupe-riortothoseoftheyearspriorto2004.Lower
budgetedfilms(lessthan1millionEUR)wereonceagainanimportantcomponentofproduc-tionvolumein2005afterasignificantdeclinein2004.Amongthe41filmswithabudgetunder1millionEURin2005,19weredocumentaries.12filmshadbudgetsinexcessof15millionEUR,asopposedto9in2004.
Distributionandexhibition
175.65millionticketsweresoldinFrenchcin-emasin2005,a10.1%dropinrelationtothehighpointof195.��millionadmissionsin2004,butstilla1.�%increaseinrelationto200�.IncommonwithmanyotherEuropeanmarkets,admissionsweredownyear-on-yearforthefirst11monthsof2005,androsesignificantlyinDecember,endingtheyearonapositivenote.Around64.8millionoftheticketssoldin2005wereforFrenchfilms,givinganationalmarketshareof�6.8%(�8.6%in2004).USfilmscapturedanestimated45.9%ofthemarket,whilefilmsofotheroriginsrepre-sented17.2%.
Source:CNC
22
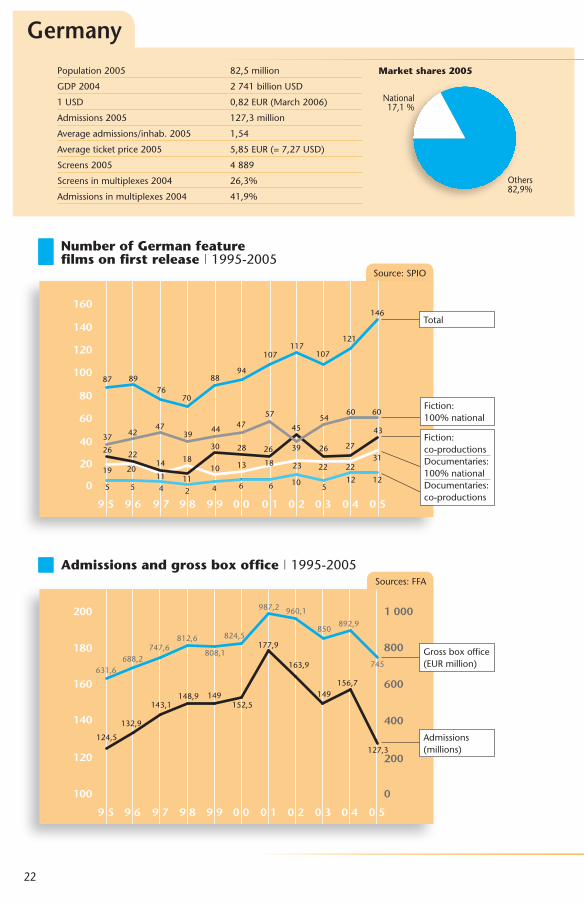
Population2005 82,5million
GDP2004 2741billionUSD
1USD 0,82EUR(March2006)
Admissions2005 127,�million
Averageadmissions/inhab.2005 1,54
Averageticketprice2005 5,85EUR(=7,27USD)
Screens2005 4889
Screensinmultiplexes2004 26,�%
Admissionsinmultiplexes2004 41,9%
Germany
Source:SPIO
0
40
60
160
140
100
120
80
20
9 5 9 6 9 7 9 8 9 9 0 0 0 1 0 2 0 3 0 50 4
8976
70
8894
107117
107
121
146
87
�7
26
19
5 5 54 4 6 6 10 12 122
2011
1810 1� 18 2� 22 22
�12214
11
�0 28 26
45
26 27
4�4247
�944 47
57
�9
5460 60
Admissionsandgrossboxoffice|1995-2005Sources:FFA
NumberofGermanfeaturefilmsonfirstrelease|1995-2005
100
200
600
800
400
1 000200
140
160
180
120
124,5
1�2,9
14�,1148,9 149
152,5
177,9
16�,9
149156,7
127,�
6�1,6688,2
747,6812,6
808,1
987,2 960,1
850892,9
745
9 5 9 6 9 7 9 8 9 9 0 0 0 1 0 2 0 3 0 4 0 5
0
824,5
Admissions(millions)
Grossboxoffice(EURmillion)
Others82,9%
Marketshares2005
National17,1%
Total
Fiction:100%national
Fiction:co-productionsDocumentaries:100%nationalDocumentaries:co-productions
2�
Germany
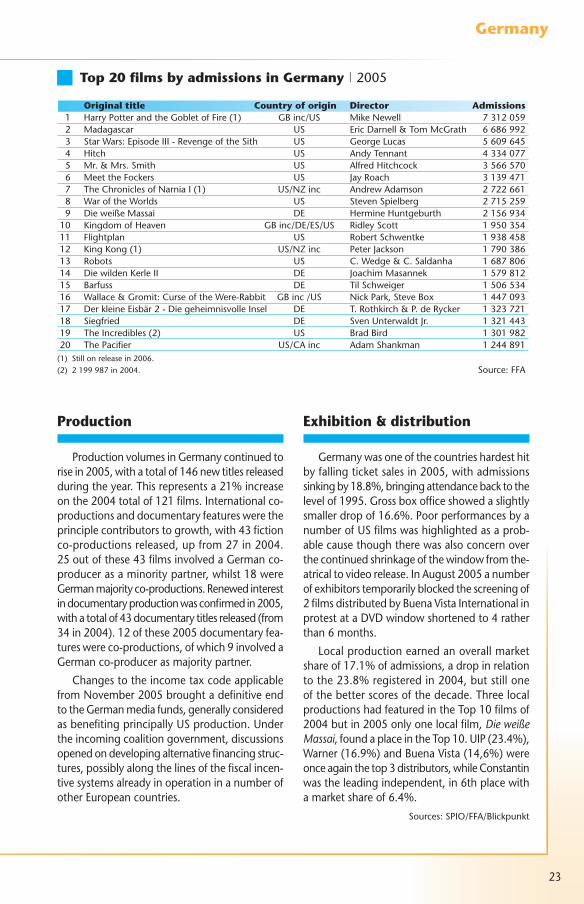
Top20filmsbyadmissionsinGermany|2005
Originaltitle Countryoforigin Director Admissions 1 HarryPotterandtheGobletofFire(1) GBinc/US MikeNewell 7�12059 2 Madagascar US EricDarnell&TomMcGrath 6686992 � StarWars:EpisodeIII-RevengeoftheSith US GeorgeLucas 5609645 4 Hitch US AndyTennant 4��4077 5 Mr.&Mrs.Smith US AlfredHitchcock �566570 6 MeettheFockers US JayRoach �1�9471 7 TheChroniclesofNarniaI(1) US/NZinc AndrewAdamson 2722661 8 WaroftheWorlds US StevenSpielberg 2715259 9 DieweißeMassai DE HermineHuntgeburth 21569�410 KingdomofHeaven GBinc/DE/ES/US RidleyScott 1950�5411 Flightplan US RobertSchwentke 19�845812 KingKong(1) US/NZinc PeterJackson 1790�861� Robots US C.Wedge&C.Saldanha 168780614 DiewildenKerleII DE JoachimMasannek 157981215 Barfuss DE TilSchweiger 15065�416 Wallace&Gromit:CurseoftheWere-Rabbit GBinc/US NickPark,SteveBox 144709�17 DerkleineEisbär2-DiegeheimnisvolleInsel DE T.Rothkirch&P.deRycker 1�2�72118 Siegfried DE SvenUnterwaldtJr. 1�2144�19 TheIncredibles(2) US BradBird 1�0198220 ThePacifier US/CAinc AdamShankman 1244891(1) Stillonreleasein2006.(2) 2199987in2004. Source:FFA
Production
ProductionvolumesinGermanycontinuedtorisein2005,withatotalof146newtitlesreleasedduringtheyear.Thisrepresentsa21%increaseonthe2004totalof121films.Internationalco-productionsanddocumentaryfeaturesweretheprinciplecontributorstogrowth,with4�fictionco-productionsreleased,upfrom27in2004.25outofthese4�filmsinvolvedaGermanco-producerasaminoritypartner,whilst18wereGermanmajorityco-productions.Renewedinterestindocumentaryproductionwasconfirmedin2005,withatotalof4�documentarytitlesreleased(from�4in2004).12ofthese2005documentaryfea-tureswereco-productions,ofwhich9involvedaGermanco-producerasmajoritypartner.
ChangestotheincometaxcodeapplicablefromNovember2005broughtadefinitiveendtotheGermanmediafunds,generallyconsideredasbenefitingprincipallyUSproduction.Undertheincomingcoalitiongovernment,discussionsopenedondevelopingalternativefinancingstruc-tures,possiblyalongthelinesofthefiscalincen-tivesystemsalreadyinoperationinanumberofotherEuropeancountries.
Exhibition&distribution
Germanywasoneofthecountrieshardesthitbyfallingticketsalesin2005,withadmissionssinkingby18.8%,bringingattendancebacktothelevelof1995.Grossboxofficeshowedaslightlysmallerdropof16.6%.PoorperformancesbyanumberofUSfilmswashighlightedasaprob-ablecausethoughtherewasalsoconcernoverthecontinuedshrinkageofthewindowfromthe-atricaltovideorelease.InAugust2005anumberofexhibitorstemporarilyblockedthescreeningof2filmsdistributedbyBuenaVistaInternationalinprotestataDVDwindowshortenedto4ratherthan6months.
Localproductionearnedanoverallmarketshareof17.1%ofadmissions,adropinrelationtothe2�.8%registeredin2004,butstilloneofthebetterscoresofthedecade.ThreelocalproductionshadfeaturedintheTop10filmsof2004butin2005onlyonelocalfilm,Die weiße Massai,foundaplaceintheTop10.UIP(2�.4%),Warner(16.9%)andBuenaVista(14,6%)wereonceagainthetop�distributors,whileConstantinwastheleadingindependent,in6thplacewithamarketshareof6.4%.
Sources:SPIO/FFA/Blickpunkt

24
Population2005 58,5million
GDP2004 1678billionUSD
1USD 0,82EUR(March2006)
Admissions2005est 108million
Averageadmissions/inhab.2005est 1,84
Averageticketprice2005est 5,70EUR(=7,08USD)
Screens2004 �171
Screensinmultiplexes2004 24,1%
Admissionsinmultiplexes2004 �5,1%
Italy
0
120
160
80
40
9 5 9 6 9 7 9 8 9 9 0 0 0 1 0 2 0 3 0 5 (prov.)0 4
75
99
8792
10810� 10�
1�0
117
1�8
86
59
97 97 97
71
8792
7971
77
60
1522
16 1� 16 16
�2 ��
20
41
27
Sources:ANICA(1995-1999)/OIA(2000-2005)
80
90
110
300
500
400
600
700
900
800
120
100
9 5 9 6 9 7 9 8 9 9 0 0 0 1 0 2 0 3 0 4 0 5 (prov.)
�74
447
498
587
5�� 546
601
645615
661
614
91
97
10�
118
10� 104
11�
116
110
116
108
Sources:SIAE/OIA
NumberoffeaturefilmsproducedinItaly|1995-2005
Admissionsandgrossboxoffice|1995-2005
Others9,5%
Marketshares2005
National24,7%
US5�,�%
Admissions(millions)
Grossboxoffice(EURmillion)
GB12,5%
100%national
Co-productions
Total
25
Italy
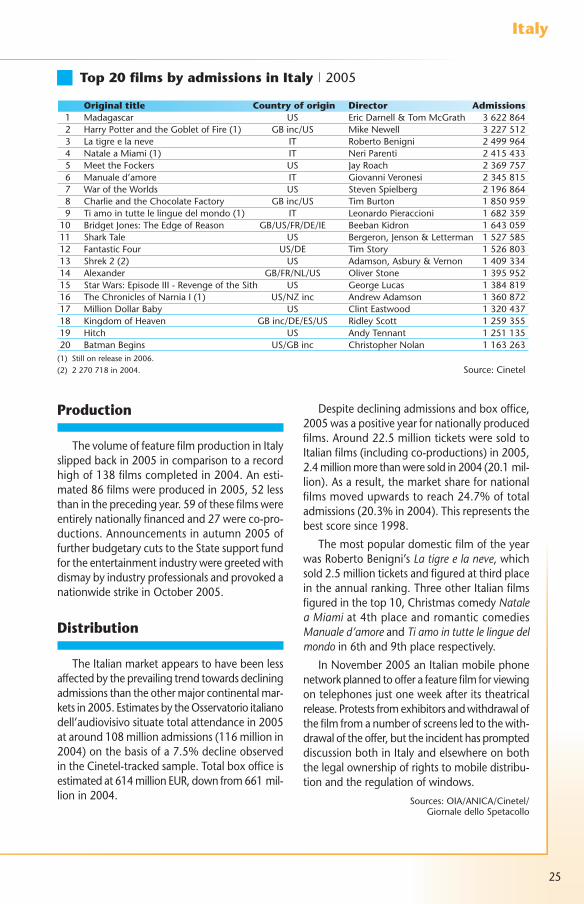
Top20filmsbyadmissionsinItaly|2005
Originaltitle Countryoforigin Director Admissions 1 Madagascar US EricDarnell&TomMcGrath �622864 2 HarryPotterandtheGobletofFire(1) GBinc/US MikeNewell �227512 � Latigreelaneve IT RobertoBenigni 2499964 4 NataleaMiami(1) IT NeriParenti 24154�� 5 MeettheFockers US JayRoach 2�69757 6 Manualed’amore IT GiovanniVeronesi 2�45815 7 WaroftheWorlds US StevenSpielberg 2196864 8 CharlieandtheChocolateFactory GBinc/US TimBurton 1850959 9 Tiamointuttelelinguedelmondo(1) IT LeonardoPieraccioni 1682�5910 BridgetJones:TheEdgeofReason GB/US/FR/DE/IE BeebanKidron 164�05911 SharkTale US Bergeron,Jenson&Letterman 152758512 FantasticFour US/DE TimStory 152680�1� Shrek2(2) US Adamson,Asbury&Vernon 1409��414 Alexander GB/FR/NL/US OliverStone 1�9595215 StarWars:EpisodeIII-RevengeoftheSith US GeorgeLucas 1�8481916 TheChroniclesofNarniaI(1) US/NZinc AndrewAdamson 1�6087217 MillionDollarBaby US ClintEastwood 1�204�718 KingdomofHeaven GBinc/DE/ES/US RidleyScott 1259�5519 Hitch US AndyTennant 12511�520 BatmanBegins US/GBinc ChristopherNolan 116�26�(1) Stillonreleasein2006.(2) 2270718in2004. Source:Cinetel
Production
ThevolumeoffeaturefilmproductioninItalyslippedbackin2005incomparisontoarecordhighof1�8filmscompletedin2004.Anesti-mated86filmswereproducedin2005,52lessthanintheprecedingyear.59ofthesefilmswereentirelynationallyfinancedand27wereco-pro-ductions.Announcementsinautumn2005offurtherbudgetarycutstotheStatesupportfundfortheentertainmentindustryweregreetedwithdismaybyindustryprofessionalsandprovokedanationwidestrikeinOctober2005.
Distribution
TheItalianmarketappearstohavebeenlessaffectedbytheprevailingtrendtowardsdecliningadmissionsthantheothermajorcontinentalmar-ketsin2005.EstimatesbytheOsservatorioitalianodell’audiovisivosituatetotalattendancein2005ataround108millionadmissions(116millionin2004)onthebasisofa7.5%declineobservedintheCinetel-trackedsample.Totalboxofficeisestimatedat614millionEUR,downfrom661mil-lionin2004.
Despitedecliningadmissionsandboxoffice,2005wasapositiveyearfornationallyproducedfilms.Around22.5millionticketsweresoldtoItalianfilms(includingco-productions)in2005,2.4millionmorethanweresoldin2004(20.1mil-lion).Asaresult,themarketsharefornationalfilmsmovedupwardstoreach24.7%oftotaladmissions(20.�%in2004).Thisrepresentsthebestscoresince1998.
ThemostpopulardomesticfilmoftheyearwasRobertoBenigni’s La tigre e la neve,whichsold2.5millionticketsandfiguredatthirdplaceintheannualranking.ThreeotherItalianfilmsfiguredinthetop10,ChristmascomedyNatale a Miamiat4thplaceandromanticcomediesManuale d’amoreandTi amo in tutte le lingue del mondoin6thand9thplacerespectively.
InNovember2005anItalianmobilephonenetworkplannedtoofferafeaturefilmforviewingontelephonesjustoneweekafteritstheatricalrelease.Protestsfromexhibitorsandwithdrawalofthefilmfromanumberofscreensledtothewith-drawaloftheoffer,buttheincidenthasprompteddiscussionbothinItalyandelsewhereonboththelegalownershipofrightstomobiledistribu-tionandtheregulationofwindows.
Sources:OIA/ANICA/Cinetel/GiornaledelloSpetacollo

26
Population2005 44,1million
GDP2004 1040billionUSD
1USD 0,82EUR(March2006)
Admissions2005 126,0million
Averageadmissions/inhab.2005 2,86
Averageticketprice2005 4,98EUR(=6,19USD)
Screens2005 4�8�
Screensinmultiplexes2004 54,5%
SpainMarketshares2005
0
60
90
120
150
30
9 5 9 6 9 8 9 9 0 0 0 1 0 2 0 3 0 4 0 59 7
22
�7
59
91
80
65
82
98106
1�7
110
1��142
6655 44
46
64 66
8068
92 89
25 2519
�8 �440
57
42 41
5�
Source:ICAA
60 0
200
400
600
1 000
800
150
140
80
90
100
110
120
130
70
9 5 9 6 9 7 9 8 9 9 0 0 0 1 0 2 0 3 0 4 0 5 (prov.)
295,6�40,4 �59,9
429,8495,9
5�6,�
616,4 625,9 6�9,4691,6
627,�
96,7
106,7 107,1
119,9
1�1,�1�5,4
146,8140,7
1�7,514�,9
126,0
Source:ICAA
Admissionsandgrossboxoffice|1995-2005
NumberoffeaturefilmsproducedinSpain|1995-2005
Co-productions
Total
100%national
Admissions(millions)
Grossboxoffice(EURmillion)
Others�%
National17%
US60%
OtherEuropeanUnion20%
27
Spain
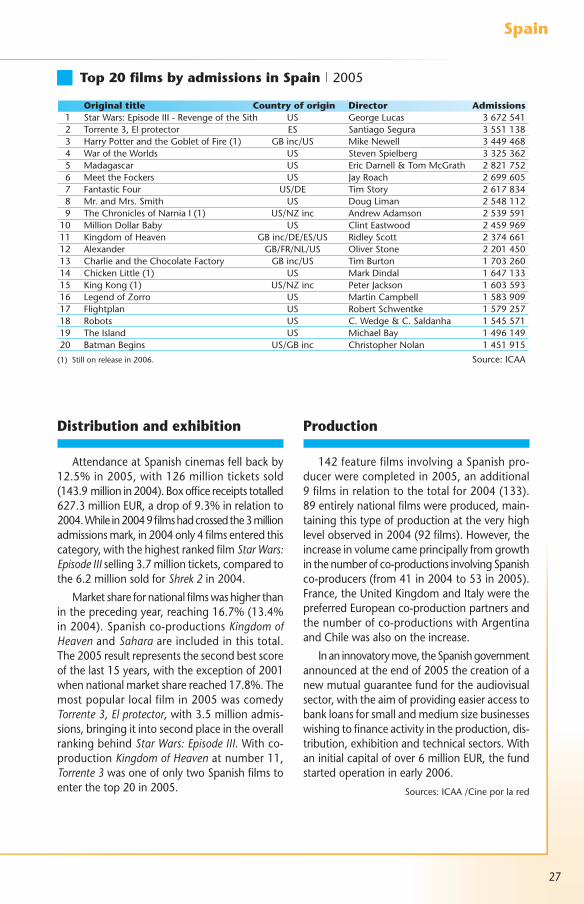
Top20filmsbyadmissionsinSpain|2005
Originaltitle Countryoforigin Director Admissions 1 StarWars:EpisodeIII-RevengeoftheSith US GeorgeLucas �672541 2 Torrente�,Elprotector ES SantiagoSegura �5511�8 � HarryPotterandtheGobletofFire(1) GBinc/US MikeNewell �449468 4 WaroftheWorlds US StevenSpielberg ��25�62 5 Madagascar US EricDarnell&TomMcGrath 2821752 6 MeettheFockers US JayRoach 2699605 7 FantasticFour US/DE TimStory 26178�4 8 Mr.andMrs.Smith US DougLiman 2548112 9 TheChroniclesofNarniaI(1) US/NZinc AndrewAdamson 25�959110 MillionDollarBaby US ClintEastwood 245996911 KingdomofHeaven GBinc/DE/ES/US RidleyScott 2�7466112 Alexander GB/FR/NL/US OliverStone 22014501� CharlieandtheChocolateFactory GBinc/US TimBurton 170�26014 ChickenLittle(1) US MarkDindal 16471��15 KingKong(1) US/NZinc PeterJackson 160�59�16 LegendofZorro US MartinCampbell 158�90917 Flightplan US RobertSchwentke 157925718 Robots US C.Wedge&C.Saldanha 154557119 TheIsland US MichaelBay 149614920 BatmanBegins US/GBinc ChristopherNolan 1451915
(1) Stillonreleasein2006. Source:ICAA
Distributionandexhibition
AttendanceatSpanishcinemasfellbackby12.5%in2005,with126millionticketssold(14�.9millionin2004).Boxofficereceiptstotalled627.�millionEUR,adropof9.�%inrelationto2004.Whilein20049filmshadcrossedthe�millionadmissionsmark,in2004only4filmsenteredthiscategory,withthehighestrankedfilmStar Wars: Episode IIIselling�.7milliontickets,comparedtothe6.2millionsoldforShrek 2in2004.
Marketsharefornationalfilmswashigherthanintheprecedingyear,reaching16.7%(1�.4%in2004).Spanishco-productionsKingdom of HeavenandSaharaareincludedinthistotal.The2005resultrepresentsthesecondbestscoreofthelast15years,withtheexceptionof2001whennationalmarketsharereached17.8%.Themostpopularlocalfilmin2005wascomedyTorrente 3, El protector,with�.5millionadmis-sions,bringingitintosecondplaceintheoverallrankingbehindStar Wars: Episode III.Withco-production Kingdom of Heavenatnumber11,Torrente 3 wasoneofonlytwoSpanishfilmstoenterthetop20in2005.
Production
142featurefilmsinvolvingaSpanishpro-ducerwerecompletedin2005,anadditional9filmsinrelationtothetotalfor2004(1��).89entirelynationalfilmswereproduced,main-tainingthistypeofproductionattheveryhighlevelobservedin2004(92films).However,theincreaseinvolumecameprincipallyfromgrowthinthenumberofco-productionsinvolvingSpanishco-producers(from41in2004to5�in2005).France,theUnitedKingdomandItalywerethepreferredEuropeanco-productionpartnersandthenumberofco-productionswithArgentinaandChilewasalsoontheincrease.
Inaninnovatorymove,theSpanishgovernmentannouncedattheendof2005thecreationofanewmutualguaranteefundfortheaudiovisualsector,withtheaimofprovidingeasieraccesstobankloansforsmallandmediumsizebusinesseswishingtofinanceactivityintheproduction,dis-tribution,exhibitionandtechnicalsectors.Withaninitialcapitalofover6millionEUR,thefundstartedoperationinearly2006.
Sources:ICAA/Cineporlared
28
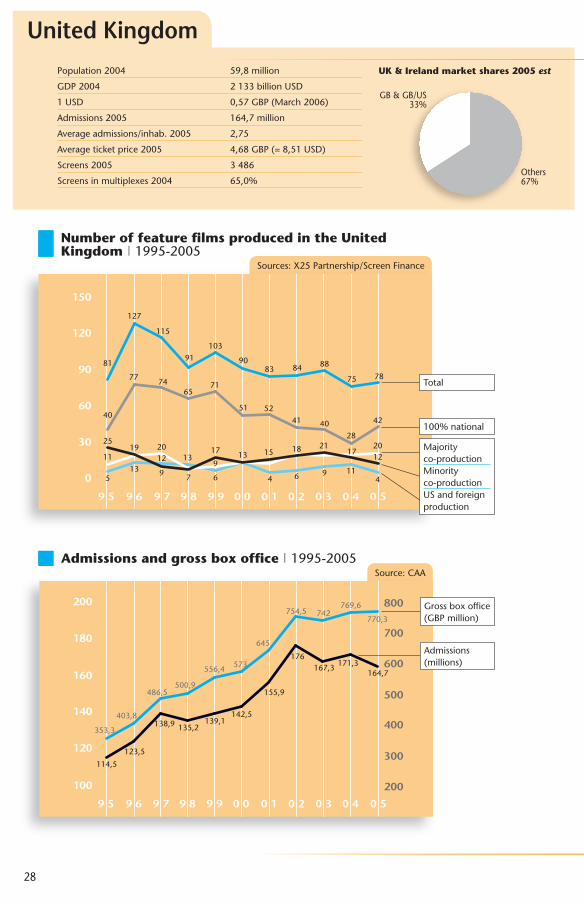
Population2004 59,8million
GDP2004 21��billionUSD
1USD 0,57GBP(March2006)
Admissions2005 164,7million
Averageadmissions/inhab.2005 2,75
Averageticketprice2005 4,68GBP(=8,51USD)
Screens2005 �486
Screensinmultiplexes2004 65,0%
United KingdomUK&Irelandmarketshares2005est
GB&GB/US��%
Others67%
0
90
150
120
60
30
9 5 9 6 9 7 9 8 9 9 0 0 0 1 0 2 0 3 0 4 0 5
81
40
25
5
1120
91�
12 1�
6 4 6 9 114
19
9 7
17 1� 152018 21
1712
77 7465
71
51 5241 40
28
42
127
115
9110�
908� 84 88
75 78
Sources:X25Partnership/ScreenFinance
100 200
600
700
500
400
300
800200
180
120
160
140
9 5 9 6 9 7 9 8 9 9 0 0 0 1 0 2 0 3 0 4 0 5
114,5
12�,5
1�8,9 1�5,21�9,1
142,5
155,9
176167,� 171,�
164,7
�5�,�
40�,8
486,5500,9
556,4 57�
645
754,5 742769,6
770,�
Source:CAA
NumberoffeaturefilmsproducedintheUnitedKingdom|1995-2005
Admissionsandgrossboxoffice|1995-2005
Total
100%national
Majorityco-productionMinorityco-productionUSandforeignproduction
Admissions(millions)
Grossboxoffice(GBPmillion)

29
UnitedKingdom
Originaltitle Countryoforigin Director Grossbox office(GBP) 1 HarryPotterandtheGobletofFire(1) GBinc/US MikeNewell 46967491 2 StarWars:Ep.III-RevengeoftheSith US GeorgeLucas �94��98� � CharlieandtheChocolateFactory GBinc/US TimBurton �7462140 4 TheChroniclesofNarniaI(1) US/NZinc AndrewAdamson �6148�21 5 Wallace&Gromit:CurseoftheWere-Rabbit(1)GBinc/US SteveBox&NickPark �1980281 6 WaroftheWorlds US StevenSpielberg �0648�15 7 MeettheFockers US JayRoach 28925095 8 KingKong(1) US/NZinc PeterJackson 2�919605 9 Madagascar US E.Darnell&T.McGrath 2265487810 Hitch US AndyTennant 17�9�84811 NannyMcPhee(1) GB/US/FR KirkJones 16461�5112 BatmanBegins US/GBinc ChristopherNolan 164201401� PrideandPrejudice GB/FR/US JoeWright 1456812814 Mr.&Mrs.Smith US DougLiman 1�59224415 WeddingCrashers US DavidDobkin 1�16�61416 FantasticFour US/DE TimStory 1270802417 Ocean’sTwelve US/AUinc StevenSoderbergh 1257617718 Robots US C.Wedge&C.Saldanha 1248121619 TheHitchhiker’sGuidetotheGalaxy GBinc/US GarthJennings 1066971420 Valiant GBinc/US GaryChapman 85169�8
(1) Stillonreleasein2006. Source:UKFilmCouncil/NielsenEDI
Top20filmsbygrossboxofficeintheUnitedKingdomandIreland|2005
Production
DatafromScreen Financeonthenumberoffilmstartsin2005showsthatthetotalvolumeoffilmsgoingintoproductionincreasedto78films,upfromthe2004totalof75.Recoverywaspar-ticularlynotableintheentirelynationallyfinancedcategory,whichhaddeclinedsharplyin2004,whilethenumberofmajorityco-productionsremainedlargelystable.Minorityco-productionsfellback,however,asdidinwardinvestmentprojectsshootingintheUK.4suchprojectswerenotedin2005,asagainst11in2004.
DatafromUKFilmCouncilInternationalshowsthatthetotalvalueofinvestmentinproduction(bothinwardanddomestic)recordedfortheyearwas568.8millionGBP,a�0%droponthelevelfor2004(811.9millionGBP).Thevalueofinwardinvestmentfellbacksteeply,reflectingboththeweaknessoftheUSdollaragainststerlingbutalsouncertaintyoverfuturetaxincentivesforfilmproduction.ThisuncertaintywasbroughttoanendwiththeGovernment’sDecember2005announcementofthenewsystemtobeimple-mentedin2006.
Distributionandexhibition
TheUnitedKingdomwasoneoftheEuropeanmarketsleastaffectedbythegeneraliseddown-wardtrendinadmissionsin2005.164.7millionadmissionstocinemaswereregisteredduringtheyear,a�.8%decreaseonthetotalfor2004(171.�million).Boxofficereceiptsremainedstable,registeringatotalof770.�millionGBP,a0.1%riseonthefigurefor2004(769.6millionGBP).Averystrongfinalquarterprovidedsufficientcompensationforthedisappointingresultsreg-isteredduringthesummermonths.
UKfilmsachievedanestimatedmarketshareof��%ofUKandIrishboxofficein2005,amarkedimprovementonthe2�%registeredin2004.Thesefigurestakeintoaccountproductionscategorisedas‘inwardinvestment’totheUnitedKingdom;filmssuchasHarry Potter and the Goblet of Fire, Batman BeginsorCharlie and the Chocolate Factory,aswellasanumberofinternationalco-productionsmadeundertheEuropeanConventiononCinematographicCo-production(SaharaorKingdom of Heaven).Nonetheless,Britishthemesand/orliteraryworksremainedtheinspirationfor9outofthe20topfilmsin2005.
Sources:CAA/ScreenFinance/UKFilmCouncil

�0
Austria Belgium Switzerland Luxembourg Netherlands
Population2004(millions) 8,2 10,4 7,5(1) 0,5 16,2
GDP2004(USDbillions) 292 �5� �59 �2 564
1USD(March2006) 0,82EUR 0,82EUR 1,�1CHF 0,82EUR 0,82EUR
Admissions2005(millions) 15,7 21,7est 15,0 1,2est 20,6
Admissions/inhabitant2005 1,94 2,09est 2,06 2,57 1,26
Sharenationalfilms2005 – 5,4% 5,9% – 1�,6%
(1) 2005
Austria - Benelux - Switzerland
0
30
40
50
20
10
9 5 9 6 9 7 9 8 9 9 0 0 0 1 0 2 0 3 0 4 0 5 (prov.)
�0
25
15
7
0 0 002 2 �
1 1 1 1
12 1�
17
22
10
15 14
20 2115 15
22
17 12
26
20
24 2425
2�20
�225
27
29
40
�1
�941
�7
25
��
22
�0
24 2427
��
22
Sources:FAF/OFS/NVF-NVB/MFB/CNA/OBS
0
15
25
30
20
10
5
9 5 9 6 9 7 9 8 9 9 0 0 0 1 0 2 0 3 0 4 0 5 (prov.)
0,67
11,99
15,20 15,15
15,55 15,92 15,4015,56
17,0818,77
16,48 17,2014,95
11,801�,72
15,22 15,02
16,�0
18,8� 19,�217,71
19,�8
15,72
0,75 1,19 1,41 1,�2 1,�6 1,41 1,4� 1,26 1,�6 1,16
17,20
19,2421,21
22,07
25,�9
21,872�,55 24,0� 24,�8
16,7818,90
20,0818,60
21,60 2�,8� 24,0922,71
24,12
21,70
24,86
2�,04
20,61
Sources:INS/MfB/NVF-NVB/OFS/FAF/CNA/OBS
NumberoffeaturefilmsproducedinAustria,Belgium,Luxembourg,theNetherlandsandSwitzerland|1995-2005
AdmissionsinAustria,Belgium,Luxembourg,theNetherlandsandSwitzerland|1995-2005
Inmillions.
Luxembourg
BelgiumTheNetherlands
AustriaSwitzerland
Switzerland
TheNetherlands
AustriaBelgium
Luxembourg

�1
Austria-Benelux-Switzerland
Originaltitle Belgium Luxembourg(1) Netherlands Total 1 HarryPotterandtheGobletofFire(2) 1106�22 42500 1015897 2164719 2 Madagascar 70�925 48700 997492 1750117 � WaroftheWorlds 564742 25�00 684502 1274544 4 StarWars:EpisodeIII-RevengeoftheSith 575�45 �1800 561726 1168871 5 Mr.andMrs.Smith 60�694 27800 5�1981 116�475 6 CharlieandtheChocolateFactory(2) 411488 20200 668202 1099890 7 MeettheFockers 504469 2�700 �97460 925629 8 Hitch �96566 �2700 446892 876158 9 Ocean’sTwelve 480011 11500 �41851 8���6210 KingdomofHeaven �46521 11000 ��2249 68977011 Flightplan 405184 14400 264751 684��512 KingKong �714�9 1�900 266521 6518601� NationalTreasure(�) �5�974 7200 287688 64886214 Herbie:FullyLoaded �55148 11900 227825 59487�15 ThePacifier �01660 11400 27�551 58661116 TheChroniclesofNarniaI ��1597 17700 215598 56489517 TheSpongeBobSquarepantsMovie 126577 11000 414582 55215918 Robots 258�59 18000 2�5502 51186119 Wallace&Gromit:CurseoftheWere-Rabbit 25161� 18700 2�196� 50227620 ChickenLittle 256�92 – 2�7665 494057(1) ProvisionaldataonthebasisofTop50filmsonly.(2) Belgiandataisthecumulativeadmissionsto20January2006.(�) 227679admissionsinBelgiumin2004.
Sources:Moniteur du film en Belgique/Utopia/NVF-NVB
Top20filmsbyadmissionsinBelgium,LuxembourgandtheNetherlands|2005
Originaltitle Austria(1) Switzerland Total 1 Madagascar 7921�8 660�74 1452512 2 HarryPotterandtheGobletofFire 699�72 612090 1�11462 � Mr.&Mrs.Smith 508210 400787 908997 4 Hitch 477679 42448� 902162 5 MeettheFockers 516845 �80404 897249 6 StarWarsIII-RevengeoftheSith 49197� �81229 87�202 7 TheChroniclesofNarniaI �128�4 216260 529094 8 WaroftheWorlds 28�660 241�01 524961 9 Ocean’sTwelve(2) �50217 168572 51878910 MeinNameistEugen – 488849 48884911 KingdomofHeaven 227528 205797 4���2512 CharlieandtheChocolateFactory 200700 22�049 42�7491� ThePacifier 229446 158�51 �8779714 BladeTrinity(�) 2144�2 905�9 �0497115 Ray – 249421 24942116 MillionDollarBaby – 247�02 247�0217 TheIncredibles(4) 11271� 127640 240�5�18 Wallace&Gromit:CurseoftheWere-Rabbit – 219151 21915119 TheAviator – 212152 21215220 TheInterpreter – 209847 209847(1) IncompletedataforAustria.(2) 227057admissonsinSwitzerlandin2004.(�) 10851admissionsinSwitzerlandin2004.(4) �2�010admissionsinAustriaand260572admissionsinSwitzerlandin2004. Sources:FAFO/OFS
Top20filmsbyadmissionsinAustriaandSwitzerland|2005

�2
Denmark Finland Iceland Norway Sweden
Population2004(millions) 5,4 5,2 0,� 4,6 9,0
GDP2004(USDbillions) 241 186 12 250 �46
1USD(April2006) 6,11DKK 0,8EUR 72ISK 6,5NOK 7,7SEK
Admissions2005(millions) 12,2 6,0 1,5(1) 11,� 14,6
Admissions/inhabitant2005 2,2 1,1 4,9(1) 2,5 1,6
Screens2005 �89 �40 45(1) 4�4 1178(1)
Screensinmultiplexes2004 19,5% 12,6% – 1�,1% 14,1%
Admissionsinmultiplexes2004 �1,8%(2) 42,5% – 26,1% –
Sharenationalfilms2004 �2,�% 15,6% 4,1%(1) 12,0% 22,5%
(1) 2004 (2)200�
Nordic countries
0
15
25
30
35
40
20
10
5
9 5 9 6 9 7 9 8 9 9 0 0 0 1 0 2 0 3 0 4 0 5 (prov.)
0
5
10
15
20
25
30
35
40
17
1�
8
7
2 2 2
6 64 4
9
4
10
108 9
12
20
17 1816 17
19 19
24
�1
9
12 1�11 10 10 11 11
1�
7
1�
1819 19
28
�2�4
2�
�8
25
21
27
�6
�9
Sources:SFI/DFI/NFF/FFF/HI/OBS
0
20
10
5
15
9 5 9 6 9 7 9 8 9 9 0 0 0 1 0 2 0 3 0 4 0 5 (prov.)
15,2
10,9
8,8
5,�
1,2 1,4 1,5 1,5 1,5 1,5 1,51,6 1,6 1,6
5,5 5,9 6,47,1 7,1
6,57,7 7,7
6,96,0
9,910,8 11,0 11,0 10,7
12,0
12,9
12,� 12,0
12,211,5
10,911,5 11,4 11,6
12,5
12,0
1�,1 12,8
11,�
15,2 15,2 15,8 16,017,0
18,1 18,� 18,2
16,6
14,6
Sources:SFI/DFI/F&K/NFF/FFF/HI
NumberoffeaturefilmsproducedintheNordiccountries|1995-2005
AdmissionsinNordiccountries|1995-2005Inmillions.
Iceland
DenmarkNorway
Sweden
Finland
Sweden
Denmark
Norway
Finland
Iceland
��
Nordiccountries
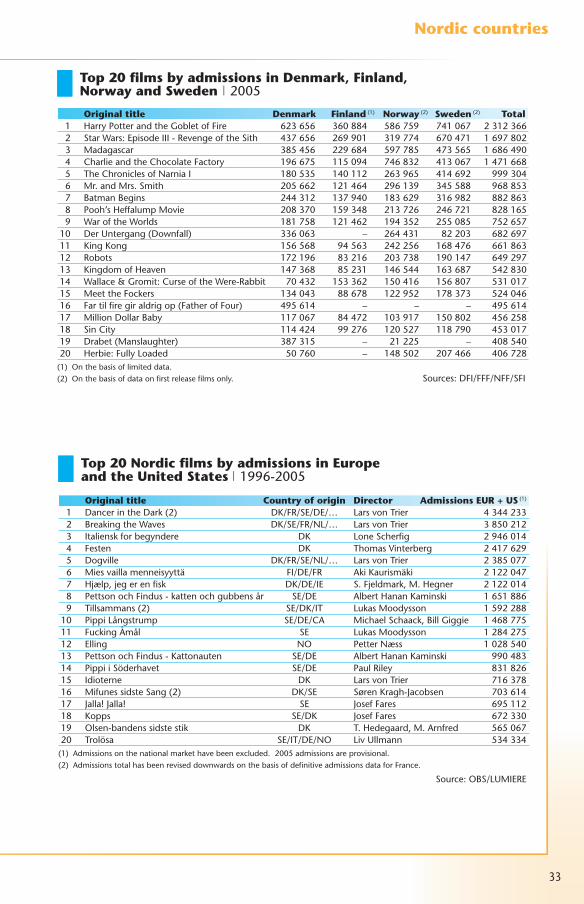
Originaltitle Denmark Finland(1) Norway(2) Sweden(2) Total 1 HarryPotterandtheGobletofFire 62�656 �60884 586759 741067 2�12�66 2 StarWars:EpisodeIII-RevengeoftheSith 4�7656 269901 �19774 670471 1697802 � Madagascar �85456 229684 597785 47�565 1686490 4 CharlieandtheChocolateFactory 196675 115094 7468�2 41�067 1471668 5 TheChroniclesofNarniaI 1805�5 140112 26�965 414692 999�04 6 Mr.andMrs.Smith 205662 121464 2961�9 �45588 96885� 7 BatmanBegins 244�12 1�7940 18�629 �16982 88286� 8 Pooh’sHeffalumpMovie 208�70 159�48 21�726 246721 828165 9 WaroftheWorlds 181758 121462 194�52 255085 75265710 DerUntergang(Downfall) ��606� – 2644�1 8220� 68269711 KingKong 156568 9456� 242256 168476 66186�12 Robots 172196 8�216 20�7�8 190147 6492971� KingdomofHeaven 147�68 852�1 146544 16�687 5428�014 Wallace&Gromit:CurseoftheWere-Rabbit 704�2 15��62 150416 156807 5�101715 MeettheFockers 1�404� 88678 122952 178�7� 52404616 Fartilfiregiraldrigop(FatherofFour) 495614 – – – 49561417 MillionDollarBaby 117067 84472 10�917 150802 45625818 SinCity 114424 99276 120527 118790 45�01719 Drabet(Manslaughter) �87�15 – 21225 – 40854020 Herbie:FullyLoaded 50760 – 148502 207466 406728(1) Onthebasisoflimiteddata.(2) Onthebasisofdataonfirstreleasefilmsonly. Sources:DFI/FFF/NFF/SFI
Top20filmsbyadmissionsinDenmark,Finland,NorwayandSweden|2005
Originaltitle Countryoforigin Director AdmissionsEUR+US(1)
1 DancerintheDark(2) DK/FR/SE/DE/… LarsvonTrier 4�442�� 2 BreakingtheWaves DK/SE/FR/NL/… LarsvonTrier �850212 � Italienskforbegyndere DK LoneScherfig 2946014 4 Festen DK ThomasVinterberg 2417629 5 Dogville DK/FR/SE/NL/… LarsvonTrier 2�85077 6 Miesvaillamenneisyyttä FI/DE/FR AkiKaurismäki 2122047 7 Hjælp,jegerenfisk DK/DE/IE S.Fjeldmark,M.Hegner 2122014 8 PettsonochFindus-kattenochgubbensår SE/DE AlbertHananKaminski 1651886 9 Tillsammans(2) SE/DK/IT LukasMoodysson 159228810 PippiLångstrump SE/DE/CA MichaelSchaack,BillGiggie 146877511 FuckingÅmål SE LukasMoodysson 128427512 Elling NO PetterNæss 10285401� PettsonochFindus-Kattonauten SE/DE AlbertHananKaminski 99048�14 PippiiSöderhavet SE/DE PaulRiley 8�182615 Idioterne DK LarsvonTrier 716�7816 MifunessidsteSang(2) DK/SE SørenKragh-Jacobsen 70�61417 Jalla!Jalla! SE JosefFares 69511218 Kopps SE/DK JosefFares 672��019 Olsen-bandenssidstestik DK T.Hedegaard,M.Arnfred 56506720 Trolösa SE/IT/DE/NO LivUllmann 5�4��4(1) Admissionsonthenationalmarkethavebeenexcluded.2005admissionsareprovisional.(2) AdmissionstotalhasbeenreviseddownwardsonthebasisofdefinitiveadmissionsdataforFrance.
Source:OBS/LUMIERE
Top20NordicfilmsbyadmissionsinEuropeandtheUnitedStates|1996-2005

�4
Bulgaria Croatia Czech Hungary Poland Romania Slovakia Slovenia Turkey Republic
Population2004(millions) 7,8 4,5 10,2 10,1 �8,6 21,8 5,4 2,0 72,2
GDP2004(USDbillions) 24 �4 107 100 242 7� 41 �2 299
Admissions2005(millions) 2,4 �,0(1) 9,5 12,1 2�,6 2,8 2,2 2,4 27,�
Admissions/inhab.2005 0,� 0,7(1) 0,9 1,2 0,6 0,1 0,4 1,2 0,4
Screens2005 97 1�1(1) 765(1) 485 870(1) 120 245 106 1269
(1) 2004 Source:OBS
Central and South-Eastern Europe
0
40
20
10
30
9 6 9 7 9 8 9 9 0 0 0 1 0 2 0 3 0 5 (prov.)0 4
�7
20
17
14
6
�5
0 0
8 9 8
11 108
�1
20
2�
19
2827
19
16
11
17
21 2224
20
2�
18
21
21
1� 16 1517
19
14
2022
2522
20
29
2022
24
17
27
Source:OBS
0
35
20
15
10
5
30
25
9 5 9 6 9 7 9 8 9 9 0 0 0 1 0 2 0 5 (prov.)0 3 0 4
22,2
11,6
9,� 9 9,5
2,9 2,7 2,5 2,6 2 2,2 2,5 2,8 � � 2,4
14
16,6
1� 9,8 9,2 8,4 8,710,4 10,7
12,1 12
9,56,84,2 5,1 5,7 5,� 4,5
42,8
1�,8
16,614,6 14,4 14,�
15,7 15,�1�,7 1�,7
12,1
15,116,1
21,0 2�,9
25,�
28,2
2�,5
24,629,7 27,�
21,42�,7
19,9
26,6
18,7
26,225,9
2�,8
��,4
2�,6
Source:OBS
NumberoffeaturefilmsproducedinCentralandSouth-EasternEurope|1996-2005
CinemaattendanceinCentralandSouth-EasternEurope|1995-2005
Turkey
CzechRepublicPolandHungary
RomaniaSloveniaBulgariaSlovakiaCroatia
Turkey
Poland
HungaryCzechRepublic
RomaniaBulgaria,Slovenia,Slovakia,Croatia
�5
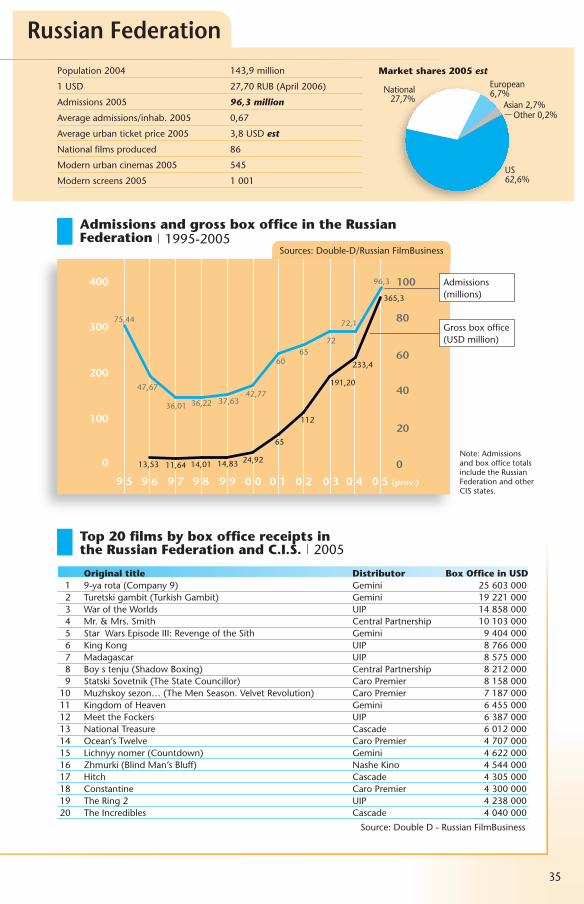
Population2004 14�,9million
1USD 27,70RUB(April2006)
Admissions2005 96,3million
Averageadmissions/inhab.2005 0,67
Averageurbanticketprice2005 �,8USDest
Nationalfilmsproduced 86
Modernurbancinemas2005 545
Modernscreens2005 1001
Russian FederationMarketshares2005est
0
100
60
40
20
80
9 7 9 89 6 9 99 5 0 5 (prov.)0 30 0 0 1 0 2 0 4
0
400
300
200
100
75,44
47,67
�6,01 �6,22 �7,6�42,77
6065
72
72,1
96,�
1�,5� 11,64 14,01 14,8� 24,92
65
112
191,20
2��,4
�65,�
Sources:Double-D/RussianFilmBusiness
AdmissionsandgrossboxofficeintheRussianFederation|1995-2005
Admissions(millions)
European6,7%National
27,7%
US62,6%
Other0,2%Asian2,7%
Grossboxoffice(USDmillion)
Originaltitle Distributor BoxOfficeinUSD 1 9-yarota(Company9) Gemini 2560�000 2 Turetskigambit(TurkishGambit) Gemini 19221000 � WaroftheWorlds UIP 14858000 4 Mr.&Mrs.Smith CentralPartnership 1010�000 5 StarWarsEpisodeIII:RevengeoftheSith Gemini 9404000 6 KingKong UIP 8766000 7 Madagascar UIP 8575000 8 Boystenju(ShadowBoxing) CentralPartnership 8212000 9 StatskiSovetnik(TheStateCouncillor) CaroPremier 815800010 Muzhskoysezon…(TheMenSeason.VelvetRevolution) CaroPremier 718700011 KingdomofHeaven Gemini 645500012 MeettheFockers UIP 6�870001� NationalTreasure Cascade 601200014 Ocean’sTwelve CaroPremier 470700015 Lichnyynomer(Countdown) Gemini 462200016 Zhmurki(BlindMan’sBluff) NasheKino 454400017 Hitch Cascade 4�0500018 Constantine CaroPremier 4�0000019 TheRing2 UIP 42�800020 TheIncredibles Cascade 4040000
Source:DoubleD-RussianFilmBusiness
Top20filmsbyboxofficereceiptsintheRussianFederationandC.I.S.|2005
Note:AdmissionsandboxofficetotalsincludetheRussianFederationandotherCISstates.
�6
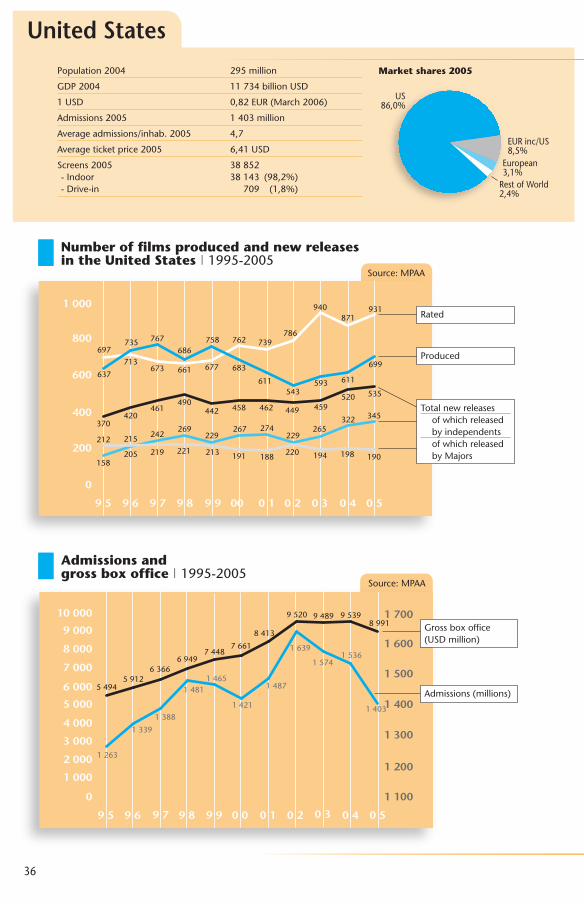
Population2004 295million
GDP2004 117�4billionUSD
1USD 0,82EUR(March2006)
Admissions2005 140�million
Averageadmissions/inhab.2005 4,7
Averageticketprice2005 6,41USD
Screens2005 �8852-Indoor �814� (98,2%)-Drive-in 709 (1,8%)
United StatesMarketshares2005
Source:MPAA
0
600
800
1 000
400
200
9 5 9 6 9 7 9 8 9 9 00 0 1 0 2 0 3 0 4 0 5
6�7
69771�
67� 661 677
762 7�9786
940871
9�1
699
7�5 767686
758
68�
61154�
59� 611
�70
212
158205
242269
229267 274
229265
�22 �45
215
219 221 21� 191 188 220 194 190198
420461
490442 458 462 449 459
520 5�5
0 1 100
1 200
1 300
1 400
1 500
1 700
1 600
6 000
7 000
10 000
9 000
8 000
5 000
4 000
3 000
2 000
1 000
9 5 9 6 9 7 9 8 9 9 0 0 0 1 0 2 0 3 0 4 0 5
54945912
6�666949
74487661
841�
9520 9489 95�98991
126�
1��9
1�88
14811465
1421
1487
16�9
157415�6
140�
Source:MPAA
NumberoffilmsproducedandnewreleasesintheUnitedStates|1995-2005
Admissionsandgrossboxoffice|1995-2005
TotalnewreleasesofwhichreleasedbyindependentsofwhichreleasedbyMajors
Admissions(millions)
Grossboxoffice(USDmillion)
US86,0%
EURinc/US8,5%
European�,1%
RestofWorld2,4%
Rated
Produced
�7
UnitedStates
Production
ThenumberoffilmsonfirstreleaseintheUnitedStatesincreasedby15titlesin2005to5�5films(520filmsin2004).MPAAcompaniesdistributedslightlylesstitlesin2005(190)thanin2004(198),while�45ofthenew2005titlesweredistributedbyindependents.699featureswereproducedwiththeintentionoftheatricalreleasein2005,a14%increaseonthetotalfor2004(611).
AveragetheatricalcostsforMPAAmembercom-paniesremainedstablein2005,shrinkingbyjust0.6%to96.2millionUSD.Despitea4%decreaseinaveragenegativecosts,marketingexpenditure,whichhadfallenin2004,roseagainin2005toreach�6.2millionUSD.Costsforfilmsproducedandmarketedbysubsidiariesandaffiliatedstu-diosfellbackoncemoreto�8.7millionUSD,ofwhich2�.5millionUSD(29.0millionin2004)representsnegativecostand15.2millionmar-ketingexpenditure(11.4millionin2004).
Distribution
WarnerBrotherswasthedistributorearningtopmarketshareonthedomesticmarketin2005,obtaining15.7%oftotalreceiptsprincipallyduetothesuccessofHarry Potter, Charlie and the Chocolate FactoryandBatman Begins.Lastyear’sleader,Sony,droppedbacktothirdplacewithashareof11.4%,withHitchandFun with Dick and Janethebestper-formingtitles.Fox,placed5thin2004,climbedtosecondplaceandadomesticmarketshareof15.4%in2005thanksprincipallytothefinalinstalmentofStar Wars,butalsotoMr. & Mrs. SmithandtheFantastic Four.Warner,Fox,SonyandUniversalallearnedrevenuesinexcessof1billionUSDatthedomesticboxofficein2005,onlythreedistribu-torshadpassedthismilestonein2004.
NorthAmericanboxofficechartsweredomi-natedbythefantasyandsciencefictiongenresin2004with6ofthetoptenfilmsfallingintothiscategory.Star Wars: Episode III – Revenge of the Sithwasthetoprankedfilm,closelyfollowedbyHarry Potter and the Goblet of FireandWar of the Worlds.In2005seventitlesgrossedmorethan200mil-lionUSD,twomorethanin2004.Howeverthenumberoftitlesgrossingbetween50and199mil-lionUSDfellback,with48titlesinthisrangein2005,comparedto58in2004.
Exhibition
TotaladmissionstocinemasintheUSin2005were1.4billion,an8.7%fallonthe1.54billionticketssoldin2004.Thisrepresentsthelowestlevelofattendancesince1997andthethirdcon-secutiveyearinwhichoveralladmissionshavedropped.Risingticketpricespartiallycushionedtheeffectofshrinkingattendanceonrevenue,withtotalboxofficereceiptsreaching8.99bil-lionUSD,a5.7%fallinrelationto2004.Averageticketpricesmovedaheadby�.2%,goingfrom6.21USDperticketin2004to6.41USDperticketin2005.Thedeclineinattendancepushedtheaverageadmissionspercapitaunderthe5visitsperyearmark,to4.7visitsperperson,closetopre-1990levels.
Atotalof�8852screenswereinoperationin2005,a6.2%increaseonthefigurereportedfor2004.Thenetgaincameprincipallyfromindoorscreens,whosenumberincreasedby2150.Drive-inscreensshowedanetgainalso,reversingadownwardtrend.Theyear-endtotalof709screensrepresentedan18%gainonthe2004totalof601screens.
Digitalcinema
2005alsomarkedtheyearinwhichtheindustrystandardsgrouping,DigitalCinemaInitiative,com-pleteditsworkandpublisheditsDigitalCinemaSystemSpecification.Thesespecificationslayoutastableframeworkforcommontechnicalstandardstobemetinthetransitiontodigitalprojection,thoughanumberofissues,inparticularcontentprotectionandcinemacompliancecertification,stillneedtobefinalised.Byend2005NorthAmericahadatotalof�24digitalcinemascreens,upfromjust85screensin2004.America’sthirdlargestchain,CarmikeCinemas,signedanagreementinDecember2005withChristie/AIX,acompanysetupforthedeploymentofdigitalcinema,todigitise2�00ofthechain’s2496screensbytheendof2007.Asmallerregionalchain,UltraStar,alsoannouncedinearly2006thatithaddigitised100%ofits102screens,againviatheinitiativerunbyChristie/AIX.
Sources:MPAA/NielsonEDI/Variety/ScreenDigest
US86,0%
EURinc/US8,5%
European�,1%
RestofWorld2,4%

�8
UnitedStates
Worldwideboxofficerevenues|2005USDbillion.
Source:MPAA
5
0
10
25
30
15
20
2000 2001 2004 200520032002
15,9216,96
19,76 20,�4
25,2�2�,24
Distributors’marketsharesontheNorthAmericanmarket|2005
Sources:NielsenEDI/Variety
WarnerBros15,7% Fox
15,4%
Sony11,4%
Universal11,�%
BuenaVista10,5%Paramount
9,�%
Dreamworks5,7%
NewLine4,7%
Miramax4,0%
LionsGate�,2%
Others8,8%

�9
UnitedStates
Top20filmsbyNorthAmericanboxoffice|2005GrossboxofficeUnitedStatesandCanada,inUSD.
Originaltitle Countryoforigin Distributor Grossboxoffice 1 StarWarsIII-RevengeoftheSith US 20thCenturyFox �80270577 2 HarryPotterandtheGobletofFire(2) GBinc/US Warner 27708�157 � WaroftheWorlds US Paramount 2�4280�54 4 TheChroniclesofNarnia(2) US/NZinc BuenaVista 22570��46 5 WeddingCrashers US NewLine 209218�68 6 CharlieandtheChocolateFactory GBinc/US Warner 206459076 7 BatmanBegins US/GBinc Warner 205�4�774 8 Madagascar US Dreamworks 19�2029�� 9 Mr.&Mrs.Smith US 20thCenturyFox 186��627910 Hitch US Sony 17757514211 KingKong(2) US/NZinc Universal 17455982512 TheLongestYard US Paramount 1581194601� FantasticFour US/DE 20thCenturyFox 15469608014 ChickenLittle(2) US BuenaVista 1�226508415 Robots US 20thCenturyFox 12820001216 MeettheFockers(1) US Universal 1167�89�017 ThePacifier US/CAinc BuenaVista 11�08686818 The40-Year-OldVirgin US Universal 10928900819 MillionDollarBaby(2) US Warner 99�9044�20 WalktheLine(2) US 20thCenturyFox 924�6258(1) Firstreleasein2004,2005grossonly.(2) Stillonreleasein2005. Source:Variety
AveragenegativeandmarketingcostsoffilmsproducedbyMPAAmembers|1990-2005
USDmillion.Source:MPAA
0
30
40
50
70
60
20
10
9 0 9 2 9 4 9 6 9 8 0 0 0 2 0 4
26,8
12,0 12,1 1�,5 14,1 16,1 17,719,8
22,�25,4 24,5
27,��1,0
9,511,2
14,711,4
15,2
�1,5 �4,0
46,9
29,02�,5�0,6
�9,0�4,4 �6,2
26,128,9 29,9
�6,4�4,�
5�,4
�9,8
51,552,747,7
54,8
6�,8 62,458,8 60,0 MPAAMember
NegativeCosts
MPAAMemberMarketingCosts
MPAASubsidiaries&AffiliatesNegativeCosts
MPAASubsidiaries&AffiliatesMarketingCosts
40
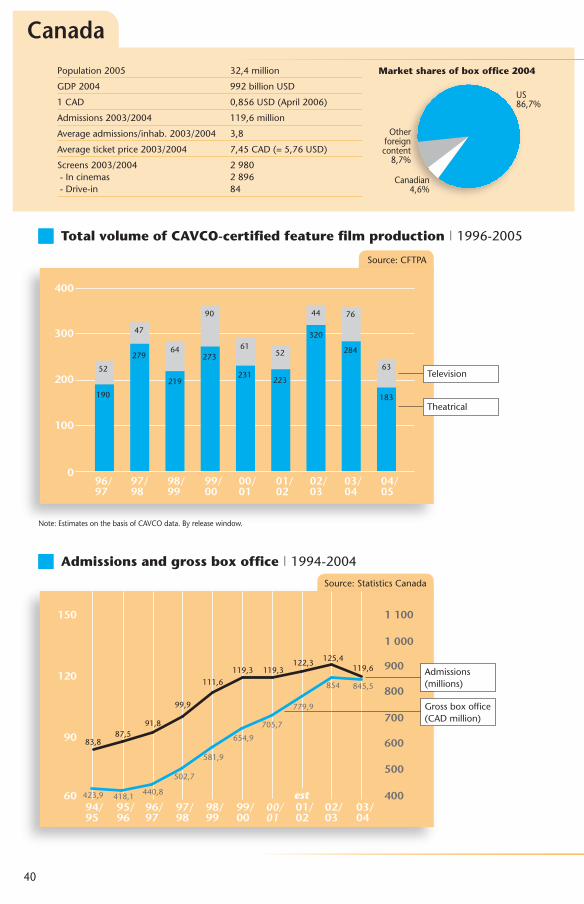
Population2005 �2,4million
GDP2004 992billionUSD
1CAD 0,856USD(April2006)
Admissions200�/2004 119,6million
Averageadmissions/inhab.200�/2004 �,8
Averageticketprice200�/2004 7,45CAD(=5,76USD)
Screens200�/2004 2980-Incinemas 2896-Drive-in 84
Canada
Admissionsandgrossboxoffice|1994-2004
TotalvolumeofCAVCO-certifiedfeaturefilmproduction|1996-2005
0
100
300
400
200
96/97
97/98
98/99
99/00
00/01
01/02
02/03
03/04
04/05
190
279
219
27�
2�122�
�20
284
18�
52
47
64
90
6152
44 76
6�
Source:CFTPA
60
90
120
400
500
1 100
1 000
900
800
700
600
150
94/95
95/96
96/97
97/98
98/99
99/00
00/01
est01/02
02/03
03/04
8�,887,5
91,8
99,9
111,6119,� 119,�
122,� 125,4119,6
42�,9 418,1 440,8
502,7
581,9
654,9
705,7
779,9
854 845,5
Source:StatisticsCanada
US86,7%
Marketsharesofboxoffice2004
Canadian4,6%
Admissions(millions)
Grossboxoffice(CADmillion)
Note:EstimatesonthebasisofCAVCOdata.Byreleasewindow.
Otherforeigncontent
8,7%
Television
Theatrical

41
Canada
Originaltitle Countryoforigin Year Director AdmissionsQuebec 1 HarryPotterandtheGobletofFire GBinc/US 2005 MikeNewell 101�625 2 StarWars:Ep.III-RevengeoftheSith US 2005 GeorgeLucas 8507�8 � C.R.A.Z.Y. CA(QC) 2005 Jean-MarcVallée 7811�7 4 Aurore CA(QC) 2005 LucDionne 706811 5 Horlogebiologique CA(QC) 2005 RicardoTrogi 54��61 6 WaroftheWorlds US 2005 StevenSpielberg 5�8552 7 Madagascar US 2005 EricDarnell&TomMcGrath 50�776 8 Hitch US 2005 AndyTennant 4�9048 9 BatmanBegins US/GBinc 2005 ChristopherNolan 42277410 Lesurvenant CA(QC) 2005 EricCanuel 41559811 MauriceRichard CA(QC) 2005 CharlesBinamé 41�51212 LesBoys4 CA(QC) 2005 GeorgesMihalka&LouisSaïa 40�5901� Mr.&Mrs.Smith US 2004 DougLiman �8929214 FantasticFour US/DE 2005 TimStory �6759415 KingKong US/NZinc 2005 PeterJackson �6161216 MillionDollarBaby US 2004 ClintEastwood �5�40�17 WeddingCrashers US 2005 DavidDobkin ��141518 TheAviator(1) US/JP 2004 MartinScorsese �1776�19 MeettheFockers(2) US 2004 JayRoach 29594620 Robots US 2005 ChrisWedge&CarlosSaldanha 27�765(1) 9�568admissionsin2004.(2) 1601�8admissionsin2004. Source:ObservatoiredelacultureetdescommunicationsduQuébec
Top20filmsbyadmissionsinQuebec|2005
Exhibitionanddistribution
CinemaattendancefellinCanadain200�/2004forthefirsttimeinadecade,shrinkingby4.6%andbringingtoanendaperiodofcontinuousupwardprogression.Boxofficereceiptsalsofellback,butonlyby1%,reflectinga2%increaseintheaverageticketprice.StatisticsCanada,whoseMotionPictureTheatresSurveyisthesourceofthisdata,suggeststhattheSARSscareduringSpring200�,togetherwithashortageofblock-bustersreleasedduringtheperiodinquestion,mayhavebeenfactorscontributingtothisdownturn.Overthesameperiod,notesaparallelsurveybyStatisticsCanada,revenuefromthewholesalingofDVDsandvideocassettesrecordeda12.9%rise,thebiggestincreaseinfiveyears.
OntheFrench-speakingmarketofQuebec,overallattendancefellbackforthirdyearinsucces-sionin2005,withatotalof26.2millionticketssold(-7%).Asin2004,thedropinadmissionsdidnotaffectthepopularityofQuebec-producedFrench-languagefilms,whosemarketsharereachedanewhighof18.9%andforwhich5millionticketsweresoldin2005(1�.8%in2004).NostalgicdramaC.R.A.Z.Y.atnumberthreewasthehighestplaced
ofthefourlocaltitlesappearingintheQuebecTop10,followedbyAuroreandHorloge Biologique infourthandfifthplacesrespectively.
Production
FigurespublishedbytheCanadianFilmandTelevisionProducersAssociation(CFTPA)showthattheoverallvalueoffilmandtelevisionpro-ductioninCanadain2004/2005amountedto4.5billionCAD,a9%dropinrelationto200�/2004.Thedecreasewasprincipallyduetoa2�%dropinthevalueofforeignlocationproduction,withatotalvolumeof1.46billionCADrecordedfor2004/2005(1.9billionCADin200�/2004).Canadianfeaturefilmproductionalsoexperiencedadecline,shrinkinginvalueby�1%toreachatotalof25�millionCAD(�69millionCADin200�/2004).ThisispartlytheresultoftheimpactonCanadianco-producersofpolicyandregulatorychangesinEurope,particularlyintheUnitedKingdom,andtheresultingdeclineintreatyco-productionactivity.
Sources:StatisticsCanada/Observatoiredelacultureetdescommunications
duQuébec/CFTPA
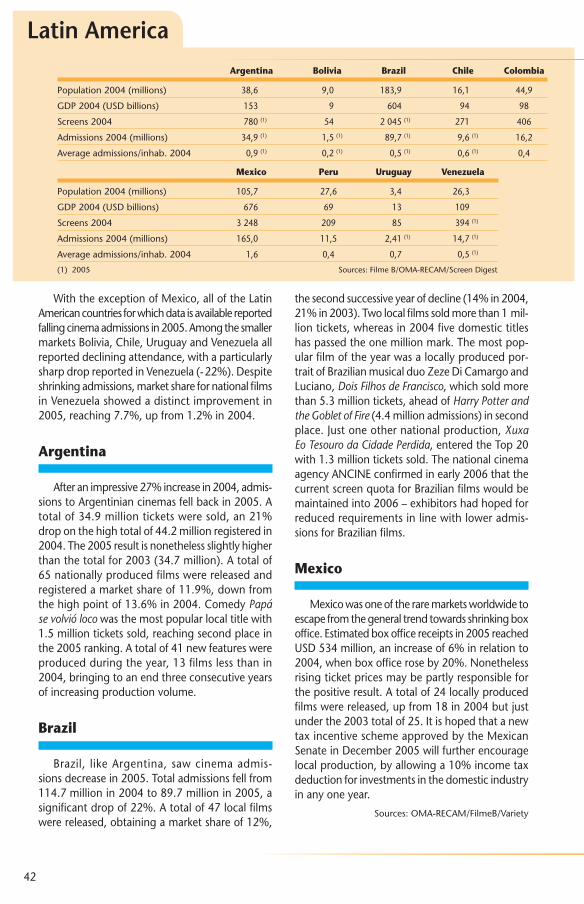
42
Argentina Bolivia Brazil Chile Colombia
Population2004(millions) �8,6 9,0 18�,9 16,1 44,9
GDP2004(USDbillions) 15� 9 604 94 98
Screens2004 780(1) 54 2045(1) 271 406
Admissions2004(millions) �4,9(1) 1,5(1) 89,7(1) 9,6(1) 16,2
Averageadmissions/inhab.2004 0,9(1) 0,2(1) 0,5(1) 0,6(1) 0,4
Mexico Peru Uruguay Venezuela
Population2004(millions) 105,7 27,6 �,4 26,�
GDP2004(USDbillions) 676 69 1� 109
Screens2004 �248 209 85 �94(1)
Admissions2004(millions) 165,0 11,5 2,41(1) 14,7(1)
Averageadmissions/inhab.2004 1,6 0,4 0,7 0,5(1)
(1) 2005 Sources:FilmeB/OMA-RECAM/ScreenDigest
Latin America
WiththeexceptionofMexico,alloftheLatinAmericancountriesforwhichdataisavailablereportedfallingcinemaadmissionsin2005.AmongthesmallermarketsBolivia,Chile,UruguayandVenezuelaallreporteddecliningattendance,withaparticularlysharpdropreportedinVenezuela(-22%).Despiteshrinkingadmissions,marketsharefornationalfilmsinVenezuelashowedadistinctimprovementin2005,reaching7.7%,upfrom1.2%in2004.
Argentina
Afteranimpressive27%increasein2004,admis-sionstoArgentiniancinemasfellbackin2005.Atotalof�4.9millionticketsweresold,an21%droponthehightotalof44.2millionregisteredin2004.The2005resultisnonethelessslightlyhigherthanthetotalfor200�(�4.7million).Atotalof65nationallyproducedfilmswerereleasedandregisteredamarketshareof11.9%,downfromthehighpointof1�.6%in2004.ComedyPapá se volvió locowasthemostpopularlocaltitlewith1.5millionticketssold,reachingsecondplaceinthe2005ranking.Atotalof41newfeatureswereproducedduringtheyear,1�filmslessthanin2004,bringingtoanendthreeconsecutiveyearsofincreasingproductionvolume.
Brazil
Brazil, likeArgentina,sawcinemaadmis-sionsdecreasein2005.Totaladmissionsfellfrom114.7millionin2004to89.7millionin2005,asignificantdropof22%.Atotalof47localfilmswerereleased,obtainingamarketshareof12%,
thesecondsuccessiveyearofdecline(14%in2004,21%in200�).Twolocalfilmssoldmorethan1mil-liontickets,whereasin2004fivedomestictitleshaspassedtheonemillionmark.Themostpop-ularfilmoftheyearwasalocallyproducedpor-traitofBrazilianmusicalduoZezeDiCamargoandLuciano,Dois Filhos de Francisco,whichsoldmorethan5.�milliontickets,aheadofHarry Potter and the Goblet of Fire(4.4millionadmissions)insecondplace.Justoneothernationalproduction,Xuxa Eo Tesouro da Cidade Perdida,enteredtheTop20with1.�millionticketssold.ThenationalcinemaagencyANCINEconfirmedinearly2006thatthecurrentscreenquotaforBrazilianfilmswouldbemaintainedinto2006–exhibitorshadhopedforreducedrequirementsinlinewithloweradmis-sionsforBrazilianfilms.
Mexico
Mexicowasoneoftheraremarketsworldwidetoescapefromthegeneraltrendtowardsshrinkingboxoffice.Estimatedboxofficereceiptsin2005reachedUSD5�4million,anincreaseof6%inrelationto2004,whenboxofficeroseby20%.Nonethelessrisingticketpricesmaybepartlyresponsibleforthepositiveresult.Atotalof24locallyproducedfilmswerereleased,upfrom18in2004butjustunderthe200�totalof25.ItishopedthatanewtaxincentiveschemeapprovedbytheMexicanSenateinDecember2005willfurtherencouragelocalproduction,byallowinga10%incometaxdeductionforinvestmentsinthedomesticindustryinanyoneyear.
Sources:OMA-RECAM/FilmeB/Variety
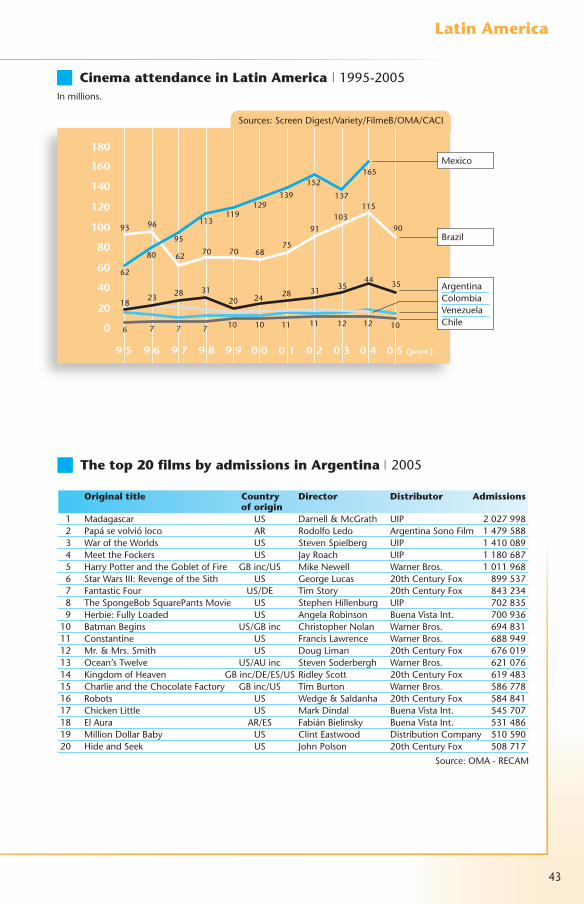
4�
LatinAmerica
Originaltitle Country Director Distributor Admissions oforigin 1 Madagascar US Darnell&McGrath UIP 2027998 2 Papásevolvióloco AR RodolfoLedo ArgentinaSonoFilm 1479588 � WaroftheWorlds US StevenSpielberg UIP 1410089 4 MeettheFockers US JayRoach UIP 1180687 5 HarryPotterandtheGobletofFire GBinc/US MikeNewell WarnerBros. 1011968 6 StarWarsIII:RevengeoftheSith US GeorgeLucas 20thCenturyFox 8995�7 7 FantasticFour US/DE TimStory 20thCenturyFox 84�2�4 8 TheSpongeBobSquarePantsMovie US StephenHillenburg UIP 7028�5 9 Herbie:FullyLoaded US AngelaRobinson BuenaVistaInt. 7009�610 BatmanBegins US/GBinc ChristopherNolan WarnerBros. 6948�111 Constantine US FrancisLawrence WarnerBros. 68894912 Mr.&Mrs.Smith US DougLiman 20thCenturyFox 6760191� Ocean’sTwelve US/AUinc StevenSoderbergh WarnerBros. 62107614 KingdomofHeaven GBinc/DE/ES/USRidleyScott 20thCenturyFox 61948�15 CharlieandtheChocolateFactory GBinc/US TimBurton WarnerBros. 58677816 Robots US Wedge&Saldanha 20thCenturyFox 58484117 ChickenLittle US MarkDindal BuenaVistaInt. 54570718 ElAura AR/ES FabiánBielinsky BuenaVistaInt. 5�148619 MillionDollarBaby US ClintEastwood DistributionCompany 51059020 HideandSeek US JohnPolson 20thCenturyFox 508717
Source:OMA-RECAM
Thetop20filmsbyadmissionsinArgentina|2005
CinemaattendanceinLatinAmerica|1995-2005Inmillions.
Sources:ScreenDigest/Variety/FilmeB/OMA/CACI
0
60
120
180
40
100
160
140
80
20
9 5 9 6 9 7 9 8 9 9 0 0 0 1 0 2 0 3 0 4 0 5 (prov.)
9�
62
18
6 7 7 7 10 10 11 11 12 12 10
2� 28 �120 24 28 �1 �5
44 �5
80
95
11�119
1291�9
152
1�7
165
96
62 70 70 6875
9110�
115
90Brazil
Mexico
ArgentinaColombiaVenezuelaChile

44
Population2005 20,52million
GDP2004 616billionUSD
1AUD 0,7�EUR(March2006)
Admissions2005 82,2million
Averageadmissions/inhab.2005 4,01
Averageticketprice2005 9,94AUD(=7,24USD)
Screens2005 194�
Australia
France1%
Marketshares2005
National2,8%
US81,2%
UnitedKingdom
10,6%
Others4,�%
0
20
40
30
10
1994/1995
1996/1997
1998/1999
2000/2001
2002/2003
2004/2005
17
14
2
1 2 2 20 1 1
�1
�
0
5
2 � 42
57
57
9
28
2�
�5
�1
�8
�4��
29
29
26
�0
22
��
24
2�
16
24
16
�1
19
Source:AFC
50
60
70
80
400
1 000
900
800
700
600
500
100
90
9 5 9 6 9 7 9 8 9 9 0 0 0 1 0 2 0 3 0 4 0 5
69,9
74,076,0
80,0
88,0
82,2
92,5 92,589,8
91,5
82,2
501,45�6,8
58�,9
629,�
704,1
689,5
821,4844,8
865,8
907,2
817,5
Sources:MPDAA/AFC
NumberoffeaturefilmsproducedinAustralia|1994-2005
Admissionsandgrossboxoffice|1995-2005
Foreignfilms
Officialco-productions
Total
100%national
Admissions(millions)
Grossboxoffice(AUDmillion)
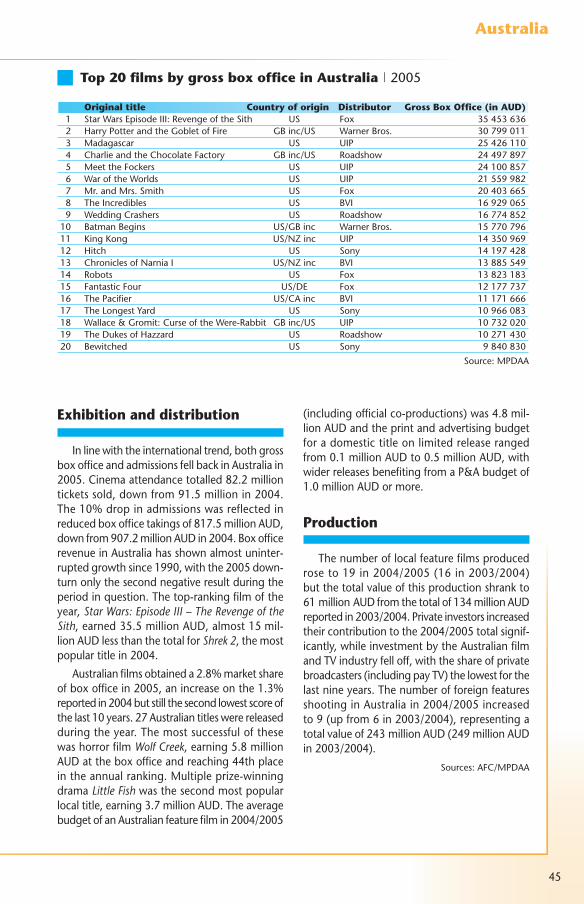
45
Australia
Originaltitle Countryoforigin Distributor GrossBoxOffice(inAUD) 1 StarWarsEpisodeIII:RevengeoftheSith US Fox �545�6�6 2 HarryPotterandtheGobletofFire GBinc/US WarnerBros. �0799011 � Madagascar US UIP 25426110 4 CharlieandtheChocolateFactory GBinc/US Roadshow 24497897 5 MeettheFockers US UIP 24100857 6 WaroftheWorlds US UIP 21559982 7 Mr.andMrs.Smith US Fox 2040�665 8 TheIncredibles US BVI 16929065 9 WeddingCrashers US Roadshow 1677485210 BatmanBegins US/GBinc WarnerBros. 1577079611 KingKong US/NZinc UIP 14�5096912 Hitch US Sony 141974281� ChroniclesofNarniaI US/NZinc BVI 1�88554914 Robots US Fox 1�82�18�15 FantasticFour US/DE Fox 121777�716 ThePacifier US/CAinc BVI 1117166617 TheLongestYard US Sony 1096608�18 Wallace&Gromit:CurseoftheWere-Rabbit GBinc/US UIP 107�202019 TheDukesofHazzard US Roadshow 102714�020 Bewitched US Sony 98408�0
Source:MPDAA
Top20filmsbygrossboxofficeinAustralia|2005
Exhibitionanddistribution
Inlinewiththeinternationaltrend,bothgrossboxofficeandadmissionsfellbackinAustraliain2005.Cinemaattendancetotalled82.2millionticketssold,downfrom91.5millionin2004.The10%dropinadmissionswasreflectedinreducedboxofficetakingsof817.5millionAUD,downfrom907.2millionAUDin2004.BoxofficerevenueinAustraliahasshownalmostuninter-ruptedgrowthsince1990,withthe2005down-turnonlythesecondnegativeresultduringtheperiodinquestion.Thetop-rankingfilmoftheyear,Star Wars: Episode III – The Revenge of the Sith,earned�5.5millionAUD,almost15mil-lionAUDlessthanthetotalforShrek 2,themostpopulartitlein2004.
Australianfilmsobtaineda2.8%marketshareofboxofficein2005,anincreaseonthe1.�%reportedin2004butstillthesecondlowestscoreofthelast10years.27Australiantitleswerereleasedduringtheyear.ThemostsuccessfulofthesewashorrorfilmWolf Creek,earning5.8millionAUDattheboxofficeandreaching44thplaceintheannualranking.Multipleprize-winningdramaLittle Fishwasthesecondmostpopularlocaltitle,earning�.7millionAUD.TheaveragebudgetofanAustralianfeaturefilmin2004/2005
(includingofficialco-productions)was4.8mil-lionAUDandtheprintandadvertisingbudgetforadomestictitleonlimitedreleaserangedfrom0.1millionAUDto0.5millionAUD,withwiderreleasesbenefitingfromaP&Abudgetof1.0millionAUDormore.
Production
Thenumberoflocalfeaturefilmsproducedroseto19in2004/2005(16in200�/2004)butthetotalvalueofthisproductionshrankto61millionAUDfromthetotalof1�4millionAUDreportedin200�/2004.Privateinvestorsincreasedtheircontributiontothe2004/2005totalsignif-icantly,whileinvestmentbytheAustralianfilmandTVindustryfelloff,withtheshareofprivatebroadcasters(includingpayTV)thelowestforthelastnineyears.ThenumberofforeignfeaturesshootinginAustraliain2004/2005increasedto9(upfrom6in200�/2004),representingatotalvalueof24�millionAUD(249millionAUDin200�/2004).
Sources:AFC/MPDAA

46
HongKong Indonesia Malaysia Philippines Singapore Taiwan Thailand
Population2004(millions) 7,0 220,8 24,9 81,6 4,� 2�,0 6�,7
GDP2004(USDbillions) 16� 258 104 85 107 �26 16�
Admissions2004(millions) 16,8(1) 42,0 16,7 6�,7 14,8 21,4(1) �5,8
Admissions/inhabitant2004 2,4(1) 0,2 0,8(1) 0,8 �,5(1) 0,9(1) 0,6
(1) 2005
Asia
CinemascreensinAsia|1997-2005
1997 1998 1999 2000 2001 2002 2003 2004 2005HongKong 179 185 189 178 175 184 188 197 200Indonesia 2150 2100 2100 2050 2000 850 850 876 ~Malaysia �09 �10 �10 �10 �00 295 20� 22� ~Philippines 970 950 950 950 940 900 870 825 ~Singapore 1�5 147 144 1�4 145 145 147 147 151Taiwan 666 672 67� 680 690 669 684 694 660Thailand �60 �60 �75 �90 �95 465 495 5�0 ~
Sources:HKTheatresAssociation/ScreenDigest/SingaporeMDA/InstitutfrançaisdeTaipei
prov.
AdmissionsinAsia|1995-2005Inmillions.
0
90
120
150
30
60
9 5 9 6 9 7 9 8 9 9 0 0 0 1 0 2 0 3 0 5 (prov.)0 4
120,�
25
19,7 16,1 16,1 14,2 1�,6 12,4 11,1 10,2 11,616,7
21,4
��
25,1
27,2
20,221,8 19,6
19,7 16,821,6
1�1
120
105
82,5 82 80 80
40 40 42
6�,7
78
Sources:ScreenDigest/MDASingapore/HKMPIA
Philippines
IndonesiaThailand
TaiwanHongKongSingaporeMalaysiaest
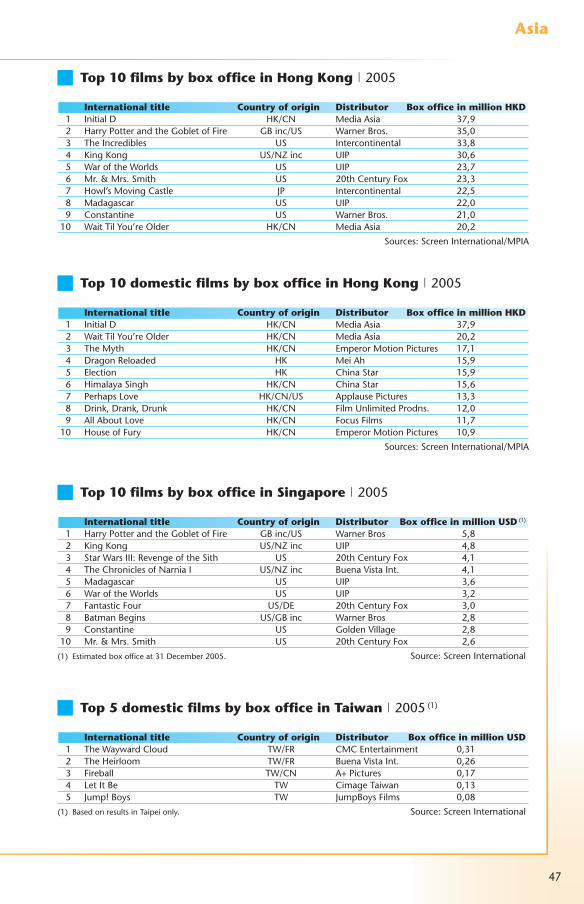
47
Asia
Internationaltitle Countryoforigin Distributor BoxofficeinmillionHKD 1 InitialD HK/CN MediaAsia �7,9 2 HarryPotterandtheGobletofFire GBinc/US WarnerBros. �5,0 � TheIncredibles US Intercontinental ��,8 4 KingKong US/NZinc UIP �0,6 5 WaroftheWorlds US UIP 2�,7 6 Mr.&Mrs.Smith US 20thCenturyFox 2�,� 7 Howl’sMovingCastle JP Intercontinental 22,5 8 Madagascar US UIP 22,0 9 Constantine US WarnerBros. 21,010 WaitTilYou’reOlder HK/CN MediaAsia 20,2
Sources:ScreenInternational/MPIA
Top10filmsbyboxofficeinHongKong|2005
Internationaltitle Countryoforigin Distributor BoxofficeinmillionUSD(1)
1 HarryPotterandtheGobletofFire GBinc/US WarnerBros 5,8 2 KingKong US/NZinc UIP 4,8 � StarWarsIII:RevengeoftheSith US 20thCenturyFox 4,1 4 TheChroniclesofNarniaI US/NZinc BuenaVistaInt. 4,1 5 Madagascar US UIP �,6 6 WaroftheWorlds US UIP �,2 7 FantasticFour US/DE 20thCenturyFox �,0 8 BatmanBegins US/GBinc WarnerBros 2,8 9 Constantine US GoldenVillage 2,810 Mr.&Mrs.Smith US 20thCenturyFox 2,6
(1) Estimatedboxofficeat�1December2005. Source:ScreenInternational
Top10filmsbyboxofficeinSingapore|2005
Internationaltitle Countryoforigin Distributor BoxofficeinmillionUSD 1 TheWaywardCloud TW/FR CMCEntertainment 0,�1 2 TheHeirloom TW/FR BuenaVistaInt. 0,26 � Fireball TW/CN A+Pictures 0,17 4 LetItBe TW CimageTaiwan 0,1� 5 Jump!Boys TW JumpBoysFilms 0,08
(1) BasedonresultsinTaipeionly. Source:ScreenInternational
Top5domesticfilmsbyboxofficeinTaiwan|2005(1)
Internationaltitle Countryoforigin Distributor BoxofficeinmillionHKD 1 InitialD HK/CN MediaAsia �7,9 2 WaitTilYou’reOlder HK/CN MediaAsia 20,2 � TheMyth HK/CN EmperorMotionPictures 17,1 4 DragonReloaded HK MeiAh 15,9 5 Election HK ChinaStar 15,9 6 HimalayaSingh HK/CN ChinaStar 15,6 7 PerhapsLove HK/CN/US ApplausePictures 1�,� 8 Drink,Drank,Drunk HK/CN FilmUnlimitedProdns. 12,0 9 AllAboutLove HK/CN FocusFilms 11,710 HouseofFury HK/CN EmperorMotionPictures 10,9
Sources:ScreenInternational/MPIA
Top10domesticfilmsbyboxofficeinHongKong|2005
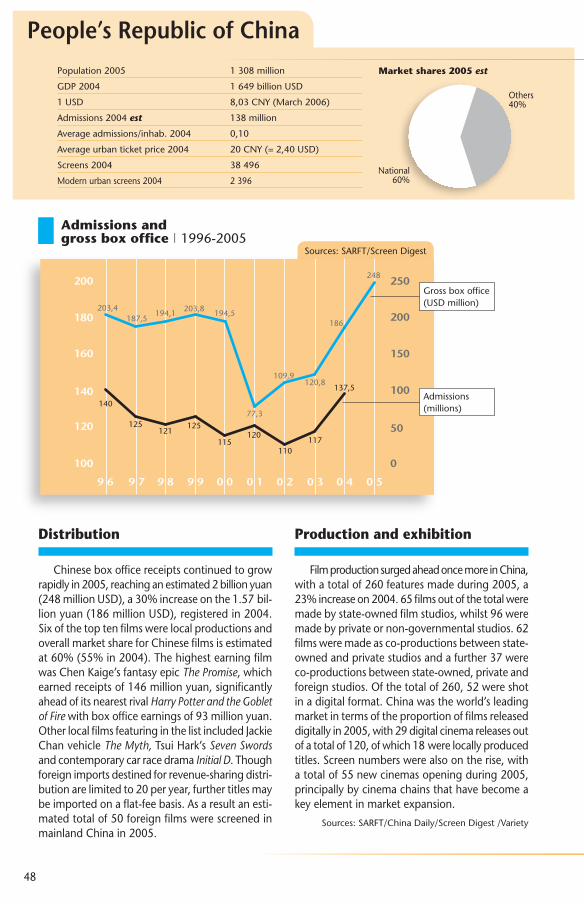
48
Population2005 1�08million
GDP2004 1649billionUSD
1USD 8,0�CNY(March2006)
Admissions2004est 1�8million
Averageadmissions/inhab.2004 0,10
Averageurbanticketprice2004 20CNY(=2,40USD)
Screens2004 �8496
Modernurbanscreens2004 2�96
People’s Republic of China
Others40%
Marketshares2005est
National60%
Distribution
Chineseboxofficereceiptscontinuedtogrowrapidlyin2005,reachinganestimated2billionyuan(248millionUSD),a�0%increaseonthe1.57bil-lionyuan(186millionUSD),registeredin2004.SixofthetoptenfilmswerelocalproductionsandoverallmarketshareforChinesefilmsisestimatedat60%(55%in2004).ThehighestearningfilmwasChenKaige’sfantasyepicThe Promise,whichearnedreceiptsof146millionyuan,significantlyaheadofitsnearestrivalHarry Potter and the Goblet of Firewithboxofficeearningsof9�millionyuan.OtherlocalfilmsfeaturinginthelistincludedJackieChanvehicleThe Myth, TsuiHark’sSeven Swordsandcontemporarycarracedrama Initial D.Thoughforeignimportsdestinedforrevenue-sharingdistri-butionarelimitedto20peryear,furthertitlesmaybeimportedonaflat-feebasis.Asaresultanesti-matedtotalof50foreignfilmswerescreenedinmainlandChinain2005.
Productionandexhibition
FilmproductionsurgedaheadoncemoreinChina,withatotalof260featuresmadeduring2005,a2�%increaseon2004.65filmsoutofthetotalweremadebystate-ownedfilmstudios,whilst96weremadebyprivateornon-governmentalstudios.62filmsweremadeasco-productionsbetweenstate-ownedandprivatestudiosandafurther�7wereco-productionsbetweenstate-owned,privateandforeignstudios.Ofthetotalof260,52wereshotinadigitalformat.Chinawastheworld’sleadingmarketintermsoftheproportionoffilmsreleaseddigitallyin2005,with29digitalcinemareleasesoutofatotalof120,ofwhich18werelocallyproducedtitles.Screennumberswerealsoontherise,withatotalof55newcinemasopeningduring2005,principallybycinemachainsthathavebecomeakeyelementinmarketexpansion.
Sources:SARFT/ChinaDaily/ScreenDigest/Variety
100
50
150
200
100
250200
140
180
160
120
9 6 9 7 9 8 9 9 0 0 0 1 0 2 0 4 0 50 3
0
140
125121
125
115120
110117
1�7,5
20�,4187,5
194,1 20�,8 194,5
77,�
109,9120,8
186
248
Sources:SARFT/ScreenDigest
Admissionsandgrossboxoffice|1996-2005
Grossboxoffice(USDmillion)
Admissions(millions)
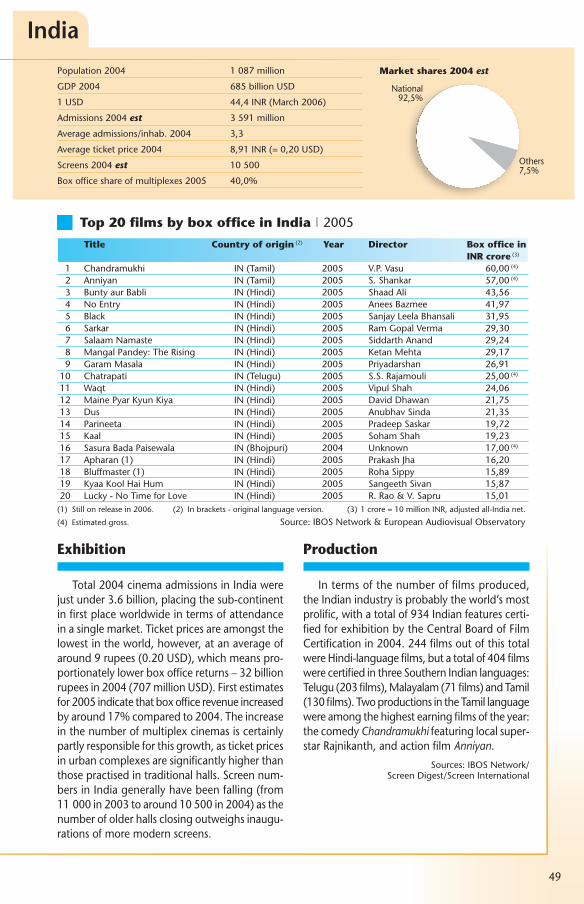
49
Population2004 1087million
GDP2004 685billionUSD
1USD 44,4INR(March2006)
Admissions2004est �591million
Averageadmissions/inhab.2004 �,�
Averageticketprice2004 8,91INR(=0,20USD)
Screens2004est 10500
Boxofficeshareofmultiplexes2005 40,0%
India
Others7,5%
Marketshares2004est
National92,5%
Exhibition
Total2004cinemaadmissionsinIndiawerejustunder�.6billion,placingthesub-continentinfirstplaceworldwideintermsofattendanceinasinglemarket.Ticketpricesareamongstthelowestintheworld,however,atanaverageofaround9rupees(0.20USD),whichmeanspro-portionatelylowerboxofficereturns–�2billionrupeesin2004(707millionUSD).Firstestimatesfor2005indicatethatboxofficerevenueincreasedbyaround17%comparedto2004.Theincreaseinthenumberofmultiplexcinemasiscertainlypartlyresponsibleforthisgrowth,asticketpricesinurbancomplexesaresignificantlyhigherthanthosepractisedintraditionalhalls.Screennum-bersinIndiagenerallyhavebeenfalling(from11000in200�toaround10500in2004)asthenumberofolderhallsclosingoutweighsinaugu-rationsofmoremodernscreens.
Production
Intermsofthenumberoffilmsproduced,theIndianindustryisprobablytheworld’smostprolific,withatotalof9�4Indianfeaturescerti-fiedforexhibitionbytheCentralBoardofFilmCertificationin2004.244filmsoutofthistotalwereHindi-languagefilms,butatotalof404filmswerecertifiedinthreeSouthernIndianlanguages:Telugu(20�films),Malayalam(71films)andTamil(1�0films).TwoproductionsintheTamillanguagewereamongthehighestearningfilmsoftheyear:thecomedyChandramukhifeaturinglocalsuper-starRajnikanth,andactionfilmAnniyan.
Sources:IBOSNetwork/ScreenDigest/ScreenInternational
Title Countryoforigin(2) Year Director Boxofficein INRcrore(�) 1 Chandramukhi IN(Tamil) 2005 V.P.Vasu 60,00(4)
2 Anniyan IN(Tamil) 2005 S.Shankar 57,00(4)
� BuntyaurBabli IN(Hindi) 2005 ShaadAli 4�,56 4 NoEntry IN(Hindi) 2005 AneesBazmee 41,97 5 Black IN(Hindi) 2005 SanjayLeelaBhansali �1,95 6 Sarkar IN(Hindi) 2005 RamGopalVerma 29,�0 7 SalaamNamaste IN(Hindi) 2005 SiddarthAnand 29,24 8 MangalPandey:TheRising IN(Hindi) 2005 KetanMehta 29,17 9 GaramMasala IN(Hindi) 2005 Priyadarshan 26,9110 Chatrapati IN(Telugu) 2005 S.S.Rajamouli 25,00(4)
11 Waqt IN(Hindi) 2005 VipulShah 24,0612 MainePyarKyunKiya IN(Hindi) 2005 DavidDhawan 21,751� Dus IN(Hindi) 2005 AnubhavSinda 21,�514 Parineeta IN(Hindi) 2005 PradeepSaskar 19,7215 Kaal IN(Hindi) 2005 SohamShah 19,2�16 SasuraBadaPaisewala IN(Bhojpuri) 2004 Unknown 17,00(4)
17 Apharan(1) IN(Hindi) 2005 PrakashJha 16,2018 Bluffmaster(1) IN(Hindi) 2005 RohaSippy 15,8919 KyaaKoolHaiHum IN(Hindi) 2005 SangeethSivan 15,8720 Lucky-NoTimeforLove IN(Hindi) 2005 R.Rao&V.Sapru 15,01(1) Stillonreleasein2006. (2) Inbrackets-originallanguageversion. (�)1crore=10millionINR,adjustedall-Indianet.
(4) Estimatedgross. Source:IBOSNetwork&EuropeanAudiovisualObservatory
Top20filmsbyboxofficeinIndia|2005
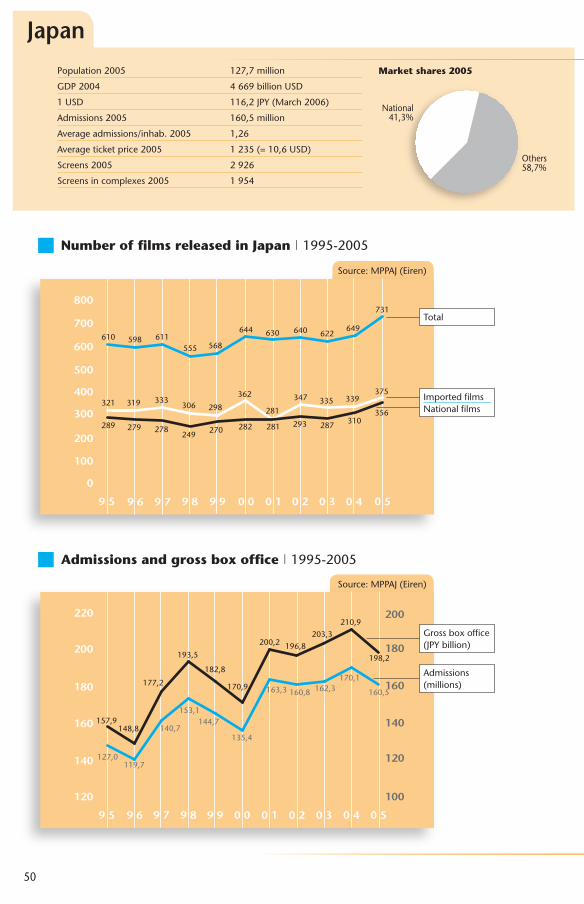
50
Population2005 127,7million
GDP2004 4669billionUSD
1USD 116,2JPY(March2006)
Admissions2005 160,5million
Averageadmissions/inhab.2005 1,26
Averageticketprice2005 12�5(=10,6USD)
Screens2005 2926
Screensincomplexes2005 1954
Japan
0
200
400
500
600
700
800
300
100
9 5 9 79 6 9 8 9 9 0 0 0 1 0 2 0 3 0 4 0 5
610
�21
289 279 278249 270 282 281 29� 287 �10
�56�19 ���
�06 298
�62
281
�47 ��5 ��9�75
598 611555 568
644 6�0 640 622649
7�1
Source:MPPAJ(Eiren)
120
140
200
180
160
100
120
140
160
180
200220
9 5 9 6 9 7 9 8 9 9 0 0 0 1 0 2 0 3 0 4 0 5
157,9148,8
177,2
19�,5
182,8
170,9
200,2 196,820�,�
210,9
198,2
127,0119,7
140,7
15�,1144,7
1�5,4
16�,� 160,8 162,�170,1
160,5
Source:MPPAJ(Eiren)
NumberoffilmsreleasedinJapan|1995-2005
Admissionsandgrossboxoffice|1995-2005
Marketshares2005
National41,�%
Others58,7%
Total
ImportedfilmsNationalfilms
Admissions(millions)
Grossboxoffice(JPYbillion)
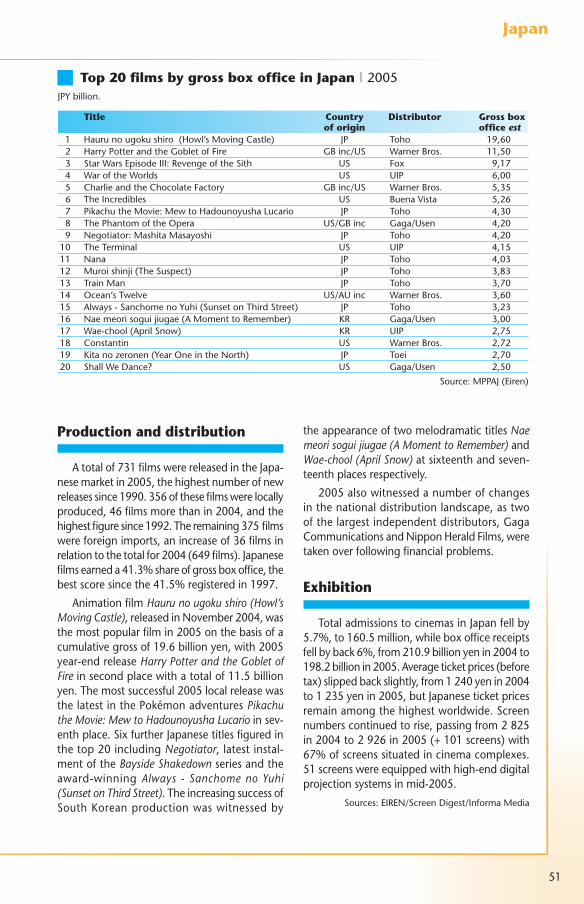
51
Japan
Title Country Distributor Grossbox oforigin officeest 1 Haurunougokushiro(Howl’sMovingCastle) JP Toho 19,60 2 HarryPotterandtheGobletofFire GBinc/US WarnerBros. 11,50 � StarWarsEpisodeIII:RevengeoftheSith US Fox 9,17 4 WaroftheWorlds US UIP 6,00 5 CharlieandtheChocolateFactory GBinc/US WarnerBros. 5,�5 6 TheIncredibles US BuenaVista 5,26 7 PikachutheMovie:MewtoHadounoyushaLucario JP Toho 4,�0 8 ThePhantomoftheOpera US/GBinc Gaga/Usen 4,20 9 Negotiator:MashitaMasayoshi JP Toho 4,2010 TheTerminal US UIP 4,1511 Nana JP Toho 4,0�12 Muroishinji(TheSuspect) JP Toho �,8�1� TrainMan JP Toho �,7014 Ocean’sTwelve US/AUinc WarnerBros. �,6015 Always-SanchomenoYuhi(SunsetonThirdStreet) JP Toho �,2�16 Naemeorisoguijiugae(AMomenttoRemember) KR Gaga/Usen �,0017 Wae-chool(AprilSnow) KR UIP 2,7518 Constantin US WarnerBros. 2,7219 Kitanozeronen(YearOneintheNorth) JP Toei 2,7020 ShallWeDance? US Gaga/Usen 2,50
Source:MPPAJ(Eiren)
Productionanddistribution
Atotalof7�1filmswerereleasedintheJapa-nesemarketin2005,thehighestnumberofnewreleasessince1990.�56ofthesefilmswerelocallyproduced,46filmsmorethanin2004,andthehighestfiguresince1992.Theremaining�75filmswereforeignimports,anincreaseof�6filmsinrelationtothetotalfor2004(649films).Japanesefilmsearneda41.�%shareofgrossboxoffice,thebestscoresincethe41.5%registeredin1997.
AnimationfilmHauru no ugoku shiro (Howl’s Moving Castle),releasedinNovember2004,wasthemostpopularfilmin2005onthebasisofacumulativegrossof19.6billionyen,with2005year-endreleaseHarry Potter and the Goblet of Fireinsecondplacewithatotalof11.5billionyen.Themostsuccessful2005localreleasewasthelatestinthePokémonadventuresPikachu the Movie: Mew to Hadounoyusha Lucarioinsev-enthplace.SixfurtherJapanesetitlesfiguredinthetop20includingNegotiator,latestinstal-mentoftheBayside Shakedownseriesandtheaward-winningAlways - Sanchome no Yuhi (Sunset on Third Street).TheincreasingsuccessofSouthKoreanproductionwaswitnessedby
theappearanceoftwomelodramatictitlesNae meori sogui jiugae (A Moment to Remember)andWae-chool (April Snow) atsixteenthandseven-teenthplacesrespectively.
2005alsowitnessedanumberofchangesinthenationaldistributionlandscape,astwoofthelargestindependentdistributors,GagaCommunicationsandNipponHeraldFilms,weretakenoverfollowingfinancialproblems.
Exhibition
TotaladmissionstocinemasinJapanfellby5.7%,to160.5million,whileboxofficereceiptsfellbyback6%,from210.9billionyenin2004to198.2billionin2005.Averageticketprices(beforetax)slippedbackslightly,from1240yenin2004to12�5yenin2005,butJapaneseticketpricesremainamongthehighestworldwide.Screennumberscontinuedtorise,passingfrom2825in2004to2926in2005(+101screens)with67%ofscreenssituatedincinemacomplexes.51screenswereequippedwithhigh-enddigitalprojectionsystemsinmid-2005.
Sources:EIREN/ScreenDigest/InformaMedia
Top20filmsbygrossboxofficeinJapan|2005JPYbillion.
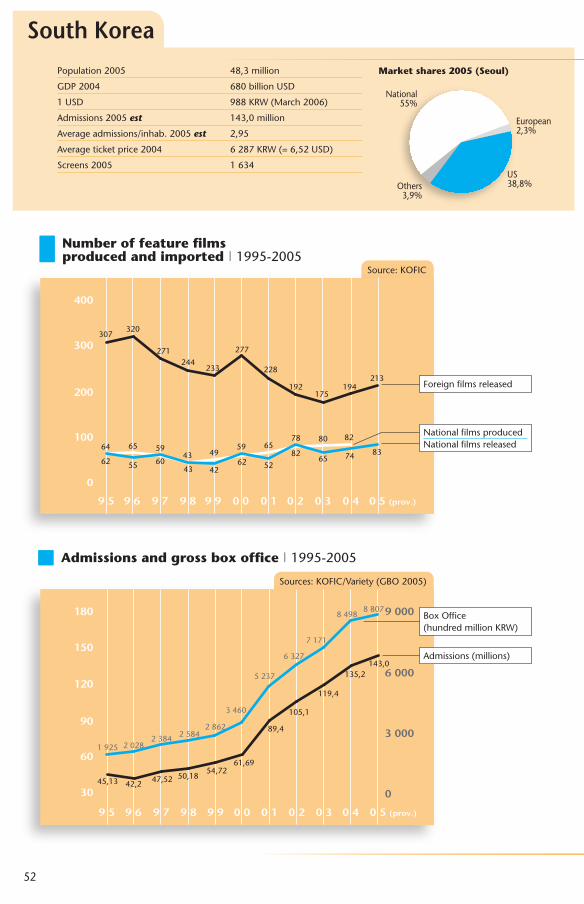
52
Population2005 48,�million
GDP2004 680billionUSD
1USD 988KRW(March2006)
Admissions2005est 14�,0million
Averageadmissions/inhab.2005est 2,95
Averageticketprice2004 6287KRW(=6,52USD)
Screens2005 16�4
South Korea
0
300
400
200
100
9 5 9 6 9 7 9 99 8 0 0 0 1 0 2 0 3 0 4 0 5 (prov.)
�07
64
62 55 604� 42
62 5282
65 74 8�65 59
4� 4959 65
78 80 82
�20
271244
2��
277
228
192175
19421�
Source:KOFIC
30 0
3 000
6 000
9 000180
150
60
90
120
1925 20282�84 2584
2862
�460
52�7
6�27
7171
84988807
9 5 9 6 9 7 9 8 9 9 0 0 0 1 0 2 0 3 0 4 0 5 (prov.)
45,1� 42,2 47,52 50,1854,72
61,69
89,4
105,1
119,4
1�5,214�,0
Sources:KOFIC/Variety(GBO2005)
Numberoffeaturefilmsproducedandimported|1995-2005
Admissionsandgrossboxoffice|1995-2005
Marketshares2005(Seoul)
Others�,9%
National55%
US�8,8%
European2,�%
Foreignfilmsreleased
NationalfilmsproducedNationalfilmsreleased
BoxOffice(hundredmillionKRW)
Admissions(millions)

5�
SouthKorea
Internationaltitle Countryoforigin Year Director Admissions 1 WelcometoDongmakgol KR 2005 ParkGwang-hyun 8008622 2 MarryingtheMafia2:Enemy-in-Law KR 2005 JeongYong-ki 56�5266 � Marathon KR 2005 JeongYoung-chul 5148022 4 AnotherPublicEnemy KR 2005 KangWoo-suk �911�56 5 Typhoon KR 2005 KwakKyung-taek �72�752 6 SympathyforLadyVengeance KR 2005 ParkChan-wook �650000 7 Mr.&Mrs.Smith US 2005 DougLiman �546900 8 HarryPotterandtheGobletofFire GBinc/US 2005 MikeNewell �47�400 9 TheIsland US 2005 MichaelBay �4��90010 WaroftheWorlds US 2005 StevenSpielberg �22�00011 Mapado KR 2005 ChooChang-min �09046712 YouAreMySunshine KR 2005 ParkJin-pyo �0511�41� Howl’sMovingCastle(1) JP 2004 HayaoMiyazaki �01516514 KingKong US/NZinc 2005 PeterJackson 291�00015 AllforLove KR 2005 MinKyu-dong 25��10�16 Murder,TakeOne KR 2005 JangJin 247529117 WhenRomanceMeetsDestiny US 2005 KimHyun-seok 247529118 BloodRain KR 2005 KimDae-seung 24�020019 Innocentsteps KR 2005 ParkYoung-hoon 227499520 ThePhantomoftheOpera(1) US/GBinc 2005 JoelSchumacher 2006880
(1) CumulativeadmissionssinceDecember2004. Sources:KOFIC/Distributors
Top20filmsbyadmissionsinSouthKorea|2005Provisionalranking.
Exhibition&distribution
SouthKoreawasoneofthefewmarketstoregisterpositiveresultsin2005,thoughgrowthshowedsignsofasignificantslowingdown.Admissionsrosetoanestimated14�million,a5.8%increaseon2004.Aselsewhereresultsforlocallyproducedandforimportedfilmsinthefirsthalfoftheyearweredisappointingandonlyasignificantimprovementinthesecondhalfallowedtheyeartoendonapositivenote.Neverthelessthe5.8%increaseinattendancebringstoanendtheperiodofdouble-digitgrowthinadmissionsobservedsince2000.Marketsharefornationalfilmsremainedstableinrelationto2004,atanestimated59%.Asin2004thecom-binedmarketshareofKoreanandAmericanfilmsinSeoulreached9�.8%,leavingscantroomforfilmsofotherorigins.
SevenoftheTop10filmsin2005wereKorean:themostpopularfilmwasdramaWelcome to Dongmakgolwhichsoldmorethan8millionticketsnationwide,aheadofsequelMarrying the Mafia 2insecondplacewith5.6millionadmis-sions.Asin2004theleadingdistributorwasCJEntertainmentwithamarketshareof21.9%,thoughShowbox,insecondplacewith19.8%ofthemarket,distributedtheleadingsuccesses
oftheyear(Welcome to Dongmakgol, Marrying the Mafia 2andMarathon).
Inthefaceofincreasingpressuretoreachagreementintradenegotiations,theKoreangovernmentdecidedtoreducethe40-year-oldscreenquotaforlocalfilmsfrom146to7�screendaysperyear.Atthesametimeanewsupportfunddesignedtofurtherstrengthenthelocalindustrywasestablishedwithafive-yearbudgetofUSD400million.
Koreanfilmsabroad
ExportsofKoreanfilmswereworthjustunder76millionUSDin2005,a�0%increaseonthevaluefor2004.ExportsconcentratedmoreonmoreontheAsianregion,with79%ofthetotalaccountedforbyexportstoJapan,where2Koreanfilmsfeaturedinthe2005Top20.Whereasinthepastcompletedworksandre-makerightsweretheprinciplefocusforexport,increasinglyKoreanfilmsarepre-sold,occasionallyatscenariostage.Asianmarketstendtoprefercommercialfilmsinvolvingspecificstaractorsordirectors,whereasEuropeanmarkets(principallyFranceandGermany)preferart-housetitles.
Sources:KOFIC/ScreenDigest
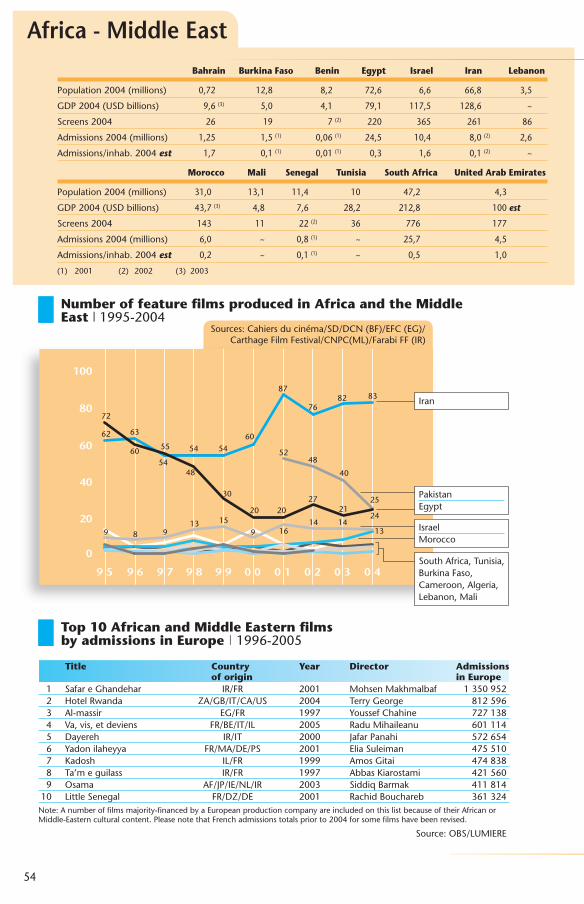
54
Bahrain BurkinaFaso Benin Egypt Israel Iran Lebanon
Population2004(millions) 0,72 12,8 8,2 72,6 6,6 66,8 �,5
GDP2004(USDbillions) 9,6(�) 5,0 4,1 79,1 117,5 128,6 ~
Screens2004 26 19 7(2) 220 �65 261 86
Admissions2004(millions) 1,25 1,5(1) 0,06(1) 24,5 10,4 8,0(2) 2,6
Admissions/inhab.2004est 1,7 0,1(1) 0,01(1) 0,� 1,6 0,1(2) ~
Africa - Middle East
Morocco Mali Senegal Tunisia SouthAfrica UnitedArabEmirates
Population2004(millions) �1,0 1�,1 11,4 10 47,2 4,�
GDP2004(USDbillions) 4�,7(�) 4,8 7,6 28,2 212,8 100est
Screens2004 14� 11 22(2) �6 776 177
Admissions2004(millions) 6,0 ~ 0,8(1) ~ 25,7 4,5
Admissions/inhab.2004est 0,2 ~ 0,1(1) ~ 0,5 1,0
(1) 2001 (2) 2002 (�) 200�
Top10AfricanandMiddleEasternfilmsbyadmissionsinEurope|1996-2005
Title Country Year Director Admissions oforigin inEurope 1 SafareGhandehar IR/FR 2001 MohsenMakhmalbaf 1�50952 2 HotelRwanda ZA/GB/IT/CA/US 2004 TerryGeorge 812596 � Al-massir EG/FR 1997 YoussefChahine 7271�8 4 Va,vis,etdeviens FR/BE/IT/IL 2005 RaduMihaileanu 601114 5 Dayereh IR/IT 2000 JafarPanahi 572654 6 Yadonilaheyya FR/MA/DE/PS 2001 EliaSuleiman 475510 7 Kadosh IL/FR 1999 AmosGitai 4748�8 8 Ta’meguilass IR/FR 1997 AbbasKiarostami 421560 9 Osama AF/JP/IE/NL/IR 200� SiddiqBarmak 41181410 LittleSenegal FR/DZ/DE 2001 RachidBouchareb �61�24Note:Anumberoffilmsmajority-financedbyaEuropeanproductioncompanyareincludedonthislistbecauseoftheirAfricanorMiddle-Easternculturalcontent.PleasenotethatFrenchadmissionstotalspriorto2004forsomefilmshavebeenrevised.
Source:OBS/LUMIERE
NumberoffeaturefilmsproducedinAfricaandtheMiddleEast|1995-2004
0
100
80
60
40
20
9 5 9 6 9 7 9 8 9 9 0 0 0 1 0 40 30 2
72
62
9 9 91� 15
1614 14
1�8
6�
54
54 5460
87
7682 8�
60 55
48
�0
20 2027
2124
25
40
4852
Sources:Cahiersducinéma/SD/DCN(BF)/EFC(EG)/CarthageFilmFestival/CNPC(ML)/FarabiFF(IR)
Iran
PakistanEgypt
IsraelMorocco
SouthAfrica,Tunisia,BurkinaFaso,Cameroon,Algeria,Lebanon,Mali
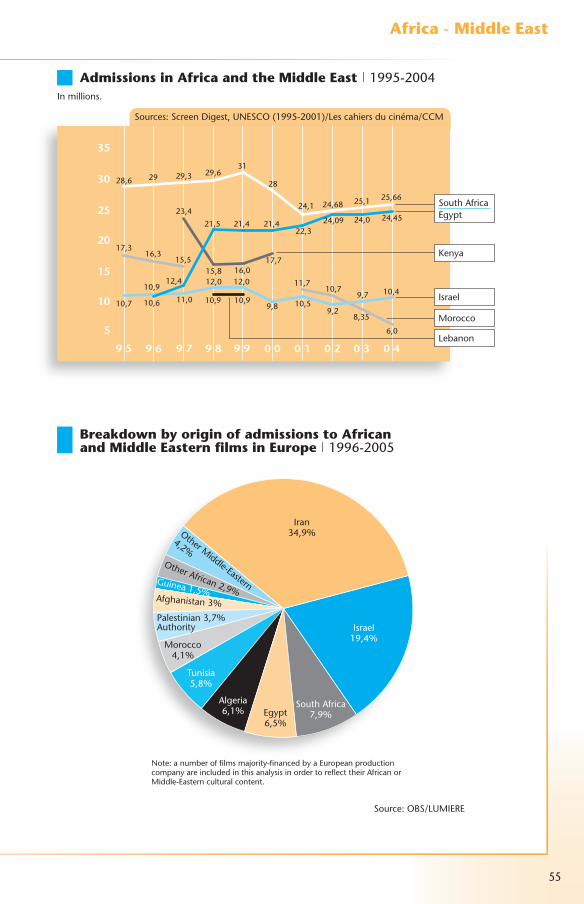
55
Africa-MiddleEast
Source:OBS/LUMIERE
AdmissionsinAfricaandtheMiddleEast|1995-2004Inmillions.
5
30
35
25
20
10
15
9 5 9 6 9 7 9 8 9 9 0 0 0 1 0 40 30 2
28,6
17,�
10,7
10,912,4
21,5 21,4 21,422,�
24,09 24,0 24,45
10,6 11,0
12,0 12,0
9,8 10,59,2
9,7 10,4
16,�15,5
10,9 10,9
11,710,7
8,�5
6,0
29 29,�
2�,4
15,8 16,017,7
29,6�1
28
24,1 24,68 25,1 25,66
Sources:ScreenDigest,UNESCO(1995-2001)/Lescahiersducinéma/CCM
BreakdownbyoriginofadmissionstoAfricanandMiddleEasternfilmsinEurope|1996-2005
Note:anumberoffilmsmajority-financedbyaEuropeanproductioncompanyareincludedinthisanalysisinordertoreflecttheirAfricanorMiddle-Easternculturalcontent.
SouthAfricaEgypt
Israel
Kenya
Morocco
Lebanon
Israel19,4%
Algeria6,1%
Tunisia5,8%
Iran�4,9%
SouthAfrica7,9%Egypt
6,5%
Morocco4,1%
Palestinian�,7%Authority
Afghanistan�%
Guinea1,5%
OtherAfrican2,9%
OtherMiddle-Eastern
4,2%
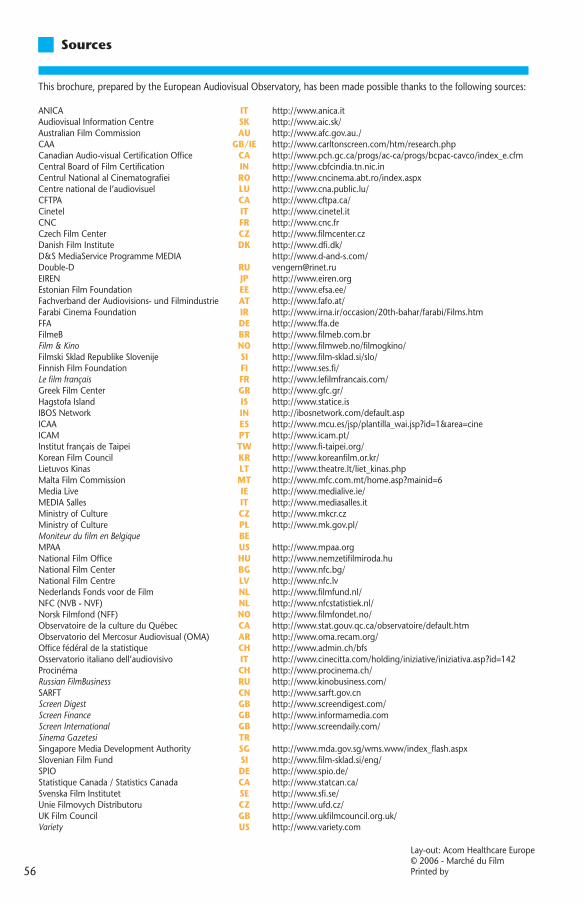
56
ANICA IT http://www.anica.itAudiovisualInformationCentre SK http://www.aic.sk/AustralianFilmCommission AU http://www.afc.gov.au./CAA GB/IE http://www.carltonscreen.com/htm/research.phpCanadianAudio-visualCertificationOffice CA http://www.pch.gc.ca/progs/ac-ca/progs/bcpac-cavco/index_e.cfmCentralBoardofFilmCertification IN http://www.cbfcindia.tn.nic.inCentrulNationalalCinematografiei RO http://www.cncinema.abt.ro/index.aspxCentrenationaldel’audiovisuel LU http://www.cna.public.lu/CFTPA CA http://www.cftpa.ca/Cinetel IT http://www.cinetel.itCNC FR http://www.cnc.frCzechFilmCenter CZ http://www.filmcenter.czDanishFilmInstitute DK http://www.dfi.dk/D&SMediaServiceProgrammeMEDIA http://www.d-and-s.com/Double-D RU [email protected] JP http://www.eiren.orgEstonianFilmFoundation EE http://www.efsa.ee/FachverbandderAudiovisions-undFilmindustrie AT http://www.fafo.at/FarabiCinemaFoundation IR http://www.irna.ir/occasion/20th-bahar/farabi/Films.htmFFA DE http://www.ffa.deFilmeB BR http://www.filmeb.com.brFilm & Kino NO http://www.filmweb.no/filmogkino/FilmskiSkladRepublikeSlovenije SI http://www.film-sklad.si/slo/FinnishFilmFoundation FI http://www.ses.fi/Le film français FR http://www.lefilmfrancais.com/GreekFilmCenter GR http://www.gfc.gr/HagstofaIsland IS http://www.statice.isIBOSNetwork IN http://ibosnetwork.com/default.aspICAA ES http://www.mcu.es/jsp/plantilla_wai.jsp?id=1&area=cineICAM PT http://www.icam.pt/InstitutfrançaisdeTaipei TW http://www.fi-taipei.org/KoreanFilmCouncil KR http://www.koreanfilm.or.kr/LietuvosKinas LT http://www.theatre.lt/liet_kinas.phpMaltaFilmCommission MT http://www.mfc.com.mt/home.asp?mainid=6MediaLive IE http://www.medialive.ie/MEDIASalles IT http://www.mediasalles.itMinistryofCulture CZ http://www.mkcr.czMinistryofCulture PL http://www.mk.gov.pl/Moniteur du film en Belgique BEMPAA US http://www.mpaa.orgNationalFilmOffice HU http://www.nemzetifilmiroda.huNationalFilmCenter BG http://www.nfc.bg/NationalFilmCentre LV http://www.nfc.lvNederlandsFondsvoordeFilm NL http://www.filmfund.nl/NFC(NVB-NVF) NL http://www.nfcstatistiek.nl/NorskFilmfond(NFF) NO http://www.filmfondet.no/ObservatoiredelacultureduQuébec CA http://www.stat.gouv.qc.ca/observatoire/default.htmObservatoriodelMercosurAudiovisual(OMA) AR http://www.oma.recam.org/Officefédéraldelastatistique CH http://www.admin.ch/bfsOsservatorioitalianodell’audiovisivo IT http://www.cinecitta.com/holding/iniziative/iniziativa.asp?id=142Procinéma CH http://www.procinema.ch/Russian FilmBusiness RU http://www.kinobusiness.com/SARFT CN http://www.sarft.gov.cnScreen Digest GB http://www.screendigest.com/Screen Finance GB http://www.informamedia.comScreen International GB http://www.screendaily.com/Sinema Gazetesi TRSingaporeMediaDevelopmentAuthority SG http://www.mda.gov.sg/wms.www/index_flash.aspxSlovenianFilmFund SI http://www.film-sklad.si/eng/SPIO DE http://www.spio.de/StatistiqueCanada/StatisticsCanada CA http://www.statcan.ca/SvenskaFilmInstitutet SE http://www.sfi.se/UnieFilmovychDistributoru CZ http://www.ufd.cz/UKFilmCouncil GB http://www.ukfilmcouncil.org.uk/Variety US http://www.variety.com
Thisbrochure,preparedbytheEuropeanAudiovisualObservatory,hasbeenmadepossiblethankstothefollowingsources:
Sources
Lay-out:AcomHealthcareEurope©2006-MarchéduFilmPrintedby

Big Screen Financing from the Small Screen
Visit us at the Marché du Film, Cannes: Riviera, Booth A4
How to order: Order online or download order form at: http://www.obs.coe.int/about/orderFor more information: http://www.obs.coe.int Tel: +33 (0)3 88 14 44 00 [email protected]
127 pages Edition 2006
IRIS Special issue
“Broadcasters’ Obligations to Invest in Cinematographic Production”
addresses the key questions:
• What obligations has the state imposed on broadcasters in terms of investment and support for cinematographic film?
• What obligations have broadcasters entered into voluntarily?
• What exactly is regulated by the main provisions?
• What are the differences between obligations for public and private broadcasters?
• What do the broadcasters receive in return?
• Which obligations lead to direct investment and which to indirect support?
• What are the key economic figures?
34 European countries covered, comparative legal analysis, 25 country reports
New Publication!
62,50

IRIS MERLIN database
on the legal issues of the audiovisual sector in Europe
KORDA database
on public film funding in Europe
LUMIERE database
on film admissions in Europe
Databases Concerning the Film Sector
Information products from the European Audiovisual Observatory
The Finger on the Pulse of the Film Industry
80 90 E 76*
Film and Home Video
Volume 3 of the Yearbook
Public Funding for Film and Audiovisual Works in Europe – A Comparative Approach
Books on Film Markets and Financing
Film Distribution Companies in EuropePre-publication special offer:
Special offer
Available July 2006
IRIS plus
supplement to IRIS NewsletterThe Protection of Cinematographic Heritage in Europe
Books on the Legal Issues of the Film SectorIRIS monthly newsletter
Legal Observations of the European Audiovisual Observatory
IRIS Special
Broadcasters’ Obligations to Invest in Cinematographic Production
free access free access free access
How to order: Order online or download order form at: http://www.obs.coe.int/about/orderFor more information: http://www.obs.coe.int Tel: +33 (0)3 88 14 44 00 [email protected]
http://merlin.obs.coe.inthttp://korda.obs.coe.inthttp://lumiere.obs.coe.int
238 62,5
Contact in Cannes: Observatory stand A4 Riviera (Palais des Festivals) Tel: +33 (0)4 92 99 88 03
Yearly subscription
Focus 2006
17,50 EUR
Ref FMF06
* Pre-publication offer