World Economic Forum on Education--Contains Human Capital Index
160
Education and Skills 2.0: New Targets and Innovative Approaches January 2014
-
Upload
independent -
Category
Documents
-
view
2 -
download
0
Transcript of World Economic Forum on Education--Contains Human Capital Index
Education and Skills 2.0: New Targets and Innovative Approaches
January 2014
Published by World Economic Forum, Geneva, Switzerland, 2014All rights reserved. No part of this publication may be reproduced, stored in a retrieval system, or transmitted, in any form or by any means, electronic, mechanical, photocopying, or otherwise without the prior permission of the World Economic Forum.
World Economic Forum91-93 route de la CapiteCH-1223 Cologny/GenevaSwitzerlandTel.: +41 (0) 22 869 1212Fax: +41 (0) 22 786 [email protected]
3Education and Skills 2.0: New Targets and Innovative Approaches
Contents
4 Preface Martina Gmür and Klaus Schwab
6 Forewords
6 Gordon Brown
7 Amina Mohammed
8 Introduction David E. Bloom, Ayla Goksel, Jody Heymann, Yoko Ishikura, Brij Kothari, Patricia A. Milligan, and Chip Paucek
16 Never Too Early to Start
16 Chapter 1 The Early Bird Catches the Worm Pia Rebello Britto and Ayla Goksel
24 Calling All Minds
24 Chapter 2 Investing in Girls (and Women) to Spur Economic Development Tae Yoo
31 Chapter 3 Scaling Up to Meet the Enormous Education Challenges in Africa Omobola Johnson, Leslie Maasdorp, and Colin McElwee
36 Chapter 4 An “E.Y.E.” to the Future: Enhancing Youth Employment Arup Banerji, Vivian Lopez, Jamie McAuliffe, Amy Rosen, and Jose Manuel Salazar-Xirinachs, with Poonam Ahluwalia, May Habib, and Tanya Milberg
41 Chapter 5 Education System Reform in Pakistan: Why, When, and How? Mehnaz Aziz, David E. Bloom, Salal Humair, Emmanuel Jimenez, Larry Rosenberg, and Zeba Sathar
51 Chapter 6 Better Late Than Never Brij Kothari
59 Chapter 7 Getting Past the Basics: Pursuing Secondary Education David E. Bloom
64 Learning Anything, Anytime, Anywhere
64 Chapter 8 Online Education: From Novelty to Necessity Chip Paucek, Jose Ferreira, Jeremy Johnson, and Christina Yu
70 Much Needed and Still Useful After All These Years
70 Chapter 9 Older and Wiser: Tapping the Full Potential of the Mature Workforce Patricia A. Milligan and Patty P. Sung
78 Chapter 10 Reinvigorating Japan’s Economy With More Women and Older Workers Yoko Ishikura
84 Measuring and Managing Our Assets
84 Chapter 11 Pay It Forward Sami Mahroum and Elizabeth Scott
92 Chapter 12 The Human Capital Index Saadia Zahidi
98 Statistical Appendix David E. Bloom, Ciara Browne, Thierry Geiger, Kenneth O’Friel, Lauren Graybill, and Larry Rosenberg
154 Biographies of Co-Editors and Authors
158 Acknowledgements
158 Membership of the Global Agenda Council on Education and Skills: 2012-13 and 2013-14
Education and Skills 2.0: New Targets and Innovative Approaches4
As policy-makers look for ways to make their economies more competitive in today's fast-changing world, a critical factor will be the extent and quality of education and skills training available for their populations. After all, education is both a compelling indicator and powerful instrument of human progress, which is why it occupies such a prominent place in the UN 2015 Millennium Development Goals and all countries’ development plans.
Preface

5Education and Skills 2.0: New Targets and Innovative Approaches
Yet the reality is that despite impressive progress made in educational systems in recent decades, especially with respect to primary enrolment, enormous challenges remain. Over 100 million children are not enrolled in primary or lower-secondary school, and even for those that are or were in school, an alarming number lack basic reading and writing skills. At the same time, many countries face unacceptably high unemployment rates, while others have extremely high underemployment rates – such as Sub-Saharan Africa and the Middle East and North Africa, regions that are expecting their youth populations to swell greatly in the coming decades. Moreover, in some parts of the world, many potential employers complain that their jobs are not being filled because jobseekers lack the requisite skills.
This timely book provides an up-to-date statement about the importance of education, with a special emphasis on the education-skills nexus. It does this by taking us on a journey through the life cycle of learning, beginning with the earliest days of life, then formal schooling at primary, secondary and tertiary levels, the transition from school to career, and finally on to mature workers – who may want (or need) to acquire new skills or to stay in work longer in response to greater longevity and population ageing.
On this journey, we discover that much learning can, and needs to, occur outside formal school systems, which may be done through lifelong education, vocational programmes, on-the-job training and online education. We also discover that although the hurdles to a better educated and skilled populace are immense, there is already a rich inventory in developed and developing countries alike of new approaches and innovations (some of it rooted in modern technology and communications) that can enable us to deliver on our commitment to education as a fundamental human right.
Given that education is central to most global issues – from economic growth and social welfare to global information technology and entrepreneurship – this topic is highly relevant to the Network of Global Agenda Councils. Education and Skills 2.0: New Targets and Innovative Approaches is the product of a true collaboration among a number of Global Agenda Councils, including the Global Agenda Councils on Africa, Pakistan, and Japan, as well as the Council on Youth Unemployment and the Council on Population Growth. To this end, we would like to thank authors from the Network of Global Agenda Councils, as well as those from further afield who have contributed chapters and essential input to this book. We would also like to thank David Bloom, the Chair of the Global Agenda Council on Education & Skills, who led this work.
This book is the result of much individual effort and collective deliberation, and it will provide the background for future activities of the Global Agenda Council on Education & Skills, which can only gain salience as the global community takes on the challenge of widening and deepening our human capital.
Martina GmürSenior Director Head of the Network of Global Agenda CouncilsWorld Economic Forum
Klaus SchwabFounder and Executive ChairmanWorld Economic Forum
Education and Skills 2.0: New Targets and Innovative Approaches6
Rt. Hon. Gordon BrownUnited Nations Special Envoy for Global Education
For centuries, societies the world over have managed only to realize some of the potential of some of their young people. At no point in history have we succeeded in developing all of the potential of all of our young people – and today hundreds of millions are not obtaining the education they deserve.
And yet at no point in history has educa-tion been so essential to the well-being of society. The majority of employees in the global workforce, who were once manual workers, will soon depend on other skills for the first time. More than ever, the labour market now demands workers who have technical attributes, knowledge and the ability to innovate and adapt to a fast-changing world where workforces compete internationally.
The biggest rise in tertiary education ever seen – a 160% increase in global enrolment from 1990 to 2009 – is testament to unprecedented demand for education as students seek to prepare themselves for nonmanual work.
However, access to even the most basic of schooling in many parts of the world still remains staggeringly limited. Globally, there are 57 million out-of-school children of primary age, a figure that has not fallen much in the past two years after big advances in the first decade of this century. There are a further 69 million young adolescents out of school – and 500 million of today’s school-age girls will leave education before they finish their schooling. The latest estimate is that even in 2030, 1 billion workers will not have completed basic education.
Crucially, quality does matter. The standard of education that children receive will often determine whether parents allow them to stay in school – or force them to drop out. High global dropout rates meant 31.1 million children left school early in 2010.
And even as quality becomes evermore important, young people are too often taught antiquated curricula where the focus on teaching students is what to think – not how to think. Countries need to learn quickly what works and how they can benefit from the best of modern ideas, methods and technology.
Roland Berger Consultants reported this year that only between 10% and 20% of graduate students in developing countries are employable by international standards. Even in fast-modernizing India, just 25% are considered by multinationals to be employable. In Russia, it is just one-fifth.
Forewords
7Education and Skills 2.0: New Targets and Innovative Approaches
Indeed, the way countries use their human capital has become an important factor in explaining why some – many of whom are in Asia and Latin America – remain stuck in a “middle-income trap”, unable to make the transition to high-income status. Others in Africa are condemned to low-income or, at best, lower-middle-income futures. Researchers trying to understand their failure to break through increasingly focus on the quantity and quality of basic skills, qualified graduate manpower and the lack of expertise in research and development.
But by the end of the decade, as research by the McKinsey Global Institute suggests, we will at once be faced with a shortfall of up to 40 million high-skilled workers and a surplus of up to 95 million low-skilled workers. It is evident that without urgent action to improve access to and quality of learning, the world faces a huge skills shortage, especially in the emerging markets and developing countries where most new economic growth will be concentrated.
The adult illiteracy rate in Somalia, for example, is 63%. Even in Nigeria, a country hoping to become one of the new growth economies, this figure is 39%. According to new figures from the Wittgenstein Center’s forthcoming book, World Population and Human Capital in the 21st Century, only 3% of young adults (30–34-year-olds) in countries such as Mali and Mozambique will have received tertiary education by 2050; in Niger, Liberia, Rwanda and Chad, it is just 4% and in Malawi and Madagascar, only 5%. While the projection for North America as a whole is 60% with tertiary qualifications – and in countries such as Korea and Singapore, 80% – the forecast for Sub-Saharan Africa is, at best, 16%.
The high out-of-school numbers make my immediate priority as UN Special Envoy for Global Education the delivery of the second Millennium Development Goal – universal primary education.
We must become the first generation that delivers on every child’s right to schooling. Our global economy will only flourish in the long term if we find a way of ensuring that every young person everywhere has the chance to reach his or her full potential.
Ms. Amina J. MohammedUnited Nations Special Advisor to the Secretary-General on Post-2015 Development Planning
The ongoing efforts of the United Nations and its member states to delineate a new development agenda to succeed the Millennium Development Goals (MDGs) when they expire in 2015 presents a unique opportunity for a paradigm shift in international development – one that can address the eradication of poverty within the context of sustainable development, enabled by the integration of economic growth, social justice and environmental stewardship.
For this ambitious development framework to take shape and unfold, a profound structural transformation will be required at all levels and domains. A new and expanded vision of education and training that is inclusive, responsive and of quality must play a central role in this endeavour. The world has seen significant progress in achieving universal primary education and gender parity, but there are still multiple challenges confronting the sector.
Successful efforts to expand access to basic education have been undermined by growing inequalities in the quality of education and learning outcomes. An alarming number of children still do not have access to preprimary education and millions are leaving primary and secondary schools without acquiring any basic knowledge, skills and competencies. Too many education systems around the world are either failing to provide access to the most vulnerable in their societies and/or falling short in providing good quality and relevant learning and skills-building opportunities. Millions of youth and adults are being prevented from reaching their potential to lead productive, healthy lives and to acquire decent jobs.
Quality basic education, including during the most formative years of life, is a prerequisite for meeting the unalienable right to learn and to develop. However, the complexities of new and emerging global challenges demand that the education agenda must be more aspirational. Provision of quality education and skills training at all levels, seamlessly linking with pathways to lifelong learning, must be equitably accessible for all through a range of flexible modalities in order to cater to the diverse needs of learners today.
Education systems must expand access to quality education at secondary and tertiary levels, as well as to technical and vocational education and training, which remains a viable avenue for youth who had poor quality basic education or no chance at all to acquire skills for work and life. The expansion of these subsectors must be well-articulated in the global development agenda and in national policies, as well as in human resource development policies in both private and public sectors. These policies must ensure that stronger links are made between the learning outcomes and skills achieved through education and training and the needs and prospects of young people and adults in the world of work.
Many of the chapters and case studies in this publication reinforce the arguments for the new development agenda to focus on improving the quality of education across the board and the imperative to expand and improve opportunities in education and skills development beyond basic education. We must ensure that all girls and boys have the best start to life and learning and that learning leads to a smooth transition from school to the world of work, accompanied by constant reskilling, upskilling of adults and the realization of their lifelong learning potential.
The book offers insights into innovative technologies and approaches that could be applied to narrow the education and skills gaps for those lagging behind. Furthermore, it showcases a number of proven and potential solutions to address some of the most intractable issues mentioned earlier. Finally, the statistical ap-pendix of this publication is a welcome addition to the international community’s drive for a data revolution. The business community’s views of the state of educa-tion presented on a country-by-country basis is of particular interest, as the quality and responsiveness of education and skills training rely on the need to better connect education to the world of work. Hopefully, this will evoke more attention on improving the timeliness and accuracy of labour market information systems and in identifying future labour market trends.
The cross-sectional representation of countries at different levels of development and the sector-wide approach in present-ing the case for the relevance of education and training makes this publication a particularly rich compendium of the latest discourses in education and skills develop-ment. It is my expectation that it will serve to enrich the ongoing debates on educa-tion, training, and skills acquisition within the post-2015 development agenda.
Education and Skills 2.0: New Targets and Innovative Approaches8
That education is an enormous contributor to individual and collective development and well-being is beyond dispute (see Box 1). This is why Article 26 of the Universal Declaration of Human Rights (1948) defines education as a basic human right and calls for making it free, at least at the fundamental levels, and compulsory. It is also the dominant reason why countries at all income levels have expanded and improved their education systems so significantly in the past half century.
Box 1: Education – A One-Stop Shop Education has a diverse but mutually reinforcing set of goals. It aims to do the following:
- impart the skills and capacities people need to be productive members of the workforce and their communities;
- generate and promote the assimilation of new knowledge to spur economic, social and political, advancement;
- promote social equity and cohesion and the legitimacy that comes from equal opportunity;
- give people access to a broad swath of knowledge and ideas;
- promote the study and development of culture and values, including arts and the humanities;
- inculcate the desire and ability to learn throughout life;
- enhance critical and creative thinking;
- promote acceptance and tolerance of difference and diversity;
- develop media literacy and the capacity to effectively evaluate large amounts of often-conflicting information – a reflection of evolving needs in the 21st century.
Thus, the goals of education are many. As William Butler Yates succinctly put it, “Education is not the filling of a pail, but the lighting of a fire.”
IntroductionDavid E. Bloom, Ayla Goksel, Jody Heymann, Yoko Ishikura, Brij Kothari, Patricia A. Milligan and Chip Paucek
9Education and Skills 2.0: New Targets and Innovative Approaches
What is the state of global education today (see Box 2)? Education achievements abound in countries throughout the world. At all levels of education, enrolment has increased and the disparity between access for girls and boys has diminished. However, much remains to be done, especially on secondary and tertiary school enrolment and the quality and relevance of education at all levels. Moreover, the indicators of improvement belie significant disparities in other dimensions, as, in many countries, education results are stronger in urban than rural areas and racial, ethnic and gender differences in outcomes persist. In addition, educational outcomes are questionable in many regions of the world. Students may be enrolled in school, but enrolment does not guarantee attendance, let alone an opportunity to receive an education of high quality. Many students complete their formal education – including in some instances higher education – without the skills needed to participate productively in the workforce or as part of an informed citizenry.
Education priorities are inevitably shaped by demographic, technological, social, political and economic trends. Some parts of the world (like Sub-Saharan Africa (SSA) and the Middle East and North Africa) will need to gear up to handle the expected explosion in the number of students requiring and seeking an education. Other parts of the world (mostly industrial at this point) will need to rethink how they are going to handle low fertility and people living longer than ever – many workers will need to stay in work longer and many of them will need to reskill, maybe repeatedly. Plus the dramatic technological advances, which have catapulted us into the digital age, are putting a premium on technical skills and know-how, along with the ability to continuously adapt. In a nutshell, education is inextricably entwined with skills development.
Box 2: A Global Snapshot of EducationEnormous progress . . .
For the world as a whole, the primary gross enrolment ratio rose from 89% in 1970 to nearly 100% just a decade later. Improvement in low-income countries has been particularly spectacular, where this measure rose from 51% in 1970 to more than 100% today.2
Improvements in gender equality at the primary school level have been widespread, with the ratio of female to male enrolment for the world as a whole rising from 81% to 97% since 1970. In low-income countries, this ratio rose from 62% to 95% during the same period. Similar improvement in gender equality has taken place in secondary education.
Literacy rates among youth (aged 15–24) have risen from 83% to 90% for the world as a whole between 1990 and 2010 and from 60% to 74% for low-income countries.
Enormous challenges remain . . .
About 126 million children are not enrolled in primary or lower-secondary school (about 13% of the age-relevant population). This figure includes 57 million children of primary school age and 69 million of lower-secondary school age.
Secondary school enrolment is still low (42%) in low-income countries, with SSA (40%) and South Asia (58%) particularly far behind. In SSA, the ratio of female to male enrolment in secondary education stands at only 82% (although this figure has increased from 62% in 1980).
Tertiary school enrolment is extremely low (9%) in low-income countries and lower-middle-income countries (18%), with upper-middle-income countries (32%) still way below the level of developed countries (73%).
Globally, 123 million youth (aged 15–24) lack basic reading and writing skills – 61% of them young women.
The progress on youth literacy has been inadequate in specific regions, standing at 72% in SSA and 79% in South Asia.
Sources: WDI, UNESCO and UN
The Education–Skills NexusHow does the education–skills nexus work? At the individual level, education has an array of effects that promote welfare. Employment in productive work (and also in the formal sector of an economy, where the most secure and best-paying jobs tend to be available) depends on an individual having the skills that education can provide – the right skills, at the right time – to take advantage of the economic opportunity. In most countries, a higher level of education is linked to higher income. In addition, greater education is often closely con-nected to the achievement of better health, which in turn allows a worker to be more productive and, often, to reap the rewards of greater productivity.
At the national level, countries with effective systems of education reap the rewards by seeing faster per capita economic growth. A well-educated populace that has both the array of skills needed for a modern economy and the capacity to adapt those skills to new industries and services provides the basis for a country’s firms and industries to compete successfully with those of other countries. In an era when a large and growing portion of the world’s economic output can be and is created nearly anywhere, such competitiveness is important for raising living standards.
Furthermore, longer lifespans change the calculus of educational investments: with the pace of change greater than ever, educated individuals – and especially those who pursue lifelong education – can adapt more quickly and are better equipped to take advantage of new opportunities. A country that manages to educate its people better can realize the economic and social benefits that emerge from higher-skilled people working for a longer period of time – among them, reducing the pressures on pension systems. At the same time, employers have to be more attentive to workers’ needs and capacities as people live and work longer. The bottom line here is that greater alignment of education and job skills is a necessity and that lifelong skills updating is more worthwhile than ever.
Against this backdrop, the global commu-nity has made a series of pledges over the past two decades to achieve universal primary education, reduce illiteracy and ensure gender parity. One of the most highly watched initiatives is the UN Millennium Development Goals (MDGs), which is aimed at improving living stand-ards worldwide by 2015. Two of the eight
Education and Skills 2.0: New Targets and Innovative Approaches10
goals centre on education: MDG 2 calls for achieving universal primary education (as measured by enrolment and completion); MDG 3 calls for eliminating gender gaps at all levels of education. Although impressive gains have been made globally and by many individual countries, for low-income countries as a group these goals are still out of reach – with the biggest hurdle being primary completion rates rather than primary net enrolment rates.1
Moreover, the MDGs do not include a goal for secondary education, or for the quality of education, both of which are increasingly being recognized as essential for competitive, knowledge-based economies. And girls are especially being left behind at the secondary level, despite the fact that their participation would boost standards of living through myriad channels.
In today’s increasingly competitive, fast-changing and technically demanding labour markets, in which individuals are likely to pursue multiple jobs over longer working lives, more attention is also needed outside formal school systems to developing both hard and soft skills. The requisite training can occur in private vocational programmes, online pro-grammes or on-the-job training (via, for example, apprenticeships, mentoring programmes and advanced training programmes in corporations). Employers, workers and society at large would also be well served by the active use of (possibly new) communication channels among prospective employees, busi-nesses, educators and trainers to promote effectiveness in skills develop-ment and job-matching.
Purpose of the Book As the global community weighs next steps on the education and skills front, this book aims to provide the latest thinking on the critical importance of education and highlight what can be done to ensure that all people around the world can benefit. To this end, it critically reviews existing and new ideas, perspectives and frameworks on education through relevant analyses and case studies. And it explores the full array of social benefits of different pro-grammes and interventions (including complementarities among efforts to improve health, education and cognition) and related evidence of return on invest-ment. But we believe our real value-added is on conceptualizing and describing innovative, plausible, scalable, compelling and high-impact solutions that will improve access to education, strengthen educa-tional quality, improve workers’ skills and
increase equity – across income level, gender and other demographic subgroups.
At the same time, the book tries to shine a light on the relevance of education and training to the labour market and the need to facilitate school-to-work transitions. In pursuing these goals, it takes a lifecycle approach, examining the full range of educational experiences – from prepri-mary education to postgraduate training to worker education and training to mature worker reskilling. This vast educational experience can occur in both formal educational settings (schools) and informal systems (such as via the family).
This book also hopes to contribute to decision-making and research by presenting an accessible and up-to-date compilation of quantitative and qualitative education data across countries, country-income groups, and geographic regions, and over time. These data are juxtaposed with corresponding economic and demographic data to facilitate their use and analysis (see Box 3).
Box 3: Sizing Up Key Educational DataThe Appendix offers country-by-country statistics on relevant demographic and economic data, as well as key education-related indicators. It also focuses on the portions of the Forum’s Executive Opinion Survey (EOS) that are relevant to education. It describes the survey and the data that the survey makes available. Finally, it includes league tables of the actual data, so that readers can be made aware – on a country-by-country basis – of the business community’s views of the state of education throughout the world. Descriptive statistics from the EOS shed light on the business community’s views of countries’ education systems, which are important because of the need to connect education to the labour market.Note: The Appendix was compiled by David E. Bloom, Ciara Browne, Thierry Geiger, Kenneth O’Friel, Lauren Graybill and Larry Rosenberg.
This book is not meant to be an exhaustive report on global education. Rather, it is an effort to highlight what the Forum’s Global Agenda Council on Education and Skills views as a selection of the most pressing issues and opportunities in education today. We are calling it “Educa-tion and Skills 2.0” because we believe that
the urgency is such that we now need to take a leap to an entirely new order of education that is being facilitated by the advent of the digital age and much more interactivity than the classrooms of the past. And we are subtitling it “New Targets and Innovative Approaches” to highlight our emphasis on best approaches to often neglected demographic groups such as preschool children, illiterate adults and mature workers, and also to emphasize the opportunities for intervention created by new technologies and a deeper under-standing of the underlying mechanisms causing the access and quality shortfalls.
We hope that this book will help a wide range of audiences review interrelated issues in education – across the lifecycle and in very different regions of the world – and learn from the practical solutions and proposed action items discussed here. Although we hope this book will be stimulating, we also want to acknowledge the need for humility when weighing in on issues that have been problematic for a very long time. The field of education is full of seemingly good ideas that have come to naught, in part because of various harsh, unforgiving and unanticipated realities (including entrenched interests and conflicting agendas).
Chapter Highlights
Section 1: Never Too Early to Start
We begin with the beginning, that is the learning that occurs after birth. In “The Early Bird Catches the Worm” Pia Rebello Britto and Ayla Goksel underscore what a huge difference early childhood development (ECD) can make in the lives of those born without the privileges conferred by either higher class and income or membership in advantaged demographic, ability and geographic groups. By offering early experiences that strengthen cognitive, emotional and social capabilities, ECD can help to overcome a wide set of inequality gaps – making it one of the most cost-effective investments in human capital creation. Yet a third of the world’s children are at risk of not being able to actualize their potential. This chapter is a call for action to the global community to pay attention to the compelling, effective and relevant evidence-based solutions that emanate from ECD programmes and to commit to actions that provide early-learning opportunities for young children – notably better parenting, early stimulation and learning programmes. They review a number of promising programmes under way that focus on both the first and
11Education and Skills 2.0: New Targets and Innovative Approaches
second 1,000 days of life. Such programmes must now be scaled up and secure broader support, likely involving government. Perhaps there is even a need for making ECD a global development goal.
Section II: Calling All Minds
The next big opportunity in the life cycle occurs as children grow up and reach traditional school-going age. But as Tae Yoo points out in “Investing in Girls (and Women) to Spur Economic Development”, all too often it is the girls who are at a distinct disadvantage, especially in developing countries. This happens despite the fact that educating girls is recognized as being one of the most effective tools for promoting gender equality, improving individual and family health and promoting economic well-being and development. So what can the global community do? She explores how to tackle some of the biggest barriers by providing resources to the poorest, creating a healthier environment, ensuring positive role models, building more schools closer to where girls live (like Barefoot College in Rajasthan, northern India, built by and for the poor in rural areas), developing more teachers, updating the curriculum and providing broadband access to data and services. She emphasizes that solutions will need to identify strategic investments (like broadband) and account for complex cultural, religious and national sensitivities.
One region of the world with a “youth bulge” – male and female – is SSA, making it a prime candidate for harness-ing the strength of younger adults to accelerate growth. However, the jury is still out on best approaches to encouraging this. As we hear in “Scaling Up to Meet the Enormous Education Challenges in Africa” by Omobola Johnson, Leslie Maasdorp and Colin McElwee, the good news is that the authors believe that SSA has the opportunity to leapfrog the skills/education gap with the help of connectiv-ity and innovation in education, in part by greater use of public–private partnerships (PPPs). This chapter focuses on three cases: (a) how Nigeria is trying to bring education innovations to scale, especially with information and computing technolo-gies (ICTs); (b) how South Africa’s Leader-ship Academy tries to leverage and develop the leadership talents of a small number of individuals to become catalysts for others; and (c) how Worldreader is trying to educate the largest number of children and young people using the least amount of incremental investment in technology and infrastructure.
In “An ‘E.Y.E.’ to the Future: Enhancing Youth Employment” the authors (Arup Banerji, Vivian Lopez, Jamie McAuliffe, Amy Rosen and Jose Manuel Salazar-Xirinachs) note that over the next 15 years, 600 million jobs will be needed just to maintain current employment rates in the developing world, let alone increase them. Yet many regions – notably the Middle East and North Africa – are already battling high youth unemployment rates, exacerbated by high underemployment rates (in which workers are underutilized). What can be done? In the short term, they suggest: (a) using apprenticeships to bridge from school to work; (b) acquiring soft skills (like Education for Employment in Egypt); (c) creating PPPs; and (d) teaching youth how to think like entrepreneurs (like Qordoba in Dubai). In the longer term, countries will need to rethink traditional education and labour market institutions – like using the Internet to democratize the flow of information.
Focusing in on Pakistan, the “Education System Reform in Pakistan: Why, When and How?” warns that the country risks falling even further behind if it cannot educate its young people effectively. That said, the authors (Mehnaz Aziz, David E. Bloom, Salal Humair, Manny Jimenez, Larry Rosenberg and Zeba Sathar) believe that there is now a window of opportunity for education reforms to finally materialize after many failed attempts. The key will be to recognize that reform must tackle all sectors of the education system – primary/secondary, higher and vocational – as Pakistan does not have the luxury to delay reform in one sector until the other sectors improve. Such an overhaul will also require a certain political and personal resolve on the part of the political leaders, bureaucracy and civil society. Here the authors cite Sir Michael Barber’s “The Punjab School Reforms Roadmap”, a project of the United Kingdom’s Department for International Development, as an emerging example.
But what happens to all the people who either miss out on primary or secondary education or graduate without actually having learned much, perhaps even being functionally illiterate. In “Better Late Than Never” Brij Kothari argues that those left out need new pathways to learning – notably, quality functional literacy, broadband access and English-language proficiency. Encouragingly, there are many innovations under way to do just that, in effect offering everyone a second, third and perhaps lifelong chance. They range from same language subtitling (audio-visual content that is subtitled in the ‘‘same’’ language as the audio) to
Questscope in Jordan (a nonformal education programme to catch up dropouts) to Yoza in South Africa (reading content made broadly available through mobile phones) to BBC Janala in Bangladesh (English-language learning pathways available through multiple delivery platforms). The big challenge now, he says, is to candidly assess the scale of the problem and then pursue an open-minded consideration of proven, culturally adaptable, scalable and sometimes out-of-the box solutions.
In “Getting Past the Basics: Pursuing Secondary Education” David E. Bloom picks up on the increasing realization that a major focus on primary schooling, without an attendant focus on secondary schooling, is inadequate for today’s globalized knowledge economy. Many of the benefits of education do not accrue until students have had 10 or more years of education and secondary education can and should impact a higher level of skills – such as those useful for creating new technologies. Yet the latest statistics show that there are 69 million children of lower secondary school age not enrolled in school, representing 17% of that age group worldwide – with the figure at 37% in SSA. Education system improvements must focus on secondary school infrastructure (ranging from working toilets to Internet connections) and personal hygiene education, the training of teachers and administrators, the establishment of performance incentives, the updating of curricula and learning materials to make them appropriate to skill-building for workforce needs and a strong higher education system to which secondary graduates can aspire. Such initiatives will be powerfully complemented by labour, financial market and macroeconomic policies that result in the steady creation of “good jobs” and by policies that discourage early marriage and childbearing.
Section III: Learning Anything, Anytime, Anywhere
On the digital front, a revolution in learning is underway, via new technologies that can be called “disruptive” because of the new learning paradigms – and changed social relations – they may bring about. Think digital open content, cloud computing, mobile and tablet technology, game-based learning, machine learning, and big data technology. Does the big one-time switch from analogue to digital solve one of the biggest problems in education – that of access – thereby serving as an economic leveller? In “Online Education: From Novelty to
Education and Skills 2.0: New Targets and Innovative Approaches12
Necessity” Chip Paucek, Jose Ferreira, Jeremy Johnson and Christina Yu explore the revolution in online education – including massive open online courses (MOOCs) – as played out in two main areas: distribution and data-mining. On the plus side, they see an end to a one-size-fits-all factory model of education, enormous room for individualizing (and continuously adapting) course learning and an almost unlimited scope for lifelong learning for anyone, anytime, anywhere. But how quickly that occurs – and which institutions and nations reap the benefits of getting there first – will hinge on overcoming two hurdles: (a) expanding credit acceptance policies for online courses; and (b) overcoming the digital divide, a result of insufficient adequate infrastructure and too little digital literacy.
Section IV: Much Needed and Still Useful After All These Years
A longstanding and widespread view of older workers is that they are ill-equipped to meet the physical demands of either rural or urban work and that they are particularly ill-suited to the evolving expectations that come with many of the jobs available in a modern economy. But in “Older and Wiser: Tapping the Full Potential of the Mature Workforce” Patricia A. Milligan and Patty P. Sung suggest that this view may be a bit dated. Moreover, the ageing of national populations – occurring globally and at an unprecedentedly rapid rate in many countries – should sufficiently motivate both public and private employers to ensure that mature workers (aged 50+) can continue to measure up. They propose three levers for employers to pull: (a) retaining mature workers to close critical skills gaps in the short term; (b) leveraging the extensive knowledge and experience of mature workers and retirees to prepare the next generation workforce; and (c) recruiting and reskilling mature workers and retirees for new roles and new fields. At the same time, governments and academia should pitch in to help address the needs of employers and mature workers at the industry or national level.
In Japan, with its shrinking and rapidly ageing workforce, the need to tap the skills of older workers and women is taking on greater urgency as a way to help the country snap out of two decades of near stagnation and regain its competitive edge. What happens there should be quite illuminating for other countries that are slowly (or not so slowly) moving up the ageing curve. In “Reinvigorating Japan’s
Economy with More Women and Older Workers” Yoko Ishikura explores initiatives (being taken by government, business, educational institutions and nonprofit organizations) to reskill the older generation (65+), improve the status of women in the labour market and both transform the educational system and the company approach to work, skills development and learning. She stresses that what Japan needs now is for stakeholders to develop a comprehensive and coordinated package embracing education, skills and employment – rather than the sequential model of education, skill development and employment.
Section V: Measuring and Managing Our Assets
So who is going to foot the bill for rising demands for primary education (in response to demographic changes) – let alone secondary, preprimary and tertiary – at a time when many countries are struggling to fund universal and quality education objectives? In “Pay It Forward” Sami Mahroum and Elizabeth Scott note that the answer matters both for finding the resources and for social cohesion and equity. And a big part of the debate, as always, is who benefits, given that education is both a public and private good. They believe that the private sector will increasingly be asked to supplement public resources, while governments can help by targeting disadvantaged children. At the same time, all stakeholders must work together to find innovative and scalable funding models that deliver affordable and quality education at all levels while maintaining equity of access. They point to a number of emerging, innovative mechanisms – including MOOCs, digitization of educational tools, securitization of student loans and reversible bonds. There is even talk of creating a global market for skills (akin to the global carbon market), with each country receiving a quota for “mobile talent”.
Finally, how can countries objectively benchmark their stocks of human capital? Traditionally, attempts to measure human capital – the skills and capacities that reside in people and that are put to productive use – have focused on education and experience (reflecting both training and learning by doing). But in recent years, health (including physical capacities, cognitive function and mental health) has come to be seen as an additional component of human capital. In “The Human Capital Index” Saadia Zahidi reports on the Forum’s initiative to construct a Human Capital Index (HCI).
The tool takes account of 51 country-level indicators of human capital – centred on education, experience, health and “enablers” (i.e. the existence and efficacy of national policies that allow the three core elements to lead to greater productivity and reward) – which it rolls up into a single summary measure. The initial results show Europe is way ahead of the rest of the global pack, with Singapore the only Asian country in the top 10. But for the other regions and countries, the good news is that the rankings are a moving target. What matters is the series of interventions that countries undertake across a person’s lifetime in the areas of health, education and employment.
Key Themes The chapters in this book trace key points in the full lifecycle of learning in different parts of the world, along with concrete ideas about how we can measure and pay for the widening and deepening of our human capital stocks. The key themes, which are amplified by their cross-cutting nature, include the following.
Education’s many forms. The linear progression of people’s lives no longer provides a good guide to what education should be. We should not be beholden to preconceptions of education as being strictly formal in nature and taking place only early in life. Rather, much education and training can take place in informal settings and at different stages of life as we age. In addition, we need to recognize the value and appropriateness of different types of education for people with different skills and interests. We must also act on the fact that catching up is possible; failure to benefit from education early in life does not mean that a person should be excluded from the benefits of education forever. With both delivery methods and the content of education changing, all sectors of society can continue to learn and grow.
Ownership of the issues. Education systems have multiple stakeholders – individuals, governments, businesses and national and global civil society – whose interests and needs must be taken into consideration. Their perspectives differ, but they all matter. Moreover, complex, multisectoral issues require complex, multisectoral solutions.
Synergies. The existence of a diverse set of stakeholders does not diminish the fact that, in the end, everyone has an interest in better education. No society will do as well as it could unless it addresses and successfully meets the challenges
13Education and Skills 2.0: New Targets and Innovative Approaches
imposed by the weaknesses in its education systems. Improving education can address the interests of widely disparate groups, even within a single country. The benefits of doing so can accrue not only to individuals but also to whole countries and even the world.
Expanding education and improving it at the same time. Education must be expanded substantially if it is to reach all children. Although the world has made great strides in this direction in recent decades, there is further to go, particularly in the realm of secondary education and beyond. But at the same time it is crucial that the quality of education is also significantly improved. Merely upping enrolment rates does not ensure attendance, the existence of well-equipped schools or the presence of effective teachers, let alone that actual learning is taking place – or even that the quality of education is adequate for what students and countries need and desire. Improving quality will be especially difficult in the many regions that have rapidly growing school-age populations (like SSA and the Middle East and North Africa), but one that must nevertheless be met.
Need for accountability. What would it truly mean to hold governments accountable for the promises they have made to young people, their families and their employers? There are a lot of efforts under way – and being considered – that would improve accountability for educational access and quality at the national level.
A skills mismatch? One arena in which accountability matters hugely is the effort to ensure that the skills imparted by an education system match those needed by employers. This issue has recently come to prominence because of the large number of reports from business owners who say they cannot find workers who have the skills needed to perform specific jobs, even when pay levels are high. Many economists, by contrast, say that the empirical evidence does not support the existence of any significant skills gap. This is an issue that is unresolved in countries at all income levels. Its resolution has implications for educational curricula and advising and also for whether investments being made in the acquisition of human capital are efficient and whether the responsibility is being appropriately born by all stakeholders.
Distinguish between means and ends. Education is both a means of development and an end in itself – that is, there is a consensus on everyone’s basic right to be educated. As such, it is both an
instrument and an indicator of progress. For example, information technology (IT), which is highlighted in several chapters, is an important means to the ends education seeks to serve. It offers new opportunities that are and can be customized to different problems and populations and its incorporation into the education arena may succeed in opening up education to populations that have had little access in the past. But the means of education must not be confused with the goals themselves, which must remain paramount. The novelty of IT is not sufficient to trump more traditional approaches to classroom education where these are being used and in an efficient manner.
Science. In a world that is increasingly driven by technological advances, societies and individuals need to accord increased importance to the STEM (science, technology, engineering and mathematics) fields. It is unlikely that any country will be able to realize its full potential without nurturing young people’s interest in science, prioritizing means for ensuring that at least a significant core of talented individuals have access to high-quality science education and then building on that education by adopting policies that allow the knowledge gained to be put to good use in promoting social and economic development. For the population as a whole, science literacy, as distinct from a focus on science, is increasingly important, because the ability of a population to assess claims and to participate fully in democratic decision-making requires a solid understanding of scientific methods and principles.
Context is crucial. No examination of education worldwide would be complete without explicit, frequent and sensitive acknowledgment of the considerable differences that exist within and across countries. No one solution is likely to apply, unmodified, to all countries. Social, economic, political, cultural, religious and even historical differences mean that solutions will need to be attuned to both specific country circumstances and within-country variations in socioeconomic characteristics. The case studies on Japan and Pakistan underscore this point. Japan has to focus on effectively combining many stakeholders’ interests in education in a way that can reignite economic growth, improve the status of women and update the skills of the older generation. Meanwhile Pakistan faces problems of significantly widening access to basic education (particularly for girls) and increasing the quality of schooling.
Changing demographics. Demographics are changing in all countries. These changes – whether taking the form of ageing societies or youth “bulges” – affect countries’ fiscal situations and their opportunities for economic growth. Changing demographics also interact with the changing nature of jobs. In addition, the accumulation and greater importance of scientific knowledge emphasizes the necessity of early preparation for education. In utero health matters for education, as do infant and child health and preprimary learning.
Forward-looking focus. We need to solve tomorrow's problems, not yesterday's. We also need to keep in mind that education has a longer payoff horizon than workforce training (and even within education, primary school has a longer payback horizon than higher education). This longer horizon often conflicts with policy-making cycles, which tend to be relatively short term. Because a good education system requires long-term investments, staying the course is often challenging.
Recommendations for ActionIn terms of recommendations, we focus on actions that either (a) close knowledge–action gaps (we know what to do and just need the resources); or (b) facilitate developing and learning how to implement new knowledge and tools. Our calls to action are about political will, financial muscle, reform and innovation. And they all require that we not fall victim to preconceptions about the nature of work or of education and its delivery or the stereotyping of workers.
(1) Don’t forget anyone. We need to cast a much wider net so that education reaches everyone – and continuously throughout their life. This means making education available from the earliest days of life to old age; targeting populations that are currently lagging behind, like girls and the vulnerable and disadvantaged; ensuring that all youth pursue and complete a secondary education; not letting the post-17 adults and dropouts fall through the cracks, because it need not be too late for them; offering mature workers ways to update their skills and work longer; and not giving up on certain regions (like SSA) and countries (Pakistan) that must overcome daunting hurdles.
Education and Skills 2.0: New Targets and Innovative Approaches14
(2) Create more and better and more flexible schooling. First, we need to attract more and high-quality teachers. Given the millions of children still out of school, let alone the millions coming up in the population pipeline – especially in SSA and the Middle East and North Africa – we still will need to attract and retain large numbers of quality teachers. This can be done through providing monetary incentives (Chile), monitoring attendance actively to reduce teacher absenteeism (India), creating better physical working environments (including sanitation), and cultivating educators’ ties to their local communities.
Second, we need to modernize what we teach so that we are meeting the educational needs of people throughout the lifecycle. This means placing greater emphasis on early education; soft skills (like a strong work ethic and good communication skills); entrepreneurial and vocational education (employment, apprenticeships); and curriculum development and connections to labour force needs (both domestically and internationally).
Third, we need to modernize how and where it is delivered. New technology offers all stakeholders new ways to learn, from low-tech (like Worldreader and same-language subtitling) to high-tech (like online education, including the MOOCs). Hence the new motto: learning anything, anytime, anywhere. For companies hoping to retain or attract mature workers and recent retirees, a further twist will be modifying the workplace so it is better suited to the scheduling needs of older workers and women and appropriate to the capacities of older workers – in other words, more emphasis on knowledge, wisdom and experience, and less on physical strength and stamina. Companies should also consider setting up bridge-to-retirement programmes that make retirement more gradual and asking mature workers to mentor young ones to create a new generation of workplace leaders.
(3) Act together. We need to coordinate our efforts so we do not bump into each other and duplicate work. This call is appropriate because the challenge is complex and multistakeholder in nature (including the private sector). Moreover, one-off interventions are less efficient than a portfolio of interventions that is well integrated – after all, we need to build up primary, secondary and tertiary in tandem and make them consistent with culture and social mores, labour force needs (school-to-work transitions) and other
policy arenas like macroeconomics, trade, governance, infrastructure and retirement policy (retirement age and incentives). The chapter on Pakistan underscores the need for tackling many educational sectors at once (not just primary or secondary or tertiary), while the chapter on Japan underscores the need for all stakeholders to combine efforts to include more women and older people in the workforce.
To accomplish our educational goals we must be creative about better using existing resources and develop innovative financing arrangements. Here, the private sector’s involvement is essential and there is enormous scope for PPPs, as highlighted in examples cited throughout the book. With the advent of online education, in many instances free, we must together work out its place in the education system so it has legitimacy and students and employers know what it means and stands for (accreditation).
(4) Act now. Because the world economy is more competitive than ever and because of the changing demographics happening all over the world – like youth bulges in SSA and the Middle East and North Africa or high elderly shares, as in Japan – there is an urgency to act now. Indeed, not acting quickly will leave many countries in the competitive dust. Fortunately, for many countries like Pakistan, there is a window of opportunity to tackle educational reforms thanks to several forces for change both within the educational system and in the broader polity. However, as history teaches us, to make a difference with such a large and complex issue, we will need vision, communication, leadership and resolve on the part of all of the major actors. Moreover, this vision will have to be appropriate and customized to the social, political, economic and cultural context. In Pakistan, Sir Michael Barber showed the way with the Punjab School Reforms Roadmap, an excellent example of how provincial governments and private education providers can move swiftly to improve access to high-quality school education.
(5) Rigorously evaluate what works and what doesn’t. One new contribution to enabling the measurement and evaluation of how countries are doing in building up their human capital endowment is the World Economic Forum’s new HCI, released in October 2013. It explores what helps and what hurts nations in their efforts to develop a healthy, educated and productive labour force. It also provides country rankings
that facilitate effectively comparing countries across regions and income groups. More broadly, technical experts throughout the world have become extremely adept at designing compelling strategies for measuring the effects and economic efficiency of a wide range of interventions related to building skills and reaping rewards therefrom. Investing in such evaluations promotes the global public good nature of knowledge and prevents us from duplicating effort and repeating the mistakes of others.
Within Our ReachThe history of education and skills is a core chapter in the story of human progress. It has powerfully shaped improvements in material well-being, as well as the development of human values that define our achievements and guide our behaviour. It is also an unfinished chapter with a multiplicity of paths ahead. The options we choose will naturally reflect our circumstances, our understanding and our aspirations.
As Winston Churchill once said, “The pessimist sees difficulty in every opportunity. The optimist sees the opportunity in every difficulty.” By this standard, we are decidedly optimistic about the future of education and skills, as there are so many plausible options for their enhancement – and for concomitant gains in human well-being – within our reach, both individually and collectively.

15Education and Skills 2.0: New Targets and Innovative Approaches
Endnotes1. World Bank, Learning for All: Investing in People’s Knowledge
and Skills to Promote Development, World Bank Group Education Strategy 2020, Washington DC: World Bank, 2011.
2. The gross enrolment ratio is the total enrolment at a given educational level, regardless of age, divided by the population of the age group that typically corresponds to that level of education. The specification of age groups varies by country, based on different national systems of education and the duration of schooling at the first and second levels. Gross enrolment ratios may exceed 100% if individuals outside the age cohort corresponding to a particular educational level are enrolled in that level.
Education and Skills 2.0: New Targets and Innovative Approaches16
Never Too Early to Start
At the turn of the 21st century, the world was offered a whole new realm of scientific results, one of which illustrated the detailed process of brain development and function. In doing so, it compellingly confirmed the potential of the formative stage of human development and the power of the environment in actualizing that potential. This eloquent evidence set in motion multidisciplinary work – spanning the fields from natural to social sciences – that remarkably arrived at a similar conclusion: Early childhood development is not only critical for human development but also transformative for economic, social and sustainable development.
- Economic analyses from the developed and developing countries show that investing in the earliest years of life leads to some of the highest rates of returns to families, societies and countries – one of the most cost-efficient investments in creating a strong foundation for human capital.
- Neuroscience studies illustrate that the plasticity of the brain and the pace of development in the first few years of life are never again repeated. Also, these early connections form the basis of a lifelong capacity to learn and adapt to change, along with physical and mental health.
- Social science studies demonstrate that early childhood interventions help mitigate the impact of adverse early experiences that, if not addressed, lead to poor health (e.g., obesity, diabetes and cardiovascular disease), poor educational attainment, economic dependency, increased violence and crime, and greater substance abuse and depression (Britto, Engle and Super, 2013).
While the science and evidence in support of early childhood is burgeoning, the results for children have not kept pace. An estimated 200 million children in low- and middle-income countries do not achieve their developmental potential in
Chapter 1: The Early Bird Catches the WormPia Rebello Britto and Ayla Goksel
Education and Skills 2.0: New Targets and Innovative Approaches16
17Education and Skills 2.0: New Targets and Innovative Approaches
the first five years of life because of a lack of stimulating, nurturing, safe and responsive environments (Grantham-McGregor et al., 2007). Here, we are talking about one-third of the world’s children (Britto and Ulkuer, 2012). And it is they who must bear the greatest burden of poverty, disease, war, social marginalization and limited health, nutrition and education services. In addition, these risks prevail not just for children living in these countries but also for the disadvantaged children in high-income countries.
On the plus side, it is interesting to note that national policy planning in early childhood development has grown, with over 40 nations now having passed national legislation and action plans, typically spanning the health, education and other sectors of services (Vargas-Baron, 2013). This suggests an acknowledgement of the importance of early childhood at national policy levels – although the translation of that recognition into budget allocations, strategies and government commitment has yet to be realized.
This chapter opens with a description of early childhood development and why it is the critical beginning to the formation of skills and workforce development. It then provides examples of best practices in early childhood as potential solutions to the world’s immense education and skills challenges. And it concludes with an action agenda consisting of programmatic and policy recommendations. This chapter is a call for action to the global community to pay attention to the compelling, effective and relevant evidence-based solutions that emanate from early childhood programmes and to commit to actions that provide early learning opportunities for young children – notably, better parenting, early stimulation and learning programmes.
It Is Never Too Early to Invest in ChildrenWhat exactly do we mean by early childhood development (ECD)?1 This term is a multifaceted concept that covers the early childhood period from prenatal to eight years of age, encompassing the complex interactions between the growing child and the multilayered contexts of development. It is during these very formative years that development and education have a symbiotic relationship, and it is the period in which the most rapid gains are made in all aspects of growth and development.
Brain development begins shortly after conception and progresses at a very rapid pace through the first three years of life – the stage of greatest development and also the period when development is significantly influenced by the environment. In the first 1,000 days of life, neuronal development and brain circuitry are stimulated by positive experiences that shape brain capacity and inform the ability to process complex information, skills and tasks. This development begins during the foetal stage then accelerates rapidly upon birth. Infants and young children benefit from positive and responsive interactions with at least one consistent caregiver, including exposure to language and opportunities for exploration and learning. For example, verbal engagement between parents and young children is one of the strongest influences on subsequent language development (Bakermans–Kranenburg and Van IJzendoorn, 2010; Shonkoff and Levitt, 2010).
Between the ages of three and five there is a second window of opportunity, but also vulnerability. The pace of development of visual, auditory, language and prefrontal regions of the brain peaks by five to six years of age. Thus great attention is required in areas of disease prevention; basic healthcare; cognitive and language stimulation; social and emotional responsiveness of family, community and friends; and safety and protection (Pinheiro, 2006; Zigler, Gilliam and Jones, 2006). From around the age of six up to the age of eight or nine, after which the transition to primary school is complete, child development and learning have a symbiotic relationship. Cognition and language are used to learn new numeracy and literacy skills. This is also the stage in which socialization, tolerance and respect, regulation of emotions and positive learning are reinforced through new behaviours and interactions. This age
range is characterized by school readiness, which is vital for school completion, later skill development and acquiring academic competencies as well as non-academic success (Kagitcibasi et al., 2009; Rouse, Brooks-Gunn and McLanahan, 2005).
The bottom line is that if children do not receive adequate stimulation, support and protection during the critical windows of growth, they can lose the opportunity to develop specific skills and abilities associated with that stage of development (see Box 1). Intensive remediation later in childhood is needed to obtain these missed skills or abilities, an exercise that is very costly and often unsuccessful (Young and Mustard, 2008).
Box 1: Investing in Early Brain Health Starting from the moment of conception and going throughout our lifetime, our brains – and consequently our personalities, behaviour and well-being are shaped by many factors. Our genes play a vital part in determining how our brains develop and our susceptibility to brain diseases. But the environment we are exposed to and individual experiences can also powerfully affect brain health.
Early development is a time of massive building and organization in the brain through a highly orchestrated process by which cells are born, develop into the correct type, move to their correct places and wire to the correct partners. Although the brain largely cannot repair itself after injury, its capacity for reconfiguring itself, particularly in childhood, is extensive.
Influences on Early Brain Health
Stress: Long-term, uncontrolled stress can impact the brain at any stage of life, with particular harm noted early in life. Stress, such as living in poverty, trauma of violence and abuse can trigger mental illness or substance abuse. Long-term release of stress hormones causes shrinkage in the hippocampus, a part of the brain associated with learning and memory. Stress also affects the immune system and metabolism.
Nutrition: Healthy early brain development depends on proper nutrition. Although many of the mechanisms are not completely understood, we know that nutrients such as fatty acids, iron, vitamins and amino acids are required for neurons to develop and function correctly, while
“A child born today must master skills and knowledge that were needed only by elites a century ago.”
O’Gara, 2013
Education and Skills 2.0: New Targets and Innovative Approaches18
deficiencies in them can lead to abnormal brain development – some of which may be irreversible. Poor prenatal nutrition can lead to poor cognitive and motor development in the child, as well as poor long-term heath. Malnutrition in early childhood is also linked to lower IQ, poorer academic performance and antisocial behaviour.
Lack of stimulation: The early years are a critical time for developing emotional and cognitive skills. Children raised in impoverished environments suffer consequences for years to come with differences in the structure and growth of their brains, pointing to the permanence of the deficits at a biological level.
Interventions to Improve Early Brain Health
Reducing trauma and deprivation: Sometimes the deleterious effects of trauma and deprivation on brain health can be reversed by better life conditions. Providing social support to at-risk mothers improves the subsequent well-being of their children. Compared to children of mothers who do not receive support, rates of antisocial behaviour and substance abuse are reduced and health is improved. Likewise, enrolling children from traumatic backgrounds in early intervention education programmes raises their social and cognitive performance.
Exercise: Physical activity boosts cognitive performance. Children who regularly perform aerobic exercise have higher IQs and perform better on a variety of cognitive functions, particularly those related to executive control (such as planning, memory, task-switching and decision-making). Exercise also reduces stress and may therefore remove its deleterious effects on brain health.
Language stimulation: Being multilingual is not only advantageous in today’s world, there is evidence that learning more than one language as a child confers cognitive benefits. Bilingual children outperform monolingual children overall on a number of cognitive abilities, particularly those requiring mental flexibility, attention, inhibitory control or task-switching. These abilities are relevant to domains beyond language, such as decision-making and creativity (Hilchey and Klein, 2008).
For society, education is a key building block. It has been almost universally established that children who participate in quality early education programmes outperform their peers who did not attend
such programmes with respect to any measure of cognitive and noncognitive development. That is why UNESCO’s Education For All (EFA) goals and the UN’s Millennium Development Goals (MDG) call for a universal primary education and a good quality one. Yet while these initiatives have succeeded in getting children enrolled in school and improving access, little progress has been made on better learning. Recent evaluations have shown high rates of grade repetition and drop out in the primary grades, along with children reading at levels far below their grade (World Bank, 2011).
For the individual, skills and knowledge gained through early education are strong predictors of later achievement and success. This includes better primary school outcomes, in the form of lower attrition rates and higher achievement and engagement. For example, the OECD’s 2009 Program for International Student Assessment (PISA) survey shows that in 58 countries, 15-year-old students who attended one year of preprimary school outperformed their peers who lacked early educational enrichment. Similar results arise in secondary schooling and young adulthood (Schweinhart et al., 2005).
Investing in Early Childhood Makes Economic Sense
Early childhood is being hailed by many economists as the smartest investment with respect to sustained returns in the form of individual learning and earning potential, internal efficiencies in the system, a lesser burden on society (especially for the health, justice and social protection systems) and a way to narrow the gap between disadvantaged and advantaged young children and families. The evidence for this assertion comes from two streams: (a) benefits to the individual (including increased school success and educational attainment, improved health and higher after-tax earnings; and (b) benefits to society.
On the cost side, investing in preprimary education has been linked to increasing the internal efficiency of primary school education by lowering its costs. Because children who attend preschool are less likely to repeat grades, drop out or require special education, significant cost reductions are realized in education budgets (Naudeau, Kataoka, Valerio et al., 2011). Furthermore, there are decreased costs of public education, improved classroom climate and greater learning from peers (because some children are better behaved and children learn from each other).
Social returns – that is, benefits to society resulting from public costs of education – are also noted in terms of decreased healthcare costs, reduced crime and violence, increased tax revenues, higher economic growth due to productivity enhancements and lower social and economic inequalities (Barnett and Nores, 2010). It is the developing countries that benefit the most with estimated social returns on investing in primary school education at 24% for SSA, 20% for Asia and 18% for Latin America – higher than the 14% for developed regions.
Among the most frequently presented data in support of ECD as one of the smartest investments in human capital development is the “Heckman Curve” (Heckman, 2006). It shows the steepest gradient in returns during the early years leading to primary school. Thereafter, it levels out during the secondary and tertiary education years. Although the data used to compute the return on investment in the original charts were primarily from the United States, more recent work has focused on low-and middle-income countries (Nores and Barnett, 2010). Increasing enrolment in just one type of ECD programme (e.g. preschool) in a sample of 73 low- and middle-income countries can result in a benefit to society of US$ 10 billion to US$ 34 billion – and a benefit-to-cost ratio of 6.4 to 17.6, depending on the percentage of children enrolled (Engle et al., 2011).
Furthermore, programmes for marginalized and disadvantaged young children – in the areas of health, education and environmental sustainability and protection – have been able to demonstrate remarkable effects. For example, one study found that disadvantaged children enrolled in quality ECD made greater gains than their more advantaged peers, thereby reducing gaps in readiness for school and reducing racial and ethnic inequalities (Rouse, Brooks-Gunn and McLanahan, 2005). Evaluations show that one reason for their effectiveness is that, as children grow, the disparity between an average growth trajectory and a delayed trajectory widens. Intervening earlier requires fewer resources and less effort with greater effectiveness. These early identification and intervention programmes are also vital to assist children with disabilities to achieve to their fullest potential and, to the greatest degree possible, eliminate later disparities and inequalities.
19Education and Skills 2.0: New Targets and Innovative Approaches
A Report Card on Current ECDSo how is the global community doing on meeting early childhood needs? The best data to draw on come from UNICEF’s Multiple Indicator Cluster Survey (MICS), which is a nationally representative and internationally comparable household survey implemented in many low-and middle-income countries to capture the ECD situation. It follows a robust method-ology for sampling, data collection, validation and analyses (Bornstein et al., 2012). To date, four rounds of MICS have been implemented. We report on data from MICS3 that was carried out in over 50 countries in 2005–2006 and MICS4 in about the same number of countries in 2009–2011. MICS3 has three question-naires: a Household Questionnaire, a Questionnaire for Individual Women (15–49 years old), and a Questionnaire for Children Under Five. We begin with a snapshot of child outcomes through a composite ECD index and then focus on contextual influences on development through a series of indicators of the early caregiving environment collected in 30 countries.
Child Outcomes
Overall, a composite ECD index – which combines literacy–numeracy, physical, social–emotional and learning domains – suggests that one-third of children under five years of age are not achieving their developmental potential, with a large variation across and within countries. Across countries, there is a set such as Bosnia and Herzegovina and Mongolia, where strong national investment has been made in ECD and nearly all children are developmentally on track. The other set of countries are in SSA, where only about one-third of children are developmentally on track. In all countries, however, there is a significant difference between those who are in the richest quintile compared to those in the poorest, with the majority of children in the poorest quintile not developmentally on track. Among the development domains, there are also large differences. For example, in physical development nearly all 30 countries are doing well; however, in literacy–numeracy there is a significant spread among the countries, although overall even the best performing country (Belarus) is not yet at 50%.
Caregiving
As for contextual influences on child outcomes, a series of analyses focusing on caregiving behaviours (based on the
MICS3 data across a sample of 28 countries) indicates that for one-third of the children, their basic health, development and protection rights are not being met. A major concern is nutrition, with on average only 25% of mothers reporting exclusive breastfeeding the previous day for their infant under six months of age. Although the reported range is wide (5– 57%), even at the uppermost limit it is still at best half the desired percentage of mothers reporting exclusive breastfeeding (EBF).
In the area of cognitive caregiving, the results (based on the MICS3) suggest that children are not receiving enough stimula-tion. The data reveal that, on average, 25% of mothers have read to their child in the past three days, slightly over 33% have told stories to their children in the past three days, and close to one-half (47%) have engaged in counting, naming and other learning activities. With respect to the socio-emotional scales, the frequency of engagement is higher, with at least 25% in all countries and, on average, 50% of moth-ers, reporting singing with their child in the past three days, about two-thirds (64%) reporting taking their child out of the house and 60% reporting playing with their child. As for disciplinary practices, about two-thirds of caregivers report that their children have experienced psychological aggression from the parent (66%) and mild physical discipline (63%) in the past month.
Access to ECD Programmes
The picture for access to ECD programmes is still rather unclear because of the difficul-ties in monitoring access – a myriad of programmes fall into this category and many of them are either nonformal or receive nongovernmental support. The clearest data available are for preprimary education provided by ministries of education, usually for children between four and six years of age. And this data suggests that more than 50% of children access a preprimary programme. But this average is misleading in that it is driven by high enrolment rates in a handful of countries and within the highest income brackets.
By contrast, MICS data for early educa-tion programme enrolment show that, for one-third of countries in the sample, preprimary school enrolment is less than 10% (UNICEF, 2012). Moreover, in most countries, there is a significant disparity in enrolment, favouring the richest 20% in a country, compared to the poorest 20%. These data point to the pervasive negative influence of poverty on equitable access, along with the limited and unequal nature of access to early education.
The Landscape of ECD ProgrammesThe inequitable distribution of opportuni-ties and resultant inequality in educational outcomes and workforce development need a bold systematic approach that addresses the underlying mechanisms that perpetuate these circumstances. A sustainable and systematic response to these challenges can be found in the evidence from ECD. When policy and pro-grammatic action addresses the most formative and foundational stage of human development, then we can expect more inclusive and equitable social and economic development. Indeed, early childhood sets in motion an equity-based pathway from opportunity to outcome.
To better understand the current landscape of ECD programmes, it is helpful to view the interventions and programmes as varying on a range of dimensions, as illustrated in Figure 1.
Using a developmental perspective, programmes can be considered on the continuum of child age, from prenatal to eight years of age, with transitions noted at the ages of three and six years.
Using a sector perspective, these programmes can be viewed as falling into various sectors – typically health, educa-tion, social protection and welfare and child protection. Of these, the dominant sectors, health and education, typically focus on different age groups within the ECD period. The health sector typically leads during infancy and toddlerhood through programmes focusing on immunization, nutrition and health interventions, and during the preschool years the lead sector is typically educa-tion. However this transition is often not coordinated, with many gaps in services.
Using a sponsorship perspective, these programmes can be grouped by those falling under the auspices of the government, a nongovernmental organization (NGO) or the private sector for fee or profit. Government programmes are implemented primarily through national systems. However, the main sponsors of ECD programmes are international, national and community-based organizations. Some of the international groups are: Save the Children, Plan International, Child Fund International and World Vision. Another growing sector in ECD is the private for fee or for profit, which is starting to gain dominance in early learning programmes for children in the preschool age bracket (Woodhead and Streuli, 2013).
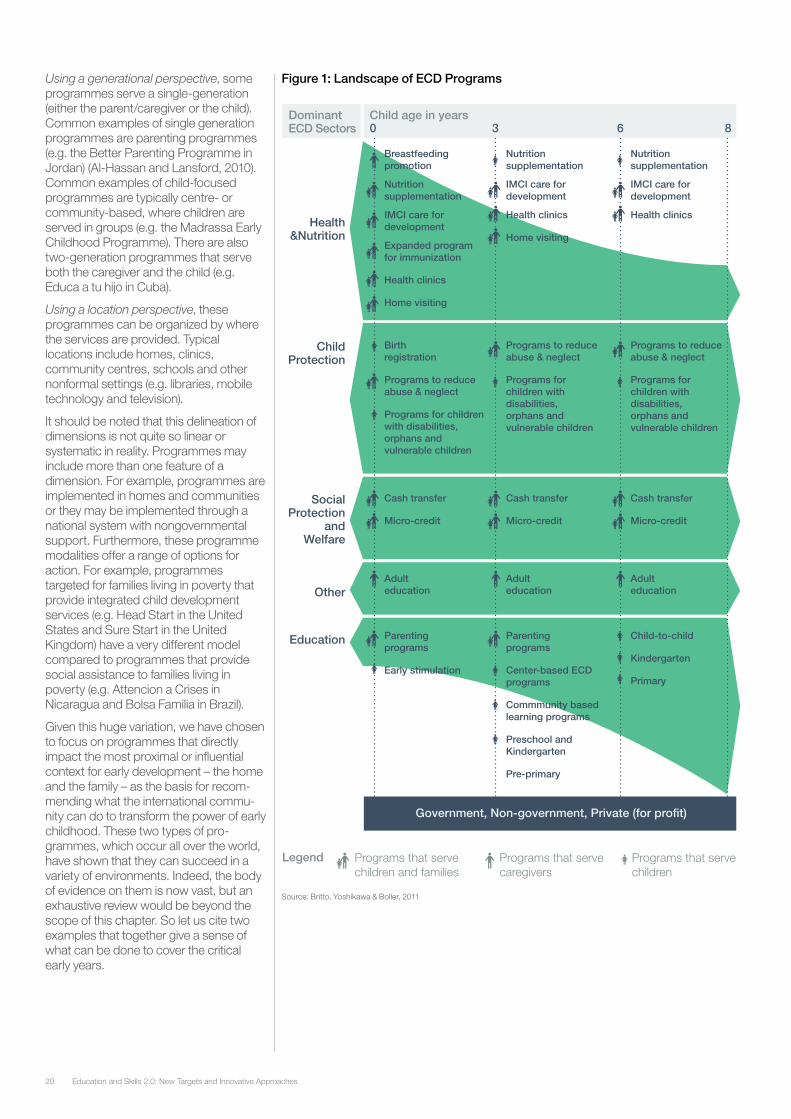
Education and Skills 2.0: New Targets and Innovative Approaches20
Using a generational perspective, some programmes serve a single-generation (either the parent/caregiver or the child). Common examples of single generation programmes are parenting programmes (e.g. the Better Parenting Programme in Jordan) (Al-Hassan and Lansford, 2010). Common examples of child-focused programmes are typically centre- or community-based, where children are served in groups (e.g. the Madrassa Early Childhood Programme). There are also two-generation programmes that serve both the caregiver and the child (e.g. Educa a tu hijo in Cuba).
Using a location perspective, these programmes can be organized by where the services are provided. Typical locations include homes, clinics, community centres, schools and other nonformal settings (e.g. libraries, mobile technology and television).
It should be noted that this delineation of dimensions is not quite so linear or systematic in reality. Programmes may include more than one feature of a dimension. For example, programmes are implemented in homes and communities or they may be implemented through a national system with nongovernmental support. Furthermore, these programme modalities offer a range of options for action. For example, programmes targeted for families living in poverty that provide integrated child development services (e.g. Head Start in the United States and Sure Start in the United Kingdom) have a very different model compared to programmes that provide social assistance to families living in poverty (e.g. Attencion a Crises in Nicaragua and Bolsa Familia in Brazil).
Given this huge variation, we have chosen to focus on programmes that directly impact the most proximal or influential context for early development – the home and the family – as the basis for recom-mending what the international commu-nity can do to transform the power of early childhood. These two types of pro-grammes, which occur all over the world, have shown that they can succeed in a variety of environments. Indeed, the body of evidence on them is now vast, but an exhaustive review would be beyond the scope of this chapter. So let us cite two examples that together give a sense of what can be done to cover the critical early years.
Figure 1: Landscape of ECD Programs
Source: Britto, Yoshikawa & Boller, 2011
Child age in yearsDominantECD Sectors
Health&Nutrition
Breastfeedingpromotion
Nutritionsupplementation
IMCI care fordevelopment
Expanded programfor immunization
Health clinics
Home visiting
Nutritionsupplementation
IMCI care fordevelopment
Health clinics
Home visiting
Nutritionsupplementation
IMCI care fordevelopment
Health clinics
ChildProtection
Birthregistration
Programs to reduceabuse & neglect
Programs for childrenwith disabilities,orphans andvulnerable children
Programs to reduceabuse & neglect
Programs forchildren withdisabilities,orphans andvulnerable children
Programs to reduceabuse & neglect
Programs forchildren withdisabilities,orphans andvulnerable children
SocialProtection
andWelfare
Cash transfer
Micro-credit
Cash transfer
Micro-credit
Cash transfer
Micro-credit
OtherAdulteducation
Adulteducation
Adulteducation
Education Parentingprograms
Early stimulation
Parentingprograms
Center-based ECDprograms
Commmunity basedlearning programs
Preschool andKindergarten
Pre-primary
Child-to-child
Kindergarten
Primary
0 3 6 8
Government, Non-government, Private (for profit)
Programs that servechildren and families
Programs that servecaregivers
Programs that servechildren
Legend
21Education and Skills 2.0: New Targets and Innovative Approaches
MOCEP is now implemented over 25 weeks in the form of structured weekly group meetings and home visits with mothers conducted by ACEV-trained groups leaders, along with a weekly curriculum for the child that is implement-ed at home by the mothers. The pro-gramme targets both mother and child, with educational outcomes geared toward both groups: enriching children cognitively to boost school readiness and optimal psycho-social development and training of mothers to create a sustainable nurturing and healthy home environments. Instead of a teacher, it leverages the mother in her natural educator role. Rather than a preschool, it implements cognitive development exercises at home. It also promotes inclusion as children without access to preschool are provided with a proven alternative.
In the second follow-up of TEEP, 19 years after the original study that tracked the original sample in young adulthood, the results further pointed to long-term benefits in educational attainment (including university education), cognitive performance, occupational status and social participation of the young adults whose mothers had participated in the training programme. There are many individual stories from both the original sample and children and mothers who participated over the years. Ceren, for example, is today a young architect and still recalls practising the worksheets at home with her mother, a factory worker. She calls her mother her “first teacher” and believes that preschool year was instrumental in her academic success. Twenty years later, she also participated in the MOCEP for her son and is an active community leader that has established a parent-led preschool in Istanbul.
Today, MOCEP has been implemented on a wide scale in Turkey, in collaboration with the Ministry of National Education, and it has also been replicated in several European and Middle Eastern countries, reaching over 400,000 mothers and children. Yet despite the mounting evidence on the critical period of the early years, over half the world’s children still lack access to preschool services and are unable to fulfil their potential. In this respect, MOCEP is an effective and cost-efficient viable model, capitalizing on the critical role of the mother to maximize our investment in young children.
The first example addresses the first 1,000 days of life, when the proliferation of neuronal connections and brain development is acute (see Box 2). It shows that by providing nutrition and stimulation in formative period of development, the complexity and pace of brain function and development are supported. The second example addresses the second 1,000 days of life (three to six years of age) (see Box 3). It shows that by providing a stimulating, enriching social, emotional and learning environment, children’s holistic development to achieve their potential is facilitated.
Box 2: The First 1,000 Days: Care for Child DevelopmentFor the first 1,000 days of life, the Care for Child Development package is a landmark, holistic intervention that brings together the essential evidence-based components. Developed by the WHO and UNICEF, it aims to guide the interaction between a caregiver and a child in a family setting, and also improve the caregiving skills of parents and other caregivers. The intervention starts with improving the skills of (mostly health) service providers, who work with families on ways to improve care practices (including the feeding practices, stimulating a child’s learning and care of the sick child), and prevent child neglect and abuse. The goal is to strengthen families’ knowledge, skills and belief in themselves to provide the best possible care, stimulation and environment for their children’s optimal development. The package was originally developed in the late 1990s and most recently updated in 2012 (WHO and UNICEF, 2012).
How is the programme doing? A recent evaluation (in an experimental randomized controlled trial) shows that within a year of implementation, the children of families participating in the programme had better cognitive development, social relationships, emotional bonds and language and communication skills. The mothers were less depressed and the family environment was more positive and stimulating. All these impacts are among the strongest predictors of later health, achievement and success (Yousafzai and Petrovic, forthcoming).
Box 3: The Second 1,000 Days: Turkish Early Enrichment ProjectFor the second 1,000 days of life, probably the only robust research on the longitudi-nal effects of ECD intervention from a developing country is the Turkish Early Enrichment Project (TEEP). It was carried out in 1983–1985 with 255 children aged four to six years of age from deprived backgrounds. It was designed to examine the separate and combined effects of two types of enrichment: a centre-based education and a home-based education (Kagitcibasi, Sunar and Bekman, 2001). For the programme, mothers of about half the children were randomly assigned to receive mother training – such as how to support the children’s development through cognitively stimulating structured activities – and the other half did not receive any mother training.
So far, there have been four evaluations: preprogramme, immediately postpro-gramme, seven years after the programme, and 19 years after the programme. TEEP has shown a positive, long-lasting impact on both mother and child. Right after the original study, benefits were found in all spheres of development and children of participating mothers achieved higher scores in intelligence and general aptitude tests. In the first follow-up, the results point to sustained benefits in cognitive develop-ment, school achievement, school attainment and socio-emotional develop-ment and social integration. Mothers and families also benefited from the programme in terms of better family relations and increased women’s intra-family status.
What makes TEEP unique is not only the comprehensive research results but how it has evolved and been taken to scale nationally as well as replicated in several countries. After the impressive results of the first follow-up of TEEP it was decided that the programme provided a viable low-cost early childhood education model that could be offered to underprivileged young children across Turkey. The Mother Child Education Foundation (ACEV) was thus established in 1993 with this mandate. TEEP was renamed as the Mother Child Education Programme (MOCEP), with the premise being that the early developmental needs of children must be met and supported by their immediate environment and parents play an important role as “first educators”.
Education and Skills 2.0: New Targets and Innovative Approaches22
In closing, given the overwhelming evidence now available on the importance of investing in children in the early years – and the fact that doing so would make good economic sense – we strongly believe that governments and donors can no longer afford not to invest in early childhood programmes and policies. As the global community discusses the next generation of development goals, we need to place a high priority on creating a sound foundation for human development – including seriously considering a goal for early childhood. We believe all young children will achieve their developmental potential through access to quality early childhood programmes and policies. If we want a more equitable and prosperous world, it begins with making the smart and the right investments in the earliest years.
ReferencesAl-Hassan, S.M. and Lansford, J.E. Evaluation of the better parenting program in Jordan. In Early Child Development and Care, 2010: 217–226. Doi:10.1080/03004431003654925.
Bakermans-Kranenburg, M.J. and Van IJzendoorn, M.H. Parenting matters: Family science in the genomic era. In Family Science, 2010. 1: 25–35.
Barnett, W.S. and Nores, M. “National Institute for Early Education Research: Investing in Early Childhood Education: A Global Perspective”. http://nieer.org/sites/nieer/files/Investing%20in%20Early%20Childhood%20Eduation%20A%20Global%20Perspectivei.pdf, 2010.
Bornstein, M.H., Britto, P.B., Nonoyama-Tarumi, Y., Ota, Y., Petrovic, O. and Putnick, D.L. Child development in developing countries: Introduction and methods. In Child Development, 2012
Britto, P.R., Engle, P.L. and Super, C.S. (eds). Handbook of Early Child Development Research and its Impact on Global Policy. New York, NY: Oxford University Press,2013.
Britto, P.R. and Ulkuer, N. Child development in developing countries: Child rights and policy implications. In Child Development, 2012, 83(1): 92–103.
Britto, P., Yoshikawa, H. and Boller, K. Quality of early childhood development programs and policies in global contexts: Rationale for investment, conceptual framework and implications for equity. In Social Policy Reports of the Society for Research in Child Development, 2011, 25(2): 1–31.
Engle, P.L., Black, M.M., Behrman, J.R. et al. Strategies to avoid the loss of developmental potential in more than 200 million children in the developing world. In Lancet, 2007, 369: 229–242.
Engle, P.L., Fernald, L.C., Alderman, H., Behrman, J., O'Gara, C., Yousafzai, A., de Mello, M.C., Hidrobo, M., Ulkuer, N., Ertem I., Iltus S. and The Global Child Development Steering Group. Strategies for reducing inequalities and improving developmental outcomes for young children in low-income and middle-income countries. In The Lancet, 2011, 378(9799): 1339–1353.
Grantham-McGregor, S., Cheung, Y.B., Cueto, S., Glewwe, P., Richter, L. and Strupp, B. Developmental potential in the first 5 years for children in developing countries. In The Lancet, 2007, 369: 60–70.
Harvard Center on the Developing Child. The Science of Early Childhood Development: Closing the Gap Between What We Know and What We Do. Cambridge, MA: Author, 2007.
Heckman, J.J. Skill formation and the economics of investing in disadvantaged children. In Science, 2006, 312: 1900–1902.
Kagitçibasi, Ç., Sunar, D., Bekman, S., Baydar, N. and Cemalcilar, Z. Continuing effects of early intervention in adult life: The Turkish Early Enrichment Project 22 years later. In Journal of Applied Developmental Psychology, 2009, 30: 764–779.
Naudeau, S., Kataoka, N., Valerio, A., Neuman, M.J. and Elder, L. K. Investing in Young Children: An Early Childhood Development Guide for Policy Dialogue and Project Preparation. Washington DC: World Bank, 2011.
Nores, M. and Barnett, W.S. Benefits of early childhood interventions across the world: (Under) investing in the very young. In Economic of Education Review, 2010, 29: 271–282.
O’Gara, C. Education based approaches to early childhood. In P.R. Britto, P.L. Engle and C.S. Super (eds). Handbook of Early Child Development Research and Its Impact on Global Policy. New York, NY: Oxford University Press, 2013.
An Action Agenda for Policies and ProgrammesFirst, mobilize stronger commitment to ECD. We call upon the global community to demonstrate commitment through international frameworks and strategies. Governments in particular have an important role in ensuring ECD is an integral part of human development policy, enforced through national legislation and harnessing of resources. Careful attention must be paid to ensuring the access of the most vulnerable populations. And creative, holistic solutions should be used to meet the multidimensional development needs of young children and their families.
Second, invest in evidence based programmes. Programmatic action has to be rooted in evidence that moves beyond proof of concept to being implementable at scale. The educational needs are vast and small demonstration programmes fall short of reaching the required populations. The genesis of the Care for Child Development can be traced back to the original study in Jamaica in the 1980s, which compared the impact of nutrition and stimulation on height and cognitive development of children age 9 to 24 months in a randomized trial in a poor disadvantaged urban neighborhood of Kingston. Most recently, this evidence was validated through a similar trial in Pakistan with an added emphasis on understanding scalability (PEDS Trial; Yousafzai and Petrovic, forthcoming). Similarly, the Turkish Early Enrichment Project has been rigorously evaluated using robust research designs to establish the accuracy of the evidence.
Third, invest in quality. Programme evaluations have shown consistently that the positive outcomes of early development and education interventions are dependent on the quality of programming. It is therefore critical for policy-makers to invest in high quality programmes to ensure that the greatest benefits accrue to both the individual and society. This is particularly critical when taking demonstration or pilot programmes to scale. Once the Turkish Early Enrichment Project had proven successful as a demonstration project, it was translated into the Mother Child Education Programme (MOCEP) in a manner that it could be implemented in multiple sites, across Turkey, and now internationally, while maintaining the quality and credibility (see Box 3). The Care for Child Development Programme, also using similar mechanisms for scale
up, is being supported by UNICEF and the WHO. A key recommendation for programming at scale is to ensure that programmes are built on a strong foundation of evidence with the potential to be scaled up to reach targeted access objectives, with quality.
Fourth, provide integrated services because development is holistic. As demonstrated by these two programmes, it was a set of integrated services (such as nutrition and stimulation) that produced the desired impact. Thus, interventions need to be able to address the complexity of young children’s environmental and developmental needs. These models also demonstrated the importance of including multigenerational approaches by address-ing both the children and their primary caregivers. In doing so, these interventions were able to maximize their impact. There are a series of other intervention models – such as media-based models (e.g. Sesame Street), childcare in the work place, adult literacy and parenting – that also include multigenerational approaches and have been successful.
Fifth, promote partnerships. The nature of ECD is multidisciplinary and multisecto-ral. It necessitates at the very least the coordination of the health, education and child protection sectors. It also requires the cooperation of families, communities, and local, as well as national, institutions. ECD has already benefited from the innovations in the NGO sector that have advanced the field in evidence-based programmes going to scale. Advancing ECD today will be successful if we involve the various sectors and stakeholders that touch the lives of young children and harness their power.
Sixth, commit to financial sustainability of programmes. This is probably one of the greatest constraints for ECD programmes and social sector programmes in general. Typically, the programmes are supported by NGOs or international agencies and are sustained for the duration of the funding. Currently, governments provide a meagre amount of ECD funding, and with the funds that are available, decisions for allocating resources to programmes are not systematic. This pattern of support for ECD programmes needs to be changed through policy commitments underwritten with financial allocations. Donors who have invested significantly in education must align their funding with the evidence for ECD on educational outcomes. A Global Fund for Early Childhood could be an important innovation in mobilizing a commitment to ECD.
23Education and Skills 2.0: New Targets and Innovative Approaches
Pinheiro, P.S. “Report of the independent expert for the United Nations study on violence against children. United Nations General Assembly”. http://www.unicef.org/violencestudy/ reports/SG_violencestudy_en.pdf, 2006.
Schweinhart, L.J., Montie, J., Xiang, Z., Barnett, W.S., Belfield, C.R. and Nores, M. Lifetime effects: The High/Scope Perry Preschool Study through age 40. In Monographs of the High/Scope Educational Research Foundation, 14. Ypsilanti, MI: High/Scope Press, 2005.
Shonkoff, J.P. and Levitt, P. Neuroscience and the future of early childhood policy: Moving from why to what and how. In Neuron, 2010, 67: 689–691
Rouse, C., Brooks-Gunn, J. and McLanahan, S. Introducing the issue, “School readiness: Closing racial and ethnic gaps”. In The Future of Children, 2005, 1: 5–14.
United Nations Children's Fund. Inequities in Early Childhood Development: What the Data Say – Evidence from the Multiple Indicator Cluster Survey. New York, NY: UNICEF, 2012.
Vargas-Barón, E. Building and strengthening national systems for early childhood development. In P.R. Britto, P. Engle and C. Super (eds). Handbook of Early Childhood Development Research and Its Impact on Global Policy. New York: Oxford University Press, 2013: 443–466.
Woodhead, M. and Streuli, N. Early education for all: Is there a role for the private sector? In P.R. Britto, P. E. Engle and C. Super (eds). Handbook of Early Childhood Development Research and Its Impact on Global Policy. New York: Oxford University Press, 2013.
World Bank. Learning for All: Investing in People’s Knowledge and Skills to Promote Development. Washington DC: World Bank, 2011.
Young, M.E. and Mustard, F. Brain development and ECD; a case for investment. In M. Garcia, A. Pence and J. Evans (eds). Africa’s Future, Africa’s Challenge: Early Childhood Care and Development in Sub-Saharan Africa. Washington DC: The World Bank, 2008.
Yousafzai, A. and Petrovic, O. The PEDS Trial: Impact of Care for Child Development in Pakistan. UNICEF and Aga Khan University, forthcoming.
Zigler, E.F., Gilliam, W.S. and Jones, S.M. A Vision for Universal Preschool Education. New York: Cambridge University Press, 2006.
Endnotes1. Early Childhood Development (ECD) is known by a multitude
of names, including “early childhood care”, “early childhood care and development”, “early childhood care and education”, “early childhood development”, “early childhood education”, “early childhood intervention,” and “early childhood services.” The presence of these related and sometimes interchange-able terms demonstrates deliberate efforts to address the development, care, and education of young children. In this chapter we use the term “Early Childhood Development” (ECD) to capture a multifaceted concept that focuses on the child’s outcome (development) which depends on characteristics of the child and the context such as care or education (Britto, Engle and Super, 2013). In this conceptual-ization, we describe both the child and the context.
Education and Skills 2.0: New Targets and Innovative Approaches24
Calling All Minds
On the face of it, the 21st century has, so far, improved educational opportunities for girls. There is greater understanding throughout the world that women play a vital role in society and the economy and there is greater emphasis globally on the need to educate female children.
Widespread ratification of the Convention on the Elimination of All Forms of Discrimi-nation Against Women (CEDAW), which many consider to be an international bill of rights for women, shows that countries are willing (or, at least, have publicly said that they are willing) to take concrete steps to end discrimination and violence against women and to improve their status in society. At the same time, increased acceptance of gender equality as a right in and of itself is bringing specific attention to the issue of girls' education.
In 2000, the United Nations adopted eight Millennium Development Goals (MDGs) aimed at boosting living standards by 2015, many of which include a focus on gender. MDG 3 calls for promoting gender equality and empowering women – with a specific target of eliminating gender disparity in primary and secondary education, preferably by 2005, and in all levels of education, no later than 2015. The other MDGs call for achieving universal primary education; reducing child mortality; improving maternal health; eradicating poverty and extreme hunger; combating HIV/AIDS, malaria and other diseases; ensuring environmental sustainability; and creating a global partnership for development.
These international goals have produced measurable results for girls and women and show how valuable it can be to frame issues in terms of gender. UNICEF, UNESCO and the World Bank, along with organizations like the Nike Foundation and the NoVo Foundation, have helped place girls' education on the global agenda and are increasing efforts to provide a quality education to more girls worldwide. All of this has, in turn, fueled
Chapter 2: Investing in Girls (and Women) to Spur Economic DevelopmentTae Yoo
Education and Skills 2.0: New Targets and Innovative Approaches24
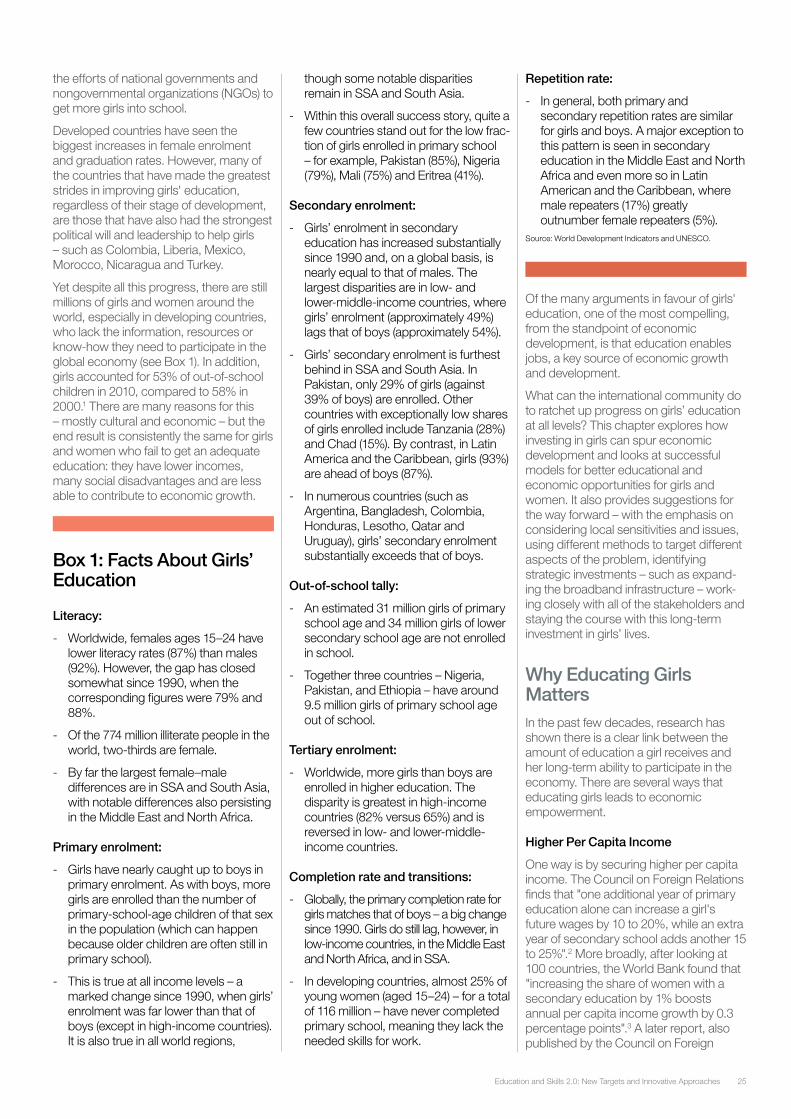
25Education and Skills 2.0: New Targets and Innovative Approaches
the efforts of national governments and nongovernmental organizations (NGOs) to get more girls into school.
Developed countries have seen the biggest increases in female enrolment and graduation rates. However, many of the countries that have made the greatest strides in improving girls' education, regardless of their stage of development, are those that have also had the strongest political will and leadership to help girls – such as Colombia, Liberia, Mexico, Morocco, Nicaragua and Turkey.
Yet despite all this progress, there are still millions of girls and women around the world, especially in developing countries, who lack the information, resources or know-how they need to participate in the global economy (see Box 1). In addition, girls accounted for 53% of out-of-school children in 2010, compared to 58% in 2000.1 There are many reasons for this – mostly cultural and economic – but the end result is consistently the same for girls and women who fail to get an adequate education: they have lower incomes, many social disadvantages and are less able to contribute to economic growth.
Box 1: Facts About Girls’ Education
Literacy:
- Worldwide, females ages 15–24 have lower literacy rates (87%) than males (92%). However, the gap has closed somewhat since 1990, when the corresponding figures were 79% and 88%.
- Of the 774 million illiterate people in the world, two-thirds are female.
- By far the largest female–male differences are in SSA and South Asia, with notable differences also persisting in the Middle East and North Africa.
Primary enrolment:
- Girls have nearly caught up to boys in primary enrolment. As with boys, more girls are enrolled than the number of primary-school-age children of that sex in the population (which can happen because older children are often still in primary school).
- This is true at all income levels – a marked change since 1990, when girls’ enrolment was far lower than that of boys (except in high-income countries). It is also true in all world regions,
though some notable disparities remain in SSA and South Asia.
- Within this overall success story, quite a few countries stand out for the low frac-tion of girls enrolled in primary school – for example, Pakistan (85%), Nigeria (79%), Mali (75%) and Eritrea (41%).
Secondary enrolment:
- Girls’ enrolment in secondary education has increased substantially since 1990 and, on a global basis, is nearly equal to that of males. The largest disparities are in low- and lower-middle-income countries, where girls’ enrolment (approximately 49%) lags that of boys (approximately 54%).
- Girls’ secondary enrolment is furthest behind in SSA and South Asia. In Pakistan, only 29% of girls (against 39% of boys) are enrolled. Other countries with exceptionally low shares of girls enrolled include Tanzania (28%) and Chad (15%). By contrast, in Latin America and the Caribbean, girls (93%) are ahead of boys (87%).
- In numerous countries (such as Argentina, Bangladesh, Colombia, Honduras, Lesotho, Qatar and Uruguay), girls’ secondary enrolment substantially exceeds that of boys.
Out-of-school tally:
- An estimated 31 million girls of primary school age and 34 million girls of lower secondary school age are not enrolled in school.
- Together three countries – Nigeria, Pakistan, and Ethiopia – have around 9.5 million girls of primary school age out of school.
Tertiary enrolment:
- Worldwide, more girls than boys are enrolled in higher education. The disparity is greatest in high-income countries (82% versus 65%) and is reversed in low- and lower-middle-income countries.
Completion rate and transitions:
- Globally, the primary completion rate for girls matches that of boys – a big change since 1990. Girls do still lag, however, in low-income countries, in the Middle East and North Africa, and in SSA.
- In developing countries, almost 25% of young women (aged 15–24) – for a total of 116 million – have never completed primary school, meaning they lack the needed skills for work.
Repetition rate:
- In general, both primary and secondary repetition rates are similar for girls and boys. A major exception to this pattern is seen in secondary education in the Middle East and North Africa and even more so in Latin American and the Caribbean, where male repeaters (17%) greatly outnumber female repeaters (5%).
Source: World Development Indicators and UNESCO.
Of the many arguments in favour of girls' education, one of the most compelling, from the standpoint of economic development, is that education enables jobs, a key source of economic growth and development.
What can the international community do to ratchet up progress on girls’ education at all levels? This chapter explores how investing in girls can spur economic development and looks at successful models for better educational and economic opportunities for girls and women. It also provides suggestions for the way forward – with the emphasis on considering local sensitivities and issues, using different methods to target different aspects of the problem, identifying strategic investments – such as expand-ing the broadband infrastructure – work-ing closely with all of the stakeholders and staying the course with this long-term investment in girls’ lives.
Why Educating Girls MattersIn the past few decades, research has shown there is a clear link between the amount of education a girl receives and her long-term ability to participate in the economy. There are several ways that educating girls leads to economic empowerment.
Higher Per Capita Income
One way is by securing higher per capita income. The Council on Foreign Relations finds that "one additional year of primary education alone can increase a girl's future wages by 10 to 20%, while an extra year of secondary school adds another 15 to 25%".2 More broadly, after looking at 100 countries, the World Bank found that "increasing the share of women with a secondary education by 1% boosts annual per capita income growth by 0.3 percentage points".3 A later report, also published by the Council on Foreign
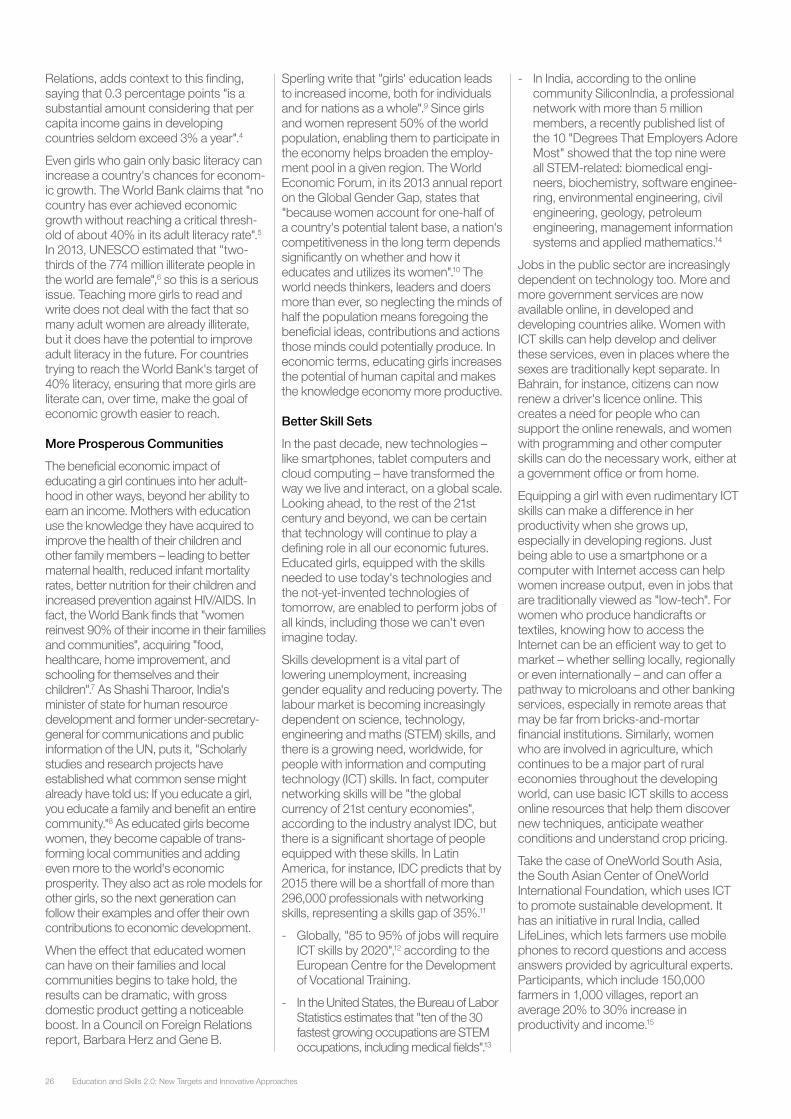
Education and Skills 2.0: New Targets and Innovative Approaches26
Relations, adds context to this finding, saying that 0.3 percentage points "is a substantial amount considering that per capita income gains in developing countries seldom exceed 3% a year".4
Even girls who gain only basic literacy can increase a country's chances for econom-ic growth. The World Bank claims that "no country has ever achieved economic growth without reaching a critical thresh-old of about 40% in its adult literacy rate".5 In 2013, UNESCO estimated that "two-thirds of the 774 million illiterate people in the world are female",6 so this is a serious issue. Teaching more girls to read and write does not deal with the fact that so many adult women are already illiterate, but it does have the potential to improve adult literacy in the future. For countries trying to reach the World Bank's target of 40% literacy, ensuring that more girls are literate can, over time, make the goal of economic growth easier to reach.
More Prosperous Communities
The beneficial economic impact of educating a girl continues into her adult-hood in other ways, beyond her ability to earn an income. Mothers with education use the knowledge they have acquired to improve the health of their children and other family members – leading to better maternal health, reduced infant mortality rates, better nutrition for their children and increased prevention against HIV/AIDS. In fact, the World Bank finds that "women reinvest 90% of their income in their families and communities", acquiring "food, healthcare, home improvement, and schooling for themselves and their children".7 As Shashi Tharoor, India's minister of state for human resource development and former under-secretary-general for communications and public information of the UN, puts it, "Scholarly studies and research projects have established what common sense might already have told us: If you educate a girl, you educate a family and benefit an entire community."8 As educated girls become women, they become capable of trans-forming local communities and adding even more to the world's economic prosperity. They also act as role models for other girls, so the next generation can follow their examples and offer their own contributions to economic development.
When the effect that educated women can have on their families and local communities begins to take hold, the results can be dramatic, with gross domestic product getting a noticeable boost. In a Council on Foreign Relations report, Barbara Herz and Gene B.
Sperling write that "girls' education leads to increased income, both for individuals and for nations as a whole".9 Since girls and women represent 50% of the world population, enabling them to participate in the economy helps broaden the employ-ment pool in a given region. The World Economic Forum, in its 2013 annual report on the Global Gender Gap, states that "because women account for one-half of a country's potential talent base, a nation's competitiveness in the long term depends significantly on whether and how it educates and utilizes its women".10 The world needs thinkers, leaders and doers more than ever, so neglecting the minds of half the population means foregoing the beneficial ideas, contributions and actions those minds could potentially produce. In economic terms, educating girls increases the potential of human capital and makes the knowledge economy more productive.
Better Skill Sets
In the past decade, new technologies – like smartphones, tablet computers and cloud computing – have transformed the way we live and interact, on a global scale. Looking ahead, to the rest of the 21st century and beyond, we can be certain that technology will continue to play a defining role in all our economic futures. Educated girls, equipped with the skills needed to use today's technologies and the not-yet-invented technologies of tomorrow, are enabled to perform jobs of all kinds, including those we can't even imagine today.
Skills development is a vital part of lowering unemployment, increasing gender equality and reducing poverty. The labour market is becoming increasingly dependent on science, technology, engineering and maths (STEM) skills, and there is a growing need, worldwide, for people with information and computing technology (ICT) skills. In fact, computer networking skills will be "the global currency of 21st century economies", according to the industry analyst IDC, but there is a significant shortage of people equipped with these skills. In Latin America, for instance, IDC predicts that by 2015 there will be a shortfall of more than 296,000 professionals with networking skills, representing a skills gap of 35%.11
- Globally, "85 to 95% of jobs will require ICT skills by 2020",12 according to the European Centre for the Development of Vocational Training.
- In the United States, the Bureau of Labor Statistics estimates that "ten of the 30 fastest growing occupations are STEM occupations, including medical fields".13
- In India, according to the online community SiliconIndia, a professional network with more than 5 million members, a recently published list of the 10 "Degrees That Employers Adore Most" showed that the top nine were all STEM-related: biomedical engi-neers, biochemistry, software enginee-ring, environmental engineering, civil engineering, geology, petroleum engineering, management information systems and applied mathematics.14
Jobs in the public sector are increasingly dependent on technology too. More and more government services are now available online, in developed and developing countries alike. Women with ICT skills can help develop and deliver these services, even in places where the sexes are traditionally kept separate. In Bahrain, for instance, citizens can now renew a driver's licence online. This creates a need for people who can support the online renewals, and women with programming and other computer skills can do the necessary work, either at a government office or from home.
Equipping a girl with even rudimentary ICT skills can make a difference in her productivity when she grows up, especially in developing regions. Just being able to use a smartphone or a computer with Internet access can help women increase output, even in jobs that are traditionally viewed as "low-tech". For women who produce handicrafts or textiles, knowing how to access the Internet can be an efficient way to get to market – whether selling locally, regionally or even internationally – and can offer a pathway to microloans and other banking services, especially in remote areas that may be far from bricks-and-mortar financial institutions. Similarly, women who are involved in agriculture, which continues to be a major part of rural economies throughout the developing world, can use basic ICT skills to access online resources that help them discover new techniques, anticipate weather conditions and understand crop pricing.
Take the case of OneWorld South Asia, the South Asian Center of OneWorld International Foundation, which uses ICT to promote sustainable development. It has an initiative in rural India, called LifeLines, which lets farmers use mobile phones to record questions and access answers provided by agricultural experts. Participants, which include 150,000 farmers in 1,000 villages, report an average 20% to 30% increase in productivity and income.15

27Education and Skills 2.0: New Targets and Innovative Approaches
Removing Barriers: Programmes that WorkTo help girls become educated, we must first remove the barriers that prevent them from attending and staying in school. UNICEF has identified many of the obstacles girls face and the observations made by NGOs and other groups that work directly with girls and women help complete the picture. This section explores some of the biggest barriers that girls in the developing world encounter. It also highlights select programmes – not necessarily the most well-known ones – that are working to break down those barriers and can serve as best-practice examples for new initiatives.
Providing Resources to the Poorest
Eliminating poverty is one of the great challenges of our time and education offers some routes to alleviating poverty. Several countries, especially in Latin America, have what are called "condi-tional" welfare programmes that aim to reduce poverty by giving money only to people once they have met certain behavioural criteria, generally related to education and children’s healthcare. The World Bank has found that conditional (and unconditional) transfer programmes can be useful – if well designed and implemented – in addressing gender inequality in education. They highlight Malawi, one of the poorest countries in the world, where a pilot programme provided cash transfers to girls who enrolled in primary schools and kept up their attendance. The two-year pilot led to a significant improvement in girls' enrolment, attendance rates and grades.16
Another study, conducted by Johns Hopkins University researchers, looked at conditional cash transfers (CCTs) for school attendance in 14 countries. They found that there is "strong evidence for positive effects of financial incentives on improving attendance".17 The Malawi programme, mentioned previously, and a programme in Guatemala, were the only two in the study that specifically targeted girls and the authors are quick to point out that rewarding attendance does not, on its own, guarantee scholastic success. However, CCTs, combined with other interventions discussed in this chapter, could be a possible solution for some countries. Scholarships, which waive fees instead of giving money directly to families, are another way of encouraging families with limited means to get their girls into school.
A Healthier Environment
If girls are not well enough for regular attendance, they can fall behind and eventually drop out of school. The WHO indicates that “272 million school days are lost each year due to diarrhea alone and about 400 million children in the developing world have worms that prevent them from learning”.18 Improving health and nutrition not only increases the likelihood that a girl will attend school but also increases her chances of growing up to be a healthy adult.
The onset of puberty is a critical time to ensure adolescent girls stay in school. UNICEF finds that one in 10 school-age African girls "do not attend . . . or drop out at puberty because of the lack of clean and private sanitation facilities in schools".19 School latrines (if they exist) may have limited privacy and poor hygienic condi-tions, making it difficult for adolescent girls to be in school. Two programmes – one in Ethiopia supported by Save the Children20 and another in Ghana supported by the international organization Plan Interna-tional21 – have introduced "girl-friendly" schools. These facilities give girls a private, protected and sanitary space, separated from boys. The Ghana programme uses standalone buildings, with ergonomically designed latrines and rainwater collected from the rooftop.
Positive Role Models
As more girls see educated women who are prominent in their careers and their communities – whether selling handmade goods online, teaching children to read, running a company or leading a nation – there is a greater incentive for them to stay in school.
Many countries have instituted quotas for women in political positions. In 1992, India amended its constitution to set aside one-third of seats, at every level of govern-ment, for women. What effect did this have on villages in West Bengal? A study by the Harvard Kennedy School of Government and the International Monetary Fund found that, with increased exposure to women in leadership roles, voters increased their approval of women as leaders. It also found that having women role models "raised the aspirations parents have for their girls and the aspirations teenage girls have for themselves".22 That said, there is still a lot to do in this area. The UN reports that the global share of women in parliaments continues to rise slowly and reached 20% in 2012 – but this was far short of gender parity, although an increase of one percentage point was seen during 2012.23
Parents can be particularly effective in ensuring that girls go to school. Pro-grammes that help redefine gender roles and increase gender equality within the family can increase the chances that a girl will get the support she needs to pursue her education. Take the ACEV Focus on Fathers in Turkey,24 which uses classes and TV programmes to encourage fathers to become more involved in child-rear-ing.25 It received a favourable review in a report by the Fatherhood Institute (a UK-based think-tank devoted to issues of male parenting), which found that "although [the ACEV courses are] not delivered from an explicit gender equality perspective, fathers are encouraged to think of the developmental and educa-tional needs of their daughters as well as those of their sons, in what is a relatively patriarchal and sex-segregated society”. In this regard, they found that the courses "demonstrated positive change".26
More Schools
If the only available schools are far away, and a girl is forced to travel long distances to get to school, the family may be less likely to allow her to attend. Transportation and the cost of travel can be part of the reason, but personal safety can also be a concern. Building educational facilities that are closer to where girls live can help increase attendance. There are many organizations dedicated to building schools in impoverished or politically and socially turbulent regions, and there are various philanthropic groups and individu-als who are interested in establishing schools just for girls and women. Barefoot College is one such organization (see Box 2) and in 2012 became the first NGO to partner with UNESCO's Global Partner-ship for Girls and Women' Education.
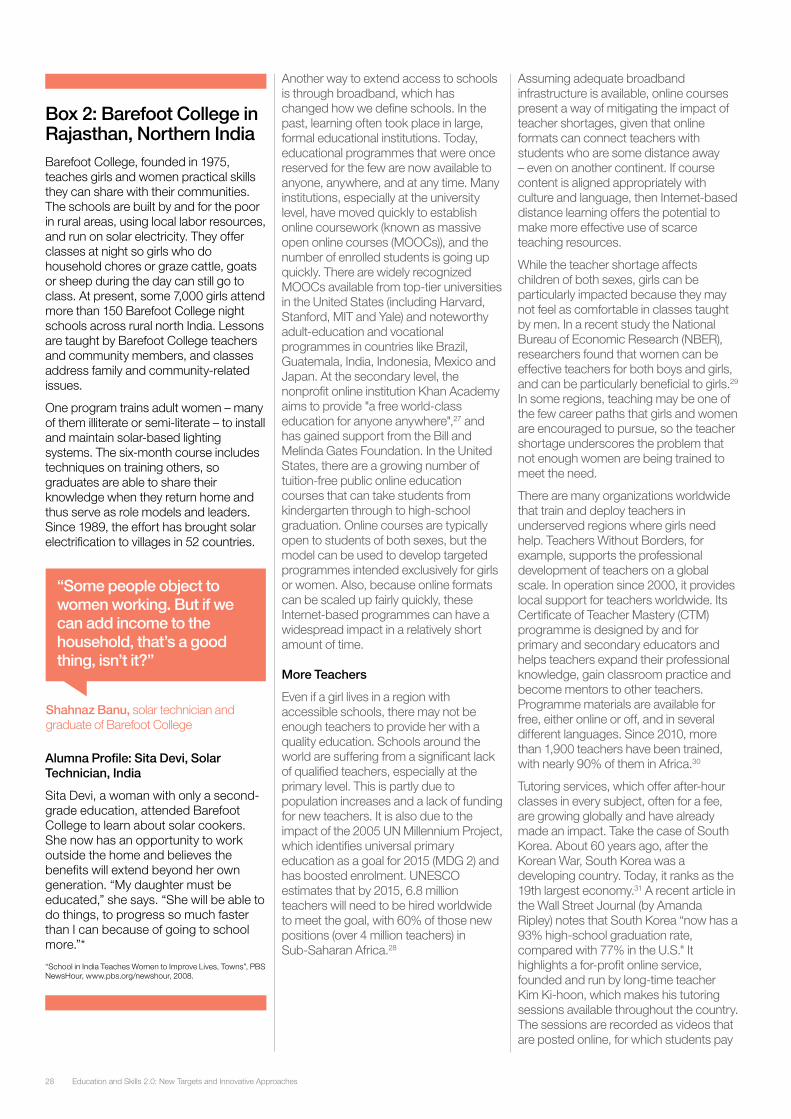
Education and Skills 2.0: New Targets and Innovative Approaches28
Box 2: Barefoot College in Rajasthan, Northern IndiaBarefoot College, founded in 1975, teaches girls and women practical skills they can share with their communities. The schools are built by and for the poor in rural areas, using local labor resources, and run on solar electricity. They offer classes at night so girls who do household chores or graze cattle, goats or sheep during the day can still go to class. At present, some 7,000 girls attend more than 150 Barefoot College night schools across rural north India. Lessons are taught by Barefoot College teachers and community members, and classes address family and community-related issues.
One program trains adult women – many of them illiterate or semi-literate – to install and maintain solar-based lighting systems. The six-month course includes techniques on training others, so graduates are able to share their knowledge when they return home and thus serve as role models and leaders. Since 1989, the effort has brought solar electrification to villages in 52 countries.
Alumna Profile: Sita Devi, Solar Technician, India
Sita Devi, a woman with only a second-grade education, attended Barefoot College to learn about solar cookers. She now has an opportunity to work outside the home and believes the benefits will extend beyond her own generation. “My daughter must be educated,” she says. “She will be able to do things, to progress so much faster than I can because of going to school more.”*
“School in India Teaches Women to Improve Lives, Towns”, PBS NewsHour, www.pbs.org/newshour, 2008.
Another way to extend access to schools is through broadband, which has changed how we define schools. In the past, learning often took place in large, formal educational institutions. Today, educational programmes that were once reserved for the few are now available to anyone, anywhere, and at any time. Many institutions, especially at the university level, have moved quickly to establish online coursework (known as massive open online courses (MOOCs)), and the number of enrolled students is going up quickly. There are widely recognized MOOCs available from top-tier universities in the United States (including Harvard, Stanford, MIT and Yale) and noteworthy adult-education and vocational programmes in countries like Brazil, Guatemala, India, Indonesia, Mexico and Japan. At the secondary level, the nonprofit online institution Khan Academy aims to provide "a free world-class education for anyone anywhere",27 and has gained support from the Bill and Melinda Gates Foundation. In the United States, there are a growing number of tuition-free public online education courses that can take students from kindergarten through to high-school graduation. Online courses are typically open to students of both sexes, but the model can be used to develop targeted programmes intended exclusively for girls or women. Also, because online formats can be scaled up fairly quickly, these Internet-based programmes can have a widespread impact in a relatively short amount of time.
More Teachers
Even if a girl lives in a region with accessible schools, there may not be enough teachers to provide her with a quality education. Schools around the world are suffering from a significant lack of qualified teachers, especially at the primary level. This is partly due to population increases and a lack of funding for new teachers. It is also due to the impact of the 2005 UN Millennium Project, which identifies universal primary education as a goal for 2015 (MDG 2) and has boosted enrolment. UNESCO estimates that by 2015, 6.8 million teachers will need to be hired worldwide to meet the goal, with 60% of those new positions (over 4 million teachers) in Sub-Saharan Africa.28
Assuming adequate broadband infrastructure is available, online courses present a way of mitigating the impact of teacher shortages, given that online formats can connect teachers with students who are some distance away – even on another continent. If course content is aligned appropriately with culture and language, then Internet-based distance learning offers the potential to make more effective use of scarce teaching resources.
While the teacher shortage affects children of both sexes, girls can be particularly impacted because they may not feel as comfortable in classes taught by men. In a recent study the National Bureau of Economic Research (NBER), researchers found that women can be effective teachers for both boys and girls, and can be particularly beneficial to girls.29 In some regions, teaching may be one of the few career paths that girls and women are encouraged to pursue, so the teacher shortage underscores the problem that not enough women are being trained to meet the need.
There are many organizations worldwide that train and deploy teachers in underserved regions where girls need help. Teachers Without Borders, for example, supports the professional development of teachers on a global scale. In operation since 2000, it provides local support for teachers worldwide. Its Certificate of Teacher Mastery (CTM) programme is designed by and for primary and secondary educators and helps teachers expand their professional knowledge, gain classroom practice and become mentors to other teachers. Programme materials are available for free, either online or off, and in several different languages. Since 2010, more than 1,900 teachers have been trained, with nearly 90% of them in Africa.30
Tutoring services, which offer after-hour classes in every subject, often for a fee, are growing globally and have already made an impact. Take the case of South Korea. About 60 years ago, after the Korean War, South Korea was a developing country. Today, it ranks as the 19th largest economy.31 A recent article in the Wall Street Journal (by Amanda Ripley) notes that South Korea “now has a 93% high-school graduation rate, compared with 77% in the U.S." It highlights a for-profit online service, founded and run by long-time teacher Kim Ki-hoon, which makes his tutoring sessions available throughout the country. The sessions are recorded as videos that are posted online, for which students pay
“Some people object to women working. But if we can add income to the household, that’s a good thing, isn’t it?”
Shahnaz Banu, solar technician and graduate of Barefoot College
29Education and Skills 2.0: New Targets and Innovative Approaches
a small fee to purchase and view. He answers student questions online, addressing individual learners directly. The bulk of his earnings, verified at US$ 4 million in 2012 alone, come from the 150,000 students who watch his lectures online each year.32 A similar online tutoring system, with or without the fee structure, could be implemented anywhere that has adequate broadband access and could be targeted specifically at girls.
Updated Content
Girls and women are more likely to attend or stay in school when they feel the curriculum has some relevance to their own lives. In addition to basic literacy and numeracy, schools do well by teaching "life skills" that help girls face everyday challenges. A curriculum that addresses subjects like health, nutrition, HIV/AIDs, and gender equality can make girls (and women) better equipped to succeed. Class material must, of course, be presented in a culturally acceptable way, and with an appropriate level of respect for local sensitivities.
Making the curriculum relevant to present-day realities also includes helping prepare girls and young women to enter the workforce. In some countries, girls’ enrolment in education has gone up, but this has not directly translated into increases in labour-force participation or productivity. Various factors, such as labour-market policies, cultural barriers, and lack of childcare facilities for working women, have an effect on this issue, but curriculum plays a role, too. It is crucial to equip girls and women with skills, including ICT, that will let them be economically productive.
One initiative that does that is Intel Corporation’s informal education programme called Intel Learn.33 Since its founding in 2004, the initiative has reached approximately 900,000 girls and young women in 16 countries worldwide. It includes more than 90 hours of curriculum that helps participants use digital skills to advance an idea, become familiar with basic concepts of business and propose solutions to community problems. In most areas, sessions are held outside the formal school setting, and the programme has consistently shown a completion rate of more than 90%.34
Programmes that teach adult women ICT skills can provide a path to employment, and having access to such programmes can guide girls as they finish their preliminary and secondary educations. Many of the well-established training
programmes that teach high-demand ICT skills are available online or in a blended learning environment, and prepare graduates (men and women alike) for industry-recognized certifications. The Cisco Networking Academy35 is an example. Since its launch in 1997, it has taught ICT skills to 4.75 million students in 165 countries. The global average of female participants is 20%, but in certain areas, including the Middle East, the average exceeds 35%.36
Bright, promising students often benefit from individual guidance, which is offered by Digital Divide Data, a digital-content company with operations in Asia and Africa. It recruits disadvantaged high-school graduates, half of them young women, from some of the poorest areas, including the slums of Kenya and rural areas of Laos, and trains them to work in digital jobs. These carefully screened young people provide digital services, such as data entry and eBook production, to Digital Divide Data's client base worldwide. The company helps its employees learn English and obtain college degrees. Since 2001, it has hired 1,745 young people and has supported 544 university graduates.37 This kind of sustainable work-study programme can be used elsewhere to teach women digital skills, encourage them to pursue college degrees and help them escape poverty.
An Effective Broadband Infrastructure
In places where girls and women have broadband access to data and services, it is easier to provide them with the opportunities necessary to expand knowledge, generate ideas and build careers. Having broadband access can also increase gender equality in education, making it possible for female students from any environment – urban or rural, rich or poor, in the classroom or at home – to obtain the same information and services as their male counterparts.
Broadband access has, in fact, become so essential to modern life that the Broadband Commission for Digital Development, a group established by UNESCO and the UN International Telecommunications Union, declared in 2011 that broadband communication "is not just a human need – it is a human right", similar to food, shelter and healthcare. The Commission also stated that "the benefits for broadband are profound", especially in education, where it can "[open] young minds to new horizons through educational technology".38
Countries that are struggling to grow and develop are beginning to recognize that broadband access is a key enabler and accelerator for growth. Ethiopia, for example, a country ranked number 121 of 144 in the World Economic Forum's Global Competitiveness Report for 2012–2013, has established a Ministry of Communication and Information Technology, with Dr Debretsion G. Michael as its head. In 2012, in his opening remarks to the Innovation Africa Digital Summit, he said, "Bridging [the] ICT gap and ensuring the optimal and innovative use of ICT tools will have a decisive bearing on whether or not the implementation of development strategies is a success or a failure. In short, rapid progress for countries such as Ethiopia in this area is not a matter of choice, but of necessity." As an example of the ministry's efforts, he cited a government "school-net programme connecting all secondary and preparatory schools in Ethiopia and enabling pupils across the country to have access to quality education through ICT schools".39 A few years ago, one might have thought that some countries were too poor to invest in ICT, but there is a growing sense that poor countries cannot afford not to invest in ICT.
A reasonable guideline for broadband infrastructure is the ability to support download and upload rates of 100 Mbps for every 1,000 students and staff members,40 since this is generally the level that students and teachers need to support the audio and video content involved in digital learning and teaching. Even in developed countries, where broadband access may be commonplace in residences, commercial spaces and private institutions, the public school system may lag behind. In the United States, for example, broadband access is not always available in public education. The San Francisco-based nonprofit Education Superhighway is dedicated to closing this digital divide and is working to ensure that every US K-12 public school has 100-Mbps access. Similar initiatives could be used elsewhere to increase broadband access, especially for girls.
Education and Skills 2.0: New Targets and Innovative Approaches30
The Way ForwardWomen can be instrumental in helping to solve the world's problems. They can help develop new technologies and can come up with better ways to use scarce resources, treat diseases, provide clean water and grow food.
Women also represent half the population. What politician who has the welfare of the population in mind would neglect such an enormous group? What corporation would hesitate to tap into such an enormous labour pool or service such an enormous market? And what community would hesitate to embrace innovative solutions that address critical social challenges?
It is essential that the international community continues to emphasize the importance of educating girls and women, especially in the most disadvan-taged regions, so we can continue to pursue the goal of complete gender equality and parity, and so we can continue to promote economic develop-ment by building on the productive capacity of women. The focus needs to be on removing the barriers that prevent girls and women from getting a quality education or from pursuing economic opportunities. The programmes men-tioned in this chapter serve as examples from which we can learn and can be used as templates for new initiatives.
When considering any programme aimed at improving girls' education, especially in developing areas, there are several things to keep in mind:
Consider local sensitivities and issues. The subject of educating girls is a topic bound up with complex cultural, religious, and national sensitivities and involves issues – physical, cultural, social, technical and financial – that often overlap.
Take a comprehensive approach. These programmes often work best when they take a multipronged approach, deploying different methods to target different aspects of the problem. It may not be feasible to create a single programme that addresses every barrier to girls' education, but an effective programme typically pursues one or more of the following goals:
- Make education affordable for all girls, even the poorest.
- Create girl-friendly schools that are supported by the local community.
- Ensure that girls who are in school get a quality education, with reasonably sized classes taught by well-trained teachers.
- Teach a curriculum that prepares girls to participate in our technology-driven economy.
- Leverage broadband to enable greater access to knowledge and increase employment opportunities.
Identify strategic investments. Establishing and expanding the broadband infrastructure is a wise investment, since it can generate a number of positive, long-term results for girls and women. Broadband access can improve the quality of girls' education, since it enables widespread, fast access to the latest curricula, subject-matter experts, mentorships and collaborative learning opportunities for the community at large. Investing in broadband infrastructure can also improve economic outcomes for women and their communities.
Work collaboratively. Education is an evolving process, one that is ideally suited to trying out new models and seeding sustainable strategies. Public–private partnerships can create a larger pool of resources, making it easier to include leading-edge technology in the solution and broaden a programme’s scope. That said, implementing this kind of partnership is a complex task given the need to manage a group that includes nonprofits, NGOs, government agencies, private sector businesses, educational institutions and community groups.
Stay the course. Educational programmes require a strong commitment from everyone involved (families, communities, schools, government agencies, and the girls and women themselves), especially since results can be slow to materialize – after all, completing primary and secondary education can take more than 10 years.
In every corner of the world, regardless of a country's stage of development, there are countless examples of girls and women who have the imagination, desire and energy to participate productively and inventively in the local and world economy. It is vital that we continue to be vigilant in ensuring a quality education for girls. This fosters the potential of those who will, in turn, contribute to a brighter future for us all.
Endnotes1. Education for All Global Monitoring Report, UNESCO Institute
for Statistics, 2012.
2. Council on Foreign Relations, 2004.
3. D. Dollar and R. Gatti, Gender Inequality, Income, and Growth: Are Good Times Good for Women?, World Bank Development Research Group, 1999.
4. B. Herz and G.B. Sperling, What Works in Girls' Education, Evidence and Policies from the Developing World, Council on Foreign Relations, 2004.
5. Opening Doors, Education and the World Bank, World Bank, 2002.
6. “Education for All global monitoring report fact sheet on girls’ education”, http://www.unesco.org/new/fileadmin/MULTIMEDIA/HQ/ED/GMR/images/2011/girls-factsheet-en.pdf, October 2013.
7. The Economic Power of Women, Women Investing in Women Initiative, A Project of Calvert Foundation, 2013.
8. S. Tharoor, "Why we should invest more in the education of girls," Forum Blog, December 2012.
9. B. Herz and G.B. Sperling, What Works in Girls' Education, Evidence and Policies from the Developing World, Council on Foreign Relations, 2004.
10. The World Economic Forum's Global Gender Gap Report, World Economic Forum, Geneva: 2013.
11. Networking Skills Gap in Latin America, IDC, 2013.
12. Joint Research Center, European Commission, March 2013.
13. United States Bureau of Labor Statistics, Employment Projections, 2010–2020.
14. SiliconIndia (jobs.silicon.india.com), November 2013.
15. LifeLines Program, OneWorld South Asia, 2013. (Note: This is an initiative that is partially funded by Cisco.)
16. M. Baird and B. Özler, Designing Cost-Effective Cash Transfer Programs to Boost Schooling among Young Women in Sub-Saharan Africa, The World Bank, 2009.
17. R. Slavin, Can Financial Incentives Enhance Educational Outcomes? Evidence from International Experiments, University of York and Johns Hopkins University, 2009.
18. Raising Clean Hands: Advancing Learning, Health and Participation through WASH in schools. A Joint Call to Action, UNICEF, 2010.
19. Sanitation: The Challenge, UNICEF, 2005.
20. S. Lee and B. Kerner, "What Do Menstruating Girls Need in Schools?", Save the Children, A Global Village Journal, January 2013, Issue 9.
21. Girl-Friendly Toilets for Schoolgirls: Helping Adolescent Girls' IRC under the SSHE, UNICEF, 2006.
22. R. Pande and P. Topalva, "Women in charge", Finance and Development, June 2013, Vol. 50, No. 2
23. We Can End Poverty: Millennium Development Goals and Beyond 2015 fact sheet (http://www.un.org/millenniumgoals/pdf/Goal_3_fs.pdf).
24. ACEV is a member of the World Economic Forum and this chapter was edited by the ACEV programme's chief executive officer.
25. ACEV, 2013.
26. F. McAllister and A. Burgess, Fatherhood: Parenting Programs and Policy, Fatherhood Institute, August 2012.
27. “One man, one computer, 10 million students: How Khan Academy is reinventing education”, Forbes, 19 November 2013.
28. “Global Teacher Shortage”, UNESCO, visual.ly/global-teacher-shortage, 2012.
29. K. Muralidharan and K. Sheth, "Bridging education gender gaps in developing countries: The role of female teachers", NBER Working Paper No. 19341, September 2013.
30. Teachers Without Borders, 2013.
31. The World Economic Forum's Global Competitiveness Report 2012–2013.
32. A. Ripley, "The $4 million teacher", The Wall Street Journal, wsj.com, 3 August 2013.
33. Intel is a member of the World Economic Forum.
34. International Center for Research on Women, 2012.
35. Cisco is a member of the World Economic Forum, and the author of this chapter is a Cisco employee.
36. Cisco Systems, 2013.
37. Digital Divide Data, 2013 (note: the company receives support from Cisco and Cisco Foundation).
38. UN press release, www.un.org/apps/news/story.asp?Cr=broadband&NewsID=40191, 25 October 2011.
39. Dr Debretsion G. Michael, "Summit Speech", Innovation Africa Digital Summit, www.mcit.gov.et, 2012.
40. State Educational Technology Directors Association, www.setda.org, 2012.
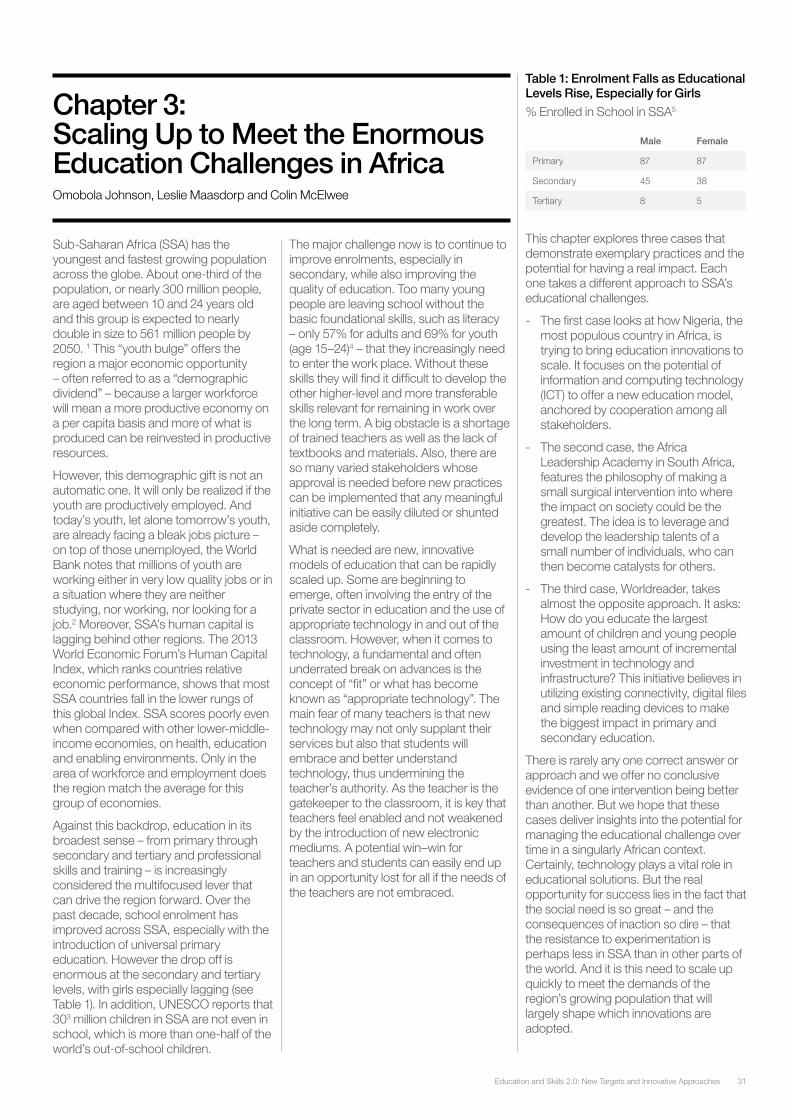
31Education and Skills 2.0: New Targets and Innovative Approaches
Sub-Saharan Africa (SSA) has the youngest and fastest growing population across the globe. About one-third of the population, or nearly 300 million people, are aged between 10 and 24 years old and this group is expected to nearly double in size to 561 million people by 2050. 1 This “youth bulge” offers the region a major economic opportunity – often referred to as a “demographic dividend” – because a larger workforce will mean a more productive economy on a per capita basis and more of what is produced can be reinvested in productive resources.
However, this demographic gift is not an automatic one. It will only be realized if the youth are productively employed. And today’s youth, let alone tomorrow’s youth, are already facing a bleak jobs picture – on top of those unemployed, the World Bank notes that millions of youth are working either in very low quality jobs or in a situation where they are neither studying, nor working, nor looking for a job.2 Moreover, SSA’s human capital is lagging behind other regions. The 2013 World Economic Forum’s Human Capital Index, which ranks countries relative economic performance, shows that most SSA countries fall in the lower rungs of this global Index. SSA scores poorly even when compared with other lower-middle-income economies, on health, education and enabling environments. Only in the area of workforce and employment does the region match the average for this group of economies.
Against this backdrop, education in its broadest sense – from primary through secondary and tertiary and professional skills and training – is increasingly considered the multifocused lever that can drive the region forward. Over the past decade, school enrolment has improved across SSA, especially with the introduction of universal primary education. However the drop off is enormous at the secondary and tertiary levels, with girls especially lagging (see Table 1). In addition, UNESCO reports that 303 million children in SSA are not even in school, which is more than one-half of the world’s out-of-school children.
The major challenge now is to continue to improve enrolments, especially in secondary, while also improving the quality of education. Too many young people are leaving school without the basic foundational skills, such as literacy – only 57% for adults and 69% for youth (age 15–24)4 – that they increasingly need to enter the work place. Without these skills they will find it difficult to develop the other higher-level and more transferable skills relevant for remaining in work over the long term. A big obstacle is a shortage of trained teachers as well as the lack of textbooks and materials. Also, there are so many varied stakeholders whose approval is needed before new practices can be implemented that any meaningful initiative can be easily diluted or shunted aside completely.
What is needed are new, innovative models of education that can be rapidly scaled up. Some are beginning to emerge, often involving the entry of the private sector in education and the use of appropriate technology in and out of the classroom. However, when it comes to technology, a fundamental and often underrated break on advances is the concept of “fit” or what has become known as “appropriate technology”. The main fear of many teachers is that new technology may not only supplant their services but also that students will embrace and better understand technology, thus undermining the teacher’s authority. As the teacher is the gatekeeper to the classroom, it is key that teachers feel enabled and not weakened by the introduction of new electronic mediums. A potential win–win for teachers and students can easily end up in an opportunity lost for all if the needs of the teachers are not embraced.
Table 1: Enrolment Falls as Educational Levels Rise, Especially for Girls
% Enrolled in School in SSA5
Male Female
Primary 87 87
Secondary 45 38
Tertiary 8 5
This chapter explores three cases that demonstrate exemplary practices and the potential for having a real impact. Each one takes a different approach to SSA’s educational challenges.
- The first case looks at how Nigeria, the most populous country in Africa, is trying to bring education innovations to scale. It focuses on the potential of information and computing technology (ICT) to offer a new education model, anchored by cooperation among all stakeholders.
- The second case, the Africa Leadership Academy in South Africa, features the philosophy of making a small surgical intervention into where the impact on society could be the greatest. The idea is to leverage and develop the leadership talents of a small number of individuals, who can then become catalysts for others.
- The third case, Worldreader, takes almost the opposite approach. It asks: How do you educate the largest amount of children and young people using the least amount of incremental investment in technology and infrastructure? This initiative believes in utilizing existing connectivity, digital files and simple reading devices to make the biggest impact in primary and secondary education.
There is rarely any one correct answer or approach and we offer no conclusive evidence of one intervention being better than another. But we hope that these cases deliver insights into the potential for managing the educational challenge over time in a singularly African context. Certainly, technology plays a vital role in educational solutions. But the real opportunity for success lies in the fact that the social need is so great – and the consequences of inaction so dire – that the resistance to experimentation is perhaps less in SSA than in other parts of the world. And it is this need to scale up quickly to meet the demands of the region’s growing population that will largely shape which innovations are adopted.
Chapter 3: Scaling Up to Meet the Enormous Education Challenges in AfricaOmobola Johnson, Leslie Maasdorp and Colin McElwee
Education and Skills 2.0: New Targets and Innovative Approaches32
Case Study 1: Bringing Educational Innovations to Scale in NigeriaNigeria is the most populous country in Africa and its third largest economy. It is also home to a huge youth population – 42% is under 15 years of age6 – whose share is growing rapidly and expected to number 185 million by 2050. These figures suggest the magnitude of investment needed in education, especially education that is of a high quality and relevant to the needs and aspirations of the country. They also suggest the importance of enabling the country to be an economic powerhouse for the rest of the continent.
Yet the strain on the country’s limited resources is seen across all educational levels. Nigeria accounts for a third of the estimated number of children (of primary school age) that are not attending school in SSA. Furthermore, many of the children enrolled are beyond the official age for the level of education they are receiving. At the tertiary level, of the over 1 million applications received each year, Nigerian universities have the capacity to admit only 20%. Nigeria needs many more teachers; existing ones are unevenly distributed across the country, poorly paid and poorly trained. Students are also taught a curriculum that is often said to be out of date and insufficient to provide ‘‘graduates’’ with the skills they require to be ‘job ready’.
Against this backdrop, traditional approaches to education delivery – which focus on teacher-led instruction (using curriculum that does not address the skill requirements of employees) within physical classrooms – can no longer meet the challenges faced by the nation’s educational sector. Thus, not surprisingly, there is enormous interest in the potential of ICT to mitigate these challenges by facilitating content delivery, quality improvements and a transformation in education delivery.
ICTs in Education in Nigeria
What are the prerequisites for effectively applying ICTs to socio-economic needs? The key ones include: (a) the accessibility of devices and affordability of connectivity; (b) the availability of relevant content; and (c) teacher adoption of the materials.
Delivering Access to Devices and Affordable Connectivity
Although the mobile cellular market in Nigeria has been growing quite rapidly, about 50% of rural areas still lack coverage. Furthermore, end-user devices remain prohibitively expensive to low-income and poor members of the population. Two major efforts are under way to improve the situation.
A key public sector initiative addressing challenges of connectivity and access to devices in the educational sector is the Universal Service Provision Fund’s (USPF) School Access Programme (SAP). The USPF was conceived in the Nigerian Communications Act 2003 as a mecha-nism for providing access to ICTs in unserved and underserved communities to help bridge the digital divide. Telecom-munications operators in the country pay up to 2.5% of their income to the Nigerian Communications Commission as an annual operating levy, with 40% of this go-ing into the USPF. The SAP provides ICT equipment, broadband connectivity and educational content in public schools across Nigeria. By the end of 2012, 1,335 public schools had been connected, with about 670,000 students benefiting.
The DigiNet programme – a collaboration between the Federal Ministry of Education’s Education Trust Fund (ETF) and SchoolNet Nigeria, a not-for-profit entity – focuses on the creation of computer labs and community education resource centres (CERC). Since 2002, the programme has built computer labs in 83 schools and established five CERCs. Each of these facilities was equipped with 21 computers, a server, Internet access via satellite and alternative (back-up) power supply. Curriculum-based content was also available, along with a teacher development programme. In recent years, the DigiNet programme has expanded to include private sector entities. As a result of a partnership with the largest mobile network operator in the country, MTN Nigeria, there are now computer labs in another 62 schools (branded as the MTN Schools Connect project). The DigiNet programme also receives support from Intel and Microsoft in deploying the teacher development component.
Together, these two programmes have helped address challenges in connectivity and access to devices in about 1,500 schools. But with about 59,000 primary and 11,500 junior secondary public schools7 across the country and over 28 million children attending these schools, scaling up these initiatives to achieve a meaningful impact remains an elusive objective.
Making Relevant Content Available in Accessible Formats
Numerous efforts are also under way to improve access to educational content in formats that are engaging and help students attain set educational targets. Some of them have resulted in the digitization of the national curriculum, the online provision of past papers of national examinations, the development of multimedia tutorials and exam preparation applications, as well as digital access to thousands of textbooks (ebooks). One example is a computer application developed by Cinfores Limited, a private sector organization, called BrainFriend – an e-learning and examination preparatory software covering the Nigerian examination curriculum in 42 subjects for all levels of primary and secondary education. The solution through various partnerships is being deployed directly by up to four state governments and will indirectly be deployed in schools across the entire country through a recent partnership with the USPF’s School Access Programme.
Increasing Adoption and Appropriation of ICTs by Teachers
Any effort to drive the technology agenda in addressing the education and skills gap or to improve students and schools performance requires high-quality capacity building, support programmes and resources for education professionals, especially teachers. One example is DSTV Multichoice Resource Centres, a private sector project that focuses on content creation and the promotion of ownership of ICT-enabled learning among teachers. Another example is iEarn Nigeria, which pulls together a global community of teachers and youth that use the Internet and ICTs to learn and collaborate on educational projects (see Box 1).
Both of these initiatives have recorded some measure of success. However, the impact such successes are having on the overall attainment of the nation’s educational objectives is as yet unknown. This is for various reasons, including difficulties encountered in bringing these initiatives to an appreciable scale (given the sheer size of the country) and the lack of an agreed framework that clearly identifies what constitutes impact.
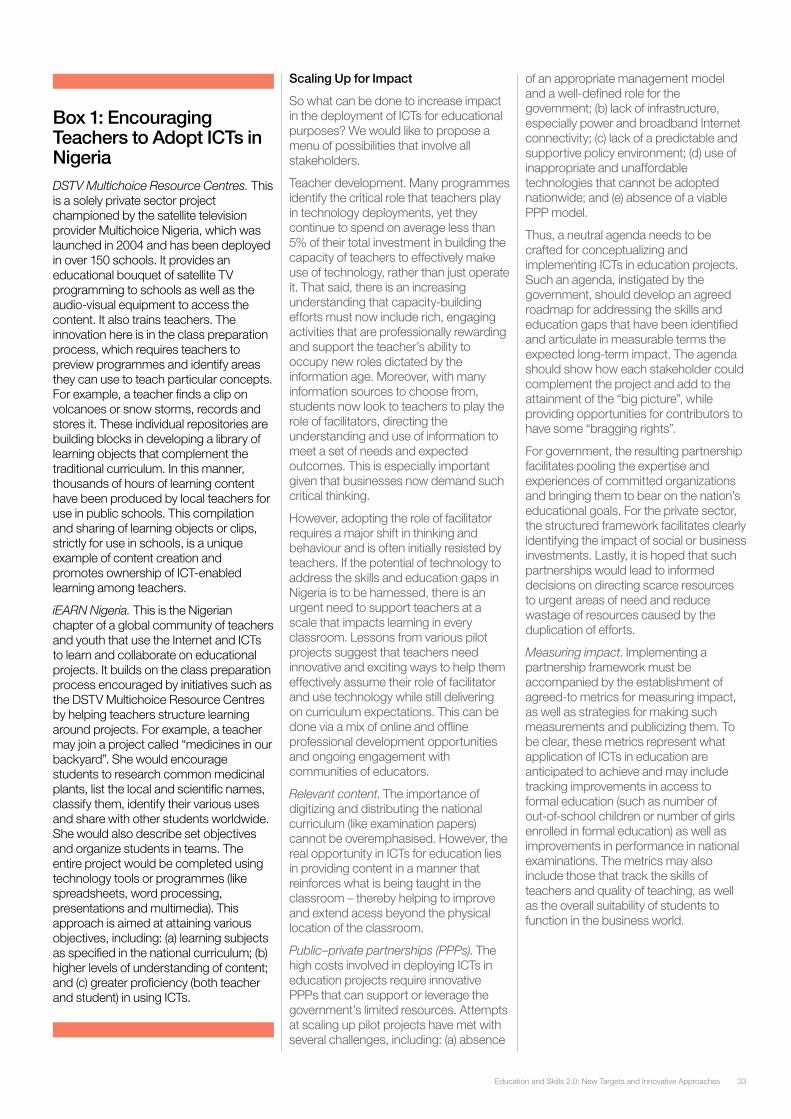
33Education and Skills 2.0: New Targets and Innovative Approaches
Box 1: Encouraging Teachers to Adopt ICTs in NigeriaDSTV Multichoice Resource Centres. This is a solely private sector project championed by the satellite television provider Multichoice Nigeria, which was launched in 2004 and has been deployed in over 150 schools. It provides an educational bouquet of satellite TV programming to schools as well as the audio-visual equipment to access the content. It also trains teachers. The innovation here is in the class preparation process, which requires teachers to preview programmes and identify areas they can use to teach particular concepts. For example, a teacher finds a clip on volcanoes or snow storms, records and stores it. These individual repositories are building blocks in developing a library of learning objects that complement the traditional curriculum. In this manner, thousands of hours of learning content have been produced by local teachers for use in public schools. This compilation and sharing of learning objects or clips, strictly for use in schools, is a unique example of content creation and promotes ownership of ICT-enabled learning among teachers.
iEARN Nigeria. This is the Nigerian chapter of a global community of teachers and youth that use the Internet and ICTs to learn and collaborate on educational projects. It builds on the class preparation process encouraged by initiatives such as the DSTV Multichoice Resource Centres by helping teachers structure learning around projects. For example, a teacher may join a project called “medicines in our backyard”. She would encourage students to research common medicinal plants, list the local and scientific names, classify them, identify their various uses and share with other students worldwide. She would also describe set objectives and organize students in teams. The entire project would be completed using technology tools or programmes (like spreadsheets, word processing, presentations and multimedia). This approach is aimed at attaining various objectives, including: (a) learning subjects as specified in the national curriculum; (b) higher levels of understanding of content; and (c) greater proficiency (both teacher and student) in using ICTs.
Scaling Up for Impact
So what can be done to increase impact in the deployment of ICTs for educational purposes? We would like to propose a menu of possibilities that involve all stakeholders.
Teacher development. Many programmes identify the critical role that teachers play in technology deployments, yet they continue to spend on average less than 5% of their total investment in building the capacity of teachers to effectively make use of technology, rather than just operate it. That said, there is an increasing understanding that capacity-building efforts must now include rich, engaging activities that are professionally rewarding and support the teacher’s ability to occupy new roles dictated by the information age. Moreover, with many information sources to choose from, students now look to teachers to play the role of facilitators, directing the understanding and use of information to meet a set of needs and expected outcomes. This is especially important given that businesses now demand such critical thinking.
However, adopting the role of facilitator requires a major shift in thinking and behaviour and is often initially resisted by teachers. If the potential of technology to address the skills and education gaps in Nigeria is to be harnessed, there is an urgent need to support teachers at a scale that impacts learning in every classroom. Lessons from various pilot projects suggest that teachers need innovative and exciting ways to help them effectively assume their role of facilitator and use technology while still delivering on curriculum expectations. This can be done via a mix of online and offline professional development opportunities and ongoing engagement with communities of educators.
Relevant content. The importance of digitizing and distributing the national curriculum (like examination papers) cannot be overemphasised. However, the real opportunity in ICTs for education lies in providing content in a manner that reinforces what is being taught in the classroom – thereby helping to improve and extend acess beyond the physical location of the classroom.
Public–private partnerships (PPPs). The high costs involved in deploying ICTs in education projects require innovative PPPs that can support or leverage the government’s limited resources. Attempts at scaling up pilot projects have met with several challenges, including: (a) absence
of an appropriate management model and a well-defined role for the government; (b) lack of infrastructure, especially power and broadband Internet connectivity; (c) lack of a predictable and supportive policy environment; (d) use of inappropriate and unaffordable technologies that cannot be adopted nationwide; and (e) absence of a viable PPP model.
Thus, a neutral agenda needs to be crafted for conceptualizing and implementing ICTs in education projects. Such an agenda, instigated by the government, should develop an agreed roadmap for addressing the skills and education gaps that have been identified and articulate in measurable terms the expected long-term impact. The agenda should show how each stakeholder could complement the project and add to the attainment of the “big picture”, while providing opportunities for contributors to have some “bragging rights”.
For government, the resulting partnership facilitates pooling the expertise and experiences of committed organizations and bringing them to bear on the nation’s educational goals. For the private sector, the structured framework facilitates clearly identifying the impact of social or business investments. Lastly, it is hoped that such partnerships would lead to informed decisions on directing scarce resources to urgent areas of need and reduce wastage of resources caused by the duplication of efforts.
Measuring impact. Implementing a partnership framework must be accompanied by the establishment of agreed-to metrics for measuring impact, as well as strategies for making such measurements and publicizing them. To be clear, these metrics represent what application of ICTs in education are anticipated to achieve and may include tracking improvements in access to formal education (such as number of out-of-school children or number of girls enrolled in formal education) as well as improvements in performance in national examinations. The metrics may also include those that track the skills of teachers and quality of teaching, as well as the overall suitability of students to function in the business world.
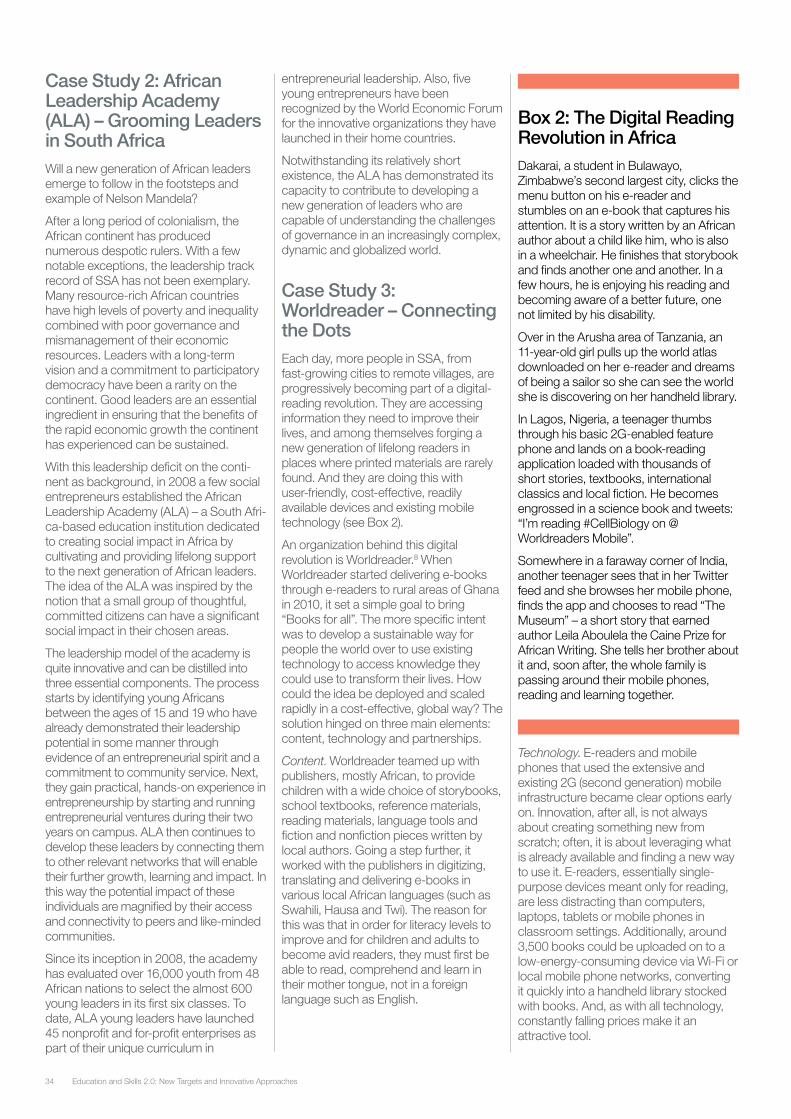
Education and Skills 2.0: New Targets and Innovative Approaches34
Case Study 2: African Leadership Academy (ALA) – Grooming Leaders in South AfricaWill a new generation of African leaders emerge to follow in the footsteps and example of Nelson Mandela?
After a long period of colonialism, the African continent has produced numerous despotic rulers. With a few notable exceptions, the leadership track record of SSA has not been exemplary. Many resource-rich African countries have high levels of poverty and inequality combined with poor governance and mismanagement of their economic resources. Leaders with a long-term vision and a commitment to participatory democracy have been a rarity on the continent. Good leaders are an essential ingredient in ensuring that the benefits of the rapid economic growth the continent has experienced can be sustained.
With this leadership deficit on the conti-nent as background, in 2008 a few social entrepreneurs established the African Leadership Academy (ALA) – a South Afri-ca-based education institution dedicated to creating social impact in Africa by cultivating and providing lifelong support to the next generation of African leaders. The idea of the ALA was inspired by the notion that a small group of thoughtful, committed citizens can have a significant social impact in their chosen areas.
The leadership model of the academy is quite innovative and can be distilled into three essential components. The process starts by identifying young Africans between the ages of 15 and 19 who have already demonstrated their leadership potential in some manner through evidence of an entrepreneurial spirit and a commitment to community service. Next, they gain practical, hands-on experience in entrepreneurship by starting and running entrepreneurial ventures during their two years on campus. ALA then continues to develop these leaders by connecting them to other relevant networks that will enable their further growth, learning and impact. In this way the potential impact of these individuals are magnified by their access and connectivity to peers and like-minded communities.
Since its inception in 2008, the academy has evaluated over 16,000 youth from 48 African nations to select the almost 600 young leaders in its first six classes. To date, ALA young leaders have launched 45 nonprofit and for-profit enterprises as part of their unique curriculum in
entrepreneurial leadership. Also, five young entrepreneurs have been recognized by the World Economic Forum for the innovative organizations they have launched in their home countries.
Notwithstanding its relatively short existence, the ALA has demonstrated its capacity to contribute to developing a new generation of leaders who are capable of understanding the challenges of governance in an increasingly complex, dynamic and globalized world.
Case Study 3: Worldreader – Connecting the DotsEach day, more people in SSA, from fast-growing cities to remote villages, are progressively becoming part of a digital-reading revolution. They are accessing information they need to improve their lives, and among themselves forging a new generation of lifelong readers in places where printed materials are rarely found. And they are doing this with user-friendly, cost-effective, readily available devices and existing mobile technology (see Box 2).
An organization behind this digital revolution is Worldreader.8 When Worldreader started delivering e-books through e-readers to rural areas of Ghana in 2010, it set a simple goal to bring “Books for all”. The more specific intent was to develop a sustainable way for people the world over to use existing technology to access knowledge they could use to transform their lives. How could the idea be deployed and scaled rapidly in a cost-effective, global way? The solution hinged on three main elements: content, technology and partnerships.
Content. Worldreader teamed up with publishers, mostly African, to provide children with a wide choice of storybooks, school textbooks, reference materials, reading materials, language tools and fiction and nonfiction pieces written by local authors. Going a step further, it worked with the publishers in digitizing, translating and delivering e-books in various local African languages (such as Swahili, Hausa and Twi). The reason for this was that in order for literacy levels to improve and for children and adults to become avid readers, they must first be able to read, comprehend and learn in their mother tongue, not in a foreign language such as English.
Box 2: The Digital Reading Revolution in AfricaDakarai, a student in Bulawayo, Zimbabwe’s second largest city, clicks the menu button on his e-reader and stumbles on an e-book that captures his attention. It is a story written by an African author about a child like him, who is also in a wheelchair. He finishes that storybook and finds another one and another. In a few hours, he is enjoying his reading and becoming aware of a better future, one not limited by his disability.
Over in the Arusha area of Tanzania, an 11-year-old girl pulls up the world atlas downloaded on her e-reader and dreams of being a sailor so she can see the world she is discovering on her handheld library.
In Lagos, Nigeria, a teenager thumbs through his basic 2G-enabled feature phone and lands on a book-reading application loaded with thousands of short stories, textbooks, international classics and local fiction. He becomes engrossed in a science book and tweets: “I’m reading #CellBiology on @Worldreaders Mobile”.
Somewhere in a faraway corner of India, another teenager sees that in her Twitter feed and she browses her mobile phone, finds the app and chooses to read “The Museum” – a short story that earned author Leila Aboulela the Caine Prize for African Writing. She tells her brother about it and, soon after, the whole family is passing around their mobile phones, reading and learning together.
Technology. E-readers and mobile phones that used the extensive and existing 2G (second generation) mobile infrastructure became clear options early on. Innovation, after all, is not always about creating something new from scratch; often, it is about leveraging what is already available and finding a new way to use it. E-readers, essentially single-purpose devices meant only for reading, are less distracting than computers, laptops, tablets or mobile phones in classroom settings. Additionally, around 3,500 books could be uploaded on to a low-energy-consuming device via Wi-Fi or local mobile phone networks, converting it quickly into a handheld library stocked with books. And, as with all technology, constantly falling prices make it an attractive tool.
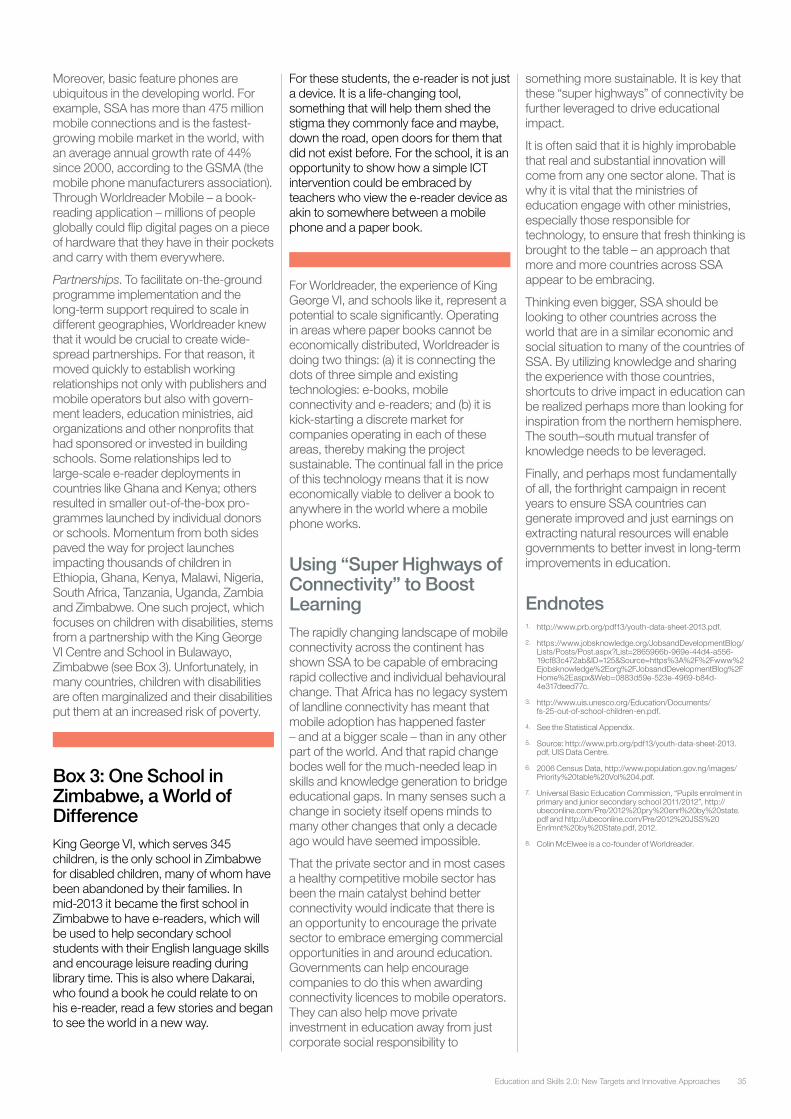
35Education and Skills 2.0: New Targets and Innovative Approaches
Moreover, basic feature phones are ubiquitous in the developing world. For example, SSA has more than 475 million mobile connections and is the fastest-growing mobile market in the world, with an average annual growth rate of 44% since 2000, according to the GSMA (the mobile phone manufacturers association). Through Worldreader Mobile – a book-reading application – millions of people globally could flip digital pages on a piece of hardware that they have in their pockets and carry with them everywhere.
Partnerships. To facilitate on-the-ground programme implementation and the long-term support required to scale in different geographies, Worldreader knew that it would be crucial to create wide-spread partnerships. For that reason, it moved quickly to establish working relationships not only with publishers and mobile operators but also with govern-ment leaders, education ministries, aid organizations and other nonprofits that had sponsored or invested in building schools. Some relationships led to large-scale e-reader deployments in countries like Ghana and Kenya; others resulted in smaller out-of-the-box pro-grammes launched by individual donors or schools. Momentum from both sides paved the way for project launches impacting thousands of children in Ethiopia, Ghana, Kenya, Malawi, Nigeria, South Africa, Tanzania, Uganda, Zambia and Zimbabwe. One such project, which focuses on children with disabilities, stems from a partnership with the King George VI Centre and School in Bulawayo, Zimbabwe (see Box 3). Unfortunately, in many countries, children with disabilities are often marginalized and their disabilities put them at an increased risk of poverty.
Box 3: One School in Zimbabwe, a World of DifferenceKing George VI, which serves 345 children, is the only school in Zimbabwe for disabled children, many of whom have been abandoned by their families. In mid-2013 it became the first school in Zimbabwe to have e-readers, which will be used to help secondary school students with their English language skills and encourage leisure reading during library time. This is also where Dakarai, who found a book he could relate to on his e-reader, read a few stories and began to see the world in a new way.
For these students, the e-reader is not just a device. It is a life-changing tool, something that will help them shed the stigma they commonly face and maybe, down the road, open doors for them that did not exist before. For the school, it is an opportunity to show how a simple ICT intervention could be embraced by teachers who view the e-reader device as akin to somewhere between a mobile phone and a paper book.
For Worldreader, the experience of King George VI, and schools like it, represent a potential to scale significantly. Operating in areas where paper books cannot be economically distributed, Worldreader is doing two things: (a) it is connecting the dots of three simple and existing technologies: e-books, mobile connectivity and e-readers; and (b) it is kick-starting a discrete market for companies operating in each of these areas, thereby making the project sustainable. The continual fall in the price of this technology means that it is now economically viable to deliver a book to anywhere in the world where a mobile phone works.
Using “Super Highways of Connectivity” to Boost LearningThe rapidly changing landscape of mobile connectivity across the continent has shown SSA to be capable of embracing rapid collective and individual behavioural change. That Africa has no legacy system of landline connectivity has meant that mobile adoption has happened faster – and at a bigger scale – than in any other part of the world. And that rapid change bodes well for the much-needed leap in skills and knowledge generation to bridge educational gaps. In many senses such a change in society itself opens minds to many other changes that only a decade ago would have seemed impossible.
That the private sector and in most cases a healthy competitive mobile sector has been the main catalyst behind better connectivity would indicate that there is an opportunity to encourage the private sector to embrace emerging commercial opportunities in and around education. Governments can help encourage companies to do this when awarding connectivity licences to mobile operators. They can also help move private investment in education away from just corporate social responsibility to
something more sustainable. It is key that these “super highways” of connectivity be further leveraged to drive educational impact.
It is often said that it is highly improbable that real and substantial innovation will come from any one sector alone. That is why it is vital that the ministries of education engage with other ministries, especially those responsible for technology, to ensure that fresh thinking is brought to the table – an approach that more and more countries across SSA appear to be embracing.
Thinking even bigger, SSA should be looking to other countries across the world that are in a similar economic and social situation to many of the countries of SSA. By utilizing knowledge and sharing the experience with those countries, shortcuts to drive impact in education can be realized perhaps more than looking for inspiration from the northern hemisphere. The south–south mutual transfer of knowledge needs to be leveraged.
Finally, and perhaps most fundamentally of all, the forthright campaign in recent years to ensure SSA countries can generate improved and just earnings on extracting natural resources will enable governments to better invest in long-term improvements in education.
Endnotes1. http://www.prb.org/pdf13/youth-data-sheet-2013.pdf.
2. https://www.jobsknowledge.org/JobsandDevelopmentBlog/Lists/Posts/Post.aspx?List=2865966b-969e-44d4-a556-19cf83c472ab&ID=125&Source=https%3A%2F%2Fwww%2Ejobsknowledge%2Eorg%2FJobsandDevelopmentBlog%2FHome%2Easpx&Web=0883d59e-523e-4969-b84d-4e317deed77c.
3. http://www.uis.unesco.org/Education/Documents/fs-25-out-of-school-children-en.pdf.
4. See the Statistical Appendix.
5. Source: http://www.prb.org/pdf13/youth-data-sheet-2013.pdf, UIS Data Centre.
6. 2006 Census Data, http://www.population.gov.ng/images/Priority%20table%20Vol%204.pdf.
7. Universal Basic Education Commission, “Pupils enrolment in primary and junior secondary school 2011/2012”, http://ubeconline.com/Pre/2012%20pry%20enrl%20by%20state.pdf and http://ubeconline.com/Pre/2012%20JSS%20Enrlmnt%20by%20State.pdf, 2012.
8. Colin McElwee is a co-founder of Worldreader.
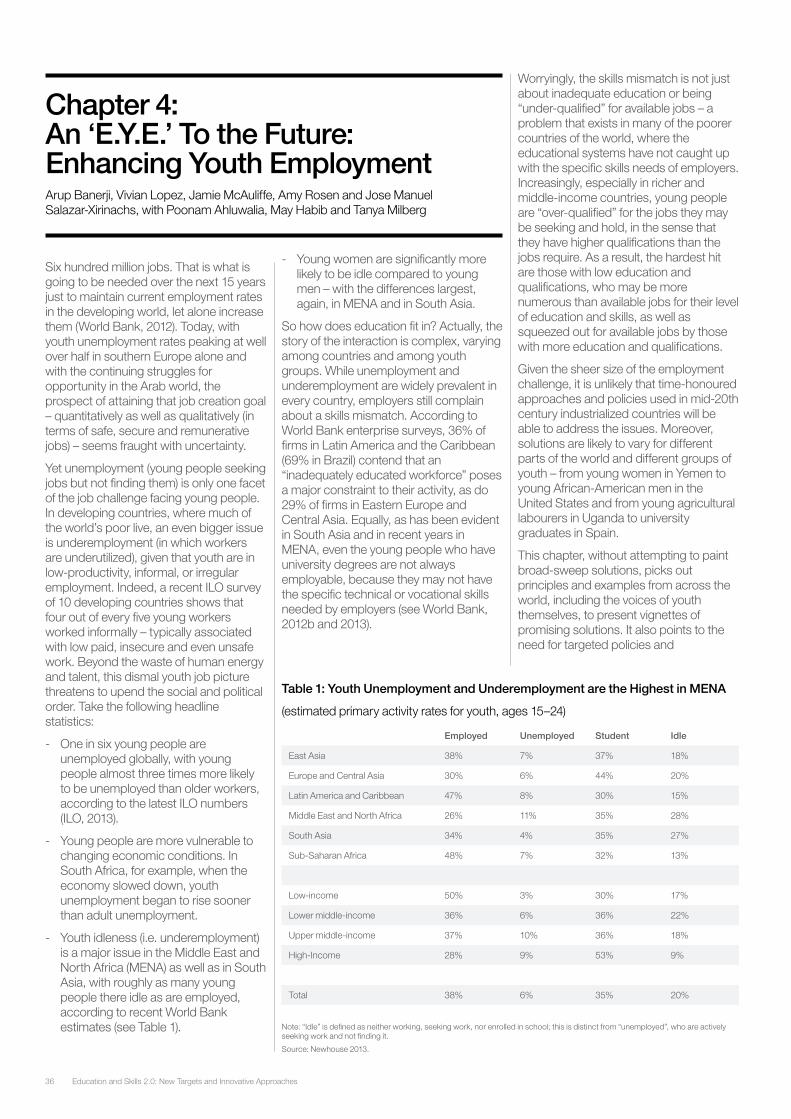
Education and Skills 2.0: New Targets and Innovative Approaches36
Six hundred million jobs. That is what is going to be needed over the next 15 years just to maintain current employment rates in the developing world, let alone increase them (World Bank, 2012). Today, with youth unemployment rates peaking at well over half in southern Europe alone and with the continuing struggles for opportunity in the Arab world, the prospect of attaining that job creation goal – quantitatively as well as qualitatively (in terms of safe, secure and remunerative jobs) – seems fraught with uncertainty.
Yet unemployment (young people seeking jobs but not finding them) is only one facet of the job challenge facing young people. In developing countries, where much of the world’s poor live, an even bigger issue is underemployment (in which workers are underutilized), given that youth are in low-productivity, informal, or irregular employment. Indeed, a recent ILO survey of 10 developing countries shows that four out of every five young workers worked informally – typically associated with low paid, insecure and even unsafe work. Beyond the waste of human energy and talent, this dismal youth job picture threatens to upend the social and political order. Take the following headline statistics:
- One in six young people are unemployed globally, with young people almost three times more likely to be unemployed than older workers, according to the latest ILO numbers (ILO, 2013).
- Young people are more vulnerable to changing economic conditions. In South Africa, for example, when the economy slowed down, youth unemployment began to rise sooner than adult unemployment.
- Youth idleness (i.e. underemployment) is a major issue in the Middle East and North Africa (MENA) as well as in South Asia, with roughly as many young people there idle as are employed, according to recent World Bank estimates (see Table 1).
- Young women are significantly more likely to be idle compared to young men – with the differences largest, again, in MENA and in South Asia.
So how does education fit in? Actually, the story of the interaction is complex, varying among countries and among youth groups. While unemployment and underemployment are widely prevalent in every country, employers still complain about a skills mismatch. According to World Bank enterprise surveys, 36% of firms in Latin America and the Caribbean (69% in Brazil) contend that an “inadequately educated workforce” poses a major constraint to their activity, as do 29% of firms in Eastern Europe and Central Asia. Equally, as has been evident in South Asia and in recent years in MENA, even the young people who have university degrees are not always employable, because they may not have the specific technical or vocational skills needed by employers (see World Bank, 2012b and 2013).
Table 1: Youth Unemployment and Underemployment are the Highest in MENA
(estimated primary activity rates for youth, ages 15–24)
Note: “Idle” is defined as neither working, seeking work, nor enrolled in school; this is distinct from “unemployed”, who are actively seeking work and not finding it.
Source: Newhouse 2013.
Worryingly, the skills mismatch is not just about inadequate education or being “under-qualified” for available jobs – a problem that exists in many of the poorer countries of the world, where the educational systems have not caught up with the specific skills needs of employers. Increasingly, especially in richer and middle-income countries, young people are “over-qualified” for the jobs they may be seeking and hold, in the sense that they have higher qualifications than the jobs require. As a result, the hardest hit are those with low education and qualifications, who may be more numerous than available jobs for their level of education and skills, as well as squeezed out for available jobs by those with more education and qualifications.
Given the sheer size of the employment challenge, it is unlikely that time-honoured approaches and policies used in mid-20th century industrialized countries will be able to address the issues. Moreover, solutions are likely to vary for different parts of the world and different groups of youth – from young women in Yemen to young African-American men in the United States and from young agricultural labourers in Uganda to university graduates in Spain.
This chapter, without attempting to paint broad-sweep solutions, picks out principles and examples from across the world, including the voices of youth themselves, to present vignettes of promising solutions. It also points to the need for targeted policies and
Chapter 4: An ‘E.Y.E.’ To the Future: Enhancing Youth Employment Arup Banerji, Vivian Lopez, Jamie McAuliffe, Amy Rosen and Jose Manuel Salazar-Xirinachs, with Poonam Ahluwalia, May Habib and Tanya Milberg
Employed Unemployed Student Idle
East Asia 38% 7% 37% 18%
Europe and Central Asia 30% 6% 44% 20%
Latin America and Caribbean 47% 8% 30% 15%
Middle East and North Africa 26% 11% 35% 28%
South Asia 34% 4% 35% 27%
Sub-Saharan Africa 48% 7% 32% 13%
Low-income 50% 3% 30% 17%
Lower middle-income 36% 6% 36% 22%
Upper middle-income 37% 10% 36% 18%
High-Income 28% 9% 53% 9%
Total 38% 6% 35% 20%
37Education and Skills 2.0: New Targets and Innovative Approaches
programmes to increase youth employment, given that youth face significantly more barriers to labour market entry (including their high cost of labour, low skill, difficulty with job search and persistently low employment outcomes) (Woolard, 2013). Indeed, some of these programmes are “active labour market policies” – government programmes that address labour market problems by helping the unemployed find work, whether through public employment services, training schemes or employment subsidies.
But applying these and other innovative solutions requires that policies, pro-grammes and new initiatives be rigor-ously evaluated for short-term or transi-tory effects versus long-term or permanent effects. Evaluations will also need to examine both individual benefits and collective benefits – i.e. if one individual getting employment means another is crowded out of employment, there is no net employment gain, although there could be a productivity gain if the lower-productivity worker is crowded out of the job by the higher productivity worker. Such efforts are vital given the still limited knowledge about the effects of active labour market programmes. The research in both the OECD and developing countries shows mixed results (see Robalino and Sanchez-Puertas, 2009; Robalino et al., 2013; Sepulveda, 2013). In general, what the programmes are able to do depends on context, design and implementation (see Almeida et al., 2013). A critical issue, as efforts under way in Australia show, is to give service providers the right incentives to respond to the needs of workers and employers (Robalino, 2013).
Thinking about Today: Short-Term Responses to Youth UnemploymentAt this point, we know that millions of young people are leaving school and unable to find work – and that number will continue to grow over the next several years. At the same time, businesses face a shortage of talent with appropriate skills. A recent McKinsey report estimates that by 2020 developing countries could have 45 million jobs for workers with secondary education that will go unfilled (Dobbs et al., 2012). In many regions and sectors across the globe, this skills mismatch represents a drag on economic growth, but it also offers a significant opportunity for youth employment.
Bridging from School to Work: The Role of Apprenticeships
Successful initiatives in both developed and developing countries confirm that practical, work-related skill-building and on-the-job experience through internships or apprenticeships help create critical bridges from school to work for youth. They not only allow youth to overcome the “experience trap” that can be a barrier to getting a first job but they also ensure that systems of education and labour market intersect rather than operate in parallel universes. Apprenticeship systems, in particular, have shown great promise and can be adapted to new contexts, as the TEN Youth initiative of the World Economic Forum Global Agenda Council on Youth Unemployment is planning to demonstrate with the corporate sector. TEN Youth will work with companies to encourage them to invest in “M&A” (Mentoring and Appren-ticeship) support, provide knowledge and develop tools for companies to implement. The initiative already includes firms such as Infosys and Educomp (India), Aramex (Jordan) and CompTrade (Serbia) and many other companies have expressed interest in being part of the pilot exercise.
A national apprenticeship model that is currently under close examination by policy-makers across the world is Ger-many’s “Dual Apprenticeship” system. In the system, apprentices alternate between learning and working in vocational schools and participating companies, either on a block basis or on agreed weekly sched-ules. These internships are developed through intensive social dialogue between the business community, the German Government (Ministries of Labour and Education), the BIBB (German Federal Institute of Vocational Education) and the trade unions. The origins of this system go back to the 15th and 16th centuries, in which guilds (sectoral associations of employers) wanted to transmit the right sets of skills for example to carpenters, book-binders, goldsmiths, masons and skilled workers in other occupations. And the system seems to work well today.
In 2010, almost two-thirds of German apprentices were taken on as full-time employees in their apprentice firm. Another 20% were taken on in different companies (BIBB, 2012). However, the success of the dual system in Germany has been thanks to specific socio-economic and historical factors not often found in other societies. For that reason, the “export” of the German dual apprenticeship system to a number of countries (such as the Philip-pines, Malaysia, China, Lebanon and Egypt) has not been a real success.
That said, there are a number of lessons that we can draw from the German system to help design apprenticeship systems that lead to better employment, at least in more similar contexts. These include: (a) high levels of trust and cooperative behaviour among public authorities, employers, training providers and young people, usually achieved by robust social dialogue; and (b) clear governance structures (institutions) that take account of any costs to employers (which might play out in a temptation to exploit apprentices) while also protecting apprentices’ rights and the benefits.
More generally, ILO reviews of formal apprenticeships (Steedman, 2012) and the lessons from countries’ experience reflected in the G20’s Key Elements for Quality Apprenticeships (G20, 2012) reveal that quality apprenticeships can be successfully designed when keeping in mind the following parameters suggested by the ILO (Axmann and Hofmann, 2013):
- Using sector-based approaches in skills development to sustain public–private partnerships and assure the quality of formal apprenticeships and the quality of apprentices’ subsequent employment.
- Combining classroom and workplace learning enables employers to match training to their needs and allows for relevant apprenticeship training that is innovative, responsive to labour market needs and leads to higher productivity, better working conditions and higher transferability of skills within and across sectors.
- Considering an appropriate balance between specific and transferable skills and reinforcing core skills such as problem-solving, teamwork and communication, allows to build a pool of competent workers for specific sectors in a sustainable manner.
- Providing a structured apprenticeship system of skills tracking, testing and certification, against competencies defined in advance, improve skills signaling (the acknowledgement of skills by employers) and the predictability of the performance of newly hired workers.
- Combining training with earnings (“learn as you earn”), access to social protection, respect for labour rights and a higher likelihood of post-training employment makes apprenticeship attractive to young people.

Education and Skills 2.0: New Targets and Innovative Approaches38
- Using employment services to expand young peoples’ awareness of formal apprenticeships and the kinds of jobs they can lead to, along with avoiding gender stereotyping so that formal apprenticeships can broaden career choices for young women and men.
- Incorporating entrepreneurship education with technical training inspires young people interested in starting their own business to choose apprenticeships and raises the social status of vocational education and training.
The Importance of Soft Skills Acquisition
Among the disparate contributing factors that have led to the supply and demand mismatch is the dearth of “soft skills” that young people, educated in more traditional systems and lacking practical experience, never develop. These include (World Bank, 2010):
- problem-solving skills or the capacity to think critically and analyse;
- learning skills or the ability to acquire new knowledge (“learning to learn”), distill lessons from experience and apply them in search of innovations;
- communication skills, including reading and writing, collecting and using information to communicate with others and using a foreign language and information and communication technologies (ICTs) as communication tools;
- personal skills for self-management, making sound judgements and managing risks;
- social skills to collaborate with and motivate others in a team, manage client relations, exercise leadership, resolve conflicts and develop social networks.
Today, such skills are frequently not being absorbed and, in many countries, there are few opportunities for on-the-job training, quality internships or practical learning to build these skills outside the family. CEOs, in survey after survey, note that while there are specific technical skills that candidates may lack, more important for many businesses is the requirement that young people come to work already prepared in some of the more basic, soft skills.
An innovative programme in the Dominican Republic, Juventud y Empleo (Youth and Employment Programme), combining classroom training with an
internship period, has demonstrated promising results with respect to “soft skills” acquisition among its youth participants. Most notable in the programme is its built-in evaluation mechanism allowing managers to adapt the programme design as necessary based on concrete regularly conducted evaluations (Polanco, 2013). Another programme, Education for Employment,1 which focuses on the MENA region, underscores the value of training in vocational and professional skills, including the soft ones (see Box 1).
Box 1: Training in Soft Skills in Egypt After graduating from the Faculty of Computer and Information Technology at Cairo University, Shaimaa Moussa, a confident 27-year-old professional’s three-year job search yielded no results. She attributes her inability to find a job to a lack of self-confidence and weak communication skills. Accustomed to excelling at technical and written tests, she was uneasy working in teams and found job interviews especially daunting. After an intensive two-month job training programme, provided by Education for Employment, a nonprofit that specializes in bridging the gap between school and work by providing work-ready skills training and job placements with private sector partners, Shaimaa was able to land a job with an e-commerce company Souk.com, the Arab world’s first online auction site. For Shaimaa, the training “was vital in my practical life to discover myself, learn new skills, and stimulate hope and energy inside me”.Source: Education for Employment.
The Promise of Public–Private Partnerships
Given the complexity of the youth employment problem, it is often noted that solutions will remain small and marginal if the critical stakeholders fail to band together with clear, comprehensive strategies and commitments. This collective approach to achieving better results and impact has been shown to work in a number of diverse industries and geographies.
In Morocco, Education for Employment has brought together large Moroccan businesses, international philanthropy and the Ministry of Youth and Sport to fund,
train and place 3,000 young people in jobs as well as partner with universities to assist an additional 10,000 young people to develop job search and interviewing skills before they graduate from university.
In South Africa, where two out of three South Africans between the ages of 18–28 are unemployed, the Harambee Youth Employment Accelerator is helping a select group of low-income South African youth “bridge” to their first jobs in the private sector. Although currently small in scale, the initiative provides a positive model for private sector engagement. Some of South Africa’s largest companies in the retail, hospitality and tourism sectors are partnering to provide the job commitments. The South African Development Bank has established a Jobs Fund that provides resources, matched by private investors and employer fees, to allow Harambee to scale up its programmes.
In Costa Rica, CAMTIC, the industry association of technology companies, is implementing the Specialist programme to match vulnerable young people with needed IT skills to fill a gap of several thousand unfilled jobs in the IT sector. Educational institutions, informed by IT companies like Cisco, Microsoft and others, have designed certificate-level training courses that combine soft skills, language and technical training and result in jobs that pay three to five times the country’s minimum wage.
These initiatives and many others (e.g. Dobbs et al., 2012) share a number of common traits, including the following:
- They are demand-driven, responding directly to the needs of the private sector, often with a sector-specific focus.
- Employers precommit to hiring, which gives educational institutions and youth the confidence that their efforts will result in a tangible benefit.
- Programmes range from several weeks to several months and include soft skills, as well as more specialized technical skills training related to the specific sector.
- Youth attain formal sector jobs with decent wages and benefits.
- All the relevant constituents (youth, businesses, educational institutions and government) are contributing something concrete (like tuition fees and time, matching fees from businesses, subsidized training and government funds or enabling policies).
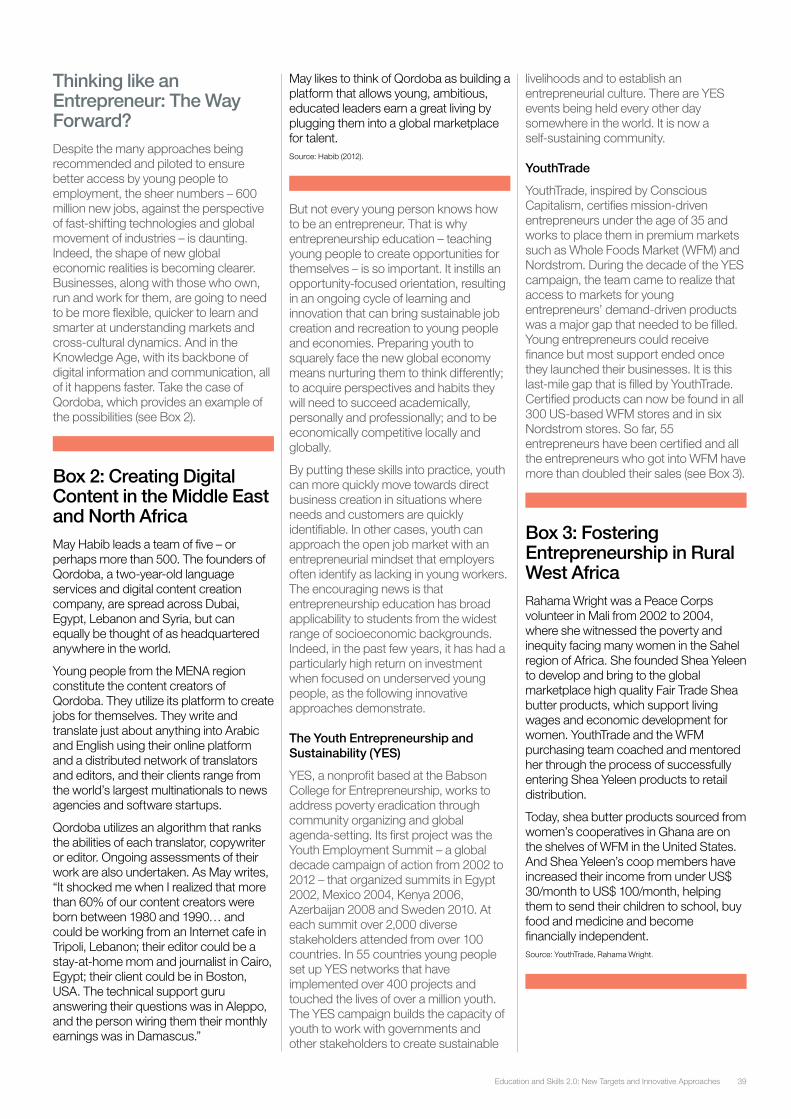
39Education and Skills 2.0: New Targets and Innovative Approaches
Thinking like an Entrepreneur: The Way Forward?Despite the many approaches being recommended and piloted to ensure better access by young people to employment, the sheer numbers – 600 million new jobs, against the perspective of fast-shifting technologies and global movement of industries – is daunting. Indeed, the shape of new global economic realities is becoming clearer. Businesses, along with those who own, run and work for them, are going to need to be more flexible, quicker to learn and smarter at understanding markets and cross-cultural dynamics. And in the Knowledge Age, with its backbone of digital information and communication, all of it happens faster. Take the case of Qordoba, which provides an example of the possibilities (see Box 2).
Box 2: Creating Digital Content in the Middle East and North AfricaMay Habib leads a team of five – or perhaps more than 500. The founders of Qordoba, a two-year-old language services and digital content creation company, are spread across Dubai, Egypt, Lebanon and Syria, but can equally be thought of as headquartered anywhere in the world.
Young people from the MENA region constitute the content creators of Qordoba. They utilize its platform to create jobs for themselves. They write and translate just about anything into Arabic and English using their online platform and a distributed network of translators and editors, and their clients range from the world’s largest multinationals to news agencies and software startups.
Qordoba utilizes an algorithm that ranks the abilities of each translator, copywriter or editor. Ongoing assessments of their work are also undertaken. As May writes, “It shocked me when I realized that more than 60% of our content creators were born between 1980 and 1990… and could be working from an Internet cafe in Tripoli, Lebanon; their editor could be a stay-at-home mom and journalist in Cairo, Egypt; their client could be in Boston, USA. The technical support guru answering their questions was in Aleppo, and the person wiring them their monthly earnings was in Damascus.”
May likes to think of Qordoba as building a platform that allows young, ambitious, educated leaders earn a great living by plugging them into a global marketplace for talent. Source: Habib (2012).
But not every young person knows how to be an entrepreneur. That is why entrepreneurship education – teaching young people to create opportunities for themselves – is so important. It instills an opportunity-focused orientation, resulting in an ongoing cycle of learning and innovation that can bring sustainable job creation and recreation to young people and economies. Preparing youth to squarely face the new global economy means nurturing them to think differently; to acquire perspectives and habits they will need to succeed academically, personally and professionally; and to be economically competitive locally and globally.
By putting these skills into practice, youth can more quickly move towards direct business creation in situations where needs and customers are quickly identifiable. In other cases, youth can approach the open job market with an entrepreneurial mindset that employers often identify as lacking in young workers. The encouraging news is that entrepreneurship education has broad applicability to students from the widest range of socioeconomic backgrounds. Indeed, in the past few years, it has had a particularly high return on investment when focused on underserved young people, as the following innovative approaches demonstrate.
The Youth Entrepreneurship and Sustainability (YES)
YES, a nonprofit based at the Babson College for Entrepreneurship, works to address poverty eradication through community organizing and global agenda-setting. Its first project was the Youth Employment Summit – a global decade campaign of action from 2002 to 2012 – that organized summits in Egypt 2002, Mexico 2004, Kenya 2006, Azerbaijan 2008 and Sweden 2010. At each summit over 2,000 diverse stakeholders attended from over 100 countries. In 55 countries young people set up YES networks that have implemented over 400 projects and touched the lives of over a million youth. The YES campaign builds the capacity of youth to work with governments and other stakeholders to create sustainable
livelihoods and to establish an entrepreneurial culture. There are YES events being held every other day somewhere in the world. It is now a self-sustaining community.
YouthTrade
YouthTrade, inspired by Conscious Capitalism, certifies mission-driven entrepreneurs under the age of 35 and works to place them in premium markets such as Whole Foods Market (WFM) and Nordstrom. During the decade of the YES campaign, the team came to realize that access to markets for young entrepreneurs’ demand-driven products was a major gap that needed to be filled. Young entrepreneurs could receive finance but most support ended once they launched their businesses. It is this last-mile gap that is filled by YouthTrade. Certified products can now be found in all 300 US-based WFM stores and in six Nordstrom stores. So far, 55 entrepreneurs have been certified and all the entrepreneurs who got into WFM have more than doubled their sales (see Box 3).
Box 3: Fostering Entrepreneurship in Rural West AfricaRahama Wright was a Peace Corps volunteer in Mali from 2002 to 2004, where she witnessed the poverty and inequity facing many women in the Sahel region of Africa. She founded Shea Yeleen to develop and bring to the global marketplace high quality Fair Trade Shea butter products, which support living wages and economic development for women. YouthTrade and the WFM purchasing team coached and mentored her through the process of successfully entering Shea Yeleen products to retail distribution.
Today, shea butter products sourced from women’s cooperatives in Ghana are on the shelves of WFM in the United States. And Shea Yeleen’s coop members have increased their income from under US$ 30/month to US$ 100/month, helping them to send their children to school, buy food and medicine and become financially independent.Source: YouthTrade, Rahama Wright.
Education and Skills 2.0: New Targets and Innovative Approaches40
The Network for Teaching Entrepreneurship
The Network for Teaching Entrepreneurship (NFTE) is an international nonprofit organization dedicated to engaging and inspiring youth in low-income communities to pursue educational opportunities, start their own businesses and succeed in life.2 Its 25 years of success has proven that by bringing entrepreneurship into the classroom, young people can have a brighter future for employment, stay in school and learn smart financial management. NFTE helps young people develop a mindset to start a business, pursue further education or become a well-rounded employee who can think like an entrepreneur. To date, NFTE has educated 500,000 students globally and trained more than 5,000 teachers in entrepreneurship. Its school-based curriculum, which consists of over 65 hours of project-based learning, sharpens students’ entrepreneurial mindset and leaves them with a set of related attitudes, knowledge and skills that mirrors those that years of research have found in successful entrepreneurs. NFTE has also created the World Series of Innovation (WSI), a prominent annual programme held each autumn as part of Global Entrepreneurship Week.
INJAZ-UAE Junior Achievement Worldwide
INJAZ-UAE, which is a member of Junior Achievement (JA) Worldwide, is a partnership among the business community, educators and volunteers to inspire young people to dream big and reach their full potential. Through an experiential programme, it teaches youth free of charge the key concepts of work readiness, entrepreneurship and financial literacy. According to INJAZ-UAE, its outreach efforts provide "the only education programme in the Arab world that teaches students business, entrepreneurship and life skills as part of a regular school curriculum". They instill Arab youth with a sense of self-motivation, confidence and empowerment, while fostering among business leaders a responsibility for investing their resources in the future of the region's youth. Its educational programmes have reached more than 23,000 students and engaged 1,500 volunteers at 43 schools and universities.
Thinking about Education and Labour Market ReformsOver the long term, to ensure that young people are better able to find the jobs that they need and firms and economies can get the productive workers that they want for growth and revenues, it is necessary to rethink traditional education and labour market institutions. For one, governments need to create long-term strategies for economic growth that include job creation at their core as well as policies that will foster an overall environment more conducive to creating and growing businesses. Second, many countries need to make long overdue changes to their education systems to better align education content and delivery to the market needs of the 21st century. Third, societies have to find better ways of managing how information flows between those who are seeking jobs and opportunities and those who provide them.
These longer-term strategies are increasingly being adopted in different countries, offering hope for better outcomes for youth, as such interventions improve and are scaled up while societies learn and adapt along the way:
- Australia is piloting a vocational training curriculum that combines a core curriculum common to all students with a set of “top-up” elective courses designed to meet the needs of local employers.
- Australia and Singapore are providing incentives for all higher educational institutions (not just vocational schools) to make jobs a core educational objective by publishing and publicizing comparative metrics of the employment outcomes of their graduates.
- Babajob in India is using an Internet-based job search portal to connect those who seek informal and entry-level jobs with potential employers.
- Glowork in Saudi Arabia is matching skilled women with opportunities, while devising technology that allows them to work from home.
Overall, the democratization of information through the Internet, if scaled up beyond these niches, can help ease the “frictional” part of youth unemployment, by helping job-seekers and those who want to hire find each other more predictably and cheaply.
Thinking Fast and Thinking Differently: Improving the Future How we can deal with the future of our societies, our economies and our world will depend greatly on what the youth of today – and those of a decade from now – can shape. That world is unlikely to be one where everyone will still have the traditional jobs that have been the drivers of prosperity over the last century. New ways of making things, from 3D printers to robotics, will change the skills needed for manufacturing. New technologies, from nanotech to biotech, will change the sorts of skills that will drive the economy. And unimaginably better information flows and processing power will empower all those who have the ability to harness them.
Accordingly, solutions for youth employment also have to increasingly embrace ways of endowing young people with the ability to adapt, to learn and to change. So many of the most promising approaches are those that build in that element of flexibility – whether quickly adaptable vocational curricula, apprenticeships that allow new skills to be rapidly identified and acquired, or indeed entrepreneurship education that provides an opportunity for young people to develop the insights necessary to create their own futures.
Finally, solutions for youth employment will also lie in the ability of adults to believe in youth – notably, offering youth opportunities to demonstrate creditworthiness and transform themselves.
ReferencesAlmeida, R., Arbelaez, J., Honorati, M., Kuddo, A., Lohmann, T., Ovadiya, M., Pop, L., Sanchez-Puerta, M. and Weber, M. Improving Access to Jobs and Earnings Opportunities: The Role of Activation and Graduation Policies. World Bank Human Development Discussion Paper, 2012.
Axmann, M. and Hofmann, C. “Overcoming the work-inexperience gap through quality apprenticeships – the ILO’s contribution”. ILO, http://www.ilo.org/beirut/media-centre/fs/WCMS_214722/lang--en/index.htm, 2013.
Almeida, R., Behrman, J., Robalino, D. The Right Skills for the Job? Human Development Perspectives. Washington DC: The World Bank, 2012.
Babajob, www.babajob.com.
BIBB. VET Data Report Germany 2012. Bonn: Bundesinstitut fur Berufsbildung, 2012.
CAMTIC, www.camtic.org.
Dobbs, R., Madgavkar, A., Barton, D., Labaye, E., Manyika, J., Roxburgh, C., Lund, S. and Madhav, S. “The world at work: Jobs, pay, and skills for 3.5 billion people”. McKinsey Global Institute, http://www.mckinsey.com/insights/employment_and_growth/, 2012.
Education For Employment, www.efe.org.
G20.“Key elements of quality apprenticeships”. G20 Task Force on Employment, http://www.skillsforemployment.org, 27 September 2012.
Glowork, www.glowork.net.
Habib. “Get to work: Inclusive markets for labour”. IFC-WEF essay competition, http://www3.weforum.org/docs/, May 2012.
41Education and Skills 2.0: New Targets and Innovative Approaches
Harambee, www.harambee.co.za.
ILO. Global Employment Trends for Youth 2013: A Generation at Risk. Geneva: The International Labor Office, 2013.
Mourshed, M., Farrell, D. and Barton, D. Education to Employment: Designing a System that Works. McKinsey Center for Government, December 2012.
Newhouse, D. New Estimates of Youth Idleness and Employment Outcomes in Developing Countries. mimeo. Social Protection and Labor. Washington DC: The World Bank, 2013.
Polanco, J.L. “Creating jobs for youth in the Dominican Republic”. https://www.jobsknowledge.org/JobsandDevelopmentBlog/Lists/Posts/Post.aspx?List=2865966b-969e-44d4-a556-19cf83c472ab&ID=190&Source=https%3A%2F%2Fwww%2Ejobsknowledge%2Eorg%2FJobsandDevelopmentBlog%2FHome%2Easpx%3FPaged%3DTRUE%26p_GroupCol1%3DIlkka%2520Lakaniemi%26PageFirstRow%3D31%26%26View%3D%7BCEF3D237-6E58-4D68-A341-9CD93009F906%7D&Web=0883d59e-523e-4969-b84d-4e317deed77c, 2013.
Robalino, D. “Designing effective employment services – The Australian way”. The World Bank, https://www.jobsknowledge.org/JobsandDevelopmentBlog/Lists/Posts/Post.aspx?List=2865966b-969e-44d4-a556-19cf83c472ab&ID=188&Source=https%3A%2F%2Fwww%2Ejobsknowledge%2Eorg%2FJobsandDevelopmentBlog%2FHome%2Easpx&Web=0883d59e-523e-4969-b84d-4e317deed77c, 2013.
Robalino, D. and Sanchez-Puertas, L. Managing Labor Market Risks and Creating Better Jobs: Alternative designs for Income Protection and Active Labor Market Policies. Washington DC: World Bank, 2009.
Robalino, D., Margolis, D., Rother, F., Newhouse, D. and Lundberg, M. Youth Employment: A Human Development Agenda for the Next Decade. Social Protection Discussion Paper No. 1308. Washington DC: The World Bank, 2013.
Sepulveda, C. “A better search ability for some young French workers reduces the search success of others”. The World Bank, https://www.jobsknowledge.org/JobsandDevelopmentBlog/Lists/Posts/Post.aspx?List=2865966b-969e-44d4-a55([0-9])–([0-9])9cf83c472ab&ID=191, 2013.
Steedman, H. Overview of Apprenticeship Systems and Issues – ILO Contribution to the G20 Task Force on Employment. International Labour Office, Skills and Employability Department. Geneva: International Labour Office, 2012.
Woolard, I. “Targeting youth to reduce South Africa’s unemployment”. https://www.jobsknowledge.org/JobsandDevelopmentBlog/Lists/Posts/Post.aspx?ID=185, 2013.
World Bank. Jobs for Shared Prosperity: Time for action in the Middle East and North Africa. Washington DC: The World Bank, 2013.
World Bank. World Development Report 2013: Jobs. Washington DC: The World Bank, 2012a.
World Bank. More and Better Jobs in South Asia. Washington DC: The World Bank, 2012b.
World Bank. Stepping up Skills for More Jobs and Higher Productivity. Washington DC: The World Bank, 2010.
World Bank enterprise surveys. www.enterprisesurveys.org.
Endnotes1. Note that co-author Jamie McAuliffe is Chief Executive, Office
of Education for Employment.
2. Note that co-author Amy Rosen is CEO of the NFTE.
Pakistan’s education system faces many well-known problems. At the primary and secondary level, both access and student achievement are low – by international standards as well as the standard of meeting Pakistan’s broad development challenges; and future outlook is pessimistic – with Pakistan likely to fall well short of the Millennium Development Goal (MDG) of achieving universal primary education by 2015.1 Teacher preparation and teacher attendance at schools are inadequate. Stubborn inequalities in access, quality and educational outcomes persist across gender, across income, between urban and rural schools and among the country’s four provinces. These inequalities create some startling disparities: for instance, Punjabi urban males completed primary school in the early 2000s at a rate of 65%; but only about 10% of rural Balochi or rural Pathan females did so.2 New data on these disparities provide some encouragement but there is still a long distance to go in eliminating them.
The higher education system fares no better, in spite of strides made in the past decade. Enrolment stands at about 8% (including two-year colleges) of the age cohort, a statistic that compares unfavourably with countries such as India at 18% and Malaysia at 42%.3 The problems in this system are legion: low quality of faculty, low student motivation, rote learning, outdated curriculum, poor student discipline in public universities, lack of funding, lack of research and so forth. As a result, a large majority of Pakistani graduates emerge from universities without the technical or social skills needed for them to be strong contributors in the workplace or society, either in Pakistan or on the global stage.
Vocational education in Pakistan is even more marginalized. Less than 1% of the population has ever received technical education or vocational training. For those who have, quality has been uneven. More than 75% of the graduates have some foundational skills but no marketable skills for employment. Poor administration, lack
of interaction with industry and the outdated infrastructure of public institu-tions have been blamed.4 Such issues, along with those that bedevil the other levels of education, explain why Skilled Workforce Indicators such as ‘poor work ethic’ and inadequate education rank as two of the top 10 most problematic factors for doing business in Pakistan, according to the World Economic Forum’s 2012 Global Competitiveness Report.5
These problems are not new or unknown and various Pakistani governments have tried, with questionable resolve, to respond. Pakistan in fact has a long history of failed reforms and educational development plans. As early as 1959, the National Commission on Education produced a report that outlined the problems in Pakistan’s educational system and recommended reforms. By and large, the problems identified in that report remained unaddressed and have persisted through the Government of Pakistan’s educational policies of 1970, 1972, 1979, 1992 and 1998. These problems have also survived more than eight five-year development plans that, among broader development efforts, aimed at resolving the problems in the education sector.
The long neglect has made these problems graver than ever before. In a world in which many countries (including in the developing world) are moving ahead quickly in terms of their economic and social development, Pakistan risks falling ever further behind if it cannot educate its young people effectively. Moreover, the challenges to Pakistan’s education system are about to multiply, given that the number of young people is projected to rise significantly in the coming decades. The current education system in Pakistan is for the most part unable to educate the existing and the coming large numbers of students so that they are fully functionally literate, are able to contribute productively to the economy and are fully aware citizens, able to constructively contribute to overcoming the country’s vast development challenges.
Chapter 5: Education System Reform in Pakistan: Why, When and How?Mehnaz Aziz, David E. Bloom, Salal Humair, Emmanuel Jimenez, Larry Rosenberg and Zeba Sathar
Education and Skills 2.0: New Targets and Innovative Approaches42
Fortunately, Pakistan is not doomed to follow this scenario. It has enormous potential, but we believe it will need to act quickly because a unique opportunity exists to initiate educational reforms now. We also believe that Pakistan no longer has the luxury for piecemeal reforms; rather, the whole system must be tackled, simultaneously, with all stakeholders – the government, donors, youth, parents, employers, and workers. This chapter articulates that opportunity for reform and summarizes the current state of education, including challenges raised by recent developments. It then focuses on how to design reforms at the system level, how to initiate them, and how to sustain them to overcome the inevitable obstacles that will arise.
Opportunity for ReformGiven the rather dismal history of educational reform in Pakistan, a pragmatic question is if anything can be done and if it has any reasonable chance of success. We believe the answer is a qualified yes, as several forces both within the educational system and in the broader polity in Pakistan have come together to create a window of opportunity for education reforms to materialize.
The first force for change is the rising expectations of the Pakistani public.6 Pakistan’s educational deficits – along with the country’s inability to provide productive work to all those who are educated – have led to widely unfulfilled expectations. Partly because of technology and global connectedness, the generation that grew up in the last decade, the one that is growing up now, their parents and businesses and leading thinkers are much more aware of global currents and of their own disadvantage with respect to other countries. Rising economic insecurity has added to the anxiety of parents and youth about their future. Pakistan’s rapidly growing population has made these problems all the more acute. Although the share of 15- to 24-year-olds is currently at its peak and will be declining in the coming decades, the absolute size of that cohort is projected to grow from about 38 million today to about 43 million in 2035. Young people, and indeed all age cohorts, will increasingly expect and demand that the country rapidly improve access to, and the quality and relevance of, its education system at all levels.
The second force is a rapidly evolving political system in which major actors are adjusting to new expectations. Pakistan’s checkered history of governance – in which the military ruled the country for more than half of its 66-year history – never allowed democratic norms to stabilize. Interim civilian governments, with limited exceptions, were typically weak and insecure. In the limited time and perceived autonomy they enjoyed, their focus was mainly on rent extraction and personal gains, in part because few expected to go back to the electorate to seek re-election based on performance, as the military was often a more important power broker.
This has now changed. The public’s power is increasingly the deciding factor in who comes to and remains in power. For instance, in spite of developmental initiatives, the end of the last military government (1999–2007) was brought about largely through popular discontent. The last democratic government (2008–2013), in spite of making important legislative gains, was emphatically voted out by the electorate – a signal that was widely interpreted as a vote of no confidence in its performance in service delivery.7 Consequently, the new government appears overtly conscious of the fact that it must deliver, rather than just declare, and be seen to deliver on services demanded by the Pakistani public, including education for Pakistan’s children. How well they can do remains to be seen.
The new government also knows that it will be kept in check by a highly active judiciary. The higher judiciary – historically pliant to the military and other political exigencies – has become aggressively independent since 2007, actively holding public officials to account. This has two significant implications for implementation of reform in the education sector. First, with the passing of Article 25(A)8, it is possible for the public to go to court about being denied basic education. Second, government and bureaucracy now know that misconduct and corruption in implementation may result in serious and public consequences.
The third force is the rise of a highly active Pakistani media that regularly highlights the dysfunction within Pakistani institutions. It has provided a forum for voicing popular discontent on various issues, including education. Already there are aggressive campaigns for public dialogue and accountability in the education sector led by nongovernmental organizations (NGOs) and the media,9,10
which highlight citizens’ and the state’s responsibility to get every child into school, improve the quality of schools and expose ghost schools.11 The media have also put politicians and other leaders on notice in terms of accountability, with media reports regularly providing the basis for court cases filed against bureaucratic malpractices. Political leaders, higher courts and civil society activists are all adjusting to this sharp spotlight of public accountability. The system is far from perfect and an often over-exuberant media can at times behave regressively (such as sometimes stoking hysteria about curricular reform), but the point is that political leaders know that there is a new reality and that they can no longer hide behind a cloak of obscurity if service delivery or reform implementation is marred by corruption.
There are also other new and potentially powerful symbols of change. Malala Yousafzai, the Pakistani girl who was shot by the Taliban in 2012 but survived, has become a focusing icon for gender equality in education – not only in Pakistan but globally. The events after her shooting, recovery and rise to the global stage have challenged perceptions and expanded the discourse in Pakistan about girls’ education in particular and education in general.
Although forces for change exist, it is not yet clear how much the government can focus on education, versus other highly visible and charged problems, such as the economy, energy and security crises. Even less clear is whether leaders who have the will to do something about the education system also have the political skill to take advantage of the country’s considerable strengths, to effect lasting change at the scale needed. This matters greatly because without major, near-term improvements in the quality of and access to education, Pakistan may stagnate in its economic and social development, continue to experience significant challenges to its democracy, fail to build on its strengths, continue to suffer considerable internal strife and, ultimately, weaken itself in relation to neighbouring countries. Fortunately, Pakistan is not doomed to follow this scenario. But it will need to act quickly if it is to realize its enormous potential and satisfy the growing demands of its people for better lives.
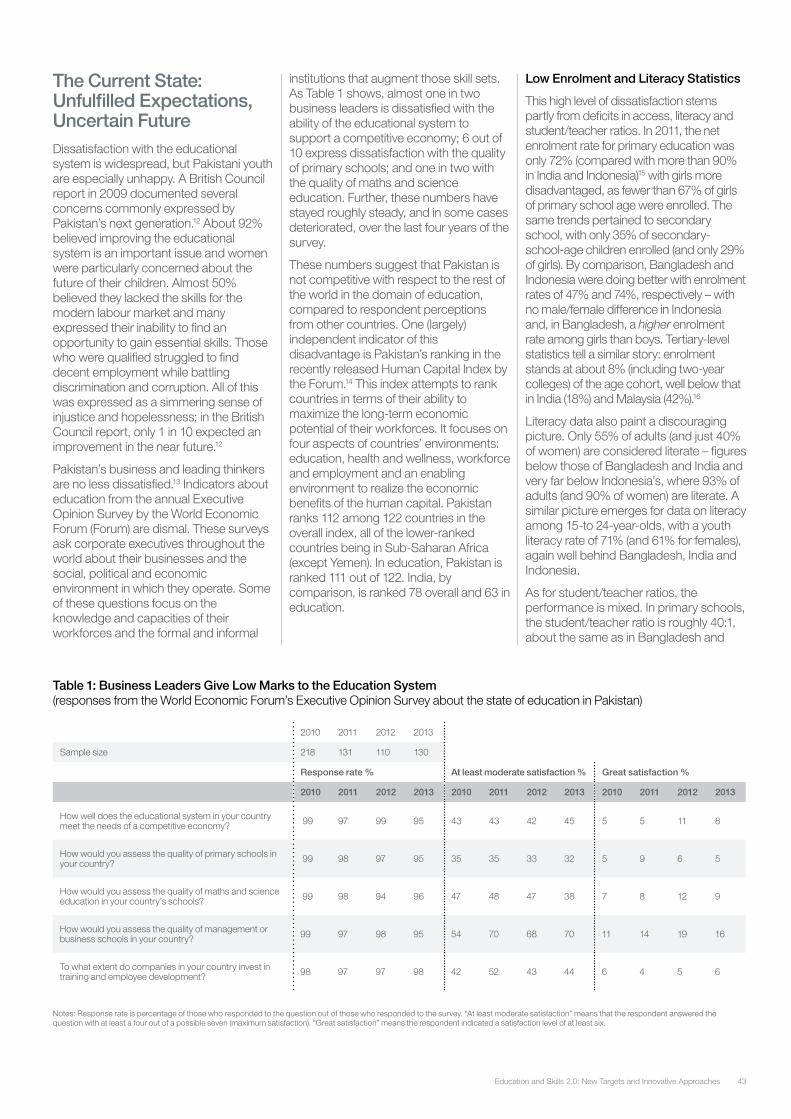
43Education and Skills 2.0: New Targets and Innovative Approaches
The Current State: Unfulfilled Expectations, Uncertain FutureDissatisfaction with the educational system is widespread, but Pakistani youth are especially unhappy. A British Council report in 2009 documented several concerns commonly expressed by Pakistan’s next generation.12 About 92% believed improving the educational system is an important issue and women were particularly concerned about the future of their children. Almost 50% believed they lacked the skills for the modern labour market and many expressed their inability to find an opportunity to gain essential skills. Those who were qualified struggled to find decent employment while battling discrimination and corruption. All of this was expressed as a simmering sense of injustice and hopelessness; in the British Council report, only 1 in 10 expected an improvement in the near future.12
Pakistan’s business and leading thinkers are no less dissatisfied.13 Indicators about education from the annual Executive Opinion Survey by the World Economic Forum (Forum) are dismal. These surveys ask corporate executives throughout the world about their businesses and the social, political and economic environment in which they operate. Some of these questions focus on the knowledge and capacities of their workforces and the formal and informal
institutions that augment those skill sets. As Table 1 shows, almost one in two business leaders is dissatisfied with the ability of the educational system to support a competitive economy; 6 out of 10 express dissatisfaction with the quality of primary schools; and one in two with the quality of maths and science education. Further, these numbers have stayed roughly steady, and in some cases deteriorated, over the last four years of the survey.
These numbers suggest that Pakistan is not competitive with respect to the rest of the world in the domain of education, compared to respondent perceptions from other countries. One (largely) independent indicator of this disadvantage is Pakistan’s ranking in the recently released Human Capital Index by the Forum.14 This index attempts to rank countries in terms of their ability to maximize the long-term economic potential of their workforces. It focuses on four aspects of countries’ environments: education, health and wellness, workforce and employment and an enabling environment to realize the economic benefits of the human capital. Pakistan ranks 112 among 122 countries in the overall index, all of the lower-ranked countries being in Sub-Saharan Africa (except Yemen). In education, Pakistan is ranked 111 out of 122. India, by comparison, is ranked 78 overall and 63 in education.
Low Enrolment and Literacy Statistics
This high level of dissatisfaction stems partly from deficits in access, literacy and student/teacher ratios. In 2011, the net enrolment rate for primary education was only 72% (compared with more than 90% in India and Indonesia)15 with girls more disadvantaged, as fewer than 67% of girls of primary school age were enrolled. The same trends pertained to secondary school, with only 35% of secondary-school-age children enrolled (and only 29% of girls). By comparison, Bangladesh and Indonesia were doing better with enrolment rates of 47% and 74%, respectively – with no male/female difference in Indonesia and, in Bangladesh, a higher enrolment rate among girls than boys. Tertiary-level statistics tell a similar story: enrolment stands at about 8% (including two-year colleges) of the age cohort, well below that in India (18%) and Malaysia (42%).16
Literacy data also paint a discouraging picture. Only 55% of adults (and just 40% of women) are considered literate – figures below those of Bangladesh and India and very far below Indonesia’s, where 93% of adults (and 90% of women) are literate. A similar picture emerges for data on literacy among 15-to 24-year-olds, with a youth literacy rate of 71% (and 61% for females), again well behind Bangladesh, India and Indonesia.
As for student/teacher ratios, the performance is mixed. In primary schools, the student/teacher ratio is roughly 40:1, about the same as in Bangladesh and
Table 1: Business Leaders Give Low Marks to the Education System (responses from the World Economic Forum’s Executive Opinion Survey about the state of education in Pakistan)
2010 2011 2012 2013
Sample size 218 131 110 130
Response rate % At least moderate satisfaction % Great satisfaction %
2010 2011 2012 2013 2010 2011 2012 2013 2010 2011 2012 2013
How well does the educational system in your country meet the needs of a competitive economy? 99 97 99 95 43 43 42 45 5 5 11 8
How would you assess the quality of primary schools in your country? 99 98 97 95 35 35 33 32 5 9 6 5
How would you assess the quality of maths and science education in your country’s schools? 99 98 94 96 47 48 47 38 7 8 12 9
How would you assess the quality of management or business schools in your country? 99 97 98 95 54 70 68 70 11 14 19 16
To what extent do companies in your country invest in training and employee development? 98 97 97 98 42 52 43 44 6 4 5 6
Notes: Response rate is percentage of those who responded to the question out of those who responded to the survey. “At least moderate satisfaction” means that the respondent answered the question with at least a four out of a possible seven (maximum satisfaction). “Great satisfaction” means the respondent indicated a satisfaction level of at least six.
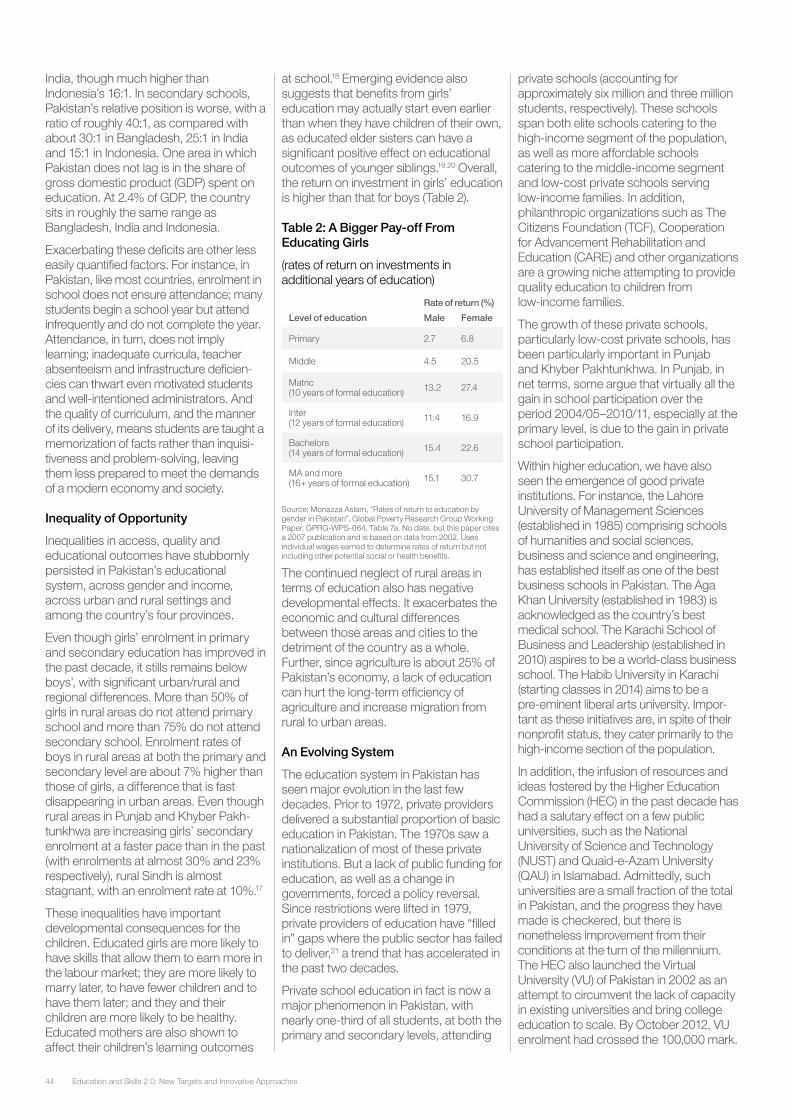
Education and Skills 2.0: New Targets and Innovative Approaches44
India, though much higher than Indonesia’s 16:1. In secondary schools, Pakistan’s relative position is worse, with a ratio of roughly 40:1, as compared with about 30:1 in Bangladesh, 25:1 in India and 15:1 in Indonesia. One area in which Pakistan does not lag is in the share of gross domestic product (GDP) spent on education. At 2.4% of GDP, the country sits in roughly the same range as Bangladesh, India and Indonesia.
Exacerbating these deficits are other less easily quantified factors. For instance, in Pakistan, like most countries, enrolment in school does not ensure attendance; many students begin a school year but attend infrequently and do not complete the year. Attendance, in turn, does not imply learning; inadequate curricula, teacher absenteeism and infrastructure deficien-cies can thwart even motivated students and well-intentioned administrators. And the quality of curriculum, and the manner of its delivery, means students are taught a memorization of facts rather than inquisi-tiveness and problem-solving, leaving them less prepared to meet the demands of a modern economy and society.
Inequality of Opportunity
Inequalities in access, quality and educational outcomes have stubbornly persisted in Pakistan’s educational system, across gender and income, across urban and rural settings and among the country’s four provinces.
Even though girls’ enrolment in primary and secondary education has improved in the past decade, it stills remains below boys’, with significant urban/rural and regional differences. More than 50% of girls in rural areas do not attend primary school and more than 75% do not attend secondary school. Enrolment rates of boys in rural areas at both the primary and secondary level are about 7% higher than those of girls, a difference that is fast disappearing in urban areas. Even though rural areas in Punjab and Khyber Pakh-tunkhwa are increasing girls’ secondary enrolment at a faster pace than in the past (with enrolments at almost 30% and 23% respectively), rural Sindh is almost stagnant, with an enrolment rate at 10%.17
These inequalities have important developmental consequences for the children. Educated girls are more likely to have skills that allow them to earn more in the labour market; they are more likely to marry later, to have fewer children and to have them later; and they and their children are more likely to be healthy. Educated mothers are also shown to affect their children’s learning outcomes
at school.18 Emerging evidence also suggests that benefits from girls’ education may actually start even earlier than when they have children of their own, as educated elder sisters can have a significant positive effect on educational outcomes of younger siblings.19,20 Overall, the return on investment in girls’ education is higher than that for boys (Table 2).
Table 2: A Bigger Pay-off From Educating Girls
(rates of return on investments in additional years of education)
Rate of return (%)
Level of education Male Female
Primary 2.7 6.8
Middle 4.5 20.5
Matric (10 years of formal education) 13.2 27.4
Inter (12 years of formal education) 11.4 16.9
Bachelors (14 years of formal education) 15.4 22.6
MA and more (16+ years of formal education) 15.1 30.7
Source: Monazza Aslam, “Rates of return to education by gender in Pakistan”, Global Poverty Research Group Working Paper, GPRG-WPS-064, Table 7a. No date, but this paper cites a 2007 publication and is based on data from 2002. Uses individual wages earned to determine rates of return but not including other potential social or health benefits.
The continued neglect of rural areas in terms of education also has negative developmental effects. It exacerbates the economic and cultural differences between those areas and cities to the detriment of the country as a whole. Further, since agriculture is about 25% of Pakistan’s economy, a lack of education can hurt the long-term efficiency of agriculture and increase migration from rural to urban areas.
An Evolving System
The education system in Pakistan has seen major evolution in the last few decades. Prior to 1972, private providers delivered a substantial proportion of basic education in Pakistan. The 1970s saw a nationalization of most of these private institutions. But a lack of public funding for education, as well as a change in governments, forced a policy reversal. Since restrictions were lifted in 1979, private providers of education have “filled in” gaps where the public sector has failed to deliver,21 a trend that has accelerated in the past two decades.
Private school education in fact is now a major phenomenon in Pakistan, with nearly one-third of all students, at both the primary and secondary levels, attending
private schools (accounting for approximately six million and three million students, respectively). These schools span both elite schools catering to the high-income segment of the population, as well as more affordable schools catering to the middle-income segment and low-cost private schools serving low-income families. In addition, philanthropic organizations such as The Citizens Foundation (TCF), Cooperation for Advancement Rehabilitation and Education (CARE) and other organizations are a growing niche attempting to provide quality education to children from low-income families.
The growth of these private schools, particularly low-cost private schools, has been particularly important in Punjab and Khyber Pakhtunkhwa. In Punjab, in net terms, some argue that virtually all the gain in school participation over the period 2004/05–2010/11, especially at the primary level, is due to the gain in private school participation.
Within higher education, we have also seen the emergence of good private institutions. For instance, the Lahore University of Management Sciences (established in 1985) comprising schools of humanities and social sciences, business and science and engineering, has established itself as one of the best business schools in Pakistan. The Aga Khan University (established in 1983) is acknowledged as the country’s best medical school. The Karachi School of Business and Leadership (established in 2010) aspires to be a world-class business school. The Habib University in Karachi (starting classes in 2014) aims to be a pre-eminent liberal arts university. Impor-tant as these initiatives are, in spite of their nonprofit status, they cater primarily to the high-income section of the population.
In addition, the infusion of resources and ideas fostered by the Higher Education Commission (HEC) in the past decade has had a salutary effect on a few public universities, such as the National University of Science and Technology (NUST) and Quaid-e-Azam University (QAU) in Islamabad. Admittedly, such universities are a small fraction of the total in Pakistan, and the progress they have made is checkered, but there is nonetheless improvement from their conditions at the turn of the millennium. The HEC also launched the Virtual University (VU) of Pakistan in 2002 as an attempt to circumvent the lack of capacity in existing universities and bring college education to scale. By October 2012, VU enrolment had crossed the 100,000 mark.
45Education and Skills 2.0: New Targets and Innovative Approaches
Vocational education, in contrast to primary/secondary schooling and the higher education sector, has not yet caught the attention of private providers, although exceptions have recently emerged such as AmanTech in Karachi.22 Government remains the primary provider, with responsibility and authority devolved to the provincial governments.
Disruptive Changes
Educational governance in the country is in a state of flux because of constitutional changes and political dynamics. In April 2010, the legislature passed the 18th amendment to the constitution which, among other far-reaching changes, devolved a significant number of respon-sibilities for education to the provinces. Prior to the amendment, primary and secondary education was a shared responsibility of the federal and provincial governments and the federal government had powers to enact and enforce laws related to education. The 18th amend-ment was initially interpreted as the federal government completely devolving responsibility to the provincial govern-ments, along with the abolition of the federal Ministry of Education (MoE). However, legal challenges were soon mounted and the Supreme Court ruled in November 2011 that education was an obligation of the federal government from which it cannot absolve itself. Conse-quently, an existing ministry, the Ministry of Professional Education and Trainings, was renamed to form the Ministry of Education and Training (MoET). However, even two years after its creation, the role, responsibility and authority of MoET is unclear and its relations with provincial ministries of education undefined.
At the higher education level as well, recent developments have created significant governance challenges. Prior to 2000, the higher education sector in Pakistan was overwhelmingly marginalized in favour of primary education. In 2002, the government created a powerful Higher Education Commission (HEC) that helped the sector make huge strides. But the HEC, too, has fallen to the vicissitudes of Pakistan’s political turmoil. Under the last regime, HEC’s budgets were radically reduced and it became party to political conflict when it was asked by the Supreme Court to verify the degrees of sitting parliamentarians. The resulting political enmity left the HEC with few champions in the government. As a result, there were several efforts to disband it or to put it under MoET’s control, which would effectively revoke its status as an
independent commission. There were also public rifts about appointments at senior positions within the HEC, with the government and the courts pushing the commission in opposite directions.
At this point, the HEC finds its future role and responsibility uncertain in regard to the higher education sector. For instance, it is not even clear if the HEC is reporting to MoET and thus MoET has ultimate responsibility for higher education, or if MoET is only supposed to channel funding to HEC (and broker its parliamentary affairs) and thus HEC is the final word. Until this challenge of governance is resolved and the new government firmly commits to higher education as a priority, reform in this very important sector of education is unlikely to be feasible.
Designing Reform: A Systems ViewA chapter of this scope cannot offer a detailed blueprint for reform of the entire educational system in Pakistan. Nor should it – any blueprint must have the buy-in of all major stakeholders in Pakistan’s educational system, such as the government, political leaders and civil society. This is particularly true because any reform will require making important choices about how much effort to spend on different sectors of the education system, what problems to tackle within the sectors, how to address them and what results to expect from these efforts. What such a chapter can do, however, is to lay out the perspective educational reform must adopt, the broad principles it must consider, propose the ends it should meet and the chief means it could adopt.
Adopt a System Focus
At various times in Pakistan’s history, the pendulum of attention has swung from one sector of the education system (see Box 1) to another based on donor interest, prevailing economic theory (e.g. focusing on public versus private returns from investments in primary and higher education), or other political flavours of the day. For instance, in the 1990s donors focused primarily on school-level education to the neglect of higher education. In the 2000s, the government of Pakistan poured money into a dilapidated higher education system.
Education reformers in Pakistan must consider that the country does not have the luxury of focusing only on parts of the system. Each of the subsectors of the
system – primary/secondary schooling, higher education and vocational training – has a vital role. Each can expand opportunity for different cohorts of Pakistani youth, enabling them to contribute to Pakistan’s economic growth. It would, for instance, not be in the best interest of Pakistan to focus on school reform now and return to higher education 5 or 10 years down the road. It would also not be wise to neglect vocational training while focusing on the other two sector first. That said, each sector of the education system has its own constituencies, challenges and constraints. Therefore, the approach to mobilizing those constituencies, raising resources and addressing challenges will be very different.
Articulate Key Principles of Reform
Still, we believe some common reform design principles can be applied to all subsectors of the education system. First, any reform must be systemic, i.e. select a minimal set of areas for each subsector (such as governance, fiscal resources, human resources and curriculum) and address them simultaneously rather than omitting one. Of course, the nature of these areas and thus appropriate solutions will vary across the subsectors. For instance, governance reform for managing and monitoring of schools will likely be more focused on government bureaucracy. In universities, however, it may also encompass the often complicated structures of governance within institutions. Similarly, human resource development is very different for school teachers versus university faculty, in terms of resources required, the time needed and the eventual roles teachers and faculty are expected to fulfil.
Education and Skills 2.0: New Targets and Innovative Approaches46
Box 1: The Education SystemBy the system of education, we mean the collection of individual institutions that are involved in delivering formal education (public and private, for-profit and nonprofit, onsite or virtual instruction) and their faculties, students, physical infrastructure, resources and rules. We also include the institutions that are directly involved in financing, managing, operating or regulating such institutions (like government ministries and regulatory bodies, central testing organizations, textbook boards and accreditation boards). Finally, in an education system, we include the rules and regulations that guide the individual and institutional interactions within these institutions.
This description is not meant to strictly circumscribe what is and is not within the educational system. There will always be fuzzy areas where judgement will need to be exercised on whether an entity is or is not part of the educational system. For instance, NGOs and think tanks dedicated solely to educational advocacy, or private watchdog groups that focus mainly on education might be reasonably considered part of the educational system. In addition, the system is not closed to the outside. It is linked both on the input and output side to the labour market (faculty as inputs and students as outputs).
One way to view linkages in an educational system can be seen in a 2000 World Bank report on higher education in developing countries.23 An even more expansive notion of the educational system is employed in the new World Bank Education Strategy.24 There the education system is also defined to include employers, families of students and nonformal education. This inclusiveness is useful as it suggests reform mechanisms for the education system that can strengthen the demand side of education, where parents and civil society organize themselves to demand better planning, delivery and monitoring of their children’s education.
Second, standards of excellence must be tailored to purpose. Systems of education are like terrains, with peaks, valleys and vast plains. The notion of excellence at the system level is not definable in the same way as it might be for a particular class of institutions. This notion for the system must be defined as “fit for purpose”. An institution is excellent if it delivers well on the purpose for which it was designed, within the constraints it has. In that sense, design of any reform at the system level must recognize that imposing uniform standards of performance may work for subsets of the system, but not the whole system.
For instance, a private school may have the resources and the flexibility to admit only the brightest students to achieve world-class results, but a public school in a rural area may not, as its primary objective is access and affordability within the means it has. Holding them account-able to the same standards may be counter-productive and will in fact generally be infeasible. Similarly, in higher education, not all universities need to be world-class research universities. That would be beyond capacity for most countries, not just developing ones. A teaching university may be excellent if it graduates a large number of students with solid fundamentals, even if its faculty does not conduct substantial research. A vocational institute may be excellent if it graduates a large number of students who have no trouble obtaining interna-tional certification for their skills, even if it does not cover all vocational areas.
Third, implementation resources must be carefully nurtured and protected. This principle is particularly important because of the preciousness of implementation resources in Pakistan. Implementation eventually comes down to people – especially those with the motivation, skill, experience and stamina to steward the reform effort. Sometimes a promising reform effort fails if one or two key people exit. This is partly because of the difficulty of replacing talent in Pakistan and the high cost of learning for new participants to carry out reforms successfully in Pakistan’s environment. For this reason, it is important for political and civil society leaders to nurture implementers of reform over a reasonable period of time and recognize the pitfalls of attempting to replace teams before the ground gained in reform has been secured.
Since much of the primary and secondary education is handled by the government, two complementary approaches to strengthen implementers of reform would
be to identify and empower reformers within the government and give them the time and space to effect reforms in education; and/or bring into the government at very high levels of administration, a few highly talented and proven people from civil society or the corporate sector, with experience in reform, management, or education administration.
Define the Goals of Reform
Some of the ends any reform effort must seek to obtain are simple to describe and not controversial. Broadly, these must be to (a) increase enrolment, (b) decrease inequality across gender, income, location (urban/rural) and ethnicity, and (c) improve overall quality of education. This simple codification, appropriately interpreted, should apply to each sector of the education system (schooling, higher education and technical education).
Inequality deserves a special note as it is most likely to be overlooked in reform efforts and also because some of the means employed for addressing other ends may exacerbate the inequalities. For instance, an emphasis on private schooling as a major vehicle of policy may end up further disadvantaging girls in rural areas. Private schools are likely to be the last option for the poor and girls to catch up in rural areas. Poor families will forego private fees especially for girls, so private schools are unlikely to become major instruments of opportunity for poor rural girls. Areas such as these are where the state must take ownership of the problem.
In addition, there may also be other legitimate ends that reformers may seek to undertake, such as increasing tolerance and civic sense. But these are not measurable in the same sense as the ends listed above. Moreover, because explicit goals inevitably raise explicit challenges by interest groups, goals such as these are perhaps best weaved into the reform effort rather than made explicit.
Delimit the Key Means for Achieving Reform Goals
Given the daunting number of problems in Pakistan’s educational system, it is easy to get distracted by creating a laundry list of potential challenges and reforms. But such a strategy is unlikely to be informative. Reform processes can often dissipate their energies by tackling too many challenges (some of which are not strategically important) and by omitting one or more key areas (the absence of which causes the reform in the intended area to fail).
47Education and Skills 2.0: New Targets and Innovative Approaches
We believe that four areas are key to the development of an effective reform programme for the educational system as a whole and are systemic in the sense that none can be avoided without seriously hampering the outcomes of the reform. Broadly construed, these are: (a) governance (including federal and provincial bureaucracy as well as the appropriate public and private sector regulation), (b) fiscal resources (including efficient use of such resources), (c) human resource development (including incentives for teachers and faculty), and (d) curricular reform. In our view, none of these areas can be implemented without support from a subset of the other three areas. Appropriately interpreted, these areas are relevant to each sector of the education system. Below are some examples of what reform in these areas might entail, described mainly in terms of the school system.
Governance
Governance encompasses at least four related areas: (a) delineation of the authority and accountability for government bureaucracy and within educational institutions; (b) good functioning of regulatory and enforcement frameworks; (c) creation of new partnerships in the public–private–civil society sector; and (d) establishment of monitoring and evaluation mechanisms for the system.
At this time, the lines of authority and accountability at the government level are hopelessly confused. Recent constitu-tional changes (like the 18th amendment) have thrown the education bureaucracy at both federal and provincial levels into uncharted waters. It is imperative to quickly resolve this confusion, or reform will be impossible to even envision at the system level, let alone initiate.
Governance reform will have to include streamlined regulatory oversight of the private sector, without increasing the bureaucratic burden unnecessarily (which can also create opportunities for corruption) and not hampering the growth of the private sector (which is providing an invaluable service within the education system). The proliferation of many nongovernment service providers means an ever-increasing burden of coordination to ensure that the outcomes of public and private schools are compatible. As the private education sector has grown, so have concerns about increasing potential disparity between public and private education – such as by private schools “stealing away” rich and capable students (and the best teachers), leaving the public
schools with poor and underachieving children. Better coordination and oversight of private and public schools is needed so disparities do not reach unacceptable levels. If this is not done, at some point, the inequalities of access may necessitate legislative intervention as has recently happened in India, where 25% of the seats in private schools are now required to be reserved by law for children from disadvantaged families in the neighbourhood.
Governance reform should also focus on new ways of defining institutional partnerships between the public, private and civil society sectors. Here, some recent initiatives have shown promising results. For instance, the Pakistani government began a programme in 2005 in Punjab to expand access to low-cost private schools in a way that enhanced accountability. The Foundation Assisted Schools programme of the Punjab Education Foundation gave monthly per-student cash subsidies to schools, which had to waive tuition for all students so as to attract poor families and ensure that a minimum percentage of their students pass a biannual standardized academic test. An evaluation of this programme shows that these subsidies pushed schools to ensure better learning so that they kept their funding.25 Such a model may not be scalable to the entire country but its success offers a vital policy instrument in areas where it is feasible and desirable (such as where existing private schools have the capacity and the students from public schools have the ability to attend such schools).
Finally, any large education system risks failing to achieve its objectives if it lacks clearly stated standards for compliance and monitoring. One task for reform is to create a new, clearly defined set of standards to ensure that everyone working in the education system (planners, administrators, teachers and support personnel) understands the goals of the system as a whole and their individual responsibilities in reaching those goals. Standards, in turn, require accountability. Well-thought-out mechanisms to encour-age, and ultimately ensure, that all actors carry out their expected roles will need to be agreed upon and implemented. Creating and strengthening bureaucratic mechanisms for enforcing accountability are important, but so is strengthening the demand side of accountability. Emerging evidence indicates that disseminating timely information about schools’ perfor-mance to parents has the potential to produce better outcomes.26 Such possibili-ties should be seriously considered.
Fiscal Resources
Fiscal resources are a perennial problem and will remain so for the foreseeable future. The past few years have seen Pakistan’s economy average a 3–4% growth rate27 and double-digit inflation. As a result, for the first time in its history, Pakistan’s per capita income has dipped below that of India. For the last few years, national budgets have routinely managed deficits of around US$ 8–10 billion, which have been financed by borrowing or other foreign inflows.
The situation today is no different. In this environment, a significant expansion of the fiscal space for education will require a major sustained push, particularly as the resources needed for investment in large-scale energy projects are likely to take precedence. Still, it can be done, and what is more important is that existing resources can be used to create better performance in the education system. Better use of resources will also provide the impetus to mobilize more resources, as there are strong voices in Pakistan that highlight the ineffectiveness of simply pouring money into a dilapidated education system.28
Better use of resources will require rethinking the private–public–civil society partnership in schooling as well as in higher education. Emerging evidence indicates that private schools have better outcomes, in spite of their teachers sometimes having less formal teaching education than public school teachers, and being lower paid. However, their absentee rates are lower, and in A Dime a Day: The Possibilities and Limits of Private Schooling in Pakistan, Andrabi, Das and Khwaja find evidence that “increased effort” in private schools “may indeed overcome the problems of poor educational qualifications and training”. Sir Michael Barber’s report The Good News from Pakistan also suggests that private schools are generally less expensive on a per-student basis. Thus, channelling some public funds into these schools via targeted scholarships may offer economically disadvantaged families an opportunity to pursue a higher quality education at a lower cost to the public exchequer.
Education and Skills 2.0: New Targets and Innovative Approaches48
Still, the use of such partnerships will need to be judicious. Private schools are not a panacea, as evidence shows they mainly crop up in areas where there are public schools already. This implies that they reduce the public schools’ share of enrolment but do not necessarily increase total enrolment. More importantly, they are unlikely to create options in areas where girls or poor children lack access to school or have to travel far. This is an area where government cannot abdicate responsibility. Further, private schools have their own share of performance issues stemming from accountability.
Other, targeted uses of resources should also be considered to meet ends such as increased enrolment. For poor families who may not have the wherewithal to send their children to schools, demand-side subsidies may be an important instrument. For exam-ple, if Pakistan subsidizes school lunches, it could promote both better nutrition and higher rates of school attendance. And if mothers of the students actually do the cooking, it could create the collateral benefit of boosting local employment, while ensuring the quality of the lunches. Similarly, a requirement that students wear school uniforms can carry both educational benefits and spillover advantages (e.g. if local people make the uniforms and by virtue of that extra income gain extra economic stability). Programmes such as these can have promising outcomes, but in some settings have also led to undesirable consequences by increasing opportunities for corruption.
Human Resources
Development and retention of human resources are of course central to any reform effort. The former requires institutions and mechanisms of training, and the latter requires appropriate incentives to hire and retain quality teachers. Both will require significant choices to be made. For instance, a reform plan will need to consider development of teacher training institutes (and perhaps a graduate school of education). The setup of these institutes is itself a major development effort, at least at the scale Pakistan requires.
Revisiting the incentive structure for teachers will be an essential albeit complicated process. One aspect of incentives reform will be to rationalize the pay scales and perks of teachers with those of other civil servants. This will require a significant increase in recurring expenditures and will thus need to have the long-term backing of all political actors. The other aspects of incentives are linking pay with performance, a
usually volatile issue, and the ability to hire and fire teachers, currently virtually impossible in public schools.
Good systems can often also be run down by regressive bureaucracy personnel. To set good governance on a long-term track, much of the educational bureaucracy will also need to be retrained to come up to speed with global trends and standards.
Curriculum
Curriculum in Pakistani schools has long been a focus of criticism and has been blamed for engendering intolerance and rigidity. But efforts at reforming curriculum have often faced resistance when changes have been proposed to Islamic studies, history (particularly Pakistan Studies), Urdu, or literature. It is not clear if there is an organized lobby for resistance, but it is clear that most often, politicians have backed off for fear of negative publicity. These controversies erupt every few years. The most recent one was April 2013 when the Punjab government beat a hasty retreat when its new Urdu textbook was accused of being anti-Islam and anti-Pakistan.29
Part of the concern with curriculum is its content and part with the manner in which it is delivered. Like many other countries, Pakistan needs to move away from rote learning and toward an education system that stimulates students’ abilities to think, challenge and be creative. In studying science, for example, students need to be encouraged to apply logic and math to real-world phenomena. One way to counter rote learning is to link testing to curriculum rather than to specific textbooks. The other is to improve the quality of teachers. In addition, curricula need to expand so that they cover financial and health literacy and entrepreneurship. This cannot be done without competent teachers – another argument for why reform needs to be systemic rather than piecemeal.
Initiating Reform: Political and Institutional Challenges The first challenge in educational reform is to get serious system-level reform – rather than piecemeal or cosmetic initiatives – firmly on the government agenda and to get it endorsed with visible resolve. This is likely to be difficult because the new government takes charge at a time of other highly emotive and visible problems such as the economy, energy and security. The economy has seen double-
digit inflation in the last three years, and growth has been meagre in comparison with South Asian neighbours; energy riots are increasing; and growing sectarian violence and other security incidents are constantly in the news. Taken together, they distract the focus from long-term development as political parties instinc-tively understand that the return (in terms of votes) from investing in these problems is likely to be greater than investing in education. Visible resolve is also impor-tant. Even though Article 25(A) enshrines basic education as a fundamental right, and even though education was an election issue and the political parties were responsive in their manifestos, the long history of failed education reform in Pakistan should make reformers cautious in interpreting political declarations.
At the same time, reformers should also recognize the opportunity at hand for getting education reform onto the public agenda. Theories of agenda-setting suggest that problems are most likely to get onto the public agenda when three streams combine:30 (a) a problem stream (a longstanding and well-recognized problem), (b) a political stream (a fortuitous political change that opens the doorway for that problem to get onto the agenda); and (c) a policy stream (when a base of potential policy solutions is available, perhaps through previous work or through the availability of think tanks and consultants). The beginning of this chapter discussed how two of these, the problem stream and the political stream, are already aligned in Pakistan – as the problem of education is of emergency proportions, and the new political leadership is more aware and probably looking to cement its political mandate by delivering services that can translate into votes in the next election. There is also a growing body of evidence about efficacy of delivery in education from NGOs follow-ing best practice solutions. What remains is to effectively build momentum for educational change and create credible policy proposals that incentivize the political leadership to act. The most likely source for this activism is civil society, policy entrepreneurs such as members of think tanks and advocacy organizations etc.29 or political leaders who are delivery-conscious.
49Education and Skills 2.0: New Targets and Innovative Approaches
The second challenge in initiating reform is the institutional impasse created by the recent constitutional changes that have affected education. This impasse has left the government bureaucracy uncertain about who is responsible and has authority and accountability for different sectors of education. Resolving this uncertainty is crucial because actors will be reluctant to stake personal and political capital as long as it is unclear who can take credit from achievements in reform. Thus it will be extremely challenging to mobilize communities of reform and to build and maintain their momentum over a 5- to 10-year effort, a period of time that is likely to be required for reform. And it is unclear if the federal government can force all of the provinces to focus equally on education and to maintain a uniform push towards reform. But even after this impasse is resolved, the ease and difficulty of initiating education reform will vary greatly across Pakistan’s four provinces (see Box 2).
Box 2: How Reform Might Unfold in Pakistan’s ProvincesInitiating reform will be very different in the four provinces. For instance, in addition to having the most resources, Punjab’s government has the most well-established political mandate postelection (an outright two-thirds majority) and a continuity of leadership from the last government and is thus likely to have the easiest time in reform. By contrast, Balochistan, which has faced an almost full-blown insurgency and devastating sectarian attacks in the last few years, will find it much more difficult to focus on reform. Similarly, Khyber Pakhtunkhwa, the frontline province in the Afghan war, the site of a steady stream of attacks on girls’ education (even if in limited districts), and led by a coalition government with conservative partners, may find educational reforms a difficult proposition. Sindh is being governed by the party that held the federal government for the last five years, and it is not clear what agenda it will pursue provincially after its recent electoral loss (i.e. whether it will refocus on or retrench its policies on service delivery).
Sustaining Reform: Implementation ChallengesThe grand challenge of educational reform in Pakistan will be implementation. The problem in Pakistan’s educational system is not what needs to be done, but who will do it and how they will achieve their aims. As Sir Michael Barber31 points out in a recent report,32 everyone he spoke with in Pakistan before initiating a reform project for education agreed that the problem was implementation. Pakistan has had a long history of reports and plans, but appears to lack both the capacity and the serious intent to implement reforms. Even if there is intent, this lack of implementation capacity will be a major challenge to be addressed before and during any reform effort.
That is not to say it cannot be done, but it requires a certain political and personal resolve on the part of political leaders, the bureaucracy and civil society. Barber’s The Punjab School Reforms Roadmap, a project of the United Kingdom’s Depart-ment for International Development, is an emerging example (see Box 3).
Box 3: The Punjab School Reforms RoadmapSince its initiation in 2010, the Punjab School Reforms Roadmap has pushed for greater efficiency in urban schools and has led to the creation of Punjab’s Programming Monitoring and Implemen-tation Unit (PMIU), a multipurpose institution that accomplishes everything from data collection to teacher training. In addition, the Roadmap has funded and expanded the Punjab Education Founda-tion, which gives vouchers to poor students to enable them to attend private schools at no cost. It has also funded the creation of private schools where govern-ment education is lacking, and “bought out” all the slots in some low-cost private schools so that the school is free for local students. In addition, it has attempted to tackle the political nature of educational job appointments and to increase merit-based appointments and promo-tions of both government teachers and the local district-level officers who oversee education.
The government of Punjab has supported the Roadmap by creating a Punjab Education Sector Reform Programme under the Department of Education, which oversees the PMIU. Through this
unit, the government has brought new textbooks into its schools, recruited new teachers, collected data on the effectiveness of the Roadmap, and provided stipends for female students to help close the education gender gap.
Although there are questions about the success of the Roadmap that cannot be answered yet, particularly about the success it has claimed in increasing enrolment, it contains important lessons. The Roadmap has certainly been able to mobilize material and political resources, and it has rapidly scaled up. In that sense, it is an important example of the manner in which provincial governments and private education providers throughout Pakistan could move forward quickly to improve access to high-quality school education.
Implementation of education reform will also require great political skill, not just political will. Policy change, and its implementation, is driven at all stages by complex political interactions, but overwhelmingly policy literature focuses on the opaque notion of political will to explain why reform stalls. This notion is problematic for students and activists seeking to implement change.33 It suggests that the main challenge for reformers is to find an appropriately powerful political leader or a small group and just convince them to want reform. They can then exert their “will” to make it happen. If reform fails, then the leader or group did not have sufficient “will”. The rest of reform is viewed more as a technical matter: designing the right curriculum, agreeing on the right policies, and then political “will” can just make things happen.
The problem is that this is not the way reform works. What is technically feasible is often infeasible in practice even if top-level political leaders desire it. Interventions often have side-effects and raise unforeseen opposition.34 Well-intentioned reformers will need to recognize the different types of political skills needed to manage the reform process, which will help them interpret the reactions their actions may generate, and thus help them adapt their strategies. This will require: astute political analysis (assessing the intentions and potential actions of stakeholders), defining political strategies (an analysis of the effects of proposed interventions on the players, their power, their positions in response to the intervention and the resulting public perception), executing these strategies and adapting to unexpected responses.35
Education and Skills 2.0: New Targets and Innovative Approaches50
While these implementation and political skills are important for providers of education, they are only one arm of a strong mechanism for sustaining reform. The other arm is the demand side. As Shantayanan Devarajan of the World Bank notes,34 there are other important elements to maximizing the chance that reforms work. One of these is to empower the clients of the education system, the children and their families who stand to benefit directly from a quality education. Emerging evidence indicates that where the parents participate actively in their children’s education, educational out-comes improve. Devarajan reminds us that while it is difficult for government agencies to monitor teacher attendance and quality of instruction in rural areas, the student in the classroom and the parents who watch over them can. Another important consequence of increasing “client power” (as phrased in the 2004 World Development Report36) is that parents and civil society can organize and lobby to break that destructive nexus between politicians and public institutions that creates dysfunction, where politicians compromise the educational system for personal or party benefit (whether through teacher appointments for political reasons, or creation of ghost schools or other mechanisms). Thus while altering provider behaviour is important, increas-ing “client power” can contribute signifi-cantly to ensuring reforms are sustained.
Seizing an Opportunity for System-wide ChangeWhile the state of the educational system in Pakistan is dire and the gap between education providers and the aspirations of the people huge, we believe that a window of opportunity is now open for initiating system-level reform. It is urgent to seize this opportunity, because population dynamics will make education a graver problem in the next decade if immediate steps are not taken. It is also important to recognize that reform must tackle all sectors of the education system – primary/secondary, higher education and voca-tional education – as Pakistan does not have the luxury to delay reform in one sector until the other sectors improve. Of course, reforming the system poses a great challenge, but strong examples of success within Pakistan remind us that it can be done. This may be the time for public, private and philanthropic institutions and change-makers to pool their resourc-es and initiate lasting system-wide change, which some of them have achieved, at least partially, in their respective domains.
AcknowledgmentsThis chapter has benefited from comments and reviews by several people. In particular, the authors would like to thank: Benjamin Osher for valuable research assistance; Syed Babar Ali from Lahore University of Management Sciences (LUMS) Pakistan for his very helpful suggestions at a formative stage of this chapter; Brij Kothari from PlanetRead for his valuable comments and guidance; Mariam Chughtai from the Harvard Graduate School of Education for her thoughtful review of the first draft; and Laura Wallace for excellent editorial suggestions.
Endnotes1. F. Barrera-Osorio and D. Raju, “Evaluating public per-student
subsidies to low-cost private schools: Regression-discontinuity evidence from Pakistan”, Policy Research Working Paper 5638, The World Bank, 2011.
2. M. Lewis and M. Lockheed, Inexcusable Absence: Why 60 Million Girls Still Aren’t in School and What To Do About It, Washington DC: Center for Global Development, 2006, 38.
3. World Development Indicators 2013, The World Bank.
4. World Bank, “Youth skills training for employment in Pakistan” (web page), http://go.worldbank.org/NJN6OHFK80, 2013.
5. World Economic Forum, “Global competitiveness report”, http://reports.weforum.org/global-competitiveness-2011-2012/#=, 2012.
6. Children’s Global Network Pakistan, “25-A: Voices on implementation: Stakeholders’ divisional consultations on implementation of article 25-A in Punjab”, 2013.
7. For instance, spending on education declined as a percentage of GDP each year from 2008 onwards, from 2.9% in 2008 to 2.4% in 2010: World Development Indicators 2013 (online), World Bank.
8. Part of the Eighteenth Amendment to the Constitution of Pakistan passed in 2010.
9. For example: Zara Sochiye (Just Think) campaign by MKRF/Jang Group/GEO Television network, http://za.org.pk; Alif Ailaan campaign, http://www.alifailaan.pk.
10. A. Ailaan, “Politicians are responsible for education in Pakistan: Education campaigns”, press release, http://www.alifailaan.pk/politicians_are_responsible_for_education_in_pakistan_education_campaigns, 8 March 2013.
11. A. Ailaan, “District education ranking 2013 report”, http://www.alifailaan.pk/alif_ailaan_district_education_ranking_2013_report, 2013.
12. British Council Pakistan, Pakistan: The Next Generation, November 2009.
13. Pakistan Economic Forum, “Education panel report of Pakistan Economic Forum – II”, http://www.pbc.org.pk/assets/pdf/education_report.pdf, 2013.
14. World Economic Forum, The Human Capital Report, 2013.
15. The most recent data available for this indicator for Bangladesh are from 1990, when net primary enrollment was 73%.
16. Comparing Pakistan with Bangladesh, India and Indonesia is instructive because two are in South Asia (Bangladesh and India), two have predominantly Islamic populations (Bangladesh and Indonesia), and all have had comparable levels of GDP/capita at some point in the last few decades.
17. Z. Sathar and M. Sadiq, Struggling Against the Odds of Poverty, Access and Gender – Secondary Schooling for Girls, Ninth Annual Conference on Management of the Pakistan Economy. Human Capital Development for Sustained Economic Growth, Lahore School of Economics, 20 March 2013.
18. T Andrabi, J Das and A Khwaja, “What did you do all day: Maternal education and child outcomes”, The Journal of Human Resources, 2011, Vol. 47, No. 4.
19. J. Qureshi, “Additional returns to investing in girls’ education: Impact on younger sibling human capital”, Working paper, http://kellogg.nd.edu/events/calendar/fall2011/qureshi.pdf, 2012.
20. L. Begum, A. Islam and R. Smyth, “Girls' education, stipend programs and the effects on younger siblings' education”, http://www.iza.org/conference_files/worldb2012/islam_a8183.pdf, 2012.
21. E. Jimenez and J.-P. Tan, “Decentralized and private education: the case of Pakistan”, Comparative Education, 1987, Vol. 23, No. 2, 173–190.
22. http://www.amanfoundation.org/amantech.php.
23. World Bank, Higher Education in Developing Countries: Peril and Promise, The Task Force on Higher Education and Society, Washington DC: World Bank, 2000.
24. World Bank, Learning for All: Investing in People’s Knowledge and Skills to Promote Development, World Bank Group Education Strategy 2020, Washington DC: World Bank, 2011.
25. World Bank, “Pakistan: can low-cost private schools improve learning?”, Evidence to Policy, http://siteresources.worldbank.org/INTHDOFFICE/Resources/E2P_Pakistan.pdf, October 2012.
26. World Bank, “Are Kenyans being served? New data sheds light on health and education”, http://www.worldbank.org/en/country/kenya/publication/are-kenyans-being-served-well-new-data-sheds-light-on-public-service-delivery?cid=ISG_E_WBWeeklyUpdate_NL, 2013.
27. The growth rate of income per capita is considerably less, since population growth is about 1.5% per year.
28. Z. Salahuddin, “Old school”, The Friday Times, 12–18 July 2013, Vol. XXV, No. 22, http://www.thefridaytimes.com/beta3/tft/article.php?issue=20130712&page=22
29. Pervez Hoodbhoy, “Banning a textbook – the Punjab government panics”, The Express Tribune, 5 April 2013, http://tribune.com.pk/story/531509/banning-a-textbook-the-punjab-government-panics/.
30. J. Kingdon, Agendas, Alternatives, and Public Policies, 2nd edn, New York: Harper Collins, 1995.
31. Special representative on education for Pakistan, for United Kingdom’s Department for International Development.
32. M. Barber, “The good news from Pakistan”, http://www.reform.co.uk/content/20419/research/education/the_good_news_from_pakistan, 2013.
33. M. Reich, “The politics of reforming health policies”, IUHPE – Promotion & Education, 2002, Vol. IX/4.
34. S. Devarajan, “Deliverology and all that“, World Bank, Let’s Talk Development blog, http://blogs.worldbank.org/developmenttalk/deliverology-and-all, 2013.
35. A.M. Fox and M.R. Reich, “Political economy of reform”, in A.S. Preker et al. (eds), Scaling Up Affordable Health Insurance, Washington DC: World Bank, 2013.
36. World Bank, World Development Report 2004, Washington DC: World Bank, 2003.
51Education and Skills 2.0: New Targets and Innovative Approaches
The statistics are dismal. Worldwide, 57 million children who should be in primary schools are not1. Of those, 47% children are unlikely to ever enter school, only 27% are likely to enter school in the future and 26% were in school but left. Moreover, 200 million children remain illiterate despite completing primary school (Brown, undated, 2011 or 2012). And globally, 743 million people aged 15 years and above will still be illiterate in 2015, the deadline for the Millennium Development Goals (MDGs) and two-thirds of them will be women.2
Complicating matters is that these deficits are concentrated in a handful of countries. For instance, 12 countries with at least one million children out of primary school account for 60% of the global out-of-school children (UIS, 2012) – Nigeria (10.5 million), Pakistan (5.1 million), China (4.3 million), Ethiopia (2.4 million), India (2.3 million), Afghanistan (2.1 million), Bangladesh (1.8 million), Philippines (1.5 million), Côte d’Ivoire (1.2 million), Burkina Faso (1.2 million), Niger (1.1 million) and Kenya (1 million).
As a result, generations of children in these and many other countries have grown up to become youth and adults who cannot read, say, a newspaper headline, often despite schooling. Have they missed the boat completely or are there some promising innovations and new pathways to adequately prepare this most challenging group for lifelong learning? How can we ensure that low-income populations get access to the preparation they need to benefit from the new learning opportunities served up by the communications’ revolution?
This chapter builds on a central argument that in an increasingly connected, networked, information- and knowledge-driven world, quality reading, writing and numeracy skills have become an even more critical foundation for ensuring access to a rapidly emerging array of solutions for lifelong self-directed learning. While there are worthy video- and audio-based approaches that have attempted to overcome certain access barriers stemming from a lack of quality
functional literacy, and are a necessary part of the solution mix, they nevertheless leave functional illiterates at a widening disadvantage.
In recent years, many countries have succeeded in getting large numbers of children into school through a combina-tion of legislation and incentives, under-scoring that the global push for universal primary education has paid off. Indeed, global primary school net enrolment went up from 83% in 2000 to 90% in 2011.3 But they have not always succeeded in imparting basic literacy skills to children who may have attended even five or more years of school. To be certain, the quality of literacy education has to improve in schools to achieve minimum expecta-tions. But equally important is what a child, whether formally in or out of school, also learns complementarily, indepen-dently or separately, outside school. Simply, more waking hours are spent outside school even when one is a student. The scale of the challenges requires that new pathways to learning are true breakthroughs. Incremental progress or boutique projects that work in limited contexts are insufficient.
The unfolding communication and digital revolution in learning is massive but still a distant dream for the masses. The digital education revolution has so far mostly favoured those at the relative upper echelons of the education ladder, or anyone with a good foundation in and access to learning. Innovative and exciting pathways to learning are rapidly being paved for the education “haves”. There is little doubt that some day it will also benefit the “have nots”. But for that to happen, the educationally deprived will somehow need to find themselves at least on connectors leading to the emerging new pathways to learning.
At a minimum, connectors for the base would include broadband access, quality functional literacy and English-language proficiency. Hard connectors like quality broadband are a technology challenge that is relatively easier to overcome. The number of mobile subscriptions already matches the number of people on this planet (over 7 billion).4 As the cost of technology continues on a downward spiral, by 2015, 80% of handsets are expected to be Internet-enabled smartphones, tablets or hybrid phablets.5 However, soft connectors like quality functional literacy, English-language proficiency and alternative pathways to a basic quality foundation for learning may take decades more to deliver if we fail to explore promising new approaches.
This chapter looks at innovations in education that build new connectors, or expand poor ones, to the emerging pathways to education and learning that the communication revolution is making possible. The good news is that these connectors can give everyone a second, third, and perhaps lifelong opportunity to learn or educate oneself. The reality check is that building these connectors will involve tackling a complex set of challenges. The best hope is to start with a candid assessment of the scale of the problem and then pursue an open-minded consideration of proven, culturally adaptable, scalable and sometimes, out-of-the-box solutions.
Challenge 1: How Do We Assess the Quality of Functional Literacy in the Population?Global rankings are sometimes key drivers for policy action. But because many developing nations do not measure the quality of their basic education, they are unable to benchmark their own relative progress on quality achievement and where they rank with respect to other nations in functional literacy – that is, the ability to read and make sense of, a newspaper in any language – as opposed to “nominal literacy”, thought of as limited alphabetic familiarity. In an effort to turn this situation around, two initiatives stand out. One civil society initiative excels in measuring the quality of reading development among children from an early stage in a population of over one billion. Another is an international initiative that does the same in an adult population.
India’s Annual Status of Education Report (ASER)
Since 2005, Pratham, a nongovernmental organization (NGO), has been implement-ing India’s Annual Status of Education Report (ASER), across all districts, primarily focused on rural areas.6 What it gets right is an early measure of basic reading and numeracy achievement, through Grade 5, with a simple tool. To assess reading achievement, the tool measures a school child’s ability to read simple text elements in their language and in English: letters, words, a very simple paragraph pitched at Grade 1 level and a story pitched at Grade 2 level. For maths, the tool measures one-digit and two-digit number recognition, two-digit subtraction with carry over and simple three-digit by one-digit division.
Chapter 6: Better Late Than NeverBrij Kothari
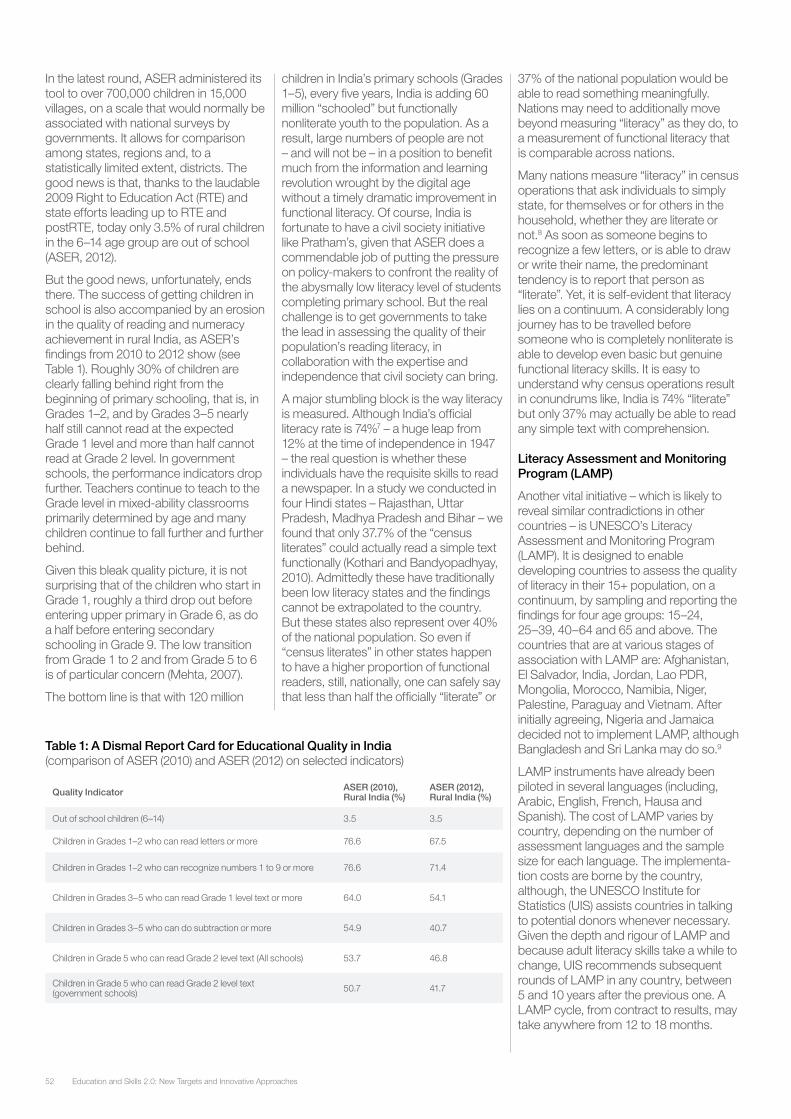
Education and Skills 2.0: New Targets and Innovative Approaches52
In the latest round, ASER administered its tool to over 700,000 children in 15,000 villages, on a scale that would normally be associated with national surveys by governments. It allows for comparison among states, regions and, to a statistically limited extent, districts. The good news is that, thanks to the laudable 2009 Right to Education Act (RTE) and state efforts leading up to RTE and postRTE, today only 3.5% of rural children in the 6–14 age group are out of school (ASER, 2012).
But the good news, unfortunately, ends there. The success of getting children in school is also accompanied by an erosion in the quality of reading and numeracy achievement in rural India, as ASER’s findings from 2010 to 2012 show (see Table 1). Roughly 30% of children are clearly falling behind right from the beginning of primary schooling, that is, in Grades 1–2, and by Grades 3–5 nearly half still cannot read at the expected Grade 1 level and more than half cannot read at Grade 2 level. In government schools, the performance indicators drop further. Teachers continue to teach to the Grade level in mixed-ability classrooms primarily determined by age and many children continue to fall further and further behind.
Given this bleak quality picture, it is not surprising that of the children who start in Grade 1, roughly a third drop out before entering upper primary in Grade 6, as do a half before entering secondary schooling in Grade 9. The low transition from Grade 1 to 2 and from Grade 5 to 6 is of particular concern (Mehta, 2007).
The bottom line is that with 120 million
children in India’s primary schools (Grades 1–5), every five years, India is adding 60 million “schooled” but functionally nonliterate youth to the population. As a result, large numbers of people are not – and will not be – in a position to benefit much from the information and learning revolution wrought by the digital age without a timely dramatic improvement in functional literacy. Of course, India is fortunate to have a civil society initiative like Pratham’s, given that ASER does a commendable job of putting the pressure on policy-makers to confront the reality of the abysmally low literacy level of students completing primary school. But the real challenge is to get governments to take the lead in assessing the quality of their population’s reading literacy, in collaboration with the expertise and independence that civil society can bring.
A major stumbling block is the way literacy is measured. Although India’s official literacy rate is 74%7 – a huge leap from 12% at the time of independence in 1947 – the real question is whether these individuals have the requisite skills to read a newspaper. In a study we conducted in four Hindi states – Rajasthan, Uttar Pradesh, Madhya Pradesh and Bihar – we found that only 37.7% of the “census literates” could actually read a simple text functionally (Kothari and Bandyopadhyay, 2010). Admittedly these have traditionally been low literacy states and the findings cannot be extrapolated to the country. But these states also represent over 40% of the national population. So even if “census literates” in other states happen to have a higher proportion of functional readers, still, nationally, one can safely say that less than half the officially “literate” or
37% of the national population would be able to read something meaningfully. Nations may need to additionally move beyond measuring “literacy” as they do, to a measurement of functional literacy that is comparable across nations.
Many nations measure “literacy” in census operations that ask individuals to simply state, for themselves or for others in the household, whether they are literate or not.8 As soon as someone begins to recognize a few letters, or is able to draw or write their name, the predominant tendency is to report that person as “literate”. Yet, it is self-evident that literacy lies on a continuum. A considerably long journey has to be travelled before someone who is completely nonliterate is able to develop even basic but genuine functional literacy skills. It is easy to understand why census operations result in conundrums like, India is 74% “literate” but only 37% may actually be able to read any simple text with comprehension.
Literacy Assessment and Monitoring Program (LAMP)
Another vital initiative – which is likely to reveal similar contradictions in other countries – is UNESCO’s Literacy Assessment and Monitoring Program (LAMP). It is designed to enable developing countries to assess the quality of literacy in their 15+ population, on a continuum, by sampling and reporting the findings for four age groups: 15–24, 25–39, 40–64 and 65 and above. The countries that are at various stages of association with LAMP are: Afghanistan, El Salvador, India, Jordan, Lao PDR, Mongolia, Morocco, Namibia, Niger, Palestine, Paraguay and Vietnam. After initially agreeing, Nigeria and Jamaica decided not to implement LAMP, although Bangladesh and Sri Lanka may do so.9
LAMP instruments have already been piloted in several languages (including, Arabic, English, French, Hausa and Spanish). The cost of LAMP varies by country, depending on the number of assessment languages and the sample size for each language. The implementa-tion costs are borne by the country, although, the UNESCO Institute for Statistics (UIS) assists countries in talking to potential donors whenever necessary. Given the depth and rigour of LAMP and because adult literacy skills take a while to change, UIS recommends subsequent rounds of LAMP in any country, between 5 and 10 years after the previous one. A LAMP cycle, from contract to results, may take anywhere from 12 to 18 months.
Quality Indicator ASER (2010), Rural India (%)
ASER (2012), Rural India (%)
Out of school children (6–14) 3.5 3.5
Children in Grades 1–2 who can read letters or more 76.6 67.5
Children in Grades 1–2 who can recognize numbers 1 to 9 or more 76.6 71.4
Children in Grades 3–5 who can read Grade 1 level text or more 64.0 54.1
Children in Grades 3–5 who can do subtraction or more 54.9 40.7
Children in Grade 5 who can read Grade 2 level text (All schools) 53.7 46.8
Children in Grade 5 who can read Grade 2 level text (government schools) 50.7 41.7
Table 1: A Dismal Report Card for Educational Quality in India (comparison of ASER (2010) and ASER (2012) on selected indicators)
53Education and Skills 2.0: New Targets and Innovative Approaches
So far UIS has worked mostly with governments directly and international organizations such as the Organization of Ibero-American States (OEI) to implement LAMP. Businesses and civil society institutions have served as service providers but not implementers of LAMP. However, if a business or civil society institution is interested in implementing LAMP in a country, independently of the government, UIS is open to exploring this possibility but would still need the government’s consent since UNESCO’s larger mandate is to provide support to member states.
Governments that may not be willing to implement LAMP or ASER-like surveys may still be willing to consent to corporations or civil society institutions taking the lead. Bringing massive quality deficits in functional literacy into the national consciousness, with some independence, depth and precision, is a critical first step in galvanizing action.
ASER’s strength is that it alerts policy-makers to the quality of functional literacy at an early stage of primary education. Any improvements at that stage (and the earlier the better) would have the maximum long-term benefits. With UIS’ backing, LAMP’s strength is that it gets nations’ buy-in to assess the quality of literacy in their youth and adult population. However, developing nations have yet to go along with an assessment in a comparative framework that could result in a ranking of participating nations – for instance, the Programme for International Student Assessment (PISA). PISA results in a ranking of participating nations’ performance among 15-year-olds in reading, mathematics and science, but it is attractive mainly to developed nations.
Developing nations would benefit from a sufficiently early assessment of the quality of reading. For most nations, Grade 5 would likely be an acceptable stage by which to aim for basic functional literacy for all. To achieve this goal, two assessment points can be suggested. The first, at the end of Grade 2 to allow for early diagnosis and individualized (or systemic) intervention as necessary before it is too late, and the second, by Grade 5 to assess the effectiveness of that intervention. Like PISA, this assessment could ideally be standardized to allow for cross-national comparison and international rankings to spur policy action.
Challenge 2: How Do We Raise the Quality of Functional Literacy, at a Mass Level?It is sometimes argued that the challenge of overcoming illiteracy is really a challenge of having all children start and complete primary schooling. The assumption is that this is sufficient to acquire basic functional literacy. The reality, as ASER has shown, is that primary schooling is necessary but far from sufficient at present quality levels. However, primary education results in high levels of official “literacy” because, as soon as children are enrolled in school, they begin to be reported as “literate”.
An innovation that has the potential to move large numbers of people from nominal “literacy” to quality functional literacy is Same Language Subtitling (SLS).10 The SLS innovation is simply the idea of subtitling audio-visual content in the “same” language as the audio. Word for word, what you hear is what you read. It is built on the principle that literacy skills must be reinforced and practised over a sustained and sufficiently long period before they can become functional first and then irreversible.
Same Language Subtitling: Toward Functional Literacy for a Billion
Take the case of India, which is home to a staggering 273 million illiterate people – or one out of every three in the world (Census 2011). Moreover, studies indicate that over half the 778 million officially “literate” people (Census 2011) are actually weak-literates who cannot, for example, read a newspaper. That said, television has a larger-than-life presence in India’s entertainment landscape, marked by 150 million TV households and 750 million viewers, with each viewer watching an average of 150 minutes per day. TV programming is dominated by content from Bollywood, India’s thriving multilin-gual film industry, which produces 1,000 films and by implication 5,000 film songs a year. Film songs tend to enjoy an extend-ed shelf-life on TV, where they are watched with lifelong passion by every-one, including most literates, weak-liter-ates and nonliterates. By implementing SLS on existing Bollywood film songs on TV, the Indian Institute of Management, Ahmedabad (IIM-A) and PlanetRead (a nonprofit) became the first two institutions in the world to leverage the power of SLS on mainstream television for mass literacy. The individual elements – Bollywood, subtitling and television – are not new.
However, the combination of these elements for mass reading reinforcement, based on popular entertainment, is a novel approach. SLS makes reading an inescapable and automatic outcome of everyday television consumption, producing lifelong benefits. SLS for mass literacy was conceived in 1996 and explored initially as an academic research project. At various sites – railway stations, bus stops, villages and slums – two TV sets were set up, both playing the exact same songs, one with the lyrics subtitled in the same language and the other without. Nine out of 10 people preferred to watch the songs with the subtitles. This was an early but critical finding because SLS could not have a future on main-stream TV if viewers did not approve of it.
The first randomized control study was set up with three groups of children in a government-run school serving low-income children (Kothari et al., 2002). The baseline tests confirmed that all three groups’ average reading scores were comparable. One group was regularly exposed to film songs with SLS, another group saw the songs without subtitles, and a third group saw nothing. The reading exercises used in the baseline were readministered after three months. The group exposed to SLS was found to be measurably further along in decoding skills (i.e. the ability to convert text into sound).
Supported with these early findings – that viewers overwhelmingly liked SLS on Bollywood and that it led to reading skill improvement – all the state and private television networks in India were ap-proached to persuade them to try SLS on film songs. A couple of networks that did entertain a conversation were unable to overcome the force of their own convic-tion that SLS would hurt their ratings. As it turns out, SLS actually improved the ratings by an average of 15%. Led by an open-minded director, the state broad-caster in Gujarat allowed SLS on one of its film song programmes, resulting not only in improved ratings but also a study that, for the first time, was able to measure the impact of SLS on reading skills in broad-cast (Kothari et al., 2004).
If networks could not immediately see SLS as a potential enhancer of the entertainment value of film songs, many educators, too, had difficulty in being open to the concept. Subsequently, a four-state study for which the data were independently collected by the Nielsen-ORG Center for Social Research, found that exposure to 30 minutes of SLS per week, in parallel with five years of

Education and Skills 2.0: New Targets and Innovative Approaches54
schooling, increased the functional literacy rate of rural children from 25% to 56%. Self-reported newspaper reading among youth and adults went up from 34% to 70%. SLS further contributed positively to writing skills.11
Since 2006, SLS has been implemented on 10 weekly half-hour song-based TV programmes, in as many languages. On Doordarshan, India’s national and state television network, with an annual budget of US$ 200,000, the SLS project is delivering 30 minutes of weekly reading practice to 200 million weak-reading TV viewers. On a nationally telecast Hindi programme, and because of the large Hindi-speaking population and viewership, every US dollar spent each year on SLS effectively delivers regular reading practise to over 5,000 people.
IIM-A and PlanetRead are now on course to deliver regular reading practice to all the 750 million TV viewers in India at present, and growing rapidly. More than half the viewers are also weak-readers. The goal is to implement SLS on all songs on TV in India, in all languages, through national policy. The strategy is to scale up in India first and let that speak as a model for expansion to other countries, especially in South Asia and Sub-Saharan Africa, on popularly watched song-based programming, in local languages. The latest update in this developing narrative is that the Broadcasting Corporation of India (Prasar Bharati), the national TV network (Doordarshan) and the Planning Commission have supported, in principle, the scaling up of SLS nationally.
The SLS story would be incomplete without a mention of the enormous systemic resistance that has dogged it for quite some time. As simple an innovation as it is, backed by research, the journey from idea to possible national scale-up is in its 17th year. But with the help of policy champions within the government, the SLS innovation is close to policy acceptance.
SLS is expected to make it increasingly difficult for anyone with a modicum of letter recognition ability and TV access to remain functionally illiterate. From the very beginning of primary schooling, as the letters are picked up in school, they will automatically get practised at home the same day, as an integral part of entertainment such as song-based programmes and/or movies (most of which have 5–6 songs). Home-based practice would continue throughout life, well after the end of formal schooling. For whatever reason, if a child drops out of school, say before becoming functionally
literate, inescapable reading practice would still continue as a by-product of entertainment. Those in their youth and adulthood who did not attain functional literacy but still have cognitive traces of letter familiarity – perhaps dormant through disuse – can be expected to experience a revival through exposure, effortless reinforcement and steady improvement of literacy skills. For the functionally literate too, besides reading practice, SLS provides a karaoke-like experience known to enhance the entertainment and interactive value of song-based TV programming.
Inescapable reading practice as an everyday part of entertainment, along with primary school, has proven to be an effective pathway for the attainment of quality functional literacy by Grade 5. A strong SLS presence on TV has the potential to considerably increase the number of children continuing longer in school and learning and reading more, in and out of school. With some imagination and political will, assured quality functional literacy skills are achievable for most.
Challenge 3: How Do We Create Alternative Pathways to Learning for School Dropouts to Give Them an Additional Chance at Learning or a Career?Another set of interventions is needed to catch those who drop out along the way to graduation. In this area, a range of educational innovations – like Questscope from Jordan, Yoza from South Africa and Tostan from Senegal – offer additional pathways to learning.
Questscope from Jordan
Prior to 1988, school dropouts in Jordan lacked a clear path to a future built on an educational foundation. In school their common experiences were marked by strained relationships with school authorities and peer violence. After leaving school prematurely, many youth, especially males aged 14 and older, were prone to substance abuse and unhealthy relationships within their own families and with authorities in juvenile services.
As a response to this bleak outlook for youth, Dr Curt Rhodes founded Questscope, a nonformal-education (NFE) programme that has grown into a unique collaboration with Jordan’s Ministry of Education (MoE). It was
shaped by his experience in the region, first as assistant dean in the School of Public Health at the American University of Beirut and then as a volunteer during the 1982 invasion of West Beirut helping civilians who were wounded and ill.
Questscope offers an estimated 100,000 school dropouts – which include more males (55%) than females (45%) – a second chance at vocational opportunities and a pathway to formal college education.12 Its work and lessons are instructive because of the paucity of good programmes that can or have been scaled up in any country that give dropouts a second chance.13 For one, that requires a high degree of cooperation between the government, civil society and the private sector.
NFE in Jordan targets males up to age 18 and females up to 22 who have not completed 10th grade and have been out of school for over 365 days. This level was chosen because in Jordan, without a 10th-grade education, a young person cannot enrol in a vocational or technical (Voc/Tech) diploma course or earn a formal diploma that could open doors to professional career advancement and higher salary options. For that reason, Questscope, with buy-in from Jordan’s MoE, designed a general education equivalence diploma (GED), an accredited certificate of completion equivalent to the first 10 years of compulsory education. The GED creates a number of pathways for young school dropouts: (a) enrolment in Voc/Tech diploma courses, leading to the starting of small businesses or better jobs; (b) the possibility of taking a placement test to reintegrate into the formal education system (FES) in 10th grade, depending on the placement score; and (c) the option of continuing to 12th grade and then a university degree, which some have obtained.
Irrespective of the school grade before dropout, Questscope is able to fast-track a school dropout to 10th-grade equivalence in three eight-month cycles, each organised around content/learning oriented to Grades 1–4, 5–7 and 8–10 respectively. If a learner passes the test for promotion to Grade 5, they can skip Cycle One, but not Cycles Two and Three. The hallmark of the latter two cycles is the attention paid to developing critical consciousness skills and interacting with adults and peers, requiring a minimum of 16 months with minimum 40% attendance but recommended at 60%. Around 50–60% youth enrolled in Questscope complete all three eight-month cycles.

55Education and Skills 2.0: New Targets and Innovative Approaches
The pedagogy in all cycles is reflected in Questscope’s copyrighted, Participatory Learning Methodology (PLM®) publications. They draw upon Paulo Freire’s theory of adult learning through an empowerment-based approach that builds mutual trust and respect between youth and adults, wherein both recognize the other as an equal and important partner. While “youth development” programmes focus broadly on youth skills, Questscope’s youth empowerment approach additionally supports the involvement of youth in shared decision-making and leadership processes.
Questscope’s PLM® and NFE differ from traditional education in that they are conceived as a “social” activity. Adult facilitators and youth are both co-learners and co-teachers. Youth drive learning topics, activities and group expectations, with adults helping to build youth’s confidence and skills to contribute in self-fulfilling ways. Indeed, a key insight of Questscope is that relationships with significant adults are a key factor in youth empowerment. The theory of change suggests that youth who practise and develop such attitudes and skills in the programme eventually transfer them to other aspects of life, including work, family and society.
One of the two keys to achieving the fast track to 10th-grade equivalence was MoE’s willingness to review curriculum requirements and hone the content of the textbooks to reflect the minimum standards for which certification could be granted. The other key was the willingness of teachers drawn from the FES to adopt in Questscope a completely different teaching methodology. They became, as Rhodes described, “leaders of dialogue, co-learners and facilitators of processes, not masters of didactics, so that students could explore, interact with adults and their peers, and learn how to learn”. Once the social environment moved from authoritarian to welcoming in nature, and relationships created learning opportunities for everyone, “students” learned faster and “teachers” guided that learning better.
Besides Jordanian youth, Questscope’s NFE programmes have benefited Iraqi student refugees in Jordan, disadvan-taged and impoverished by war. In Syria, its programmes are located in a juvenile correction facility.14 In Sudan, children were drawn from displaced populations owing to the civil war between North and South Sudan and in Darfur. In Yemen, children from marginalized social groups have enrolled. Since first implemented in
Jordan, Questscope’s NFE has benefited approximately 10,000 youth. About a third of them were rehabilitated into FES, a third resettled and a third are currently enrolled.
Yoza from South Africa
South Africa is a book-poor country. In 2006, 51% of households owned no leisure books and in 2009 only 7% of public schools had functioning libraries of any kind – one reason for low literacy scores at school and the absence of a culture of reading. Yet it is a mobile phone-rich country, with a penetration of more than 100% of the population. Mobile data infrastructure is widespread, and data costs, while not cheap, are affordable enough for low-bandwidth browsing. Most young people, especially in urban areas, can access the Internet through a mobile phone that they own or have access to. While smartphones are on the rise, most youth use “feature” phones, which can get online but still have very small screens and number-only keypads.
Out of this book-poor, but mobile phone-rich context, the m4Lit (mobile for literacy) project, as it was initially known, had its genesis. Today, this project, now known as Yoza, demonstrates that mobile phones offer a new way to bring reading content to a much broader audience (see Box 1).
Box 1: Spreading the Word through Mobile Phones in South AfricaLaunched in 2009, with funding from the Shuttleworth Foundation, the m4Lit project, as it was known then, sought to investigate whether teenagers in South Africa would read stories – not just SMS or instant messages – on their mobile phones. To gauge interest, a mobile novel, or short ebook, called Kontax was published in English and isiXhosa, an indigenous language. The uptake among young South Africans was significant and, not long thereafter, another Kontax story followed. In seven months both stories were read over 34,000 times on mobile phones, over 4,000 comments were left by readers, and over 4,000 entries were received in the writing competitions. Readers requested more stories and in different genres, not just the teen adventure style of Kontax.
Based on this interest, Yoza Cellphone Stories15 – or Yoza for short – was launched. This library of short stories, poems and classic literature published on mobile phones can be accessed through a web browser or via MXit,16 a popular mobile instant messaging platform started in South Africa. Today the site has over 30 m-novels, 18 poems and five Shakespeare plays. A wide range of genres includes romance (the most popular), teen issues (like safe sex and HIV/AIDS) and soccer. When initially published, some stories are serialized with a new chapter released daily.
A key feature of Yoza is interactivity: users can comment, vote, enter writing competitions and review the stories. Another feature is its low cost: users need to pay data download charges to their mobile network operator (the content itself is free), but since the stories are short, the data consumption is very low. The average data charge for a chapter is less than 1 Euro cent. Moreover, all of the content is either openly licensed as Creative Commons or in the public domain. In its first two and a half years, Yoza users have read over 575,000 stories, poems and plays; left over 50,000 comments; and cast more than 44,000 votes on chapters. The number of unique visitors was over 220,000.
Yoza has shown that mobile phones represent a significant new medium for making reading content available more broadly and to engage readers with voting and commenting. Mobile phones, or other mobile devices such as tablets, are a viable distribution platform for e-books that is instant and vastly more cost effective than traditional distribution of print books. While print has its place (a book does not run out of battery life or need to be connected to the Internet), e-books accessed via mobile platforms are an exciting complement and, in some places, the only way to spread the word.Contributed by Steve Vosloo, founder of Yoza Cellphone Stories.
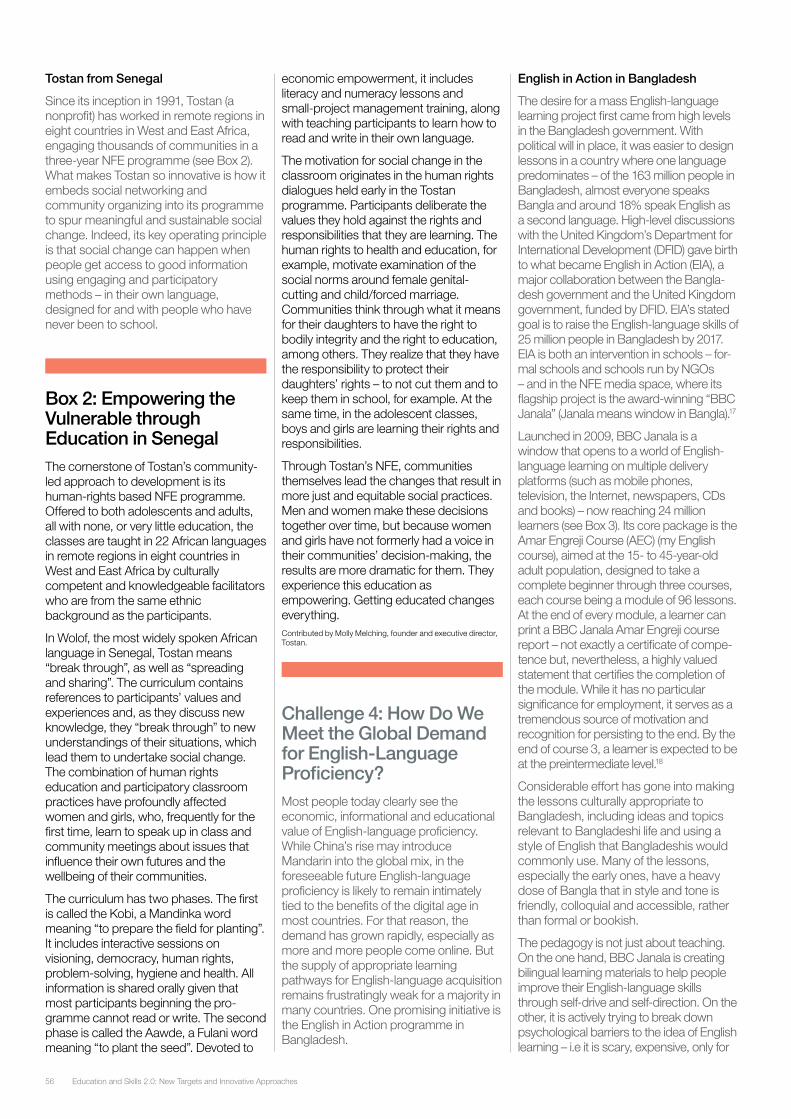
Education and Skills 2.0: New Targets and Innovative Approaches56
Tostan from Senegal
Since its inception in 1991, Tostan (a nonprofit) has worked in remote regions in eight countries in West and East Africa, engaging thousands of communities in a three-year NFE programme (see Box 2). What makes Tostan so innovative is how it embeds social networking and community organizing into its programme to spur meaningful and sustainable social change. Indeed, its key operating principle is that social change can happen when people get access to good information using engaging and participatory methods – in their own language, designed for and with people who have never been to school.
Box 2: Empowering the Vulnerable through Education in SenegalThe cornerstone of Tostan’s community-led approach to development is its human-rights based NFE programme. Offered to both adolescents and adults, all with none, or very little education, the classes are taught in 22 African languages in remote regions in eight countries in West and East Africa by culturally competent and knowledgeable facilitators who are from the same ethnic background as the participants.
In Wolof, the most widely spoken African language in Senegal, Tostan means “break through”, as well as “spreading and sharing”. The curriculum contains references to participants’ values and experiences and, as they discuss new knowledge, they “break through” to new understandings of their situations, which lead them to undertake social change. The combination of human rights education and participatory classroom practices have profoundly affected women and girls, who, frequently for the first time, learn to speak up in class and community meetings about issues that influence their own futures and the wellbeing of their communities.
The curriculum has two phases. The first is called the Kobi, a Mandinka word meaning “to prepare the field for planting”. It includes interactive sessions on visioning, democracy, human rights, problem-solving, hygiene and health. All information is shared orally given that most participants beginning the pro-gramme cannot read or write. The second phase is called the Aawde, a Fulani word meaning “to plant the seed”. Devoted to
economic empowerment, it includes literacy and numeracy lessons and small-project management training, along with teaching participants to learn how to read and write in their own language.
The motivation for social change in the classroom originates in the human rights dialogues held early in the Tostan programme. Participants deliberate the values they hold against the rights and responsibilities that they are learning. The human rights to health and education, for example, motivate examination of the social norms around female genital-cutting and child/forced marriage. Communities think through what it means for their daughters to have the right to bodily integrity and the right to education, among others. They realize that they have the responsibility to protect their daughters’ rights – to not cut them and to keep them in school, for example. At the same time, in the adolescent classes, boys and girls are learning their rights and responsibilities.
Through Tostan’s NFE, communities themselves lead the changes that result in more just and equitable social practices. Men and women make these decisions together over time, but because women and girls have not formerly had a voice in their communities’ decision-making, the results are more dramatic for them. They experience this education as empowering. Getting educated changes everything.Contributed by Molly Melching, founder and executive director, Tostan.
Challenge 4: How Do We Meet the Global Demand for English-Language Proficiency?Most people today clearly see the economic, informational and educational value of English-language proficiency. While China’s rise may introduce Mandarin into the global mix, in the foreseeable future English-language proficiency is likely to remain intimately tied to the benefits of the digital age in most countries. For that reason, the demand has grown rapidly, especially as more and more people come online. But the supply of appropriate learning pathways for English-language acquisition remains frustratingly weak for a majority in many countries. One promising initiative is the English in Action programme in Bangladesh.
English in Action in Bangladesh
The desire for a mass English-language learning project first came from high levels in the Bangladesh government. With political will in place, it was easier to design lessons in a country where one language predominates – of the 163 million people in Bangladesh, almost everyone speaks Bangla and around 18% speak English as a second language. High-level discussions with the United Kingdom’s Department for International Development (DFID) gave birth to what became English in Action (EIA), a major collaboration between the Bangla-desh government and the United Kingdom government, funded by DFID. EIA’s stated goal is to raise the English-language skills of 25 million people in Bangladesh by 2017. EIA is both an intervention in schools – for-mal schools and schools run by NGOs – and in the NFE media space, where its flagship project is the award-winning “BBC Janala” (Janala means window in Bangla).17
Launched in 2009, BBC Janala is a window that opens to a world of English-language learning on multiple delivery platforms (such as mobile phones, television, the Internet, newspapers, CDs and books) – now reaching 24 million learners (see Box 3). Its core package is the Amar Engreji Course (AEC) (my English course), aimed at the 15- to 45-year-old adult population, designed to take a complete beginner through three courses, each course being a module of 96 lessons. At the end of every module, a learner can print a BBC Janala Amar Engreji course report – not exactly a certificate of compe-tence but, nevertheless, a highly valued statement that certifies the completion of the module. While it has no particular significance for employment, it serves as a tremendous source of motivation and recognition for persisting to the end. By the end of course 3, a learner is expected to be at the preintermediate level.18
Considerable effort has gone into making the lessons culturally appropriate to Bangladesh, including ideas and topics relevant to Bangladeshi life and using a style of English that Bangladeshis would commonly use. Many of the lessons, especially the early ones, have a heavy dose of Bangla that in style and tone is friendly, colloquial and accessible, rather than formal or bookish.
The pedagogy is not just about teaching. On the one hand, BBC Janala is creating bilingual learning materials to help people improve their English-language skills through self-drive and self-direction. On the other, it is actively trying to break down psychological barriers to the idea of English learning – i.e it is scary, expensive, only for
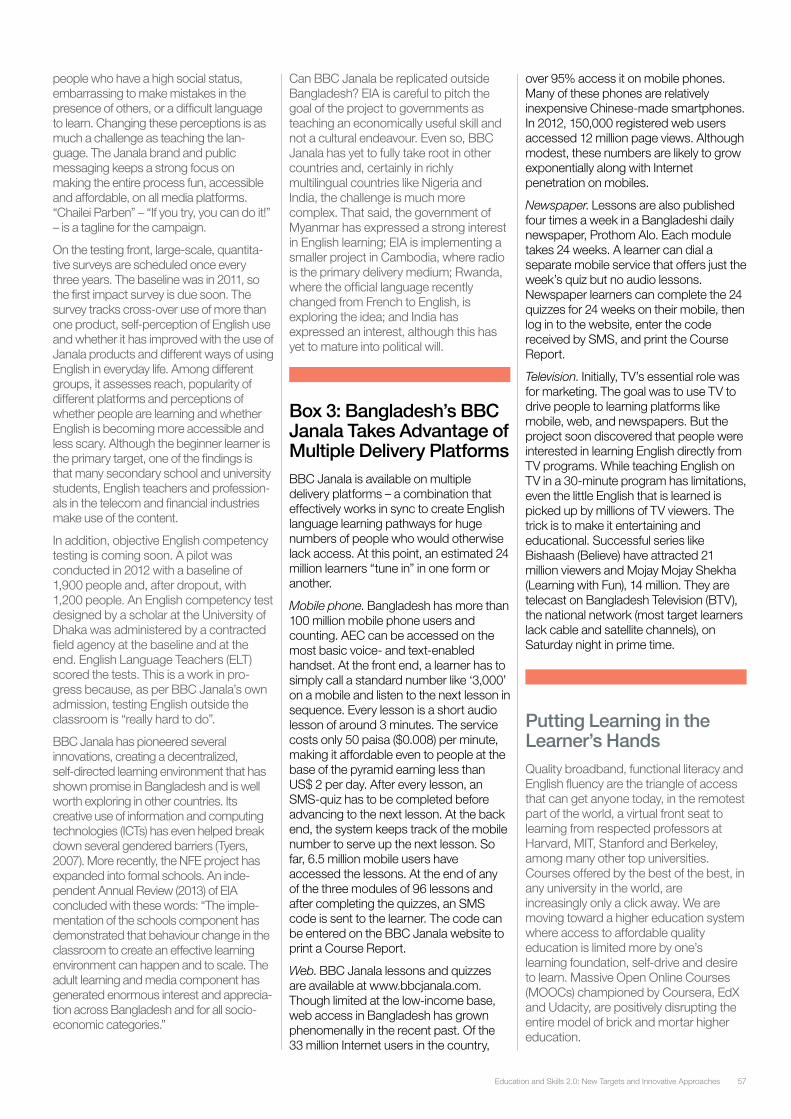
57Education and Skills 2.0: New Targets and Innovative Approaches
people who have a high social status, embarrassing to make mistakes in the presence of others, or a difficult language to learn. Changing these perceptions is as much a challenge as teaching the lan-guage. The Janala brand and public messaging keeps a strong focus on making the entire process fun, accessible and affordable, on all media platforms. “Chailei Parben” – “If you try, you can do it!” – is a tagline for the campaign.
On the testing front, large-scale, quantita-tive surveys are scheduled once every three years. The baseline was in 2011, so the first impact survey is due soon. The survey tracks cross-over use of more than one product, self-perception of English use and whether it has improved with the use of Janala products and different ways of using English in everyday life. Among different groups, it assesses reach, popularity of different platforms and perceptions of whether people are learning and whether English is becoming more accessible and less scary. Although the beginner learner is the primary target, one of the findings is that many secondary school and university students, English teachers and profession-als in the telecom and financial industries make use of the content.
In addition, objective English competency testing is coming soon. A pilot was conducted in 2012 with a baseline of 1,900 people and, after dropout, with 1,200 people. An English competency test designed by a scholar at the University of Dhaka was administered by a contracted field agency at the baseline and at the end. English Language Teachers (ELT) scored the tests. This is a work in pro-gress because, as per BBC Janala’s own admission, testing English outside the classroom is “really hard to do”.
BBC Janala has pioneered several innovations, creating a decentralized, self-directed learning environment that has shown promise in Bangladesh and is well worth exploring in other countries. Its creative use of information and computing technologies (ICTs) has even helped break down several gendered barriers (Tyers, 2007). More recently, the NFE project has expanded into formal schools. An inde-pendent Annual Review (2013) of EIA concluded with these words: “The imple-mentation of the schools component has demonstrated that behaviour change in the classroom to create an effective learning environment can happen and to scale. The adult learning and media component has generated enormous interest and apprecia-tion across Bangladesh and for all socio-economic categories.”
Can BBC Janala be replicated outside Bangladesh? EIA is careful to pitch the goal of the project to governments as teaching an economically useful skill and not a cultural endeavour. Even so, BBC Janala has yet to fully take root in other countries and, certainly in richly multilingual countries like Nigeria and India, the challenge is much more complex. That said, the government of Myanmar has expressed a strong interest in English learning; EIA is implementing a smaller project in Cambodia, where radio is the primary delivery medium; Rwanda, where the official language recently changed from French to English, is exploring the idea; and India has expressed an interest, although this has yet to mature into political will.
Box 3: Bangladesh’s BBC Janala Takes Advantage of Multiple Delivery PlatformsBBC Janala is available on multiple delivery platforms – a combination that effectively works in sync to create English language learning pathways for huge numbers of people who would otherwise lack access. At this point, an estimated 24 million learners “tune in” in one form or another.
Mobile phone. Bangladesh has more than 100 million mobile phone users and counting. AEC can be accessed on the most basic voice- and text-enabled handset. At the front end, a learner has to simply call a standard number like ‘3,000’ on a mobile and listen to the next lesson in sequence. Every lesson is a short audio lesson of around 3 minutes. The service costs only 50 paisa ($0.008) per minute, making it affordable even to people at the base of the pyramid earning less than US$ 2 per day. After every lesson, an SMS-quiz has to be completed before advancing to the next lesson. At the back end, the system keeps track of the mobile number to serve up the next lesson. So far, 6.5 million mobile users have accessed the lessons. At the end of any of the three modules of 96 lessons and after completing the quizzes, an SMS code is sent to the learner. The code can be entered on the BBC Janala website to print a Course Report.
Web. BBC Janala lessons and quizzes are available at www.bbcjanala.com. Though limited at the low-income base, web access in Bangladesh has grown phenomenally in the recent past. Of the 33 million Internet users in the country,
over 95% access it on mobile phones. Many of these phones are relatively inexpensive Chinese-made smartphones. In 2012, 150,000 registered web users accessed 12 million page views. Although modest, these numbers are likely to grow exponentially along with Internet penetration on mobiles.
Newspaper. Lessons are also published four times a week in a Bangladeshi daily newspaper, Prothom Alo. Each module takes 24 weeks. A learner can dial a separate mobile service that offers just the week’s quiz but no audio lessons. Newspaper learners can complete the 24 quizzes for 24 weeks on their mobile, then log in to the website, enter the code received by SMS, and print the Course Report.
Television. Initially, TV’s essential role was for marketing. The goal was to use TV to drive people to learning platforms like mobile, web, and newspapers. But the project soon discovered that people were interested in learning English directly from TV programs. While teaching English on TV in a 30-minute program has limitations, even the little English that is learned is picked up by millions of TV viewers. The trick is to make it entertaining and educational. Successful series like Bishaash (Believe) have attracted 21 million viewers and Mojay Mojay Shekha (Learning with Fun), 14 million. They are telecast on Bangladesh Television (BTV), the national network (most target learners lack cable and satellite channels), on Saturday night in prime time.
Putting Learning in the Learner’s HandsQuality broadband, functional literacy and English fluency are the triangle of access that can get anyone today, in the remotest part of the world, a virtual front seat to learning from respected professors at Harvard, MIT, Stanford and Berkeley, among many other top universities. Courses offered by the best of the best, in any university in the world, are increasingly only a click away. We are moving toward a higher education system where access to affordable quality education is limited more by one’s learning foundation, self-drive and desire to learn. Massive Open Online Courses (MOOCs) championed by Coursera, EdX and Udacity, are positively disrupting the entire model of brick and mortar higher education.
Education and Skills 2.0: New Targets and Innovative Approaches58
Other positive disruptors are rapidly building on MOOCs. 2U is a company that now offers full-fledged online degree courses, in partnership with well-established brick and mortar universities, at a fraction of the cost of in-person university education.19 The remarkable University of the People is even “the world’s first tuition-free online university,” especially attractive to low-income people from around the world. In contrast to this revolution in higher education, education at earlier stages is perhaps not in as much ferment and similar, alternative pathways to learning are not easily created for those in and outside the formal system lacking the triangle of access.
The next big ideas coming of age in the digital learning space are adaptive learning and flipped education. Every learner, theoretically, learns at her/his own pace and could be at a different stage of mastering any given concept. Traditional group or classroom instruction can only aspire to incorporate customized learning. Adaptive education, driven by a learning system’s ability for continuous individualized monitoring of concept mastery, can dynamically adjust the next learning challenge to the level, pace and capacity of the learner. Knewton is a rapidly growing company that offers a backbone infrastructure for educational systems interested in building adaptive digital learning environments.
Flipped education flips the locus of ‘instruction’ and ‘homework’ in traditional schooling. Anytime, anywhere access to video allows classroom instruction to be broken into lesson nuggets that can be seen at will, multiple times, outside the classroom. The balance of classroom activity can, thus, shift from direct instruction to problem-solving, clarification and project work that would have earlier been approached more as homework. The teacher of the future will need to be an able facilitator of access to quality content and encourage mastery of concepts through creative problem solving. She/he will be, much less, a fountain of knowledge.
The well-known Khan Academy began by being an open-access collection of short videos on practically any concept in K-12 math and science education. While it may have started off as a small intra-family initiative of its founder, Salman Khan, teaching his cousin via home-made videos, it struck a universal need for time- and place-shifted access to learning at one’s own pace and direction. After a phase of organic growth fuelled by demand on YouTube, Khan Academy has
more strategically embraced and built around the concepts of flipped instruction and adaptive learning. By further making its content available in many other languages, the academy increasingly serves as a complement to formal education, an integral part of formal education, and an alternative pathway for parents and anyone who wishes to revisit prior learning.
The irony of the digital education revolution is that most people who can, have and will benefit from it are already advantaged to leverage the emerging and exciting pathways to learning. The critical challenge facing the global community is to build new connectors to these learning pathways that would serve masses of people who have so far been denied the opportunities to propel their own learning.
AcknowledgmentsThe author would like to thank David Bloom for his insightful comments and Laura Wallace for sharpening the narrative considerably.
ReferencesAnnual Status of Education Report. ASER. http://www.asercentre.org/Annual/Status/of/Education/Report/The/Annual/p/80.html, 2010.
Annual Status of Education Report. ASER. http://www.asercentre.org/education/India/status/p/143.html, 2012.
Brown, G. Delivering on the promise, building opportunity: The case for a Global Fund for Education. http://www.educationpanel.org/brownreport2.pdf, undated, 2011 or 2012.
Kothari, B., Pandey, A. and Chudgar, A. Reading out of the “idiot box”: Same-language subtitling on television in India. In Information Technologies and International Development, 2004, vol. 2(1): 23–44.
Kothari, B., Takeda, J., Joshi, A. and Pandey, A. Same language subtitling: A butterfly for literacy? In International Journal of Lifelong Education, 2002, 21(1): 55–66.
Kothari, B. and Bandyopadhyay, T. Can India’s ‘‘literate’’ read? In International Review of Education, 2010, 56:705–728.
Mehta, A.C. Student flow at primary level: An analysis based on DISE Data. National University of Educational Planning and Administration, New Delhi. http://www.dise.in/downloads/reports&studies/studentflow.pdf, 2007.
Tyers, A. A gender digital divide? Women learning English through ICTs in Bangladesh, mLearn, 955: 94–100, CEUR Workshop Proceedings, 2012.
UNESCO Institute for Statistics (UIS). Opportunities lost: The impact of grade repetition and early school leaving. In Global Education Digest, 2012.
University of Oxford. A pilot impact and process study of empowerment-based non-formal education for out-of-school youth in Amman, Jordan. http://www.questscope.us/sites/default/files/documents/Attachment%205%20-%20B-%20Oxford_s%20Impact%20Study-Stakeholder%20Report-2011.pdf, 2011.
Endnotes1. According to UIS (2012), 61 million children were out of school
but a more recent UIS fact sheet (2013) has revised this figure to 57 million. See http://www.uis. Unesco.org/Education/Documents/fs-25-out-of-school-children-en.pdf (checked on 2 Jan 2014). The country-wise figures that follow are drawn from UIS (2012).
2. http://www.unesco.org/new/en/media-services/single-view/news/literacy_for_all_remains_an_elusive_goal_new_unesco_data_shows/, 17 October 2013.
3. http://www.un.org/millenniumgoals/pdf/Goal_2_fs.pdf, 17 October 2013.
4. http://www.itu.int/en/ITU-D/Statistics/Documents/facts/ICTFactsFigures2013.pdf, 17 October 2013.
5. http://www.gartner.com/newsroom/id/2209615, 17 October 2013.
6. http://www.asercentre.org/.
7. See http://populationcommission.nic.in/content/933_1_LiteracyRate.aspx for trends from census to census.
8. http://www.uis.unesco.org/literacy/Pages/lamp-literacy-assessment.aspx.
9. The LAMP outline here is based on inputs by Manuel Cardoso Fernandez at the UNESCO Institute for Statistics (UIS).
10. The author is a founder of the SLS project.
11. http://www.planetread.org/pdf/Research%20Summary_SLS.pdf.
12. This section on Questscope is based on inputs from Dr Curt Rhodes.
13. An independent evaluation of Questscope was conducted by the University of Oxford (2011).
14. Questscope’s work is located in a part of Damascus where they can still be operative. The situation in Syria has not affected their programming at the juvenile correction facility.
15. See http://www.yoza.mobi for the stories and http://www.yozaproject.com for information about the project.
16. http://www.mxit.com.
17. The write-up on BBC Janala is based on an interview with Richard Lace, Head of Project, EIA.
18. Course 3 is in production.
19. For example, 2U recently partnered with Berkeley’s School of Information to offer “the first” online master of information and data science degree.
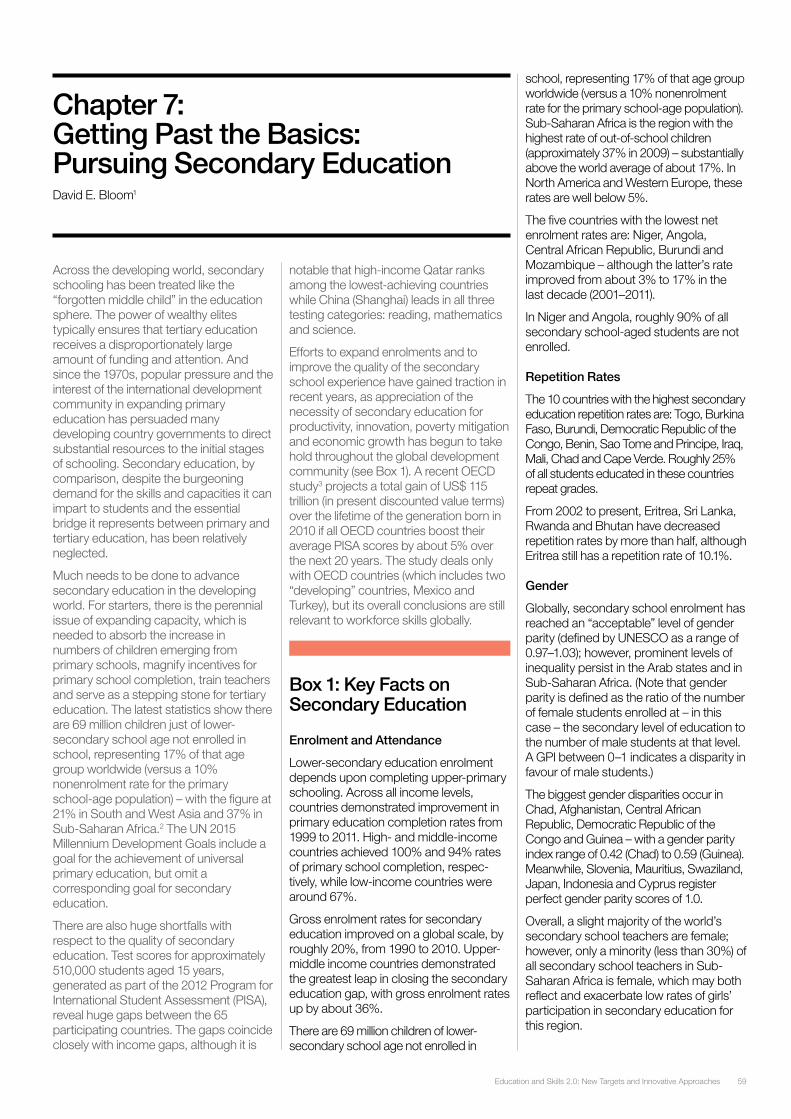
59Education and Skills 2.0: New Targets and Innovative Approaches
Across the developing world, secondary schooling has been treated like the “forgotten middle child” in the education sphere. The power of wealthy elites typically ensures that tertiary education receives a disproportionately large amount of funding and attention. And since the 1970s, popular pressure and the interest of the international development community in expanding primary education has persuaded many developing country governments to direct substantial resources to the initial stages of schooling. Secondary education, by comparison, despite the burgeoning demand for the skills and capacities it can impart to students and the essential bridge it represents between primary and tertiary education, has been relatively neglected.
Much needs to be done to advance secondary education in the developing world. For starters, there is the perennial issue of expanding capacity, which is needed to absorb the increase in numbers of children emerging from primary schools, magnify incentives for primary school completion, train teachers and serve as a stepping stone for tertiary education. The latest statistics show there are 69 million children just of lower-secondary school age not enrolled in school, representing 17% of that age group worldwide (versus a 10% nonenrolment rate for the primary school-age population) – with the figure at 21% in South and West Asia and 37% in Sub-Saharan Africa.2 The UN 2015 Millennium Development Goals include a goal for the achievement of universal primary education, but omit a corresponding goal for secondary education.
There are also huge shortfalls with respect to the quality of secondary education. Test scores for approximately 510,000 students aged 15 years, generated as part of the 2012 Program for International Student Assessment (PISA), reveal huge gaps between the 65 participating countries. The gaps coincide closely with income gaps, although it is
notable that high-income Qatar ranks among the lowest-achieving countries while China (Shanghai) leads in all three testing categories: reading, mathematics and science.
Efforts to expand enrolments and to improve the quality of the secondary school experience have gained traction in recent years, as appreciation of the necessity of secondary education for productivity, innovation, poverty mitigation and economic growth has begun to take hold throughout the global development community (see Box 1). A recent OECD study3 projects a total gain of US$ 115 trillion (in present discounted value terms) over the lifetime of the generation born in 2010 if all OECD countries boost their average PISA scores by about 5% over the next 20 years. The study deals only with OECD countries (which includes two “developing” countries, Mexico and Turkey), but its overall conclusions are still relevant to workforce skills globally.
Box 1: Key Facts on Secondary Education
Enrolment and Attendance
Lower-secondary education enrolment depends upon completing upper-primary schooling. Across all income levels, countries demonstrated improvement in primary education completion rates from 1999 to 2011. High- and middle-income countries achieved 100% and 94% rates of primary school completion, respec-tively, while low-income countries were around 67%.
Gross enrolment rates for secondary education improved on a global scale, by roughly 20%, from 1990 to 2010. Upper-middle income countries demonstrated the greatest leap in closing the secondary education gap, with gross enrolment rates up by about 36%.
There are 69 million children of lower-secondary school age not enrolled in
school, representing 17% of that age group worldwide (versus a 10% nonenrolment rate for the primary school-age population). Sub-Saharan Africa is the region with the highest rate of out-of-school children (approximately 37% in 2009) – substantially above the world average of about 17%. In North America and Western Europe, these rates are well below 5%.
The five countries with the lowest net enrolment rates are: Niger, Angola, Central African Republic, Burundi and Mozambique – although the latter’s rate improved from about 3% to 17% in the last decade (2001–2011).
In Niger and Angola, roughly 90% of all secondary school-aged students are not enrolled.
Repetition Rates
The 10 countries with the highest secondary education repetition rates are: Togo, Burkina Faso, Burundi, Democratic Republic of the Congo, Benin, Sao Tome and Principe, Iraq, Mali, Chad and Cape Verde. Roughly 25% of all students educated in these countries repeat grades.
From 2002 to present, Eritrea, Sri Lanka, Rwanda and Bhutan have decreased repetition rates by more than half, although Eritrea still has a repetition rate of 10.1%.
Gender
Globally, secondary school enrolment has reached an “acceptable” level of gender parity (defined by UNESCO as a range of 0.97–1.03); however, prominent levels of inequality persist in the Arab states and in Sub-Saharan Africa. (Note that gender parity is defined as the ratio of the number of female students enrolled at – in this case – the secondary level of education to the number of male students at that level. A GPI between 0–1 indicates a disparity in favour of male students.)
The biggest gender disparities occur in Chad, Afghanistan, Central African Republic, Democratic Republic of the Congo and Guinea – with a gender parity index range of 0.42 (Chad) to 0.59 (Guinea). Meanwhile, Slovenia, Mauritius, Swaziland, Japan, Indonesia and Cyprus register perfect gender parity scores of 1.0.
Overall, a slight majority of the world’s secondary school teachers are female; however, only a minority (less than 30%) of all secondary school teachers in Sub-Saharan Africa is female, which may both reflect and exacerbate low rates of girls’ participation in secondary education for this region.
Chapter 7: Getting Past the Basics: Pursuing Secondary EducationDavid E. Bloom1
Education and Skills 2.0: New Targets and Innovative Approaches60
Teachers
As global secondary school enrolment has increased, so too has the number of secondary school teachers – with this rise occurring in all regions between 2000 and 2009. Moreover, most regions (except Sub-Saharan Africa and Latin America and the Caribbean) saw an increase in female educators at both the lower- and upper-secondary levels.
Outcomes and Quality (International Assessment)
Since its inception in 2000, 30 countries currently classified as “developing” (not in the UN’s high per capita GNI category) have participated in the PISA (Program for International Student Assessment). In 2012, Shanghai ranked highest in average reading, science and maths scores (Chinese regions tested separately), topping the charts among both develop-ing and developed nations. Among participating developing countries, it was followed by Vietnam. Peru ranked the lowest in all three categories, although its reading scores had improved significantly, up to 384 from 370 in 2009.
Turkey also showed a major improvement, with average PISA science scores climbing from 434 in 2003 to 463 in 2012, as did Romania, whose maths scores rose from 415 in 2006 to 445 in 2012. No developing countries have experienced any significant declines in PISA scores since 2003 – ex-cept for Uruguay, whose reading scores fell from 434 to 411 and whose math scores dropped from 422 to 409.Sources: WDI, UNESCO, EdStats and OECD
Human development and gender equity can also be expected to get a big boost from improvements in secondary education, not just through enhanced earnings but also – especially in the case of girls – via more meaningful and confident participation in family and community decision-making and individual and family health gains (see Chapter 2 for more on girls’ education).
The economic development process generally involves a progression from the production of primary commodities (such as agricultural goods and minerals) to industry and services. This progression maps to workforce demands in so far as the value of education beyond the primary level is higher in industry and services than agriculture. The tools of basic education are necessary for many tasks, but secondary schooling can better equip workers with the knowledge and skills
that economies demand as they develop. Education also promotes the ability to learn new skills and adapt to new circumstances, the need for which is heightened in a rapidly changing world.4
A More Robust, Reimagined Secondary EducationAddressing the challenges of secondary education will require a coordinated set of programmes and policies, both within and beyond the education system. Education system improvements must focus on secondary school infrastructure (ranging from working toilets to Internet connec-tions), the training of teachers and adminis-trators, the establishment of performance incentives and the updating of curricula and learning materials to make them appropriate to skill-building for workforce needs. A strong higher education system to which secondary graduates can aspire, a vibrant and meritocratic labour market and policies to facilitate girls staying in school are also key.
Updating Curricula and Learning Materials
Although “goodness” or “efficacy” of a particular curriculum can be difficult to measure, most education specialists seem to concur that in many developing country school systems, curricula are character-ized by rote-learning practices, too much focus on outdated content and poor learning materials. Key recommendations for curriculum reform include (a) more emphasis on developing cognitive skills and an active approach to problem-solving in lieu of memorizing content, (b) frequent allowances to accommodate emerging new topics, and (c) greater emphasis on the versatility of vocational education. And given today’s fast-changing, knowledge economy, more and better science will be essential – which can be taught in an updated, exciting manner (see Box 2).
- In Uganda, a recent World Bank study notes that the current secondary curriculum is overloaded with anachro-nistic content, especially in the sciences where curricula fail to reflect “... major epistemological and philoso-phical changes in our understanding of the subjects over the past half cen-tury”.5 It recommends a focus on skills instead of content, as well as making room in the curriculum for such topics as democracy, education, HIV/AIDS, health and the environment, with scope and flexibility for regular reform.
- In India, another World Bank account cites similar problems with the secondary curricula, which suffer from “over-emphasis on rote learning of facts” and an overload of content. Textbook quality is also “low” and the overwhelming majority of secondary schools lack computing facilities. It recommends revising texts “to emphasize higher-order thinking skills” and to “prepare and introduce comprehensive policies and programs for integration of ICTs into teaching/learning of core secondary syllabi”.6
- In Chile, successful reforms in the secondary school curriculum in the 1990s still tended “towards the reduc-tion and trivialization of knowledge, favoring a passive learning relationship”. But in the late 1990s and early 2000s, Chile implemented a combination of “top-down” education reforms including curriculum redesign – with “bottom-up” and decentralized actions, such as making it easier for teachers to collabo-rate with one another and receive additional training. The reforms also extended the “common curriculum” from 8th to 10th grade, allowing students more time to choose between academic and vocational paths. Vocational subjects were redesigned to give “occupational sector” skills rather than skills for one specific job.7
Box 2: Creating a Spark: Does School Physics Need to Be Boring? “Education is not the filling of a pail, but the lighting of a fire”, W.B. Yeats, Irish poet (1865–1939)
Do you remember your physics lessons at school? Boring? Irrelevant? Highly mathematical? Ask your friends – you are likely to get the same reaction. Physics teaching in secondary school does not inspire or motivate, foster creative thinking or produce applicable skills. Worse, it fails to provide a framework for understanding the basis of modern technology and often discourages students from pursuing scientific or engineering studies.
At this point, many countries are experiencing a lack of interest in physics, which in turn is leading to a lack of young engineers and scientists. This trend affects industrial countries like Germany, but it is also detrimental to developing countries, which need young scientists and engineers to become competitive.
61Education and Skills 2.0: New Targets and Innovative Approaches
The problem behind this trend appears to be multifaceted:
- The physics syllabus is outdated. It is often centred on the 1675–1830 period, leaving out the great discoveries of 20th century physics.
- Physics teaching focuses much more on solving equations than on understanding the underlying models of nature. Even if pupils pass their exams, a rote learning of formulas does not result in applicable knowledge or foster creative thinking.
- The qualification and status of physics teachers remains an issue. In a number of countries, physics is taught (as a second subject) by science teachers who have never taken physics courses at university – and if they did, those courses were inadequate.
- The social status and salary of teachers does not necessarily attract the best students.
So what can be done to spark an interest in physics? First, the physics syllabus needs to be adapted to the 21st century. There is strong evidence that topics from frontier research, which make the headlines of newspapers, inspire pupils to learn more about the questions stimulating contempo-rary research. In addition, more time should be devoted to talking about the way sci-ence works. The laws of nature have not been issued by scientific authorities, as school teaching often makes believe. Rather, they have emerged from an iterative process, shifting between model-building, experiment and analysis.
Second, physics teaching has to be relevant to students’ lives. Pupils should be encour-aged to develop their talents and “learn how to learn”. For example, the seventh frame-work programme of the European Commis-sion puts a focus on “inquiry-based learning”, encouraging students to be creative, develop their problem-solving skills and find solutions to real-life problems, with the support of their teachers.
Third, the teaching profession needs a facelift. Teachers are role models and we should aim at recruiting the best candi-dates. They should follow the same university courses as their peers who become researchers in academia or industry. We should also try to raise their social status. Finland’s educational system scores high in many international comparisons, mainly thanks to the high respect accorded to its teaching profession. The job of a Finnish teacher is a desirable well-paid one and students must fiercely compete to become one.
Plato wrote: “Wisdom begins in wonder.” It is tempting to add “…but not with a formula.”Contributed by Rolf Landua, head of education, CERN (European Organization for Nuclear Research).
Improving Sanitation Infrastructure and Hygiene Education
Although the issue of expanding and updating infrastructure to provide better sanitation can be difficult to study in isolation and suffers from a lack of conclusive and generalizable data, anecdotal evidence and common sense suggest that sanitary and toilet facilities, or lack thereof, are an important factor in school enrolment, attendance and value added – especially for girls.8 Some food for thought, starting with a few anecdotes:
- In Bagamoyo, Tanzania, according to a study by the Global Poverty Project,9 a local school headmistress says: “Enrolment at the school has gone up by 100% because the girls now have their own toilets. They are free to use them without fear of being victimized by boys.”
- According to WaterAid, access to, and improvement of, water sources is a vital step toward improving enrolment rates in schools generally. It cites a UNICEF report showing 2011 data indicating that for schools in least developed and low-income countries, only 51% had satisfactory water sources; worse yet, only 45% had satisfactory sanitation infrastructure.10
- In the Philippines, the “Fit for School” programme, which targets school-aged children for hygiene education (including an essential healthcare package consisting of soap, a toothbrush, fluoride toothpaste and two deworming tablets), managed to reduce absenteeism by 30% within one year.11 The programme focused on primary school children, but by improving their health, completion rates should rise, followed by higher secondary enrolment and completion rates.
Promoting the Quality of Secondary Teaching
Like curriculum, teacher “quality” can be difficult to monitor and measure. However, many schools in developing countries – both primary and secondary – suffer from such issues as endemic teacher absenteeism, high staff turnover and a lack of teachers with postsecondary qualifications. In Sri Lanka, for example,
only 56% of upper-secondary school teachers hold tertiary-level degrees.12 While the number of secondary school teachers worldwide has increased over the past 20 years, large numbers of teachers will still need to be suitably trained and recruited to keep up with growing student populations.
- Nationally representative surveys of schools in Bangladesh, Ecuador, India, Indonesia, Peru and Uganda recorded teacher absences in nearly one in five unannounced visits during October 2002 through April 2003. The results also reveal that teachers who were born in the district of the school in which they taught were significantly less likely to be absent, as were teachers in schools at which students' parents had higher rates of literacy.13 Teacher absenteeism was not significantly linked to their salaries (indeed, higher-paid head teachers were more likely to be absent), but was correlated with the quality of school infrastructure. These patterns suggest that improving physical working environments and cultivating educators’ ties to the local community may be more effective than increasing remuneration in decreasing teacher absenteeism, at least in some contexts. (Only primary schools were surveyed, but one can easily imagine that the same principles apply to secondary teachers.)
- In a randomized experiment in Rajasthan, India, monitoring teacher attendance and closely tying teacher pay to attendance records produced a dramatic drop in absenteeism and a corresponding improvement in student test scores. The experiment began in September 2002 and ran for 18 months. Under this experiment, a treatment group set of teachers was given a camera with a tamper-proof date and time stamp and instructed to ask a student to take a picture of the teacher and their classmates at the start and end of every school day. The result was a reduction in teacher absences by over 20% compared to schools in which no camera was provided, suggesting that technology-based solutions may be helpful in teacher-monitoring in other contexts.14
Education and Skills 2.0: New Targets and Innovative Approaches62
- Evidence from other developing country settings shows that greater monetary incentives can increase the quantity and aptitude of available teaching candidates. In the 1990s, Chile’s massive increase in teachers’ pay, along with campaigns to encourage college students to go into teaching, resulted in a significant growth in applications to teaching programmes, as well as an increase in the average university admissions exam scores of those applying.15 Coupled with compel-ling recent evidence about the sizable long-term benefits to high primary/low secondary students of “good” teachers – measured in terms of teen pregnancy outcomes, college enrolment rates and adult earnings – the training, recruitment, retention and motivation of secondary school teachers should be accorded high priority.16
Educating Girls
According to Lawrence Summers, “Educating girls quite possibly yields a higher rate of return than any other investment available in the developing world.”17 This conclusion reflects a combination of earnings gains associated with additional schooling18 and the benefits to reproductive and general health for both the girl/woman and other members of her family. It is conservative in the sense that it does not account for the significantly greater capacity of educated women to participate meaningfully in community decision-making or the benefits that educated grandmothers confer on their grandchildren.
In many traditional settings, parents perceive girls to be less worthy of educa-tional investments than boys because girls’ subsequent economic and social contributions will accrue predominantly to the family of their husbands. This percep-tion, which denies many girls the opportu-nity to attend secondary school in favour of their participation in household activities (such as fetching water and wood, cooking, working in the fields or looking after younger siblings) can potentially be addressed by compulsory education laws. In so far as school enrolment and attendance are relatively more vulnerable to income shocks like those caused by droughts and ill health for girls than boys, expanded use of financial instruments like savings accounts and crop insurance will also promote educational attainment among girls.19
- In Turkey, in 1997, a change in compulsory education laws from five to eight years was significantly linked to girls getting married at older ages,
according to a study by Kirdar, Davoglu and Koc (2009). Moreover, “the impact of extension of compulsory schooling persists beyond the completion of compulsory schooling and the magnitude of this impact is large”.20
As a practical matter, marriage often marks the end of a women’s formal education. As such, policies to deter child marriage or to strengthen the incentives girls have to remain in school have the potential to promote their secondary school attendance.
- In rural Bangladesh, traditionally known for its high rates of early marriage, it is estimated that a 0.22-year gain in schooling and a 5.6% gain in literacy is associated with each one-year postponement of marriage. The study also finds that a prohibition on marriages below age 17 would increase average female schooling by about 10%, or over one-half year. 21
- Also in Bangladesh, a study of female garment workers shows that access to jobs allows women to delay marriage because it increases the cost of leaving the workforce to establish a family. It also suggests that access to jobs that rely on skills acquired in secondary school create an incentive to stay in school longer. According to one interview of a single, 20-year-old operator named Aleya: “I stopped studying after class five because my father was religious and did not believe in girls’ education. Now I know the value of education. No one can take it away from you; it is your very own. If my father had let me, I would have been a doctor…. If you have more education, you earn more…you are more likely to become a supervisor if you are a matriculate [have 10 years of education].”22
- Evidence is now abundant in support of the view that families can be incentivized to keep their children in school. A recent World Bank review shows that conditional cash transfer programmes have a beneficial effect on secondary school enrolment rates in virtually every location where they have been used.23 Such programmes make the receipt of cash transfers by needy families contingent on certain behaviours such as enrolling one’s children in school. As another example, Amin and Sedgh show that secondary enrolments were increased in rural Bangladesh, with resulting later age of marriage, as a result of a female secon-dary school scholarship scheme.24
- Providing more convenient and effective sanitary products for menstruating girls is another promising intervention. Two recent studies deliver a mixed verdict, although they highlight the possibility of using rigorous empirical methods to improve our understanding of the link between menstruation and girls’ school enrolment and attendance. In Ghana, one study reports that providing free disposable sanitary pads increased school attendance. The results, based on an intervention study involving 98 schoolgirls aged 12 and over in four villages (three treatment and one control), also suggests that this measure would facilitate girls’ progression from primary to secondary school.25 However, a study in Nepal – a randomized evaluation of the effect on school attendance of providing improved sanitary technology (that is, menstrual cups) to 198 seventh and eighth grade girls enrolled in four schools in Chitwan District – shows no effect of the provision of the sanitary product on the small number of lost school days due to menstruation (0.4 in a 180-day school year). That said, the girls valued the sanitary products, which increased their mobility and reduced time spent doing laundry.26
The Next FrontierSecondary education is a complex and critical new frontier on the path of human progress. Although there is no singular universal remedy for the dual challenges of getting children enrolled and providing them a quality experience, we fortunately have many instruments at our disposal that can be adapted and pieced together in a way that is appropriate to myriad contexts to form a coherent portfolio of actionable and scalable interventions. As with most social change processes, the going may be slow at first. But as the improvements cumulate, the perception that enrolment in quality secondary education programmes is the norm will take hold – thereby accelerating the process of social change and allowing widespread enjoyment of its benefits.
63Education and Skills 2.0: New Targets and Innovative Approaches
Endnotes1. Elizabeth Cafiero, Alyssa Lubet, Liza Mitgang, Larry
Rosenberg and Laura Wallace provided helpful assistance in the preparation of this chapter.
2. UNESCO Institute for Statistics, Global Education Digest 2011, Quebec: UNESCO Institute for Statistics, 2011.
3. OECD, The High Cost of Low Educational Performance: the long-run economic impact of improving PISA outcomes, Paris: OECD, http://www.oecd.org/pisa/44417824.pdf, 2010.
4. According to Nobel economics laureate T. W. Schultz, “There is enough evidence to give validity to the hypothesis that the ability to deal successfully with economic disequilibria [changes in economic conditions] is enhanced by education and that this ability is one of the major benefits of education accruing to people privately in a modernizing economy. We see it in the equilibrating performance of housewives, laborers, students, and farmers. There is no reason to suppose it is not also important in the case of businessmen….” (T. W. Schultz, “The Value of the Ability to Deal with Disequilibria”, Journal of Economic Literature, 1975, Vol. 13, No. 3, 843.)
5. A. Clegg, W. Ottevanger, J. Bregman, H. Nannyonjo and K. Klosowska, Uganda - Secondary Education and Training: Curriculum, Assessment and Examination (CURASSE) : Roadmap for Reform, Washington DC: World Bank. http://documents.worldbank.org/curated/en/2012/01/16453727/uganda-secondary-education-training-curriculum-assessment-examination-curasse-roadmap-reform, 2012.
6. R. Zagha, M. Rutkowski, A. Dar and S. Carlson, Secondary Education in India: Universalizing Opportunity, Washington DC: World Bank, http://siteresources.worldbank.org/EDUCATION/Resources/278200-1099079877269/547664-1099079967208/Secondary_edu_India_Universalizing_v1.pdf, 2009.
7. C. Cox, Policy Formation and Implementation in Secondary Education Reform: The Case of Chile at the Turn of the Century, Washington DC: World Bank, http://siteresources.worldbank.org/EDUCATION/Resources/278200-1099079877269/547664-1099079967208/Policy_SecondaryEd_Reform_Chile_3.pdf, 2006.
8. T. Crofts and J. Fisher, “Menstrual hygiene in Ugandan schools: an investigation of low-cost sanitary pads”, The Journal of Water, Sanitation and Hygiene for Development, 2012, 2(1), 50–58.
9. Global Poverty Project, Global Poverty Info Bank: Sanitation and Poverty, http://www.globalpovertyproject.com/infobank/Sanitation, 2013.
10. UNICEF, “Raising even more clean hands: Advancing health, learning and equity through WASH in schools”, www.unicef.org/wash/schools/files/Raising_Even_More_Clean_Hands_Web_17_October_2012(1).pdf, 2012.
11. Ibid.
12. UNESCO Institute for Statistics.
13. N. Chaudhury, J. Hammer, M. Kremer, K. Muralidharan and H.F. Rogers, “Missing in action: Teacher and health worker absence in developing countries”, The Journal of Economic Perspectives, 2006, 20:1, 91–116.
14. E. Duflo, R. Hanna and S. P. Ryan, “Incentives work: getting teachers to come to school”, American Economic Review, 2012, 102:4, 1241–1278.
15. E. Vegas, “Teacher labor markets in developing countries”, The Future of Children, 2007, 17:1, 219–232.
16. R. Chetty, J. Friedman and J. Rockoff, “Measuring the impacts of teachers II: Teacher value-added and student outcomes in adulthood”, NBER Working Paper No. 19424, September 2013.
17. L. Summers, “The most influential investment”, Scientific American, August 1992, 132.
18. Psacharapoulos and Patrinos 2004 report that women receive higher returns than men to investments in their schooling; they also report that women receive higher returns than men to investments in secondary education (18 versus 14%). (G. Psacharopoulos and H. A. Patrinos, "Returns to investment in education: a further update", Education Economics, 2004, Vol. 12(2), 111–134.)
19. M. Björkman-Nyqvist, “Income shocks and gender gaps in education: Evidence from Uganda”, Journal of Development
Economics, 2013, Vol. 105, 237–253.
20. M. G. Kirdar, M. Dayoglu and I. Koc, “The impact of schooling on the timing of marriage and fertility: Evidence from a change in compulsory schooling law”, working paper, http://mpra.ub.uni-muenchen.de/13410/, 2009.
21. E. Field and A. Ambrus, “Early marriage, age of menarche and female schooling attainment in Bangladesh”, Journal of Political Economy, 2008, 116(5), 881–930.
22. S. Amin, I. Diamond, R. T. Naved and M. Newby, “Transition to adulthood of female garment-factory workers in Bangladesh”, Studies in Family Planning, 1998, Vol. 29(2), 185–200.
23. A. Fiszbein and N. Schady, Conditional Cash Transfers: Reducing Present and Future Poverty, Washington DC: The World Bank, 2009.
24. S. Amin and G. Sedgh, “Incentive schemes for school attendance in rural Bangladesh”, Policy Research Division Working Paper No. 106, New York: The Population Council, 1998.
25. L. Scott, C. Ryus, C. Dolan, S. Dopson and P. Montgomery, “The power of ordinary objects: Sanitary care in Ghana”, University of Oxford Working Paper, Autumn 2011.
26. E. Oster and R. Thornton, “Menstruation, sanitary products, and school attendance: Evidence from a randomized evaluation”, American Economic Journal: Applied Economics, 2011, 3(1), 91–100.
Education and Skills 2.0: New Targets and Innovative Approaches64
Learning Anything, Anytime, Anywhere
Today, digital innovation is driving unprecedented change across the education sector. In doing so, it has the potential both to improve student learning outcomes and expand access to high-quality education opportunities in ways that would have been unimaginable even a decade ago. Because this revolution is taking place online, it is globally accessible and able to leverage the lower distribution costs afforded by the Internet. These digital innovations will transform both what happens in the classroom as well as broader educational policy in the years to come.
There is no shortage of alarming statistics that reflect the wasted potential of human capital owing to lack of access to quality education: in the United States alone, 30% of students fail out of high school; 33% of college students require remediation; and 46% of college students fail to graduate. (All this is to say nothing of education in the global economy and the social ills that have pervaded the world as a result.) Because of escalating tuition rates, unemployment and a massive student debt burden in the United States – which has now reached more than US$ 1 trillion – there is tremendous momentum to disrupt education as we know it and provide an alternative, or at least a complement, to the traditional and largely one-size-fits-all bricks-and-mortar school system.
On the business side, the potential is enormous. Education is a US$ 7 trillion industry. In other words, the total amount of money (both public and private) spent annually on education exceeds all spending, both online and offline, of every other information industry combined – i.e. all media, entertainment, games, news, software, Internet and mobile media and e-tailing.
Chapter 8: Online Education: From Novelty to NecessityChip Paucek, Jose Ferreira, Jeremy Johnson and Christina Yu
Education and Skills 2.0: New Targets and Innovative Approaches64
65Education and Skills 2.0: New Targets and Innovative Approaches
Technological innovation has finally caught up to the potential at hand. Digital open content, cloud computing, mobile and tablet technology, game-based learning, machine learning and big data technology are sweeping through education and its associated industries. As a result, education is undergoing a monumental shift, from a factory model to a digital, personalized model.
The shifting of education from analogue to digital is a one-time event in the history of the human race. At scale, it may have as big an effect on the world as indoor plumbing or electricity. The consequence of nearly every human being receiving as much education as she wants and her ability permits will likely transform the quality of life and global GDP within one generation. Massive pools of human talent will be unlocked. Better-educated people will raise better-educated kids. How many more great minds – future Einsteins, Curies, Da Vincis, Pasteurs, Martin Luther Kings and McCartneys – will the world produce when we can quadruple the number of high school graduates?
This chapter will cover the revolution in online education, as played out in two main areas: distribution and data-mining. It will also assess the disruptive innovation occurring in higher education today and describe its ramifications for the future of universities. So how quickly will this revolution occur and which institutions and nations will reap the benefits of getting these first? The authors believe the answer lies in the ability to surmount two hurdles: (a) expanding credit acceptance policies for online courses; and (b) overcoming the digital divide, a result of insufficient adequate infrastructure and too little digital literacy.
Revolution in Distribution The widespread growth and acceptance of online classes – whether primary, secondary or higher education; credit-bearing or not-for-credit; private or open; paid or free; delivered by for-profit institution or not-for-profit – reflect a seismic shift in the education universe.
According to The New York Times, 2012 is the “year of the MOOC” (massive open online course), but they easily could have called it the “year elite colleges embraced online courses”. Reflecting public senti-ment, Tom Friedman of The New York Times wrote about MOOCs that “nothing has more potential to lift more people out of poverty – by providing them an affordable education to get a job or improve in the job
they have”. However, online courses offered by prestigious universities are not new. In fact, orders of magnitude more students have paid for and completed online university courses for credit than all those who have completed a MOOC.
The MOOC Landscape
The MOOC ecosystem today provides free online courses in nearly every higher education field of study. Some MOOC providers, like Coursera, are for-profit and venture-funded – they will one day be forced to pursue revenue and liquidation opportunities for their investors. Others, like EdX and Khan Academy, are not-for-profit – meaning they will be perpetually capital-constrained versus any for-profit players that figures out a successful revenue model.
Though Khan Academy is not technically a MOOC platform, it serves much the same purpose. The not-for-profit provides an open online content repository that students can navigate at their own pace. Khan Academy’s video library draws approximately six million unique visitors a month and contains a collection of more than 4,000 free micro-lectures on subjects ranging from maths to history to American civics. Their maths assessment material is lightly adaptive and self-paced; the system will serve up questions that escalate in difficulty. A badge system gamifies the learning process, with the most “legendary” badges (“sun” and “black hole”) requiring years of work.
EdX, by contrast, is a MOOC platform founded by the Massachusetts Institute of Technology and Harvard University, which offers online, college-level courses free of charge to the public. As of May 2013, the platform offers courses from 27 participating universities, including Georgetown University, the University of California at Berkeley, Cornell University, Wellesley College and Rice University.
To date, MOOCs and Khan Academy offer only part of what constitutes a course. They offer lectures with top teachers. This is certainly revolutionary, but it is also incomplete. For all the massive size and bureaucracy of the global education system, students primar-ily do just two things to drive their learning: (a) attend classes; and (b) read or interact with texts and other materials. MOOCs offer very large and impersonal – but free – classes, sometimes supported with very light textbooks and materials. Professors generally contribute notes and suggest free materials to students, but to date the focus of MOOCs has been almost entirely on lectures. Almost all of the additional
learning that students normally are expected to do on their own – by studying a carefully curated textbook, with profes-sionally created scope and sequence, instructional design, assessment items and production values – is missing. The other supporting services that universities provide, both academic services like libraries and tutors, as well as other nonacademic services, are also missing.
Small wonder then that MOOCs have struggled with course quality and retention. Take Udacity. First, it announced a pioneering partnership with San Jose State. The partnership was front-page news in January 2013, but six months later San Jose State announced it would “pause” the partnership after trial courses reported failure rates ranging from 56 to 76%. Six months later, Udacity founder Sebastian Thrun announced the company would “pivot” to focus on corporate training rather than academic courses. “We have a lousy product”, Thrun admitted.
At the time of this writing, Udacity is the MOOC provider most in the spotlight. But completion rates for MOOCs as a whole have been similarly problematic. One study found the average churn rate (or amount of customers who cut ties with a service or company during a given time period) for MOOCs to be 93%.1
Of course, given the large numbers of registrants some MOOCs attract, it is statistically inevitable that they will also produce a few heartwarming stories, like that of Khadijah Niazi, the 11-year-old Pakistani girl who completed Udacity’s physics class with highest distinction. Offering unsupported but free classes to students dogged enough to complete them is certainly a great social good and will be a game-changer where the alterna-tive is no classes at all. But MOOCs’ promise of widespread disruption will go unfulfilled until the product is completed and the churn rate goes down.
The NonMOOC Landscape
The improvements – such as high quality textbooks, materials and supporting servic-es – needed to turn MOOCs from just free classes into fully developed courses cost money, a fact that is unlikely to change soon. In response, some MOOC providers are beginning to offer nonMOOCs. Prior to its pivot, Udacity partnered with Georgia Tech to offer a masters in computer science priced at around US$ 7,000. The programme is neither “massive” nor “open”. It is, however, showing early signs of traction and the sphere in which future trends will likely play out.
Education and Skills 2.0: New Targets and Innovative Approaches66
Given present trends, virtually every large university in the United States, and many elsewhere as well, will within 10 years, offer online courses – for credit and for a fee. For-profit institutions like the University of Phoenix, Education Management Corporation (EDMC), Kaplan University and others have been doing this for years, as have large public institutions such as Arizona State University, Penn State and the University of Maryland. Even institutions that were once slow to innovate are now rapidly following suit. According to a study by the Babson Survey Research Group, as of 2012 all but 13.5% of institutions had some online offerings. Furthermore, many schools that once offered only online courses now offer complete online degree programmes – 62.4% in 2012, sharply up from 34.5% in 2002. And it is not just public and for-profit universities increasing their presence in the online space. From 2002 to 2012, the fraction of private nonprofit institutions with online degree programmes more than doubled from 22.1% to 48.4%.2
Into this new landscape has come a wealth of new educational opportunities and models. Some small schools, like Southern New Hampshire State University, adapted early, focusing on assembling the best educational experience possible while maintaining ties to bricks-and-mortar community and regional businesses. Meanwhile, large flagship institutions like SUNY, Arizona State University and Penn State have chosen to offer a relatively low-cost education in order to serve hundreds of thousands and eventually perhaps millions of students. Elite institutions, most of which now offer online credits only, will begin offering online degrees (especially to overseas students) once it becomes clear that it will not dilute their brand (e.g. because enough of their competitors are already doing so).
A variety of third-party, mostly for-profit companies have emerged to help facilitate these courses. The for-profit company 2U (formerly “2tor”), which already facilitated masters degrees in partnership with schools like Georgetown and the University of Southern California, recently launched “Semester Online” – a self-governing consortium of elite undergraduate institutions (including Northwestern University, Washington University in St Louis, Emory University, Notre Dame, Boston College, Brandeis University and the University of North Carolina at Chapel Hill) that allows students to take for-credit classes online. As a higher price-point provider, 2U and
others like it provide higher-end solutions involving considerable custom content and technical development as well as logistical support to their university partners and students. Meanwhile, Udacity’s partnership with Georgia Tech is an example of a low price-point provider teaming with an elite university to offer a lower-price point product.
The Future of MOOCs
From 2012 to 2013, MOOCs were the poster child for online education. It is easy to understand why people are so excited. Education has always had an access problem. People intuitively understand that creating video versions of the world’s great lecture experiences represents the beginning of a solution to this problem. By providing free access to world-class educators, MOOCs deliver tremendous social good. For many working adults with families, these courses represent an exciting way to improve one’s professional value and get promoted or find new work. When coupled with innovations in Internet infrastructure and hardware, MOOCs also provide an opportunity for students in both developed and developing countries to access educational experiences from top-tier universities for the first time.
But the commercial value of MOOCs has not yet been proven. MOOCs’ main value-added may lie in serving as a lead-generation mechanism for for-credit, for-fee courses provided by institutions – sometimes referred to as “small private online courses” (SPOCs). Today, the billions of people who have left the formal K-12 education system are largely invisible to that system, though countless numbers would love to take courses from reputable schools. MOOCs could provide a large, untapped demographic to which SPOCs can market their for-credit or for-certificate offerings.
Given the business dynamics at work, it will likely be high production value, for-credit online courses that will play the central role in the ongoing educational revolution. Before the advent of online education, we could not build a more efficient system in the United States, at scale. But now we can. The factory model of education is no longer necessary.
Revolution in Data-MiningEducation has always had the capacity to produce a tremendous amount of data – student proficiency data, student engagement data and content efficacy data to name some of the possibilities. Until recently, however, we have not been able to capture virtually any of it. With the potential of big data sweeping across industries – affecting social media, network monitoring, sentiment analysis, fraud detection, risk-modeling and marketing campaign analysis – technology has finally caught up. With our new capacity to capture data and analyse it, we can now use data to deliver personalized, world-class education on a global scale.
Educational data-mining is broadly defined as the process of developing new methods for using data to improve learning experiences. The field is closely related to that of learning analytics, which focuses more specifically on the application of these methods at large scales to predict student success and/or improve outcomes. Educational data-mining can perform advanced “user-modeling” to determine what a learner knows, what a learner’s behaviour and motivations are and how engaged the learner is with a given course. Learning analytics can determine when students are getting off-track, or when they’re becoming bored or frustrated.
By identifying and analysing patterns in educational data, technology can now do all of the following: personalize the learning process; predict future student performance and remediate pre-emptively; reduce administrative work for teachers; measure the efficacy of learning content; help publishers refine content; unlock the potential for cross-disciplinary education; gamify learning; aid in study habituation; conduct longitudinal studies; and facilitate community development and in-person activities (like study groups).
Ultimately, there is the potential for continuous improvement in all education products owing to the multiple feedback loops that provide valuable information to all parties. Students get immediate help on the next problem or piece of content they are tackling; teachers receive feedback each day on both individual students and their classes as a whole to guide individual intervention and class lessons; administrators can judge large-scale progress of their whole schools and district and state officials are able to see broad metrics quarterly or annually to inform overall initiatives. In
67Education and Skills 2.0: New Targets and Innovative Approaches
addition to user-modeling, the ability exists to profile learners into groups to allow for a deeper understanding of each learner, or a more productive collaborative learning experience among learners.
Categories of Educational Data
Educational data can be divided into five types: one pertaining to student identity and onboarding and four student activity-based data sets that have the potential to improve learning outcomes. They are listed below in the order of how difficult they are to attain:
1. Identity data: Who are you? Are you allowed to use this application? What administrative rights do you have? What district are you in? How about demographic information?
2. User interaction data: This includes engagement metrics, click rate, page views, bounce rate, etc. These metrics have long been the cornerstone of Internet optimization for consumer Web companies, which use them to drive sales and improve user experience and retention.
3. Inferred content data: How well does a piece of content “perform” across a group, or for any one subgroup, of students? What measurable student proficiency gains result when a certain type of student interacts with a certain piece of content? How well does a question actually assess what it intends to?
4. System-wide data: Rosters, grades, disciplinary records and attendance information are all examples of system-wide data. Assuming you have permission (e.g. you are a teacher or principal), this information is easy to acquire locally for a class or school. But it is not particularly helpful at small scale.
5. Inferred student data: Exactly what concepts does a student know, at exactly what percentile of proficiency? Was an incorrect answer owing to a lack of proficiency, or forgetfulness, or distraction, or a poorly worded question, or something else altoge-ther? What is the probability that a student will pass next week’s quiz and what can she do right this moment to increase it? Inferred student data are the most difficult type of data to generate. Doing so requires low-cost algorithmic assessment norming (standardization of assessment items) at scale. Why is this so important? Without the standardization of assess-ment items – a clear understanding of
what each item assesses and at what level, it is difficult to determine what it really means for a student to answer questions correctly or incorrectly.
It is now possible to collect an unprecedented level of data per student per day and, as a result, capture and analyse data across these five categories.
Big Data and Education
Why exactly is education particularly suited for big data in the first place? What makes the industry uniquely suited for the potential of big data? Academic study requires a long period of engagement – students take a given course over months or even a full year and they spend a great deal of time each week on homework and other assignments. As a result, educational data sets are as broad and deep (if not more so) than those produced in other industries – such as consumers shopping online for a few minutes each day or users engaging in social media for a few hours each day.
What truly distinguishes the data produced by students from that produced in other fields like e-commerce is the very high degree of correlation between educational data and the aggregated effect of all those correlations. If, for example, a student has demonstrated a mastery of fractions, algorithms can reveal how likely it is that he will demonstrate a mastery of exponentiation as well – and how best to introduce that concept to him. The hierarchical nature of educational concepts means that they can be organized in a graph-like structure, which allows a student’s flow from concept to concept to be optimized over time.
Anonymizing these data allows students to reap all the benefits of these technological innovations while preserving their privacy. No personally identifiable information need be collected from students. Because educational business models are subscription-based (and intrinsically linked to learning outcomes) – rather than ad-supported like the consumer web business models of Google, Facebook, etc. – educational data-mining will naturally be used to improve learning outcomes and drive product development.
Learning Analytics
Data-mining provides the opportunity to make educational data much more transparent and useful to students, teachers, parents, administrators and others. Rather than using this data to market other products to consumers
within the platform, as is the case in many consumer Web business models, educational software providers can use concept-level learning analytics to improve learning experiences and outcomes.
Analytics allows teachers and others to assess student progress, predict future performance and identify any issues early on. Learning experiences can be personalized to every student, providing the most effective materials and instruction possible. Furthermore, big data makes it possible to move beyond observed metrics, such as test scores and homework performance. “Inferred metrics” can communicate far more complex and meaningful measures of performance. How well would a student do if tested on a particular set of educational content? Was an incorrect answer on a test question more likely due to a lack of proficiency or to a poorly written question or to a lapse in student engagement? What is the probability that a student will complete all of next week’s assignment and what steps can be taken to improve that percentage?
Inferred student data are very difficult to generate and provide extremely useful insight – and context – for students, teachers, administrators and parents alike. Teachers can shape their lesson plans and individual help depending on what students need most. Administrators can understand not only how well students in a class or across a grade level are performing but also what factors are contributing to that performance.
Content analytics can help teachers, publishers and administrators determine the strongest and weakest aspects of their educational content. Content can be analysed for fine-tuned improvements so that students are never stuck with outdated or ineffective materials. Content analytics can ensure that effective content is promoted and weaker content improved or replaced.
Adaptive Learning
Thanks to advances in data science and machine-learning techniques, it is possible to provide every student in a classroom with a personalized learning experience. In the next few years, it seems likely that the majority of learning applications (known as “apps”) will be not only digital but also adaptive. But there is a potential obstacle to such a world. While it is relatively straightforward to make simple differentiated learning apps, it is extremely difficult to make proficiency-based adaptive learning.
Education and Skills 2.0: New Targets and Innovative Approaches68
What is the difference? Data. Specifically, concept-level proficiency data for each student, which goes way beyond “observable data” like time scores or time taken. Capturing a student’s performance on a test or assignment does not account for the difficulty of the material, the concepts to which it has relevance or a student’s prior experience on similar content. A true model of proficiency can estimate what students know, how prepared they are for further instruction or assessment, and how their abilities evolve over time.
In other words, concept-level proficiency data is not what a student did, but what the system is confident that he or she knows, at a granular level. To extract this information, it is essential to have large pools of “normed” content. But doing so requires infrastructure to passively, inexpensively and algorithmically norm content at scale, as well as infrastructure to make sense of and take action on the resulting data. These infrastructures – when complemented by infrastructures to turn that insight into great product features to help students, teachers and parents – facilitate true adaptive learning.
Learning apps powered by such systems can respond to each individual’s performance and activity in real time, maximizing the likelihood a student will obtain her learning objectives by providing the right instruction, at the right time, about the right thing. Such a system can predict, with extremely high accuracy, how a student will perform on concepts that have yet to be introduced and, if necessary, remediate her in advance to prevent failure. Teachers can use this information to shape lessons around the group’s average understanding of concepts and optimize one-on-one time to focus on students who are struggling the most.
Teachers have for decades understood the importance of “differentiated instruction” – the process of tailoring instruction to meet individual learners’ needs. At last technology has evolved to the point where we can produce instruction that is differentiated on an atomic or granular level.
Industry Barriers Education has always been resistant to change. It is such a high-stakes industry – right up there with food, shelter and medicine in importance – that practitioners are reluctant to try unproven innovations that could possibly lower outcomes. Moreover, in education in particular, people are attached to longstanding habits and strongly defended interests that also slow innovation.
Regardless of industry, innovation is by its nature nearly always incremental. Tectonic innovation is extremely rare. It is only by adding myriad small innovations that most industries see steady product improvement over time. But, until recently, education has been one of the world’s most difficult industries to measure and, of course, it is especially difficult to measure small changes.
Despite these challenges, education is right now undergoing a massive shift. In some countries, the Internet is revolutionizing the way today’s students learn. But for the revolution to be fully realized, there are still battles to fight and barriers to overcome.
Expanding Credit Acceptance Policies
Right now, nearly all higher education and K-12 schools will readily accept credits from in-person courses that their students have taken at other schools. As the number of online courses from accredited schools continues to grow, it only makes sense that schools accept credits from these courses as well. Encouraging institutions at all levels to expand their credit acceptance policies to accept without friction online courses from any legitimate school is crucial to accelerating overall education innovation.
Such policies are likely to be inevitable within the decade. But those schools, colleges and even nations that get there first will have a long-term advantage over those who wait. Encouraging schools to start accepting these credits right now, without onerous terms and conditions, will in turn encourage more schools to produce high-quality online courses – which will encourage more students to take them and more innovators to power them, with ever better features.
What effects would this widespread credit acceptance have?
First, students would have access to a greater number of courses in subjects that they would not otherwise encounter. A community college student could
experiment with courses in subjects her school does not offer, or from four-year schools that she is interested in attending. An ambitious high-schooler lacking local AP (advanced placement) course offerings could take them online.
Second, elementary school kids would have a huge selection of language courses to choose from (currently, many elementary schools do not offer any on-ground language classes, even though this is the best time for children to start a second language). A student who, owing to her unique developmental path, should be in higher-level or lower-level courses than the rest of her cohort, would be able to do so online without a stigma. Home-schooled kids, kids with special needs, kids who just want to do a little extra – all of them would have a huge online library of classes to choose from.
Third, schools needing to generate their own revenue could further leverage their on-ground operations to earn high margin revenue by offering online courses in what they teach best. Schools buying those courses would provide increased academic opportunities for their students at a relatively low cost. In some cases, the schools buying the courses could charge the provider school a processing fee and turn the acceptance of online credits into a modest profit centre. (Or perhaps they could charge parents or receive state financing assistance.) The schools accepting these credits would also free up additional capacity on campus. This would benefit all types of schools: colleges and private schools could accept more on-ground students and generate much more tuition, while public schools could reduce classroom-overcrowding problems. In New York City, these problems have reached such proportions that students are commonly denied entrance at their neighbourhood public school and bussed across town instead.
Fourth, this new credit “marketplace” would solve many of the problems that currently impede innovators. For one thing, it would significantly improve measurability. With hard student outcomes data, online learning technologies that work will spread quickly, as useful technologies do in every other Internet endeavour.
Fifth, this marketplace would also consolidate activity and buying power. Right now, entrepreneurs are so daunted by selling to schools that many are dissuaded from entering the industry altogether. Of those who try, many cannot raise capital from wary investors, or find that their distribution model is difficult to

69Education and Skills 2.0: New Targets and Innovative Approaches
scale. An ecosystem in which the best ideas can be measured and easily distributed would also help the natural entrepreneurs already inside the system – the teachers – spread best practices through a competitive online marketplace.
The most important concern in promoting an ecosystem of ready online credit acceptance is maintaining quality standards for every online course. The presence of such quality standards will make it possible for any school that would accept another school’s credit from a transferring student to accept that school’s online credit as well.
As the educational landscape continues to evolve rapidly, it is incumbent upon everyone – policy-makers, entrepreneurs, teachers, administrators, students and other stakeholders – to support the good while minimizing the bad. Encouraging widespread credit acceptance of online courses from reputable schools is the most immediate, and least disruptive, way to turbocharge innovation and demonstrably improve outcomes for students and schools.
Increasing Digital Inclusion
As education increasingly moves online, the need to increase digital access for all students and families is crucial. Lack of adequate infrastructure and lack of digital literacy are two core causes of the digital divide. Both must be addressed to achieve mass connectivity. In the United States, efforts are under way by a variety of organizations to bring reliable broadband infrastructure to every K-12 school in the country. Currently, 80% of US schools lack enough bandwidth to take advantage of all the possibilities of digital learning – such as Internet video, social learning, big data and cloud-based education. If students are to get the most out of online courses, appropriate infrastructure needs to be built up in schools everywhere.
In 2010, the Federal Communications Commission (FCC) created the National Broadband Plan to work towards increased broadband access in homes, schools and other institutions. Among many goals, the plan aims to provide at least 100 million American homes with access to high-speed connections by the year 2020. Other organizations have also taken up the cause – not-for-profits like Education SuperHighway and Connect2Compete are working to help ensure that every US public school is able to take advantage of digital education.
Of course, the United States is not the only country in need of adequate infrastructure. According to the International Telecommunications Union, only 39% of the world population currently uses the Internet. In developing countries, the percentage of users is only 31%, compared to 77% in the developed world.
There are a variety of projects under way that attempt to increase these numbers. Google’s Project Loon involves a network of balloons, set out on the edge of space, that provide Internet access to people in remote areas and can help fill coverage gaps. One Laptop Per Child provides children in developing countries with rugged, low-cost computers. An organization called Green Wi-Fi uses solar energy to bring Internet access to “last mile” areas. The Kenya-based NGO Ushahidi has developed a device called BRCK, part modem and part Wi-Fi router, which has eight hours of battery life to allow it to work if the power goes out (common in rural Africa). A variety of organizations are introducing rugged, low-cost tablets with extended battery lives to students and others in developing nations.
This is just a tiny sample of the ideas out there. New ones emerge every day and the most effective and scalable solutions remain to be seen. Maintaining a steady focus on expanding infrastructure and innovative hardware solutions is key to increasing access to digital education to students. Increasing digital literacy – the capability to find, analyse and create information using digital technologies – is also critical.
Digital literacy is necessary to build a knowledge economy. Training in basic computer skills enables students to find and understand information communicated through technology. It also empowers individuals with the vital skills to solve problems in a scalable, sustainable way. According to the ECDL Foundation, “improved rates of digital literacy and access to [Information and Communications Technology] can help to ‘leapfrog’ the lag in education levels between those of more developed countries through improved teaching methods, and the potential to access the informational resources available through technology”. Digital literacy gives individuals the skills they need to make use of new education options like MOOCs; increased education can help alleviate poverty rates in developing countries by providing individuals with the skills they need to play a more productive part in the local economy.
Endnotes1. http://www.insidehighered.com/news/2013/05/10/
new-study-low-mooc-completion-rates.
2. http://www.onlinelearningsurvey.com/reports/changingcourse.pdf.
Education and Skills 2.0: New Targets and Innovative Approaches70
Much Needed and Still Useful After All These Years Across the world, the view of ageing
workers as ill-equipped to meet the physical demands of work and ill-suited to the new roles and expectations of the modern economy persists. It is a view that has dissuaded employers from engageing in human resource (HR) practices that could help them better recruit, engage, train and retain mature workers (see Box 1).1 It has also limited the number of initiatives undertaken collaboratively across key stakeholders – employers, governments and academia – to enhance the productivity of mature workers. Take these two examples from the United States and Singapore:
- A study of companies in the United States found that a majority surveyed had made no special provisions for older workers despite the ageing of the workforce.2
- A study of mature workers in Singapore found that those over 50 have the highest unemployment rate and took longest to secure a job because of employers’ negative perceptions of mature workers.3
Among the reasons employers cite for their lack of enthusiasm for mature workers – despite positive perceptions of this group’s work experience, knowledge, loyalty and work habits – are higher compensation costs compared to younger workers and the costs of training mature workers in new technologies. In addition, employers hold many negative stereotypes: that mature workers are less productive than younger workers, produce lower quality work, are less mobile and are resistant to change.4
Our view is that ignoring the mature workforce may ultimately prove damageing to employers. Despite years of recession or sluggish growth, employers across the world are struggling to find employees with the skills they need for business success.
Limiting the hunt for critical skills to those
Chapter 9: Older and Wiser: Tapping the Full Potential of the Mature WorkforcePatricia A. Milligan and Patty P. Sung
Education and Skills 2.0: New Targets and Innovative Approaches70
71Education and Skills 2.0: New Targets and Innovative Approaches
under 50 unnecessarily restricts the field and increases the difficulties employers face. At the same time, the ageing of national populations – a phenomenon that is taking place in many developed and developing countries alike – means that both public policy-makers and employers have a large stake in ensuring that the mature segments of their workforces are capable of performing needed, and often changing, tasks. If these workers are left behind, they will suffer – but so too will businesses struggling to find the talent they need to compete, and societies burdened by individuals unable to contribute (see Box 2).
Fortunately, many innovative solutions exist to cope with this new workforce challenge. But so far, efforts to solve the problem have been pursued mainly on a piecemeal basis by individual entities – an approach that is insufficient to meet the needs of an ageing workforce or the threat of skills shortages and brain drain owing to major demographic shifts. While markets may ultimately adjust to bring the supply of labour into line with the needs of employers, employers are facing a possible global talent crisis in the short- and medium-term.
Fully leverageing the mature workforce for growth will require employers, governments, nongovernmental organizations (NGOs) and educational institutions to work together at the industry or national level to find ways to retain mature workers, prepare them for new job demands and facilitate the transfer of skills and knowledge to the next generation. This chapter tries to inform the debate by highlighting some of the steps that trailblazing stakeholders are taking to ensure that mature workers are well prepared and well utilized – and that their significant knowledge and experience is transferred to the generations coming up behind them.
Box 1: What Do We Mean by a Mature Workforce?We define a mature workforce as that portion of the workforce born in 1963 or earlier that is now aged 50 years and older. This includes most of the “baby boom” generation, those born during the first two decades following World War II in the US, Canada, Europe, Australia and New Zealand. The mature workforce encompasses not only those workers approaching retirement, but also retirees who re-enter the workforce.
Box 2: The Benefits of Fully Leverageing Mature Workers The returns to individual businesses that proactively accommodate mature workers, build on their talents and engage them to pass on their skills and knowledge to younger workers are substantial. Many of these employers are enjoying higher retention rates, lower recruiting costs and lower absenteeism as a result of policies and programmes aimed at hiring, training, accommodating and retaining mature workers. Moreover, with workforces that more closely mirror their customer bases, many have seen improved customer satisfaction and, with it, improved results.
The returns to nations are no less significant. Given ageing populations, accessing sufficient human capital to fuel economic growth and enhance national competitiveness will require all members of the workforce – not just the young – to be well utilized.
Of course, mature workers themselves stand to benefit from smarter policies designed to better train and deploy them. Individuals can achieve increased financial security as well as increased personal satisfaction – outcomes that strengthen their families and communities as well as themselves.
Global Trends Create Urgency for Lifelong LearningEmbracing mature workers – and ensuring that they are prepared for continued productivity – is critical to the success of businesses, the growth of economies and the security and prosperity of individuals as they age. Four significant trends are contributing to the urgency:
Trend 1: Changing Demographics
Dramatic changes in the composition of the global workforce are driving the need to ensure the productivity of all segments of the population, including mature workers. Across many key markets, populations are ageing and mature workers are making up an increasingly large share of the total workforce. Worldwide, the number of people over
age 60 is expected to increase from 810 million in 2012 to more than 2 billion in 2050.5
In the United States, the share of the labour force ages 55 and older grew from 13.1% in 2000 to 21% in 2011 and is expected to increase to 25.2% by 2020.6 This shift is being driven by demographic changes – the US median age increased from 32.9 in 1990 to 37.1 in 2012 – and by higher participation rates among older people who either do not want or cannot afford to retire. According to the AARP, 79% of US baby boomers do not plan to retire at age 65 for financial or personal reasons.7
Other mature economies are going through a similar transition. In Germany, the percentage of workers over age 60 is expected to increase from 26% in 2011 to 38% in 2050.8 Similarly, over a third (38%) of Italy’s workforce and 42% of Japan’s are expected to be over the age of 60 by 2050. Over that same period, China’s 60-plus population is expected to increase by 21% and the Republic of Korea’s by 23%. By 2050, Korea will have one of the oldest populations among OECD countries.9
Many emerging markets are also dealing with an ageing workforce. The share of the population age 65 and over will reach 17% in Argentina, 20% in Mexico and Brazil and 22% in Chile by 2050.10 In Russia, the elderly population will make up 26% of the total population by 2050.
Trend 2: Economic Uncertainty
Volatile economic conditions in the wake of the recent global economic crisis have accelerated the trend toward an ageing workforce as employees delay retirement because of financial concerns. In many countries, the risks and costs of funding retirement are being shifted away from government and employers to the individual, with increases in government retirement ages and decreases in the coverage rates of defined benefit plans. Insufficient retirement savings and pension shortfalls mean that many mature workers cannot afford to retire when originally planned.
In the United States, 22% of workers in the 2013 Retirement Confidence Survey (RCS) say the age at which they expect to retire has increased in the past year. Workers most frequently cite the poor economy (22%), followed by a lack of faith in social security or the government (19%) and the inability to afford retirement (19%), as reasons for postponing retirement.11
Education and Skills 2.0: New Targets and Innovative Approaches72
In other countries, the age at which employees can retire and collect pensions has been raised to reduce the drain on public finances and keep needed workers in the workforce longer. Finland, for example, raised the age at which retirees can receive a government pension in 2000 from 59 to 63–68 as decided by the individual worker.12
Trend 3: Industry Brain Drain
The changing demographics of populations around the world mean that employers have a smaller pool of new talent at their disposal. This is putting pressure on industries that require highly trained talent or specialized skills and whose current workforces are ageing.
In the US healthcare industry, the workforce is ageing and will be difficult to replace as individuals retire, according to the Institute of Medicine. As of January 2007, nearly 25% of physicians were 60 years old or older. By 2020, nearly 50% of all registered nurses will reach the traditional retirement age of 50. In addition, the number of dentists expected to enter the field by 2020 will not be sufficient to replace those likely to retire.13
One of the biggest risks facing the global oil and gas industry is an impending significant change in industry personnel and a potential shortfall of qualified technical talent in the future. More than 25% of petrotechnicals – geoscientists and petroleum engineers – currently working for exploration and production companies are over age 50 and many are expected to retire by 2016. These 22,000 experienced professionals are expected to be replaced by about 17,000 young petrotechnicals in the pipeline.14 Not only will this result in vacancies, but the industry is bracing itself for a huge loss of knowledge and experience.
Major skills shortages already exist in the United Kingdom in professional services including accounting, finance, IT, engi-neering and marketing. The ageing workforce is projected to exacerbate this problem over time. For example, accord-ing to one report, the United Kingdom will face a shortfall of 10,200 qualified accountants by 2050.15 Similarly, Canada faces a skilled trades workforce crunch as significant numbers of its mechanics, welders and construction workers near retirement. Findings from Canada’s 2011 National Household Survey indicate that a labour shortage in the skilled trades is looming because a smaller proportion of the country’s younger workers (those aged 25–34) holds a trades certificate compared with those aged 55–64.16
Trend 4: Technology Advancement and Social Media
Rapid technology advancements and the widespread use of social media are significantly changing the work environment of the 21st century. Computers, smartphones, the Internet and social media are just some of the elements changing many work processes as well as the tasks and skills required of workers. Moreover, accelerated technological change is likely to be ongoing, requiring all workers to continually upgrade their skills to remain competitive.17
In this environment, the adaptation of mature workers to new technology is a pressing concern. Studies show that while mature workers possess valuable institutional knowledge and experience that greatly benefit employers, they are less adept in using technology compared to younger workers and are more likely to retire when employers introduce new technology.18 For example, a 2007 study of individual differences in performing computer-based tasks found that age was one factor impacting both performance and the change in performance resulting from practice and experience.19
This does not mean, however, that mature workers are unable to master new technology. Although research has shown that mature workers need more time, practise and environmental support than younger workers to learn new skills, training has proven effective in helping them develop the technology skills they need and level the playing field across generations.20 Unlike younger workers who take technology for granted, though, mature workers respond best to training conducted in small classes and in which trainers help learners recognize the need to know the new technology being introduced, how it will help them better perform their tasks or handle routine workplace problems and how it will improve the bottom line.21
Yet employers’ perceptions about the adaptability of mature workers remain a barrier. A survey of 800 Dutch managers found that most see mature workers as less adaptable and more resistant to innovation and technical change than younger workers. Similarly, 400 employers participating in an AARP survey characterized workers aged 50 and over as more resistant to learning new technologies than workers under 50.22
Predictably, these beliefs have resulted in a dearth of training opportunities for mature workers. According to a recent report, employers are much more likely to provide training to early- and mid-career employees, denying similar training opportunities to mature workers.23 A study of Canadian workers found that between July 2007 and June 2008, 45% of workers age 25–54 took at least one job-related course or programme compared to 32% of those age 55–64.24 And with less support for their learning, mature workers tend to engage in fewer training opportunities, causing their skills to fall behind.
Unfortunately, adding to the challenge are the self-perceptions of mature workers themselves. Studies have indicated that some ageing workers are dissuaded from participating in training because they too have bought into stereotypes about age-related performance declines and therefore see little benefit in participation.25 In other words, beliefs about age among mature workers themselves are factors preventing them from accessing and benefitting from technology training.
Thus the circle is complete: the failure of employers to proactively train mature workers helps to realize a mature workforce less willing to participate in training and, therefore, less adept in using new technology. Unless employers commit to continuous learning for their older workers, they may see productivity declines when it comes to the adoption of this technology.
Together these trends underscore the necessity of ensuring that mature workers are a productive part of the workforce of the future. The dramatic demographic shifts underway combined with continuing rapid technological change is creating an urgency for employers and governments to act. Failure to tap the full potential of the mature workforce is likely to cause serious economic harm to businesses struggling with talent shortages and to vast and growing numbers of workers over 50 who want and need to remain productively employed.
Practices for Leverageing Mature Workers to Enhance Growth What types of innovative solutions are being tried to better engage mature workers? Employers today are facing two major hurdles – preparing for the retirement of the large generation born in
73Education and Skills 2.0: New Targets and Innovative Approaches
the decades following World War II without sufficient skilled workers to replace them and manageing multigenerational workforce productivity issues. By and large, they are facing these hurdles with limited support from government and academia. While the case studies included below feature some examples of partnership among stakeholders, most detail the actions of individual employers, with a focus on the two key target groups: mature workers and retirees (see Box 3).
Box 3: Targets for New InitiativesNew approaches to better leverageing existing knowledge, enhancing skills and improving productivity are urgently needed for two key segments:
Mature workers. Mid- and senior-level workers in their 40s and above need access to continuous learning so they can keep their skills in sync with new technology, business models, work styles and modes of communication. In addition, highly skilled mature workers in declining and sunsetting industries could be effectively deployed to other growing industries with the appropriate retraining. This shift would benefit workers, their families and communities and the companies struggling to find the talent needed to fuel growth. Mature workers also represent a vast pool of knowledge and experience that must be effectively tapped to ensure the highest level of productivity for society. Plus current and looming talent shortages make it essential that businesses find ways to retain and improve the productivity of their mature workers.
Retirees. Many retirees either need to re-enter the workforce to supplement pensions and retirement savings or would like to be professionally engaged, although perhaps with greater flexibility in their schedules or locations. Mercer’s recent Talent Barometer study found that less than 4% of companies across all industries tap this potential source of talent to fill critical skills gaps. Some industries are more aggressive than others – in the oil and gas industry, 12% of companies rely on retirees to fill critical gaps.26 Retirees have experience, knowledge and flexibility, all of which can be leveraged to close the widening skills gap.
Successful organizations are using three levers, individually or in combination, to close skills gaps, transfer knowledge and enhance productivity: (a) retaining mature workers to close critical skills gaps in the short term; (b) leverageing the extensive knowledge and experience of mature workers and retirees to prepare the next generation workforce; and (c) recruiting and reskilling mature workers and retirees for new roles and new fields.
Lever 1: Retaining Mature Workers to Close Critical Skills Gaps in the Short Term by Implementing Progressive HR Policies and Creating an Environment that Fosters Productivity
Mature employees often possess a wealth of institutional knowledge and experience that greatly benefits their employers. Keeping these employees on the job and maximally productive is one important way that businesses can combat looming skills gaps and facilitate knowledge transfer to younger workers in the pipeline.
An increasingly popular way to try to retain mature workers is by rethinking traditional work schedules. Abbott Laboratories, a US global pharmaceutical and healthcare products company, introduced a phased retirement programme called Freedom to Work to encourage mature workers to work longer. One component, the Custom Schedule programme, provides employees with the option to take an additional five weeks of vacation or work four days per week with reduced pay but without affecting benefits. Another component, the Emeritus programme, allows employees to change job responsibilities without changing their pay. Since Freedom to Work began in 2008, about 500 US employees have enrolled and 97% of participating employees and 89% of managers say they are satisfied or very satisfied with the programme. Additionally, 84% of managers say it has aided in knowledge retention.27
The Aerospace Corporation, a nonprofit that conducts research and development for the US Air Force, created a “Retiree Casual” pool programme to retain the valuable institutional knowledge held by its most experienced employees. The programme allows retirees to be hired back for up to 999 hours per year at the same salary they earned when full-time employees while also receiving pension benefits.
MITRE, a not-for-profit that provides systems engineering, research and information technology support to US government agencies, has a workforce with an average age of 47. The majority of its workforce has more than 20 years of technical experience. Fearing the loss of that experience and intellectual capital, the organization implemented a part-time on-call programme in 2001 that enables mature workers approaching retirement and those already in retirement to provide short-term support for complex projects. This gives them the opportunity to scale back their careers while still continuing to contribute their critical skills and pass on their specialized knowledge to less experienced employees.28
Fidelity Investments, a US multinational financial services corporation, opted to hire mature workers desiring part-time work to cover peak hours, instead of hiring full-time employees to staff its call centre. This not only maximizes the productivity of its call centre, but also offers greater flexibility. Customer satisfaction has increased because those calling the centre – primarily those preparing for or in retirement – are now talking with more experienced staff who are at a similar stage in life and can relate to the callers’ circumstances and concerns.29
Creating learning environments to boost engagement and productivity can also help employers retain critical workers and skills. Wells Fargo, a US-based multinational banking and financial services company, created a Boomers Network to focus on career development of its mature workers. The Network has partnered with St Catherine University in Minnesota to offer a custom graduate certificate in organizational leadership. The programme’s courses are offered on-site at Wells Fargo and tuition can be reimbursed. Employees who have participated in the programme have benefited from their new ability to contribute to the firm through research and projects, as well as their increased self-confidence and leadership ability. At the same time, the company has benefited from developing a cohort of leaders across the firm who share common leadership concepts and abilities.30

Education and Skills 2.0: New Targets and Innovative Approaches74
Changing the physical work environment can also help boost the retention and productivity of mature workers. Aerospace Corporation’s ergonomics programme offers employees an assessment of their workplace environment to ensure that desks, chairs and work environments properly support the workers.31 In Germany, BMW overhauled its physical space in a way that has boosted mature workers’ productivity and the quality of their output (see Box 4).
Box 4: BMW: From Barbershop Chairs to Magnifying LensesIn 2007, to prepare for an expected increase in the average age of the workforce in its Bavarian plant, BMW, the German automobile, motorcycle and engine manufacturing company, conducted an experiment. It staffed an assembly line with workers with an average age of 47 and then made 70 small, ergonomic changes to see if adjusting the work environment for mature workers would increase employee productivity. The company added barbershop chairs so that workers could sit while working; wooden floors to aid knees; angled monitors, large typeface on computers and magnifying lenses to reduce eye strain; large-handled gripping tools to reduce strain on hands; stackable transport containers to ease physical strain; and manual hoisting cranes to reduce strain on backs. It found that workers could stay at the mild/moderately straining workstations for an entire shift but needed to rotate between the most and least physically demanding stations to reduce the chance of injury.
From its investment of €40,000, the company boosted productivity on the line by 7% over one year, making it just as productive as lines staffed by younger workers. Moreover, the line staffed by mature workers produced higher quality products than other lines. And during that first year, absenteeism dropped dramatically, from 7 to 2%. Now, six years later, the lessons learned from the experiment have been implemented on most of its assembly lines globally, impacting over 10,000 employees and are currently being piloted in office settings.32
Lever 2: Leverageing the Extensive Knowledge and Experience of Mature Workers and Retirees to Prepare the Next Generation Workforce
Given the ageing of the workforce, a growing and substantial percentage of employees in many companies are approaching retirement age. The potential loss of knowledge and expertise this represents could deal a serious blow to business success. In many industries, the knowledge required cannot be acquired solely through a college or university education but must be gained on the job. Thus, organizations need programmes to facilitate the transfer of critical knowledge from mature workers to the next generation, ensuring their readiness to assume new roles and the company’s future success.
Some leading employers are doing this by pairing near-retirees with their successors for a period of time. Western Australian Petroleum Proprietary Limited (now Chevron Australia), an oil and gas exploration and processing company, incentivized near-retirees to spend their last three months on the job mentoring their successors by offering reduced schedules without reducing pay.33
Others are focusing on mentoring programmes. General Electric, the US multinational, created a network to enhance professional growth for women, particularly in the technical and engineering fields where it faces impending shortages. First launched in 1997 and now operating in 43 countries, the programme provides mentors to new hires and develops new and existing talent through workshops and networking activities.34
KPMG LLP, the US member firm of KPMG International, a professional services network, began a mentoring programme in 2004 that now encompasses over 10,000 mentoring relationships and offers less experienced workers access to and interaction with more senior professionals, personalized feedback, the potential for mentoring relationships to evolve into sponsorship opportunities and much more.35 Mentorships also enable the transfer of knowledge from seasoned workers to those with less experience. The turnover rate in 2008 for employees with mentors was 17 to 18% lower than the turnover rate for employees without mentors.36
Lever 3: Recruiting and Reskilling Mature Workers and Retirees for New Roles and New Fields
Historically, learning has been seen as a process that begins at the primary level, progresses to secondary education and ends with higher education. But as careers begin to span five and even six decades, learning that ends in early adulthood is insufficient to elicit individuals’ best work over entire careers. Leverageing this talent pool for maximal returns will mean designing continuous lifelong learning opportunities to support talent development.
Forward-thinking companies are launch-ing initiatives to reskill mature workers to take advantage of their experience and perspective. Many are finding that they can reduce recruitment costs and absenteeism while increasing retention by focusing on this often-neglected seg-ment. Employers are also finding that mature workers are highly productive once established in a role and can help improve the customer experience.
Westpac, an Australian bank, created a plan in 2002 to hire and train 900 recruits over the age of 45 for various roles including that of financial advisor. The company believed this would improve the overall customer experience and thereby strength-en the brand because older customers would feel better understood by older workers.37 Besides providing better customer service, these employees exhibit lower turnover and longer tenure, lowering the bank’s recruiting and training costs. An integral part of spurring the hiring of mature workers in the company was providing age-balance training to managers to combat stereotypes about the ability and productivity of mature workers and highlight the benefits of hiring mature workers.38
L’Incontro Cooperative, an Italian, nongov-ernmental social services organization, actively recruits workers over the age of 40. For example, one unit within the cooperative employs retired nurses as social workers while another employs retired art teachers as art therapists. L’Incontro targets mature workers for two reasons: the shortage of highly-skilled workers, particularly in the nursing sector, and “the possibility of having a highly flexible workforce, while limiting service costs”. Major improvements have been noted in the quality of client services and overall staff management. Absenteeism among the entire staff has decreased since flexible scheduling options have spread from mature workers only to all employees.39 Turnover has also decreased as a result of sourcing older workers.40
75Education and Skills 2.0: New Targets and Innovative Approaches
The public sector can also play a pivotal role. In the United States, the government created a three-year Ageing Worker Initiative (AWI) to better understand and prepare for demographic shifts. The initiative explored how best to serve mature workers and create business models to suit their needs. In 2009, AWI awarded US$ 1 million grants to 10 organizations to provide individuals aged 55 and older jobs and advancement opportunities. Targeted workers included mature workers who were seeking re-employment, those working beyond traditional retirement age who needed training and those who faced barriers from disabilities.41 A 2012 evalua-tion found that about half of the exited participants had obtained unsubsidized employment by that time. It also found that assistance with career planning and the provision of personalized support were particularly effective in helping mature workers with re-employment.42
In Australia, technology training is key in removing barriers to workplace participa-tion for mature workers. The government of New South Wales partnered with Telstra, an Australian telecommunications company, to create a technology training programme for seniors. Tech Savvy Seniors provides free or low-cost training on computers, tablets and smart phones to older citizens. The public–private partnership provides funding and training through 35 community colleges as well as a library network focused on rural and regional areas. The programme also provides self-training DVDs available through these libraries as well as online, self-training videos. This programme is a part of the New South Wales Ageing Strategy, which seeks to provide better learning, career and lifestyle opportunities for the ageing Australian population.43
In Canada, the government’s Targeted Initiative for Older Workers (TIOW) programme, launched in 2007, helps workers between the ages of 55 and 64 who are living in communities of less than 250,000 residents to remain productive participants in the workforce. So far, 402 TIOW projects have been implemented, at a cost of C$ 270 million, giving nearly 32,000 unemployed mature workers in communities across Canada access to training and employment programmes.44 The results of a programme evaluation reveal that 75% of surveyed participants found employment during or after their participation in a TIOW project and that skills obtained helped them transition into new sectors or occupations. At the same time, employers reportedly appreciated the ability to fill gaps in their workforce with experienced workers.45
Combining Multiple Levers for Enhanced Results
Some companies are implementing policies and practices that combine more than one of the three levers described above to close skills gaps, transfer knowledge and enhance productivity – in fact, Central Baptist Hospital in Kentucky uses all three (see Box 5).
CVS/Caremark, a US pharmacy chain and drug retailing company, allows its mature workers to transfer from store to store on a seasonal basis (Lever 1). This Snowbird programme not only reflects the lifestyle needs of the many older folks who migrate to the south from the northeast in winter months but has helped CVS/Caremark fill employment gaps that result from seasonal fluctuations in demand while retaining valuable institutional knowledge.46 As of 2011, about 1,000 employees had participated in the programme. Overall, CVS/Caremark has enjoyed retention rates for its mature workers that are significantly higher than the industry average, and it is better able to manage the increased business in warmer-climate stores during the winter.47
CVS also has recruitment and training programmes (Lever 3) targeting mature workers. Through its Talent is Ageless programme, CVS partners with local agencies to identify potential employees between the ages of 50 and 99 who meet CVS’s criteria. Candidates who are hired then go through a four- to six-week CVS “SucceSS Development” programme, during which mature workers are mentored by store associates who determine if they are appropriate for the job. Training is usually done at a slower pace than for younger hires because the process is customized to the mature worker to ensure that all hires are successful. The programme allows mature workers to acquire new skills to obtain a new career.48 As a result of its efforts across levers, over the past 20 years, CVS has increased the percentage of its employees over the age of 50 from 7 to 22%.49
Marriott, a global lodging company recently launched a proactive, multiphase ageing workforce study to identify issues and create a strategic plan to accommodate the changing demographics of its workforce – 43% of its US employees are now older than 45 and 18% are older than 55. Based on this plan, the company implemented several programmes to increase workplace flexibility and, thereby, employee engagement and business results.
- The cross-training programme (Lever 3) lets associates take shifts in other functional areas so mature workers can maximize hours and learn new skills without totally switching careers. It also helps mature workers access formal job rotations so they can alternate days on jobs that require significant physical strain with those that require less.
- The Work Process Design programme (Lever 1) pairs a younger worker with a mature worker and allows them to divide time and tasks while teaming up on other tasks. More physically demanding tasks can be assigned to the younger worker while the mature worker can do other tasks, fostering increased productivity overall.
- Another programme offers at-home agent positions for sales and customer care representatives (Levers 1 and 3). Attractive to both younger workers with children and retirees, this programme allows workers to fill telephone sales and customer service positions on an hourly basis from home. It has led to increased retention, reduced recruiting costs and productivity gains.
For Marriott, the changes have paid off. Of the 90% of the US workforce that completed a satisfaction survey about workplace flexibility and employee engagement in 2011, the majority responded that they have the flexibility they need. Responses from those over age 55 “were above the external [survey] vendor’s best employer benchmarks”.50
The National Institute of Health (NIH) – named number one on AARP’s “Best Employers for Workers Over 50” in 2013 – uses multiple levers to effectively leverage mature workers. This is critical to its success given that 47% of the organization’s employees are age 50 or over. Two of the ways that NIH actively recruits mature workers (Lever 1) are by participating in an annual 50-plus job fair and doing regular mailings to recent NIH retirees to let them know of current job openings. NIH also promotes the retention of mature workers by offering them flexibility through arrangements like flextime, compressed work schedules, job sharing and telecommuting. As a result, the average tenure of employees age 50-plus at NIH is 18.4 years.
Education and Skills 2.0: New Targets and Innovative Approaches76
NIH supports continuous learning by offering online training, certification classes and tuition reimbursement (Lever 3). Employees can work on temporary assignments in other departments or participate in mentoring and job rotation programmes to experience different fields. In a recent 12-month period, 100% of employees participated in at least one of the training opportunities offered, spending an average of eight hours in training.51
In Canada, Sodexo Canada – part of a global outsourcing company that provides food, housekeeping and facilities management services – launched initiatives across multiple levers to obtain the most value from its mature workers. To attract mature workers with extensive experience, it offers them a generous package of benefits (Lever 1). Although it allots three weeks of vacation time per year to inexperienced new hires, Sodexo offers up to 10 weeks of vacation per year to new hires with substantial experience. The company also offers formal career and succession planning and has extended employee benefits to those up to age 70 in the hope of attracting workers that have the ability to close the skills gap.
As a result, 32% of the company’s new hires in 2012 were over age 40 and 63% were over age 60.52
Sodexo also developed its Spirit of Mentoring Program (Lever 2) to assist in retention and knowledge transfer between the more and less experienced members of its workforce. The programme facilitates knowledge transfer in two directions: mature workers pass their knowledge to younger workers while also gaining insight into what drives and engages younger workers. The programme has three elements: Impact, Peer-to-Peer and Bridge. Impact includes more than 100 formal partnerships, while Peer-to-Peer is more informal and Bridge pairs new hires with frontline mangers to expand professional development opportunities.53 In 2007, the company’s return on investment for the programme was two to one, with most of the gain coming from increased productivity and retention.54
Box 5: Central Baptist Hospital Woos Nurses with Flexibility and Career Counseling Central Baptist Hospital (CBH) in Lexington, Kentucky, was experiencing challenges related to an ageing workforce. Many US hospitals are experiencing a worsening nursing shortage and experienced workers are expensive to replace. CBH’s own nursing staff was ageing, with the share of its 1,000 registered nurses (RNs) over age 45 increasing from 20% in 2002 to 34% in 2011. The hospital decided to act by implementing a number of programmes targeting highly skilled, mature individuals.
One component is a flexible scheduling policy (Lever 1) to keep mature, experienced workers on the job longer, although all employees can participate. CBH offers employees part-time, seasonal positions with full healthcare benefits, specific positions with shorter shifts and job or shift sharing. It also enables employees to move from full-time to part-time while remaining in the same position, or transfer to jobs with reduced patient responsibilities. Additionally, employees can request specific schedules and post schedules to an online website to facilitate shift changes.
A second component is the Career Coaching programme (Levers 2 and 3), which helps develop a leadership pipeline and retain talent. The programme facilitates knowledge transfer by providing nurses with support from a retired nurse coach. It also helps nurses develop action plans for attaining career goals, including recareering and continuing education. As a result, many nurses have returned to school to continue their education and develop new skills.
In combination, these programmes have enabled CBH to reduce its turnover and job vacancy rates to a level well below the national benchmark for healthcare. In addition, the percentage of its RNs over age 45 providing positive job satisfaction ratings increased from 65 in 2006 to 88% in 2010.55
Moving ForwardAs the major demographic and workforce trends converge, an increasing number of mature workers will want and need to remain in the workforce considerably longer than those of past generations. At the same time, employers will need more of them, given the relative lack of younger workers available, to power and grow their businesses. The rapidity of this change – combined with the accelerated pace of technological change in and out of the workplace – makes it imperative that employers and stakeholders in the larger society move quickly to prevent serious economic harm to businesses, communi-ties and individuals. They should:
Act immediately. The global workforce is already substantially older than it was at the start of the new millennium. If stakeholders are going to avoid serious disruptions they must act immediately to effectively recruit, retain and reskill mature workers while also leverageing their knowledge and experience to bring the next generation workforce up to speed.
Combine levers to maximize results. Increasing the productivity of the mature workforce will require the implementation of practices designed to pull all three of the levers described in this chapter. Only by retaining those mature workers with critical skills and experience, developing the means for those workers to transfer their skills and experience to the next generation and cost-effectively recruiting and reskilling mature workers to close talent gaps can employers fully leverage this growing segment of the workforce.
Invest in appropriate training for mature workers. Research into training the mature workforce has pointed to the efficacy of properly designed training in upgrading technology and workplace skills – and the relative lack of training opportunities available. To better leverage mature workers, researchers recommend:56 (a) targeting those who would most benefit from training; (b) using methods, materials and environments suitable to the ageing workforce; (c) holding multiple sessions rather than concentrating all training into one session and giving mature workers additional time to practice; (d) using mixed formats including self-directed, online and instructor-led training; and (e) linking training to current work.
Collaborate across multiple stakehold-ers to move the needle. The changing work and demographic landscape threatens not only individual employers but also entire industries and societies.
77Education and Skills 2.0: New Targets and Innovative Approaches
Yet there are too few examples today of collaborative efforts across multiple stakeholders aimed at fully leverageing the mature workforce. Instead, most employers are taking a piecemeal approach to reskilling and knowledge transfer. For maximum impact, the needs of employers and mature workers should be addressed at the industry or national level with the coordinated involvement of employers, governments and academia.
- Governments can: remove disincentives to workforce participation for mature workers. This might include allowing mature workers to make contributions to state pension plans that will increase benefits and removing penalties to employment income; educate employers about the need for and the benefits of utilizing mature workers and retirees; provide incentives to employers to hire mature workers; fund training designed by industry groups in collaboration with academia to give mature workers and retirees industry-specific and technology skills.
- Employers can: implement progressive HR policies to reflect the changing demographics of the workforce. These should offer mature workers increased flexibility in terms of their hours, schedules, work location and employment relationship; introduce ergonomic designs and initiatives to improve the health and wellbeing of mature workers to increase productivity; offer better training to upgrade and maintain skills; train managers on the effective utilization of mature workers’ skills.
- Academia can: study the impact of various methods of training mature workers to identify those most effective; set up training programmes in collaboration with industry. Research the skills needed by growth industries and the job skills of mature workers to identify industries suitable for skills transfer and guide the development of training programmes.
The returns to businesses, nations and the growing number of workers over 50 from these coordinated efforts will be substan-tial. From enhanced engagement, retention and productivity at the employer level to enhanced competitiveness at the industry and national levels, tapping the potential of the mature workforce will yield substantial economic benefits. At the same time, individuals who want to work both for personal satisfaction and financial security will benefit from holistic efforts to ensure that their work is both valuable and valued.
Endnotes1. M. Armstrong-Stassen, “Human resource practices for
mature workers – And why aren't employers using them?”, Asia Pacific Journal of Human Resources, 2008, 46, 334–352. doi: 10.1177/1038411108091755
2. F. Tishman, S. Van Looy and S. Bruyere, Employer Strategies for Responding to an Ageing Workforce, The NTAR Leadership Center, 2012.
3. J.W. Lim, Retire or Rehire: Learning from the Singapore Story. Skills Development for Inclusive and Sustainable Growth in Developing Asia-Pacific Technical and Vocational Education and Training: Issues, Concerns and Prospects, Vol. 19, 2013, 241–251, http://link.springer.com/chapter/10.1007/978-94-007-5937-4_13#.
4. F. Tishman, S. Van Looy and S. Bruyere, Employer Strategies for Responding to an Ageing Workforce, The NTAR Leadership Center, 2012.
5. Population Ageing and Development 2012, United Nations, 2012.
6. A. Hayutin, M. Beals and E. Borges (eds), Demographics of the Ageing Workforce – Summary, Stanford Center on Longevity, 2013.
7. S. Reeves, “An ageing workforce’s effect on U.S. employers”, Forbes, www.forbes.com/2005/09/28/career-babyboomer-work-cx_sr_0929bizbasics.html, 2005.
8. Global Population Ageing: Peril or Promise?, World Economic Forum.
9. Addressing the Challenges of the Ageing Workforce, IBM, 2004
10. Global Ageing and the Future of Emerging Markets, Center for Strategic and International Studies, 2011.
11. 2013 RCS Fact Sheet #2, Changing Expectations About Retirement, Employee Benefit Research Institute
12. Gray Skies Silver Lining, Conference Board, 2007.
13. L. Harrington and M. Heidkamp (eds), Ageing Workforce: Challenges for the Health Care Industry Workforce, The NTAR Leadership Center, 2013.
14. J.-M. Rousset, P. Bismuth and O. Soupa, “Technical talent shortage could begin to limit growth”, Talent & Technology, June 2011.
15. Tracy Barrett, “UK brain drain triggers accounting and finance skills shortage”, Press Association National Newswire, 2013.
16. J. Fekete, “Skilled trades workforce facing a ‘crunch’; Dire shortage will get worse”, http://www2.canada.com/windsorstar/news/business/story.html?id=806bf65d-d392-4ad8-b72c-4e520d8adf6d, 2013.
17. C.C. Lee, S.J. Czaja and J. Sharit, “Training older workers for technology-based employment”, Educational Gerontology, 2009, Vol. 35, Issue 1, 15–31.
18. T. Hægeland, D. Rønningen and K.G. Salvanes, “Adapt or withdraw? Evidence on technological changes and early retirement using matched worker-firm data”, NHH Dept. of Economics Discussion Paper No. 22/07, August 2007.
19. C.C. Lee, S.J. Czaja and J. Sharit, “Training older workers for technology-based employment”, Educational Gerontology, 2009, Vol. 35, Issue 1, 15–31.
20. N. Charness, “Work, older workers, and technology”, Generations, 2006, 30(2), 25–30.
21. “Training a multigenerational workforce”, Professional Safety, March 2012.
22. M. Malul, “Older workers’ employment in dynamic technology changes”, Journal of Socio-Economics, 2009, 38(5), 809–813, doi:10.1016/j.socec.2009.05.005.
23. F. Tishman, S. Van Looy and S. Bruyere, Employer Strategies for Responding to an Ageing Workforce, The NTAR Leadership Center, 2012.
24. “Job-related training of older workers, Perspectives on labour and income”, Summer 2012.
25. C.C. Lee, S.J. Czaja and J. Sharit, “Training older workers for technology-based employment”, Educational Gerontology, 2009, Vol. 35, Issue 1, 15–31.
26. Talent Rising High Impact Accelerators to Global Growth, Mercer, 2013
27. “Abbott Laboratories Global Citizenship”, www.abbott.com/citizenship/culture/workplace/worklife.htm.
28. Flex Strategies to Attract, Engage & Retain Older Workers, Boston College Sloan Center on Ageing & Work, 2012.
29. Fidelity Emerging Strategy, Boston College Sloan Center on Ageing & Work, 2008.
30. St Catherine University Master of Arts in Organizational Leadership, 2013–14 custom certificate in collaboration with Wells Fargo, programme brochure.
31. “2011 Best Employers The Aerospace Corporation”, www.aarp.org/work/on-the-job/info-09-2011/the-aerospace-corporation-aarp-best-employers.1.html, AARP, 2011.
32. C. Loch, F. Sting, N. Bauer and H. Mauermann, “How BMW is defusing the demographic time bomb”, Harvard Business Review, March 2010.
33. Addressing the Challenges of an Ageing Workforce, IBM Business Consulting Services, 2004.
34. General Electric’s Women’s Network, www.ge.com/careers/culture/diversity/womens-network.
35. http://www.kpmg.com/Global/en/careers/CareerNews/advance-your-career/Pages/take-five-mentor.aspx
36. Making Mentoring Work, Catalyst, 2010.
37. Business Boldness and Benefits: How Westpac Tackled the Ageing Workforce, HC Online, February 2005.
38. http://blip.tv/iir-conferences-australia/ir-interview-ross-miller-on-westpac-s-ageing-workforce-964823.
39. A. Walker and P. Taylor, Combating Age Barriers in Employment: A European Portfolio of Good Practice, 1998.
40. A. Walker, “Combating age barriers in employment: Findings from a European research project”, http://www.taloustieteellinenyhdistys.fi/esitelmiae/52-walkereng311000.html.
41. Ageing Worker Initiative: Strategies for Regional Talent Development, United States Department of Labor.
42. Evaluation of the Ageing Worker Initiative, Final Report, Social Policy Research Associates, 29 March 2013.
43. NSW Ageing Strategy, Department of Family and Community Services, 2012.
44. Correspondence from programme representative, 26 September 2013.
45. http://www.hrsdc.gc.ca/eng/publications/evaluations/skills_and_employment/2010/june.shtml.
46. Flex Strategies to Attract, Engage & Retain Older Workers, Boston College Sloan Center on Ageing & Work, 2012.
47. http://capricorn.bc.edu/ageingandwork/database/browse/case_study/24047.
48. Talent Management and the Prism of Age, Boston College Sloan Center on Ageing & Work, 2010.
49. Flex Strategies to Attract, Engage & Retain Older Workers, Boston College Sloan Center on Ageing & Work, 2012.
50. Flex Strategies to Attract, Engage & Retain Older Workers, Boston College Sloan Center on Ageing & Work, 2012.
51. “AARP Best Employers 2013 National Institute of Health”, www.aarp.org/work/2013-aarp-best-employers/national-institutes-health-aarp-best-employers, 2013.
52. Age of Wisdom, Brooke Smith, Benefits Canada, May 2013.
53. “Development and training”, http://www.sodexousa.com/usen/careers/development-training/spirit-of-mentoring.aspx, Sodexo.
54. Making Mentoring Work, Catalyst, 2010.
55. Flex Strategies to Attract, Engage & Retain Older Workers, Boston College Sloan Center on Ageing & Work, 2012.
56. F. Tishman, S. Van Looy and S. Bruyere, Employer Strategies for Responding to an Ageing Workforce, The NTAR Leadership Center, 2012.
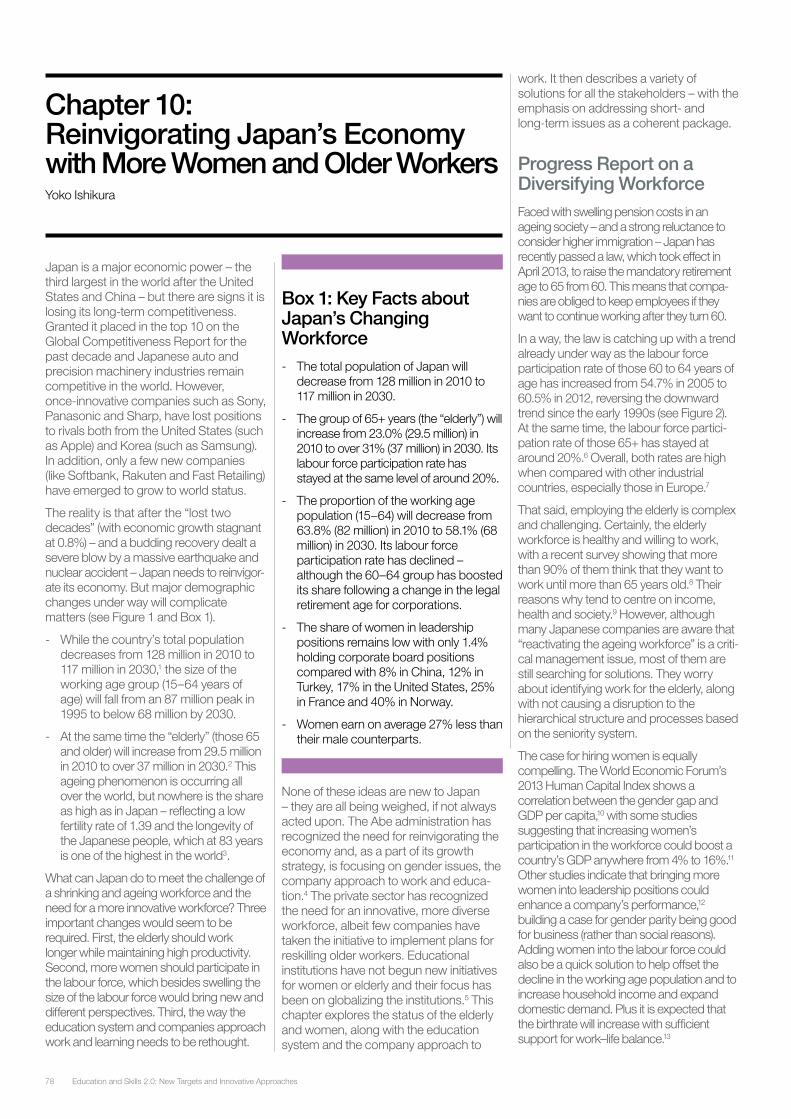
Education and Skills 2.0: New Targets and Innovative Approaches78
Box 1: Key Facts about Japan’s Changing Workforce - The total population of Japan will
decrease from 128 million in 2010 to 117 million in 2030.
- The group of 65+ years (the “elderly”) will increase from 23.0% (29.5 million) in 2010 to over 31% (37 million) in 2030. Its labour force participation rate has stayed at the same level of around 20%.
- The proportion of the working age population (15–64) will decrease from 63.8% (82 million) in 2010 to 58.1% (68 million) in 2030. Its labour force participation rate has declined – although the 60–64 group has boosted its share following a change in the legal retirement age for corporations.
- The share of women in leadership positions remains low with only 1.4% holding corporate board positions compared with 8% in China, 12% in Turkey, 17% in the United States, 25% in France and 40% in Norway.
- Women earn on average 27% less than their male counterparts.
None of these ideas are new to Japan – they are all being weighed, if not always acted upon. The Abe administration has recognized the need for reinvigorating the economy and, as a part of its growth strategy, is focusing on gender issues, the company approach to work and educa-tion.4 The private sector has recognized the need for an innovative, more diverse workforce, albeit few companies have taken the initiative to implement plans for reskilling older workers. Educational institutions have not begun new initiatives for women or elderly and their focus has been on globalizing the institutions.5 This chapter explores the status of the elderly and women, along with the education system and the company approach to
work. It then describes a variety of solutions for all the stakeholders – with the emphasis on addressing short- and long-term issues as a coherent package.
Progress Report on a Diversifying WorkforceFaced with swelling pension costs in an ageing society – and a strong reluctance to consider higher immigration – Japan has recently passed a law, which took effect in April 2013, to raise the mandatory retirement age to 65 from 60. This means that compa-nies are obliged to keep employees if they want to continue working after they turn 60.
In a way, the law is catching up with a trend already under way as the labour force participation rate of those 60 to 64 years of age has increased from 54.7% in 2005 to 60.5% in 2012, reversing the downward trend since the early 1990s (see Figure 2). At the same time, the labour force partici-pation rate of those 65+ has stayed at around 20%.6 Overall, both rates are high when compared with other industrial countries, especially those in Europe.7
That said, employing the elderly is complex and challenging. Certainly, the elderly workforce is healthy and willing to work, with a recent survey showing that more than 90% of them think that they want to work until more than 65 years old.8 Their reasons why tend to centre on income, health and society.9 However, although many Japanese companies are aware that “reactivating the ageing workforce” is a criti-cal management issue, most of them are still searching for solutions. They worry about identifying work for the elderly, along with not causing a disruption to the hierarchical structure and processes based on the seniority system.
The case for hiring women is equally compelling. The World Economic Forum’s 2013 Human Capital Index shows a correlation between the gender gap and GDP per capita,10 with some studies suggesting that increasing women’s participation in the workforce could boost a country’s GDP anywhere from 4% to 16%.11 Other studies indicate that bringing more women into leadership positions could enhance a company’s performance,12 building a case for gender parity being good for business (rather than social reasons). Adding women into the labour force could also be a quick solution to help offset the decline in the working age population and to increase household income and expand domestic demand. Plus it is expected that the birthrate will increase with sufficient support for work–life balance.13
Japan is a major economic power – the third largest in the world after the United States and China – but there are signs it is losing its long-term competitiveness. Granted it placed in the top 10 on the Global Competitiveness Report for the past decade and Japanese auto and precision machinery industries remain competitive in the world. However, once-innovative companies such as Sony, Panasonic and Sharp, have lost positions to rivals both from the United States (such as Apple) and Korea (such as Samsung). In addition, only a few new companies (like Softbank, Rakuten and Fast Retailing) have emerged to grow to world status.
The reality is that after the “lost two decades” (with economic growth stagnant at 0.8%) – and a budding recovery dealt a severe blow by a massive earthquake and nuclear accident – Japan needs to reinvigor-ate its economy. But major demographic changes under way will complicate matters (see Figure 1 and Box 1).
- While the country’s total population decreases from 128 million in 2010 to 117 million in 2030,1 the size of the working age group (15–64 years of age) will fall from an 87 million peak in 1995 to below 68 million by 2030.
- At the same time the “elderly” (those 65 and older) will increase from 29.5 million in 2010 to over 37 million in 2030.2 This ageing phenomenon is occurring all over the world, but nowhere is the share as high as in Japan – reflecting a low fertility rate of 1.39 and the longevity of the Japanese people, which at 83 years is one of the highest in the world3.
What can Japan do to meet the challenge of a shrinking and ageing workforce and the need for a more innovative workforce? Three important changes would seem to be required. First, the elderly should work longer while maintaining high productivity. Second, more women should participate in the labour force, which besides swelling the size of the labour force would bring new and different perspectives. Third, the way the education system and companies approach work and learning needs to be rethought.
Chapter 10: Reinvigorating Japan’s Economy with More Women and Older Workers Yoko Ishikura
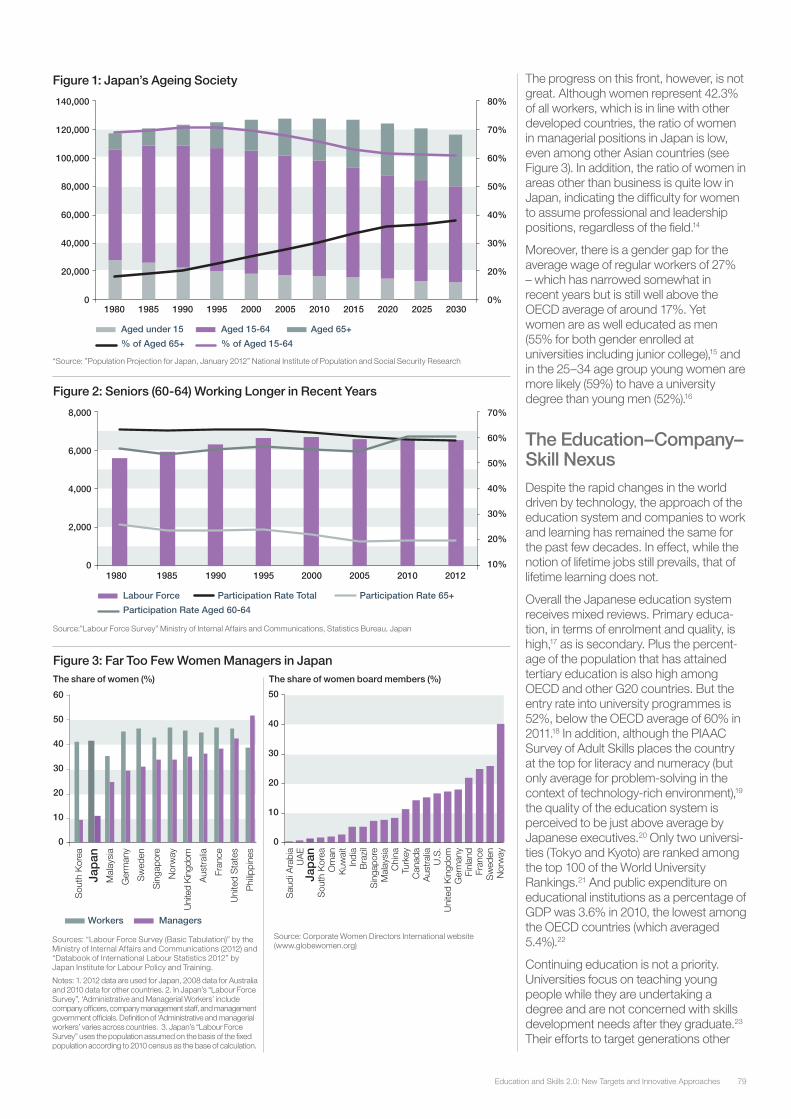
79Education and Skills 2.0: New Targets and Innovative Approaches
The progress on this front, however, is not great. Although women represent 42.3% of all workers, which is in line with other developed countries, the ratio of women in managerial positions in Japan is low, even among other Asian countries (see Figure 3). In addition, the ratio of women in areas other than business is quite low in Japan, indicating the difficulty for women to assume professional and leadership positions, regardless of the field.14
Moreover, there is a gender gap for the average wage of regular workers of 27% – which has narrowed somewhat in recent years but is still well above the OECD average of around 17%. Yet women are as well educated as men (55% for both gender enrolled at universities including junior college),15 and in the 25–34 age group young women are more likely (59%) to have a university degree than young men (52%).16
The Education–Company–Skill NexusDespite the rapid changes in the world driven by technology, the approach of the education system and companies to work and learning has remained the same for the past few decades. In effect, while the notion of lifetime jobs still prevails, that of lifetime learning does not.
Overall the Japanese education system receives mixed reviews. Primary educa-tion, in terms of enrolment and quality, is high,17 as is secondary. Plus the percent-age of the population that has attained tertiary education is also high among OECD and other G20 countries. But the entry rate into university programmes is 52%, below the OECD average of 60% in 2011.18 In addition, although the PIAAC Survey of Adult Skills places the country at the top for literacy and numeracy (but only average for problem-solving in the context of technology-rich environment),19 the quality of the education system is perceived to be just above average by Japanese executives.20 Only two universi-ties (Tokyo and Kyoto) are ranked among the top 100 of the World University Rankings.21 And public expenditure on educational institutions as a percentage of GDP was 3.6% in 2010, the lowest among the OECD countries (which averaged 5.4%).22
Continuing education is not a priority. Universities focus on teaching young people while they are undertaking a degree and are not concerned with skills development needs after they graduate.23 Their efforts to target generations other
Figure 2: Seniors (60-64) Working Longer in Recent Years
The share of women (%)
Figure 3: Far Too Few Women Managers in Japan The share of women board members (%)
Source:”Labour Force Survey” Ministry of Internal Affairs and Communications, Statistics Bureau, Japan
Figure 1: Japan’s Ageing Society
“Source: ”Population Projection for Japan, January 2012” National Institute of Population and Social Security Research
Source: Corporate Women Directors International website (www.globewomen.org)
Sources: “Labour Force Survey (Basic Tabulation)” by the Ministry of Internal Affairs and Communications (2012) and “Databook of International Labour Statistics 2012” by Japan Institute for Labour Policy and Training.
Notes: 1. 2012 data are used for Japan, 2008 data for Australia and 2010 data for other countries. 2. In Japan’s “Labour Force Survey”, ‘Administrative and Managerial Workers’ include company officers, company management staff, and management government officials. Definition of ‘Administrative and managerial workers’ varies across countries. 3. Japan’s “Labour Force Survey” uses the population assumed on the basis of the fixed population according to 2010 census as the base of calculation.
1980 1985 1990 1995 2000 2005 2010 2015 2020 2025 2030
140,000
120,000
100,000
80,000
60,000
40,000
20,000
0
80%
70%
60%
50%
40%
30%
20%
0%
Aged under 15 Aged 15-64 Aged 65+
% of Aged 65+ % of Aged 15-64
Labour Force Participation Rate Total Participation Rate 65+
Participation Rate Aged 60-64
1980 1985 1990 1995 2000 2005 2010 2012
8,000
6,000
4,000
2,000
0
70%
60%
50%
40%
30%
20%
10%
60
50
40
30
20
10
0
Sou
th K
orea
Jap
anM
alay
sia
Ger
man
y
Sw
eden
Sin
gapo
re
Nor
way
Uni
ted
Kin
gdom
Aus
tral
ia
Fran
ce
Uni
ted
Sta
tes
Phi
lippi
nes
Workers Managers
50
40
30
20
10
0
Sau
di A
rabi
aU
AE
Jap
anS
outh
Kor
eaO
man
Kuw
ait
Indi
aB
razi
lS
inga
pore
Mal
aysi
aC
hina
Turk
eyC
anad
aA
ustr
alia
U.S
.U
nite
d K
ingd
omG
erm
any
Finl
and
Fran
ceS
wed
enN
orw
ay
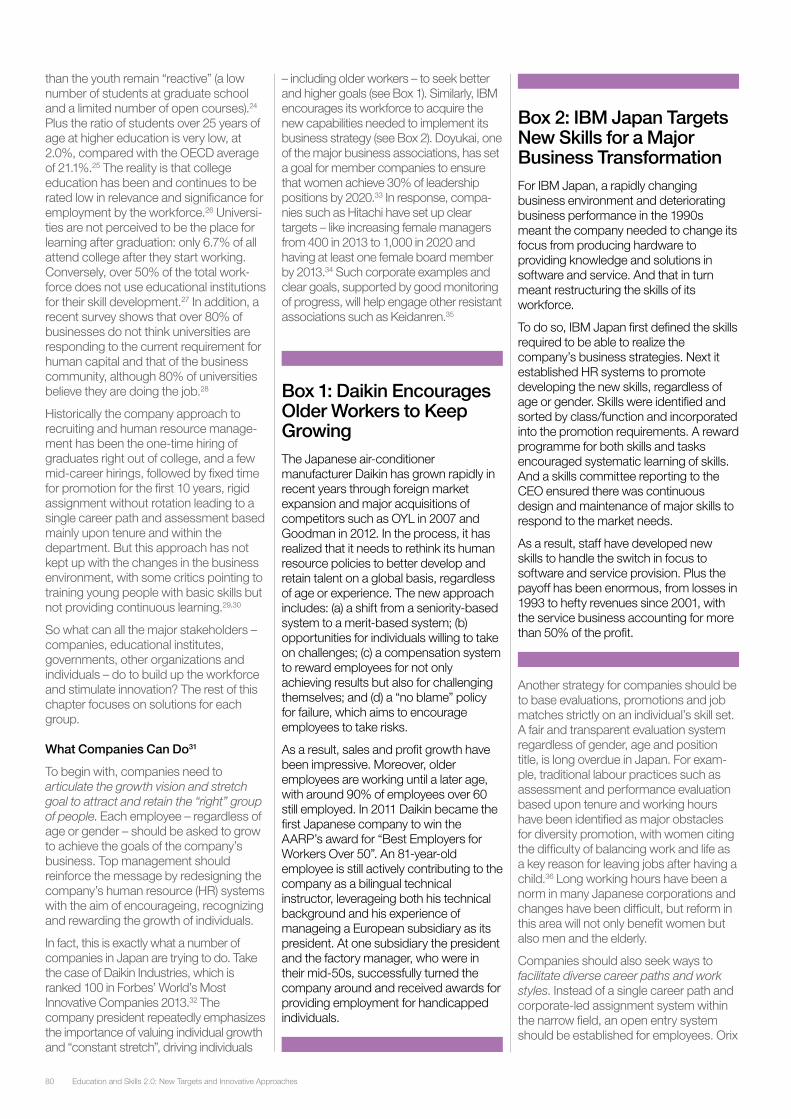
Education and Skills 2.0: New Targets and Innovative Approaches80
than the youth remain “reactive” (a low number of students at graduate school and a limited number of open courses).24 Plus the ratio of students over 25 years of age at higher education is very low, at 2.0%, compared with the OECD average of 21.1%.25 The reality is that college education has been and continues to be rated low in relevance and significance for employment by the workforce.26 Universi-ties are not perceived to be the place for learning after graduation: only 6.7% of all attend college after they start working. Conversely, over 50% of the total work-force does not use educational institutions for their skill development.27 In addition, a recent survey shows that over 80% of businesses do not think universities are responding to the current requirement for human capital and that of the business community, although 80% of universities believe they are doing the job.28
Historically the company approach to recruiting and human resource manage-ment has been the one-time hiring of graduates right out of college, and a few mid-career hirings, followed by fixed time for promotion for the first 10 years, rigid assignment without rotation leading to a single career path and assessment based mainly upon tenure and within the department. But this approach has not kept up with the changes in the business environment, with some critics pointing to training young people with basic skills but not providing continuous learning.29,30
So what can all the major stakeholders – companies, educational institutes, governments, other organizations and individuals – do to build up the workforce and stimulate innovation? The rest of this chapter focuses on solutions for each group.
What Companies Can Do31
To begin with, companies need to articulate the growth vision and stretch goal to attract and retain the “right” group of people. Each employee – regardless of age or gender – should be asked to grow to achieve the goals of the company’s business. Top management should reinforce the message by redesigning the company’s human resource (HR) systems with the aim of encourageing, recognizing and rewarding the growth of individuals.
In fact, this is exactly what a number of companies in Japan are trying to do. Take the case of Daikin Industries, which is ranked 100 in Forbes’ World’s Most Innovative Companies 2013.32 The company president repeatedly emphasizes the importance of valuing individual growth and “constant stretch”, driving individuals
– including older workers – to seek better and higher goals (see Box 1). Similarly, IBM encourages its workforce to acquire the new capabilities needed to implement its business strategy (see Box 2). Doyukai, one of the major business associations, has set a goal for member companies to ensure that women achieve 30% of leadership positions by 2020.33 In response, compa-nies such as Hitachi have set up clear targets – like increasing female managers from 400 in 2013 to 1,000 in 2020 and having at least one female board member by 2013.34 Such corporate examples and clear goals, supported by good monitoring of progress, will help engage other resistant associations such as Keidanren.35
Box 1: Daikin Encourages Older Workers to Keep GrowingThe Japanese air-conditioner manufacturer Daikin has grown rapidly in recent years through foreign market expansion and major acquisitions of competitors such as OYL in 2007 and Goodman in 2012. In the process, it has realized that it needs to rethink its human resource policies to better develop and retain talent on a global basis, regardless of age or experience. The new approach includes: (a) a shift from a seniority-based system to a merit-based system; (b) opportunities for individuals willing to take on challenges; (c) a compensation system to reward employees for not only achieving results but also for challenging themselves; and (d) a “no blame” policy for failure, which aims to encourage employees to take risks.
As a result, sales and profit growth have been impressive. Moreover, older employees are working until a later age, with around 90% of employees over 60 still employed. In 2011 Daikin became the first Japanese company to win the AARP’s award for “Best Employers for Workers Over 50”. An 81-year-old employee is still actively contributing to the company as a bilingual technical instructor, leverageing both his technical background and his experience of manageing a European subsidiary as its president. At one subsidiary the president and the factory manager, who were in their mid-50s, successfully turned the company around and received awards for providing employment for handicapped individuals.
Box 2: IBM Japan Targets New Skills for a Major Business TransformationFor IBM Japan, a rapidly changing business environment and deteriorating business performance in the 1990s meant the company needed to change its focus from producing hardware to providing knowledge and solutions in software and service. And that in turn meant restructuring the skills of its workforce.
To do so, IBM Japan first defined the skills required to be able to realize the company’s business strategies. Next it established HR systems to promote developing the new skills, regardless of age or gender. Skills were identified and sorted by class/function and incorporated into the promotion requirements. A reward programme for both skills and tasks encouraged systematic learning of skills. And a skills committee reporting to the CEO ensured there was continuous design and maintenance of major skills to respond to the market needs.
As a result, staff have developed new skills to handle the switch in focus to software and service provision. Plus the payoff has been enormous, from losses in 1993 to hefty revenues since 2001, with the service business accounting for more than 50% of the profit.
Another strategy for companies should be to base evaluations, promotions and job matches strictly on an individual’s skill set. A fair and transparent evaluation system regardless of gender, age and position title, is long overdue in Japan. For exam-ple, traditional labour practices such as assessment and performance evaluation based upon tenure and working hours have been identified as major obstacles for diversity promotion, with women citing the difficulty of balancing work and life as a key reason for leaving jobs after having a child.36 Long working hours have been a norm in many Japanese corporations and changes have been difficult, but reform in this area will not only benefit women but also men and the elderly.
Companies should also seek ways to facilitate diverse career paths and work styles. Instead of a single career path and corporate-led assignment system within the narrow field, an open entry system should be established for employees. Orix
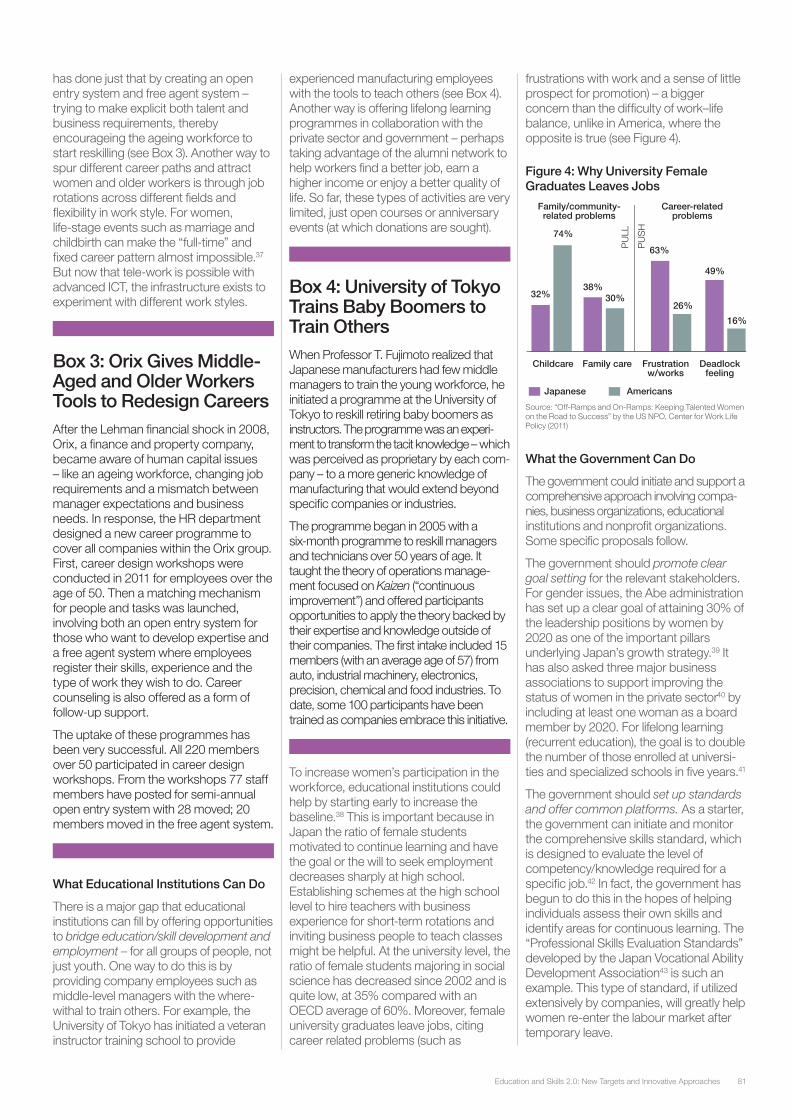
81Education and Skills 2.0: New Targets and Innovative Approaches
has done just that by creating an open entry system and free agent system – trying to make explicit both talent and business requirements, thereby encourageing the ageing workforce to start reskilling (see Box 3). Another way to spur different career paths and attract women and older workers is through job rotations across different fields and flexibility in work style. For women, life-stage events such as marriage and childbirth can make the “full-time” and fixed career pattern almost impossible.37 But now that tele-work is possible with advanced ICT, the infrastructure exists to experiment with different work styles.
Box 3: Orix Gives Middle-Aged and Older Workers Tools to Redesign CareersAfter the Lehman financial shock in 2008, Orix, a finance and property company, became aware of human capital issues – like an ageing workforce, changing job requirements and a mismatch between manager expectations and business needs. In response, the HR department designed a new career programme to cover all companies within the Orix group. First, career design workshops were conducted in 2011 for employees over the age of 50. Then a matching mechanism for people and tasks was launched, involving both an open entry system for those who want to develop expertise and a free agent system where employees register their skills, experience and the type of work they wish to do. Career counseling is also offered as a form of follow-up support.
The uptake of these programmes has been very successful. All 220 members over 50 participated in career design workshops. From the workshops 77 staff members have posted for semi-annual open entry system with 28 moved; 20 members moved in the free agent system.
What Educational Institutions Can Do
There is a major gap that educational institutions can fill by offering opportunities to bridge education/skill development and employment – for all groups of people, not just youth. One way to do this is by providing company employees such as middle-level managers with the where-withal to train others. For example, the University of Tokyo has initiated a veteran instructor training school to provide
experienced manufacturing employees with the tools to teach others (see Box 4). Another way is offering lifelong learning programmes in collaboration with the private sector and government – perhaps taking advantage of the alumni network to help workers find a better job, earn a higher income or enjoy a better quality of life. So far, these types of activities are very limited, just open courses or anniversary events (at which donations are sought).
Box 4: University of Tokyo Trains Baby Boomers to Train OthersWhen Professor T. Fujimoto realized that Japanese manufacturers had few middle managers to train the young workforce, he initiated a programme at the University of Tokyo to reskill retiring baby boomers as instructors. The programme was an experi-ment to transform the tacit knowledge – which was perceived as proprietary by each com-pany – to a more generic knowledge of manufacturing that would extend beyond specific companies or industries.
The programme began in 2005 with a six-month programme to reskill managers and technicians over 50 years of age. It taught the theory of operations manage-ment focused on Kaizen (“continuous improvement”) and offered participants opportunities to apply the theory backed by their expertise and knowledge outside of their companies. The first intake included 15 members (with an average age of 57) from auto, industrial machinery, electronics, precision, chemical and food industries. To date, some 100 participants have been trained as companies embrace this initiative.
To increase women’s participation in the workforce, educational institutions could help by starting early to increase the baseline.38 This is important because in Japan the ratio of female students motivated to continue learning and have the goal or the will to seek employment decreases sharply at high school. Establishing schemes at the high school level to hire teachers with business experience for short-term rotations and inviting business people to teach classes might be helpful. At the university level, the ratio of female students majoring in social science has decreased since 2002 and is quite low, at 35% compared with an OECD average of 60%. Moreover, female university graduates leave jobs, citing career related problems (such as
frustrations with work and a sense of little prospect for promotion) – a bigger concern than the difficulty of work–life balance, unlike in America, where the opposite is true (see Figure 4).
What the Government Can Do
The government could initiate and support a comprehensive approach involving compa-nies, business organizations, educational institutions and nonprofit organizations. Some specific proposals follow.
The government should promote clear goal setting for the relevant stakeholders. For gender issues, the Abe administration has set up a clear goal of attaining 30% of the leadership positions by women by 2020 as one of the important pillars underlying Japan’s growth strategy.39 It has also asked three major business associations to support improving the status of women in the private sector40 by including at least one woman as a board member by 2020. For lifelong learning (recurrent education), the goal is to double the number of those enrolled at universi-ties and specialized schools in five years.41
The government should set up standards and offer common platforms. As a starter, the government can initiate and monitor the comprehensive skills standard, which is designed to evaluate the level of competency/knowledge required for a specific job.42 In fact, the government has begun to do this in the hopes of helping individuals assess their own skills and identify areas for continuous learning. The “Professional Skills Evaluation Standards” developed by the Japan Vocational Ability Development Association43 is such an example. This type of standard, if utilized extensively by companies, will greatly help women re-enter the labour market after temporary leave.
Figure 4: Why University Female Graduates Leaves Jobs
Source: “Off-Ramps and On-Ramps: Keeping Talented Women on the Road to Success” by the US NPO, Center for Work Life Policy (2011)
Japanese Americans
Family careChildcare
Family/community-related problems
PU
LL
PU
SH
Career-relatedproblems
32%
74%
38%30%
63%
26%
49%
16%
Deadlockfeeling
Frustrationw/works

Education and Skills 2.0: New Targets and Innovative Approaches82
The government could also help set up a web-based, integrated solution that provides quality assessment of individual skills, generates career options and develops programmes based on individual assessment results, by building a network of institutions in the areas of assessment, career design and skills development. This platform could help individuals consider next career steps, independent of gender or age, and be leveraged as a talent market for employers who might provide immediate job opportunities.
The government could promote the concept of lifelong learning and create a friendly environment for the workforce to continue learning by collaborating with the private sector and possibly with educational institutions and nonprofit organizations. In this area, some initiatives have begun. Obstacles often identifed by the workforce to relearn skills include time constraints, course fees and location.44 The government could also offer direct support by offering scholarships and other subsidies for students and for companies that send employees to outside programmes. Award programmes are also planned by the government to recognize good practices. The government should continue this effort by ensuring collaboration among three ministries – MEXT (Ministry of Education, Culture, Sports, Science and Technology), MHLW (Ministry of Health, Labour and Welfare) and METI (Ministry of Economy, Trade and Industry).
The government should create the infrastructure to help empower women. The Abe administration, as a part of empowering women, has proposed three-year parental leave, but it has met with mixed reactions,45 as there is some evidence that parental leave longer than two years correlates negatively with women’s labour force participation.46 Both parents should be encouraged to take this type of leave, although the ratio of fathers who take parental leave is extremely low at 2% – it is often reported that fathers are reluctant to take parental leave, because of peer pressure and perception at work.
An evaluation system for promotion and open entry system for job rotation might help make such leave more attractive and more childcare facilities would make it easier for more women to return to work and assume more responsible positions. The Abe administration has set a goal to eliminate the number of infants who cannot be accommodated at childcare facilities by 2017, currently estimated at
somewhere between 20,000 and 500,000.47 Local governments and companies have built more facilities. In Yokohama, Mayor Fumiko Hayashi accomplished the goal of zero waiting infants in April 2013 not only by increasing the number of facilities and budgets but also by offering a variety of services (such as counseling for mothers and matching of real estate owners and childcare operators through an information exchange).48
What Other Organizations such as Nonprofits Can Do
Nonprofit organizations (NPOs) could develop a comprehensive and coordinated information sharing platform on job, skills and learning opportunities. For women, business associations – such as Doyukai, J-Win (http://www.j-win.jp) and the Women Corporate Directors Japan chapter (http://www.womencorporatedirectors.com/) – already have databases on women leaders and candidates for leadership positions. Other organizations such as G1 and ewoman (http://www.ewoman.jp) have their own website or Facebook page and groups. If well coordinated, the platform could serve as the hub for sharing information and for casual and informal networking on a frequent basis. It could also provide a source of role models of women with a satisfying career, which in Japan are scarce.
For the elderly, a similar information-sharing platform could be effective, but to date there are few in existence. A good example of what can be done though is SECURITE, a web-based site for individual investors (see Box 5). As companies accumulate skills and experience, the information-sharing platform could be quite effective in matching jobs and people with a required set of skills. If some skills are missing, the platform could serve as the trigger for reskilling. The platform could also serve as a source of role models for the elderly.
Box 5: SECURITE: An Open Platform for Micro Investment FundsSECURITE is a micro investment fund management scheme that aims to support local traditional industries as a way to promote small businesses to expand their businesses. It is an open platform for micro investment funds designed and operated by Music
Securities Inc., a fund management company in Tokyo. The key idea is to discover business owners with business sense and the potential to appeal to individual investors and then help them improve their marketing skills to expand their businesses. Suitable business owners are found through reliable third parties who have good local knowledge of industries and then matched with a compatible investor.
Since 2009 there have been 187 funds of 99 companies from different industries such as agriculture, forestry and sake brewing. Of these, 71 funds have been redeemed and 80% of those redeemed funds have exceeded the original principal. There are about 5.3 million registered members and more than ¥33 billion has been raised.
NPOs can set up an informal and open exchange for individuals and jobs. This would enable individuals to reflect on their own aspirations, identify development areas and find appropriate learning programmes or a job. It would also offer older employees and women the chance to become aware of the need for stretch and growth, expand the applicability of their own skills, review individual motivations and provide role models and promote the matching of latent business opportunities.
By collaborating with companies – as in the case of NEC Craftsman Workshop – NPOs can tap rich experiences and skills accumulated in the elderly workforce of large corporations. NEC, in conjunction with the Japanese Philanthropic Association, has initiated a corporate social responsibility programme of workshops to enable older workers to contribute skills and experience after retirement. Through the workshops, participants identify how they can contribute and they are matched with suitable NPOs in terms of interests and preferences. These participants tend to be former company executives or businessmen engaged in global business. In the first year there were eight participants of which three became active in NPOs; in the second year there were 11 participants of which five are now establishing NPOs.
NPOs and other organizations can arrange events and awards to raise awareness and recognize the importance of entrepreneurs and mentors. Recent initiatives include a women business competition by the Development Bank of
83Education and Skills 2.0: New Targets and Innovative Approaches
What the country needs now is not another initiative or programme to address separate issues, but a comprehensive and coordinated package to address all of these issues. That will require all stakeholders – namely, educational institutions, private sector companies, government, NPOs and individuals – to interact and collaborate continuously, instead of following the sequential model of education, skill development and employment.
At this stage, several pieces are already in place for gender issues, while little has been done for the elderly. Granted, some measures are difficult to implement. But when it comes to developing human capital for a country with little other resources, the time is now.
Endnotes1. Population Census, Statistics Bureau, Ministry of Internal
Affairs and Communications, 2012; Population Projections for Japan, National Institute of Population and Social Security Research, January 2012.
2. Labor Force Survey, Statistics Bureau, Ministry of Internal Affairs and Communications, 2012.
3. Vital Statistics, Ministry of Health, Labor and Welfare, 2012.
4. Japan Revitalization Strategy – Japan is Back, Cabinet Office, 2013.
5. Third Proposal; University Education & Global Human Resource Development for the Future, Council for the implementation of Education Rebuilding, 2013.
6. Labor Force Survey, 2012 op. cit.
7. Databook International Labor Comparison, Japan Institute for Labor Policy and Training, 2012.
8. Survey Concerning the Participation in the Community, Society of Elderly People Cabinet Office, 2008.
9. Survey of the Current Status of Employment of the Elderly, JILPT, 2011.
10. Human Capital Report 2013, World Economic Forum, 2013 .
11. Can Women Save Japan?, IMF Working Paper, Goldman Sachs Report, 2007.
12. “Gender diversity and corporate performance”, Credit Suisse Research Institute, 2012, “Gender diversity & corporate returns” Daiwa Securities Research Institute, 2012, “External pressure for female board member”, Nihon Keizai Shimbun, 28 June 2013.
13. Revitalizing Economy Through Women Power, Ministry of Industry, Economy and Trade, October 2013.
14. White Paper on Gender Equality 2013, Cabinet Office, June 2013.
15. School Survey, Ministry of Education and Technology, 2013.
16. “Closing the Gender Gap”, www.oecd.org/gender/closingthegap.htm, 2012.
17. UNESCO, Institute of Statistics through Human Capital Report, 2013.
18. OECD Education at a Glance, OECD Indicators, 2013.
19. “OECD Skills Outlook”, http://skills.oecd.org/skillsoutlook.html, 2013.
20. Global Competitiveness Report, Executive Opinion Survey, 2013.
21. “World university rankings, 2012–2013”, Times Higher Education, 2013.
22. OECD Education at a Glance, OECD Indicators, 2013.
23. Third Proposal; University Education & Global Human Resource Development for the Future, Council for the implementation of Education Rebuilding, May 2013.
24. School Survey, Educational Reform Third Proposal, Ministry of Education and Technology,2013 Japan Revitalization Strategy, Cabinet Office, 2013 .
25. OECD Education Database 2009, “School Survey”, Ministry of Education as reported in The Third Proposal, ibid.
26. Skills for Employment, JILPT, 2013.
27. Working Person Survey 2012, Recruit Works Institute.
28. Survey of human capital required today, Sundai Education Institute, Sankei Shimbun, 2012.
29. Satoshi Tsukada, “Characteristics of workplace management and the expansion of women’s roles in Japanese Corporations”(in Japanese), Policy and Business Research, http://www.murc.jp/thinktank/rc/quarterly/quarterly_detail/201302_23.pdf. Kanae Sano “Drawbacks of Japanese-Style Personnel Management in Expanding the Role of Women”, , Policy and Business Research 2013, http://www.murc.jp/thinktank/rc/quarterly/quarterly_detail/201302_31.pdf.
30. Japan Revitalization Strategy, 2013 op. cit.
31. The author wishes to thank the Mercer Japan team, led by Masaki Nakajima, for conducting company interviews and assisting with data analysis related to the reskilling of older workers.
32. http://www.forbes.com/innovative-companies/.
33. Keizai Doyukai, “Toward real diversity at the decision making board” (in Japanese), http://www.doyukai.or.jp/policyproposals/articles/2012/pdf/121016a.pdf, October 2012.
34. “Departure from male-dominated society”, Nihon Keizai Shimbun, 11 August 2013.
35. Keidanren was believed to have been instrumental in blocking the disclosure of information related to diversity. “Report by the Committee to reveal women’s activities in the capital market” (in Japanese) December 2012.
36. “Drawbacks of Japanese-Style Personnel Management in Expanding the Role of Women” Policy /Business Research”, , op.cit.
37. “Comprehensive Study on Issues Concerning Work – Family Life Balance Support”, Mitsubishi UFJ Research and Consulting Co Ltd, 2008, “Survey of Diversity Status”, Ministry of Health, Labor and Welfare http://www.mhlw.go.jp/toukei/list/dl/71-24b.pdf.
38. “Start early for active female participation in labor market” (in Japanese), Japan Center for Economic Research, 2013.
39. Other policy initiatives such as extension of parental leave, childcare facilities, tax incentives and pensions related to the mechanisms will be discussed later.
40. White Paper on Gender Equality 2013, op. cit.
41. “Educational Reform”, Third Proposal, “University Education and Global Human Resource Development”, Ministry of Education, op.cit.
42. The initiative comes under its Growth Strategy in order to promote the shift of the labour forces to growing segments, “Japan Revitalization Strategy”.
43. “Skills evaluation standard” (in Japanese), Japan Vocational Ability Development Association, http://www.hyouka.javada.or.jp/user/outline.html.
44. Survey of workforce for university education 2009 (in Japanese), University of Tokyo, University Management and Policy Research Center.
45. “How about 3-year leave for both parents”, interview article with Yoshihisa Aono, CEO of Cybozu, http://www.nikkei.com/article/DGXNASGG2900C_X00C13A5000000/; “3-year parental leave leading to more housewives with no career?”, interview article with Kaori Sasaki, ewoman (in Japanese) http://diamond.jp/articles/-/39332.
46. Kotaro Tsuru “Avoid career gap for women” (in Japanese) ,Nihon Keizai Shimbun, 17 September 2013.
47. A huge range given that more mothers try to work as childcare facilities become available and it is almost impossible to estimate the number of infants requiring child care.
48. “Action to eliminate child waiting for child care facilities” (in Japanese), http://www.city.yokohama.lg.jp/kodomo/kinkyu/jidou.html.
49. “Women’s Initiative Forum in Tokyo 2013-Women’s perspective to start a business” Nihon Keizai Shimbun 7 October 2013, , “
50. Self management of career, NRI Report, 2012.
Japan, a women’s initiative forum by Cartier & McKinsey supported by Nikkei newspaper49 and a social business award organized by Nikkei. Awards could serve as networking opportunities for motivated applicants and as the source of role models. More skill development programmes need to be in place so that women with good ideas can develop concepts into a business plan. These events could encourage women (and possibly the elderly) who want to create their own job, using technology and their own business acumen.
What Individuals Can Do
Individuals could set up a vision or stretch goal for themselves, reflecting their own aspirations and motivations, instead of waiting for companies and the governments to design their career and life for them. And they should set themselves free from any stereotypes based on age, gender or past career track records.50
Individuals could seek opportunities to evaluate the level of their own skills, on a market basis, outside of the company. Money is not necessarily the best indicator, but comparing one’s current salary with the market price of an equivalent job is a useful way to know where one is positioned. If over-valued, think about how to create more value in one’s role. If under-valued, explore a new job opportunity to realize the value.
A Comprehensive, Not Piecemeal, Approach to ReformJapan is now faced with both short-term and long-term problems in the area of human capital, no doubt complicated by a shrinking workforce and an ageing society. It has long been internationally recognized for an intelligent and hard-working workforce made possible by a good educational system at schools and training/skill development programmes offered by companies. But concerns now are surfacing about (a) a “divide” between universities and the business community in responding to the needs for new knowledge and skills required for the contemporary reality of global competition and a digital world; (b) the limited employment opportunities for the educated population (especially women); and (c) the increasing need for reskilling and continuous learning (especially for older workers).
Education and Skills 2.0: New Targets and Innovative Approaches84
Measuring and Managing Our Assets
Just who should foot the bill for education remains a hotly debated matter around the world. With both enrolment rates and average years of schooling going up in most countries, the education bill is getting heftier. Education systems are a key driver of human capital development and represent a fundamental pillar on which the future economic and social welfare of nations is built. It is therefore not surprising that the funding of education is a growing problem. Leaders, policy-makers and communities around the globe must work together to develop effective and robust funding models that ensure people have equitable access to quality education and are thus empowered to reach their full potential as productive members of society.
The increasing number of countries seeking to develop knowledge-based economies in which innovation and creativity play a central role is also elevating the importance of investments in human capital2 and knowledge generation through education. At the same time, many countries are grappling with fiscal challenges unprecedented in recent history that demand close scrutiny of budgets to maximize the efficiency and effectiveness with which governments allocate finite public funds.
Conventional approaches to funding education clearly have limitations in so far as achieving both equity and quality goals for education. As a result, the development of new and innovative education financing models will be critical looking ahead. This is particularly true in developing countries where the demand for education is rapidly exceeding supply and where education is often the only way out of poverty for vast sections of the population. The aim of this chapter is to discuss key challenges in funding education in order to achieve equity goals, to examine past and present funding models, to identify potential options going forward and, most especially, to address the question of who is going to foot the education bill.
Chapter 11: Pay it ForwardSami Mahroum and Elizabeth Scott1
Education and Skills 2.0: New Targets and Innovative Approaches84
85Education and Skills 2.0: New Targets and Innovative Approaches
The Issue of Parity and How it MattersEducation is widely considered a means to increase workforce productivity, promote social mobility and reduce poverty and inequality. Consequently, primary education is nearly always compulsory in most countries, while many countries also require some level of lower-secondary education. Since 2000 the number of years of compulsory education has been generally rising, with the global average duration of compulsory education being 8.9 years in 2010 (UNESCO, 2012). It is perhaps not surprising that total public and private spending on all levels of education rose from 5.3% to 6.2% of GDP between 2000 and 2009,3 with growth in private spending outpacing that of public spending (OECD, 2012).4 Moreover, growth in expenditure on all levels of education exceeded GDP growth.
But meeting the funding requirements of increased enrolment at all levels of education has emerged as a major challenge for countries around the globe. Debate surrounds the appropriate minimum level of education that should be provided by governments, with lower levels typically associated with less developed countries.5 This might in part reflect higher opportunity costs of education in countries where children are actively engaged in production and where citizens have short lifespans. Nevertheless, inadequate budget allocations and high growth in the number of school-age children in develop-ing countries are key contributors to compulsory attendance goals going unmet.6 Indeed the young age profile of populations in many developing nations has exacerbated the funding challenges governments face as they tackle the nexus of equity, quality and costs within their education systems. India, for example, has a population of over 1 billion people of which 50% are 25 years of age or young-er.7 A similar situation exists across the Arab world and in many other Asian and African countries.8
The interplay of social9 versus private returns on investment in education can also have an important influence on the choices governments make in funding models by level of education, especially when providing equitable access to quality education when students move to noncompulsory levels of study. In an important trend, the OECD indicates participation in education beyond compulsory schooling has grown from a “small minority to the vast majority”
(OECD, 2009, 2012). And as we move up the education ladder to secondary, upper-secondary and postsecondary education, the private share of funding tends to increase in most countries. This trend can at least partly be explained by the commonly held view that the social rate of return to investments in education are highest at the primary level, and the private rates of return to both secondary and tertiary education are strongly positive (Boissiere, 2004; Campbell et al., 2003; Kara, 2010; Psacharopoulos, 1994 and 1995; Psacharopoulos and Patrinos, 2002). Nevertheless, recent studies suggest that the returns to primary education might be declining vis-à-vis returns to higher levels of education (Colclough et al., 2009) – meaning that there might be more reason for public investment in higher education.
Certainly, higher education influences social mobility across a population. Furthermore, returns on investments are typically greater for countries at lower levels of economic development with the scarcity of skilled human capital providing a significant premium to tertiary-educated workers. In any event, returns on higher education remain positive in high-income countries for both individuals and society, supporting arguments for cofinancing models10 (Gropello et al., 2011). Accord-ingly, the introduction of fees for university students has been justified on the grounds that it apportions at least part of the cost to those who benefit from it most directly and provides an incentive to students to complete their studies efficiently. Public funding of higher education, if not means-tested, redistributes resources away from low-income taxpayers to (future) higher-income taxpayers and may therefore be viewed as regressive (Greenaway and Haynes, 2003).
US Department of Education estimates suggest that 54% of students from the highest-income quartile complete a college degree compared to only 9% of students from the lowest-income quartile.11 This education attainment gap contributes to a widened gap in levels of income among different groups in society as private returns on investment in higher education include increased earnings potential and greater job opportunities. The social cost might even be higher when taking into account estimates of the lifetime economic consequences of educational attainment in terms of health, crime and welfare. In fact, a recent study by McKinsey and Company (2009) underscores the enormous economic impact of the achievement gap12 in US schools (see Box 1).
Box 1: How Significant Is the Economic Impact of the Achievement Gap in US schools?A study by McKinsey and Company (2009) finds that, “avoidable shortfalls in academic achievement impose heavy and often tragic consequences, via lower earnings, poorer health, and higher rates of incarceration”. They estimate that if the United States had closed the gap between educational achievement levels and those of better performing countries such as Finland and Korea, its GDP could have been US$ 1.3–2.3 trillion higher in 2008, with the loss representing the equivalent of a permanent national recession.
Besides income considerations, intergenerational legacies can affect the equity and quality of participation in education when families and communities lack a culture of educational attainment. Indeed, studies show that parents’ education influences their children’s education and subsequent life-course outcomes (like occupational status) (Andrew, 2012). Moreover, if students from low socio-economic backgrounds have low rates of school completion, it exacerbates the situation (Polidano et al., 2012). Thus, a key way to break this vicious circle is by increasing the completion rate of students of low socio-economic status.
Ultimately, the education gap among students results not only from enrolment and drop-out rates but also from variations in the performance of schools and school systems serving similar students. As a result, equity and quality goals often work against each other. Striking the right balance between public and private investment in different levels of education, and the funding mechanisms adopted, demands that policy-makers address concerns of both equity of access and outcomes achieved – including the quantity, quality and content of educational provision and output in meeting a country’s labour market and economic needs.
Education and Skills 2.0: New Targets and Innovative Approaches86
So Who Should Foot the Rising Education Bill?As early as the 1950s, the eminent free-market economist Milton Friedman (1955) argued that gains from education are a public good and should be funded accordingly, as benefits not only accrue to the individual but to society at large by promoting a stable and democratic society. Policy arguments supporting universal access to education advocate public funding of education on the grounds that it is a social investment necessary to avoid negative externalities such as crime and unemployment. Moreover, education is believed to promote positive externalities such as productivity, civic engagement and equity (Buckingham, 2011). In order to feasibly enforce a minimum level of education, government subsidization is necessary and can be justified by the associated net social welfare gains (Friedman, 1955; Boissiere, 2004).
Many of the social costs associated with education can be easily measured. However, positive externalities, or social benefits, are less easily quantified, which hinders informed debate and decision-making. While arguments advocating universal access to a minimum level of government-funded education are widely supported – with 61 million children of primary school age estimated to be out of school (UNESCO, 2012) – it is clear that this does not always translate into effective education policy on the ground. But as argued by Campbell et al. (2003) in analysing the policy debate surrounding UK education financing, “funding issues cannot be resolved in purely technical terms, but are contingent on ideological perspectives about broader economic and social priorities”. Finland is one such an example of an education system that is fully government-funded and where even the establishment and operation of private schools remains tightly regulated. The merits of the Finnish system are evi-denced in the performance of its students who consistently rank at the top of OECD international standardized tests (Hancock, 2011).
Besides Finland, many other countries provide free education up to university level – particularly in European countries such as Denmark, Greece, Norway and Sweden (EC, 2012) – while in other countries the privilege of free education is granted only until primary or secondary school levels (e.g. the United Kingdom and the United States). In an interesting policy reversal, Austria and Germany
recently abolished tuition fees in higher education as they were considered politically divisive (Redden, 2013).
While financial pressures have seen many countries permit the establishment of private educational institutions to meet excess demand, or a lack of certain skills or expertise, opponents of private schooling – including the likes of US billionaire investor Warren Buffett – argue that it perpetuates inequality and diverts money to elite private schools rather than to the betterment of public schools that are open to all. This has led to calls for the banning of private schools in numerous countries including the United Kingdom and the United States.
Exactly who should foot the education bill is therefore an important question not only in relation to finding the resources needed to finance education but also because of its implications for social cohesion and equity. Passing more of the bill to private households carries the risk of reducing access to education and widening the gap between those who can afford to pay for education and those who cannot. While research suggests the demand for education is inelastic, at least at the tertiary level, Hamadeh and Khoueiri (2010) show that low-income individuals are more sensitive to variations in price and income. This represents an important consideration for policy-makers trying to develop funding models that address equity issues.
Equity Should Not Imply Homogeneity
Quality is an essential dimension in any policy discussion about education where governments try to maximize the value that may be obtained from the funds they have to spend. Where parents perceive insuf-ficient quality in government schools or wish to obtain a competitive advantage for their child, they are often willing to pay the premium required to send their child to a private school. Unfortunately, this can leave the children of families unable to afford private school fees at a disadvantage and compromises equity objectives. Neverthe-less, there is a lot governments can do to ensure better equity while not giving up on the quality of education provided.
The challenge within so-called “equitable” public school systems has been that they often seek to homogenize the format and process in which education is delivered. Consequently, they inadvertently risk stifling the autonomy and flexibility of school administrators and teachers to respond to local needs or to innovate in ways that improve outcomes. This takes away a potentially important channel for
improving the efficacy of the education system. In countries where education budgets are tight, teachers in public systems also have to contend with insufficient resources and large class sizes that limit what they can hope to achieve. However, Peterson's analysis of US school data shows that even among private schools with fewer financial resources, having more choice, smaller class sizes, greater administrative simplicity and stronger extrinsic learning incentives (such as more homework, greater communications between school and family and higher behavioural and educational expectations) produces better outcomes (Peterson, 2008).
As a result, a number of governments13 are now looking at ways to empower public schools to operate with more of the autonomy and incentives associated with private schools. School-based manage-ment (SBM) is one such policy approach that aims to maximize returns on public spending in education by decentralizing decision-making authority for public school operations and management to principals, teachers, parents, members of the wider community with a vested interest in student outcomes and, in some cases, even students themselves (Barrera-Osorio et al., 2009; OECD, 2013; Polidano et al., 2012). The inclusion on school management boards of members of the business community who can contribute proven credentials in adminis-tration especially when overseeing the allocation of school resources can also be beneficial.
The disbursement of public monies has brought with it greater accountability and monitoring of performance, including student and teacher assessment. This requires more effective evidence-based decision-making at a central government planning level, particularly as more nuanced frameworks for student assessment that include multiple sources of evidence (like Finland and New Zealand) and focus on creative thinking and independent problem-solving skills (like Singapore) are being implemented (OECD, 2012).
In 2009, the OECD’s PISA study, which investigated the relationship between school performance and school autonomy, found that while the degree and types of school autonomy vary widely, greater autonomy and accountability tended to be associated with better student outcomes (OECD, 2011). PISA tests found that greater freedom in decision-making about curricula (such as courses, content and
87Education and Skills 2.0: New Targets and Innovative Approaches
textbooks), student assessments, policies and staff recruitment were positively correlated with better school performance. However, greater autonomy in resource allocation decisions was found to have no effect on school performance in terms of PISA test results.
As for the applicability of SBM systems in developing countries, a study by Caldwell (2005) – which looks at the introduction of SBM systems in 79 schools in Indonesia and seven Latin American countries – finds that the introduction of SBM systems was instrumental in bringing about improved learning outcomes for students (see Box 2).
Box 2: School-based Management Systems in Indonesia and Latin AmericaAre SBM systems a useful tool for developing countries? The answer appears to be yes, according to Caldwell (2005), who examined the impact of a pilot programme that introduced an SBM system in 79 schools in Indonesia (funded by UNESCO, UNICEF and the government). The study determined that the programme resulted in dramatic improvements in both school attendance and test results. However, the outcomes of this programme were also influenced by the concomitant provision of professional development for teachers on new approaches to curriculum and teaching, as well as efforts to improve levels of student and community engagement. Caldwell also highlights the findings of a study of schools in seven Latin American countries that concluded that the introduction of SBM systems was instrumental in bringing about improved learning outcomes for students.
A Shift to Cofunding ArrangementsMany fiscally challenged governments have opted for cofunding solutions that combine both public and private sources of funding in attempts to improve equity of access to quality education across their populations. Policy-makers cite the private benefits of education to justify private contributions from those with the ability to pay, while government subsidies are targeted at those least able to afford the
cost of education. However, in low-income countries with young population profiles, such as India, that face strong growth in the demand for education and a marked increase in the share of education funding coming from private sources, achieving equity objectives continues to present a challenge. In an effort to include all sections of the population in the Indian education system, the government has introduced “positive discrimination” or “affirmative action” strategies. While these measures have seen enrolment in primary schools increase, an estimated 2.3 million Indian children of primary school age remain out of school (OECD, 2012).
Since 1978, China’s education system has also transitioned from being entirely government funded to one that is significantly financed from private sources. But Chow and Shen (2005) indicate that while the government mandated nine years of compulsory government-funded education, responsibility for providing it was devolved to provincial and local governments, which in turn imposed private tuition fees to meet funding shortfalls. Such privately sourced funding was estimated to be as high as 50% in 2002, with a significant proportion of Chinese children aged 15 years and younger receiving below the compulsory minimum level of education.
It is also inevitable that education systems with both private and public educational institutions will experience some degree of inequity along income lines. Variations in tuition, quality and services among primary-level government-funded public schools in many countries have resulted in an increasing number of parents opting to send their children to privately funded nongovernment schools that are often better equipped and staffed. The consequent effect has been that private households now foot a large part of many national education bills. Meanwhile, families that are less well-off have little choice other than to send their children to publicly funded schools, many of which struggle with stretched budgets and overcrowded classrooms.
A further trend in most countries is for the share of private funding to increase as students move up the education ladder (with the exception of preprimary education). This likely reflects higher private rates of return on investments in tertiary education and has seen the introduction of cofunding mechanisms as well as the establishment of privately funded tertiary institutions in many countries to meet the growing demand for university placements.
School Voucher Schemes
School vouchers represent an increasingly popular cofunding model that provides student-based government funding allocations that can be used at both private and public schools and can be used to address both equity and quality issues. In Sweden, for example, the government funds private schools – including for-profits – to the same level as municipal schools through an unweighted voucher system that allows students to attend their school of choice (Buckingham, 2011). Where governments provide vouchers for use at private schools, this essentially represents a form of public–private partnership. Voucher-based funding generally reflects student enrolments and is typically conditional on schools meeting performance criteria reflecting student outcomes and efficiency gains. As a result, the role of governments in many countries14 has shifted toward that of policy-maker and administrator rather than provider of educational services (Buckingham, 2011; NEA, 2013).
Voucher schemes can be designed to achieve specific equity objectives by providing student-centred government funding that can be weighted according to socio-economic status and other forms of educational disadvantage (such as race, language proficiency and socio-economic status), irrespective of whether they attend public or private schools (Buckingham, 2011; Gonski et al., 2011). The rationale is that educationally disadvantaged students are more difficult to teach and thus merit the greater level of teacher and school resources typically associated with private schooling.
How have voucher systems fared in developing countries? The positive evidence so far mainly stems from Colombia and Chile (see Box 3), unlike in other developing countries located in Asia, Africa or Europe, where the benefits are less clear (Srur, 2012). Nevertheless, the experiences in both Colombia and Chile would appear to indicate that voucher systems have led to improved attendance and educational outcomes. Benefits, however, have generally been limited to urban areas owing to an absence of private schools in rural areas (thereby limiting school choice and incentives through competition). Furthermore, public schools in rural areas are less likely to be able to participate in voucher schemes where they are also required to partially finance programmes (Srur, 2012).
Education and Skills 2.0: New Targets and Innovative Approaches88
Box 3: School Voucher Systems in Colombia and ChileIn the early 1980s, Chile decided to reform its school system. The government transferred administration of public schools to local municipalities. It allowed the private sector to participate in publicly financed education by introducing a school voucher scheme that provides student-based subsidies to both munici-pal-run schools and private schools. The Chilean system also allows private schools that are fully funded through fees paid by parents. Studies of a nationwide voucher program operating in Chile over the years have shown mixed results, although on balance they would appear to indicate student attendance and outcomes have risen. However, research indicates that the Chilean programme has resulted in student sorting, with better performing students within the public sector leaving to attend private schools (Patrinos, 2012).
In 1991, Colombia introduced a govern-ment-funded voucher system designed to provide the poorest third of the country’s population with access to secondary schooling. Running until 1997, the pro-gramme was oversubscribed and vouch-ers were allocated through a lottery. A recent study suggests that the voucher beneficiaries achieved higher levels of educational attainment than nonvoucher students: they were 6% less likely to repeat a grade; scored 0.2 standard deviations higher in achievement tests; were 20% more likely to sit a college entrance exam; were less likely to be married; and earned higher wages (Patrinos, 2012).
Cofunding Mechanisms at the Tertiary Level
To address the growing demand for tertiary-level education, a broad variety of funding mechanisms exist at the tertiary level. These range from fully funded public universities in Nordic countries to elite private universities and colleges (in countries like India and the United States) that enjoy tax-free status and receive research grants from the government. While the high fees associated with private universities usually preclude the participation of low-income students, most countries also provide some level of government subsidization often based on cofunding models such as income-
contingent student loans. In providing student loans, governments use their discretion to tailor the parameters according to employment (like part-time, casual, full-time), level of earnings and interest and repayment rates – as well as to reflect the market realities of supply and demand for different qualifications, reflecting the costs of delivering different degrees.
While the Nordic countries have had a student loan system in place that dates back to the 1940s, in 1989, Australia was the first country to introduce fees repayable in the form of income-contingent loans provided to cover the portion of fees not subsidized by the government. These loans require repayment of fees once students have completed their studies through a tax levied on their income above a threshold level. Low-income students are also granted a student support allowance to cover, at least partially, living expenses while studying. Similar systems have since been introduced elsewhere including in New Zealand and the United Kingdom.
Reports assessing the impact of income-contingent student loans on accessibility to university education have been mixed and, at least in part, reflect the terms and conditions of loan repayments. This suggests that particular attention should be paid to the design of student loan schemes to achieve equity objectives. University participation rates in Australia and New Zealand continued to increase following the introduction of student loans, including the participation of low-income students (Chapman and Ryan, 2002; NZ MOE, 2008), although resulting high debt loads in New Zealand have taken a toll (see Box 4). In contrast, the introduction of student loans in the United Kingdom – offsetting higher tuition fees – is reported to have left university participation rates unaffected (Dearden et al., 2010). These findings align with an OECD study (2012) that determined the relative share of private expenditure had little impact on access to higher education.
Box 4: New Zealand’s Student Loan SchemeIn New Zealand, the administration of its student loans scheme has been associ-ated with a number of adverse outcomes. Rising levels of student debt have been attributed as a causal factor in declining birth rates and lower levels of home ownership, wherein graduates have had to spend more of their income servicing this
debt – thus being unable to start a family or afford the deposit for a home loan (CFS, 2007). New Zealand’s loan scheme comprises a relatively low repayment threshold, high interest rate, and a high level of repayments following graduation (Baxter & Birks, 2004; Maani & Warner, 2000).
The experience in the United Kingdom is interesting also because Denny (2010) similarly reports that when tertiary educa-tion in Ireland became free, differences in participation across socio-economic groups corresponded to pre-existing student performance at secondary level – where those students from white-collar backgrounds generally performed better in final exams than those from blue-collar backgrounds. The policy implication is that there are factors beyond affordability of tertiary-level education that enhance or hinder participation and that early intervention and policies that address un-derperformance at school level are likely to be more effective. Policy responses could include improving equity of access for socio-economically disadvantaged students to pretertiary education and improving secondary school comple-tion rates. Policy options include provid-ing student-based weighted voucher schemes and subsidizing key tools of learning (such as school meals, Internet access, e-textbooks, tablets and laptops) at the pretertiary level.
Achieving Global Equity Through International Cofunding?
Just like within countries, the challenges of equity and quality within education systems manifest themselves at the global level too, albeit through different means. Through the movement of people, the bulk of invest-ments made in education by an entire generation of a developing country can be captured by a more competitive economy elsewhere. As a result, developing countries can lose their most talented people to the developed world where salaries and lifestyles are better. The World Bank (2007) argues that while migration provides an important channel for resolving labour market imbalances in domestic markets, the home countries incur major losses in terms of utility, consumption and competitiveness. Consequently, while remittances help mitigate part of the value capture problem, additional measures are required to ensure equity objectives are achieved at a global level – including possibly introducing international cofunding mechanisms that better reflect both private and social benefits and costs of education across geographies.
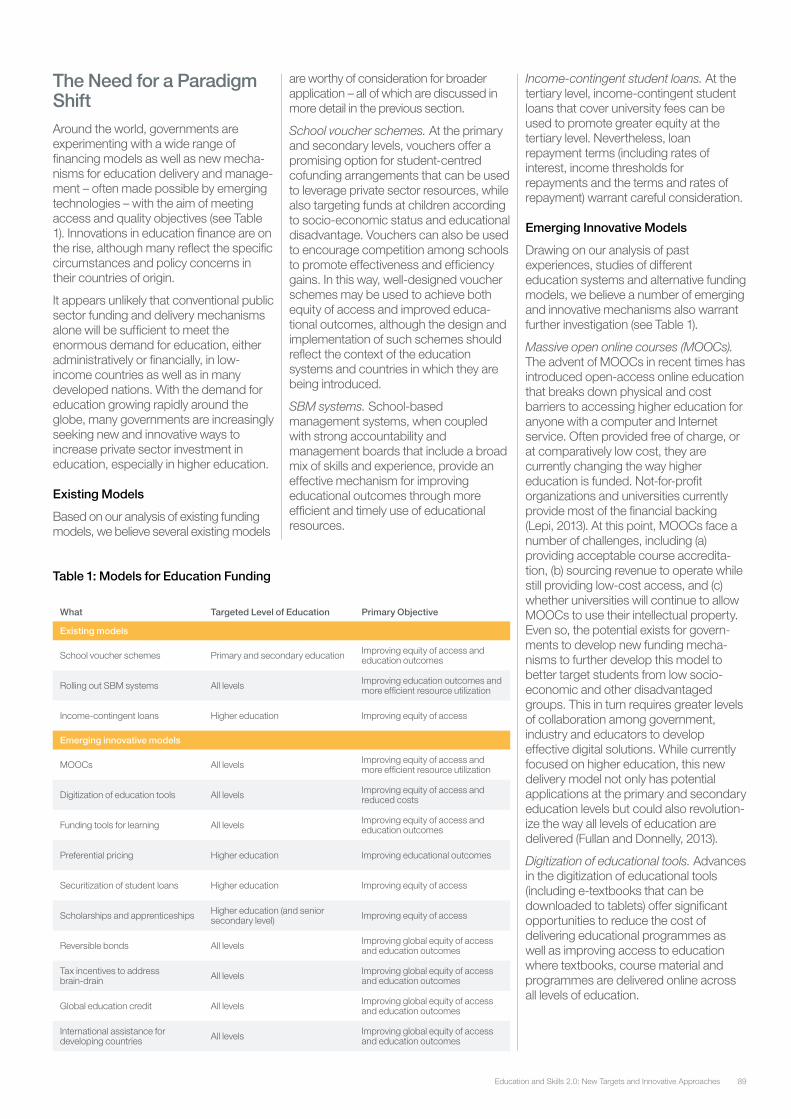
89Education and Skills 2.0: New Targets and Innovative Approaches
The Need for a Paradigm ShiftAround the world, governments are experimenting with a wide range of financing models as well as new mecha-nisms for education delivery and manage-ment – often made possible by emerging technologies – with the aim of meeting access and quality objectives (see Table 1). Innovations in education finance are on the rise, although many reflect the specific circumstances and policy concerns in their countries of origin.
It appears unlikely that conventional public sector funding and delivery mechanisms alone will be sufficient to meet the enormous demand for education, either administratively or financially, in low-income countries as well as in many developed nations. With the demand for education growing rapidly around the globe, many governments are increasingly seeking new and innovative ways to increase private sector investment in education, especially in higher education.
Existing Models
Based on our analysis of existing funding models, we believe several existing models
are worthy of consideration for broader application – all of which are discussed in more detail in the previous section.
School voucher schemes. At the primary and secondary levels, vouchers offer a promising option for student-centred cofunding arrangements that can be used to leverage private sector resources, while also targeting funds at children according to socio-economic status and educational disadvantage. Vouchers can also be used to encourage competition among schools to promote effectiveness and efficiency gains. In this way, well-designed voucher schemes may be used to achieve both equity of access and improved educa-tional outcomes, although the design and implementation of such schemes should reflect the context of the education systems and countries in which they are being introduced.
SBM systems. School-based management systems, when coupled with strong accountability and management boards that include a broad mix of skills and experience, provide an effective mechanism for improving educational outcomes through more efficient and timely use of educational resources.
Income-contingent student loans. At the tertiary level, income-contingent student loans that cover university fees can be used to promote greater equity at the tertiary level. Nevertheless, loan repayment terms (including rates of interest, income thresholds for repayments and the terms and rates of repayment) warrant careful consideration.
Emerging Innovative Models
Drawing on our analysis of past experiences, studies of different education systems and alternative funding models, we believe a number of emerging and innovative mechanisms also warrant further investigation (see Table 1).
Massive open online courses (MOOCs). The advent of MOOCs in recent times has introduced open-access online education that breaks down physical and cost barriers to accessing higher education for anyone with a computer and Internet service. Often provided free of charge, or at comparatively low cost, they are currently changing the way higher education is funded. Not-for-profit organizations and universities currently provide most of the financial backing (Lepi, 2013). At this point, MOOCs face a number of challenges, including (a) providing acceptable course accredita-tion, (b) sourcing revenue to operate while still providing low-cost access, and (c) whether universities will continue to allow MOOCs to use their intellectual property. Even so, the potential exists for govern-ments to develop new funding mecha-nisms to further develop this model to better target students from low socio-economic and other disadvantaged groups. This in turn requires greater levels of collaboration among government, industry and educators to develop effective digital solutions. While currently focused on higher education, this new delivery model not only has potential applications at the primary and secondary education levels but could also revolution-ize the way all levels of education are delivered (Fullan and Donnelly, 2013).
Digitization of educational tools. Advances in the digitization of educational tools (including e-textbooks that can be downloaded to tablets) offer significant opportunities to reduce the cost of delivering educational programmes as well as improving access to education where textbooks, course material and programmes are delivered online across all levels of education.
What Targeted Level of Education Primary Objective
Existing models
School voucher schemes Primary and secondary education Improving equity of access and education outcomes
Rolling out SBM systems All levels Improving education outcomes and more efficient resource utilization
Income-contingent loans Higher education Improving equity of access
Emerging innovative models
MOOCs All levels Improving equity of access and more efficient resource utilization
Digitization of education tools All levels Improving equity of access and reduced costs
Funding tools for learning All levels Improving equity of access and education outcomes
Preferential pricing Higher education Improving educational outcomes
Securitization of student loans Higher education Improving equity of access
Scholarships and apprenticeships Higher education (and senior secondary level) Improving equity of access
Reversible bonds All levels Improving global equity of access and education outcomes
Tax incentives to address brain-drain All levels Improving global equity of access
and education outcomes
Global education credit All levels Improving global equity of access and education outcomes
International assistance for developing countries All levels Improving global equity of access
and education outcomes
Table 1: Models for Education Funding
Education and Skills 2.0: New Targets and Innovative Approaches90
Funding tools for learning. Drawing on the Irish model, the provision of “tools of learning”, such as providing students with adequate nutrition (like school meals), access to technology (like Internet, tablets and laptops), and access to extra-curricular activities (important for social inclusion) represent important factors in breaking down barriers to accessing education and improving education outcomes for disadvantaged students. In India, the state of Bihar has experimented with giving out bicycles for girls to help them commute to school where transport has been a barrier.15 The feasibility of developing cofunding opportunities for delivering projects that provide “tools for learning” should be investigated, possibly combining private sector sponsorship (e.g. by technology companies or food manufacturers) with government funding.
Preferential pricing of tertiary education. At the tertiary level, the potential exists for developing preferential pricing mechanisms for degrees and other programmes, whereby governments and higher education institutions (HEIs) collaborate to streamline faculties and courses offered so that the number of students graduating from a specific field aligns with labour market demand and a country’s human resource planning goals. For example, fees for university programmes could be set to reflect:
- the demand by students for places in a particular field of study;
- the cost of programme delivery (such as the cost of providing science degrees is generally higher than that of a social science degree);
- labour market demand for graduates;
- relevance of the field of study in terms of national objectives for economic development.
Securitization of student loans. The securitization of student loans for higher education – where student loans are pooled into a trust and sold as asset-backed securities to investors – provides a potential vehicle for tapping into private sources of education funding (Copping, 2004). This in turn can free up public funding for other targeted purposes, including providing financial assistance to low-income students at the primary and secondary levels and crafting initiatives aimed at a better quality of education. Nevertheless, concerns arise regarding pressures graduates may encounter from private creditors should they find themselves unable to meet loan repayments, or should the repayments terms be altered retrospectively. Clearly,
safeguards would need to be set to prevent retrospective changes being made by private creditors to the terms of student loan repayments.
Historically, the United States provided a model for the securitization of student loans. However, the collapse of the US subprime mortgage market resulted in a collapse in markets for securitized debt. A major challenge for the recovery of these markets involves overcoming the significant problems of accurately assessing the risks associated with these instruments. This is especially true for student loans, which are not typically tied to creditworthiness or ability to repay. Sabhlok (2012) suggests using a formula comprising students’ grade score average, major and academic institution, to assess student creditworthiness as these factors are directly related to future employability and ability to repay. It is worth noting that the United Kingdom recently announced plans to divest a share of the government’s student loan portfolio as a first tranche in privatizing a large student loan portfolio that is forecast to rise to close to 7% of GDP by 2033 from just under 2% of GDP in 2011–2012.16,17,18,19
Scholarships and apprenticeships. Governments and private sector organizations could make greater use of scholarships to either partially or fully fund the studies of selected students. Students can be targeted based on their socio-economic background, academic ability or a range of other eligibility criteria. Generally offered at the tertiary level, these schemes typically combine paid study with work and include offers of employment upon graduation, subject to results. Governments could encourage greater private sector involvement by offering incentives through a variety of means including (a) the taxation system (tax deductibility of scholarships); (b) preferential access to government contracts; or (c) cofunding scholarships (matching private sector funding dollar-for-dollar). They could also target industry sectors according to labour market needs and national development priorities. Additionally, these programmes could be extended to developing country students in return, for example, for a given period of employment with the sponsoring company or country on the completion of their studies.
As an alternate route to gaining more formal qualifications, governments could also increase the number of people undertaking apprenticeships by offering cofunded programmes that provide
“on-the-job” training in vocational skills and qualifications in a variety of trades and potentially nontrade sectors (like office administration or hospitality). Greater funding from the private sector could come from similar mechanisms as those proposed for scholarship schemes.
Reversible bonds. One innovative solution recently proposed by Professor Ann Bradford of Columbia Law School is introducing a system of “reversible bonds”. These could act as an insurance mechanism for both source countries as compensation for the cost of lost talent (costs of education and productivity losses), as well as to mitigate the risk to destination countries of potential welfare payments (unemployment benefits and healthcare), or to cover incarceration or deportation costs if the worker commits a crime.
How would it work? The employer in the destination country would post a bond – the amount of which could be agreed by both governments – and so long as the worker stays employed for a specified period, the bond could then be divided between the employer that posted it (as a reward) and the source country (as compensation). If the worker were to return home after a specified period, neither country would need compensation as the destination country would have benefited from the person’s labour and tax revenues, while the source country would have benefited from the worker’s return, presumably with higher-level skills. The bond could then be released to the worker as an incentive for returning home and, as Professor Bradford explains, as an incentive for “brain circulation” instead of brain drain.
Tax incentives to reduce brain-drain. A longstanding potential initiative is the introduction of a “brain-drain” tax. First proposed by Bhagwati (1972), it would tax income earned abroad by a country’s diaspora living in developed countries. The tax could provide governments with a means of reclaiming the cost of investments in education and help to offset costs associated with losing educated citizens to more lucrative overseas labour markets. While politically acceptable because of its perceived fairness, major complications arise owing to administrative and legal difficulties associated with international tax collection, which generally requires bilateral treaties. Significant issues also arise owing to the consequent double-taxation of income by host and source countries (Brauner, 2010).

91Education and Skills 2.0: New Targets and Innovative Approaches
One possibility, suggested by Wilson (2008), involves asking governments to offer lower tax rates to returning emigrants who have previously paid the brain-drain tax compared with rates paid by citizens who have evaded the brain-drain tax when employed overseas (Wilson, 2008). In an alternative approach, Thailand is proposing a reduction in personal income tax rates to encourage the return of Thailand’s diaspora, attract investors and create new jobs (Deboonme, 2012).
Despite the potential challenges of effective implementation, the authors believe changes to tax legislation – including the formation of bilateral and multilateral tax agreements – should be investigated further to encourage greater levels of remittances and investments from citizens living abroad. This could involve the levying of a “migration tax” on destination countries receiving foreign workers and paid to source countries as a means of compensation in recognition of the “global public good” nature of education. The revenue generated could be used to fund higher secondary and tertiary education in countries of origin.
Global education credits. The feasibility of developing a market for the trading of “global mobile talent” could be investigated as an option for raising funds for education in the developing world, or even in poorer communities in the developed world. This funding model could include establishing a global trading market for skills akin to the global carbon market, with each country allocated a certain quota of “mobile talent” depending on the size of its population. This market could work in much the same way as the market for carbon credits (or emissions trading permits) whereby polluters offset their emissions by paying for “green” initiatives (such as reforestation projects and wind farms) by purchasing carbon credits.20 Thus, countries that exceed their quotas of imported talent would pay into a global fund that would compensate countries most affected by a brain drain.
International assistance for developing countries. Foreign governments, international agencies and foreign HEIs could provide greater levels of assistance to developing nations in formulating and implementing educational policy reforms that encourage local HEIs to be more responsive to a country’s economic and social development needs. This could include working with these nations to ensure that clear strategies and effective funding allocation mechanisms are in place, supported by rigorous monitoring of results. Assistance could also be
provided to increase levels of collaboration between public and private sector stakeholders at the local level on developing funding models and the curriculum and aligning the skills of graduates to labour market needs.
A Broad Coalition Needed to Foot the BillIn summary, many countries around the world are struggling to fund universal and quality education objectives through conventional models. Countries facing budget constraints arising from the current global fiscal climate will increasingly require funding approaches that combine greater private sector investment. Governments, private sector stakeholders and not-for-profit organizations must work together to find innovative and scalable solutions that deliver affordable and quality education at all levels while maintaining equity of access. To this end, governments need to target public investment at levels and segments of the population where corresponding improvement aligns with and supports social and economic development objectives. Moreover, governments that move quickly to take advantage of recent advancements in low-cost access to education delivery may make significant inroads into the issues of equity and quality – and see a corresponding boost in socio-economic performance that yields a significant competitive advantage to a country’s firms and industries.
ReferencesAndrew, M. Black-white differences in the intergenerational transmission of education and the role of heterogeneous middle class experiences. Session 200: Education and Social Mobility. Population Association of American, 2012 Annual Meeting Program.
Barrera-Osorio, F., Fasih, T. and Patrinos, H. A. Decentralized Decision-making in Schools: The Theory and Evidence on School-based Management. The World Bank, 2009.
Baxter, R. and Birks, S. The student debt debate: An economic investigation of the issues. Student Paper, No. 4, Massey University Centre for Public Policy Evaluation, 2004.
Bhagwati, J. N. The United States in the Nixon Era: The End of Innocence. Daedalus, 1972.
Boissiere, M. Rationale for Public Investment in Primary Education in Developing Countries: Background Paper for the Evaluation of the World Bank’s Support to Primary Education. WB Operations Evaluation Dept., World Bank, 2004.
Bradford, A. Insuring immigration. Project Syndicate, 18 June 2013.
Brauner, Y. Brain drain taxation as development policy. Uni of Florida Legal Studies Research Paper No. 2010–17, 2010.
Buckingham, J. Submission to the Review of Funding for Schooling. Sydney: The Centre for Independent Studies, 2011.
Buckingham, J. School Funding, Choice and Equity, Issues Analysis. No. 126, The Centre for Independent Studies, 26 October 2011.
School-Based Management. The International Institute for Educational Planning and The International Academy of Education, Education Policy Series 3, UNESCO, 2005.
Campbell, C., Carpentier, V. and Whitty, G. Educational financing and improvement: conceptual issues and policy
debates in the UK. In Scheweizerische Zeitschrift fur Bidungswissenschaften, 2003, 25, 3: 455–480.
CFS, Study Now, Pay Forever: Income Contingent Repayment Loan Scheme. Canadian Fed. of Students, 2007.
Chan, K. Education. http://www.kailchan.ca/economics-finance-2/education/, 2013.
Chapman, B. and Ryan, C. Income contingent financing of student charges for higher education: assessing the Australian innovation. Discussion Paper No. 449, Centre for Economic Policy Research, ANU, 2002.
Chow, G. C. and Shen, Y. Demands for education in China. CEPS Working Paper No. 106, April 2005.
Copping, M. Australian student loans – Taking securitization back to school. In Securitisation News, Deloitte, 2004.
Dearden, L., Fitzsimons, E. and Wyness, G. The impact of higher education finance on university participation in the UK. BIS Research Paper No. 11, Department for Business Innovation & Skills, 2010.. In The Nation, 24 December 2012.
Denny, K. What did abolishing university fees in Ireland do?. UCD Geary Institute Discussion Paper Series, 20 May 2010.
Education Innovation Fund for India. http://www.eifiaurosociety.org/about-the-grant.html, 2011.
European Commission. National Student Fee and Support Systems: 2011–12. EC, September 2012.
Friedman, M. The role of government in education. In Solo, R. (ed.). Economics and the Public Interest. Brunswick, 1955, pp 123–144.
Fullan, M. and Donnelly, K. Alive in the Swamp: Assessing Digital Innovations in Education. New Schools Venture Fund, Nesta, 2013.
Gonski, D., Boston, K., Griener, K., Lawrence, C., Scales, B. and Tannock, P. Review of funding for schooling: Final Report. Australian Department of Education, Employment and Workplace Relations, December 2011.
Gropello, E., Tandon, P. and Yusuf, S. Putting higher education to work: Skills and research for growth in East Asia. In World Bank East Asia and Pacific Regional Report. WB Publications, 2012.
Hamadeh, M. and Khoueiri, R. Demand elasticities for higher education in the United States. In International Journal of Business and Economics Perspectives, 2010, Vol. 5, No. 2, Autumn 2010.
Hancock, L. Why are Finland’s schools successful?. In Smithsonian Magazine, September 2011.
Kara, O. Comparing two approaches to the rate of return to investment in education. In Education Economics, 2010, Vol. 18, No. 2: 153–165.
Lepi, K. Behind-The-Scenes: How MOOCs Are Getting Money. eduemic, 2013.
Maani, S. and Warner, A. R. The Economic Implications of Tertiary Fee Rises in Relation to Student Welfare and the Policy Environment. The University of Auckland, 2000.
McKinsey & Company. The Economic Impact of the Achievement Gap in Americas Schools. McKinsey & Company, 2009.
NEA. Charter Schools. National Education Association, 2013.
NZ MOE. Student Loan Scheme Annual Report 2008. NZ Ministry of Education, 2008.
OECD. On the edge: Securing a sustainable future for higher education. OECD Education WP, No. 7, OECD, 2007.
OECD. Education at a Glance 2009: OECD Indicators. OECD Directorate for Education, OECD, 2009.
OECD. PISA in Focus, Education Policy. OECD, 2011.
OECD. Education at a Glance 2012: OECD Indicators. OECD, 2012.
OECD. Education Indicators in Focus. OECD, 2012.
OECD. OECD Reviews of Evaluation and Assessment in Education – Synergies for Better Learning: An International Perspective on Evaluation and Assessment. OECD, 2013.
Patrinos, H. A. How Do School Vouchers Help Improve Education Systems?. World Bank, 2012.
Peterson, P. E. School vouchers in the United States: Productivity in the public and private sectors. In ZfE, 2008, 11 2: 1–15.
Polidano, C., Hanel, B. and Buddelmeyer, H. Explaining the SES school completion gap. Melbourne Institute Working Paper Series, Working Paper No. 16/12, 2012.
Pool, I. The demography of the student loan, transcript of presentation. Student Debt Summit, Auckland, 2002.
Psacharopoulos, G. Returns to investment in education: A global update. In World Development, 1994, Vol. 2, No. 9: 1325–1343.
Psacharopoulos, G. The profitability of investment in education: Concepts and methods, human capital development and operations policy. HCO Working Papers, December 1995.
Psacharopoulos, G. Returns to investment in education: A further update. Policy Research Working Paper, Latin America and the Caribbean Region, Education Sector Unit, The World Bank, September 2002.
Sabhlok, R. Student loan crisis solved – next problem?. In Forbes, 14 December 2012.
Education and Skills 2.0: New Targets and Innovative Approaches92
Srur, A. Subsidising education: are school vouchers the solution?. International Initiative for Impact Evaluation, 3ie Enduring Questions Brief Number 16, July 2010.
StateUniversity.com. Measurement economic benefits of education investment – an illustration, private value versus social costs, Empirical Findings, Estimation Issues, undated.
UK Department for Business Innovation & Skills. The impact of higher education finance on university participation in the UK. BIS Research Paper No. 11, UK Department for Business Innovation & Skills, 2010.. The Future of Higher Education. UK Department for Education and Skills, 2003.
UNESCO. Opportunities Lost: The Impact of Grade Repetition and Early School Leaving. UNESCO Institute of Statistics, 2012.
US Department of Education. Race to the Top Program: Executive Summary. Washington DC: US Department of Education, 2009.
World Bank. The road not traveled: Education reform in the Middle East and North Africa. MENA Development Report, The World Bank, 2007.
Wison, J. D. A voluntary brain-drain text. In Journal of Public Economics, 2008, Vol. 92: 2385–2391.
WISE. Funding education: New models for our times. World Innovation Summit for Education, Qatar, 2010.
Endnotes1. The authors wish to thank Dr John Dennehy and Dr Kai Chan
for their valuable inputs into the chapter.
2. In the early 1960s, Theodore W. Schultz, professor of economics at the University of Chicago, first developed the concept of human capital. He argued that human capital “consists of the accumulation of all prior investments in education, on-the-job training, health, migration and other factors that increase individual productivity and, therefore, earnings”. http://academic.cengage.com/resource_uploads/downloads/0324321457_65782.pdf.
3. Study included OECD countries plus other G20 countries (Argentina, Brazil, China, India, Indonesia, Russian Federation, Saudi Arabia, South Africa).
4. Across all OECD countries for which comparable data are available.
5. Source: http://www.nationmaster.com/red/graph/edu_dur_of_com_edu-education-duration-of-compulsory&b_printable=1.
6. Source: http://www.bmz.de/en/what_we_do/issues/Education/hintergrund/bildungsituation/index.html.
7. Source: http://www.eifiaurosociety.org/about-the-grant.html.
8. Source: http://populationaction.org/Publications2/Data_and_Maps/Shape_of_Things_to_Come/Summary.php.
9. Where “social” returns reflect the benefits and costs of funding education to society. Social benefits include having and educated and productive workforce that contributes to economic growth and greater levels of civic engagement, while social costs can include unemployment and crime.
10. Source: http://education.stateuniversity.com/pages/1930/Economic-Benefits-Education-Investment-Measurement.html.
11. Source: http://www.ed.gov/ladders.
12. Achievement as measured by the Program for International Student Assessment (PISA) conducted by the OECD that evaluates the knowledge and skills of the world’s 15-year-olds through its PISA test, which covers maths, reading and science, with the main focus on maths. The OECD indicates that PISA results reveal what is possible in education by showing what students in the highest-performing and most rapidly improving education systems can do. http://www.oecd.org/pisa/.
13. Including Hong Kong, Mexico, New Zealand, the Netherlands, Spain, Thailand, the United States and the United Kingdom.
14. E.g. Chile, India, Sweden, United States and the United Kingdom.
15. Source: http://www.theigc.org/publications/igc-project/cycling-school-increasing-high-school-enrollment-girls-bihar.
16. http://countryeconomy.com/gdp/uk.
17. http://cdn.budgetresponsibility.independent.gov.uk/2013-FSR_OBR_web.pdf.
18. http://media.efinancialnews.com/digest/2013-10-20/uk-student-loan-portfolio-privatisation-plan?ea9c8a2de0ee111045601ab04d673622.
19. http://uk.reuters.com/article/2013/11/24/uk-britain-loans-selloff-idUKBRE9AN0HX20131124.
20. Source: http://advancedglobaltrading.com/featured/carbon-credits-birth-of-new-commodity/#.UixqgsZmim4.
human capital is critically determined by the physical, social and economic context of a society, because that context determines how particular attributes a person possesses may be rewarded. The HCI is thus based on four pillars: three core determinants of human capital (education, health and employment) plus those factors that allow these three core determinants to translate into greater returns.
Second, the HCI takes a long-term approach to human capital. In addition to providing a snapshot of the state of a country’s human capital today through measures that reflect the results of a country’s past practices, it includes indicators resulting from practices and policy decisions impacting the children of today and that will shape the future workforce. Long-term thinking around human capital often does not fit political cycles or business investment horizons. But a lack of such long-term planning can perpetuate continued wasted potential in a country’s population and losses for a nation’s growth and productivity.
Third, the HCI aims to take into account the individual life course. For example, the World Health Organization (WHO) states that “early childhood is the most impor-tant phase for overall development throughout the lifespan”, elaborating that “many challenges faced by adults, such as mental health issues, obesity, heart disease, criminality and poor literacy and numeracy, can be traced back to early childhood”. The HCI thus includes measures indicating quality of early childhood. Furthermore, the HCI captures the extent to which investments made in earlier years in health and education are being realized in the working-age popula-tion through lifelong learning and training. Finally, at the other end of the continuum, the HCI takes into account the health and productivity of the older population.
The HCI structure contains four pillars:
- The Health and Wellness pillar contains indicators relating to a population’s physical and mental well-being, from childhood to adulthood.
- The Education pillar contains indicators relating to quantitative and qualitative aspects of education across primary, secondary and tertiary levels, and contains information on both the present workforce as well as the future workforce.
- The Workforce and Employment pillar is designed to quantify the experience, talent, knowledge and training in a country’s working-age population.
A nation’s human capital endowment – the skills and capacities that reside in people and that are put to productive use – can be a more important determinant of its long-term economic success than virtually any other resource. This resource must be invested in and leveraged efficiently to generate returns, for the individuals involved as well as an economy as a whole. Despite high unemployment in many countries, the global economy is entering an era of talent scarcity that, if left unaddressed, will hinder economic growth worldwide. Understanding and addressing challenges related to human capital is thus fundamental to short-term stability as well as the long-term growth, prosperity and competitiveness of nations.
The World Economic Forum’s Human Capital Index (HCI), released in October 2013, explores the contributors and inhibitors to the development and deployment of a healthy, educated and productive labour force. The HCI provides country rankings that allow for effective comparisons across regions and income groups. For full details of the HCI and to view 122 individual country profiles, please refer to the World Economic Forum’s Human Capital Report.1 The Report was coauthored by David E. Bloom, Patricia Milligan, Rick Guzzo, Charlotte Harding and Saadia Zahidi. This chapter draws upon the Report’s findings.
MethodologyThe HCI has three key features. First, the HCI measures a broader set of indicators than the traditional definitions of human capital. Human capital is not a one-dimensional concept, but means different things to different stakeholders. Tradition-ally, human capital has been viewed as a function of education and experience, the latter reflecting both training and learning by doing. But in recent years, health (including physical capacities, cognitive function and mental health) has come to be seen as a fundamental component of human capital. Additionally, the value of
Chapter 12: The Human Capital Index Saadia Zahidi
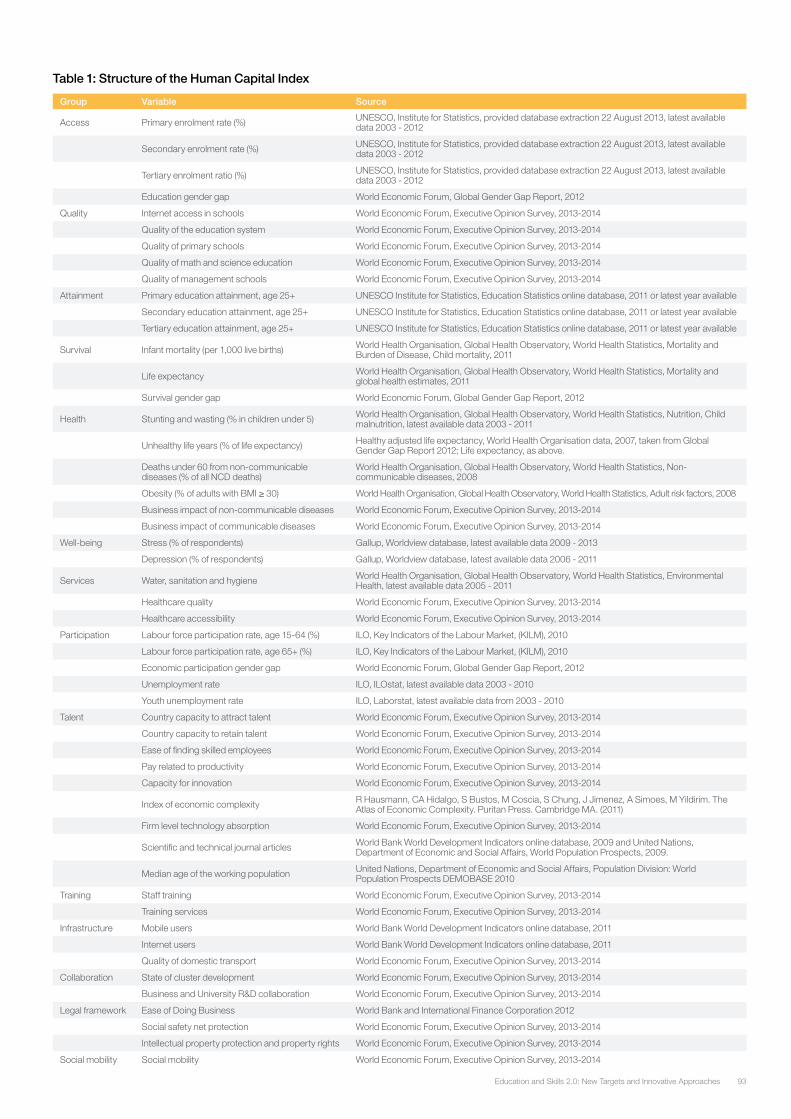
93Education and Skills 2.0: New Targets and Innovative Approaches
Group Variable Source
Access Primary enrolment rate (%) UNESCO, Institute for Statistics, provided database extraction 22 August 2013, latest available data 2003 - 2012
Secondary enrolment rate (%) UNESCO, Institute for Statistics, provided database extraction 22 August 2013, latest available data 2003 - 2012
Tertiary enrolment ratio (%) UNESCO, Institute for Statistics, provided database extraction 22 August 2013, latest available data 2003 - 2012
Education gender gap World Economic Forum, Global Gender Gap Report, 2012
Quality Internet access in schools World Economic Forum, Executive Opinion Survey, 2013-2014
Quality of the education system World Economic Forum, Executive Opinion Survey, 2013-2014
Quality of primary schools World Economic Forum, Executive Opinion Survey, 2013-2014
Quality of math and science education World Economic Forum, Executive Opinion Survey, 2013-2014
Quality of management schools World Economic Forum, Executive Opinion Survey, 2013-2014
Attainment Primary education attainment, age 25+ UNESCO Institute for Statistics, Education Statistics online database, 2011 or latest year available
Secondary education attainment, age 25+ UNESCO Institute for Statistics, Education Statistics online database, 2011 or latest year available
Tertiary education attainment, age 25+ UNESCO Institute for Statistics, Education Statistics online database, 2011 or latest year available
Survival Infant mortality (per 1,000 live births) World Health Organisation, Global Health Observatory, World Health Statistics, Mortality and Burden of Disease, Child mortality, 2011
Life expectancy World Health Organisation, Global Health Observatory, World Health Statistics, Mortality and global health estimates, 2011
Survival gender gap World Economic Forum, Global Gender Gap Report, 2012
Health Stunting and wasting (% in children under 5) World Health Organisation, Global Health Observatory, World Health Statistics, Nutrition, Child malnutrition, latest available data 2003 - 2011
Unhealthy life years (% of life expectancy) Healthy adjusted life expectancy, World Health Organisation data, 2007, taken from Global Gender Gap Report 2012; Life expectancy, as above.
Deaths under 60 from non-communicable diseases (% of all NCD deaths)
World Health Organisation, Global Health Observatory, World Health Statistics, Non-communicable diseases, 2008
Obesity (% of adults with BMI ≥ 30) World Health Organisation, Global Health Observatory, World Health Statistics, Adult risk factors, 2008
Business impact of non-communicable diseases World Economic Forum, Executive Opinion Survey, 2013-2014
Business impact of communicable diseases World Economic Forum, Executive Opinion Survey, 2013-2014
Well-being Stress (% of respondents) Gallup, Worldview database, latest available data 2009 - 2013
Depression (% of respondents) Gallup, Worldview database, latest available data 2006 - 2011
Services Water, sanitation and hygiene World Health Organisation, Global Health Observatory, World Health Statistics, Environmental Health, latest available data 2005 - 2011
Healthcare quality World Economic Forum, Executive Opinion Survey, 2013-2014
Healthcare accessibility World Economic Forum, Executive Opinion Survey, 2013-2014
Participation Labour force participation rate, age 15-64 (%) ILO, Key Indicators of the Labour Market, (KILM), 2010
Labour force participation rate, age 65+ (%) ILO, Key Indicators of the Labour Market, (KILM), 2010
Economic participation gender gap World Economic Forum, Global Gender Gap Report, 2012
Unemployment rate ILO, ILOstat, latest available data 2003 - 2010
Youth unemployment rate ILO, Laborstat, latest available data from 2003 - 2010
Talent Country capacity to attract talent World Economic Forum, Executive Opinion Survey, 2013-2014
Country capacity to retain talent World Economic Forum, Executive Opinion Survey, 2013-2014
Ease of finding skilled employees World Economic Forum, Executive Opinion Survey, 2013-2014
Pay related to productivity World Economic Forum, Executive Opinion Survey, 2013-2014
Capacity for innovation World Economic Forum, Executive Opinion Survey, 2013-2014
Index of economic complexity R Hausmann, CA Hidalgo, S Bustos, M Coscia, S Chung, J Jimenez, A Simoes, M Yildirim. The Atlas of Economic Complexity. Puritan Press. Cambridge MA. (2011)
Firm level technology absorption World Economic Forum, Executive Opinion Survey, 2013-2014
Scientific and technical journal articles World Bank World Development Indicators online database, 2009 and United Nations, Department of Economic and Social Affairs, World Population Prospects, 2009.
Median age of the working population United Nations, Department of Economic and Social Affairs, Population Division: World Population Prospects DEMOBASE 2010
Training Staff training World Economic Forum, Executive Opinion Survey, 2013-2014
Training services World Economic Forum, Executive Opinion Survey, 2013-2014
Infrastructure Mobile users World Bank World Development Indicators online database, 2011
Internet users World Bank World Development Indicators online database, 2011
Quality of domestic transport World Economic Forum, Executive Opinion Survey, 2013-2014
Collaboration State of cluster development World Economic Forum, Executive Opinion Survey, 2013-2014
Business and University R&D collaboration World Economic Forum, Executive Opinion Survey, 2013-2014
Legal framework Ease of Doing Business World Bank and International Finance Corporation 2012
Social safety net protection World Economic Forum, Executive Opinion Survey, 2013-2014
Intellectual property protection and property rights World Economic Forum, Executive Opinion Survey, 2013-2014
Social mobility Social mobility World Economic Forum, Executive Opinion Survey, 2013-2014
Table 1: Structure of the Human Capital Index
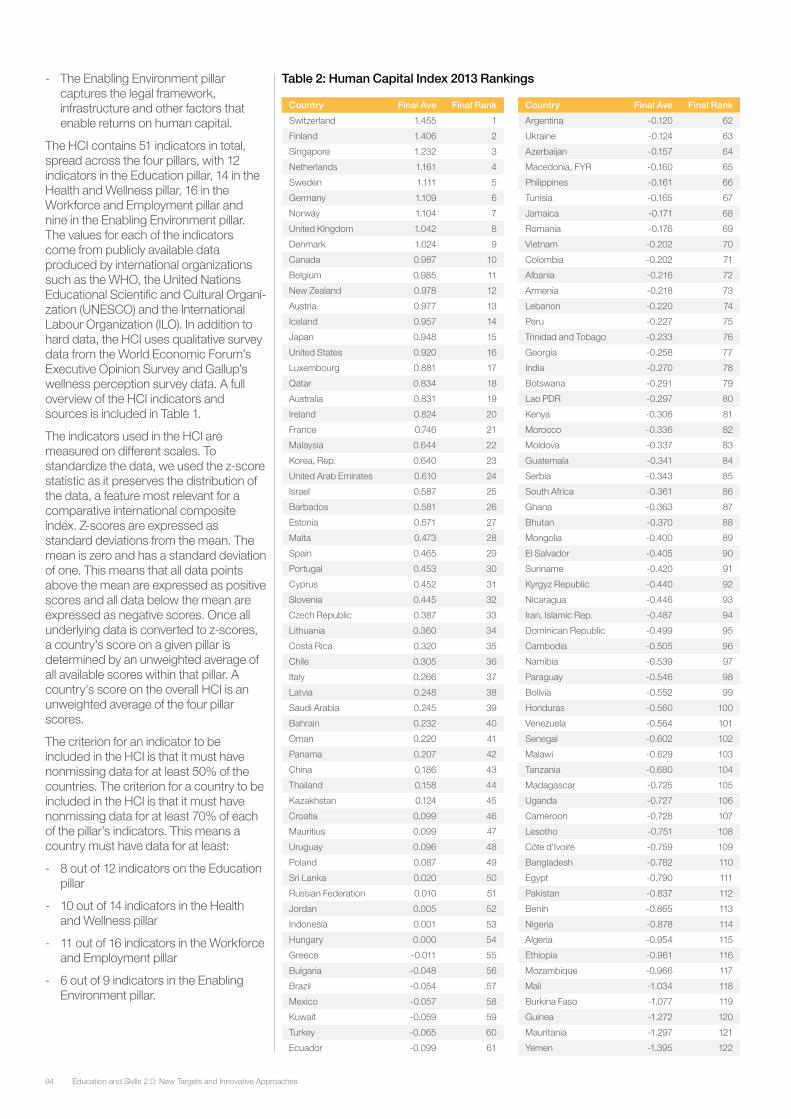
Education and Skills 2.0: New Targets and Innovative Approaches94
- The Enabling Environment pillar captures the legal framework, infrastructure and other factors that enable returns on human capital.
The HCI contains 51 indicators in total, spread across the four pillars, with 12 indicators in the Education pillar, 14 in the Health and Wellness pillar, 16 in the Workforce and Employment pillar and nine in the Enabling Environment pillar. The values for each of the indicators come from publicly available data produced by international organizations such as the WHO, the United Nations Educational Scientific and Cultural Organi-zation (UNESCO) and the International Labour Organization (ILO). In addition to hard data, the HCI uses qualitative survey data from the World Economic Forum’s Executive Opinion Survey and Gallup’s wellness perception survey data. A full overview of the HCI indicators and sources is included in Table 1.
The indicators used in the HCI are measured on different scales. To standardize the data, we used the z-score statistic as it preserves the distribution of the data, a feature most relevant for a comparative international composite index. Z-scores are expressed as standard deviations from the mean. The mean is zero and has a standard deviation of one. This means that all data points above the mean are expressed as positive scores and all data below the mean are expressed as negative scores. Once all underlying data is converted to z-scores, a country's score on a given pillar is determined by an unweighted average of all available scores within that pillar. A country's score on the overall HCI is an unweighted average of the four pillar scores.
The criterion for an indicator to be included in the HCI is that it must have nonmissing data for at least 50% of the countries. The criterion for a country to be included in the HCI is that it must have nonmissing data for at least 70% of each of the pillar’s indicators. This means a country must have data for at least:
- 8 out of 12 indicators on the Education pillar
- 10 out of 14 indicators in the Health and Wellness pillar
- 11 out of 16 indicators in the Workforce and Employment pillar
- 6 out of 9 indicators in the Enabling Environment pillar.
Country Final Ave Final Rank
Switzerland 1.455 1
Finland 1.406 2
Singapore 1.232 3
Netherlands 1.161 4
Sweden 1.111 5
Germany 1.109 6
Norway 1.104 7
United Kingdom 1.042 8
Denmark 1.024 9
Canada 0.987 10
Belgium 0.985 11
New Zealand 0.978 12
Austria 0.977 13
Iceland 0.957 14
Japan 0.948 15
United States 0.920 16
Luxembourg 0.881 17
Qatar 0.834 18
Australia 0.831 19
Ireland 0.824 20
France 0.746 21
Malaysia 0.644 22
Korea, Rep. 0.640 23
United Arab Emirates 0.610 24
Israel 0.587 25
Barbados 0.581 26
Estonia 0.571 27
Malta 0.473 28
Spain 0.465 29
Portugal 0.453 30
Cyprus 0.452 31
Slovenia 0.445 32
Czech Republic 0.387 33
Lithuania 0.360 34
Costa Rica 0.320 35
Chile 0.305 36
Italy 0.266 37
Latvia 0.248 38
Saudi Arabia 0.245 39
Bahrain 0.232 40
Oman 0.220 41
Panama 0.207 42
China 0.186 43
Thailand 0.158 44
Kazakhstan 0.124 45
Croatia 0.099 46
Mauritius 0.099 47
Uruguay 0.096 48
Poland 0.087 49
Sri Lanka 0.020 50
Russian Federation 0.010 51
Jordan 0.005 52
Indonesia 0.001 53
Hungary 0.000 54
Greece -0.011 55
Bulgaria -0.048 56
Brazil -0.054 57
Mexico -0.057 58
Kuwait -0.059 59
Turkey -0.065 60
Ecuador -0.099 61
Country Final Ave Final Rank
Argentina -0.120 62
Ukraine -0.124 63
Azerbaijan -0.157 64
Macedonia, FYR -0.160 65
Philippines -0.161 66
Tunisia -0.165 67
Jamaica -0.171 68
Romania -0.176 69
Vietnam -0.202 70
Colombia -0.202 71
Albania -0.216 72
Armenia -0.218 73
Lebanon -0.220 74
Peru -0.227 75
Trinidad and Tobago -0.233 76
Georgia -0.258 77
India -0.270 78
Botswana -0.291 79
Lao PDR -0.297 80
Kenya -0.306 81
Morocco -0.336 82
Moldova -0.337 83
Guatemala -0.341 84
Serbia -0.343 85
South Africa -0.361 86
Ghana -0.363 87
Bhutan -0.370 88
Mongolia -0.400 89
El Salvador -0.405 90
Suriname -0.420 91
Kyrgyz Republic -0.440 92
Nicaragua -0.446 93
Iran, Islamic Rep. -0.487 94
Dominican Republic -0.499 95
Cambodia -0.505 96
Namibia -0.539 97
Paraguay -0.546 98
Bolivia -0.552 99
Honduras -0.560 100
Venezuela -0.564 101
Senegal -0.602 102
Malawi -0.629 103
Tanzania -0.680 104
Madagascar -0.725 105
Uganda -0.727 106
Cameroon -0.728 107
Lesotho -0.751 108
Côte d'Ivoire -0.759 109
Bangladesh -0.782 110
Egypt -0.790 111
Pakistan -0.837 112
Benin -0.865 113
Nigeria -0.878 114
Algeria -0.954 115
Ethiopia -0.961 116
Mozambique -0.966 117
Mali -1.034 118
Burkina Faso -1.077 119
Guinea -1.272 120
Mauritania -1.297 121
Yemen -1.395 122
Table 2: Human Capital Index 2013 Rankings
95Education and Skills 2.0: New Targets and Innovative Approaches
Country Rankings 2013The final HCI covers 122 countries, with various tables showing global rankings, individual country profiles and regional comparisons. In this section, we would like to highlight some of the key rankings (for the full HCI results, see Table 2).
Top 10
The Report identifies those countries that are leading in investing in their nation’s human capital. The top 10 countries are dominated by the European countries, with eight of the top 10 spots occupied by countries from this region. Switzerland (1) tops the rankings for the HCI, demonstrating consistently high scores across all four pillars, with top spots on Health and Wellness and Workforce and Employment, second place on Enabling Environment and fourth on Education.
Within the countries from northern and western Europe in the top 10, four Nordic countries, Finland (2), Sweden (5), Norway (7) and Denmark (9) dominate. Finland’s exemplary Education and Enabling Environment scores put it at the top of the rankings for these two pillars and seven ranks ahead of the next highest ranking Nordic country. The overall strength of the Nordic region lies in the Workforce and Employment pillar, with Finland, Norway and Sweden occupying three of the top six ranks in this pillar, while Denmark drops out of the top 10, to 12th position in this pillar and down to 11th position for the Enabling Environment pillar.
Singapore (3) is the only Asian country in the top 10 due to very strong scores on the Education pillar, Workforce and Employment pillar and a strong fifth position on the Enabling Environment pillar. The Netherlands (4) is the third of the European countries in the top 10 due to strong performances for Health and Wellness and for Enabling Environment. Germany (6) edges ahead of the Nether-lands on the Enabling Environment rankings in third place but holds ninth position on the Workforce and Employ-ment pillar. Germany’s relatively low place on the Education pillar (19) pulls down the country’s overall score in the HCI.
The United Kingdom (8) performs well on Enabling Environment but has lower scores on Health and Wellness, holding 17th position. Canada (10) is the first of two North American countries in the HCI and the only one in the top 10. Its overall scores are greatly enhanced by its second position on the Education pillar, while ranks for the remaining three pillars vary between 15th and 20th position.
By National Income Group
While there is a strong correlation between national income and human capital across the 122 countries, there are also variations within each income category and unique experiences that can serve as examples within income groups.
Among the lowest-income countries – those with around US$ 1,000 per capita GNI – countries like Kenya and the Kyrgyz Republic perform far ahead of countries such as Malawi or Burkina Faso. Among lower-middle-income countries – those with US$ 1,000–4,000 per capita income – Nigeria, Pakistan and Egypt rank low, while others such as Sri Lanka, Ukraine and Indonesia rank much higher. Among upper-middle-income countries – those with US$ 4,000–12,000 per capita income – countries such as Malaysia, Costa Rica and China outstrip South Africa, Venezuela and Algeria.
Among the high-income countries – those with US$ 12,000 and above – the variations are the greatest. There are strong performers such as the Nordics and Singapore. There are countries such as Qatar and UAE that are hubs for skilled and unskilled talent and rank in the upper half of this group, while countries like Russia, Greece and Kuwait fall near the bottom.
By Regions
There are also variations within each region.
In Europe, a clear geographical division has emerged in terms of countries’ ability to exploit their human capital endowments, with those in southern and eastern Europe faring poorly compared with their neighbours to the north and west. Among these, Spain ranks 29, recording high marks in the Health and Wellness pillar (12) but doing less well in terms of Workforce and Employment (70). Nevertheless, it comes ahead of Italy (37), Greece (55) and Serbia (85). France ranks 21, with strong Health and Wellness (14) rankings followed by lower performance in Education (22), Workforce and Employment (24) and Enabling Environment (25).
In North America, Canada ranks ahead of the United States primarily on account of its excellent rating for Education, where it comes second in the world. The United States’ position (16) is earned by its dynamic workforce and capacity to attract talent, as well as its innovation potential and high levels of university-level education. Weaker factors include relatively high levels of noncommunicable
diseases (NCDs) during prime working ages and comparatively low levels of mental well-being.
In Asia, while Japan’s performance is strong across Health and Wellness, its relative weak spots include gender gap indicators for education and the workforce, the country’s ability to attract talent and reported depression in the Well-being sub-pillar. After Singapore and Japan, Asia’s highest ranking countries are Malaysia (22) and Korea (23). China’s (43) positions across the four pillars vary greatly from the 26th rank on the Workforce and Employment pillar to 65th on the Health and Wellness pillar, the latter due in part to weak scores across the Health and Services sub–pillars. China’s overall scores are boosted by good performance on the Talent sub–pillar of indicators, such as the Attraction and Retention of talent. The country’s highest scores are from the Labour force participation of the 15–64 age group and Pay relating to productivity measures indicators. India, at 78, scores well for Workforce and Employment (49) but poorly for Health and Wellness (112).
In the Middle East and North Africa, Qatar, the strongest performer at 18, ranks 26 on Education, 7 on Workforce and Employment and 15 on Enabling Environment. However, it fares less well on Health and Wellness (44), due to high levels of NCDs, obesity and years spent in poor health. UAE (24), Israel (25), Saudi Arabia (39) and Bahrain (40) are next. Tunisia (67), Lebanon (74), Morocco (82) and Egypt (111) occupy some of the lowest positions in the rankings. Yemen is in last place.
In Latin America, Costa Rica (35) and Chile (36) are the leaders, while Barbados (26) leads in the Caribbean. Brazil (57) is held back by a relatively weak performance in Education (88). The highest-placed Sub-Saharan African country is Mauritius (47), followed by Botswana (79) and Kenya (81). Nigeria, the most populous nation on the continent, ranks 114, while South Africa, the region’s largest economy is in 86th place. Mali (118), Burkina Faso (119) and Guinea (120) occupy the lowest positions in the region.
Among the BRICS economies, China (43) is the highest, followed by Russia (51), Brazil (57), India (78) and South Africa (86).
Education and Skills 2.0: New Targets and Innovative Approaches96
Trends and ChallengesThe HCI reveals several trends and challenges in the current education, skills and jobs agenda. These developments imply that we need to rethink how the world’s human capital endowment is invested in and leveraged for social and economic prosperity and stability. Like all global challenges where our existing systems, structures and formal institutions no longer suffice, the world needs a new level of global cooperation on education, skills and jobs.
Many of today’s education systems are disconnected from the skills needed to function in today’s labour markets and the exponential rate of technological and economic change is further increasing the gap between education and labour markets. The premise of current education systems is on developing cognitive skills, yet behavioural and noncognitive skills that nurture an individual’s capacity to collaborate, innovate, self-direct and problem-solve are increasingly important.
Current education systems are time-compressed in a way that may not be suited to current or future labour markets. They force narrow career and expertise decisions in early youth. The lines between academia and the labour market may need to blur or disappear entirely as learning, R&D, knowledge-sharing, retraining and innovation take place simultaneously throughout the work life cycle, regardless of the job, level or industry.
Education delivery mechanisms and financial aspects have gone through little change over the last decades. In many countries, many youth and children may find their paths constrained depending on the type of education they are able to afford, while others may not have access to even basic literacy and learning. On the other hand, many developed world education systems have made enormous increases in spending with little return. Early childhood education and teacher quality remain neglected areas in many developed and developing countries, despite their proven impact on learning outcomes; both areas also suffer from lack of objective, global data.
Many large businesses, as one of the key consumers of human capital, face a skills mismatch between the jobs they need to fill and the people searching for jobs, a gap evident in many countries for which this data was available. This mismatch is partly because education type and institutional affiliation in education or employment are still among the few, imperfect first signals for employers to identify the “skills” of potential candidates. It is also because what people learn in educational institutions today is not neces-sarily applicable to the demands of the current labour market. Businesses increasingly place a premium on creativity, interaction and collaboration skills, yet the business community does not engage in directly influencing the formation of human capital as it does with other supply chains.
The developments on both the supply and demand side of labour are occurring in an era where technology, mobility and migration mean that both jobs and people can move across national boundaries, relatively quickly. The ability to attract talent can entail prosperity and efficiency in some cases and social stresses in others. Moreover, many countries experience a loss of talent or brain drain.
As the recent economic crisis has revealed, an economic slowdown can have a severe and longlasting impact on employment for people across the experience spectrum – from today’s older breadwinners to an entire generation of new entrants to the labour market. Some countries are under the double burden of both the economic crisis as well as the past failures of the education system and the skills it imparted.
Rapid demographic changes and the ability to forecast them offer a valuable opportunity for planning, while creating unprecedented pressures in markets and societies. Ageing economies will face a historical first as more and more of their populations cross the age of 60 and their workforces shrink further, necessitating a better integration of female workers, potentially importing talent and better aligning the state pension age with lifespans. Youth-bulge economies face burdens of a different kind as a very large cohort of the next generation – one that is more connected and globalized than ever before enters the workforce and with very different aspirations, expectations and worldviews than their predecessors.
A Holistic Approach to Measuring Human CapitalThe HCI is a diagnostic tool that takes a life cycle approach to provide a deep understanding of the state of a population’s talent, skills and capabilities. It may be customized to specific countries and regions. The HCI is a first attempt at measuring human capital holistically and across a large set of countries and we plan to continue to improve methodology in future years.
The HCI aims to bring multiple stakeholders to the same level of understanding on the current state of human capital and demographic trends. We hope that it can help governments, business, universities and civil society institutions identify key areas for focus and investment. All of these entities have a stake in human capital development, whether their primary goal is to power their businesses, strengthen their communities or create a population that is better able to contribute to and share in the rewards of growth and prosperity. We thus hope that the HCI can inspire cross-stakeholder collaboration and partnerships.
Endnotes1. http://reports.weforum.org/human-capital-index-2013.

97Education and Skills 2.0: New Targets and Innovative Approaches
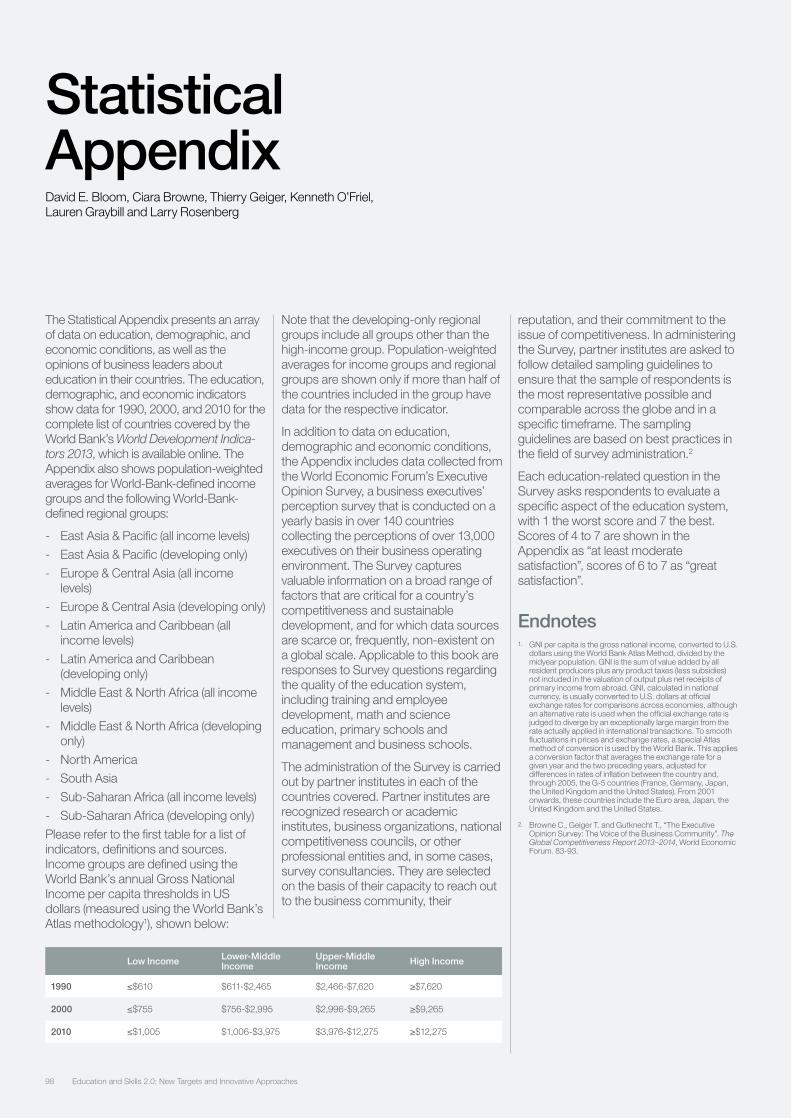
Education and Skills 2.0: New Targets and Innovative Approaches98
The Statistical Appendix presents an array of data on education, demographic, and economic conditions, as well as the opinions of business leaders about education in their countries. The education, demographic, and economic indicators show data for 1990, 2000, and 2010 for the complete list of countries covered by the World Bank’s World Development Indica-tors 2013, which is available online. The Appendix also shows population-weighted averages for World-Bank-defined income groups and the following World-Bank-defined regional groups:
- East Asia & Pacific (all income levels)
- East Asia & Pacific (developing only)
- Europe & Central Asia (all income levels)
- Europe & Central Asia (developing only)
- Latin America and Caribbean (all income levels)
- Latin America and Caribbean (developing only)
- Middle East & North Africa (all income levels)
- Middle East & North Africa (developing only)
- North America
- South Asia
- Sub-Saharan Africa (all income levels)
- Sub-Saharan Africa (developing only)
Please refer to the first table for a list of indicators, definitions and sources. Income groups are defined using the World Bank’s annual Gross National Income per capita thresholds in US dollars (measured using the World Bank’s Atlas methodology1), shown below:
Note that the developing-only regional groups include all groups other than the high-income group. Population-weighted averages for income groups and regional groups are shown only if more than half of the countries included in the group have data for the respective indicator.
In addition to data on education, demographic and economic conditions, the Appendix includes data collected from the World Economic Forum’s Executive Opinion Survey, a business executives’ perception survey that is conducted on a yearly basis in over 140 countries collecting the perceptions of over 13,000 executives on their business operating environment. The Survey captures valuable information on a broad range of factors that are critical for a country’s competitiveness and sustainable development, and for which data sources are scarce or, frequently, non-existent on a global scale. Applicable to this book are responses to Survey questions regarding the quality of the education system, including training and employee development, math and science education, primary schools and management and business schools.
The administration of the Survey is carried out by partner institutes in each of the countries covered. Partner institutes are recognized research or academic institutes, business organizations, national competitiveness councils, or other professional entities and, in some cases, survey consultancies. They are selected on the basis of their capacity to reach out to the business community, their
reputation, and their commitment to the issue of competitiveness. In administering the Survey, partner institutes are asked to follow detailed sampling guidelines to ensure that the sample of respondents is the most representative possible and comparable across the globe and in a specific timeframe. The sampling guidelines are based on best practices in the field of survey administration.2
Each education-related question in the Survey asks respondents to evaluate a specific aspect of the education system, with 1 the worst score and 7 the best. Scores of 4 to 7 are shown in the Appendix as “at least moderate satisfaction”, scores of 6 to 7 as “great satisfaction”.
Endnotes1. GNI per capita is the gross national income, converted to U.S.
dollars using the World Bank Atlas Method, divided by the midyear population. GNI is the sum of value added by all resident producers plus any product taxes (less subsidies) not included in the valuation of output plus net receipts of primary income from abroad. GNI, calculated in national currency, is usually converted to U.S. dollars at official exchange rates for comparisons across economies, although an alternative rate is used when the official exchange rate is judged to diverge by an exceptionally large margin from the rate actually applied in international transactions. To smooth fluctuations in prices and exchange rates, a special Atlas method of conversion is used by the World Bank. This applies a conversion factor that averages the exchange rate for a given year and the two preceding years, adjusted for differences in rates of inflation between the country and, through 2005, the G-5 countries (France, Germany, Japan, the United Kingdom and the United States). From 2001 onwards, these countries include the Euro area, Japan, the United Kingdom and the United States.
2. Browne C., Geiger T. and Gutknecht T., “The Executive Opinion Survey: The Voice of the Business Community”. The Global Competitiveness Report 2013–2014, World Economic Forum. 83-93.
Statistical Appendix David E. Bloom, Ciara Browne, Thierry Geiger, Kenneth O’Friel, Lauren Graybill and Larry Rosenberg
Low Income Lower-Middle Income
Upper-Middle Income High Income
1990 ≤$610 $611-$2,465 $2,466-$7,620 ≥$7,620
2000 ≤$755 $756-$2,995 $2,996-$9,265 ≥$9,265
2010 ≤$1,005 $1,006-$3,975 $3,976-$12,275 ≥$12,275
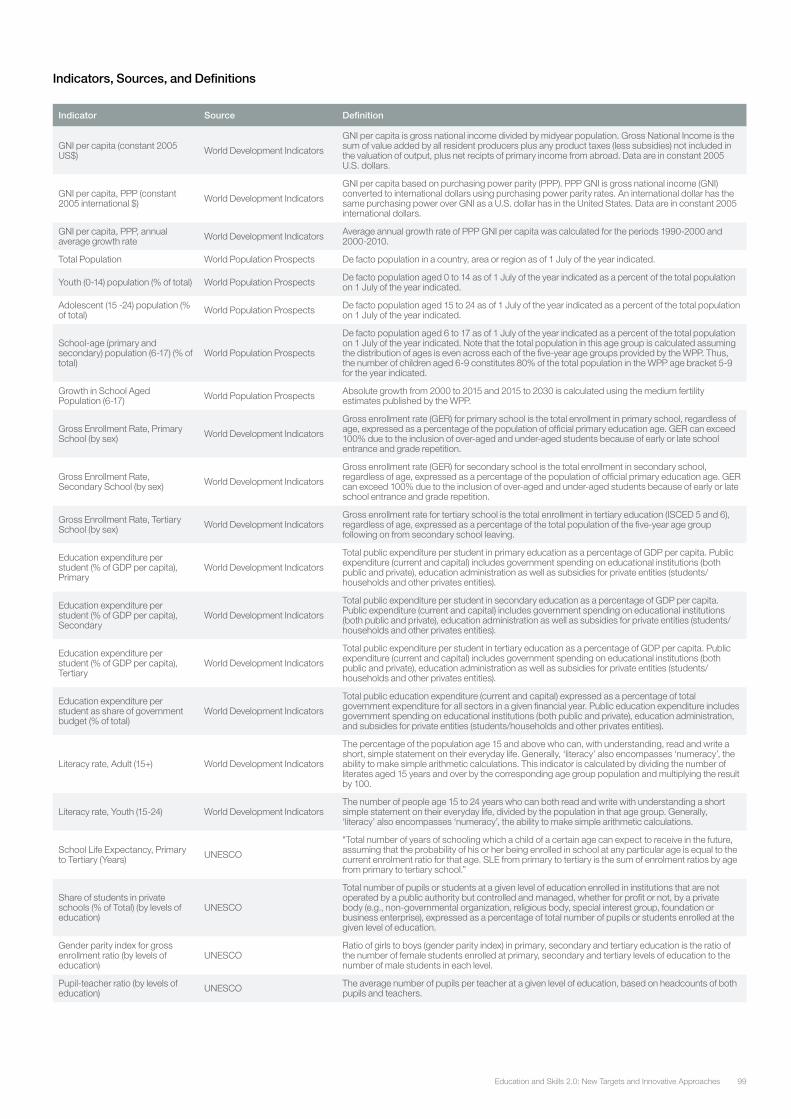
99Education and Skills 2.0: New Targets and Innovative Approaches
Indicator Source Definition
GNI per capita (constant 2005 US$) World Development Indicators
GNI per capita is gross national income divided by midyear population. Gross National Income is the sum of value added by all resident producers plus any product taxes (less subsidies) not included in the valuation of output, plus net recipts of primary income from abroad. Data are in constant 2005 U.S. dollars.
GNI per capita, PPP (constant 2005 international $) World Development Indicators
GNI per capita based on purchasing power parity (PPP). PPP GNI is gross national income (GNI) converted to international dollars using purchasing power parity rates. An international dollar has the same purchasing power over GNI as a U.S. dollar has in the United States. Data are in constant 2005 international dollars.
GNI per capita, PPP, annual average growth rate World Development Indicators Average annual growth rate of PPP GNI per capita was calculated for the periods 1990-2000 and
2000-2010.
Total Population World Population Prospects De facto population in a country, area or region as of 1 July of the year indicated.
Youth (0-14) population (% of total) World Population Prospects De facto population aged 0 to 14 as of 1 July of the year indicated as a percent of the total population on 1 July of the year indicated.
Adolescent (15 -24) population (% of total) World Population Prospects De facto population aged 15 to 24 as of 1 July of the year indicated as a percent of the total population
on 1 July of the year indicated.
School-age (primary and secondary) population (6-17) (% of total)
World Population Prospects
De facto population aged 6 to 17 as of 1 July of the year indicated as a percent of the total population on 1 July of the year indicated. Note that the total population in this age group is calculated assuming the distribution of ages is even across each of the five-year age groups provided by the WPP. Thus, the number of children aged 6-9 constitutes 80% of the total population in the WPP age bracket 5-9 for the year indicated.
Growth in School Aged Population (6-17) World Population Prospects Absolute growth from 2000 to 2015 and 2015 to 2030 is calculated using the medium fertility
estimates published by the WPP.
Gross Enrollment Rate, Primary School (by sex) World Development Indicators
Gross enrollment rate (GER) for primary school is the total enrollment in primary school, regardless of age, expressed as a percentage of the population of official primary education age. GER can exceed 100% due to the inclusion of over-aged and under-aged students because of early or late school entrance and grade repetition.
Gross Enrollment Rate, Secondary School (by sex) World Development Indicators
Gross enrollment rate (GER) for secondary school is the total enrollment in secondary school, regardless of age, expressed as a percentage of the population of official primary education age. GER can exceed 100% due to the inclusion of over-aged and under-aged students because of early or late school entrance and grade repetition.
Gross Enrollment Rate, Tertiary School (by sex) World Development Indicators
Gross enrollment rate for tertiary school is the total enrollment in tertiary education (ISCED 5 and 6), regardless of age, expressed as a percentage of the total population of the five-year age group following on from secondary school leaving.
Education expenditure per student (% of GDP per capita), Primary
World Development Indicators
Total public expenditure per student in primary education as a percentage of GDP per capita. Public expenditure (current and capital) includes government spending on educational institutions (both public and private), education administration as well as subsidies for private entities (students/households and other privates entities).
Education expenditure per student (% of GDP per capita), Secondary
World Development Indicators
Total public expenditure per student in secondary education as a percentage of GDP per capita. Public expenditure (current and capital) includes government spending on educational institutions (both public and private), education administration as well as subsidies for private entities (students/households and other privates entities).
Education expenditure per student (% of GDP per capita), Tertiary
World Development Indicators
Total public expenditure per student in tertiary education as a percentage of GDP per capita. Public expenditure (current and capital) includes government spending on educational institutions (both public and private), education administration as well as subsidies for private entities (students/households and other privates entities).
Education expenditure per student as share of government budget (% of total)
World Development Indicators
Total public education expenditure (current and capital) expressed as a percentage of total government expenditure for all sectors in a given financial year. Public education expenditure includes government spending on educational institutions (both public and private), education administration, and subsidies for private entities (students/households and other privates entities).
Literacy rate, Adult (15+) World Development Indicators
The percentage of the population age 15 and above who can, with understanding, read and write a short, simple statement on their everyday life. Generally, ‘literacy’ also encompasses ‘numeracy’, the ability to make simple arithmetic calculations. This indicator is calculated by dividing the number of literates aged 15 years and over by the corresponding age group population and multiplying the result by 100.
Literacy rate, Youth (15-24) World Development IndicatorsThe number of people age 15 to 24 years who can both read and write with understanding a short simple statement on their everyday life, divided by the population in that age group. Generally, ‘literacy’ also encompasses ‘numeracy’, the ability to make simple arithmetic calculations.
School Life Expectancy, Primary to Tertiary (Years) UNESCO
"Total number of years of schooling which a child of a certain age can expect to receive in the future, assuming that the probability of his or her being enrolled in school at any particular age is equal to the current enrolment ratio for that age. SLE from primary to tertiary is the sum of enrolment ratios by age from primary to tertiary school.”
Share of students in private schools (% of Total) (by levels of education)
UNESCO
Total number of pupils or students at a given level of education enrolled in institutions that are not operated by a public authority but controlled and managed, whether for profit or not, by a private body (e.g., non-governmental organization, religious body, special interest group, foundation or business enterprise), expressed as a percentage of total number of pupils or students enrolled at the given level of education.
Gender parity index for gross enrollment ratio (by levels of education)
UNESCORatio of girls to boys (gender parity index) in primary, secondary and tertiary education is the ratio of the number of female students enrolled at primary, secondary and tertiary levels of education to the number of male students in each level.
Pupil-teacher ratio (by levels of education) UNESCO The average number of pupils per teacher at a given level of education, based on headcounts of both
pupils and teachers.
Indicators, Sources, and Definitions
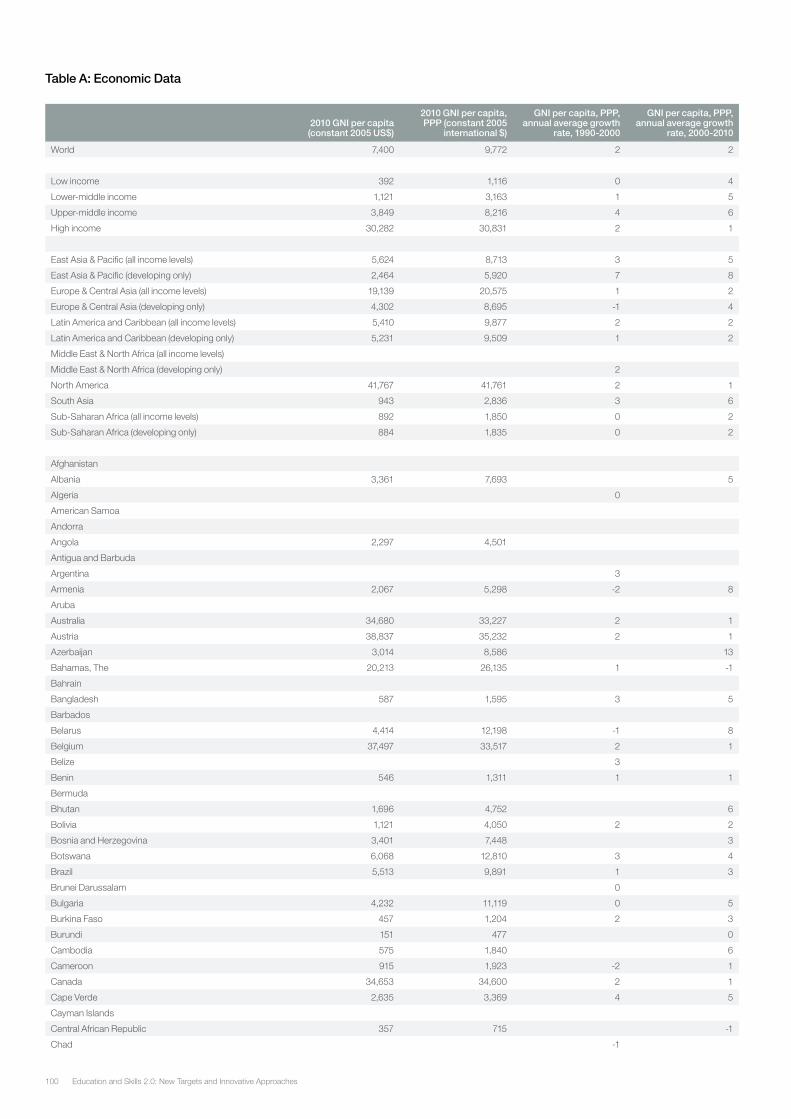
Education and Skills 2.0: New Targets and Innovative Approaches100
2010 GNI per capita (constant 2005 US$)
2010 GNI per capita, PPP (constant 2005
international $)
GNI per capita, PPP, annual average growth
rate, 1990-2000
GNI per capita, PPP, annual average growth
rate, 2000-2010
World 7,400 9,772 2 2
Low income 392 1,116 0 4
Lower-middle income 1,121 3,163 1 5
Upper-middle income 3,849 8,216 4 6
High income 30,282 30,831 2 1
East Asia & Pacific (all income levels) 5,624 8,713 3 5
East Asia & Pacific (developing only) 2,464 5,920 7 8
Europe & Central Asia (all income levels) 19,139 20,575 1 2
Europe & Central Asia (developing only) 4,302 8,695 -1 4
Latin America and Caribbean (all income levels) 5,410 9,877 2 2
Latin America and Caribbean (developing only) 5,231 9,509 1 2
Middle East & North Africa (all income levels)
Middle East & North Africa (developing only) 2
North America 41,767 41,761 2 1
South Asia 943 2,836 3 6
Sub-Saharan Africa (all income levels) 892 1,850 0 2
Sub-Saharan Africa (developing only) 884 1,835 0 2
Afghanistan
Albania 3,361 7,693 5
Algeria 0
American Samoa
Andorra
Angola 2,297 4,501
Antigua and Barbuda
Argentina 3
Armenia 2,067 5,298 -2 8
Aruba
Australia 34,680 33,227 2 1
Austria 38,837 35,232 2 1
Azerbaijan 3,014 8,586 13
Bahamas, The 20,213 26,135 1 -1
Bahrain
Bangladesh 587 1,595 3 5
Barbados
Belarus 4,414 12,198 -1 8
Belgium 37,497 33,517 2 1
Belize 3
Benin 546 1,311 1 1
Bermuda
Bhutan 1,696 4,752 6
Bolivia 1,121 4,050 2 2
Bosnia and Herzegovina 3,401 7,448 3
Botswana 6,068 12,810 3 4
Brazil 5,513 9,891 1 3
Brunei Darussalam 0
Bulgaria 4,232 11,119 0 5
Burkina Faso 457 1,204 2 3
Burundi 151 477 0
Cambodia 575 1,840 6
Cameroon 915 1,923 -2 1
Canada 34,653 34,600 2 1
Cape Verde 2,635 3,369 4 5
Cayman Islands
Central African Republic 357 715 -1
Chad -1
Table A: Economic Data
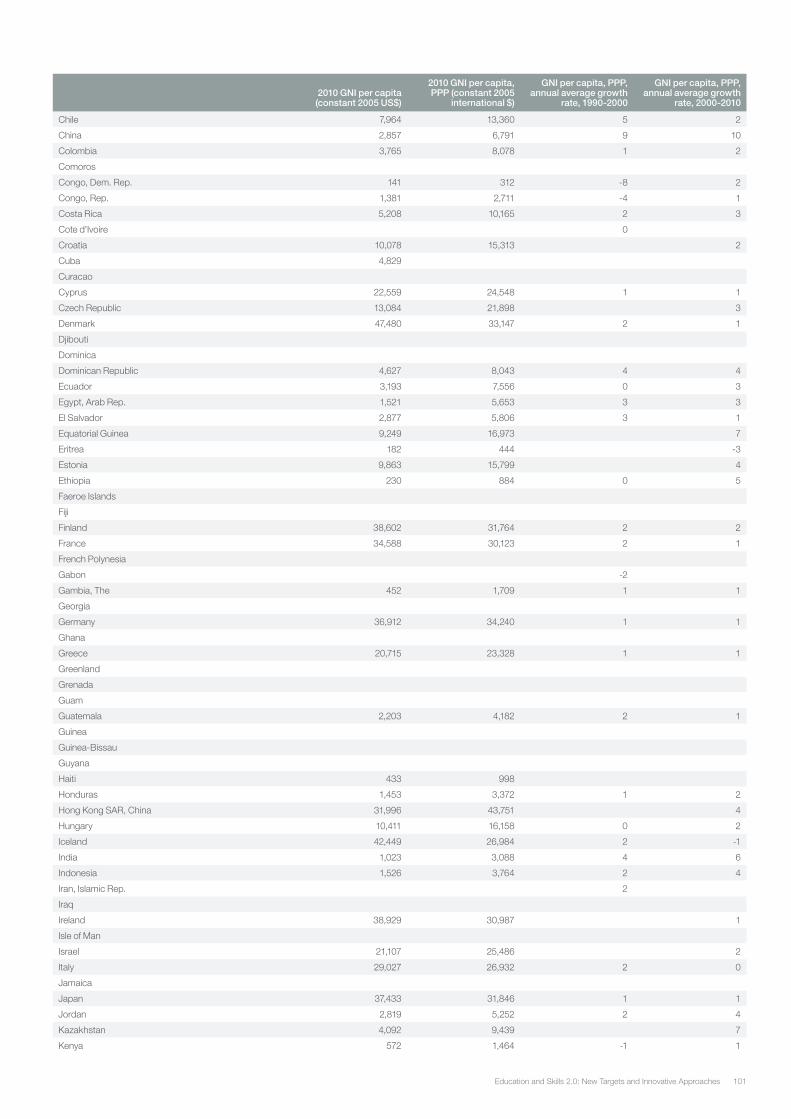
101Education and Skills 2.0: New Targets and Innovative Approaches
2010 GNI per capita (constant 2005 US$)
2010 GNI per capita, PPP (constant 2005
international $)
GNI per capita, PPP, annual average growth
rate, 1990-2000
GNI per capita, PPP, annual average growth
rate, 2000-2010
Chile 7,964 13,360 5 2
China 2,857 6,791 9 10
Colombia 3,765 8,078 1 2
Comoros
Congo, Dem. Rep. 141 312 -8 2
Congo, Rep. 1,381 2,711 -4 1
Costa Rica 5,208 10,165 2 3
Cote d'Ivoire 0
Croatia 10,078 15,313 2
Cuba 4,829
Curacao
Cyprus 22,559 24,548 1 1
Czech Republic 13,084 21,898 3
Denmark 47,480 33,147 2 1
Djibouti
Dominica
Dominican Republic 4,627 8,043 4 4
Ecuador 3,193 7,556 0 3
Egypt, Arab Rep. 1,521 5,653 3 3
El Salvador 2,877 5,806 3 1
Equatorial Guinea 9,249 16,973 7
Eritrea 182 444 -3
Estonia 9,863 15,799 4
Ethiopia 230 884 0 5
Faeroe Islands
Fiji
Finland 38,602 31,764 2 2
France 34,588 30,123 2 1
French Polynesia
Gabon -2
Gambia, The 452 1,709 1 1
Georgia
Germany 36,912 34,240 1 1
Ghana
Greece 20,715 23,328 1 1
Greenland
Grenada
Guam
Guatemala 2,203 4,182 2 1
Guinea
Guinea-Bissau
Guyana
Haiti 433 998
Honduras 1,453 3,372 1 2
Hong Kong SAR, China 31,996 43,751 4
Hungary 10,411 16,158 0 2
Iceland 42,449 26,984 2 -1
India 1,023 3,088 4 6
Indonesia 1,526 3,764 2 4
Iran, Islamic Rep. 2
Iraq
Ireland 38,929 30,987 1
Isle of Man
Israel 21,107 25,486 2
Italy 29,027 26,932 2 0
Jamaica
Japan 37,433 31,846 1 1
Jordan 2,819 5,252 2 4
Kazakhstan 4,092 9,439 7
Kenya 572 1,464 -1 1
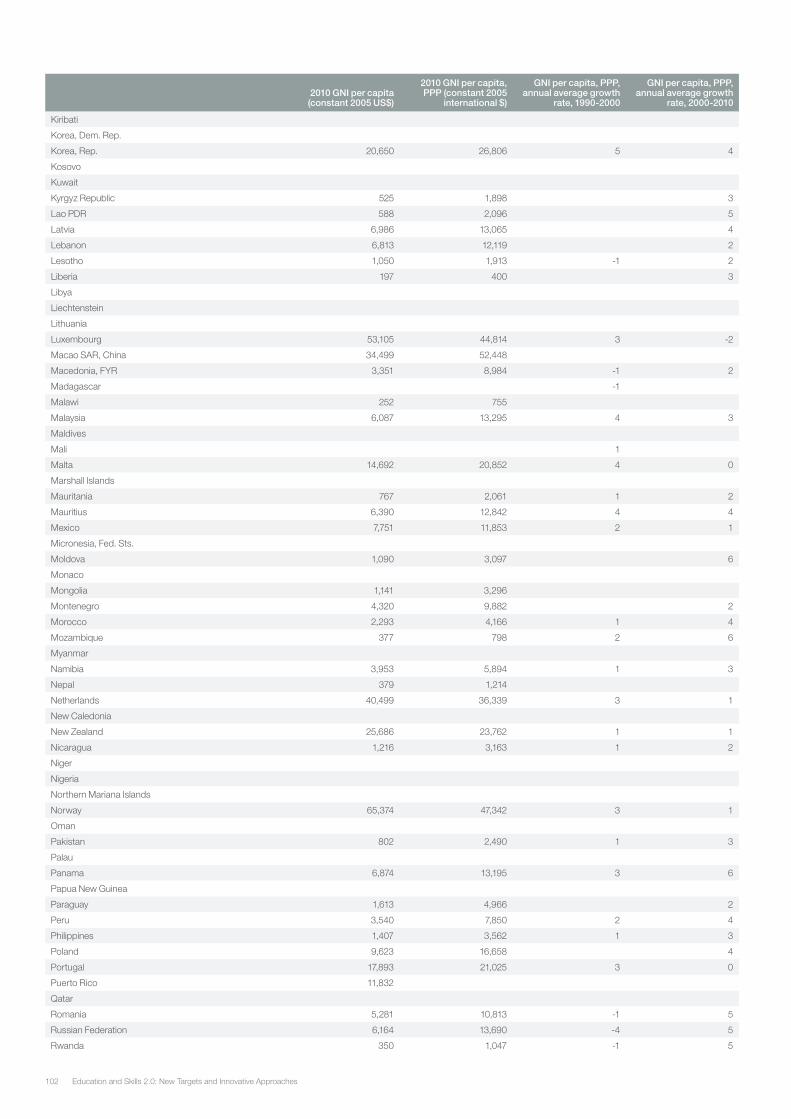
Education and Skills 2.0: New Targets and Innovative Approaches102
2010 GNI per capita (constant 2005 US$)
2010 GNI per capita, PPP (constant 2005
international $)
GNI per capita, PPP, annual average growth
rate, 1990-2000
GNI per capita, PPP, annual average growth
rate, 2000-2010
Kiribati
Korea, Dem. Rep.
Korea, Rep. 20,650 26,806 5 4
Kosovo
Kuwait
Kyrgyz Republic 525 1,898 3
Lao PDR 588 2,096 5
Latvia 6,986 13,065 4
Lebanon 6,813 12,119 2
Lesotho 1,050 1,913 -1 2
Liberia 197 400 3
Libya
Liechtenstein
Lithuania
Luxembourg 53,105 44,814 3 -2
Macao SAR, China 34,499 52,448
Macedonia, FYR 3,351 8,984 -1 2
Madagascar -1
Malawi 252 755
Malaysia 6,087 13,295 4 3
Maldives
Mali 1
Malta 14,692 20,852 4 0
Marshall Islands
Mauritania 767 2,061 1 2
Mauritius 6,390 12,842 4 4
Mexico 7,751 11,853 2 1
Micronesia, Fed. Sts.
Moldova 1,090 3,097 6
Monaco
Mongolia 1,141 3,296
Montenegro 4,320 9,882 2
Morocco 2,293 4,166 1 4
Mozambique 377 798 2 6
Myanmar
Namibia 3,953 5,894 1 3
Nepal 379 1,214
Netherlands 40,499 36,339 3 1
New Caledonia
New Zealand 25,686 23,762 1 1
Nicaragua 1,216 3,163 1 2
Niger
Nigeria
Northern Mariana Islands
Norway 65,374 47,342 3 1
Oman
Pakistan 802 2,490 1 3
Palau
Panama 6,874 13,195 3 6
Papua New Guinea
Paraguay 1,613 4,966 2
Peru 3,540 7,850 2 4
Philippines 1,407 3,562 1 3
Poland 9,623 16,658 4
Portugal 17,893 21,025 3 0
Puerto Rico 11,832
Qatar
Romania 5,281 10,813 -1 5
Russian Federation 6,164 13,690 -4 5
Rwanda 350 1,047 -1 5
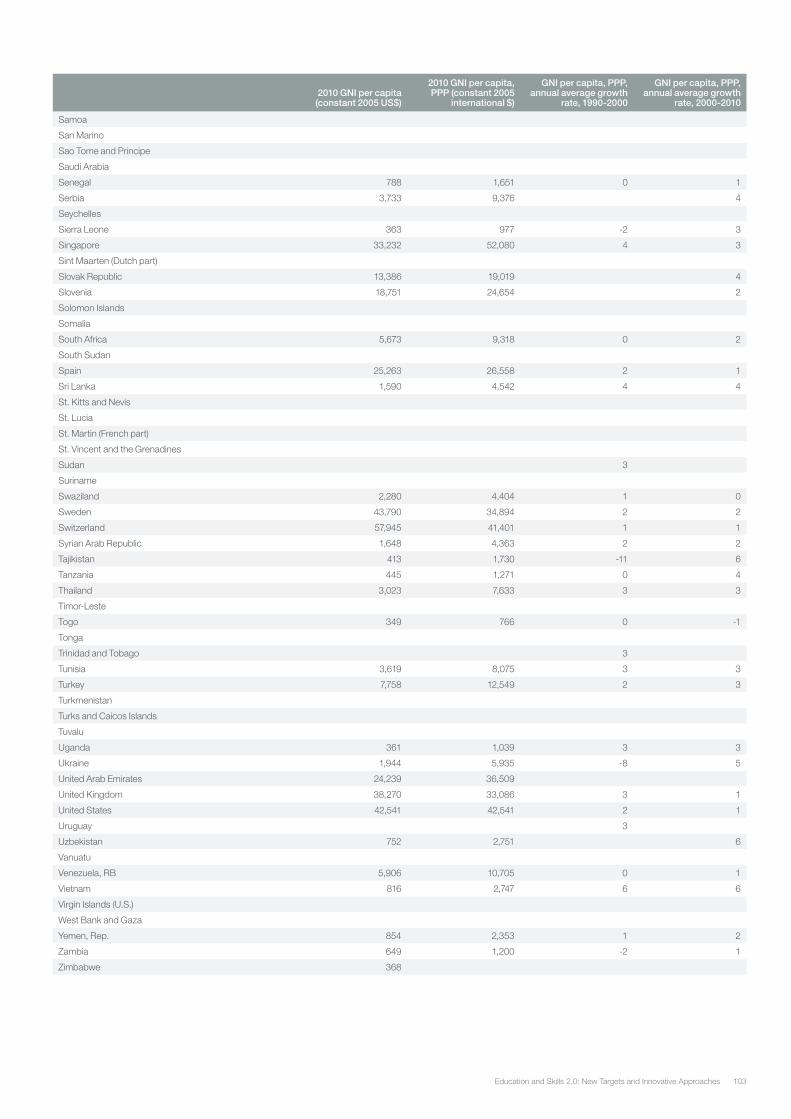
103Education and Skills 2.0: New Targets and Innovative Approaches
2010 GNI per capita (constant 2005 US$)
2010 GNI per capita, PPP (constant 2005
international $)
GNI per capita, PPP, annual average growth
rate, 1990-2000
GNI per capita, PPP, annual average growth
rate, 2000-2010
Samoa
San Marino
Sao Tome and Principe
Saudi Arabia
Senegal 788 1,651 0 1
Serbia 3,733 9,376 4
Seychelles
Sierra Leone 363 977 -2 3
Singapore 33,232 52,080 4 3
Sint Maarten (Dutch part)
Slovak Republic 13,386 19,019 4
Slovenia 18,751 24,654 2
Solomon Islands
Somalia
South Africa 5,673 9,318 0 2
South Sudan
Spain 25,263 26,558 2 1
Sri Lanka 1,590 4,542 4 4
St. Kitts and Nevis
St. Lucia
St. Martin (French part)
St. Vincent and the Grenadines
Sudan 3
Suriname
Swaziland 2,280 4,404 1 0
Sweden 43,790 34,894 2 2
Switzerland 57,945 41,401 1 1
Syrian Arab Republic 1,648 4,363 2 2
Tajikistan 413 1,730 -11 6
Tanzania 445 1,271 0 4
Thailand 3,023 7,633 3 3
Timor-Leste
Togo 349 766 0 -1
Tonga
Trinidad and Tobago 3
Tunisia 3,619 8,075 3 3
Turkey 7,758 12,549 2 3
Turkmenistan
Turks and Caicos Islands
Tuvalu
Uganda 361 1,039 3 3
Ukraine 1,944 5,935 -8 5
United Arab Emirates 24,239 36,509
United Kingdom 38,270 33,086 3 1
United States 42,541 42,541 2 1
Uruguay 3
Uzbekistan 752 2,751 6
Vanuatu
Venezuela, RB 5,906 10,705 0 1
Vietnam 816 2,747 6 6
Virgin Islands (U.S.)
West Bank and Gaza
Yemen, Rep. 854 2,353 1 2
Zambia 649 1,200 -2 1
Zimbabwe 368
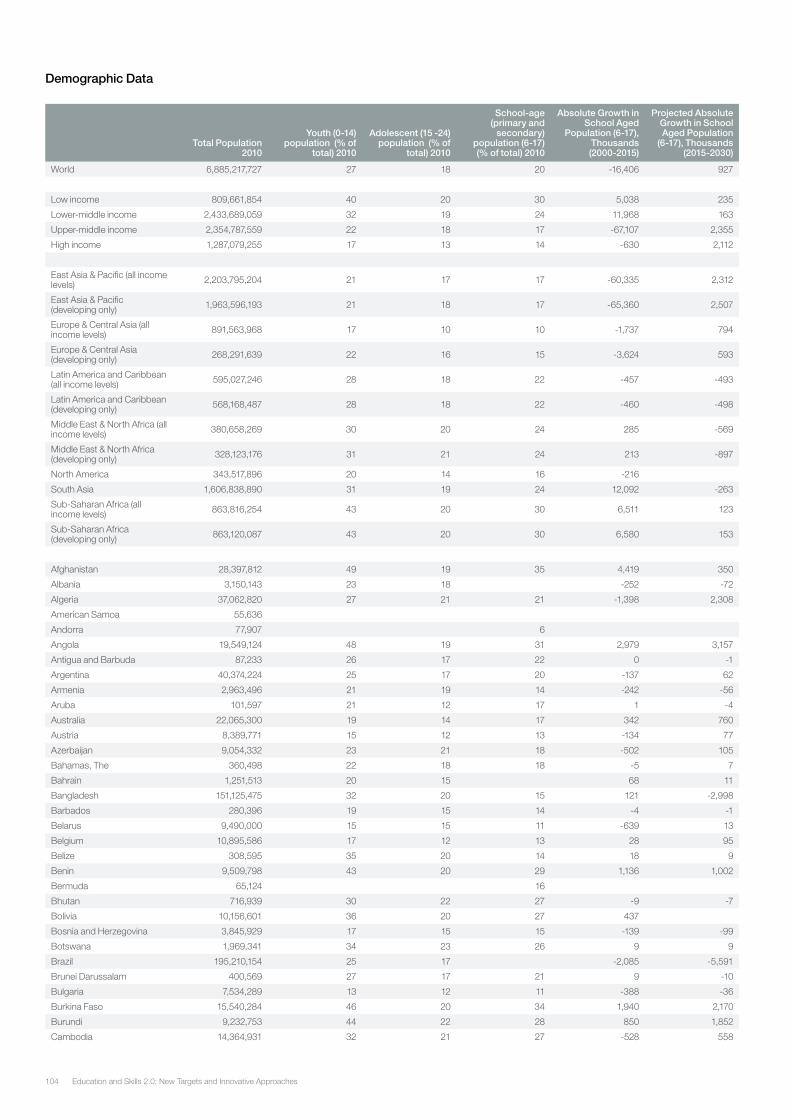
Education and Skills 2.0: New Targets and Innovative Approaches104
Demographic Data
Total Population 2010
Youth (0-14) population (% of
total) 2010
Adolescent (15 -24) population (% of
total) 2010
School-age (primary and
secondary) population (6-17)(% of total) 2010
Absolute Growth in School Aged
Population (6-17), Thousands (2000-2015)
Projected Absolute Growth in School Aged Population
(6-17), Thousands (2015-2030)
World 6,885,217,727 27 18 20 -16,406 927
Low income 809,661,854 40 20 30 5,038 235
Lower-middle income 2,433,689,059 32 19 24 11,968 163
Upper-middle income 2,354,787,559 22 18 17 -67,107 2,355
High income 1,287,079,255 17 13 14 -630 2,112
East Asia & Pacific (all income levels) 2,203,795,204 21 17 17 -60,335 2,312
East Asia & Pacific (developing only) 1,963,596,193 21 18 17 -65,360 2,507
Europe & Central Asia (all income levels) 891,563,968 17 10 10 -1,737 794
Europe & Central Asia (developing only) 268,291,639 22 16 15 -3,624 593
Latin America and Caribbean (all income levels) 595,027,246 28 18 22 -457 -493
Latin America and Caribbean (developing only) 568,168,487 28 18 22 -460 -498
Middle East & North Africa (all income levels) 380,658,269 30 20 24 285 -569
Middle East & North Africa (developing only) 328,123,176 31 21 24 213 -897
North America 343,517,896 20 14 16 -216
South Asia 1,606,838,890 31 19 24 12,092 -263
Sub-Saharan Africa (all income levels) 863,816,254 43 20 30 6,511 123
Sub-Saharan Africa (developing only) 863,120,087 43 20 30 6,580 153
Afghanistan 28,397,812 49 19 35 4,419 350
Albania 3,150,143 23 18 -252 -72
Algeria 37,062,820 27 21 21 -1,398 2,308
American Samoa 55,636
Andorra 77,907 6
Angola 19,549,124 48 19 31 2,979 3,157
Antigua and Barbuda 87,233 26 17 22 0 -1
Argentina 40,374,224 25 17 20 -137 62
Armenia 2,963,496 21 19 14 -242 -56
Aruba 101,597 21 12 17 1 -4
Australia 22,065,300 19 14 17 342 760
Austria 8,389,771 15 12 13 -134 77
Azerbaijan 9,054,332 23 21 18 -502 105
Bahamas, The 360,498 22 18 18 -5 7
Bahrain 1,251,513 20 15 68 11
Bangladesh 151,125,475 32 20 15 121 -2,998
Barbados 280,396 19 15 14 -4 -1
Belarus 9,490,000 15 15 11 -639 13
Belgium 10,895,586 17 12 13 28 95
Belize 308,595 35 20 14 18 9
Benin 9,509,798 43 20 29 1,136 1,002
Bermuda 65,124 16
Bhutan 716,939 30 22 27 -9 -7
Bolivia 10,156,601 36 20 27 437
Bosnia and Herzegovina 3,845,929 17 15 15 -139 -99
Botswana 1,969,341 34 23 26 9 9
Brazil 195,210,154 25 17 -2,085 -5,591
Brunei Darussalam 400,569 27 17 21 9 -10
Bulgaria 7,534,289 13 12 11 -388 -36
Burkina Faso 15,540,284 46 20 34 1,940 2,170
Burundi 9,232,753 44 22 28 850 1,852
Cambodia 14,364,931 32 21 27 -528 558
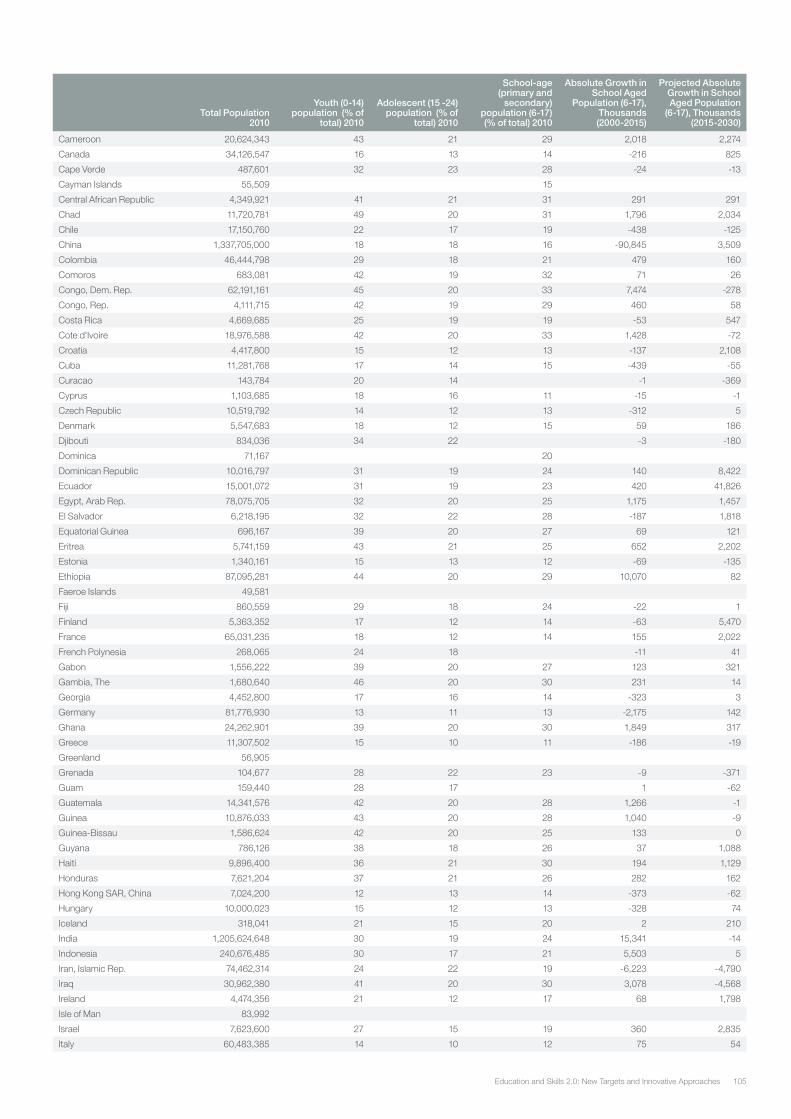
105Education and Skills 2.0: New Targets and Innovative Approaches
Total Population 2010
Youth (0-14) population (% of
total) 2010
Adolescent (15 -24) population (% of
total) 2010
School-age (primary and
secondary) population (6-17)(% of total) 2010
Absolute Growth in School Aged
Population (6-17), Thousands (2000-2015)
Projected Absolute Growth in School Aged Population
(6-17), Thousands (2015-2030)
Cameroon 20,624,343 43 21 29 2,018 2,274
Canada 34,126,547 16 13 14 -216 825
Cape Verde 487,601 32 23 28 -24 -13
Cayman Islands 55,509 15
Central African Republic 4,349,921 41 21 31 291 291
Chad 11,720,781 49 20 31 1,796 2,034
Chile 17,150,760 22 17 19 -438 -125
China 1,337,705,000 18 18 16 -90,845 3,509
Colombia 46,444,798 29 18 21 479 160
Comoros 683,081 42 19 32 71 26
Congo, Dem. Rep. 62,191,161 45 20 33 7,474 -278
Congo, Rep. 4,111,715 42 19 29 460 58
Costa Rica 4,669,685 25 19 19 -53 547
Cote d'Ivoire 18,976,588 42 20 33 1,428 -72
Croatia 4,417,800 15 12 13 -137 2,108
Cuba 11,281,768 17 14 15 -439 -55
Curacao 143,784 20 14 -1 -369
Cyprus 1,103,685 18 16 11 -15 -1
Czech Republic 10,519,792 14 12 13 -312 5
Denmark 5,547,683 18 12 15 59 186
Djibouti 834,036 34 22 -3 -180
Dominica 71,167 20
Dominican Republic 10,016,797 31 19 24 140 8,422
Ecuador 15,001,072 31 19 23 420 41,826
Egypt, Arab Rep. 78,075,705 32 20 25 1,175 1,457
El Salvador 6,218,195 32 22 28 -187 1,818
Equatorial Guinea 696,167 39 20 27 69 121
Eritrea 5,741,159 43 21 25 652 2,202
Estonia 1,340,161 15 13 12 -69 -135
Ethiopia 87,095,281 44 20 29 10,070 82
Faeroe Islands 49,581
Fiji 860,559 29 18 24 -22 1
Finland 5,363,352 17 12 14 -63 5,470
France 65,031,235 18 12 14 155 2,022
French Polynesia 268,065 24 18 -11 41
Gabon 1,556,222 39 20 27 123 321
Gambia, The 1,680,640 46 20 30 231 14
Georgia 4,452,800 17 16 14 -323 3
Germany 81,776,930 13 11 13 -2,175 142
Ghana 24,262,901 39 20 30 1,849 317
Greece 11,307,502 15 10 11 -186 -19
Greenland 56,905
Grenada 104,677 28 22 23 -9 -371
Guam 159,440 28 17 1 -62
Guatemala 14,341,576 42 20 28 1,266 -1
Guinea 10,876,033 43 20 28 1,040 -9
Guinea-Bissau 1,586,624 42 20 25 133 0
Guyana 786,126 38 18 26 37 1,088
Haiti 9,896,400 36 21 30 194 1,129
Honduras 7,621,204 37 21 26 282 162
Hong Kong SAR, China 7,024,200 12 13 14 -373 -62
Hungary 10,000,023 15 12 13 -328 74
Iceland 318,041 21 15 20 2 210
India 1,205,624,648 30 19 24 15,341 -14
Indonesia 240,676,485 30 17 21 5,503 5
Iran, Islamic Rep. 74,462,314 24 22 19 -6,223 -4,790
Iraq 30,962,380 41 20 30 3,078 -4,568
Ireland 4,474,356 21 12 17 68 1,798
Isle of Man 83,992
Israel 7,623,600 27 15 19 360 2,835
Italy 60,483,385 14 10 12 75 54
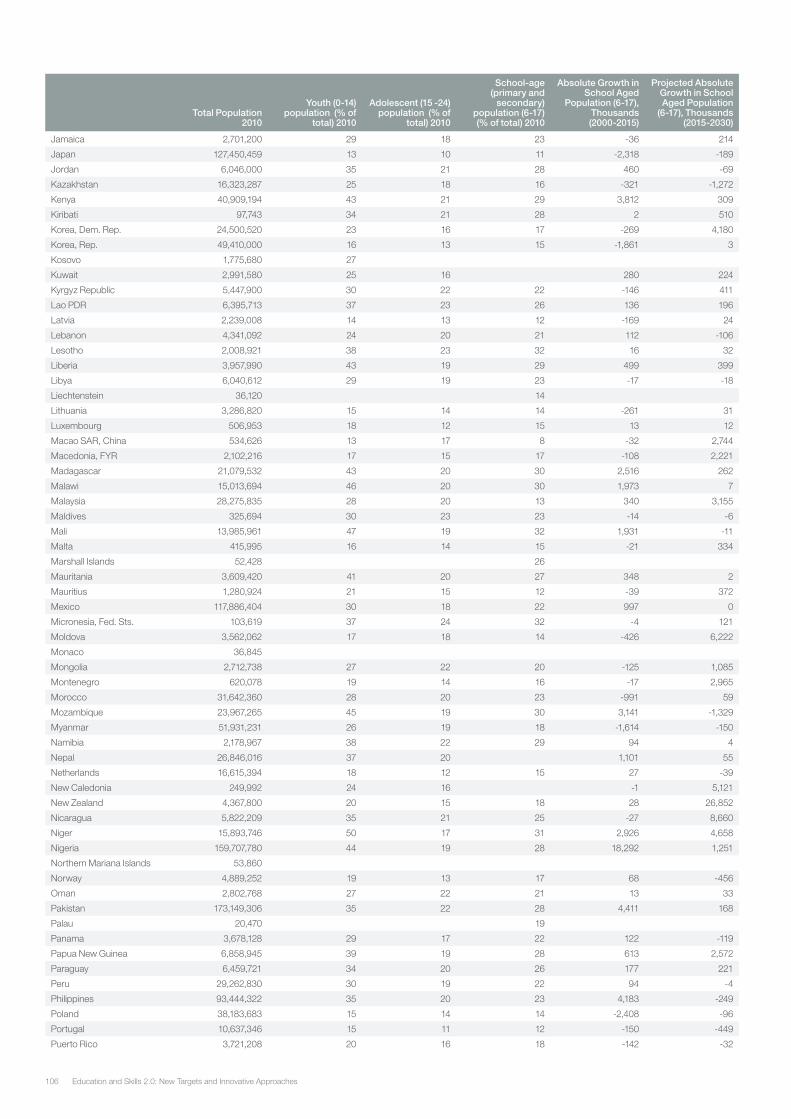
Education and Skills 2.0: New Targets and Innovative Approaches106
Total Population 2010
Youth (0-14) population (% of
total) 2010
Adolescent (15 -24) population (% of
total) 2010
School-age (primary and
secondary) population (6-17)(% of total) 2010
Absolute Growth in School Aged
Population (6-17), Thousands (2000-2015)
Projected Absolute Growth in School Aged Population
(6-17), Thousands (2015-2030)
Jamaica 2,701,200 29 18 23 -36 214
Japan 127,450,459 13 10 11 -2,318 -189
Jordan 6,046,000 35 21 28 460 -69
Kazakhstan 16,323,287 25 18 16 -321 -1,272
Kenya 40,909,194 43 21 29 3,812 309
Kiribati 97,743 34 21 28 2 510
Korea, Dem. Rep. 24,500,520 23 16 17 -269 4,180
Korea, Rep. 49,410,000 16 13 15 -1,861 3
Kosovo 1,775,680 27
Kuwait 2,991,580 25 16 280 224
Kyrgyz Republic 5,447,900 30 22 22 -146 411
Lao PDR 6,395,713 37 23 26 136 196
Latvia 2,239,008 14 13 12 -169 24
Lebanon 4,341,092 24 20 21 112 -106
Lesotho 2,008,921 38 23 32 16 32
Liberia 3,957,990 43 19 29 499 399
Libya 6,040,612 29 19 23 -17 -18
Liechtenstein 36,120 14
Lithuania 3,286,820 15 14 14 -261 31
Luxembourg 506,953 18 12 15 13 12
Macao SAR, China 534,626 13 17 8 -32 2,744
Macedonia, FYR 2,102,216 17 15 17 -108 2,221
Madagascar 21,079,532 43 20 30 2,516 262
Malawi 15,013,694 46 20 30 1,973 7
Malaysia 28,275,835 28 20 13 340 3,155
Maldives 325,694 30 23 23 -14 -6
Mali 13,985,961 47 19 32 1,931 -11
Malta 415,995 16 14 15 -21 334
Marshall Islands 52,428 26
Mauritania 3,609,420 41 20 27 348 2
Mauritius 1,280,924 21 15 12 -39 372
Mexico 117,886,404 30 18 22 997 0
Micronesia, Fed. Sts. 103,619 37 24 32 -4 121
Moldova 3,562,062 17 18 14 -426 6,222
Monaco 36,845
Mongolia 2,712,738 27 22 20 -125 1,085
Montenegro 620,078 19 14 16 -17 2,965
Morocco 31,642,360 28 20 23 -991 59
Mozambique 23,967,265 45 19 30 3,141 -1,329
Myanmar 51,931,231 26 19 18 -1,614 -150
Namibia 2,178,967 38 22 29 94 4
Nepal 26,846,016 37 20 1,101 55
Netherlands 16,615,394 18 12 15 27 -39
New Caledonia 249,992 24 16 -1 5,121
New Zealand 4,367,800 20 15 18 28 26,852
Nicaragua 5,822,209 35 21 25 -27 8,660
Niger 15,893,746 50 17 31 2,926 4,658
Nigeria 159,707,780 44 19 28 18,292 1,251
Northern Mariana Islands 53,860
Norway 4,889,252 19 13 17 68 -456
Oman 2,802,768 27 22 21 13 33
Pakistan 173,149,306 35 22 28 4,411 168
Palau 20,470 19
Panama 3,678,128 29 17 22 122 -119
Papua New Guinea 6,858,945 39 19 28 613 2,572
Paraguay 6,459,721 34 20 26 177 221
Peru 29,262,830 30 19 22 94 -4
Philippines 93,444,322 35 20 23 4,183 -249
Poland 38,183,683 15 14 14 -2,408 -96
Portugal 10,637,346 15 11 12 -150 -449
Puerto Rico 3,721,208 20 16 18 -142 -32
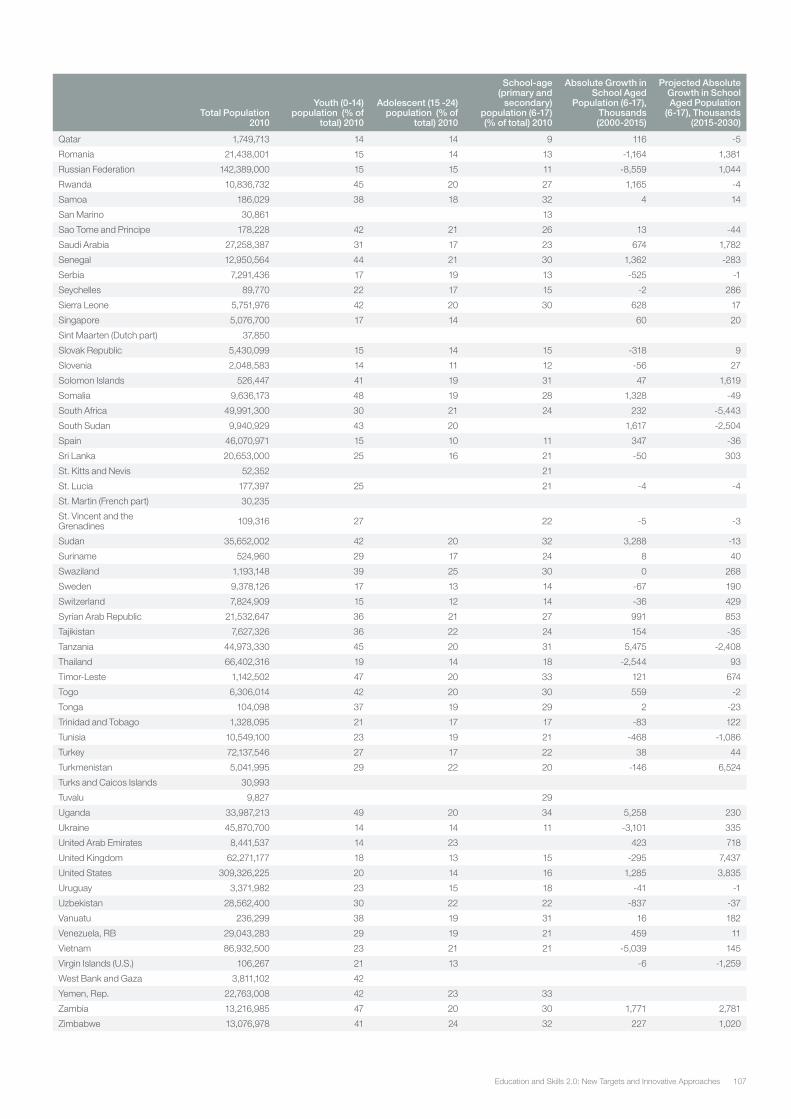
107Education and Skills 2.0: New Targets and Innovative Approaches
Total Population 2010
Youth (0-14) population (% of
total) 2010
Adolescent (15 -24) population (% of
total) 2010
School-age (primary and
secondary) population (6-17)(% of total) 2010
Absolute Growth in School Aged
Population (6-17), Thousands (2000-2015)
Projected Absolute Growth in School Aged Population
(6-17), Thousands (2015-2030)
Qatar 1,749,713 14 14 9 116 -5
Romania 21,438,001 15 14 13 -1,164 1,381
Russian Federation 142,389,000 15 15 11 -8,559 1,044
Rwanda 10,836,732 45 20 27 1,165 -4
Samoa 186,029 38 18 32 4 14
San Marino 30,861 13
Sao Tome and Principe 178,228 42 21 26 13 -44
Saudi Arabia 27,258,387 31 17 23 674 1,782
Senegal 12,950,564 44 21 30 1,362 -283
Serbia 7,291,436 17 19 13 -525 -1
Seychelles 89,770 22 17 15 -2 286
Sierra Leone 5,751,976 42 20 30 628 17
Singapore 5,076,700 17 14 60 20
Sint Maarten (Dutch part) 37,850
Slovak Republic 5,430,099 15 14 15 -318 9
Slovenia 2,048,583 14 11 12 -56 27
Solomon Islands 526,447 41 19 31 47 1,619
Somalia 9,636,173 48 19 28 1,328 -49
South Africa 49,991,300 30 21 24 232 -5,443
South Sudan 9,940,929 43 20 1,617 -2,504
Spain 46,070,971 15 10 11 347 -36
Sri Lanka 20,653,000 25 16 21 -50 303
St. Kitts and Nevis 52,352 21
St. Lucia 177,397 25 21 -4 -4
St. Martin (French part) 30,235
St. Vincent and the Grenadines 109,316 27 22 -5 -3
Sudan 35,652,002 42 20 32 3,288 -13
Suriname 524,960 29 17 24 8 40
Swaziland 1,193,148 39 25 30 0 268
Sweden 9,378,126 17 13 14 -67 190
Switzerland 7,824,909 15 12 14 -36 429
Syrian Arab Republic 21,532,647 36 21 27 991 853
Tajikistan 7,627,326 36 22 24 154 -35
Tanzania 44,973,330 45 20 31 5,475 -2,408
Thailand 66,402,316 19 14 18 -2,544 93
Timor-Leste 1,142,502 47 20 33 121 674
Togo 6,306,014 42 20 30 559 -2
Tonga 104,098 37 19 29 2 -23
Trinidad and Tobago 1,328,095 21 17 17 -83 122
Tunisia 10,549,100 23 19 21 -468 -1,086
Turkey 72,137,546 27 17 22 38 44
Turkmenistan 5,041,995 29 22 20 -146 6,524
Turks and Caicos Islands 30,993
Tuvalu 9,827 29
Uganda 33,987,213 49 20 34 5,258 230
Ukraine 45,870,700 14 14 11 -3,101 335
United Arab Emirates 8,441,537 14 23 423 718
United Kingdom 62,271,177 18 13 15 -295 7,437
United States 309,326,225 20 14 16 1,285 3,835
Uruguay 3,371,982 23 15 18 -41 -1
Uzbekistan 28,562,400 30 22 22 -837 -37
Vanuatu 236,299 38 19 31 16 182
Venezuela, RB 29,043,283 29 19 21 459 11
Vietnam 86,932,500 23 21 21 -5,039 145
Virgin Islands (U.S.) 106,267 21 13 -6 -1,259
West Bank and Gaza 3,811,102 42
Yemen, Rep. 22,763,008 42 23 33
Zambia 13,216,985 47 20 30 1,771 2,781
Zimbabwe 13,076,978 41 24 32 227 1,020
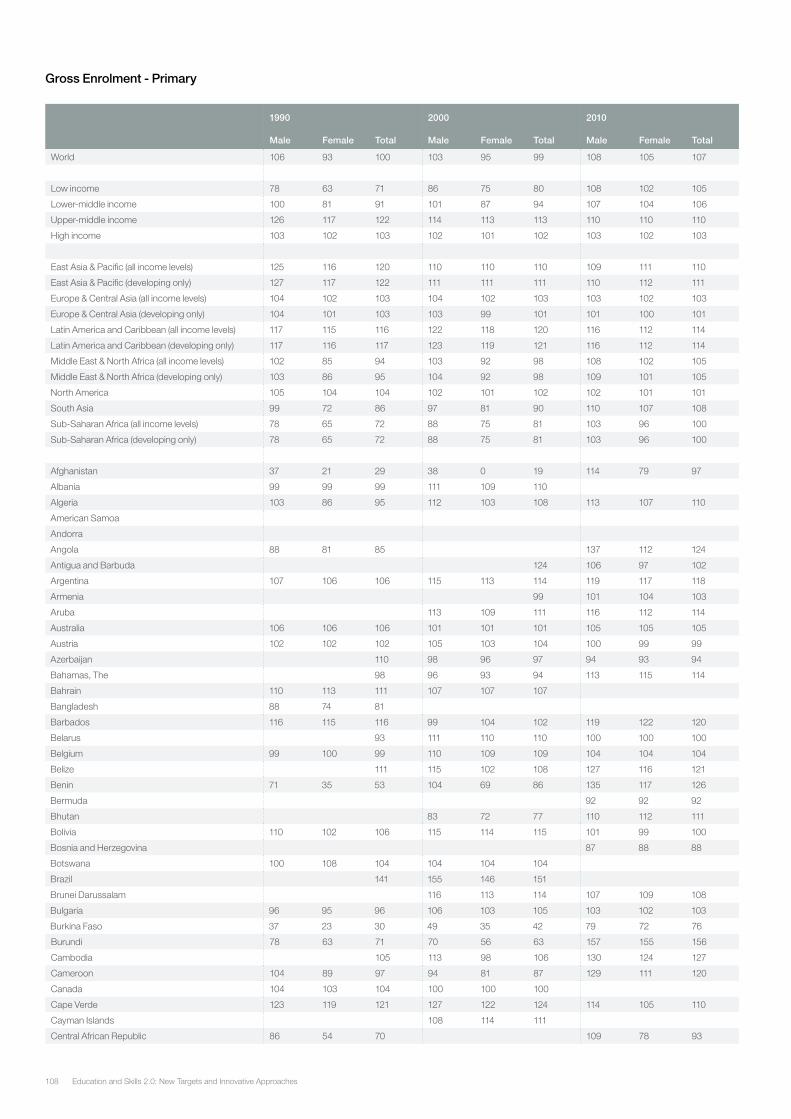
Education and Skills 2.0: New Targets and Innovative Approaches108
Gross Enrolment - Primary
1990 2000 2010
Male Female Total Male Female Total Male Female Total
World 106 93 100 103 95 99 108 105 107
Low income 78 63 71 86 75 80 108 102 105
Lower-middle income 100 81 91 101 87 94 107 104 106
Upper-middle income 126 117 122 114 113 113 110 110 110
High income 103 102 103 102 101 102 103 102 103
East Asia & Pacific (all income levels) 125 116 120 110 110 110 109 111 110
East Asia & Pacific (developing only) 127 117 122 111 111 111 110 112 111
Europe & Central Asia (all income levels) 104 102 103 104 102 103 103 102 103
Europe & Central Asia (developing only) 104 101 103 103 99 101 101 100 101
Latin America and Caribbean (all income levels) 117 115 116 122 118 120 116 112 114
Latin America and Caribbean (developing only) 117 116 117 123 119 121 116 112 114
Middle East & North Africa (all income levels) 102 85 94 103 92 98 108 102 105
Middle East & North Africa (developing only) 103 86 95 104 92 98 109 101 105
North America 105 104 104 102 101 102 102 101 101
South Asia 99 72 86 97 81 90 110 107 108
Sub-Saharan Africa (all income levels) 78 65 72 88 75 81 103 96 100
Sub-Saharan Africa (developing only) 78 65 72 88 75 81 103 96 100
Afghanistan 37 21 29 38 0 19 114 79 97
Albania 99 99 99 111 109 110
Algeria 103 86 95 112 103 108 113 107 110
American Samoa
Andorra
Angola 88 81 85 137 112 124
Antigua and Barbuda 124 106 97 102
Argentina 107 106 106 115 113 114 119 117 118
Armenia 99 101 104 103
Aruba 113 109 111 116 112 114
Australia 106 106 106 101 101 101 105 105 105
Austria 102 102 102 105 103 104 100 99 99
Azerbaijan 110 98 96 97 94 93 94
Bahamas, The 98 96 93 94 113 115 114
Bahrain 110 113 111 107 107 107
Bangladesh 88 74 81
Barbados 116 115 116 99 104 102 119 122 120
Belarus 93 111 110 110 100 100 100
Belgium 99 100 99 110 109 109 104 104 104
Belize 111 115 102 108 127 116 121
Benin 71 35 53 104 69 86 135 117 126
Bermuda 92 92 92
Bhutan 83 72 77 110 112 111
Bolivia 110 102 106 115 114 115 101 99 100
Bosnia and Herzegovina 87 88 88
Botswana 100 108 104 104 104 104
Brazil 141 155 146 151
Brunei Darussalam 116 113 114 107 109 108
Bulgaria 96 95 96 106 103 105 103 102 103
Burkina Faso 37 23 30 49 35 42 79 72 76
Burundi 78 63 71 70 56 63 157 155 156
Cambodia 105 113 98 106 130 124 127
Cameroon 104 89 97 94 81 87 129 111 120
Canada 104 103 104 100 100 100
Cape Verde 123 119 121 127 122 124 114 105 110
Cayman Islands 108 114 111
Central African Republic 86 54 70 109 78 93
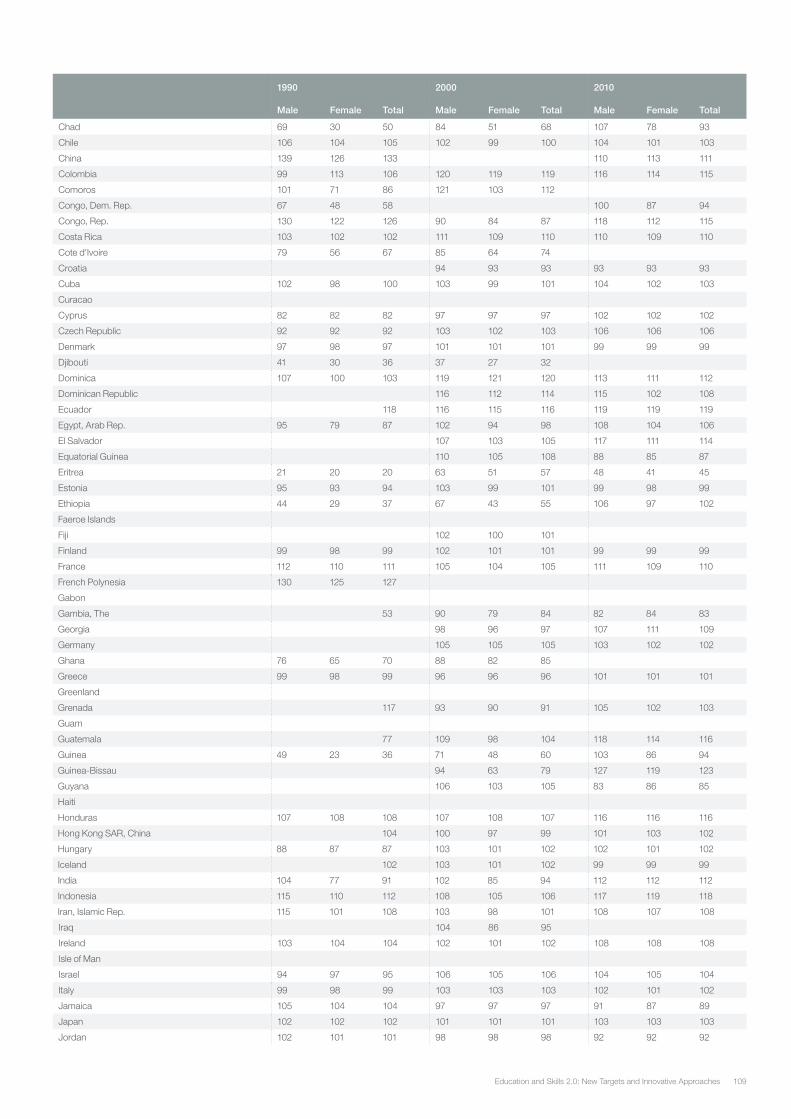
109Education and Skills 2.0: New Targets and Innovative Approaches
1990 2000 2010
Male Female Total Male Female Total Male Female Total
Chad 69 30 50 84 51 68 107 78 93
Chile 106 104 105 102 99 100 104 101 103
China 139 126 133 110 113 111
Colombia 99 113 106 120 119 119 116 114 115
Comoros 101 71 86 121 103 112
Congo, Dem. Rep. 67 48 58 100 87 94
Congo, Rep. 130 122 126 90 84 87 118 112 115
Costa Rica 103 102 102 111 109 110 110 109 110
Cote d'Ivoire 79 56 67 85 64 74
Croatia 94 93 93 93 93 93
Cuba 102 98 100 103 99 101 104 102 103
Curacao
Cyprus 82 82 82 97 97 97 102 102 102
Czech Republic 92 92 92 103 102 103 106 106 106
Denmark 97 98 97 101 101 101 99 99 99
Djibouti 41 30 36 37 27 32
Dominica 107 100 103 119 121 120 113 111 112
Dominican Republic 116 112 114 115 102 108
Ecuador 118 116 115 116 119 119 119
Egypt, Arab Rep. 95 79 87 102 94 98 108 104 106
El Salvador 107 103 105 117 111 114
Equatorial Guinea 110 105 108 88 85 87
Eritrea 21 20 20 63 51 57 48 41 45
Estonia 95 93 94 103 99 101 99 98 99
Ethiopia 44 29 37 67 43 55 106 97 102
Faeroe Islands
Fiji 102 100 101
Finland 99 98 99 102 101 101 99 99 99
France 112 110 111 105 104 105 111 109 110
French Polynesia 130 125 127
Gabon
Gambia, The 53 90 79 84 82 84 83
Georgia 98 96 97 107 111 109
Germany 105 105 105 103 102 102
Ghana 76 65 70 88 82 85
Greece 99 98 99 96 96 96 101 101 101
Greenland
Grenada 117 93 90 91 105 102 103
Guam
Guatemala 77 109 98 104 118 114 116
Guinea 49 23 36 71 48 60 103 86 94
Guinea-Bissau 94 63 79 127 119 123
Guyana 106 103 105 83 86 85
Haiti
Honduras 107 108 108 107 108 107 116 116 116
Hong Kong SAR, China 104 100 97 99 101 103 102
Hungary 88 87 87 103 101 102 102 101 102
Iceland 102 103 101 102 99 99 99
India 104 77 91 102 85 94 112 112 112
Indonesia 115 110 112 108 105 106 117 119 118
Iran, Islamic Rep. 115 101 108 103 98 101 108 107 108
Iraq 104 86 95
Ireland 103 104 104 102 101 102 108 108 108
Isle of Man
Israel 94 97 95 106 105 106 104 105 104
Italy 99 98 99 103 103 103 102 101 102
Jamaica 105 104 104 97 97 97 91 87 89
Japan 102 102 102 101 101 101 103 103 103
Jordan 102 101 101 98 98 98 92 92 92
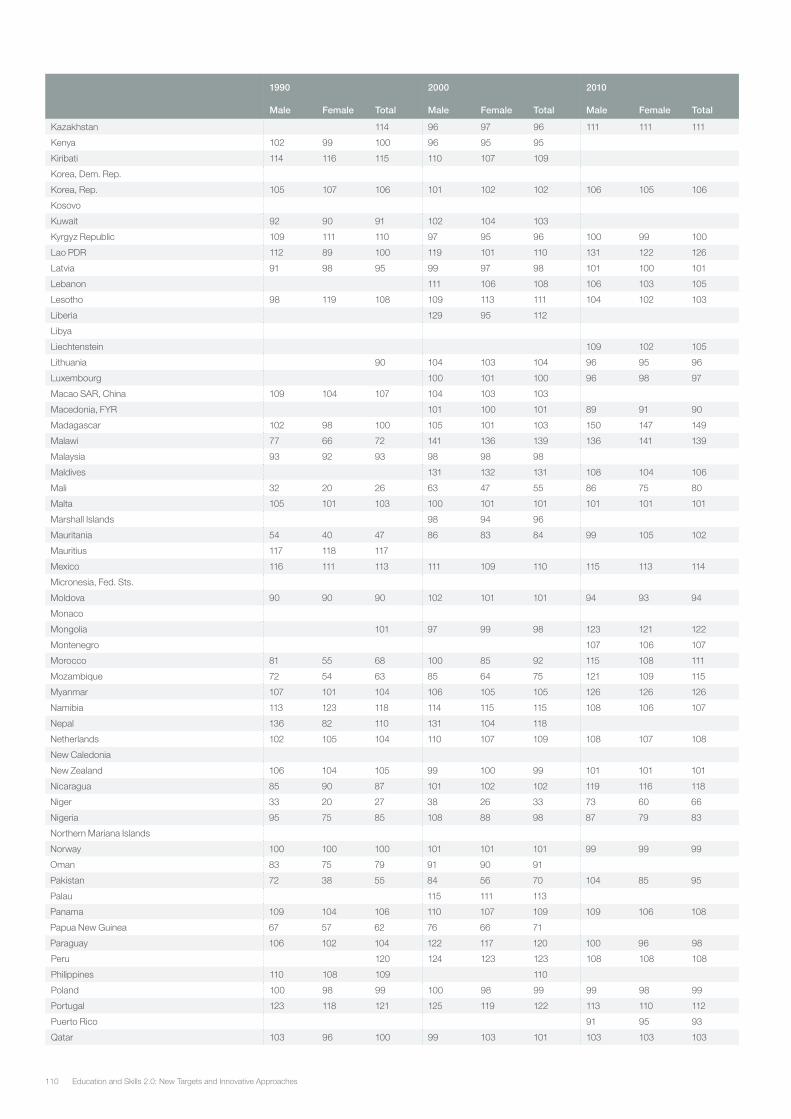
Education and Skills 2.0: New Targets and Innovative Approaches110
1990 2000 2010
Male Female Total Male Female Total Male Female Total
Kazakhstan 114 96 97 96 111 111 111
Kenya 102 99 100 96 95 95
Kiribati 114 116 115 110 107 109
Korea, Dem. Rep.
Korea, Rep. 105 107 106 101 102 102 106 105 106
Kosovo
Kuwait 92 90 91 102 104 103
Kyrgyz Republic 109 111 110 97 95 96 100 99 100
Lao PDR 112 89 100 119 101 110 131 122 126
Latvia 91 98 95 99 97 98 101 100 101
Lebanon 111 106 108 106 103 105
Lesotho 98 119 108 109 113 111 104 102 103
Liberia 129 95 112
Libya
Liechtenstein 109 102 105
Lithuania 90 104 103 104 96 95 96
Luxembourg 100 101 100 96 98 97
Macao SAR, China 109 104 107 104 103 103
Macedonia, FYR 101 100 101 89 91 90
Madagascar 102 98 100 105 101 103 150 147 149
Malawi 77 66 72 141 136 139 136 141 139
Malaysia 93 92 93 98 98 98
Maldives 131 132 131 108 104 106
Mali 32 20 26 63 47 55 86 75 80
Malta 105 101 103 100 101 101 101 101 101
Marshall Islands 98 94 96
Mauritania 54 40 47 86 83 84 99 105 102
Mauritius 117 118 117
Mexico 116 111 113 111 109 110 115 113 114
Micronesia, Fed. Sts.
Moldova 90 90 90 102 101 101 94 93 94
Monaco
Mongolia 101 97 99 98 123 121 122
Montenegro 107 106 107
Morocco 81 55 68 100 85 92 115 108 111
Mozambique 72 54 63 85 64 75 121 109 115
Myanmar 107 101 104 106 105 105 126 126 126
Namibia 113 123 118 114 115 115 108 106 107
Nepal 136 82 110 131 104 118
Netherlands 102 105 104 110 107 109 108 107 108
New Caledonia
New Zealand 106 104 105 99 100 99 101 101 101
Nicaragua 85 90 87 101 102 102 119 116 118
Niger 33 20 27 38 26 33 73 60 66
Nigeria 95 75 85 108 88 98 87 79 83
Northern Mariana Islands
Norway 100 100 100 101 101 101 99 99 99
Oman 83 75 79 91 90 91
Pakistan 72 38 55 84 56 70 104 85 95
Palau 115 111 113
Panama 109 104 106 110 107 109 109 106 108
Papua New Guinea 67 57 62 76 66 71
Paraguay 106 102 104 122 117 120 100 96 98
Peru 120 124 123 123 108 108 108
Philippines 110 108 109 110
Poland 100 98 99 100 98 99 99 98 99
Portugal 123 118 121 125 119 122 113 110 112
Puerto Rico 91 95 93
Qatar 103 96 100 99 103 101 103 103 103

111Education and Skills 2.0: New Targets and Innovative Approaches
1990 2000 2010
Male Female Total Male Female Total Male Female Total
Romania 93 92 92 98 96 97 96 95 96
Russian Federation 107 107 107 104 103 103
Rwanda 76 75 76 106 102 104 141 144 143
Samoa 99 99 99 107 109 108
San Marino 89 101 94
Sao Tome and Principe 144 132 138 131 130 131
Saudi Arabia 106 106 106
Senegal 65 47 56 76 66 71 84 89 87
Serbia 107 106 106 96 96 96
Seychelles 112 113 112 117 117 117
Sierra Leone 63 42 52 75 66 70
Singapore
Sint Maarten (Dutch part)
Slovak Republic 100 98 99 101 101 101
Slovenia 100 96 98 97 99 98 98
Solomon Islands 95 82 89 90 84 87 146 144 145
Somalia
South Africa 107 106 107 109 103 106
South Sudan
Spain 107 105 106 106 105 106 106 105 106
Sri Lanka 112 108 110 99 99 99
St. Kitts and Nevis 116 111 113 112 109 111 93 94 93
St. Lucia 142 136 139 104 101 103 96 92 94
St. Martin (French part)
St. Vincent and the Grenadines 121 115 118 109 101 105
Sudan 52 44 48
Suriname 112 123 118
Swaziland 94 94 94 97 93 95 121 111 116
Sweden 100 100 100 108 111 110 102 101 101
Switzerland 89 90 89 106 106 106 103 102 103
Syrian Arab Republic 113 102 107 113 105 109 119 116 118
Tajikistan 100 93 97 104 100 102
Tanzania 70 69 69 69 68 68 101 103 102
Thailand 98 98 96 97
Timor-Leste 119 115 117
Togo 117 75 96 133 103 118 147 132 140
Tonga 108 107 107 112 106 109
Trinidad and Tobago 96 97 97 100 99 100 107 103 105
Tunisia 120 104 112 119 111 115 112 108 110
Turkey 107 98 102 106 97 101 105 104 104
Turkmenistan
Turks and Caicos Islands
Tuvalu 103 107 105
Uganda 77 62 70 137 126 131 120 122 121
Ukraine 107 107 107 108 108 108 99 100 99
United Arab Emirates 110 106 108 90 89 90
United Kingdom 106 106 106 101 101 101 107 107 107
United States 105 104 105 103 101 102 102 101 102
Uruguay 109 108 109 110 108 109 114 110 112
Uzbekistan 111 110 110 99 99 99 95 93 94
Vanuatu 98 96 97 122 119 120 120 114 117
Venezuela, RB 106 102 100 101 104 101 103
Vietnam 105 111 105 108 109 103 106
Virgin Islands (U.S.)
West Bank and Gaza 99 98 98 92 90 91
Yemen, Rep. 96 78 87
Zambia 97 87 81 84 115 116 115
Zimbabwe 101 100 101
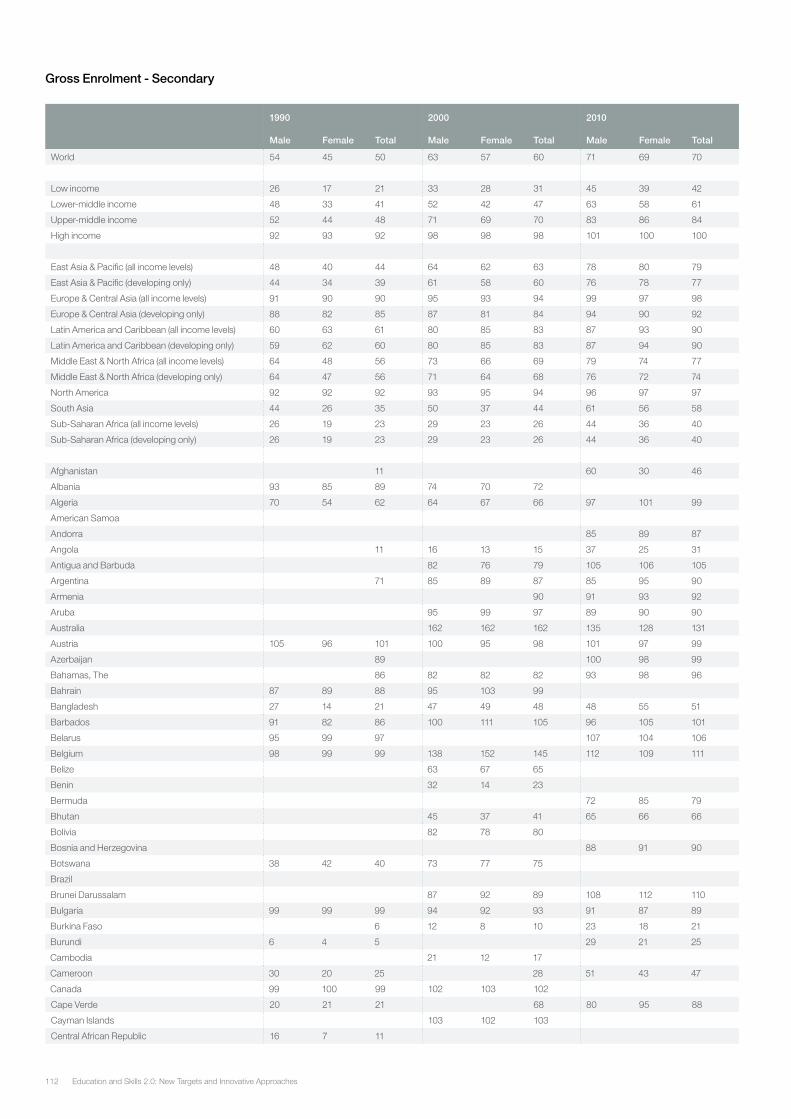
Education and Skills 2.0: New Targets and Innovative Approaches112
Gross Enrolment - Secondary
1990 2000 2010
Male Female Total Male Female Total Male Female Total
World 54 45 50 63 57 60 71 69 70
Low income 26 17 21 33 28 31 45 39 42
Lower-middle income 48 33 41 52 42 47 63 58 61
Upper-middle income 52 44 48 71 69 70 83 86 84
High income 92 93 92 98 98 98 101 100 100
East Asia & Pacific (all income levels) 48 40 44 64 62 63 78 80 79
East Asia & Pacific (developing only) 44 34 39 61 58 60 76 78 77
Europe & Central Asia (all income levels) 91 90 90 95 93 94 99 97 98
Europe & Central Asia (developing only) 88 82 85 87 81 84 94 90 92
Latin America and Caribbean (all income levels) 60 63 61 80 85 83 87 93 90
Latin America and Caribbean (developing only) 59 62 60 80 85 83 87 94 90
Middle East & North Africa (all income levels) 64 48 56 73 66 69 79 74 77
Middle East & North Africa (developing only) 64 47 56 71 64 68 76 72 74
North America 92 92 92 93 95 94 96 97 97
South Asia 44 26 35 50 37 44 61 56 58
Sub-Saharan Africa (all income levels) 26 19 23 29 23 26 44 36 40
Sub-Saharan Africa (developing only) 26 19 23 29 23 26 44 36 40
Afghanistan 11 60 30 46
Albania 93 85 89 74 70 72
Algeria 70 54 62 64 67 66 97 101 99
American Samoa
Andorra 85 89 87
Angola 11 16 13 15 37 25 31
Antigua and Barbuda 82 76 79 105 106 105
Argentina 71 85 89 87 85 95 90
Armenia 90 91 93 92
Aruba 95 99 97 89 90 90
Australia 162 162 162 135 128 131
Austria 105 96 101 100 95 98 101 97 99
Azerbaijan 89 100 98 99
Bahamas, The 86 82 82 82 93 98 96
Bahrain 87 89 88 95 103 99
Bangladesh 27 14 21 47 49 48 48 55 51
Barbados 91 82 86 100 111 105 96 105 101
Belarus 95 99 97 107 104 106
Belgium 98 99 99 138 152 145 112 109 111
Belize 63 67 65
Benin 32 14 23
Bermuda 72 85 79
Bhutan 45 37 41 65 66 66
Bolivia 82 78 80
Bosnia and Herzegovina 88 91 90
Botswana 38 42 40 73 77 75
Brazil
Brunei Darussalam 87 92 89 108 112 110
Bulgaria 99 99 99 94 92 93 91 87 89
Burkina Faso 6 12 8 10 23 18 21
Burundi 6 4 5 29 21 25
Cambodia 21 12 17
Cameroon 30 20 25 28 51 43 47
Canada 99 100 99 102 103 102
Cape Verde 20 21 21 68 80 95 88
Cayman Islands 103 102 103
Central African Republic 16 7 11
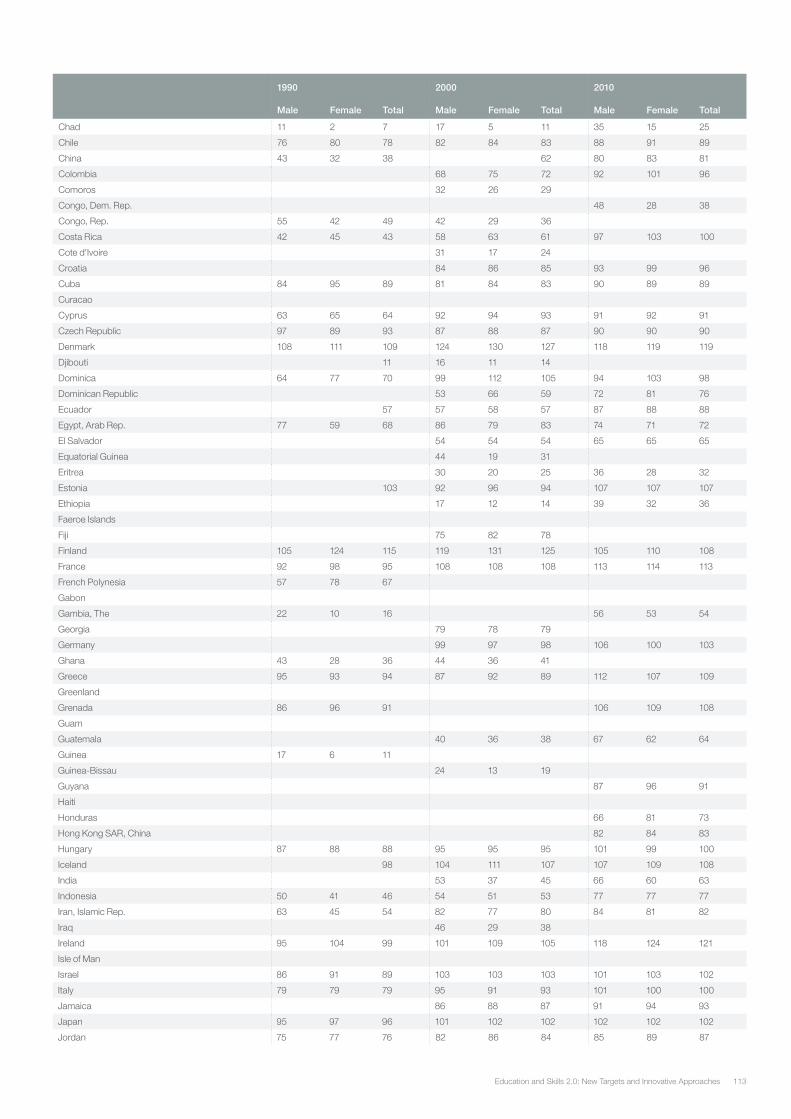
113Education and Skills 2.0: New Targets and Innovative Approaches
1990 2000 2010
Male Female Total Male Female Total Male Female Total
Chad 11 2 7 17 5 11 35 15 25
Chile 76 80 78 82 84 83 88 91 89
China 43 32 38 62 80 83 81
Colombia 68 75 72 92 101 96
Comoros 32 26 29
Congo, Dem. Rep. 48 28 38
Congo, Rep. 55 42 49 42 29 36
Costa Rica 42 45 43 58 63 61 97 103 100
Cote d'Ivoire 31 17 24
Croatia 84 86 85 93 99 96
Cuba 84 95 89 81 84 83 90 89 89
Curacao
Cyprus 63 65 64 92 94 93 91 92 91
Czech Republic 97 89 93 87 88 87 90 90 90
Denmark 108 111 109 124 130 127 118 119 119
Djibouti 11 16 11 14
Dominica 64 77 70 99 112 105 94 103 98
Dominican Republic 53 66 59 72 81 76
Ecuador 57 57 58 57 87 88 88
Egypt, Arab Rep. 77 59 68 86 79 83 74 71 72
El Salvador 54 54 54 65 65 65
Equatorial Guinea 44 19 31
Eritrea 30 20 25 36 28 32
Estonia 103 92 96 94 107 107 107
Ethiopia 17 12 14 39 32 36
Faeroe Islands
Fiji 75 82 78
Finland 105 124 115 119 131 125 105 110 108
France 92 98 95 108 108 108 113 114 113
French Polynesia 57 78 67
Gabon
Gambia, The 22 10 16 56 53 54
Georgia 79 78 79
Germany 99 97 98 106 100 103
Ghana 43 28 36 44 36 41
Greece 95 93 94 87 92 89 112 107 109
Greenland
Grenada 86 96 91 106 109 108
Guam
Guatemala 40 36 38 67 62 64
Guinea 17 6 11
Guinea-Bissau 24 13 19
Guyana 87 96 91
Haiti
Honduras 66 81 73
Hong Kong SAR, China 82 84 83
Hungary 87 88 88 95 95 95 101 99 100
Iceland 98 104 111 107 107 109 108
India 53 37 45 66 60 63
Indonesia 50 41 46 54 51 53 77 77 77
Iran, Islamic Rep. 63 45 54 82 77 80 84 81 82
Iraq 46 29 38
Ireland 95 104 99 101 109 105 118 124 121
Isle of Man
Israel 86 91 89 103 103 103 101 103 102
Italy 79 79 79 95 91 93 101 100 100
Jamaica 86 88 87 91 94 93
Japan 95 97 96 101 102 102 102 102 102
Jordan 75 77 76 82 86 84 85 89 87
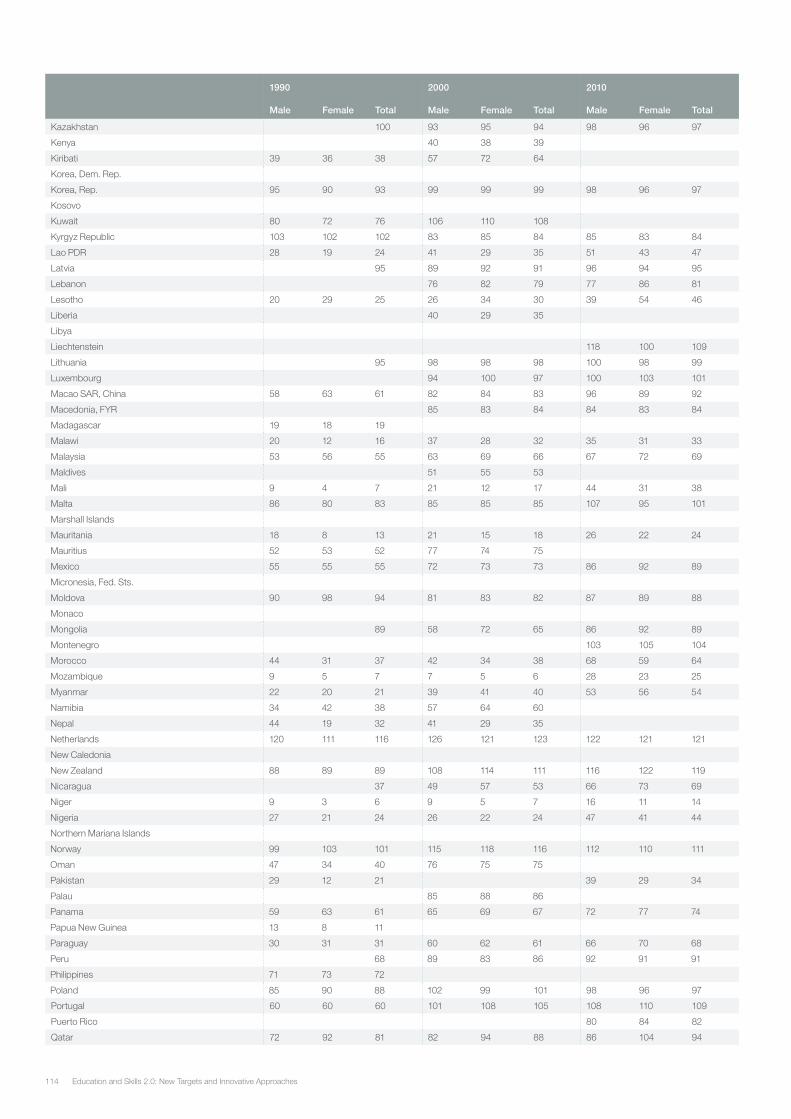
Education and Skills 2.0: New Targets and Innovative Approaches114
1990 2000 2010
Male Female Total Male Female Total Male Female Total
Kazakhstan 100 93 95 94 98 96 97
Kenya 40 38 39
Kiribati 39 36 38 57 72 64
Korea, Dem. Rep.
Korea, Rep. 95 90 93 99 99 99 98 96 97
Kosovo
Kuwait 80 72 76 106 110 108
Kyrgyz Republic 103 102 102 83 85 84 85 83 84
Lao PDR 28 19 24 41 29 35 51 43 47
Latvia 95 89 92 91 96 94 95
Lebanon 76 82 79 77 86 81
Lesotho 20 29 25 26 34 30 39 54 46
Liberia 40 29 35
Libya
Liechtenstein 118 100 109
Lithuania 95 98 98 98 100 98 99
Luxembourg 94 100 97 100 103 101
Macao SAR, China 58 63 61 82 84 83 96 89 92
Macedonia, FYR 85 83 84 84 83 84
Madagascar 19 18 19
Malawi 20 12 16 37 28 32 35 31 33
Malaysia 53 56 55 63 69 66 67 72 69
Maldives 51 55 53
Mali 9 4 7 21 12 17 44 31 38
Malta 86 80 83 85 85 85 107 95 101
Marshall Islands
Mauritania 18 8 13 21 15 18 26 22 24
Mauritius 52 53 52 77 74 75
Mexico 55 55 55 72 73 73 86 92 89
Micronesia, Fed. Sts.
Moldova 90 98 94 81 83 82 87 89 88
Monaco
Mongolia 89 58 72 65 86 92 89
Montenegro 103 105 104
Morocco 44 31 37 42 34 38 68 59 64
Mozambique 9 5 7 7 5 6 28 23 25
Myanmar 22 20 21 39 41 40 53 56 54
Namibia 34 42 38 57 64 60
Nepal 44 19 32 41 29 35
Netherlands 120 111 116 126 121 123 122 121 121
New Caledonia
New Zealand 88 89 89 108 114 111 116 122 119
Nicaragua 37 49 57 53 66 73 69
Niger 9 3 6 9 5 7 16 11 14
Nigeria 27 21 24 26 22 24 47 41 44
Northern Mariana Islands
Norway 99 103 101 115 118 116 112 110 111
Oman 47 34 40 76 75 75
Pakistan 29 12 21 39 29 34
Palau 85 88 86
Panama 59 63 61 65 69 67 72 77 74
Papua New Guinea 13 8 11
Paraguay 30 31 31 60 62 61 66 70 68
Peru 68 89 83 86 92 91 91
Philippines 71 73 72
Poland 85 90 88 102 99 101 98 96 97
Portugal 60 60 60 101 108 105 108 110 109
Puerto Rico 80 84 82
Qatar 72 92 81 82 94 88 86 104 94

115Education and Skills 2.0: New Targets and Innovative Approaches
1990 2000 2010
Male Female Total Male Female Total Male Female Total
Romania 104 101 103 81 83 82 98 97 97
Russian Federation 96
Rwanda 18 15 16 11 11 11 32 32 32
Samoa 73 83 78 79 91 85
San Marino 96 98 97
Sao Tome and Principe 51 52 51
Saudi Arabia 111 98 104
Senegal 20 10 15 20 13 16 40 35 37
Serbia 89 91 90 91 92 91
Seychelles 102 107 105 114 125 119
Sierra Leone 23 12 17
Singapore
Sint Maarten (Dutch part)
Slovak Republic 84 85 85 90 91 90
Slovenia 88 99 103 101 98 97 97
Solomon Islands 17 11 14 23 18 21 51 45 48
Somalia
South Africa 61 71 66 81 90 85
South Sudan
Spain 99 105 102 108 115 111 123 126 125
Sri Lanka 69 75 72 99 102 100
St. Kitts and Nevis 95 99 97 98 97 98
St. Lucia 39 59 49 64 83 73 97 96 96
St. Martin (French part)
St. Vincent and the Grenadines 71 95 82 106 109 107
Sudan 25
Suriname 49 63 56
Swaziland 42 42 42 58 58 58
Sweden 88 92 90 134 170 152 100 99 99
Switzerland 99 92 96 98 92 95 97 94 95
Syrian Arab Republic 59 43 51 47 43 45 72 73 72
Tajikistan 80 69 74 93 81 87
Tanzania 6 4 5 35 28 32
Thailand 28 29 28 74 80 77
Timor-Leste 56 56 56
Togo 33 11 22 47 21 34
Tonga 99 98 98 101 113 106
Trinidad and Tobago 84 86 85 72 79 76
Tunisia 50 38 44 75 77 76 88 93 90
Turkey 63 37 50 82 60 71 86 79 82
Turkmenistan
Turks and Caicos Islands
Tuvalu
Uganda 14 8 11 19 14 16
Ukraine 93 97 95 99 99 99 97 94 96
United Arab Emirates 56 69 62 83 88 85
United Kingdom 82 85 84 101 102 102 105 106 105
United States 91 91 91 92 94 93 96 97 96
Uruguay 81 92 105 98 85 96 90
Uzbekistan 101 89 86 88 105 104 105
Vanuatu 32 37 35 54 55 55
Venezuela, RB 56 55 65 60 79 86 83
Vietnam 36
Virgin Islands (U.S.)
West Bank and Gaza 79 82 81 83 89 86
Yemen, Rep. 54 34 44
Zambia 21
Zimbabwe 50 44 47
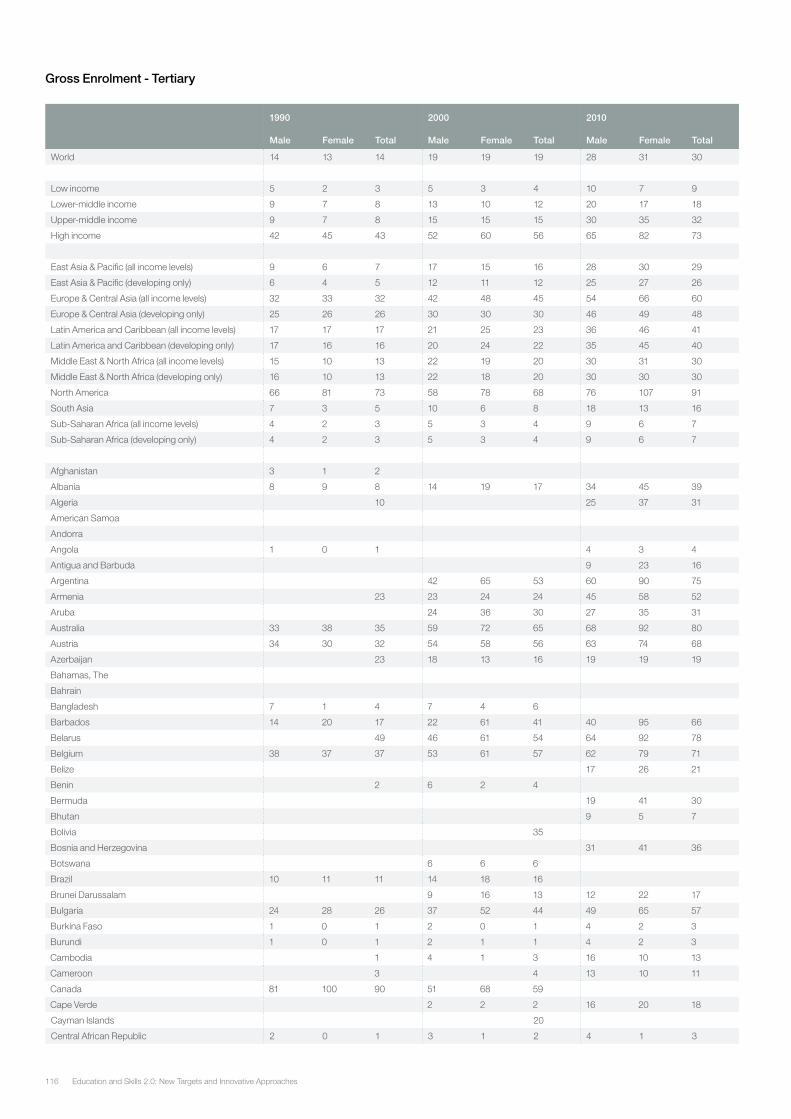
Education and Skills 2.0: New Targets and Innovative Approaches116
Gross Enrolment - Tertiary
1990 2000 2010
Male Female Total Male Female Total Male Female Total
World 14 13 14 19 19 19 28 31 30
Low income 5 2 3 5 3 4 10 7 9
Lower-middle income 9 7 8 13 10 12 20 17 18
Upper-middle income 9 7 8 15 15 15 30 35 32
High income 42 45 43 52 60 56 65 82 73
East Asia & Pacific (all income levels) 9 6 7 17 15 16 28 30 29
East Asia & Pacific (developing only) 6 4 5 12 11 12 25 27 26
Europe & Central Asia (all income levels) 32 33 32 42 48 45 54 66 60
Europe & Central Asia (developing only) 25 26 26 30 30 30 46 49 48
Latin America and Caribbean (all income levels) 17 17 17 21 25 23 36 46 41
Latin America and Caribbean (developing only) 17 16 16 20 24 22 35 45 40
Middle East & North Africa (all income levels) 15 10 13 22 19 20 30 31 30
Middle East & North Africa (developing only) 16 10 13 22 18 20 30 30 30
North America 66 81 73 58 78 68 76 107 91
South Asia 7 3 5 10 6 8 18 13 16
Sub-Saharan Africa (all income levels) 4 2 3 5 3 4 9 6 7
Sub-Saharan Africa (developing only) 4 2 3 5 3 4 9 6 7
Afghanistan 3 1 2
Albania 8 9 8 14 19 17 34 45 39
Algeria 10 25 37 31
American Samoa
Andorra
Angola 1 0 1 4 3 4
Antigua and Barbuda 9 23 16
Argentina 42 65 53 60 90 75
Armenia 23 23 24 24 45 58 52
Aruba 24 36 30 27 35 31
Australia 33 38 35 59 72 65 68 92 80
Austria 34 30 32 54 58 56 63 74 68
Azerbaijan 23 18 13 16 19 19 19
Bahamas, The
Bahrain
Bangladesh 7 1 4 7 4 6
Barbados 14 20 17 22 61 41 40 95 66
Belarus 49 46 61 54 64 92 78
Belgium 38 37 37 53 61 57 62 79 71
Belize 17 26 21
Benin 2 6 2 4
Bermuda 19 41 30
Bhutan 9 5 7
Bolivia 35
Bosnia and Herzegovina 31 41 36
Botswana 6 6 6
Brazil 10 11 11 14 18 16
Brunei Darussalam 9 16 13 12 22 17
Bulgaria 24 28 26 37 52 44 49 65 57
Burkina Faso 1 0 1 2 0 1 4 2 3
Burundi 1 0 1 2 1 1 4 2 3
Cambodia 1 4 1 3 16 10 13
Cameroon 3 4 13 10 11
Canada 81 100 90 51 68 59
Cape Verde 2 2 2 16 20 18
Cayman Islands 20
Central African Republic 2 0 1 3 1 2 4 1 3
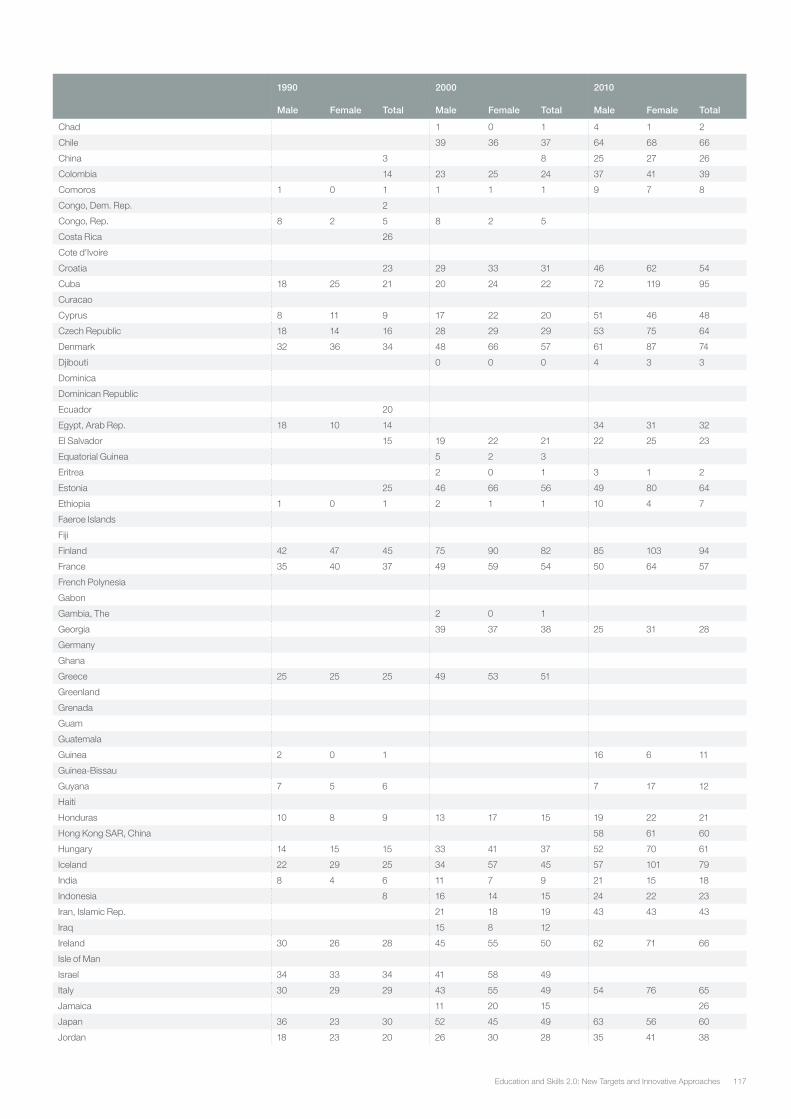
117Education and Skills 2.0: New Targets and Innovative Approaches
1990 2000 2010
Male Female Total Male Female Total Male Female Total
Chad 1 0 1 4 1 2
Chile 39 36 37 64 68 66
China 3 8 25 27 26
Colombia 14 23 25 24 37 41 39
Comoros 1 0 1 1 1 1 9 7 8
Congo, Dem. Rep. 2
Congo, Rep. 8 2 5 8 2 5
Costa Rica 26
Cote d'Ivoire
Croatia 23 29 33 31 46 62 54
Cuba 18 25 21 20 24 22 72 119 95
Curacao
Cyprus 8 11 9 17 22 20 51 46 48
Czech Republic 18 14 16 28 29 29 53 75 64
Denmark 32 36 34 48 66 57 61 87 74
Djibouti 0 0 0 4 3 3
Dominica
Dominican Republic
Ecuador 20
Egypt, Arab Rep. 18 10 14 34 31 32
El Salvador 15 19 22 21 22 25 23
Equatorial Guinea 5 2 3
Eritrea 2 0 1 3 1 2
Estonia 25 46 66 56 49 80 64
Ethiopia 1 0 1 2 1 1 10 4 7
Faeroe Islands
Fiji
Finland 42 47 45 75 90 82 85 103 94
France 35 40 37 49 59 54 50 64 57
French Polynesia
Gabon
Gambia, The 2 0 1
Georgia 39 37 38 25 31 28
Germany
Ghana
Greece 25 25 25 49 53 51
Greenland
Grenada
Guam
Guatemala
Guinea 2 0 1 16 6 11
Guinea-Bissau
Guyana 7 5 6 7 17 12
Haiti
Honduras 10 8 9 13 17 15 19 22 21
Hong Kong SAR, China 58 61 60
Hungary 14 15 15 33 41 37 52 70 61
Iceland 22 29 25 34 57 45 57 101 79
India 8 4 6 11 7 9 21 15 18
Indonesia 8 16 14 15 24 22 23
Iran, Islamic Rep. 21 18 19 43 43 43
Iraq 15 8 12
Ireland 30 26 28 45 55 50 62 71 66
Isle of Man
Israel 34 33 34 41 58 49
Italy 30 29 29 43 55 49 54 76 65
Jamaica 11 20 15 26
Japan 36 23 30 52 45 49 63 56 60
Jordan 18 23 20 26 30 28 35 41 38
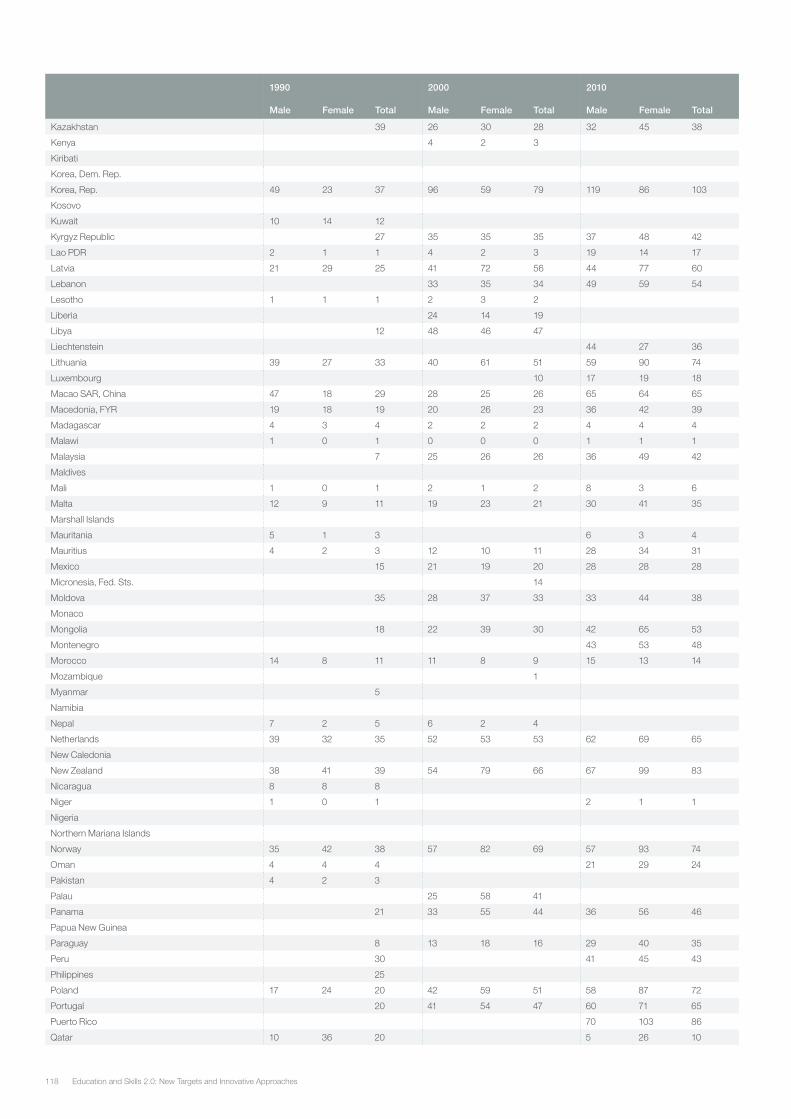
Education and Skills 2.0: New Targets and Innovative Approaches118
1990 2000 2010
Male Female Total Male Female Total Male Female Total
Kazakhstan 39 26 30 28 32 45 38
Kenya 4 2 3
Kiribati
Korea, Dem. Rep.
Korea, Rep. 49 23 37 96 59 79 119 86 103
Kosovo
Kuwait 10 14 12
Kyrgyz Republic 27 35 35 35 37 48 42
Lao PDR 2 1 1 4 2 3 19 14 17
Latvia 21 29 25 41 72 56 44 77 60
Lebanon 33 35 34 49 59 54
Lesotho 1 1 1 2 3 2
Liberia 24 14 19
Libya 12 48 46 47
Liechtenstein 44 27 36
Lithuania 39 27 33 40 61 51 59 90 74
Luxembourg 10 17 19 18
Macao SAR, China 47 18 29 28 25 26 65 64 65
Macedonia, FYR 19 18 19 20 26 23 36 42 39
Madagascar 4 3 4 2 2 2 4 4 4
Malawi 1 0 1 0 0 0 1 1 1
Malaysia 7 25 26 26 36 49 42
Maldives
Mali 1 0 1 2 1 2 8 3 6
Malta 12 9 11 19 23 21 30 41 35
Marshall Islands
Mauritania 5 1 3 6 3 4
Mauritius 4 2 3 12 10 11 28 34 31
Mexico 15 21 19 20 28 28 28
Micronesia, Fed. Sts. 14
Moldova 35 28 37 33 33 44 38
Monaco
Mongolia 18 22 39 30 42 65 53
Montenegro 43 53 48
Morocco 14 8 11 11 8 9 15 13 14
Mozambique 1
Myanmar 5
Namibia
Nepal 7 2 5 6 2 4
Netherlands 39 32 35 52 53 53 62 69 65
New Caledonia
New Zealand 38 41 39 54 79 66 67 99 83
Nicaragua 8 8 8
Niger 1 0 1 2 1 1
Nigeria
Northern Mariana Islands
Norway 35 42 38 57 82 69 57 93 74
Oman 4 4 4 21 29 24
Pakistan 4 2 3
Palau 25 58 41
Panama 21 33 55 44 36 56 46
Papua New Guinea
Paraguay 8 13 18 16 29 40 35
Peru 30 41 45 43
Philippines 25
Poland 17 24 20 42 59 51 58 87 72
Portugal 20 41 54 47 60 71 65
Puerto Rico 70 103 86
Qatar 10 36 20 5 26 10
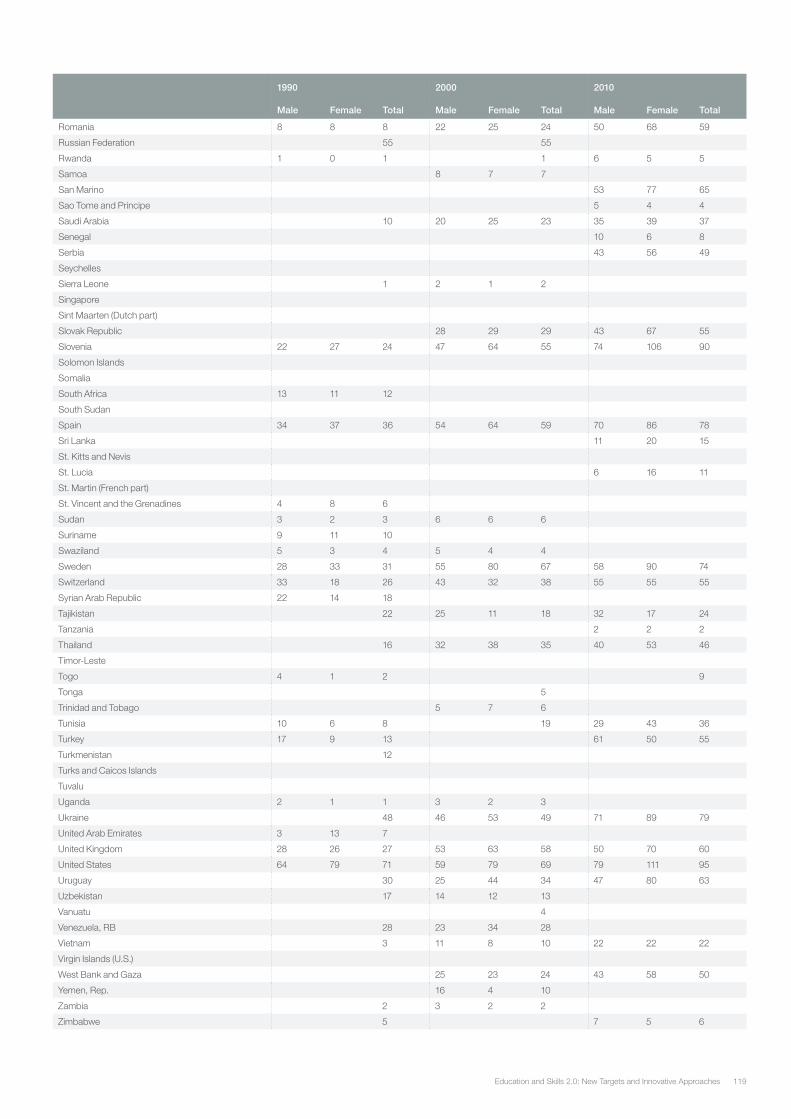
119Education and Skills 2.0: New Targets and Innovative Approaches
1990 2000 2010
Male Female Total Male Female Total Male Female Total
Romania 8 8 8 22 25 24 50 68 59
Russian Federation 55 55
Rwanda 1 0 1 1 6 5 5
Samoa 8 7 7
San Marino 53 77 65
Sao Tome and Principe 5 4 4
Saudi Arabia 10 20 25 23 35 39 37
Senegal 10 6 8
Serbia 43 56 49
Seychelles
Sierra Leone 1 2 1 2
Singapore
Sint Maarten (Dutch part)
Slovak Republic 28 29 29 43 67 55
Slovenia 22 27 24 47 64 55 74 106 90
Solomon Islands
Somalia
South Africa 13 11 12
South Sudan
Spain 34 37 36 54 64 59 70 86 78
Sri Lanka 11 20 15
St. Kitts and Nevis
St. Lucia 6 16 11
St. Martin (French part)
St. Vincent and the Grenadines 4 8 6
Sudan 3 2 3 6 6 6
Suriname 9 11 10
Swaziland 5 3 4 5 4 4
Sweden 28 33 31 55 80 67 58 90 74
Switzerland 33 18 26 43 32 38 55 55 55
Syrian Arab Republic 22 14 18
Tajikistan 22 25 11 18 32 17 24
Tanzania 2 2 2
Thailand 16 32 38 35 40 53 46
Timor-Leste
Togo 4 1 2 9
Tonga 5
Trinidad and Tobago 5 7 6
Tunisia 10 6 8 19 29 43 36
Turkey 17 9 13 61 50 55
Turkmenistan 12
Turks and Caicos Islands
Tuvalu
Uganda 2 1 1 3 2 3
Ukraine 48 46 53 49 71 89 79
United Arab Emirates 3 13 7
United Kingdom 28 26 27 53 63 58 50 70 60
United States 64 79 71 59 79 69 79 111 95
Uruguay 30 25 44 34 47 80 63
Uzbekistan 17 14 12 13
Vanuatu 4
Venezuela, RB 28 23 34 28
Vietnam 3 11 8 10 22 22 22
Virgin Islands (U.S.)
West Bank and Gaza 25 23 24 43 58 50
Yemen, Rep. 16 4 10
Zambia 2 3 2 2
Zimbabwe 5 7 5 6
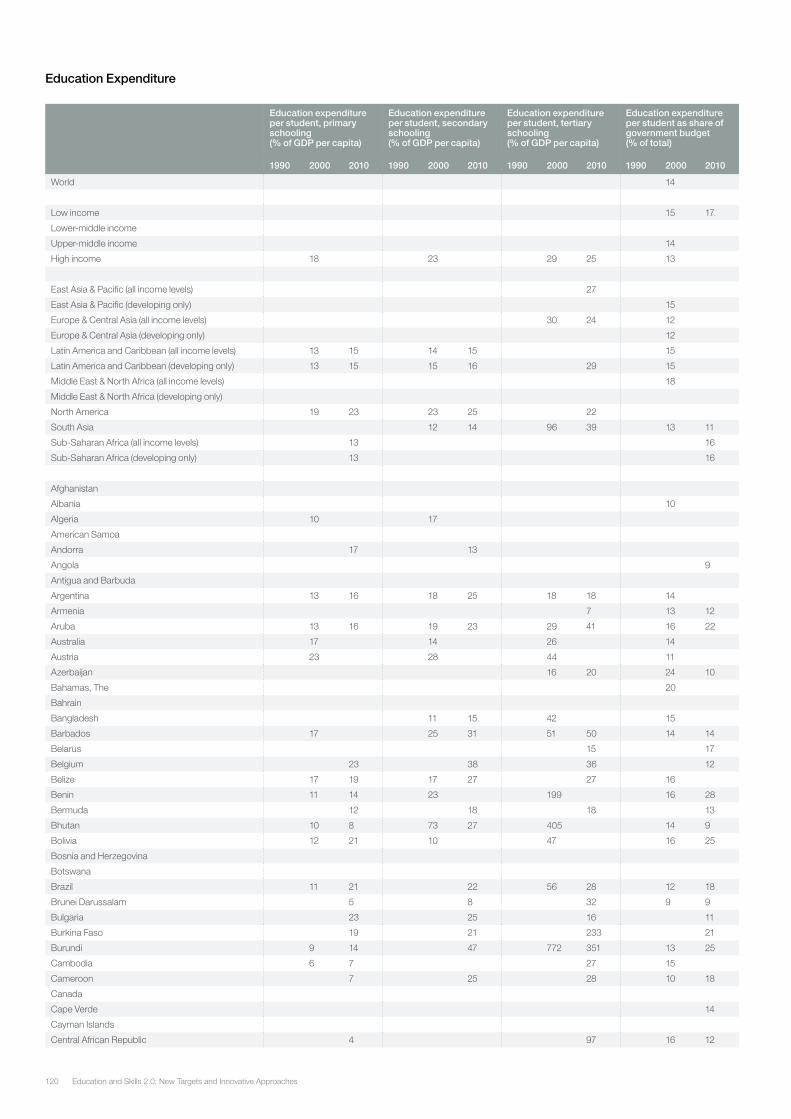
Education and Skills 2.0: New Targets and Innovative Approaches120
Education Expenditure
Education expenditure per student, primary schooling (% of GDP per capita)
Education expenditure per student, secondary schooling (% of GDP per capita)
Education expenditure per student, tertiary schooling (% of GDP per capita)
Education expenditure per student as share of government budget (% of total)
1990 2000 2010 1990 2000 2010 1990 2000 2010 1990 2000 2010
World 14
Low income 15 17
Lower-middle income
Upper-middle income 14
High income 18 23 29 25 13
East Asia & Pacific (all income levels) 27
East Asia & Pacific (developing only) 15
Europe & Central Asia (all income levels) 30 24 12
Europe & Central Asia (developing only) 12
Latin America and Caribbean (all income levels) 13 15 14 15 15
Latin America and Caribbean (developing only) 13 15 15 16 29 15
Middle East & North Africa (all income levels) 18
Middle East & North Africa (developing only)
North America 19 23 23 25 22
South Asia 12 14 96 39 13 11
Sub-Saharan Africa (all income levels) 13 16
Sub-Saharan Africa (developing only) 13 16
Afghanistan
Albania 10
Algeria 10 17
American Samoa
Andorra 17 13
Angola 9
Antigua and Barbuda
Argentina 13 16 18 25 18 18 14
Armenia 7 13 12
Aruba 13 16 19 23 29 41 16 22
Australia 17 14 26 14
Austria 23 28 44 11
Azerbaijan 16 20 24 10
Bahamas, The 20
Bahrain
Bangladesh 11 15 42 15
Barbados 17 25 31 51 50 14 14
Belarus 15 17
Belgium 23 38 36 12
Belize 17 19 17 27 27 16
Benin 11 14 23 199 16 28
Bermuda 12 18 18 13
Bhutan 10 8 73 27 405 14 9
Bolivia 12 21 10 47 16 25
Bosnia and Herzegovina
Botswana
Brazil 11 21 22 56 28 12 18
Brunei Darussalam 5 8 32 9 9
Bulgaria 23 25 16 11
Burkina Faso 19 21 233 21
Burundi 9 14 47 772 351 13 25
Cambodia 6 7 27 15
Cameroon 7 25 28 10 18
Canada
Cape Verde 14
Cayman Islands
Central African Republic 4 97 16 12
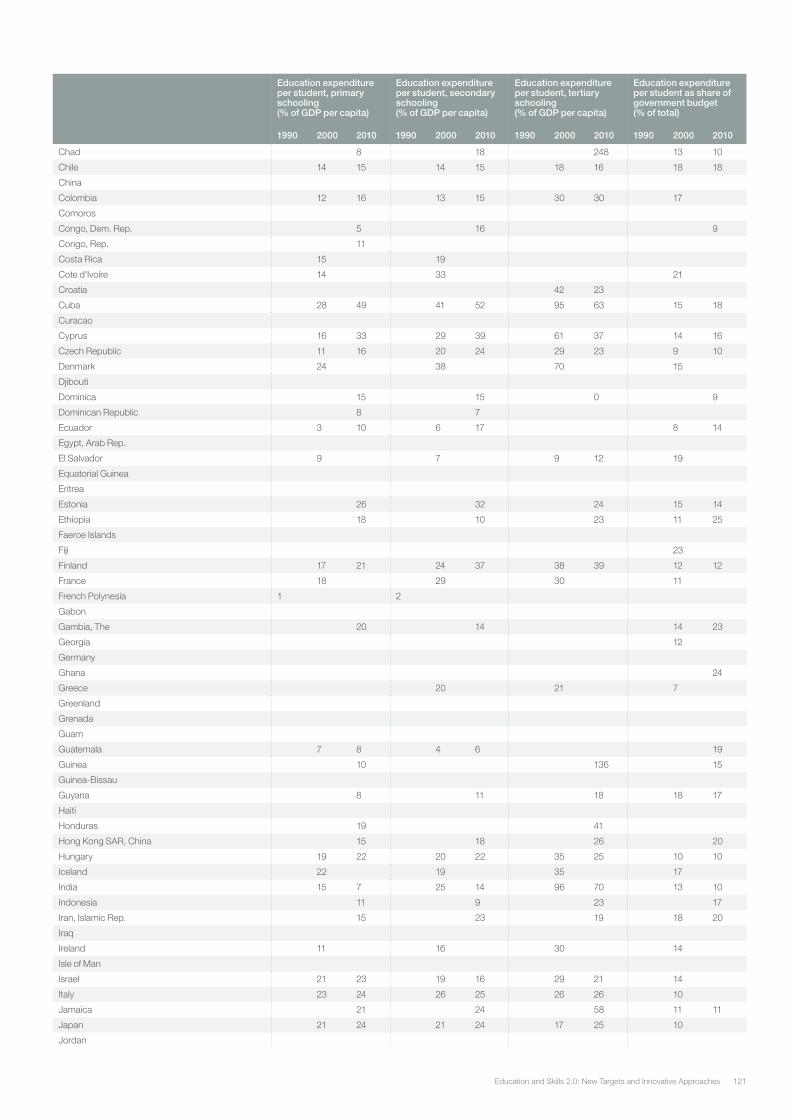
121Education and Skills 2.0: New Targets and Innovative Approaches
Education expenditure per student, primary schooling (% of GDP per capita)
Education expenditure per student, secondary schooling (% of GDP per capita)
Education expenditure per student, tertiary schooling (% of GDP per capita)
Education expenditure per student as share of government budget (% of total)
1990 2000 2010 1990 2000 2010 1990 2000 2010 1990 2000 2010
Chad 8 18 248 13 10
Chile 14 15 14 15 18 16 18 18
China
Colombia 12 16 13 15 30 30 17
Comoros
Congo, Dem. Rep. 5 16 9
Congo, Rep. 11
Costa Rica 15 19
Cote d'Ivoire 14 33 21
Croatia 42 23
Cuba 28 49 41 52 95 63 15 18
Curacao
Cyprus 16 33 29 39 61 37 14 16
Czech Republic 11 16 20 24 29 23 9 10
Denmark 24 38 70 15
Djibouti
Dominica 15 15 0 9
Dominican Republic 8 7
Ecuador 3 10 6 17 8 14
Egypt, Arab Rep.
El Salvador 9 7 9 12 19
Equatorial Guinea
Eritrea
Estonia 26 32 24 15 14
Ethiopia 18 10 23 11 25
Faeroe Islands
Fiji 23
Finland 17 21 24 37 38 39 12 12
France 18 29 30 11
French Polynesia 1 2
Gabon
Gambia, The 20 14 14 23
Georgia 12
Germany
Ghana 24
Greece 20 21 7
Greenland
Grenada
Guam
Guatemala 7 8 4 6 19
Guinea 10 136 15
Guinea-Bissau
Guyana 8 11 18 18 17
Haiti
Honduras 19 41
Hong Kong SAR, China 15 18 26 20
Hungary 19 22 20 22 35 25 10 10
Iceland 22 19 35 17
India 15 7 25 14 96 70 13 10
Indonesia 11 9 23 17
Iran, Islamic Rep. 15 23 19 18 20
Iraq
Ireland 11 16 30 14
Isle of Man
Israel 21 23 19 16 29 21 14
Italy 23 24 26 25 26 26 10
Jamaica 21 24 58 11 11
Japan 21 24 21 24 17 25 10
Jordan
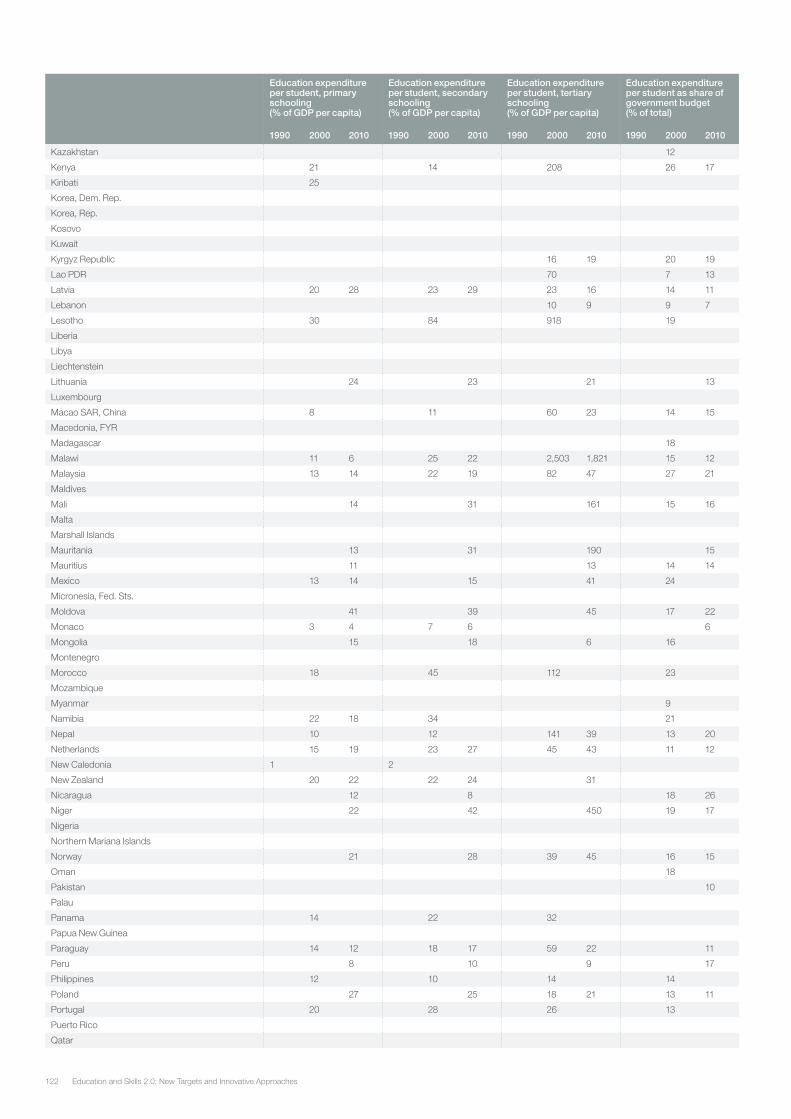
Education and Skills 2.0: New Targets and Innovative Approaches122
Education expenditure per student, primary schooling (% of GDP per capita)
Education expenditure per student, secondary schooling (% of GDP per capita)
Education expenditure per student, tertiary schooling (% of GDP per capita)
Education expenditure per student as share of government budget (% of total)
1990 2000 2010 1990 2000 2010 1990 2000 2010 1990 2000 2010
Kazakhstan 12
Kenya 21 14 208 26 17
Kiribati 25
Korea, Dem. Rep.
Korea, Rep.
Kosovo
Kuwait
Kyrgyz Republic 16 19 20 19
Lao PDR 70 7 13
Latvia 20 28 23 29 23 16 14 11
Lebanon 10 9 9 7
Lesotho 30 84 918 19
Liberia
Libya
Liechtenstein
Lithuania 24 23 21 13
Luxembourg
Macao SAR, China 8 11 60 23 14 15
Macedonia, FYR
Madagascar 18
Malawi 11 6 25 22 2,503 1,821 15 12
Malaysia 13 14 22 19 82 47 27 21
Maldives
Mali 14 31 161 15 16
Malta
Marshall Islands
Mauritania 13 31 190 15
Mauritius 11 13 14 14
Mexico 13 14 15 41 24
Micronesia, Fed. Sts.
Moldova 41 39 45 17 22
Monaco 3 4 7 6 6
Mongolia 15 18 6 16
Montenegro
Morocco 18 45 112 23
Mozambique
Myanmar 9
Namibia 22 18 34 21
Nepal 10 12 141 39 13 20
Netherlands 15 19 23 27 45 43 11 12
New Caledonia 1 2
New Zealand 20 22 22 24 31
Nicaragua 12 8 18 26
Niger 22 42 450 19 17
Nigeria
Northern Mariana Islands
Norway 21 28 39 45 16 15
Oman 18
Pakistan 10
Palau
Panama 14 22 32
Papua New Guinea
Paraguay 14 12 18 17 59 22 11
Peru 8 10 9 17
Philippines 12 10 14 14
Poland 27 25 18 21 13 11
Portugal 20 28 26 13
Puerto Rico
Qatar
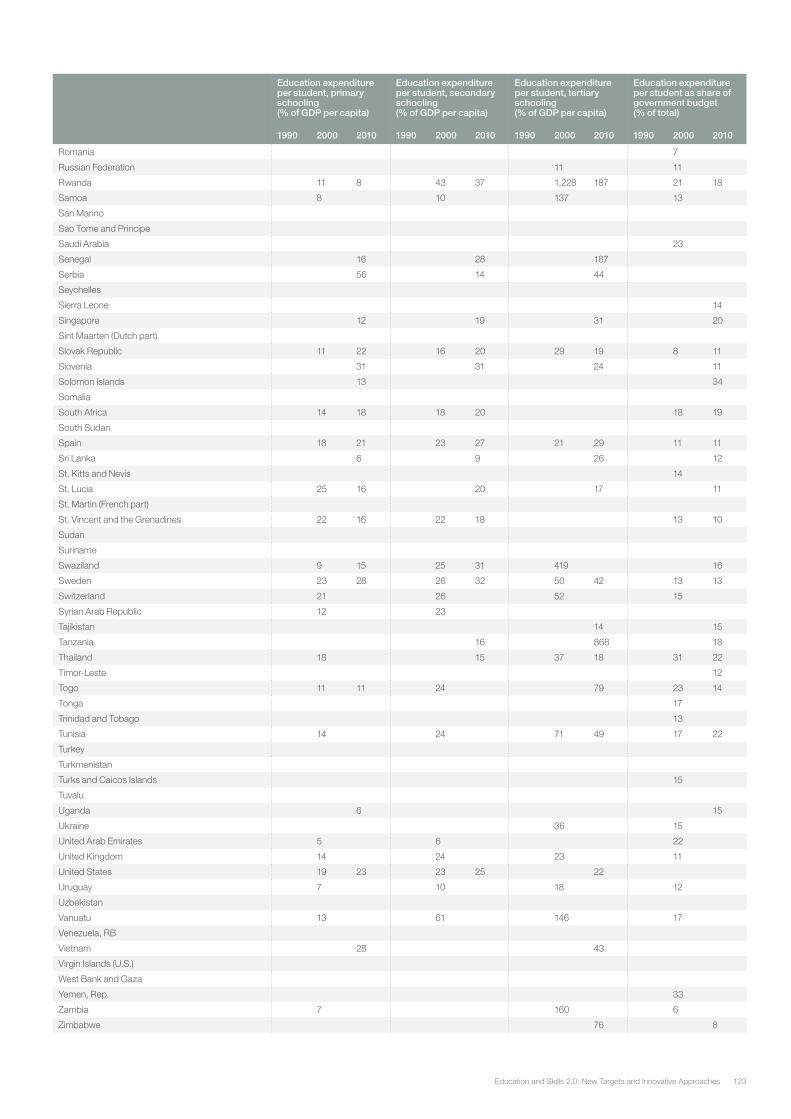
123Education and Skills 2.0: New Targets and Innovative Approaches
Education expenditure per student, primary schooling (% of GDP per capita)
Education expenditure per student, secondary schooling (% of GDP per capita)
Education expenditure per student, tertiary schooling (% of GDP per capita)
Education expenditure per student as share of government budget (% of total)
1990 2000 2010 1990 2000 2010 1990 2000 2010 1990 2000 2010
Romania 7
Russian Federation 11 11
Rwanda 11 8 43 37 1,228 187 21 18
Samoa 8 10 137 13
San Marino
Sao Tome and Principe
Saudi Arabia 23
Senegal 16 28 187
Serbia 56 14 44
Seychelles
Sierra Leone 14
Singapore 12 19 31 20
Sint Maarten (Dutch part)
Slovak Republic 11 22 16 20 29 19 8 11
Slovenia 31 31 24 11
Solomon Islands 13 34
Somalia
South Africa 14 18 18 20 18 19
South Sudan
Spain 18 21 23 27 21 29 11 11
Sri Lanka 6 9 26 12
St. Kitts and Nevis 14
St. Lucia 25 16 20 17 11
St. Martin (French part)
St. Vincent and the Grenadines 22 16 22 18 13 10
Sudan
Suriname
Swaziland 9 15 25 31 419 16
Sweden 23 28 26 32 50 42 13 13
Switzerland 21 26 52 15
Syrian Arab Republic 12 23
Tajikistan 14 15
Tanzania 16 868 18
Thailand 18 15 37 18 31 22
Timor-Leste 12
Togo 11 11 24 79 23 14
Tonga 17
Trinidad and Tobago 13
Tunisia 14 24 71 49 17 22
Turkey
Turkmenistan
Turks and Caicos Islands 15
Tuvalu
Uganda 6 15
Ukraine 36 15
United Arab Emirates 5 6 22
United Kingdom 14 24 23 11
United States 19 23 23 25 22
Uruguay 7 10 18 12
Uzbekistan
Vanuatu 13 61 146 17
Venezuela, RB
Vietnam 28 43
Virgin Islands (U.S.)
West Bank and Gaza
Yemen, Rep. 33
Zambia 7 160 6
Zimbabwe 76 8
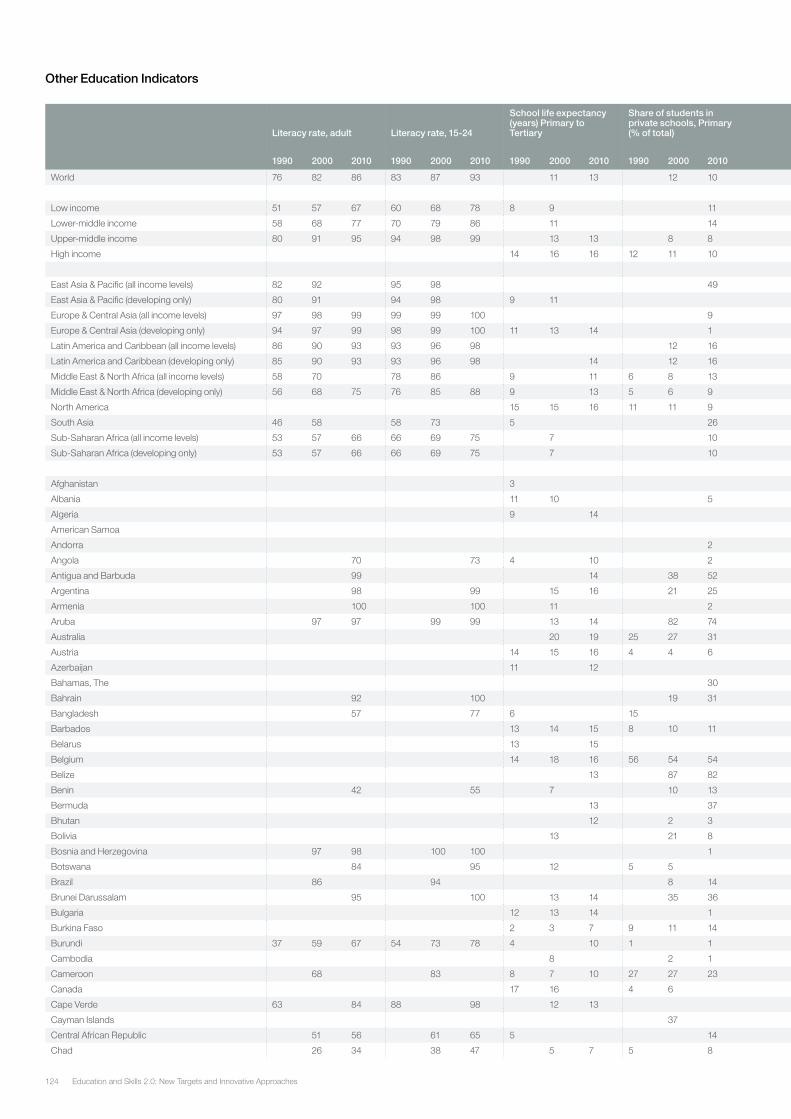
Education and Skills 2.0: New Targets and Innovative Approaches124
Other Education Indicators
Literacy rate, adult Literacy rate, 15-24
School life expectancy (years) Primary to Tertiary
Share of students in private schools, Primary (% of total)
Share of students in private schools, Secondary (% of total)
Gender parity index for gross enrollment ratio, Primary
Gender parity index for gross enrollment ratio, Secondary
Gender parity index for gross enrollment ratio, Tertiary
Pupil-teacher ratio, Primary
Pupil-teacher ratio, Secondary
1990 2000 2010 1990 2000 2010 1990 2000 2010 1990 2000 2010 1990 2000 2010 1990 2000 2010 1990 2000 2010 1990 2000 2010 1990 2000 2010 1990 2000 2010
World 76 82 86 83 87 93 11 13 12 10 28 0.9 0.9 1.0 0.9 1.0 0.9 1.0 28 30 24 22 20
Low income 51 57 67 60 68 78 8 9 11 15 0.8 0.9 0.9 0.7 0.8 0.9 0.7 0.6 30 38 45 30
Lower-middle income 58 68 77 70 79 86 11 14 17 15 0.8 1.0 1.0 0.8 1.0 0.9 28 24 28 17
Upper-middle income 80 91 95 94 98 99 13 13 8 8 45 1.0 1.0 1.0 1.0 1.0 1.2 1.1 26 18 19 16
High income 14 16 16 12 11 10 24 1.0 1.0 1.0 1.0 1.0 1.0 1.0 1.2 1.3 16 15 14
East Asia & Pacific (all income levels) 82 92 95 98 49 1 1.0 1.0 24 26 18 17
East Asia & Pacific (developing only) 80 91 94 98 9 11 52 0.9 1.0 0.8 1.0 1.0 24 27 17 16 18
Europe & Central Asia (all income levels) 97 98 99 99 99 100 9 10 14 1.0 1.0 1.0 1.0 1.2 1.2 17 15 13 12
Europe & Central Asia (developing only) 94 97 99 98 99 100 11 13 14 1 6 9 1.0 1.0 1.0 0.9 0.9 1.0 1.0 1.2 1.1 18 16 12 12
Latin America and Caribbean (all income levels) 86 90 93 93 96 98 12 16 15 1.0 1.0 1.0 1.1 26 24 17 18
Latin America and Caribbean (developing only) 85 90 93 93 96 98 14 12 16 25 15 1.0 1.0 1.0 1.0 1.1 1.2 29 26 24 17 18
Middle East & North Africa (all income levels) 58 70 78 86 9 11 6 8 13 25 0.8 0.9 0.9 0.8 0.9 0.8 0.7 0.8 0.9 25 25 23 19 17
Middle East & North Africa (developing only) 56 68 75 76 85 88 9 13 5 6 9 26 0.8 0.9 1.0 0.7 0.9 0.9 0.8 1.1 26 25 26 19
North America 15 15 16 11 11 9 27 1.0 1.0 1.0 1.0 1.0 1.0 1.2 1.3 1.4 15 14 14
South Asia 46 58 58 73 5 26 5 13 0.7 0.8 1.0 0.5 0.7 0.9 0.5 50 39 40 24 34 26
Sub-Saharan Africa (all income levels) 53 57 66 66 69 75 7 10 0.8 0.8 0.9 0.7 0.8 0.5 42 48 46
Sub-Saharan Africa (developing only) 53 57 66 66 69 75 7 10 0.8 0.8 0.9 0.7 0.8 0.8 0.5 42 48 46 27
Afghanistan 3 0.6 0.7 0.5 0.5 41 44 25
Albania 11 10 5 1.0 1.0 0.9 1.0 1.1 1.4 1.3 23 20 16 15
Algeria 9 14 6 0.8 0.9 0.9 0.8 1.1 1.0 1.5 28 28 23 18
American Samoa
Andorra 2 1.0 10
Angola 70 73 4 10 2 2 0.9 0.8 0.8 0.7 0.2 0.8 46 19 39
Antigua and Barbuda 99 14 38 52 11 0.9 0.9 1.0 2.6 19 15 13 12
Argentina 98 99 15 16 21 25 20 18 1.0 1.0 1.0 1.0 1.1 1.6 1.5 19 11
Armenia 100 100 11 2 27 28 1.0 1.0 1.1 1.3 7
Aruba 97 97 99 99 13 14 82 74 1 1.0 1.0 1.0 1.0 1.5 1.3 19 17 15 14
Australia 20 19 25 27 31 92 1.0 1.0 1.0 1.0 1.0 1.2 1.2 1.4
Austria 14 15 16 4 4 6 24 33 1.0 1.0 1.0 0.9 1.0 1.0 0.9 1.1 1.2 11 11 10 10
Azerbaijan 11 12 8 10 1.0 1.0 1.0 0.7 1.0 19 11
Bahamas, The 30 13 1.0 1.0 1.0 1.1 15 14 12
Bahrain 92 100 19 31 30 1.0 1.0 1.0 1.1 21 18 15 14
Bangladesh 57 77 6 15 14 21 0.8 0.5 1.0 1.1 0.2 0.5 63 43 27 38 28
Barbados 13 14 15 8 10 11 96 95 1.0 1.0 1.0 0.9 1.1 1.1 1.5 2.8 2.4 18 18 13 20 17
Belarus 13 15 6 6 1.0 1.0 1.0 1.0 1.3 1.4 18 15
Belgium 14 18 16 56 54 54 1 1.0 1.0 1.0 1.0 1.1 1.0 1.0 1.1 1.3 12 11 7 10
Belize 13 87 82 59 69 0.9 0.9 1.1 1.6 23 22 23 17
Benin 42 55 7 10 13 77 63 0.5 0.7 0.9 0.4 0.2 31 53 46 23
Bermuda 13 37 16 1.0 1.2 2.1 7 5
Bhutan 12 2 3 45 0.9 1.0 0.8 1.0 0.6 41 26 32 21
Bolivia 13 21 8 11 0.9 1.0 1.0 1.0 25 22
Bosnia and Herzegovina 97 98 100 100 1 29 1.0 1.0 1.3
Botswana 84 95 12 5 5 2 1.1 1.0 1.1 1.1 1.0 32 27 17 17
Brazil 86 94 8 14 4 0.9 1.1 1.3 25 22 17
Brunei Darussalam 95 100 13 14 35 36 14 1.0 1.0 1.1 1.0 1.8 1.8 14 11 11
Bulgaria 12 13 14 1 11 14 1.0 1.0 1.0 1.0 1.0 1.0 1.2 1.4 1.3 17 17 12 12
Burkina Faso 2 3 7 9 11 14 1 1 0.6 0.7 0.9 0.7 0.8 0.3 0.3 0.5 55 49 52 30
Burundi 37 59 67 54 73 78 4 10 1 1 34 42 0.8 0.8 1.0 0.6 0.7 0.4 0.4 0.5 66 55 51 18 30
Cambodia 8 2 1 9 0.9 1.0 0.5 0.3 0.6 35 50 48 18
Cameroon 68 83 8 7 10 27 27 23 1 0.9 0.9 0.9 0.7 0.8 0.8 51 46 26 24
Canada 17 16 4 6 32 1.0 1.0 1.0 1.0 1.2 1.3 16 17 14
Cape Verde 63 84 88 98 12 13 7 1.0 1.0 0.9 1.1 1.2 1.0 1.3 33 29 24 18
Cayman Islands 37 13 1.1 1.0 14 9
Central African Republic 51 56 61 65 5 14 25 0.6 0.7 0.4 0.2 0.2 0.3 90 84 37
Chad 26 34 38 47 5 7 5 8 0.4 0.6 0.7 0.2 0.3 0.4 0.2 0.2 67 69 62 32 32
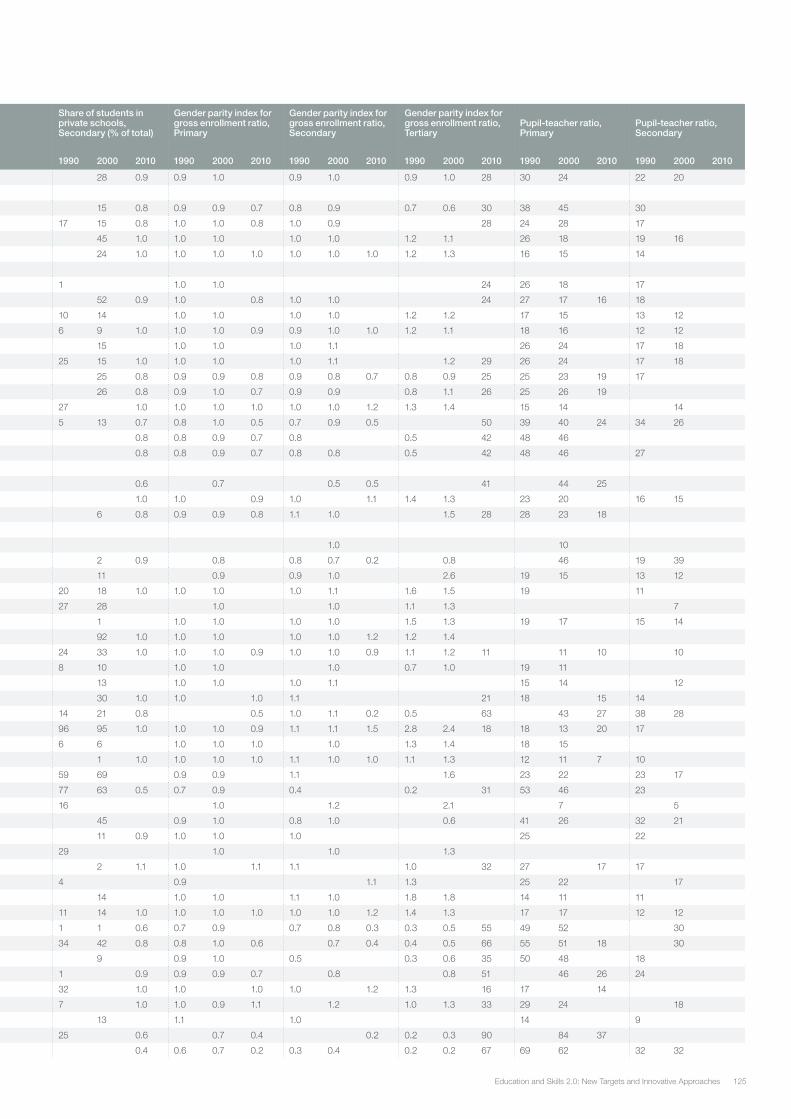
125Education and Skills 2.0: New Targets and Innovative Approaches
Literacy rate, adult Literacy rate, 15-24
School life expectancy (years) Primary to Tertiary
Share of students in private schools, Primary (% of total)
Share of students in private schools, Secondary (% of total)
Gender parity index for gross enrollment ratio, Primary
Gender parity index for gross enrollment ratio, Secondary
Gender parity index for gross enrollment ratio, Tertiary
Pupil-teacher ratio, Primary
Pupil-teacher ratio, Secondary
1990 2000 2010 1990 2000 2010 1990 2000 2010 1990 2000 2010 1990 2000 2010 1990 2000 2010 1990 2000 2010 1990 2000 2010 1990 2000 2010 1990 2000 2010
World 76 82 86 83 87 93 11 13 12 10 28 0.9 0.9 1.0 0.9 1.0 0.9 1.0 28 30 24 22 20
Low income 51 57 67 60 68 78 8 9 11 15 0.8 0.9 0.9 0.7 0.8 0.9 0.7 0.6 30 38 45 30
Lower-middle income 58 68 77 70 79 86 11 14 17 15 0.8 1.0 1.0 0.8 1.0 0.9 28 24 28 17
Upper-middle income 80 91 95 94 98 99 13 13 8 8 45 1.0 1.0 1.0 1.0 1.0 1.2 1.1 26 18 19 16
High income 14 16 16 12 11 10 24 1.0 1.0 1.0 1.0 1.0 1.0 1.0 1.2 1.3 16 15 14
East Asia & Pacific (all income levels) 82 92 95 98 49 1 1.0 1.0 24 26 18 17
East Asia & Pacific (developing only) 80 91 94 98 9 11 52 0.9 1.0 0.8 1.0 1.0 24 27 17 16 18
Europe & Central Asia (all income levels) 97 98 99 99 99 100 9 10 14 1.0 1.0 1.0 1.0 1.2 1.2 17 15 13 12
Europe & Central Asia (developing only) 94 97 99 98 99 100 11 13 14 1 6 9 1.0 1.0 1.0 0.9 0.9 1.0 1.0 1.2 1.1 18 16 12 12
Latin America and Caribbean (all income levels) 86 90 93 93 96 98 12 16 15 1.0 1.0 1.0 1.1 26 24 17 18
Latin America and Caribbean (developing only) 85 90 93 93 96 98 14 12 16 25 15 1.0 1.0 1.0 1.0 1.1 1.2 29 26 24 17 18
Middle East & North Africa (all income levels) 58 70 78 86 9 11 6 8 13 25 0.8 0.9 0.9 0.8 0.9 0.8 0.7 0.8 0.9 25 25 23 19 17
Middle East & North Africa (developing only) 56 68 75 76 85 88 9 13 5 6 9 26 0.8 0.9 1.0 0.7 0.9 0.9 0.8 1.1 26 25 26 19
North America 15 15 16 11 11 9 27 1.0 1.0 1.0 1.0 1.0 1.0 1.2 1.3 1.4 15 14 14
South Asia 46 58 58 73 5 26 5 13 0.7 0.8 1.0 0.5 0.7 0.9 0.5 50 39 40 24 34 26
Sub-Saharan Africa (all income levels) 53 57 66 66 69 75 7 10 0.8 0.8 0.9 0.7 0.8 0.5 42 48 46
Sub-Saharan Africa (developing only) 53 57 66 66 69 75 7 10 0.8 0.8 0.9 0.7 0.8 0.8 0.5 42 48 46 27
Afghanistan 3 0.6 0.7 0.5 0.5 41 44 25
Albania 11 10 5 1.0 1.0 0.9 1.0 1.1 1.4 1.3 23 20 16 15
Algeria 9 14 6 0.8 0.9 0.9 0.8 1.1 1.0 1.5 28 28 23 18
American Samoa
Andorra 2 1.0 10
Angola 70 73 4 10 2 2 0.9 0.8 0.8 0.7 0.2 0.8 46 19 39
Antigua and Barbuda 99 14 38 52 11 0.9 0.9 1.0 2.6 19 15 13 12
Argentina 98 99 15 16 21 25 20 18 1.0 1.0 1.0 1.0 1.1 1.6 1.5 19 11
Armenia 100 100 11 2 27 28 1.0 1.0 1.1 1.3 7
Aruba 97 97 99 99 13 14 82 74 1 1.0 1.0 1.0 1.0 1.5 1.3 19 17 15 14
Australia 20 19 25 27 31 92 1.0 1.0 1.0 1.0 1.0 1.2 1.2 1.4
Austria 14 15 16 4 4 6 24 33 1.0 1.0 1.0 0.9 1.0 1.0 0.9 1.1 1.2 11 11 10 10
Azerbaijan 11 12 8 10 1.0 1.0 1.0 0.7 1.0 19 11
Bahamas, The 30 13 1.0 1.0 1.0 1.1 15 14 12
Bahrain 92 100 19 31 30 1.0 1.0 1.0 1.1 21 18 15 14
Bangladesh 57 77 6 15 14 21 0.8 0.5 1.0 1.1 0.2 0.5 63 43 27 38 28
Barbados 13 14 15 8 10 11 96 95 1.0 1.0 1.0 0.9 1.1 1.1 1.5 2.8 2.4 18 18 13 20 17
Belarus 13 15 6 6 1.0 1.0 1.0 1.0 1.3 1.4 18 15
Belgium 14 18 16 56 54 54 1 1.0 1.0 1.0 1.0 1.1 1.0 1.0 1.1 1.3 12 11 7 10
Belize 13 87 82 59 69 0.9 0.9 1.1 1.6 23 22 23 17
Benin 42 55 7 10 13 77 63 0.5 0.7 0.9 0.4 0.2 31 53 46 23
Bermuda 13 37 16 1.0 1.2 2.1 7 5
Bhutan 12 2 3 45 0.9 1.0 0.8 1.0 0.6 41 26 32 21
Bolivia 13 21 8 11 0.9 1.0 1.0 1.0 25 22
Bosnia and Herzegovina 97 98 100 100 1 29 1.0 1.0 1.3
Botswana 84 95 12 5 5 2 1.1 1.0 1.1 1.1 1.0 32 27 17 17
Brazil 86 94 8 14 4 0.9 1.1 1.3 25 22 17
Brunei Darussalam 95 100 13 14 35 36 14 1.0 1.0 1.1 1.0 1.8 1.8 14 11 11
Bulgaria 12 13 14 1 11 14 1.0 1.0 1.0 1.0 1.0 1.0 1.2 1.4 1.3 17 17 12 12
Burkina Faso 2 3 7 9 11 14 1 1 0.6 0.7 0.9 0.7 0.8 0.3 0.3 0.5 55 49 52 30
Burundi 37 59 67 54 73 78 4 10 1 1 34 42 0.8 0.8 1.0 0.6 0.7 0.4 0.4 0.5 66 55 51 18 30
Cambodia 8 2 1 9 0.9 1.0 0.5 0.3 0.6 35 50 48 18
Cameroon 68 83 8 7 10 27 27 23 1 0.9 0.9 0.9 0.7 0.8 0.8 51 46 26 24
Canada 17 16 4 6 32 1.0 1.0 1.0 1.0 1.2 1.3 16 17 14
Cape Verde 63 84 88 98 12 13 7 1.0 1.0 0.9 1.1 1.2 1.0 1.3 33 29 24 18
Cayman Islands 37 13 1.1 1.0 14 9
Central African Republic 51 56 61 65 5 14 25 0.6 0.7 0.4 0.2 0.2 0.3 90 84 37
Chad 26 34 38 47 5 7 5 8 0.4 0.6 0.7 0.2 0.3 0.4 0.2 0.2 67 69 62 32 32
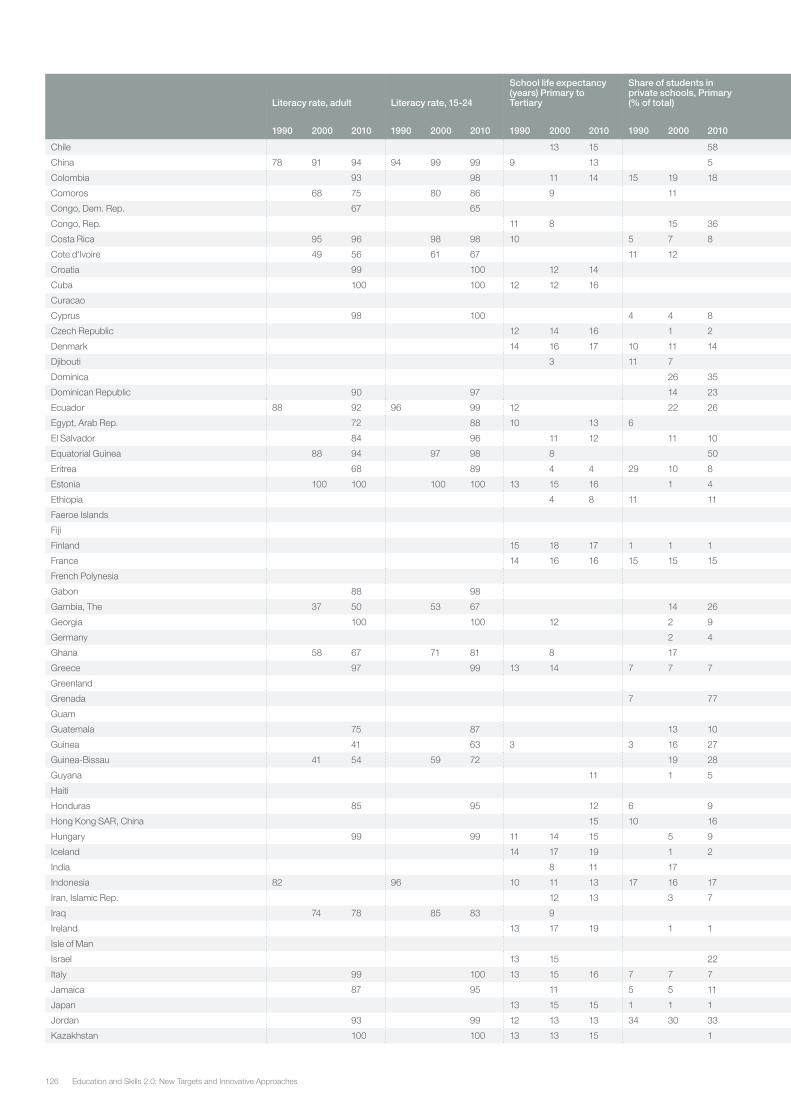
Education and Skills 2.0: New Targets and Innovative Approaches126
Literacy rate, adult Literacy rate, 15-24
School life expectancy (years) Primary to Tertiary
Share of students in private schools, Primary (% of total)
Share of students in private schools, Secondary (% of total)
Gender parity index for gross enrollment ratio, Primary
Gender parity index for gross enrollment ratio, Secondary
Gender parity index for gross enrollment ratio, Tertiary
Pupil-teacher ratio, Primary
Pupil-teacher ratio, Secondary
1990 2000 2010 1990 2000 2010 1990 2000 2010 1990 2000 2010 1990 2000 2010 1990 2000 2010 1990 2000 2010 1990 2000 2010 1990 2000 2010 1990 2000 2010
Chile 13 15 58 15 15 1.0 1.0 1.0 1.1 1.0 1.0 0.9 1.1 32 23 29 22
China 78 91 94 94 99 99 9 13 5 58 0.9 1.0 0.7 1.0 1.1 22 17 15 17 15
Colombia 93 98 11 14 15 19 18 10 1.1 1.0 1.0 1.1 1.1 1.1 1.1 30 26 28 19 27
Comoros 68 75 80 86 9 11 30 21 0.7 0.9 0.8 0.2 0.7 0.7 36 37
Congo, Dem. Rep. 67 65 45 0.7 0.9 0.6 37 16
Congo, Rep. 11 8 15 36 16 0.9 0.9 1.0 0.8 0.7 0.2 0.3 64 60 49 27
Costa Rica 95 96 98 98 10 5 7 8 1.0 1.0 1.0 1.1 1.1 1.1 32 25 18 19 19 16
Cote d'Ivoire 49 56 61 67 11 12 13 10 0.7 0.7 0.5 36 45
Croatia 99 100 12 14 1.0 1.0 1.0 1.1 1.2 1.3 19 14 12 8
Cuba 100 100 12 12 16 1 1 1.0 1.0 1.0 1.1 1.0 1.0 1.4 1.2 1.7 12 11 9 10 12 9
Curacao
Cyprus 98 100 4 4 8 1.0 1.0 1.0 1.0 1.0 1.0 1.4 1.3 0.9 21 18 14 12 14 10
Czech Republic 12 14 16 1 2 10 17 1.0 1.0 1.0 0.9 1.0 1.0 0.8 1.0 1.4 24 17 19 13 11
Denmark 14 16 17 10 11 14 6 1.0 1.0 1.0 1.0 1.0 1.0 1.1 1.4 1.4 11 10 10
Djibouti 3 11 7 11 14 0.7 0.7 0.7 0.9 0.7 44 28
Dominica 26 35 9 0.9 1.0 1.0 1.2 1.1 1.1 20 16 21 13
Dominican Republic 90 97 14 23 29 1.0 0.9 1.2 1.1 31 26 28
Ecuador 88 92 96 99 12 22 26 23 22 1.0 1.0 1.0 1.0 30 23 19 14 11
Egypt, Arab Rep. 72 88 10 13 6 24 33 0.8 0.9 1.0 0.8 0.9 1.0 0.5 0.9 25 23 28 21 17
El Salvador 84 96 11 12 11 10 1.0 1.0 1.0 1.0 1.1 1.2
Equatorial Guinea 88 94 97 98 8 50 23 16 1.0 1.0 0.4 0.4 43 27 23
Eritrea 68 89 4 4 29 10 8 0.9 0.8 0.8 0.7 0.8 0.2 0.4 38 48 38 54 39
Estonia 100 100 100 100 13 15 16 1 4 6 5 1.0 1.0 1.0 1.0 1.0 1.4 1.6 14 12 10 9
Ethiopia 4 8 11 11 1 3 0.7 0.6 0.9 0.7 0.8 0.2 0.3 0.4 41 67 54 43
Faeroe Islands 14
Fiji 1.0 1.1 28 20
Finland 15 18 17 1 1 1 1.0 1.0 1.0 1.2 1.1 1.0 1.1 1.2 1.2 17 14 13 10
France 14 16 16 15 15 15 8 8 1.0 1.0 1.0 1.1 1.0 1.0 1.1 1.2 1.3 19 18 12 12 13
French Polynesia 25 26
Gabon 88 98
Gambia, The 37 50 53 67 14 26 0.9 1.0 0.5 0.9 0.3 31 37
Georgia 100 100 12 2 9 1.0 1.0 1.0 1.0 1.3 17 8 7
Germany 2 4 1.0 1.0 1.0 0.9 15 13 14 13
Ghana 58 67 71 81 8 17 7 8 0.8 0.9 0.7 0.8 27 34 18 19
Greece 97 99 13 14 7 7 7 10 1.0 1.0 1.0 1.0 1.1 1.0 1.0 1.1 20 13 15 10
Greenland 6 5
Grenada 7 77 1.0 1.0 1.1 1.0 25 20 16 15
Guam 62
Guatemala 75 87 13 10 0.9 1.0 0.9 0.9 33 27 14 14
Guinea 41 63 3 3 16 27 62 0.5 0.7 0.8 0.3 0.1 0.3 38 46 42
Guinea-Bissau 41 54 59 72 19 28 0.7 0.9 0.6 44 52 15
Guyana 11 1 5 13 1.0 1.0 1.1 0.7 2.5 26 25 21
Haiti 6
Honduras 85 95 12 6 9 1.0 1.0 1.0 1.2 0.8 1.3 1.1 35 34
Hong Kong SAR, China 15 10 16 25 1.0 1.0 1.0 1.0 22 15
Hungary 99 99 11 14 15 5 9 17 1.0 1.0 1.0 1.0 1.0 1.0 1.1 1.2 1.3 11 11 10 10
Iceland 14 17 19 1 2 7 13 1.0 1.0 1.1 1.0 1.3 1.7 1.8
India 8 11 17 4 12 0.7 0.8 1.0 0.7 0.9 0.5 0.7 0.7 40 34 25
Indonesia 82 96 10 11 13 17 16 17 42 1.0 1.0 1.0 0.8 1.0 1.0 0.9 0.9 23 22 16 13 16 12
Iran, Islamic Rep. 12 13 3 7 43 42 0.9 0.9 1.0 0.7 0.9 1.0 0.9 1.0 26
Iraq 74 78 85 83 9 11 0.8 0.6 0.5 21 20
Ireland 13 17 19 1 1 1.0 1.0 1.0 1.1 1.1 1.0 0.9 1.2 1.2 27 16 17
Isle of Man 1 1
Israel 13 15 22 1.0 1.0 1.0 1.1 1.0 1.0 1.0 1.4 14 14 13 11 11
Italy 99 100 13 15 16 7 7 7 11 1.0 1.0 1.0 1.0 1.0 1.0 1.0 1.3 1.4 12 11 9 10
Jamaica 87 95 11 5 5 11 5 8 1.0 1.0 1.0 1.0 1.0 1.8 34 34 21 19 15
Japan 13 15 15 1 1 1 6 1.0 1.0 1.0 1.0 1.0 1.0 0.7 0.9 0.9 21 21 18 17 14 12
Jordan 93 99 12 13 13 34 30 33 18 19 1.0 1.0 1.0 1.0 1.0 1.1 1.3 1.2 1.2
Kazakhstan 100 100 13 13 15 1 16 19 1.0 1.0 1.0 1.0 1.2 1.4 22 19 16 11 9
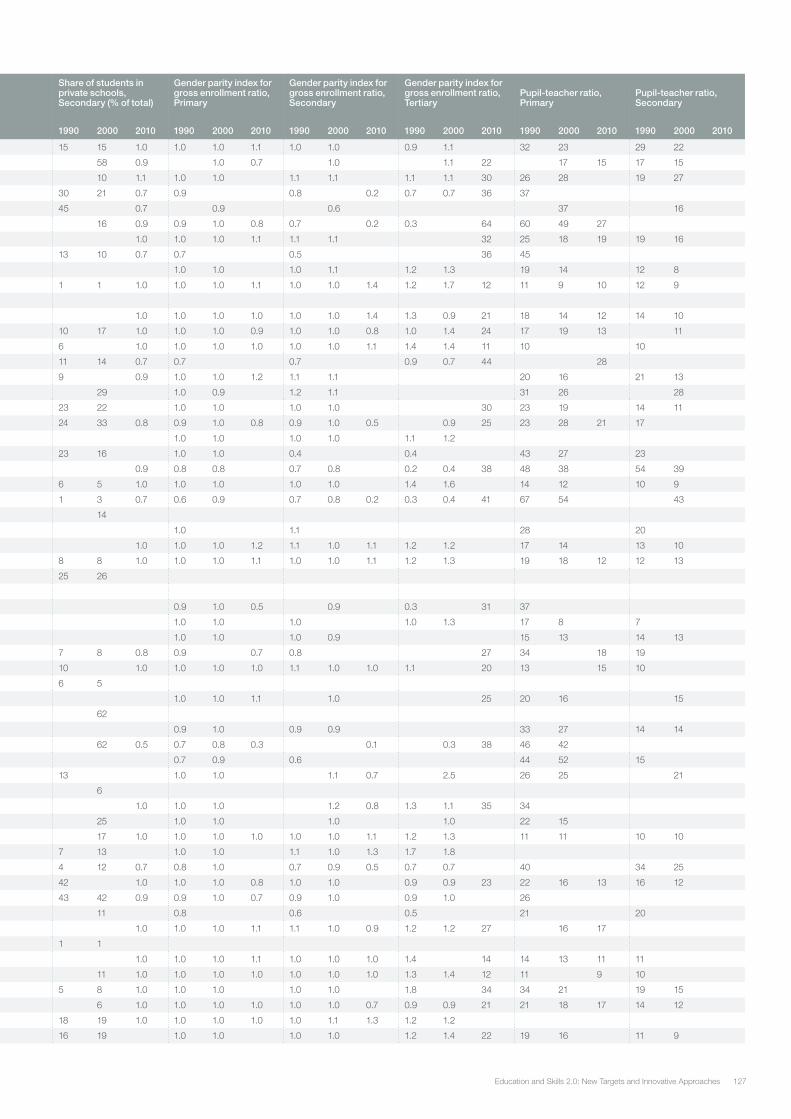
127Education and Skills 2.0: New Targets and Innovative Approaches
Literacy rate, adult Literacy rate, 15-24
School life expectancy (years) Primary to Tertiary
Share of students in private schools, Primary (% of total)
Share of students in private schools, Secondary (% of total)
Gender parity index for gross enrollment ratio, Primary
Gender parity index for gross enrollment ratio, Secondary
Gender parity index for gross enrollment ratio, Tertiary
Pupil-teacher ratio, Primary
Pupil-teacher ratio, Secondary
1990 2000 2010 1990 2000 2010 1990 2000 2010 1990 2000 2010 1990 2000 2010 1990 2000 2010 1990 2000 2010 1990 2000 2010 1990 2000 2010 1990 2000 2010
Chile 13 15 58 15 15 1.0 1.0 1.0 1.1 1.0 1.0 0.9 1.1 32 23 29 22
China 78 91 94 94 99 99 9 13 5 58 0.9 1.0 0.7 1.0 1.1 22 17 15 17 15
Colombia 93 98 11 14 15 19 18 10 1.1 1.0 1.0 1.1 1.1 1.1 1.1 30 26 28 19 27
Comoros 68 75 80 86 9 11 30 21 0.7 0.9 0.8 0.2 0.7 0.7 36 37
Congo, Dem. Rep. 67 65 45 0.7 0.9 0.6 37 16
Congo, Rep. 11 8 15 36 16 0.9 0.9 1.0 0.8 0.7 0.2 0.3 64 60 49 27
Costa Rica 95 96 98 98 10 5 7 8 1.0 1.0 1.0 1.1 1.1 1.1 32 25 18 19 19 16
Cote d'Ivoire 49 56 61 67 11 12 13 10 0.7 0.7 0.5 36 45
Croatia 99 100 12 14 1.0 1.0 1.0 1.1 1.2 1.3 19 14 12 8
Cuba 100 100 12 12 16 1 1 1.0 1.0 1.0 1.1 1.0 1.0 1.4 1.2 1.7 12 11 9 10 12 9
Curacao
Cyprus 98 100 4 4 8 1.0 1.0 1.0 1.0 1.0 1.0 1.4 1.3 0.9 21 18 14 12 14 10
Czech Republic 12 14 16 1 2 10 17 1.0 1.0 1.0 0.9 1.0 1.0 0.8 1.0 1.4 24 17 19 13 11
Denmark 14 16 17 10 11 14 6 1.0 1.0 1.0 1.0 1.0 1.0 1.1 1.4 1.4 11 10 10
Djibouti 3 11 7 11 14 0.7 0.7 0.7 0.9 0.7 44 28
Dominica 26 35 9 0.9 1.0 1.0 1.2 1.1 1.1 20 16 21 13
Dominican Republic 90 97 14 23 29 1.0 0.9 1.2 1.1 31 26 28
Ecuador 88 92 96 99 12 22 26 23 22 1.0 1.0 1.0 1.0 30 23 19 14 11
Egypt, Arab Rep. 72 88 10 13 6 24 33 0.8 0.9 1.0 0.8 0.9 1.0 0.5 0.9 25 23 28 21 17
El Salvador 84 96 11 12 11 10 1.0 1.0 1.0 1.0 1.1 1.2
Equatorial Guinea 88 94 97 98 8 50 23 16 1.0 1.0 0.4 0.4 43 27 23
Eritrea 68 89 4 4 29 10 8 0.9 0.8 0.8 0.7 0.8 0.2 0.4 38 48 38 54 39
Estonia 100 100 100 100 13 15 16 1 4 6 5 1.0 1.0 1.0 1.0 1.0 1.4 1.6 14 12 10 9
Ethiopia 4 8 11 11 1 3 0.7 0.6 0.9 0.7 0.8 0.2 0.3 0.4 41 67 54 43
Faeroe Islands 14
Fiji 1.0 1.1 28 20
Finland 15 18 17 1 1 1 1.0 1.0 1.0 1.2 1.1 1.0 1.1 1.2 1.2 17 14 13 10
France 14 16 16 15 15 15 8 8 1.0 1.0 1.0 1.1 1.0 1.0 1.1 1.2 1.3 19 18 12 12 13
French Polynesia 25 26
Gabon 88 98
Gambia, The 37 50 53 67 14 26 0.9 1.0 0.5 0.9 0.3 31 37
Georgia 100 100 12 2 9 1.0 1.0 1.0 1.0 1.3 17 8 7
Germany 2 4 1.0 1.0 1.0 0.9 15 13 14 13
Ghana 58 67 71 81 8 17 7 8 0.8 0.9 0.7 0.8 27 34 18 19
Greece 97 99 13 14 7 7 7 10 1.0 1.0 1.0 1.0 1.1 1.0 1.0 1.1 20 13 15 10
Greenland 6 5
Grenada 7 77 1.0 1.0 1.1 1.0 25 20 16 15
Guam 62
Guatemala 75 87 13 10 0.9 1.0 0.9 0.9 33 27 14 14
Guinea 41 63 3 3 16 27 62 0.5 0.7 0.8 0.3 0.1 0.3 38 46 42
Guinea-Bissau 41 54 59 72 19 28 0.7 0.9 0.6 44 52 15
Guyana 11 1 5 13 1.0 1.0 1.1 0.7 2.5 26 25 21
Haiti 6
Honduras 85 95 12 6 9 1.0 1.0 1.0 1.2 0.8 1.3 1.1 35 34
Hong Kong SAR, China 15 10 16 25 1.0 1.0 1.0 1.0 22 15
Hungary 99 99 11 14 15 5 9 17 1.0 1.0 1.0 1.0 1.0 1.0 1.1 1.2 1.3 11 11 10 10
Iceland 14 17 19 1 2 7 13 1.0 1.0 1.1 1.0 1.3 1.7 1.8
India 8 11 17 4 12 0.7 0.8 1.0 0.7 0.9 0.5 0.7 0.7 40 34 25
Indonesia 82 96 10 11 13 17 16 17 42 1.0 1.0 1.0 0.8 1.0 1.0 0.9 0.9 23 22 16 13 16 12
Iran, Islamic Rep. 12 13 3 7 43 42 0.9 0.9 1.0 0.7 0.9 1.0 0.9 1.0 26
Iraq 74 78 85 83 9 11 0.8 0.6 0.5 21 20
Ireland 13 17 19 1 1 1.0 1.0 1.0 1.1 1.1 1.0 0.9 1.2 1.2 27 16 17
Isle of Man 1 1
Israel 13 15 22 1.0 1.0 1.0 1.1 1.0 1.0 1.0 1.4 14 14 13 11 11
Italy 99 100 13 15 16 7 7 7 11 1.0 1.0 1.0 1.0 1.0 1.0 1.0 1.3 1.4 12 11 9 10
Jamaica 87 95 11 5 5 11 5 8 1.0 1.0 1.0 1.0 1.0 1.8 34 34 21 19 15
Japan 13 15 15 1 1 1 6 1.0 1.0 1.0 1.0 1.0 1.0 0.7 0.9 0.9 21 21 18 17 14 12
Jordan 93 99 12 13 13 34 30 33 18 19 1.0 1.0 1.0 1.0 1.0 1.1 1.3 1.2 1.2
Kazakhstan 100 100 13 13 15 1 16 19 1.0 1.0 1.0 1.0 1.2 1.4 22 19 16 11 9
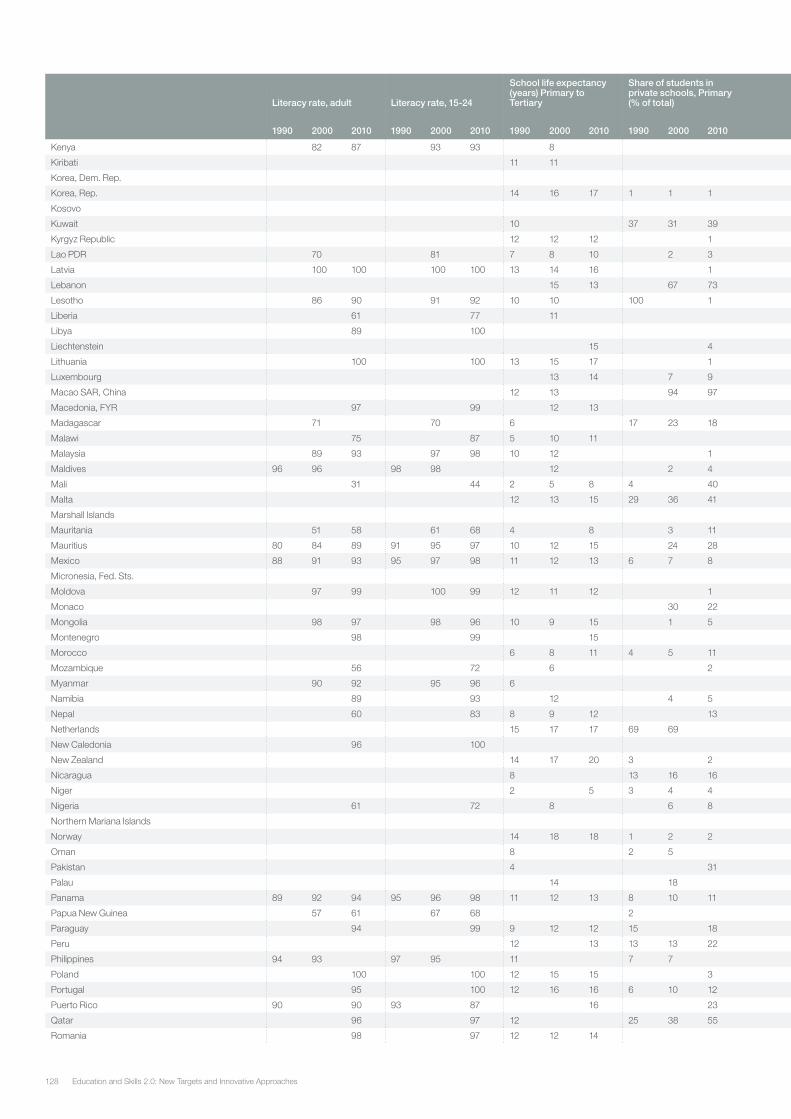
Education and Skills 2.0: New Targets and Innovative Approaches128
Literacy rate, adult Literacy rate, 15-24
School life expectancy (years) Primary to Tertiary
Share of students in private schools, Primary (% of total)
Share of students in private schools, Secondary (% of total)
Gender parity index for gross enrollment ratio, Primary
Gender parity index for gross enrollment ratio, Secondary
Gender parity index for gross enrollment ratio, Tertiary
Pupil-teacher ratio, Primary
Pupil-teacher ratio, Secondary
1990 2000 2010 1990 2000 2010 1990 2000 2010 1990 2000 2010 1990 2000 2010 1990 2000 2010 1990 2000 2010 1990 2000 2010 1990 2000 2010 1990 2000 2010
Kenya 82 87 93 93 8 1 1 1.0 1.0 1.0 0.5 34
Kiribati 11 11 1.0 1.0 0.9 1.3 29 32 12
Korea, Dem. Rep.
Korea, Rep. 14 16 17 1 1 1 1.0 1.0 1.0 1.0 1.0 1.0 0.5 0.6 0.7 36 32 21 28 21 18
Kosovo 40 32
Kuwait 10 37 31 39 1.0 1.0 0.9 1.0 1.3 18 14 8 13 11 8
Kyrgyz Republic 12 12 12 1 27 32 1.0 1.0 1.0 1.0 1.0 1.0 1.0 1.3 16 24 24 13 15
Lao PDR 70 81 7 8 10 2 3 1 0.8 0.9 0.9 0.7 0.7 0.8 0.5 0.5 0.8 28 30 29 12 21 20
Latvia 100 100 100 100 13 14 16 1 1 3 1.1 1.0 1.0 1.0 1.0 1.4 1.8 1.7 15 15 12 10 11 9
Lebanon 15 13 67 73 1 1.0 1.0 1.1 1.1 1.0 1.2 14 14 9
Lesotho 86 90 91 92 10 10 100 1 55 60 1.2 1.0 1.0 1.5 1.3 1.4 1.3 1.6 55 48 34 22 24
Liberia 61 77 11 1 0.7 0.7 0.6 38 26
Libya 89 100 1.0
Liechtenstein 15 4 0.9 0.9 0.6 6
Lithuania 100 100 13 15 17 1 4 1.0 1.0 1.0 1.0 0.7 1.5 1.5 19 16 13 11 9
Luxembourg 13 14 7 9 1 1.0 1.0 1.1 1.0 1.1 9 11 8
Macao SAR, China 12 13 94 97 18 18 1.0 1.0 1.1 1.0 0.9 0.4 0.9 1.0 30 16 24 16
Macedonia, FYR 97 99 12 13 93 95
Madagascar 71 70 6 17 23 18 1.0 1.0 1.0 0.9 0.8 0.9 0.9 40 48 40 22
Malawi 75 87 5 10 11 0.9 1.0 1.0 0.6 0.8 0.9 0.3 0.4 0.6 79 43
Malaysia 89 93 97 98 10 12 1 1.0 1.0 1.1 1.1 1.1 1.1 1.3 20 20 13 19 18 14
Maldives 96 96 98 98 12 2 4 6 4 1.0 1.0 1.1 23 12 15
Mali 31 44 2 5 8 4 40 17 0.6 0.8 0.9 0.5 0.6 0.7 0.2 0.5 0.4 45 65 50 29
Malta 12 13 15 29 36 41 32 1.0 1.0 1.0 0.9 1.0 0.9 0.8 1.2 1.4 21 19 14 12 10 9
Marshall Islands 27 29 1.0
Mauritania 51 58 61 68 4 8 3 11 0.7 1.0 1.1 0.5 0.7 0.8 0.1 0.4 44 45 37 26
Mauritius 80 84 89 91 95 97 10 12 15 24 28 27 1.0 1.0 1.0 0.6 0.9 1.2 21 26 21 19
Mexico 88 91 93 95 97 98 11 12 13 6 7 8 68 1.0 1.0 1.0 1.0 1.0 1.1 0.9 1.0 31 27 28 17 17 18
Micronesia, Fed. Sts. 16 14
Moldova 97 99 100 99 12 11 12 1 1.0 1.0 1.0 1.1 1.0 1.0 1.3 1.3 24 21 15 13 13 10
Monaco 30 22 1
Mongolia 98 97 98 96 10 9 15 1 5 24 22 1.0 1.0 1.2 1.1 1.8 1.5 30 33 30 19 20 14
Montenegro 98 99 15 7 1.0 1.0 1.2
Morocco 6 8 11 4 5 11 0.7 0.8 0.9 0.7 0.8 0.9 0.6 0.7 0.9 25 29 26 18 17
Mozambique 56 72 6 2 5 0.8 0.8 0.9 0.6 0.6 0.8 55 64 58 34 34
Myanmar 90 92 95 96 6 12 0.9 1.0 1.0 0.9 1.1 1.1 45 33 28 12 32 34
Namibia 89 93 12 4 5 1.1 1.0 1.0 1.3 1.1 32 30 24
Nepal 60 83 8 9 12 13 4 0.6 0.8 0.4 0.7 0.3 0.4 39 38 32 31 30 32
Netherlands 15 17 17 69 69 1.0 1.0 1.0 0.9 1.0 1.0 0.8 1.0 1.1 17 16 14
New Caledonia 96 100 83
New Zealand 14 17 20 3 2 1.0 1.0 1.0 1.0 1.1 1.0 1.1 1.5 1.5 18 18 14 16 15
Nicaragua 8 13 16 16 10 19 1.1 1.0 1.0 1.2 1.1 1.1 33 36 30 32 31
Niger 2 5 3 4 4 30 22 0.6 0.7 0.8 0.4 0.6 0.7 0.1 0.4 41 41 39 26 23 31
Nigeria 61 72 8 6 8 0.8 0.8 0.9 0.8 0.8 0.9 41 43 36 22 31 33
Northern Mariana Islands 22
Norway 14 18 18 1 2 2 1.0 1.0 1.0 1.0 1.0 1.0 1.2 1.5 1.6
Oman 8 2 5 7 8 0.9 1.0 0.7 1.0 0.9 1.4 28 25 15 18
Pakistan 4 31 1 0.5 0.7 0.8 0.4 0.8 0.4 41 33 40 19
Palau 14 18 31 1.0 1.0 2.4 16 15
Panama 89 92 94 95 96 98 11 12 13 8 10 11 29 1.0 1.0 1.0 1.1 1.1 1.1 1.7 1.5 23 25 23 20 16 15
Papua New Guinea 57 61 67 68 2 16 16 0.8 0.9 0.7 32 35
Paraguay 94 99 9 12 12 15 18 1.0 1.0 1.0 1.0 1.0 1.0 1.4 1.4 25 12
Peru 12 13 13 13 22 28 22 1.0 1.0 0.9 1.0 1.1 29 29 20 20 20 16
Philippines 94 93 97 95 11 7 7 17 24 1.0 1.0 33 35 33
Poland 100 100 12 15 15 3 1.0 1.0 1.0 1.1 1.0 1.0 1.5 1.4 1.5 9 10
Portugal 95 100 12 16 16 6 10 12 5 4 1.0 1.0 1.0 1.0 1.1 1.0 1.3 1.2 15 13 11 10 7
Puerto Rico 90 90 93 87 16 23 12 16 1.0 1.1 1.5 12 11
Qatar 96 97 12 25 38 55 21 0.9 1.0 1.0 1.3 1.2 1.2 3.6 5.4 12 13 12 9 10 10
Romania 98 97 12 12 14 39 1.0 1.0 1.0 1.0 1.0 1.0 1.0 1.1 1.3 19 16 13 12
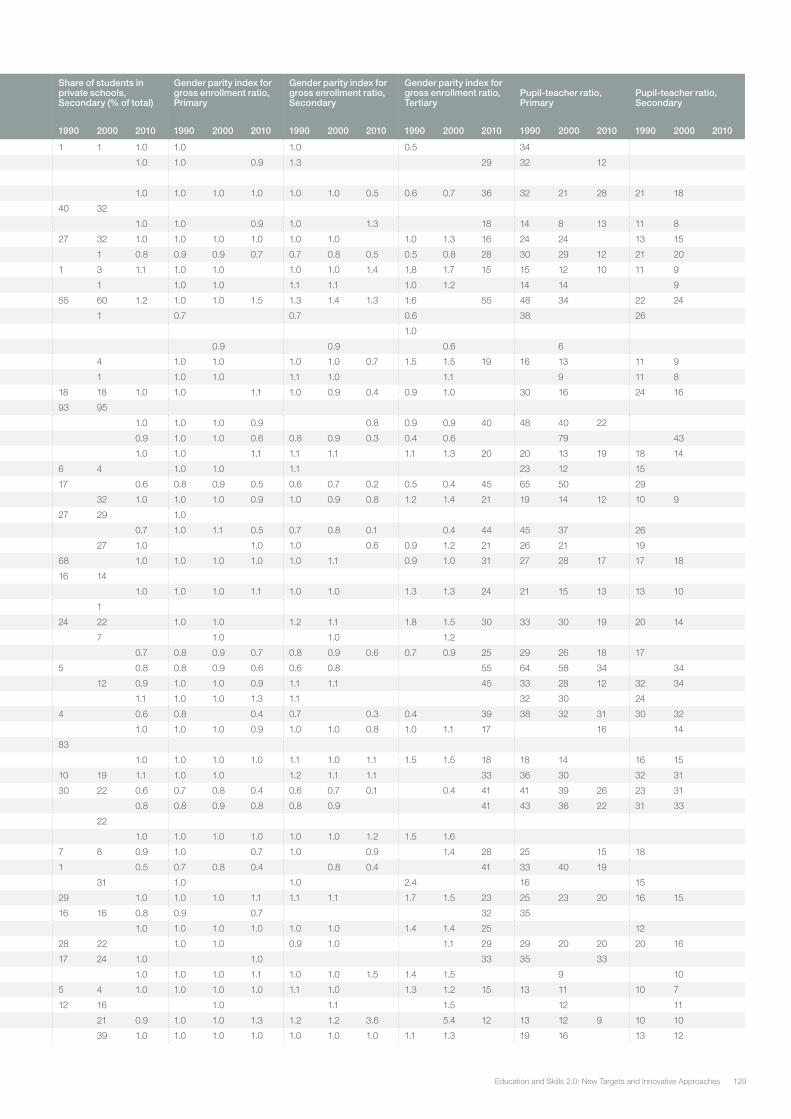
129Education and Skills 2.0: New Targets and Innovative Approaches
Literacy rate, adult Literacy rate, 15-24
School life expectancy (years) Primary to Tertiary
Share of students in private schools, Primary (% of total)
Share of students in private schools, Secondary (% of total)
Gender parity index for gross enrollment ratio, Primary
Gender parity index for gross enrollment ratio, Secondary
Gender parity index for gross enrollment ratio, Tertiary
Pupil-teacher ratio, Primary
Pupil-teacher ratio, Secondary
1990 2000 2010 1990 2000 2010 1990 2000 2010 1990 2000 2010 1990 2000 2010 1990 2000 2010 1990 2000 2010 1990 2000 2010 1990 2000 2010 1990 2000 2010
Kenya 82 87 93 93 8 1 1 1.0 1.0 1.0 0.5 34
Kiribati 11 11 1.0 1.0 0.9 1.3 29 32 12
Korea, Dem. Rep.
Korea, Rep. 14 16 17 1 1 1 1.0 1.0 1.0 1.0 1.0 1.0 0.5 0.6 0.7 36 32 21 28 21 18
Kosovo 40 32
Kuwait 10 37 31 39 1.0 1.0 0.9 1.0 1.3 18 14 8 13 11 8
Kyrgyz Republic 12 12 12 1 27 32 1.0 1.0 1.0 1.0 1.0 1.0 1.0 1.3 16 24 24 13 15
Lao PDR 70 81 7 8 10 2 3 1 0.8 0.9 0.9 0.7 0.7 0.8 0.5 0.5 0.8 28 30 29 12 21 20
Latvia 100 100 100 100 13 14 16 1 1 3 1.1 1.0 1.0 1.0 1.0 1.4 1.8 1.7 15 15 12 10 11 9
Lebanon 15 13 67 73 1 1.0 1.0 1.1 1.1 1.0 1.2 14 14 9
Lesotho 86 90 91 92 10 10 100 1 55 60 1.2 1.0 1.0 1.5 1.3 1.4 1.3 1.6 55 48 34 22 24
Liberia 61 77 11 1 0.7 0.7 0.6 38 26
Libya 89 100 1.0
Liechtenstein 15 4 0.9 0.9 0.6 6
Lithuania 100 100 13 15 17 1 4 1.0 1.0 1.0 1.0 0.7 1.5 1.5 19 16 13 11 9
Luxembourg 13 14 7 9 1 1.0 1.0 1.1 1.0 1.1 9 11 8
Macao SAR, China 12 13 94 97 18 18 1.0 1.0 1.1 1.0 0.9 0.4 0.9 1.0 30 16 24 16
Macedonia, FYR 97 99 12 13 93 95
Madagascar 71 70 6 17 23 18 1.0 1.0 1.0 0.9 0.8 0.9 0.9 40 48 40 22
Malawi 75 87 5 10 11 0.9 1.0 1.0 0.6 0.8 0.9 0.3 0.4 0.6 79 43
Malaysia 89 93 97 98 10 12 1 1.0 1.0 1.1 1.1 1.1 1.1 1.3 20 20 13 19 18 14
Maldives 96 96 98 98 12 2 4 6 4 1.0 1.0 1.1 23 12 15
Mali 31 44 2 5 8 4 40 17 0.6 0.8 0.9 0.5 0.6 0.7 0.2 0.5 0.4 45 65 50 29
Malta 12 13 15 29 36 41 32 1.0 1.0 1.0 0.9 1.0 0.9 0.8 1.2 1.4 21 19 14 12 10 9
Marshall Islands 27 29 1.0
Mauritania 51 58 61 68 4 8 3 11 0.7 1.0 1.1 0.5 0.7 0.8 0.1 0.4 44 45 37 26
Mauritius 80 84 89 91 95 97 10 12 15 24 28 27 1.0 1.0 1.0 0.6 0.9 1.2 21 26 21 19
Mexico 88 91 93 95 97 98 11 12 13 6 7 8 68 1.0 1.0 1.0 1.0 1.0 1.1 0.9 1.0 31 27 28 17 17 18
Micronesia, Fed. Sts. 16 14
Moldova 97 99 100 99 12 11 12 1 1.0 1.0 1.0 1.1 1.0 1.0 1.3 1.3 24 21 15 13 13 10
Monaco 30 22 1
Mongolia 98 97 98 96 10 9 15 1 5 24 22 1.0 1.0 1.2 1.1 1.8 1.5 30 33 30 19 20 14
Montenegro 98 99 15 7 1.0 1.0 1.2
Morocco 6 8 11 4 5 11 0.7 0.8 0.9 0.7 0.8 0.9 0.6 0.7 0.9 25 29 26 18 17
Mozambique 56 72 6 2 5 0.8 0.8 0.9 0.6 0.6 0.8 55 64 58 34 34
Myanmar 90 92 95 96 6 12 0.9 1.0 1.0 0.9 1.1 1.1 45 33 28 12 32 34
Namibia 89 93 12 4 5 1.1 1.0 1.0 1.3 1.1 32 30 24
Nepal 60 83 8 9 12 13 4 0.6 0.8 0.4 0.7 0.3 0.4 39 38 32 31 30 32
Netherlands 15 17 17 69 69 1.0 1.0 1.0 0.9 1.0 1.0 0.8 1.0 1.1 17 16 14
New Caledonia 96 100 83
New Zealand 14 17 20 3 2 1.0 1.0 1.0 1.0 1.1 1.0 1.1 1.5 1.5 18 18 14 16 15
Nicaragua 8 13 16 16 10 19 1.1 1.0 1.0 1.2 1.1 1.1 33 36 30 32 31
Niger 2 5 3 4 4 30 22 0.6 0.7 0.8 0.4 0.6 0.7 0.1 0.4 41 41 39 26 23 31
Nigeria 61 72 8 6 8 0.8 0.8 0.9 0.8 0.8 0.9 41 43 36 22 31 33
Northern Mariana Islands 22
Norway 14 18 18 1 2 2 1.0 1.0 1.0 1.0 1.0 1.0 1.2 1.5 1.6
Oman 8 2 5 7 8 0.9 1.0 0.7 1.0 0.9 1.4 28 25 15 18
Pakistan 4 31 1 0.5 0.7 0.8 0.4 0.8 0.4 41 33 40 19
Palau 14 18 31 1.0 1.0 2.4 16 15
Panama 89 92 94 95 96 98 11 12 13 8 10 11 29 1.0 1.0 1.0 1.1 1.1 1.1 1.7 1.5 23 25 23 20 16 15
Papua New Guinea 57 61 67 68 2 16 16 0.8 0.9 0.7 32 35
Paraguay 94 99 9 12 12 15 18 1.0 1.0 1.0 1.0 1.0 1.0 1.4 1.4 25 12
Peru 12 13 13 13 22 28 22 1.0 1.0 0.9 1.0 1.1 29 29 20 20 20 16
Philippines 94 93 97 95 11 7 7 17 24 1.0 1.0 33 35 33
Poland 100 100 12 15 15 3 1.0 1.0 1.0 1.1 1.0 1.0 1.5 1.4 1.5 9 10
Portugal 95 100 12 16 16 6 10 12 5 4 1.0 1.0 1.0 1.0 1.1 1.0 1.3 1.2 15 13 11 10 7
Puerto Rico 90 90 93 87 16 23 12 16 1.0 1.1 1.5 12 11
Qatar 96 97 12 25 38 55 21 0.9 1.0 1.0 1.3 1.2 1.2 3.6 5.4 12 13 12 9 10 10
Romania 98 97 12 12 14 39 1.0 1.0 1.0 1.0 1.0 1.0 1.0 1.1 1.3 19 16 13 12
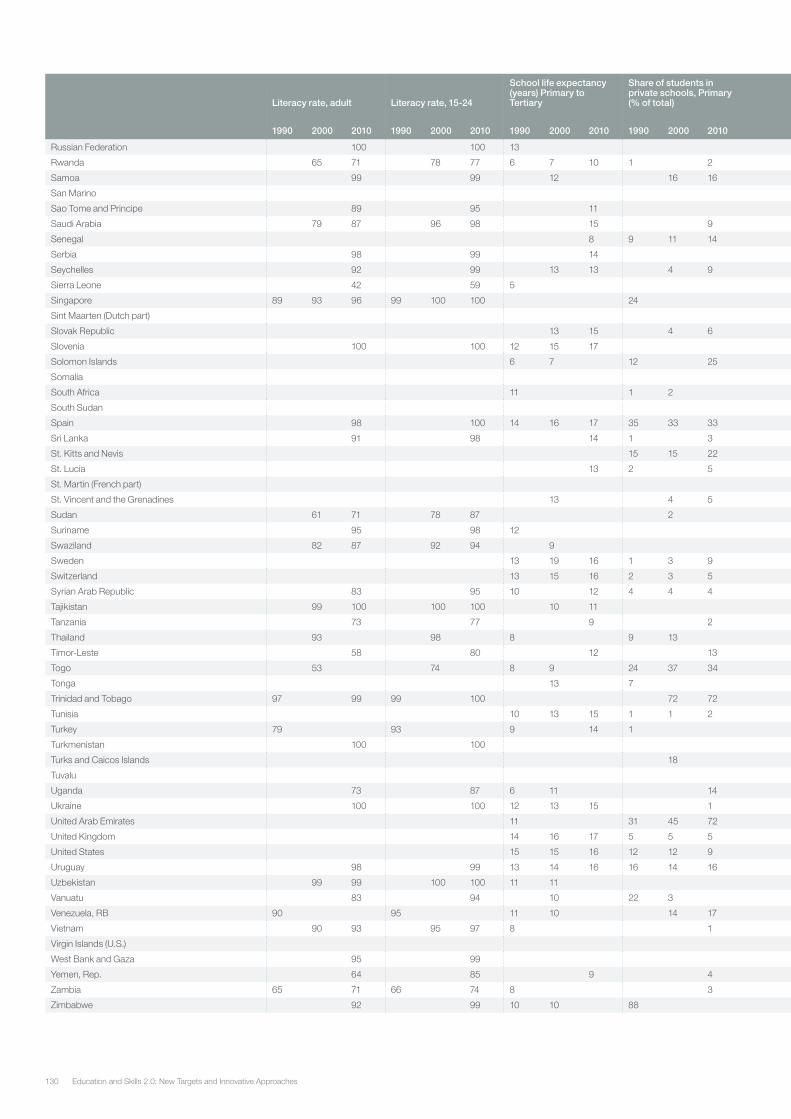
Education and Skills 2.0: New Targets and Innovative Approaches130
Literacy rate, adult Literacy rate, 15-24
School life expectancy (years) Primary to Tertiary
Share of students in private schools, Primary (% of total)
Share of students in private schools, Secondary (% of total)
Gender parity index for gross enrollment ratio, Primary
Gender parity index for gross enrollment ratio, Secondary
Gender parity index for gross enrollment ratio, Tertiary
Pupil-teacher ratio, Primary
Pupil-teacher ratio, Secondary
1990 2000 2010 1990 2000 2010 1990 2000 2010 1990 2000 2010 1990 2000 2010 1990 2000 2010 1990 2000 2010 1990 2000 2010 1990 2000 2010 1990 2000 2010
Russian Federation 100 100 13 1 2 1.0 1.0 23 18
Rwanda 65 71 78 77 6 7 10 1 2 1.0 1.0 1.0 0.8 0.9 1.0 0.2 0.8 50 54 65 23
Samoa 99 99 12 16 16 44 24 1.0 1.0 1.1 1.1 0.9 24 30 21 21
San Marino 32 1.1 1.0 1.5 6 5 6 14
Sao Tome and Principe 89 95 11 0.9 1.0 1.0 1.0 35 26
Saudi Arabia 79 87 96 98 15 9 1.0 0.9 1.3 1.1 11
Senegal 8 9 11 14 0.7 0.9 1.1 0.5 0.7 0.9 0.6 58 51 34 27
Serbia 98 99 14 26 21 1.0 1.0 1.0 1.0 1.3 16 10
Seychelles 92 99 13 13 4 9 1.0 1.0 1.1 1.1 15 13 14 12
Sierra Leone 42 59 5 3 7 0.7 0.9 0.5 0.8 35 19
Singapore 89 93 96 99 100 100 24 26
Sint Maarten (Dutch part)
Slovak Republic 13 15 4 6 1.0 1.0 1.0 1.0 1.1 1.5 18 15 12 12
Slovenia 100 100 12 15 17 6 10 1.0 1.0 1.0 1.0 1.3 1.4 1.4 13 17 13
Solomon Islands 6 7 12 25 1 1 0.9 0.9 1.0 0.6 0.8 0.9 19 25 10 28
Somalia 34
South Africa 11 1 2 1.0 1.0 1.2 1.1 0.8 33 28
South Sudan 2
Spain 98 100 14 16 17 35 33 33 1.0 1.0 1.0 1.1 1.1 1.0 1.1 1.2 1.2 23 15 12 17 11 11
Sri Lanka 91 98 14 1 3 29 28 1.0 1.0 1.1 1.0 1.9 24 19
St. Kitts and Nevis 15 15 22 6 0.9 1.0 1.0 1.0 1.0 22 19 14 14 9
St. Lucia 13 2 5 4 1.0 1.0 1.0 1.5 1.3 1.0 2.6 29 23 19 19 18 16
St. Martin (French part) 3
St. Vincent and the Grenadines 13 4 5 0.9 0.9 1.3 1.0 2.2 19 16 24 17
Sudan 61 71 78 87 2 24 0.9 0.7 0.9
Suriname 95 98 12 9 1.1 1.3 1.2 22 13
Swaziland 82 87 92 94 9 1.0 1.0 0.9 1.0 1.0 0.6 0.9 33 31 32 17 18
Sweden 13 19 16 1 3 9 2 1.0 1.0 1.0 1.0 1.3 1.0 1.2 1.5 1.5 12 10 14 10
Switzerland 13 15 16 2 3 5 2 17 1.0 1.0 1.0 0.9 0.9 1.0 0.5 0.8 1.0
Syrian Arab Republic 83 95 10 12 4 4 4 8 7 0.9 0.9 1.0 0.7 0.9 1.0 0.6 26 25 18 18
Tajikistan 99 100 100 100 10 11 5 4 0.9 1.0 0.9 0.9 0.4 0.5 22 25 16 17
Tanzania 73 77 9 2 1.0 1.0 1.0 0.7 0.8 0.8 35 41 51 21
Thailand 93 98 8 9 13 1.0 1.0 1.1 1.2 1.3 20 21 16
Timor-Leste 58 80 12 13 16 1.0 1.0 30 23
Togo 53 74 8 9 24 37 34 26 0.6 0.8 0.9 0.3 0.4 0.2 56 37 41 28 32
Tonga 13 7 1.0 0.9 1.0 1.1 24 22 18 15
Trinidad and Tobago 97 99 99 100 72 72 1.0 1.0 1.0 1.0 1.1 1.5 21 18 21
Tunisia 10 13 15 1 1 2 8 0.9 0.9 1.0 0.8 1.0 1.1 0.6 1.5 30 23 17 17 19 13
Turkey 79 93 9 14 1 8 5 0.9 0.9 1.0 0.6 0.7 0.9 0.5 0.8 30 23
Turkmenistan 100 100
Turks and Caicos Islands 18 18 8
Tuvalu 8 1.0 20
Uganda 73 87 6 11 14 0.8 0.9 1.0 0.6 0.8 0.4 0.5 29 59 49 18
Ukraine 100 100 12 13 15 1 1.0 1.0 1.0 1.0 1.0 1.0 1.1 1.2 20 16 13
United Arab Emirates 11 31 45 72 1.0 1.0 1.2 1.1 4.1 18 16 17 13 13
United Kingdom 14 16 17 5 5 5 32 56 1.0 1.0 1.0 1.0 1.0 1.0 0.9 1.2 1.4 20 19 18 15
United States 15 15 16 12 12 9 26 29 1.0 1.0 1.0 1.0 1.0 1.0 1.2 1.3 1.4 15 14 15 14
Uruguay 98 99 13 14 16 16 14 16 10 8 1.0 1.0 1.0 1.1 1.1 1.8 1.7 22 21 14 15 11
Uzbekistan 99 99 100 100 11 11 12 15 1.0 1.0 1.0 1.0 1.0 0.8 24 21 18 11 12 13
Vanuatu 83 94 10 22 3 1.0 1.0 1.0 1.1 1.0 23 22 25
Venezuela, RB 90 95 11 10 14 17 27 1.0 1.0 1.2 1.1 1.5
Vietnam 90 93 95 97 8 1 27 29 0.9 0.9 0.7 1.0 34 30 20 18
Virgin Islands (U.S.)
West Bank and Gaza 95 99
Yemen, Rep. 64 85 9 4 0.8 0.6 0.3 31
Zambia 65 71 66 74 8 3 3 0.9 1.0 0.5 44 58 59
Zimbabwe 92 99 10 10 88 1.0 0.9 0.8 36
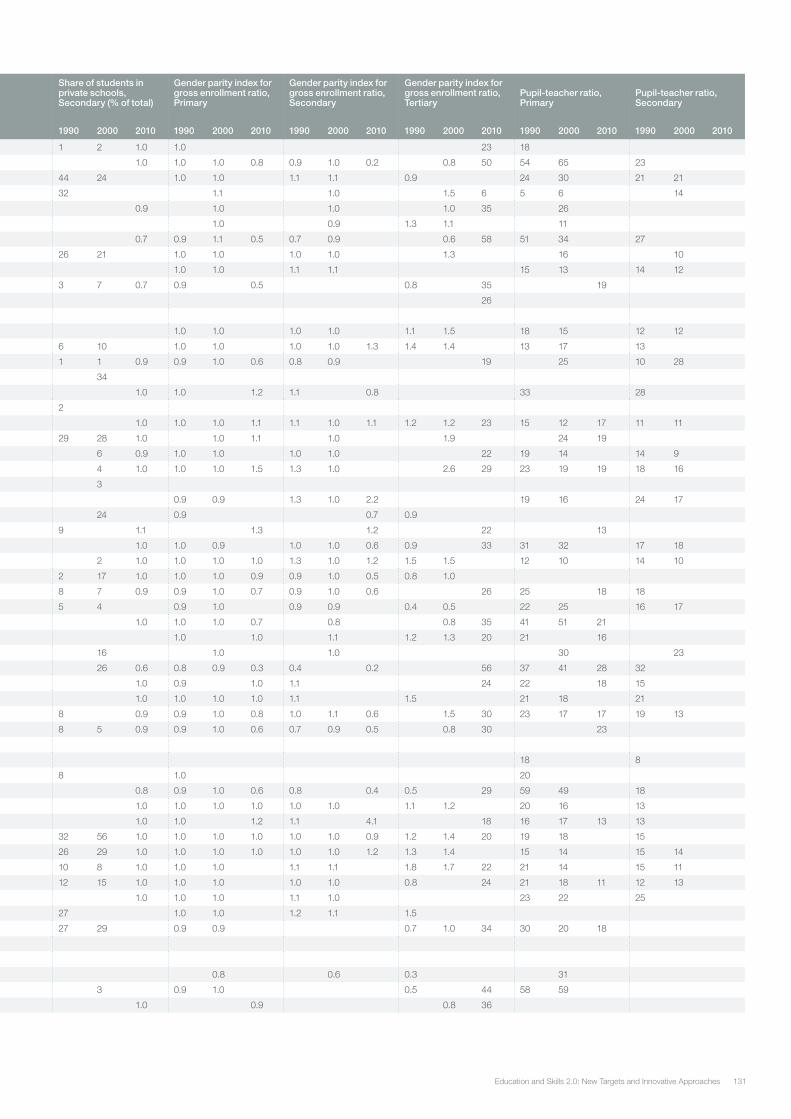
131Education and Skills 2.0: New Targets and Innovative Approaches
Literacy rate, adult Literacy rate, 15-24
School life expectancy (years) Primary to Tertiary
Share of students in private schools, Primary (% of total)
Share of students in private schools, Secondary (% of total)
Gender parity index for gross enrollment ratio, Primary
Gender parity index for gross enrollment ratio, Secondary
Gender parity index for gross enrollment ratio, Tertiary
Pupil-teacher ratio, Primary
Pupil-teacher ratio, Secondary
1990 2000 2010 1990 2000 2010 1990 2000 2010 1990 2000 2010 1990 2000 2010 1990 2000 2010 1990 2000 2010 1990 2000 2010 1990 2000 2010 1990 2000 2010
Russian Federation 100 100 13 1 2 1.0 1.0 23 18
Rwanda 65 71 78 77 6 7 10 1 2 1.0 1.0 1.0 0.8 0.9 1.0 0.2 0.8 50 54 65 23
Samoa 99 99 12 16 16 44 24 1.0 1.0 1.1 1.1 0.9 24 30 21 21
San Marino 32 1.1 1.0 1.5 6 5 6 14
Sao Tome and Principe 89 95 11 0.9 1.0 1.0 1.0 35 26
Saudi Arabia 79 87 96 98 15 9 1.0 0.9 1.3 1.1 11
Senegal 8 9 11 14 0.7 0.9 1.1 0.5 0.7 0.9 0.6 58 51 34 27
Serbia 98 99 14 26 21 1.0 1.0 1.0 1.0 1.3 16 10
Seychelles 92 99 13 13 4 9 1.0 1.0 1.1 1.1 15 13 14 12
Sierra Leone 42 59 5 3 7 0.7 0.9 0.5 0.8 35 19
Singapore 89 93 96 99 100 100 24 26
Sint Maarten (Dutch part)
Slovak Republic 13 15 4 6 1.0 1.0 1.0 1.0 1.1 1.5 18 15 12 12
Slovenia 100 100 12 15 17 6 10 1.0 1.0 1.0 1.0 1.3 1.4 1.4 13 17 13
Solomon Islands 6 7 12 25 1 1 0.9 0.9 1.0 0.6 0.8 0.9 19 25 10 28
Somalia 34
South Africa 11 1 2 1.0 1.0 1.2 1.1 0.8 33 28
South Sudan 2
Spain 98 100 14 16 17 35 33 33 1.0 1.0 1.0 1.1 1.1 1.0 1.1 1.2 1.2 23 15 12 17 11 11
Sri Lanka 91 98 14 1 3 29 28 1.0 1.0 1.1 1.0 1.9 24 19
St. Kitts and Nevis 15 15 22 6 0.9 1.0 1.0 1.0 1.0 22 19 14 14 9
St. Lucia 13 2 5 4 1.0 1.0 1.0 1.5 1.3 1.0 2.6 29 23 19 19 18 16
St. Martin (French part) 3
St. Vincent and the Grenadines 13 4 5 0.9 0.9 1.3 1.0 2.2 19 16 24 17
Sudan 61 71 78 87 2 24 0.9 0.7 0.9
Suriname 95 98 12 9 1.1 1.3 1.2 22 13
Swaziland 82 87 92 94 9 1.0 1.0 0.9 1.0 1.0 0.6 0.9 33 31 32 17 18
Sweden 13 19 16 1 3 9 2 1.0 1.0 1.0 1.0 1.3 1.0 1.2 1.5 1.5 12 10 14 10
Switzerland 13 15 16 2 3 5 2 17 1.0 1.0 1.0 0.9 0.9 1.0 0.5 0.8 1.0
Syrian Arab Republic 83 95 10 12 4 4 4 8 7 0.9 0.9 1.0 0.7 0.9 1.0 0.6 26 25 18 18
Tajikistan 99 100 100 100 10 11 5 4 0.9 1.0 0.9 0.9 0.4 0.5 22 25 16 17
Tanzania 73 77 9 2 1.0 1.0 1.0 0.7 0.8 0.8 35 41 51 21
Thailand 93 98 8 9 13 1.0 1.0 1.1 1.2 1.3 20 21 16
Timor-Leste 58 80 12 13 16 1.0 1.0 30 23
Togo 53 74 8 9 24 37 34 26 0.6 0.8 0.9 0.3 0.4 0.2 56 37 41 28 32
Tonga 13 7 1.0 0.9 1.0 1.1 24 22 18 15
Trinidad and Tobago 97 99 99 100 72 72 1.0 1.0 1.0 1.0 1.1 1.5 21 18 21
Tunisia 10 13 15 1 1 2 8 0.9 0.9 1.0 0.8 1.0 1.1 0.6 1.5 30 23 17 17 19 13
Turkey 79 93 9 14 1 8 5 0.9 0.9 1.0 0.6 0.7 0.9 0.5 0.8 30 23
Turkmenistan 100 100
Turks and Caicos Islands 18 18 8
Tuvalu 8 1.0 20
Uganda 73 87 6 11 14 0.8 0.9 1.0 0.6 0.8 0.4 0.5 29 59 49 18
Ukraine 100 100 12 13 15 1 1.0 1.0 1.0 1.0 1.0 1.0 1.1 1.2 20 16 13
United Arab Emirates 11 31 45 72 1.0 1.0 1.2 1.1 4.1 18 16 17 13 13
United Kingdom 14 16 17 5 5 5 32 56 1.0 1.0 1.0 1.0 1.0 1.0 0.9 1.2 1.4 20 19 18 15
United States 15 15 16 12 12 9 26 29 1.0 1.0 1.0 1.0 1.0 1.0 1.2 1.3 1.4 15 14 15 14
Uruguay 98 99 13 14 16 16 14 16 10 8 1.0 1.0 1.0 1.1 1.1 1.8 1.7 22 21 14 15 11
Uzbekistan 99 99 100 100 11 11 12 15 1.0 1.0 1.0 1.0 1.0 0.8 24 21 18 11 12 13
Vanuatu 83 94 10 22 3 1.0 1.0 1.0 1.1 1.0 23 22 25
Venezuela, RB 90 95 11 10 14 17 27 1.0 1.0 1.2 1.1 1.5
Vietnam 90 93 95 97 8 1 27 29 0.9 0.9 0.7 1.0 34 30 20 18
Virgin Islands (U.S.)
West Bank and Gaza 95 99
Yemen, Rep. 64 85 9 4 0.8 0.6 0.3 31
Zambia 65 71 66 74 8 3 3 0.9 1.0 0.5 44 58 59
Zimbabwe 92 99 10 10 88 1.0 0.9 0.8 36
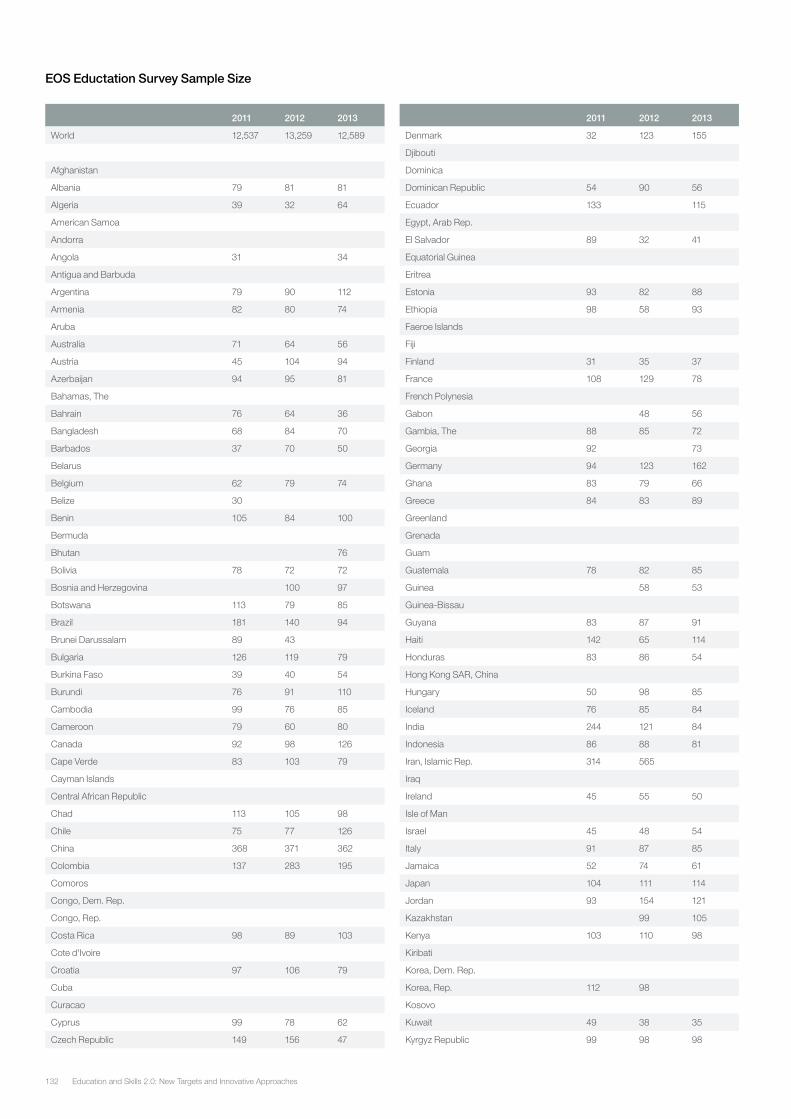
Education and Skills 2.0: New Targets and Innovative Approaches132
2011 2012 2013
Denmark 32 123 155
Djibouti
Dominica
Dominican Republic 54 90 56
Ecuador 133 115
Egypt, Arab Rep.
El Salvador 89 32 41
Equatorial Guinea
Eritrea
Estonia 93 82 88
Ethiopia 98 58 93
Faeroe Islands
Fiji
Finland 31 35 37
France 108 129 78
French Polynesia
Gabon 48 56
Gambia, The 88 85 72
Georgia 92 73
Germany 94 123 162
Ghana 83 79 66
Greece 84 83 89
Greenland
Grenada
Guam
Guatemala 78 82 85
Guinea 58 53
Guinea-Bissau
Guyana 83 87 91
Haiti 142 65 114
Honduras 83 86 54
Hong Kong SAR, China
Hungary 50 98 85
Iceland 76 85 84
India 244 121 84
Indonesia 86 88 81
Iran, Islamic Rep. 314 565
Iraq
Ireland 45 55 50
Isle of Man
Israel 45 48 54
Italy 91 87 85
Jamaica 52 74 61
Japan 104 111 114
Jordan 93 154 121
Kazakhstan 99 105
Kenya 103 110 98
Kiribati
Korea, Dem. Rep.
Korea, Rep. 112 98
Kosovo
Kuwait 49 38 35
Kyrgyz Republic 99 98 98
EOS Eductation Survey Sample Size
2011 2012 2013
World 12,537 13,259 12,589
Afghanistan
Albania 79 81 81
Algeria 39 32 64
American Samoa
Andorra
Angola 31 34
Antigua and Barbuda
Argentina 79 90 112
Armenia 82 80 74
Aruba
Australia 71 64 56
Austria 45 104 94
Azerbaijan 94 95 81
Bahamas, The
Bahrain 76 64 36
Bangladesh 68 84 70
Barbados 37 70 50
Belarus
Belgium 62 79 74
Belize 30
Benin 105 84 100
Bermuda
Bhutan 76
Bolivia 78 72 72
Bosnia and Herzegovina 100 97
Botswana 113 79 85
Brazil 181 140 94
Brunei Darussalam 89 43
Bulgaria 126 119 79
Burkina Faso 39 40 54
Burundi 76 91 110
Cambodia 99 76 85
Cameroon 79 60 80
Canada 92 98 126
Cape Verde 83 103 79
Cayman Islands
Central African Republic
Chad 113 105 98
Chile 75 77 126
China 368 371 362
Colombia 137 283 195
Comoros
Congo, Dem. Rep.
Congo, Rep.
Costa Rica 98 89 103
Cote d'Ivoire
Croatia 97 106 79
Cuba
Curacao
Cyprus 99 78 62
Czech Republic 149 156 47
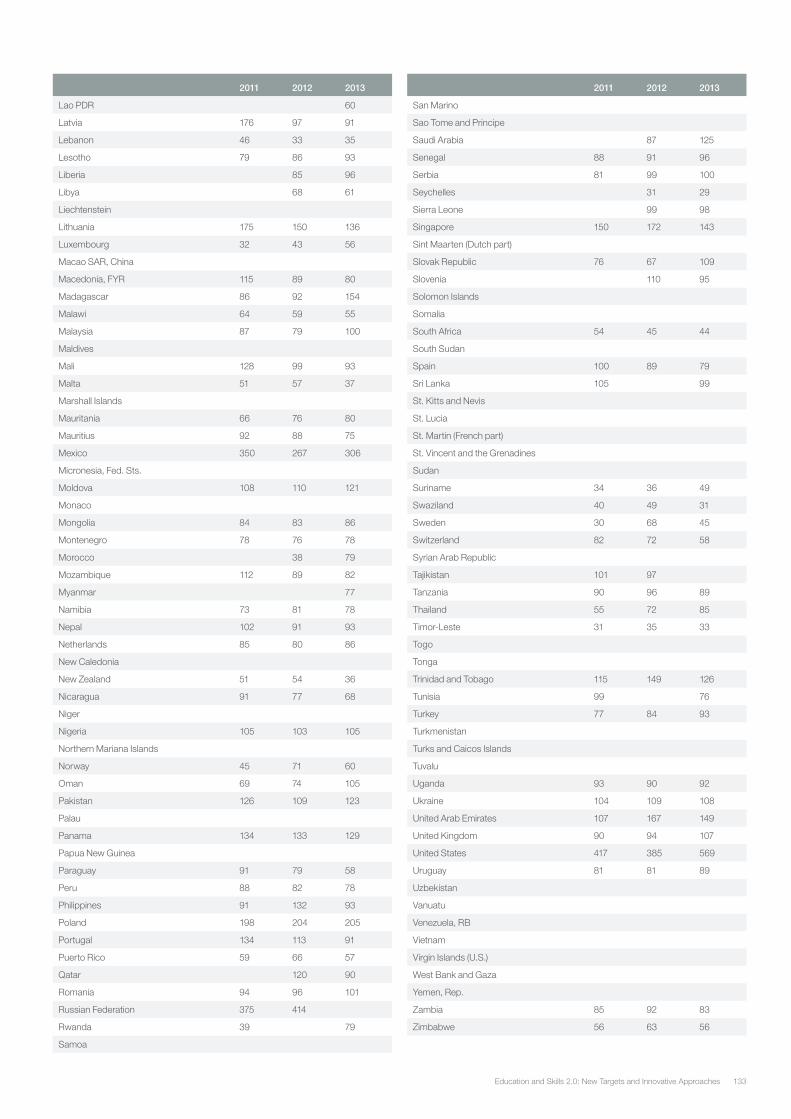
133Education and Skills 2.0: New Targets and Innovative Approaches
2011 2012 2013
Lao PDR 60
Latvia 176 97 91
Lebanon 46 33 35
Lesotho 79 86 93
Liberia 85 96
Libya 68 61
Liechtenstein
Lithuania 175 150 136
Luxembourg 32 43 56
Macao SAR, China
Macedonia, FYR 115 89 80
Madagascar 86 92 154
Malawi 64 59 55
Malaysia 87 79 100
Maldives
Mali 128 99 93
Malta 51 57 37
Marshall Islands
Mauritania 66 76 80
Mauritius 92 88 75
Mexico 350 267 306
Micronesia, Fed. Sts.
Moldova 108 110 121
Monaco
Mongolia 84 83 86
Montenegro 78 76 78
Morocco 38 79
Mozambique 112 89 82
Myanmar 77
Namibia 73 81 78
Nepal 102 91 93
Netherlands 85 80 86
New Caledonia
New Zealand 51 54 36
Nicaragua 91 77 68
Niger
Nigeria 105 103 105
Northern Mariana Islands
Norway 45 71 60
Oman 69 74 105
Pakistan 126 109 123
Palau
Panama 134 133 129
Papua New Guinea
Paraguay 91 79 58
Peru 88 82 78
Philippines 91 132 93
Poland 198 204 205
Portugal 134 113 91
Puerto Rico 59 66 57
Qatar 120 90
Romania 94 96 101
Russian Federation 375 414
Rwanda 39 79
Samoa
2011 2012 2013
San Marino
Sao Tome and Principe
Saudi Arabia 87 125
Senegal 88 91 96
Serbia 81 99 100
Seychelles 31 29
Sierra Leone 99 98
Singapore 150 172 143
Sint Maarten (Dutch part)
Slovak Republic 76 67 109
Slovenia 110 95
Solomon Islands
Somalia
South Africa 54 45 44
South Sudan
Spain 100 89 79
Sri Lanka 105 99
St. Kitts and Nevis
St. Lucia
St. Martin (French part)
St. Vincent and the Grenadines
Sudan
Suriname 34 36 49
Swaziland 40 49 31
Sweden 30 68 45
Switzerland 82 72 58
Syrian Arab Republic
Tajikistan 101 97
Tanzania 90 96 89
Thailand 55 72 85
Timor-Leste 31 35 33
Togo
Tonga
Trinidad and Tobago 115 149 126
Tunisia 99 76
Turkey 77 84 93
Turkmenistan
Turks and Caicos Islands
Tuvalu
Uganda 93 90 92
Ukraine 104 109 108
United Arab Emirates 107 167 149
United Kingdom 90 94 107
United States 417 385 569
Uruguay 81 81 89
Uzbekistan
Vanuatu
Venezuela, RB
Vietnam
Virgin Islands (U.S.)
West Bank and Gaza
Yemen, Rep.
Zambia 85 92 83
Zimbabwe 56 63 56

Education and Skills 2.0: New Targets and Innovative Approaches134
EOS Education Survey, Question 1
How well does the educational system in your country meet the needs of a competitive economy?
Percent of Sample Responding to EOS Survey Question 1
Percent Responding “At Least Moderate Satisfaction”
Percent Responding “Great Satisfaction”
2011 2012 2013 2011 2012 2013 2011 2012 2013
World 98% 98% 96% 51% 51% 51% 16% 16% 14%
Afghanistan
Albania 100% 100% 100% 81% 57% 83% 11% 2% 6%
Algeria 100% 97% 98% 21% 22% 20% 3% 6% 6%
American Samoa
Andorra
Angola 100% 97% 10% 12%
Antigua and Barbuda
Argentina 92% 91% 92% 46% 43% 41% 9% 8% 2%
Armenia 99% 100% 97% 41% 46% 43% 2% 10% 7%
Aruba
Australia 99% 94% 98% 83% 83% 79% 45% 45% 25%
Austria 98% 99% 95% 73% 78% 80% 22% 30% 27%
Azerbaijan 98% 100% 95% 38% 26% 43% 13% 4% 7%
Bahamas, The
Bahrain 95% 98% 88% 76% 58% 67% 26% 16% 28%
Bangladesh 99% 98% 99% 40% 39% 37% 6% 12% 9%
Barbados 100% 97% 98% 86% 97% 94% 46% 47% 40%
Belarus
Belgium 91% 95% 86% 89% 94% 89% 47% 59% 46%
Belize 100% 23% 10%
Benin 100% 93% 99% 61% 36% 40% 20% 13% 7%
Bermuda
Bhutan 89% 71% 18%
Bolivia 99% 100% 97% 47% 53% 44% 3% 8%
Bosnia and Herzegovina 100% 97% 18% 4% 4%
Botswana 99% 99% 98% 58% 63% 53% 9% 8% 8%
Brazil 98% 98% 96% 29% 27% 24% 1% 1% 1%
Brunei Darussalam 98% 98% 85% 84% 31% 35%
Bulgaria 100% 99% 98% 37% 41% 49% 4% 8% 9%
Burkina Faso 98% 98% 95% 28% 25% 22% 3% 9%
Burundi 99% 99% 100% 17% 14% 25% 5% 1%
Cambodia 99% 99% 91% 57% 57% 42% 10% 13% 8%
Cameroon 95% 97% 99% 43% 47% 53% 9% 5% 16%
Canada 94% 95% 95% 95% 94% 90% 49% 54% 41%
Cape Verde 100% 95% 99% 58% 52% 67% 7% 10% 10%
Cayman Islands
Central African Republic
Chad 100% 100% 96% 36% 24% 22% 12% 7% 11%
Chile 100% 99% 97% 45% 36% 57% 3% 4% 6%
China 99% 100% 99% 57% 62% 65% 15% 12% 14%
Colombia 100% 99% 96% 53% 44% 46% 14% 9% 5%
Comoros
Congo, Dem. Rep.
Congo, Rep.
Costa Rica 99% 95% 94% 81% 87% 87% 28% 30% 20%
Cote d'Ivoire 100% 47% 5%
Croatia 100% 99% 99% 35% 42% 47% 8% 8% 8%
Cuba
Curacao
Cyprus 100% 99% 98% 54% 95% 95% 26% 42% 47%

135Education and Skills 2.0: New Targets and Innovative Approaches
Percent of Sample Responding to EOS Survey Question 1
Percent Responding “At Least Moderate Satisfaction”
Percent Responding “Great Satisfaction”
2011 2012 2013 2011 2012 2013 2011 2012 2013
Czech Republic 97% 96% 94% 60% 58% 47% 20% 17% 13%
Denmark 97% 96% 90% 91% 85% 83% 34% 33% 36%
Djibouti
Dominica
Dominican Republic 100% 99% 100% 11% 14% 16% 4% 2%
Ecuador 99% 97% 44% 72% 9% 20%
Egypt, Arab Rep.
El Salvador 99% 94% 93% 22% 9% 78% 2%
Equatorial Guinea
Eritrea
Estonia 100% 96% 96% 67% 60% 75% 13% 10% 13%
Ethiopia 98% 97% 95% 53% 33% 45% 5% 10% 5%
Faeroe Islands
Fiji
Finland 94% 97% 93% 94% 91% 100% 72% 71% 73%
France 99% 100% 98% 69% 63% 72% 23% 16% 15%
French Polynesia
Gabon 100% 95% 25% 25% 2% 2%
Gambia, The 97% 98% 95% 76% 80% 74% 30% 26% 19%
Georgia 97% 99% 33% 36% 4% 8%
Germany 99% 97% 95% 81% 89% 92% 28% 48% 44%
Ghana 99% 100% 94% 46% 61% 76% 6% 11% 5%
Greece 99% 100% 98% 25% 36% 34% 1% 5% 2%
Greenland
Grenada
Guam
Guatemala 100% 99% 99% 17% 27% 14% 3% 1% 2%
Guinea 97% 95% 24% 25% 5% 6%
Guinea-Bissau
Guyana 99% 98% 99% 58% 59% 75% 13% 11% 4%
Haiti 97% 97% 97% 11% 14% 16%
Honduras 98% 100% 98% 20% 14% 17% 2%
Hong Kong SAR, China
Hungary 100% 95% 97% 42% 43% 40% 6% 8% 6%
Iceland 94% 91% 92% 99% 92% 89% 54% 47% 29%
India 98% 99% 99% 70% 71% 70% 27% 27% 25%
Indonesia 100% 100% 93% 71% 66% 73% 8% 11% 21%
Iran, Islamic Rep. 96% 97% 41% 40% 7% 6%
Iraq
Ireland 92% 89% 91% 93% 95% 96% 44% 53% 58%
Isle of Man
Israel 96% 94% 90% 58% 67% 59% 16% 8% 11%
Italy 99% 100% 100% 40% 41% 58% 8% 7% 7%
Jamaica 98% 99% 100% 42% 53% 52% 12% 9% 13%
Japan 99% 100% 99% 78% 59% 69% 13% 7% 19%
Jordan 97% 99% 97% 67% 78% 70% 20% 29% 22%
Kazakhstan 96% 98% 45% 44% 12% 12%
Kenya 99% 98% 98% 83% 56% 76% 30% 18% 18%
Kiribati
Korea, Dem. Rep.
Korea, Rep. 100% 100% 70% 63% 18% 13%
Kosovo
Kuwait 100% 100% 97% 35% 42% 37% 4% 11% 9%
Kyrgyz Republic 100% 99% 97% 32% 24% 26% 3% 1% 2%
Lao PDR 97% 55% 18%
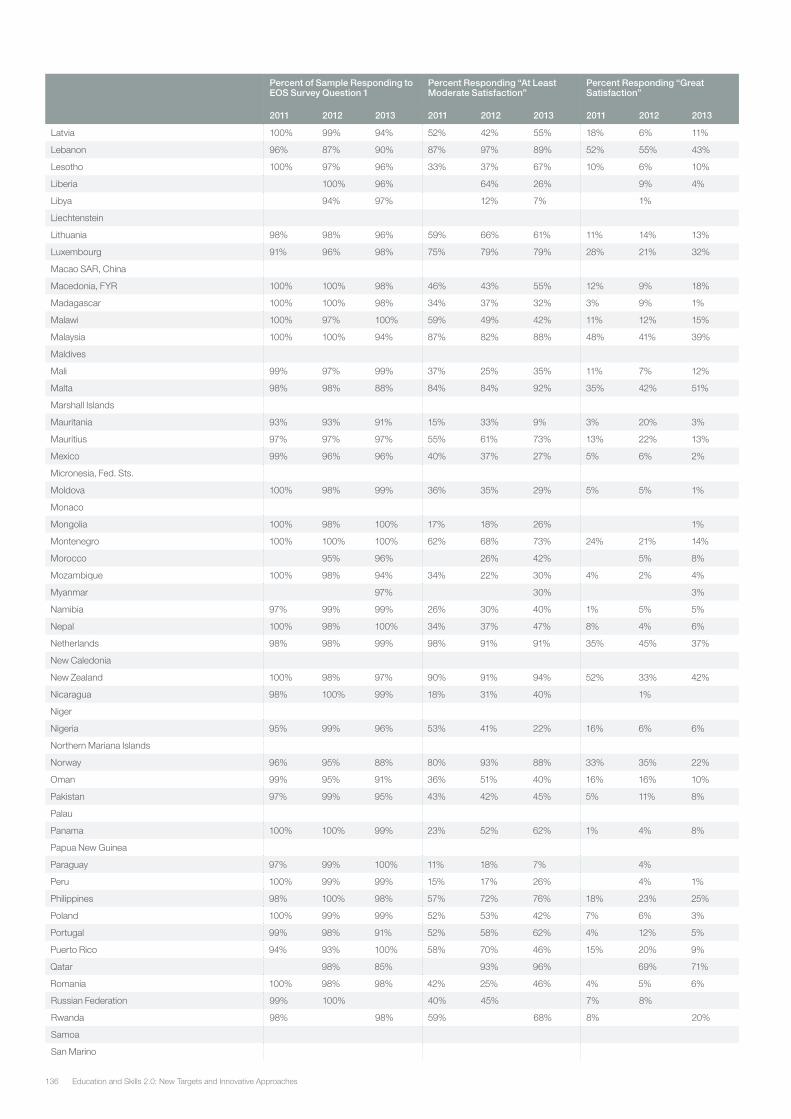
Education and Skills 2.0: New Targets and Innovative Approaches136
Percent of Sample Responding to EOS Survey Question 1
Percent Responding “At Least Moderate Satisfaction”
Percent Responding “Great Satisfaction”
2011 2012 2013 2011 2012 2013 2011 2012 2013
Latvia 100% 99% 94% 52% 42% 55% 18% 6% 11%
Lebanon 96% 87% 90% 87% 97% 89% 52% 55% 43%
Lesotho 100% 97% 96% 33% 37% 67% 10% 6% 10%
Liberia 100% 96% 64% 26% 9% 4%
Libya 94% 97% 12% 7% 1%
Liechtenstein
Lithuania 98% 98% 96% 59% 66% 61% 11% 14% 13%
Luxembourg 91% 96% 98% 75% 79% 79% 28% 21% 32%
Macao SAR, China
Macedonia, FYR 100% 100% 98% 46% 43% 55% 12% 9% 18%
Madagascar 100% 100% 98% 34% 37% 32% 3% 9% 1%
Malawi 100% 97% 100% 59% 49% 42% 11% 12% 15%
Malaysia 100% 100% 94% 87% 82% 88% 48% 41% 39%
Maldives
Mali 99% 97% 99% 37% 25% 35% 11% 7% 12%
Malta 98% 98% 88% 84% 84% 92% 35% 42% 51%
Marshall Islands
Mauritania 93% 93% 91% 15% 33% 9% 3% 20% 3%
Mauritius 97% 97% 97% 55% 61% 73% 13% 22% 13%
Mexico 99% 96% 96% 40% 37% 27% 5% 6% 2%
Micronesia, Fed. Sts.
Moldova 100% 98% 99% 36% 35% 29% 5% 5% 1%
Monaco
Mongolia 100% 98% 100% 17% 18% 26% 1%
Montenegro 100% 100% 100% 62% 68% 73% 24% 21% 14%
Morocco 95% 96% 26% 42% 5% 8%
Mozambique 100% 98% 94% 34% 22% 30% 4% 2% 4%
Myanmar 97% 30% 3%
Namibia 97% 99% 99% 26% 30% 40% 1% 5% 5%
Nepal 100% 98% 100% 34% 37% 47% 8% 4% 6%
Netherlands 98% 98% 99% 98% 91% 91% 35% 45% 37%
New Caledonia
New Zealand 100% 98% 97% 90% 91% 94% 52% 33% 42%
Nicaragua 98% 100% 99% 18% 31% 40% 1%
Niger
Nigeria 95% 99% 96% 53% 41% 22% 16% 6% 6%
Northern Mariana Islands
Norway 96% 95% 88% 80% 93% 88% 33% 35% 22%
Oman 99% 95% 91% 36% 51% 40% 16% 16% 10%
Pakistan 97% 99% 95% 43% 42% 45% 5% 11% 8%
Palau
Panama 100% 100% 99% 23% 52% 62% 1% 4% 8%
Papua New Guinea
Paraguay 97% 99% 100% 11% 18% 7% 4%
Peru 100% 99% 99% 15% 17% 26% 4% 1%
Philippines 98% 100% 98% 57% 72% 76% 18% 23% 25%
Poland 100% 99% 99% 52% 53% 42% 7% 6% 3%
Portugal 99% 98% 91% 52% 58% 62% 4% 12% 5%
Puerto Rico 94% 93% 100% 58% 70% 46% 15% 20% 9%
Qatar 98% 85% 93% 96% 69% 71%
Romania 100% 98% 98% 42% 25% 46% 4% 5% 6%
Russian Federation 99% 100% 40% 45% 7% 8%
Rwanda 98% 98% 59% 68% 8% 20%
Samoa
San Marino
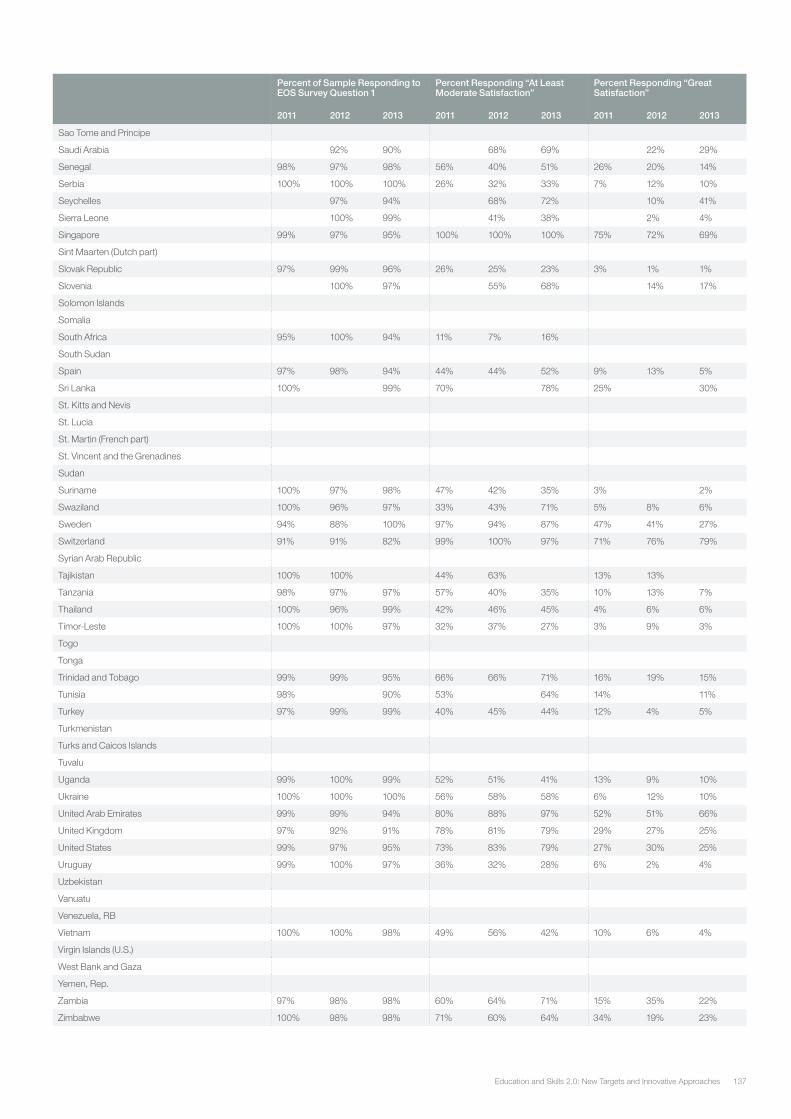
137Education and Skills 2.0: New Targets and Innovative Approaches
Percent of Sample Responding to EOS Survey Question 1
Percent Responding “At Least Moderate Satisfaction”
Percent Responding “Great Satisfaction”
2011 2012 2013 2011 2012 2013 2011 2012 2013
Sao Tome and Principe
Saudi Arabia 92% 90% 68% 69% 22% 29%
Senegal 98% 97% 98% 56% 40% 51% 26% 20% 14%
Serbia 100% 100% 100% 26% 32% 33% 7% 12% 10%
Seychelles 97% 94% 68% 72% 10% 41%
Sierra Leone 100% 99% 41% 38% 2% 4%
Singapore 99% 97% 95% 100% 100% 100% 75% 72% 69%
Sint Maarten (Dutch part)
Slovak Republic 97% 99% 96% 26% 25% 23% 3% 1% 1%
Slovenia 100% 97% 55% 68% 14% 17%
Solomon Islands
Somalia
South Africa 95% 100% 94% 11% 7% 16%
South Sudan
Spain 97% 98% 94% 44% 44% 52% 9% 13% 5%
Sri Lanka 100% 99% 70% 78% 25% 30%
St. Kitts and Nevis
St. Lucia
St. Martin (French part)
St. Vincent and the Grenadines
Sudan
Suriname 100% 97% 98% 47% 42% 35% 3% 2%
Swaziland 100% 96% 97% 33% 43% 71% 5% 8% 6%
Sweden 94% 88% 100% 97% 94% 87% 47% 41% 27%
Switzerland 91% 91% 82% 99% 100% 97% 71% 76% 79%
Syrian Arab Republic
Tajikistan 100% 100% 44% 63% 13% 13%
Tanzania 98% 97% 97% 57% 40% 35% 10% 13% 7%
Thailand 100% 96% 99% 42% 46% 45% 4% 6% 6%
Timor-Leste 100% 100% 97% 32% 37% 27% 3% 9% 3%
Togo
Tonga
Trinidad and Tobago 99% 99% 95% 66% 66% 71% 16% 19% 15%
Tunisia 98% 90% 53% 64% 14% 11%
Turkey 97% 99% 99% 40% 45% 44% 12% 4% 5%
Turkmenistan
Turks and Caicos Islands
Tuvalu
Uganda 99% 100% 99% 52% 51% 41% 13% 9% 10%
Ukraine 100% 100% 100% 56% 58% 58% 6% 12% 10%
United Arab Emirates 99% 99% 94% 80% 88% 97% 52% 51% 66%
United Kingdom 97% 92% 91% 78% 81% 79% 29% 27% 25%
United States 99% 97% 95% 73% 83% 79% 27% 30% 25%
Uruguay 99% 100% 97% 36% 32% 28% 6% 2% 4%
Uzbekistan
Vanuatu
Venezuela, RB
Vietnam 100% 100% 98% 49% 56% 42% 10% 6% 4%
Virgin Islands (U.S.)
West Bank and Gaza
Yemen, Rep.
Zambia 97% 98% 98% 60% 64% 71% 15% 35% 22%
Zimbabwe 100% 98% 98% 71% 60% 64% 34% 19% 23%
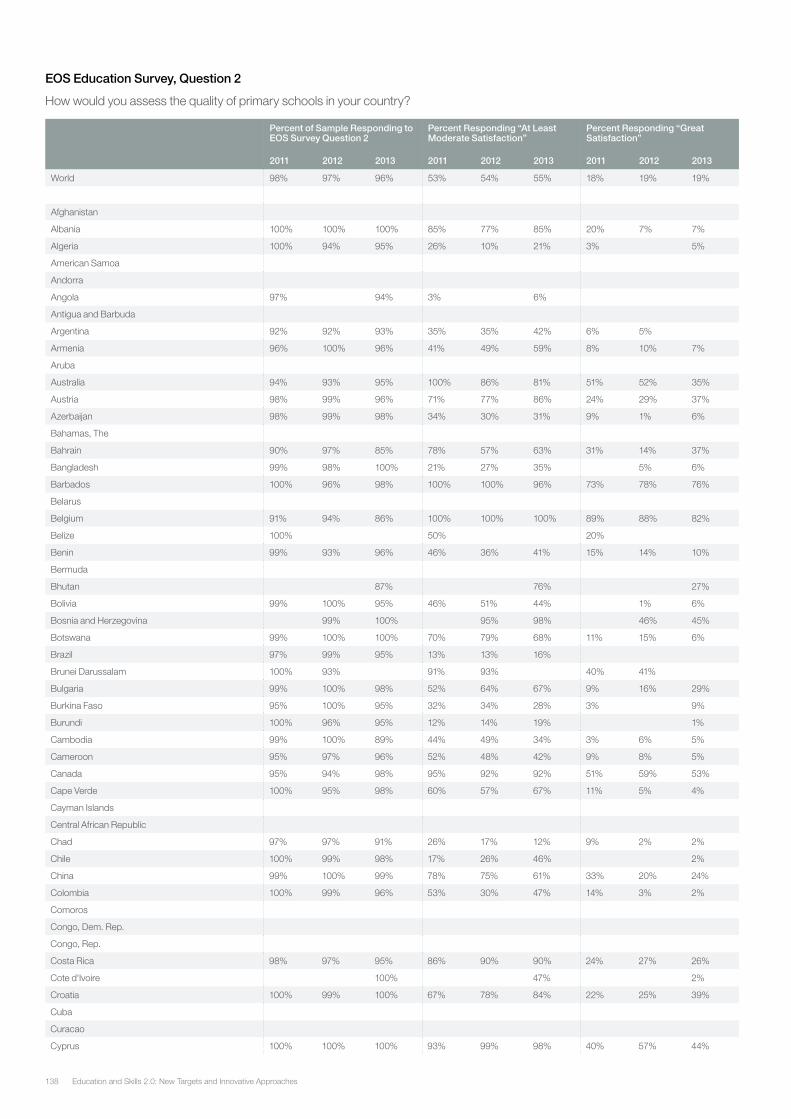
Education and Skills 2.0: New Targets and Innovative Approaches138
EOS Education Survey, Question 2
How would you assess the quality of primary schools in your country?
Percent of Sample Responding to EOS Survey Question 2
Percent Responding “At Least Moderate Satisfaction”
Percent Responding “Great Satisfaction”
2011 2012 2013 2011 2012 2013 2011 2012 2013
World 98% 97% 96% 53% 54% 55% 18% 19% 19%
Afghanistan
Albania 100% 100% 100% 85% 77% 85% 20% 7% 7%
Algeria 100% 94% 95% 26% 10% 21% 3% 5%
American Samoa
Andorra
Angola 97% 94% 3% 6%
Antigua and Barbuda
Argentina 92% 92% 93% 35% 35% 42% 6% 5%
Armenia 96% 100% 96% 41% 49% 59% 8% 10% 7%
Aruba
Australia 94% 93% 95% 100% 86% 81% 51% 52% 35%
Austria 98% 99% 96% 71% 77% 86% 24% 29% 37%
Azerbaijan 98% 99% 98% 34% 30% 31% 9% 1% 6%
Bahamas, The
Bahrain 90% 97% 85% 78% 57% 63% 31% 14% 37%
Bangladesh 99% 98% 100% 21% 27% 35% 5% 6%
Barbados 100% 96% 98% 100% 100% 96% 73% 78% 76%
Belarus
Belgium 91% 94% 86% 100% 100% 100% 89% 88% 82%
Belize 100% 50% 20%
Benin 99% 93% 96% 46% 36% 41% 15% 14% 10%
Bermuda
Bhutan 87% 76% 27%
Bolivia 99% 100% 95% 46% 51% 44% 1% 6%
Bosnia and Herzegovina 99% 100% 95% 98% 46% 45%
Botswana 99% 100% 100% 70% 79% 68% 11% 15% 6%
Brazil 97% 99% 95% 13% 13% 16%
Brunei Darussalam 100% 93% 91% 93% 40% 41%
Bulgaria 99% 100% 98% 52% 64% 67% 9% 16% 29%
Burkina Faso 95% 100% 95% 32% 34% 28% 3% 9%
Burundi 100% 96% 95% 12% 14% 19% 1%
Cambodia 99% 100% 89% 44% 49% 34% 3% 6% 5%
Cameroon 95% 97% 96% 52% 48% 42% 9% 8% 5%
Canada 95% 94% 98% 95% 92% 92% 51% 59% 53%
Cape Verde 100% 95% 98% 60% 57% 67% 11% 5% 4%
Cayman Islands
Central African Republic
Chad 97% 97% 91% 26% 17% 12% 9% 2% 2%
Chile 100% 99% 98% 17% 26% 46% 2%
China 99% 100% 99% 78% 75% 61% 33% 20% 24%
Colombia 100% 99% 96% 53% 30% 47% 14% 3% 2%
Comoros
Congo, Dem. Rep.
Congo, Rep.
Costa Rica 98% 97% 95% 86% 90% 90% 24% 27% 26%
Cote d'Ivoire 100% 47% 2%
Croatia 100% 99% 100% 67% 78% 84% 22% 25% 39%
Cuba
Curacao
Cyprus 100% 100% 100% 93% 99% 98% 40% 57% 44%
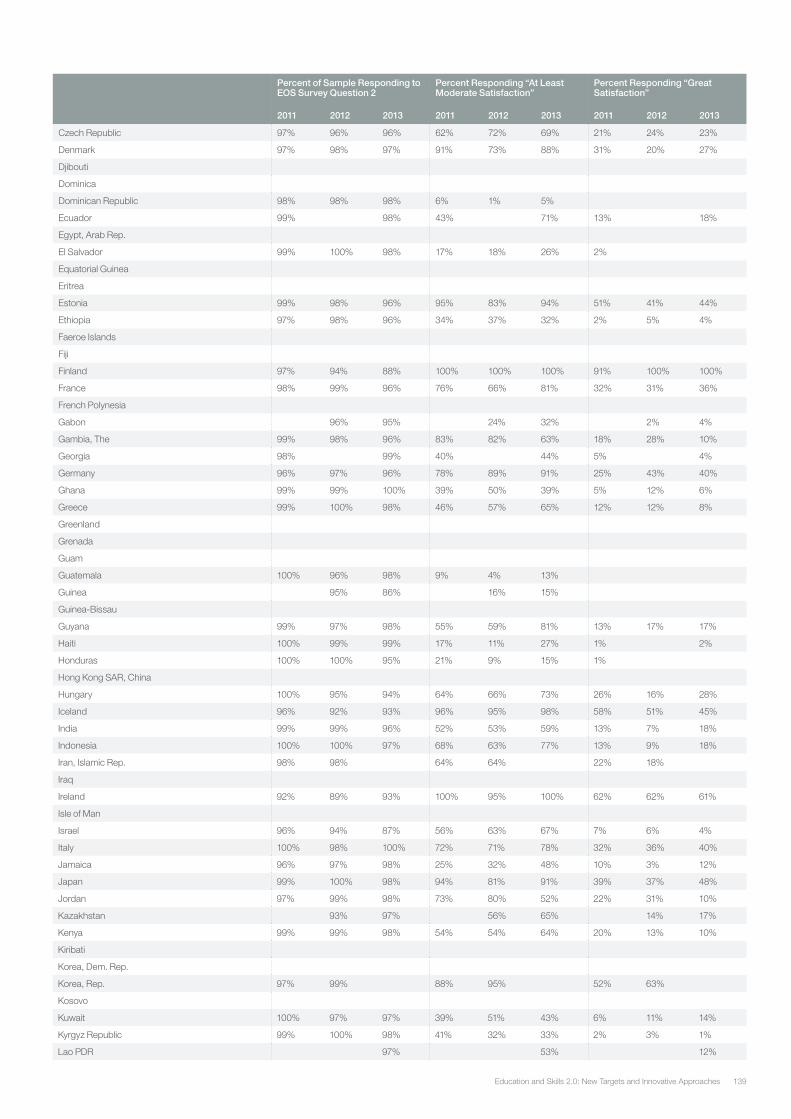
139Education and Skills 2.0: New Targets and Innovative Approaches
Percent of Sample Responding to EOS Survey Question 2
Percent Responding “At Least Moderate Satisfaction”
Percent Responding “Great Satisfaction”
2011 2012 2013 2011 2012 2013 2011 2012 2013
Czech Republic 97% 96% 96% 62% 72% 69% 21% 24% 23%
Denmark 97% 98% 97% 91% 73% 88% 31% 20% 27%
Djibouti
Dominica
Dominican Republic 98% 98% 98% 6% 1% 5%
Ecuador 99% 98% 43% 71% 13% 18%
Egypt, Arab Rep.
El Salvador 99% 100% 98% 17% 18% 26% 2%
Equatorial Guinea
Eritrea
Estonia 99% 98% 96% 95% 83% 94% 51% 41% 44%
Ethiopia 97% 98% 96% 34% 37% 32% 2% 5% 4%
Faeroe Islands
Fiji
Finland 97% 94% 88% 100% 100% 100% 91% 100% 100%
France 98% 99% 96% 76% 66% 81% 32% 31% 36%
French Polynesia
Gabon 96% 95% 24% 32% 2% 4%
Gambia, The 99% 98% 96% 83% 82% 63% 18% 28% 10%
Georgia 98% 99% 40% 44% 5% 4%
Germany 96% 97% 96% 78% 89% 91% 25% 43% 40%
Ghana 99% 99% 100% 39% 50% 39% 5% 12% 6%
Greece 99% 100% 98% 46% 57% 65% 12% 12% 8%
Greenland
Grenada
Guam
Guatemala 100% 96% 98% 9% 4% 13%
Guinea 95% 86% 16% 15%
Guinea-Bissau
Guyana 99% 97% 98% 55% 59% 81% 13% 17% 17%
Haiti 100% 99% 99% 17% 11% 27% 1% 2%
Honduras 100% 100% 95% 21% 9% 15% 1%
Hong Kong SAR, China
Hungary 100% 95% 94% 64% 66% 73% 26% 16% 28%
Iceland 96% 92% 93% 96% 95% 98% 58% 51% 45%
India 99% 99% 96% 52% 53% 59% 13% 7% 18%
Indonesia 100% 100% 97% 68% 63% 77% 13% 9% 18%
Iran, Islamic Rep. 98% 98% 64% 64% 22% 18%
Iraq
Ireland 92% 89% 93% 100% 95% 100% 62% 62% 61%
Isle of Man
Israel 96% 94% 87% 56% 63% 67% 7% 6% 4%
Italy 100% 98% 100% 72% 71% 78% 32% 36% 40%
Jamaica 96% 97% 98% 25% 32% 48% 10% 3% 12%
Japan 99% 100% 98% 94% 81% 91% 39% 37% 48%
Jordan 97% 99% 98% 73% 80% 52% 22% 31% 10%
Kazakhstan 93% 97% 56% 65% 14% 17%
Kenya 99% 99% 98% 54% 54% 64% 20% 13% 10%
Kiribati
Korea, Dem. Rep.
Korea, Rep. 97% 99% 88% 95% 52% 63%
Kosovo
Kuwait 100% 97% 97% 39% 51% 43% 6% 11% 14%
Kyrgyz Republic 99% 100% 98% 41% 32% 33% 2% 3% 1%
Lao PDR 97% 53% 12%
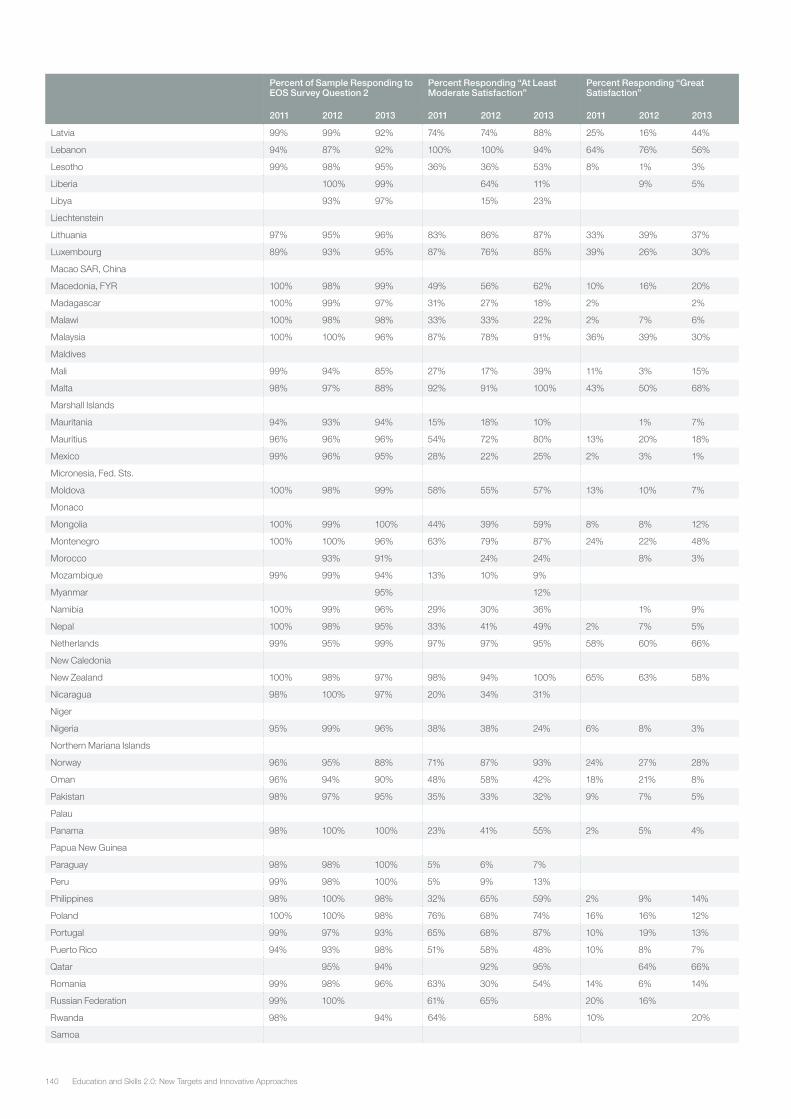
Education and Skills 2.0: New Targets and Innovative Approaches140
Percent of Sample Responding to EOS Survey Question 2
Percent Responding “At Least Moderate Satisfaction”
Percent Responding “Great Satisfaction”
2011 2012 2013 2011 2012 2013 2011 2012 2013
Latvia 99% 99% 92% 74% 74% 88% 25% 16% 44%
Lebanon 94% 87% 92% 100% 100% 94% 64% 76% 56%
Lesotho 99% 98% 95% 36% 36% 53% 8% 1% 3%
Liberia 100% 99% 64% 11% 9% 5%
Libya 93% 97% 15% 23%
Liechtenstein
Lithuania 97% 95% 96% 83% 86% 87% 33% 39% 37%
Luxembourg 89% 93% 95% 87% 76% 85% 39% 26% 30%
Macao SAR, China
Macedonia, FYR 100% 98% 99% 49% 56% 62% 10% 16% 20%
Madagascar 100% 99% 97% 31% 27% 18% 2% 2%
Malawi 100% 98% 98% 33% 33% 22% 2% 7% 6%
Malaysia 100% 100% 96% 87% 78% 91% 36% 39% 30%
Maldives
Mali 99% 94% 85% 27% 17% 39% 11% 3% 15%
Malta 98% 97% 88% 92% 91% 100% 43% 50% 68%
Marshall Islands
Mauritania 94% 93% 94% 15% 18% 10% 1% 7%
Mauritius 96% 96% 96% 54% 72% 80% 13% 20% 18%
Mexico 99% 96% 95% 28% 22% 25% 2% 3% 1%
Micronesia, Fed. Sts.
Moldova 100% 98% 99% 58% 55% 57% 13% 10% 7%
Monaco
Mongolia 100% 99% 100% 44% 39% 59% 8% 8% 12%
Montenegro 100% 100% 96% 63% 79% 87% 24% 22% 48%
Morocco 93% 91% 24% 24% 8% 3%
Mozambique 99% 99% 94% 13% 10% 9%
Myanmar 95% 12%
Namibia 100% 99% 96% 29% 30% 36% 1% 9%
Nepal 100% 98% 95% 33% 41% 49% 2% 7% 5%
Netherlands 99% 95% 99% 97% 97% 95% 58% 60% 66%
New Caledonia
New Zealand 100% 98% 97% 98% 94% 100% 65% 63% 58%
Nicaragua 98% 100% 97% 20% 34% 31%
Niger
Nigeria 95% 99% 96% 38% 38% 24% 6% 8% 3%
Northern Mariana Islands
Norway 96% 95% 88% 71% 87% 93% 24% 27% 28%
Oman 96% 94% 90% 48% 58% 42% 18% 21% 8%
Pakistan 98% 97% 95% 35% 33% 32% 9% 7% 5%
Palau
Panama 98% 100% 100% 23% 41% 55% 2% 5% 4%
Papua New Guinea
Paraguay 98% 98% 100% 5% 6% 7%
Peru 99% 98% 100% 5% 9% 13%
Philippines 98% 100% 98% 32% 65% 59% 2% 9% 14%
Poland 100% 100% 98% 76% 68% 74% 16% 16% 12%
Portugal 99% 97% 93% 65% 68% 87% 10% 19% 13%
Puerto Rico 94% 93% 98% 51% 58% 48% 10% 8% 7%
Qatar 95% 94% 92% 95% 64% 66%
Romania 99% 98% 96% 63% 30% 54% 14% 6% 14%
Russian Federation 99% 100% 61% 65% 20% 16%
Rwanda 98% 94% 64% 58% 10% 20%
Samoa
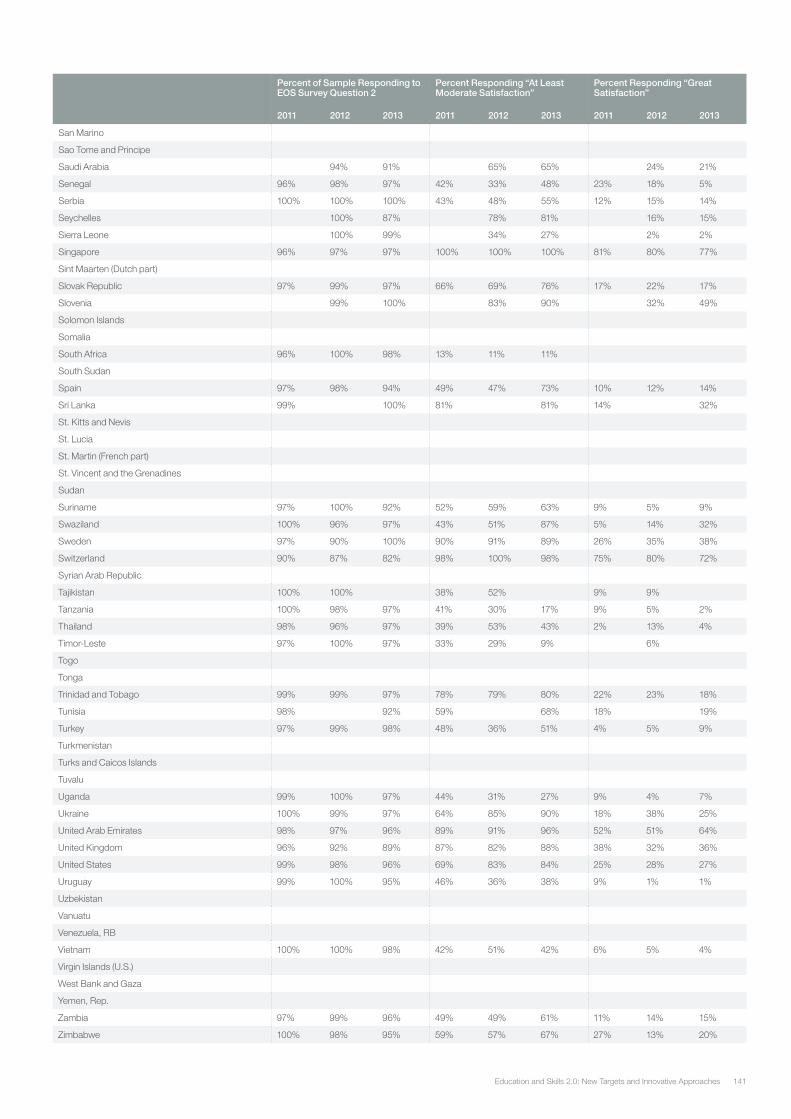
141Education and Skills 2.0: New Targets and Innovative Approaches
Percent of Sample Responding to EOS Survey Question 2
Percent Responding “At Least Moderate Satisfaction”
Percent Responding “Great Satisfaction”
2011 2012 2013 2011 2012 2013 2011 2012 2013
San Marino
Sao Tome and Principe
Saudi Arabia 94% 91% 65% 65% 24% 21%
Senegal 96% 98% 97% 42% 33% 48% 23% 18% 5%
Serbia 100% 100% 100% 43% 48% 55% 12% 15% 14%
Seychelles 100% 87% 78% 81% 16% 15%
Sierra Leone 100% 99% 34% 27% 2% 2%
Singapore 96% 97% 97% 100% 100% 100% 81% 80% 77%
Sint Maarten (Dutch part)
Slovak Republic 97% 99% 97% 66% 69% 76% 17% 22% 17%
Slovenia 99% 100% 83% 90% 32% 49%
Solomon Islands
Somalia
South Africa 96% 100% 98% 13% 11% 11%
South Sudan
Spain 97% 98% 94% 49% 47% 73% 10% 12% 14%
Sri Lanka 99% 100% 81% 81% 14% 32%
St. Kitts and Nevis
St. Lucia
St. Martin (French part)
St. Vincent and the Grenadines
Sudan
Suriname 97% 100% 92% 52% 59% 63% 9% 5% 9%
Swaziland 100% 96% 97% 43% 51% 87% 5% 14% 32%
Sweden 97% 90% 100% 90% 91% 89% 26% 35% 38%
Switzerland 90% 87% 82% 98% 100% 98% 75% 80% 72%
Syrian Arab Republic
Tajikistan 100% 100% 38% 52% 9% 9%
Tanzania 100% 98% 97% 41% 30% 17% 9% 5% 2%
Thailand 98% 96% 97% 39% 53% 43% 2% 13% 4%
Timor-Leste 97% 100% 97% 33% 29% 9% 6%
Togo
Tonga
Trinidad and Tobago 99% 99% 97% 78% 79% 80% 22% 23% 18%
Tunisia 98% 92% 59% 68% 18% 19%
Turkey 97% 99% 98% 48% 36% 51% 4% 5% 9%
Turkmenistan
Turks and Caicos Islands
Tuvalu
Uganda 99% 100% 97% 44% 31% 27% 9% 4% 7%
Ukraine 100% 99% 97% 64% 85% 90% 18% 38% 25%
United Arab Emirates 98% 97% 96% 89% 91% 96% 52% 51% 64%
United Kingdom 96% 92% 89% 87% 82% 88% 38% 32% 36%
United States 99% 98% 96% 69% 83% 84% 25% 28% 27%
Uruguay 99% 100% 95% 46% 36% 38% 9% 1% 1%
Uzbekistan
Vanuatu
Venezuela, RB
Vietnam 100% 100% 98% 42% 51% 42% 6% 5% 4%
Virgin Islands (U.S.)
West Bank and Gaza
Yemen, Rep.
Zambia 97% 99% 96% 49% 49% 61% 11% 14% 15%
Zimbabwe 100% 98% 95% 59% 57% 67% 27% 13% 20%
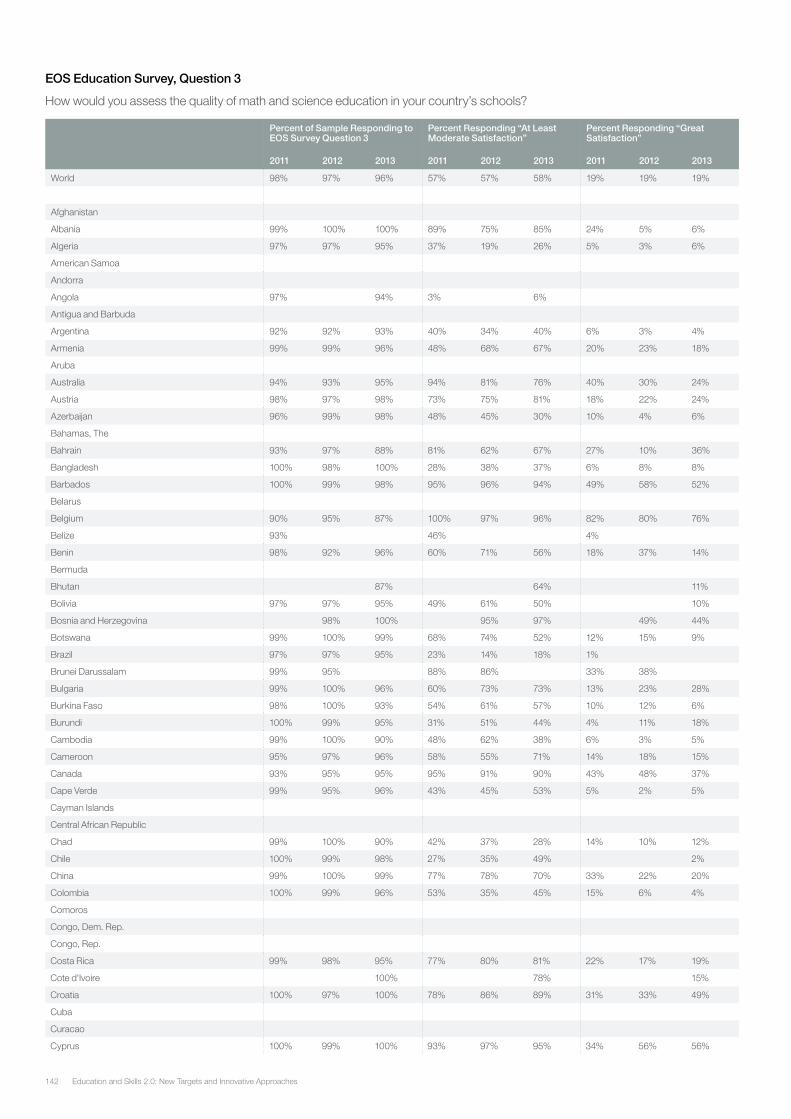
Education and Skills 2.0: New Targets and Innovative Approaches142
EOS Education Survey, Question 3
How would you assess the quality of math and science education in your country’s schools?
Percent of Sample Responding to EOS Survey Question 3
Percent Responding “At Least Moderate Satisfaction”
Percent Responding “Great Satisfaction”
2011 2012 2013 2011 2012 2013 2011 2012 2013
World 98% 97% 96% 57% 57% 58% 19% 19% 19%
Afghanistan
Albania 99% 100% 100% 89% 75% 85% 24% 5% 6%
Algeria 97% 97% 95% 37% 19% 26% 5% 3% 6%
American Samoa
Andorra
Angola 97% 94% 3% 6%
Antigua and Barbuda
Argentina 92% 92% 93% 40% 34% 40% 6% 3% 4%
Armenia 99% 99% 96% 48% 68% 67% 20% 23% 18%
Aruba
Australia 94% 93% 95% 94% 81% 76% 40% 30% 24%
Austria 98% 97% 98% 73% 75% 81% 18% 22% 24%
Azerbaijan 96% 99% 98% 48% 45% 30% 10% 4% 6%
Bahamas, The
Bahrain 93% 97% 88% 81% 62% 67% 27% 10% 36%
Bangladesh 100% 98% 100% 28% 38% 37% 6% 8% 8%
Barbados 100% 99% 98% 95% 96% 94% 49% 58% 52%
Belarus
Belgium 90% 95% 87% 100% 97% 96% 82% 80% 76%
Belize 93% 46% 4%
Benin 98% 92% 96% 60% 71% 56% 18% 37% 14%
Bermuda
Bhutan 87% 64% 11%
Bolivia 97% 97% 95% 49% 61% 50% 10%
Bosnia and Herzegovina 98% 100% 95% 97% 49% 44%
Botswana 99% 100% 99% 68% 74% 52% 12% 15% 9%
Brazil 97% 97% 95% 23% 14% 18% 1%
Brunei Darussalam 99% 95% 88% 86% 33% 38%
Bulgaria 99% 100% 96% 60% 73% 73% 13% 23% 28%
Burkina Faso 98% 100% 93% 54% 61% 57% 10% 12% 6%
Burundi 100% 99% 95% 31% 51% 44% 4% 11% 18%
Cambodia 99% 100% 90% 48% 62% 38% 6% 3% 5%
Cameroon 95% 97% 96% 58% 55% 71% 14% 18% 15%
Canada 93% 95% 95% 95% 91% 90% 43% 48% 37%
Cape Verde 99% 95% 96% 43% 45% 53% 5% 2% 5%
Cayman Islands
Central African Republic
Chad 99% 100% 90% 42% 37% 28% 14% 10% 12%
Chile 100% 99% 98% 27% 35% 49% 2%
China 99% 100% 99% 77% 78% 70% 33% 22% 20%
Colombia 100% 99% 96% 53% 35% 45% 15% 6% 4%
Comoros
Congo, Dem. Rep.
Congo, Rep.
Costa Rica 99% 98% 95% 77% 80% 81% 22% 17% 19%
Cote d'Ivoire 100% 78% 15%
Croatia 100% 97% 100% 78% 86% 89% 31% 33% 49%
Cuba
Curacao
Cyprus 100% 99% 100% 93% 97% 95% 34% 56% 56%
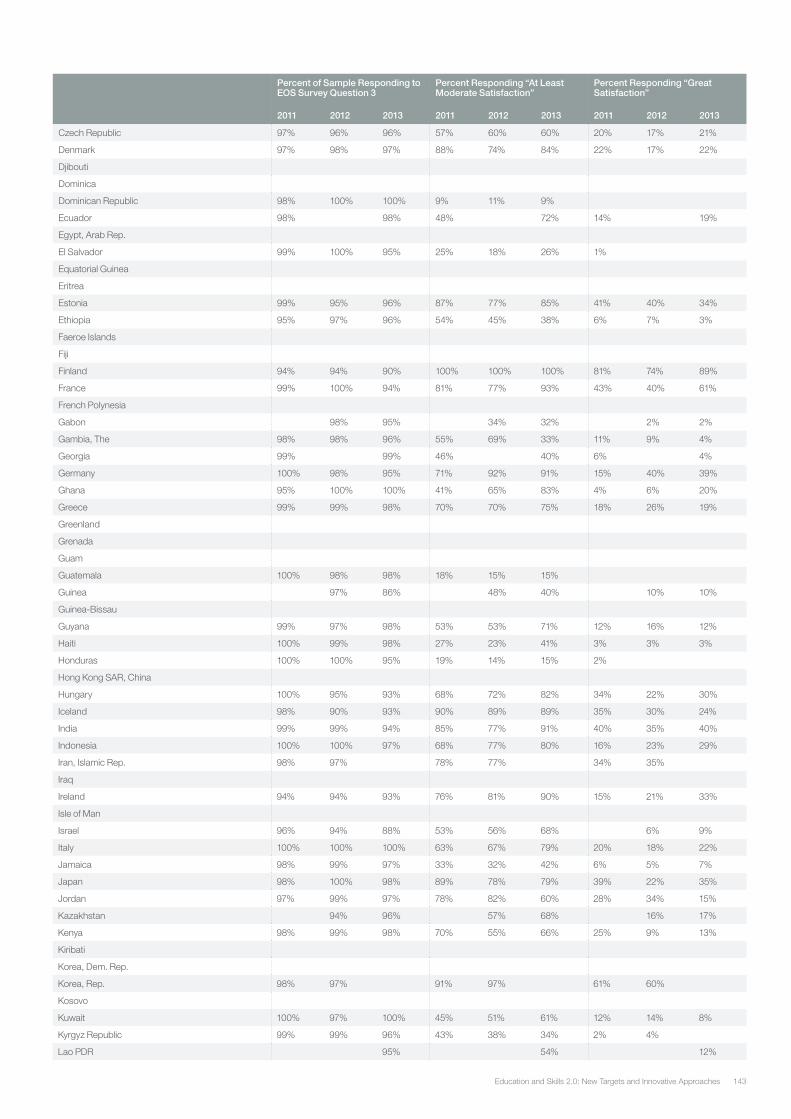
143Education and Skills 2.0: New Targets and Innovative Approaches
Percent of Sample Responding to EOS Survey Question 3
Percent Responding “At Least Moderate Satisfaction”
Percent Responding “Great Satisfaction”
2011 2012 2013 2011 2012 2013 2011 2012 2013
Czech Republic 97% 96% 96% 57% 60% 60% 20% 17% 21%
Denmark 97% 98% 97% 88% 74% 84% 22% 17% 22%
Djibouti
Dominica
Dominican Republic 98% 100% 100% 9% 11% 9%
Ecuador 98% 98% 48% 72% 14% 19%
Egypt, Arab Rep.
El Salvador 99% 100% 95% 25% 18% 26% 1%
Equatorial Guinea
Eritrea
Estonia 99% 95% 96% 87% 77% 85% 41% 40% 34%
Ethiopia 95% 97% 96% 54% 45% 38% 6% 7% 3%
Faeroe Islands
Fiji
Finland 94% 94% 90% 100% 100% 100% 81% 74% 89%
France 99% 100% 94% 81% 77% 93% 43% 40% 61%
French Polynesia
Gabon 98% 95% 34% 32% 2% 2%
Gambia, The 98% 98% 96% 55% 69% 33% 11% 9% 4%
Georgia 99% 99% 46% 40% 6% 4%
Germany 100% 98% 95% 71% 92% 91% 15% 40% 39%
Ghana 95% 100% 100% 41% 65% 83% 4% 6% 20%
Greece 99% 99% 98% 70% 70% 75% 18% 26% 19%
Greenland
Grenada
Guam
Guatemala 100% 98% 98% 18% 15% 15%
Guinea 97% 86% 48% 40% 10% 10%
Guinea-Bissau
Guyana 99% 97% 98% 53% 53% 71% 12% 16% 12%
Haiti 100% 99% 98% 27% 23% 41% 3% 3% 3%
Honduras 100% 100% 95% 19% 14% 15% 2%
Hong Kong SAR, China
Hungary 100% 95% 93% 68% 72% 82% 34% 22% 30%
Iceland 98% 90% 93% 90% 89% 89% 35% 30% 24%
India 99% 99% 94% 85% 77% 91% 40% 35% 40%
Indonesia 100% 100% 97% 68% 77% 80% 16% 23% 29%
Iran, Islamic Rep. 98% 97% 78% 77% 34% 35%
Iraq
Ireland 94% 94% 93% 76% 81% 90% 15% 21% 33%
Isle of Man
Israel 96% 94% 88% 53% 56% 68% 6% 9%
Italy 100% 100% 100% 63% 67% 79% 20% 18% 22%
Jamaica 98% 99% 97% 33% 32% 42% 6% 5% 7%
Japan 98% 100% 98% 89% 78% 79% 39% 22% 35%
Jordan 97% 99% 97% 78% 82% 60% 28% 34% 15%
Kazakhstan 94% 96% 57% 68% 16% 17%
Kenya 98% 99% 98% 70% 55% 66% 25% 9% 13%
Kiribati
Korea, Dem. Rep.
Korea, Rep. 98% 97% 91% 97% 61% 60%
Kosovo
Kuwait 100% 97% 100% 45% 51% 61% 12% 14% 8%
Kyrgyz Republic 99% 99% 96% 43% 38% 34% 2% 4%
Lao PDR 95% 54% 12%
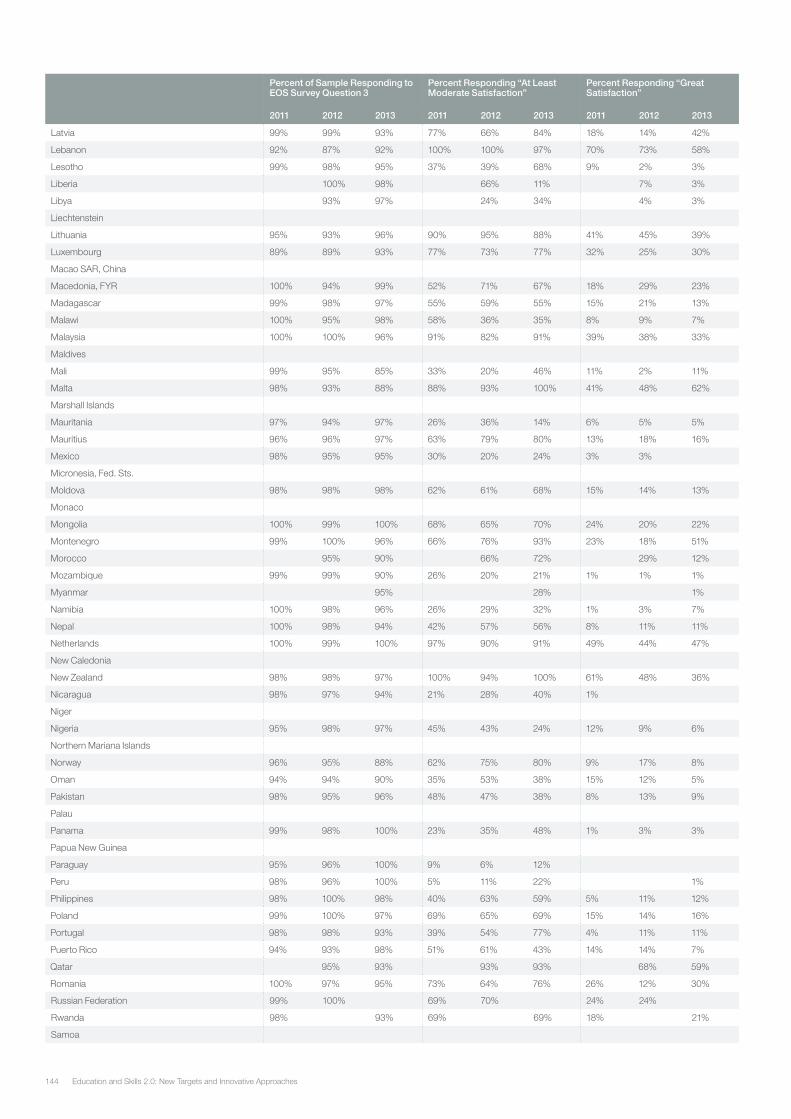
Education and Skills 2.0: New Targets and Innovative Approaches144
Percent of Sample Responding to EOS Survey Question 3
Percent Responding “At Least Moderate Satisfaction”
Percent Responding “Great Satisfaction”
2011 2012 2013 2011 2012 2013 2011 2012 2013
Latvia 99% 99% 93% 77% 66% 84% 18% 14% 42%
Lebanon 92% 87% 92% 100% 100% 97% 70% 73% 58%
Lesotho 99% 98% 95% 37% 39% 68% 9% 2% 3%
Liberia 100% 98% 66% 11% 7% 3%
Libya 93% 97% 24% 34% 4% 3%
Liechtenstein
Lithuania 95% 93% 96% 90% 95% 88% 41% 45% 39%
Luxembourg 89% 89% 93% 77% 73% 77% 32% 25% 30%
Macao SAR, China
Macedonia, FYR 100% 94% 99% 52% 71% 67% 18% 29% 23%
Madagascar 99% 98% 97% 55% 59% 55% 15% 21% 13%
Malawi 100% 95% 98% 58% 36% 35% 8% 9% 7%
Malaysia 100% 100% 96% 91% 82% 91% 39% 38% 33%
Maldives
Mali 99% 95% 85% 33% 20% 46% 11% 2% 11%
Malta 98% 93% 88% 88% 93% 100% 41% 48% 62%
Marshall Islands
Mauritania 97% 94% 97% 26% 36% 14% 6% 5% 5%
Mauritius 96% 96% 97% 63% 79% 80% 13% 18% 16%
Mexico 98% 95% 95% 30% 20% 24% 3% 3%
Micronesia, Fed. Sts.
Moldova 98% 98% 98% 62% 61% 68% 15% 14% 13%
Monaco
Mongolia 100% 99% 100% 68% 65% 70% 24% 20% 22%
Montenegro 99% 100% 96% 66% 76% 93% 23% 18% 51%
Morocco 95% 90% 66% 72% 29% 12%
Mozambique 99% 99% 90% 26% 20% 21% 1% 1% 1%
Myanmar 95% 28% 1%
Namibia 100% 98% 96% 26% 29% 32% 1% 3% 7%
Nepal 100% 98% 94% 42% 57% 56% 8% 11% 11%
Netherlands 100% 99% 100% 97% 90% 91% 49% 44% 47%
New Caledonia
New Zealand 98% 98% 97% 100% 94% 100% 61% 48% 36%
Nicaragua 98% 97% 94% 21% 28% 40% 1%
Niger
Nigeria 95% 98% 97% 45% 43% 24% 12% 9% 6%
Northern Mariana Islands
Norway 96% 95% 88% 62% 75% 80% 9% 17% 8%
Oman 94% 94% 90% 35% 53% 38% 15% 12% 5%
Pakistan 98% 95% 96% 48% 47% 38% 8% 13% 9%
Palau
Panama 99% 98% 100% 23% 35% 48% 1% 3% 3%
Papua New Guinea
Paraguay 95% 96% 100% 9% 6% 12%
Peru 98% 96% 100% 5% 11% 22% 1%
Philippines 98% 100% 98% 40% 63% 59% 5% 11% 12%
Poland 99% 100% 97% 69% 65% 69% 15% 14% 16%
Portugal 98% 98% 93% 39% 54% 77% 4% 11% 11%
Puerto Rico 94% 93% 98% 51% 61% 43% 14% 14% 7%
Qatar 95% 93% 93% 93% 68% 59%
Romania 100% 97% 95% 73% 64% 76% 26% 12% 30%
Russian Federation 99% 100% 69% 70% 24% 24%
Rwanda 98% 93% 69% 69% 18% 21%
Samoa

145Education and Skills 2.0: New Targets and Innovative Approaches
Percent of Sample Responding to EOS Survey Question 3
Percent Responding “At Least Moderate Satisfaction”
Percent Responding “Great Satisfaction”
2011 2012 2013 2011 2012 2013 2011 2012 2013
San Marino
Sao Tome and Principe
Saudi Arabia 91% 91% 69% 66% 23% 23%
Senegal 98% 84% 96% 50% 47% 77% 24% 23% 16%
Serbia 100% 100% 100% 58% 63% 70% 19% 28% 28%
Seychelles 97% 84% 71% 81% 16% 15%
Sierra Leone 100% 99% 21% 22% 5%
Singapore 97% 97% 97% 100% 100% 100% 89% 90% 90%
Sint Maarten (Dutch part)
Slovak Republic 97% 97% 98% 59% 58% 62% 17% 11% 16%
Slovenia 98% 100% 88% 92% 36% 48%
Solomon Islands
Somalia
South Africa 96% 100% 98% 13% 7% 7% 2%
South Sudan
Spain 97% 98% 92% 46% 45% 61% 9% 11% 9%
Sri Lanka 99% 100% 74% 82% 11% 38%
St. Kitts and Nevis
St. Lucia
St. Martin (French part)
St. Vincent and the Grenadines
Sudan
Suriname 100% 97% 88% 50% 53% 64% 9% 11% 9%
Swaziland 100% 96% 97% 35% 49% 71% 5% 8% 10%
Sweden 97% 92% 98% 84% 79% 80% 19% 24% 18%
Switzerland 91% 91% 80% 96% 100% 100% 72% 65% 65%
Syrian Arab Republic
Tajikistan 100% 100% 38% 56% 10% 10%
Tanzania 99% 96% 98% 33% 23% 13% 1% 4%
Thailand 98% 95% 97% 59% 63% 52% 13% 27% 7%
Timor-Leste 100% 100% 97% 35% 23% 12% 9%
Togo
Tonga
Trinidad and Tobago 99% 99% 95% 74% 72% 80% 25% 26% 21%
Tunisia 98% 92% 79% 81% 33% 38%
Turkey 97% 99% 98% 55% 40% 52% 10% 7% 12%
Turkmenistan
Turks and Caicos Islands
Tuvalu
Uganda 98% 100% 97% 42% 38% 33% 8% 7% 4%
Ukraine 99% 100% 99% 76% 87% 93% 25% 46% 28%
United Arab Emirates 98% 97% 96% 90% 91% 97% 51% 51% 59%
United Kingdom 95% 93% 89% 76% 76% 79% 24% 26% 20%
United States 99% 97% 96% 65% 78% 78% 20% 22% 18%
Uruguay 98% 100% 92% 34% 19% 28% 6% 2%
Uzbekistan
Vanuatu
Venezuela, RB
Vietnam 100% 100% 98% 63% 69% 59% 15% 17% 7%
Virgin Islands (U.S.)
West Bank and Gaza
Yemen, Rep.
Zambia 97% 99% 96% 54% 60% 67% 16% 25% 20%
Zimbabwe 100% 98% 95% 70% 62% 67% 25% 22% 24%
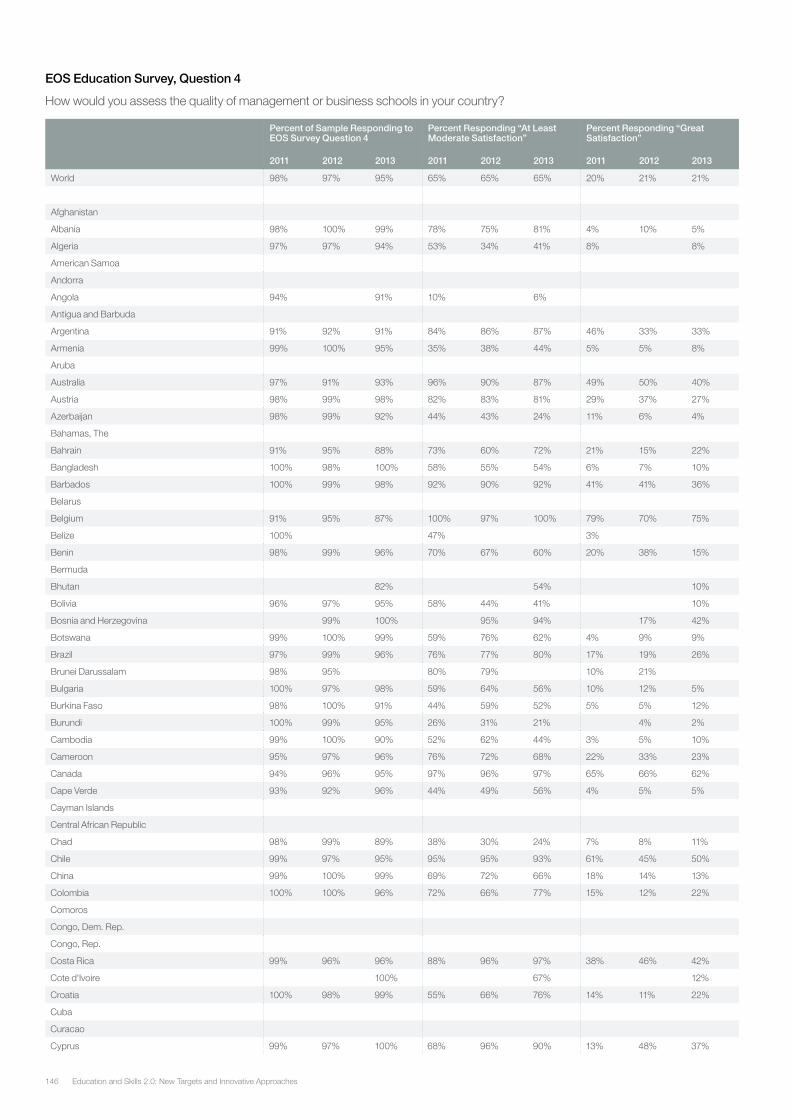
Education and Skills 2.0: New Targets and Innovative Approaches146
EOS Education Survey, Question 4
How would you assess the quality of management or business schools in your country?
Percent of Sample Responding to EOS Survey Question 4
Percent Responding “At Least Moderate Satisfaction”
Percent Responding “Great Satisfaction”
2011 2012 2013 2011 2012 2013 2011 2012 2013
World 98% 97% 95% 65% 65% 65% 20% 21% 21%
Afghanistan
Albania 98% 100% 99% 78% 75% 81% 4% 10% 5%
Algeria 97% 97% 94% 53% 34% 41% 8% 8%
American Samoa
Andorra
Angola 94% 91% 10% 6%
Antigua and Barbuda
Argentina 91% 92% 91% 84% 86% 87% 46% 33% 33%
Armenia 99% 100% 95% 35% 38% 44% 5% 5% 8%
Aruba
Australia 97% 91% 93% 96% 90% 87% 49% 50% 40%
Austria 98% 99% 98% 82% 83% 81% 29% 37% 27%
Azerbaijan 98% 99% 92% 44% 43% 24% 11% 6% 4%
Bahamas, The
Bahrain 91% 95% 88% 73% 60% 72% 21% 15% 22%
Bangladesh 100% 98% 100% 58% 55% 54% 6% 7% 10%
Barbados 100% 99% 98% 92% 90% 92% 41% 41% 36%
Belarus
Belgium 91% 95% 87% 100% 97% 100% 79% 70% 75%
Belize 100% 47% 3%
Benin 98% 99% 96% 70% 67% 60% 20% 38% 15%
Bermuda
Bhutan 82% 54% 10%
Bolivia 96% 97% 95% 58% 44% 41% 10%
Bosnia and Herzegovina 99% 100% 95% 94% 17% 42%
Botswana 99% 100% 99% 59% 76% 62% 4% 9% 9%
Brazil 97% 99% 96% 76% 77% 80% 17% 19% 26%
Brunei Darussalam 98% 95% 80% 79% 10% 21%
Bulgaria 100% 97% 98% 59% 64% 56% 10% 12% 5%
Burkina Faso 98% 100% 91% 44% 59% 52% 5% 5% 12%
Burundi 100% 99% 95% 26% 31% 21% 4% 2%
Cambodia 99% 100% 90% 52% 62% 44% 3% 5% 10%
Cameroon 95% 97% 96% 76% 72% 68% 22% 33% 23%
Canada 94% 96% 95% 97% 96% 97% 65% 66% 62%
Cape Verde 93% 92% 96% 44% 49% 56% 4% 5% 5%
Cayman Islands
Central African Republic
Chad 98% 99% 89% 38% 30% 24% 7% 8% 11%
Chile 99% 97% 95% 95% 95% 93% 61% 45% 50%
China 99% 100% 99% 69% 72% 66% 18% 14% 13%
Colombia 100% 100% 96% 72% 66% 77% 15% 12% 22%
Comoros
Congo, Dem. Rep.
Congo, Rep.
Costa Rica 99% 96% 96% 88% 96% 97% 38% 46% 42%
Cote d'Ivoire 100% 67% 12%
Croatia 100% 98% 99% 55% 66% 76% 14% 11% 22%
Cuba
Curacao
Cyprus 99% 97% 100% 68% 96% 90% 13% 48% 37%
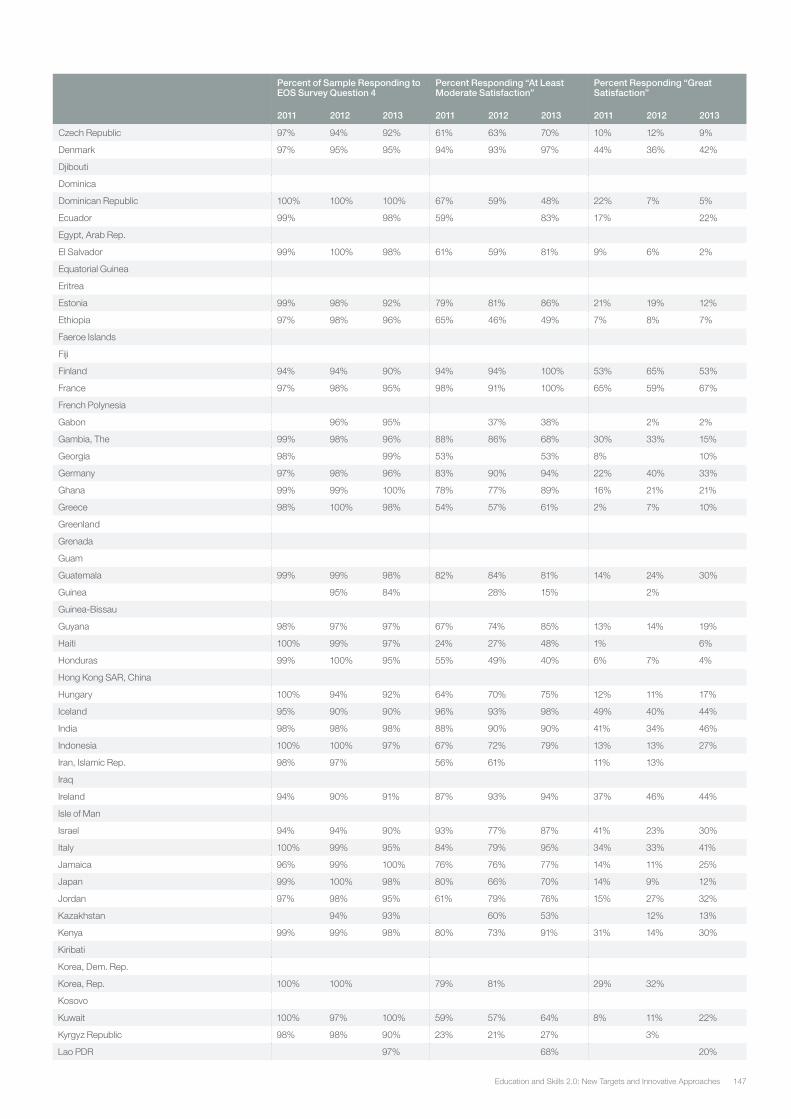
147Education and Skills 2.0: New Targets and Innovative Approaches
Percent of Sample Responding to EOS Survey Question 4
Percent Responding “At Least Moderate Satisfaction”
Percent Responding “Great Satisfaction”
2011 2012 2013 2011 2012 2013 2011 2012 2013
Czech Republic 97% 94% 92% 61% 63% 70% 10% 12% 9%
Denmark 97% 95% 95% 94% 93% 97% 44% 36% 42%
Djibouti
Dominica
Dominican Republic 100% 100% 100% 67% 59% 48% 22% 7% 5%
Ecuador 99% 98% 59% 83% 17% 22%
Egypt, Arab Rep.
El Salvador 99% 100% 98% 61% 59% 81% 9% 6% 2%
Equatorial Guinea
Eritrea
Estonia 99% 98% 92% 79% 81% 86% 21% 19% 12%
Ethiopia 97% 98% 96% 65% 46% 49% 7% 8% 7%
Faeroe Islands
Fiji
Finland 94% 94% 90% 94% 94% 100% 53% 65% 53%
France 97% 98% 95% 98% 91% 100% 65% 59% 67%
French Polynesia
Gabon 96% 95% 37% 38% 2% 2%
Gambia, The 99% 98% 96% 88% 86% 68% 30% 33% 15%
Georgia 98% 99% 53% 53% 8% 10%
Germany 97% 98% 96% 83% 90% 94% 22% 40% 33%
Ghana 99% 99% 100% 78% 77% 89% 16% 21% 21%
Greece 98% 100% 98% 54% 57% 61% 2% 7% 10%
Greenland
Grenada
Guam
Guatemala 99% 99% 98% 82% 84% 81% 14% 24% 30%
Guinea 95% 84% 28% 15% 2%
Guinea-Bissau
Guyana 98% 97% 97% 67% 74% 85% 13% 14% 19%
Haiti 100% 99% 97% 24% 27% 48% 1% 6%
Honduras 99% 100% 95% 55% 49% 40% 6% 7% 4%
Hong Kong SAR, China
Hungary 100% 94% 92% 64% 70% 75% 12% 11% 17%
Iceland 95% 90% 90% 96% 93% 98% 49% 40% 44%
India 98% 98% 98% 88% 90% 90% 41% 34% 46%
Indonesia 100% 100% 97% 67% 72% 79% 13% 13% 27%
Iran, Islamic Rep. 98% 97% 56% 61% 11% 13%
Iraq
Ireland 94% 90% 91% 87% 93% 94% 37% 46% 44%
Isle of Man
Israel 94% 94% 90% 93% 77% 87% 41% 23% 30%
Italy 100% 99% 95% 84% 79% 95% 34% 33% 41%
Jamaica 96% 99% 100% 76% 76% 77% 14% 11% 25%
Japan 99% 100% 98% 80% 66% 70% 14% 9% 12%
Jordan 97% 98% 95% 61% 79% 76% 15% 27% 32%
Kazakhstan 94% 93% 60% 53% 12% 13%
Kenya 99% 99% 98% 80% 73% 91% 31% 14% 30%
Kiribati
Korea, Dem. Rep.
Korea, Rep. 100% 100% 79% 81% 29% 32%
Kosovo
Kuwait 100% 97% 100% 59% 57% 64% 8% 11% 22%
Kyrgyz Republic 98% 98% 90% 23% 21% 27% 3%
Lao PDR 97% 68% 20%
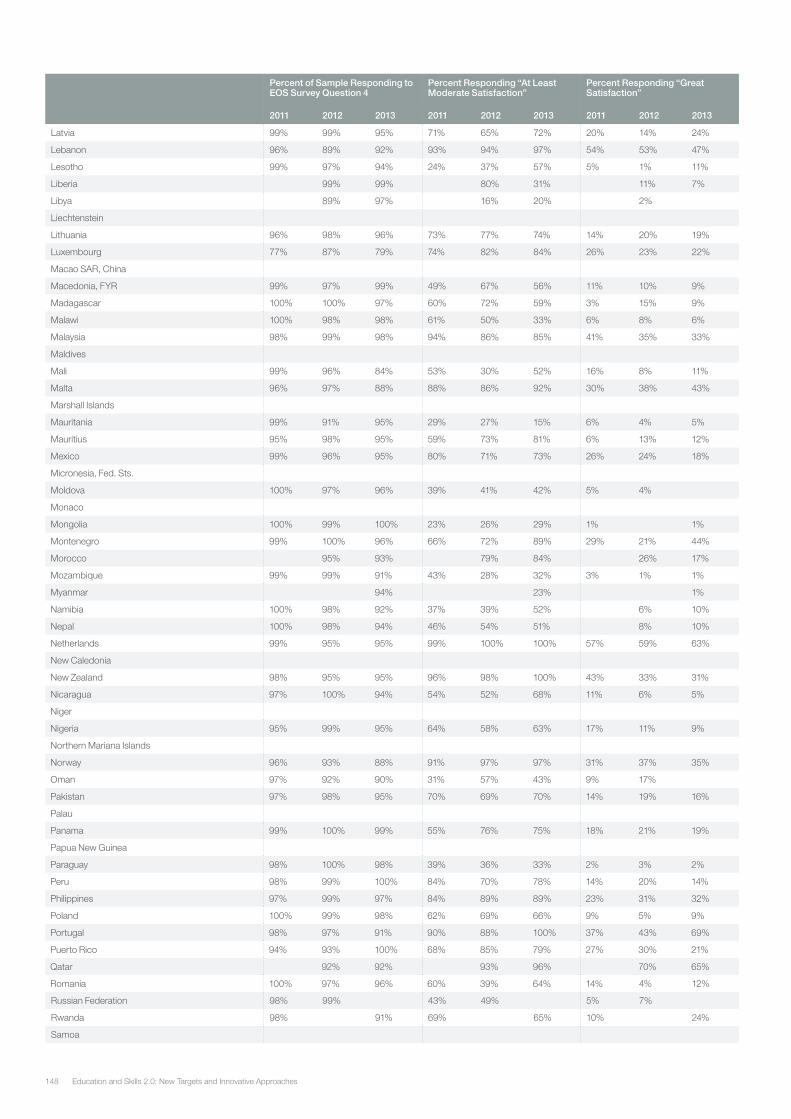
Education and Skills 2.0: New Targets and Innovative Approaches148
Percent of Sample Responding to EOS Survey Question 4
Percent Responding “At Least Moderate Satisfaction”
Percent Responding “Great Satisfaction”
2011 2012 2013 2011 2012 2013 2011 2012 2013
Latvia 99% 99% 95% 71% 65% 72% 20% 14% 24%
Lebanon 96% 89% 92% 93% 94% 97% 54% 53% 47%
Lesotho 99% 97% 94% 24% 37% 57% 5% 1% 11%
Liberia 99% 99% 80% 31% 11% 7%
Libya 89% 97% 16% 20% 2%
Liechtenstein
Lithuania 96% 98% 96% 73% 77% 74% 14% 20% 19%
Luxembourg 77% 87% 79% 74% 82% 84% 26% 23% 22%
Macao SAR, China
Macedonia, FYR 99% 97% 99% 49% 67% 56% 11% 10% 9%
Madagascar 100% 100% 97% 60% 72% 59% 3% 15% 9%
Malawi 100% 98% 98% 61% 50% 33% 6% 8% 6%
Malaysia 98% 99% 98% 94% 86% 85% 41% 35% 33%
Maldives
Mali 99% 96% 84% 53% 30% 52% 16% 8% 11%
Malta 96% 97% 88% 88% 86% 92% 30% 38% 43%
Marshall Islands
Mauritania 99% 91% 95% 29% 27% 15% 6% 4% 5%
Mauritius 95% 98% 95% 59% 73% 81% 6% 13% 12%
Mexico 99% 96% 95% 80% 71% 73% 26% 24% 18%
Micronesia, Fed. Sts.
Moldova 100% 97% 96% 39% 41% 42% 5% 4%
Monaco
Mongolia 100% 99% 100% 23% 26% 29% 1% 1%
Montenegro 99% 100% 96% 66% 72% 89% 29% 21% 44%
Morocco 95% 93% 79% 84% 26% 17%
Mozambique 99% 99% 91% 43% 28% 32% 3% 1% 1%
Myanmar 94% 23% 1%
Namibia 100% 98% 92% 37% 39% 52% 6% 10%
Nepal 100% 98% 94% 46% 54% 51% 8% 10%
Netherlands 99% 95% 95% 99% 100% 100% 57% 59% 63%
New Caledonia
New Zealand 98% 95% 95% 96% 98% 100% 43% 33% 31%
Nicaragua 97% 100% 94% 54% 52% 68% 11% 6% 5%
Niger
Nigeria 95% 99% 95% 64% 58% 63% 17% 11% 9%
Northern Mariana Islands
Norway 96% 93% 88% 91% 97% 97% 31% 37% 35%
Oman 97% 92% 90% 31% 57% 43% 9% 17%
Pakistan 97% 98% 95% 70% 69% 70% 14% 19% 16%
Palau
Panama 99% 100% 99% 55% 76% 75% 18% 21% 19%
Papua New Guinea
Paraguay 98% 100% 98% 39% 36% 33% 2% 3% 2%
Peru 98% 99% 100% 84% 70% 78% 14% 20% 14%
Philippines 97% 99% 97% 84% 89% 89% 23% 31% 32%
Poland 100% 99% 98% 62% 69% 66% 9% 5% 9%
Portugal 98% 97% 91% 90% 88% 100% 37% 43% 69%
Puerto Rico 94% 93% 100% 68% 85% 79% 27% 30% 21%
Qatar 92% 92% 93% 96% 70% 65%
Romania 100% 97% 96% 60% 39% 64% 14% 4% 12%
Russian Federation 98% 99% 43% 49% 5% 7%
Rwanda 98% 91% 69% 65% 10% 24%
Samoa
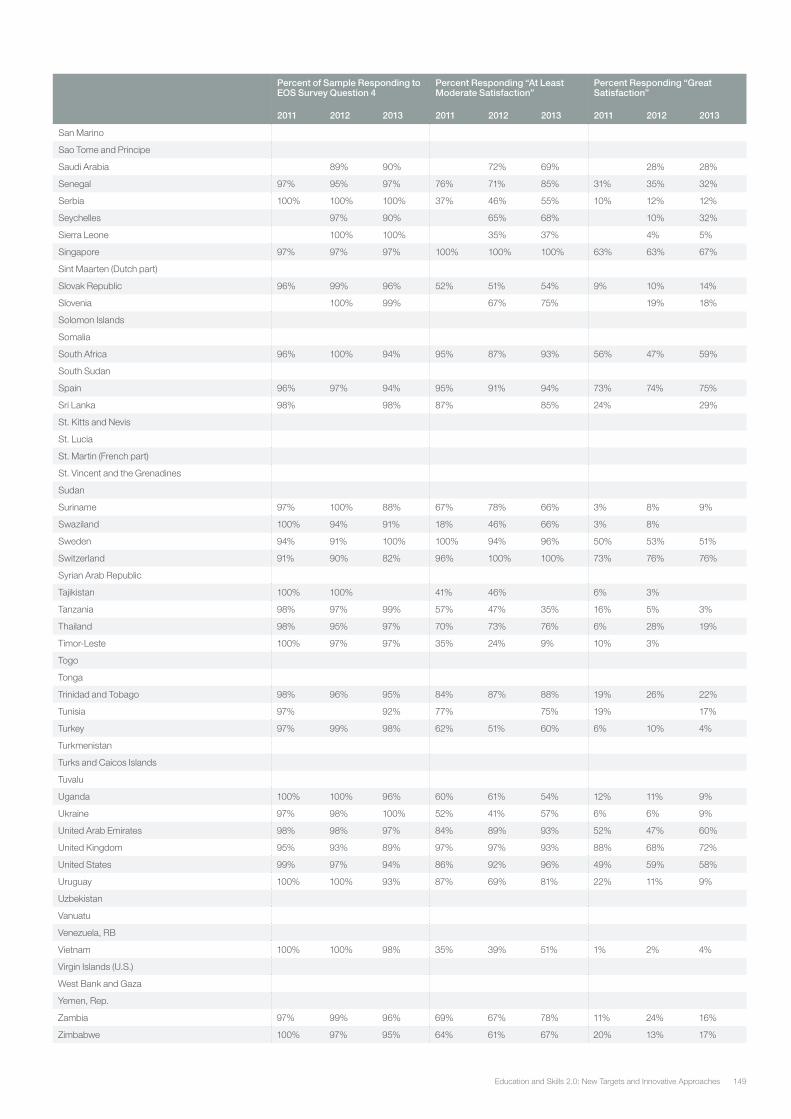
149Education and Skills 2.0: New Targets and Innovative Approaches
Percent of Sample Responding to EOS Survey Question 4
Percent Responding “At Least Moderate Satisfaction”
Percent Responding “Great Satisfaction”
2011 2012 2013 2011 2012 2013 2011 2012 2013
San Marino
Sao Tome and Principe
Saudi Arabia 89% 90% 72% 69% 28% 28%
Senegal 97% 95% 97% 76% 71% 85% 31% 35% 32%
Serbia 100% 100% 100% 37% 46% 55% 10% 12% 12%
Seychelles 97% 90% 65% 68% 10% 32%
Sierra Leone 100% 100% 35% 37% 4% 5%
Singapore 97% 97% 97% 100% 100% 100% 63% 63% 67%
Sint Maarten (Dutch part)
Slovak Republic 96% 99% 96% 52% 51% 54% 9% 10% 14%
Slovenia 100% 99% 67% 75% 19% 18%
Solomon Islands
Somalia
South Africa 96% 100% 94% 95% 87% 93% 56% 47% 59%
South Sudan
Spain 96% 97% 94% 95% 91% 94% 73% 74% 75%
Sri Lanka 98% 98% 87% 85% 24% 29%
St. Kitts and Nevis
St. Lucia
St. Martin (French part)
St. Vincent and the Grenadines
Sudan
Suriname 97% 100% 88% 67% 78% 66% 3% 8% 9%
Swaziland 100% 94% 91% 18% 46% 66% 3% 8%
Sweden 94% 91% 100% 100% 94% 96% 50% 53% 51%
Switzerland 91% 90% 82% 96% 100% 100% 73% 76% 76%
Syrian Arab Republic
Tajikistan 100% 100% 41% 46% 6% 3%
Tanzania 98% 97% 99% 57% 47% 35% 16% 5% 3%
Thailand 98% 95% 97% 70% 73% 76% 6% 28% 19%
Timor-Leste 100% 97% 97% 35% 24% 9% 10% 3%
Togo
Tonga
Trinidad and Tobago 98% 96% 95% 84% 87% 88% 19% 26% 22%
Tunisia 97% 92% 77% 75% 19% 17%
Turkey 97% 99% 98% 62% 51% 60% 6% 10% 4%
Turkmenistan
Turks and Caicos Islands
Tuvalu
Uganda 100% 100% 96% 60% 61% 54% 12% 11% 9%
Ukraine 97% 98% 100% 52% 41% 57% 6% 6% 9%
United Arab Emirates 98% 98% 97% 84% 89% 93% 52% 47% 60%
United Kingdom 95% 93% 89% 97% 97% 93% 88% 68% 72%
United States 99% 97% 94% 86% 92% 96% 49% 59% 58%
Uruguay 100% 100% 93% 87% 69% 81% 22% 11% 9%
Uzbekistan
Vanuatu
Venezuela, RB
Vietnam 100% 100% 98% 35% 39% 51% 1% 2% 4%
Virgin Islands (U.S.)
West Bank and Gaza
Yemen, Rep.
Zambia 97% 99% 96% 69% 67% 78% 11% 24% 16%
Zimbabwe 100% 97% 95% 64% 61% 67% 20% 13% 17%
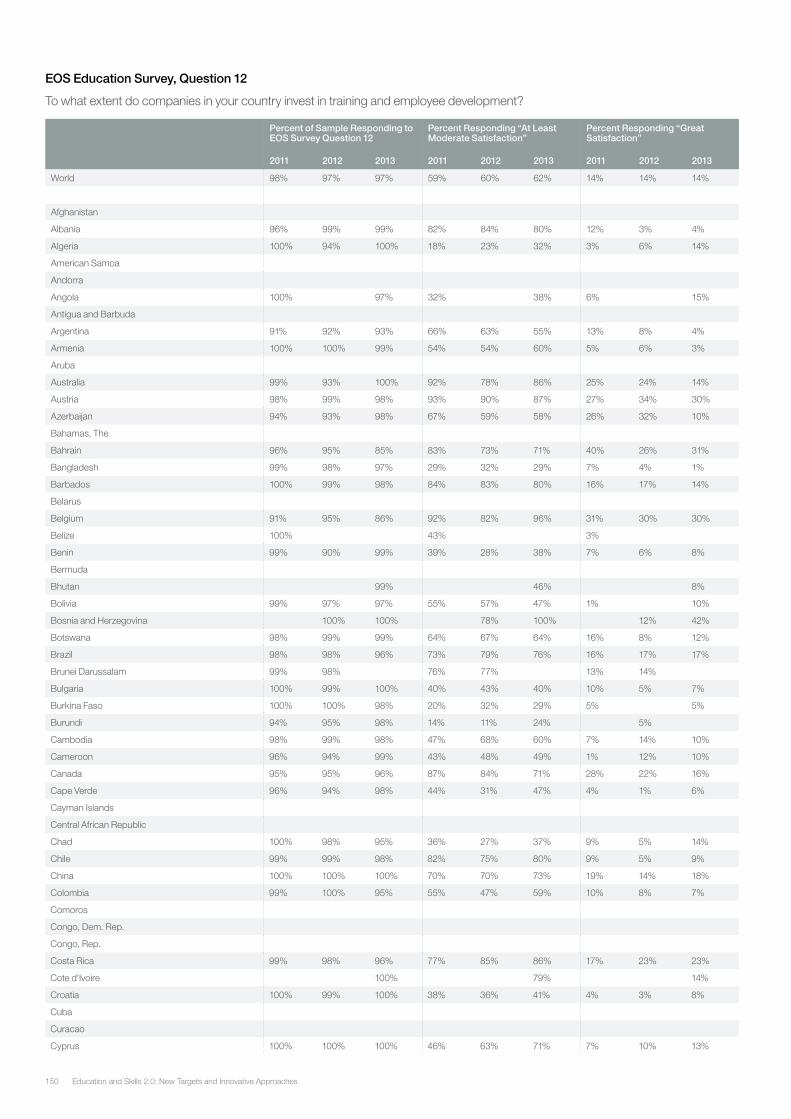
Education and Skills 2.0: New Targets and Innovative Approaches150
EOS Education Survey, Question 12
To what extent do companies in your country invest in training and employee development?
Percent of Sample Responding to EOS Survey Question 12
Percent Responding “At Least Moderate Satisfaction”
Percent Responding “Great Satisfaction”
2011 2012 2013 2011 2012 2013 2011 2012 2013
World 98% 97% 97% 59% 60% 62% 14% 14% 14%
Afghanistan
Albania 96% 99% 99% 82% 84% 80% 12% 3% 4%
Algeria 100% 94% 100% 18% 23% 32% 3% 6% 14%
American Samoa
Andorra
Angola 100% 97% 32% 38% 6% 15%
Antigua and Barbuda
Argentina 91% 92% 93% 66% 63% 55% 13% 8% 4%
Armenia 100% 100% 99% 54% 54% 60% 5% 6% 3%
Aruba
Australia 99% 93% 100% 92% 78% 86% 25% 24% 14%
Austria 98% 99% 98% 93% 90% 87% 27% 34% 30%
Azerbaijan 94% 93% 98% 67% 59% 58% 26% 32% 10%
Bahamas, The
Bahrain 96% 95% 85% 83% 73% 71% 40% 26% 31%
Bangladesh 99% 98% 97% 29% 32% 29% 7% 4% 1%
Barbados 100% 99% 98% 84% 83% 80% 16% 17% 14%
Belarus
Belgium 91% 95% 86% 92% 82% 96% 31% 30% 30%
Belize 100% 43% 3%
Benin 99% 90% 99% 39% 28% 38% 7% 6% 8%
Bermuda
Bhutan 99% 46% 8%
Bolivia 99% 97% 97% 55% 57% 47% 1% 10%
Bosnia and Herzegovina 100% 100% 78% 100% 12% 42%
Botswana 98% 99% 99% 64% 67% 64% 16% 8% 12%
Brazil 98% 98% 96% 73% 79% 76% 16% 17% 17%
Brunei Darussalam 99% 98% 76% 77% 13% 14%
Bulgaria 100% 99% 100% 40% 43% 40% 10% 5% 7%
Burkina Faso 100% 100% 98% 20% 32% 29% 5% 5%
Burundi 94% 95% 98% 14% 11% 24% 5%
Cambodia 98% 99% 98% 47% 68% 60% 7% 14% 10%
Cameroon 96% 94% 99% 43% 48% 49% 1% 12% 10%
Canada 95% 95% 96% 87% 84% 71% 28% 22% 16%
Cape Verde 96% 94% 98% 44% 31% 47% 4% 1% 6%
Cayman Islands
Central African Republic
Chad 100% 98% 95% 36% 27% 37% 9% 5% 14%
Chile 99% 99% 98% 82% 75% 80% 9% 5% 9%
China 100% 100% 100% 70% 70% 73% 19% 14% 18%
Colombia 99% 100% 95% 55% 47% 59% 10% 8% 7%
Comoros
Congo, Dem. Rep.
Congo, Rep.
Costa Rica 99% 98% 96% 77% 85% 86% 17% 23% 23%
Cote d'Ivoire 100% 79% 14%
Croatia 100% 99% 100% 38% 36% 41% 4% 3% 8%
Cuba
Curacao
Cyprus 100% 100% 100% 46% 63% 71% 7% 10% 13%
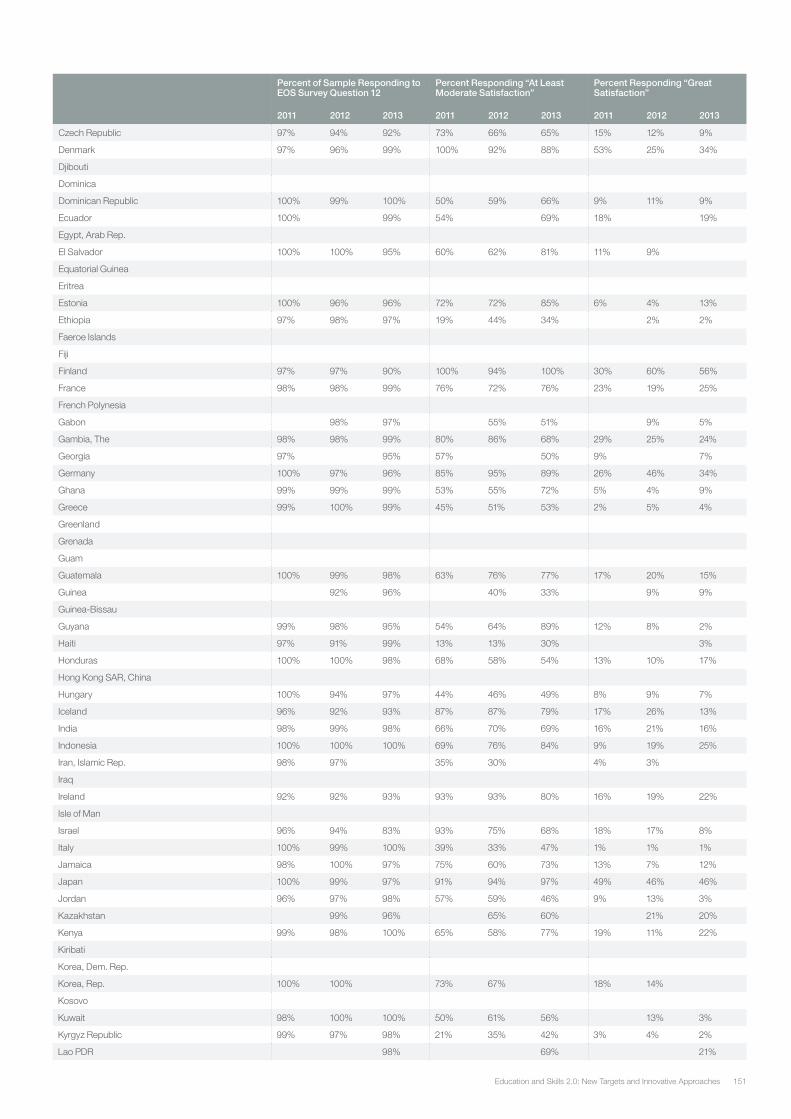
151Education and Skills 2.0: New Targets and Innovative Approaches
Percent of Sample Responding to EOS Survey Question 12
Percent Responding “At Least Moderate Satisfaction”
Percent Responding “Great Satisfaction”
2011 2012 2013 2011 2012 2013 2011 2012 2013
Czech Republic 97% 94% 92% 73% 66% 65% 15% 12% 9%
Denmark 97% 96% 99% 100% 92% 88% 53% 25% 34%
Djibouti
Dominica
Dominican Republic 100% 99% 100% 50% 59% 66% 9% 11% 9%
Ecuador 100% 99% 54% 69% 18% 19%
Egypt, Arab Rep.
El Salvador 100% 100% 95% 60% 62% 81% 11% 9%
Equatorial Guinea
Eritrea
Estonia 100% 96% 96% 72% 72% 85% 6% 4% 13%
Ethiopia 97% 98% 97% 19% 44% 34% 2% 2%
Faeroe Islands
Fiji
Finland 97% 97% 90% 100% 94% 100% 30% 60% 56%
France 98% 98% 99% 76% 72% 76% 23% 19% 25%
French Polynesia
Gabon 98% 97% 55% 51% 9% 5%
Gambia, The 98% 98% 99% 80% 86% 68% 29% 25% 24%
Georgia 97% 95% 57% 50% 9% 7%
Germany 100% 97% 96% 85% 95% 89% 26% 46% 34%
Ghana 99% 99% 99% 53% 55% 72% 5% 4% 9%
Greece 99% 100% 99% 45% 51% 53% 2% 5% 4%
Greenland
Grenada
Guam
Guatemala 100% 99% 98% 63% 76% 77% 17% 20% 15%
Guinea 92% 96% 40% 33% 9% 9%
Guinea-Bissau
Guyana 99% 98% 95% 54% 64% 89% 12% 8% 2%
Haiti 97% 91% 99% 13% 13% 30% 3%
Honduras 100% 100% 98% 68% 58% 54% 13% 10% 17%
Hong Kong SAR, China
Hungary 100% 94% 97% 44% 46% 49% 8% 9% 7%
Iceland 96% 92% 93% 87% 87% 79% 17% 26% 13%
India 98% 99% 98% 66% 70% 69% 16% 21% 16%
Indonesia 100% 100% 100% 69% 76% 84% 9% 19% 25%
Iran, Islamic Rep. 98% 97% 35% 30% 4% 3%
Iraq
Ireland 92% 92% 93% 93% 93% 80% 16% 19% 22%
Isle of Man
Israel 96% 94% 83% 93% 75% 68% 18% 17% 8%
Italy 100% 99% 100% 39% 33% 47% 1% 1% 1%
Jamaica 98% 100% 97% 75% 60% 73% 13% 7% 12%
Japan 100% 99% 97% 91% 94% 97% 49% 46% 46%
Jordan 96% 97% 98% 57% 59% 46% 9% 13% 3%
Kazakhstan 99% 96% 65% 60% 21% 20%
Kenya 99% 98% 100% 65% 58% 77% 19% 11% 22%
Kiribati
Korea, Dem. Rep.
Korea, Rep. 100% 100% 73% 67% 18% 14%
Kosovo
Kuwait 98% 100% 100% 50% 61% 56% 13% 3%
Kyrgyz Republic 99% 97% 98% 21% 35% 42% 3% 4% 2%
Lao PDR 98% 69% 21%
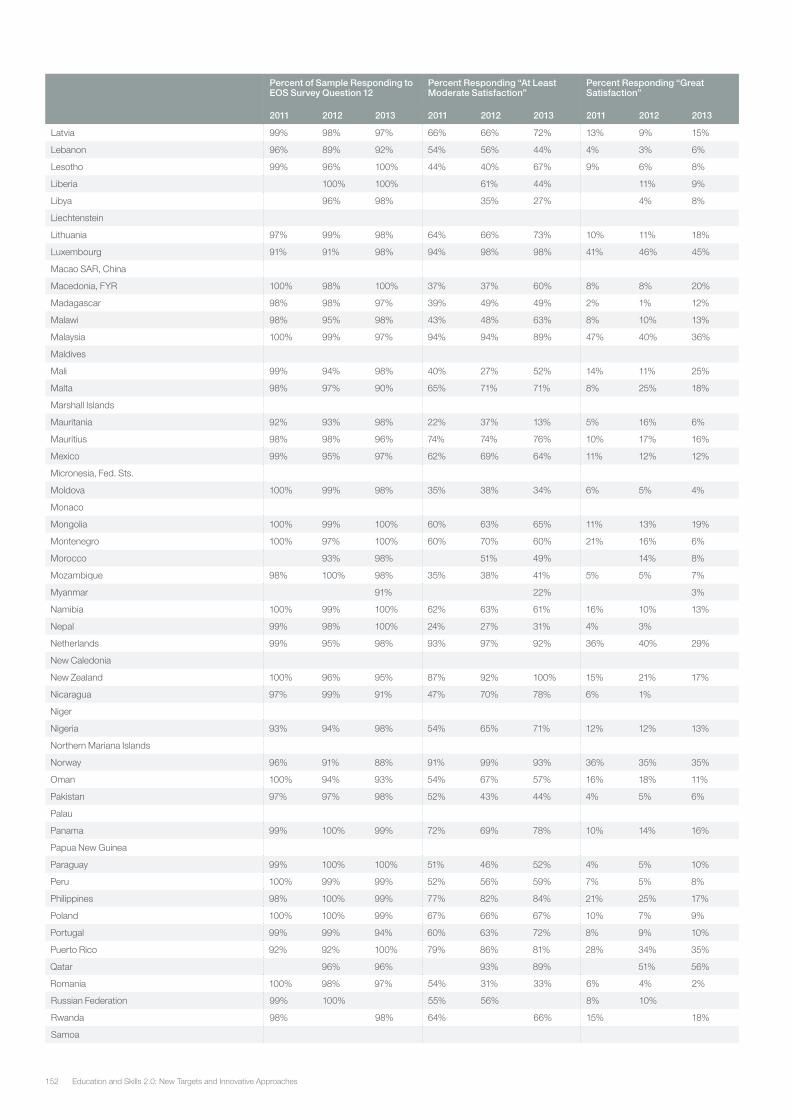
Education and Skills 2.0: New Targets and Innovative Approaches152
Percent of Sample Responding to EOS Survey Question 12
Percent Responding “At Least Moderate Satisfaction”
Percent Responding “Great Satisfaction”
2011 2012 2013 2011 2012 2013 2011 2012 2013
Latvia 99% 98% 97% 66% 66% 72% 13% 9% 15%
Lebanon 96% 89% 92% 54% 56% 44% 4% 3% 6%
Lesotho 99% 96% 100% 44% 40% 67% 9% 6% 8%
Liberia 100% 100% 61% 44% 11% 9%
Libya 96% 98% 35% 27% 4% 8%
Liechtenstein
Lithuania 97% 99% 98% 64% 66% 73% 10% 11% 18%
Luxembourg 91% 91% 98% 94% 98% 98% 41% 46% 45%
Macao SAR, China
Macedonia, FYR 100% 98% 100% 37% 37% 60% 8% 8% 20%
Madagascar 98% 98% 97% 39% 49% 49% 2% 1% 12%
Malawi 98% 95% 98% 43% 48% 63% 8% 10% 13%
Malaysia 100% 99% 97% 94% 94% 89% 47% 40% 36%
Maldives
Mali 99% 94% 98% 40% 27% 52% 14% 11% 25%
Malta 98% 97% 90% 65% 71% 71% 8% 25% 18%
Marshall Islands
Mauritania 92% 93% 98% 22% 37% 13% 5% 16% 6%
Mauritius 98% 98% 96% 74% 74% 76% 10% 17% 16%
Mexico 99% 95% 97% 62% 69% 64% 11% 12% 12%
Micronesia, Fed. Sts.
Moldova 100% 99% 98% 35% 38% 34% 6% 5% 4%
Monaco
Mongolia 100% 99% 100% 60% 63% 65% 11% 13% 19%
Montenegro 100% 97% 100% 60% 70% 60% 21% 16% 6%
Morocco 93% 98% 51% 49% 14% 8%
Mozambique 98% 100% 98% 35% 38% 41% 5% 5% 7%
Myanmar 91% 22% 3%
Namibia 100% 99% 100% 62% 63% 61% 16% 10% 13%
Nepal 99% 98% 100% 24% 27% 31% 4% 3%
Netherlands 99% 95% 98% 93% 97% 92% 36% 40% 29%
New Caledonia
New Zealand 100% 96% 95% 87% 92% 100% 15% 21% 17%
Nicaragua 97% 99% 91% 47% 70% 78% 6% 1%
Niger
Nigeria 93% 94% 98% 54% 65% 71% 12% 12% 13%
Northern Mariana Islands
Norway 96% 91% 88% 91% 99% 93% 36% 35% 35%
Oman 100% 94% 93% 54% 67% 57% 16% 18% 11%
Pakistan 97% 97% 98% 52% 43% 44% 4% 5% 6%
Palau
Panama 99% 100% 99% 72% 69% 78% 10% 14% 16%
Papua New Guinea
Paraguay 99% 100% 100% 51% 46% 52% 4% 5% 10%
Peru 100% 99% 99% 52% 56% 59% 7% 5% 8%
Philippines 98% 100% 99% 77% 82% 84% 21% 25% 17%
Poland 100% 100% 99% 67% 66% 67% 10% 7% 9%
Portugal 99% 99% 94% 60% 63% 72% 8% 9% 10%
Puerto Rico 92% 92% 100% 79% 86% 81% 28% 34% 35%
Qatar 96% 96% 93% 89% 51% 56%
Romania 100% 98% 97% 54% 31% 33% 6% 4% 2%
Russian Federation 99% 100% 55% 56% 8% 10%
Rwanda 98% 98% 64% 66% 15% 18%
Samoa
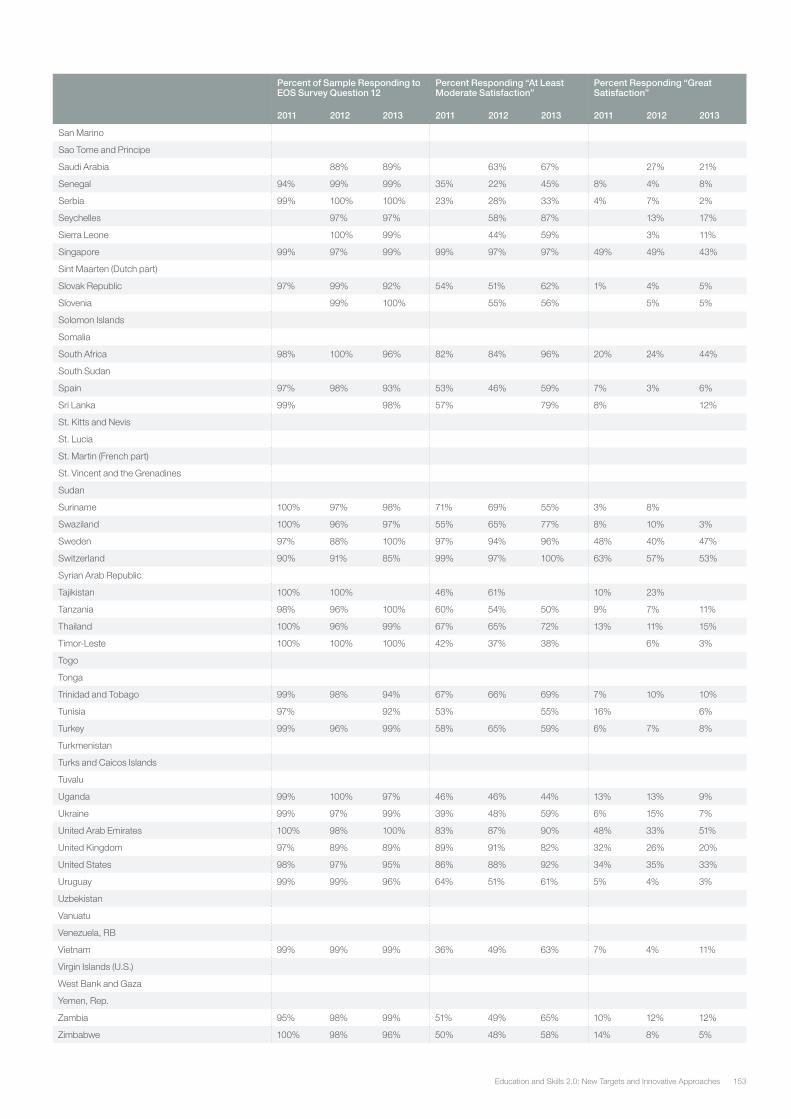
153Education and Skills 2.0: New Targets and Innovative Approaches
Percent of Sample Responding to EOS Survey Question 12
Percent Responding “At Least Moderate Satisfaction”
Percent Responding “Great Satisfaction”
2011 2012 2013 2011 2012 2013 2011 2012 2013
San Marino
Sao Tome and Principe
Saudi Arabia 88% 89% 63% 67% 27% 21%
Senegal 94% 99% 99% 35% 22% 45% 8% 4% 8%
Serbia 99% 100% 100% 23% 28% 33% 4% 7% 2%
Seychelles 97% 97% 58% 87% 13% 17%
Sierra Leone 100% 99% 44% 59% 3% 11%
Singapore 99% 97% 99% 99% 97% 97% 49% 49% 43%
Sint Maarten (Dutch part)
Slovak Republic 97% 99% 92% 54% 51% 62% 1% 4% 5%
Slovenia 99% 100% 55% 56% 5% 5%
Solomon Islands
Somalia
South Africa 98% 100% 96% 82% 84% 96% 20% 24% 44%
South Sudan
Spain 97% 98% 93% 53% 46% 59% 7% 3% 6%
Sri Lanka 99% 98% 57% 79% 8% 12%
St. Kitts and Nevis
St. Lucia
St. Martin (French part)
St. Vincent and the Grenadines
Sudan
Suriname 100% 97% 98% 71% 69% 55% 3% 8%
Swaziland 100% 96% 97% 55% 65% 77% 8% 10% 3%
Sweden 97% 88% 100% 97% 94% 96% 48% 40% 47%
Switzerland 90% 91% 85% 99% 97% 100% 63% 57% 53%
Syrian Arab Republic
Tajikistan 100% 100% 46% 61% 10% 23%
Tanzania 98% 96% 100% 60% 54% 50% 9% 7% 11%
Thailand 100% 96% 99% 67% 65% 72% 13% 11% 15%
Timor-Leste 100% 100% 100% 42% 37% 38% 6% 3%
Togo
Tonga
Trinidad and Tobago 99% 98% 94% 67% 66% 69% 7% 10% 10%
Tunisia 97% 92% 53% 55% 16% 6%
Turkey 99% 96% 99% 58% 65% 59% 6% 7% 8%
Turkmenistan
Turks and Caicos Islands
Tuvalu
Uganda 99% 100% 97% 46% 46% 44% 13% 13% 9%
Ukraine 99% 97% 99% 39% 48% 59% 6% 15% 7%
United Arab Emirates 100% 98% 100% 83% 87% 90% 48% 33% 51%
United Kingdom 97% 89% 89% 89% 91% 82% 32% 26% 20%
United States 98% 97% 95% 86% 88% 92% 34% 35% 33%
Uruguay 99% 99% 96% 64% 51% 61% 5% 4% 3%
Uzbekistan
Vanuatu
Venezuela, RB
Vietnam 99% 99% 99% 36% 49% 63% 7% 4% 11%
Virgin Islands (U.S.)
West Bank and Gaza
Yemen, Rep.
Zambia 95% 98% 99% 51% 49% 65% 10% 12% 12%
Zimbabwe 100% 98% 96% 50% 48% 58% 14% 8% 5%
Education and Skills 2.0: New Targets and Innovative Approaches154
David E. Bloom is Clarence James Gamble Professor of Economics and Demography at the Harvard School of Public Health. He earned his PhD in Economics and Demography from Princeton University in 1981. Bloom is a Fellow of the American Academy of Arts and Sciences, Faculty Research Associate at the National Bureau of Economic Research, and Research Fellow at IZA in Bonn. He directs Harvard’s Program on the Global Demography of Aging, was co-director of the World Bank/UNESCO-sponsored Task Force on Higher Education, and was co-director of the American Academy of Arts and Sciences' research program on universal basic and secondary education. Bloom currently serves as Chair of the Forum’s Global Agenda Council on Education and Skills.
Ayla Goksel is Chief Executive Officer of ACEV, a Turkish NGO working in early childhood, female literacy, and parent training. ACEV has provided education services for over 800,000 individuals and trained 9,000 teachers and volunteers. Goksel is also Chief Executive Officer of the Hüsnü M. Özyeðin Foundation, Trustee of Ozyegin University, and a board member of the Education Reform Initiative and TOHUM Foundation for Autism. She is a Young Global Leader of the World Economic Forum, a Senior Fellow of the Synergos Institute, a Qatar Foundation WISE Laureate, and a World Economic Forum Global Agenda Council member. Goksel holds a BSc from the University of Bath, an MSc from the London School of Economics, and has conducted fellowships at Johns Hopkins University and Harvard University.
Jody Heymann is Dean and Distinguished Professor of Epidemiology at the UCLA Fielding School of Public Health, Distinguished Professor of Public Policy at the Luskin School of Public Affairs, and Distinguished Professor of Medicine at the Geffen School of Medicine. Heymann is founding director of the World Policy Analysis Center (WPAC). WPAC is the largest global data centre of quantitative indicators of law and policy, including over 1,000 aspects of social policy for 193 UN countries. Author of Children’s Chances: How Countries Can Move from Surviving to Thriving (Harvard University Press), Heymann served as past chair of the Forum’s Global Agenda Council on Education. She is an elected member of the U.S. Institute of Medicine and a Fellow of the Canadian Academy of Health Sciences.
Yoko Ishikura is a Professor at Keio University’s Graduate School of Media Design. Prior to her current position, Ishikura was a manager at McKinsey & Company Inc., a professor at the School of International Politics, Economics and Business at Aoyama Gakuin University, and a professor at the Graduate School of International Corporate Strategy at Hitotsubashi University. She has also served as a non-executive director for companies in Japan, the United States, and the United Kingdom, as well as vice president of the Science Council of Japan. She received a BA from Sophia University in Tokyo, Japan, MBA from the University of Virginia Darden School of Business, and a Doctor of Business Administration from Harvard Business School.
Brij Kothari conceived Same Language Subtitling (SLS) on mainstream television for mass literacy and continues to research and advocate for its implementation in India and other low-literacy countries. He is a Schwab Social Entrepreneur, Ashoka Fellow, and on the faculty of the Indian Institute of
Management, Ahmedabad. Kothari founded PlanetRead, a non-profit, and BookBox, a social enterprise company. These organizations leverage SLS for reading and language learning via popular entertainment, mass media, and ICTs. He has a PhD in Education from Cornell University and currently serves as Vice-Chair of the World Economic Forum’s Global Agenda Council on Education and Skills.
Patricia A. Milligan is the President of Mercer’s North America Region. Over her 25-year career, she has held various leadership positions including the President of Mercer’s Talent business and Chief Markets Officer. She has been a pioneer in innovative work in the area of human capital, including HR function, talent management, and rewards strategy. Milligan is widely recognized as a thought leader in solving global human capital challenges. She is also a strong advocate for the development and mentorship of women, serving as executive sponsor for Women@Mercer. She currently serves as the Co-Vice Chair of the World Economic Forum’s Global Agenda Council on Education and Skills. Milligan earned her MBA at the Kellogg Graduate School of Management at Northwestern University and is a graduate of Georgetown Univer-sity’s School of Foreign Service.
Chip Paucek is an education entrepreneur and Co-Founder and Chief Executive Officer of 2U, Inc. Prior to 2U, Paucek served as Chief Executive Officer of Hooked on Phonics, founded Cerebellum Corporation, the company behind the award-winning educational Standard Deviants television program, and also co-managed the re-election campaign of Senator Barbara Mikulski of Maryland.He also serves on the World Economic Forum’s Global Agenda Council on Education and Skills and won Ernst & Young’s Entrepreneur Of The Year Award™ in Maryland.
Co-Editors and Authors
155Education and Skills 2.0: New Targets and Innovative Approaches
Other Authors Mehnaz Aziz is the Founding Director of Children’s Global Network Pakistan, a leading non-profit educational institution, implementing education reforms in Pakistan. She has served as a senior member of the Education Task Force under the Prime Minister of Pakistan and is also a member of Punjab Compulsory Education Commission. She initiated the Early Childhood Care and Development Centre of Excellence at CGN-P and currently serves on the Board of Directors for 'Zara Sochiyay', National Media Campaign on Education. She is also a member of the World Economic Forum's Global Agenda Council on Pakistan. Aziz holds an M.Sc. in Anthropology from Quaid-e-Azam University, Pakistan and an M.A. in Gender and Development from the Institute of Development Studies at Sussex University, UK.
Arup Banerji is Director and Head of the Global Practice on Social Protection and Labor at the World Bank. He is a Research Fellow at the Institute for Labour Economics (IZA), co-chairs the Social Protection Inter-Agency Coordination Board and the Youth Employment Network, and serves as a member of the G20 Task Force on Employment. He has co-authored two World Development Reports and overseen a third. Banerji has written books and academic papers on topics including employment and labour markets, skills, aging, social protection systems, and institutions and governance. He earned his PhD in Economics from the University of Pennsylvania in 1991, and has taught at the University of Pennsylvania and the Center for Development Economics at Williams College. He is currently a member of the Global Economic Forum’s Global Agenda Council on Youth Unemployment.
Pia Rebello Britto is the Senior Advisor and Global Chief for Early Childhood Development at UNICEF. She earned her PhD in Developmental Psychology from Columbia University in 1999. Prior to her position at UNICEF, she was an Assistant Professor at Yale University and the Associate Director of the Edward Zigler Center for Child Development and Social Policy at Yale. Britto is known internationally for her work on creating evidence-based early childhood programs and policies, primarily in low- and middle-income countries.
Gordon Brown is the United Nations Special Envoy for Global Education and Member of Parliament for Kirkcaldy and Cowdenbeath in the United Kingdom. He served as Prime Minister of the United Kingdom and Leader of the Labour Party from 2007 to 2010 and is widely credited with preventing a second Great Depression through his stewardship of the 2009 London G20 summit. Previously, he served as Chancellor of the Exchequer from 1997 to 2007, making him the longest-serving Chancellor in modern history. Brown is the author of several books, including Beyond the Crash: Overcoming the First Crisis of Globalisation, and a forthcoming work 2025: Shaping a New Future.
Ciara Browne is Associate Director of The Global Competitiveness Network, where her responsibilities include managing the network of Partner Institutes worldwide and coordinating the Executive Opinion Survey process. Browne is also involved in the production of the Global Competi-tiveness Report and the Network’s other benchmarking studies. She works closely with the World Economic Forum’s media team in conveying the findings of the various competitiveness reports to the media and the public. She is also respon-sible for the organization and manage-ment of a series of competitiveness workshops in Sub-Saharan Africa.
Jose Ferreira is the founder and Chief Executive Officer of Knewton, the world’s leading adaptive learning company. Knewton was named a Technology Pioneer by the World Economic Forum at Davos, where Ferreira is a member of the Global Agenda Council on Education. He graduated from Carleton College with a BA in Philosophy and received his MBA from Harvard Business School. Before founding Knewton, he worked as a Kaplan executive, derivatives trader, venture capitalist, and strategist for John Kerry's presidential campaign.
Thierry Geiger is an Economist and Associate Director with The Global Com-petitiveness Network at the World Economic Forum. He leads the competitiveness research on Asia, supervises the develop-ment and computation of a wide range of composite indicators, and is responsible for the Network’s technical assistance and capacity building activities. His areas of expertise are private sector development, international trade, and applied economics. Geiger is a co-author of the Forum’s flagship publications The Global Competitiveness Report, The Global Information Technology Report, and The Global Enabling Trade Report. He is the lead author of several regional and country studies.
Martina Gmür is Senior Director at the World Economic Forum. She currently heads the Global Knowledge Networks, which includes the Network of Global Agenda Councils, a braintrust of over 1,000 global experts across multi-disciplinary fields, and the Global Academic Networks, the foremost global community of universities, think tanks and other research based organizations. She is also the editor of the Outlook on the Global Agenda, which provides a top-of-mind perspective from the Global Agenda Councils on the challenges and opportunities ahead. Previously, she oversaw the development of the Forum of Young Global Leaders, a community of exceptional young leaders around the world. Prior to joining the World Economic Forum, she was associate vice-president with Lazar & Company, a New York-based investment bank, and she has held positions in marketing and sales at Nestlé Switzerland. Larkin holds an MBA and a BS in Finance, and is a member of a number of non-profit boards and a Yale World Fellow 2011.
Lauren Graybill is a current student at Harvard School of Public Health working toward her Master of Science in Global Health and Population. She graduated from Northeastern University with a BS in economics in 2013, and worked at Pathfinder International and John Snow Incorporated as a co-op student on projects based in Uganda, Ethiopia, Pakistan, Papua New Guinea, and South Africa. Her research is currently focused on the effect of macroeconomic policies on infant mortality rates; however, she is also pursuing opportunities in the field of global health epidemiology.
Salal Humair is a Research Scientist in the Department of Global Health and Population, Harvard School of Public Health. Previously, he has served as an Associate Professor and as Associate Dean at the School of Science and Engineering, established in 2008 at the Lahore University of Management Sciences in Pakistan; and as a Principal Software Engineer at Optiant, Inc., a start-up company that focused on supply chain optimization software. He obtained his doctorate in Operations Research from the Massachusetts Institute of Technology in 2001. His current work spans a range of public health policy questions, as well as traditional operations areas such as supply chain optimization theory and practice.
Education and Skills 2.0: New Targets and Innovative Approaches156
Emmanuel Jimenez is Director of Public Sector Evaluations at the World Bank Group. Prior to holding this position, he was responsible for the Bank’s operational programme in Human Development for the Asia regions and, before that, served in its research department. Jimenez led the core team that prepared The World Development Report 2007: Development and the Next Generation and is editor of the journal, The World Bank Research Observer. Before joining the Bank, Jimenez was on the economics faculty at the University of Western Ontario. He received his PhD from Brown University and currently serves as vice-chair of the World Economic Forum’s Global Agenda Council on Population Growth.
Omobola Johnson is the Honourable Minister for Communication Technology of the Federal Republic of Nigeria. Prior to her appointment, she was Country Managing Director of Accenture, Nigeria. Johnson holds a Bachelor's Degree in Electrical and Electronic Engineering from the University of Manchester and a Master’s degree in Digital Electronics from King's College, London. She is also nearing completion of a doctorate at Cranfield University, focused on corporate leadership practices in emerging markets. Johnson currently serves as Vice-Chair of the World Economic Forum’s Global Agenda Council on Africa and is a member of the United Nations' Broadband Commission Working Group on Gender and Broadband. Johnson is also a member of the International Telecommunications Union’s m-Powering Development Advisory Board.
Jeremy Johnson is Co-Founder of 2U. A lifelong entrepreneur, he founded his first company at 15 and his second, a social network around the college admissions process, at 21 while a student at Princeton University. He has been named to both Forbes’ and Inc. Magazine's 30 Under 30 lists and was named “one of the 30 Most Influential Entrepreneurs” in 2011 and 2012 by Under30 Chief Executive Officer. Johnson has spoken on education and innovation at the White House, in front of Congress, and at conferences and universities around the world. He serves on a handful of boards including the Young Entrepreneur Council and PENCIL, and has been a mentor for both the TechStars and the TechStars EdTech Accelerators.
Vivian Lopez is UNICEF’s Middle East and North Africa Regional Adviser for Adolescent Development in New York, and serves on the Global Agenda Council on Youth Unemployment. Previously, she was a member of UNICEF’s Latin America and Caribbean HIV/AIDS team. Lopez serves as a consultant with various organizations: UNAIDS, World Health Organization, Inter-American Development Bank, Pan American Health Organization, and UN Secretariat’s Youth Unit. In the past, Lopez was a Medical Faculty Research Fellow at Catholic University of Chile, a Rotary Ambassadorial Scholar and a researcher at Yale Center for Interdisciplinary Research on AIDS. Lopez holds an MS in Public Health from Yale University, and a BSc in Biology and Community Health from Tufts University.
Leslie Maasdorp is the President for the Southern Africa region at Bank of America-Merrill Lynch. Prior to this role he served as Vice Chairman of Barclays Capital and Absa Capital. He is a former International Adviser to Goldman Sachs. In 1994, after the transition to democracy in South Africa he was appointed Special Adviser to the Minister of Labour. In 1999, he was appointed as Deputy Director General in the Department of Public Enterprises leading the restructuring and privatisation programme in the South African Government. He holds a BA in Economics and Psychology and an MSc in Economics from the School of Oriental and African Studies at the University of London. In 2007 he was appointed a Young Global Leader by the World Economic Forum.
Jamie McAuliffe is President and Chief Executive Officer of Education for Employment (EFE), a non-profit dedicated to creating jobs for Arab youth in the Middle East and North Africa. Prior to EFE, Jamie was at the Edna McConnell Clark Foundation (EMCF) where he helped bring proven youth-serving organizations to national scale. He has worked with Ashoka where he launched new programs to support leading social entrepreneurs globally. A graduate of Johns Hopkins School of Advanced International Studies, Jamie is also a graduate of Teach for America and the Coro Fellows program for Public Affairs. He is a Schwab Foundation Global Social Entrepreneur and Chairs the World Economic Forum’s Global Agenda Council on Youth Unemployment.
Colin McElwee is Co-Founder of not-for-profit Worldreader, which aims to eradicate illiteracy across the globe. He has a degree in economics from the University of Manchester and began his career as an economist for several Brussels-based lobbies to the European Commission. He later worked in global marketing in the consumer goods sector for Scottish & Newcastle PLC before joining ESADE Business School as their first director of marketing. He has an MBA from ESADE and is an invited member of the World Economic Forum’s Global Agenda Council on Africa.
Sami Mahroum is Founding Director of INSEAD’s Innovation and Policy Initiative. Previously, Mahroum was a Senior Analyst with the OECD, a Visiting Reader at Birkbeck College, University of London, and Research Director at NESTA. He has contributed to the UK Innovation White Paper, the OECD Innovation Strategy, and the Europe 2010 Futures project. He is a member of the World Economic Forum’s Global Agenda Councils on Education and Skills, and a former member of the London-based RSA. He has been a Visiting Reader at the University of London and a Visiting Professor at the EPFL in Lausanne, and AUB in Beirut. Mahroum holds a PhD in the Social Studies of Science, Technology, and Innovation from the German Armed Forces University, an MSc in Science and Technology Dynamics from the University of Amsterdam, and a BA in Political Science and Economic Development from the University of Oslo, Norway.
Amina J. Mohammed is Special Adviser on Post-2015 Development Planning for the United Nations, a post to which she was appointed in 2012 by the Secretary General. Mohammed has more than 30 years’ experience as a development practitioner in the public and private sectors, as well as civil society. Prior to her UN role, she served as Senior Special Assistant to the President of Nigeria on the Millennium Development Goals, serving three Presidents over a period of six years. Mohammed has served on numerous international advisory panels and boards. She is a recipient of the Nigerian ‘National Honours Award of the Order of the Federal Republic’ and was inducted in the Nigerian Women’s Hall of Fame in 2007.
Kenneth M. O’Friel is a sophomore at Bates College in Maine. He is currently studying to be a double major in Economics and East Asian Studies with a concentration in Applied Mathematics.
157Education and Skills 2.0: New Targets and Innovative Approaches
Amy Rosen is Chief Executive Officer and President of the Network for Teaching Entrepreneurship (NFTE), which has educated more than 500,000 young people from low-income communities from around the world. She is passionate about providing all young people with the knowledge and skills necessary to pursue successful futures. A recognized expert in education and systemic change, she brings to this work a deep belief in the entrepreneurial mindset and empowering young people to seek education and opportunity. She serves as the Vice Chair of President Obama’s Advisory Council on Financial Capability and is Vice Chair of the World Economic Forum’s Youth Unemployment Council. Rosen spent 20 years as an effective, entrepreneurial leader of transportation systems and start-up companies. She has lectured, written, and received numerous public recognitions of her work.
Larry Rosenberg is recently retired from a position as Senior Research Associate in the Department of Global Health and Population at the Harvard School of Public Health. A graduate of Harvard’s Kennedy School of Government, he has worked on projects relating to health, education, demographic change, economic growth, poverty alleviation, social protection, tax policy, the Israeli-Palestinian conflict, and wind energy. His research interests center on economic inequality, the effects of climate change, and political and economic development in Latin America and Asia.
Jose Manuel Salazar-Xirinachs is Assistant-Director General for Policy at the International Labour Organization (ILO). Before that, he was Executive Director for Employment at the ILO. Previously he has served as Director of the Office of Trade, Growth and Competitiveness at the Organization of American States; Minister of Foreign Trade of Costa Rica; Chief economist and later Executive Director of the Federation of Private Entities of Central America and Panama, the main regional private sector think-tank at the time; member of the Board of Directors of the Central Bank of Costa Rica; and Executive President of the Costa Rican Development Corporation. He has authored numerous journal articles on development, trade, and competitiveness policies, and has written and edited several books, including Towards Free Trade in the Americas, Promoting Sustainable Enterprises, Trade and Employment: From Myths to Facts. He holds a PhD from Cambridge University.
Zeba Sathar is the Country Director of the Population Council Pakistan Office. She has worked at the Pakistan Institute of Development Economics, the World Bank, the World Fertility Survey and London School of Hygiene and Tropical Medicine. She has authored several articles and papers and recently co-authored a book on “Capturing the Demographic Dividend in Pakistan.” Sathar was awarded the Tamgha-i-Imtiaz in 2006 in recognition of meritorious services to the development sector in Pakistan. She holds a doctorate in Medical Demography from the London School of Hygiene and Tropical Medicine, and a MSc. in Demography from the London School of Economics.
Elizabeth Scott is a research associate for INSEAD’s Innovation and Policy Initiative at the Abu Dhabi Campus. She has written on economic development, innovation policy, business management, and leadership development. She has also worked as Coordinator of INSEAD’s Case Development Centre. Previously, Scott worked with the Abu Dhabi Department of Economic Development’s Centre for Economic Knowledge where she re-searched areas of best practice in government leadership and economic policy issues and supported the Depart-ment’s leadership development pro-gramme. She has also worked as an economist with IMS Health and the Reserve Bank of Australia, as a manage-ment consultant at KPMG, and in strategic and business planning at the University of Technology Sydney and Greater Union Group of Companies. Scott holds an undergraduate degree in Economics from the University of Adelaide, and post-grad-uate diplomas in Health Economics from Curtin University of Technology and Applied Finance and Investment (Securi-ties Institute of Australia).
Patty P. Sung is the Innovation Team Leader at Mercer. She has been at the forefront of Mercer’s innovation effort and was recently appointed to co-lead new business and product development. Sung also has had extensive experience working with senior executives on developing and executing firm-wide strategic initiatives and transformational plans. And she worked in Singapore to help expand Mercer’s business in the South East Asia market. Prior to Mercer, she held various research positions in the field of Biotechnology. She holds a Master’s degree in Biotechnology from Columbia University, and a Bachelor’s degree in Biochemistry from the University of California, Berkeley.
Tae Yoo is Senior Vice President of Cisco’s corporate social responsibility practice. A 20-year veteran of Cisco, her insight and business acumen have enabled Cisco to collaborate across government, business, and NGO sectors for tangible social benefit. Her leadership has helped make Cisco Networking Academy one of the largest education programs in the world, recognized globally for its innovative approach to providing ICT education. Yoo is a trustee of the Cisco Foundation, sits on the board of Business for Social Responsibility and the Leadership Council for The Franklin Project at the Aspen Institute. She was Co-Chair of the World Economic Forum’s Global Agenda Council on Education Systems. She has also served on the City Year National board and the Smithsonian National Museum of the American History board, as well as the advisory boards of the Global Philanthropy Forum and the Women’s Technology Cluster.
Christina Yu is a Marketing Manager at Knewton and a part-time MBA candidate at the NYU Stern School of Business, where she is specializing in Marketing, Media and Entertainment. She holds an AB in English and Creative Writing from Dartmouth College and an MFA in Creative Writing from Notre Dame, where she was the Diversity Fellow and the Nicholas Sparks Fellow at Hachette Book Group. Prior to Knewton, she worked as a lecturer in English literature and composition at Kean University and Southern Connecticut State University. In recent years, her fiction has appeared in literary magazines nationwide and has been nominated and cited in several Best American anthologies.
Saadia Zahidi is a Senior Director at the World Economic Forum. With the World Economic Forum, she started as Econo-mist, Global Competitiveness Pro-gramme, responsible for economic analysis for the Global Competitiveness reports and other topical and regional studies. She currently heads the Women Leaders and Gender Parity Programme; the Human Capital Project; and Constitu-ents. She is the founder and co-author of the Global Gender Gap Report series, which benchmarks countries according to the size of their gender gaps on health, education, economic participation, and political empowerment. Zahidi holds a BA (with Honors) in Economics from Smith College, a Masters in International Economics from the Graduate Institute of International Studies, and Masters of Public Administration from Harvard University.
Education and Skills 2.0: New Targets and Innovative Approaches158
This book is a product of the World Economic Forum’s Global Agenda Council on Education & Skills. The book was prepared under the editorial leadership of the Council’s chair, David E. Bloom; vice-chairs Jody Heymann (2012-2013), Yoko Ishikura (2012-2013), Brij Kothari (2013-2014), and Patricia A. Milligan (2013-2014); and Council members Ayla Goksel and Chip Paucek. All of the Council members are grateful for the significant participation of members of several other Global Agenda Councils (GACs), including the GACs on Population Growth, Pakistan, Sub-Saharan Africa, and Youth Unemploy-ment. Thoughtful suggestions and strong support were provided throughout from the Forum’s Ciara Browne, Associate Director and Council Manager; Michele Petochi Director, Academic Networks (formerly); Patrick McGee, Senior Community Manager, Africa; Daniel Beaulieu, Associate Director, Head of Knowledge Lab, Global Agenda Councils; Mehran Gul, Senior Knowledge Manager and Global Leader-ship Fellow, Global Agenda Councils; Michael Hanley, Senior Director of Publica-tions; Ann Brady, Head of Editing; and Kamal Kimaoui, Director, Head of Produc-tion and Design. The co-Editors are also grateful for research, editorial, and adminis-trative assistance from Harvard’s Elizabeth Cafiero Fonseca, Lauren Gurfein, Alyssa Lubet, Liza Mitgang, and Juliana Semine-rio; Mercer Consulting’s Patty Sung; and 2U’s Sarah Fudin, Rebecca Lindegren, Chance Patterson, and Jenn Pedde. The Council would also like to extend special thanks to Laura Wallace for her superb editing of the book, to Larry Rosenberg for excellent research and editorial assistance and advice, to Julian Roskams for copy-editing and to Linda Lorimer and Adam Bly for helpful discussions. Financial support for the book and its dissemination has been provided by the World Economic Forum, Harvard School of Public Health, Mercer Consulting, Inc., and 2U, Inc. (a firm that develops online degree programs).
Suggested citation:Bloom, David E., Ayla Goksel, Jody Heymann, Yoko Ishikura, Brij Kothari, Patricia Milligan, and Chip Paucek, eds., Education and Skills 2.0: New Targets and Innovative Approaches, Geneva: World Economic Forum, 2014.
Members of the Global Agenda Council on Education and Skills (2012-2014) - Mallam Bolaji Abdullahi, Minister of
Sports; Ministry of Sports and National Sports Commission of Nigeria, Nigeria
- May Al Dabbagh,Non-Resident Research Fellow, Dubai School of Government, United Arab Emirates
- Abdulla Bin Ali Al Thani, President, Hamad bin Khalifa University; Vice-President, EducationQatar Foundation, Qatar
- David E. Bloom; Clarence James Gamble Professor of Economics and Demography Harvard School of Public Health, United States,
- Kristin Clement, Managing Director; Civita, Norway, (2012-2013)
- Jared Cohon, President, Carnegie Mellon University, United States
- Ricardo Manuel dos Santos Henriques, Superintendent Executive, Instituto Unibanco, Brazil
- Jose Ferreira, Founder and Chief Executive Officer, Knewton, United States
- Roland G. Fryer, Professor of Economics, Harvard University, United States
- Ayla Göksel, Chief Executive Officer, ACEV, Turkey
- Jody Heymann, Dean of Public Health, University of California, United States
- Yoko Ishikura, Professor, Graduate School of Media Design, Keio University
- Brij Kothari, Director, PlanetRead, India
- Rolf Landua, Head, Education Group, European Organization for Nuclear Research (CERN), Switzerland (2013-2014
- Sami Mahroum, Academic and Executive Director, Innovation and Policy Initiative, INSEAD, United Arab Emirates,
- Patricia A. Milligan, President, North America Region Mercer (MMC), United States
- Chip Paucek, Chief Executive Officer, 2U, United States
- Christopher Pissarides, Regius Professor of Economics, London School of Economics and Political Science, United Kingdom
- Soraya Salti, Senior Vice-President, Middle East and North Africa, INJAZ Al-Arab - Junior Achievement Worldwide, Jordan
- Tae Yoo, Senior Vice-President, Cisco, United States
Acknowledgements

World Economic Forum91-93 route de la CapiteCH-1223 Cologny/GenevaSwitzerland
Tel +41 (0) 22 869 1212Fax +41 (0) 22 786 2744
The World Economic Forum is an independent international organization committed to improving the state of the world by engaging business, political, academic and other leaders of society to shape global, regional and industry agendas.
Incorporated as a not-for-profit foundation in 1971 and headquartered in Geneva, Switzerland, the Forum is tied to no political, partisan or national interests