World Bank Group
227
FILE CmPY DOCUMENT OF INTERNATIONAL BANK FOR RECONSTRUCTION AND DEVELOPMENT INTERNATIONAL DEVELOPMENT ASSOCIATION Not For Public Use Report No. 168a-BA THE CURRENT SITUATION AND PROSPECTS OF THE UNION OF BURMA July 25, 1973 South Asia Department This report was prepared for official use only by the Bank Group. It may not be published, quoted or cited without Bank Group authorization. The Bank Group does not accept responsibility for the aecuracy or cnmpletene-ss of the report. Public Disclosure Authorized Public Disclosure Authorized Public Disclosure Authorized Public Disclosure Authorized Public Disclosure Authorized Public Disclosure Authorized Public Disclosure Authorized Public Disclosure Authorized
-
Upload
khangminh22 -
Category
Documents
-
view
0 -
download
0
Transcript of World Bank Group

FILE CmPY
DOCUMENT OF INTERNATIONAL BANK FOR RECONSTRUCTION AND DEVELOPMENTINTERNATIONAL DEVELOPMENT ASSOCIATION
Not For Public Use
Report No. 168a-BA
THE CURRENT SITUATION AND PROSPECTS
OF
THE UNION OF BURMA
July 25, 1973
South Asia Department
This report was prepared for official use only by the Bank Group. It may not be published, quotedor cited without Bank Group authorization. The Bank Group does not accept responsibility for theaecuracy or cnmpletene-ss of the report.
Pub
lic D
iscl
osur
e A
utho
rized
Pub
lic D
iscl
osur
e A
utho
rized
Pub
lic D
iscl
osur
e A
utho
rized
Pub
lic D
iscl
osur
e A
utho
rized
Pub
lic D
iscl
osur
e A
utho
rized
Pub
lic D
iscl
osur
e A
utho
rized
Pub
lic D
iscl
osur
e A
utho
rized
Pub
lic D
iscl
osur
e A
utho
rized

Currency Unit - rKyat (KAY)
Through December 1971 - US$1 Ky 4.7619Ay 1 U$0U.21
Ky 1,000 = US$210.00,,. l,OOO,OOO - 'uS$210,000.21 nftL V3 IJ,UUV Up±,UA.e
From December 1971 toFebruary 1973 US$1 = Ky 5.3h87
Kgy i US$0.19Ky 1,000 = US$186.96Ky 1,OOO,O0 = US1-86,961.32
From February 19, 1973 - uS = 4.818Ky 1 = US$0.21Ky 1,000 - US$07.74Ky l,OOO,OOO = US$207,736
Fiscal Year - October 1 - September 30
This Report is ba4ed upon the findings of.a missionwhich visited Burma in February 1973. The missionconsisted of:
Mrs. Chandra Hardy (Chief)Mr. James Hendry (Agricultural Economist)Mr. Choeng Chung (Agricultural Economist)Mr. V. Dragomanovic (Industrial Economist)Mr. David Turnham (Economist)Miss Meera Shah (General Economist)

TABLE OF CONTENTS
Page No.
COUNTRY DATA
SUffARY AND CONCLUSIONS ..... ..................... i-vi
INTRODUCTION .1
A. RECENT ECONOMIC DEVELOPMENTS .2
I. NATIONAL PRODUCT AND ITS USE .2
II. DISTRIBUTION AND TILE COOPERATIVES.
III. PUBLIC FINTANCE .
IV. MONEY AND CREDIT ....... .......................... 12
V. THE EXTERNAL SECTOR ...... ........................ 15
B. SOCIAL W4ELFARE INDICATORS ..... ................... 21
VI. MTANPOWER AND EMPLOYMENT ..... ..................... 21
VII. PRICES ANTD WAGES ....... .......................... 26
C. SOME MAJOR CONSTRAINTS TO GROWTH .... ............. 34
VIII. AGRICULTURE...................................... 34
LX. INDUSTRY...................................... 51
X. MOBILIZING RESOURCES FOR INVESTMCENT. ......... 62
D. TIlE ECONOMY IN PERSPECTIVE. ....................... 66
,U4L ,t,,,Mv, , nL r*LrN'¶7 I - wTfI
ZX 2 - A T'ICTT'IU AR CREDIT ATD COOPERATWVES
STATISTICAL APPENDIX
MAPS


ANNEX I
Page 1 of 2 pages
COUNTRY DATA - BURNA
AREA POiULATION DENSITY
678.528 km 2 28.9 million (19731/72). 42 per km"Ri'e of Growth: 2.3% (from 1965/66 to 1971/72) 1km of arable land
POPULATION CHARACTERISTICS 1970/71 (Selected Urban Areas) ALTH1970/71Crude Birth Rate (per 1,000) 38.B Population per physician 9,177Crude Death Rate (per 1,000) 11.1 Population per hospital bed 1,370Infant Mortality (per l,OOO live births) 59.8
INCOME DISTRIBUTION DISTRIBUTION OF LAND OWNERSHIP7. of national income, lowest quintile .% owned by top 10% of owners
highest quintile . . % owned by smallest 10% of owners
ACCESS TO PIPED WATER ACCESS TO ELECTRICITY% of population - urban ,% of population - urban
- rural - rural
NUTRITION 1969/70 EDUCATION 197O/7lCalorie intake as 7. of requirements 124 Adult literacy rate 7M6Per capita protein intake 60 Primary school enrollment 88%
GNP PER CAPITA in 197? US $ 85
GROSS NATIONAl PRODUCn T I?N 1071/72 ANNTUAL RATE OF GROWTH (7. constant prices)
US $ HMln. % 1962-66 1966-71 1971-72
GNP at Market Prices 2011 100'0 2.6 4.1 2.8Gross wixed Investment 241 12.0 5.2 3.9 5.8Gross National Saving - 172 8.6 .. -4.1 13.3Current Account Balance -45 -2.2Exports of Goods, NFrS 136 6.,7 -9M0 -10 6 16.3
Imports of Goods, NFS 191 9.5 -8.o -0.7 2.6
OUTPUT, LABOR FORCE ANDPRODUCTIVITY IN 19701/71
Value Added Labor Force V. A. Per WorkerUS S Mln. 7 Ml. 7. US$ _%
Agriculture 829.8 37.7 7.6 69.7 109.2 54.0Industry 275.2 12-5 0.8 7.3 344.0 170.0Services 1094.4 49.8 2.5 23.0 437.8 217.0Unal.-ocated . -
Total/Average 2199.4 100.0 10.9 100.0 201.8 10O.0
GOVERNMENT FINANCE 1971/72'netEral Govurnmnent TTniorin rovernment
Kya~ts Min. % of % of GDP average Kyats Man. % of % of average GDPGDP last three years 9LX last three Years
Current Receipts 8372 / 77.5 82.4 1959 18.1 18.7Current Expenditure 8336 V 77.1 82.1 2429 22,5 23.2Current Surplus 3' 36 ' 0.3 0.4 -470 -- T4- 3&45Capital Expenditures 852 7-9 8.4 228 2.1 2.2Exterl Assistance (net' 222 2.0 - 2.2
1/ The per capita GNP estimate is at 1972 market prices, calculated by the same conversiontechnique as the 1972 Wiorld Atlas. All other co-nversions to dollars in this table areat the &varage exchange rate prevailing 'du'ring the period covered.
not availablenot applicable
ANNEX IPage 2 of 2 pages
COUNTRY DATA - BUiUA.
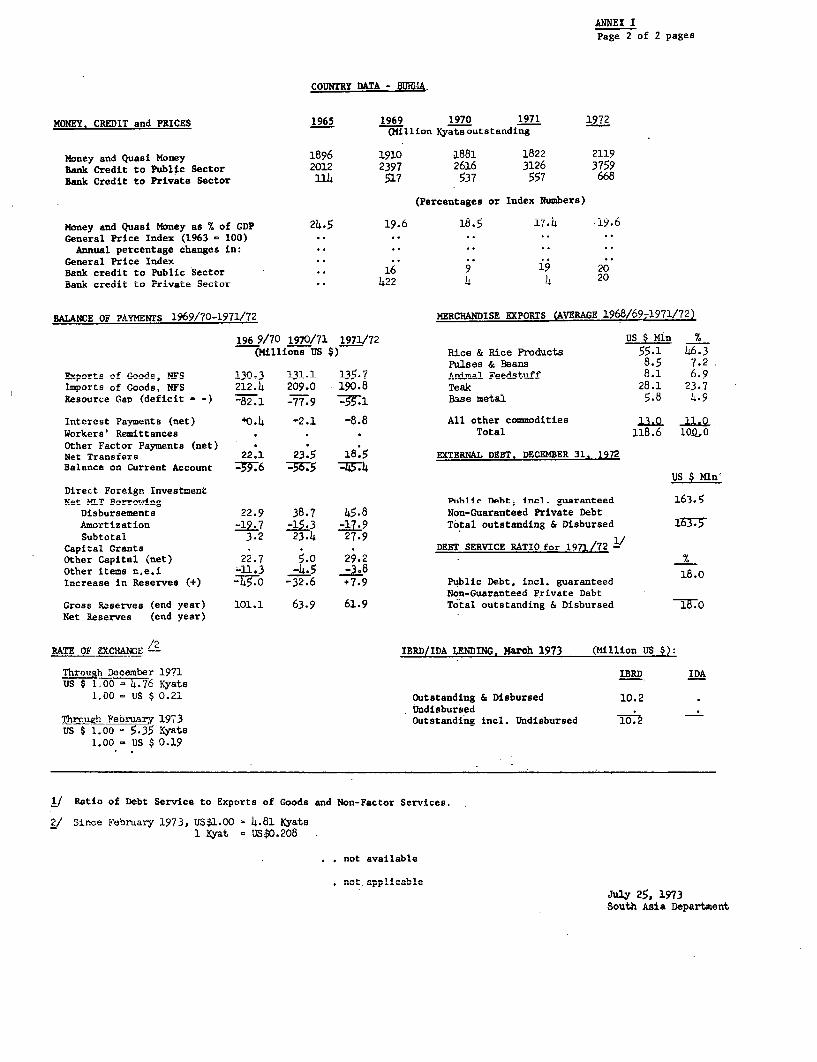
MfWnv CREDVnIT and PRT-ES 1965 1969 1970 1971 1972(Million Kyatsoutstanding
Money and Quasi Money 1896 1910 1881 1822 2119Bank Credit to Public Sector 2012 2397 2616 3126 3759Bank Credit to Private Sector 114 517 537 557 668
(Percentages or Index Numbers)
Money and Quasi Money as 7 of GDP 24.5 19.6 18.5 17.4 -19.6General Price Index (1963 - 100) .. ..
Ann--,-! percentage chan"ges in: -* -v*
General Price IndexBank credit to Public Sector .. 16 9 19 20Bank credit to Private Sector - 22 4 h 20
BALANCE OF PAYMENTS i969/7U-iY97/ ( ERCHANDI;SbE AAEVPO (ArDVZAGA , , /6, 7 /7
196 9/70 1970/71 1971/72 US $ Min %(Millions US $) Rice & Rice Products 55.1 46.3
Putlses & Beans 8.5 7.27, or ts o f _-ood _, NF......S 130J 3 _3 135 .7 Ar o FedAtlfi3r 8.1 6.9Imports of Goods, NFS 212.4 209.0 190.8 Teak 28.1 23.7Resource Gap (deficit e -) - -77.9 - Base metal 5.8 4.9
Interest Payments (net) '0.4 -2.1 -8.8 All other commodities 1J3* 11.0Workers' Remittances . Total 118.6 lOQ,OOther Factor Payments (net)Net Transfers 22.1 23.5 18.5 EXTERNAL DEBT. DECEMBER 31. 1972Balance on Current Account .76 -56.5 j34
US $ MlnDirect Foreign InvestmentNet M-T Borroing Public Debt incl. guaranteed 163.5
Disbursements 22.9 38.7 45.8 Non-Guaranteed Private Debt
Amortization -19.7 -15.3 -17-9 Total outstanding & Disbursed 1
Subtotal 3.2 23. 27.9Capital Grants . . . DEBT SERVICE RATIO for 1971/72Other Capital (net) 22.7 5.0 29.2 %Other items n.e.i J -LL.± .8o 18.0Increase in Reserves (+) -15o -32.6 +7.9 Public Debt, incl. guaranteed
Non-Guaranteed Private DebtGross R3serves (end year) 101.1 63.9 61.9 Total outstanding & Disbursed lo.0Net Reserves (end year)
RATE OF EXCHANGE ZA IBRD/IDA LENDING. March 1973 (Million US $):
Through December 1971 IBRD IDAUS $ 1.00 = .76 Kyats
1.00 = US $ 0.21 Outstanding & Disbursed 10.2
UndisbursedThrough Febnaxy 1973 Outstandiniz incl. Undisbursed 10.2
US 1.00 35 Kyats1.00 - US $ 0.19
1/ Ratio of Debt Service to Exports of Goods and Non-Factor Services.
2/ Since February 1973, US4.00 = 4.81 Ityats1 Kyat = US$0.208
not available
not applicable
July 25, 1973South Asia Department

SUMMARY AND CONCLUSIONS
i. In 'the course of the past year, the Government of Burma madecontinuing efforts to widen its contacts with foreign countries and inter-national institutions. The most recent of these developments is Burma'sadmission to the Asian Development Bank in April 1973. On the economic front,considerable attention is being given to implementing the current Four YearPlan (1971/72-1974/75) and to devising measures to increase the rate ofeconomic growth.
ii. Last year was the first year of the current Four Year Plan (1971/72-1974/75). GDP in constant prices increased by 3.1 percent over the previousyear. This was lower than the average annual rate of growth of about 5.0percent experienced over the period 1968/69-1970/71 and it was also lowerthan the plan target of 4 percent per annum. The main reason for the slowgrowth of production was the continuing stagnation in agricultural output.Paddy production remained at around 8 million tons, while the output of someother important crops (groundnut and sesamum) declined. There was also amarked slowdown in livestock and fishery production.
iii Industrial output increased by 3.1 percent over the previous year.In view of the fact that most of what little investment there has been, overthe decade; has gone into the industrial sector and several new factoriescame into operation in recent years, this was not a good performance. Thegrowth of the manufacturing sector is partly constrained by the slow growthof agricultural production and the continued decline in imported raw materials,spare nprts- and comnponents. However, it is also a consequence of the very cleardisinvestment process which has been going on for some time. Industrialcapacity is rapidly being worn out due to noor reconstruction, replacement,depreciation and maintenance policies.
iv. The expansion of output during the year would have been evensmal'le b.u for tha increoaps in the ountput of the mining and services
sectors. Mineral output increased.by 12.0 percent in 1971/72, due primarilyto the 19 percent rise ln the production of criide oil The oaitnut of the
services sectors increased altogether by nearly 4 percent but there was no
increase ir. Acor.structior. activity.
v. -DurTig the year consumptior. ar.d oss fixed investment grFA faster
than GNP, by 5.2 percent and 5.8 percent respectively (in constant prices)...i.J.. er.tail.ed a subst.an,tial decrease i. stocks and increased use of forei gn
borrowing. The ratio of investment to GNP remained low at around 12 percent.National savi..gs remain at arounA 0 percer.t-of C-P. Pner capit income in
constant prices was K 374, showing no increase over the previous year. Thedecline JAX the dolilar vc-lue of estim.ated per. -apit ir.come from. $880 in1971 to $70 in 1972 was due to the devaluation of the Kyat in 1972.
vi. The functioning of the nationalized distribution sector continuesto be an important obstacle to development. It -aplifies scarcities andcreates price distortions which enhance the profitability of black-marketoperations. mne Government's respoLse to Udistribution problerms seemscentered on a drive to expand the cooperatives on a large scale at a rapid

rate. While there is clearly scope for improvement of consumer goods
distribution to which the cooperatives can contribute significantly, the
expansion of the role of the cooperatives to the extent now being planned
could prove an expensive venture with little immediate benefit to the economy.
vii. The continued worsening of the economic situation is also reflected
in widening budget and balance of payments deficits. The overall budget
deficit in 1972 was K 815 million, or 32 percent higher than in the previous
year. According to the revised estimates, K 488 million were to be financed
by gross foreign capital inflows and K 327 million by bank credit. This
level of deficit financing was not imuch higher than the average for the past
three years but its inflationary impact could no longer be cushioned by a
drawdown in foreign exchange reserves. Net reserves were negative at the
end of 1971/72, including liabilities to the IMF.
viii. No neT revenue measures were undertaken in 1971/72 and tax revenues
continued the decline which has been evident since 1964/65. Total receipts
were equal to 13. ercent of GDP in 1972, compared to 25 percent in 1965.
At the same time, there was an unprecedented jump in expenditures by 10
percent last -ear, corresponding to a 16 nercent increase in expenditures
on social and economic services and a 12 percent increase in the cost of
adm,iistration. Another important contributory factor to the rise in
current expenditures was the considerable increase in service payments on
internal and external public debt. The current revenues of the state
enterprises increased by 12 percent but this was wholly offset by increases
in current and capital. expenditures. The overall deficit of the state
enterprises was the same last year (K 121 million) as in the previous year.
ix. Control of the money supply has been an important instrument formaintaining prie stability and for most of the past decade, the growth of
the money supply was contained at less than 2 percent per annum. Last year,
hG.wever, the monetary picture changed drasticallv. During 1972, the money
supply and total liquidity increased by 16 percent, bringing the ratio of
money to GNF to 20 percent.
x. In 1971/72, the balance of paxj.ents showed an overall surplus of
nearly $8 million, compared to an overall deficit of $37 million in the
previous year but this, unforturately, did not result from a ny real irinrove-
ment in the external sector. The value of merchandise exports increased by
4 percent. Tne volum..e of rice exports was around 670,000 ton-s, dwn from
the previous year's '750,000 tons. The increase was mainly due to increases
in the exports of pulses, animal feedstuff, rubber and 4ute. It was also
due to higher expor.t prices for some of these commodities. The slight
improvement in the balarce of trade resulted from a 10 percen't de14ne in
the level of imports over the previous year. The major cut-back was in
imports of textiles and producer goods.
xi. Tne deterioration of Burma's terms of trade has been particularly
severe since 1968. The 36 percent deterioration in the terms of trade
between 1968 and 1971, was almost solely due to the 47 perceb.t drop in the
export price of rice over this period. The resulting decline in export

- iii -
earnings imposes a severe limitation on the country's import capacity andhence its economic development. This fall in the export price has beencompounded by a rise in the price of imports. In addition, the volume ofexports also fell. Over the past decade, the purchasing power of Burma'sexports have declined by 55 percent and it is currently less than 20 percentof its pre-war value.
xii. The 1972 current account deficit of $53 million was financed by asubstantial increase in foreign loan disbursements and an even more substantialincrease in miscellaneous capital inflows resulting from the repayment by SriLanka of rice export credits extended in 1971. the sale of gold and therevaluation of gross reserves.
xiii. Burma contracted several new loans during the past year, includingtwn largp loans frnm Jaan;n, -nd one from the Peonle's Renublic of China. Thesethree loans together amounted to $50 million. As of September 30, 1972, thetotal external debt was $308 mIllon, including an *ndishbrsed balanre of $144million. The average terns and conditions of these loans are very favorable.The gran t element on all the loans taken together is about 53 percent. Evenso, repayment obligations have been rising very rapidly and they accounted for52 percent of disbursements in 1972. The undisbursed balance of $144L ,i lioinis expected to be fully drawn down over the next five years and the debtservice ratio which is currently 18 percent i p to rise to ahout 21
percent by 1975.
xiv. The prospects for 1973, do not offer hope for much improvement inthe economic situation. B...a did not escape the effects of the bad weatherwhich has resulted in the present Asian grain crisis. Rice production is
do yar. esti,uated '=5percent. Th ln, h ugtestimates areUI.)LL )' 01 ~L .LUaLu I J IJ J1 'ff la. LII F_ ~ - - -
based on an export target of 800,000 tons of rice this year but the governmentUoes rLot now eApect export s a le s I.o bUe ..or e thl an 3000 00 tJons, at s. I- T.heoriginal budget estimates for 1973 show an even greater deficit than last year'sIL ut -L` vLew of thLe str'Igen.cy o,L the foreign exchar.ge cor.straint, t he govern-
ment is already in the process of cutting back imports and capital expenditures.1LIese cut-backlls will hiavle a severe i.mpact on t6-hae growtCh of output -nless thereis an offsetting increase in loan disbursements greater than is currentlyantLcLipate'U.
X-V. As notea in 'Last year's econoriic report, tle assessment ofperformance cannot be limited to the criterion of economic growth but musttake into account all of the country's objectives. It was also noted thatwhile economic performance has been poor, Burma's major success over thepast decade has been the provision of advanced social services 'or a populationof about 30 million with a per capita income of well below $100. Theseachievements are still there and these goals are still being pursued, but bynow, the possibility of further social progress is being endangered by thelack of job opportunities for the growing population and the stagnation, ifnot decline, in living standards.
xvi. The mission estimates that the labor force is about 12.8 million.No data are available for rural employment but it is believed that under-employment is fairly widespread in the rural areas. Preliminary results of

- iv -
the Urban Social Survey for 1972, show an unemployment rate of 6.5 percentfor the 10 major towns taken together. Another estimate (derived from laborexchange data) suggests an urban unemployment rate of 9.4 percent. By Asianstandards these are moderately high rates of unemployment, especially sincethe overall rate of unemployment generally corresponds to a rate among youngpeople two or three times as high.
xvii. The emergence of high and increasing levels of open unemploymentamong voung peonle is the beginnings of a different, and in some respects
more urgent, type of employment problem. The government's success in ex-panding the education system during the 1960's has resulted in an annual
outflow of high school and graduate students far in excess of available jobonportunities. Failure to provide enough obs, or iobs that match expecta-
tions can have serious consequences. The curtailment of expenditures onhi-her education and tho Rhift in expenditure to more vocational and technical
education which is required will, however, not provide the medium-termsolution to the -roblem of increasing unemployment. This can only be achievedthrough higher rates of economic growth.
xviii. Price stability has been an important component of the government's
economic objectives A fr. ceim s etent this has been achieved= The cost of
living index for Rangoon shows an average annual rate of growth of 4 percentper annum between 1962 and 1972. However, the ir.dex show.s severa1 disturbing
trends in recent years. For example, prices were as high in 1970 and 1971
(peakj agricultural years) as in a 1097 (.o years of drought). Th.e
slow growth and high costs of domestic production together with rising import
pr'ces ar,d increasir.g re.lance on deficit fina.-cing are the main factors
responsible for the pressure on prices. Last year, the Consumer Price IndexLor R-aLgooUL iLncreasedU uy 8 percent over the previous year. It should be
added that trends in Rangoon represent a floor of price trends for the
country as a wihole.
xix. Available data on wages and earnings indicate that earnings werevirtually static throughout much of the 1960's and 1970's, at least up to
the October 1972 revision of the wage structure. T.he mmajor chaanges in thenew wage and salary system (the first revision since 1947) are the consolida-tion of categories, the increase in the low level salary scale minima fromK 82 to K 100 per month and the reduction of the maxima at the other end of
the scale from K 2,100 to K 1,500 per month for riew entra..ts to LLese Jobs.
A general increase averaging roughly 11 percent was built into the new scales.
Tfhese increases are probably above the increases experienced by pr'Lvate sector
workers over the 1965-1972 period. Nevertheless, the increase in prices overthe last eighteen months has more than eliminated the partial restoration of
purchasing power implicit in the wage increases. With prices rising and
shortages of consumer goods becoming more acute, it seems that on balanceabsolute levels of living standards may have declined, albeit with varyingeffects on different segments of the population and parts of the country.
xx. The major economic problems continue to be the slow growth of
agricultural and industrial production, the acute shortage of foreignexchange and the inefficiency of the state enterprises. The main factors

cnsraining ithe grnwth nf agriculture are the disproportionately low level
of investment in agriculture and the unwillingness of the government (until
this year) to use pricing poliry to stimulate increases in production. The
low level of investment has left the rice sub-sector with little technical
capab.ility for further expansion i,n the short run and the emphasis on price
stability has been a factor depressing the production of several crops.
xxi. The government's policy towards the agricultural, sector is
currently in a transitional stage. Further rhanges will be reauired to
develop the country's agricultural resources to full advantage. The moreimportar.t st.eps inc.lu.de (i) the dApt3t-4rio of lenon' high vielding varieties
and the development of new ones; (ii) increased input use, particularlyof fertilizers; (iii) ir.creased inese t 4nirrigatin Pmhankment- drainage
and flood protection works; and (iv) improvements in price and marketing
policies.
xxii. It is recogni.zed that dIversification of the overall structure of
production has to be achieved through an expansion of the share of industry
in GDP and it is also recognized that Burma's potential for expanding the
industrial sector is basically good. So far, however, Burma hasinot beenvery successful in pursuing industr'al growth. TIs has been due in a.n
important degree to such factors as the lack of capital, the slow growthot agricuitural production and the shortage of foreign excha.nge but it hasalso been due to the neglect of the small-scale (largely private) sector whichstill accounts for more than hair of value-added In raLLufacturing; inadequate
pricing policies; insufficient replacement of existing capacity; the lackof incentives; the lack of correspondence witn market forces adll Inadequat
attention to putting the state enterprises on a self-sustaining, economicallyviable basis.
xxiii. The shortage of financial resources has been the dominant Lactor
in determining the low level of investment. However, current levels ofinvestment cannot lead to dynamic growth; indeed they will barely be enoughfor the task of rehabilitating existing productive capacity. The problem for
Burma is how to mobilize sufficient resources to carry out such ani expandleu
investment program. The government is, as yet, unwilling to consider taxincreases but this unpalatable decision will have to be maue soon. Efforts
will also have to be made to curtail the growth of expenditures, particularlyon administration and improve the management of public sector enterprises.
Given Burma's fundamental option for a socialist system, the main potential
source of domestic savings is the surplus of the public sector enterprise-.
The task of improving the management of'public sector enterprises is one which
cannot be further postponed.
xxiv. The need for foreign exchange is perhaps even greater than the
local currency constraint and another avenue for mobilizing resotrces for
investment is a dynamic export policy. The world market prospects for nearly
all of Burma's traditional exports are very good. This is even true for rice,
though probably not at today's extremely high prices. Burma supplies less
than one percent of the demand of the USA and Western Europe for'teak and
other hardwoods and less than one percent of world trade in minerals. Yet
-vi-
export promotion is not being given the priority it warrants. Poor export
performance is a direct corollary of the slow growth of production, but this
is not the only problem. The responsibility for exports is diffuse; coordina-
tion between producers and exporting agencies is inadequate, and there is a
lack of corresnondence between the domestic-and international price of export-
ables. Considerable increases in investment in agriculture, forestry andmining are required to increase and diversify production for export. At the
same time, an increased flow of exportables will require correspondinginprnuements in export marketing and pricing policies.
xxv= The government is aware of these problems and the determination
to come to grips with the economic problems endangering social progress,
has been gathering momentum over .the last year. Thus, the government has
substantially increased the'prices of paddy and other major crops; the
structure and level of wages have been revised and there is greater
flexibility in the use of piece rates, bonus schemes and other productivityincentrives. Tntprest rates on savings deposits have been increased and the
government hopes that this measure together with the expansion of the bankingnetwork will induce more private savin.s. The cooneratives are taking overretail distribution and it is hoped that this will bring about improvementsthrough the reductinn in stocks and wastages. The uniform selling price
of rice has been abolished. In the industrial and mining sectors several
schemes have been introduced, and others are under consideration for improving
efficiency. Though these measures may not be enough to reverse present trends,most of them represent steps in the right .irertin. They also represent
radical departures from previous policies and, as such, they warrant credit
andU support.
xxvi. The picture whIch emerges is therefore not unrelievedly discouraging.
All the macro-indicators point to a worsening economic situation. This is,however, partly due to the ,glect of the economy over the past decade, and
to the steady drop in the purchasing power of Burma's exports. For these
reasons, it would be unrealistic to expect a major reversal of these trends
in the immediate future. Moreover, the analysis of this report indicates
that the major economic probleems are deep=seated and it will require substantial
increases in investment over time to set the economy on the path of dynamic
growth. Tne basic causes for optimism are, however, the country's enor.mousresource potential and the evidence that -the authorities are making a seriouseffort to harness some of this potential. To develop these resources, even
at the modest rate of 4 percent per annum increase in GDP will require
substantial inflows of foreign assistance. In vjew of the under=investmentof the past decade and Burma's rich resource base, there is no dearth of
sound development projects and no question of the country's ability to absorb
foreign aid in some sectors effectively.

INTRODUCTION
1. In the course of the past year, the GuVveriment of Burma continued
its efforts to widen its contacts with foreign countries and international
institutions, and greater consideration is being given to encouragirng tour-
ism. The most recent of these developments is Burma's admission to the Asian
Development Bank in April 1973, and the pending extension of the seven-day
tourist visa to one month. On the economic front, considerable attention
was given to trying to implement the targets of the current Four Year Plan
(1971/72-1974/75), and to devising measures to increase the rate of economic
growth.
2. The government, in the course of the past year, has taken strong
measures, most notably a complete overhaul of the wage structure, an upward
adjustment of both wages and the procurement price of major crops (including
paddy, pulses and.cotton) and an unprecedented increase in interest rates
on savings deposits from 2 percent to 3-1/2 percent, tax-exempt. These and
other policy measures currently under consideration represent radical departures
from the types of policies which characterized the management of the economy
over the past decade. As noted in last year's Economic Report, over most of
the past decade the government devoted much of its energies and limi ted
resources to two overriding objectives -- unifying the country and creating a
social welfare state. By and large, the authorities have made notable progress
in the attainment of these political and social objectives, and it is a source
of pride to them that this has been accomplished witbout outside help.
3. At the same time, the neglect of the economy has resulted in a
lack of economic growth which is endangering the social progress which has
been made. lioreover, the measures now required to reverse the declining
trend in real per capita incomes and investment will have to be severe.
The economy of Burma is approaching that vicious constellation of circum-
stances which is all too familiar. As the economic situation worsens, the
measures which must be adopted to reverse the process become increasingly
more riskv and harsh, and thus tend to be not taken. Nor does postponement
make the solutions any easier.
4. Part A of this report (Chapters I-V) contains a review of recent
economic develonments, an evaluation of some of the more important policy
measures recently adopted and under consideration and a discussion of the
prospects for 1973.
5. Part B (chapters VT and VII) continues the discussion in the
previous economic report on the social progress which has been made but it
draws attention to two nroblems; namely, increasing rates of unemployment
and declining trends in real incomes which illustrate the limits to further
soc^il actio wrth the nresent economic constraints. Part C of the report
(Chapters VIII-X) contains an analysis of some of the major constraints to
BurmaIs economic development. The report discusses the problem of rice --
the dominant crop -- and its relation to other crops, and the prospects for
increasing the rate of agricultural growth-. The discussion of the industrial
sector focuses on three main problems -- the neglect of the small-scale
sector, prices and costs and the shortage of imported raw materials and
components. A third problem is the shortage of resources for investment,
which is discussed in Chapter X. The concludine ch2nter tries to place these
recent developments in perspective and relate them to the broader question of
how to achieve higher rates of econromic growth.

-2-
A. RECENT ECONOMIC DEVELOPMENTS
I. NATIONAL PRODUCT AND ITS USE
6. Last year was the first year of the current Four Year Plan (1971/72
- 1974/75). It is the first plan to reach the stage of Cabinet approval since
the early sixties and it is intended to be the first of a series of five Four
Year Plans for the long run development of the economy. The current plan
targets an overall increase in GDP at 4 percent per annum. The plan defines
sectoral targets for the agricultural, forestry, fishery, livestock, industry
and mining sub-sectors and it delineates what needs to be done to improve
the efficiency of the other sectors. The plan is a statement of the priority
given by the government to economic development but it is not a program for
specific action. It contains no analysis of financing, of economic inter-
relationships, nor of projects, and there is little indication as to how the
targets are to be achieved. Both the amount and the distribution of invest-
ment over the Plan neriod are to be maintained at the 1970/71 level. There
is, however, no means of determining whether this is a level of investment
which is consistent with the attainment of the sectoral targets. The
performance of the economy last year suggests that it is not.
7. In 1972, GDP in constant prices increased by 3.1 percent over the
previous year; which was lower than the average annual rate of growth of
4.7 percent experienced over the period 1968-1971, and was also lower than
the plan target of 4 percent per annum. The main reasons for the slow growth
of production were the near stagnation in agricultural output and the slow
grOwth of industrial production (Table 1).
Table 1: SECTORAL CO-TnOSITION OF GDP (constant 1969/70 Prices)
(millions Kyats)
Year Ending Sept. 30 1968 1969 1970 1971 1972
griculture (including-ivestock, fishe.;L
and forestry) 3,550 3,589 3,707 3,983 4,051
Industry 992 1,017 1,071 1,114 1j155
tining 94 91 111 117 131
Wholesale and Retai' Trade 2,397 1,452 2,535 2A,6R 2 751
Others 2,164 2,397 2,567 2,657 2,767
TOTAL GDP 9197 9,546 9,991 10,529 100855
GDP Annual Increase (%) - 3.8 4.7 5.4 3.1
Source: Ministry of Planning and Finance.
8. Agriculture. Taking account of variations in production due to
weather fluctuations, the growth of agricultural output over the past decade
was slightly over 2 percent per annum. Last year's performance represented

no significant departure from this trend. The value of crop production
increased by 1.3 percent, which was more than the planners had expected
because 1971 had been a bumper crop year. Forestry output also increased
more than had been planned, but livestock and fishery production were well
below the unrealistic target growth rate of 14 percent. Altogether, the
output value of the sector increased by 1.7 percent over the previous year
(Appendix Table 7.1).
9. The causes of this near stagnation of the agricultural sector
can be identified by examining the factors affecting the area, yield and
production of the major crops -- paddy, groundnut and sesamum, pulses, cotton,
jute, tobacco, sugarcane, onions and chillies (Appendix Table 7.2). Jute,
sugarcane, groundnut and sesamum, onions and chillies are the only crops
which increased by more than 2 percent per annum but, with the possible
exception of groundnuts, onions and sugarcane, the increase was solely due
to area expansion. The data show no real evidence of a breakthrough in
increasine agricultural productivity. Yields have either declined or remained
stagnant. Among the other crops, export pulses, maize and cotton production
have declined the most.
10 Rice-, the dominant crop and the country's largest export, has also
registered a poor record over the past decade. Once the largest rice
exporter in the world, Burma suffered severely from the devastation wrought
in World War II and from recurrent social disturbances. As a result of
extensave embankment and reclamation work carried out from 1958-1963, sown
acreage under paddy regained its pre-war level of 12.4 million acres in
1964. Since that time there has been no significant increase in area under
cultivation or in yields, and production has fluctuated around its pre-war
level of about 8 million tons. The drop in the exportable surplus from
1.5 million tons in 1963 to 650,000 tons in 1972, can therefore be explained
very simply hy the increases in population and per capita consumption of
2.2 percent and 1 percent per annum, respectively.
11. The details of the performance in 1972 and the prospects for 1973
are given in the Appendix Table 7.3. In 1972, paddy production was about
8 million tons. Compared to the previous year, there was a slight increase
in yields, but no increase in sown acreage. The acreage under cotton con-
tinued to expand in-1972,.probably at the expense of chillies and edible oil
crops. Cottonr. yleda were neP-third the level expected, however, and there
was no major increase in output. The decline in the retail price of edible
oils in 1970 and 1971 was a factor influencing the acreage under cultivation
and the production of oilseeds in 1972. The production of chillies was also
dow.n (by 32 percent) in 1972. Simi1ar,iv the wheat area continued the
decline which had been taking place since 1966 when prices were reduced from
K 19 to K 12 per basket. Harvested sugarcane production was less than half
of the plan target, but this was due to the failure to coordinate harvesting
and deliveries to the mills rather than a shortfall in production. Tobacco
and jute were the only two crops which did as well, or better, than expected.
12. The prospects for 1973 do not call for any major increase in
output. The first half of the crop year was beset by inadequate rains

-4-
in sone areas, as a result of which paddy production is estimated to fall
by around 0u percent. Th e government raised the nrocurement price of paddy
by 19 percent in January 1973, but it is too early to tell what effect this
is likely to have on pruction and procurement. The production of edible
oil crops is likely to be down by 20-30 percent, since these crops are
grown primarily in the drought areas. Th-.e production of cotton, wheat and
jute are not expected to be adversely affected by weather, but taken alto-
gether it seems unlikely that the plan target of a 2.8 percent increase in
total crop production will be achieved. There is also no reason to believe
that the increase in the output of the livestock and fishery sub-sectors
will be as high as 11 percent. Only for the forestry sub-sector is there a
likelihood production might achieve the target increase of 3.4 percent.
13. Industry. Industrial output increased by 3.1 percent over the
previous year. This was a poor performance, however, even if judged by
the past decadets standards, since most of what little investment there
has been has gone into the industrial sector. Public sector enterprises
receive the lion's share of the investment resources, and in recent years
several new factories (including two fertilizer plants, three textile mills,
and one each for paper and cement) came on stream. Gross output from the
public sector enterprises increased last year by 5 percent, bringing their
share of total industrial output to 44 percent; in conitrast, gross output
in the private sector declined by 3 percent.
14. The depressed growth rates of the manufacturing sector reflect
mainly the slow growth of agricultural production and the continual decline
in the availability of imported raw materials, spare parts and components.
But it is also partly a consequence of the very steady disinvestment process
which has been going on for some time. The level of public sector investment
in manufacturing over the past decade corresponded to about 2 percent of GDP
annually and most of it went into the establishment of new industries. As
a result, industrial capacity is rapidly being worn out (mainly in the
private sector, but also in the public sector) due to poor maintenance,
depreciation, repairs and replacement policies.
15. Minerals. The expansion of GDP during the year would have been
even smaller but for the increase in the output of the mining sector. For
the first time in the post-war period, output in the mining sector regis-
tered a remarkable 12 percent increase in 1972. This was due mainly to an
increase in the output of crude oil by 19 percent, in natural gas by 67
percent and in zinc by 16 percent. In all other items, mineral production
either stagnated or declined, so Burma remains far below pre-war production
levels in metallic minerals. Most of the increase in crude oil production
comes from new: oil wells, brought into operation during the last two years,
probably as a result of onshore exploration programs financed in part by a
$5.6 million loan from the Exim Bank and Manufacturers Hanover Trust, and
by a DM 22 million loan from the Federal Republic of Germany. These in-
creases in crude oil output all came from one field; the average daily
outntit of all other fields is' declining. Hence the necessity to intensify
exploration works,both onshore and offshore, which is reflected in the fact
that 48 nercent of the mining sector investment program has been earmarked
for oil exploration and field development works during the plan period.

16. The minerals sector as it stands today, with worn-out and out-dated equipment, well depleted higher-grade ore deposi--s an a slortage ofskilled labor, requires enormous investment and concerted efforts to re-store its ro; ir. Axot end U dutr4al deeo,lrt hs task is ,-<even more difficult by the insecurity which prevails in some of the most
importan m.4ing areas. It+ i9 r.ot possible o assess Ir quantLitat.ve term,sthe damage being caused by insurgent activities, but the effect on miningpr^uction, transportatior, L L the cosL oL new projects imist be sizeable.The problem of.labor shortages seems.to have eased somewhat during the pastyear, at least fUor unsIkilled wor'Kers. ±LLe goverILfi,enLt's attitude towardsincentive schemes is now more flexible, and the supply of consumer goodsto minir.L ares ILas been JLmprovedL. 1AccordLnLg to official statistics, thenumber of mine workers increased in 1972 by 11,500, or 46 percent, and thiswas tLhe f'rst time t'at the labor -eCLUitent service succeeded in attractinga large number of new mine workers.
17. Services. The output of the services sector -- which includesall non-commodity producing sectors -- increased by nearly 4 percent from1971 to 1972. Within the sector, however, there were significant variations.Output of the construction and telecommunications sub-sectors continued tostagnate and there was a further slowing down in the performance of thetransportation and power sub-sectors. Inadequate transportation and tele-communications, together with frequent breakdowns in the supply of power,constitute increasingly constraining bottlenecks to the growth of outputwhich point up the need for substantial increases in infrastructure invest-ment.
National Income
18. During the year, consumption and gross fixed investment grewfaster than the increase in GNP, by 5.2 percent and 5.8 percent, respectively(Appendix Table 2.2). This entailed a substantial decrease in stocks andincreased use of foreign borrowing. No data are available on the relativeshares of public and private consumption. According to the information whichis available, gross capital formation, in current prices, remained low ataround 12.percent of GNP, and a further decline in private sector investmentbrought its share of total investment to less than 30 percent. This comparesto a private sector share of slightly more than 50 percent in 1962. Inreal terms, pe.r capita gross fixed investment has been stagnant at $8since 1965.
19. Available data indicate that total national savings increased inboth absolute terms and as a proportion of GNP last year. Public savingsare negligible, and most of the increase is accounted for by a 20 percentincrease in private savings. The behavior of-private savings seemsparticularly unrealistic in view of the fact that per capita income inconstant prices was K 374, showing no increase over the previous year.The only-plausible explanation is that the figures refer to trends innominal savings, for such an increase would be consistent with the rapidexpansion in liquidity and savings held in deposits relative to the previLusyear. Even so, the share of national savings in GNP is still only around8 percent, and net external borrowing accounts for 3.5 percent of GNP.

-6-
II. DISTRIBUTION AND THE COOPERATIVES
20. hle huaJor cliaLge In economic organization last year fwas the con-siderable expansion in the role of cooperatives. Since 1970, membershipin the cooperatives has '-Lcreased by nearly one m4llion, bringIng the t^tal
to 5.7 million. The number of cooperatives is now 15,650, compared to
13,000 in 1970. Mxembership is voluntary and thLe cooperatives ae -ected to
appoint their own staffs. However, the Cooperative Ministry undertakes to
train managetial personnel, Or even tLU provide it, to eI..odsof
operation, extend credit, fix prices and appoint 6one-third- of th"e members
of each cooperative committee.
21. A large expansion has taken place in the num..ber o'f consumer co=
operatives, which have replaced most of the People's Shops dealing withfoodstuffs, textiles, household goods and gener'al stores. The mi3sion visitedseveral of these cooperatives and found them generally well-run and better
stocked than the People's Shops, which sold only the g6oa- ofL or.e particularTrading Corporation. Another imp'ortant development is the recent removal of
the subsidy elements in the domestic sales of rice. -ice was sold previouslythroughout the countfy at 20 Kyats per bag (2 cents per pound). The co-
operatives have now been instructed- to charge prices wh,ich co'ver cSt5s.
This-does not mean that the cooperatives will be free toj let prices adjust
to supply and demand forces, because the Government will st'ill set price
ceilings. The retail price of rice in Rangoon, for example, is not supposed
to exceed 2.5-3.5 cents per pound, depending on the quality. Nev'ertneless,the potential importance of the new policy can be gauged from the fact
that the budgetary losses on previously subsidized domestic rice sales were
estimated at K 70 million in 1971.
22. At the wholesale level, the current plarn is for each of the Trade
Corporations to establish depots in each of the 14 major divisions of the
country for distribution to the cooperatives. Government also hopes that
most of the now redundant employees of the Trade Ministry will be absorbed by
the Trade Corporation division depots and the cooperatives. Even with all
of these teething troubles, the consumer cooperatives may bring about improve-
ments in distribution if some of the more general problems'such as inadequate
transportation, storage and credit can be solved.
23. Meanwhile, the position of the priva'te retail traders remains
anomalous. The emphasis on cooperatives tends.to obscure the fact that the
private sector accounts for more than half of value added in the trade sector.Because private traders, operating with uncertain'legality, are subject toarbitrary seizure of their goods, the prices consumers pay presumably coversome of the risks of- private sector trade operations. Early this year, theGovernment issued a notification requiring the-registration of all privatedoctors and clinics. This action was taken with a view to 'supervisingstandards of operation. Similar action with regard to the7'regularization of
private retail trade could serve to improve the efficiency of distributionand thus be in the public's interest. Taking steps to legalize private
retail trade would perhaps not be so necessary if the cooperatives concentrated

their efforts on improving retail distribution, but, unfortunately, the
emphasis seems to be more on simply expanding the role of the cooperatives
in all aspects of the economy.
24. As a result, in addition to their wholesale and retail functions,
the cooperatives have replaced Trade Corporation No. I in the procurement,
processing and most of the distribution of rice. Trade Corporation No. I
will be responsible only for the processing of paddy for export and for dis-
tribution to the remote areas. The cooperatives have also replaced the
Ministry of Trade in the purchasing, processing and marketing of marine
products, textiles and industrial goods, both at the wholesale and retail
levels. Beginning this year the cooperatives are also to replace the Union
Bank in the provision of short-term credit to the farmers. This change has
many serious implications, not the least of which is the abolition of the
only existing institution for credit (the Village Banks) and its replacement
by something xwholly untried.
25. The change in the provision of credit also has important effects
on the pricing of agricultural commodities. Since the cooperatives have to
borrow funds from the Union Bank at 4-1/2 percent per annum to finance their
interest-free advanced Dayment scheme to farmers, they intend to cover this
by generating a surplus through their profit margins at various levels beyond
procurPment. The effect of this scheme is, therefore, to subsidize credit
to the farmers by the consumers. Furthermore, since the advanced payments to
farmers can be used for non-productive purposes, this scheme may be less
effective in improving production, than, say, increasing the procurement
prices. Further detais on credit and the cooperatives are provided in
Annex II.
26. The expansion of the cooperatives is creating considerableeconomic upheaval. The budget is feeling the impact of the loss of the
surplus from the Trade Council, increased administrative costs and interest-
free credit to the cooperatives. At the same time; there is as yet no sign
of significant improvements in the entire distribution network. On the
contrary, in the last quarter of 1972, the cooperatives were quite unableto handle efficiently the distribution of edible oils and these commodities
were again handed over to the private sector after three months. To put
it simply, expansion of the cooperative movement appears to be proceeding
too rapidly and on too mmany fronts, with little attention apparently being
given to the costs of this latest drive relative to the probable benefits.
Since, as noteu previously, t.he consumer cooperatives m,nv bring about some
improvement in retail distribution, it is not the principle of expansion ofthe role of the cooperatives in the economy which i hbeing nuestioned. Rather,
the doubts concern the timing of the expansion, the mode of operation and the
effects on cost and efficiency of the rapid expansion in a large number of
areas which is currently in progress.

- 8 -
III. PUBLIC FINANCE
27. The continued worsening of the economic situation is also reflectedin the widening budget deficit. In 1972, the overall budget deficit wasK 815 million, or 32 percent higher than in the previous year. (Table 2).
28. Current Revenues and Expenditures. Details of the Union Governmentcurrent receipts and expenditures (excluding interest payments) are shown inAppendix Tables 5.1 and 5.2. About 36 percent of government revenues comefrom income taxes; another 40 percent comes from indirect taxes, mainlycustoms duties, sales taxes and excise duties. Virtually all taxes (on income,production and expenditure) are collected by the Union Government from theBoards and Corporations. No new revenue measures were taken last year andtotal receipts registered a two percent decrease over the previous year.This continued a trend which has been steadily declining since 1965 and ismainly due to the slow rate of economic growth, the decline in exports andimports and the failure of the Boards and Corporations to show a taxablesurplus. Total receipts were equal to 13 percent of GDP in 1972 compared to25 percent of GDP in 1965.
29. At the same time, current expenditures continue to increase. Theunprecedented iump in expenditures by 10 percent last year was considerablyhigher than the 4 percent annual rate of increase registered over the pastdecade, and was due largely to a 10 percent increase in expenditures onthe social and economic services and a 12 percent increase in the cost ofadministration. The increase in expenditure on economic services resultedfrom the more than doubling of expenditure on the cooperatives. The increasein expenditure on social services was due to a 10 percent increase in theexpenditure on health and education and a 28 percent increase in pensions.For mnot of the nast decade- the growth of current expenditures was kept inline with the growth in revenue, although this was increasingly difficult tonronmplish over the npat four years. Even so; un to 1970. the current surnlus
of the Union Government was sufficient to finance its capital expenditurenrogam= T-act yper t-hp etst-ormnrv siirnpli on rctrrent acrount tuirne.d into a
deficit, however, while capital expenditures remained at the same level as in1971 (Asppen.dix Table 5.3).

-9
Table 2: CONSOLIDATED PUBLICECTOR BUDGET(million Kyats)
Est. BudgetYearx Ending Sept. 30 1968 1969 1970 1971 1972 1973
C urrent Revenues 6,524__ 7,036 ,-7,389 / 7,599 /V8,372 8,700
Union Government /a 1,826 1,810 1,953 1,855 1,959 1,674Local Bodies 69 70 71 79 82 79Boards & Corporations 4,629- 5,156- 5,365, 5,665. 6,331 6,947
urrent Expenditures 6,248,-'6,852_--7,399-- 7,517 /,336 8,694
Union Government /a 1,731 1,882 2,062 2,155 2,429 2,359Local Bodies 49 52 53 55 64 66Boards & Corporations 4,468 4,918 5,284 5,306 5,843 6,259
Current Surplus/Deficit 276 184 -10 82 35 16
Capital Expenditure 613 726 778 712 852 988
Union Government /a 202 209 278 222 228 264Local Bodies 10 13 12 10 17 17Boards & Corporations 4n1 504 488 480 607 707
Capital Revenues _b 1 61 117 13 1 1
Deficit to be Financed -336 -536 -671 -617 -815 -971of whichDomestic Borrowing /c 113 326 345 300 327 451Gross Foreign Borrowing 223 210 326 317 488 520
/a Including Special Accounts and the States.
/b Derived from the liquidation and sale of state assets.
/c Mostly bank financing.
Source: Ministry of Planning and Finance.
30. State Enterprises. The major source of government revenue is thecurrent surplus of the State Boards and Corporations, in particular Industry,Transport, Banks and Insurance. State enterprises are required to transferall receipts to the Union Government Consolidated Cash Fund, from which fundsare returned to the enterprises according-to their budget allocations. Lastyear, the current revenues of the state enterprises increased by 12 percent,but this was wholly offset by increases in current and capital expnditures.As a result the overall deficit of the state enterprises was the same lastyear (K 120 million) as in the previous year (Appendix Table 5.4). TheAgricultural Corporation has consistently shown a deficit. This is due tothe losses on the operation of the tractor and pump stations, the non-recoveryof loans and the non-payment for services. The current surplus of the state

-10-
manufacturing sector has been declining since 1969, while capital expend-
itures have been rising. The same is true of the transport agencies. Thegovernment's difficulties in handling wholesale and retail trade is reflected
in the performance of the Trade Council. As stated previously, producer
organizations are required to hand over goods at cost and only the Trade
Organizations are allowed profit margins. These profits are then to be
transferred to the government in the form of income taxes. However, since
the nationalization of trade in 1963, the Trade Council has shown a surplus
only in 1965, 1966 and again last year. The transference of responsibility
for internal distribution to the cooperatives is likely to have a negative
impact on the budget, but government officials hope that the huge losses on
the distribution operations can be reduced. The nationalized financial
institut'ons used to be a steady net contributor to government revenues, but
in recent years the surplus has been declining due to rising expenditures
associated with widening the network of branch banks and taking over the
numerous subtreasuries '(over 100) of the Government. Taken together, the
state enterprises have shown an overall deficit every year since 1965. The
main reasons for these continuing deficits were given in last year's report.
In brief, they reflect essentially the inadequate management of the state
enterprise sector.
31. Capital Expenditure. Public sector investment increased last
year by nearly 20 percent. Most of the increase took place in the State
Boards and Corporations, which accounted for 71 percent of the total. There
was no malor change in the distribution of investment. Industry continues
to take the major share, accounting for 40 percent of the total, but there
were substantial increases in investment in agriculture and mining. Invest-
ment in agriculture increased from K 42 million to K 72 million, increasing
its share from 9 percent to 12 percent. Investment in mining increased
from K 83 million to K 171 million, reflecting largely the disbursementson the Japanese loans for oil exploration.
32- Consolidated BudRet. The deficit of the Union Government accounted
for 86 percent of the public sector overall deficit of K 815 million for 1972.
In addition to what was said earlier,-another important contributory factor
to the rise in current expenditures was the considerable increase in service
payments on nublic debt. Interest charges on internal public debt increased
from K 75 million in 1971 to K 169 million in 1972, and interest charges
on external debt rose from K 133 million to K 176 million over the same
period. These increases were the direct outcome of the government's increas-lng reliance on Treasury Bill horrowing and short-term foreign credits to
finance the deficit. About 40 percent of last year's budget deficit was
financed by bank borrowing and the rest by disbursements on foreign loans
and grants. Although the government is increasing its reliance on foreign
borrowing to finance the deficit, and despite a leve1 of bank ffnancing in
1972 which was not much higher than the average for the past three years, the
inflationary impact could no lorer be cushioned by a drawdown in foreign
exchange reserves. Net reserves were negative at the end of 1972, including
the I'rnr stardLUy credit.

The 1973 Budget
33. The budget for 1973 does not indicate the likelihood of anyimprovement in the basic situation. According to the original estimates,Union Government current expenditures are slated to go up by a further 23percent, and revenLues are again expected to decline. The anticipated declinein revenues is largely due to the expected decrease in corporate income taxwhich would result from handing over the responsibility for distribution tothe cooperatives. It is not that the cooperatives are exempt from taxes,but no procedure has been established as yet for assessing and collectingtaxes from them. It is also very likely that the cooperatives will not show-much of a taxable surplus for some time. The decentralization of distributionwill also reduce profits to the non-taxable level. The budget also envisagesa substantial increase in capital outlays, and the resultant deficit may beup to 20 percent higher than last year's. Since disbursements on foreignloans and grants are not expected to increase by much, the budget anticipatessubstantial 'reliance on bank borrowing, which would raise the level ofdeficit financing to K 450 million.
34. Since the announcement of the 1973 Budget in September 1972,several events have occurred which will require major revisions in thebudget estimates. First, the original estimates did not include the costof providing salary increases, estimated to be K 190 million. Second, thebudget did not allow for a K 500 million increase in lending to the cooper-atives during 1973. Most of these loans are for advance purchases of paddyand are repayable at 4 percent interest, but at least K 150 million are tobe given interest free to the farmers as the cooperatives replace the VillageBanks. The implications of this change are discussed elsewhere, but sufficeit to say in this context that it will probably add another K 150 millionto the deficit.
35. On the other hand, the government is already engaged in the taskof cutting back certain other proposed increases in expenditures. Measureshave been initiated to reduce and/or postpone non-urgent expenditures. Forexample, the government no longer provides cars and drivers for seniorofficials. These employees are now allowed to purchase the cars and operatethem at their own expense. Also, a high level committee has been establishedto vet proposed expenditure increases, although it is not clear that thecommittee has much room for maneuver. Much of the increased cost of govern-ment administration goes toward the establishment of new institutions (suchas the People's Courts) and widening the functions of the Burma Socia istProgram Party, wich are funded almost entirely out of the budget. Partof this year's huge increase in expenditure reflects the cost of carryingout the long overdue population census. But in all candour, for most of therequired cutbacks in current expenditures. the critical decisions can onlybe taken at the highest levels of government where choices dictated byoverall considerations must be reconsidered in the light of a rapidlyworsening economic- situation.
36. On the capital expenditure side, the original budget estimateswere based upon the assimnption that rice exports would be as high as

- 12 -
300,000 tons this y'ear. The government now does not expect exkorts to bemore than 300,000 tons, and this entails substantial cutbacks in the tree
forein exchanrge allocation to the Boards and Corporationiis. Since theforeign exchange conitent of public sector investment is arou*d;50 percent,capital formation next year in the public sector is, at bes't, likely to hecontained at this year's level. Thfe careful management of m-onetary andfiscal w li-ciets over the past decade is the basis for th1e belief that effortswill b'e made to-redu'ce- reliance on deficit financing to,a muchi more manageablelevel than is indicated in the original budget estimates. No increase in
short-term inter-biank borrow'ing is expected but eff6qtts are being made toincrease the rate of disbursement on toreign loans and to cut-bacK current
and capital exp'endituies. Unfortuna'te-ly, any red'uction in capital expenditurewill hnve an advre imoinact on th'e outDut tarRets for 1973' and for this reason,
it would be preferable if the n'ec'essary reductions fell iore heavily on
current expennditu'es.
IV. MONEY AND. CREDIT
37. 1!onetary De-v"lnments. For m6st of the' D daecade.-contr6l of
the money supply'wAs- an impOrtant in'trtitent for mifTtain`ing price stability.Dm-teStic credit 6.sexpanid+h r4in1dlvj hlt- it wiAA noassible to contain thegrowth of the money supp"ly' ait less than 2 percent per annum right up to 1971
by sharply redti&ing ektetnal reservPs - st yeari nowever ; the To'nA,tqrvpicture changed drastically. Doimstic cre'dit (maiffnly to' the public sect-r)n.reased by ,a ii, inf1a'fioin v impart eas immediate because
there were no external reserves- whfich cou-ld be' drawn down. ,At the end of
1971 net forei, a-sets -- r- K 13' i,Wii Iton - hi.t- hv th:e end of 1972, thev werenil - actually negative by' about $30' mi'llion', if liabiliti-e"s to the IMF are
in.luded-. Duri.g.- 1797,. the mjg,,o9 a,,npl~ nn tnt21- linai{dftv iner'ased by
16 percent, bringing the ratio of money to GNP to 20 p'ercent.1/
38. According to' the reeulTations eovernini the- dpDerations of the UnionBank (thne only athorized fibat41iDl in.'tituitirn) e ninuel adivanre to th
Government should. not exceed 15 pe'rceit of e§timated' budget revenues. The
Govern.,ent has byjpassed this re -lafiorsiiiIp'lZby s1lling seruritie to the
Bank and almost all of the internal public debt is lield b'y the Union Bank
in the forL of r y i. .latte are, t-h.ro.e m.ot1i i nMiat-4nno beanyr4,
interest of one pe'rcent per annum.i Government sales' of Trea'sury Bills in-
creaseu by 22percen pet r ann-.. betweeer.1968 a 1971. L -- .oun
of Treasury Bills outstanding was'K 809 million, or 31 percent over the
previous year. '(Appe,idix Table 6.1).
1/ All this is'not immediately evide'nt from Table 3. Burimas monetary
statistics present some difficulties- oL ±1t.LepLULaLion,.
- 13 -
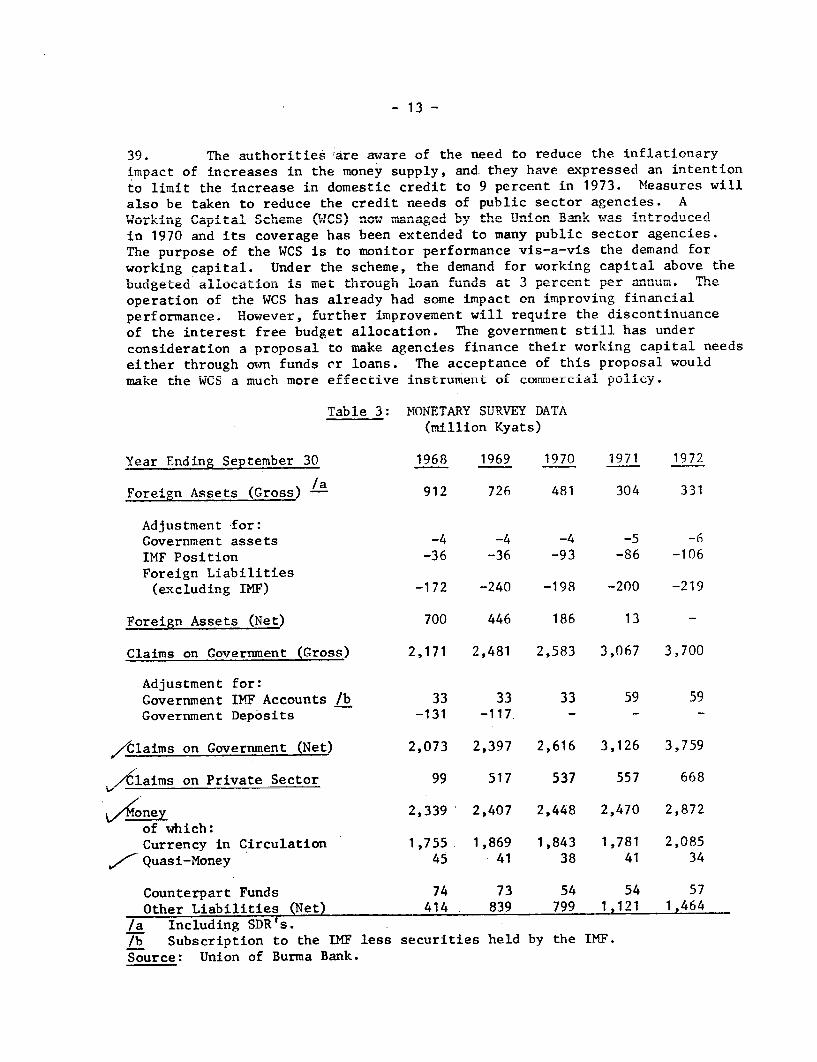
39. ..e author-e are aware -f the need to reduce thp infl ltionnrvimpact of increases in the money supply, and. they have expressed an intentionto limt- the increase in doumestic credit to 0 per-cnt in 1973. Meaclsrpes willLU L.LMLU.L L.16C LuLL. LLt- ' *~-~ ---
also be taken to reduce the credit needs of public sector agencies. A
Working Capital Scheme (UCS) now .-anaged by the Union Brnk wa introducdin 1970 and its coverage has been extended to many public sector agencies.
The purpose of the WC is to monitor performnance vis-a-vis the demand for
working capital. Under the scheme, the demand for working capital above the
budgeted allocation is ueL .uguh loa.n funds at 3 percent per -nnum. The
operation of the WCS has already had some impact on improving financial
performance. However, further lmprovemuent will require the discontinuanceof the interest free budget allocation. The government still has underconsideration a proposal to make agencies finance theiLr working capital needseither through own funds cr loans. The acceptance of this proposal wouldmake the WCS a much more effective instrument of commercial policy.
Table 3: MfNETARY S'uR.vEY DATA(million Kyats)
Year Ending September 30 1968 1969 1970 1971 1972
Foreign Assets (Gross) 912 726 481 304 331
Adjustment for:Government assets -4 -4 -4 -5 -6
IMF Position -36 -36 -93 -86 -106Foreign Liabilities(excluding IMF) -172 -240 -198 -200 -219
Foreign Assets (Net) 700 446 186 13 -
Claims on Government (Gross) 2,171 2,481 2,583 3,067 3,700
Adjustment for:Government IMF Accounts /b 33 33 33 59 59Government Deposits -131 -117. - - -
./Claims on Government (Net) 2,073 2,397 2,616 3,126 3,759
/Claims on Private Sector 99 517 537 557 668
,<oney 2,339 2,407 2,448 2,470 2,872
of which:Currency in Circulation 1,755 1,869 1,843 1,781 2,085
7- Quasi-Money 45 41 38 41 34
Counterpart Funds 74 73 54 54 57
Other Liabilities (Net) 414 839 799 1,121 1,464
/a Including SDR's./b Subscription to the IMF less securities held by the IMF.
Source: Union of Burma Bank.

- 14 -
40. Interest Rate, Savings and Credit. Since 1964, the interest onsavings deposits had been kept constant at a tax-exempt rate of 2 percentper annum. and ceilings were applied to the amount of the deposits whichcould earn interest. In January 1973, the government took the unprecedentedstep of raising the rate to 3.5 percent tax free, and abolished the limitson the size of deposits. The government hopes that this measure, togetherwith the exnansion of branch banks and credit societies. will increase themobilization of private savings.
41. Between 1968 and 1971, total savings held in the Union Bank in-creased mersrtelu by arounid npercent- per annum. Last yepr, tntal savings
(mostly in the form of deposits) increased by 11 percent (Appendix Table 6.2).Th.e reasons fnr thia aiiieln i-ncreas ar not quite clear. Owing to therapid increase in the money supply in recent years, total liquidity in thehr.oAas of tho -ubli4c hFa inreaosedA and there has hoben consoidoeahle hoari4ngn
During last year, there were rumors about another demonetization measureof K 20 notes and th4s may have prompted some flow of funds into the Bank.Another possible explanation is that the expansion of branch banks hasinduced peoplke to .h.old. .more of their savings in the fo-- of depositJs.
A) C-redit7 -tho nt4eori-. r ortnesetr 1 roislarel- limiste to short--term og-r4--_ r ~~~~~0_ __ -0_
cultural loans. Over the last three years, K 150 million were advancedannually to the farmers through the Village Bnks. These loans are -ade
available to the Village Banks at 3 percent per annum, and are relent tothIe farm.ers at a per L - .-- 6 pecet diAAfferetial, A4 ir. diAtion to a
compulsory saving of one percent of the loan, are held as savings deposits.T.f*LV are 11,000 Villlage B.ks i..th a -toa- --- t.iiL of- near tw. o mil-
lion. In recent years, the annual repayment on their loans averaged 90percent a an'" uiuele vallue of theIr .deosts gr--L--A L4 percenkt of thle loansadvanced in 1972. The Agricultural Corporation is the only other source of'nistitutional credit t0 thLe farmer>L .LL tL CorpULorLat.LioLL gives credit in the
form of inputs (fertilizer, seed, etc.) amounting to about K 15-18 million.Recovery rates are extremely low - about 35 prLcenLt of the anLual ad-vances -
and with defaults being generally written off, the Corporation has beenloosing at least K 11 million per year.
43. Beginning this year, the Cooperatives will initiate a system ofadvance payments to provide short term credit to farmers without interestrate charges. Participation in this scheme, applicable to all crops willbe voluntary. The Village Bank system will be discontinued, however, andthe Cooperatives will now have to establish units to take over the provisionof credit to at least the two million farmers who have been members ofthe Village Banks. It is not clear exactly how this proposal will be carriedout. Although a broad outline of the scheme has been described, no concreteprogram for implementation has been developed. The government hopes thatthe Cooperatives will succeed in procuring greater quantities of paddy, butit is doubtful whether this will materialize. It is not clear why it hasbeen decided to totally replace an efficient credit institution by one whichhas yet to be created and is totally untried, at the same time continuinganother system (input loans in kind) which has proven much less successfulon the criteria of repayment.
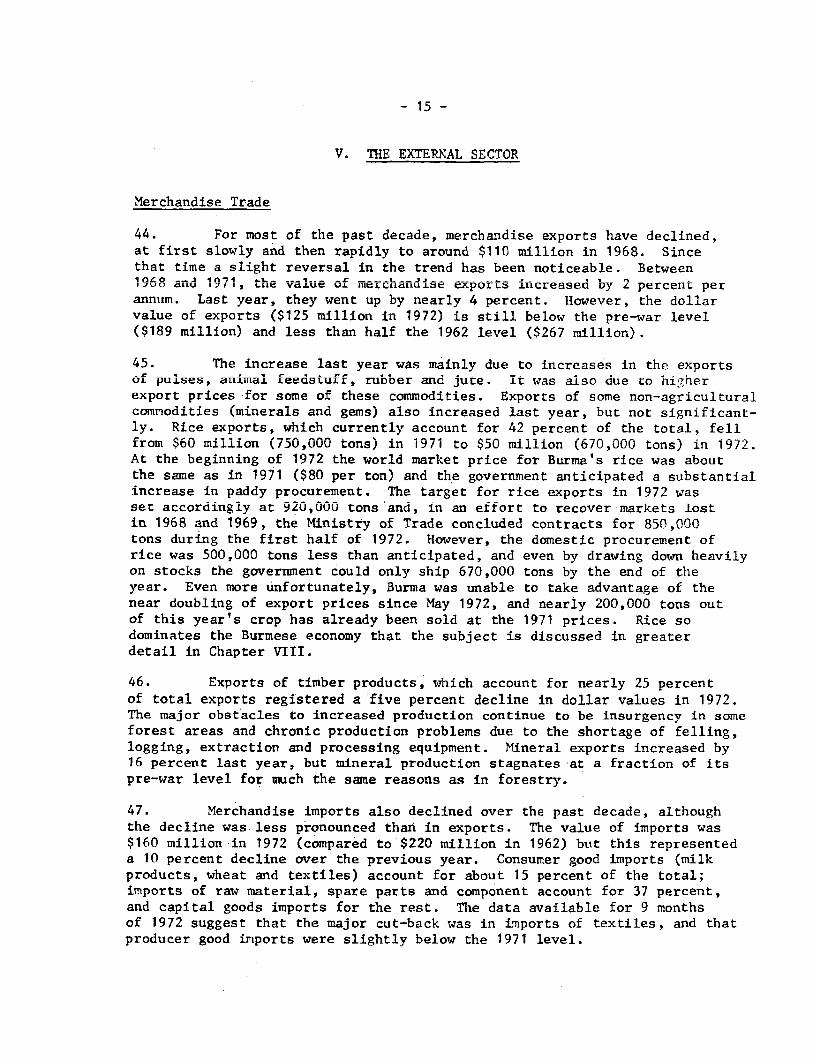
VU TT.h RYTRPMAT SVECTOR
Merchandise Trade
44. For most of the past decade, merchandise exports have declined,at .first slowly ar.d ten rapidly to aoLULLU $ IIJ LLU..L.L.Ult 110 L '19UO. D L.M.Ac
that time a slight reversal in the trend has been noticeable. Between1968 and 1971, the value of merchandise eports increased by 2 percent perannum. Last year, they went up by nearly 4 percent. However, the dollarvalue of exports ($125 million in 1972) is still below tne pre-war ievei($189 million) and less than half the 1962 level ($267 million).
45. The increase last year was mainly due to increases in the exportsof pu'lses, animal feedsturff, rubber and jute. it was also due to higherexport prices for some of these commodities. Exports of some non-agriculturalcommodities (minerals and gems) also increased last year, but not significant-ly. Rice exports, which currently account for 42 percent of the total, fellfrom $60 million (750,000 tons) in 1971 to $50 million (670,000 tons) in 1972.At the beginning of 1972 the world market price for Burma's rice was aboutthe same as in IY97 ($80 per ton) and the government anticipated a substantialincrease in paddy procurement. The target for rice exports in 1972 wasset accordingly at 920,000 tons'and, in an effort to recover-markets lostin 1968 and 1969, the Ministry of Trade concluded contracts for 850,000tons during the tirst halt ot 1972. However, the domestic procurement ofrice was 500,000 tons less than anticipated, and even by drawing down heavilyon stocks the government could only ship 670,000 tons by the end of theyear. Even more unfortunately, Burma was unable to take advantage of thenear doubling of export prices since May 1972, and nearly 200,000 tons outof this year's crop has already been sold at the 1971 prices. Rice sodominates the Burmese economy that the subject is discussed in greaterdetail in Chapter VIII.
46. Exports of timber products, which account for nearly 25 percentof total exports registered a'five percent decline in dollar values in 1972.The major obstacles to increased production continue to be insurgency in someforest areas and chronic production problems due to the shortage of felling,logging, extraction and processing equipment. Mineral exports increased by16 percent last year, but mineral production stagnates at a fraction of itspre-war level for much the same reasons as in forestry.
47. Merchandise imports also declined over the past decade, althoughthe decline was less pronounced thad in exports. The value of imports was$160 million in 1972 (compared to $220 million in 1962) but this representeda 10 percent decline over the previous year. Consumer good imports (milkproducts, wheat and textiles) account for about 15 percent of the total;imports of raw material, spare parts and component account for 37 percent,and capital goods imports for the rest. The data available for 9 monthsof 1972 suggest that the major cut-back was in imports of textiles, and thatproducer good imports were slightly below the 1971 level.

- 16 -
Pattern and Terms of Trade
48. There was no particular change in the pattern of Burma's tradein 1972. Asia (mainly India and Japan) continues to be the major tradingpartner accounting for more than 50 percent of imports and exports. WesternEurope accounts for around 30 percent. Over 70 percent of rice exports areto Asian countries - Sri Lanka. India. Philippines. SinRapore. Indonesia andBangladesh. The remaining 30 percent go to Western Europe, Eastern Europeand Africa in almost equal amounts. About 56 percent of the timber exportsare to Western Europe, 20 pecent to Japan and the remainder to Asia.
49. About 40 percent of Burma's imports from Asia come from Japan andthey consist lnrgely nf nnital gnond imnortq. Western Etironpe' sharp oftotal imports has remained the same over the last three years (around 30percent), although the crmposntion has chnngpd as the share of capital equip-ment has fallen and the share of raw materials has increase-d proportionately.There -as, however , ! a noticeable increoncan i m portf from. Rasteorn Europe
This probably reflects the fact that seven out of Burma's eleven generaltrade a-reemennts are w ith E? - etfe Euorean coun trie4 Sm qn f urther shif4tfs
in the pattern of trade may result from the recent currency realignments.It could be expected that exports to Japan and Western Europe nrd imports
from the US will increase, but for the most part, trade with other Asiancountr4 es is not ex-ected to chaon.e significantly.
50. ~Thk.e deterioration ir. Burr.,.a's t-sof tr_ade_ has been particularly1
severe since 1968 (Table 4). Taking the decade (1961-971) as a whole, thedecl.ine i4n the t*ermns of trade WaS 20n percent, largely duet to a 28 percentincrease in import prices, while export prices in 1971 were at about thesame level as i. 1961. T.-wevet a closer look at the data .reals r6 ha
export prices did fluctuate between those dates - they increased by about 44percent between 1961 and 1068 then A ropped sharply by 3percent between 19aand 1971. On the other hand, import prices rose steadily between 1961 and 1968and Lhave siLnce bUeen stable . T . contrast, Ath d A.erioration in thle O tus of
trade since 1968 has been 36 percent, almost solely due to the 47 percenta I tX 1-Q -C t v 4 K MU A14_ 4- -
Uiop LL Lllt. export pi UCe uL rIC 2 ,,uu. iLLA. reOsu.LgLL6 Uc.. L anLexpL
earnings imposes a severe limitation on the country's import capacity andhence its economic developmenLt. LLLis absoluteL limitatiLtLo n is comLpounded by
the deterioration in the terms of trade and the consequent decline in thepurchasing power of exports. Over the decade, the purchasiLng power of Burnma'sexports have declined by 55 percent, and it is currently less than 20 percentof its pre-war value.

- 17 -
Table 4: UNIT VALUE, QUANTUM INDICES AND TERMS OF TRADE1964 = 100
Pre-WarYear Ending September 30 1939-41 1961 1967 1968 1969 1970 1971
Export
Value Index 49 89 59 46 49 47 51Unit value 22 89 116 128 123 91 90
Quantum /a 222 100 51 36 39 52 56
Import
Value Index 28 99 75 70 69 72 77
unit -value 20 94 121 119 116 120 120
Quantum /a 142 106 62 58 60 60 64
Terms of Tradef 110 95 96 107 106 76 75
ICPurchasing Power of Exports 244 94 49 38 42 39 42
/a Quantum Indices: Ratio of value index to unit value index.
/b Terms of Trade: Ratio of export to import unit value index.
/c Purchasing Power of Exports: Value index of exports deflated by import
unit value index.
Source: Statistical Yearbook 1971, CSED and Mission Estimates.
Balance of Payments
51. In 1972, the balance of payments showed an overall surplus of
nearly $8 million, compared to a deficit of ;.I million . T o-ly this did not result from any improvement in the external sector (Table 5).
As indicated, the slight improvement in the trade balance (reduction of the
deficit) resulted from a 10 percent decline in the dollar value of merchandise
imports and a four percent increase in the value of exports.

4n10
Table 5: BALANCE OF PAYMENTS(US$ million)
Year Ending September 30 1968 1969 1970 1971 1972
Merchandise Trade Balance -50.4 -61.7 -62.6 -57.7 -36.2
Exports 114.5 113.9 120.4 120.2 124.7
Imports 164.9 175.6 183.0 177.7 160.9
Net Non-Factor Services -11.1 -17.9 -19.5 -20.4 -18.9
Net Transfers 13.0 18.7 22.1 23.5 18.5
Net Factor Services +1.9 +2.3 +0.4 -2.1 -8.8
Net Current Account -46.4 -59.2 -62.0 -61.3 -52.9
Net Capital Flows +68.3 +23.9 +17.0 +28.8 +60.7
Loan Disbursements (net) 21.8 5.5 3.2 23.3 27.9Other capital (net) 10.3 4.2 22.7 5.0 29.2Short-term Bank Credit (net) 36.1 14.3 -8.8 0.4 3.7
Currenpt5 &CapitalAccounts 21.8 -35.3 -45.0 -32.6 +7.9
MonetarY Movements 21.8 -35.3 -45.0 -32.6 +7.9
Source: Appen,dix ITable 3.1
52. l~~I.edefici;- or. the services accour.n ascnsdral larger last* Izi~e U L L L ILk LU
year than in 1971. This was due to the near five-fold increase in interestpayments on fLoreLgn debt, resulting from the heavy reliance on sh.ort-te
inter-bank borrowing and suppliers' credits in recent years. The currentaccount deficit of $53 million would have been .ch larger but for the
fact that inflows of official grants remain at around $20 million. Thedeficit was financed by a 30 percent increase in net disbursemnents on foreign
loans and an even more substantial increase in miscellaneous capital inflows.The latter amounted to about $30 million and consisted of the repa-ymllent bySri Lanka of rice export credits extended in 1971, gains from revaluation
of foreign exchange reserves and from the sale of gold.
Reserves
53. These large capital inflows helped to forestall further rapiddecline in the gross reserve position. At the end of 1972, gross reserveshad declined by two million to $62 million, compared to losses of $52 millionand $37 million in 1970 and 1971, and were equivalent to about 4 months ofimports. However, net reserves were zero at the end of 1972 or minus $30million if liabilities to the IMF are included.

- 19 -
Tne Exchange Rate
54. Tne Kyat was devalued in December 1971 for the first time sincethe parity was fixed at K 4.76 to US$1.00 in 1949. The new rate (K 5.35 =US$1.00) was estimated by the IMF to represent a 10 percent depreciationagainst the countries importing rice and 20 percent against other tradingpartners. However, it took some time before domestic prices were revisedto reflect the new exchange rate. In February 1972, the prices of newimports were increased to reflect the increase in costs, but imports pur-chased prior to that date were sold at the pre-devaluation prices. Withregard to exportables, the change took much longer. Immediately after thedevaluation, high level Prices and Wages committees were established to makerecommendations for necessary price and wage adjustments. The availabledocumentation indicates that the Committees did very thorough jobs and therecent prices and wage revisions were based on their recommendations.
55. Following the February 1973 devaluaticn of the dollar and therealignment of other currencies, the parity rate of the Kyat was againrevised. The authorities decided to maintain parity with the SDR and thenew rate was fixed at K 4.81 to the dollar. This meant an effective re-valuation against the dollar, the pound sterling and the currencies of mostAsian developing countries. It is important to point out, however, that adevaluation against the dollar would have had as little impact on the balanceof payments as the new rate is likely to have. There are two reasons forthis. First, the major problem with Burma's exports is a supply problem whichwould not be corrected by minor price adjustments. Greater flexibility inprices would be beneficial, but what is really called for is a substantialincrease in investment in the productive sectors. Second, it has taken theGovernment about a year to assess and decide upon necessary revisions indomestic price following the 1971 devaluation. The authorities can thereforejustifiably be expected to wait and see what effects the recent prices and wagerevisions are likely to have on production. In short, the exchange rate isnot being used as a major instrument of economic policy in the presentcircumstances.
External Debt
56. Burma contracted several new loans during the past year, includingtwo large loans from Japan (a $10 million untied loan for off-shore oilexploration and a S15 million commodity loan) and a S25 million commodityloan from the People's Republic of China. Also during last year, the 1961loan with China,, suspended in 1967. was reactivated. The undisbursedbalance of this loan is currently around $53 million, and the loan is tobe fully dilhursed by 1975e Two loans aminntline to about $8 million wereconcluded with the Federal Republic of Germany to finance a tin project(Helnda), the purchase of canital equipment and the nrovision of technicalassistance for the industrial sector.
57. As of September 30, 1972, the total external debt was $308 mil-lion, including an undisbursed balance of $144 million. Of the total loar.s

- 20
committed, about 75 percent is extended by various governments, 22 percent
by private suppliers' credits and 3 percent by the IBRD. As Table 6 shows,
45 percent of the official loans (equivalent to $104 million) was committed
by the People's Republic of China. The next largest donors are japan and
the Federal Republic of Germany, which have extended official loans of $50
million and $34 million respectively.
Table 6: EXTERNAL PUBLIC DEBT AS OF 9/30/72US$ million
ai:or Donor Official Lending Private Lending Total(%) (%i (%)j
China (People's Rep.) 104.2 (45.4) - (-) 104.2 (33.9)
Czechoslovakia 13.1 ( 5.7) - (-) 13.1 ( 4.2)
France 2.7 ( 0.9) 13.0 (19.2) 15.7 (5.1)
Germany (Feb. Rep.) 33.7 (14.7) 12.3 (18.1) 46.0 (15.0)
Japan 50.1 (21.8) 23.1 (34.0) 73.1 (23.8)
USSR 8.4 ( 3.6) - (-) 8.4 ( 2.7)
USA 7.6 ( 3.3) 5.4 ( 8.0) 13.0 ( 4.2)
Others 9.8 C 4.6) 14.0 (20.7) 23.8 ( 7.7)
Sub-total 229.5 (100.0) 67.8 (100.0) 297.4 (96.7)
IBRD 10.2 ( 3.3)
Total 229.5 ( 74.6) 67.8 ( 22.0) 307.6 (100.0)
Note: Details may not add to totals owing to rounding.
Sourre: Economic and Social Data Division, IBRD.
58. The weighted average terms and conditions of the debt incurred have
been favorable:
Official Loans Private Loans IBRD
Interest (%) 1.67 6.05 5.32
Grace period (years) 10.0 1.90 3.5
Repayment (years) 22.0 8.8 17.8
The grant element on all these loans taken together is about 53 percent, and
this does not include exter-al assistance in the form of grants which amounted
to about $200 million over the past decade.
59. Utilization of foreign loans amounted to $48 million in 1972
compared to $38 u-illioOr in 1971. 1ep,a-ent oblIgations also increasedj
amounting to $25 million last year or 53 percent of disbursements. The
undisbursed balance ol $144 million is expected to be fully disbursed bv
1977 and annual service charges on existing debt are expected to rise from
$25 million in 1972 to $31 million in 1975. Assuming an increase in export

- 21 -
earnings at 3 percent per annum, the debt service ratio is expected to rise from18 percent in 1972 to about 21 percent in 1975. In view of this already highdebt burden, the future borrowing which Burma greatly needs should be onlong-term concessionary terms.
B. SOCIAL WELFARE INDICATORS
Introduction
60. As noted in last year's economic report, the assessment of per-formance cannot be limited to the criterion of economic growth but must takeinto account all of the country's objectives. It was also noted that whileeconomic performance was poor, Burma's major success over the past decade hasbeen the provision of advanced social services for a population of about 30million with a per capita income of well below $100. Efforts were made toraise the standard of living by reducing inequalities in the distribution ofincome and keeping the prices of basic commodities stable. The uniform pricingpolicy for rice ensured the improvement in nutrition, particularly in the hillareas. Disparities exist but incomes are more or less equally distributed andin the field of health and education, Burma has achieved successes which surpassthose of much richer countries. These achievements are still there and thesegoals are still being pursued but, by now, the possibility of further socialprogress is being endangered by the lack of iob onnortunities for the growingpopulation and the stagnation, if not decline, in living standards. These twoproblems are the main focus of the discusnion in rhantprs VT and VTT=
VI. MANPOWER AND EMPLOYMENT
Population, Labor Force an. A...'oCL..
61. No new finfo 111o h,44 fy th,e - u o-4 f
the previous economic report on population. The major uncertainty continuest- be birt anda .o.. de t - - 4 +-I , a.at O C IaLa ,IJa LILS '.J aA ato b bith nd eat raes in. the --rr 1 areas, -Where more than 80n percentof the population are thought to be living. Official estimates of population4ncraA Cse fr V 7 *intLictC a; CL ontnutiLon. of LILO LC C .LLC tE CL-ULS i LU WJV cLr C- 1
growth rate, to 2.4 percent per annum. The (implicit) rate of naturalj.,,tincrase foJA 'A.r rura r CaIr e as o.f 2.' p* e r ce. L.-L L" CLr an inum.seemis very l0w, hLiowCever,
given the improvement in medical facilities, and the likelihood of a steepAecline 4n ir.far.t mortality rat-es. Tn the- urban are- -as -the 4_4fant ru_rtaI yCCt~A.LLL J.lL ILA CII. IJA I.G .L. U C.a LI = U LC .ILL LCIL& OL _CLC , ULIC .L.IiA CLII.L. LLLJ L. -LC.LJ. U)
rate seems to have declined from around 130 per thousand in the early 1960'sto about 60A per.tosrdby*h al 190s.Arsest r.ofhedLId UUU RJL k/ L LLLIU0CL1LU Li) LIIO _CZOL.Ly I 7 It. 0* LAIZ0WRCLO LI.) ZOVIML Ud.L ULICZ IUJVor
questions will, however, soon be available with the 1973 population census.Census takr,ers are CallUWi.ng for the pLII s bily 0f.a 3J ri-llion population
while the current estimate is about 29.5 million. Given the officialencouragement to rapid growth of population in Burma, there seems n-o reasonwhy a growth rate closer to 3 percent per annum should not quickly become

- 22 -
established - if indeed population growth is not already much closer to sucha figure than is now thought to be the case.
62. In terms of labor force, the role of demographic factors isalready defined for the next 10 to 15 years. The teenage entrants to thelabor market of the 1980's are the infants and young children of the early1970's. Official estimates are, as indicated above, based on very defectiveand incomplete data; nevertheless, the trends they portray are likely toerr in the direction of under, rather than of over-statement. Estimatesshown in Table 7 indicate the probability of a sharp acceleration in thegrowth rate of the population of working age, the average annual increasesin absolute terms, moving from roughly 260 thousand in the 1960's to 400thousand in the 1970's.
Table 7: POPULATION OF WORKING AGE (15-59)(000's)
Projected1961 1971 1981
Number 12,514 15,094 19,075Absolute Increase +2,580 +3,981Annual Rate of Increase (M) 1.9 2.4
Source: Report to the People, 1971/72, and Mission Estimates.
63. Moving from 'population of working age' to 'labor force', involvessubtracting groups like students, or, more dubiously, full-time housekeepers(male and female), that are neither gainfully employed nor seeking Rainfulemployment. But in the circumstances of countries like Burma, especially inrural areas. irregular and snoradic work on the nart of all family membersmay be normal rather than exceptional, so that labor force concepts are oflimited validitv. At nreRent. however, there is little scope for definitionalcontroversy as data, with one important exception, are virtually lacking.Thp oorintinn Jq thp 1972 TTrhan Social Survev. conducted by the Universitv
at Rangoon, results of which are just beginning to appear. Preliminary datafor the 10 largest tns indiratp a nartirination rate among 16-60 year oldsclose to 60 percent, all but a tiny minority of the remainder being accountedfor as students or full-time h,,uPewivP._ The resuilts are strikingly elInee
to those found in a similar enquiry in the municipalities of neighboringThailand (Appen"dix Table 1.5). Notewnrth, in hnt-h tnn,ntrieQ iq the veryhigh level of female participation - at over 40 percent, more than doublet hat found,-, forurar Ir.dia or- Sri4 T-anl for xaw-mnIpe
64. In many courntries, a factor tending to reduce t-he agrmta.i of lnbor
force, at least in the short run, is the growth of enrollments in secondaryandt higher education. For Bu-.ma, the survey data show education 4n the10 largest towns to account for a sizeable group of whom most would other-
wis ib a Lauilae for worlK. ror tbhe wh-,olle country, hOe-ver; h dt ndct

- 23 -
that higher level educational enrollment has only a limited impact. Forexample, between 1961 and 1971, increased enrollments among groups aged15 and over, reduArd labor force growth at most by 5 nercent. For the 1970'srates of expansion in enrollments can be expected to be quite modest, partlyfor budgetarv reasons, nartlv alno for labor market reasons. to be explainedshortly.
65. The 10 largest towns included in the survey account for about 3.,.4ll4 .. peopa.le ,.,roughl~y hlnf nf the tntal unrban nopulation if all the verv
small towns are included, but less than 10 percent of total population.,.kere are no recer. surveys for rural BuR-ma hbt exper4ence in Thai iandtsuggests a close correspondence between population of working age and laborforce: 4.n t.. e .st recent survey of rural Th.aiand in 16Q,Q RR nprrepnt of
15-60 age group were classed as members of the labor force. Applying thisestimate to rural Burmna, gives a hoA1le -n.. 4 partici4patin -t nf roughly85 percent and a labor force in 1971 of 12.8 niillion, compared to theoff'cial est4imate of 10.9 0411.ion. (App4e.. Table 1.2).
6 to Data relatig to the structure --- e .n 4i B 4a ether
back to the 1953 Census or are confined to the public sector. OfficialestLImtes, baseu 'Largl6y UrI LLthes source, su6gsL LLaLL 6U - o
work force is still occupied in Agriculture and related activities, followedby Services at 10 percent, aiUd Commerce at 9 percent of LtLe total. Accordir
to these estimates, about 10 percent of the labor force is employed in thepublic sector. Table 8 summarizes the salient features.
Table 8: w-MPOSITINOF 1971/72 WOUrKING POPULATION
Share Share ofof Sector Public Sectorin Total in Total
Agriculture, Forestry, 68.4 2.0Fishing
Mining, Manufacturing 7.3 16.2Power, Construction,
Transport, Communications 5.3 45 .4Trade 9.0 11.0Services 1u.0 43.5
i10.0 10.3
Source: The Report to the People, 1972/73.
67. Linked to the absence of comprehensive data on employment in Burmais the very small size of the organized or formal sector. For example. theNational Social Security scheme included only 220 thousand active subscribersin Septe.mber 1Q71 nnA nilv ahnout- nnp-th4ir of the suistcribers are emnlovedin the private sector - considerably less than 1 percent of all private sector

- 24 -
workers. A rough overall estimate of the regular 'factory' work force inBurma of 400,000 works out to be somewhat less than 4 percent of total laborforce. The rate of increase, judged from social security data, has beenless than 2 percent per annum over the past 9 years.
68. Excluding agriculture, public sector employment grew by 7.5 per-cent per annum for the three years 1968/69-1971/72, in contrast to anestimated increase of less than one percent per annum for all other sectorscombined. Some breakdown by skill category is possible for the publicsector. In 1971/72, university graduates numbered almost 43,000 andaccounted for about 4 percent of the public sector work force. Over thepast two years, 3,200 graduates have been hired annually - far below theoutflow of 6,000 new graduates from the universities in 1969/70 and 1970/71.The flow of graduates (already increased from 4,000 in the mid-1960's)will grow considerably more in the early 1970's. In effect, therefore,despite the prospect of a considerable net demand for graduates on thepart of the public sector, currently estimated at about 7 percent per annum,a considerable worsening in supply-demand balance seems certain.
69. As has happened in many other countries in these circumstances,a considerable number of graduates will, of necessity, accept work of lowerstatus and which pays less well than typical graduate employment. On theother hand, though, if it is assumed that a high school graduate could dosuch lower grade work equally well, then the extra cost to government insupporting university level education is hard to iustify. Currently, theadditional cost of the basic Arts or Science first degree, relative tohigh school completion, is estimated at K 4,655 - a sum sufficient to nut17 primary school leavers through middle school, or 28 children throughprimary school.1/
70. For technicians, a shortfall of qualified anplicants seems likelyon the basis of current projections, with an anticipated annual averagedemand equal to 1.400 per annum, of which only 890 will be suppliedt How-ever, differences by type of skill are very marked, as indicated in Table 9.
Table 9: DEMAND AND SUPPLY FOR DIPLOMA LEVEL VOCATIONALTRAINEES 1971-75: ANNTTAT AVERAGE
Spnnly Demand Inbalance
Building and Highway Construction(engineering skills) 280 1,100 -820
Agriculture and Veterinary 280 10 +270Other (mainly engineering skills) 330 290 -40
Source: Report to the People, 1972/73.
1/ For a doctor's t:a4-4-g, the cost savir.g would e equivalent to 29middle school educations, or 48 primary school places.

- 25 -
71. No other manpower projections have yet been prepared. Skilled
manpower employed in the Social Services Administration -- which group
accounts for the bulk of middle level white collar workers -- has been
growing at 4.8 percent per annum. This rate, projected in 1975, would give
rise to an annual average demand of 11,500 people. But already, in 1969,
there were 30,000 successful graduates from secondary high schools, a
number likely to increase to 60,000 by the mid-1970's. In contrast, numbers
of graduates of secondary level technical and vocational schools, wnile
growing rapidly, are still barely in excess of 1,000 p6r annum. The demand
for skilled labor in the public sector, excluding the mainly administrative
groups listed above, grew by 9.5 percent per annum during the past two
years - in absolute terms, by 12,000 jobs per annum.
Unemployment
72. Growing imbalance between demand and supply of labor in the wage
paying Aector is indicated by various measures of unemployment. The most
reliable measure is probably that provided through the Urban Social Survey
for 1972, described earlier. Preliminary results from this Survey show an
unemployment rate of 8.5 percent in Rangoon and 6.5 percent for the 10 major
towns taken together. By Asian standards, these are moderately high rates of
unemployment, especially since the overall rate of unemployment generally
corresponds to a rate among young people two or three times as high - i.e.
between 13 and 20 percent in the case of Burma. Alternative estimates, and
some indication of trends, can be obtained using the statistics of regis-
tered unemployment at the labor exchanges. In total, 187.5 thousand people
were registered as unemployed at the end of 1972. Estimating the urban labor
force at about 2 million, these data suggest an unemployment rate of 9.4
percent - considerably above the survey estimate of 6.5 percent. Part of
the difference however is due to employed persons who keep registering as
unemploved in hope of obtaining a better paid or more regular job. Of the
187.5 thousand registered at the end of 1972, 10,127 were graduates, about
6 percent of the total.
73. Employment Exchange data indicate an increase in unemployment of
80 percent between 1965 and 1972, about two-thirds of this increase occurringduring the last two years. While unskilled workers continue to account for
the bulk of registered unemployment, the share of clerical and skilled
(rofessional and trained) workers increased from 10.2 to 24.7 percent over
the 7 year period. Graduate registrations (available from 1970 only) have
shnwn a rise from 4,400 in 1970 to 10,100 in 1972. Unfortunately, the data
are not tabulated for other levels of education.
74. Summary and Conclusions. Like all the poorer countries of Asia,
the very lw return to work effort in Burma reflects a chronic and pervasive
employment problem, associated with the continuing acute scarcity of man-made
factors of production and the abulndance of unskilled labor resources. In not
a few countries in similar situations, rapid and continuous growth of labor
suppl. in the r5st-war period (assoriated mainlv with nopulation growth)has brought about stagnation or even deterioration in levels of living
- 26 -
among the working poor and widening disparities in income. In Burma,deliberate and determined efforts have been made to avoid this pattern.Unfortunately though, since Burma did not experience very much economicgrowth, absolute levels of living scarcely increased even for poor people,and on balance, may have declined. Thus, while avoiding the worst side-effects of failure, Burma can scarcely claim as yet to have begun to tacklethe general employment problem effectively.
75. In addition, however, there is the beginnings of a different,and in some respects more urgent, type of employment problem, indicated byhigh and increasing levels of open unemployment among young people in theurban centers. The great expansion of the formal education system duringthe 1960's, and accompanying programs of nationalization that took placemarked, in effect, the conversion of the skill-intensive wage paid sectorof the labor market to a public service sector. However, failure to provideenough jobs, or jobs that match expectations, can have serious consequences,especially when there is no one else to blame for any shortfall but governmentand no solution except through government actions.
76. It is, in truth, much easier to point the dangers in a situationof an increasingly well educated exodus from the schools and colleges,faced with a stagnant or near stagnant labor market, and little immediateprospect for a more rapid rate of absorption, than to point out wherein liesthe solution to the problem. On the one side, there is a temptation to expandeducation further, because it is one method of opening up avenues throughwhich the poor and deserving can get access to a richer and fuller life, andlife-style. On the other hand, with so tiny a base of paid employment inindustry, government and other services to which formal education is relevant,the rate of expansio'n in the supply of jobs must be extremely modest. It willbe even more modest so long as the rate of development overall remains aslow as is currently the case.
77. The authorities are sensitive to the dangers of the currentsituation and education reforms to reduce the 'academic bias' and to favorvocational and pre-vocational instruction are being pursued. The govern-ment's objectives in regard to education are laudable and popular pressuresto provide more places in secondary schools will be hard to resist, never-theless, the preliminary judgement must be that the economic justificationof further expansion in investment in general higher, secondary and universityeducation, is not high at the present stage of development.
VII. PRICES AND WAGES
78. Policy. Prices in Burma are fixed by the government for allcommodities except those which have been officially designated decontrolledcommodities. These include edible oil crops, some pulses, fresh fruit,vegetables, meat and poultry. A brief review of the government's role inmarketing and pricing would probably be helpful in understanding the mechanismsof price determination and the functioning of the price system. Immediately

- 27 -
after the war, the government gradually began to take over the marketingand distribution of important commodities and to fix their prices. Thus theprocurement price of paddy was fixed at K 3.0 per basket. which was threetimes the pre-war level. The prices of certain essential imports and rawmaterials for the state manufacturing sector were also fixed. After thenationalization of trade and most of the productive sectors in the earlysixties; the government's role in Drice determination expanded considerably.Profit margins of 10-5-10 percent were to be added to ex-factory (or farmgate? rirne f-n determine producer; wholesale and retail prices of wagegoods. Higher markups were allowed on goods classified as conventional orlonit1ru-v a markup of at least 30 pereent wae included in the retail nrice ofimported goods.
79. Furthermore, the retail prices of commodities sold in the governmentchnna wav ?nnAag imi fnrm tnrntlrhniut- t-hp conuntrv Thi irni form qvrtpm wan
begun in 1964 and is only now in the process of being replaced following adirective to cooperatives to set pri-c toucv costs and allow a sma1profit margin (5-7 percent). In 1965, there was a further change in marketing.The producer. orga.iz-ations were re-uired to hand over goods to the TradeMinistry at cost and only the Trade organizations were allowed profit margins.
e.ae apo t .w.ea to bA tr ansferr-rA -ha 5nntmaf.- a*eF 4,, Fha fnr- n-F 4 ncome
taxes.
80. The weaknesses of this pricing and marketing policy are manifold.Firstly, the_ producer .JLaU..lJaton.s were to haUn over A -o -a- io,ut
costs are inadequately defined. Among other things, no charges were madeor, capiLta, ar,dILA UpLeiat rA. te1 L WeLr extreeLy loJW. Secondly, tLh TrAd
Ministry found it difficult to handle wholesale and retail distributionefL.L.cien.tly. Ir1UdUe, A.t WLULU LdUV= hv 4U.LLU a sophiJsLiLcL.U Lint--LWork Lf.L
computers connected in a central system, together with adequate transport,storage facilities iiU quai.iLLeLu mUapUWeL LU uake Lele taLt UdL.LrUUL.LUti
system work. Lacking these facilities and staff, the Trade organizationspiled up stocks equivalent to 40 percent of sales while the stores wereempty and operating costs rose continually. Thirdly, in addition to insti-tL.LIAnal and physical. corstraintsU, the TLaeU orgar.izations were not aLloweU
to pass on the increases in producer costs to the consumers. Instead costncreases were aborbbed bULy rteducing the establdibhed profit margins. in. view
of these factors; the distortions in prices, scarcities and the decliningsurplus of the Trade Ministry are not difficuit to understand.
81. Analysis of Trend8s. No national price indices are available, butthe indices which are available for Rangoon do represent at least a floorfor price trends in otner urDan areas. A ranKing 0o the maJ or towns on acost-of-living basis would probably be as follows:
Mergui (Tenasserim)TPaun g-i (Shr,Stte
Mandalay (Central/Upper Burma)Dasse'Ln (Jjelta, 'b.AoW-er Burm.a)Akyab (Arakan)RangoonMoulmein (Lower Burma)
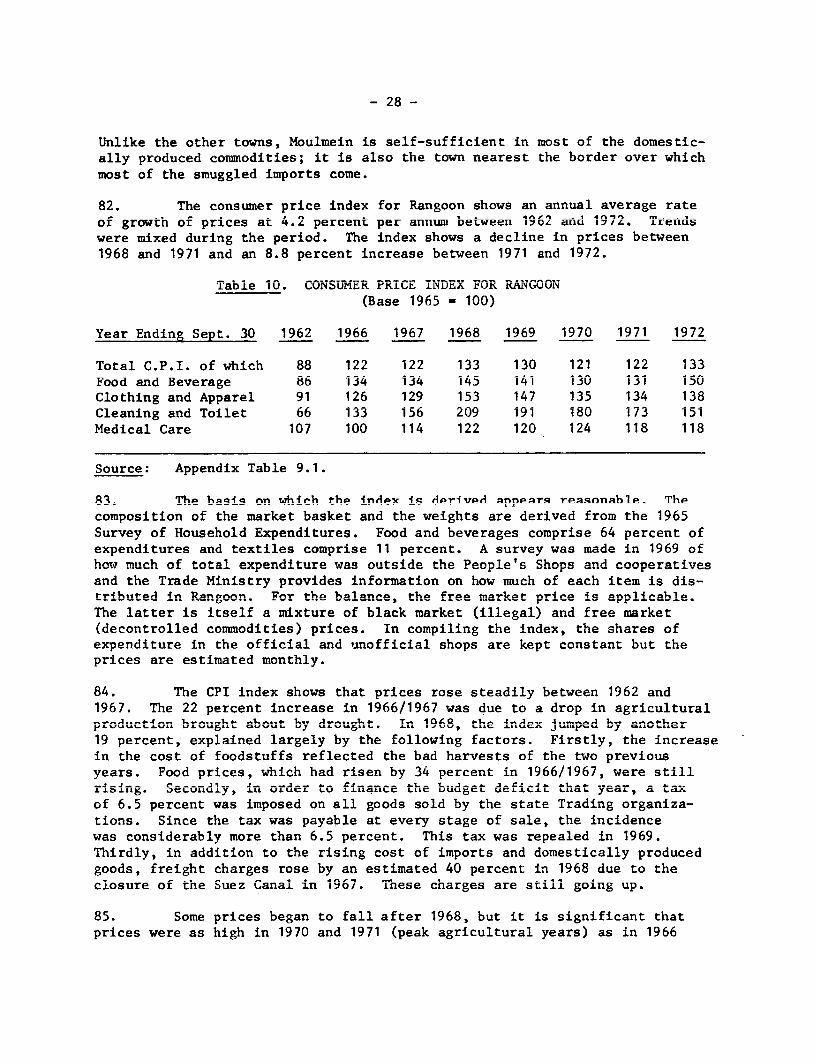
- 28 -
Unlike the other towns, Moulmein is self-sufficient in most of the domestic-ally produced commodities; it is also the tuwai nearest tLe border over whichmost of the smuggled imports come.
82. The consumer price index for Rangoon shows an annual average rateof growth of prices at 4.2 percent per annum between 1962 and 1972. Trendswere mixed during the period. The index shows a decline in prices between1968 and 1971 and an 8.8 percent increase between 1971 and 1972.
Table 10. CONSuME1R PRICE INDEX FOR RANGOON
(Base 1965 = 100)
Year Ending Sept. 30 1962 1966 1967 1968 1969 1970 1971 1972
Total C.P.I. of which 88 122 122 133 130 121 122 133Food and Beverage 86 134 134 145 141 130 131 150Clothing and Apparel 91 126 129 153 147 135 134 138Cleaning and Toilet 66 133 156 209 191 180 173 151Medical Care 107 100 114 122 120 124 118 118
Snurce: Annendix Table 9.1.
83 mThe asqiq nn whirh the index is derived appears reasonable. The
composition of the market basket and the weights are derived from the 1965Rivav of Hnuieahhnld A l%PnAit,irPc Fooud AnA hvernaoac PnmTnriQP ALL nerr'Pnt nf
expenditures and textiles comprise 11 percent. A survey was made in 1969 ofhorw much nf f-totl a.vn.ndittvre was otsa4fa the People's Shonp nA cnnperati4va
and the Trade Ministry provides information on how much of each item is dis-tributed in Rangoon. For the balance, the free market price is applicable.The latter is itself a mixture of black market (illegal) and free market(decontrolled bod4t4es) prices. In compili-.g414 h the 4iAex, the sh-res of
expenditure in the official and unofficial shops are kept constant but therprices are estimated monrthly.
84 * m he rCP index shows that prices rose steadily b-et-ween 10962tl. an.1967. The 22 percent increase in 1966/1967 was due to a drop in agriculturalproduction brought about by drougt. ITn 1968, the index Jumped b-y another~~ UL~
5flUL U~Y * . & - , us- &
19 percent, explained largely by the following factors. Firstly, the increaseiLn thle cost oil foodstuffs reflected thle bL-ad harvests of the nWo previousyears. Food prices, which had risen by 34 percent in 1966/1967, were stillrLsising. SLeconuLy, iLr order Lt LoL1aLL..; L1ktV LfUUanL UtLb.Lg.LL deLfci tht y , a 6ta
of 6.5 percent was imposed on all goods sold by the state Trading organiza-tiLons. Since the tax was payable at eveLy stage of sale, the in,cidencewas considerably more than 6.5 percent. This tax was repealed in 1969.Tnirdly, in addition to the rising cost of imports and domestically producedgoods, freight charges rose by an estimated 40 percent in 1968 due to theclosure of the Suez Canal in 19o6. Tnese charges are still going up.
85. Some prices began to fall after 1968, but it is signiricant tnatprices were as high in 1970 and 1971 (peak agricultural years) as in 1966

- 29 -
and 1967 (drought years). The explanation given is (a) that meat and fishprices, which went up in 1966/67, have not come down since, and (b) thatimport prices and the cost of domestic production are still rising.
86. In 1972! the CPI index again increased by nearly 9 percent overthe previous year. Behind this increase are a number of problems which addto the pressure on prices. There is a general pattern for prices to increasefrom April (the beginning of the cultivation season) through to July/August(the end of the monsoon period and early harvest) when they begin to fall.But over the last two years the monthly index shows that prices have risensteadily from March 1971 (120) to December 1972 (150). Only part of thiscontinued inflation was due to rising costs. Additional factors were thetremendous exnane1nn of lintiditv In the hands of the nublic and distribu-tional difficulties. In recent years, the government has increased itsrelianc-P on hank financing to lncle the buidget deficit and a 16 nercent in-crease in the money supply last year added to the pressure on prices.
87. Distribution problems also explain some of the rise in prices.Last year, for example, the substantial incrasea in the pri4e of edible oilswas due to the inability of the cooperatives to handle the distribution ofthese commodities. Trade in edible oils was decontrolled in 1967, but inJuly/August 1972 the cooperatives took over the distribution of groundnutanrd sesa.m.um. The production of these crops was down by about 10 percentlast year and there was some speculative hoarding, but the main reason oft,he price increases throughout the country was the inadequacy of distribution.The cooperatives were selling oil at K 7-8 per viss (3.6 lbs) but supplies4in the shops were insufficier.t; at the sa.-m.e time tChe free market prlceswere as much as K 20-22 per viss.
88. The free market price of rice also rose suostantially towards theendu of 'last year, ir. part buecause thle governr-uent was dUrawing d"own stocksheavily in order to meet export sales, so much so that stocks were down tozero at the end of Detc=embLer 1 972 IT Iq. ii,e UU-LLUb.LUL±UI Uof baU WeahLIeL, the
depletion of stocks and the handing over of the responsibility for riceULL LU L.LO L Ltohe cooperat,ives resulAtedAU in large pr-ice -A ThLL
government was forced to relax controls on rice trade outside of the townshipsand suspen,d ship.-.ents olf exports. Tbhe situatilon 'Ls somie-what calm,er now b-utthere is still no sign of prices coming down. The December 1972 index was_j5 up fLro..I.JJ 13 n "Septer'LIUer andLU thlere 'Ls every ±ndication that fLurthLer
increases may be expected.
89. Table 11 contains recent prices for some controlled commodities,that ri, goods which are to be sold only irn goverlc-uL-er.t shLops. compariLsonof the prices for these goods in the official shops and on the free marketshows the effect of inadequate distribution on prices.

- 30 -
Table 11: PRICE FORMATION OF SELECTED COMMODITIES IN RANGOON(Relative to ex-factory price)
Official Free MarketEx-Fartorv Total Selling Profit /a Selling Profit /b
Commodity Price Cost Price Margin Price Margin
1971/72Wheat Flour 100 135 190 41 532 180
Gram split /c 100 - - - 155 24inn - - - 237 8
Toilet Soap 100 151 200 40 371 86TY-%.inn 100 133 165 25 178 7Codanin (100) 100 115 228 100 324 50B.P. Ba'n- (1 oz) 100 116 120 25 161 15Cement 100 140 176 27 588 233Gent Longyi 100 156 211 156 333 114
1970/71Sugar 100 125 129 3 412 219
1 Inn lot t. I)o~~~~~~~~iu IAv I , A
Shirting 100 125 137 15 234 65Urea 1v0 114 1
1969/70Cigarettes 100 548 724 28 796 10
/a On Total Cost of Goods.
/b On Official Selling Price.
_c Decontrolled Commodities.
Source: Central btatistics and Economics DeparLment.
90. Tne range of official profit margins idLIcaLt tlat iL practice pLrc
determination is not quite as simple as it is purported to be in principle.The data also indicate that bfficial protit margins are not exceptionailylow (except on essential cofnmodities) though costs may be underestimated.More important, however, is the range of prices and profit margins forofficial commodities resoid on the free market. The functioning of thestate distribution system is such that a substantial flow ot goods goes tothe free market. Consumers either sell their rations or the goods arestolen from the state g6downs. The large discrepancies between official andunofficial prices reflect scarcities to a certain extent, but the scarcityfactor is greatly compounded by the inefficiency of the marketing system,and in the final analysis no one benefits but the black-marketeers.
91. To sum up, the major factors influencing the rate of growth ofprices are (a) the slow growth and rising costs of prioduction; (b) theincrease in the cost of imports; (c) the increase in the money supply; and

31 -
(d) the deficiencies in the marketing system. Price stability has been an
important objective nf the 2overnment and for most of the past decade, a
reasonable degree of price stability was achieved. In recent years, how-
ever, the government has been unable to devise measures to contain the rate
of growth of prices and has, to some extent, been responsible for the pressure
or. prices.
Wages ar.d Ern.ing!
92. Available data indicate that earnings were virtually static through-
out much of the 1960's and early 1970's, at least up to the 1972 revision of
th.e wage structure. Thus statistics of earnings for workers covered bysocial security (Appendix Table 9.4) show the proportion earning less than
R 120 per m.onth to have ainaed about constant between 1963 and 1969. These
data also show the low level of incomes among urban industrial wage earners -
less than 10 percent of them earn more than $8 per week,
93. The M-nistry of Labor quarterly survey of earnings and hours worked
provides information on regular employees - managers, clerical and skilled
workers - and temporary emsployees, sually skilled and semi-sk-illed workers.
With regard to temporary workers, the data indicate that between 1965 and
1970 some increases in wages occurred in some industries (Appendix Table
9.5); for rice milling, the increase has been considerable (from a relatively
low base) Dut for Cheroot and Cigar makirng, also comprising a large group
of low income earners, no improvement was recorded. The highest levels of
hourly earnings for temporary workers correspond to a monthly income of
K 120; the lowest to a monthly income half as large. The quarterly data
for the numbers of temporary workers indicate that seasonal variation inhiring is very considerable. In some cases, three to four hundred percent
differences in hiring over the course of a year have been experienced.
94. For the regular employees (Appendix Table 9.6), comparisons for
1965 and 1970, show again, with few exceptions, that most categories ofworkers experienced little increase in monthly earnings over the five-year
period. And as might be expected, fairly distinct patterns in earnings
levels emerge from a comparison by average size of establishments; with
allowance for special groups like banks, the larger the establishment, thebigger the salary for managers and clerical staff (Appendix Table 8.7).
95. The third major source of earnings data is the pay scales for
public sector employees (Appendix Table 1.3). Following the wage reforms
of October 1972, the old salary scales, 740 in all, were consolidated into
21 schedules, with 66 specified occupational groups. The major change was
to increase the low level salary scale and daily paid workers m'inirma from
1/ The data available relate essentially to the urban wage earning
organized sector. The main data sources are: social security statis-
tics, the survey of earnings and hours worked, and the Wage Commission
Report.

- 32 -
K 82 per month to K 100 per mnth in the case of salaried workers anrd, fordaily workers, from K 3.15 to K 3.85 per day. Those earning K 82 per month(or vR 3.15 per, day) on he oldI scale accounted -for about- 30 percent- ofL- -' r~t Ca, 1 J ItL - .~ Ot.aL ,SSSI S.-C *J U L. JSJjCLLLL U
salaried and daily paid workers - i.e., over 200,000 employees. At the otherend of the salary range, the new scales are such that K 1,500 per ,-.onthbecome the highest level attainable, in contrast to the previous maximum of
K 2,100. Since the r.ur.ber of postholders with salary levels abo-ve R ,500was less than 200, the quantitative effect of this change is negligible.
96. Between the highest and the lowest salaries, some general increase,UecILiLn'ing wi'th hLU giier levels of. salary, was built into the new scales. rneexact extent of the change is difficult to gauge however, because of theconpleexity of the old scales, because the salary step position of individualsunder the new arrangements depends on their position under the old scale,and because old scales at similar salary levels were not always correspondingto the same new scale. It was possible however, to calculate the averageincrease in salaries at each of the new scale levels. The results of thesecalculations are shown in Table 9.8. Surprisingly, they indicate relativelylarge rates of increase over middle as well as lower levels of income andlittle or no tendency for these rates to decline before scales with minimaor K u400 and above, affecting a small number of workers. in partthis is because a considerable number of lowest grade workers were alreadyat or near the maximum salary under the old scale and so had relativelylittle increase to obtain under the new. 1/
97. In part also it arises because of the principle adopted in therevision that no salary should actually be cut-back as a result of thechange. Hence higher level postholders will continue at their old salary,while a new postholder would only obtain the lower salary available underthe new scale. One effect of the "no salary reduction" ruling is to createan element of extra cost increase in the year of the change, (the totalcost of implementing the wage reform is estimated at K 190 million in1972/73) with some reduction in subsequent years as current postholders athigh levels are gradually replaced at lower salaries.. Again, however, inaggregate terms this effect is bound to be sma-ll as the numbers at thesehigh level scales are extremely small.
98. The effect of the wage revision is also somewhat less egalitarianthan has been emphasized in Burma, though a st.ronger egalitarian effectwill begin to emerge as new posthold-ers at upper levels of government servicetake over from the present holders. One potentially important disincentiveproblem is created by the changes, however. For workers now approaching toplevels of responsibility and authority, existing salaries may not be too
1/ For daily paid workers the problem does not arise and many workersreceived the full benefit of the change from a K 3.15 per day wage rateto one of K 3.85 per day. Again however, on average, the increase wasslightly lower because of intermediate wage rates (between the old 3.15and the new 3.85) that were moved to 3.85.

- 33 -
far below the fixed salaries under the new maxima for top posts; hence, formiddle levels of the service there wtill be little or no financial incentivesfor further advancement. Able and responsible senior public servants inBurma, as in other countries, are not greatly influenced in work attitudesby salary considerations alone; nevertheless, gaps between old and newpostholders may induce some discontent and a tendency for the more able toseek outside part time work in addition to their normal jobs, and often tothe detriment of the performance of their major work activity.
99. In conclusion, the available data for earnings changes in theorganized sector, suggest modest increases over the period of the late 1960'sand the early 1970's with some tendency for changes to have been greatestat lower and middle levels. No data are available for the level or trend inthe earnings of private sector employees but the awards in the public sector,averaging roughly 11 percent, are probably above the increases experiencedby private sector workers over the 1965-1972 period. These modest increaseshowever, almost certainly have not prevented a considerable net loss inreal terms. With 1965 as base year, the price index for consumers inRangoon stood at 123 in December 1971, and at 150 in December 1972 - theincrease over this one year period in effect therefore, more than eliminatingthe partial restoration of purchasing power implicit in the public sectorawards iust described.
Standard of Livine
100. The imnlications of the trends in prices and earnings on the stand-ard of living of the population can only be discussed qualitatively. It isgenerally recognized that the urban population (of about 6 million) faresbetter than the rural population, although as the foregoing discussionindicates. incomes in the urban areas have been virtually static over thepast decade. A survey carried out in 1959/60 showed that per capita incomesin the urban arean were rnuehlv double those in the rural areas. This wasthe same estimate given in last year's economic report, and was probablyconservative. It seems mnrp likely thatj with real inrnmmes Qenera11v declining;rural incomes have declined faster thereby widening the gap between ruraland urban incomes. But one cannot safely generalize. In Central and UpperBurma, there is more mixed farming and -crop diversification. Also the decon-trolling of mnnv commondities in 1966/67 undonbtedly had a beneficial imDacton incomes.
101. In Lower Burma, on the other hand, farmers have no alternativeto paddy growing in the wet seasan and 4ute ano secotn ronp has only beenencouraged in recent years. Besides rice, the only other commodities inrelative abundnr.ce in the delta area are fish ar.d fish products, thereforefarmers in Lower Burma are much worse off because of the need for cash(or pad)AA for a 1he purch-se of non-ric f-o -.A r.on-f-oA 4teomc s. Wi-
the general increase in prices, farmers in the delta area have found thatt-h e purchasing powe r of paddy 4whic ial uediuv. of excrI h4as
been falling. On balance therefore, the conclusion can be reached thatthIe gap bt ruraL . U Lin, L.es Uhas beLe U .LL1n , .hat farmerg i

- 34 -
Central and Upper Burma are relatively better off than those in the delta
area and that everyone fares better than the ethnic minorities in the Hill
areas.
C. SOME MAJOR CONSTRAINTS TO GROWTH
VIII. AGRICULTURE
Introduction
102. The previous Bank economic mi-ussion report drew attention to the
wealth of Burma's agricultural resources, the importance which this has for
Burma:s economic development, and the main features of performance by the
agricultural sector in recent years. This report complements the previous
one by examining the rice situation in somewhat more detail, and discusses
problems associated with that important crop in conjunction with some of the
constraints to agricultural development and the potential for other major
crops which are being produced in Burma.
103. Although the agriculture sector is a most critical element in any
future development of Burma, the contribution wnich it has been expecteu to
play appears almost passive. In seeking-to shift the economy to an industrial
base as a long run structural objective, government policy has tended to place
agriculture in a subsidiary role as a supplier of basic foodstuffs and some
raw materials and a residual employer of those not absorbed into the industrial
or service sectors. This pattern, by itself, is not exceptional; but the
failure to use agriculture more effectively in helping to bring about the
desired structural change is striking.
104. To illustrate the basis on which this assessment rests, consider
the following objectives which seem implicit in the recent record of the
sector and policies of the government:
(a) Burma is to meet domestic rice requirements as a matter
of highest priority, and the prices to non-farm consumersare to be kept as low as possible consistent with this
objective. Rice exports will be made from any surplusremaining after meeting domestic needs.
(b) Price stability is another primary objective which is to
be achieved by direct controls where feasible. Controls
have been dropped where experience has proven them to be
unworkable, and where shortages of essential consumer
items have aroused popular resentment.
(c) Two industrial raw materials, cotton and jute, have an
important priority. Both are essentially import sub-
stitutes, but in the case of jute there is some expecta-
tion that exportable surpluses will continue to be
availabLLe.

-35 -
(d) Pulses, be n,S a.nd a n4m.l feedstuffs are expecte toprovide export earnings in increasing amounts.
(e) Levels of investment going into agriculture can be keptdisproportior.ately 3-- in ---ais, -- t th co-ntr Xbu-two_n _'L. ~.11 ~ I J.AJW LU LJ'&LJ.~.L WA.LU.L LILLLZ _UIL LL.L LJUU .LIJ
which agriculture makes to GDP and to export earnings.
105. The argument is not whether industry or agriculture should becomethe ileadin4g sector in Bu..la's developr,ent, but whether 'ur-nna 's ri-isslingLL aU.LA ~L.LJ £1 IJIId u UVL p[eIL LILWLI LIILDLLIdLi lsig
opportunities to support its development efforts by failing to use itsagricultural resources to full Uadv -vlgt . IL seemts proDable, for example,that the emphasis on price stability has been inconsistent with hopes for______J __D..__._,I_ . I . . I LncreaeU agrLcultur-aL production; efforts to stimulaLe producLion or certaincrops, e.g., cotton may have been at the expense of more remunerative croppingopportunities available to farmers; the low investment priority for agri-culture has left the rice subsector with little technical capability forfurther expansion of production; pricing policies may have been inconsistentwith the stated objective to increase exports of pulses and beans. Thebalance of this cnapter will examine some of these themes in greater detail.
Tne Rice Sub-sector
106. Recent performance. Because the rice sub-sector is so predominant inBurmese agriculture - in terms of the area devoted to it, the physical produc-tion of paddy, the contribution it has made to export earnings (see Tables 7.4,7.6 and 3.4) - there is need to have some understanding of the factors whichhave shaped the recent experience. Despite a measure of improvement in certainrespects (e.g., restoration of cultivated acreage), it would be fair to saythat the overall performance of this crop has been a poor one.
107. Immediately following World War II, the important objective was torestore the area under paddy cultivation to levels achieved before the war.Extensive efforts at minor embankment and reclamation works (1958-1963) weresuccessful in this regard, and for the crop year 1964-65 the production ofpaddy was the highest ever recorded (8.4 million tons). In the interveningperiod since that time, the sown area has fluctuated between 12.2 and 12.4million acres, about the same as the pre-war level and slightly below the1965 level; with the exception of 1967 and 1968, paddy production hasfluctuated narrowly around 8 million tons, again slightly below the 1965level. The trend over the past ten years (1963-1972) for sown acreageshows essential stability; the trend for paddy production shows a slightincrease. Yields have therefore been increasing 1/ somewhat, but at a rateso slow that it cannot be regarded as significant. The meaning behind theseaggegate measures can best be understood through an examination of thepossible sources of productivity - e.g., new high-yielding varieties, the
1/ Burmese paddy yields now seem roughly comparable to those of India,Philippines and Pakistan, but below yields in Sri Lanka, Indonesia,Thailand and Viet Nam. For further yield data see Table 7.7.

- 36 -
use of modern inputs, the scope for irrigation facilities, changes incultivation practices.
108. Land and water resources. About 70 percent of the area under paddyis located in Lower Burma, where during the monsoon there is virtually nosubstitute crop for paddy. Some of this land (five to ten percent) is subiectto deep water flooding; another 50-55 percent consists of land which is lessf1nnodd but may exceed one foot. The remaining areas, 35-45 percent of thesown area is on land sufficiently high to enable water control at levels notexceeding one foot. 1/ The latter represents the present scope for introductionof high-yielding varieties, and as shown (Annex 1, Table 4) only about 10perrcnft of thi4 mnount (348.000 acres in 1972) is actually being utilizedin this way. The extensive use of transplanting, discussed below, confirmsthat t+p heibulk of agricultural land is subiect only to very shallow flooding.or no flooding at all. Although the rate of adoption of high-yielding varie-ties was rapid at the st-art; from 1969 to 1971; the pace has slowed consider-ably in the two years since 1971.
109. Upper Burma presents a quite different situation. Rainfall is less,and mrch of the paddy is grown in lowland vallvey npnr the rivepr where some
irrigation is possible. In the four largest paddy producing Divisions inUpper Burma, about half the sewn paddy area (1-4 million acres) is nnw
irrigated. This irrigation is primarily by river diversion and gravitydistri-butior- . Only in 4.-o or three places, how,ever, is water available forirrigation throughout the year. Because irrigation permits water control -vital for successful use of the short-ste m-ed ne varieties - the irrigatedarea is a prima facie measure of the scope for their introduction. Againref'err'ing Lto Ar.nex 1, T 4, A.L.e c.OJ see that somJth.in. le t.
percent of this opportunity is being used. Moreover, the use of high-yieldingVar et tLes 'L Upc L p Ler L LiBra O .s.nw onl--, ,a"'L V- at L waX Wi X 9 69 L. Ve fLirs
year in which there was significant acceptance.
110. The use of modern inputs. The introduction of high-yielding
varieties accomipanied b'y LncreasedU use ofL otLLer irputs is one zailzble Leans
by which to break the stable production pattern of recent years. Where they
can be USeU, LLIth hIIiLhyiCeU.LLng VarietiesLC a curLreULntly 1Lt4.LAL-LAfl5 -
than double the average achieved with traditional strains. The slight trendincrease in average pauuy yields LUL BL ULrr.a, cLtedCU earli , is pLbabU.Ly
due to the contribution from the high-yielding varieties which have beenused, offsetting declines in -yields xi-tong far-Lers stiLL using trLaLitioal
varieties. Unfortunately, however, the four high-yielding varietiesintroduced so ifar have riot bteen very successfuUl. lle first LhL iLgh-LylelU.1ln
variety (IR-8),,which was introduced in 1968, did not meet the tastepreferences of the Burmese nor ox' most foreign importers. AccUUUdgly,
1/ These estimates refer to Class I and Class II land, which have relativelylittle inundation and are suitable for transplanted paddy, as recordedin Technical Papers, Vol. I (Physical Resources), Union Land AgriculturePlanning Commission, 1956.

- 37 -
ehie area under tnis 'niv nas declined drastLcally. A. secoUIu VarLeLy .IR-J)j
which was later introduced, has not been acceptable to farmers in UpperBurma although it made some progress in Lower Burma. As IR-a gave a higheryield than other varieties in Mandaiay (see Annex 1, Table 5), taste pre-ferences, pricing and the marketing system may all have contributed to causethis decline but we do not really know. Of the remaining two high-yieldingvarieties, 'Ngweto' did not make much progress during the last four years.The variety C4-63 -- introduced only since 1972 -- did exhibit some progress,but not enough to have any substantial impact on production. On the whole,work on varietal problems seems to have been much more limited than inneighboring countries.
111. Because traditional paddy varieties are generally not responsiveto fertilizer, the contribution from this input is largely a function ofthe area under the more responsive high-vielding varieties. Thus, it isnot surprising to note that the sharp increase in area under these varietieswas accompanied by a spurt in the use of fertilizer, e.g., from about 16,000tons of urea in the pre-1968 period to a level of over 30,000 tons sincethen, and a four-fold increase in the use of super phosphate. But averagerates of application remain low, perhaps as little as ten percent of recom-mended rates, and the total amount is still negligible considering the totalcultivated area.
112. Cultural practices are one explanation for the probable decline inyields among farmers using traditional varieties -- a higher proportion ofpaddy is now being broadcast, rather than transplanted. Because broadcastplanting is faster and uses less labor, it is less costly, but the yieldsfrom transplanted paddy may be as much as 30 percent higher than broadcast.Data for the three most recent years indicate the average transplanted areahas remained constant at about 60 percent of the sown paddy area in LowerBurma (though with considerable variation), but this is a decline from afigure of about 75-85 percent which reportedly prevailed prewar. Two factorsseem the most plausible explanations for this - general economic pressuresare forcing some farmers to reduce costs of production, and/or insecurityin certain areas may dictate cost-minimization as the appropriate productionstrategy.
113. Looking back on the recent performance, three points seem worthemphasizing:
(a) the scope for further introduction of high-yieldingvarieties seems sizeable, on the basis of availableinformation on land and water suitability, but theefforts to introduce new varieties have been lessvigorous than the rice situation clearly requires.
(b) the complementary use of other inputs, primarilyfpr-ti1izer in this cane. haq shown some increase. butnot to the extent normally associated with optimumnrntoduc-tinn fr.m high-yviedlina variptfPs.

- 38 -
(c) cultural practices have not shown any tendency toimprove.
114. Prourem .en t f-t -Ai _ 4-r.C 4 nflU--- 4-n --- reentperformance stem from the marketing side of farm operations. It has beengOvernbe.Ont policy to set procurement targets by subtracting from -timed4-A
production the quantity of paddy needed for home consumption, includingcor.zu'k 1Fior by, fa.. labores. Farm.ers --- sell r4ce dirctl to-+ 1 -consumers
within their own townships, but aside from the (presumed) small amountsin.voll.vrd 4in thLu i s, S aall sae sare to be ,nda thrug official -rocurem.ent
centers at prices determined by the government. Until the current crop year( I97I 217, I the prLoL.ULCLUr&tLe LfLuLcLo.LLL Was LICdL'U.LU Uy TrLaU CoLrpoatoL.LnLA L
(TCI), but this has now been transferred to the Cooperatives. TCI stillp r ovides WL.oLesaLe supplies to 76 deficit to-wnLships, Ihowever. Clooperativesalso handle the bulk of retail sales. The export surplus consists of thosequantiLtiLes ofj riLce -WIlich reLaia.in ,Ln goverLLLmeLt hIaridUs 'n excess ofL wLat isestimated to be needed for domestic consumption. A uniform price is paidto fLarers for each kind of paddy, although discounts are said to be applieaif the paddy offered does not meet minimum standards with respect tomoisture content and presence of foreign matter. WVnereas the retaii priceof rice was once uniform throughout Burma, prices in the current year willreflect transport costs incurred L, mUV'g L.LCe LLUf sUrplu LU UdefLCJ.L areas.
Further details on the procurement and distribution system are provided inannex 1.
115. Government price policies. A Key reature or government rice policysince 1964 has been the effort to maintain a stable price for the consumerswno must buy tneir rice. Tne price paid to farmers for paddy was keptconstant at K 3 per basket 1/ from postwar to 1964, at which time it wasincreased to K 3.10 per basket. Furtner increases to K 3.30 and K 3.58occurred in 1967 and 1969, respectively, and the latest - this time toK 4.25 per basket (equivaient to $38.05/m ton) -- was announced in early 1973.Prices of non-controlled food items have increased substantially over thepast decade, however, and in many cases have more than doubled; prices ofnon-food items have also gone up markedly, and shortages of basic consumergoods are widespread.
116. The impact of this policy has been particularly severe on paddyfarmers in Lower Burma. As noted earlier, there is virtually no alternativethere to paddy production during the monsoon season - cash crops of wintergroundnut and pre-monsoon jute are grown, but the area involved is relativelysmall. Representative costs and returns from paddy production, as shown inAnnex Table 14, indicate that given prevailing procurement prices and theyields from traditional varieties until the latest price increase of 1973,the net return from paddy production was quite low. In the face of rapidly
1/ One basket of paddy is 46 lbs. The paddy prices to farmers citedabove ($38.05/m ton) corresponds to an f.o.b. price in Rangoon of$97.05/m ton (See Annex I, Table 8).

- 39 -
risin.g prices for4 , angAo farmers mint h,v thp advreas effprt nn real
income has been serious. These cost and revenue data also provide someindication twhy the area of broadcast paddy may have been rising, particularlywhere local labor costs have risen in recent years.
117. Better prices should encourage adoption of improved varieties, butalthughthescope for ir.troducing high-yielAing varietiee s exte.siveihJ. flfutghJ.
5I 0fL Ot. e exten -t%Afl
5La
6,-J~ L~L& kAC LOA~
is by no means unlimited. There is therefore additional need for investmentin "eDrsw.ch er.ab'le effective water con"'--" as 1 wel a8thdveopen
of new varieties, and this will take time. The most recent increase in the…5J ~ __.. _.._1 _ _A......_1* 0
puLi LJUuI~L J L. &iUCL &L.JU OW.JUM & Lt.LAL L #.t L
the returns to labor will apparently be greater than has been the case forsou-me time, Uut secur.Lty cozLiderations also enter L'arIiUers Udecisions. AoLthULLLrL
unknown is the extent to which marginal areas in the delta may be put underpauddy cultivation. For a.Ll these reasons tLte imlpaUct of Le pJLLi.e cLLLLr. oL
next year's production is hard to predict.
118. Domestic consumption and exportable surpluses. The rapid, andpersistent, drop in rice exports over tne past decade nas bceen a srir'kingfeature of the Burmese economy. Because export data are generally quitereliable, tne sharp decline in rice exports could be interpreted as anoverstatement of the production figures. Another possibility would bethat per capita consumption has gone up suDstantially, and thna witn relative-ly unattractive prices offered for their paddy, farmers simply have beenkeeping more for their own consumption. Per capita consumption apparentlyhas been rising at about one percent per year, from 1963/64 as shown in Annex1, Table 12, from a level of about 320 lbs per person per year. Estimtesfor pre-war consumption of rice on a per capita level are difficult to make ona comparable basis.
119. From the scattered bits of evidence, however, it appears that therice supplies retained in Burma, after allowing for seed, waste and changesin stocks, have indeed provided for gradually increasing rice consumption,but that per capita consumption probably remains at best about prewar levels.Moreover, if the production figures were overstated, the actual per capitaconsumption figures would be lower than they now appear to be, and thereforeprobably below prewar levels. 1/ This explanation does not seem plausible inthe face of price behavior on the free market (see Annex 1). The conclusionthus seems to be that overstatement of paddy production has been negligible,if at all. A stable production, rising population, and very slightly risingper capita consumption have been the major factors accounting for the drop inrice exports.
120. A strategy for increased production. If the foregoing analysisis accurate, what can be done to bring about significant improvements?The recent price increase is probably a positive factor -- it may induce
1/ This could also be the case if population is underestimated assuggested el s aher 4i 1,4this reprt.C L
500~IA~4 h CW&e ti Sf this 4.p o_

- 40 -
some farms in the delta to increase transDlantine or move into marginal areas.But additional fundamental changes will have to take place. The more impor-tant of these inrclude (i) the adaptation of known, or the development ofnew high yielding varieties, suitable to consumer taste preference and growingcnnditions in Burma; (ii) inrreased innut use- narticularlv of fertilizers!(iii) investment in irrigation, embankment, drainage and flood protectionworks; (iY) imnrnvpements in marketing and nricing nolicies; and (v! intensiveinstitutional development.
121. Among the things which might be taken up immediately, it seemsclear there is neeA fnr a mrnh more serious and we11-uQppnnrted effort todevelop and introduce new varieties which are particularly suited to Burmesecond 4it 4 ns and are responsible to fertilizer trevament- As discussed above
this involves consumer-taste preferences as well as growing conditions.Foz. ex.mpe, from the .t.n" nt. of taste TR-5 see vanabnly s.rc.tabl
to consumers in Lower Burma, but much less so in Upper Burma. Fortunately,a large backlog of alte-rnatives has been developed outside Burma *,hich canbe drawn upon. To illustrate, IR-20 has recently been introduced underlnsoon conditions in neighborI.ng Bangladesh, and by the 1972/73 growingseason more than two million acres were devoted to this variety. It seemslikely that yields of IR-20 in Ba.ngladesh arromaabet thebet yiefldsa
of IR-5 in Lower Burma, but this is only one of many new varieties whichcJUoul Ube lestedL. Since there seems to Ibe consderal-le lanA (n both Lv er
and Upper Burma) where water conditions will permit use of the high yieldingvaretLies l-C .L L L Op.LU . .. U L.LULL J.L LA J ULAULL JVL WA LU A-C A E -
and plant protection measures offers the most ready means to realize rapidexpansiton iLn paAAy outpu.t. But a arach high er p-rorit4y, accompanied by
adequate financial support, must be given to adaptive research on high-yie~Ulding var L . L&I.LS should include buth efforts LtU .LLpJVe traditional
Burmese varieties and a more vigorous testing, and crossing with, well-suitedvarietLes being developed in other paddy-growi.g areas in. Asia.
122. Increased use of inputs, partLcuarly fertilizer, is largely relatedto the adoption of the high-yielding varieties. The mission was unable toassess the state of knowledge with respect to fertllzer nLeeds, but availableevidence suggests that fertilizer use generally is not sufficiently attractiveto farmers, particularly when used with traditional varieties. Greateremphasis on fertilizer trials, to determine physical response and economicadvantages under different conditions, could produce more answers than arenow available to planners, and could pinpoint those applications which havesignificant production and financial impact. Furtnermore, considerationmight be given to launching a package program combining high-yielding seed,fertilizer, plant protection and credit to spread known and tested technologies.
123. Embankments to protect against flooding and salt water incursion,drainage and pump irrigation can all open new opportunities in the delta.Whether through improving yields tor reducing losses) ot traditional varietiesor enabling water control so that high yielding varieties can be introduced,these investments also offer means for expanding paddy production. Thepossibility of using pump irrigation for a paddy crop during the winter
- 41 -
.ontLs ailso seems worth sL e --- ioAUs tpULaLLUI If JLaLrIIr LadU puIps L[thy
could grow either paddy or jute but with new varieties paddy may be economicallymore a'vardv.tageous tLo thLLe farLmlers than Jute. No ±LL.LLt:dU wtIier paddy crop(December through April) is grown in Lower Burma, and available pump irriga-tion is now be'ng used to promote Jute (Marcn through july). Ir determined tobe technically feasible, the use of irrigation for winter paddy would requirereconsideration of present priorities. For Upper and Middle Burma, possibi-lities for groundwater development deserve special attention since relativelylittle exploration has been carried out.
124. Tnere is, finally, the general matter of price and procurementpolicies. Government now seems more prepared than in the past to use priceas a policy instrument to encourage the production it requires, but it isnot yet evident that the pricing signals (in relation to other prices) arethe correct ones. There must be continuing review of performance, takinginto account relative prices and costs of production, and further priceadjustments as necessary. Sharp departures of the domestic free marketprice of rice from the official retail price probably reflect deficienciesin the procurement/distribution system, as well as absolute shortages in thedomestic rice supply (see Annex 1). Much is expected from the changes beingmade to shift procurement to the cooperatives, but it is not clear whetherimprovements in efficiency will indeed occur.
125. The distribution function is nmuch more difficult than it appearsbecause it involves the coordination of milling, storage and shipment fronsurplus to deficit areas, and the cooperatives' ability to do this complextask is yet to be determined. Leaving farmers free to market a portion oftheir retained supplies locally serves the function of providing a check onthe efficiency of the official procurement/distribution system. If freemarket prices diverge substantially, this is a signal that the official systemrequires attention. Rather than supressing the limited free market, itshould be retained or even expanded to provide a continuing indicator of mar-keting efficiency which will help officials to focus on the major problems.To the extent that official retail prices begin to approximate the underlyingmarket realities, the incentives for farmers to withhold supplies for saleon the free markets may be less, and the ability of government to procureits needs for all purposes may be enhanced.
126. The realization of new technological potentials requires intensiveinstitutional development. It is urgent that plant breeding and agronomicresearch be strengthened through a network of research stations covering theprincipal ecological zones of the country. This should be combined withextensive fertilizer trials. The seed supply and advisory work should bestrengthened to make immediate use of new varieties as they become available.This would inevitably require a many-fold increase in the use of commercialinputs, and thus a corresponding strengthening of the distribution systemand emphasis on agricultural credit. The mission has not explored theseaspects in detail, but the evident scope for introducing new varieties makesit imperative to initiate institutional strengthening along these lines.

- 42 -
Performance and Prospects for Other Major CroAs
Introduction
127. The recent experience with crops other than rice is instructive in
helping to understand Burmese farmers' responses to their ecological and
economic environment. The crops selected here for further examination are
not an exhaustive list, but they include the most important from the stand-
points of production, area devoted to their cultivation, and potential ef-
fect on the balance or payments. ±iie exterL. Lto which th.ey bee
controlled as to price or production varies among them, as well as varying
over time. This provides a series of interesting case studies on farmers'
behavior under these different conditions, particularly since these involve
the major cash crops which farmers raise. Given the i'mportance which the
government is attaching to their future production, a brief review of the
agricultural sector would be incomplete without some attention to these
cash crops and the factors which affect the role they can play in future
sectoral growth.
128. Pulses and Beans. A great variety of pulses and beans is grown inBurma. Of the important ones, pesigone, htawbutpe (butterbeans), matpe,pedisein, sultani are monsoon pulses (planted in August and September and
harvested in December); gram, pelun and many others (including some of theabove) are winter pulses (planted November - December and harvested in
February - March) grown mainly in alluvial soils as the tide recedes. This
category competes with winter groundnuts for land use. Aside froru ratpe andbocate, which are grown mainly in Lower Burma, the production of pulses is
largely concentrated in Upper Burma. Pulses are grown basically for three
purposes: (i) as a traditional staple in many parts of the dry zone in
middle Burma, (ii) as a cash crop and (iii) as an "insurance crop", after
other crops fail.
129. Until 1964, pulses and beans were second only to paddy in terms of
sown acreage. However, since then, the expansion of the sown acreage under
groundnuts has grown to such an extent that they have overtaken the sown
acreage for pulses and beans. The overall performance of pulses and beans
reflects distinctly opposite trends as between the export pulses (controlled
commodities) and those mainly consumed locally. From 1966 to 1971, the
production of all exports pulses has either decreased or remained stagnant.
Production of matpe and sultanis for example, decreased annually by an
average of 12.4 percent and 11 percent, respectively. Except for matpe,
this decline is primarily due to the decreasing sown area rather than declining
yields. The production of decontrolled pulses, particularly pegyi, gram and
sadawpe, has increased. Except for pegyi, most domestically consumed pulses
increased production despite declining yields.
130. These trends clearly reflect the acreage responsiveness of pulses
to relative price. In 1965 and 1966, the prices and marketing of all pulses
were under government control. From 1967, however, controls for peboke, gram,

- 43 -
pelun, pegyi, peyaza and sadawpe were lifted resulting in increased pricesand profitability to producers. The downward production trends for exportpulses are a reflection of their declining profitability. Since 1967, areasdevoted to export pulses were replaced by groundnut and sesame (and to alesser extent chillies and tobacco) as cash crops. Partly due to theirlack of profitability, pulses like matpe are increasingly growm as crops oflast resort after the failure of priority crops like rice or groundnuts.As pointed out in the Price Committee Report, 1/ soil fertility has becomedeoleted in certain areas, particularly near river beds. The decline in theyields of gram and pelun may be attributed to this.
131. Government procurement of beans and pulses understandably declinedafter 1966 when controls w-re lifted for the domestically consumed crops --
the result of lower production, increased withholding by farmers who usedpulses as a substitute food during the rice shortages in 1967 and 1969., 2/and the more attractive prices and services on the open market. In 1971/72,the procurement of matpe, htawbhutpe neariv doubled, &nd sultani/sultanvajumped eightfold as a result of the large increase in production when pricesfor these pulses were raised by 8-20 percent. Prohlems in the distribution
of these crops persisted, however, and the price committee report quotedcases where farmers had to wait for days at buying centers Prices formatpe, bocate, sultani/sultapya and peyin were further increased in March1973. These export crops were selected by the -rice conmittee on the basis
of available export markets 3/, relative profitability and comparative ad-vantage in world trade. If the experience of the 1971 price inrrence is
repeated, the procurement situation should greatly improve. Special at-tem, p ts shold U be .-.aAe to ensure that existing .marketing and distributiomn
LCLp L L OtUIU. U~ IOU L tLO.A Ua. "'- t '-- - --5
constraints are lessened.
132. Oilseeds. Sesamum and groundnut constitute the major oilseedsproducedu in ')uLIui dLia ardA sesamum. an.d grounnut now rank second and third (afterrice), with sown acreages of 2.3 and 1.7 million acres, respectively, in1972. L-ne production per'or-.ance of sesamum and groundnuts has also beeninfluenced by changing policies on pricing and market control of vegetableoils andU o'lseedUs. Retail priLces for grounAnut oil and sesamur oi, wch
were about K 3.50 - K 4.0 per viss 4/ in 1962-1964, increased to about K 4.80in 1965 and then jnulped to K 8.30 in 1966. Goverr.rLent assumed control of
sesamum and groundnut marketing in 1965 and guaranteed prices to farmerswere set at tne 1964 levels. Lnere was sel;i ar, icrase 'n11 thle production
1/ Report on Fixing the Prices of Various Pulses, 1972.
2/ Per Capita consumption increased in 1967 and 1968 to about 10 percenthigher than. 1965 despite nearl- 10 pereent lower nroduction levels inthose years (Statistical Appendix Table 7.10).
3/ Appendix Table 7.13.
4/ 3.6 lbs.

- 44 -
of sesamum and groundnut from 385,000 tons in 1964 to 437,000 tone in 1965,and an increase of edible vegetable oil imports from 33 to 43 thousand tons,but the controlled retail price increased by about 20 percent in 1965. Thisis mainly explained by the increased costs of imports by nearly 20 percentand the higher costs associated with the government's takeover of marketing.The 73 percent increase in the 1966 price was due to shortages resultingfrom the cessation of imports in that year.
133. The behavior of prices from 1964 throuph 1972 may be explained bytracing the behavior of per capita apparent edible oil consumption (AppendixTable 7.11). Before the embargo on imports, the "normal" per capita con-sumption was about 3.5 viss (12.6 lb.). Allowing for slight increases ofper canita consumntion annually, any shortage (per capita availability lessthan the trend value of per capita "normal" consumption) would result innr4ces higher than the K 4.50 equilibrium level. Prices were consequentlyhigh in 1967, as a result of shortages resulting from the poor oilseed crop.The bumner cron of 1971 nearly enabled consumers to reach their normal nercapita consumption, and prices fell to about K 5.80. Prices increased againin 1979 as n rstilt of a 10 npercent decline in sesamlm and groundnut pro-duction, the takeover by cooperatives of marketing in June - August 1972,and nartlv because of increased sneculative hoarding.
134= Generally higher nrices alqn nrovided incentives for better hus-
bandry and increased input use which led to an increase in average yieldsfrom 585 lha/acre (aYerage 1963/65) to 671 lbs./acre (avernae 1q7072) forgroundnuts and 118 lbs./acre to 144 lbs./acre for sesamum. Given the exportpossIbilities for oilseed cake nnd the netd tn eavnd pnrnoduction of oilseedsin Burma to meet the yet unsatisfied demand, the evidence strongly suggestst hant n ADoPrntroel 1 pIA TcI r4n o nnlI b eo% hg nIadoted to ̂ Torr e sra o l-hlD prnoductonn
of oilseeds as a cash crop.
135. Sugar. Approximately 237,000 acres are planted to sugarcane inBurma, butL 'Less thar. half th4s amLouat are act-ally harve-te for del.1ve
to the mills. There has been an acceleration of area devoted to sugarcaneo4 n cta 1 060 -en. nTi Tn t44 in s 4i c-a-eon Arom _ ,4 ro annh-o wr ro-_ s of
30,000 acres to 50,000 acres. In 1972, an unprecedented 121,000 acres ofnew plantings tookl place. Production of sugarcane has been cyclical, bufrom 1963/65 to 1970/72, it has increased at an average annual rate of 3.4percent per year. W.titl thle n.ation.alizationL of nearL-y all sugar mills in
1954, the government also fixed prices for sugarcane which is a plannedcrop. 'This umeans that not only are prices and marketing controlled, butwhere areas are designated for sugarcane, farmers have no choice but togrow the crop.
136. Tne major problem in the sugar industry is related to the poorcoordination of harvesting and transportation to the mills. Farmers areusually given harvesting (sale) quotas for dirrerent segments of theircrop. When these are complied with and the farmers bring their cane to bepicked up at rail centers, promised transport is often not availabie.Because of poor scheduling, losses in sugar content result from irregular
- 5
arrivals at the mills, even at the height of the rather short (140-145 day)crushing season. Although shortages of transport facilities is part of theexplanation, the basic reason lies in the lack of proper planning and or-ganization.
137. Before nationalization, the planning for sugarcane was centered atthe factory level. Mill overseers also supervised the harvesting andtransportation of the crop to ensure proper coordination. Even after nationali-zation, the ARDC managed to administer the Sugarcane Plan quite efficientlythrough the activation of committees for coordinating cane growing andprocessing. With the formation of the Agricultural Corporation, however, theARDC Sugar Cane Project office was closed, and there are no more districtlevel committees under the new system of administration. Extension of newsugarcane growing areas is often done on the basis of limited criteria. Forexample, recent new plantings in Paan (near Moulmein) were encouraged byAgricultural Corporation on grounds of agricultural suitability. But thisarea is too far from the nearest factory and there were problems in gettingfarmers to harvest and deliver their crops because more lucrative opportunitieswere available elsewhere. The authorities realize the problem and aretrying to activate committees to remedy the situation, but significant improve-ments have yet to occur.
138. Although husbandary problems do not constitute major bottlenecks,apart from the location problem, there are disease problems associated withthe sugarcane crop. The incidence of red rot in recent years affected somecrops in the wetter areas. Farmers have been advised to shift from rot-prone cane varieties like CO-419 to resistant varieties like CO-1001, but themultiplication of cuttings of the disease-resistant varieties has not beenable to keep up with the demand requirements.
139. The location of mills in relation to present and future cane areasshould be thoroughly examined. The larger mills are at least thirty yearsold, and are sorely in need of modernization. New sugar areas are movingfurther away from existing mills, while many existing mills operate at lessthan 50 percent of capacity. Part of the problem of under-utilization ofcapacity is that nearly half the cane available for consumption is notdelivered to the factories, but is used for home consumption and for makingkyanthaga (cane jaggery). Growers like to make cane jaggery not becauseit is necessarily more profitable, but because they can cut their cane earlyand do not have to wait throughout the five-month period to get their alloca-tion harvested and delivered to the mills. The manufacture of kyanthaga isnow prohibited in most of the sugarcane districts except Pyinmana, and yetin sugarcane areas like Zeyawaddy, only 62 percent of the contracted 350000tons of cane were received last year, despite an increase in production.
140. The situation can be improved in various ways:
(a) Improved scheduling and coordination would certainly help.Field teams are needed to visit the farms and assess the

- 46 -
actual amount of crop available for harvest. With a know-
ledge of mill requirements and a realistic assessment on the
availability and scheduling of transport, permission could
be granted to use the excess for Kyanthaga.
(b) If necessary, the procurement price for sugarcane can be
further increased. The free market price for sugar in the
past few years has been more than three times the controlled
prices obtained in consumer cooperative shops. 1/ Tne price
paid for sugarcane since May 1971 (K 40/ton) is lower than
equivalent prices (K 50/ton) in India. Since increased costs
at processing are passed on to the consumer, an increase in
the purchase price of cane to K 50/ton will increase retail
prices of sugar to not more than K 1,900/ton (K 3/viss).
This still compares very favorably with the present free
market price for sugar of K 6.6/viss.
141. Cotton. Cotton production grew fairly rapidly in-the early 1960's
as a result of area expansion. Following the nationalization of marketing
activities in 1965. cotton area and production declined until 1969/70, after
which the government embarked on its Cotton Plan to stimulate expansion.
From 1965-70, despite overall declines, there has been a change in the re-
lative importance of the different types of cotton. The production of
Wagale (a short staple) declined while long staple production expanded pri-
marily as a result of government's efforts to encourage a shift to higher
quality cotton. The government increased the price for Wagyi (a medium
staple) in 1971, and followed suit for the other cottons in 1972. A re-
view of the results of the Government's push for cotton expansion can bring
out some of the problems faced in the cotton sub-sector. In 1972, despite
favorable weather, the percentage of sown area which was subsequently re-
corded as "destr6yed" increased from 13 percent to 19 percent. Thus, al-
thouigh the government actually met its target of 553,000 acres for sown area
in 1972 (representing an increase of 18 percent over the previous year), pro-
duction did not increase - in fact, it was 34 percent below the 63,000 tons
target.
142. The reason for the increased proportion of destroyed area and
lower yields is the result of the emphasis on target area expansion, to the
neglect of the minimum inputs necessary to ensure a corresponding increase
in production. The long staple cotton encouraged by the government is a
relatively high risk crop, more difficult to grow than the traditional
cottons and other crops which can be grown in its place. Not only are the
timing and availability of water important, but the crop is susceptible to
numerous pests and diseases which require higher standards of crop husbandry
and input use. The area expansion in the past couple of years has been
increasingly in marginal cotton areas, especially with resespect to water
availability. Places like Myingyan township (Mandalay Division) where
1/ This situation arose after 1965/66, when significant imports of
refined sugar ceased.

- 47 -
"planned" cotton was grown for the first time in place of tobacco, providean illustration of the problem. In the first season (1972), sufficientwater from the Pyaungoya dam could reach only 565 acres of the 2,018 acresplanned. It is, therefore, understandable that tor the 1973 crop year,the majority of the farmers were unwilling to grow cotton. Many farmersbegan.growing pulses, tobacco and onions, but when planting time for cottoncame, the tobacco and onion plants had to be destroyed to make way for it.
143. Some farmers in other areas are reported to avoid having to growcotton by boiling their seed before sowing, so that at inspection, they canshow that the seeds are not "viable" and receive permission to grow perferredcash crops. A waste of resources therefore occurs as a result of over-zealous implementation of planned crops. Not only has overall production ofcotton not increased but the area under other competing crops, like chillies,has also declined substantially. Unless sufficient water can be assuredwhen it is needed, actual cotton yields in these areas do not provide pro-fitable returns.
144. The cotton dilemma is related to the need to provide raw materialsfor the cotton manufacturing industry. Since 1966, the imports of cottontextiles have declined drastically, the government has built more mills toproduce yarn and cloth, and the pressure for increased domestic productionof raw cotton has since mounted. Government mills (mainly large scale units)are given top priority in terms of access to available raw materials (localor imported), hence most of them are working at near capacity. The smallunits, however, which comprise the bulk of Burma's capability for yarn andcloth manufacturing, are utilized well below 50 percent of their capacity.
145. There appear to be numerous compelling reasons for increasing theprice of cotton to the farmer. Although the.necessary backup of supportingservices will still be required, it would serve to diminish somewhat therisks associated with the crop and provide added incentives for production.Unit cost reductions should also result as increasing capacity utilizationby the small textile mills are brought about. This means that increasedproducer prices for cotton need not be passed to the consumer. Moreover,current producer prices of cotton are mDre than 50% lower than world pricesand the corresponding prices to farmers in India, 1/ which makes it even moreimportant to increase domestic cotton prices.
146. Jute. Jute is a crop of recent importance in Burma. Before 1965,annual production was only about 11,000 tons. It has since been the fastestgrowina crop in Burma, reaching 64.000 tons in 1972. Primarily grown in thedelta area, recent expansions have been as pre-monsoon crops (planted inMarch-April and harvested in July-September) and generally followed by paddy.
1/ Unit CIF import prices (long staple) in Rangoon for 1970/71 were K 2,854/toncompared with the highest guaranteed nroducer nrice of K 1.120/ton and inJune 1972, the price for long staple (28-32 quality) was Rs 4,450/ton orahbuit K 2A927Iton in India.

- 48 -
Jute expansion, unlike the growth of sesarte andu groundnuts , has not beenfuelled by price increases, but rather by the availability of lift pumps whichcan more than double yields in the pre-monsoon season compared with monsoonjute. The jute crop has provided extra income for an increasing number offarm families, since it is grown on rice land which 's normally fallow orplanted to less remunerative crops, and it is grown in the off-season. There
is some competition with monsoon rice in the use of land anrd especiallylabor, particularly if jute is planted late. Because harvesting and retting
of jute invariably coincides with the transplanting of rice and with theshortage of labor at this time, 1/ the quality of retting suffers. Al-
though the introduction of retting machines in such areas could ailleviatethe labor problem, it is uncertain whether present grading systems and
prices paid for each grade would be sufficient to provide an incentive for
such an investment. 2/
147. Unit export prices of jute from Burma are approximately equal tothat of Bangladesh.3/ Farm prices were significantly higher in Burma prior
to 1971/72, but farm prices in Bangladesh have since risen to similar levels.
With generally higher average quality, the export cost of jute from Burmais competitive with that of Bangladesh. Since the cessation of jute importsin 1968, Burma has been marginally self-sufficient in Jute, but it still has
a deficit in gunny bags. In 1971 for example, 4.5 million gunny bags wereimported at a cost of K 7 million to supplement domestic requirements. there
is only one mill producing gunny bags in Burma, and it is currently operating
at full capacity (about 22,000 tons/year). It was only in 1972, when juteproduction jumped to 64,000 tons, that Burma emerged from its marginallyself-sufficient situation, and exported nearly 16,000 tons of raw jute (Table
7.13). Burma imports gunny bags more cheaply than it can produce them. In1971 for example, the ex-factory price per bag was K 2.0, compared with the
CIF (Rangoon) price of K 1.50.
148. The rate of expansion of jute has been so successful in the lastfew years that actual output has consistently exceeded targets. For 1972 in
particular, production exceeded the target of 18 percent. Given the poorworld market prospects for jute, further growth of surpluses at the present
1/ In Myaungmya. even though Jute growers were willing to pay K 5/day (com-pared with the average rate of K 3), they often are unable to hire labor
because of the unpleasantness of retting, and the availability of other
seasonal jobs.
2/ Although farm prices are fixed for three grades, about 90 percent ofthe annual crop is of Grade I quality (K 1.65/viss).
3/ In 1971, fob prire in Chittagong was US$244/long ton (excluding tax)and fob price in Rangoon was US$238/long ton.

- 49 -
rate will encounter increasing difficulties in export sales. Some diversi-fication of exports away from traditional buyers (U.K. and Japan) was achievedin 1972 when nearly 35 percent of exports were shipped to Yugoslavia and WestGermany, but an indication of sales difficulties is already evident in thesize of apparent stock build-up in 1972. Burma's iute quality may be an ad-vantage, but in government-to-government sales, it may not command muchpremium. A careful re-examination of the Government's iute policy is needed.The 135,000 ton production target by 1975 may well be reached, but unlesslocal demand exnands by at least the same rate- a 100.000 ton surnlus may notbe easily sold unless prices dip substantially below the 20 percent declineproiected by comnwod{tv trade ana1ysts= 1/ On the other hand, the 4mnliadfarm price for a 20 percent reduction from 1970/71 price levels would be
K 1.29. At this nr4re even if yidlA increase fre" its current 735 lb/acreto 900 lb/acre, jute will not be able to compete with improved rice as apre-monsoon crop (Awniiv 1 Table-14II, ndA the probl f a 4.te- -- l-
sort itself out.
149. Pricing Policy, and Burma's Comparative Advantage. The precedingreview of the performance by, selected crops agairn-. underscores te .. portane of- -' … ~~r-.-.-. -0.* 'StLo~., c L* ~.A UL~LLC*C%
pricing policy. Generalizing from this body of experience, except for juteand s ugarc ane, th e agricultur c dlt i who.s4 4- -- I ann ual g ro- ra tesi. .the~ ,~*S. 05 . t. uA U tsu.a.L.=C n-#o a,,flUaJ. WWi LUU LL Lb n1 LI-LL
past decade were faster than population growth are those in which expansion;has been related t-o increas-s in pri8ce. Thuese commodities (groundnut, eaeV%x;~~~~~nc a e LLA0SS Fri _ A.XC LL XO t VU.LL.A=Z rLVUiLLUllUL, ebt:bUILUgram, pegyi, onions and chillies and others) are also those which have beend AIL ~ i. .~a UJ..LI.hough it isdiffut 1 o U mae a JudgeuientL as to whLLich wasthe more influential factor (the price mechanism or private sector marketing),the 1971 experience with the incrWea iLL the guararnteed price for pulses,matpe, htawbutpe and particularly sultani/sultapya seem to argue in favorof the price mechanism. Iu other -words, private sector marketing andincreased prices have been responsible for production increases, but pricei.ncreases alone (under government marketing) seem to have been sufricient toelicit a production response.
150. The government's increased interest in the role of the pricemechanism is evidenced by the formation of the Price Committee last yearand from the Economic Guidelines adopted at the First Party Congress, butit has taken the government a long time to make this change in policyemphasis. The government's concern for price stability and the need toKeep the costs of necessities (especiaily foodstuff) uniformly low toconsumers throughout the country is not by itself unusual ,but to do sounder conditions of scarcity has served to stifle the growth of manyagricultural commodities. Two policy developments in 1965/66 led tothis situation. Firstly, because of foreign exchange concerns, agricul-tural imports declined by 58 percent from K 393 million to K 168 million
1/ IBRD Commodity forecasts. FAO's consultative committee for jute, kenafand Allied Fibers projected a 25 percent decline from thp 1970/71 pricelevels of t 115/long ton f.o.b. Chittagong.

- 50 -
between 1965 and 1966 and secondly, the Government took over the marketing
of all agricultural products 1/ and fixed their prices at (and sometimesbelow) previously prevailing price levels.
151. These measures led to a shortage situation (particularly for sugar
and cooking oil) and the emergence of a black market. These difficulties,
aggravated by poor weather and social unrest, then led the Government tonermit the private sector to engage in the trading of some food commodities,
primarily those only consumed domestically. The prices of these decontrolled
croFp were allowed to rise, and in turn this provided the incentives forincreased production. For the controlled crops, prices were held to relatively
low levels (until very recently) and substitution in cash crop production
from controlled crops to more remunerative decontrolled crops like jute,
sugarcar.e and particulariy cotton were zealously encouraged by the Government,
frequently at the expense of more remunerative crops.
152. Before the formation of the Price Committee, the changing of
conttrolled price levels, on the few occasions it was done, was rather ad-hoc.
The Price Committee, in its increases in 1973 has for the first time
spelleA out the cr4teria by which -rice chanv;-c would be assessed. 2/
Among the criteria mentioned as having been taken into account were:
(a) cultivation costs and comparative returns among crops;
(b) potential external market and export price trends;
(c) current retail prices (controlled and free), and theirimpacL on. the .ost of living;
(Ud prices asked buy proucers; and
(e) maximum price at which a reasonable margin would beleft to the Government.
153. Although no mention was made as to how these criteria were to be
reconciled ('.if they all were usedU), iL i8 r.everthLeless ecouraging to see a
readiness to consider them. If the Price Committee estimates are correct 3/the current f.o.b. costs of rice, maLze and jute for export (Table 7.14) are
higher than the average export prices which prevailed in the past three years(1969-71). Burma's comparative advantage appears to be in .he ex-por of
pulses and the oilseed cakes. The competitive advantage of pulses in trade
has unfortunately been derived at thae expense of relative profitability to
the farmer. Matpe, bocate and gram are among the crops which provide the
1/ Except for fresh fish, meat, fruits and perishable vegetables.
2/ Price Committee, Formulation of Pricing Policy of Government enterprises(mimeo), 1973.
3/ Price Committee, Report on the Pricing of Various Pulses, 1972.

- 5i -
least net returns to family labor. There is therefore substantial leewayfor price increases for the export pulses.
154. Controlled commodities can therefore be divided into categoriesaccording to whether further price increases could or could not be instituted.The former would apply to the export pulses. In February 1973, priceincreases were announced only for matpe, bocate, sultani, sultapya, andpeyin. Given the attractive export margins for the other export pulses likepedisein, htawbutpe and pesingone (and their potential markets), similarprice increases should be instituted for them. Rice, maize and jute arein the latter category. In fact, in the case of jute, price decreases shouldbe contemplated if Burma intends to recover future export losses. In 1975with an expected decline of wozld jute prices for about 20 percent, ifBurma achieves its plan target cf 100,000 tons, and f.o.b. costs remain thesame, the loss to the Government would well reach K 5.5 million.
155. The decontrolled crops (particularly groundnut, sesame, and domesticpulses) have been shown to be price responsive, and the market mechanismshould continue to determine the appropriate levels. But more than pricepolicy will be required to improve the growth of agriculture. As noted earlier,further infrastructure support like irrigation, the introduction of pumps,better transportation facilities and improvements of agricultural servicesto the farmers (extension, research, input and credit supply) are someof them. Nevertheless, given the interrelated effect it has on the extentof 4-nput nep and relative nrofitabilitvy a rational price policy must beregarded as a sine qua non for agricultural growth.
IX. TNDIJSTRY -
156. The major emphasis of industrial policy during the sixties wasthe development -f lmport subsa1 4 4titu4ng irstries. The data availb1nle
do not permit an assessment of the success of this policy but it is
--lear that there is still considerable sco-e for further mnnort substitu-tion. Several industries rely heavily on imported raw materials and manyconsumer products are imported some of which could be -roduced domestically.
Towards the second half of the decade, considerable emphasis has been given
to lin.klng the development of industry w4th th at of agriculture. Several
industries providing important inputs for agricultural production, have beenset up sir.Ace tchat- tcime (fertilizers, irrigatior. pump8, tract- Ior assavnhly,repair facilities). Burma also has the potential to develop industrial exports
1/ Industrial statistics are quite limited and unreliable, particularlyLa regard -to the pri.vante sector. Th&ere a be.e- .no comprehen.sive
survey of the manufacturing sector since 1963/64 and the recent revisionLl the 1970t71 data or. ind-ustr-al pro-duct'Jon ir,ticate a a. increase by
4 percent over the previous year arid not 15 percent as given in lastyear' economic report.
- 52 -
but, as yet, this possibility receives little attention from the government.Last year's economic report pointed out that the basic principle of Burma'sindustrial development has been to give priority to the establishment ofnew capacity at the expense of maintaining the capacity of existing industriesand as a result decapitalization trends are apparent in many branches ofindustry. The report also pointed out that the lack of financial andmanagerial autonomy in the public sector enterprises was a major tactor inexplaining the sector's poor performance. This report highlights themanagerial problem by discussing in greater detail the costs of industrialproduction and two important constraints to industrial development, namely,the shortage of raw materials and components and the neglect of the small-scale (largely private) sector.
157. But, first, a brief discussion of the role of industry in theeconomy and of its performance last year may be appropriate. As statedpreviously, output in the manufacturing sector increased by 3.1 percent in1972, which was about the same as the average annual real rate of growthover the past decade. The share of manufacturing in GDP has also remainedabout the same as in 1961/62 (10.6 percent). Within this generally stag-nating trend, there have been some noticeable shifts in the structure ofindustry. A group of more dynamic industries (printing, household goods,electrical and engineering industries) grew at an average annual rate of8.8 percent over the decade, compared with a 2.4 percent annual rate ofgrowth of the traditional (agricultural processing) industries, raisingtheir share of industrial GDP from 13 to 22 percent over the period. Theshare of value-added in gross industrial output also increased from 18.4 to20.6 percent over the decade. The pattern of production in 1972 conformedwith these trends. The traditional sectors other than food and tobaccoexperienced a considerable drop in production, while the growth of industrialraw materials and some equipment producing sectors was far above the sector'saverage (Appendix Table 8.1).
158. These changes in the structure and composition of industry are,however, still quite marginal. Modern, l:arge-scale units, which are veryfew in number remain an enclave with little connection to the rest of thesector. Out of the more than 15,000 registered factories in 1972, 70 per-cent employed less than 10 workers and only 2.3 percent employed more than100 workers. Within the public sector, nearly 80 percent of the enter-prises produce food, beverages, clothing and construction materials.
159. More importantly, however, the performance of the industrialsector over the nast decade has been extremelv noor in relation to thepriority it has been given in investment. Industrial value-added percapita did not improve sign4ifiantlu nover the past decade ($7.R in 1972as compared with $6.8 in 1962), nor did the per capita production and con-su…ption of such goods as su-ar, textiles, pr-rl, s0ap, remant and steel ,m-
prove during the period. Average productivity per worker decreased from

- 53 -
around $6,000 in 1970 to $4,800 in 1972 in the public sector and from $1,000to $860 in the private sector. These figures should be treated as roughestimates but the trend is unmistakable. Between 1963 and 1972, total in-vestment in the manufacturing sector amounted to over $280 million (21 percentof public sector investment during the period), making a capital-output ratioof 4.2:1.0. Moreover, the heavy investments over the last four years havenot yet induced higher rates of growth of output. The capital-output ratioover the last four years is around 6.7:1.0. 1/ In view of trends in averageproductivity per worker, these ratios appear high. The obverse of this trendis, of course, a pronounced and increasing under-utilization of capacity.The Mission's estimates based on partial information indicate that publicsector enterprises are operating at around 60 percent capacity while theprivate sector must be operating at well below 50 percent capacity. Some ofthe causes of these disturbing trends are discussed in the following sections.
Small-Scale Sector
160. One of the major reasons for industry's poor performance is thecontinuing deterioration of the role of the small-scale sector. All large-scale industrial units have been nationalized but the private sector (in-cluding a small number of cooperatives) still accounts for more than halfof value-added in industry and almost 90 percent of industrial employment.In spite of its size and importance, however, the small-scale sector benefitsvery little from government policies towards the development of industry.Its function to create new jobs is limited by the overall constraints to itsexpansion in terms of investment and the availability of raw materials.Small-scale producers are generally left out of the planning system, invest-ment programs, financial and promotional schemes and there are as yet noplans to change this situation. The government's intention is apparentlyto promote the expansion of producer cooperatives 2/. This is a reasonablepolicy, as far as it goes, but it can be argued that it does not go farenough since it restricts private sector activities to a kind of cottageindustry producing handicrafts utilizing mainly local raw materials and itis not an optimum use of resources. To take one example, it will be sometime before the public sector could productively employ those currentlyengaged in small-scale industries.
161. In 1972, gross output in the manufacturing sector increased by0.5 percent. This corresponded to a 3 percent fall in the output of theprivate sector and a 5.5 percent increase in the output of nublic sectorenterprises. Some of the reasons for this were (a) several new publicsector factories came on stream during the year. while no new, units have
1/ The relationship between industrial investment in the public sectorand incremental value-added in industrial sector. No data is availablefor private sector investment in manufacturing.
2/ The number of industrial cooperatives has increased from 6 in 1966/67to 159 in 1971/72.

- 54 -
been permitted in the private sector since 1963; (b) a number of establish-
ments (probably over 50 in the food processing sector) were taken over by
the government; and (c) small producers have been harder hit by the shortage
of imported raw materials and components (which is discussed later). These
and other factors have been at work for most of the decade and in the cir-
cumstances, it is amazing that the absolute level of gross output in the
private sector has not fallen along with the reduction in the number of
factories and workers. In 1972, there were 2 000 units and 20,000 workers
less in the private sector than in 1970.
162. Private producers who choose to obtain imported raw materials
from the ge'vernment must be registered with the Ministry of Industry to
become eligibleo In some broad sectors such as rice milling, saw mills and
cloth weaving, 1/ almost the only way for a small producer to exist is to
enter into a contractual relationship with government agencies, under which
the goods are delivered to the agencies in exchange for raw materials and
a prescribed fee, Uinder this system, the private producers function as an
extended arm of the state agencies with very little freedom of action other
Uan. the commo. practice of siphoning off goods and materials to the black
market. The responsibility for registered small-scale producers is widely
dlffused among various agencies, 2/ but, for the most part, the private
producers operate without any government assistance and supervision and not
always in the pu.blic's- Interest. These producers do not have to observe the
minimum wage laws nor any other standards of operation and they rely heavily
on the black market for raw materials and spare parts.
163. It is therefore recomended that the whole approach toward the
development of the small-scale sector be reassessed with the view of en-
hancirng its role in the economy. A central institution should be created
which would be capable of supervising, promoting and financing small-scale
industries. These producers should be encognuraged to register themselves for
government assistance and to uphold the general policies regarding operationsand~ * T- D.u.man Ir.he small-scale sector has vast note tial for makingan'U rce LLL~ . o_-----Ia
a significant contribution to economic growth. In addition to what they
hnave been doirng so far, small producers shhould be assisted and encouraged to
concentrate on certain new lines of activity, such as (a) the establishment
o -various ;;pes of ancillary industries which would producia on a fontractt-aa
basis simple parts, components and accessories for large-scale industries;
(D) starting or expa.uuLng production of those consumer and producer goods
which are in scarce supply and cannot be manufactured on a large-scale basis,at least for the time being. Such commnodities are hardware, plastics,
1/ Tnere are about 115,000 handlooms and 3,200 powerlooms in the non-
government sector.
2/ Cottage Industries Corporation, General Industries Corporation, StateTimber Corporation, Industrial iance Division of the Uo Bank ad
Several Trade Corporations.

- 55 -
brushes, glass, metal manufactures, etc., all of which are currently smuggled
into the country; and (c) produce for export various handicraf ts on a reaular
and supervised basis.
164. Burma is unlike many other socialist countries in that private
sector activity is allowed in many sectors and on a fairly large scale.
Except in the case of the agricultural sector which is almost entirely
privately operated, the stated government policy is to allow private sector
activity until such time as the state can take over all sectors entirely.
In the meanwhile, the attitude of the authorities regarding the rLon-govern-
mental sector could be described as one of benign neglect but it is the
Mission's conclusion that in formulating a strategy for the development of
the industrial sector, a positive policy towards the promotion of the
small-scale sector is required.
Cost of Production
165. The small-scale sector in industry has stagnated over the past
decade because it has been almost completely neglected. On the other hand,
public sector enterprises which have been given overriding priority have
not done much better. Part of this is due to physical and some non-economic
constraints besetting the sector but it is largely due to the way the public
sector is structured, its operational principles and mechanisms, the policy
framework under which it functions and the nature of its relationship with
other sectors. The following discussion of price levels and practices
illustrates some of these problems.
166. On the basis of some very incomplete data, a comparison was made
of the level of industrial prices in Burma and some neighboring countries.
The general conclusion of the analysis is that prices in Burma (wholesale
or official retail prices) are higher than the prices for similar products
in India and Pakistan (Appendix Table 8.2). In the case of India, out of
22 representative industrial products in both countr.es, prices in Burma
were found to be higher for 15 products; 1/ roughly comparable for 6
(wheat flour. glass bottles. cement, sugar. longyis and Jute bags) and
lower only in the case of urea fertilizer. International comparisons of
ex-factory prices are even less favorable to Burma but the discrepancy is
greatest in the comparison with free market prices. Compared with the
above-mentioned countries; market prices are twice as high in Burma for
sugar, cigarettes, cotton products, soap, bricks and dry-cell batteries,
and 3-5 times higher in the case of wheat flour, salt, cement and bicycles.
1/ Groundnut oil, salt, cigarettes, cotton yarn, clothing and shirting,
paper, bricks, matches, toilet soan. steel round bars, wire nails.
electric bulbs, dry cell batteries, cycle tires and bicycles.

- 56 -
167. So many factors are responsible for the high cost of industrial
production in Burma that it is difficult to single out any one as critical,
particularly since they tend to reinforce the effect of each other. To
begin with, the size of plants is generally far below optimum levels, even
in new public sector industries. Save for three or four new textile mills,
which can be described as having close to optimum capacity, there is hardly
any other plant in Burma of a size approaching minimum international
standards. The 30,000 tons steel mill, two 35,000 tons (in terms of ni-
trogen content) fertilizer plants, 13,000 bicycles and 1,000 cars/tractors
assemblying units are examples of the size constraint. Even so, existing
industrial capacity is grossly underutilized and this probably increases
unit costs more than any other factor. Capacity utilization for the sector
as a whole is probably around 50 percent but it is lower in the private
small-scale sector, lower in the more import-based industries and, of
course, in the older, more worn-out units. This phenomenon is largely due
to the shortage of raw materials (both local and imported) and the chronic
lack of spare parts and components which explain the frequency with which
equipment breaks down.
168. Availability of Raw Materials. Since more than 60 percent of
industrial production consists of the processing of agricultural products
(including livestock, forestry and fishery), it is not surprising that the
slow growth of agricultural production is a factor constraining the growth
of industry. Last year, for example, the value of purchases of domestic
comodities for direct sale by the Trading Corporations increased by 42 per-
cent, while their purchase of domestic commodities for manufacturing pur-
npoes fell by 20 percent. Also, their purchases of imported industrial raw
materials fell by 12 percent. The decline in the availability of both
localiy nroduced and imported materials led to a sizeable slackening in
certain manufacturing operations. Rice and wheat milling, for example,
dropped by 8 percent (in terms of value of output) and the production of
textiles on a raw materials supply basis fell by 41 percent.
169. Imports of industrial raw materials and intermediates haveamounted to $50-65 million a vear over the last three years, but the data
(Appendix Table 8.3) provide no basis for quantifying the relationship
between imports and the growth of industrial subsectors. The absence of
a quantifiable relationship, however, between imports of materials and
industrial production by nr.o mans im.nlies the lack of an important correla-
tion. On the contrary, there is every reason to believe that the import
capacity co.straint s4 quite searious, although this provides only a partial
explanation of the sector's poor performance. The value of imported raw
materials is not larger today than it was in the earli 'sixties, since which
time there has been a growing requirement for imported industrial inputs.
T ne shortage of imports of cotton yarn, chemcals, comoents and accessorie8appears to be the most critical.
170. Despite the obvious scarcity of both domestic and imported raw
materials, there is very li ttle i..tication that input prices reflect demanTd.
The purchase price of domestic materials is determined by various government
agencies on the basis of what can or.ly be descri'bed as historIcal prices.

- 57 -
The Agricultural Corporation, for example, fixes a price which is supposed
to be roughly remunerative to the farmer compared to the prices of other
crops on the free market= This imnrecise pricing policy has dire implica-
tions for production as shown in the case of cotton. The procurement price
for raw cotton in Burma is less than half the nrice in Pakistan, India orthe international market. This undoubtedly explains why cotton productionhas declined over the decade, and hy Burma's textile canacitv is heavilyunderutilized and cotton manufacturing costly.
171. In addition to uneconomic relative domestic prices, even lesscons'deration is given to the implications of input prices on manufacttiringcosts or their relationship with international prices. Very little regularitycomes ou;of othe compariso,s which can be made with other countri es Whi 1 e
the price of groundnut is much higher in Burma than in India and higher
tnan the worLUd ,u-rket prLce, te Burmese sugarcane grower gets much less
than his Indian counterpart. Similarly, the price of raw jute in Burma iscomparable wit'h those Ln India and Bangladesh, w.ile rubber prices are
lower than in India but higher than in the world market.
172. The price of imported raw materials in Burma is generally highertnan in neighboring countries. The price is determ.ned by adding to the
c.i.f. price an import license fee of 5 percent, customs duty of between10 and 50 percent, special import surcharges, and other taxes. ITm.portprices also tend to be higher in Burma than in other countries for two
reasons. Much of the import trade is Dased on tieu loans or Uarter agree=
ments and purchases appear to be excessively decentralized and thereforetoo small for achieving a better price. Most government agenci'es procureon their own although in the name of the Myanma Export Import Corporation.Cotton yarn, for instance, is purchased separately by Trade Corporat[Lon
No. 5 for commissioning private producers and by each of the larger state
mills.
173. Replacement and Maintenance. The policy on maintenance and
depreciation has also proved to be a major obstacle tc the growth of the
industrial sector. Depreciation rates are generally too low. LTlere is
a general depreciation rate for machinery of 5 percent, with higher ratesapplicable in certain sectors. These rates are applied to largely under-
valued assets and they take little account of actual replacement cost ortechnological change. Furthermore, depreciation charges are transferredfrom the entities to the central budget where they lose both their identity
and function. These funds are treated as general government revenues andvery little is returned to the enterprises for replacement purposes. Instead
priority is given to new investments. This policy, pursued over a long
period of time, is responsible for the state of disrepair of the equipmentin many industrial units.

- 58 -
174. Another problem has been, and is, the chronic lack of spare parts
and accessories. There is no precise information on what would be the
annual requirements for industrial spare parts, nor the actual amounts
available. What is known, however, is that almost 80 percent of the spare
parts have to be imported and that no more than 20-30 percent of the foreign
exchange required is being allocated for this purpose. Of the domestically
produced spares, one part is made by the factories under the Heavy Industries
Corporation and People's Engineering Industries, and the other by each factory's
workshops. It is difficult to find a single factory in Burma without its own
workshop employing 50-150 qualified workers whose main job is to make spare
parts. These workshops, taken together, are probably the largest single
industry in Burma but their efficiency is necessarily at an extremely lowlevel, since parts are produced mostly by hand, at irregular intervals and
in small numbers. The high cost of locally made spare parts increases
production costs but it is the scarcity of necessary spares which is really
costly. Given the overall foreign exchange constraint, it tends to be
easier to replace worn out equipment by winding up old and erecting new
factories than through normal replacements. This is actually happening under
the rice and saw mills replacement programs. Also, much of the undisbursed
balance on existing loans is tied to the establishment of new factories.
On the other hand, even the new and relatively privileged units are bound
to face the same problems of shortage of spare parts and inadequate main-
tenance under the existing framework. The entire set of policies and
practices regarding depreciation, capital formation, new investment, foreign
exchanRe allocation and foreign participation 1/ should be reconsidered with
a view to making the producing units economically viable and self-financing.
175. Capital Costs. Enterprises can acquire or expand their stock
of fixed capital only through the central budget. Local currency appro-
priations bear no interest and repayment obligations, and the same principle
applies to allocations of the government's free foreign exchange resources.
Enterprises only bear the cost of foreign loan disbursements and these
service payments are included in the ex-factory price even if they are
treated as overhead or depreciation charges. With regard to workingea-ita1, al1orations are still made by the btudget as a noncommercial ap-
propriation. However, what is needed over and above these quotas canbe obtained through loansq hbariTg interest of 3 n rcent ner annum. It
is not expected that the total amount of these loans will be more than 5percent of the working capital budgetary apnronriati onns= The Working CanitalScheme (described in last year's economic report) is now under the supervi-sion of the Industrial Finance Division of the Union Bank and the scheme has
been extended to cover all Trade Corporations. 2/
1/ The government should ensure that contracts with foreign suppliers pro--vide for the supply of spare parts after the projects are completed.
if 2o8 organizations are now under tLe WCS - 80 trade a.d ir.dustrial,
3 printing and press; 180 cinemas, 18 shipping, and 5 transport.

- 59 -
176. The object of the WCS is to monitor performance regarding therequirement for working capital and the authorities feel that the WCShas already had a positive impact on reducing current expenditures andimposing some financial discipline on public enterprises. But the WCShas no form of sanction and it still has a long way to go in transformingworking capital from a nonreturnable budgetary grant to a commercial typeloan. As long as enterprises do not have to pay for their capital renqiire-ments (both fixed and current), they cannot be expected to economize onits use. The high level of receivables and stocks in most public sectorenterprises attest to this fact.
177. Utility Charges. Fertilizer plants and other industries witha consumption of more than 2 million KWH ner month are charged the equivalentof one cent per KWH, which is 25 percent lower than rates in India. Medium-and small-scale units pay higher rates - 2.5 and 3.5 cents per .a., respec-tively. The actual cost of power is, however, higher for Burmese industriesthan these rates suggest. Frequent nower shortages and v.oltage changes exertan adverse impact on capacity utilization and production costs. As a result,many enterprises have to resort to establishing their own generating facili-ties which are themselves costly but probably more assured. On balance,thouth; the nr4-ee of electricit, for large-scale producers is not excessivelyhigh, and supply is. not a major problem - certainly not at the presentlevel of capacity utilizatiorn. There is also scope for reducing electricitycosts if the country's transmission and distribution networks could bebrought to the level of its gapacity and any future revision intariffs should eliminate the bias against medium- and small-scale units.
178. Transportation costs represent only a minor item in the directcosts of production, since both the shipments of materials to the factorygate and the pick-up of finished goods are the responsibility of theT-.--de Coor^porations and r.ot the producing enterpr'Lses . Ne-vertheless , theinadequate availability of transport is a serious problem both in termsof the timely arrival of materials and the heavy and wasteful stock-pilingof goods which tends to occur because of the general lack of transportationfacIlities. The rea' costs of transportation in production costs, however,cannot be determined because of the lack of data.
179. Labor and Overhead Costs. The pay increases enacted in 1972represent the flrst major revis,ion in wages since 1947. Tne number ofpay scales was reduced and the wages of the lowest paid workers wereJncreased by 21 percent from $17.2 to $21.8 per month). Since the wage
and salary increases are highest in the most numerous categories ofworkers, 1/ their overall effect on production costs is likely to be high.
1/ See Appendix, Table 9.8.

- 60 -
The government does not yet envisage any increases in the prices of indus-
trial goods although such increases would seem to be inevitable. The
authorities expect that the increase in labor costs will be offset by
increases in labor productivity but this is an eventuality which does not
seem very likely. Firstly, because the wage and salary increases have
proDably already been offset by the rapid increase in nrices leaving real
wages, at best, at the pre-October 1972 level and, secondly, the basic
problem is to improve capaity Ut4lization and this c-annot be done simply
by the increase in wages. Another element of high labor costs is the fact
that public sector enterprises tend to be staffed at their nominal c-pacity
and not to the actual level of their operations.
180. In most cases, overhead costs constitute a sizeable element in
Burma's industrial cost structure, although they seem to be lower than in
some other Asian countries. It would be difficult, however, to make any
generalization on this matter given the differences in accounting practice
from one enterprise to another. 1/ What is more important, however, is
the real costs of management in terms of its effectiveness i-n managing
enterprises. Except for some special jobs, Burma does not lack qualified
technical personnel in industry. In most of the factories visited by the
Mission, the impression was left that managers were competent in organizing
production and running the factories, but beyond this technical function,
managerial ability is greatly underutilized. Managers are very little, if
at all, concerned with cost and productivity anaalysis, profitability obJec-
tives, modernization and expansion programs, export financing, changes in
consumer preferences, marketing and advertising opportunities and other
activities which normally occupy factory management in other countries.
Under the present excessively centralized framework, factory managers have
little scope for influence on matters beyond the technical operation of their
units and the removal of this constraint, although Lt will take sonme time,
is a sine qua non for improved industrial practices.
181. One final element in the cost structure is the addition of excise
duties on ex-factory prices. These duties are fairly moderate except in
the case of cigarettes where excise duties are more than double the
producers' price. There is also a component of cost called the "safety
margin" which generally amounts to 5 percent of ex-factory price. This
margin is what has remained from the 10 percent profit margin that existed
in the early sixties. It now has no legal status, although it is retained
by the authorities since it performs the obviously useful function of
cushioning minor changes in the prices of inputs. The determination of
1/ In some cases, for instance, production engineers' salaries are in-
cluded in the factory's overhead costs, while in the others they are
under direct production costs.
-61 -
the safety margin is the only financial decision left to the discretion ofenterprises but there is a clear need to legalize profit margins and revisetheir scales.
182= Ex-factorv Drice as described in the foregoing may still not bethe actual ex-factory price. It differs from the approved ex-factory pricein twn resnects= Firstlvy there is a fixed price for inter-governmentalsales and one for the public. The former does not cont,ain the commercialtax. Secondly, when there is more than one nroducer of a Droduct. a priceequalization process takes place within the corporation which results inan ex-co roration price. By this process, higk cost producers are subsidizedby the more efficient ones as exemplified by the Textile Industry Corpora-tion. The textile indust.-y includes both lare-scale, low-cost mills and
numerous small units. One of the large mills - in Meiktila - had accumulatedprofits during the first three an.d a half -ears of its onerationn of aboutK27 million. This would make an impressive rate of return on investment.Tn 1970/71 alone, this factory's profit margin was 45 npercnt. This
does indicate that under certain favorable conditions (new equipment, availa-bil_ty of raw materials, etc. ) textile goods could be produced much more
cheaply in Burma than at present.
183. Prices. The ex-industrial corporation price, as described above,.is th'e purch'as'rng priLce for Trade Corporations and other. state agencies.From this point on, productive enterprises have nothing to do with theormation o1 the JLinal seling priLces. ThIL le sellin.g price is co.mposed of the
purchasing price plus sales tax, handling and transport charges, overheadcharges and prof it margilns. Some of these charges vary from year to year(for example, transport charges are being fixed on the basis of theprevious year's actual cost), but most oL them remain as they have beenfixed at different times in the past. Most of these charges and marginsvary from one corporation to another; some of them are being fixed as apercentage of the base price and others in absolute amounts.
184. Very often, selling prices are determined by negotiation betweengovernment agencies and prices derived in this way are not always co,-..patiblewith economic costs. In any case, much of the rationale, upon which theexisting price level was based, seems to have been eroded resulting in veryarbitrary and at times inconsistent price levels and relationships (seeTable 11). Even more serious, however, is the fact that .prices have beendeprived of most of their economic function - to provide guidelines for theallocation of resources, capital formation, consumer preference, performanceevaluation and growth - and that no adequate measures have yet been devisedto replace the role of pricing policy in economic management.
185. Some major changes in pricing policies are therefore indispensableif the country is to overcome many important constraints imposed on theindustrial sector. Due to recent increases in the prices of imported raw

- 62 -
nmterials, wa,,es and caitali re-rtain u,nwarrd adiustments in Drice levels
seem to be imminent. The Mission understands that the Pricing Committeeis considering some mi-nr rhngace in the whnlp rnctino and nrtcing mechanism.This might include fixing prices of domestically produced goods in line withcomparable 4i-mt- pri4csa ac wall as establish nrgdlwtivitv norms for
workers and machines. Manufacturing costs would include interest on capital,depreciation and an appropriate rate of return on capital. Profit mnarginswould be determined on the basis of the essential nature of the goods andmarllet- .onditions ar.d transactions between fIactories and state agencieswould be conducted on a commercial basis.
186. If these recommendations of the Pricing Committee are implemented,i;t wou'ld constiLtute a ma.laor ove-haul 0of the existing system. ThSe problem.
.1.L WULULUL~ L LUC ~iIJ UkIVLIL L J. 4. LIL .&LL1F '-" A-
is, however, that so far the discussion of a revision has been going onlargely outside the industrial sector whereas it is essential for somebasic principles of price formation to be acceptable to and observed bythe i.ndustrial units. DurLm.a obvious.Ly ca,-.not yet afford to close doSn even
the least efficient units but some thinking is necessary on how to move them
on to more productive 'LLnes ofJ actLivity. Industrial priLces sIoUlA have animportant function in capital formation at the factory level, no matter whichLorr. it takes, andu th'i's will only bue successful if enterprises are given sumincentives for improved efficiency.
X. MuBILIINL REaSURIC 'a rF INRPvrISOrL-TII
187. According to the Plan (1971/72 - 1974/75) the level of grossinvestment is to be maintained at the 1970/71 level, corresponding to abIout
11 percent of GNP, and about US$250 million. In this decision, the shortageof financial resources was the dominant factor, but this is not an acceptablelevel of investment, particularly in view of the slow rate of economicgrowth and the widespread disinvestment process which nas been going on forsome time. In addition to a substantial increase in gross fixed investment,probably of up to 15 to 20 percent of GNP, a shift in emphasis is aiso re-quired to reallocate a greater share of investment to much needed spare partsand equipment to overhaul and renew overaged capital stock. The toregoinganalysis of the agricultural and industrial sectors leads to the conclusionthat the major elements of investment strategy should be: (a) to improvethe imbalance between investment in industry and agriculture, and to directinvestment in agriculture towards diversifying production and exports; (b) torehabilitate the mineral and forestry sectors; and (c) to improve capacityutilization in the manufacturing sector, both public and private. It followsthat investment in infrastructure (power, telecommunication and transport) is
a necessary concomitant of such a strategy.
- 63 -
188. The problem for Burma is how to mobilize sufficient resources tocarry out such an investment program. Considerable further work needs tobe done to improve our understanding of the budgetary process, the country'sresource generation potential, including the fiscal system, the profitabilityand accounting practices of public sector enterprises, and savings institu-tions. The following is the mission's tentative analysis of the problemsand prospects of increasing the mobilization of resources for investment.
189. The increase in interest rates on savings deposits to 3-1/2 per-cent (tax exempt), the removal of the ceilings on the size of deposits andthe expansion of the network of banks are steps the Government has taken toincrease mobilization of private savings. These measures should have abeneficial impact on mopping up some of the excessive liquidity in the handsof the public, but their effectiveness really depends on the growth ofprivate incomes. The Government also has under consideration the creationof a national pension scheme and the expansion of the coverage of the lifeinsurance scheme for public sector employees. No new revenue measures arebeing considered other than the switch-over from the sales tax to a turnovertax. Sales taxes are levied on goods handed over to-the Trade Corporations,whereas the turnover tax would be imposed at the factorv level. The inridenreof the turnover tax should not be different from that of the sales tax butthe authorities expect that the turnover tax would be easier to collert thanthe present sales tax.
190. Per capita current revenues in Burma are currently $10 comparedto $4-5 per capita for Nepal, Afghanistan and Banaldeshj 816 for Indi-a and$24 for Thailand, and it is difficult to see how revenues can increasewithout an increase in tax - rates given the slow growth of output and the de-clining trend in imports. The present tax system cannot be expected tomake a maior contribution to the needs of an expanded investment pro'gram.Personal income taxes account for 0.2 percent of total revenues; therevenues from customs duties are not significantly different from inter-agency transfers, and the rates on indirect taxes are progressive andconsndeired fairlv high. In the present economic and political circumstances,the Government is unwilling to consider tax increases but this unpalatabledecision will have to be made soon; perhans after the 1974 elections. Inthe interim, what is urgently required is the enactment of policies aimedat imoroving the management of the public sector enterprises and substantialinflows of foreign capital on concessionary terms.
191. For most of the past decade the government policy has been tocontain the growth of expenditures in line with the growth of revenues.This became an increasingly difficult task with revenues declining andlittle scone for further cut-backs 4n current expenditures. In fact,there is now a tremendous pressure for substantial increases in currentexpenditures. This year's budget anticipates a 23 percent increase in cur-rent expenditures resulting from a 24 percent increase in expenditure onsocial and econo.ic services and a 52 percent 'ncrease in the cost of ad-ministration. Most of the recent and proposed increases in current expendi-tures reflect the increased ro'le of' the government anri of th-e Burma SocialistProgram Party in the economy. Ilowqever, in the absence of any immediate

possibility of a corresponding increase in revenues, and given the infla-
tionary impact of furthier reliance on deficit financing, it would seem prudent
to curtail or postpone further increases in expenditures on government ad-
ministration.
192. Budgetary savings amounted to K 35 million in 1972 and they are
expected to be even lower this year. As stated previously, the major
source of government revenues is the receipts from the State Boards and
Corporations and, given the reduced role of the private sector, the main
source of domestic savings must be the surplus of public sector enterprises.
Taken together, these enterprises have shown an overall deficit since 1965
and the task of improving the management of the public sector is one which
cannot be further postponed. A concerted effort needs to be made to review
public sector management with a view to making specific recommendations to
improve operating efficiency and generate a surplus for investment. De-
centralization of decision making and a clear allocation of responsibilities
are urgently needed but giving some measure of autonomy to the managers of
individual agencies and corporations alone will not suffice. A complete
overhaul of the policy framework as it affects pricing policies, cost
determination, accounting practices, productive efficiency, depreciation
and capital formation is urgently required. The Government has made some
efforts in this direction such as the introduction of the Working Capital
Scheme, the revision of wages and the introduction of piece-rates in a
limited number of factories, but the situation calls for a larger than
piece-meal approach.
193. Another avenue for mobilizing resources for investment is increased
exports. The need for foreign exchange is even greater than the local cur-
rency constraint. It is difficult to quantify the effect of import restric-
tions on production and investment on the basis of the data available. The
commodity classification of imports and the data on sectoral production
and investment are all incomplete. Moreover, since the growth of output
over the past decade coincided with a declining trend in imports, estimates
of import elasticities are necessarily dubious. Available data indicate
imnort elasticities for output and investment of about 0.65 but the need for
producer good imports is probably much greater than is implied in this rela-
tionshiD.
194. In the agricultural sector., more than half of the tractors and
pumps in the country are unusable because of the shortage of replacement
parts and the analysis of the industrial sector (Chapter IX) points unmis-
takably to thie adverse effects of the lack of spare parts and components on
production. Tn short, although considerable further work needs to be done
to quantify the magnitude of the problem, visible evidence of the deteriora-
tion of physical assets throughout the economy and the low level of capacity
utilization attest to the severity of the shortage of producer goods. The
M.ission's estimates nf imnort requirements for the remaining three years of
the Plan (which projects a 4 percent rate of growth of output) is of the
order of S200 mllionn per annum., compared to $160 million in 1972. This
implies an annual rate of growth of imports over the next three years of 8
percent and thIis does not jncluide imnrt-cs of crvireS and foreiqn exrhange
for debt service payments.
- 65-
195. The prospects for an equivalent increase in exports are not verygood. Exports have been declining for most of the nast decade; and the maiorreasons for this have been insufficient investment in the export producingsectors, and inadequate attention to expsrt promotion. Agriu1ltural exports
currently account for 67 percent of thc total, with rice alone accounting for42 percent (Appendix Table 3 The,.overrments1 8 polcy has been to Pive
priority to domestic consumption of rice and little investment has gone into
raising paddy yields. In addition to inlsufficient investment, until this crop
year, the government has not used pricing policy as a means of encouraging
greater production for export. As a consequence, the production of paddy
and export pulses (controlled commodities) became less attractive than
other crops produced mainly for domestic consumption. Supply constraints
also affect exports of foresrry and mineral products. Burma has considerable
potential for increasing both its timber and mineral exports, given 'ts enor-
mous forestry and mineral resclrces and the fact that the country supplies
only about one percent of the import requirements of Western Europe anu the
USA for teak and hardwoods and less than one percent of world trade in
minerals. The major obstacles to increased production continue to be in-
surgency in the forest and mining areas and the low level of investment in
the subsectors.
196. The world market prospects for nearly all of Burma's traditional
exports, including rice, are very good but there is as yet no indicationthat export promotion is being given the priority it warrants. Understandably,
with limited resources available for investment, and the priority given to
other objectives, little investment has gone into producing for export, but
in view of the acute shortage of foreign exchange, a re-assessment of priori-
ties is urgently needed and measures must be devised to take advantage of
existing market conditions.
197. Poor export performance is a direct corollary of the slow growth
of production, but this has not been the only problem. The Myanma Export
Import Corporation (MEIC) is the official agency handling foreign trade but,in practice, MEIC provides an umbrella under which the direct responsibility
for exports is rather-diffuse. Rice exports is handled by the Trade Ministry
since most of the rice is sold on government-to-government contracts and tim-ber is sold by the State Timber Corporation (STC). Trade Corporation I pur-
chases agricultural commodities which are then handed over to MEIC for export.
Similarly, the Ministries of Industry and Mines have no marketing units. They
conceive of their role as producers with export markets and prices being the
responsibility of MEIC.
198. The lack of communication between producers and exporting agencies
provides an important additional expianation of Burma's poor export per-
formance. Marketing intelligence is extremely weak. There is no Bureau of
Standards and the attitude with regard to exports is generally passive.
Burma's inability to take advantaze of the considerable rise in the export
price of rice this year is not just a matter of ill-luck. It is also due
to noor mnrketing intelligence and a very conservative sales policy which
has some merit but is too inflexible. Similarly, the STC employs no sales
agents abroad, nor does it deal directlv with buyers. Sales are made to
traditional buying agents and, in all probability, the country is not getting
- 66 -
the best price for its teak. The various mineral corporations hLave rnoawareness of export markets even though virtually all metallic mineralproduction is exported, and little effort is being m-,ade to promote newexports of industrial goods and handicrafts.
199. This discussion of the weaknesses of Burma's export marketingpolicy is not intended to de-emphasize the importance of the physicalcontraints to increasing production for exports. The Mission estimatesthat exports will grow at about 3 percent per annum over the next few years,anid the trade gap alone is likely to be of the order of $60 million. Con-siderable increases in investment in agriculture, forestry and mining arerequired to increase and diversify production for export. At the same time,an increased flow of exportables will require corresponding improvementsin export marketing and price policies.
200. In determining the level of investment over the Plan period, theshortage of financial resources (local and foreign exchange) was certainlytile dominant factor. In addition, however, the authorities give greatemphasis to consolidation and improved capacity utilization. There isindeed room for both of these things, but what seems to be emerging veryclearly is the fact that improved capacity utilization itself requires newinvestment. The agriculture, forestry and mining sectors have probablyreached their maximum productivity under existing conditions. In theindustrial and infrastructural sectors, equipment is so over-aged andreplacement has been postponed for so long that massive investments are nowrequired simply to rehabilitate rated capacity. It therefore seems likelythat the modest target increase in per capita GDP of 1 percent per annumover the Plan period will not be achieved unless there is a substantialincrease in investment. In view of the present constraints, to mobilizinggreater domestic savings and increasing export earnings, the Governmentis seeking foreign assistance to finance an expanded investment program.AddiLional foreign assistance must, however, for the time being be onlong-term concessionary terms. This is not only because the debt burdenis already quite high but because of the extremely low level of the country'simport purchasing ability which imposes probably the severest constraint toits development and which is likely to remain low until there is an accelera-tion in the rate of growth of exports.
D. THE ECONOMIY INi PERSPECTIVE
201. A review of recent economic developments leads to the inescapableconclusion that economic performance has not met Burma's needs. For most ofthe past decade, output growth barely kept abreast of population and, overthe last two years, there is increasing evidence of declining per capitaincomes and living standards. At the same time, it must be recognized that,until very recently, the achievement of higher rates of economic growth wasnot a major objective of the Government. The level of investment and savingshas been and still is low, accounting for 12 percent and 8.5 percent of GNP,

- 67 -
respectivUely. 'U'Lreove, r c w--
plishment of the Government's social and political objectives. Gross fixedinvestment (excluding social services, ad-m-n1stration aAd defence) accountsfor 6.6 percent of GDP, and of this the major share goes into the manufac-turing sector. 'lost of the .eedus ofL the economy, outside manufacturing, have
to be met out of a level of public sector investment corresponding to about4 percent of GDP.
202. The low level of investment and its un'balanced allocation have notbeen the only factors responsible for the stagnation in output. In addition,policies dictated by other priorities have quite clearly had depressing ef-fects on economic growth. The social transformation of the economy (begunin the forties) is still in progress, as evidenced by the expanding role ofthe cooperatives in the agricultural sector, but in effect nationalizationof the means of production and distribution has been largely accomplished,albeit at the cost of considerable economic disruption, while its benefitshave yet to be reaped. A major task confronting the government is to make thenew system function efficiently. A necessary but not fully sufficient con-dition for this is improved management of public sector enterprise. This isa formidable task.
203. It is also widely recognized that the inefficiency of the statedistribution system continues to be an important obstacle to development.It amplifies scarcities and creates price distortions which enhance theprofitability of black market operations and speculative activities. Theeconomy-wide uniform pricing policy for goods sold in official shops and theemphasis on price stability undoubtedly alleviated some of the hardships ofthe slow growth of production. It seems evident, though, that this policyhas been inconsistent with the hopes for increased agricultural productionand exports and that it has been partly responsible for the inability of thestate enterprises to accumulate a surplus for investment.
204. The government is aware of these problems and is trying to dosomething about them. The renewed interest in economic development isexemplified in the Cabinet adoption of the Four-Year Plan, 1971/73 - 1974/75(the first one to reach that stage since 1962). This determination tograpple with economic problems endangering social progress has been gatheringmomentum over the last year.
205. The government's strategy toward agricultural development is in atransitional stage, in part reflecting the prior experience which has beendiscussed earlier. One key to the emerging strategy lies in the diminishedexpectations with respect to rice exports. This change in emphasis seems tostem essentially from two working assumptions:
(a) the next ten years will see many, if not most, of therice importing countries becoming self-sufficient inrice production, with a corresnonding decline in theexport prospects; and

- 68 -
(b) since Burma intends to fully supply its domestic ricerequirements as a first priority, the setting aside of
this portion of the crop will leave relatively smallsurpluses for export in the future.
206. The corollary of these assumptions is that the Plan seeks to place
greater emphasis on import substitution and increased exports of crops other
than r4ce. Special efforts will thus be made to expand production of cotton,
Virginia tobacco, sugar, and wheat in order to reduce imports, and pulses
and beans, Jute, oil cake and other animal feeds to increase exports. Rice
exports will continue, subject to the constraint that domestic requirements
be fully met first, but the target for the next three years has been set
tentatively at 800,000 tons, or approximately the volume achieved in 1970/71.
The value of livestock and livestock products is to increase by 40 Dereent
over the Plan period (1971/72-1974/75). Other target increases for this
period include fisheries production at 10 percent, teak production at 11 per-
cent, hardwood production at 9 percent and other forest products at 10 percent.
The value of output for the agriculture sector as a whole is exnected to grow
16 percent over the course of the Plan.
207. The cooperative movement is expected to expand its role in agri-
cu'lture in -ways wLlich promote .e methods and i.troduce new innutsj enable
farmers to work collectively on purchasing inputs and small equipment, ac-
quire pumps and tractors .'or hire to members and undertake villa-e level works
such as irrigation canals, water tanks and wells. This basic approach is not
new to Burma, but t1ne emphas3 likely to be… placed on it ma- be reater than
before.
208. A significant change, discussed earlier, may be forthcoming with
respect to agricultural pr'ces. Whereas prices have been regarded as
something to be restrained in the interest of consumer protection and greater
equity in income distribution, there is rnow growing recognition of the need
to use price as a device to direct the flow and composition of output.
209. The Plan strategy also mentions certain types of investment to be
undertaken. These include an increase in irrigated area outside the dry zone
by 194,000 acres, an addition of 33,000 acres of virgin land to the land
brought under cultivation, the restoration of 671,000 acres of fallow land to
cultivation, and the continuation of dry zone development projects involving
dam construction, irrigation and drainage. Finally, targets are set for yield
increases in the major crops, to be obtained from generally greater use of
inputs and improved plant material.
210. In assessing the Plan strategy for agriculture, one can start
by granting that the analysis of the long-term rice situation may have
some foundation. Nevertheless, there remain substantial opportunities for
rice exports. There is still some scope for the introduction of known
improved varieties where water and soil conditions permit. However, further
improvement and adaptation of indigenous varieties does not appear imminent.
This is unfortunate because the testing and introduction of high-yielding
varieties, together with complementary inputs, affords a real opportunity
for raising production in the shortest period of time. Since the area of

- 69 -
unused lands suitable for paddy cultivation is not very extenrsive, the nextmost promising possibilities for increased paddy output lie in more extensiveembankments to protect against severe flooding and salt water intrusion,supplemental pump irrigation for second crops, better drainage and bettercultivation practices (i.e., a larger portion of the paddy area being trans-planted) on lands already devoted to paddy cultivation.
211. In connection with all these, the importance of supporting researchcannot be overemphasized. With such a program, accompanied by appropriatepricing and marketing policies, it should be possible to reach and maintainannual export surpluses in the range of one to one and one-half million tonsfor some time to come. In this context it is immaterial whether the Burmese
estimate of long-term rice export prospects is unduly pessimistic, for itseems clear that in the short-run rice can be counted on to continue as animportant foreign exchange earner for Burma.
212. With respect to the other crops, jute acreage and production haveresponded well to the government's efforts to stimulate them, and smallamounts are being exported. Burma will probably be able to meet its ownrequirements for gunnies, but given the relatively poor prospects for rawjute exports on world markets, jute does not seem a strong base on which torest hopes for very large increases in foreign exchange earnings. The cottonexpansion program-seems to be encountering more serious problems. Despitesome recovery in sown acreage since 1971, production remains below the levelsof the early 1960s as yields continue to decline. Cotton is a difficult cropand, moreover, it competes with pulses, chillies and onions which are moreremunerative to the farmers. Similarly, export pulses and beans have shownlittle tendency to respond to direct government efforts to expand productionexcept when the low prices paid for these crops were raised. Oil cake forexDort offers better prospects, but groundnut production is particularlysusceptible to weather conditions and the drought of recent years has beena major reason for the decline in production since 1970/71. Sugarcaneproduction has doubled over the last decade, and Burma is now approachingself-sufficiency at per capita consumption levels approximating pre-war ones.While much could be done to improve the efficiency of the production andmilling, the scope for either further import substitution or export does not
seem great.
213. The other real export potential would seem to lie with forestry.The long-term market for teak exports is favorable. and that for other hard-wood species is improving. Burma's forests are capable of producing a sus-tained production of both teak and hardwoods at levels greatly in excess ofcurrent removals. Not only can earnings grow from increased production, butthere is reason to expect that improvement in the milling can bring substantialgrains in the average value of sawn timber exports. Livestock is anotherarea of considerable promise. There are large areas which seem eminentlvsuited for livestock production, but the difficulties in implementing aviable nrogram may be hard to overcome in the short run. The feasibilitvof deriving exports from this subsector is yet to be determined, but toiudge from the resource base available it is probable that something canbe accomplished on this score. Lacking specifics on the type of program

- 70 -
envisaged by the Plan, however, the increase in livestock production
projected for the Plan period seems most optimistic.
214. The expressed intent to use prices as an im,portant policy element
to promote production is a development of considerable promise. It would
be unrealistic to expect price adjustments alone to uring about spectacular
improvements in the production of most commodities, but some adjustments
could go far to support other efforts. For example, better paddy prices
to the farmer would be consistent with efforts to get farmers to use new varie-
ties and modern inputs, and to transplant a larger proporti,on o' their
crop; price seems to be important in explaining the poor performance of cot-
ton, pulses and beans, despite government campaigns to expand the'ir produc-
tion. On the other hand if wage goods are not widely available irn the
countryside, the incentive effects of price readjustments are lessened -- a
general type of problemi which has impact beyond just the agricultural sector.
215. Lacking more specific study of the recent history of the coopera-
tives and analysis of their strengths and weaknesses, assessment of their
enhanced role under the Plan strategy may be somewhat premature. Never-
theless, one may already say that if the reason tor expanding the role of
the cooperatives is the expectation that economies of scale will follow, the
benefits may prove somewhat illusory. As in similar situations in other
countries, management is a key factor. For example, if management is poor
there is no reason to assume that tractors and pumps will be operated more
economically or efficiently under cooperatives than under the tractor stations
which are now being phased out. The transfer of procurement, transport and
sale of paddy functions to cooperatives, by itself, offers no grounds to
believe additional benefits will accrue to farmers via scale economies,
although better management could make a difference, whether it is supplied
by cooperatives or otherwise.
216. Turning to the industrial sector, certain broad actions have been
taken to improve the basis for future growth. Acting upon the recommenda-
tions of the Prices and Wages Committees (established in December 1971), the
structure and level of wages have been revised and there is now much greater
flexibility in the use of piece rates, bonus schemes and other productivity
incentives. Diversification of the overall structure of production must be
achieved through an expansion of the share of industry in GDP, and Burma's
notential for exDanding the industrial sector is basically good, both in
terms of natural and human endowmients, and in the prevailing social climate.
Participation with foreign groups could speed up the process of industrializa-
tion (especially in the mineral sector), but this is a course of action which
the goverrment must weigh against its other objectives.
217- The maior priority is to rethink current policies regarding the
development of the sector. So far, Burma has not been very successful in
pursuing indlstrial growth. This has been due, to an important degree, to
such factors as the lack of capital, the slow growth of agricultural produc-
tion, unfavorable terms of trade and diminishing foreign exchange resources,
but it has also been due to inadequate pricing policies, insufficient replace-
ment of existing c2…acitv, the lack of incentives at macro_ and micro-levels,

- 71 -
the lack of inter-industry linkages through the market and inadequate atten-
tion to putting enterprises on a self-financing, economically viable basis.
Apart from a revision of pricing policy, the following issues would seem to
be of prime importance:
(a) The small-scale sector should be revitalized andgiven a chance to play an active role in the country's
industrial development. In this regard, the government
should make a concentrated effort to evolve a strategy,including the establishment of appropriate institutions
and policies aimed at providing financial and technical
assistance to small-scale producers;
(b) Industrial enterprises should be entitled to hold and
use their own depreciation funds in order to preventfurther disinvestment, and to enable these enterprisesto maintain and replace equipment adequately; and
(c) To the extent possible- new inv.estment in industry should
be curtailed or postponed, and greater priority should be
given to the reconstruction and modernization of existing
industry. Such a policy could be greatly helped if some
of the undisbursed balance on existing loans, which are
now tied to new industrial projects, could be diverted to
the rehabilitation of existing industries.
218. With regard to increasing the mobilization of resources for
investment, the government hopes that the increase in interest rates on
savings deposits to 3-1/2 percent (tax exempt), the removal of the ceilings
on the size of deposits and the expansion of the network of banks will
induce more private savings. These measures should ha-ve a beneficial impact
but their effectiveness really depends on the growth of incomes. Given the
political orientation of Burma, the main source of domestic savings must be
the surplus of the public sector enterprises.
219. Consumer cooperatives are taking over wholesale and retail dis-
tribution from the state tradinr orga.izations, and thev are now allowed to
charge prices to cover costs and have a small profit margin. These measures,
together with the establIshment of wholesale outlets in each of the major
divisions of the country, should bring about some improvements in distribu-
tio.n through the reduction in stocks and wastages. Similarly, the expansion
of the Working Capital Scheme to nearly all public sector enterprises is
the first step towards making these en.terprises more nost-conscious. These
measures alone, however, will not suffice. As stated previously, a concerted
effort h11cas to be ` Ae to review public sector m.a.gemet and devise policies
aimed at improving operating efficiency and generating a surplus for invest-
ment. A siumilar effort aLso r.eeds to be maAe to promote exports and to
strengthen the export marketing institutions.
220. All the macro-indicators point to a worsening economic situation
which is partly due to the neglect of the ecornomy over the past decade and
partly to the steady drop in the purchasing power of Burma's exports. For

- 72 -
these reasons, it would be unrealistic to expect to see a major reversal of
these trends in the irmediate future. In fact, the outlook for 1973 suggests
that the basic situation is likely to get a lot worse before it begins to
improve. The expected drop in rice exports to around 300,000 tons will have
a severe impact on the investment program. As the analysis of Part C of
this reponrt indi-cates. the maior economic problems are deep-seated and will
require substantial increases in investment over time to set the economy on
a nath of dynamic growth. Recalling that Burma's infrastructure was built
in the days when export earnings were a multiple of what they are today, the
level of i-nvp-utmont required to maintain and expand this infrastructure is
now disproportionately high.
221. Nevertheless, the picture which emerges is not unrelievedly dis-
couraging. The basir cPuses for optiTmism are the country's enormous re-
source potential and the evidence that the authorities are making a serious
effort to harness some of this potential. The country's recent admission
to membership of the Asian Development Bank is a further indication of the
priority being, aien to ecrnonic deve1onment and of a willingness to accept
foreign assistance to promote it. In addition to the wealth of Burma's
agricultural, forestry and mineral resourcesi the country is relatively
under-populated, the people healthier, better-fed and better educated than
those in manyr other Asi-an countries. To develoD these resources, even at
the modest rate of 4 percent per annum increase in GDP, will require substan-
tial inflows of foreign assistance. In fact; if Burma is unable to secure
financing over thie next five years on the requisite scale and terms, the
country may well be faced vwith} the problem of further cutting back imports,
and thereby forced to accept the prospect of continued economic stagnation.
222. It is difficult to put an order of magnitude on the level of
Bur-,a's capital requirements, but it is likely that the required capital
inflows are quite substantial. In view of the already high debt burden,
a2xternal assistance w'..ich Burma greatly needs must be on lon-term concessionary
teri:s. Such assistance, however, will not be easy to obtain and will in any
case require continuing e-vidence of the willir.gness of the authorities to take
some difficult decisions which are necessary for increasing the rate of
economic jrowth.

ANNEX IPage 1
RICE
1. Rice, the dominant crop and also Burma's largest export has been
stagnating over thLe past decade. Once or.e of the largest rice exporters inthe world, Burma suffered severely from the devastation wrought in WorldWar LI and from recurrent social disturbances. As a result of extensive
minor embankment and reclamation works undertaken from 1958-1963, sownacreage of paddy regained its pre-war levels of 12.4 million acres only in
1964 and has remained at approximately that level since. The national paddyyield increased by on,ly 0O. J percent annually, from the 1,473 lbs average for1963-65 to the 1,523 lbs average for 1970-72, largely as a result of the
slight introduction of exotic nigh-yieldIng varieties in parts of the Deltaafter 1969. Paddy production regained its pre-war level of 7.4 million tonsin 1963), DUt has iLcreasedu by on-L;y percent annually since. W4ith anaverage population growth of 2.2 percent in the same period and the apparentper capita rice consumpt'ion increasing by- nearly 1 percent annually, it is
not surprising that Burmese rice exports have eroded from 1.5 million tonsin 1963 to less than 600,000 tons in 1972. Despite the poor performance ofthe rice subsector, it remains Burma's single most important commodity,accounting for 41 percent of the value of agricultural production and 42percent of total export value. It is planted on 60 percent of the arableland and provides the main food staple for the population.
2. The Structure of Production. About 70 percent of thre area unduer
paddy is located in Lower Burma, where during the monsoon there is virtuallyno substitute crop for paddy. Some of this land (five to ten percent) is
subject to deep water flooding; another 50-55 percent consists of landwhich is less flooded but may exceed one foot. The remaining areas, 35-45 per-cent of the sown area is on land sufficiently high to enable water control atlevels not exceeding one foot. _/ The latter and part of the second floodingcategory represent the present scope for introduction of high-yielding varieties.In Bangladesh, one and a half feet of flooding is considered acceptable for
HYV such as IR-20. In Burma, as shown in Table 4 only about 10 percent(348,000 acres in 1972) of the area flooded up to one foot is actually beingutilized in this way. The extensive use of transplanting, discussed below,confirms that the bulk of agricultural land is subject only to very shnaiow
flooding, or no flooding at all. Although the rate of adoption of high-yielding varieties was rapid at the start, from 1969 to 1971, the pace hasslowed considerably in the two years since 1971. An estimated 60 percent of
paddy sown in Lower Burma is transplanted (Table 1). Most of this transplant-ing is done around July, except for Mayin paddy which is transplanted in
October-November at the time of receding flood waters. Tnere is virtuaily
1/ These estimates refer to Class I and Class II land, which have
relatively little inundation and are suitable for transplanted,aS recorded i n Technical Paners. Volume I (Physical Resources),Union Land and Agriculture Planning Commission, 1956.

ANNEX 1Page 2
no substitute for paddy during the monsoon season in the paddy-growing areas
in Lower Burma, although some winter groundnuts, pulses (especially gram)
and vegetables compete with Mayin rice.
3. Upper Burma presents a quite different situation. Rainfall is
less, and much of the paddy is grown in lowland valleys near the rivers
where some irrigation is possible. In the four largest paddy producing
divisions in Upper Burma, about half the sown paddy area (1.4 million acres)
is now irrigated. This irrigation is primarily by river diversion and
gravity distribution. Only in two or three places, however, is water avail-
able for irrigation throughout the year. Because irrigation permits water
control - vital for successful use of the short-stemmed new varieties - the
irrigated area is a prima facie measure of the scope for their introduction.
Again referring to Table 4, one can see that something less than ten percent
of this opportunity is being used. Moreover, the use of high-yielding
varieties in Upper Burma is now only half of what it was in 1969, the first
year in which there was significant acceptance.
4. Where paddy is grown as the sole crop, 53 percent of the farms are
below 5 acres (Table 3), and another large proportion (28.5 percent) is
found in the 5-10 acre category.
5. Input Use and Technological Change. The introduction of high-
vielding varieties accompanied by increased use of other inputs is one
available means by which to break through the stable production pattern of
recent years. Where they can be used, the high-yielding varieties are
currently hbringing yields more than double the average achieved with tradi-
tional yields. The slight trend increase in average paddy yields for all
Burma, cited earlier, is probably due to the contribution from the high-
yielding varieties which have been used, offsetting declines in yields among
farmers still using traditional varieties. Unfortunately, however, the four
high-yielding varieties introduced so far have not been verv successful.
The first hiqh-yielding variety (IR-8). which was introduced in 1968, did
not meet the taste preferences of the Burmese nor of most foreign importers.
Accordingly, the area under this HYV has declined drastically. A second
variety (IR-5), which was later introduced, has not been acceptable to
far.m.ers in Upper Burma although it made some progress in Lower Burma. As
IR-5 gave a higher yield than other varieties in Mandalay (Table 5), taste
preferences, pricing and the marketing system may all have contributed to
cause this decline. Of the remaining two high-yielding varieties, 'Ngweto'
did not make much progress during the last four years. The variety C4-63 --
introduced only since 1972 -- did exhibit some progress, but not enough toh.ave any substa.ti-al i.Pact on production. On the whole, work on varietal
problems seems to have been much more limited than in neighboring countries.
6. Although the Agricultural Corporation is the sole distributor of
fertilizers, it is rather difficult to assess the amounts actualiv used for
each crop. This is particularly true in the case of paddy in Upper Burma
because several more fertilizer-responsive crop alternatives to paddv are
available. On the basis of the amounts distributed, the share of fertilizer

ANNEX 1Page 3
estimated for paddy use has declined from 68 percent (average for 1963/64)to 52 percent (average for 1970/71). From 1963 to 1968, the annual averagedistribution of fertilizer for paddy was stagnant at about 16,000 tons ofurea and nearly 6,000 tons of super phosphate. With the introduction ofHYV's in 1969, these figures have risen to over 30,000 1/ tons and 24.000tons respectively. Average levels of application are still less than 10percent of recommended rates. On traditional varieties. this level ofunderutilization is not surprising because the generally poor water controlconditions removed most of the channe for nrofitahilit-v whirh might ot-her-wise come from fertilizer application. Despite a 25 percent average reduc-tion of fertilizer nrices to farmers (effectiue ainre the 1Q71 crop season)and a 19 percent paddy (Ngasein) price increase (December 1972), Table 7reveals that the ratio of incremental profits to total cost of fertilizationis only 1.0, hardly sufficient to compensate for the uncertainty involved.
7. Although fertilizer application has been shown generally to beunnrom4isng foir traditional varieties, varying soil con.ditions in dIfferentparts of the rice growing areas may involve specific deficiencies whichslig oh t i nvesQtment in4 feriie col orret .e.g sol' in Ba osse1in anA
certain parts of Shan State can be made high-yielding with phosphate sup-.lementation)* It -- I b-en o n as Wo years tfhat.. r-ct-tS--ua-
have been localized to cover fertilizer applications for paddy by divisions,thus reco-nizing that natioanal reco,n.-endation. a-re not al-wys apprp-ri- a
and particularly when there are widely varying local conditions.
8. Cultural practices are one explanation for the probable decline inyields 11r,a nong fa.,.ers using trdiioa vaite ==ahghrpoorinoy A. ~~~~ L'fl~~~~1 A. a,.. liLa. c ~~~~~~~~~a,&fl
6l..L ~~~~~~~LL.L L.LL,ILa.L V~~~~~~~~~L .L~~~~ C a Li±? L CLi VL L.JL LLJJ.ILJlLL Li OIL LiL).I-V.~I t
paddy is now being planted broadcast, rather than transplanted. Becauseu Uad L c LapanUing sL' faster and uses less labor, iLt 'Ls tlerelore less costL-y,
but the yields from transplanted paddy may be as much as 30 percent higherthLLan Luroaducast. Data fLor the Lliltree r,os recent years indicate tile averagetransplanted area has remained constant at about 60 percent of the sown paddyarea Ln Lower Bur,,a (; LIoUgh1 WILth consUiderable variation), bDut thLis is a
decline from a figure of about 75-85 percent which reportedly prevailed pre-war. Two factors seem the most plausible explanations for tnis - generai econ-omic pressures are forcing some farmers to reduce costs of production, and/orLinsecurity in certain areas maLyaD dCtlay d te UILLoLstC -L t.LLL.LL.LLaiUL1on as thLe appropriLate
production strategy.
9. Very little mechanical power is used for paddy husbandry. Landpreparation ana other farm operations are performed Dy Dufraloes in tnelower valleys and by cattle in the drier areas. Hand tractors have yet tomake mucn inroads in paddy planting. Regular tractors are used mainly forcash crops like jute, cotton, chillies and sugarcane, especially where thetiming of planting is important. The cnief sources of short-term credit
1/ The growth in fertilizer distribution for other crops, particularly jute,cotton, and groundnut have been even more phenomenal.

ANNEX 1
Page 4
for paddy production are through the village banks and Agricultural Corpora-tion. 1/ In 1971, the village banks extended about K 89 million for culti-vation assistance during the monsoon season - benefitting only about 560,000or 29 percent of total paddy farm families.
10. Reasons for Stagnant Productivity. The factors which have con-tributed to the relative stagnation in yields may be summarized as follows:
(a) The general lack of price incentives meant paddy producersdid not strive for a marketable surplus. Tne increasingcost of hired labor has also been advanced to explain theextent of broadcasting in portions of the delta in the mid-sixties, although this condition has been prevalent sincethe end of the war.
(b) The economic benefits from fertilizer use seem marginal,even after t'ne recent increase in relative input/outputprices. The basic problem is that there is little yieldresponse in most of the paddy-growing areas in Lower Burmawhere water control is poor or non-existent and knownresponsive varieties cannot be used.
(c) Relatively little research has been carried out to develophigh-yielding varieties suitable to the different ecologicalconditions in Burma.
(d) Minor water control embankments, extensively built priorto 1962, have fallen into disrepair and large segmentshave been washed away because of inadequate maintenanceand reconstruction.
11. Procurement and Marketing. Before 1973, the procurement of paddywas through buying centers of Trade Corporation I and cooperatives scatteredthroughout the paddy growing areas in Burma. Guaranteed prices were paidfor different types of paddy (based on the size and shape of the grain) 2/and grade (based on moisture and dirt content). Since early in 1973, how-ever, cooperatives have taken over all the buying centers. Guaranteedprices no longer reflect grade differentials, but there is a discount ifthe paddy fails to meet minimum standards. The retailing of rice can beundertaken onlv bv Consumer Cooperatives or Peoples Stores. Primary pro-ducers may sell their rice directly to consumers only within their owntownships.
1/ For further details on the credit mechanisms see Annex II.
2/ These are (i) Emata (long thin grain), (ii) Letwezin (short thin grain),(iii) Ngasein (bold long grain), (iv? Meedone (shnrt hold grain) and(v) Byat (plump long grain).

ANNEX 1Page 5
12. The distribution of rice in Burma is also done by the CooperativeMinistry and Trade Corporation I. The latter organization distributes riceonly to 76 deficit townships mainly located in the hill areas of UpperBurma. The distribution of rice through cooperatives is administered bycommittees which are set up at the central, divisional, township and villagelevels. At the central level the committee comprises about 25 members,chaired by the Cooperative Minister. 1/ This committee meets three timesa week and is supported by a working committee which meets everyday. 2/The working committee includes essentially the same personnel which hadhitherto provided the logistical support of monitoring and schedulingshipments from the rice surplus areas to the rice deficit areas, with theexception that additional personnel from the cooperatives are now providingmore assistance. 3/ The d4strict, township, and village level procurementcommittees are chaired by the chairman of the SAC with the cooperativerepresentative acting as secretary. The other representatives are essen-tially those who comprise the working committee.
13. Marketing and processing begins with procurement at the buyingcenter. Milling is usually done at or near the buying center. A typicalflow could involve the transportation of rice to Rangoon to newly formedcooperative group societies (CGS) which act as wholesale agents supplyingRangoon Consumer Cooperatives or onshipping to other wholesale cooperativeoutlets which then supply the consumer cooperative stores. The CGS arepermitted a profit margin of not more than 5 percent. Rangoon consumercooperatives have to charge members a retail price of not more than K 1.40/pvi (K 669/ton). The retail price to be charged by consumer cooperativesoutside Rangoon is their wholesale price plus a 10 percent margin.
I/ The rest of the Comm.ittee consiasts of the p np-Dt-, 1 ft7O Minister
(Deputy Chairman); three members each from TC-1, Cooperative Directorate,and the Peoples Peasant Council; and one representative each (usuallythe heads of departments) from the following departments/corporations -Aaricurflt-.rp Water Transport RnAa Transport, Railway Transnnrt- Spttle-ments and Land Records, Statistics and Planning (Ministry of Agricultureand Forestry), Lahor, nooperative; one rPnresentAri-%m each fro theMinistry of.Transport and Commerce, Labor Council, the Planning Director-ate, the Parti anA the TT,i4e%n ef Rl,rma Bank;of Police.'
2/ This working committee is headed by the Director of the CooperativeDepartment, and has representatives, from the Transport Ministry, TC-1,the Party, Peoples Peasant Council, Labor Council and Central SAC.
3/ The only difference appears to be a lack of commitment on the part ofTC1 - n the wh.ole process in that they generally feel they aconcentrate on their responsibility for distributing for the 76 deficitto-wnshlips (ksee later).

ANNEX IPage 6
14. For the 76 deficit townships located mainly in the hill areas ofUpper Burma, TC-i procures paddy from the cooperatives at K 425 per hunureubasket; plus a K 15 commission. The procured paddy may be milled at thenearest TC-1 mill or brought to Rangoon for milling. The cost build-up
of TC-1 procured rice to Rangoon is given in Table 8 for both internaldistribution and for exports. Rice may be shipped from surplus areas orfrom Rangoon to Central Trade (CT) wholesale branches and to the variousdeficit townships. These CT branches distribute the rice through consumercooperatives. The wholesale branches are permitted a margin of 2-3 percenton the delivered value of rice, while the consumer cooperatives are currentlypermitted a profit margin of 5-10 percent on the wholesale price. Thedistribution of rice by TC-1 for these 76 townships is independent fromthe activities of the cooperative procurement committee.
15. The new system of pricing rice by both the cooperatives and TC-1means that prices to consumers in deficit areas will henceforth have atransport cost differential. The price of rice, therefore, is no longerstandardized between deficit and surplus areas at official wholesale andretail levels. For example, instead of the standardized price of K 0.65/pyi(K 310/ton) for Ngasein rice throughout the country consumer cooperativesare permitted to charge a maximum of K 1.40/pyi (K 669/ton) and K 1.50/pyi(K 717/ton) in Rangoon and Muse (Shan State) respectively. The maximumfixed price for Rangoon appears to be high in relation to the cost of pro-curement and handling estimated at K 493/ton. 1/ It is however, slightlylower than the average 1972 (Rangoon) free market price of K 1.43/pyi(K 683/ton). Estimates of the rice requirement for each village aredetermined by the local SAC on the basis of a coefficient of 6 pyi (28 lbs)per adult per month and 3 pyi for children. Deficit area consumer coopera-tives may purchase rice directly from surplus areas of Rangoon with thepermission of the sub-regional procurement committee.
16. The main deficit areas (Table 9) are in the Northwest Command(Sagaing. Mandalay, Mazwe and Kachin). Rangoon and Eastern Command (Shan andKayah States). Rice has to be transported to the Northwest and EasternCommand from Pegu and Irrawaddv divisions. Transportation costs to Mandalayfrom Rangoon-Pegu via the cheapest mode (railroad) is about K 45/ton whichcould add about 15 nerrent to the present guaranteed naddv price to producersin the Mandalay area. Where railroad links are not available and truckshave to be seed for long haulls to defirit areas; transportation costs in-crease to more than double the rail rates. In the deficit areas like Musein the Shan State, for example, a further K 173/ton (58 npercent) has to
be added as transport and handling charges from Mandalay.
1/ See Table 8. Although the figures apply to rice originating fromWakema (Lower Burma), the range of procurement costs could be betweenK 461 and K 555/ton depending on location. (This range is obtainedby assuming half or double the asterisked cost items in Table 8).

ANNEX 1Page 7
17. Processing. The number of rice mills currently operating inBurma is 801 (Table 10), down from the 1,293 estimated to be operating in1964. The government owns only 43 of these mills, and private mills areemployed by both TC-1 and the cooperatives to mill their rice. These millsare paid K 20 to mill 100 baskets of paddy, from which they are expected.to obtain an average nrofit margin of 5 percent. Small private mills(averaging 2-10 tons/day) are also licensed to process the paddy which farmers retain for their own cons--ption. The average age oi rice mills inBurma is between 25-30 years, and most of them are in need of modernizationThe inadenuacy of milling equipment can. be an important; factor af'ecting tnout-turn of rice from paddy. Only 19 mills are capable of milling highuIsality export rice, and even these have inadequate cleaning and separation
equipment and virtually no rice classification and blending equipment.Therefore, the little high1 quallty r,ce now produced does not nave tneuniformity and freedom from foreign matter required to command premiumprices in the- world .marke -_ts -.
18. Ever if the spare parts problems are resolved, there will belittle incentive to modernize the mills if the shortage of surpluses formilling continue, and on average, only 60 percent of total milling capacityis presently being used. Furthermore, the recent price increases stipulateonly or.e price for eachl pady type, anud there is no longer a scnedule ofprices for 1st, 2nd and ordinary grades (Table 11). There will thereforebe less incentive for producers to sell the Detter grades to the government,
19. Exportable Surplus and Consumption. Tne exportable surplus situa-tion for rice in Burma is discouraging. The peak export was about 3 milliortons of rice ar.d rice products berore the war, but the closest Burma hasever approached that figure since was in 1960 and 1962, when nearly 2 mil-lion tons were exported. Since then exports have dropped as low as 350,000tons in 1968/69. Over the last two years, the government made efforts torecover sume of the lost markets and rice exports increased to about 700,OOCtons. In 1971 the Trade Ministry in its zeal to increase exports, over-estiLmated the 1972 surplus and over contracted for 200,000 tons of ricewhich it has since been unable to deliver. The basic cause of the "blackmarket'" problem. appears to be one of net availabiiity, in terms of amounts,timing and consumer preferences. 1/ In terms of the amounts, an analysisof the trends shows, production has been increasing at about 2.0 percentannually in the past decade. Domestic rice consumption has been growingat an average rare of 3.2 percent to the present estimated level of about4 million tons (Table 12). Population growth, estimated at 2.2 percent,would seem to account for most of this demand growth, and although national
1/ "Black market" in the rice context is taken to mean an appreciabledepsrture by free mar-.ket. prices fro.. priLces fixed for go-vernLi-ient stores

ANNEX 1Page 8
per capita incomes have been declining slightly, per capita consumption,shows an average rate of increase of 1 percent annually. 1/
20. With respect to timing, because the bulk of harvested paddy isdelivered from January-April, the inventory policy for paddy and rice becomesimportant. Due to poor stock management and problems in distribution, short-ages were experienced (by numerous Consumer Cooperatives and Peoples Stores)in deficit areas for certain months 2/ in 1971 and again in 1972, at whichtime they were unable to supply the monthly rations to their members. Thefree market prices in 1971 and 1972 were appreciably higher than the officialprices (Table 13). Despite the equally good production of paddy in the 1972crop, therefore, as compared with the bumper crop of 1971, government pro-curement actually fel'l (Table 9) because of the existing incentives to sellon the free market and the increased speculative activitv among producers.The government responded by raising paddy prices in December 1972, and inFebruary 1973 prohibited the direct sale of rice (two baskets were tempora-rilv allowed) outside producers' own townships. 3/ By February, the procure-ment rate was still no higher than the previous year, despite additionalincentives in the form of a larger quota of consumer goods which could bebought in the cooperative buying centers). Moreover, free market pricesremained significantly higher than official prices, and it is still a matterof conjecture 4/ whether the prohibition of outside towinship sales will helprevise this situation.
1/ The growth of per capita rice consumption has been mainly in the largercities and in Upper Burma. In 1964, when the price of rice was standard-ized for the whole country (and even lowered from K 0.73 to K 0.59/pyi)per caDita consumption in rice deficit areas, especially in the hills(Shan and Kayah States), increased sharply. National average consumpt-ion rose from about 290 lbs to 315 lbs per capita. Government salesto thiese two states have more than doubled since. Increased per capitaconsumption among Upper Burma farmers (especially those growing oil-seeds) has also partly been due to a sharp cutback of imports in 1965.which has made other foodstuffs less available. Relatively lowerprices in deficit areas since 1964, in addition to encouraging the shiftto rice by non--rice eaters, also encouraged normal consumers of inferiorrice (e.g. in Magwe and Pakokku) to consume better quality rice.
2/ Particularly in the months.before monsoon harvest (June-August) andalso through the early harvesting season (September-October).
3/ This provision had hitherto provided a "legal" guise for moving riceinto the black market.
4/ Mission field trips to the Pegu-Prome areas found no increase inprocurement as a result of this new ruling.

ANNEX I
Page 9
Issues and Prospects
21. The problems and prospects for the rice industry in Burma thusrevolve around two basic issues:
(a) can Burma increase the exportable surplus of rice; and
(b) what are the appropriate pricing and marketing policyalternatives which can be used to bring this about?
22. Prospects for Increasing Exportable Supplies. If the foregoinganalysis is accurate, what can be done to bring about significant improve-ments? The recent price increase is probably a positive factor -- it mayinduce some farms in the delta to increase transplanting or move intomarginal areas. But additional fundamental changes will have to take place.The more important of which include: (i) the adaptation of known and/orthe development of new high-yielding varieties suitable to consumer tastepreference and growing conditions in Burma; (ii) increased input use, par-ticularly of fertilizers; (iii) investment in irrigation, embankment, drain-age and flood protection works; (iv) improvements in marketing and pricingpolicies; and (v) intensive institutional development.
23. Among the things which might be taken up immediately, it seemsclear there is need for a much more serious and well-supported effort todevelop and introduce new varieties which are particularly suited to Burmeseconditions and are responsible to fertilizer treatment. As discussed above,this involves consumer taste preferences as well as growing conditions. Forexample, from the standpoint of taste IR-5 seems reasonably acceptable toconsumers in Lower Burma, but much less so in Upper Burma. Fortunately, alarge backlog of alternatives has been developed outside Burma which can bedrawn upon. To illustrate. IR-20 has recently been introduced under monsoonconditions in neighboring Bangladesh, and by the 1972/73 growing season morethan two million acres were devoted to this variety. The prospects are thatyields of IR-20 in Bangladesh are comparable to the best yields of IR-5 inLower Burma, but this is only one of many new varieties which could betested. Since there seems to be considerable land (in both Lower and UpperBurma) where water conditions will permit use of the high-yielding varieties,their rapid introduction in conjunction with fertilizer supplies and plantprotection measures offers the most ready means to realize rapid expansionin paddy output. But a much higher priority, accompanied by adequatefinancial support, must be given to adantive research on high-vieldingvarieties. This should include both efforts to improve traditional Burmesevarieties and a more vigorous testing; and crossing with, well-suitedvarieties being developed in other parts of the paddy-growing areas in Asia.
24. Increased use of inputs, particularly fertilizer, is largelyrelate the ndtn of the high-yielding varieties, The mission was
unable to assess the state of knowledge with respect to fertilizer needs,but availa1ble1 e4Aine. -uggests th a t the re-onnse generally is not suffi-
ciently attractive to farmers, particularly when used with traditional

ANNEX IPage 10
varieties. Greater emphasis on fertilizer trials, to determine physicalresponse and economic advantages under different conditions, couid producemore answers than are now available to planners, and could pinpoint thoseapplications which have significant production and financial impact. Fur-thermore, consideration might be given to launching a package program com-bining high-yielding seed, fertilizer, plant protection and credit to spreadknown and tested technologies.
25. Embankments to protect against flooding and salt water incursion,drainage and pump irLigation can all open new opportunities in the delta.Whether through improving yields (or reducing losses) of traditionalvarieties or enabling water control so that high-yielding varieties can beintroduced, these investments also offer means for expanding paddy produc-tion. The possibility of using pump irrigation for a paddy crop during thewinter months also seems worth serious exploration. If farmers had pumpsthey could grow either paddy or jute but with new varieties paddy may beeconomically more advantageous to the farmers than jute. An irrigatedwinter paddy crop (December through April) is not grown in Lower Burma,and available pump irrigation is now being used to promote jute (Marchthrough July). If determined to be technically feasible, the use of irri-gation for winter paddy would require reconsideration of present priorities.For Upper and Middle Burma, possibilities for groundwater development deservespecial attention since relatively little exploration has been carried out.
26. In light of the foregoing, maintaining an average annual export-able surplus of one to one and one-half million tons should be possible toachieve. Tightening consumption offers another way to generate the export-able surpluses to meet the targets, and the new retail pricing system forrice may very well provide some assistance in this direction.
27. Pricing and Marketing Policy. The effect of the recent increasein the price of paddy cannot be assessed until the marketing season is over.An historical analysis of the impact of past price increases on representa-tive farm budgets (see Table 14) shows the changing profitability situationfrom 1963 to the present. For the average paddy farmer who has no alterna-tive, paddy planting has just managed to become profitable again. One maytherefore see some incentive for him to plant a greater proportion of thefarm to paddy, and perhaps practice more transplanting. However, unlessprices are increased by about 38 nercent. 1/ to K 5.86lbasket (K 285Iton).the price mechanism cannot be counted on as a vehicle to encourage fertili-7pr appllcitinn to increase averape yields= One shonld still rplv thprefore
on a technological breakthrough in high-yielding varieties and/or improvedwater contrnl. RpBidep the incre2sed cst to the. rnncnumer, a price incrp2Qe
of this size would be disadvantageous to Burma's competitive position in
1/ This is the extent price for Ngasein will have to rise in order toincrease its incremental profit/cost ratio from fertilizer applicationto 1.7:1, the present level for IR-5 (see Table 7).

AI±T L'&TVA I
Page 11
exports, since tne FOB cost corresponding to this price increase would beK 641 or US$128 per ton. 1/ The matter of domestic price increases there-fore requires furtner aetallea assessment oI tne impact or tne increasewhich has been recently made.
28. The government's policy and effectiveness with respect to storageand marketing requires reexamination. The procurement and distribution ofrice for the nation as a whole involves careful planning and coordinationat all levels. Shipping rice from the surplus areas of Pegu or Irrawaddydivisions to the deficit areas in Upper Burma which must be completed beforethe onset of monsoon rains, involves high transportation costs and this mayprove to be a more expensive policy than, for example, giving rice growersin the deficit areas additional price incentives which would cost less thanthe transport. There may xell be extra savings for the government in thisapproach, since the rice mills in Mandalay, Sagaing and Magwe (Table 10) arethe most underutilized with only about 20 percent of capacity currentlybeing used.
29. As noted earlier, the new maximum retail price for Ngasein ricein Rangoon is K 1.40/pyi (K 672/ton). Allowing for the 10 percent marginpermitted consumer cooperatives, the corresponding wholesale price is K 1.26/pyi (K 591/ton). The average cost of procuring, milling and deliveringNgasein rice to Rangoon warehouses is estimated to be about K 1.05/pyi (K 504/ton). Excessive margins seem,to be built into this level for wholesaleprices, even if part of this margin is meant to cover inventory costs.The adequacy and location of storage facilities in relation to key consumerareas, mills and transportation points should be fully assessed and thetiming of flows better coordinated. The switch to the cooperatives in thisregard could prove premature unless fully committed and experienced personnelare available to run the operation.
30. Government trade authorities have argued that because of thedifficulty in accumulating export surpluses and given the top priorityassigned to domestic consumption, Burma need not make a conscious effortto seek out new markets. Besides, traditional buyers are expected toretain their trade ties with Burma. This seems unduly pessimistic. Thepolicy of making forward contracts for export sales well before a reasonableassessment of prospective surpluses made sense in a declining world ricemarket, but with a strong market for rice in prospect, good market intelli-gence to assess future price trends and availability of markets is required.This type of market intelligence has not been available. To cover a widerange of export commodities, the Ministry of Trade has only a fledgling
1/ Burma's average f.o.b. export price for Ngasein SMS 35 percent in 1971and 1972 was K 402.70. Thailands fob cost for 15 percent quality isestimated to be only US$112 or $ 2,325 per metric ton (C.F. AgriculturalSector Survey of Thailand, May 1, 1972).

ANNEX IPage 12
marketing intelligence unit, and this needs to be expanded. Closer coordi-nation among the agencies responsible for forecasting domestic surpluses,the market intelligence unit and the trade negotiators may have preventedBurma's failure to benefit from the present high world prices for rice.
31. Conclusion and Recommendations. The area devoted to rice and theproductivity of these rice lands have been essentially unchanged in thepast decade. Nevertheless, there remain substantial opportunities for riceexports. There is still some scope for the introduction of known improvedvarieties where water and soil conditions permit. The launching of a muchmore vigorous nrogram of testing and introduction of high-yielding varieties,together with making available complementary inputs, affords a real oppor-tunitv for raisina nroduction in the shortest period of time. The next mostpromising possibilities for increased paddy output lie in more extensiveemhankments to nrotect against severe flooding and salt water intrusion.supplemental pump irrigation for second crops, better drainage and bettercltltivatron praetire-. (i-. a larger nortion of the naddv area beingtransplanted) on lands already devoted to paddy cultivation.
32. In connection with all these, the importance of supporting researchcnnnnt be nueremphasized. With such a program, accompanied by appropriatepricing and marketing policies, it should be possible to reach and maintainexport surpl sea in the range nf i*nwaird of one million tons for some timeto come. The price of paddy, which had hitherto been kept rather low,
-"41.. t et^w nviTtrnfihi1itv nZl tha 4 allf-t.Anrp nf fnimilipa tn invpct
in inputs on the crop. The recent increase in paddy price may help torestore some of the incentive, ut h riin,uino cnnern for the farmers'
relative position in the economy is a necessary part of any policy designedto inr.c:e productiorn.
33. The 4e-4f pumpirr,ig4
ato for th-e prouAc-4un -f 1V-IYU 14tie IR-5
is currently not as attractive as using it for growing jute. With theprojected decline of Jute prices (ab-1t 22 percen.t wthin the next threeyears), 1/ only slight declines anticipated for rice prices and given feas-,ibl i s-to- 2| the mo-pet""tve positdon may- well be reversedAX.LU± Y.LU.±U nooUIULAVL0U, ±Lf L.L&= U.LL4.~L.JLV= 1v0.5L. .L%JL LUCy W~_LJ. IJW. V&L0%.A
(Table 15). From the point of view di the farmers' investment in the pumps,they will not lose should the comipetiLive position change. It is thereforeimperative to increase the momentum of research in developing higher yield-ing varieties. T'ne provision of equipment and improveu-ent In tLe infrLstruc-ture will not be enough. To realize the yield potential of improvedvarieties, the provision of adequate inputs and credit will have to bebacked by advice on new technologies and water management; production creditshould be available; the procurement, distribution and storage system, mustbe made capable of performing its rolte, and the complex system of pricingpolicies (for outputs and inputs, including consumption goods) must be madeconsistent with the achievement of prbduction goals.
1/ IBRD, Trade Policies and Export Projections Division projections.
2/ That HYV paddy and jute would reach 70 baskets/acre and 250/viss/acrerespect'ively.

ANNEX I
RICE
Table No.
1 Paddy Areas in Lower Burma (1969/70-1971/72)
2 Rice Land: Capability and Current Utilization
3 Size and Distribution of Rice Farnms, 1971
4 Sown Area of Paddy High Yielding Varieties
5 Paddy Yields of High Yielding Varieties
6 Utilization of Chemical Fertilizers by Crop
7 Fertilizer Response, Incremental Profit/Cost Ratiosin Lower Burma. 1973
8 The Cost of Rice (Ngasein SMS 35). February 1973
9 Governient Procurement and Sales of Rice
10 Number and Capacity of Operating Rice Mills
11 Procurement Price for Paddy, by Group and rWades
12 Production and Apparent Utilization of Paddv and Rice
13 Retail Prices in Rangoon of Selected Controlled Commodirties
114 Estimated Rate of Return to Paddy Famer
15 Cost and Return for Rice and Jute in T>wer Bh,uma


MTPNY T
Table 1: PAnfLY AIRS IN LOWER. BTJRMA (1969/70-1971/72)Transplanted and Broadcast
1969/70 1970/71 1971/72
Sown Area T B Sown Area T B Sown Area T B000 acres IJuv acres o u'v5u acres %
Pegu 2,300 76 24 2,290 74 26 2,269 74 26
Rangoon 1,263 35 65 1,263 35 65 1,269 36 64
Tenasserim I 636 52 48 636 56 44 631 54 46
Tenasserim II 197 4 96 196 496 195 595
Irrawaddy 3,193 72 28 3,198 73 27 3,186 73 27
Arakan 801 27 73 800 25 75 807 27 73
Lower Burma 8.389 60 40 8,383 60 40 8,357 60 Lo
Kawthoolei 434 96 4 435 96 4 433 96 4
T= TransplantedB= Broadcast
Source: Settlement and Land Records, Ministry of Agriculture.

ANNEX I
Table 2: RICE LAND: CAPABILITY AND CURRENT UTILIZATION%(rrt0 A cres)
1/ 2/ 2//
Division/State Area Suitable- Sown Area-/ Irrigated Area-. Rice Land3 Utilization %
Sagaing 1,095 1,150 398 1,094 100
Mandalay 1,303 670 466 5421 42
Magwe 663 410 188 361 54
Pegu 4,369 3,563 67 3,561 82
Tenasserim 1,407 867 24 867 62
Irrawaddy 3,431 3,237 36 3,234 94
Anakan 1,217 807 4 807 66
Kachin 255 268 133 268 110
Shan 799 742 356 719 90
Kawthoolei 737 458 25 457 62
Chin 101 76 97 76 75
Kayah 92 46 21 46 50
TOTAL 15,468 12,294 1,815 12,031 78
1/ Data obtained from the Regional Soil Survey results of the Land Use Bureau. Inthi4s s --v ey te hsol msap i 1 M to 1 4 v 41I e ,arS voil 4ir is .. at.fI densityof 1 test pit in every 16 square miles.
2, 1971 Crop Vear3/ Sown area less irrigated area sown more than once
Source: Report to the People 1972/73; Land Use Division,.Agricultural Corporationar-' 'r'"ssion estimates.

ANNEX I
Table 3: STZE LNn DATThPIBTTTIPN OF PTi' W APW 19071
No. of Farm % of % ofFamilies Area Pice Farmso" Pad-y Land
(p000) ('000 Acres)
Paddy Land: /
Under 2.0 acres 485.7 638 25.3 5.2
2.0 - 4.9 acres 532.8 1,844 27.7 15.0
5.0 - 9.9 acres 547.7 3,966 28.5 32.2
10.0 - 19.9 acres 287.7 3,992 15.0 32.4
20.0 - 49.9 acres 66.5 1,776 3.5 14.4
50.0 - 99.9 acres 1.3 83 - 0.7
100 acres and above n.s. 10 - 0.1
Total 1,921.7 12,309 100.0 100.0
Paddy planted as a mono crop
2/ n.s. = less than 500,000
Source: Settlements and Land Records Department

ANNEX I
Table 4: SOWN AREA OF PADDY HIGH YIELDING VARIETIES
Crop Year Ending 1/June 30 19685. 1969 1970 1971 1972 1973 -
UPPer BUrma
IR - 8 3 236 163 7 6 5
IR - 5 -- 5 158 76 49C4 - 63 - - 35 63Ngwetoe - - 2 3 9
Subtotal 3 236 168 167 120 126
Lower BurmaIR - 8 5 175 151 17 5 3IR - 5 -- 7 265 283 317C4 - 63 - - 27 30
Ngwetoe _ - 24 40 33 29
Subtotal 5 175 182 322 348 379
StatesIR - 8 - 2 5 1 1 1IR - 5 -_ 4 6 4CL - 63 -. - 1 1
Ngwetoe _ ___ ___ __
Subtotal - 2 5 5 8 6
Union TotalTR - 8 8 L12 319 25 12 9IR - 5 _ 12 427 365 370r;l - 63 - - - 62 94Ngwetoe -- 24 42 35 38
Total 8 412 355 494 474 511
1 / D 1 * m; nor V mn n*
* ^UrCe+ Seteet ar.d La.dv~ ReCOrdSc~ flyePartRe.

ANNEX I
Table 5: PADDY YIELDS OF HIGH YIELDING VARIETIES(baskets/acre)
Crop Year EnAding Actual! EstimatedJ.Thne 3 1972 1973 Potential
,Manrin I n
IR - 8 49 44 n.a.IR- 6 1 35 73C4 - 63 49 42 69
Rangoon-> - ,5 5 0
C4 -63 49 47 71
IR - 5 57 55 68NSg-we I,o e 5a48 n.aE.
1-R - §67 61 72
Ngwetoe 55 48 n.a.
Arakanlri r- 5rnIRA - 5_ 6)
Union Totuai.IR - 8 58 51 n.a.IR- Do. - n.a.C4 - 63 46 43 n.a.Ngwetoe 48 46 n.a.
j Based on averages at experimental station 1y9u7/7.
Basket - 46 lbs
Source: Settlements and Land Records Department

AUM'KnV T
Table 6: -TuTIiTl6ATION OF Ur<iPi C rrlILLZL BY CR
-- ~~( t000 tons)
Year Paday Jute Cotton Sugarcane Groundunlw uts Others TotaL
1963 l5.0 1.3 - 2.3 - 2.5 21.11964 15.0 1.1 2.3 1.0 3.2 22.61965 1.0 1.0 - 2.5 3.0 4.0 31.51966 17.3 1.1 - 5.5 4.0 6.0 33.91967 12.2 1.0 1.0 4.0 1.3 6.3 2_).1968 17.0 1.0 2.0 3.0 3.3 11.0 37.31969 57.0 1.4 1.4 4.1 3.4 6.0 73.31970 36.0 1.0 7.1 5.3 3.4 7.4 60.21971 23.3 1.9 8.4 4.2 2.4 8.0 48.21972 47.1 7.1 4.5 7.7 10.8 22.5 99.7
Source: Agricultural Statistics and Report to the People.

ANNEX I
Tb 7; rFiIaL.L.L~j~jL1 £Z R, INCRUENTAL rUOFL/UCOST RATIUbIN LOWER BURMA, 1972
T0 Gn- I 'Sugar- Ground-Paddy IR -5 C4 - 63 Jute Cane Nut
Fertilizer Rate(lb/acre)
Urea 87 14 119 82 211 130
T. Super .124 43 87 119
MLirint.o '178 '75 _ _ 110
Cost of Fertilizer peracre (kyats) 25.5 63.4 59.1 25.4 60.5 64.2
Responses(lb/acre) 520 1,890 1,380 400 8.2 tons 757
Value of Responses(rJats J 4u i714 138 184 328 242
£ ncrementadJ Prof it peracre (kyats) 24 111 79 159 208 178
Incremental Profit/cost 1.0 1.7 1.3 6.2 4.4 2.8
Source: Agricultural Corporation and Mission Estimates.

ANNEX I
Table 8: THE COST OF RICE (NGASEIN SMS 35%), FEBRUARY 1973
(Kyats)
Internal Sales Export Sales
Unit Co-ops TCI 1972/73 1971/72
Paddy Purchasing Price 4,600 lbs. 425.00 425.00 425.00 358.oo
Commission Charges - 15.00 15.00 -
Handling, Storage andTransnort+ 20.00 20.00 20.00 20.00
Millino harges r c20 nn 20.nn 200nn 20=OQ)
P::add-r P-r-ir (in -{iti n;nemilling) " 465.00 480.00 480.00 398.00
Rice price equivalent ton 359-45 371.05 371.05 250.74Storage and losses " 7 -'. 25 = t- 2Packing & materials 40.00 40.00 40.00 40.00Ta-Kes & Inspnetion " 19=00 19=00 19=00 19=00
Cost+ of Rico (a-mill) " 423.70 435.30 )3- 2C4 .6II)
*P. & va",aa.'ir rin o 25.0 25.0 2. 2 rLoading & Unloading
Freight to Rangoon * 19.00 19.00 19.00 19.0G
to Warehouse 20.00 20.00 15.00 15.0c;
Price at Warehouse 492.78 504.38 499.38 378-3,
Transp. & Handling to Port "- - 15.00 15.00T -..3J1- fI...--4.ft-s rrf%^ l
LoaD rr Costs 9 - 3no 390.3
* Items which would vary depending on location of production, buying centers,mills, etc. Data used here are for Wakema (Lower Burma).
Source: TCI, Cooperatives Directorate and Mission Estimates.

ANNEX I
Table 9: GOVERNMENT PROCUREMENT AND SALES OF RICE
1967/68 1968,69 1969Z70 1970/71 l971/72
Sagaing, Mandalay and Procurement 100 252 222 193 121
Kachin State Sales 1,563 644 668 652 613
NetProcurement -1,4f3 -392 -446 -459 -492
Shan and Kayah States Procurement 1 1 1 n.s. n.s.
Sales 56 75 79 _ lg 99NetProcurement -5 -74 -78 -119 -99
Pegu and Arakan Procurement 6oO6 829 806 823 6&4
Sales 55 57 60 78 56
NetProcurement 551 772 746 745 628
Tenasserim and _ Procurement 95 78 95 91 57
KawthooLeJ Sales 74 108 94 96 7B
NetProcurement 21 -30 -1 -5 -21
Irrawaddy Procurement 579 662 726 705 514
Sales 24 19 10 21 15
NetProcurement 555. 643 716 684 499
Ranaoon Procurement 18 9 13 17 8
Sales 183 198 192 196 203
NetProcurement -165 -189 -180 -368 -195
Government Depart- Procurement - - - - -
ments Sales 35 39 41 46 46
TOTAL Procurement 1,398 1,831 1,862 1,828 1,384
Sales 12989 1,140 1,144 1,207 1,109
NetProcurement -591 691 718 621 275
Source. Adapted fro.m. data provided by T-radAe Corporation 1.

; .W (~ ,,.iT..IY OF' OPF'TINTG HIC§S MJ13
CapacityNo, -:J. ce I Gr'aI Gra y sGra r Total No. Total-Y UtilizationC,o-DDPrivreT1A C--L of Mil.ls Caa c i, %
Rang,oon - 101 7 c 2 52; 108 1,45( 56
Irrawaddy 3 184 li :, 5 J 191 2,655 84
Pegu 2 6, 9 80 138 226 2,948 1
Ara"kan 2 21 o 2 - 27 29 390 73
Tenn.asserim 1 54 12 4L3 55 652 61
Ma3ndlaay 3' i 39 39 298 20
Sagaing 1 914 4 - 99 99 6413 38
Ma gwe 2 33 1 _ 36 36 236 16
Kachin State 1 17 i _ _! . 8 18 136 58
Total 12 7h8 31 lo 18IQ 53 801 9)43 60
1/ Eport rice up to super c,ua.LJtiees.
2/ Eport rice -up to Burma 15% qualities.
E/ Expcrt qualitie's of 35% and for local consumptinn qu31ities.
4/ TonS/ 8 hours
Source: T.C. 1]

ANNEX I
Table 11: PROCUREKENT PRICE FOR PADDY, BY GROUP AND GRADES(kiats per basket)
1968 - 1972 1973
EMAkTA GROUP
Premium 2nd Grade 398 ) 448Premi,um IL su Gr.Lade 408
7KTf-,A C=1T1T t.prATTm
Ordinary 358 )Prreri-Lulm 2'_nd'u Gr-ade '373 ) 425Premium 1st Grade 378 )
GLUTINOUS RICEOrdinary 348 )Premium 2nd Grade 358 ) 413Premium ist Grade 378
NGAKYIWE GROUPOrdinary 433 )Premium 2nd Grade 448 j 514Premium 1st Grade 458 )
MEhDONE GROUPOrdinary 373 )Premium 2nd Grade 388 ? 442Premium 1st Grade 393 )
Source: Trade Corporation 1.

Table 12: PRODUCTION 2`D TPAPAEWT IJTILIZATION CF PAMMY APIP RIHU(I'000 tons)
19634 1 !2 j 1 6 ',55,/66 1 967/68 196 / 19 1970/7 1 1 1971/7Faddy
1. Production 7,660 8,373 7,928 IS,532 7,647 7, 896 7,859 8,033 8,0482. Wastage 153 167 159 130 153 158 157 161 1613. Net Product:ion (:1-2) 7,507 8,206 7,769 6S,402 7,494 7,738 7,702 7,872 7,8874. Seedling 285 280 278 275 280 277 278 278 2805. Inteynal UtJlization (3-4) 7,222 7,926 7,491 6,127 7,214 7,461 7,424 7,594 7,607
Rice
1. Production 4,537 4,854 4,588 3,828 4,536 4,663 4,639 4,746 4,7542. Wastage 45 49 46 38 45 47 46 47 L483. Net Prcduction (1-2) 4,492 4,80D5 4,5L42 3,790 4,491 4,616 4,593 .4,699 4,7064. Xcports j 1,44,5 1,176 989 624 335 345 527 639 5885. Available for doraestic use(3-4-5) 3,0471 3,629 3,553 3,166 4,156 4,271 4,066 .4,060 4,11.86. Changes in stock -231] +2D8 +8 -473 +419 +4.22 -+122 -1 -797. Internal consumption 3,178 3,421 3,545 3,639 3,737 3,849 3,944 4,061 4,197
Per capita consumption lbs 303 310 314 316 317 319 320 323 326
1/ Excludixig Rice Products
2/ Basket of 75 lbs
Source: PlanniAg Department and Mission Estimates.

ANNEX I
Table 13: RETAIL PRICES IN RANGOON OF SELECTED CONTROLLED COMMODITIES
Rice Wheat Men'sYFAR Ngakywe Ngasein Flour gar Longyi
C F C F C F C F C F
(Kyat/pyi- (Kvat/pyiT (Kyat/VissT 7Kyat/Viss} TKyat/Longyi`
1962 - 1006 - O.76 - 2.19 - 2.00 - -
1963 - i - 0.73 - 1.77 - 1.95 - 10.8"
oAI.1 - 0.87 - 0.59 - 1.99 1.91 - - 11.0(
1965 0.95 - 0.62 - 1 -51 1.90 2.14 10.20 16.'
1966 1.10 - 0.75 7 1,51 - 1 90 2.9Q 10.32 22.
1967 1.10 0 50 0.65 3.72 e151 395 .9Q 5.54 1 0n. 70
1968 1.10 2.06 0.65 1.38 1,50 5.59 2 10 6.17 11,30
.1 I~ A - 1 in C qcfl _ _i)--
15-69 '.O=.0.65 _ 15 5 21 |7 26 39
.6cf .0155.9 I fl J A7( 12 _
J.YU7 -~~- A UV_ n_
1970 1610 _ .65 - 1.50 473 2.10 5.74 1 3 6
1971 1.10 1.4 0 0.65: 0.92 1.o50 4.13 2.10 6.70 13.6i5 28.2)
1972 1.1W0 1.86 0.65 1.4 3 - 2.1 0 6.54 _-
Note: C = Controlled
F F Free Market
Source: Statistical Yearbook, 1971; and Sp-emen atr Dat a fro.. CrSD.

ANNEX I
Table 14: ESTIMATED RATE OF RETURN TO PADDY FARMER
1963 1966 1970 1973
Total Cost 1/ 80.80 81.80 85.80 85.80
Value of Fami-ly Labor 2/ 53.10 53.10 53.10 53.10
Yield (Baskets) 2/ 31.9 32.2 32.9 33.3
Price (K/Basket) 4/ 3.00 3.10 3.58 4.25
Total Revenue 95.70 99.82 117.78 141.53
Net Revenue 14.90 18.02 31.98 55.73
Rate of Return to familylabor 5/ 0.28 0.34 0.60 L05
l/ Family labor excluded
2/ At hirea .a.bor rate
3/ Actual rati.onial average yields
4/ Actual g.ua:ranteed orice to farrmers for Ngasein
2/ Net revŽiue - value of famrily labo.
Source: Agricultural Corporation and Mission Estimates

ANHEX I
Table 15: COST AND RETURNS FOR RICE AND JUTE IN LOWER BURMA
RicT n Irrigated JuteTraditional Improved Technology Present Future
(Present) (Present) (Future) 1/
Variable Costs 117.L0 173.90 182.20 192.50 243.50
Material costs 21.50 60.00 60.00 23.00 59.00
Labor costsHired 42.80 6o.80 69.10 114.0 129.00FTmi1V 53.10 53.10 53,10 55.5 55.50
Fixed Costs 21.50 38.50 38.50 38.5 38.50
Total costs (excluAinprfamily labor" 85.8 159.30 167.60 175.5 225c50
Yield 2/ 32.74 3/ 60.00 - 70.00 1/ 200.00 250.00 .
Price 4.45 4.45 4.36 5i 1.65 1.29
Total revenue 145.69 267.00 305.20 330.00 322.50
G-ross margin 28.30 93.10 123.00 137.5 79.0
Net revenue 59.89 107.70 137.60 154.5 96.0
Returns/unit family labor 1.13 2,03 2.59 2.78 1.73
1/ Projected for 1976
2/ 4o lb basket for paddy andviss for Jute
3/ Present average yield in Lower Burma
4/ Average 1972/73 yield for IR-5 in Lower Burma
5/ Projected 2% decline
6/ Projected 22% decline
Source: Agricultural Corporation and Mission Estimates


ANNEX 2Page 1
AGRICULTURAL CREDIT AND COOPERATIVES
1. Before World War II, agricultural credit was primarily in the handsof Chettyars (private money-lenders). They provided the bulk of the creditto rice cultivators, using the paddy land as security. With the sharplyfalling world prices of the depression era, the debt burden of the cultivatorsmounted to such an extent that the Chettyar rice holdings rose to between2-3 million acres (nearly half of the delta rice area). Since independencein 1947, most of the Chettyars have been driven from the country and privatemoney lending has been prohibited.
2. Until 1953; the iovernment advanced small loans to rural coonerativesfor on-lending to farmers; tiese were mostly seasonal loans, but to a smallextent medium-term lonna fnr rcttle nurchaqes were also aivanred- Where therewere no cooperatives, the Government advanced credit to the farmers throughvillage land coMm4 t t'-Pa Tho State Agricultural Bank (SAR) was set up in 1953with a share capital of K 50 million, and between 1953 and 1958 it providedcredit th.rouch the cooepratives and inritiated a np-narogr feor sei-tt-ing, Up Village
Banks. Ly 1958, financing through the cooperatives was stopped, after whichSABR channelled its funds oniy through the Vilincap RAnle- RAR w:c merapri intothe People's Bank (the country's only financial institution) in 1970, and
- responsibilities were han.ded over to the Aogricul_ur al Fitanc Divi s4
of the People's Bank (now Union of Burma Bank). From 1953-1970, SAB'ssource of funds was the government, but since 1970, loan. funds are fromthe Union Bank's own resources. Very little information is available onrepaym.e.n t pe r f o.. anvcn prio4 to 1960,bt it bel4 nieved that4 about 75 petrcnt
of the loans advanced annually were recovered. In 1960, and again in 1965,the governm.ent Ae ideA to write off most of the pre-1960 debts outst-a4dlnfrom the cultivators.
3. The only legal sources of agricultural credit in Burma now arethe Village Banks and the cooperatives, although sor.e credit, mainly in
kind, is extended by the Ministry of Agriculture through the AgriculturalConrpo.ratlo4an and the M-Ichanization* Departm.entf. All! these credit sources
cater almost exlusively to short term credit requirements and, altogether,i t tis esti.uated that --- -----verrh...ent prvi about .6 .p tm f th% e cul-
tivators' credit requirements.
Agricultural Credit Institutions
4. Village Banks. The village banks are administered through theAgricultural Finance u±visLon o'L the unio7n oi DUrria DBanfk kuiDj * Edach
village bank covers a village tract and is managed by a locally appointedcommittee. Lne banks nave no paia staff ana thei'r accounts are maintaineu
by branch offices of the URB. The number of village banks has increasedfrom 208 in 1955 to 1I,134 in 1972. Loans are advanced to village banksat 3 percent interest and the village banks on-lend to farmers at 9 percent.In addition, the village banks collect I percent from eacn borrower asa savings deposit. The funds of village banks are deposited in threedeposit accounts, (i) share capital deposits, (ii) a profits deposit account,

Page 2
ardLU %i.LLj a savings uepos'it account. *ItLe Union of Burma Bank pays outsmall amounts annually to each village bank to meet contingency expensesand for writing up accounts. Tne total amount to the credit of these accountsnow stands at K 96 million (Annex 2, Table 1).
5. Village banks lend only to a maximum of K 500 per season perfarmer for cultivation and harvesting and they finance only the short-termcredit requirements of the farmers. The scale of finance provided is basedon the recommendation of the Ministry of Agriculture and approved by theboard of the Union Bank and by the Ministry of Planning and Finance. Thescale of finance at present in force is as follows:
Credit Allotments
Kyats/acre Kyats/acre
Rice 25 Virginia tobacco 80Rice harvest 10 Chillies 50Cotton (long staple) 40 Jute 50Cotton (short staple) 20 Maize 20Potato 75 Beans and pulsesWheat 40 (decontrolled) 10Garlic 100 Beans and pulsesOnion 75 (controlled) 15Burmese tobacco 50 Groundnuts 50
Sesame 10
6. The amounts issued and recovered by te village banks during theyears 1964 to 1972 are presented in Annex 2, Table 2. Although about 90percent of the loans issued each year were recovered, very little of theoverdues for each year were collected in subsequent years. Given theconstraint that there was practically no security on loans (except thecrop 1/), this performance is commendable. Two measures have been used todiscourage defaults: (i) denial of future credit to defaulting farmersand (ii) imposition of a heavy penal interest charge of 1 percent per monthover and above the normal interest charges payable. These measures appearto have had only a marginal effect on the recovery performance of farmers.Accrued interest charges, unpaid at the end of 1970, amounted to K 31.6million.
?/ Under the Land Nationalization Act, since all land is vested in thegovernment, it has the power to dispossess the farmer of his land. Inpractice, not only would dispossession be an unpopular step (whateverthe reason), but implementing the dispossession would be very complicatedsince only the Ministry of Home Affairs has the power to do so. Thecultivators' farm implements and cattle are also protected by law againstattachment by the financing institution in satisfaction of claims.

ANNEX 2ri 3Prage 3
7. Since 1966-67, three types of production 'Loans have been issuedby village banks -- monsoon loans, harvest loans and winter loans. Monsoonloans are issued flo, May 1 to August 31 and harvest loans from November1 to December 31; the recovery period for both these loans is from January1 to April 15. Winter loans are issued from October 1 to December 31 andthe last date for recovery is May 15. Tne Union Bank makes an allotmentof the likely amount required and the branch offices are authorized tosanction the loans to farmers up to the alloted amounts. About 80 percentof village bank loans are slated for paddy production (Annex 2, Table 3).Since 1967, the share of total loans for wheat, pesingon (a pulse), Burmesetobacco, paddy and onions has declined. Cotton and other pulses (notablyBtawbutpe, Matpe and pegyi) have increased their claims on total loansissued. Monsoon loans in 1972 were distributed to farmers covering 3.6 mil-lion acres of paddy, and 235,000 acres of groundnuts (Annex 2, Table 4).
8. Other Sources of Credit. The Agricultural Corporation in theMinistry of Agriculture supplies farm inputs (seeds, fertilizersand pesticides) on both credit and a cash basis for certain planned cropslike jute, cotton, sugarcane and special paddy varieties. The value of in-put sales for credit is given below.
Value of Inputs Supplied on Credit(million Kyats)
Annual AmountInsecti- Recovery Under
Year Fertilizers Seeds cides Total Amount % Default
1968-69 32.1 2.6 0.9 35.6 19.3 54 16.31969-70 12.4 2.9 1.2 16.4 7.3 45 9.11970-71 9.7 4.2 1.2 15.0 4.6 31 10.41971-72 19.5 0.9 2.0 22.4 6.7 30 15.7
Source: Agricultural Corporation.
Defaults have been heavy, particularly in the last two years when the per-cer,;age reco-very 'as bee.. or.ly _30 percer.t. W41 th hese defaults usuallywritten off by the Corporation, annual losses in the last two years haveDeen about K 13 ,-IU.llior.. ±L'te Agricultural MLech.Caization Department (A),,
also in the Ministry of Agriculture, runs 88 tractor stations throughoutthe country, and undertakes ploughing at-LIU harrowin.g of fields for cultiva-ion
of special crops on a credit basis. The charges are K 18 per hour forploughing anu R 12 per hour for harrowing, recoverable at harvest. Of aboutK 6.0 million annually, on average only 66 percent have been recovered forthe past nine years (Annex 2, Table 5). Although AMD sells pumps tocooperatives and groups of farmers, no credit is provided by them except thatthey allow for a 50 percent do-wn paym,lent on the cost of the pumps initially,with the rest to be paid after the first harvest.
9. The Small Loans Division of UBB also provides loans for farmers(mainly for consumption purposes) through government pawnshops which were

1.ININA h
Page 4
r.ationalized ir, 1963. Tnterest rates of 2-3 percer.t per month are chargedeven with jewellery placed as collateral. No estimate of private moneylerdirg is available, but various reports suggest that farmers still relyon private money-lenders for at least 40 percent of their credit needs.These private mloney-lenders are mai'n'ly reLati-ves, other farmers or localtownship inhabitants. Although they charge rates which are higher than thegovernment pawnshops, they are often preferred since less red tape is in-volved and they need not disclose their wealth (e.g., jewellery) to thegovernm.len LI
10. Rural Cooperatives. Although cooperative societies have beenin existence in Burma since the turn of the century, they have so far playedonly a mn'nor role in the economic life of the people. From 1958, when theirrole in advancing credit to farmers was stopped, they have been engagedprimarily in the marketing of members' produce (agriculture and multiple-purpose cooperatives), distribution of consumer goods (consumer societies)and in special activities such as the operation of slaugtherhouses andf4shery development. Following a comprehensive plan (announced in May 1970)to be implemented by the Ministry of Cooperatives, the following categoriesof cooperatives have been set up as of December 1972:
Reorganized Newly Formed Total
Consumers 17 1,990 2,007Agricultural Producers 69 15 84Industrial Producers 19 516 535Savings and Credit 272 990 1 ,797Village Co-op 11,187 158 11,345Townshnip - 268 268Cooperatives and Group
Societies 5 _5 55
11,-664 3,992 15,656
Consunmer cooperatives and the agricultural and multi-purpose cooperativesin rural areas are now being reorganized as single-village cooperativesserving both consumners and producers. The agricultural producers' coop-eratives will be special-purpose societies which link the production,marketing and processing activities for commodities like forest productsand fisheries. Coc,perative group societies have recently been createdin Rangoon to act as wholesale rice agencies between procurement pointsand ultimate retail points. All cooperatives are expected to operate ontheir own funds and with funds borrowed from UBB. They are to be taxed atthe same rate as an individual or business income.
11. The administration of cooperatives is expected to follow a three-tier system, with the central cooperative on top and township cooperatives(wholesale outlets) affiliated to it which supervise the village cooperatives(retail otulets). The township cooperatives will, in addition, act aswholesalers for marketing village cooperatives' produce. In the case ofrice they will also undertake the milling of paddy purchased by the villagesocieties. Nominal loans to cooneratives have been made in the nast to
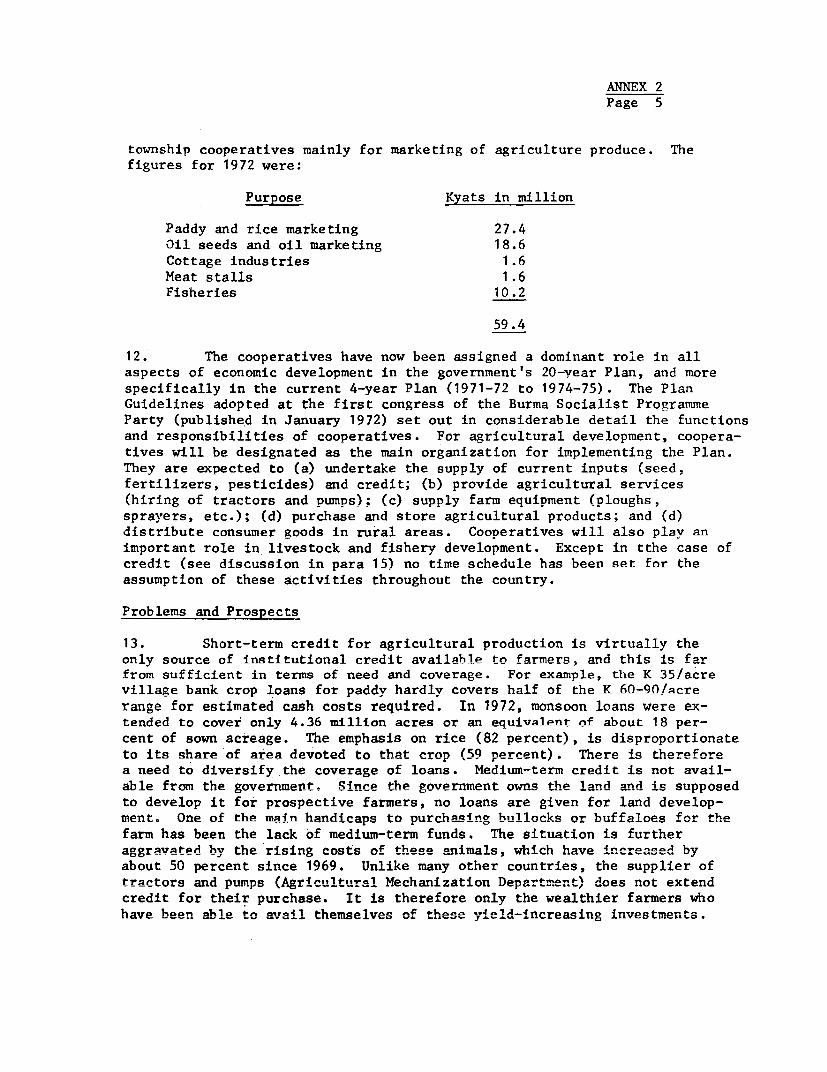
ANNEX 2Page 5
township cooperatives mainly for marketing of agriculture produce. Thefigures for 1972 were:
Purpose Kyats in million
Paddy and rice marketing 27.4Oil seeds and oil marketing 18.6Cottage industries 1.6Meat stalls 1.6Fisheries 10.2
59.4
12. The cooperatives have now been assigned a dominant role in allaspects of economic development in the government's 20-year Plan, and morespecifically in the current 4-year Plan (1971-72 to 1974-75). The PlanGuidelines adopted at the first congress of the Burma Socialist ProgranmeParty (published in January 1972) set out in considerable detail the functionsand responsibilities of cooperatives. For agricultural development, coopera-tives will be designated as the main organization for implementing the Plan.They are expected to (a) undertake the supply of current inputs (seed,fertilizers, pesticides) and credit; (b) provide agricultural services(hiring of tractors and pumps); (c) supply farm equipment (ploughs,sprayers, etc.); (d) purchase and store agricultural products; and (d)distribute consumer goods in rural areas. Cooperatives will also Dlay animportant role in livestock and fishery development. Except in tthe case ofcredit (see discussion in para 15) no time schedule has been set for theassumption of these activities throughout the country.
Problems and Prospects
13. Short-term credit for agricultural production is virtually theonly source of institutional credit available to farmers, and this is farfrom sufficient in terms of need and coverage. For example, the K 35/acrevillage bank crop loans for paddy hardly covers half of the K 60-90!acrerange for estimated cash costs required. In 1972, monsoon loans were ex-tended to cover only 4.36 million acres or an equivalent of about 18 per-cent of sown acreage. The emphasis on rice (82 percent), is disproportionateto its share of area devoted to that cronp (59 percent). There is thereforea need to diversify the coverage of loans. Medium-term credit is not avail-able from the government. Sin-e the government owns the land and is supposedto develop it for prospective farmers, no loans are given for land develop-ment. One of the main handiAnns to purch2sing bullocks or buffaloes for thefarm has been the lack of medium-term funds. The situation is furtheraggravated hv the rising -o-sts of these animals, which have increased byabout 50 percent since 1969. Unlike many other countries, the supplier oftractors and pumps (Agricultural Mechanization Department) does not extendcredit for their purchase. It is therefore only the wealthier farmers whohave been able to ava4l themselves of these yield-increasing invest-ments.

ANNEX 2Page 6
14. A viable system of agricultural credit which reaches a wide spectrum
of farmers is difficult to establish in any countrv. In Burma, achieving
such a system seems to be even more difficult given (a) the official pro-hibitiorn of private money lending whirh iould meet some of the credit needs
of farmers, 1/ and (b) additional impediments to the securing of agricultural
loans. 2/ Despite these constraints, viillage banks have been relatively
successful, especially in recovering their loans. Their success is mainly-due t-o -.. e we o,f local successful farrers as their lnan nerv4-ne agents.u L. u I…-
--- o
These agents are generally very effective in collecting from their fellowfarmers at harvest tIr4me. On the other hand, payment under the credit-for-
input schemes run by the Agricultural Corporation has been very poor, largely
bcu ofth gk414 a ity to reach these farmers at the rigoht
time. A successful credit system under Burmese conditions therefore appearsto require access 'o the crop ( 41, 4is t.he on.ly source of securit- for
loans), either directly or indirectly.
15. From April 1973, the cooperatives will initiate a system of
purchase to provide short-term. production credit to farmers without interest
charges. Although participation in this scheme is voluntary, farmers reallyhave no choice because the village bank system wI-ill be discontinued. Onlythe Agricultural Corporation will remain as an alternative source of institu-tional credit. hle tentative procedure for the advanced pay.ment scheme
stipulates that before planting begins, farmers are invited to enter into
a contract with th'e cooperatives on the ar.ount of harvest they w4ll deliver.The basis for calculating this amount will be historical production lessrequirements for tne Iarmers' own consumiLp tion (for AfoodJ arA
the contract is made, farmers get an initial advance equal to about K 25-30/acre, or a fixed percentage of t-he value of the contracted harvest. When
crops are about to mature, an amendment to the contract is made based on the
crop's actual performance and a forecast oc the final yield. The fanmersare then given their second and final installment, which represents thevalue of the yield forecast at the guaranteed price. If farmers honor their
contracts, the cooperatives will have had a reliable estimate of their pro-
curement for the year, and should be able to plan accordirngly. Anrother
benefit, in principle, is that the advance payment scheme should provide
more funds per acre for crop cultivation than did the crop loans -.der the
village banks system.
16. The implementation of this scheme throughout the country is fraughtwith numerous problems which raise doubts about the likelihood of its success.
The cooperatives will have to expand their field operations greatly to include
the two million farmers formerly benefitting from the village bank scheme.Even if this can be done, the scheme will require very close cooperation with
other government organizations, notably Agricultural Corporation and the
Settlements and Land Records Department. Since staff from these departments
have their own duties, one cannot expect more than token assistance at the
1/ Black market interest rates are therefore higher than they would
otherwise be if private lending were legalized.
2/ see footnote in para 6.
AINNEX 2
Page 7
field level. In addition, the pool of "technicians" originally provided byLor-Ler -Vil±lJage bankU perso,nel -will lUe "Lost I to the progrm.. Given tfflhe
enormity of the tavwx, and the amount of planning involved to implement thescheme successfully, it appears prematue to aUdopt it on a large scale,
particularly since it is geared to replace an existing and relatively success-ful system. Pilot basis trials in representatLve areas 'n the country would
seem a much more realistic approach. Furthermore, the repercussions of achange in tne creuit arrangements has importnit efLects on prLcLng policiesfor agricultural commodities, and especially rice, which needs to be examinedcarefully. Since t:he cooperaLives have to borrow from the Union Bank ofBurma to finance the advanced payment schieme, they intend to acquire theserepayment funds by increasing tne price at various levels after procurement.If the cooperatives' expected adva.ice payment of K 500 million is received,at 4 percent interest to TUBB, K 20 million will have to be added to the valuereceived from handling the (o.:op produced. Assuming paddy takes up itspresent share of 82 percent, the K 16 million added to a traditional procure-ment of 110 raillion baskets would imply a paddy price increase of K 0.18/basket, or a 4 percent increase on the present price. This would be thecost to consumers for subsidizing the credit of producers. Furthermore,since the advance payment can be used for non-productive purposes, thisscheme will probably be less effective in improving production comparedwith an alternative policy of, say, directly increasing the price to farmers.


ANNIM 2
m9I A &I9flfMwIa ^p UIIUM ITTTT AfII 'A1WYMXa JL .IJa 1z J"&L AAW
Year Ending SApital Saviflg8 Profits Villageep.30 Deost lDeposit; fl27 Totw Ba!E-1
1962 1Q76 3.01 7.13 11.9v
1963 0.144 1.o6 6 16 6. 66 0 2.10
1964 2.12 1.82 4. 7 8.604 1.0
1965 3.59 3.57 13.2 12 20.37 1*99
1966 0.214 1.90 8.70 10.8i, 8 59
1967 0.19 1.03 5.64 6.86 0o.94
1968 0.12 1.49 9.75 11.36 0.91
1n69 0.16 1.50 8.46 10.12 1.81
1970 0.15 1.60 7.77 9.52 2.15
1971 0.14 1.68 7.914 9.76 2.26
1972 0.20 1.49 7.24 8.93 3.34
Total 9ell 20.15 85e70L 1114.96 18099
1/ Payments made from profits deposits to village banks ror contiengencyexpenses and for maintenance of accounts.
Source: Agricultural Finance Division, UBB.

ANNEX 2
Table 2: VILLAGE BANKS - ADVANCES AND REPAyMENTS- (~~~~~~uL L."on Kyat6a
Year Ending Loans Re- Out- % Re- Cumulative! ..;, AUvcLAncl sCOvered stanOdin covery Outstanding
Old loans 19.6) 6. 124 3 L _.6 £ 132.0
9 _ ,,- ,~i no^0
I 10 - _
1966 i28.0 i(.0 21.0 83.6 20i.6
1967 112.7 97.4 -153 86.4 216.9
1968 106.1 97.2 8.9 91.6 225.8
1969 125.2 v 9.i 6.0 95.3 231.4
1970 146.4 133.0 13.4 90.8 243.4
1971 151.4 102.8 48.6 67.9 267.41/ 2/ ~~~1/
1972 151.0 25.2 125.s8 72.5 390.2
y Winter and Harvest Loans only.
i/ Inclusive of 1972 Monsoon Loans amounting to K116.2, which is notyet due for recovery.
Source: Agricultural Finance Division, UBB.

ANNEX 2
Table 3s VILLAGE BANK LOANS BY CROP(million Kyats)
Year Ending Percent of LoansSept. 30 1967 1968 1969 1970 1971 1972 1967 1972
Pad27 83.8R R89 103.1 122.7 12 1260iA R81. 79.R
Wheat 3.6 2.2 2.0 2.0 2.0 2.1 3X5 1.4
Pesingon 4.r ° J° 04 7 0.7 0A7 - 3.8 _
Cotton. 2.7 2.4 4.2 A.8 5.8 7.3 2.6
tobacco 3.2 3.0 3.4 3.6 4.1 4.2 3.2 2.7
Chillies 2.1 2.8 3.0 3.4 3.3 3.4 2.0 2.1
Onions 1.7 1.6 1.8 1.9 2.1 2.3 1.7 1.5
Others 1.9 4.7 6.9 7.3 8.6 12.6 1.8 8.0
Total 102.9 106.1 125.2 146.4 151.4 157.9 100.0 100.0
Source: Report to the People 1972/73.

Table 4: CROP AREA COVERED BY VILLAGE BANK LOANS
1971 Winter Loan 1972 Pre-Monsoon Loanl/ 1972 Monsoon LoanArea Area
('000 Acres) % ('000 Acres) % ('000 Acres) %
Paddy 17,0 390 13.8 4.5 3,577.2 82.0Wheat 85.3 14.8 - _ - _
Maize 25.3 4.4 - - 65.8 2.0Potatoes 5.7 1.0 7.2 - 2e3 0.2 n.s.
Onions 28.7 5.0 - - 2.9 n.s.
ChiLJies 27.7 5,0 - - 35.8Tobacco:Virginia 10.6 2.0 - -
Barmese 68.6 12.0 - - 0.8 n.s.
Puls e33
Matne 51.4 9.0 - - 2.3 -
Pedisein 13.2 2.3 - - 36.6 O 0Sultawri 10.9 2.0 - - 8.1 n.s.
Sultapya 13.3 2.3 - - 29.3 0.6Pe gi 19.5 3.3 - - 17.4 0,3Btawbutpe 2402 4.2 - - 49.7 1.1Gram 107.0 19.0 - - 0o4 n.s.
Sadawpe 32.8 6.0 - - - -
Pesigone - - - - 46.0 1.1
Sasame - - - 32.2 0.7
Groundnut - - - - 234.5 5.4Jute _ - 3.4 1.0 5.4 n.s.Cotton - - - -
Long staple - - 285.7 92.3 5.3nthar 31.8 5.4 - - 213,5 5O
Tntal 37.0 100.0 3Je0.1 100.0 40363.6 100.0
/ Excludes harvesting loans
Source: Report to the People, 1972/73.

ANNE 2
Table 5: SERVICES PROVIDED ON CREDIT BYAGRICULTURAL MECHANIZATION DEPARTMENT
l!^Ir !]djng t^-_.nohl ne arn Amnont ,AmiwontSept. 30 Harrowing Recovered Outstanding Recovery
1963 2029 1.71 0.58 75
1964 3.05 2.09 0.96 69
1965 5.24 2.36 2.88 45
1966 5a4l) 3.13 2.26 58
1967 6-S9 5.04 1.86 73
1968 7.*o 5.67 1.63 78
1969 6.07 6.10 1.98 75
1970 7.14 5 .22 1.92 73
157 i 6.63 3.33 3.30 50
Total J2.04 34.65 17.38 66
1/ At K18 per acre for ploughing and U2 per acre for harrowing
Source: Agricultural Mechanization Department

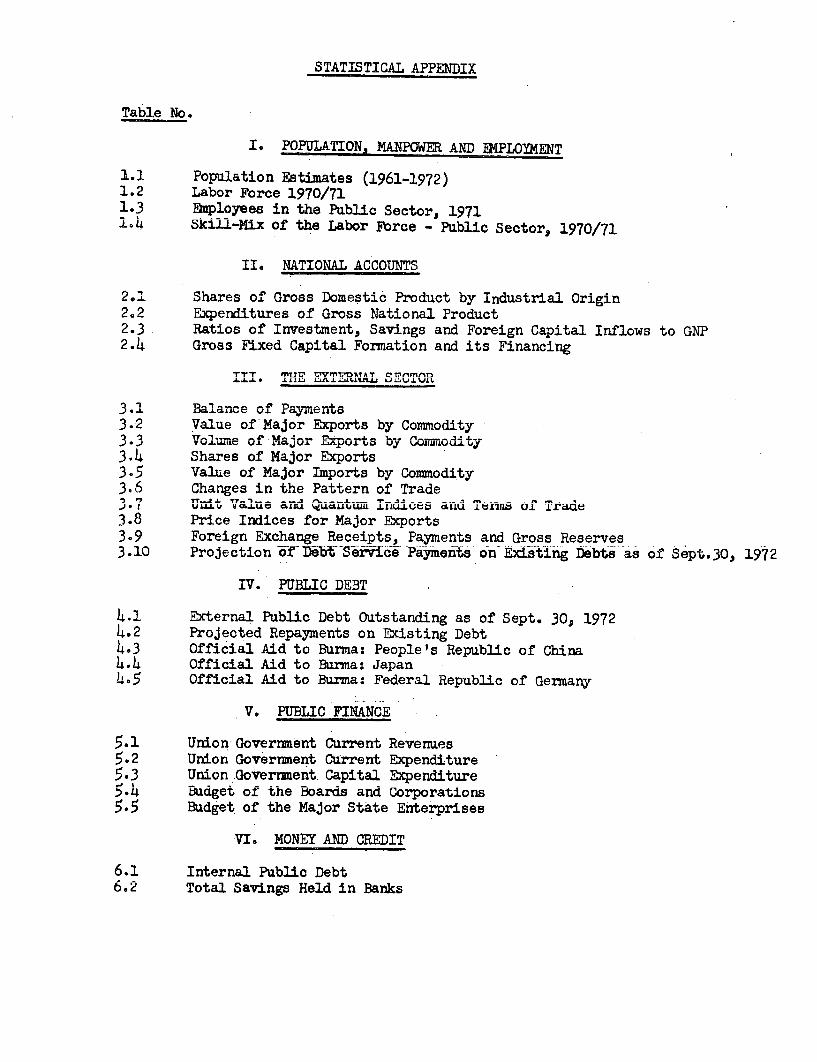
STATISTICAL APPENDIX
Table No.
I. POPULATION, MANPa4M AND EKPLOYENT
1.1 Population Estimates (1961-1972)1.2 Labor Force 1970/711.3 Employees in the Public Sector, 19711.4 SkilUl-Mix of the Labor Force - Public Sector, 1970/71
II. NATIONAL ACCOUNTS
2.1 Shares of Gross Domestic Product by Industrial Origin2,2 Expenditures of C-rss XTa4 ' -12.3 Ratios of Investment, Savings and Foreign Capital Inflows to GNP2.4 Grov8s Fixed Cap±tal Fom.ation and its Finan,ci
~W .L.L. A VC&I.~J..A1AW..r .L1.UIJJ LJ± I U L .LCL%.L
TTT *r ri.TL. V WP TAT IaJ InJ
s s*> x .nLJ. :,L A.w
3.2 Value of Major Exports by Commodity*. WV LW. U S L .~IJ V.LO.JU.L- Z£&y.kLJ- U U)' IJ4JIIUIVU.LU.
3.4 Shares of Major ExportsVCLALe V.L rCJ.jor .AUyV-II,Q Uy WLiUIULUUU± uy
3.6 Changes in the Pattern of Trade3.7 Unit Value adA Quanuwa Indices and Terms of Trade3.8 Price Indices for Major Exports3.9 Foreign EAcharge Receipts, Payments and Lross Reserves3.10 Projection ef DObt Ser-ice Payments on Existing Debts as of Sept.30, 1972
IV. PUBLIC DEBT
4.1 External Public Debt Outstanding as of Sept. 30, 19724.2- Projected Repayments on Existing Debt4.3 Official Aid to Burma: People's Republic of China4.4 Official Aid to Baurma: Japan4.5 Official Aid to Burma: Federal Republic of Germany
V. PUBLIC FINANCE
5.1 Union Government Current Revenues5.2 union Government Current Expenditure5.3 Union Government Capital Expenditure5.4 Budget of the Boards and Corporations5.5 Budget of the Major State Enterprises
VI. MONEY AND CREDIT
6.1 Internal Public Debt6.2 Total 'Savings Held in Banks
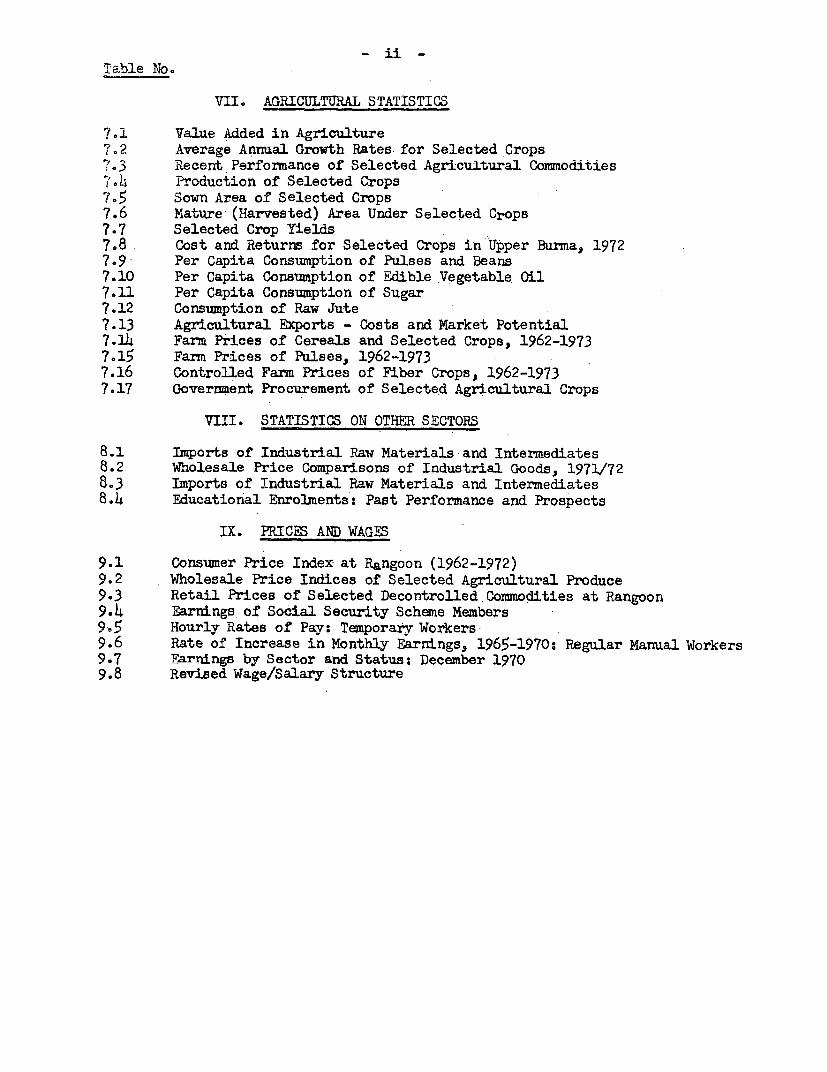
- ii -
Table iNo.
VII. AGRICULTURAL STATISTICS
7o1 Value Added in Agriculture7.2 Average Annual Growth Rates for Selected Crops
7.3 Recent Performance of Selected Agricultural Commoditiesi04 Production of Selected Crops7.5 Sown Area of Selected Crops7.6 Mature (Harvested) Area Under Selected Crops7.7 Selected Crop Yields7.8 Cost and Returns for Selected Crops in Upper Burma, 19727.9 Per Capita Consumption of Pulses and Beans7.10 Per Capita Consumption of Edible Vegetable Oil7.11 Per Capita Consumption of Sugar7.12 Consumption of Raw Jute7.13 Agricultural Exports - Costs and Market Potential7.114 Farm Prices of Cereals and Selected Crops, 1962-19737.15 Farm Prices of Pulses, 1962-19737.16 Controlled Fanm Prices of Fiber Crops, 1962-19737.17 Government Procurement of Selected Agricultural Crops
VIII. STATISTICS ON OTHER SECTORS
8.1 Imports of Industrial Raw Materials and Intermediates8.2 Wholesale Price Comparisons of Industrial Goods, 1971/728.3 Imports of Industrial Raw Materials and Intermediates8.4 Educational Enrolments: Past Performance and Prospects
IX. PRICES AND WAGES
9.1 Consumer Price Index at Rangoon (1962-1972)9.2 Wholesale Price Indices of Selected Agricultural Produce
9.3 Retail Prices of Selected Decontrolled. Commodities at Rangoon
9.4 Earnings of Social Security Scheme Members9-5 Hourlv Rates of Pay: Temporary Workers9.6 Rate of Increase in Monthly Earnings, 1965-1970: Regular Manual Workers
9.7 Farn4ngs by Sector and Status: December 19709.8 Revised Wage/Salary Structure

T//able 1.1: lo rTTqiTQ1T MT?"fPm (3f16 1072O
Year Total Population Anmnal Growth Rate
-I 61 22, 70 -
1964 24,4229 -3 2.1
196) 2h, 732 / 2.1
1966 25,246 ' 2.2
07>' 2(` I/ 2.2i96 25,811 o0 2.2
1968 r6,399 / 22z
1969 26,9g80 2.2.
1970 27,584 / 2.2
1971 28,,201 2.2
1972 28,874 / 2.4
Source: Report to the People, 1972/73.

T mable 1.2: T.BOR FRRCE 1970/71
(000)
Public Private
2ect:or Total Sector % Sector
Aagri rcul ture /7,272.7 66.6 64.1 6.0 7,208.6 73.2
Livestoc k and IFishery 3 147.5 1.3 4.5 0.4 143.0 1.5
Forestry K 118.1 1.1 78.9 7.3 39.2 0.4
Mining v-'27.0 0.2 25.2 2.3 1.8 0.0
Manufacturing .-762.8 7.0 81.5 7.6 681.3 6.9
Power -.,13. 8 0.1 13.8 1.3 - -
Construction .,-180.9 1.7 138.3 12.8 42.6 0.4
Transport andOnrimmnjctions 3?703 3.4 95-7 8.9 274.6 2.8
--ci ' erSvi-es -1 3 1.3 1l41l 13a 1 _ -
A-,4i.istration {,/335.2 3.1 335.2 31.1 - -
LTe-L d e - 7 7. 8 I 99.6 I92 877.7 8.9
kur'-ers n. i e. - - 576.3
Total l02923.2 100.0 1L078.1 100.0 9 845.1 100.0
Source: Report to the People, 1972/73

Table 1.3: EMPI~OYEES IN THE PUBLIC SECTOR: 1971
CertrAl LocalTotal Government States Bodies Corporations
SalaTied Staff 515,100 221,200 18,100 14,9600 261,300
Fixed Salary 26,000 2,700 100 200 22,900
Daily Wage 152,100 100 - 500 151,600
Seasonal Workers 14,200 - - - 14,200
Piece Work 63 800 - - - 63A800
7719200 224,,000 18,200 25,300 513,800
Source: Wage Covmnission Report, ?inistry of Finance

Table 1.4: SKILL--MIX OF THE LABOR FORICO7 - PUB3LIC SECTOR, 1970/71
Ratio ofUniv. and. Rati.o of'
University Diploma Skilled to
and I)iploma Semi- Graduates Semi - and
Gracluates Skilled Skilled Unskilled Part-Time Total to Total Unskilledc
Agri.culture,,Livestock, Fisheryand Forestry 4,9L4 24,328 17,883 92,504 123459 152,,088 1:31 14.5
Mining andManafact;uring 8,0751 21,152 47,074 47,890 7,506 131,673 1:16 1:4.5
Power, Construction,Transpor-t andCommluniLcations 11,486 4,559 17s551 108,076 84,861 2709533 1g24 1:2..6
Tracle 5,3154 45,846 40,703 19,079 - 110,982 1:21 11:1.3
Adninistratio n andSocial Services 51,226 218,298 6053 132 4_37 _ 4L8,14 1 10 1:1 .0
Total 81,031 3585183 2099264 399,986 104,826 1,153,290 1:14 ls1.7
Source: Report to the People, 1972/73.

Table 2.1: SHARES OF GROSS DOMESTIC PRODUCT BY INDUSTRIAL ORIGIN_____ Cat Constant 1969/70 Prices),
(In Percent)
Year Ending Sept. 30 1968 1969 1970 1971 |1972
Agriculture 28.2 27.7 27.2 27.5 ) \27.0 '
Livestock & Fishery 7.5 7.1 7.4 7.6 7.6
Forestry 2.9 2.8 2.6 2.7) 2.7
Mining 1.0 0.9 1.1 1.1 1.2
Manufacturing 10.8 10.6 10.7 10.6 10.6'
Construction 2.2 2.3 2.1 1.9 1.9-
Power 0.5 o.6 o.6 0.7 0.7'
Transportation 4.5 5.5 5.8 5.7 5.87
Commmnication 0.4 0.3 0.3 0.3 0.3(
Financial Institutions 1.5 1.3 1.1 1.2 1.3
Social & AdndnistrativeServices 7.1 8.0 8.2 b.0 8.1
Rental & Other Services 7.3 7.2 7.5 7.4 7.4
Trade 26.1 25.7 25.4 25.3 25.47
Total: 100.0 100.0 100.0 100.0 100.0
Source: Ministry of Finance & Planning
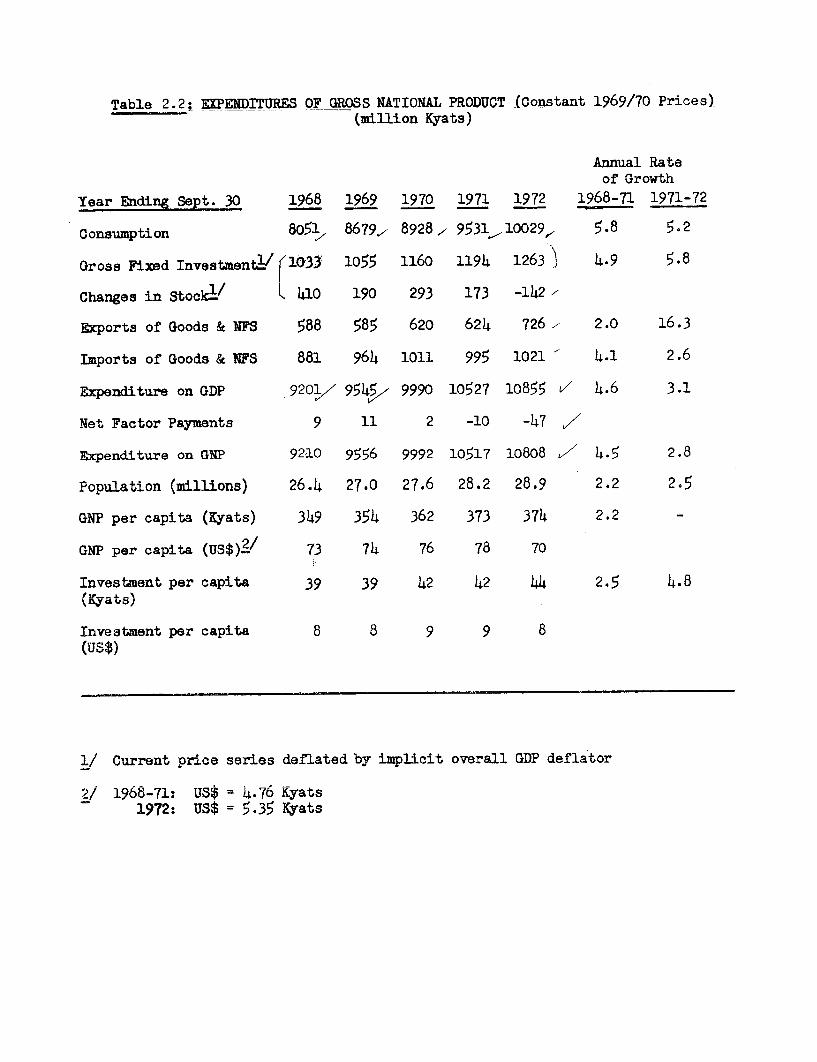
Table 2.2: EXPENDITIJRES OF GROSS NATIONAL PRODUCT (Constant 1969/70 Prices)(million Kyats)
Annual Rateof Growth
Year Ending Sept. 30 1968 1969 1970 1971 1972 1968-71 1971-72
ConsuLaption 8051. 8679, 8928k 9531,,10029,, 5.8
Gross Fixed Investment/ r1033 1055 1160 1194 1263 ) 4.9 5.8
Changes in Stock1c/ t 410 190 293 173 -142 ,
Exports of Goods & NFS 588 585 620 624 726 - 2.0 16.3
Imports of Goods & NFS 881 964 1011 995 1021 )4.1 2.6
Expenditure on GDP 9201 954z 9990 10527 10855 Vl 4.6 3.1
Net Factor Payments 9 11 2 -10 -)47
Expenditure on GNP 9210 9556 9992 10517 10808 4.5 2.8
Population (millions) 26.4 27.0 27.6 28.2 28.9 2.2 2.5
GNP per capita (Kyats) 349 354 362 373 374 2.2 -
GNP per capita (US$)2/ 73 7)4 76 78 70
Investment per capita 39 39 42 42 44 2.5 4.8I. MY a' s j
Investrnt per capia 8 8 9 9 8
(uJS$)
1/ Current price series deflated by implicit overall GD? deflator
2/ 1968-71: US$ = 4.76 Kyats1972: US$ = 5.35 Kyats

Table 2.3: RATIOS OF INVEISTMNNT, SAVINGS AND FOREIGN CAPITAL INFLOWS TO GNP
(current market prices)
Year ending Sept. 30 1968 1969 1970 1971 1972
Gross National Product.(million Kyats) ( 935° 9926 10237813
Gross Fixed Capital Formation --
(million Kvats) 1054 1077 1160 1206 1289
GFCF as % GNP 11.2 10.8 11.3 11.4 11.9
INaMonal Savinrs (million Kvats) 775 706 763 807 9071,
Na-.ional Savings as % GNP 8.2 7.1 7.4 7.6 8.3
NetM. Pr+.Ar-nql Pnrrow-ino(million Kyats) 279 371 397 399 382
Net External Borrowingas a. r P 29 Q R 7 'A 3 7 3R5
National Savings as % GFCF 731 5 65- 65 69 5 70C).

Table 2.4: GROSS FIXE CAPITAL FORMATION AND ITS FINANCING(million Kyats)
Year EndinR Sept. 30 1968 1969 l970 1971 1972
Gross Fixed Investment 1054 1077 1160 1206 1289
,P(iblic Sector 689 761 800 800 850>?rivate Sector 366 316 360 406 439
Foreign Capital Inflows 279 71 399 382
ktOfficial-Gra pts (Net) 29 69 83 100 9gOfficial loans (NMt) 111 24 2 26 149Short term credit 172 20 -42 2 20Other capital 49 20 108 24 156Change in Reserves +82 -186 -246 -177 +42
National Savings 775 706 763 807 207
Budget Savings 276 184 -10 82 3,Private Savings 499 522 773 725 872
of whichBank financing (114) (328) (338) (303) (327)
Source: Ministry of Planning and Finance and Mission Estimates

Table 3.1:BALANCE 0 PAYAMNTS(million Kyats)
Year Ending Sept. 30 1968 1969 1970 1971 1972
/ Exports of Goods 545 542/ 573 572 667
V"Imports of Goods 785/ 836/ 871 846 861
TRADE BALANCE -240 -294 -298 -274 -194
Exports of Non-Factor Services 43/ 43/ 47 52 59
'KImports of Non-Factor Services 96/ 128 140 149 160
NET NON-FACTOR SERVICES -53 -85 -93 -97 -101
NET TRANSFERS: 62/ 89 105 112 99
Private 4 4 3 5 4
Official grants 58 85 102 107 95
NET FACTOR SERVICES +9 +11/ +2 -10 -47
TOTAL CURRENT ACCOUNT -222 -279 -284 -269 -243
Errors and omissions +1 -3 -11 -23 -40
NET CURRENT ACCOUNT -221 -282 -295 -292 -283
Foreign Loans 147 145 109 184 245
Debt Repayment -43 -119 -94 -73 -96
Other Capital (net) +49 +20 +108 +24 +156/1
Short-term Bank Credit (net) +172 +68 -42 +2 +20
NET CAPITAL FLOWS +325 +114 +81 +137 +325
CURRENT & CAPITAL ACCOUNTS +104 -168 -214 -155 +42
MONETARY MOVEMENTS /2 +104 -168 -214 -155 +42
/T m frfHnernt frcm cnstoms data due mainlv to the timinu nof A,rnnrt- teelintR arni
coverage since some imports do not go through customs.
/2 Comprising (a) K43m deferred payments on rice, (b) K16.3m sale of gold,(,c TI'7, SnP -1 1+tion a -I', 'gn of MK',,Qm o,n ze_"uabio' reserves.
Ir ni..~, ..4 .., + e7 snv 4 n,'y'Sna 4 n~ bCabyQ,£ 1- M - 4w.d^ 4 *& 4.V
Source: TV J 40n.L of oA %"W

Table 3.2: _VALUE OF MAJOR EXPORTS BY CO1MODITY(million Kyats)
Ye2r Ending Sept. 30 1962 1968 1969 1971 1972
Rice & Rice Products 852 238 235 285 286 273
Pulses and Beans 60 43 33 40 41 54
Animal Feedstuff 76 25 25 31 38 68
Rubber 28 9 27 13 15 18
Cotton 41 4 -- -- -- --
Jute 1 4 2 2 6 25
Hides and Skins 2 1 1 -- 1 1
Teak 125 155 159 113 137 144
Hardwood 7 -- -- 1 3 5
Wax 6 2 4 6 6 9
Base Metals 36 19 29 25 26 34
Silver 6 -- 17 6 6 7
Precious Stones 4 9 11 7 -- 11
Others 22 7 6 6 8 8
Total Exports 1271 521 557 539 579 657
-- denotes less than 1.0 mi1 ion t ats

Table 3.3s VOLUME OFJMAJOR EXPORTS BY CCQODITY(000 tons)
Year Ewdins Sept. 30 1962 1968 1969 1970 1971 1972
RhIee A RiGe Products 1831 347 364 666 749 668
-Al0es & Beam 108 65 46 54 59 77
Arnimal Feedst1iff 21X! 95 88 10'• 129 181
Rubber 10 6 13 6 9 12
_+ +r 19 2 _ 1 6 _
JUtS 1 3 2 1 5 16
Teakle 119 lQ0 130 112 122 1 20
ode netnn& ores -35 18 18 12 15_1'. me O R. ;l . __
Source: Central Statistical and Economics Department.
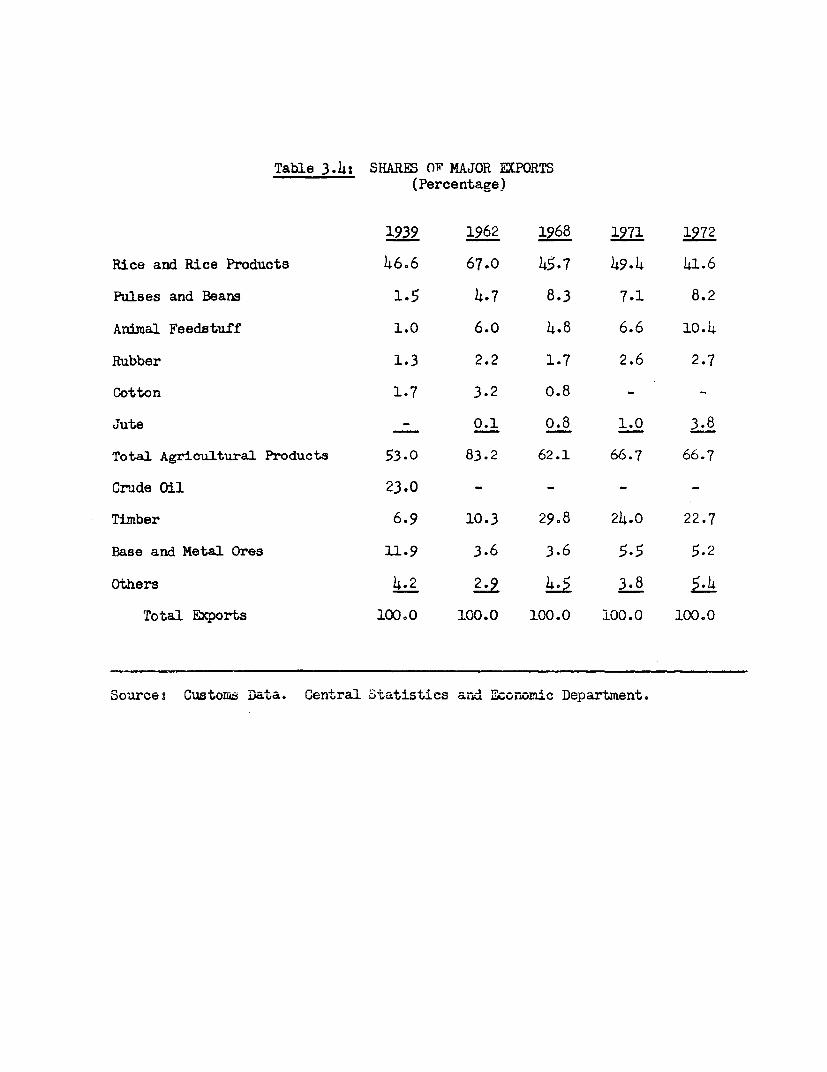
Table 3.4: SHARES OF MAJOR EXPORTS(Percentage)
1939 1962 1968 1971 1972
Rice and Rice Products 46.6 67.0 45.7 49.4 41.6
Pulses and Beans 1.5 4.7 8.3 7.1 8.2
Arnmal Feedstuff 1.0 6.0 4.8 6.6 10.4
Rubber 1.3 2.2 1.7 2.6 2.7
Cotton 1.7 3.2 0.8 -
Jute - 0.1 o.8 1.0 3.8
Total Agricultural Products 53.0 83.2 62.1 66.7 66.7
Crude Oil 23.0 - - - -
Timber 6.9 10.3 29.8 24.0 22.7
Base and Metal Ores U.9 3.6 3.6 5.5 5.2
Others 4.2 2.9 4.5 3.8 5
Total Exports 100.0 100.0 100.0 100.0 100.0
Source: Customs Data. Central Statistics and Ecornoic Depart-aent.

Table '.15: VALUE OF MAJOR IMPORTS BY OCOOODITY(Million Kyats)
Year Ending Sept. 30 1963 19 1965 1966 1967 1r96 1969 1970 1971 1972
Consumer Goods 367 369 401 220 123 109 119 163 120 71
Foodstuff 112 140 167 59 56 31 31 28 25 19
Textiles 145 126 112 107 28 25 35 90 52 27
Medicinal & Pharmaceutical 37 33 43 16 15 16 14 15 16 9
Durable Goods 42 .34 35 13 11 20 20 15 11 7
Other 31 36 44 25 13 17 19 15 16 9
AW,, aterials t nL TA-A4nt 348 369 621 303 343 301 226 263 274 191
Agriculture 55 53 63 66 43 66 39. 12 16 45
Industry 249 280 50 208 232 202 156 230 205 116
Fuels and Lubricants 44 36 54 29 68 33 31 21 53 30
Construction Materials 138 132 166 78 88 113 105 102 128
Steel and structural 59 2.A 76 8 25 19 18 25 29 16
Water supply 9 10 12 10 14 14 17 13 15 15
Railway construction 9 1 3 5 -- 2 10 9 16 9
Road making 4 3 5 4 3 4 -- 2 3 2
Building and Construction 31 27 35 22 17 22 29 25 24 14
Other 26 27 35 29 29 52 31 28 41 23
Machinery & Equipment 242 213 223 201 261 234 303 249 310 210
Agricultural 44 -11 7 24 13 5 20 11 5 10
Electrical 24 13 13 10 18 27 29 18 23 20
Other industrial 70 43. 47 64 68 90 91 97 116 88
Mining & Road construction ,5 23 47 9 45 26 40 42 28 26
Office 5 4 7 3 7 3 3 2 11 2
Telegraph & wireless 6 5 8 2 5 3 5 3 3 4
Road transport 42 27 49 39 53 46 47 36 58 28
Railway transport 11 61 21 16 13 12 17 9 32 10
Other transport 19 21 14 25 30 13 40 21 27 14
Other canital 6 5 10 9 9 9 11 10 7 8
lot classified 1 1 2 1 1 -- 1. 1 1 1
TOTAL IMPORTS .1096 1084 1413 803 816 757 754 778 833 552
Of which: X X Z Z a X 7. % %
Consumer goods 34 34 28 27 15 .14 16 21 14 13
Raw materials'Irte.ediates 32 34. 44 38 42 40 30 34 33 35
Capital Goods . 34 32 28 35 43 46 54 45 53 52
-- Denotes less than Kl million.
L Estimates for the period October 1971 - June 1972.
/9 TnrltieS construction' materials and marhinery equinment
Source: Central Statistics and Economics Department.

Table 3.6:QHANGES IN THE PATT L -TF A.DE
1961/62 1967/68 1970/71 1971/72Destination of Exports % % .J.
Asia (including Japan and China) 67.2 57.2 59.1 56.6
Western Europe 17.2 31.5 25.6 26.8
Eastern Europe 6.9 2.5 4.o 4.7
Africa 5.6 6.7 4.3 4.6
Middle East 2.0 1.0 4.1 4.6
North America 1.0 o.6 0.3 2.4
Others 0.1 0.5 2.6 0.3
TOTAL 100.0 100.0 iO.0 100.0
Origin of Imports 1961/62 1967/68 1970/71 1971/72 A
Asia (including Japan and China) 49.2 40.7 54.7 51.6
Western Europe 31.4 37.3 29.2 27.6
Eastern Europe 5.9 10.0 7.6 10.9
Africa 2.7 0.2 0.0 1.3
Middle East 1.5 0.8 0.5 0.4
North America 5.0 8.1 4.9 5.1
Others 4.3 2.9 3.1 3.1
TOTAL 100.0 100.0 100.0 100.0
/ Covers only 9-month period, October 1971 to June 1972.
Source: Central Statistical and Economics Department.

-. m3.7 ux 7 TYATTT AW?n ATTAXTWIrT1A T1TC' rim A'ywIvDIU %V' 'MATh
l196b = 100
rrs3'arYear ending Sept. 30 1939-41 1961 1967 1968 1969 1970 1971
Export
. Value Index/ 49 89 59 46 49 47 51Vl. . Id2 9 -e 91 90 .unit value ie'O -, Le L--j L Y
Quantumn 222 100 531 36 39 52 56
Import
Value Index 28 99 75 70 69 72 77Unit val.ue V 20 Y4 lZl IY 116 10ZU 12 -U
Quantum /1 142 106 62 58 6o6G) 60 64
Terms of Trade /2 110 95 96 107 106 76 75
Puhrhasing PowerofEportsL{ 244 94 49 38 42 39 42
/z Quantum Indicess Ratio of value index to unit value index
/2 Terzs of Trade: Ratio of export unit value index to import unit value index
/3 Purchasing Power of Exports: Value index of exports deflated by import unitvalue index.
Source: Statistical Yearbook 1971, CSED and Mission Estimates.

Table 3.8: PRICE INDICES FOR MAJOR EXPORTS
1963 =10
Yearx E-ing:Sept-. 30 Rice Teak Oil Cakes Pulses
1962 96 98.0 93 97
1963 100 100.0 100 100
1964 104 90 100 105
1965 102 98 86 102
1966 104 112 100 109
1967 119 119 92 98
1968 142 144 79 116
1969 133 114 86 126
1970 88 94 89 130
1971 79 104 89 122
1972 84 112 113 123
Source: CSED and Mission Estidites.

Ta FDse F EXis7 iuE. RFEI'Pf1]S, PAYMNTS AND GROSS RESERVES(Kyats million)
Surplus/ Gross /1 Receipts/YeaEdinget.30 Receipts Pa_ments Deficit Reserves Payments %
1968 -58 881 -293 913 67
1969 585 964 -379 727 61
1970 620 1011 -391 481 61
1971 624 995 -371 3014 63
1972 726 1021 -295 331 71
Ll End of period
Sources Union of Bunma Bank.

Table 3.10: PROJECTION OF DEBT SERVICE PAYMENTSON EISTING DEBS AS OF SE- n-, 'I
Export Earningsa_/ Debt Repayment Debt Service RatioYear Ending Sept. 30. (US$ million) (US$ million) (%)
1972 135.7 24.5 18.0
1973 139.8 26.0 18.6
1974 144.0 27.8 19.3
1975 148.3 30.9 20.8
1976 152.7 27.3 17.9
1977 157.3 23.1 14.7
1/ Exports of goods and non-factor services growing at 3% per annum, 1972-1977
Source: IBRD and Mission estimates

Table 4. 1 07/26/73
EXTERNAL PUBLIC DEBT OUTSTAND1NG AS OF SE'PTEMBER 30'1972
DEBT REPAYABLE IN FOREIGN CURRENCY
IN TI4OUSANDS OF U.S. DOLLARS
DET n!iTSTAnDIUN EpyvMpRE %na1Qo72
CfRFf TTnR CflnJNTRY UNDIS'TYPE OF CREDITOR DISBURSED BURSED TOTAL
FRANCE 4,747 8P263 13D010GEHNIANY (FEC.REP9aF) 11,724 564 12J288I N U1 A 4J 198 1e5 4p 'a
ITAL Y 1033 ' 1pSc33AYJAN 21pid 19 1-. 239Au65
wETHERLAND5 lbb 1 iSWITZFRLAND 2,840 306 3P146TlNI SIA I,538 o S53UNITED KINGDOM 2J770 954 3f*724USA 3D11b 3P118
SUPPL IERS 53P966 1 >525 65#491
USA 1,870 439 2, 309PRIVTAE RANKS IJ870 439 2P309
I HifU - I u23p l 10o231LOANS FROM INTLO ORGANIZATIONS 10i231 10P231
CHI'JA,PEOPLES REPoOF 27,0Y7 77,i49 104P228CZFCHOSLOVAKIA 7P297 5,764 13,U61F N A C CE - 2 6 41 2 PJ!GERMANY (EAST) 7,833 a 7,P833GEH-AANY (FED#REPeOF) 22p218 11,052U 33i738JAPAN 18-493 31,572 5OPD65POLAN D /2 a 72UJSA 7A141 439 7,580USSR 7J 320 1' D 30 8J 350YUGUSLAVIA = i,9i8 1,J918
LOANS FROM GOVERNMENTS 97D453 132,073 229P526
TOTAL EXTERNAL PUBLIC DEBT 163'520 144,O37 307r557
NOTE! OEBT WITH A MAtURItY O; A, £VEt ONt YEAR
ECONOMIC AND SOCIAL DATA DIVISIONECONOMI:C ANALYSIS & PROJECTIONS DEPARTMENT
JULY 26, 1973


T9'I v NIR ERIESI I lIlI MYV dO SOIAZES 5gAnf'13NI :RION
@~~~~~~~ll 111110 lIS 999f . u,111'aaz ESf,11FU 94/ 16w ~~~~~S99''11 169 blt001 i ZOi£ co,t Izlc: 6/06@ ~~~~~~169t'Zl 6 30 f9f 9 0f O 69 lth 060 itV 0 6/ 6
" ~~~~~~11cl LtY45ts Itolalt e C e11,9i9 199111,19 99/igD Z~~~~~ZEE 4t I 66LZ i et°' le I f6 0508 OC6 1,9 19/199> t1t6tg~~~t t 0l f t I ¢ 1 EhIf , 111'ai.l EL6 d86 9 9/1;
a~~~~~~~V 49Z9E- Z9S''Y tz r 0ZY " ,lOSI sEIiSEEdfI E 9/lego~~~~~~~6 d6s f' 999 1?s Zo6ffG9s c1i 11,69S9ZbWl 1 81 909
e~~~~~~~ ibtr4 IFI990 v 1c I2 ,, 9 Z 6 3 I QQfef;9z I / IL
@ ~~~~~~661eZ (PZ LE 9 ELI? Ilse X0#<11 fs 169#09Z 10S11111idtz 6.1/l0l-~~~~~~10 tOSOE 9tO'e 690 Flat E9,119a .s9rafaof zlQeZ'f vi/E'lI fill 090tg d9cf 50toE logs SO I,NIF 1S5°1,Ot oaSZ59l t Is/;Cvt 0 E RI 9 t1t a too0¢ It 56tS¢86 116ft 060#91 96 irsEZ MillaZI EJ/%60t26ep tBI 6itX I 690,9f t9t IitY g6teMdo [0bO1Ifelt990 soloEo #acO I I I/01St 9 f1, V6 fidOE ' 9te ¢Z / retO I 9te#91 9Q1205 f 19#011S 091#f0t 0 1/11990 tod9O'l9Z , 30ItZ OOS£Z 911111re QO§°Ot I 5,190'fool 969ZO0 9Xle9Itl¢> I 119T 9s1�t ifI 9ce tE 020f 96 io0t 996 40f 01 evilo 6614,49 899/,9
I 0I3h ltlE11 A.2]VJj,N I l114d' 9NIVd UlN3 S111N3H 032ldngl§XNfl AIN0 dV3A=111fralvt S,.NN!AVd 319AUH% 0321in@gst Ql!W: N51110 NInONS 0'39vn9s5z1
OSu'd wricla 'ev°n jo sawylonami 1i
AO)NSHMM5. NDY3§10J MI 318WlAVd3U 1030
iA6 unwmid AoNZ, JOv atI,3c sssndl lV131X3
t.1"1311B z *8 aTq el

* 0 5 bigGP a #S to 19 opt"~~~~~~16 il5 1z blr ,9 el a dot? I' 6ttSs I OFZ
*>gtas 8*t'aS 1 0 eJ,<,W64RiT 66L4 g t
* 9E9t? *0s . 61A 0 6LGAi1 hOl* 11001 060i Io 9 OT I v TUtI 0U9°I 9loll* 1945'0 5Usfi6tz a9t it I 6ig 46i 699ESGil 1LO'
"~~~~~~i eP9 ¢o OCtl9 1i79s GH d As74 ,ilbi gj6 Z clP° sLof i- 110g19 tSd Es TE C l s b^ d 5
e gogEq;<ftg; ISt0 II 09 S 6 S 9904'6 IS6 1,tv lIV ti6 1I
CI 6i,# ZlOto I Is Ott or o 9 oe siol , z sgea�t, III 0 1 tfi VGv; dGl! 81
atSt 1; fif I et sO Ie OtO #t otlece OVA T 699160 96 461t Al/t§5; ,18016 tTs T91 I? 116 dI Pt3 lt a0g°tE 9 5 41 i@ AOX¢dX. 191 essw91 SLO es flto I I 00seAl itoaz 019 °aoo;s 6 .^
601m" IL, @t iL I ,9-0 6 1 Ogg t, %9g¢t It 0 c t a 9 9 . . . . . . . N
6@9 g.S) -§ Ce9g, . (g gs'
-ilfleQwe IVNLeU,Lil sAa,NODB ,aeSn"tQ xs6X4b sWSnn:ll8 XSS"qzeI
.n1Z931" MIMI SNURAOMIM. emii9ai AO sNiaNI
Zo o *genfl AG 9IGNVINlDHA, Ng
A3Nt Slil P/ 53 / NS OiVAVI3 1330
,&6 <t@- 3iS4X;<dAD2 'IV 1INS 5SIainZ.fi 71VN?Mtl2J
Wt'1110

07 /2? /7 v1XYERNAL PUBLIC DEST A's OF SEPTEMBER 30.191;2
DCIa REPAV4BLC IN FOR1SIN ,01ACRRCY
IN TwioUsAiND or U060o OOLLAIR - Page 3
- 1CS?1 OUJT8YfANOIN6 ThANXd8ACT81N5 DURINGl P1CR,l0BIEB!4INGN Of' PERIOID DU lAlNC6ELI
DISBURSED INCLUDING CONN01ITIO o312muR54 SE:RVICE PAYMMNTs AhDJU8TaYEAR ONLO UNDISOURSCa MCNT& 'PR^gIPAL INrEfEST TBITAL KOE,TACl) C2) (a1) C4) -3 (6) -s: Cl C,)70/71 . 2.00 1.12 .t a71/72 112? 20i800 629 1863s 1.120 J1I? 1.23?72/73t I46 20.09 '43R 840 1768 1a0167314 1.469 1.67 e 1 *092 1,27 19219 a3??t?/&N 3at? ITt Z ' 252 41 292?5/70 126 126 a 126 8 134

* Oo~~~~~~~~~~~~~E~~~~~~ ~~~~~~~~~QO1~~il E/161I 9f> $ °9O'tt Lt d Ca 9#6 L/0I Is1r4 I t03n GICZ tt I c (lie it 0det 9 lI/tIb~~~~~~ bCl°i 1 a 1-a' 'ti eo Igd 9tiF�f' 'S/I tAE
3~ ~~~~~ . a 18t tot gs1i 5 9 g(tt I 1 9 9 0 I111L[
W13 6tZI" t08 ta9t' tollI l I Oh/69* e~~~~6# VE 96 Ioc'a * oe; '6 I G8fi 6T 69 / 89
;4 6tiC°E 4g99. Z 99/i9
t@§ <s~C) -1~ C'i .f' t r)t: )IJINI3N fl@ .. O,'lIl8MN' -I,dl Ml V1 91143H '.1143h no'neflgIONn flNO wV3A*L9nrOv 1INSI±d 1A '! AM311 vimf8 U sLrOi *N!arflUrN z aOsuncfs x a
113O1113d AO ONINNI11,311G1
IW aIUMINIVIDO *11I W4lll IN Vo1
su'1101O *i've io saNvonOMI N!
AlN9S1UUf N9EUSO. NX T1OUAVdIN 1.30
ADL4sGO 13V41, 0 103 ±9'F1 1VINIU
S2 / As /A

S ~ ~~~~~ 90119 d0 a 90 T 0 e950 §1 901: 41 1ti/ 0go ' 0 , Ia mQ c I £SE dbT iI dt I 0 6/6 9
6;~~~~~~0 0A)z, e @o¢l z3 A t " s!Eel:t 519 I a 9 gow~~~~~~~0 9ofe, 90 itdt, e9tt61 021 g9eldoeZ i9 /9s~~~~~~~ olli ¢, 901 el afgs af;G 19So| Z/j¢t9X9frx ~~~~~9 0 1 ol ,. e 9 0 t 19 St 1 16 std 9 60sm~~~~~~~o 0111' a §o0s s as' gb*l fsit8¢6 fi t/to
s!l~~~~~g '1 901 el& e 903 a z3 e A: 69()8il ge/lees~~~~~~0 O'l a g e 14f91 II doo IIIS?z #OA,g 09/0iXX ~ ~~~~~~ fe £t II I ,M.'10 E I G19 QQt I 6j}9l 0-/6
@~~~~~~~t f1t¢* 0 E§fo o e' 0 )08 I 001 ooi it16O ,A0~~~~~~~t iplo'1 a Etc dt 06t tfit 9 big laSai 96<0Z egit/91s ~ ~~~~~~ ti¢t c tpt lot 56s¢t1 ei I 983 ftJ* I s0tfx #to
@t6¢t~~~~~~~~~~~~~~~~~~~~~~~~~~~~~sto St ID et Alla 1g0#9i #CZ8ti IoogIg,t; t O c s c3 es e exe e O O IO ° Z i~~~~~~~~~~~~~~~~~00 $l iE Sfl #l iZ X / 0w~~~~~~~~~~~~~~~~~~~~~~~~~~~~~~~~~~~~00O a e it w a a 01>0ZlZROi i/69r9 e1 s vr rs Z ~~~~~~~~~~~~~~~~~~ ~~~~~~~~~~OOID iZ al all'Bd'a 69/99
00081oez E OOIDftSI. 6j10 foa9 991,19
asgg1Qw9 1u0SlN3d F9 1AU IV ll0 Nt>|n 1`00130- 1W01N'1t9 410&Rt¢8illN9nOA3

EXTERNAL OUSLIC IDOL1i AS Of SEP[TLMIER 30.11972
DIEB2 REPAYABLE IN FOREIGN CUIRRENCY
ZN THOUSANDS OF Us. DO1LLARS Page 6l
LOANS FROM OGIVERNMENOTSCZECHOISLOVAK I A
DEBT OUTSfTANDING TRANiSACTIONS DURING PERIODBEGINNING OF PERIOD CAN CELA
LAY IONS.I>ZSBURSED PICLUDINa CONMXTO D ISBURSK' SERVICE IPAYMENTS ADJUST",
YIEAR ONLY UNDISBURGED MENTS WENTS PRINCIPAL INTEIRST1' TlaTAL. NIENTSj(l) Ct) V3) SS) C?) (S)
60/68 S5.54 I2a IS2 7.344 310481 1089l7 ,279 2,o V 6 la 1I073368/69 6.339 150866 ' 6.t9 15 2# 141 :238 2,p379l 169of70 .1111 13.726 40711 108316 3.4104 .371 3, T 7 I70/7r1 9o,545 15e034 2A 5 93 3F 772 3 52 40124 3 3971/72 9.#044 11c601 4D646 1l597 3.900 369 4R269 714
72/73 7A297 13.06 1 m 5. 221 30323 185 3.5081 "64373/74 8P836 9 0 095 261 3.2 66 .327 3,59Al74/75 501330 5J a 30 e 0 2.49 1 225 2.716175/76 3.339 3.339 '' 1.47R 1)3 1.03076/eT7 1.842 1.842 a n 1 4ID7 72 1 oS56 977/78 344 344 a ' 344 10 3555

EXTERNAL PUBLIC DEBT AS Of 8EPTEMIER 30197`2
DEBT REPAYABLE IN 1FORIGtlN CUlRRtEN-CY
IN THOUSANDS OF IJo$o D0OLLAR8 Page 7
LOAINS fROM BIOVCRdNMNTSFRANCiE
DEBT OUTSTAND-ING TRANSACTITON s DtURING PRDstGlINNING or PERIOD CANtCCL*'
LAT ION seDISBURSED' INCLUDINII ODMMITI DIZSBUUR SlERY I PAYMENTIS ADJUSTe
YCAR ONILY UNDIABURSIED MENTS s 4ENTi PRAINCIpAL INTERSTTTAL MC NTSI) Cl(2) (93:1 () it) 6''(6 (t) (l6)
7 l 2 Of 1 2
72t7 3 e 21681 a 2097V9 101 2 179 29873/74 2*798 24908 1 s El 18 96 277'74/75 2'V18 21618 a a 181 90 271 -
75/'76 21437 2 4:3 7 1 m 8l1 84 264,76/P77 21257 2 2 25 7 I18E 77 258177,`78 21076 2DOFOr I ' 101 71 25278/0`79 1'895 1p 80 0 a 1 01 65 24579/80 10715 OT'7I5 sil1 58 239180/a1 1IS34 1*534 I E 1 52 2331 81/82 1 354 1 354 I 011 46 226 -
62of83 D,113 ItI?3 U 181 39 22( a83/84 993 993 I181 33 21484/085 812 812 1t1 27 207 U
85/^86 632 632 L 11 21 201 U
86/t87 451 451 101 14 19
8768a 271 27 1 I 8 I 18ll88of89 90 ID 0 '0 2 92

* ~~~23?O * 6i MzZ~~~~~le 0' OZ Z61 .04 a 061 IoW@'
* w t 109 60 Est 916egy 19/09* 365~11 6 cl a 991109 oe0*
a 1?69T 66 cal Q6 09G1f GA/0S* 116 6?1 3l65 el e Qt6 OfS'iS* 6ft gal * U0 5 5 11
H ~~~C1,E0 Xes t1 C callf £ii,fli tost1* tlsl 90? 3451 Ut G3 flfg9 0'9ig 95/OS9i* CISG Olt 365 .4 531E SoE S 0s15tA* 06 0//SQ61 t44 * Sd l~EA e @ 616e tblOt ALgi ll0e? 0(3 365 0 * tIOS E EdLt
961F1 902 de eto s6i1: 106 161 * 00E * &99'A O6tCS 11/0.to lilt oi l tt 84105 0f01U5 ° * 90? Q00 S I M alo tAS'0 69/,9901'?l AL 5 Z . 91#6 Qoa 99/49
Av) - .) co (9 . 1114111f111 IVIIWVd ! V.~9fIM'~ .j1M3VO 039018 NXi QWflO t?VIi.t'3ANVN *wo sU3W wdas4 sa 0W" eXUn0?eaN 40¢4 8X#3
.. n3nl"wa- ... 00X"d 0N:fl tnaN O s ~ L9 0. V fQ A 30
X 9Vj3 ANVW"J8X
S92Niltic *01l 40 BCNVISflN N?
A0NINfl10 wSl?Ouj NZ 3-i WAW'dim 131f
ES~ ~ ~~~~~~,^ /10 SXlna 3/lt Ls :1"01lM30

,,,~~~~~~G IF I ME 19i T,I, al 0 90t it: 909 aI Is t0 16es tjt%t4j9 I s 4 tgtit 019gt I t3 Q4)°Elo otiI tll ift }6 /soaD ~ ~~~~~ Os t 1R 1 vtrz otl I gil 101 61 t7 AEIt> ist I 3> r 00/6oa~~~~~~164 1t010 09I tI 11s ; 06 159sj jloIX 19/90
066S-1 aOctOb olsl 10 f9Air'll tI del6,9 ZBX9'ttB a ~~~2 9 1 1 9p 00 I) d T § : 6X,C o6 I, 111,16 SlgaX,SW6 Oea~~~~~~9 fI@' 5X' 010 6'1: ll I 4r¢i9vIc z-l0 0 to/so@ @XttRjg.06,9 9i6; 9 Z a ; X o U84li'ta go /to8SQ
o~~~~~~i 'FE tt 14L sIg -jZ D e1 910A SIT 1Q#8t 91,11
cl7~~~~~ stitl Ecil SIP I; a 9 O f fit 01i 111it 9j,#si
z @°t~ ~ ~06 {itA T 0. 1 0 4F It4f 0 iftC lt 91- e at It g2
g¢8 ~ ~~~~ It,e ,eq, 919 ttll 9s 091S§> ES§ lb R I I itS T V 691 Irl O606if cEall 9!591g ll'ts8 tX,tb§OwS 1 ig e totic IX la 0110 I t, &oe 11B11 04,-ao 06A,169
S 2t~~~~OS t19t zsol 69 lot .1 lie 611°A 916p0f9 69/Z99flAj~~~~~~~~~~~~~~~~~~~~~~~~~sl Osg 106j #AP.. 190,0 -. 9/19P9
6%)@15 a3PRe1d 31'iYAica nam@fI|r go I!II coliv41:8N QIIXX@
Q@"lD'gXhI ~ ~ ~ ~ ~ ~ ~ ~ ~ ~ ~ ~~~IINIX

P u3 e e a e E l aZ2
99~~~~~~~~~~~~~~~~~~~~~~~~~j6
* £9§s¢3 ams BggsZ X 's 91°1~ 9iSzI 41 69/90* lsaOtJZ 19t ttt§g A 97 6616 966 6 9 9/y9
IBNl3ftW BvAOlA 11 J 9'1AIoIq lwN iMl" IS1N W O3IN9 W 10
e!B"O ~ ~ ~ ~~oll 1w9A "01voV
~~I N V 0 oa~~~~~~~~~~:~~~ icV cm WtONX
91igNIWNIAOID NOWA CNVO¶'
OT a -go jo 1 $nOwl ml
A9N1'fl0tI N'D8Z?IUO NI ':I9VAYdIN 030
1030013J3 ilO IV li3Q aoViSfd UNNlX1
!; 4 A!s1

@ ~ ~~~~ 0 6 9 9i 9@ 4.g# It s #ta Z I el> Z/6It0S rof @ CeEsa d@i fs'6/06
X t§e§t oil c eV Olet OO0fo OSI000Uo¢s>s 06/69, Y #~~~to kli lotg to 11 ego0 Ite e ;letoego 6 1B/ go
029 btp GoX E Ole fioa oa^g t19 98/AS
2 esg9 612,6 L6LID 6, is 0E9009 0 10 9g{1o-agt gtic 0 1 as ., oil4 II6658ti a4ig Eelse
e Lt;l 09 0eI 21, 9fI Met E e 691 0 Ito 190 1 0/0
*D @X841 Goods 996T 3clE 0i e t99001 t Ia016 09,/'19 O,41, 069E0 I6EB m 6 f s 9 leSs
G SX9§g @§!o, 69AE' * LL!1I $616 BI AIS* ~~~~iee 9090 * *o 1806jj8fI 11,1195
* @W1 §e 6I@a Gt 0 0 1% II It li'S 91/6I
* £9sE¢, sto¢T ,06 0 1I tots 6L091911 #1/65Stoll 066 096 go I09a * L690s0 1it'Il t I/t
!zO'Z 1rW1t tX~~~ gg9§#I Q99'9 &94A-ti#M g9t1Zt91t ~~~tX Ig 3of oil§ @at¢' o0 f) 60, 11/01
* a eOOeO? e* 000,101 05/69
B"XN 5w&sA ^ ALlS8ZalNX .1 -11momflid. BS,#3Xl B14 SIN 09118811114Fn A?ll"0 NV3A
CFei CS) :Cg. .u) ~~iVd~9N~Ud I1N~~ OIUflUB#, ON~ AlNOX9140~~~~~~~~~~~fi2S I§i8gt [email protected](1tgi1}X
IT ~~~~~~~~~9 8S9! "|X[10,. *§ #l 2O4tfl0?W4#l 14K

E)CTERNAL PUIILIC DE61T A1S 'Of 6SPTEM.BER 30.11972
0E@:t REPAYABLE IN FOREIGN CUiRENCY
ZIN THOUSANDS all U.S. DOLLARS Pviage 12
LOANS FROM SIOVRNNENTSiPOLA Mo
IDES?1 OUTSTANDING TRANSACTIONS OUPtRIN PFERZODIBlEGYtINNING 0F PERIOD CA NC916a
LA? ION ,OISBURSED INCLUDING COMMIT 115SUR69 I&CRYICE PAYMENTS ADJUST*
YEAR IONL1Y UINDISUR5CD MENTS MENTS PRINC!PAL 0t9R9sy- TvnTA MLNTI)c 6C) to) CY)
69/ 71) 133 o e70/7 1 133 a 133 a2 3 25 a7/2 111 111 ° s 39 S 44 t
72/7)3 2 72 48 2 !3073/74 24 24 0 24 :1 2!

ExTERNAL PUBL"' D'COT As OF IBSEPYIMER 11001973
DEBT RtEPAYABLiE IN FOREIGN CURCNCY
IN IrMOUANID COF U.Ss D0LiQLARS Page :,
LOANS F1ROM GOVERNM4ENTSU6SA
OEST OU" i'ANDIINGI TRANSACYTONS OURZNI8 PI:R199BEGINNZINQ F IPERIOD CA NC91L°
LAT£0 N oDISBURSED 2NI:LUCING CON,YT* OisBURt£sE SIRVICC6 PAYNt,NYs ADJUST.
YEAR ONLY 'wNDthsILURSo P£NTIi MENTII PRKNICIPAL INTERE8T TOTAL "N'tCi) C,l CZ 4)W "iS) - ) CV) cS)
67/68 5.016 5. 0 16 173 149 3a2 2i68/69 4'84l3 4. 84 '3 ' 173 144 31t69/70 - A6170 4i670 a 173 136 31170/7 1 4.497 4,.497 280a0 10127 86 69 155 '71/72 505.38 To 21 1 6 29 10863 259 297 556A
72/73 714 1 7.580 ' 439 13. 31t 4190?3/74 - .407 7.407 ' 103 324 4107 74/75 7.2314 .234 * 1.293 302 59 tlT5/16 S5.941 5.941 6 1419 229 1*o 64876/77 4*522 40522 e 995 146 1I13077/TB 3.5318 3.538 485 1 0 0 533 78/19 30 11,3 3.113 173 9,2 216579/80 2.940 2.940 a t173 87 26080/81 27 67 2.76? ' 1T3 02 255 ai81/82 2I5 94 2.594 9 a 173 T? 249 9182/03 2 421 2.421 ' a 173 71 24 4 GI83/84 '2.248 2.248 4 a 173 616 239 s84/85 2 07'6 2.0716 a 173 61 234 e85/86 I1.90,3 1.903 a 173 56 2,29 a86/87 I .730o 1.730 o 173 51 224 el87/88 u,I557 1.557 1?3 451 216:88/89 1'J384 1P384 173 40 213 ;89/90 1I21 1 1.211 a 173 35 208 U
90/91 1#038 1.031a31 173 310 21D03 .91/92 8 65 3615 173 215 1 9e 8

e 6*t t 16t a a 16* 16t t 6/t ** ~~~96# 4 16# a g6 906 L9/19* 06t t 1 16#* tLteT Lb "; Z/ Io* 90S t* 16t e 961 t496i ofI 19/09* 9606 0I 16t 0 * 0919 'OOt i/64
* 9ti O t 9 u61C 1 463'P 63 ot 1 1 4,'~~~~e o° tte ab .t t I§t t t Irv 1,1141* °6999 Lbt o e 0t219'5 0bl6#; xS* 4~~~60 61 Ito a * Bft 96 't 44,/94* 01~~O6 99 bt zgfliog.; 94/64
* ii6 09 zoo 999119 999419 S9/b * 9i6 to ito el 06'V4 if I OSZ o Va/g* O1i6 61 Ito UIS Oti6tE" Oat I ECSZi
Zt5 azl 04 EGA 6tl 0Q4tS9 Q t? d T/ISO* El6 #I 969 16T H 99 if6 Q14v4 IL/Olo O0b 1t tZE 06 OO9 i, Y64F4 166 Olt OC69
#09 tD t§t16 E s o '96 40 S6oE ue 6 9 9/99Z;6. G S01 It 9 601 Ie0I t l0 £` O I1t'01 99/ 4LCI', CA) c9:i . i.^rj1t @l6t
Z11, N 3 *VL 123"UN I -- wd2ON1d 111N31"W 21,)" imu9toflSamNfl AIND MArLenro0v IjN3WAVd ;IXAM3f W'LImmoo SNI,fiNI (13IMln8I?Q4iNIlYl
100!iid NINIRInO 9lNOI3OVINVIil ONQNVq2AflO 13a0
2143IPN031AAO WOjIJ INVOIttIT aSed £>utrV1oa *`n 0 *aONvIRCOH NIl
A:ON3Uvn* NOTIVlAJ Mg 319VAVfW 11130
1614U0t, MI3U"NLd32I JAO IV ASi30 9U fnld 'MNt31X3
£ /1141/ 40

S 0U t *tZ 9 " 1 Z 12 61/91
s g~~~st
eilil-w W- W v
- *6t(1 t* 0
6 6 16e 011 59b bPt * * E~TtZ b} -%'* 1S9t 9S W * * 1 ct;
got * 1o I 6 St * Vs /I
IC a~~96 I la 4o I
* I/OT;gX n . " zB Z tt jEbflS -~~~~~~~~~~~~ta *1 Z1/0L
X U - e a a t1OtI I 05/69
S * * * * * a ~~~~~~~~~~~~~~~~~~~69/99
A 66 La
;z "
991.ti) f49 ellI)Cj .CE) (1) C
RM3IN IVllDl. 11202441 -IW0111N?1d SIMI S'19iNN I O:Ii9fl@?ONfNn AINO MAia~~~~~~~ ~~~~t4VOSX
ENU1 -F@tv§¢a OO?fNld 09&N2t483U
Vt A VflflA2IINDNNMIAS' I4Oi tNVYO51 ased: ~jy tjilQ *9l 1 0D s flenoHJ Nt
AlNIVWnf P4S!33Oj ? !31ISVAVd3I 18310
o6T'OE 093N31.S01 10 IV 40330 MINNd IVNNX3,XJti/Al/AO

CL61 'go mIr1.sEXLEVdR2a SNOIIDHfOCd 1P 9I34-qV. DiINONc1o
NOISIAIG VZYa TYIOOS aNY -DIWOtCOS
" b~~~~~l?bftie 11 se# EOi2 C Z6/16a S!>~~~~6190tl 1 69 1116,10T i Z#E ZOeetE 160 06a iO@§iCl~~190T 6Z9 C9901?T 064,t 0 66t7 666b
OZ6 86 l' St6 ES96 e IiE d 10 tb G9 C&eie9g; 01 I9/ elpe tl1#tl' SiClfl ~~~~~~~~~~~tboi e0 Ol QSD e9 j69 Q0/10
D Zltftlt ~~~~~~ ~~61ety t90e;fi , OW 09§ OtiOeO9 A129a
e §|S@eXl:~tt f I ofet f to 0e? T ,o #3e6 t 16o 416t 996R,~ ~~~~~919f z,z#l lft StS#,C' I [ 0 If t SO¢ I I I0'|0I t0XfD
e Q!;le~~~91 lSt d lILe t M0T e0 1 #t09 1 t I 09 I 1TO/019
@~~~~~~~011 zottil 9Gj #a St9@ I co lo nat itb ge I tOEq 61 / 9.a SS6 Olt 1; 96 4Z 06600a w 1Bt911Y OV6 91t@OW Wit
sew~~~~~GI O'll¢l ttia de 10%i@tl 0{btsc1' DWSOZ#0° Oft? 411 11/941@~~~~~~~8 6;f1¢1[ 96t f 9 It 94 6i4 I fe I IS% Orl I a 991 0'06 1 91 / 6.o C8~~~~6#06t1I Otl st 9S9iSet Tit9al VI poodozz 069ao 5'O il/9,ls~~~~~~~e S6f 0r toi, ft Z6 it'D giStel 4 i 116COPUZ Caa 4VIIt VI/VI
I IZ Isto 6 ltoSi fE tt 01 99;:¢i e 99St606a Est O,L6 El/&
9 0ZeI 6V0e6 tZSe aZlfiIa lo 1 9 l,t d a o9a91,9 99 e I is SQ 69 O'sl Z1/ILQ1sot 610D e6 Oft 6 65s¢'9 6111 CT1 COG061 Vfll f1tt 99silt§ it/OZt@OOT Z,ltdl 61PUF tOOl Si(Vot 0t9f9c ot6t¢1iZ 9Z9''69 L1/69GM 6tO1 9 Gi1el 0 tcecI C11111,4rl: * t80¢62t lftO''9 69/99
AI 0 I 9 ttI OI Fr: I al 0 Zte 04e Ioel att 1 02l CotI Sal OtE 9 9 / 1
tQj~~~~A tA <j t!c ti At) t) ls"sM~~~IV e#lO livililm1 lvdt awxYid 2a"316. 21Ma munes i 2X1mn AING NV3A*19flP0a1 5~~~~11149AVOI MIIA83 0.11111113191 mil""Noa oN2onlas#: aXsttnesto
#~~~~~~~~~~~~~~~aii tNIn N0u im S11m in 111°
l*j 13wil N111t3V0j- ml: 3-1|1VAvilvlf1 1030
aid OIt U318il01J321 Al I lOjial olilild lVINU131XI
Ul/418/10

>~~~~~~~~~~~0 SZ 1
O iwg tX /lS 9 a 7 5566 i I t 6iteO 6t 0 1 4U O690" S9l -19 C £9tz Ea94tZ Zo/ I- 9 aIT 6as bi i a ,1vft S60tr C 0 9s ~ ~~~~~ W6y 1 0 t I 9 ? # Zi2OZCt °e/ 4f,- E6T'0t 6at 6?afT o Q 9 13o54 /- '61¢I pi I 0 ' 9 -I IS 0 g 9 0 I
aaI a 9 I6 6 I t S I t I X t
5>v tClr ;99 I 0 ; 0 £ £o't I It I4 tt tlrttt £96 O £01 *W OSOftC.t1 iZb9E OZS 1£Z 9 *§s, £tot', 9T04'SFZ9 a la? 919 9Z O1T? I if 9 0 S * 5 S
- a * B -,*% i 9 0 (a e V a U I G 4 Ij o
fL'A ) 9 . C9ij Ct) + (8 C;)(5
.+J4flPCI1 IiP4N3bA#k <BXt1A31' .*2B"nflOI?O siaL1NO: *N:0fl,:X (i32^fleIj0
Iw7noO *stn io 9Oa4V9flW4iH N:!
lir H I A '; N j k U t! 1 o9 e :E' 18' C 21 8I6w t io Iv 9; ~' d ] X < : ' ,
ti6s°06' /;3i4"03.1d3S,¢ Ec1 /12 103; , ,IL
IvIel ONI l'r2lMAIN H.. W 32ki,estow'rl. AIN9

'RooOft 5@ elle t i §941 4t IA f il 9 1,s
9 ~~~~~~6?6 off9 60 i;rQQ li t 9d, 1 *46 ;X,/3s '£~~~~t; 17 9Q 6;t¢ Ie 63 IsS¢Z SeZO ea11PAI
1z I%rt I s Il, 666X I9$ so 0 1C c a 9CIO0 ZS, Il I
I blp I t 9 19 ea5t llidt e 9619 ,°el dil tv S1,0
G;l s~~~~9 IDS 6 ro 61 gs 1 0 s t C t 9 1 69-1
slZf1PgW~IVLI 12313At4d 0;1S3 -1sl")Id 914 1 10i14iH 11:1120111 gRXINON A3lsNGsl
';6-dA:4"n NOI'iM0A1 NJ '2111VAUld} s@'a
2l6f0t83111431d3f, 41- IV @loll 3snn W1:dIOJX3

* 9tg06 *gI Mioi" ~ ~ ~ tf -9 t Etw tit 8C9 I So f* lS lc tot6 I IOMA
* 96A S S1 * ?S9' 9T1sitO tti 9?1 t0g1 * * tI9'Z f9l tefs
9stt tOt9 101 16 l9Sot i'st I fi14° °st VI cot t95; *g g ,oo9
o .1o . .01 .. . . . .
31~~!W LU1~~1~~N1 ~dlON?~~ anwnus:~~~~ A'INO ~~V3A
f1dVIoO10 't*n All 90WifoNJ Ni
BAN-XN 1vX0t fl3M31 S~Io X1 21I3N 3J *l31 JOX IV £620 0?,Uflld 'lwwisx:iABea /ls"Al AOAlJ IsS"4t 950D 6X05:N lS10
'%X@XV'Q'~~~~~~~~~~~NMd1

B , I a at U a a I I
21, 2' t agt 9, ti Mb Z91L1 0U69a ~ 9z6 e QZ'6 Z'*t X; 6X I 1 96 69/9P* * * 906 9 99/S9
£@§~ CS C6) sR i. *Ctj Ct X) t}s s A i N pIV L O l N $ A d 3 X M @ t¢ 3 " l i ' Q 8 S " ' O gN iA i I C I flx AX ll N Q l
U i NO I ,&II 1
¢>n1XPORDao~us r~ii~ g~~~QOz;33JXQNt4N08INIIIAVd A* I A 9:31 9d f
t"1#nnelQ 29e so @Nt§Rt>"l Leli
9MlV :G I*lD IONVtlW0,L N!
11 -rMUc 9""13Ni@3WOi NI Z1IVAVdjl JAU2*ssedko. u 023s1106. A 1w N .l IIVAeliee . ws.u*w

tte *ft a fi" £ C? 9t/64b S SO I 106 96 a$t S/tLzic a t Sol ,io , t; IL tilSS
>~~~~f 0t 9 Sol4 tit of TP t1> it0 , f s
Ot £1 tCs 6got t o9 t1,1@ till1 '!
.. X . . . t9t *l .1 0x/69
.e49X CIL) (i1: . *i 4:3) eI)||"llW 1VA1JX 2H"Y18N? 1.iVd3W2!1d 11113W 1l111I4 OIsNJlWS Nf AlINO NVIA
sAflNY INS1At IA"1 *33NtVflUIIi *JJaONOO IN(1flN? o:isinsewa
0834a"w^ OOVld8341 Jo ONINNIX3UOO!Ujd e,iuna I~hra~v~NvvL. N?QINV.IS1ft)lO l93
THA NVi 2I1V141 s
eoi"si ~ ~ Ul ogtn - dfll""z "Xltsne |3
IUYflNOG *Vfl jO I O1VSlOWL" NS
2 ~ ~ ~~~1A6ONIUl ,X11 INOA J0 1 l IAV2 J9 11fi b8|;

@ ~ ~~~~ ~ titZ I za1 a9 91 t% 9 11 gX I;g Z@te 0ttX 1 t§g° @ @ ~~~~~ ~ ~~~~9T9aT 9,19's @ai t t91 toyX Mil a a 66Oe'f 6604C 0e/61a a96s§ s tt%¢ a 0 0960 Et
e ~ ~~~~ ~~ 96 al 69f lit'v ,, 07l1i5#£O 0g;f1 alv Ir. 4>gli¢~~It If!S I §§goA 2 a 'ie oldf ;!Jf13°l 4,/01
fse #t 016 0b8tp $C abv i289' T|0 Mgill/t,1"~~~~~~A6 iSS I I 0 ttvit I I IX§1 9 llI ct 6 Itl>/6J
0 SlSgt ~~~~ ~ ~~~tra¢ Of° 990c t ; fid,l Cwa¢a 1g
{t ~~~~~1169°X Oa% 10#1t 16tilQ WstXetos106 tl/0Ogzi Oleot 66C IsXe$? Evf:Ss It eg Cfto' 80 tI laeo0 -O / 9
f r. ~~~t-'f #I G!X6 5X@¢t Gidl ET§; ve)¢ i@ * * ) 4 s 9 ( 9 > g g0 j~~~~tt lo
s~~~~~~~ A Jilil
008334i CT gc iMS1X 11 3gT132fi3d. 04,113MG1 Bis"lot")VIDNlWVl ORzION ....t.naLlia. f
IVVlt61< ell e@ Jo IONVIt1IDNIl NX
311614'16f 93g11430 2, Jo3| IRV 18t i jj13t! :Ie I M M 1 Ib3,L4;

11 61Z 1 i,OZ . w ' 98? 901 t i /
1l 200 ea 991t e o Ott 9,I1U461 tO0 It t * o 66t 66t n/OS10
901 Ot 991 a. o 909 999 01/,16e * 9 .0, 999 6 1099
ts o e o ~~~~~~~~~~f ovis. O'l09 111 M19 N . e ig18
,L(21i 8C) tt)' .. tl) CI)EXWXW V18A@ -9tz8 IlYdI:"SW1 WN 91N31W OZlflhSG1Nfl A4INOid'AsElt1bli? RL1iWAYd 9'D!AflO31 .ItIUA0SS .LZ1X1OO 9WI6lXnl:" ais~nszaei
UO2!Uid1 1N191giUE flBI3VU41¢8. ISNONvLSInlass113|
IuvWflDU *e°l jSI'g4lftlON804X. 1#X
53~~~~~~~~~A9a9§@ tISO'*. W,is§l*lll
aS4br004t tlll$LF,t!,| s W 1Iddf'llfi'w¢Ml'i

cm
e" 1Ca do Ca o
s _<~~t ac C;a fb a c4 2
- u-w -we
204 I" ; 1
so 3q m "a
23. 0 23go at C2 co 0 2 t CB *ZiPCD co I' v-
~_ t: Wdw akx so o soo
ta ~~.h ~~A .4 oGo z
32 2 -4
0 *~ 0 0 C
ct '0sc ' b P
ua _A
.a 0 0 pi
63 * CD v o o
n -4~I
O-~ ~ 3 F- t: PSw wa
| O tD e t a X pa 2
-s ' -r es -iw~ Z D C 2
az :
GI% 3 C4 M_~~ 0
s ._" i n b~~~~~~~~~~~~~'
.040
-e_
C~~~~~
: w4~~~~~~~~¶_w
_ vo~~~~~~~~~~~¶
0 WOO R ma.8 a

° 9REt * 4T l4it 0 a .at 11/94* t *1 it t 0 a ta li 91/64,Ii 4§9 *1' ,1t0 " " SFtS¢ 9IaSIZ 611#4* ;C9TaI 5t 4S I a GO 1 696 #C tEttg999 * t 0 0# t0i I3 ,Tc c olt¢ Cs CI/U
Z9X 69b *t rttIl: I 8 0£0 - 99 got/ I4* n *a 9Q ti t t I tl/04
C92 CI) CI) (9)
91N3w IVIAL lam1ne1S 'ttSll"+XUd SttM3N St"3W ClZZ"ttOlt0N1` wA'1NO M]V3AwilXnPw em'ict lSSX SMXeQol"": "analoN 931VIM110:
AM9%": I0IN O h0ZAD ONAIN131NO0019431v vAl I. 11JOwwoO *N1Of. 9Nl1NV O inolh110
W NO I LW ~ ~ ~ ~ ~ ~ ~ ~ W13O N q1VVdM113QlUll dd iZl'
* g~~~~~~~~viW'ioO *lol 0 lINVflnOM, Naw6 :MW Aoliiiuno wsuZMoji 3'-Xiu,vA ii lSuia
83461,01 0UlW3WLdll 1O IV AUsia 31'¶9fnd VWmU31X3
t 19/410

ICts a litt 6t91* 2-11 *ia eL S
.(@i .A 1Cfi). .I CI)ft}titlZt'IIWIXNJ ;JOl ISIUIIl? -qYdZ3U?Ud t1FaW IJIMI a1 i SfllhiOKn kIND VV2I
II NO? IfWI41ol oNv 3 OOUZdAdJISNINAIIII*|1Z:11w: - aOSS~~~~~~~~~~003d JO evINN1|193
wSUlfl9i.
INvIlOSi *I*At 40' t@WVJlOI4L"s N?
01 i[OYd A 3NIgWUR PI*!1rU64 N! 34 !IV*~l ASl
1S~EOi'to U38U31ld2' S- lt IC I LS2OI fli lYlNWIIXI
IL !1/ .9 A 0

o 9 * OPT 76 o1 19/09e 991t *W- 9o@X 9 o 00o 0136 00/O4Go * * 949 91S9 t toS/OS O 900 91 4/0
siWt OM . so * 6 ; IOil 95/ 1o~~~~ttoltOt t 0Ta 91 Z C6E T49
* at 8991 99 - sl;t§l /Si0 sstt, gM §get- - ,g21 t91 91/si.
0~~~~~~~~09 - 9% 0s $C' Of 0 $f¢Q #I/a:stl* . 6 *WI@0EW9@o0s8 RG# SX
* a'eoo * egtoo Oco0i60T ~~~~~~06 £04' * ~~~~~~~~06 uIf 0L/6it§l, Ts 60 toS s*1 @~~~~~99 tMtli OS28 hi/0
-ft8 @% gs* I4t V' *10 T 1 : It1 69/99* c * TeSt *rBt *110 -- 90/5
w80eSlS A,"flB#B ?392flSst "XtGg wS8"""". 9VflSSSaNfl AlUiWO 83
Kaq19i @12?fl
V~~~~~~~~~ 4/53/5
gI2U?venB ' 001f' ja 2tI"?tInO"2l,i W
. . . . .~~~~~N
TT A Z?3|40 l0 VneS t i [|s@'f
rE6r¢ @?SXIS,-X2t. t &|109gw7a 1 w"Etas

o 099 g El 06Z01 O#I6 09u 9A,111
lrog Ogl~~~~~~~~*1e ~ 09f( OAdiSe
CD #I!g ,9 , lb9q I1oifIIAOe IS/ iAo S * e T 0911 os0ol * oS/69* 6|tL4' * 6I4'i.91 * 6Itt ° 6 69 /9,90a
CA) C9w - .CI. C) C D 1U t 6° -,~~ ~ ~ ~ ~~~ ~ , , , til ,I9 .0 1 ,I1
iI~~rniw IWLUJI. k33U2~~~a 1094 a?IwnuI:Nfi A1 OVAfG
'II 9 ID6 IIi I it ' 010 I esa
E 0 WVc 1 MI O)?2d4 IN2 I
.U5tlev: fl6w~1d3I 40 IV &S l aodu s MUM
£ A#SIiLO ~ ~ ~ ~ ~ ~ t A 3,0il Vm3xWX2e@ 14pM!s4d"' iD Bt ,&sXD 8501
ssRzgJo.~~~~~~~~~~IsMdis

EKTERNA1, PUBLIC DCIt AG OPfi - UI.PtRt .10*19T2
DEIDY 12PAWRLE IN 1RI911N OUR1tWCY PAGE 13
,e1 1wousanIDs Olf US. lOLa3s
_PZ1VAU BANK
DCIIT aUITsANOSNI IIANSACTIONSI o&1N0' P.IlOIDIKtOl[SNINB 0' PERIOD CANCCo
DISBURSED INCLUDING -0@NWZ?' DISBUR'sE ERRVIMC PAYM;NTA ADJUATeYEAR ONl.Y W19NOlTSIUfRBD MclutS ENWTS 'PRINCIPA1. IRTUOILST TOTAL -NUTS
t,,, £22 tz?) t&6C) CA)
70/7' 1 * 2*a DO 1 127 71/72 1L2? ; 2.00 629 1B683 1S 12aalJ . 1.231
72/73 It6TO 2M3I9 s 439 640 18a 1. 01?3/74 <1#4619 4 die U .' 1127 Io 21974/75 9'y 3 -* 212 # 1 29275/76 126 126 126 134


Table 43: .9FIC.L,AIP.oBu.T,OuiRMA: PEOPLE'S REPUBLIC OF CHINA
AmountSterling Pound-Miillio-s Date of Loan Terms (Interest rate,
Type of Loan (U.S.$ equiva1ent)LI Agreement Years incl. grace) Remarks
Industriai Projects 30.0 January 1961 Interest free In October 197i, it was agreed to(U.S.$84.0 miLlion) 30 years (10 years) reactivate the Sino-Burnmese economic
and technical cooperation agreementwhich had been suspended since 1967,after some 9.5 million pounds wereutilized.
Commodity Aid 10.0 December 1971 Interest free Import financing for industrial
(U.S.S26.1 million) 10 years (3 years) raw materials.
Total committed: 40.0 million Sterling Pounds (U.S.$110.1 million)
LI U.S.$ equivalents are converted at I.M.F. par value or central rate prevailing at the time of the respective loan
agreements.
Source: Data supplied by the Ministry of PlanniLag and Pinance as of September 30, 1972.
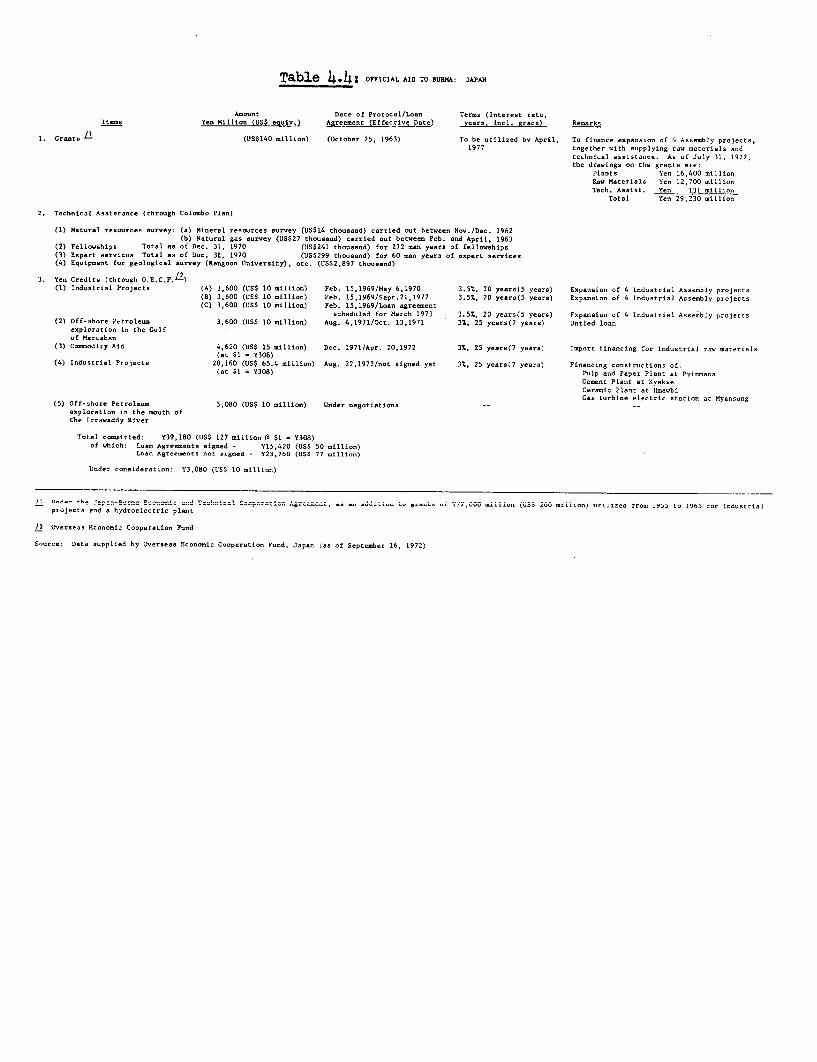
Table 4.4: OFFICIAL AID TO BURMA: JAPAN
Amount Date of Protocol/Loan Terms (Interest rate,Items Yes Killion (USS esuiv.) Areement (Effective Date) vearn incl cr,ee Renarks
1. Griate (USS140 million) (October 25, 1963) To be utilized by April, To finance expaenion of 4 Assembly projects.1977 together with supplying ros materials and
tech-i-.. -.istanu-r A.oE -uy 3;, ;972,the dresings on the grants are:
Plants Yen 16,400 millionRaw Materials een 12,700 nillio-Tech. Assist. Yen 131 nillion
Total Yen 29,230 million
2. Technical Assistance (through Coloobo Plan)
(1) Natural refo.rces survey: (a) Mineral resources survey (US$14 thousand) carried out between Nov./Dec. 1962(b) Natural gas survey (US$27 thousand) carried out between Feb. and April, 1963
(2) Fellowshipo Total as of Dec, 31, 1970 (US$241 thousand) for 272 nan years of fellowships(3) Empert services Total as of Dec. 31, 1970 (US$299 thousand) for 60 mao years of e.pert services(4) Equipmnnt for geological survey (Rangoon University), etc. (US$2,897 thossend)
3. Yen Credits (through O.E.C.F.U )(I) Industrial Projects (A) 3,600 (US$ 10 million) Feb. 15,1969/May 6,1970 3.5%., 20 years(5 years) Eipansioc of 4 Indsdtria; As-eably projects
(B) 3,600 (US$ 10 million) Feb. 15,1969/Sept.21,1972 3.5%, 20 yeara(5 years) Expansion of 4 Industrial Asse-bly projects(C) 3,600 (US$ 10 nillion) Feb. 15,1969/Loga agreement
schduld fr Mrc -97 3.5 ,20 yer( yers -5pansio. of 4 odosti-ia Assembly projects(2) Off-share Potrolesm 3,600 (US$ 10 million) Ag. 4,1971/Oct. 13.1971 3%, 25 years(7 years) ntioed loan
emplorartio in the Golfof Marta-as
(3) C=odity Aid 4,620 (US$ 15 million) Dec. 1971/Apr. 20,1972 3%, 25 yesrs(7 years) Import financing for industrial row materials(at $1 - Y308)
(4) Indostrial Projects 20,160 (US$ 65.4 million) Asg. 22,1972/not signed yet 3%, 25 years(7 years) Financing constructions of:
(at $1 = Y30f) Pulp and Paper Plant at PyinnnaCeo-nt Plant at KyasikCeramic Plant at hoavbiGas turbine electric stotino at Myann-g
(5) 0ff-shore Petroleum 3,080 (US$ 10 million) Under negotiations -- Gaeaplorstion in the mouth ofthe Irrawaddy River
Total comaitted: Y39.180 (US$ 127 million a Sl -Y308)of uhich: Loan Agreeents signed - Y15,420 (US$ 50 million)
Loan Agreemente sot signad - Y23,760 (US$ 77 million)
Ulzder consideration: Y3.080 (USS 10 =illion)
/I Under thej pan-Burms Econcnic and Technical Coopcr:tion Agreeeat, a e. additior. to graats ou Y72,000 million (US1 200 nilion) utili.ed fron 1955 to 195 for industrialprojects and a hydroelectric plant
/2 Overseas fEonomei Cooperation Fond
Sonrce: Dart sspplied by Overseas Economic Cooperation Fund, Japan (as of Septeber 16, 1972)

Table 4.5: OFFICIAL AID TO BURMA: FEDERAL REPUBLIC OF GERMANY
AmountType of Loan D.M.Thousand Date of Loan Terms (Interest rate, Remarks
(U.S.$ equiv.)j- Agreement Years inci. grace)
Industrial Project 7,550 January 1966 3.0%, 15 years Water pump and electric motor factory(U.S.$1.9 million) (3 years) at Sinde (Completed)
Industr4al Pro4ect 2,850 Febrnlary 1966 307A; 15 years Brick factory at Hmawbi (Completed)
(U.S.$0.7 million) (3 years)
Industrial Project 2,000 February 1966 5.0%, 10 years Brick factory at Danyi.gon(U.S.$0.5 million) (3 years) (Completed)
Industrial Project 9,600 March 1966 3.07, 15 years Glass factory at Syriam (Completed)(U.S.$2.4 million) (3 years)
Industrial Project 5,391 November 1967 6.0%, 10 years Alcohol distilling plant and 3 bottling(U.S.$1.3 million) (3 years) plants at Zeyawaddy, Rangoon and
Industrial Project 15,000 February 1968 3.0%, 15 years Fertilizer plant at Kyunchaung(U.S.$3.8 million) (7 years) (Completed in January 1972)
Industrial Proiect 32,000 May 1970 2.5%, 30 years Textile finishing plant at Paleik(U.S.$8.7 million) (8 years)
Mineral ProJect 22,000 February 1971 2.57, 30 years O--shore oil exploration(U.S.$6.0 million) (8 years)
Mineral Project 13,000 November 1971 2.5%, 31 years Rehabilitation of tin mines at(U.S.$4.0 million) (9 years) Heinda
Import Credit 5,000 January 1972 2.5%, 25 years Financing for spare parts and machinery(U.S.$1.6 million) (10 years) for factories constructed by German aid
Industrial Projects 40,000 Loan agreement 2.5%, 25 years Financing for (a) jointly selected(U.S.$12.4 million) not signed yet (6 or 7 years) industrial projects, (b) feasibility
studies for industrial projects selec-ted by Government, (c) establishmentof an industrial vocational center,(d) the foreign exchange costs of ex-ploring the potential at the Hermyingyi.mine, and (a) upgrading of tests forthe Bawdwin mine.
Total committed: D.M.154.391 thousand (U.S.S43.4 million)of which: Loan Agreements signed: D.M.114,391 thousand (U.S.$31.0 million)
Loan Agreement not signed: D.M.40 million (U,S.$12.4 million)
/i iV,S.$ equivalents are converted at I.M.F. par value or central rates prevailing at the time of respective loanagreements.
Source: Data supplied by the Ministry of Planning and Finance as of September 30, 1972.


Table 5.1s UNION GOVERNMENT CURRENT REVENUES(million Kyats)
Est. BudgetYear Ending Sept. 30 1968 1969 1970 1971 1972. 1973 -
Income Tax 555 6 2 588 522 391of vhieh(a) Personal 62 40 37 37 32 35(b) Boarde and
Corporations 493 545 660 551 490 356
Customs Thitie 206 183 215 206 210 215
Commercial Taxes 222 133 176 132 132 155
Sales Tax 112 108 156 116 1l9 142
Excise and Excise Duties 185 28 202 211 220 237
Property Taxes 102 120 117 101 113 122
Other a 212 212 196 238 256 290
Total Revenue 1,482 1,431 1,603 1,,47 6 1,453 :L410
Li Includes other taxes; earnings from the sale OI gOo and services
and reyeridus-collected by the States. Excludes Special Accounts.
Source: Ministry of Planning and Finance.

Table 5.2: UNION GOVERNMENT CURRENT EXPENDITURE(million Kyats)
E8t. BudgetYear Ending Sept. 30 1968 1969 1970 1971 1972 1973
General Services 205 208 224 267 45Council of Ministers 8 8 29 27 55 65Home 115 118 123 121 123 203Information 23 22 19 20 21 6Judicial Affairs 26 26 26 26 27 59Immigration & Registration 14 14 14 14 17 55Foreign Affairs 12 12 13 14 15 17Chin Affairs 7 8 - 8 9 -7
g7 Defense Z433 461 491 496 515 545
Economic Services 197 204 220 227 255 345Agriculture & Forests 77 80 89 89 99 160Industry and Mines 2 2 3 3 4 2Transport & Telecommuni-
communication 40 42 44 42 45 42Public Works & Housing 33 34 37 41 42 36Planning & Finance 36 36 37 39 40 31Trade 2 3 3 1 2 4Cooperatives 7 7 7 12 30 7
Social Services 384 404 430 435 488 573_FAcntion z 212 23 3 911X ' 256 281 339Health 86 87 99 102 110 135P'nRYPenriqonq &ratib -7 2 q73 74 _ _ 6 L 7 R. 652Labor 4 , z 4 2 2 6Social Walfnre 10 7 9 8 9
Oth .era 26 2 1 51
Total 1245 1303 1375 139l, ^ 153o
Sourcez Ministry of Planning and Finance.

Table 5;.3a UNION OwGOv(E!N T CAPITAL EPEI)DITJRE.(million Kyats)
- . BuAget
Year Ending Sept. 9O 1968 1969 1970 12n 1972 1973
General Services L- 14 1. 12
Defense 53 74 0 -J ^ H
Economic Services 66 82 I7 62 Ou
Agriculture & Forests 29 27 4i 33 44 62Transport & Communication 16 1i 8 8 10 l
Public Works & Housing 26 30 28 25 28 4iFinance & Reverne 26 9 70 - - 2
Social Services 18 22 19 23 23 a
Education . 12 16 15. 19. 16 17
Health 6 6 4 4 7 12
Others 4 3 1 - 3 6
Total 187 92 _64 211 216 264
/1'. R US -w .4 ,i a of4Mj- eqinmeeAnt
So-rce: Mlr41-4-y of P.ln ,ng and Firmane-

Table 5e4 r BUDGET OF THE BOARDS & CORPORATIONS(million Kyats)
Est. BudgetYaEn-ding- S pt.~ 30 1968 1969 1970 1971 1972 1973
- - -A" e, 22L -7
Cu_r_r_ P _een_ es 4..629 52'16 5365 5665 6. 331 6.,947
Indat-ri' 536 ilim 753 86q 1.025 1,353
Agricultural 410 421 360 394 576 710
Fi sheri; es and Pearl 11 11 11 11 25 29
Transport 361 399 415 468 494 573Welfare 35 29 27 1iL. 19 15Printing and Press 42 46 112 123 128 156
arnd Power 591 702 827 850. 966 1,oo8
,nl-Mt-ar n 156 163 175 171 187 925
Trade Council 2,487 2,571 2,685 2,769 2,911 2,878
Current Enqenditures 4 468 4,t918 5 284 5,306 5 843 6,259
Industrial 473 599 600 705 889 1,199
Agr, -It '>u=-L UU L-ai482 57 475 616 696
Fisheries and Pearl 8 10 14 16 21 2811'ansport 2g4). -4-1 ~ 315 335 34934 ).I 5~ )476
Welfare 37 33 26 13 15 6
rrinting and Pess 36 42 101 " 2l9
Construction, Mineraland Power 584 684 780 8Q (iR0 958
Bank and Insurance 73 92 89 68 78 112
T-rade Council 2,481 2,606 2,938 2,711 2,606 ,635
Current Surplus/DeficitAL ±1 ±28 +81 +319 +488 +688
Capital Expe-ndiv-re 401 5°4 488 480 707
Industrial 132 229 260 217 242 274
Agricultural 63, 72 39 42 72 71Fisheries and Pearl 7 3 1 3 7
Transport 98 128 95 91 77 118
Welfare 3 1 2 1 1 -
Printing and Press 1 - 2 1 2 2
Construction, Mineraland Power 90 62 84 83 171 194
Banicand Insurance 1 _ i 33 27 25
Trade Council 6 9 4 9 11 16
Overall Deficit/SMrplus -240 -266 -407 -121 -119 -19
Source: Ministry of Planning and Finance.
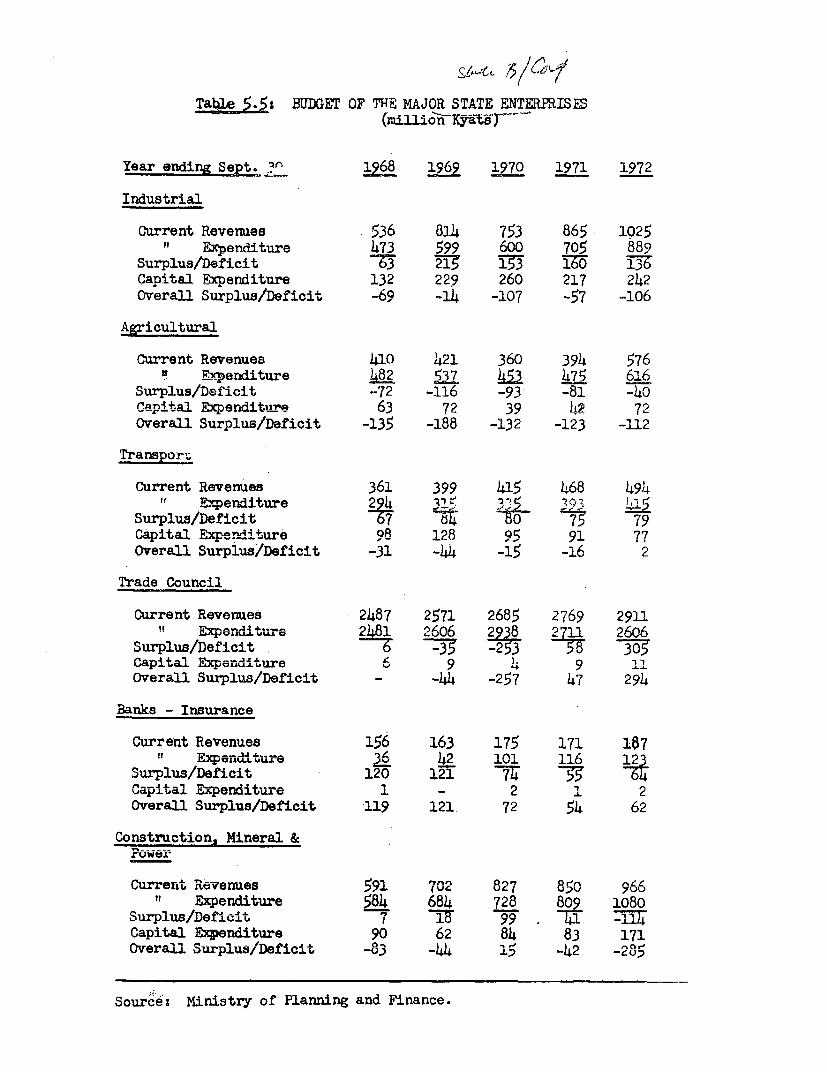
Tabl -I: BUDGET OF THE MAJOR STATE ENTERIISESCmiio-n-ts)
Year ending Sept. 3 1968 1970 197 1972
Industrial
Current Revenues 536 814 753 865- 1025it Expenditure 473 599 600 705 889
Surplus/Deficit 3 21 13 0 3Gapital Expenditure 132 229 260 217 242Overall Surplus/Deficit -69 -14 -107 -57 -106
Agricultural
Current Revenues 410 421 360 394 576u Expenditure L82 537 iL3 475 616
Surplus/Deficit -72 -116 -93 -81 -40ap±ait.l Expendilture 63 72 39 h2 72
Overall Surplus/Deficit -135 -188 -132 -123 -112
Trans_ or.-
Current Revenues 361 399 415 468 494"t ExpenAittl 9O1e
Surplus/Deficit :V 84 17 79CApital Expendituz- 98 128 95 Q1 77Overall Surplus/Deficit -31 -44 -15 -16 2
Trade Council
Current Revenues 2487 2571 2685 2769 2911!! Expendi ture 2 2606 "oR 27" 26
Surplus/Deficit . 253 305ZL -. - A 0 11
pt ',P.u.J Expe.diture 67 94 .7 -
Overall Surplus/Deficit - -44 -257 47 294
Banks - Insurance
Current Revenues 156 163 175 171 187
Surplus/Deficit 120 121 7 T
Lu ,a.j £J..IJ tur-e 1 - 2.
Overall Surplus/Deficit 119 121. 72 54 62
Construction, Mineral &rower
jurreet, hevelLaes 591 78"I Expenditure 584 684 728 1080
Surp±usi ue± icuX 70 9nr .> q
Capital Expenditure 90 62 84 83 171Overall Surplu-/De-icit -83 I44 15 -42 -285
Source: Ministry of Planning and Finance.

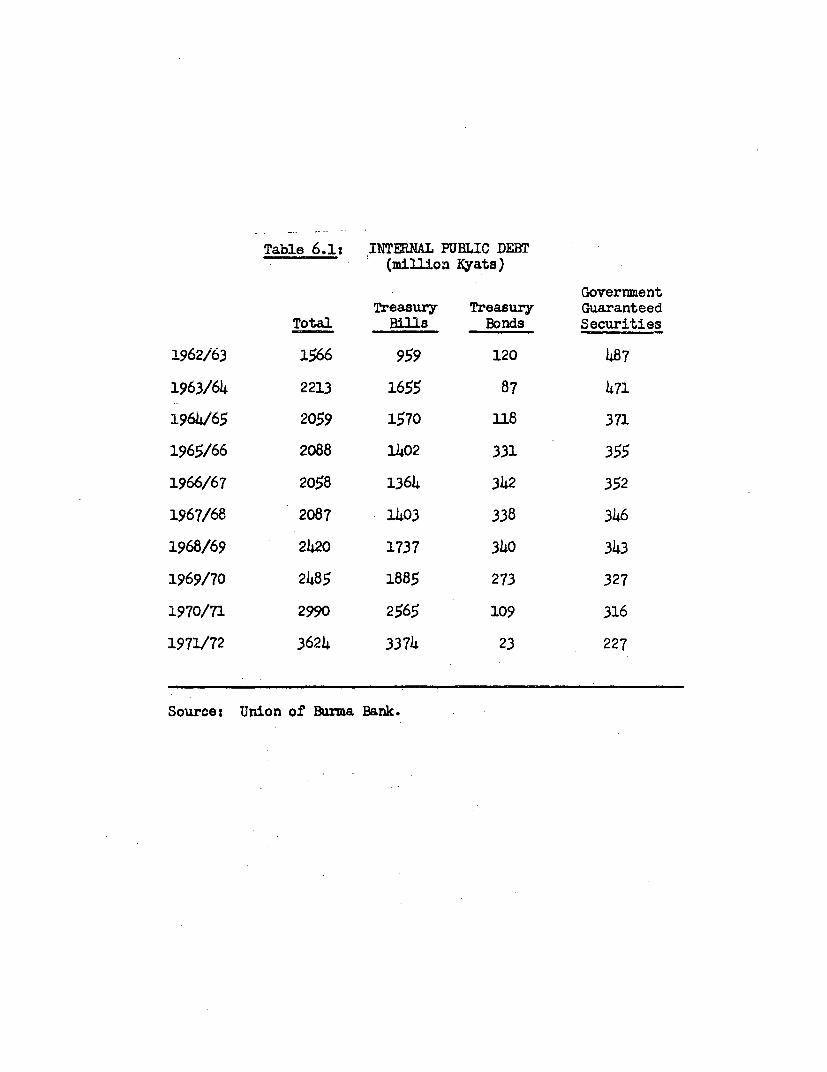
Table 6.1: INTENAL PUBLIC DEBT(million Kyats)
GovernmentTreasury Treasury Guaranteed
Total -Bills Bonds Securities
1962/63 1566 959 120 487
1963/64 2213 1655 87 471
1964/65 2059 1570 118 371
1965/66 2088 1402 331 355
1966/67 2058 1364 342 352
1967/68 2087 1403 338 346
1968/69 2420 1737 340 343
1969/70 2485 1885 273 327
1970/71 2990 2565 109 316
1971/72 3624 3374 23 227
Source: Union of Burma Bank.

Table 6.2: TOTAL SAVINrS HELD IN BANKS(million Kyats)
Year Ending Savings 12 Year Saving 5 Year CashSept. 30 Total Deposits /1 Certificates Certificates
1961 356 151 202 3
1962 423 170 250 3
1963 503 180 320 3
1964 414 218 193 3
1965 578 346 229 3
1966 585 337 245 3
1967 570 320 248 2
1968 573 325 246 2
1969 562 318 242 2
1970 585 338 245 2
1971 602 362 238 2
1972 669 412 255 2
/1 Includes postal savings.
Source: Union of Burma Bank.

Table 7.1: VALUE ADDED IN AGRICULTURE(r.aliion Kyats)
Year Edin, Sept. 30 Agriculture Livestock & Fishery Forestry Total
1963-1965 2497 568 247 3312
1966 2406 516 254 3176
1967 2162 644 253 3059
1968 ?592 695 263 3550
1969 £-647 679 263 3589
1970 2713 736 262 3701-
1971 2897 803 283 3983
1972 2935 823 293 4051
1973 (Plan) 3018 912 307 4333
Growth Rates (%)
1963/65-1970/72 1.9 4.8 1.8 2.4
Plan 1971/72 1.1 14.3 2.1 3.9
Actual 1971/72 1.3 2.5 3.5 1.7
Plan 1972/73 2.8 10.8 3.4 6.9
Source: Report to the Penole and Mission Etimates.

Table 7.2: AVERAGE ANDNUAL GROWTH RATES FOR SELECTED CROPS(1963/65 - 1970/72)
Crops Sown Area Mature Area Yield ' Production
Paddy -0.1 -0.3 0.5 0.2
Wheat -4.2 -4.4 0.6 -4.0
Maize 2.9 2.5 -5.6 -3.2
Groundnut 1.8 2.1 2.0 4.1
Sesame 4.6 4.8 0.5 5.4
Pulses 21 -0.6 -o.6 0.3 -0.4Gram 3. e.0*) 9 411v J7 L4.
Matpe -6.9 -7.7 -5.1 -12.4Htawbute - 7 -2 1 -
Pesigone -6.0 -5.9 3.9 -2.2Pegy-i ..Sultani -10.6 -10.6 0.2 -11.0S, apya 4.A 2.L -2.9 -1.0
cotAJLI 4.oJ 5.o U.25.
Jute 15.8 15.4 3.2 1i.4
Onions 2 1.7 2.5 3.9 6.5
Chil'ies 1.*8 3.*3 -0.8 2.7
Tobacco -/ 1.3 1.3 -1.9 -0.6
Sugarcane 11.3 1.6 1.6 3.4
Rubber -/0.3 -1.1 1.7
i, rroQudllOfl per unit mature (harvested) area.
2/ Growtn rates for r96s/OO-iy(U/yi.
Noe: Growth rates for mature area and yield may not necessarily add up due
with the other statistics.Source: Annex Table.

Table 7. 3 RECRNT PERFoRMAmNCE OF S ET.rrn AQR.ITMTMAT. nrwA(.T-TrTV
Sown Area (000 acres) Production (000 tons)Crop Year Ending Actual Forecast Actual Forecast
June~~~~~. 00171 10702 '973 19Q71 192-97
Paddy 1i2,294 i2,300 2, w 5 8,033 8,1046 7,243
wVeat 172 156 1 4;2 39 26 42
Maize 371 488 n.a. 48 57 n.a.
Groundnut 1,735 1,674 1,518 521 478 380
Sesame 2,510 2,292 2,253 130 112 72
Pulses 1,576 n.a. n.a. 285 304 n.a.
Cotton 466 554 530 42 42 45
Jute 116 224 288 28 64 89
Chillies 158 140 n.a. 29 20 n.a.
Tobacco 137 169 n.a. 54 54 n.a.
Sugarcane 237 273 157 1,414 1,606 2,024
Rubber 217 213 214 13 14 15
Source: Settlements and Land Records Department MOAF.Agricultural Statistics.

Table 7.4: PRODUCTIO! 0.? SELECTED CROPS('000 tons)
Crop Year EncL-ng Average Averaee Annual
June 30 1963 1964 1965 1966 1967 1968 1969 1970 1971 1929 1963/66 1970/72 Growth Tcate
CerealsPaddy 7,5ijit 7,667 8,373 7,928 6,532 7,647 7,896 7,859 8,033 8,048 7,865 7,980 0.2
'W.eat 32 53 71 95 66 50 25 33 39 44 52 39 -4.0
Millet 66 73 53 47 53 64 61 47 47 59 64 51 -3.2
OilseedsGroundnut 425 332 338 283 273 365 392 437 521 494 365 484 4.1
Sesame 84 53 99 57 56 106 82 100 130 112 79 114 5.4
Fibre.Cotton 54 53 68 448 32 34 42 42 58 39 -5.5
Wagyi n.a 10 12 12 10 9 7 7 1 10 11 8 -4.4Wagale n.a 21 28 12 7 11 9 7 6 5 25 6 -18.0
N 5/6 n.a. 7 12 3 2 4 4 5 0 7 1U0Long Staple n.a 15 16 19 23 24 12 15 23 20 16 19 2-5Jute 1t 12 10 1o 13 22 21 22 28 64 11 38 19.4
PulsesGram 71 76 54 48 43 52 80 60 70 80 51 65 4.1
Matpe 46 27 47 38 33 26 21 17 21 30 42 19 -12.4
Htawb,tpe 14 32 30 36 38 34 32 26 28 40 33 27 -3.3
Pedisein 9 15 10 11 7 9 12 10 9 7 11 13 -1.6
Sultani 27 15 10 10 9 9 7 5 5 2 10 5 -11.0~11 41 4~ ff I i. 1 17
Sultapya 8 4 1 6 1. I1 -1.OSadawpe 15 13 10 11 11 12 17 16 15 17 11 16 6.4
Pesin&one 23 36 26 29 17 21 28 23 25 30 28 24 -2.2
Pegyi 36 32 21 21 18 22 30 33 31 3-1 21 32 7.3
Other Pulses 81 84 59 66 68 63 74 67 64 44 63 66 0.&
Total Pulses 330 339 281 287 259 264 315 269 285 304 284 277 -O. 4
Horticultin-al CroPS-- Q~~~~~~~~~' ~ s OP, f OR
Onions 9_ 78 83 >0 77 73 9 112 8, 5 79
Chillies 23 18 20 17 18 17 22 27 23 22 20 24 2.7
('.ar1ic. 24 19 14 14 14 14 16 17 20 19 14 19 5.2
Tobacco CroDs
Tobacco 58 54 57 52 60 67 56 52 54 54 55 53 -o.6
Virgin.ia 13 11 17 23 23 18 13 14 14 n.a. 20 14 -5.7
Burmese 45 43 40 29 37 49 43 38 40 n.a. 35 39 1.
'RuMber 14 13 13 12 11 12 12 13 13 14 13 13 -
'2 -21,2 1,007 1,067 1 , 1,7 t9 i23 t1237 1;2911 1.tL14 625 1.14L 1.1443 3.14
. Nota: Crowt- rate for pulses, onions, ,arlic, tobacco and rubber for 1965/66 -. 1970/71-
Source: Report to the People, 1972/73.

Table 7.5: SOWN AREA OF SELECTED CROPS('000 Acres)
Crop Year Ending Average AveraLge AnnualJune 30 1963 1964 1965 1966 1967 1968 1969 1970 1971 1972 1963/65 1970/72 Growth Rate
CerealsPaddy 11,953 12,475 12,624 12,39:1 12,328 12,193' 12,402 12,243 1.2,294 12,302 12,351 12,280 -0.1Wheat 162 218 298 409 372 235 151 166 172 163 226 1.67 -4.2MaiLze 350 357 306 337 386 428 416 377 371 491 338 413 -2.9Millet 442 447 415 415 414 460 453 453 429 395 435 420 -0.5
OilseedsGrounduvtt 1,536 1,490 1,332 1,315 1,132 1,259 1,510 1,510 1,735 1,679 1,453 1,641 1.8Sesame 1,570 1,610 1,960 1,998 1,910 2,050 2,037 2,258 2,510 2,292 1, 713 2,353 4.6
FibresCot.ton 551 674 616 567 487 526 389 362 467 553 614 461 -4.0Wagyi n.a. 88 1D0 111. 106 91 77 71 90 120 94Wagalei n.a. 353 300 22S 186 203 142 100 112 115 327 109 -14.5Mi 5/6 n.a. 109 105 96., 55 59 55 60 110 148 1.07 106 -0.1Long Staple n.a. 124 111 132 140 173 115 1.31 155 170 1.18 152 3.7Jut:e 53 54 '53 72 69 87 99 104 115 224 53 148 15.8
Pulses;Gram 348 377 271 29C0 290 272 410 350 358 407 281 354 3.9Matpe 204 234 216 192 203 175 158 130 135 l78 2.04 133 -6,9Htalwbutpe 107 153 1160 18Cl 217 176 147 142 132 196 170 144 -2.7Pedlisein 89 123 125 130 101 107 118 106 96 95 128 101 -3.8Sultani (156 (126 48 45 53 46 34 26 22 15 47 24 -10.6Sultapya ( ( 69 8O 100 90 93 84 90 IL26 75 87 2.,4Sadawpe 66 68 41 47 53 43 60 69 65 67 44 67 7,3Pesingone 146 191 221 241 211 1130 170 156 162 :194 231 159 -6.0Pegyi 206 181 129 140' 156 1'59 167 189 174 :180 134 182 5,0Other Pulses 338 402 329 362 384 368 394 379 342 326 346 361 0.7Total Pulses 1,710 1,855 1,609 1,707 1,768 1,6:16 1,751 1,631 1,576 1,;784 1,658 1,603 -0.6
H orticultural CropsOnions 53 39 45 46 45 46 43 54 47 50 46 51 1.7Chillies 134 134: 144 155 116 128 139 174 158 136 137 156 1.8Garlic 29 20 1]9 16 15 L5 16 18 18 17 17 18 0.9
Industrial. CropsTobacco 124 142 129 118 140 157 145 131 137 1.69 124 1:34 1.3Virginia 6 9 13 17 20 12' 12 12 13 16 15 . 13 -2.3Burmese 118 133 116 101 120 145 133 120 123 134 104 122 2.7Rub'ber 184 207 213 215 216 219 220 219 217 2'14 214 2:18 0.3Sugarcane 117 98 120 143 155 146 162 201 237 280 112 237 11.3
Note: Growth rates fcr pulses, onion, garlic, tobacco and rubber for 1965/66-1970/71.
Source: Report t.o the People 1972/73,
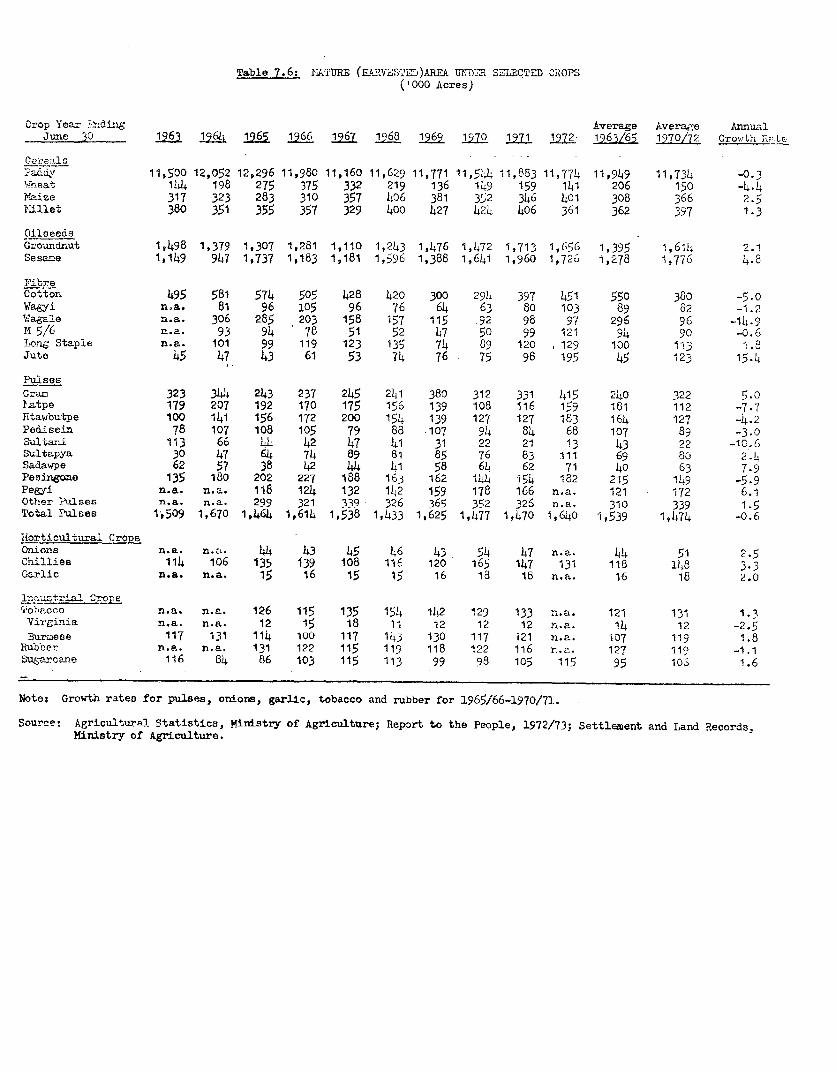
Table 7.6: MATURE (TivESL2-)AREA U1TD-TR SELECTED CROPS('000 Acres)
Crop YV. . ;-.d-n Average Average Annual
June 30 1963 1965 i2& 1966 1967 1968 1969 1970 171 1972 1963/65 1970/72 Grorth Th.te
Ce e laa -D,add.y 11,500 12,052 12,296 11,980 11,160 11,629 11,771 11,544 11,883 11,774 11,949 11,734 -0.3
WTheat UlL 198 275 375 332 219 136 149 159 141 206 150 -4.4
Maize 317 323 283 310 357 406 381 352 346 401 308 366 2.5
Killet 380 351 355 357 329 400 427 424 406 361 362 397 1.3
OilseedsGroundnut 1,498 1,379 1,307 1,281 1,110 1,243 1,476 1,472 1,713 1,656 1,395 1,614; 2.1
Sesame 1,149 947 1,737 1,183 1,181 1,596 1,388 1,641 1,960 1,726 1,278 1,776 4.8
Fi*) r
Cotton 495 581 574 505 428 420 300 294 397 451 550 380 -5.0
Wagyi n.a. 81 96 1°5 96 76 64 63 80 103 89 82 -1.2
Wagale n.a. 306 285 203 158 157 115 92 98 97 296 96 -14-9
M 5/6 n.a. 93 94 78 51 52 47 50 99 121 94 90 -0.6
TLnc Staple n.a. 101 99 119 123 135 74 89 120 , 129 100 13 1.8
Jute 45 47 43 61 53 74 76 75 98 195 45 123 15-4
PulseEG-rai 323 344 243 237 245 241 380 312 331 415 240 322 5.0
Eat9e 179 207 192 170 175 156 139 108 116 159 181 112 -7.7
8tawibutDe 100 141 156 172 200 154 139 127 127 183 164 127 -4.2
Pedisein 78 107 108 105 79 88 107 94 84 68 107 89 -3.0
Sult-an 413 66 44 42 4 7 41 31 22 21 13 22 -10.6
Sultapya 30 47 64 74 89 81 85 76 83 11t 69 80 2.4
Sadawpe 62 57 38 42 44 41 58 64 62 71 40 63 7.9Pesingone 135 180 202 227 i88 163 162 i44 154 182 215 1149 -5.9Pegyi n.a. n.a. 118 124 132 142 159 178 166 n.a. 121 172 6.1Other TulseR n.a. n.a. 299 321 339 326 365 352 326 n.a. 310 339 1.5
Total Pulses 1,509 1,670 1,464 1,614 1,538 1,433 1,625 1,477 1,470 1,640 1,539 1,474 -0.6
Horticultural Cro-DOnions n.a. n.aC. 44 43 45 46 43 54 47 n.a. 44 51 2.5
Chillies 114 106 135 139 108 116 120 165 147 131- 118 148 3-3Garlic n.a. n.a. 15 16 15. 15 16 18 18 n.a. 16 18 2.0
';obacco n.a. n.a. 126 115 135 154 142 129 133 n-na- 121 131 1.3
Virginia n.a. n.a. 12 15 18 11 12 12 12 n.a. 14 12 -2.5
Burmese 117 131 114 100 117 143 130 117 121 n.a. 107 119 1.8
Rubber n.a.. n.a. 131 122 115 119 118 122 116 r-.a. 127 119 -1.1
S arcane 116 8h 86 103 115 113 99 98 105 115 95 106 1.6
Notes Growth rates for pulses, onions, garlic, tobacco and rubber for l965/66-u970/71.
Soarce: Agricldltural Statistins, winrstrv of ALriculture- Report to the People. 1972/73: Settlement and Land Records.
Ministry of Agriculture.

Table 7.7 SELECTED CROP YIELDS(lb/acre)
J^.vp Year MA.Lfl -dir,g C-erag AterafnAAr
June 30 1263 196 4 1965 1966 1967 1968 1969 197G 1971 1972 1963/65 1970/72 Grovth Rate
CerealsPaddy 1,469 1,424 1,525 1,483 1,331 1J,473. 1,503 1,525 1,514 1,531 1,473 1,523 0.5
wneat 47u w 1 VW- 4' ..2 ,,, 4. d, " v
Maize 466 506 420 340 333 353 359 299 304 330 464 311 -5.6Millet 295 345 252 282 170 241 278 269 270 236 297 258 -2.0
OilseedsOrou-it6 36539 579 4951C e,3 f ,c7O hot: c91 A68 Co5 6n 5 2=0 MR e8 671 _
Sesame 164 125 128 108 106 119 132 137 149 145 139 144 0.5
Fibrecotton 2 81 67 87 66 73 85 79 85 78 69 78 77 -0.2
WagQy n_ n 8 87 81 73 90 73 73 62 68 86 68 -3.3
Wagale 83 44 63 36 34 45 56 53 43 35 54 144 -2.9
M 5/6 n.a. 54 88 2? 34 54 67 70 48 43 71 54 -3.8
Long Staple a.a. 120 123 122 116 14 1 129 128 1-4 120 124 132 0.9
Jute 546 570 500 543 561 657 603 648 634 735 539 672 3.2
PulEesGiam 495 499 499 457 395 482 47 431 474 n.a. 478 453 -0.9
Matpe 372 577 538s 501 426 376 333 358 399 n.a. 520 379 -5.1
Htawrbatpe 322 506 428 475 420 501 522 466 509 n.a. 452 488 1.3
Pedisein n.a. n.a. 207 235 198 229 251 238 240 n.a. 221 239 1.3
Sultani 541 512 514 547 408 491 517 495 580 n.a. 531 538 0.2
Sultapya 572 428 475 524 377 432 379 364 471 n.a. 500 418 -2.9
Suawpe 5142 511r 589 587 5$e 656 65? 560s ej" n a= 588 5R1 -1.1Pesingone 382 448 288 286 203 289 387 358 364 n.a. 287 361 3.9Pegyi 422 437 397 377 302 348 414 415 418 n.a. 387 417 1.3
Total Pulses n.a. n.a. 430 398 377 413 434 408 434 n.a. 414 421 0.3
Onions n.a. n.a. 4,225 2,605 3,833 3,555 4,688 4,646 3,956 n.a. 3,415 4,301 3.9
Chillies 448 375 336 278 335 322 400 369 354 376 386 366 -0.8
Garlic n.a. n.a. 2,091 1,960 2,091 2,091 2,2 4u 2, 16 2,489 D.a. 2,026 2,32- 2 1
Industrial CroDsTobacco n.a. n.a. 1,013 1,013 996 975 883 903 909 n.a. 1,013 906 -1.9
Virginia 755 635 497 517 428 542 372 420 438 n.a. 507 42900 m c30-85vm7i. cL6e. 4 7°0 769 711 73e 7!,7 - n.a ? 7hi niA
Bumeoc VI.J'i IC. 57-4 hiJ'4 I"' Iz I 1- "I - -.-- .2-
Rubbor n.a. nba. 222 220 214 226 228 239 251 n.a. 221 245 1.7
Sugarcane 10.99 13.U 12.42 13.79 13.51 12.64 U3.06 13.18 13.AB 14.13 12.17 13.60 1.6
2/ Yields estimated from production data and harvested area in tems of lint.
Notes Growth rate for pulses, onions, garlic, tobacco and rubber for 1965/66-1970/71.
Source: Agric,-Atial -Statis Settlement and 'a O+o+. Ag-t-oj I _slon ost h ...J

Table 7.80 COST AND IET'JIR1 MOR "ELECTED CROP I' UPPER BURMIA, 1972(Kyats per acrej
Rate1/ Cost of 2/ Yield lUnit Total Net Return to
Units Total Cost1- Family Labor- per acre Price Revenue Revenue Famzi1 LabcŽ
Jute 3.6 lbEs 119 58 10,2 1.35 137 19 2.35
L4/Hs cotton (irrigated) H 102 60 115 1.80 208 116 3J4
E/Hs cotton (rain) 83 39 64 1.80 115 32 2.895
Chillies 102 87 75 4.69 352 250 4.05
Onions 1t 319 71 822 o.65 534 216 7.-54
PulsesMat,pe 72 lbs. 26 34 4 14.00 62 36 1.81
Bocate tt 27 37 7 12.00 84 57 2.30
Gram 69 lbs. 34 29 6 12.00C 75 40 2. ';9
Groundnut 25 lbs. 144 64 18 11.32 2.08 64 3.24
Paddy 46 lbs. 65 61 29 4.25 122 61 1.87
Early Sesame 54 lbs. 39 27 2 5,1.26 93 66 2.37
Late Sesiame it 24 35 3 42.44 1]18 83 4.94
Wheat 72 lbs. 51 93 7 13.00C 86 143 1.68
j,/ ExoLuding the value of family labor2g/ Valiied at the same rate as hired labor
/ Net Reveanue . Cost of Family labor
Source: Ministry of Planning and F'inarnce and Mission Estimzates.

Table 7.9: P}SR CPTA .CONSUMPTION OF PUISES AND BEAR('000 tonsl
Ye_a- End_i Sep+. 30 10AQI I< 1966 1967 1968 1969 1970 1971 1972
'+o3Q 28] 287 259 264 315 269 285 304
Wastage | 7 61 6 C 5 6
N=et rodcio-+4 332 275 281 254 259 3 264 279 298
Seeo .in . 17 18 19 17 19 18 17 20 25
.0r8s 75 1 7 80 89 65 A7 55 57 63
AvaIlable for ..-e 240 on A 183 J1R 175 9h), 191 202 211
wiariges 'iu stok =70 +4 =37 13 +L5 _ +1 +24
C,,-rii'u 1 1 K 170 18 18I 100 107 20r117
Per capita conswution(visa) 4.4 4.0 4.4 4.5 4.4 4.6 4.5 4.4 4.0
1 viss = 3.6 lbs.
Sources Ministry of Plarming and Finance.

Table 7.10: PER CAPITA CQ1_11MPTION OF EDIBLE VEGETABLE OIL'.J.J1 UWAWO/
1964 1965 1966 1967 1968 1969 1970 1971 1972
Production (sesamum) 53 99 57 56 106 82 100 130 112
Production (groundnut) 332 338 283 273 365 392 437 521 494
Production (edible oil) 84 104 70 66 105 104 118 151 137
Imports 33 43 - - - - - - -
Internal consumption 117 147 70 66 105 104 118 151 137
Per capita consumption(visa) 3.0 3.7 1.7 1.6 2.5 2.4 2.7 3.3 2.9
Retail price for ground-nut oil (K/vies) 4.1 4.8 8.4 11.4 9.9 18.6 9.3 5.9 10.0
Retail price for sesamumoi2 (K/viss) 4k1 4.9 8.2 118 9.6 11.8 9.3 5.6 10.1
I viss - 3.6 lbs.
Source: Ministry of Planning and Finance and Mission Estimates.

Table 7.U: PER CAPITA CONSUMPTION OF SUGAR('000 tons)
Year Em SngSePt 3° 0 1964 6 1966 1267 1268 12969 197'0 1971 972
_. rcane.
Production 1,097 1s,067 1,1425 1,557 1,1423 1.,287 1p2951 1,1L13 1,,625
Wastage L1 11 14 16 14 13 13 14 16
Net production 1,086 1,056 1,411 1,5541 1,409 1,274 1,278 1,399 1,608
Seedling 24 81 96 97 73 127 2 23 290 310
Internal utilizat:Lon 1,062 975 1,313 1,,444 1,335 1,1147 1,0,56 1,Lo9 1,,298
(a) for sulgar :Lndustry 570 744 639 744 756 628 628 523 699
(b ) for sugarcane jaggeryand direct consumption 493 231 674 700 580 519o 428 586 601
Production 49 64 55 64 65 54 5'4 45 60
Imports 15 50 33 - n.so n.e* n.s.
Inlternl utilization 64 114 88 64 65 54 5'4 45 60
Per capita consumption 1.65 2.86 2.17 1.54 1.54 1.2r; 11.22 1.00 1L.29
n.s. Less than 500 tons

Table 7.12: CONSUMPTION OF RAW JUTE('000 tons)
Not 1/ InternalYear Ending Sept. 30 Pt tU WrCnntilon- Riqorts TmDorts Use
'964 12.0 11.9 1.4 9.4 20.0
1965 10.0 9.9 1.0 25.7 34.6
41' t O 14.0 A 0.8 9. 2.6
1967 13.0 12.9 0.7 15.0 27.2
41zo w' 22. 2. 3.2 7 n 5. A
1969 21.0 20.8 1.5 - 19.3
I~~~(V cc.u LI .v I .*) -~~~~~~~o c1970 CC. 21. el3 -0.
1971 28.0 27.7 4.8 _ 22.9
1972 64.0 63.4 15.6 - 47.8
1/ Wastage estimated at 1% of production.
Source: Ministry of Planning and Finance.

Table 7.13,:. AGRICULTURAJ1 EXPORTS - COSTS ANE MARKET POTENTIAL(Kyats per ton)
Export Actual / Marketpw^lreme!n &mort . Export, . argrln Exot3PenilProce 2 osa rje/Exports-Z PotentialWPrice= Cos/ Pric- - ('000 tons)
Rice Ngasein) 207 519 505 -2.5. 614 880
Maize 163 302 273 49.5 12 200
Pulses - - ~ ~ 56 132
Grams 454 700 833 17-5 6 10
Htawbutpe 390 548 766 39.7 19 30.Pres-.Ingone 280 5t5 36-3 10 15Matpe 404 565 736 30.3 8 30Peyin 280 425 567 33n4 6 15
Pelun 349 424 500 17.9 - 5S-ultani 308 456 496 8.8 4 10Bocate 265 407 630 54.6 1 10Pedisein 358 512 616 20.3 2 7
Jute 1e027 1,568 1,269 -19.1 10 -00
Groundnut cake - - - 36 120
Sesamum cake - - - 17 25
Rice Bran cake - - - - 63 100
1/ 1971 Prices except Rice t;J9733()i/ Average 1969-71/ Latest two-year average
Official estimates
Source: Price Committee, CSED and Mission Estimfates.

Table 7J:14 FA.M r TUCR;S OF CERELhJ ANM SELECTED CROPS. 1962-,1973
(Kyats per ton)
op Yestr EndingJune 30 1962 1963 19,64 1965 1966 1967 1968 1969 1970 1971 1972 1973
Paddy 1/
Ngasein OrdiLnary 146* 146* 151* 151* 151* 161* 174* 174* 174* 174* 174* 207*
1st Grade - - 161* 161* 170* 184* 184* 184* 184* 184* -
Meedone Ordinary 153* 153* 158* 158* 158* 168* 182* 182* 182* 182* 182* 215* 1/
1st Grade - - - 168* 168* 1.78* 191* 191* 191* 191* 191* -
Emata Ordinary 156* 156* 161* 161* 161* 1.70* 184* 184* 184* 1L84* 184* 218* 1/
1st Grade - - - 175* 175* 1.85* 199* 199* 199* 199* 199* -
Ngak,we Ord:Lnary 183* 183* 187* 187* 187* 197* 211* 211* ,211* 211* 211* 250* 1/
1st Grade - - - 199* 199* 209* 223* 223* 223* 223* 2:23* -
WheatRed ( 467 467 467* 467* 280* 280* 280* 280* 280* 280* :342* 2/
White 626 ( 591 591 5591* 591* 373* 373* S73 373* 373* :373* 404* 2/
Maxipax - ( - - - - - - - - - - 467* 2/
Maize 144 157 163 163* 163* 163* 163* 163* :163* 163* 163* 163*
MilLet - - - - - 273 237 274 :184 205 :231 n.a.
OilseedisGroundnut 628 527 538 538* 538* 804 1,434 1,467 1,:366 926 471 n.a.
Sesane 836 813 830 830* 830* 1,866 1,663 2,059 1,943 1,493 1,322 n.a.
Induastrial 'Crops
Sugarcane 35 35 35 35* 35* 35* 35* 35* 35* 35* 40* n.a.
TobaccoVirginia 280 280 280 280* 280* 280* 280* 280* 280* 280* 280* n.a.
Burmese 1,717 1,897 1,748 2,177* 2,335* 2,:242 2,490 2,230 1,928 2,:370 2,259 n.a.
* Government monopoly control of marketing
1/ Effective from January, 19732/ Effective from March, 1973
Source: Agricultural Statistics

Table 7 23:. ,4GRItCl2T-1--EIXPORT - COSTS AND MARKET POTENTLkL(Kyats per ton)
Export Actual MarketL,COSt1 Price-e. o,- ;.unnrtsi/ Potential=
_ Pricm y _C08' Pric'/ ('000 tons)
Rice Ngaaein) 207 519 505 -2.5 614 880
Maize 163 302 273 9.5 12 200
Pul.ses - - - 56 132- I ~~~~~~~10 -- I -.Ie I nf
Gram 454 v7y 8,3 J. 566 Ll
Htawbutpe 390 548 766 39.7 19 30Pesingone 280 595 8,11 36. 3 10 L5
Matpe 404 565 736 30.3 8 30Peyin 280 425 567 33.4 6 15Pelun 349 424 500 17.9 - 5Sultari 308 456 496 8.8 4 10Bocate 265 407 630 54.6 1 10Pedisein 358 512 616 20.3 2 7
Jute 1S027 1,568 1,269 -19.1 10 100
Groundnmt cake - - - - 36 120
Sesamum cake -- - 17 25
Rice Bran cake - - - - 63 100
1/ 1971 Prices except Rice (1973)2/ Average 1969-71
Latest two-year average_/ Official estimates
Sources Price Committee, CSED and Mission E-stimates.

Table 7.1L4: F'LRM -TTCM QF CEEATL AND SEECTIED CROPS. 1962-1973
(Kyats per ton)
op Year EndingJune 30 1962 1963 1964 1965 1966 1967 1968 1969 1970 1971 1972 1973
Paddy 1/Ngasein Ordinary 146* 146* 151* 151* 151* 161* 174* 174* 174* 174* 174* 207*
1st Grade - - - 161* 161* 170* 184* 184* 184* 184* 184* -Meedone Ordinary 153* 153* 158* 158* 158* 168* 182* 182* 182* 182* 182* 215* 1/
1st Grade - - - 168* 168* 178* 191* 191* 191* 191* 191* -Emata Ordinary 156* 156* 161* 161* 161* 170* 184* 184* 184* 184* 184* 218* 1/
1st Grade - - - 175* 175* 185* 199* 199* 199* 199* 199* -Ngakywe Ordinary 183* 183* 187* 187* 187* 197* 211* 211* 211* 211* 211* 250* I/
Ist Grade - - - 199* 199* 209* 223* 223* 223* 223* 223* -
WheatRed ( 467 467 467* 467* 280* 280* 280* 280* 280* 280* 342* 2/White 626 ( 591 591 591* 591* 373* 373* 373* 373* 373* 373* 404* 2/Maxipax - ( - - - - - - - - - - 467* 2/
Maize 144 157 163 163* 163* 163* 163* 163* 163* 163* 163* 163*Millet - - - - - 273 237 274 184 205 231 n,a.
OilseedsGroundnut 628 527 538 538* 538* 804 1,434 1,467 1,366 926 471 n.a.Sesame 836 813 830 830* 830* 1,866 1,663 2,059 1,943 1,493 1,322 n.a.
Industrial CropsSugarcane 35 35 35 35* 35* 35* 35* 35* 35* 35* 40* n.a.TobaccoVirginia 280 280 280 280* 280* 280* 280* 280* 280* 280* 280* n.a.Burmese 1,717 1,897 1,748 2,177* 2,335* 2,242 2,490 2,230 1,928 2,370 2,259 n.a.
* Government monopoly control of marketing
1/ Effective from January, 197321 Effective from March, 1973
Source: Agricultural Statistics

Table 741: PAM! PRICES OF PUISES, 1962-1973
(Yya.ts per ton)Crop Year Ending
June 30. 1962 1963, 1964, 1965, 1966 1967 1968 1969 1970 1971 197:2 1973
Pul ses k
Matpe 475 373 373 373 373 373 3173 373 373* 4 0 4k 404* 498Pedisein - 358 358 358* 358* 358* 358* 358* 358* 358* 358* 358*Htawbutpe 463 325 325 3255* 325*, 325* 325* 325* 325* 390* 390* 390*Bocate 399 249 249 n.a.* 249* 249* 249* 249* 2491* 265'* 265* 373*Sultani andSultapya, 315 292 292 226* 276* 276* 276* 27676 276* 308* 308* 406*
Pesigone 320 233 280 280*r 280* 280* :280* 280* 280*k 280* 280* 28;0*Peyin 325 246 280 280*r 280* 280* 280* 280*k 280* 280* 280* 37'3*Pebuygale 385 371 295 276* 276* 276* 276* 2761* 276* 276* 276* 276*Peboke n.a. 404 342 342*' 342* 413 1310 759 774 905 700 n.a.Gram. 483 367 260 260*r 260* 337 1582 429 482 454 392 n.a.Pelu.n 348 226 280 280*r 280* 331 46 7 327 293 316 349 n.a.Pegyi 525 426 375 308fe 308* 400 650 666 644 540 556 n.a.Peyaza 330 239 262 n.a., 235* 484 602 415 1,214 910 959 n.a.Sadawpe - 404 311 280* 280* 408 754 762 638 580 580 n.a.
* Government monopoly control of marketing
1/ Effective from March, 1.973
Source: Agricultural Statistics, TCI

I'a' h 7 n t 3CIONYTROLLED FARM PRICO; OF FIBER CROPSJ, 1962-1973(Kyats per ton)
1962 1963 19,64 1965 1966 1967 1968 1969 1970 1971 1.972 1.973
CottonWagyl: Grade I - 659 - 659 659 659 996 996 996
Gracde II - 622 622 622 622 622 622 622 622 - - -Grade III - - - 249 249 249 249 249 249 311 311 311
WTagal.e: Gracle I - 622 6:22 622 622 622 622 622 622 622 933 933Gracle II - - - 249 249 249 249 249 249 249 311 311
M 5/6: Gracle I 7093 746 746 746 746 746 746 746 746 746 996 996Gracle II - - 249 249 249 249 249 249 249 311 311
Longc- Grac3 e I - i.4 964 974 974 974 974 974 974 1,120 1,120S tap e: Gratle II - 435 435 435 435 435 435 435 467 467
;Gr4.de I 1,027 1,027 1,0: 7 1,027 1,027 1,027 1,027 1,027 1,027 1,027 1,027 1,027Grade I]' 828 8:28 ; 78 778 778 778 778 778 778 778 778 778Grade III 311 311 311 311 311 311 311 311 311 311 311 311
enaf Gracde I - 622 746 746 746 746 746 746 746 746 746Gradle II - - 498 560 560 560 560 560 560 560 560 560Gracle III - - 187 187 187 187 187 187 187 187 187
Source: Agricultural Statistics, Agriculitura1 Corporation
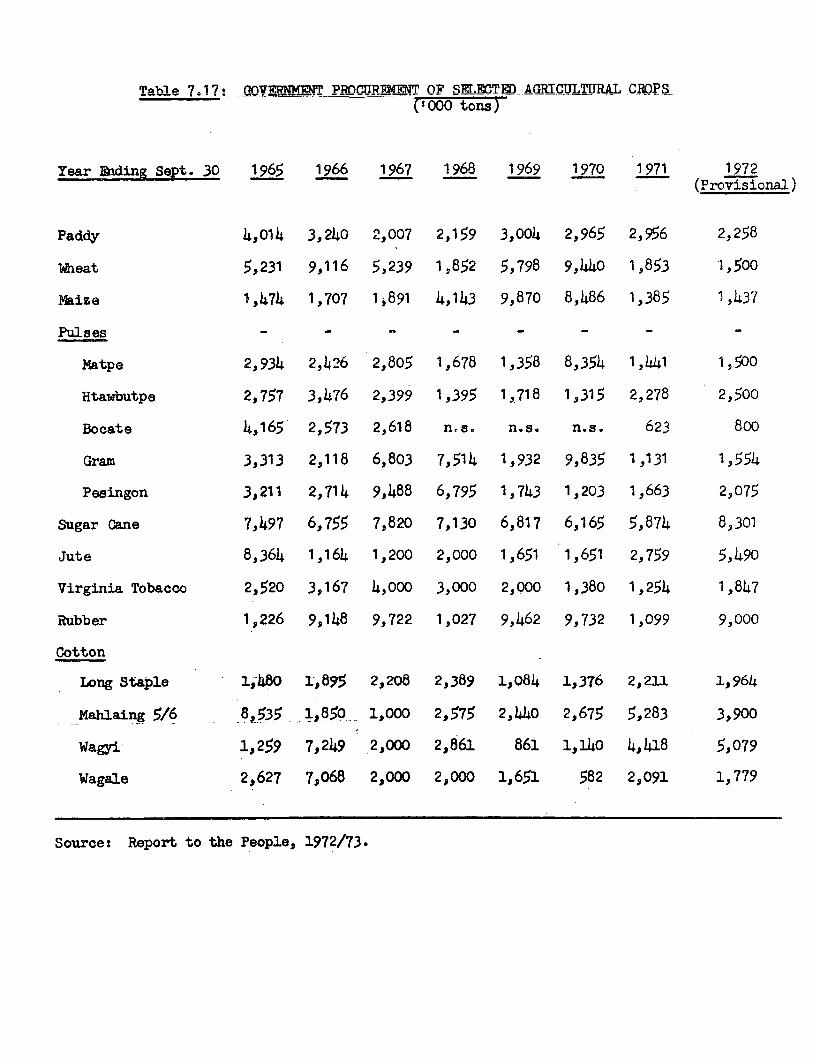
T abhle 717 * VrRNITPR0CMRRMM. OF SRLECTBD AGRICULTURAL CRDPS('000 tons)
Year &iding Sept. 30 1965 1966 1967 1968 1969 1970 1971 1972(P-rmi.i1nnql
Paddy 4,014 3,240 2,007 2,159 3,004 2,965 2,956 2,258
heat 5,231 9,116 5,239 1,852 5,798 9,440 1,853 1,500
Maize 1,474 1,707 1,891 4,143 9,870 8,486 1,385 1,437
Pulses - - - - - - - -
Matpe 2,934 2,426 2,805 1,678 1,358 8,354 1,441 1,500
Htawbutpe 2,757 3,476 2,399 1,395 1 ,718 1.,315 2,278 2,500
Bocate 4,165 2,573 2,618 n.s. n.s. n.s. 623 800
Gram 3,313 2,118 6,803 7,514 1,932 9,835 1,131 1,554
Pesingon 3,211 2,714 9,488 6,795 1,743 1,203 1,663 2,075
Sugar Cane 7,497 6,755 7,820 7,130 6,817 6,165 5,874 8,301
Jute 8,364 1,164 1,200 2,000 1,651 1,651 2,759 5,490
Virginia Tobacco 2,520 3,167 4,000 3,000 2,000 1,380 1,254 1,847
Rubber 1,226 9,148 9,722 1,027 9,462 9,732 1,099 9,000
Cotton
Long Staple 1,480 1-,895 2,208 2,389 1,084 1,376 2,211 1,964
Mahlaing 5/6 8o,535 1,850 - 1,000 2,575 2,440 2,675 5,283 3,900
Wagyi 1,259 7,249 2,000 2,861 861 1,140 4,418 5,079
Wagale 2,627 7,068 2,000 2,000 1,651 582 2,091 1,779
Source: Report to the People, 1972/73.


TablEl 8.1:s INDUSTRIAL VALUE-ADED :L963J/62-:L971!/72
(at constant 1969/70 prices)
Value added as %- h Inillion krats St3iicbire - ___ _ of ross oliltpu_t
-]16 1 92lfW 7 19712 l971 1970 71 1971 72
Industrial sector, total 818.0 1113i.4 liLt76 10(.0 100.0 100.0 13.4 ,20.0 20.6Food, beverages and tobacco 336.2 448.8 ffl 41L.1 14h0.3 404. 1'2.2 13.3 13.8Clothing and other wearing
apparel. 132.0 153.7 138.-5 16.1 :L3.8 12.'1 2:2.4 22.0 22.1Housing and householdi equip-
ment industry 101.1 131.0 138.1 12.4 :1.8 12.0 33.3 334.5 34.0Fersonal goods 49.3 64.1 5'9.8 6.0 5.8 5.,2 4,2.3 38.5 36.5Household products 2.1 57.8 8.4 0.2 0.9 0.7 24.4 36.9 37.1Printing and publishing 10.8 25;.9 27.0 1-.3 2.3 2.,4 43.1 41.3 41.3Industrial raw materials
industry 67.5 53.5 77.4 8.2 4.8 6.,8 24.7 25.5 29.1Mineral processirLg prodacts 82.3 127'.3 132.0. 1(0.1 .11.4 11.15 31.7 33.2 33.3Agricultural machineries - 11.7 1.9 1.1 1.0 - 78.2 78.2Manuf acturing machinery
and equipment 2.4 2.2 7.1 (.3 0.2 0.65 78.2 78.2 78.2Transport, equipment 8.7 61.6 55.9 :L.1 5.5 4.9 51.4 54.7 53.8Electrical products 2.1 8.3 9.0 0.3 0.7 0.8 29.3 28.9' 28.9Miscellaneous 23.4 15 .5 18.9 2.9 1.4 1.65 22.3 15.7 17.4
Source: Data supplied by the Ministry of' Planning and FLinance.

Table 8.2: WHOLESALE PRICE COMPARISONS OF INDUSTRIAL GOODS, 1971/72(US dollars)
1/Unit Burma-` India Pakistan
Wheat flour Ton 162 160 48?/Sugar n 264 225-352 173Salt 58 6 10Groundnut oil " 742 522 285Cement " 30 29 164Bar Soap " 267 - 829;'Urea Fertilizer " 94 118Steel round bars 202 130Wire nails I 278 253 -Printing paper " 502 356 369Cotton yarn, 20"t 100 lb8. 62 30 35Cotton cloth, grey 100 yds. 37 18-32 13-21Cotton shirting price 43 32 33Longyi, gent. " 2 2 -Bicycle " 55 27Cycle tires " 2 1 1Cigarettes 1000 14 4-9 2-4Bricks if 29 13 -Jute Bags 100 42 41 31Glass Bottles n 9 8.5Toilet soap " 10),, 8 6Matches Carton 7` 1.2 4Dry cell batteries doz. 1.5 1 -
1/ Producer's price plus taxes and distribution charges excluding profit mareins2/ Ration shop price5/ Retail price1/ Units may not be comparable
Source: Mission estimates based on information from:(i) Bnrma - CSED, Ministry of Planning and Finance, Industrial enterprises.
(ii) India - Index Number o.L Wholesale Prices, Feb. 1972; Bulletin ofAgricultural Prices. Noo. 39.
(iii) Monthly Statistical 'Bu&l4tin, Sept. 1972
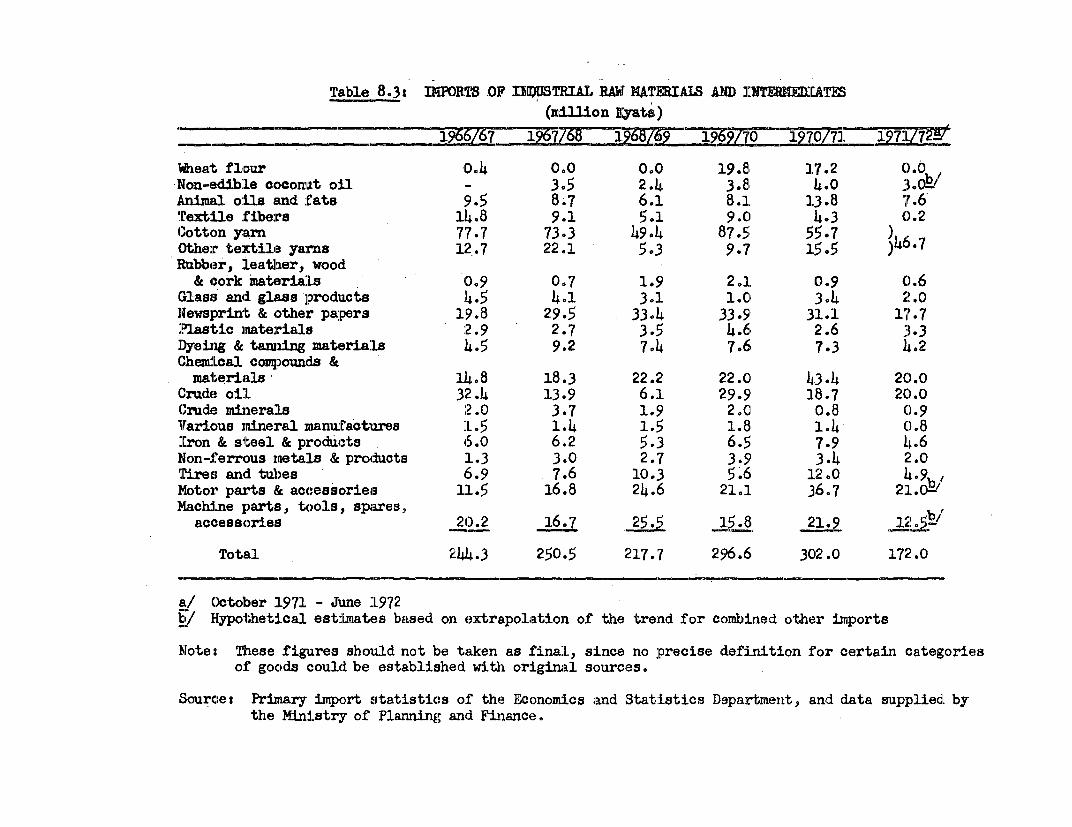
Table 8.3£ I1IPOR;15 OF IIUl)URSIAL RAWr NA1'ERIAI D AMINTO TE3(nd4lUlon J;yatil )
__75-zz Z~~~~~~~~~~~~~2 1962L7FO /973.5 1271770-liCeat flour 0.4 0.0 0.0 19.8 17.2 0.0lJon-edib:le acDornat oil - 3.5 2.4 3.81 4.0 3v0Animual oils and fats 9.5 8.7 6.1 8.1 1.3.8 7.6Textile fibers 14.8 9.1 5.1 9.0C 4.3 0.2Cotton yarn 77.7 73.3 49.4 875 5;5.7 )Other textile yarns 12.7 22.1 5.3 9.7 15.5 )hb7Rubber, leatJher, wood
& cork materiaLs 0.9 0.7 1.9 2.1 0.9 0.6(Glass and. glass jprodaucts 42.5 4.1 3.1 1.0 3.4 .1 2.0Newsprixnt & other papers 19.8 29.5 33.4 33.9 31.1 17.7Plastic mnaterials :2.9 2.7 3.5 4.6, 2.6 3.3]Dyeing & tamiing materials 4.5 9.2 7.4 7.6 7.3 14.2Chemical compounds &
materials 114.8 18.3 22.2 22.0 43.4 20.0Cr(de oi:L 322.4 13.9 6.1 29.9 18.7 2C).0Crude minerals ;2.0 3.7 1.9 2.0 0.8 0.9Various mnineral marfarotixres 1.5 1.4 1.5 1.8 1.4 C).8Iron & steel & prodICts 65.0 6.2 5.3 6.5 7.9 4.6Non-lferrous rmetaLs & prodacts 1.3 3.0 2.7 3.9 3.4 2.0Tires an(i tubes 6 .9 7.6 10.3 5.6 12.0 9Motor parts &t accessories 11.5 16.8 24.6 21.1 36-7 21.0-'Machine parts, tools, sparesb
accessories 20.2 16.7 25.5 21.9
Total 244.3 250.5 :217.7 296.6 302.0 172 .0
at/ October 1L971 - Jume 1L972b/ bHypothetical estimates based on extrapolation of the trend for combined other imports
Note: These figures should not be taken as finaL, since no precise definition for certain categoriesof goods could be established with or:Lginal sources.
Slource: Primary imort statistics of the Economics and Statistics Department, and data suppliedL bythe Ministryr of Planning ancd Finance.
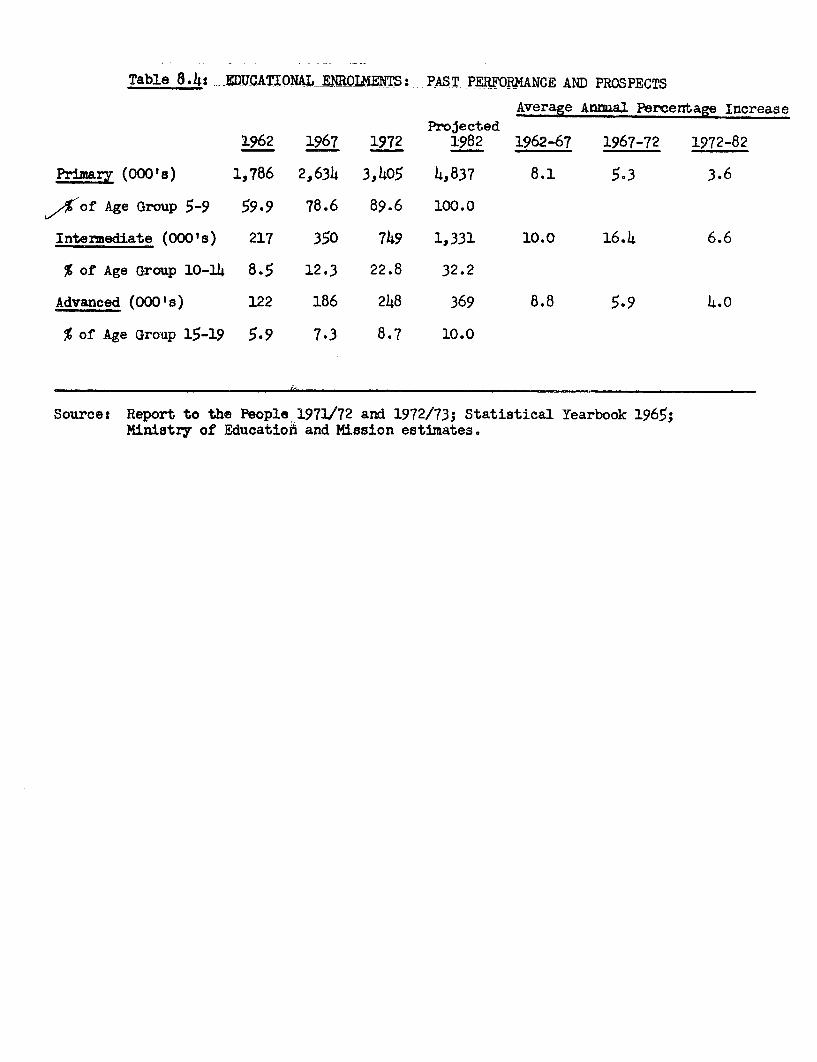
Table 8.4S- EDUCATIONAL EROENTS: PAST PERFORMANCE AND PROSPECTS
Average Annual. Percentage Increaserojected
1962 1967 1972 1982 1962-67 1967-72 1972-82
Primary (000's) 1,786 2,634 3,405 4,837 8.1 5.3 3.6
'% of Age Group 5-9 59.9 78.6 89.6 100.0
Intermediate (000°8) 217 350 749 1,331 10.0 16.4 6.6
% of Age Group 10-14 8.5 12.3 22.8 32.2
Advanced (00018) 122 186 248 369 8.8 5.9 4.0
% of Age Group 15-19 5.9 7.3 8.7 10.0
Sourcet Report to the People 1971/72 and 1972/73; Statistical Yearbook 1965;Ministry of Education and Mission estimates.

Table 2i.: C0SUM1ER PRICE, IlD1E AT RA.NGOCN (1962--1972)-i9165 1CO
1962 1963 1964 19565 1566 1967 15968 19?69 1970 1971 1972
L.YFoo,d and Beverage 85.6 83.1 83.7 100.C 0 134. 0 133.7 145. 3 14ti.5 129.5 1310 149.9
Tobacco. 83.5 83,5 82.8 3.00.0 114.7 86.7 88.2 815.7 85.0 85.3 83.2
Fuel and Light 85t.o 84.4 85.3 100.0 9i7.5 93.4 93.4 96.5 99.4 101.9 105.0
Clothing and Apparel 91.3 82.9 77.0 10(.0 125.8 128.8 15'.6 147.0 135.4 134.4 137.8
1/'House Rent & Repairs 102.6 100.7 1loC).l 100.0 103.9 10:3.1 106.1 106.1 104.5 106.6 lo5.5
Education 105.1 12.0 100.0 100.0 57.6 57.6 58.2 59.2 59.0 60.6 62.1
Medical. Care 106.8 103.1 10().0 100.0 99.6 114.3 122.3 119.9 123.8 13.7.8 118.1
CorcveyaLnce 10(.0 100.0 10(.0 100.0 100.0 103.0 100.0 100.0 100.0 100.0 100.0
Cleaning & Toilet 66.1 63.8 88.4 100.0 132.6 156.3 209.4 190.6 180.0 173.2 150.7
y.,Miscellaneous 99.2 977.3 98.7 100.0 96.1 99.4 106.6 104.8 103.6 103.3 101.0
,-Total Consumerv Price Index 88.4 86 .5 86.4 100.0 12:1.9 121.9 133.1 129.4 121.5 122.3 133.0
Sources Central StatisticI3 anu Economics ]Departme nt.

Table 9.-2: 'HOLESALE PRICE INDICES OF SELECTED AGRICULTUREJ PRODUCE]15'65 = 10C
19651 1962 1963 1964 1965 1966 15967 1968 1971
Padcly 110.7 121.0 108.0 96.5 100.0 100.0 100.0 106.6 106.6 106.6 106 .6
Millet 103.2 115,0 97.5 100.0 100.0 100.0 100.0 100.0 10C).0 100.0 10(.0
Gam 182.3 181A4 128.0 120.0 100.0 100.0 211.0 301.9 24 j7.8 258.4 1914.2
Matpe 108.0 179.6 101.5 98.6 100.0 116.5 186.3 260.0 222.0 171..7 140.6
Sadawpe 194.,5 209.6 153.5 138.6 100.0 142.0 271.6 346.0 298.5 140.0 160.4
SesEsagmnu 104,.8 106.5 102.2 102.0 100.0 100.0 220.9 268.3 302.4 250.0 302.-5
Groundmut 151.-1 151.6 106.5 105.1 100.0 100 .0 230.8 265.7 26,5.3 247.3 194.0
Chillies 206.1 122.5 123eO 172.3 100.0 100.*0 228.1 384.l 424.-4 253l.5 311.7
Onions 260o0 1.26.o 112.0 156.0 100.0 100.O 178.0 226.0 2521.0 192.0 248.-0
Garlic 425..7 300.0 155.8 103.5 100.0 188.0 805.3 631.0 385r.0 416.8 400.9
Tumeric 102..9 128.2 139.1 U3.8 100.0 91.3 181.1 176.8 177.5 75.7 322e.5
Ginger - - - 95.5 100.0 141.6 107.9 105.6 321.0 190.6 163.8
Cotton (als) 1057 76.-4 97.1 96.2 100.0 94.3 94.3 94.3 94.3 94.3 134.0
Cotton (1/8) - - - - 100.0 68.8 68.8 68.8 68.3 68.3 95.4
Jute - - - - 100.0 100.0 100.0 100.0 100.0 100.0 100.0
ALL PRODUCTS 118.7 123.2 106-.5 98.7 100.0 100.3 127.5 142.2 143.4 1341 3 133.2
Source: ,CentraL Statistics anxd Econoics Departmerrt and Mission Estimates

Table 9E3s: REAThPCES OF SELi:CITD DECAN'R±OL OOIODITIES AT RAK}_OO
(Kyats per Vi8a)
Year Erding Sept. 30 1962 1963 1964 1965 1966 1967 1968 1969 1970 1971 1972
Chillies 4.3 3.4 4.6 9.2 12.1 5.9 8.1 9.5 6.7 6.7 8.7
Or40ra '.2 .8 1.0 1.6J 4I ° 3.2 16 2 1..7 2.0 2.0
Twueric 2.1 2.4 2.0 2.4 3.8 3.5 3.1 3.5 6.0 5.8 4.2
Potatoes 0.9 0.7 0.7 2.1 4.0 2.0 1.9 1.5 1.h 1.7 1.8
Cabbages 1.0 1.0 1.1 1.5 1.3 1.3 1.14 1.6 1.5 1.4 1.5
Cooonuts 0.8 o.8 1.2 1.5 1.6 1.8 2.5 2.4 2.4 2.4 2.2
Tea 10.0 10.0 9.8 22.0 22.5 11.1 10.4 10.0 10.4 11.1 12.0
Cigars /L2 6.1 5.9 6.2 7.8 9.9 10.0 10.1 10.1 10.3 10.14 10.6
Firewood /2 2.7 2.5 2.6 4.1 4.4 4.1 3.9 4.2 4.2 4.1 3.9
Cnaroal .y.u .2 9.1 12.8 16.6 12.1 12.6 12.9 12.8 12.7 13.0
ja8gernr - 1.4 1.14 1.4 2.9 4.0 3.3 14.5 4.0 3.3 3.6 3.2
Chicken 6.1 6.0 6.1 6.8 8.4 8.0 10.0 9.4 9.2 9.3 9.6
Duck 5.4 5.1 5.4 6.0 7.4 6.5 8.9 8.5 7.9 7.8 8.2
Hutton 8.6 8.0 8.0 8-3 9.7 9-9 9.9 9.9 9.8 11.6 13.0
^t 3.5 3.5 3-5 4.0 5.R 6.0 7.8 8.2 8.1 8.4 8.0
por-k 4.0 4.0 14.0 4.9 5.2 5.1 7.8 7.7 7.7 6.0 6.3
EggsA i.5 1.7 1.6 2.2 2.5 2.4 3.6 3.2 2.5 2.3 2.6
Groundnut 0i1 3.5 3.2 4.1 4.8 8.4 11.4 9.9 18.6 9.3 5.9 10.1
Sersa&nr Oi 3-9 38 14. 1 4.9 8 .2 U.8.. 9.6 1U.8 9.3 5.8 10.1
Gram 1.3 1.0 0.9 1.3 2.4 2.2 3.2 1.8 1.4 2.0 1.6
Fresh fish 8.5 8.2 8.0 8.2 10.5 11.8 13.0 13.4 l:3.5 13.8 14.2
Fish products 12.4 14.3 17.2 21.2 32.3 29.3 31.0 26.2 25.4 22.9 26.0
/1 Price per unit 1 vis G 'A A I hr.
/2 Price per 100/3 Price per bag-4 Price per dozen
Source: Central Ec-onomc and Statistics Depa-r`ent.

Fa7ble ¢9.4s EARNINGS OF SOCIAL SECURITY SCKEME,MEMBERS
1963 1969 1971............. percentages.
Income per month
Under 52 Kyats 10.0) 7.5) 9.4)) ) )
53 - 86 (19.9)61.9 (23.8)60.9 26.6)63.7
87 - 120 (32.0) (29.6) 27.7)
121 - 154 (21.4) (17.8) 15.1)_ 29 2 ( ! 30-( ) )
155 - 206 ( 7.8) (12.2)39.1 13.6)36.3)38.2 )
Over 206 8.9) 9.2) 7.5)100 100 100
Source: Statistical Yearbooks, 1967, 1969 and the Annual Report of theSoclv.J Acrt Bo1AAn , 1070-A 1 71VV;i VS= S W; s o I I r~~~~~~~.7 - I

Table 9.5$ HOURLY RATES OF PAY: TEMPORARY WORKERS
Kyats per Hour
1970 )19
Rubber Plantations o.48 0.o42
Silver Mining 0.50 0.47
Rice Milling 0.47 0.36
Sesaxaum Oil extraction o.60 0.52
Sugar Refining 0.54 0.40
Cheroot and Cigar manufacture 0.32 0.33
Cotton Spinning o.69 0.67
Umbrella-Manufacture 0.67 o.68
Sawmilling .48 0o.45
Printing, Publishing 0.63 0.57
Match Manufacture o.66 o.6oCinema Workers 0.42 o.41
Source: People'8e Forkers' Gazette - varlous isues,

Table 9.011 RATE OF INCREASE IN MONTHLY EARNINGS, 1965-1970:REGULAR MANUAL WORKERS
Increase over 5 years
Under 5 percent 5-10 percent Over 10 percent
Oil Industry Cinema Workers Silver Mining
Printing and Publishing Rice Milling Distillery WorkersElectricity Generation Sea and Riverine
Dockyard Repairs transportCement WorkersSugar RefiningRailway WorkersSawmills
Source: People's Workers" Gazette - various issues.

Table 9.7: EARNINGS BY SECTOR AND STATUS: DECEMBER 1970(MATT.R
Kyats
Regular- _ ~~~~ManagerilQ Clerical Maimal3 TemporaJry
Large=scale Firm -(over 150 e-oye-
Sea and Riverine transport 650 360 104 -Slugar Re uLing -li )-I 21 13 92~
Oil Extraction 528 291 153 -
Tin dU Wolfram 538 221 10 Vo
Motor Workshops (Rangoon) 477 189 182 80
Medium-scale (25-150)
Sawmilling 365 164 105 87Cotton Spinning 371195 131 137Printing and Stationery 418 197 149 120Banks & Financial Inst. 67c, 253 101 -
Small Firms (25 and unaer)
Amusements (Cinema) 294 163 136 84Rice Milling 211. 135 107 82Tobacco (Cigars & Cheroots) 217 135 110 63
Source: People's Workers Gazette - various series.

4L)
Tat1~~~~~ 0ul V\ O rl4v rt r4i r\ r-I rq r4. r4. r-i r4. r-1 r4.
P Ci r- ri r- r-i r4, r.,H :d i 4) S.CL H
C4-44)
1C) .4C) :tJ O C0 CN \ar- r-I cr\ CCOH\ H- 0 t~rI4 ~ t tCJsO\C\.
4) PU ° ° r i O r- r- O a3 a° rl co a:) INi C- J r- c 3 3H U).H r4, r-l r4 OJ 04 t tN \0 r- rl r *In O
gj , r4 WX~~C rl r/ r-4. rt r-4, -
N~~~~~~~~~- 1t °> .
CO 43 Cd~~~~~~~~~~~~~~~'3~C"
CO~~~~~~~~~~~~~~~~~~~~~~~~~~~~~~~~~C14),~~~~~~~~~L
co f :4 0 r
g~~~~~~~C --- a )Ct) r4. C) r4. rI- 04j Co 04 04 \0 IA ljr\ c cr\ o O Dt
d C)S O\ -: 'C0 rl 04 a) r-I <D 04 Cj\O O uE _:t r3i 0lD O O C) (13 e> b h ~~~~~~~r- r rrX 044 o 04j tj m cv, t _zt -- ir\ wD r-crON r-4 04 cn -LA :F
@ %<~~~~~~~~~~~~~~~~~~~~~~~~r r-l r4.-ir r-4.
C
.,
ao~~~~C OJ FDf --'4 I C'J \4D CP\ 0 r-co0 OD r- * rl r-I \0 r-l en A r;i r-4. l
al C)
ird ~ ~ rjV A QI - O( 0'AC - - O 03 0
P0 ri U" C'j O- r C\' CO *t O cO\JO( 8c FCd~~~~~~~c
E-~~~~~~~~~~~~~~~~~~~~-
H H UN O H H H C D "j 0 r\ aD u __ a o - C)ri r-i r-. CMU CQ (\J tc\ t (') -- , :T __ ' A Lr- CD r- I O 8 DO
r9 8B r; 'CUQ' 0 LR Is a'L:) r°S ()D 8 t<D\u \4DD 8< IR 8, g83r 4 r -
(s] rl r4. r-I r4. r4. r4.CJ \ OU In to --I ---a t'i\ r-.I} ri

< SNDIAzt 7 C H I N A j |NDIA4 8 ' ;elhtnisilll
B U R M A \_NORTH f
X H . L X C \ o X C S N / 2 60~~C H N
THA DA )Islo S t S 2
6Anclam'r:t 3t r--X B en a < ir ,fi Y l
Th~~~~ a r. 'K,,,, j >THAI
"N,~~~, -14~~~~~~~~~~~~~~~ HUM A Niv 1
Single ~ ~ D Irc rala 0 ; :
B rnio ric nrwn gre a K A
T H A/ I L A N /ond
-14- -BURMA. 10°-
I . a I roads Q V ---- irt lo meler A ndaman
- Snge trc ralway mMain rivers°(D 1


RHUTAIk r mo o _ .. ooonoo,pa
INDIA .'
eANtot2DRsO/8 tv C H I N A INDIA
BANGLADESH/ I'< Tn OIbrvgorh A ioo
U R M A . , \NORTH , .) I-VIE AM
6 / aLAOSN '. I f z < / 2 / / C H I N A
A c~ IN26oJTHAILAND . A6 5 2 i , kSSTATE .J6°)
3Andomon REUBI f, //' . Myifv
1 Gff VIETNAM J ~ 7
*~~~~ I To K>n-inR C og -
B o y o f b < s fnt ~~~~~~~~~~~~~~~~~~~~~~~~~~~~~14 00 m110.1v-
I~~~~~~~~~~~~~~~~~~~
/ 92' L S G A) N G I"'
9~~~~~~~~ \ T A E STA)E 7
CV iX i ro~~me Tong 1i T-rgy
-16°~~~ 2\ GRoolewXO\ -N
~~~~\ ~ ~ ) hIyn1 LA iv:Ppu%
Akyg M_E TT C
/. . M~11AG 1 1 u T o
B 0 y 0 f Ii O
e n g aA K Oh i40 ~~~~~~~~~~~~~~~~~~~~~~~T9141
B~~ ~ ~ b
A--A
BURMA BANGKOK
TRANSPORTATION NETWORK T.oo \ BANGKOK
Paved roadsGrovel roadsDirt roads A n d ma nRoads being upgradedRoads under constructionSingle track railway 5 e oDouble track railway -
Proposed doable track railway i,,,~= Navigable rivers
4 Moin ports. Dockoyards Gu If
International boundaries.Divisional boundaries l
Ar,92kJ~~Tho /an1011d . i10°
O i0o 200 300 400Kiiomeie,s v zi
O 50 o 00 150 2 00 2 50
Mil- OR11